UNITED STATES
SECURITIES AND EXCHANGE COMMISSION
Washington, D.C. 20549
FORM N-CSR
CERTIFIED SHAREHOLDER REPORT OF REGISTERED MANAGEMENT INVESTMENT COMPANIES
Investment Company Act file number: 811-07589
THE HARTFORD MUTUAL FUNDS, INC.
(Exact name of registrant as specified in charter)
5 Radnor Corporate Center, Suite 300, 100 Matsonford Road, Radnor, Pennsylvania 19087
(Address of Principal Executive Offices) (Zip Code)
Edward P. Macdonald, Esquire
Hartford Funds Management Company, LLC
5 Radnor Corporate Center, Suite 300
100 Matsonford Road
Radnor, Pennsylvania 19087
(Name and Address of Agent for Service)
Registrant’s telephone number, including area code: (610) 386-4068
Date of fiscal year end: October 31
Date of reporting period: October 31, 2014
Form N-CSR is to be used by management investment companies to file reports with the Commission not later than 10 days after the transmission to stockholders of any report that is required to be transmitted to stockholders under Rule 30e-1 under the Investment Company Act of 1940 (17 CFR 270.30e-1). The Commission may use the information provided on Form N-CSR in its regulatory, disclosure review, inspection, and policymaking roles.
A registrant is required to disclose the information specified by Form N-CSR, and the Commission will make this information public. A registrant is not required to respond to the collection of information contained in Form N-CSR unless the Form displays a currently valid Office of Management and Budget ("OMB") control number. Please direct comments concerning the accuracy of the information collection burden estimate and any suggestions for reducing the burden to Secretary, Securities and Exchange Commission, 100 F Street, NE, Washington, DC 20549. The OMB has reviewed this collection of information under the clearance requirements of 44 U.S.C. § 3507.
Item 1. Reports to Stockholders.
HARTFORDFUNDS
 |
THE HARTFORD BALANCED FUND
2014 Annual Report |

A MESSAGE FROM THE PRESIDENT
Dear Fellow Shareholders:
Thank you for investing in Hartford Funds.
Market Review
U.S. equities (as represented by the S&P 500 Index) rose steadily for the fiscal year ended October 31, 2014, with a return of 17.27% for the period. With the exception of short-lived geopolitical scares early in 2014 and concerns about continuing global growth near the end of the period, stocks generally rose on solid fundamentals and encouraging macroeconomic data during the year.
September 2014 marked the six-year anniversary of the start of the financial crisis. Within weeks of that anniversary, both the S&P 500 Index and the Dow Jones Industrial Average set new all-time highs, closing at 2,018 and 17,391, respectively, on October 31. Although the fallout of the crisis continues to influence investor behavior, stocks have recovered and risen dramatically, up 198% from their low in March 2009. Meanwhile, the domestic economy is notching strong growth, and the unemployment rate has reached its lowest level since August 2008.
While the U.S. economy appears to have stabilized and to have reverted to a solid growth path, the outlook for the global economy appears to have gotten cloudier. The U.S. Federal Reserve has ended quantitative easing, while Europe and Japan are pursuing stimulus options to avoid a double-dip recession and deflation, respectively. Diverging central-bank policies will likely continue to play an important role in market movements going forward as investors wait to see the reactions to their efforts and their impacts on global markets.
How have market movements impacted your portfolio throughout the last year? Are your investments still on track to provide the growth or income you need, and are you comfortable with their progress during times of volatility?
Your financial professional can help you navigate today’s markets with confidence, as well as assist you to achieve your investment goals by providing advice on the best options within our fund family to help you work toward overcoming today’s investing challenges. Meet with your financial advisor regularly to examine your portfolio and your investment strategy, and to determine if you’re still on track to meet your goals.
Thank you again for investing with Hartford Funds.

James Davey
President
Hartford Funds
1 The S&P 500 Index is a market capitalization-weighted price index composed of 500 widely held common stocks.
2 The Dow Jones Industrial Average is an unmanaged, price-weighted index of 30 of the largest, most widely held stocks traded on the NYSE
The Hartford Balanced Fund
The views expressed in the Fund’s Manager Discussion under ‘‘Why did the Fund perform this way?’’ and ‘‘What is the outlook?’’ are views of the Fund’s sub-adviser and portfolio management team through the end of the period and are subject to change based on market and other conditions. The Fund’s Manager Discussion is for informational purposes only and does not represent an offer, recommendation or solicitation to buy, hold or sell any security. The specific securities identified and described, if any, do not represent all of the securities purchased or sold and you should not assume that investments in the securities identified and discussed will be profitable.
| The Hartford Balanced Fund inception 07/22/1996 |
| (sub-advised by Wellington Management Company, LLP) |
| Investment objective – The Fund seeks long-term total return. |
Performance Overview 10/31/04 - 10/31/14
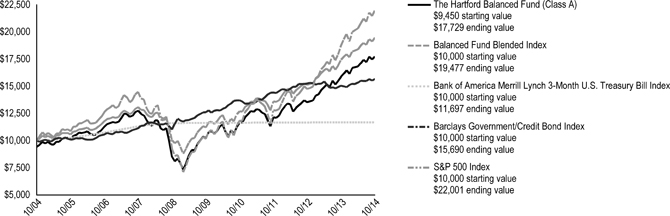
The chart above represents the hypothetical growth of a $10,000 investment in Class A, which includes a sales charge. Growth results in classes other than Class A will vary from what is seen above due to differences in the expenses charged to those share classes.
Average Annual Total Returns (as of 10/31/14)
| 1 Year | 5 Years | 10 Years | ||||||||||
| Balanced A# | 11.60 | % | 11.55 | % | 6.49 | % | ||||||
| Balanced A## | 5.46 | % | 10.29 | % | 5.89 | % | ||||||
| Balanced B# | 10.64 | % | 10.61 | % | 5.79 | %* | ||||||
| Balanced B## | 5.64 | % | 10.34 | % | 5.79 | %* | ||||||
| Balanced C# | 10.82 | % | 10.76 | % | 5.73 | % | ||||||
| Balanced C## | 9.82 | % | 10.76 | % | 5.73 | % | ||||||
| Balanced R3# | 11.32 | % | 11.29 | % | 6.40 | % | ||||||
| Balanced R4# | 11.67 | % | 11.63 | % | 6.64 | % | ||||||
| Balanced R5# | 12.02 | % | 11.97 | % | 6.90 | % | ||||||
| Balanced Y# | 12.08 | % | 12.04 | % | 6.97 | % | ||||||
| Balanced Fund Blended Index | 11.74 | % | 11.67 | % | 6.89 | % | ||||||
| Bank of America Merrill Lynch 3-Month U.S. Treasury Bill Index | 0.05 | % | 0.09 | % | 1.58 | % | ||||||
| Barclays Government/Credit Bond Index | 4.21 | % | 4.43 | % | 4.61 | % | ||||||
| S&P 500 Index | 17.27 | % | 16.69 | % | 8.20 | % | ||||||
| # | Without sales charge |
| ## | With sales charge |
| * | Class B shares convert to Class A shares after 8 years. The return shown reflects the conversion to Class A shares, which had different operating expenses, for the period after conversion. |
PERFORMANCE DATA QUOTED REPRESENTS PAST PERFORMANCE AND DOES NOT GUARANTEE FUTURE RESULTS. The investment return and principal value of the investment will fluctuate so that investors’ shares, when redeemed, may be worth more or less than their original cost. Current performance may be lower or higher than the performance data quoted. To obtain performance data current to the most recent month-end, please visit our website www.hartfordfunds.com.
The initial investment in Class A shares reflects the maximum sales charge of 5.50% and returns for Class B shares reflect a contingent deferred sales charge of up to 5.00% and declining to zero, depending on the period of time the shares are held. Returns for Class C shares reflect a contingent deferred sales charge of up to 1.00% on shares redeemed within twelve months of purchase.
Total returns presented above were calculated using the Fund’s net asset value available to shareholders for sale or redemption of Fund shares on October 31, 2014, which may exclude investment transactions as of this date. All share class returns assume the reinvestment of all distributions at net asset value and the deduction of all fund expenses.
Effective 9/30/09, Class B shares of the Fund were closed to new investments.
Class R3, R4 and R5 shares commenced operations on 12/22/06. Performance prior to that date is that of the Fund's Class Y shares, which had different operating expenses.
Balanced Fund Blended Index is calculated by Hartford Funds Management Company, LLC and represents the weighted return of 60% S&P 500 Index, 35% Barclays Government/Credit Bond Index and 5% Bank of America Merrill Lynch 3-Month U.S. Treasury Bill Index.
Bank of America Merrill Lynch 3-Month U.S. Treasury Bill Index is an unmanaged index that tracks the performance of U.S. dollar denominated U.S. Treasury bills publicly issued in the U.S. domestic markets with maturities of 90 days or less that assumes reinvestment of all income.
Barclays Government/Credit Bond Index is an unmanaged, market-value-weighted index of all debt obligations of the U.S. Treasury and U.S. Government agencies (excluding mortgaged-backed securities) and of all publicly-issued fixed-rate, nonconvertible, investment grade domestic corporate debt.
S&P 500 Index is a market capitalization-weighted price index composed of 500 widely held common stocks.
You cannot invest directly in an index.
The chart and table do not reflect the deductions of taxes that a shareholder would pay on Fund distributions or the redemption of Fund shares.
Performance information may reflect historical or current expense waivers/reimbursements from the investment adviser, without which performance would have been lower. For information on current expense waivers/reimbursements, please see the prospectus.
| 2 |
| The Hartford Balanced Fund |
| Manager Discussion |
| October 31, 2014 (Unaudited) |
| Operating Expenses* | ||||||||
| Net | Gross | |||||||
| Balanced Class A | 1.18 | % | 1.21 | % | ||||
| Balanced Class B | 2.04 | % | 2.27 | % | ||||
| Balanced Class C | 1.89 | % | 1.89 | % | ||||
| Balanced Class R3 | 1.40 | % | 1.51 | % | ||||
| Balanced Class R4 | 1.10 | % | 1.15 | % | ||||
| Balanced Class R5 | 0.80 | % | 0.86 | % | ||||
| Balanced Class Y | 0.74 | % | 0.74 | % | ||||
| * | As shown in the Fund's current prospectus dated March 1, 2014. Actual expenses may be higher or lower. Please see accompanying Financial Highlights for expense ratios for the year ended October 31, 2014. |
Gross expenses are the Fund's total annual operating expenses shown in the Fund's most recent prospectus. Net expenses are the Fund's total annual operating expenses shown in the Fund's most recent prospectus and reflect contractual expense reimbursements in instances when these reductions reduce the Fund's gross expenses. Contractual reimbursements remain in effect until February 28, 2015, and automatically renew for one-year terms unless terminated.
All investments are subject to risk including the possible loss of principal. For a discussion of the Fund’s risks, please see the Main Risks section of this report. For more detailed information on the risks associated with an investment in the Fund, please see the prospectus.
| Portfolio Managers | |
| Karen H. Grimes, CFA | John C. Keogh |
| Senior Vice President and Equity Portfolio Manager | Senior Vice President and Fixed Income Portfolio Manager |
How did the Fund perform?
The Class A shares of The Hartford Balanced Fund returned 11.60%, before sales charge, for the twelve-month period ended October 31, 2014, underperforming the Fund’s custom benchmark (60% S&P 500 Index, 35% Barclays Government/Credit Bond Index, and 5% Bank of America Merrill Lynch 3-Month U.S. Treasury Bill Index), which returned 11.74% for the same period. The Fund outperformed the 8.98% average return of the Lipper Mixed-Asset Target Allocation Growth Funds peer group, a group of funds that hold between 60%-80% in equity securities, with the remainder invested in bonds, cash, and cash equivalents. For the same period, the S&P 500 Index returned 17.27%, the Barclays Government/Credit Bond Index returned 4.21%, and the Bank of America Merrill Lynch 3-Month U.S. Treasury Bill Index returned 0.05%.
Why did the Fund perform this way?
The S&P 500 Index surged during the period (+17%), despite bouts of significant volatility. After finishing its best year since 1997, the S&P 500 Index began 2014 with its worst month in nearly two years. Worries about an economic slowdown in China and general angst surrounding emerging markets overshadowed a fairly benign domestic environment. However, robust merger and acquisition activity and an uncontested increase in the debt ceiling from Congress helped stoke investors' risk appetites in February. The rally continued in May amid renewed signs of life in the housing market and the best payroll gain in more than two years. However, a pullback in July ended a streak of five consecutive monthly gains. Fear gripped the market as heightened geopolitical risks, a potential Portuguese banking crisis, and worries of U.S. Federal Reserve (Fed) tightening took center stage. Stocks rebounded in August as investors were emboldened by encouraging economic data, headlined by better-than-expected Gross Domestic Product (GDP) growth and signs that the housing recovery still had legs. In September, U.S. equities retreated for just the third month this year. Despite solid manufacturing and consumer confidence readings, the reality of quantitative easing ending and the prospect of higher federal funds rates in mid-2015 contributed to increased risk aversion levels. Stocks finished a volatile October at an all-time high on the heels of a positive earnings season and generally solid economic data. Returns varied noticeably by market-cap, as small- and mid-cap stocks underperformed large-cap stocks. Within the S&P 500 Index, Healthcare (+30%), Information Technology (+26%), and Utilities (+22%) posted the largest gains, while the Energy (+4%), Telecommunication Services (+5%), and Consumer Discretionary (+9%) sectors lagged on a relative basis.
The bond market, as measured by the Barclays Government/Credit Bond Index, returned 4.21% during the period. Fixed income markets gained throughout much of the period as expectations of prolonged easy monetary policy by major central banks and a supportive macroeconomic environment kept rates low and suppressed volatility. Early in the period emerging markets dominated headlines as economic and political developments sparked risk aversion across global markets, pushing bond prices higher and yields lower amid a flight to quality. Toward the end of the period, however, persistent geopolitical risks – tensions between Ukraine and Russia and violence in Iraq – and Chinese economic slowdown concerns raised questions about the global growth rate, keeping a lid on risk appetites overall.
The period was also highlighted by a divergence in central bank policies. The European Central Bank (ECB) cut its benchmark lending and deposit rates and announced a host of stimulus measures in an effort to encourage lending and fend off fears of deflation. China’s central bank joined the ECB in boosting liquidity by injecting funds into the nation’s largest banks in an attempt to combat weakening growth. The Bank of Japan pre-emptively announced incremental monetary easing to counter the risk of missing the country’s inflation and growth targets. In contrast, the Bank of England and the Fed leaned toward tighter policies. The Fed ended its quantitative easing program as U.S. data largely
| 3 |
| The Hartford Balanced Fund |
| Manager Discussion – (continued) |
| October 31, 2014 (Unaudited) |
suggested the economy was on a sustainable growth path. Second quarter GDP rebounded after the first quarter’s steep contraction. The labor market strengthened as the unemployment rate dropped to a six-year low. Housing regained some lost ground after a weak start to the year, though the pace of home price appreciation started to slow after a strong 2013. Inflation pressures were muted overall, alleviating pressure on the Fed to raise rates.
The U.S. Treasury curve flattened as markets contemplated bringing interest rates to normal levels; short-term yields rose while longer term rates declined. Most credit risk sectors posted positive absolute returns and outperformed duration-equivalent government bonds as credit spreads tightened.
The Fund has three primary levers to generate investment performance: equity investments, fixed income investments, and asset allocation among stocks, bonds, and cash. During the period, the equity portion of the Fund underperformed the S&P 500 Index, while the fixed income portion performed in line with the Barclays Government/Credit Bond Index. Asset allocation contributed positively to the custom benchmark-relative results as the Fund was overweight equities relative to this benchmark in an environment where equities outperformed.
Equity underperformance versus the S&P 500 Index was driven primarily by security selection within the Information Technology, Energy, and Consumer Discretionary sectors. An overweight to and security selection in Healthcare and an underweight to Telecommunications Services contributed to benchmark-relative performance.
During the period, stocks that detracted the most from relative returns in the equity portion of the Fund included Academy CoInvest (Consumer Discretionary), Apple (Information Technology) and BG Group (Energy). Our private placement position in Academy CoInvest, a U.S.-based apparel, fitness, and recreational products retailer, declined during the period driven by a change in the fair-value price derived from key comparable companies, a group that experienced declining earnings in aggregate. Academy CoInvest has been a positive absolute contributor since inception of the position. Shares of Apple, a maker of an interconnected ecosystem of computing and mobile devices, rose after the company posted better-than-expected quarterly earnings and gave solid guidance for the fourth quarter; our underweight relative to the benchmark detracted. Shares of BG Group, a UK-based natural gas company, fell short of consensus expectations as upstream operating profits fell as production declined due to a slide in crude oil prices which reverberated through the oil and gas industry. Academy, Ford Motor (Consumer Discretionary), and BG Group detracted most from absolute results during the period.
Top contributors to relative performance in the equity portion of the Fund during the period were Vertex Pharmaceuticals (Healthcare), Covidien (Healthcare) and Amazon.com (Consumer Discretionary). Shares of Vertex Pharmaceuticals, a biotechnology firm with a focus on cancer and neurodegenerative diseases, rose as the company launched its product to treat cystic fibrosis patients, which we believe puts the company in a good position to grow its platform in this treatment area. Covidien, a U.S.-based medical products, manufacturing and distribution company, outperformed over the period after medical device giant Medtronic agreed to acquire Covidien for a mix of cash and stock. Covidien also reported solid third quarter results as it continues to grow its key business segments. Not owning Amazon.com, a U.S.-based global e-commerce retailer, contributed to S&P 500 Index-relative results as the company has experienced three consecutive quarterly losses amid investor concerns that it is overstretched as it attempts to move into niche markets. The Fund’s holdings in Microsoft (Information Technology), and Wells Fargo (Financials) contributed on an absolute basis.
The fixed income portion of the Fund performed roughly in line with the Barclays Government/Credit Bond Index during the period. An out-of-benchmark allocation to agency pass-through mortgages contributed the most to benchmark-relative results. Security selection within investment grade corporates also contributed to relative results, particularly within industrials and financials. Non corporate investment grade credit detracted from relative results driven by sovereigns and local agencies.
Derivatives are not used in a significant manner in this Fund and did not have a material impact on performance during the period.
What is the outlook?
We believe U.S. fundamentals remain supportive of moderate growth, but acknowledge some risks have increased since the start of the year including geopolitical risks, such as continued conflicts in the Middle East, tougher Russian sanctions, and the cyber-security attacks.
The Healthcare and Consumer Staples sectors represented our largest sector overweight and underweight, respectively, at the end of the period.
On the fixed income side, we ended the period with a moderately positive risk posture, continuing to favor financial issuers within investment grade credit. We continued to hold an out-of-benchmark allocation, relative to the Fund’s custom benchmark, to agency mortgage backed securities. At the end of the period, the Fund’s equity exposure was at 69% compared to 60% in the Fund’s custom benchmark and at the upper end of the Fund’s 50-70% range.
| 4 |
| The Hartford Balanced Fund |
| Manager Discussion – (continued) |
| October 31, 2014 (Unaudited) |
Credit Exposure
as of October 31, 2014
| Credit Rating * | Percentage of Net Assets | |||
| Aaa/ AAA | 2.9 | % | ||
| Aa/ AA | 15.1 | |||
| A | 4.4 | |||
| Baa/ BBB | 4.6 | |||
| Ba/ BB | 0.2 | |||
| Non-Debt Securities and Other Short-Term Instruments | 72.7 | |||
| Other Assets and Liabilities | 0.1 | |||
| Total | 100.0 | % | ||
| * | Credit exposure is the long-term credit ratings for the Fund's holdings, as of the date noted, as provided by Standard and Poor's (S&P) or Moody's Investors Service (Moody's) and typically range from AAA/Aaa (highest) to C/D (lowest). Presentation of S&P and Moody's credit ratings in this report have been selected for informational purposes for shareholders, as well as the Fund's consideration of industry practice. If Moody's and S&P assign different ratings, the lower rating is used. Fixed income securities that are not rated by either agency are listed as "Not Rated." Ratings do not apply to the Fund itself or to the Fund's shares. Ratings may change. |
Diversification by Security Type
as of October 31, 2014
| Category | Percentage of Net Assets | |||
| Equity Securities | ||||
| Common Stocks | 68.8 | % | ||
| Total | 68.8 | % | ||
| Fixed Income Securities | ||||
| Asset & Commercial Mortgage Backed Securities | 0.3 | % | ||
| Corporate Bonds | 9.7 | |||
| Foreign Government Obligations | 0.1 | |||
| Municipal Bonds | 0.9 | |||
| U.S. Government Agencies | 2.6 | |||
| U.S. Government Securities | 13.6 | |||
| Total | 27.2 | % | ||
| Short-Term Investments | 3.9 | |||
| Other Assets and Liabilities | 0.1 | |||
| Total | 100.0 | % | ||
| 5 |
| The Hartford Balanced Fund |
| Schedule of Investments |
| October 31, 2014 |
| (000’s Omitted) |
| Shares or Principal Amount | Market Value ╪ | |||||||
| Common Stocks - 68.8% | ||||||||
| Automobiles and Components - 0.5% | ||||||||
| 269 | Ford Motor Co. | $ | 3,787 | |||||
| Banks - 3.9% | ||||||||
| 107 | BB&T Corp. | 4,046 | ||||||
| 101 | PNC Financial Services Group, Inc. | 8,708 | ||||||
| 288 | Wells Fargo & Co. | 15,279 | ||||||
| 28,033 | ||||||||
| Capital Goods - 4.6% | ||||||||
| 62 | 3M Co. | 9,519 | ||||||
| 92 | Eaton Corp. plc | 6,285 | ||||||
| 92 | Fortune Brands Home & Security, Inc. | 3,970 | ||||||
| 93 | Ingersoll-Rand plc | 5,830 | ||||||
| 38 | PACCAR, Inc. | 2,495 | ||||||
| 46 | United Technologies Corp. | 4,890 | ||||||
| 32,989 | ||||||||
| Consumer Durables and Apparel - 0.5% | ||||||||
| 34 | PVH Corp. | 3,934 | ||||||
| Diversified Financials - 6.7% | ||||||||
| 36 | Ameriprise Financial, Inc. | 4,593 | ||||||
| 23 | BlackRock, Inc. | 7,709 | ||||||
| 165 | Citigroup, Inc. | 8,816 | ||||||
| 30 | Goldman Sachs Group, Inc. | 5,738 | ||||||
| 165 | Invesco Ltd. | 6,661 | ||||||
| 247 | JP Morgan Chase & Co. | 14,933 | ||||||
| 48,450 | ||||||||
| Energy - 6.0% | ||||||||
| 65 | Anadarko Petroleum Corp. | 5,938 | ||||||
| 230 | BG Group plc | 3,830 | ||||||
| 58 | Chevron Corp. | 6,969 | ||||||
| 45 | EOG Resources, Inc. | 4,277 | ||||||
| 97 | Exxon Mobil Corp. | 9,420 | ||||||
| 106 | Halliburton Co. | 5,834 | ||||||
| 53 | Occidental Petroleum Corp. | 4,704 | ||||||
| 69 | Southwestern Energy Co. ● | 2,240 | ||||||
| 43,212 | ||||||||
| Food and Staples Retailing - 1.1% | ||||||||
| 89 | CVS Health Corp. | 7,663 | ||||||
| Food, Beverage and Tobacco - 3.3% | ||||||||
| 32 | Anheuser-Busch InBev N.V. ADR | 3,585 | ||||||
| 35 | Diageo plc ADR | 4,176 | ||||||
| 62 | Kraft Foods Group, Inc. | 3,481 | ||||||
| 113 | Mondelez International, Inc. | 3,991 | ||||||
| 48 | Philip Morris International, Inc. | 4,273 | ||||||
| 119 | Unilever N.V. NY Shares ADR | 4,617 | ||||||
| 24,123 | ||||||||
| Health Care Equipment and Services - 3.3% | ||||||||
| 64 | Baxter International, Inc. | 4,503 | ||||||
| 99 | Covidien plc | 9,133 | ||||||
| 55 | Medtronic, Inc. | 3,742 | ||||||
| 68 | UnitedHealth Group, Inc. | 6,480 | ||||||
| 23,858 | ||||||||
| Insurance - 2.3% | ||||||||
| 107 | American International Group, Inc. | 5,705 | ||||||
| 162 | Marsh & McLennan Cos., Inc. | 8,797 | ||||||
| 74 | Unum Group | 2,465 | ||||||
| 16,967 | ||||||||
| Materials - 1.9% | ||||||||
| 119 | Dow Chemical Co. | 5,879 | ||||||
| 98 | International Paper Co. | 4,945 | ||||||
| 60 | Nucor Corp. | 3,238 | ||||||
| 14,062 | ||||||||
| Media - 2.9% | ||||||||
| 76 | CBS Corp. Class B | 4,131 | ||||||
| 107 | Comcast Corp. Class A | 5,945 | ||||||
| 112 | Thomson Reuters Corp. | 4,165 | ||||||
| 76 | Walt Disney Co. | 6,936 | ||||||
| 21,177 | ||||||||
| Pharmaceuticals, Biotechnology and Life Sciences - 10.6% | ||||||||
| 74 | Agilent Technologies, Inc. | 4,074 | ||||||
| 44 | Amgen, Inc. | 7,103 | ||||||
| 79 | AstraZeneca plc ADR | 5,755 | ||||||
| 155 | Bristol-Myers Squibb Co. | 8,996 | ||||||
| 61 | Celgene Corp. ● | 6,575 | ||||||
| 69 | Gilead Sciences, Inc. ● | 7,683 | ||||||
| 28 | Johnson & Johnson | 2,986 | ||||||
| 223 | Merck & Co., Inc. | 12,938 | ||||||
| 20 | Roche Holding AG | 6,036 | ||||||
| 90 | UCB S.A. | 7,220 | ||||||
| 50 | Vertex Pharmaceuticals, Inc. ● | 5,576 | ||||||
| 55 | Zoetis, Inc. | 2,055 | ||||||
| 76,997 | ||||||||
| Retailing - 3.0% | ||||||||
| 2,007 | Allstar Co. ⌂●† | 1,703 | ||||||
| 10 | AutoZone, Inc. ● | 5,369 | ||||||
| 75 | Home Depot, Inc. | 7,314 | ||||||
| 67 | Nordstrom, Inc. | 4,865 | ||||||
| 32 | Tory Burch LLC ⌂●† | 2,123 | ||||||
| 21,374 | ||||||||
| Semiconductors and Semiconductor Equipment - 3.6% | ||||||||
| 115 | Analog Devices, Inc. | 5,682 | ||||||
| 276 | Intel Corp. | 9,370 | ||||||
| 277 | Maxim Integrated Products, Inc. | 8,124 | ||||||
| 65 | Xilinx, Inc. | 2,882 | ||||||
| 26,058 | ||||||||
| Software and Services - 6.6% | ||||||||
| 78 | Accenture plc | 6,287 | ||||||
| 95 | eBay, Inc. ● | 4,993 | ||||||
| 18 | Google, Inc. Class C ● | 9,895 | ||||||
| 300 | Microsoft Corp. | 14,104 | ||||||
| 139 | Oracle Corp. | 5,428 | ||||||
| 282 | Symantec Corp. | 7,007 | ||||||
| 47,714 | ||||||||
| Technology Hardware and Equipment - 5.5% | ||||||||
| 145 | Apple, Inc. | 15,703 | ||||||
| 487 | Cisco Systems, Inc. | 11,912 | ||||||
| 281 | EMC Corp. | 8,085 | ||||||
| 50 | Qualcomm, Inc. | 3,957 | ||||||
| 39,657 | ||||||||
| Telecommunication Services - 0.4% | ||||||||
| 56 | Verizon Communications, Inc. | 2,820 | ||||||
| Transportation - 0.9% | ||||||||
| 41 | FedEx Corp. | 6,780 | ||||||
The accompanying notes are an integral part of these financial statements.
| 6 |
| The Hartford Balanced Fund |
| Schedule of Investments – (continued) |
| October 31, 2014 |
| (000’s Omitted) |
| Shares or Principal Amount | Market Value ╪ | |||||||
| Common Stocks - 68.8% - (continued) | ||||||||
| Utilities - 1.2% | ||||||||
| 85 | NextEra Energy, Inc. | $ | 8,489 | |||||
| Total Common Stocks | ||||||||
| (Cost $337,315) | $ | 498,144 | ||||||
Asset and Commercial Mortgage Backed Securities - 0.3% | ||||||||
| Finance and Insurance - 0.3% | ||||||||
| Ally Master Owner Trust | ||||||||
| $ | 900 | 1.54%, 09/15/2019 | $ | 900 | ||||
| Hilton USA Trust | ||||||||
| 345 | 2.66%, 11/05/2030 ■ | 347 | ||||||
| Santander Drive Automotive Receivables Trust | ||||||||
| 85 | 2.33%, 11/15/2019 | 85 | ||||||
| 140 | 2.57%, 03/15/2019 | 142 | ||||||
| SBA Tower Trust | ||||||||
| 310 | 2.90%, 10/15/2044 ■Δ | 311 | ||||||
| Westlake Automobile Receivables Trust | ||||||||
| 360 | 0.97%, 10/16/2017 ■ | 360 | ||||||
| 2,145 | ||||||||
| Total Asset and Commercial Mortgage Backed Securities | ||||||||
| (Cost $2,143) | $ | 2,145 | ||||||
Corporate Bonds - 9.7% | ||||||||
| Accommodation and Food Services - 0.0% | ||||||||
| Sysco Corp. | ||||||||
| $ | 85 | 3.00%, 10/02/2021 | $ | 86 | ||||
| 50 | 3.50%, 10/02/2024 | 51 | ||||||
| 137 | ||||||||
| Air Transportation - 0.2% | ||||||||
| Continental Airlines, Inc. | ||||||||
| 623 | 5.98%, 04/19/2022 | 689 | ||||||
| Southwest Airlines Co. | ||||||||
| 400 | 5.75%, 12/15/2016 | 436 | ||||||
| 514 | 6.15%, 08/01/2022 | 590 | ||||||
| 1,715 | ||||||||
| Arts, Entertainment and Recreation - 0.5% | ||||||||
| 21st Century Fox America | ||||||||
| 180 | 4.00%, 10/01/2023 | 188 | ||||||
| British Sky Broadcasting Group plc | ||||||||
| 220 | 3.75%, 09/16/2024 ■ | 221 | ||||||
| Comcast Corp. | ||||||||
| 1,000 | 5.90%, 03/15/2016 | 1,070 | ||||||
| 150 | 6.40%, 05/15/2038 | 192 | ||||||
| DirecTV Holdings LLC | ||||||||
| 545 | 4.45%, 04/01/2024 | 569 | ||||||
| Discovery Communications, Inc. | ||||||||
| 55 | 3.25%, 04/01/2023 | 54 | ||||||
| News America, Inc. | ||||||||
| 220 | 4.50%, 02/15/2021 | 240 | ||||||
| Time Warner Cable, Inc. | ||||||||
| 780 | 5.85%, 05/01/2017 | 862 | ||||||
| 80 | 6.55%, 05/01/2037 | 101 | ||||||
| 60 | 7.30%, 07/01/2038 | 82 | ||||||
| Viacom, Inc. | ||||||||
| 145 | 3.88%, 12/15/2021 | 150 | ||||||
| 3,729 | ||||||||
| Beverage and Tobacco Product Manufacturing - 0.4% | ||||||||
| Altria Group, Inc. | ||||||||
| 330 | 4.50%, 05/02/2043 | 320 | ||||||
| 420 | 4.75%, 05/05/2021 | 463 | ||||||
| Anheuser-Busch InBev Worldwide, Inc. | ||||||||
| 610 | 7.75%, 01/15/2019 | 740 | ||||||
| BAT International Finance plc | ||||||||
| 565 | 3.25%, 06/07/2022 ■ | 567 | ||||||
| Coca-Cola Femsa S.A.B. de C.V. | ||||||||
| 222 | 2.38%, 11/26/2018 | 224 | ||||||
| 250 | 3.88%, 11/26/2023 | 260 | ||||||
| Molson Coors Brewing Co. | ||||||||
| 12 | 2.00%, 05/01/2017 | 12 | ||||||
| 180 | 3.50%, 05/01/2022 | 181 | ||||||
| 85 | 5.00%, 05/01/2042 | 88 | ||||||
| Philip Morris International, Inc. | ||||||||
| 300 | 2.63%, 03/06/2023 | 291 | ||||||
| 3,146 | ||||||||
| Chemical Manufacturing - 0.0% | ||||||||
| Monsanto Co. | ||||||||
| 65 | 4.70%, 07/15/2064 | 67 | ||||||
| Computer and Electronic Product Manufacturing - 0.1% | ||||||||
| Apple, Inc. | ||||||||
| 300 | 2.85%, 05/06/2021 | 304 | ||||||
| 270 | 3.45%, 05/06/2024 | 278 | ||||||
| 35 | 4.45%, 05/06/2044 | 37 | ||||||
| EMC Corp. | ||||||||
| 366 | 1.88%, 06/01/2018 | 364 | ||||||
| 983 | ||||||||
| Couriers and Messengers - 0.1% | ||||||||
| FedEx Corp. | ||||||||
| 50 | 2.63%, 08/01/2022 | 49 | ||||||
| 80 | 2.70%, 04/15/2023 | 77 | ||||||
| 180 | 4.90%, 01/15/2034 | 197 | ||||||
| 300 | 5.10%, 01/15/2044 | 330 | ||||||
| 653 | ||||||||
| Finance and Insurance - 4.7% | ||||||||
| ACE INA Holdings, Inc. | ||||||||
| 185 | 3.35%, 05/15/2024 | 186 | ||||||
| American Express Centurion Bank | ||||||||
| 1,200 | 6.00%, 09/13/2017 | 1,348 | ||||||
| American International Group, Inc. | ||||||||
| 180 | 4.13%, 02/15/2024 | 190 | ||||||
| American Tower Corp. | ||||||||
| 225 | 3.45%, 09/15/2021 | 220 | ||||||
| AvalonBay Communities, Inc. | ||||||||
| 150 | 3.63%, 10/01/2020 | 156 | ||||||
| Bank of America Corp. | ||||||||
| 750 | 4.20%, 08/26/2024 | 756 | ||||||
| 560 | 5.00%, 05/13/2021 | 620 | ||||||
| 1,200 | 5.42%, 03/15/2017 | 1,299 | ||||||
| Barclays Bank plc | ||||||||
| 200 | 2.50%, 02/20/2019 | 202 | ||||||
| 350 | 3.75%, 05/15/2024 | 354 | ||||||
| 150 | 6.05%, 12/04/2017 ■ | 166 | ||||||
| BNP Paribas | ||||||||
| 425 | 2.40%, 12/12/2018 | 428 | ||||||
| 65 | 3.25%, 03/03/2023 | 65 | ||||||
The accompanying notes are an integral part of these financial statements.
| 7 |
| The Hartford Balanced Fund |
| Schedule of Investments – (continued) |
| October 31, 2014 |
| (000’s Omitted) |
| Shares or Principal Amount | Market Value ╪ | |||||||
| Corporate Bonds - 9.7% - (continued) | ||||||||
| Finance and Insurance - 4.7% - (continued) | ||||||||
| BP Capital Markets plc | ||||||||
| $ | 25 | 3.99%, 09/26/2023 | $ | 26 | ||||
| 575 | 4.75%, 03/10/2019 | 634 | ||||||
| BPCE S.A. | ||||||||
| 375 | 2.50%, 12/10/2018 | 377 | ||||||
| 250 | 4.00%, 04/15/2024 | 258 | ||||||
| 200 | 5.15%, 07/21/2024 ■ | 206 | ||||||
| Brandywine Operating Partnership L.P. | ||||||||
| 350 | 5.70%, 05/01/2017 | 381 | ||||||
| Capital One Bank | ||||||||
| 345 | 2.15%, 11/21/2018 | 344 | ||||||
| Capital One Financial Corp. | ||||||||
| 445 | 2.15%, 03/23/2015 | 448 | ||||||
| 615 | 3.75%, 04/24/2024 | 623 | ||||||
| Caterpillar Financial Services Corp. | ||||||||
| 400 | 3.30%, 06/09/2024 | 402 | ||||||
| CDP Financial, Inc. | ||||||||
| 575 | 4.40%, 11/25/2019 ■ | 636 | ||||||
| Citigroup, Inc. | ||||||||
| 255 | 2.50%, 07/29/2019 | 256 | ||||||
| 300 | 4.95%, 11/07/2043 | 328 | ||||||
| 140 | 5.30%, 05/06/2044 | 149 | ||||||
| 550 | 5.85%, 08/02/2016 | 593 | ||||||
| 300 | 6.13%, 05/15/2018 | 341 | ||||||
| 105 | 8.13%, 07/15/2039 | 158 | ||||||
| Credit Agricole S.A. | ||||||||
| 405 | 2.50%, 04/15/2019 ■ | 408 | ||||||
| Credit Suisse New York | ||||||||
| 250 | 2.30%, 05/28/2019 | 250 | ||||||
| 335 | 3.63%, 09/09/2024 | 336 | ||||||
| Discover Financial Services | ||||||||
| 645 | 6.45%, 06/12/2017 | 720 | ||||||
| Eaton Vance Corp. | ||||||||
| 99 | 6.50%, 10/02/2017 | 112 | ||||||
| Five Corners Funding Trust | ||||||||
| 315 | 4.42%, 11/15/2023 ■ | 333 | ||||||
| Ford Motor Credit Co. LLC | ||||||||
| 615 | 2.38%, 03/12/2019 | 614 | ||||||
| General Electric Capital Corp. | ||||||||
| 400 | 3.10%, 01/09/2023 | 401 | ||||||
| 800 | 4.63%, 01/07/2021 | 892 | ||||||
| 925 | 5.88%, 01/14/2038 | 1,135 | ||||||
| Goldman Sachs Group, Inc. | ||||||||
| 655 | 2.38%, 01/22/2018 | 661 | ||||||
| 275 | 3.63%, 01/22/2023 | 276 | ||||||
| 250 | 3.70%, 08/01/2015 | 256 | ||||||
| 595 | 5.63%, 01/15/2017 | 645 | ||||||
| 470 | 6.25%, 02/01/2041 | 582 | ||||||
| HCP, Inc. | ||||||||
| 335 | 6.00%, 01/30/2017 | 370 | ||||||
| HSBC Holdings plc | ||||||||
| 650 | 6.10%, 01/14/2042 | 841 | ||||||
| ING Bank N.V. | ||||||||
| 900 | 3.75%, 03/07/2017 ■ | 948 | ||||||
| JP Morgan Chase & Co. | ||||||||
| 650 | 3.25%, 09/23/2022 | 651 | ||||||
| 180 | 3.38%, 05/01/2023 | 176 | ||||||
| 475 | 3.70%, 01/20/2015 | 478 | ||||||
| 230 | 5.40%, 01/06/2042 | 267 | ||||||
| 100 | 6.30%, 04/23/2019 | 116 | ||||||
| Korea Development Bank | ||||||||
| 550 | 2.50%, 03/11/2020 | 548 | ||||||
| Liberty Mutual Group, Inc. | ||||||||
| 100 | 4.25%, 06/15/2023 ■ | 103 | ||||||
| Loews Corp. | ||||||||
| 165 | 2.63%, 05/15/2023 | 157 | ||||||
| Merrill Lynch & Co., Inc. | ||||||||
| 300 | 6.40%, 08/28/2017 | 338 | ||||||
| MetLife, Inc. | ||||||||
| 60 | 1.90%, 12/15/2017 | 61 | ||||||
| 525 | 3.60%, 04/10/2024 | 535 | ||||||
| 235 | 4.88%, 11/13/2043 | 255 | ||||||
| Morgan Stanley | ||||||||
| 425 | 2.50%, 01/24/2019 | 428 | ||||||
| 200 | 3.70%, 10/23/2024 | 200 | ||||||
| 550 | 5.75%, 01/25/2021 | 631 | ||||||
| National City Corp. | ||||||||
| 125 | 6.88%, 05/15/2019 | 148 | ||||||
| Nissan Motor Acceptance Corp. | ||||||||
| 700 | 1.80%, 03/15/2018 ■ | 700 | ||||||
| Nordea Bank AB | ||||||||
| 330 | 3.70%, 11/13/2014 ■ | 330 | ||||||
| Prudential Financial, Inc. | ||||||||
| 200 | 3.50%, 05/15/2024 | 201 | ||||||
| 300 | 4.50%, 11/15/2020 | 326 | ||||||
| Rabobank Nederland | ||||||||
| 750 | 3.20%, 03/11/2015 ■ | 757 | ||||||
| Republic New York Capital I | ||||||||
| 250 | 7.75%, 11/15/2026 | 252 | ||||||
| Scentre Group | ||||||||
| 345 | 2.38%, 11/05/2019 ■☼ | 344 | ||||||
| Sovereign Bancorp, Inc. | ||||||||
| 1,000 | 8.75%, 05/30/2018 | 1,210 | ||||||
| State Grid Overseas Investment | ||||||||
| 380 | 2.75%, 05/07/2019 ■ | 383 | ||||||
| Synchrony Financial | ||||||||
| 75 | 3.00%, 08/15/2019 | 76 | ||||||
| Teachers Insurance & Annuity Association of America | ||||||||
| 100 | 4.90%, 09/15/2044 ■ | 106 | ||||||
| U.S. Bancorp | ||||||||
| 165 | 3.70%, 01/30/2024 | 172 | ||||||
| Wachovia Corp. | ||||||||
| 100 | 5.75%, 06/15/2017 | 111 | ||||||
| Wellpoint, Inc. | ||||||||
| 81 | 3.30%, 01/15/2023 | 80 | ||||||
| Wells Fargo & Co. | ||||||||
| 1,794 | 4.48%, 01/16/2024 | 1,899 | ||||||
| 33,969 | ||||||||
| Food Manufacturing - 0.2% | ||||||||
| ConAgra Foods, Inc. | ||||||||
| 50 | 1.90%, 01/25/2018 | 50 | ||||||
| Kraft Foods Group, Inc. | ||||||||
| 145 | 2.25%, 06/05/2017 | 148 | ||||||
| 90 | 3.50%, 06/06/2022 | 92 | ||||||
| Mondelez International, Inc. | ||||||||
| 700 | 4.13%, 02/09/2016 | 728 | ||||||
| Tyson Foods, Inc. | ||||||||
| 65 | 2.65%, 08/15/2019 | 66 | ||||||
| 1,084 | ||||||||
The accompanying notes are an integral part of these financial statements.
| 8 |
| The Hartford Balanced Fund |
| Schedule of Investments – (continued) |
| October 31, 2014 |
| (000’s Omitted) |
| Shares or Principal Amount | Market Value ╪ | |||||||
| Corporate Bonds - 9.7% - (continued) | ||||||||
| Health Care and Social Assistance - 0.7% | ||||||||
| Actavis Funding SCS | ||||||||
| $ | 250 | 4.85%, 06/15/2044 ■ | $ | 236 | ||||
| Bayer Finance LLC | ||||||||
| 375 | 3.00%, 10/08/2021 ■ | 377 | ||||||
| Catholic Health Initiatives | ||||||||
| 155 | 2.60%, 08/01/2018 | 158 | ||||||
| Celgene Corp. | ||||||||
| 55 | 2.25%, 05/15/2019 | 55 | ||||||
| 125 | 3.63%, 05/15/2024 | 126 | ||||||
| CVS Caremark Corp. | ||||||||
| 470 | 4.00%, 12/05/2023 | 495 | ||||||
| Dignity Health | ||||||||
| 35 | 2.64%, 11/01/2019 | 35 | ||||||
| 80 | 3.81%, 11/01/2024 | 82 | ||||||
| Eli Lilly & Co. | ||||||||
| 215 | 4.65%, 06/15/2044 | 232 | ||||||
| Express Scripts Holding Co. | ||||||||
| 315 | 2.25%, 06/15/2019 | 313 | ||||||
| 460 | 3.50%, 06/15/2024 | 456 | ||||||
| Forest Laboratories, Inc. | ||||||||
| 60 | 4.88%, 02/15/2021 ■ | 64 | ||||||
| Gilead Sciences, Inc. | ||||||||
| 195 | 3.70%, 04/01/2024 | 200 | ||||||
| GlaxoSmithKline Capital, Inc. | ||||||||
| 460 | 2.80%, 03/18/2023 | 452 | ||||||
| Kaiser Foundation Hospitals | ||||||||
| 60 | 3.50%, 04/01/2022 | 61 | ||||||
| 115 | 4.88%, 04/01/2042 | 128 | ||||||
| McKesson Corp. | ||||||||
| 25 | 2.85%, 03/15/2023 | 24 | ||||||
| 205 | 3.80%, 03/15/2024 | 208 | ||||||
| Medtronic, Inc. | ||||||||
| 65 | 3.63%, 03/15/2024 | 66 | ||||||
| Merck & Co., Inc. | ||||||||
| 315 | 2.80%, 05/18/2023 | 312 | ||||||
| 125 | 4.15%, 05/18/2043 | 130 | ||||||
| Novartis Capital Corp. | ||||||||
| 550 | 3.40%, 05/06/2024 | 565 | ||||||
| Zoetis, Inc. | ||||||||
| 30 | 3.25%, 02/01/2023 | 30 | ||||||
| 35 | 4.70%, 02/01/2043 | 36 | ||||||
| 4,841 | ||||||||
| Information - 0.6% | ||||||||
| America Movil S.A.B. de C.V. | ||||||||
| 250 | 3.13%, 07/16/2022 | 246 | ||||||
| AT&T, Inc. | ||||||||
| 25 | 5.35%, 09/01/2040 | 27 | ||||||
| 105 | 5.55%, 08/15/2041 | 115 | ||||||
| 175 | 6.55%, 02/15/2039 | 217 | ||||||
| Orange S.A. | ||||||||
| 650 | 4.13%, 09/14/2021 | 687 | ||||||
| Verizon Communications, Inc. | ||||||||
| 45 | 3.45%, 03/15/2021 | 46 | ||||||
| 490 | 3.50%, 11/01/2021 | 500 | ||||||
| 880 | 4.50%, 09/15/2020 | 955 | ||||||
| 130 | 4.75%, 11/01/2041 | 131 | ||||||
| 1,180 | 6.40%, 09/15/2033 | 1,437 | ||||||
| 4,361 | ||||||||
| Machinery Manufacturing - 0.1% | ||||||||
| Caterpillar, Inc. | ||||||||
| 170 | 3.40%, 05/15/2024 | 174 | ||||||
| 100 | 4.30%, 05/15/2044 | 103 | ||||||
| Hutchison Whampoa International Ltd. | ||||||||
| 200 | 3.63%, 10/31/2024 ■ | 198 | ||||||
| 475 | ||||||||
| Mining - 0.1% | ||||||||
| BHP Billiton Finance USA Ltd. | ||||||||
| 335 | 3.85%, 09/30/2023 | 351 | ||||||
| Rio Tinto Finance USA Ltd. | ||||||||
| 365 | 3.75%, 09/20/2021 | 380 | ||||||
| 731 | ||||||||
| Miscellaneous Manufacturing - 0.0% | ||||||||
| United Technologies Corp. | ||||||||
| 65 | 3.10%, 06/01/2022 | 66 | ||||||
| Motor Vehicle and Parts Manufacturing - 0.1% | ||||||||
| Daimler Finance NA LLC | ||||||||
| 1,000 | 2.63%, 09/15/2016 ■ | 1,029 | ||||||
| Other Services - 0.0% | ||||||||
| Illinois Tool Works, Inc. | ||||||||
| 165 | 3.50%, 03/01/2024 | 170 | ||||||
| Petroleum and Coal Products Manufacturing - 0.4% | ||||||||
| Atmos Energy Corp. | ||||||||
| 1,160 | 6.35%, 06/15/2017 | 1,308 | ||||||
| Gazprom Neft OAO via GPN Capital S.A. | ||||||||
| 200 | 4.38%, 09/19/2022 ■ | 177 | ||||||
| Schlumberger Investment S.A. | ||||||||
| 330 | 3.65%, 12/01/2023 | 345 | ||||||
| Shell International Finance B.V. | ||||||||
| 200 | 4.38%, 03/25/2020 | 221 | ||||||
| Statoil ASA | ||||||||
| 310 | 2.90%, 11/08/2020 | 318 | ||||||
| Total Capital S.A. | ||||||||
| 325 | 2.70%, 01/25/2023 | 316 | ||||||
| 2,685 | ||||||||
| Pipeline Transportation - 0.2% | ||||||||
| Kinder Morgan Energy Partners L.P. | ||||||||
| 1,000 | 6.95%, 01/15/2038 | 1,167 | ||||||
| Real Estate, Rental and Leasing - 0.1% | ||||||||
| ERAC USA Finance Co. | ||||||||
| 140 | 2.35%, 10/15/2019 ■ | 139 | ||||||
| 70 | 2.75%, 03/15/2017 ■ | 72 | ||||||
| 510 | 4.50%, 08/16/2021 ■ | 555 | ||||||
| 250 | 5.63%, 03/15/2042 ■ | 285 | ||||||
| 1,051 | ||||||||
| Retail Trade - 0.3% | ||||||||
| Amazon.com, Inc. | ||||||||
| 285 | 2.50%, 11/29/2022 | 267 | ||||||
| AutoZone, Inc. | ||||||||
| 200 | 3.13%, 07/15/2023 | 195 | ||||||
| 355 | 3.70%, 04/15/2022 | 363 | ||||||
| Home Depot, Inc. | ||||||||
| 75 | 4.40%, 03/15/2045 | 79 | ||||||
| Kroger (The) Co. | ||||||||
| 125 | 3.30%, 01/15/2021 | 127 | ||||||
| 230 | 4.00%, 02/01/2024 | 239 | ||||||
The accompanying notes are an integral part of these financial statements.
| 9 |
| The Hartford Balanced Fund |
| Schedule of Investments – (continued) |
| October 31, 2014 |
| (000’s Omitted) |
| Shares or Principal Amount | Market Value ╪ | |||||||
| Corporate Bonds - 9.7% - (continued) | ||||||||
| Retail Trade - 0.3% - (continued) | ||||||||
| Lowe's Cos., Inc. | ||||||||
| $ | 600 | 4.63%, 04/15/2020 | $ | 668 | ||||
| 1,938 | ||||||||
| Soap, Cleaning Compound and Toilet Manufacturing - 0.3% | ||||||||
| Procter & Gamble Co. | ||||||||
| 1,457 | 9.36%, 01/01/2021 | 1,817 | ||||||
| Utilities - 0.6% | ||||||||
| Consolidated Edison Co. of NY | ||||||||
| 655 | 5.30%, 12/01/2016 | 714 | ||||||
| Electricitie De France | ||||||||
| 525 | 4.88%, 01/22/2044 ■ | 559 | ||||||
| 525 | 5.63%, 01/22/2024 ■♠ | 556 | ||||||
| Indianapolis Power and Light | ||||||||
| 750 | 6.60%, 06/01/2037 ■ | 1,024 | ||||||
| NiSource Finance Corp. | ||||||||
| 70 | 4.80%, 02/15/2044 | 74 | ||||||
| Pacific Gas & Electric Co. | ||||||||
| 135 | 3.85%, 11/15/2023 | 142 | ||||||
| 85 | 5.13%, 11/15/2043 | 96 | ||||||
| Southern California Edison Co. | ||||||||
| 750 | 5.55%, 01/15/2037 | 921 | ||||||
| 4,086 | ||||||||
| Wholesale Trade - 0.0% | ||||||||
| Heineken N.V. | ||||||||
| 245 | 2.75%, 04/01/2023 ■ | 234 | ||||||
| 10 | 4.00%, 10/01/2042 ■ | 9 | ||||||
| 243 | ||||||||
| Total Corporate Bonds | ||||||||
| (Cost $65,689) | $ | 70,143 | ||||||
Foreign Government Obligations - 0.1% | ||||||||
| Mexico - 0.1% | ||||||||
| Mexico (United Mexican States) | ||||||||
| $ | 372 | 3.50%, 01/21/2021 | $ | 383 | ||||
| Total Foreign Government Obligations | ||||||||
| (Cost $370) | $ | 383 | ||||||
Municipal Bonds - 0.9% | ||||||||
| General Obligations - 0.2% | ||||||||
| California State GO, Taxable, | ||||||||
| $ | 250 | 7.55%, 04/01/2039 | $ | 375 | ||||
| Chicago, IL, Metropolitan Water Reclamation GO, | ||||||||
| 130 | 5.72%, 12/01/2038 | 162 | ||||||
| Illinois State GO, | ||||||||
| 150 | 5.10%, 06/01/2033 | 147 | ||||||
| Los Angeles, CA, USD GO, | ||||||||
| 800 | 5.75%, 07/01/2034 | 987 | ||||||
| 1,671 | ||||||||
| Health Care/Services - 0.1% | ||||||||
| University of California, | ||||||||
| 100 | 6.55%, 05/15/2048 | 132 | ||||||
| University of California, Regents MedCenter Pooled Rev, | ||||||||
| 375 | 6.58%, 05/15/2049 | 494 | ||||||
| 626 | ||||||||
| Higher Education (Univ., Dorms, etc.) - 0.1% | ||||||||
| University of California, Build America Bonds Rev, | ||||||||
| 370 | 5.77%, 05/15/2043 | 454 | ||||||
| Tax Allocation - 0.1% | ||||||||
| Dallas, TX, Area Rapid Transit Sales Tax Rev, | ||||||||
| 425 | 6.00%, 12/01/2044 | 558 | ||||||
| Transportation - 0.4% | ||||||||
| Bay Area, CA, Toll Auth Bridge Rev, | ||||||||
| 650 | 6.26%, 04/01/2049 | 894 | ||||||
| Illinois State Toll Highway Auth, Taxable Rev, | ||||||||
| 350 | 6.18%, 01/01/2034 | 442 | ||||||
| Maryland State Transportation Auth, | ||||||||
| 255 | 5.89%, 07/01/2043 | 326 | ||||||
| New York & New Jersey PA, | ||||||||
| 185 | 5.86%, 12/01/2024 | 230 | ||||||
| 115 | 6.04%, 12/01/2029 | 145 | ||||||
| North Texas Tollway Auth Rev, | ||||||||
| 730 | 6.72%, 01/01/2049 | 1,015 | ||||||
| 3,052 | ||||||||
| Utilities - Combined - 0.0% | ||||||||
| Utility Debt Securitization Auth, New York, | ||||||||
| 100 | 3.44%, 12/15/2025 | 104 | ||||||
| Utilities - Electric - 0.0% | ||||||||
| Municipal Elec Auth Georgia, | ||||||||
| 150 | 6.64%, 04/01/2057 | 191 | ||||||
| Total Municipal Bonds | ||||||||
| (Cost $5,326) | $ | 6,656 | ||||||
| U.S. Government Agencies - 2.6% | ||||||||
| FHLMC - 0.4% | ||||||||
| $ | 68 | 4.00%, 03/01/2041 | $ | 73 | ||||
| 2,815 | 4.50%, 08/01/2033 - 11/01/2043 | 3,057 | ||||||
| 3,130 | ||||||||
| FNMA - 1.9% | ||||||||
| 12,387 | 4.50%, 04/01/2039 - 06/01/2044 | 13,448 | ||||||
| GNMA - 0.3% | ||||||||
| 436 | 6.00%, 11/20/2023 - 09/15/2034 | 494 | ||||||
| 591 | 6.50%, 04/15/2026 - 02/15/2035 | 675 | ||||||
| 628 | 7.00%, 11/15/2031 - 11/15/2033 | 743 | ||||||
| 137 | 8.00%, 12/15/2029 - 02/15/2031 | 149 | ||||||
| 2,061 | ||||||||
| Total U.S. Government Agencies | ||||||||
| (Cost $18,212) | $ | 18,639 | ||||||
| U.S. Government Securities - 13.6% | ||||||||
| Other Direct Federal Obligations - 0.9% | ||||||||
| FFC - 0.9% | ||||||||
| $ | 5,000 | 9.80%, 04/06/2018 | $ | 6,423 | ||||
The accompanying notes are an integral part of these financial statements.
| 10 |
| The Hartford Balanced Fund |
| Schedule of Investments – (continued) |
| October 31, 2014 |
| (000’s Omitted) |
| Shares or Principal Amount | Market Value ╪ | |||||||||||
| U.S. Government Securities - 13.6% - (continued) | ||||||||||||
| U.S. Treasury Securities - 12.7% | ||||||||||||
| U.S. Treasury Bonds - 1.9% | ||||||||||||
| $ | 865 | 2.75%, 11/15/2042 | $ | 813 | ||||||||
| 5,420 | 2.88%, 05/15/2043 | 5,218 | ||||||||||
| 3,988 | 3.13%, 02/15/2043 - 08/15/2044 | 4,035 | ||||||||||
| 1,850 | 3.38%, 05/15/2044 | 1,963 | ||||||||||
| 1,400 | 6.00%, 02/15/2026 ‡ | 1,890 | ||||||||||
| 13,919 | ||||||||||||
| U.S. Treasury Notes - 10.8% | ||||||||||||
| 490 | 0.25%, 11/30/2015 | 491 | ||||||||||
| 4,350 | 0.38%, 06/30/2015 - 05/31/2016 □ | 4,354 | ||||||||||
| 15,000 | 0.50%, 08/31/2016 | 15,021 | ||||||||||
| 1,500 | 0.63%, 05/31/2017 | 1,494 | ||||||||||
| 534 | 0.88%, 01/31/2017 | 537 | ||||||||||
| 9,300 | 1.00%, 09/30/2016 - 05/31/2018 | 9,321 | ||||||||||
| 1,525 | 1.25%, 11/30/2018 | 1,516 | ||||||||||
| 9,400 | 1.38%, 09/30/2018 | 9,413 | ||||||||||
| 5,000 | 1.50%, 06/30/2016 | 5,091 | ||||||||||
| 8,280 | 1.63%, 07/31/2019 | 8,300 | ||||||||||
| 9,745 | 1.75%, 09/30/2019 | 9,810 | ||||||||||
| 2,365 | 2.38%, 08/15/2024 | 2,374 | ||||||||||
| 1,850 | 2.75%, 02/15/2024 | 1,921 | ||||||||||
| 955 | 3.50%, 05/15/2020 | 1,043 | ||||||||||
| 1,950 | 3.88%, 05/15/2018 | 2,131 | ||||||||||
| 5,200 | 4.50%, 05/15/2017 | 5,688 | ||||||||||
| 78,505 | ||||||||||||
| 92,424 | ||||||||||||
| Total U.S. Government Securities | ||||||||||||
| (Cost $95,670) | $ | 98,847 | ||||||||||
| Total Long-Term Investments | ||||||||||||
| (Cost $524,725) | $ | 694,957 | ||||||||||
| Short-Term Investments - 3.9% | ||||||||||||
| Repurchase Agreements - 3.9% | ||||||||||||
| Bank of America Merrill Lynch TriParty Repurchase Agreement (maturing on 11/03/2014 in the amount of $82, collateralized by U.S. Treasury Note 1.50%, 2019, value of $83) | ||||||||||||
| $ | 81 | 0.08%, 10/31/2014 | $ | 81 | ||||||||
| Bank of America Merrill Lynch TriParty Repurchase Agreement (maturing on 11/03/2014 in the amount of $1,389, collateralized by GNMA 1.63% - 7.00%, 2031 - 2054, value of $1,417) | ||||||||||||
| 1,389 | 0.09%, 10/31/2014 | 1,389 | ||||||||||
| Bank of Montreal TriParty Repurchase Agreement (maturing on 11/03/2014 in the amount of $373, collateralized by U.S. Treasury Bond 2.88% - 5.25%, 2029 - 2043, U.S. Treasury Note 0.38% - 4.50%, 2015 - 2022, value of $381) | ||||||||||||
| 373 | 0.08%, 10/31/2014 | 373 | ||||||||||
| Bank of Montreal TriParty Repurchase Agreement (maturing on 11/03/2014 in the amount of $1,265, collateralized by FHLMC 2.00% - 5.50%, 2022 - 2034, FNMA 2.00% - 4.50%, 2024 - 2039, GNMA 3.00%, 2043, U.S. Treasury Note 4.63%, 2017, value of $1,290) | ||||||||||||
| 1,265 | 0.10%, 10/31/2014 | 1,265 | ||||||||||
| Barclays Capital TriParty Repurchase Agreement (maturing on 11/03/2014 in the amount of $4,766, collateralized by U.S. Treasury Bond 4.50% - 6.25%, 2023 - 2036, U.S. Treasury Note 1.63% - 2.13%, 2015 - 2019, value of $4,861) | ||||||||||||
| 4,766 | 0.08%, 10/31/2014 | 4,766 | ||||||||||
| Citigroup Global Markets, Inc. TriParty Repurchase Agreement (maturing on 11/03/2014 in the amount of $5,478, collateralized by U.S. Treasury Bill 0.02%, 2015, U.S. Treasury Bond 3.88% - 11.25%, 2015 - 2040, U.S. Treasury Note 2.00% - 3.38%, 2019 - 2021, value of $5,587) | ||||||||||||
| 5,478 | 0.09%, 10/31/2014 | 5,478 | ||||||||||
| Deutsche Bank Securities TriParty Repurchase Agreement (maturing on 11/03/2014 in the amount of $316, collateralized by U.S. Treasury Note 0.88%, 2017, value of $323) | ||||||||||||
| 316 | 0.13%, 10/31/2014 | 316 | ||||||||||
| RBS Securities, Inc. TriParty Repurchase Agreement (maturing on 11/03/2014 in the amount of $465, collateralized by U.S. Treasury Bond 3.63% - 5.00%, 2037 - 2043, U.S. Treasury Note 2.13%, 2020, value of $475) | ||||||||||||
| 465 | 0.07%, 10/31/2014 | 465 | ||||||||||
| Societe Generale TriParty Repurchase Agreement (maturing on 11/03/2014 in the amount of $4,904, collateralized by U.S. Treasury Bill 0.02%, 2015, U.S. Treasury Bond 3.75% - 11.25%, 2015 - 2043, U.S. Treasury Note 1.38% - 4.25%, 2015 - 2022, value of $5,002) | ||||||||||||
| 4,904 | 0.08%, 10/31/2014 | 4,904 | ||||||||||
| TD Securities TriParty Repurchase Agreement (maturing on 11/03/2014 in the amount of $9,503, collateralized by FHLMC 3.00% - 4.00%, 2026 - 2044, FNMA 2.50% - 5.00%, 2025 - 2044, U.S. Treasury Bond 3.50% - 6.50%, 2026 - 2041, U.S. Treasury Note 1.75% - 2.88%, 2018 - 2019, value of $9,693) | ||||||||||||
| 9,503 | 0.10%, 10/31/2014 | 9,503 | ||||||||||
| 28,540 | ||||||||||||
| Total Short-Term Investments | ||||||||||||
| (Cost $28,540) | $ | 28,540 | ||||||||||
| Total Investments | ||||||||||||
| (Cost $553,265) ▲ | 99.9 | % | $ | 723,497 | ||||||||
| Other Assets and Liabilities | 0.1 | % | 811 | |||||||||
| Total Net Assets | 100.0 | % | $ | 724,308 | ||||||||
The accompanying notes are an integral part of these financial statements.
| 11 |
| The Hartford Balanced Fund |
| Schedule of Investments – (continued) |
| October 31, 2014 |
| (000’s Omitted) |
| Note: | Percentage of investments as shown is the ratio of the total market value to total net assets. |
Prices of foreign equities that are principally traded on certain foreign markets may be adjusted daily pursuant to a fair value pricing service approved by the Board of Directors in order to reflect an adjustment for factors occurring after the close of certain foreign markets but before the close of the New York Stock Exchange.
The Fund may refer to any one or more of the industry classifications used by one or more widely recognized market indices, ratings group indices and/or as defined by Fund management. Industry classifications may not be identical across all security types.
Equity industry classifications used in this report are the Global Industry Classification Standard, which was developed by and is the exclusive property and service mark of MSCI, Inc. and Standard & Poor’s.
For Fund compliance purposes, the Fund may not use the same classification system shown in this report as these classifications are used for reporting ease.
| ▲ | At October 31, 2014, the cost of securities for federal income tax purposes was $556,241 and the aggregate gross unrealized appreciation and depreciation based on that cost were: |
| Unrealized Appreciation | $ | 172,827 | ||
| Unrealized Depreciation | (5,571 | ) | ||
| Net Unrealized Appreciation | $ | 167,256 |
| † | These securities were valued in good faith at fair value as determined under policies and procedures established by and under the supervision of the Board of Directors. At October 31, 2014, the aggregate fair value of these securities was $3,826, which represents 0.5% of total net assets. This amount excludes securities that are principally traded in certain foreign markets and whose prices are adjusted pursuant to a third party pricing service methodology approved by the Board of Directors. |
| ● | Non-income producing. |
| Δ | Variable rate securities; the rate reported is the coupon rate in effect at October 31, 2014. |
| ■ | Securities issued within terms of a private placement memorandum, exempt from registration under Rule 144A under the Securities Act of 1933, as amended, and may be sold only to qualified institutional buyers. Unless otherwise indicated, these holdings are determined to be liquid. At October 31, 2014, the aggregate value of these securities was $12,740, which represents 1.8% of total net assets. |
| ⌂ | The following securities are considered illiquid. Illiquid securities are often purchased in private placement transactions, are often not registered under the Securities Act of 1933, as amended, and may have contractual restrictions on resale. A security may also be considered illiquid if the security lacks a readily available market or if its valuation has not changed for a certain period of time. |
| Period Acquired | Shares/ Par | Security | Cost Basis | |||||||
| 08/2011 | 2,007 | Allstar Co. | $ | 873 | ||||||
| 11/2013 | 32 | Tory Burch LLC | 2,539 | |||||||
At October 31, 2014, the aggregate value of these securities was $3,826, which represents 0.5% of total net assets.
| ♠ | Perpetual maturity security. Maturity date shown is the next call date or final legal maturity date, whichever comes first. |
| ☼ | This security, or a portion of this security, was purchased on a when-issued or delayed-delivery basis. The cost of these securities was $343 at October 31, 2014. |
| ‡ | This security, or a portion of this security, has been segregated to cover funding requirements on investment transactions settling in the future. |
| □ | This security, or a portion of this security, has been pledged as collateral in connection with futures contracts. |
The accompanying notes are an integral part of these financial statements.
| 12 |
| The Hartford Balanced Fund |
| Schedule of Investments – (continued) |
| October 31, 2014 |
| (000’s Omitted) |
Futures Contracts Outstanding at October 31, 2014
| Number of | Expiration | Notional | Market | Unrealized Appreciation/(Depreciation) | Variation Margin | |||||||||||||||||||||||
| Description | Contracts* | Date | Amount | Value ╪ | Asset | Liability | Asset | Liability | ||||||||||||||||||||
| Long position contracts: | ||||||||||||||||||||||||||||
| U.S. Treasury 10-Year Note Future | 31 | 12/19/2014 | $ | 3,880 | $ | 3,917 | $ | 37 | $ | — | $ | — | $ | (8 | ) | |||||||||||||
| * | The number of contracts does not omit 000's. |
TBA Sale Commitments Outstanding at October 31, 2014
| Description | Principal Amount | Maturity Date | Market Value ╪ | Unrealized Appreciation/ Depreciation | ||||||||||
| FNMA, 4.50% | $ | 4,100 | 11/15/2044 | $ | 4,443 | $ | (11 | ) | ||||||
At October 31, 2014, the aggregate market value of these securities represents 0.6% of total net assets.
| ╪ | See Significant Accounting Policies of accompanying Notes to Financial Statements regarding valuation of securities. |
| GLOSSARY: (abbreviations used in preceding Schedule of Investments) | |
| Municipal Bond Abbreviations: | |
| GO | General Obligation |
| PA | Port Authority |
| Rev | Revenue |
| USD | United School District |
| Other Abbreviations: | |
| ADR | American Depositary Receipt |
| FFC | Federal Financing Corp. |
| FHLMC | Federal Home Loan Mortgage Corp. |
| FNMA | Federal National Mortgage Association |
| GNMA | Government National Mortgage Association |
| TBA | To Be Announced |
The accompanying notes are an integral part of these financial statements.
| 13 |
| The Hartford Balanced Fund |
| Schedule of Investments – (continued) |
| October 31, 2014 |
| (000’s Omitted) |
| Investment Valuation Hierarchy Level Summary |
| October 31, 2014 |
| Total | Level 1 ♦ | Level 2 ♦ | Level 3 | |||||||||||||
| Assets: | ||||||||||||||||
| Asset and Commercial Mortgage Backed Securities | $ | 2,145 | $ | — | $ | 2,145 | $ | — | ||||||||
| Common Stocks ‡ | 498,144 | 477,232 | 17,086 | 3,826 | ||||||||||||
| Corporate Bonds | 70,143 | — | 68,864 | 1,279 | ||||||||||||
| Foreign Government Obligations | 383 | — | 383 | — | ||||||||||||
| Municipal Bonds | 6,656 | — | 6,656 | — | ||||||||||||
| U.S. Government Agencies | 18,639 | — | 18,639 | — | ||||||||||||
| U.S. Government Securities | 98,847 | 4,216 | 94,631 | — | ||||||||||||
| Short-Term Investments | 28,540 | — | 28,540 | — | ||||||||||||
| Total | $ | 723,497 | $ | 481,448 | $ | 236,944 | $ | 5,105 | ||||||||
| Futures * | $ | 37 | $ | 37 | $ | — | $ | — | ||||||||
| Total | $ | 37 | $ | 37 | $ | — | $ | — | ||||||||
| Liabilities: | ||||||||||||||||
| TBA Sale Commitments | $ | 4,443 | $ | — | $ | 4,443 | $ | — | ||||||||
| Total | $ | 4,443 | $ | — | $ | 4,443 | $ | — | ||||||||
| ♦ | For the year ended October 31, 2014, there were no transfers between Level 1 and Level 2. |
| ‡ | The Fund has all or primarily all of the equity securities categorized in a particular level. Refer to the Schedule of Investments for further industry breakout. |
| * | Derivative instruments (excluding purchased and written options, if applicable) are valued at the unrealized appreciation/depreciation on the investments. |
Following is a reconciliation of Level 3 assets for which significant unobservable inputs were used to determine fair value:
| Balance as of October 31, 2013 | Realized Gain (Loss) | Change in Unrealized Appreciation (Depreciation) | Net Amortization | Purchases | Sales | Transfers Into Level 3 | Transfers Out of Level 3 | Balance as of October 31, 2014 | ||||||||||||||||||||||||||||
| Assets: | ||||||||||||||||||||||||||||||||||||
| Common Stocks | $ | 3,849 | $ | 140 | $ | (2,205 | )* | $ | — | $ | 2,539 | $ | (497 | ) | $ | — | $ | — | $ | 3,826 | ||||||||||||||||
| Corporate Bonds | 1,323 | — | 7 | † | — | — | (51 | ) | — | — | 1,279 | |||||||||||||||||||||||||
| Total | $ | 5,172 | $ | 140 | $ | (2,198 | ) | $ | — | $ | 2,539 | $ | (548 | ) | $ | — | $ | — | $ | 5,105 | ||||||||||||||||
| * | Change in unrealized appreciation (depreciation) in the current period relating to assets still held at October 31, 2014 was $(2,090). |
| † | Change in unrealized appreciation (depreciation) in the current period relating to assets still held at October 31, 2014 was $7. |
| Note: | For purposes of reporting transfers between different hierarchy levels, both transfers in and out of each level, as applicable, are shown as if they occurred at the beginning of the period. |
The accompanying notes are an integral part of these financial statements.
| 14 |
| The Hartford Balanced Fund |
| Statement of Assets and Liabilities |
| October 31, 2014 |
| (000’s Omitted) |
| Assets: | ||||
| Investments in securities, at market value (cost $553,265) | $ | 723,497 | ||
| Cash | 4 | |||
| Receivables: | ||||
| Investment securities sold | 16,215 | |||
| Fund shares sold | 623 | |||
| Dividends and interest | 2,017 | |||
| Other assets | 52 | |||
| Total assets | 742,408 | |||
| Liabilities: | ||||
| TBA sale commitments, at market value (proceeds $4,432) | 4,443 | |||
| Payables: | ||||
| Investment securities purchased | 12,696 | |||
| Fund shares redeemed | 651 | |||
| Investment management fees | 92 | |||
| Administrative fees | — | |||
| Distribution fees | 53 | |||
| Variation margin on financial derivative instruments | 8 | |||
| Accrued expenses | 155 | |||
| Other liabilities | 2 | |||
| Total liabilities | 18,100 | |||
| Net assets | $ | 724,308 | ||
| Summary of Net Assets: | ||||
| Capital stock and paid-in-capital | $ | 689,588 | ||
| Undistributed net investment income | 597 | |||
| Accumulated net realized loss | (136,127 | ) | ||
| Unrealized appreciation of investments and the translation of assets and liabilities denominated in foreign currency | 170,250 | |||
| Net assets | $ | 724,308 | ||
| Shares authorized | 910,000 | |||
| Par value | $ | 0.001 | ||
| Class A: Net asset value per share/Maximum offering price per share | $20.54/$21.74 | |||
| Shares outstanding | 28,489 | |||
| Net assets | $ | 585,217 | ||
| Class B: Net asset value per share | $ | 20.42 | ||
| Shares outstanding | 423 | |||
| Net assets | $ | 8,635 | ||
| Class C: Net asset value per share | $ | 20.54 | ||
| Shares outstanding | 6,171 | |||
| Net assets | $ | 126,773 | ||
| Class R3: Net asset value per share | $ | 20.75 | ||
| Shares outstanding | 29 | |||
| Net assets | $ | 593 | ||
| Class R4: Net asset value per share | $ | 20.78 | ||
| Shares outstanding | 38 | |||
| Net assets | $ | 786 | ||
| Class R5: Net asset value per share | $ | 20.80 | ||
| Shares outstanding | 8 | |||
| Net assets | $ | 157 | ||
| Class Y: Net asset value per share | $ | 20.82 | ||
| Shares outstanding | 103 | |||
| Net assets | $ | 2,147 |
The accompanying notes are an integral part of these financial statements.
| 15 |
| The Hartford Balanced Fund |
| Statement of Operations |
| For the Year Ended October 31, 2014 |
| (000’s Omitted) |
| Investment Income: | ||||
| Dividends | $ | 10,518 | ||
| Interest | 5,816 | |||
| Less: Foreign tax withheld | (135 | ) | ||
| Total investment income | 16,199 | |||
| Expenses: | ||||
| Investment management fees | 4,661 | |||
| Administrative services fees | ||||
| Class R3 | 1 | |||
| Class R4 | 1 | |||
| Class R5 | — | |||
| Transfer agent fees | ||||
| Class A | 1,039 | |||
| Class B | 55 | |||
| Class C | 138 | |||
| Class R3 | — | |||
| Class R4 | — | |||
| Class R5 | — | |||
| Class Y | — | |||
| Distribution fees | ||||
| Class A | 1,412 | |||
| Class B | 104 | |||
| Class C | 1,152 | |||
| Class R3 | 3 | |||
| Class R4 | 2 | |||
| Custodian fees | 7 | |||
| Accounting services fees | 125 | |||
| Registration and filing fees | 138 | |||
| Board of Directors' fees | 19 | |||
| Audit fees | 24 | |||
| Other expenses | 129 | |||
| Total expenses (before waivers and fees paid indirectly) | 9,010 | |||
| Expense waivers | (1 | ) | ||
| Transfer agent fee waivers | (24 | ) | ||
| Commission recapture | — | |||
| Total waivers and fees paid indirectly | (25 | ) | ||
| Total expenses, net | 8,985 | |||
| Net Investment Income | 7,214 | |||
| Net Realized Gain on Investments, Other Financial Instruments and Foreign Currency Transactions: | ||||
| Net realized gain on investments | 38,398 | |||
| Net realized loss on TBA sale transactions | (216 | ) | ||
| Net realized loss on futures contracts | (47 | ) | ||
| Net realized gain on swap contracts | 37 | |||
| Net realized gain on foreign currency contracts | 15 | |||
| Net realized loss on other foreign currency transactions | (6 | ) | ||
| Net Realized Gain on Investments, Other Financial Instruments and Foreign Currency Transactions | 38,181 | |||
| Net Changes in Unrealized Appreciation of Investments, Other Financial Instruments and Foreign Currency Transactions: | ||||
| Net unrealized appreciation of investments | 29,620 | |||
| Net unrealized depreciation of TBA sale commitments | (7 | ) | ||
| Net unrealized appreciation of futures contracts | 37 | |||
| Net unrealized depreciation of swap contracts | (9 | ) | ||
| Net unrealized depreciation of translation of other assets and liabilities in foreign currencies | (11 | ) | ||
| Net Changes in Unrealized Appreciation of Investments, Other Financial Instruments and Foreign Currency Transactions | 29,630 | |||
| Net Gain on Investments, Other Financial Instruments and Foreign Currency Transactions | 67,811 | |||
| Net Increase in Net Assets Resulting from Operations | $ | 75,025 |
The accompanying notes are an integral part of these financial statements.
| 16 |
| The Hartford Balanced Fund |
| Statement of Changes in Net Assets |
| (000’s Omitted) |
| For the Year Ended October 31, 2014 | For the Year Ended October 31, 2013 | |||||||
| Operations: | ||||||||
| Net investment income | $ | 7,214 | $ | 6,862 | ||||
| Net realized gain on investments, other financial instruments and foreign currency transactions | 38,181 | 25,722 | ||||||
| Net unrealized appreciation of investments, other financial instruments and foreign currency transactions | 29,630 | 64,392 | ||||||
| Net Increase in Net Assets Resulting from Operations | 75,025 | 96,976 | ||||||
| Distributions to Shareholders: | ||||||||
| From net investment income | ||||||||
| Class A | (6,596 | ) | (6,295 | ) | ||||
| Class B | (25 | ) | (45 | ) | ||||
| Class C | (590 | ) | (477 | ) | ||||
| Class R3 | (6 | ) | (5 | ) | ||||
| Class R4 | (8 | ) | (18 | ) | ||||
| Class R5 | (2 | ) | (2 | ) | ||||
| Class Y | (33 | ) | (31 | ) | ||||
| Total distributions | (7,260 | ) | (6,873 | ) | ||||
| Capital Share Transactions: | ||||||||
| Class A | (12,446 | ) | (15,316 | ) | ||||
| Class B | (4,619 | ) | (5,676 | ) | ||||
| Class C | 15,371 | 9,097 | ||||||
| Class R3 | (106 | ) | 192 | |||||
| Class R4 | 190 | (1,120 | ) | |||||
| Class R5 | 3 | — | ||||||
| Class Y | (29 | ) | (118 | ) | ||||
| Net decrease from capital share transactions | (1,636 | ) | (12,941 | ) | ||||
| Net Increase in Net Assets | 66,129 | 77,162 | ||||||
| Net Assets: | ||||||||
| Beginning of period | 658,179 | 581,017 | ||||||
| End of period | $ | 724,308 | $ | 658,179 | ||||
| Undistributed (distributions in excess of) net investment income | $ | 597 | $ | 430 | ||||
The accompanying notes are an integral part of these financial statements.
| 17 |
| The Hartford Balanced Fund |
| Notes to Financial Statements |
| October 31, 2014 |
| (000’s Omitted) |
Organization:
The Hartford Mutual Funds, Inc. (“Company”) is an open-end management investment company comprised of forty-two portfolios. Financial statements for The Hartford Balanced Fund (the "Fund"), a series of the Company, are included in this report.
The Company is organized under the laws of the State of Maryland and is registered with the Securities and Exchange Commission (“SEC”) under the Investment Company Act of 1940, as amended (“1940 Act”). The Fund is a diversified open-end management investment company. The Fund is an investment company and applies specialized accounting and reporting under Accounting Standards Codification Topic 946, Financial Services - Investment Companies.
Class A shares are sold with a front-end sales charge of up to 5.50%. Class B shares were sold with a contingent deferred sales charge which is assessed on the lesser of the per share net asset value (“NAV”) of the shares at the time of redemption or the original purchase price, and declines from up to 5.00% to zero depending on the period of time the shares are held (see note below regarding the closing of Class B shares). Class C shares are sold with a contingent deferred sales charge of up to 1.00% on shares redeemed within twelve months of purchase. Class R3, R4 and R5 shares, which are offered to employer-sponsored retirement plans, and Class Y shares, which are sold to certain eligible institutional investors, are sold without a sales charge. All classes of shares have identical voting, redemption, dividend, liquidation and other rights and the same terms and conditions, with the exceptions that each class may have different expenses, which may affect performance, and that Class B shares automatically convert to Class A shares after 8 years.
No new or additional investments are allowed in Class B shares of the Fund (including investments through any systematic investment plan). Existing shareholders of Class B shares may continue to hold their Class B shares, exchange their Class B shares for Class B shares of another Hartford Fund (as permitted by existing exchange privileges), or redeem their Class B shares as described in the Fund’s prospectus. Reinstatement privileges with respect to Class B shares are set forth in the Fund's prospectus. For investors electing to reinvest capital gains and dividends, any such capital gains or dividends on Class B shares will continue to be reinvested in Class B shares of the Fund. All Class B share attributes, including the 12b-1 fee, contingent deferred sales charge schedule, and conversion to Class A shares, remain unchanged.
Significant Accounting Policies:
The following is a summary of significant accounting policies of the Fund in the preparation of its financial statements, which are in accordance with United States generally accepted accounting principles (“U.S. GAAP”). The preparation of financial statements in accordance with U.S. GAAP may require management to make estimates and assumptions that affect the reported amounts of assets and liabilities and disclosure of contingent assets and liabilities at the date of the financial statements and the reported amounts of increases and decreases in net assets from operations during the reporting period. Actual results could differ from those estimates.
Determination of Net Asset Value – The NAV of each class of the Fund's shares is determined as of the close of regular trading (normally 4:00 p.m. Eastern Time) (the “NYSE Close”) on each day that the New York Stock Exchange (the “Exchange”) is open (“Valuation Date”). Information that becomes known to the Fund after the NAV has been calculated on a particular day will not generally be used to retroactively adjust the NAV determined earlier that day.
Investment Valuation and Fair Value Measurements – For purposes of calculating the NAV, portfolio investments and other assets held by the Fund's portfolio for which market quotes are readily available are valued at market value. Market value is generally determined on the basis of last reported sales prices or official close price. If no sales are reported, market value is based on quotes obtained from a quotation reporting system, established market makers, or independent pricing services. If market prices are not readily available or are deemed unreliable, the Fund will use the fair value of the investment as determined in good faith under policies and procedures established by and under the supervision of the Company's Board of Directors. Market quotes are considered not readily available where there is an absence of current or reliable market-based data (e.g., trade information or indicative market quotes), including where events occur after the close of the relevant market, but prior to the NYSE Close, that materially affect the values of the Fund's portfolio investments or assets. In addition, market quotes are considered not readily available when, due to extraordinary circumstances, the exchanges or markets on which the investments trade do not open for trading for the entire day and no other market prices are available. In addition, prices of foreign equities that are principally traded on certain foreign markets may be adjusted daily pursuant to a fair value pricing service approved by the Board of Directors in order to reflect an adjustment for the
| 18 |
| The Hartford Balanced Fund |
| Notes to Financial Statements – (continued) |
| October 31, 2014 |
| (000’s Omitted) |
factors occurring after the close of certain foreign markets but before the NYSE Close. Investments that are primarily traded on foreign markets may trade on days that are not business days of the Fund. The value of the foreign investments in which the Fund invests may change on days when a shareholder will not be able to purchase or redeem shares of the Fund. Fair value pricing is subjective in nature and the use of fair value pricing by the Fund may cause the NAV of its shares to differ significantly from the NAV that would have been calculated using market prices at the close of the exchange on which a portfolio investment is primarily traded. There can be no assurance that the Fund could obtain the fair market value assigned to an investment if the Fund were to sell the investment at approximately the time at which the Fund determines its NAV.
Fixed income investments (other than short-term obligations), non-exchange traded derivatives and centrally cleared swaps held by the Fund are normally valued on the basis of quotes obtained from independent pricing services or brokers and dealers in accordance with procedures established by the Company's Board of Directors. Prices obtained from independent pricing services use information provided by market makers or estimates of market values through accepted market modeling, trading and pricing conventions. Inputs to the models may include, but are not limited to, prepayment speeds, pricing spread, yield, trade information, dealer quotes, market color, cash flow models and the investment’s terms and conditions. Generally, the Fund may use fair valuation in regard to fixed income investments when the Fund holds defaulted or distressed investments or investments in a company in which a reorganization is pending. Short-term investments maturing in 60 days or less are generally valued at amortized cost, if their original term to maturity was 60 days or less, or by amortizing their value on the 61st day prior to maturity, if the original term to maturity exceeded 60 days, which approximates fair value.
Exchange traded options, futures and options on futures are valued at the settlement price or last trade price determined by the relevant exchange as of the NYSE Close. If the last trade price for exchange traded options does not fall between the bid and ask prices, the value will be the mean of the bid and ask prices as of the NYSE Close. If a last trade price is not available, the value will be the mean of the bid and ask prices as of the NYSE Close. If a mean of the bid and ask prices cannot be calculated for the day, the value will be the bid price as of the NYSE Close. In the case of over-the-counter ("OTC") options and such instruments that do not trade on an exchange, values may be supplied by a pricing service using a formula or other objective method that may take into consideration the style, direction, expiration, strike price, notional value and volatility or other special adjustments.
Investments valued in currencies other than U.S. dollars are converted to U.S. dollars using exchange rates obtained from independent pricing services for calculation of the NAV. As a result, the NAV of the Fund’s shares may be affected by changes in the value of currencies in relation to the U.S. dollar. The value of investments traded in markets outside the United States or denominated in currencies other than the U.S. dollar may be affected significantly on a day that the NYSE is closed and the market value may change on days when an investor is not able to purchase, redeem or exchange shares of the Fund.
Foreign currency contracts represent agreements to exchange currencies on specific future dates at predetermined rates. Foreign currency contracts are valued using foreign currency exchange rates and forward rates as provided by an independent pricing service on the Valuation Date.
Financial instruments for which prices are not available from an independent pricing service may be valued using market quotations obtained from one or more dealers that make markets in the respective financial instrument in accordance with procedures established by the Company's Board of Directors.
U.S. GAAP defines fair value as the price that the Fund would receive to sell an asset or pay to transfer a liability in an orderly transaction between market participants. The U.S. GAAP fair value measurement standards require disclosure of a fair value hierarchy for each major category of assets and liabilities. Various inputs are used in determining the fair value of the Fund’s investments. These inputs are summarized into three broad hierarchy levels. This hierarchy is based on whether the valuation inputs are observable or unobservable. These levels are:
Level 1 – Quoted prices in active markets for identical investments. Level 1 may include exchange traded instruments, such as domestic equities, some foreign equities, options, futures, mutual funds, exchange traded funds, rights and warrants.
Level 2 – Observable inputs other than Level 1 prices, such as quoted prices for similar investments; quoted prices in markets that are not active; or other inputs that are observable or can be corroborated by observable market data. Level 2 may include
| 19 |
| The Hartford Balanced Fund |
| Notes to Financial Statements – (continued) |
| October 31, 2014 |
| (000’s Omitted) |
debt investments that are traded less frequently than exchange traded instruments and which are valued using independent pricing services; foreign equities, which are principally traded on certain foreign markets and are adjusted daily pursuant to a fair value pricing service in order to reflect an adjustment for the factors occurring after the close of certain foreign markets but before the NYSE Close; senior floating rate interests, which are valued using an aggregate of dealer bids; short-term investments, which are valued at amortized cost; and swaps, which are valued based upon the terms of each swap contract.
Level 3 – Significant unobservable inputs that are supported by limited or no market activity. Level 3 may include financial instruments whose values are determined using indicative market quotes or require significant management judgment or estimation. These unobservable valuation inputs may include estimates for current yields, maturity/duration, prepayment speed, and indicative market quotes for comparable investments along with other assumptions relating to credit quality, collateral value, complexity of the investment structure, general market conditions and liquidity. This category may include investments where trading has been halted or there are certain restrictions on trading. While these investments are priced using unobservable inputs, the valuation of these investments reflects the best available data and management believes the prices are a reasonable representation of exit price.
The Board of Directors of the Company generally reviews and approves the “Procedures for Valuation of Portfolio Securities” at least once a year. These procedures define how investments are to be valued, including the formation and activities of a Valuation Committee. The Valuation Committee is responsible for determining in good faith the fair value of investments when the value cannot be obtained from primary pricing services or alternative sources or if the valuation of an investment as provided by the primary pricing service or alternative source is believed not to reflect the investment’s fair value as of the Valuation Date. Voting members of the Valuation Committee include the Fund's Treasurer or designee and a Vice President of the investment manager or designee. An Assistant Vice President of the Fund with legal expertise or designee is also included on the Valuation Committee as a non-voting advisory member. In addition, the Fund’s Chief Compliance Officer shall designate a member of the compliance group to attend Valuation Committee meetings as a non-voting resource, to monitor for and provide guidance with respect to compliance with these procedures. Two members of the Valuation Committee or their designees, representing different departments, shall constitute a quorum for purposes of permitting the Valuation Committee to take action. The Valuation Committee will consider all relevant factors in determining an investment’s fair value, and may seek the advice of the Fund’s sub-adviser, knowledgeable brokers, and legal counsel in making such determination. The Valuation Committee reports to the Audit Committee of the Company's Board of Directors. The Audit Committee receives quarterly written reports which include details of all fair-valued investments, including the reason for the fair valuation, and an indication, when possible, of the accuracy of the valuation by disclosing the next available reliable public price quotation or the disposition price of such investments (the “look-back” test). The Board of Directors then must consider for ratification all of the fair value determinations made during the previous quarter.
Valuation levels are not necessarily indicative of the risk associated with investing in such investments. Individual investments within any of the above mentioned asset classes may be assigned a different hierarchical level than those presented above, as individual circumstances dictate.
For additional information, refer to the Investment Valuation Hierarchy Level Summary and the Level 3 roll-forward reconciliation, if applicable, which follow the Schedule of Investments.
Investment Transactions and Investment Income – Investment transactions are recorded as of the trade date (the date the order to buy or sell is executed) for financial reporting purposes. Investments purchased or sold on a when-issued or delayed-delivery basis may be settled a month or more after the trade date. Realized gains and losses are determined on the basis of identified cost.
Dividend income from domestic securities is accrued on the ex-dividend date. In general, dividend income from foreign securities is recorded on the ex-date; however, dividend notifications in certain foreign jurisdictions may not be available in a timely manner and as a result, the Fund will record the dividend as soon as the relevant details (i.e., rate per share, payment date, shareholders of record, etc.) are publicly available. Interest income, including amortization of premium, accretion of discounts and additional principal received in-kind in lieu of cash, is accrued on a daily basis. Paydown gains and losses on mortgage related and other asset backed securities are included in interest income in the Statement of Operations, as applicable.
| 20 |
| The Hartford Balanced Fund |
| Notes to Financial Statements – (continued) |
| October 31, 2014 |
| (000’s Omitted) |
Foreign Currency Transactions – Assets and liabilities denominated in currencies other than U.S. dollars are translated into U.S. dollars at the exchange rates in effect on the valuation date. Purchases and sales of investments, income and expenses are translated into U.S. dollars at the exchange rates on the dates of such transactions.
The Fund does not isolate that portion of portfolio investment valuation resulting from fluctuations in the foreign currency exchange rates from the fluctuations arising from changes in the market prices of investments held. Exchange rate fluctuations are included with the net realized and unrealized gain or loss on investments in the accompanying financial statements.
Net realized foreign exchange gains or losses arise from sales of foreign currencies and the difference between asset and liability amounts initially stated in foreign currencies and the U.S. dollar value of the amounts actually received or paid. Net unrealized foreign exchange gains or losses arise from changes in the value of other assets and liabilities at the end of the reporting period, resulting from changes in the exchange rates.
Joint Trading Account – The Fund may invest cash balances into a joint trading account that may be invested in one or more repurchase agreements.
Fund Share Valuation and Dividend Distributions to Shareholders – Orders for the Fund’s shares are executed in accordance with the investment instructions of the shareholders. The NAV of the Fund’s shares is determined as of the close of business on each business day of the Exchange. The NAV is determined separately for each class of shares of the Fund by dividing the Fund’s net assets attributable to that class by the number of shares of the class outstanding. Each class of shares offered by the Fund has equal rights as to assets and voting privileges (except that shareholders of a class have exclusive voting rights regarding any matter relating solely to that class of shares). Income and non-class specific expenses are allocated daily to each class on the basis of the relative net assets of the class. Realized and unrealized gains and losses are allocated daily based on the relative net assets of each class of shares of the Fund.
Orders for the purchase of the Fund’s shares received prior to the close of the Exchange on any day the Exchange is open for business are priced at the NAV determined as of the close of the Exchange. Orders received after the close of the Exchange, or on a day on which the Exchange and/or the Fund is not open for business, are priced at the next determined NAV.
Dividends are declared pursuant to a policy adopted by the Company's Board of Directors based upon the investment performance of the Fund. The policy of the Fund is to pay dividends from net investment income, if any, quarterly and realized gains, if any, at least once a year.
Net investment income, dividends and distributions from net realized gains and capital are determined in accordance with federal income tax regulations, which may differ from U.S. GAAP with respect to character and timing (see Federal Income Taxes: Distributions and Components of Distributable Earnings and Reclassification of Capital Accounts).
Securities and Other Investments:
Repurchase Agreements – A repurchase agreement is an agreement by which a counterparty agrees to sell an investment and agrees to repurchase the investment sold from the buyer at a mutually agreed upon time and price. During the period of the repurchase agreement, the counterparty will deposit cash and or securities in a third party custodial account to serve as collateral. At the time the Fund enters into a repurchase agreement, the value of the underlying collateral, including accrued interest, will be equal to or exceed the value of the repurchase agreement. Repurchase agreements expose the Fund to counterparty risk - that is, the risk that the counterparty will not fulfill its obligations. To minimize counterparty risk, the investments that serve to collateralize the repurchase agreement are held by the Fund’s custodian in book entry or physical form in the custodial account of the Fund or in a third party custodial account. Repurchase agreements are valued at cost plus accrued interest, which approximates fair value. Repurchase agreements have master netting arrangements which allow the Fund to offset amounts owed to a counterparty with amounts owed by the counterparty, including any collateral. Upon an event of default under a master repurchase agreement, the non-defaulting party may close out all transactions traded under such agreement and net amounts owed under each transaction to one net amount payable by one party to the other. Absent an event of default, the master repurchase agreement does not result in an offset of reported amounts of assets and liabilities in the Statement of Assets and Liabilities across transactions between the Fund and the
| 21 |
| The Hartford Balanced Fund |
| Notes to Financial Statements – (continued) |
| October 31, 2014 |
| (000’s Omitted) |
applicable counterparty. The Fund, as shown on the Schedule of Investments, had outstanding repurchase agreements and related collateral as of October 31, 2014.
Illiquid and Restricted Investments – The Fund is permitted to invest up to 15% of its net assets in illiquid investments. Illiquid investments are those that may not be sold or disposed of in the ordinary course of business within seven days, at approximately the price used to determine the Fund’s NAV. The Fund may not be able to sell illiquid investments when its sub-adviser considers it desirable to do so or may have to sell such investments at a price that is lower than the price that could be obtained if the investments were more liquid. A sale of illiquid investments may require more time and may result in higher dealer discounts and other selling expenses than does the sale of those that are liquid. Illiquid investments also may be more difficult to value due to the unavailability of reliable market quotations for such investments, and an investment in them may have an adverse impact on the Fund’s NAV. The Fund may also purchase certain restricted investments that can only be resold to certain qualified investors and may be determined to be liquid pursuant to policies and guidelines established by the Company's Board of Directors. The Fund, as shown on the Schedule of Investments, had illiquid or restricted investments as of October 31, 2014.
Investments Purchased on a When-Issued or Delayed-Delivery Basis – Delivery and payment for investments that have been purchased by the Fund on a forward commitment, or when-issued or delayed-delivery basis, take place beyond the customary settlement period. The Fund may dispose of or renegotiate a delayed-delivery transaction after it is entered into, and may sell delayed-delivery investments before they are delivered, which may result in a realized gain or loss. During this period, such investments are subject to market fluctuations, and the Fund identifies investments segregated in its records with a value at least equal to the amount of the commitment. The Fund, as shown on the Schedule of Investments, had when-issued or delayed-delivery investments as of October 31, 2014.
In connection with the Fund’s ability to purchase investments on a when-issued or forward commitment basis, the Fund may enter into to-be announced (“TBA”) commitments. TBA commitments are forward agreements for the purchase or sale of mortgage backed securities for a fixed price, with payment and delivery on an agreed-upon future settlement date. The specific securities to be delivered are not identified at the trade date; however, delivered securities must meet specified terms, including issuer, rate and mortgage terms. Although the Fund may enter into TBA commitments with the intention of acquiring or delivering securities for its portfolio, the Fund can extend the settlement date, roll the transaction, or dispose of a commitment prior to settlement if deemed appropriate to do so. If the TBA commitment is closed through the acquisition of an offsetting TBA commitment, the Fund realizes a gain or loss. In a TBA roll transaction, the Fund generally purchases or sells the initial TBA commitment prior to the agreed upon settlement date and enters into a new TBA commitment for future delivery or receipt of the mortgage backed securities. TBA commitments involve a risk of loss if the value of the security to be purchased or sold declines or increases, respectively, prior to settlement date.
The Fund may enter into “dollar rolls” in which the Fund sells securities and contracts with the same counterparty to repurchase substantially similar securities (for example, same issuer, coupon and maturity) on a specified future date at an agreed upon price. The Fund gives up the right to receive interest paid on the investments sold. The Fund would benefit to the extent of any differences between the price received for the security and the lower forward price for the future purchase. Dollar rolls involve the risk that the market value of the securities that the Fund is required to purchase may decline below the agreed upon repurchase price of those securities. The Fund records dollar roll transactions as purchases and sales and realizes gains and losses on these transactions. These transactions are excluded from the Fund’s portfolio turnover rate. The Fund, as shown on the Schedule of Investments, had open TBA commitments as of October 31, 2014, which may be a part of dollar roll transactions.
Mortgage Related and Other Asset Backed Securities – The Fund may invest in mortgage related and other asset backed securities. These securities include mortgage pass-through securities, collateralized mortgage obligations, commercial mortgage backed securities, stripped mortgage backed securities, asset backed securities, collateralized debt obligations and other securities that directly or indirectly represent a participation in, or are secured by and payable from, mortgage loans on real property. Mortgage related securities are created from pools of residential or commercial mortgage loans, including mortgage loans made by savings and loan institutions, mortgage bankers, commercial banks and other similar financial institutions. Asset backed securities are created from many types of assets, including auto loans, credit card receivables, home equity loans, and student loans. These securities provide a monthly payment that consists of both interest and principal payments. Interest payments may be determined by fixed or adjustable rates. The rate of pre-payments on underlying mortgages will affect the price and volatility of a mortgage related security,
| 22 |
| The Hartford Balanced Fund |
| Notes to Financial Statements – (continued) |
| October 31, 2014 |
| (000’s Omitted) |
and may have the effect of shortening or extending the effective duration of the security relative to what was anticipated at the time of purchase. The timely payment of principal and interest of certain mortgage related securities is guaranteed by the full faith and credit of the United States Government. Mortgage related and other asset backed securities created and guaranteed by non-governmental issuers, including government-sponsored corporations, may be supported by various forms of insurance or guarantees, but there can be no assurance that the private insurers or guarantors can meet their obligations under the insurance policies or guarantee arrangements. The Fund, as shown on the Schedule of Investments, had outstanding mortgage related and other asset backed securities as of October 31, 2014.
Financial Derivative Instruments:
The following disclosures contain information on how and why the Fund uses derivative instruments, the credit-risk-related contingent features in certain derivative instruments and how derivative instruments affect the Fund’s financial position and results of operations. The location and fair value amounts of these instruments on the Statement of Assets and Liabilities and the realized gains and losses and changes in unrealized gains and losses on the Statement of Operations, each categorized by type of derivative contract, are included in the following Additional Derivative Instrument Information footnote. The derivative instruments outstanding as of year-end are disclosed in the notes to the Schedule of Investments, if applicable. The amounts of realized gains and losses and changes in unrealized gains and losses on derivative instruments during the year are disclosed in the Statement of Operations.
Foreign Currency Contracts – The Fund may enter into foreign currency contracts that obligate the Fund to purchase or sell currencies at specified future dates. Foreign currency contracts are used to hedge the currency exposure associated with some or all of the Fund’s investments and/or as part of an investment strategy. Foreign currency contracts are marked to market daily and the change in value is recorded by the Fund as an unrealized gain or loss. The Fund will record a realized gain or loss when the foreign currency contract is settled.
Foreign currency contracts involve elements of market risk in excess of the amounts reflected in the Statement of Assets and Liabilities. In addition, risks may arise upon entering into these contracts from the potential inability of the counterparties to meet the terms of the contracts and from unanticipated movements in the value of the foreign currencies relative to the U.S. dollar. The Fund had no outstanding foreign currency contracts as of October 31, 2014.
Futures Contracts – The Fund may enter into futures contracts. A futures contract is an agreement between two parties to buy or sell an asset at a set price on a future date. The Fund uses futures contracts to manage or obtain exposure to the investment markets, commodities, or movements in interest rates and currency values. The primary risks associated with the use of futures contracts are the imperfect correlation between the change in market value of the investments held by the Fund and the prices of futures contracts and the possibility of an illiquid market. Upon entering into a futures contract, the Fund is required to deposit with a futures commission merchant (“FCM”) an amount of cash or U.S. Government or Agency Obligations in accordance with the initial margin requirements of the broker or exchange. Futures contracts are marked to market daily at the most recent settlement price reported by an exchange on which, over time, they are traded most extensively, and an appropriate payable or receivable for the change in value (“variation margin”) is recorded by the Fund. Gains or losses are recognized but not considered realized until the contracts expire or are closed. Futures contracts involve, to varying degrees, risk of loss in excess of the variation margin disclosed on the Statement of Assets and Liabilities; however, the Fund seeks to reduce this risk through the use of an FCM. The Fund, as shown on the Schedule of Investments, had outstanding futures contracts as of October 31, 2014.
Swap Contracts – The Fund may invest in swap contracts. Swap contracts are agreements to exchange or swap investment cash flows, assets, foreign currencies or market-linked returns at specified, future intervals. Swap contracts are either privately negotiated in the over-the-counter market (“OTC swaps”) or cleared in a central clearing house (“centrally cleared swaps”). The Fund may enter into credit default, total return, cross-currency, interest rate, inflation and other forms of swap contracts to manage its exposure to credit, currency, interest rate, commodity and inflation risk. Swap contracts are also used to gain exposure to certain markets. In connection with these contracts, investments or cash may be identified as collateral or margin in accordance with the terms of the respective swap contracts and/or master netting arrangement to provide assets of value and recourse in the event of default or bankruptcy/insolvency.
| 23 |
| The Hartford Balanced Fund |
| Notes to Financial Statements – (continued) |
| October 31, 2014 |
| (000’s Omitted) |
Swaps are valued based on custom valuations furnished by an independent pricing service. Swaps for which prices are not available from an independent pricing service are valued in accordance with procedures established by the Company's Board of Directors. Changes in market value, if any, are reflected as a component of net changes in unrealized appreciation or depreciation on the Statement of Operations. Daily changes in valuation of centrally cleared swaps, if any, are recorded as a receivable or payable for the change in value (“variation margin”) on the Statement of Assets and Liabilities. Realized gains or losses on centrally cleared swaps are recorded upon the termination of the swap. OTC swap payments received or paid at the beginning of the measurement period are reflected as such on the Statement of Assets and Liabilities and represent premiums paid or received upon entering into the swap contract to compensate for differences between the stated terms of the swap contract and prevailing market conditions (credit spreads, currency exchange rates, interest rates and other relevant factors). These upfront premiums are recorded as realized gains or losses on the Statement of Operations upon termination or maturity of the swap. A liquidation payment received or made at the termination or maturity of the swap is recorded as a realized gain or loss on the Statement of Operations. Net periodic payments received or paid by the Fund are included as part of realized gains or losses on the Statement of Operations.
Entering into these contracts involves, to varying degrees, elements of liquidation, counterparty, credit and market risk in excess of the amounts recognized on the Statement of Assets and Liabilities. Such risks involve the possibility that there will be no liquid market for these contracts, that the counterparty to the contracts may default on its obligation to perform or disagree as to the meaning of contractual terms in the contracts, and that there may be unfavorable changes in market conditions (credit spreads, currency exchange rates, interest rates and other relevant factors).
The Fund’s maximum risk of loss from counterparty risk for OTC swaps is the net value of the discounted cash flows to be received from the counterparty over the contract’s remaining life, and current market value, to the extent that amount is positive. The risk is mitigated by having a master netting arrangement between the Fund and the counterparty, which allows for the netting of payments made or received (although such amounts are presented on a gross basis within the Statement of Assets and Liabilities, as applicable) as well as the posting of collateral to the Fund to cover the Fund’s exposure to the counterparty. In a centrally cleared swap, while the Fund enters into an agreement with a clearing broker to execute contracts with a counterparty, the performance of the swap is guaranteed by the central clearinghouse, which reduces the Fund’s exposure to counterparty risk. The Fund is still exposed to the counterparty risk through the clearing broker and clearinghouse. The clearinghouse attempts to minimize this risk to its participants through the use of mandatory margin requirements, daily cash settlements and other procedures. Likewise, the clearing broker reduces its risk through margin requirements and required segregation of customer balances.
Credit Default Swap Contracts – The credit default swap market allows the Fund to manage its exposure to the market or certain sectors of the market, to reduce its risk exposure to defaults of corporate and sovereign issuers, or to create exposure to corporate or sovereign issuers to which it is not otherwise exposed. Certain credit default swaps involve the exchange of a fixed rate premium for protection against the loss in value of an underlying investment or index in the event of a credit event, such as payment default or bankruptcy.
Under a credit default swap contract, one party acts as guarantor by receiving the fixed periodic payment in exchange for the commitment to purchase the underlying investment at par if the defined credit event occurs. Upon the occurrence of a defined credit event, the difference between the value of the reference obligation and the swap’s notional amount is recorded as realized gain or loss on swap transactions in the Statement of Operations. A “buyer” of credit protection agrees to pay a counterparty to assume the credit risk of an issuer upon the occurrence of certain events. The “seller” of the protection receives periodic payments and agrees to assume the credit risk of an issuer upon the occurrence of certain events. Although specified events are contract specific, credit events are generally defined as bankruptcy, failure to pay, restructuring, obligation acceleration, obligation default or repudiation/moratorium. A “seller’s” exposure is limited to the total notional amount of the credit default swap contract. These potential amounts would be partially offset by any recovery values of the respective referenced obligations or upfront payments received upon entering into the contract.
Implied credit spreads, represented in absolute terms, utilized in determining the market value of credit default swap contracts on corporate issues, sovereign government issues or U.S. municipal issues as of year-end are disclosed in the notes to the Schedule of Investments, as applicable, and serve as an indicator of the current status of the payment/performance risk and represent the likelihood or risk of default for the credit derivative. The implied credit spread of a particular referenced entity reflects the cost of buying/selling protection and there may also be upfront payments required to be made to enter into the contract. Wider credit spreads
| 24 |
| The Hartford Balanced Fund |
| Notes to Financial Statements – (continued) |
| October 31, 2014 |
| (000’s Omitted) |
represent a deterioration of the referenced entity’s credit soundness and a greater likelihood or risk of default or other credit event occurring as defined under the terms of the contract. For credit default swap contracts on credit indices, the quoted market prices and resulting values serve as the indicator of the current status of the payment/performance risk. Increasing market values, in absolute terms when compared to the notional amount of the swap, represent a deterioration of the referenced equity’s credit soundness and a greater likelihood or risk of default or other credit event occurring as defined under the terms of the contract. The Fund had no outstanding credit default swap contracts as of October 31, 2014.
Additional Derivative Instrument Information:
Fair Value of Derivative Instruments on the Statement of Assets and Liabilities as of October 31, 2014:
| Risk Exposure Category | ||||||||||||||||||||||||||||
| Interest Rate Contracts | Foreign Exchange Contracts | Credit Contracts | Equity Contracts | Commodity Contracts | Other Contracts | Total | ||||||||||||||||||||||
| Liabilities: | ||||||||||||||||||||||||||||
| Variation margin payable * | $ | 8 | $ | — | $ | — | $ | — | $ | — | $ | — | $ | 8 | ||||||||||||||
| Total | $ | 8 | $ | — | $ | — | $ | — | $ | — | $ | — | $ | 8 | ||||||||||||||
| * | Only current day's variation margin is reported within the Statement of Assets and Liabilities. The variation margin is included in the open futures net cumulative appreciation of $37 as reported in the Schedule of Investments. |
The volume of derivatives that is presented in the Schedule of Investments is consistent with the derivative activity during the year ended October 31, 2014.
The Effect of Derivative Instruments on the Statement of Operations for the year ended October 31, 2014:
| Risk Exposure Category | ||||||||||||||||||||||||||||
| Interest Rate Contracts | Foreign Exchange Contracts | Credit Contracts | Equity Contracts | Commodity Contracts | Other Contracts | Total | ||||||||||||||||||||||
| Realized Gain (Loss) on Derivatives Recognized as a Result of Operations: | ||||||||||||||||||||||||||||
| Net realized loss on futures contracts | $ | (47 | ) | $ | — | $ | — | $ | — | $ | — | $ | — | $ | (47 | ) | ||||||||||||
| Net realized gain on swap contracts | — | — | 37 | — | — | — | 37 | |||||||||||||||||||||
| Net realized gain on foreign currency contracts | — | 15 | — | — | — | — | 15 | |||||||||||||||||||||
| Total | $ | (47 | ) | $ | 15 | $ | 37 | $ | — | $ | — | $ | — | $ | 5 | |||||||||||||
| Net Change in Unrealized Appreciation (Depreciation) on Derivatives Recognized as a Result of Operations: | ||||||||||||||||||||||||||||
| Net change in unrealized appreciation of futures contracts | $ | 37 | $ | — | $ | — | $ | — | $ | — | $ | — | $ | 37 | ||||||||||||||
| Net change in unrealized depreciation of swap contracts | — | — | (9 | ) | — | — | — | (9 | ) | |||||||||||||||||||
| Total | $ | 37 | $ | — | $ | (9 | ) | $ | — | $ | — | $ | — | $ | 28 | |||||||||||||
Balance Sheet Offsetting Information - The following discloses both gross information and net information about instruments and transactions eligible for offset in the financial statements, and instruments and transactions that are subject to a master netting arrangement, as well as amounts related to margin, reflected as financial collateral (including cash collateral), held at clearing brokers, counterparties and the Fund’s custodian. The master netting arrangements allow the clearing brokers to net any collateral held in or on behalf of the Fund, or liabilities or payment obligations of the clearing brokers to the Fund, against any liabilities or payment obligations of the Fund to the clearing brokers. The Fund is required to deposit financial collateral (including cash collateral) at the FCM's custodian on behalf of clearing brokers and counterparties to continually meet the original and maintenance requirements established by the clearing brokers and counterparties. Such requirements are specific to the respective clearing broker or counterparty. Certain master netting arrangements may not be enforceable in the bankruptcy proceedings of a counterparty.
| 25 |
| The Hartford Balanced Fund |
| Notes to Financial Statements – (continued) |
| October 31, 2014 |
| (000’s Omitted) |
Offsetting of Financial Liabilities and Derivative Liabilities as of October 31, 2014:
| Gross Amounts* of Liabilities Presented in Statement of Assets and Liabilities | Financial Instruments with Allowable Netting | Non-cash Collateral Pledged | Cash Collateral Pledged | Net Amount (not less than $0) | ||||||||||||||||
| Description | ||||||||||||||||||||
| Futures contracts - variation margin payable | $ | 8 | $ | — | $ | (85 | ) | $ | — | $ | — | |||||||||
| Total subject to a master netting or similar arrangement | $ | 8 | $ | — | $ | (85 | ) | $ | — | $ | — | |||||||||
* Gross amounts are presented here as there are no amounts that are netted within the Statement of Assets and Liabilities.
Principal Risks:
Credit risk depends largely on the perceived financial health of bond issuers. In general, the credit rating is inversely related to the credit risk of the issuer. Higher rated bonds generally are deemed to have less credit risk, while lower or unrated bonds are deemed to have higher risk of default. The share price, yield and total return of a fund that holds securities with higher credit risk may be more volatile than those of a fund that holds bonds with lower credit risk. Similar to credit risk, the Fund may be exposed to counterparty risk, or the risk that an institution or other entity with which the Fund has unsettled or open transactions will default.
The Fund’s investments expose the Fund to various risks including, but not limited to, interest rate, prepayment, extension, foreign currency and equity risks. Interest rate risk is the risk that fixed income securities will decline in value because of changes in interest rates. As nominal interest rates rise, the values of certain fixed income securities held by the Fund are likely to decrease. A nominal interest rate can be described as the sum of a real interest rate and an expected inflation rate. Fixed income securities with longer durations tend to be more sensitive to changes in interest rates, usually making them more volatile than securities with shorter durations. Duration is useful primarily as a measure of the sensitivity of a fixed income security’s market price to interest rate (i.e., yield) movements. Rising interest rates may cause prepayments to occur at a slower than expected rate, thereby effectively lengthening the maturity of the security and making the security more sensitive to interest rate changes. Prepayment and extension risk are major risks of mortgage backed securities and certain asset backed securities. For certain asset backed securities, the actual maturity may be less than the stated maturity shown in the Schedule of Investments, if applicable. As a result, the timing of income recognition relating to these securities may vary based upon the actual maturity.
If the Fund invests directly in foreign currencies or in securities that trade in, and receive revenues in, foreign currencies, or in derivatives that provide exposure to foreign currencies, it will be subject to the risk that those currencies will decline in value relative to the base currency (U.S. dollars) of the Fund, or, in the case of hedging positions, that the Fund’s base currency will decline in value relative to the currency being hedged. Currency rates in foreign countries may fluctuate significantly over short periods of time for a number of reasons, including changes in interest rates, intervention (or the failure to intervene) by U.S. or foreign governments, central banks or supranational entities, such as the International Monetary Fund, or by the imposition of currency controls or other political developments in the United States or abroad. As a result, the Fund’s investments in foreign currency denominated securities may reduce the returns of the Fund. The market values of equity securities, such as common stocks and preferred stocks, or equity related investments, such as futures and options, may decline due to general market conditions which are not specifically related to a particular company, such as real or perceived adverse economic conditions, changes in the general outlook for corporate earnings, changes in interest or currency rates or adverse investor sentiment generally. The market value of equity securities may also decline due to factors which affect a particular industry or industries, such as labor shortages or increased production costs and competitive conditions within an industry. Equity securities and equity related investments generally have greater market price volatility than fixed income securities.
Federal Income Taxes:
Federal Income Taxes – For federal income tax purposes, the Fund intends to continue to qualify as a Regulated Investment Company ("RIC") under Subchapter M of the Internal Revenue Code (“IRC”) by distributing substantially all of its taxable net investment income and net realized capital gains to its shareholders and otherwise complying with the requirements of the IRC. The
| 26 |
| The Hartford Balanced Fund |
| Notes to Financial Statements – (continued) |
| October 31, 2014 |
| (000’s Omitted) |
Fund has distributed substantially all of its income and capital gains in prior years, if applicable, and intends to distribute substantially all of its income and capital gains during the calendar year ending December 31, 2014. Accordingly, no provision for federal income or excise taxes has been made in the accompanying financial statements. Distributions from short-term capital gains are treated as ordinary income distributions for federal income tax purposes.
Net Investment Income (Loss), Net Realized Gains (Losses) and Distributions – Net investment income (loss) and net realized gains (losses) may differ for financial statement and tax purposes primarily because of losses deferred due to wash sale adjustments, foreign currency gains and losses, adjustments related to Passive Foreign Investment Companies ("PFICs"), Real Estate Investment Trusts ("REITs"), RICs, certain derivatives and partnerships. The character of distributions made during the year from net investment income or net realized gains may differ from their ultimate characterization for federal income tax purposes. Also, due to the timing of dividend distributions, the fiscal year in which amounts are distributed may differ from the year that the income or realized gains (losses) were recorded by the Fund.
Distributions and Components of Distributable Earnings – The tax character of distributions paid by the Fund for the periods indicated is as follows (as adjusted for dividends payable, if applicable):
| For the Year Ended October 31, 2014 | For the Year Ended October 31, 2013 | |||||||
| Ordinary Income | $ | 7,260 | $ | 6,873 | ||||
As of October 31, 2014, the Fund’s components of distributable earnings (deficit) on a tax basis are as follows:
| Amount | ||||
| Undistributed Ordinary Income | $ | 597 | ||
| Accumulated Capital and Other Losses* | (133,113 | ) | ||
| Unrealized Appreciation† | 167,236 | |||
| Total Accumulated Earnings | $ | 34,720 | ||
| * | The Fund has capital loss carryforwards that are identified in the Capital Loss Carryforward note that follows. |
| † | Differences between book-basis and tax-basis unrealized appreciation (depreciation) may be attributable to the losses deferred due to wash sale adjustments, foreign currency gains and losses, adjustments related to PFICs, REITs, RICs, certain derivatives and partnerships. |
Reclassification of Capital Accounts – The Fund may record reclassifications in its capital accounts. These reclassifications have no impact on the total net assets of the Fund. The reclassifications are a result of permanent differences between U.S. GAAP and tax accounting for such items as foreign currency, PFICs, expiration or utilization of capital loss carryforwards or net operating losses. Adjustments are made to reflect the impact these items have on current and future distributions to shareholders. Therefore, the source of the Fund’s distributions may be shown in the accompanying Statement of Changes in Net Assets as from undistributed net investment income, from accumulated net realized gains on investments or from capital depending on the type of book and tax differences that exist. For the year ended October 31, 2014, the Fund recorded reclassifications to increase (decrease) the accounts listed below:
| Amount | ||||
| Undistributed Net Investment Income (Loss) | $ | 213 | ||
| Accumulated Net Realized Gain (Loss) | (213 | ) | ||
Capital Loss Carryforward – On December 22, 2010, the Regulated Investment Company Modernization Act of 2010 (the “Act”) was enacted, which made changes to the capital loss carryforward rules. The changes are effective for taxable years beginning after the date of enactment. Under the Act, funds are permitted to carry forward capital losses for an unlimited period. However, any losses incurred during those future taxable years will be required to be utilized prior to the losses incurred in pre-enactment taxable years, which carry an expiration date. As a result of this ordering rule, pre-enactment capital loss carryforwards may be more likely to expire
| 27 |
| The Hartford Balanced Fund |
| Notes to Financial Statements – (continued) |
| October 31, 2014 |
| (000’s Omitted) |
unused. Additionally, post-enactment capital loss carryforwards retain their character as either short-term or long-term capital losses rather than being considered all short-term as permitted under prior regulation.
At October 31, 2014 (tax year end), the Fund had capital loss carryforwards for U.S. federal income tax purposes as follows:
| Year of Expiration | Amount | |||
| 2017 | $ | 133,113 | ||
| Total | $ | 133,113 | ||
During the year ended October 31, 2014, the Fund utilized $40,031 of prior year capital loss carryforwards.
Accounting for Uncertainty in Income Taxes – The Fund has adopted financial reporting rules that require the Fund to analyze all open tax years, as defined by the statute of limitations, for all major jurisdictions. Generally, tax authorities can examine all tax returns filed for the last three years. The Fund does not have an examination in progress.
The Fund has reviewed all open tax years and major jurisdictions and concluded that these financial reporting rules had no effect on the Fund’s financial position or results of operations. There is no tax liability resulting from unrecognized tax benefits relating to uncertain income tax positions taken or expected to be taken on the tax return for the fiscal year ended October 31, 2014. The Fund is also not aware of any tax positions for which it is reasonably possible that the total amounts of unrecognized tax benefits will significantly change in the next twelve months.
Expenses:
Investment Management Agreement – Hartford Funds Management Company, LLC ("HFMC") serves as the Fund’s investment manager pursuant to an Investment Management Agreement with the Company. HFMC is an indirect wholly owned subsidiary of The Hartford Financial Services Group, Inc. ("The Hartford"). The investment manager has overall investment supervisory responsibility for the Fund. In addition, the investment manager provides administrative personnel, services, equipment, facilities and office space for proper operation of the Fund. HFMC has contracted with Wellington Management Company, LLP ("Wellington Management") under a sub-advisory agreement for the provision of day-to-day investment management services to the Fund in accordance with the Fund’s investment objective and policies. The Fund pays a fee to the investment manager, a portion of which may be used to compensate Wellington Management.
The schedule below reflects the rates of compensation paid to the investment manager for investment management services rendered as of October 31, 2014; the rates are accrued daily and paid monthly:
| Average Daily Net Assets | Annual Fee |
| On first $500 million | 0.6900% |
| On next $500 million | 0.6250% |
| On next $4 billion | 0.5750% |
| On next $5 billion | 0.5725% |
| Over $10 billion | 0.5700% |
Accounting Services Agreement – Pursuant to the Fund Accounting Agreement between HFMC and the Company, on behalf of the Fund, HFMC provides accounting services to the Fund and receives monthly compensation based on the Fund’s average daily net assets at the rates set forth below. The Fund’s accounting services fees are accrued daily and paid monthly.
| Average Daily Net Assets | Annual Fee |
| On first $5 billion | 0.018% |
| On next $5 billion | 0.014% |
| Over $10 billion | 0.010% |
| 28 |
| The Hartford Balanced Fund |
| Notes to Financial Statements – (continued) |
| October 31, 2014 |
| (000’s Omitted) |
Operating Expenses – Allocable expenses incurred by the Company are allocated to each Fund and allocated to classes within the Fund in proportion to the average daily net assets of the Fund and each class, except where allocation of certain expenses is more fairly made directly to the Fund or to specific classes within a Fund. As of October 31, 2014, HFMC contractually limited the total operating expenses of this Fund, exclusive of taxes, interest expense, brokerage commissions, acquired fund fees and expenses and extraordinary expenses, through February 28, 2015 as follows:
| Class A | Class B | Class C | Class R3 | Class R4 | Class R5 | Class Y |
| 1.18% | NA | NA | 1.40% | 1.10% | 0.80% | NA |
Fees Paid Indirectly – The Fund has entered into agreements with State Street Global Markets, LLC and Russell Implementation Services, Inc. to partially recapture non-discounted trade commissions. Such rebates are used to pay a portion of the Fund's expenses. For the year ended October 31, 2014, this amount, if any, is included in the Statement of Operations.
The ratio of expenses to average net assets in the accompanying financial highlights excludes the reduction in expenses related to fees paid indirectly. The annualized expense ratio after waivers for the period listed below reflecting the reduction for fees paid indirectly is as follows:
| Year Ended October 31, 2014 | ||||
| Class A | 1.17 | % | ||
| Class B | 2.04 | |||
| Class C | 1.86 | |||
| Class R3 | 1.40 | |||
| Class R4 | 1.10 | |||
| Class R5 | 0.80 | |||
| Class Y | 0.74 | |||
Distribution and Service Plan for Class A, B, C, R3 and R4 Shares – Hartford Funds Distributors, LLC ("HFD"), an indirect wholly owned subsidiary of The Hartford, is the principal underwriter and distributor of the Fund. HFD is engaged in distribution activities, which include marketing and distribution of shares through broker/dealers, financing distribution costs and maintaining financial books and records. For the year ended October 31, 2014, HFD received front-end load sales charges of $883 and contingent deferred sales charges of $11 from the Fund.
The Fund has adopted a Distribution and Service Plan in accordance with Rule 12b-1 of the 1940 Act to compensate the distributor (HFD) for activities intended to result in the sale and distribution of Class A, B, C, R3 and R4 shares and for providing services for shareholders. The Rule 12b-1 plan applicable to Class A shares of the Fund provides for payment of a Rule 12b-1 fee of 0.25% of average daily net assets. Some or all of the fee may be used for shareholder servicing expenses with the remainder used for distribution expenses. Under the Class B Plan, the Fund pays the distributor 1.00% of the average daily net assets of Class B shares that are outstanding for 8 years or less, 0.25% of which is a fee for services provided to existing shareholders with the remainder used for distribution expenses. Some or the entire Rule 12b-1 fee for Class B shares may be remitted to broker/dealers for distribution and/or shareholder account services. After eight years, Class B shares convert to Class A shares. Upon conversion to Class A shares, the Class A plan described above will apply to those shares. Under the Class C Plan, the Fund pays the distributor 1.00% of the average daily net assets of Class C shares outstanding, 0.25% of which is intended as a fee for services provided to existing shareholders with the remainder used for distribution expenses. For Class C shares, some or the entire fee may be remitted to broker/dealers for distribution and/or shareholder account services. Class R3 shares have a distribution fee of 0.50% of average daily net assets and Class R4 shares have a distribution fee of 0.25% of average daily net assets. For Class R3 and R4 shares, some or the entire fee may be remitted to broker/dealers for distribution and/or shareholder account services. The Fund’s 12b-1 fees are accrued daily and paid monthly or at such other intervals as the Board of Directors may determine.
Other Related Party Transactions – Certain officers of the Fund are directors and/or officers of HFMC and/or The Hartford or its subsidiaries. For the year ended October 31, 2014, a portion of the Fund’s Chief Compliance Officer’s compensation was paid by all of the investment companies in the Hartford fund complex. The portion allocated to the Fund, as represented in other expenses on
| 29 |
| The Hartford Balanced Fund |
| Notes to Financial Statements – (continued) |
| October 31, 2014 |
| (000’s Omitted) |
the Statement of Operations, was in the amount of $1. Hartford Administrative Services Company (“HASCO”), an indirect wholly-owned subsidiary of The Hartford, provides transfer agent services to the Fund. HASCO has contractually agreed to reimburse any portion of the transfer agency fees over 0.30% of average daily net assets per fiscal year for each class. Any transfer agency fee reimbursement is determined before considering the contractual operating expense limitation. For providing such services, HASCO is compensated on a per account basis that varies by account type, except with respect to Class Y, for which it is compensated based on average daily net assets. The amount paid to HASCO and any related contractual reimbursement amounts, if applicable, can be found in the Statement of Operations. These fees are accrued daily and paid monthly.
Administrative services fees are paid to HASCO for third-party recordkeeping services that are payable as a percentage of net assets in the amount of up to 0.20%, 0.15% and 0.10% for Classes R3, R4 and R5 shares, respectively. The total administrative services fees are shown on the Statement of Operations. These fees are accrued daily and paid monthly.
Affiliate Holdings:
As of October 31, 2014, affiliates of The Hartford had ownership of shares in the Fund as follows:
| Percentage of Class | Percentage of Fund | |||||||
| Class R5 | 99 | % | — | %* | ||||
| * | Percentage rounds to zero. |
Investment Transactions:
For the year ended October 31, 2014, the cost of purchases and proceeds from sales of investment securities (excluding short-term investments) were as follows:
| Excluding U.S. Government Obligations | U.S. Government Obligations | Total | ||||||||||
| Cost of Purchases | $ | 253,686 | $ | 85,649 | $ | 339,335 | ||||||
| Sales Proceeds | 267,120 | 85,562 | 352,682 | |||||||||
| 30 |
| The Hartford Balanced Fund |
| Notes to Financial Statements – (continued) |
| October 31, 2014 |
| (000’s Omitted) |
Capital Share Transactions:
The following information is for the year ended October 31, 2014, and the year ended October 31, 2013:
| For the Year Ended October 31, 2014 | For the Year Ended October 31, 2013 | |||||||||||||||||||||||||||||||
| Shares Sold | Shares Issued for Reinvested Dividends | Shares Redeemed | Net Increase (Decrease) of Shares | Shares Sold | Shares Issued for Reinvested Dividends | Shares Redeemed | Net Increase (Decrease) of Shares | |||||||||||||||||||||||||
| Class A | ||||||||||||||||||||||||||||||||
| Shares | 2,893 | 325 | (3,860 | ) | (642 | ) | 3,048 | 354 | (4,345 | ) | (943 | ) | ||||||||||||||||||||
| Amount | $ | 56,723 | $ | 6,415 | $ | (75,584 | ) | $ | (12,446 | ) | $ | 53,386 | $ | 6,101 | $ | (74,803 | ) | $ | (15,316 | ) | ||||||||||||
| Class B | ||||||||||||||||||||||||||||||||
| Shares | 25 | 1 | (263 | ) | (237 | ) | 80 | 3 | (414 | ) | (331 | ) | ||||||||||||||||||||
| Amount | $ | 471 | $ | 25 | $ | (5,115 | ) | $ | (4,619 | ) | $ | 1,391 | $ | 44 | $ | (7,111 | ) | $ | (5,676 | ) | ||||||||||||
| Class C | ||||||||||||||||||||||||||||||||
| Shares | 1,499 | 28 | (737 | ) | 790 | 1,176 | 26 | (701 | ) | 501 | ||||||||||||||||||||||
| Amount | $ | 29,311 | $ | 559 | $ | (14,499 | ) | $ | 15,371 | $ | 20,822 | $ | 454 | $ | (12,179 | ) | $ | 9,097 | ||||||||||||||
| Class R3 | ||||||||||||||||||||||||||||||||
| Shares | 8 | — | (13 | ) | (5 | ) | 12 | — | (1 | ) | 11 | |||||||||||||||||||||
| Amount | $ | 142 | $ | 6 | $ | (254 | ) | $ | (106 | ) | $ | 213 | $ | 5 | $ | (26 | ) | $ | 192 | |||||||||||||
| Class R4 | ||||||||||||||||||||||||||||||||
| Shares | 12 | — | (2 | ) | 10 | 19 | 1 | (82 | ) | (62 | ) | |||||||||||||||||||||
| Amount | $ | 234 | $ | 7 | $ | (51 | ) | $ | 190 | $ | 320 | $ | 17 | $ | (1,457 | ) | $ | (1,120 | ) | |||||||||||||
| Class R5 | ||||||||||||||||||||||||||||||||
| Shares | — | 1 | — | 1 | — | — | — | — | ||||||||||||||||||||||||
| Amount | $ | 1 | $ | 2 | $ | — | $ | 3 | $ | — | $ | 2 | $ | (2 | ) | $ | — | |||||||||||||||
| Class Y | ||||||||||||||||||||||||||||||||
| Shares | 15 | 2 | (19 | ) | (2 | ) | 15 | 2 | (23 | ) | (6 | ) | ||||||||||||||||||||
| Amount | $ | 298 | $ | 33 | $ | (360 | ) | $ | (29 | ) | $ | 259 | $ | 31 | $ | (408 | ) | $ | (118 | ) | ||||||||||||
| Total | ||||||||||||||||||||||||||||||||
| Shares | 4,452 | 357 | (4,894 | ) | (85 | ) | 4,350 | 386 | (5,566 | ) | (830 | ) | ||||||||||||||||||||
| Amount | $ | 87,180 | $ | 7,047 | $ | (95,863 | ) | $ | (1,636 | ) | $ | 76,391 | $ | 6,654 | $ | (95,986 | ) | $ | (12,941 | ) | ||||||||||||
The following reflects the conversion of Class B shares into Class A shares (reflected as Class A shares sold) for the year ended October 31, 2014, and the year ended October 31, 2013:
| Shares | Dollars | |||||||
| For the Year Ended October 31, 2014 | 117 | $ | 2,300 | |||||
| For the Year Ended October 31, 2013 | 157 | $ | 2,711 | |||||
Line of Credit:
The Fund is one of several Hartford Funds that participate in a $500 million committed revolving line of credit facility. The facility is to be used for temporary or emergency purposes. Under the arrangement, the funds are required to own securities having a market value in excess of 300% of the total bank borrowings. The interest rate on borrowings varies depending on the nature of the loan. The facility also requires a fee to be paid based on the amount of the commitment. This commitment fee is allocated to all the funds participating in the line of credit based on the average net assets of the funds. During the year ended October 31, 2014, the Fund did not have any borrowings under this facility.
Pending Legal Proceedings:
On February 25, 2011, Jennifer L. Kasilag, Louis Mellinger, Judith M. Menendez, Jacqueline M. Robinson, and Linda A. Russell filed a derivative lawsuit against Hartford Investment Financial Services, LLC (“HIFSCO”) (now known as HFD) on behalf of six Hartford retail mutual funds in the United States District Court for the District of New Jersey, alleging that HIFSCO received excessive advisory and distribution fees in violation of its statutory fiduciary duty under Section 36(b) of the 1940 Act when serving as investment manager and principal underwriter, respectively, to the Hartford retail mutual funds. Although this action was purportedly filed on behalf of certain of the Hartford Funds, none of the Hartford Funds is itself a defendant to the suit. HIFSCO moved to dismiss and, in September 2011, the motion was granted in part and denied in part, with leave to amend the complaint. In November 2011, plaintiffs filed an amended complaint on
| 31 |
| The Hartford Balanced Fund |
| Notes to Financial Statements – (continued) |
| October 31, 2014 |
| (000’s Omitted) |
behalf of certain Hartford retail mutual funds, The Hartford Global Health Fund (now known as The Hartford Healthcare Fund), The Hartford Conservative Allocation Fund, The Hartford Growth Opportunities Fund, The Hartford Inflation Plus Fund, The Hartford Advisers Fund (now known as The Hartford Balanced Fund), and The Hartford Capital Appreciation Fund. Plaintiffs seek to rescind the investment management agreements and distribution plans between HIFSCO and these funds and to recover the total fees charged thereunder or, in the alternative, to recover any improper compensation HIFSCO received, in addition to lost earnings. HIFSCO filed a partial motion to dismiss the amended complaint and, in December 2012, the court dismissed without prejudice the claims regarding distribution fees and denied the motion with respect to the advisory fees claims. HIFSCO disputes the allegations and intends to defend vigorously.
In March 2014, the plaintiffs filed a new complaint that added as new plaintiffs The Hartford Floating Rate Fund and The Hartford Small Company Fund and named as a defendant HFMC, which assumed the role as investment manager to the funds as of January 2013. HFMC and HIFSCO dispute the allegations and intend to defend vigorously.
No accrual for litigation relating to this matter has been recorded in the financial statements of the Fund because the Fund is not party to the suit.
Indemnifications:
Under the Company's organizational documents, the Company shall indemnify its officers and directors to the full extent required or permitted under Maryland General Corporation Law and the federal securities laws. In addition, the Company, on behalf of the Fund, may enter into contracts that contain a variety of indemnifications. The Company's maximum exposure under these arrangements is unknown. However, as of the date of these financial statements, the Company has not had prior claims or losses pursuant to these contracts and expects the risk of loss to be remote.
Subsequent Event:
Effective December 1, 2014, pursuant to a sub-transfer agency agreement between HASCO and Boston Financial Data Services, Inc. (“BFDS”), HASCO has delegated certain transfer agent, dividend disbursing agent and shareholder servicing agent functions to BFDS. The costs and expenses of such delegation are borne by HASCO, not by the Fund.
| 32 |
| The Hartford Balanced Fund |
| Financial Highlights |
| - Selected Per-Share Data - (A) | - Ratios and Supplemental Data - | |||||||||||||||||||||||||||||||||||||||||||||||||||
| Class | Net Asset Value at Beginning of Period | Net Investment Income (Loss) | Net Realized and Unrealized Gain (Loss) on Invest- ments | Total from Investment Operations | Dividends from Net Investment Income | Distribu- tions from Realized Capital Gains | Total Dividends and Distributions | Net Asset Value at End of Period | Total Return(B) | Net Assets at End of Period (000's) | Ratio of Expenses to Average Net Assets Before Adjust- ments(C) | Ratio of Expenses to Average Net Assets After Adjust- ments(C) | Ratio of Net Investment Income (Loss) to Average Net Assets | |||||||||||||||||||||||||||||||||||||||
| For the Year Ended October 31, 2014 | ||||||||||||||||||||||||||||||||||||||||||||||||||||
| A | $ | 18.62 | $ | 0.23 | $ | 1.92 | $ | 2.15 | $ | (0.23 | ) | $ | – | $ | (0.23 | ) | $ | 20.54 | 11.60 | % | $ | 585,217 | 1.17 | % | 1.17 | % | 1.17 | % | ||||||||||||||||||||||||
| B | 18.50 | 0.06 | 1.91 | 1.97 | (0.05 | ) | – | (0.05 | ) | 20.42 | 10.64 | 8,635 | 2.27 | 2.04 | 0.33 | |||||||||||||||||||||||||||||||||||||
| C | 18.63 | 0.09 | 1.92 | 2.01 | (0.10 | ) | – | (0.10 | ) | 20.54 | 10.82 | 126,773 | 1.86 | 1.86 | 0.47 | |||||||||||||||||||||||||||||||||||||
| R3 | 18.81 | 0.18 | 1.94 | 2.12 | (0.18 | ) | – | (0.18 | ) | 20.75 | 11.32 | 593 | 1.50 | 1.40 | 0.93 | |||||||||||||||||||||||||||||||||||||
| R4 | 18.83 | 0.24 | 1.95 | 2.19 | (0.24 | ) | – | (0.24 | ) | 20.78 | 11.67 | 786 | 1.16 | 1.10 | 1.22 | |||||||||||||||||||||||||||||||||||||
| R5 | 18.85 | 0.30 | 1.95 | 2.25 | (0.30 | ) | – | (0.30 | ) | 20.80 | 12.02 | 157 | 0.86 | 0.80 | 1.53 | |||||||||||||||||||||||||||||||||||||
| Y | 18.87 | 0.32 | 1.95 | 2.27 | (0.32 | ) | – | (0.32 | ) | 20.82 | 12.08 | 2,147 | 0.74 | 0.74 | 1.59 | |||||||||||||||||||||||||||||||||||||
| For the Year Ended October 31, 2013 | ||||||||||||||||||||||||||||||||||||||||||||||||||||
| A | $ | 16.06 | $ | 0.22 | $ | 2.56 | $ | 2.78 | $ | (0.22 | ) | $ | – | $ | (0.22 | ) | $ | 18.62 | 17.40 | % | $ | 542,452 | 1.21 | % | 1.18 | % | 1.24 | % | ||||||||||||||||||||||||
| B | 15.94 | 0.07 | 2.54 | 2.61 | (0.05 | ) | – | (0.05 | ) | 18.50 | 16.43 | 12,206 | 2.27 | 2.04 | 0.42 | |||||||||||||||||||||||||||||||||||||
| C | 16.07 | 0.09 | 2.57 | 2.66 | (0.10 | ) | – | (0.10 | ) | 18.63 | 16.58 | 100,230 | 1.89 | 1.89 | 0.52 | |||||||||||||||||||||||||||||||||||||
| R3 | 16.23 | 0.17 | 2.59 | 2.76 | (0.18 | ) | – | (0.18 | ) | 18.81 | 17.11 | 641 | 1.51 | 1.40 | 0.98 | |||||||||||||||||||||||||||||||||||||
| R4 | 16.23 | 0.24 | 2.59 | 2.83 | (0.23 | ) | – | (0.23 | ) | 18.83 | 17.55 | 531 | 1.15 | 1.10 | 1.35 | |||||||||||||||||||||||||||||||||||||
| R5 | 16.26 | 0.28 | 2.59 | 2.87 | (0.28 | ) | – | (0.28 | ) | 18.85 | 17.81 | 140 | 0.86 | 0.80 | 1.62 | |||||||||||||||||||||||||||||||||||||
| Y | 16.27 | 0.30 | 2.59 | 2.89 | (0.29 | ) | – | (0.29 | ) | 18.87 | 17.92 | 1,979 | 0.74 | 0.74 | 1.69 | |||||||||||||||||||||||||||||||||||||
| For the Year Ended October 31, 2012 (D) | ||||||||||||||||||||||||||||||||||||||||||||||||||||
| A | $ | 14.63 | $ | 0.22 | $ | 1.44 | $ | 1.66 | $ | (0.23 | ) | $ | – | $ | (0.23 | ) | $ | 16.06 | 11.42 | % | $ | 483,041 | 1.24 | % | 1.18 | % | 1.40 | % | ||||||||||||||||||||||||
| B | 14.51 | 0.09 | 1.42 | 1.51 | (0.08 | ) | – | (0.08 | ) | 15.94 | 10.43 | 15,803 | 2.24 | 2.05 | 0.55 | |||||||||||||||||||||||||||||||||||||
| C | 14.64 | 0.10 | 1.45 | 1.55 | (0.12 | ) | – | (0.12 | ) | 16.07 | 10.60 | 78,414 | 1.92 | 1.92 | 0.67 | |||||||||||||||||||||||||||||||||||||
| R3 | 14.78 | 0.18 | 1.47 | 1.65 | (0.20 | ) | – | (0.20 | ) | 16.23 | 11.22 | 378 | 1.56 | 1.40 | 1.17 | |||||||||||||||||||||||||||||||||||||
| R4 | 14.79 | 0.24 | 1.44 | 1.68 | (0.24 | ) | – | (0.24 | ) | 16.23 | 11.44 | 1,456 | 1.16 | 1.10 | 1.59 | |||||||||||||||||||||||||||||||||||||
| R5 | 14.81 | 0.28 | 1.46 | 1.74 | (0.29 | ) | – | (0.29 | ) | 16.26 | 11.84 | 121 | 0.88 | 0.80 | 1.78 | |||||||||||||||||||||||||||||||||||||
| Y | 14.82 | 0.29 | 1.46 | 1.75 | (0.30 | ) | – | (0.30 | ) | 16.27 | 11.89 | 1,804 | 0.75 | 0.75 | 1.83 | |||||||||||||||||||||||||||||||||||||
| For the Year Ended October 31, 2011 | ||||||||||||||||||||||||||||||||||||||||||||||||||||
| A | $ | 14.23 | $ | 0.18 | $ | 0.40 | $ | 0.58 | $ | (0.18 | ) | $ | – | $ | (0.18 | ) | $ | 14.63 | 4.10 | % | $ | 488,193 | 1.23 | % | 1.18 | % | 1.20 | % | ||||||||||||||||||||||||
| B | 14.10 | 0.05 | 0.41 | 0.46 | (0.05 | ) | – | (0.05 | ) | 14.51 | 3.24 | 28,334 | 2.15 | 2.03 | 0.34 | |||||||||||||||||||||||||||||||||||||
| C | 14.24 | 0.07 | 0.41 | 0.48 | (0.08 | ) | – | (0.08 | ) | 14.64 | 3.33 | 78,642 | 1.90 | 1.90 | 0.47 | |||||||||||||||||||||||||||||||||||||
| R3 | 14.38 | 0.15 | 0.41 | 0.56 | (0.16 | ) | – | (0.16 | ) | 14.78 | 3.87 | 228 | 1.52 | 1.40 | 0.98 | |||||||||||||||||||||||||||||||||||||
| R4 | 14.39 | 0.19 | 0.41 | 0.60 | (0.20 | ) | – | (0.20 | ) | 14.79 | 4.18 | 4,788 | 1.14 | 1.10 | 1.29 | |||||||||||||||||||||||||||||||||||||
| R5 | 14.40 | 0.24 | 0.41 | 0.65 | (0.24 | ) | – | (0.24 | ) | 14.81 | 4.52 | 107 | 0.85 | 0.80 | 1.58 | |||||||||||||||||||||||||||||||||||||
| Y | 14.41 | 0.25 | 0.41 | 0.66 | (0.25 | ) | – | (0.25 | ) | 14.82 | 4.60 | 1,763 | 0.74 | 0.74 | 1.64 | |||||||||||||||||||||||||||||||||||||
See Portfolio Turnover information on the next page.
| 33 |
| The Hartford Balanced Fund |
| Financial Highlights – (continued) |
| - Selected Per-Share Data - (A) | - Ratios and Supplemental Data - | |||||||||||||||||||||||||||||||||||||||||||||||||||
| Class | Net Asset Value at Beginning of Period | Net Investment Income (Loss) | Net Realized and Unrealized Gain (Loss) on Invest- ments | Total from Investment Operations | Dividends from Net Investment Income | Distribu- tions from Realized Capital Gains | Total Dividends and Distributions | Net Asset Value at End of Period | Total Return(B) | Net Assets at End of Period (000's) | Ratio of Expenses to Average Net Assets Before Adjust- ments(C) | Ratio of Expenses to Average Net Assets After Adjust- ments(C) | Ratio of Net Investment Income (Loss) to Average Net Assets | |||||||||||||||||||||||||||||||||||||||
| For the Year Ended October 31, 2010 (D) | ||||||||||||||||||||||||||||||||||||||||||||||||||||
| A | $ | 12.67 | $ | 0.17 | $ | 1.55 | $ | 1.72 | $ | (0.16 | ) | $ | – | $ | (0.16 | ) | $ | 14.23 | 13.64 | % | $ | 554,735 | 1.23 | % | 1.18 | % | 1.21 | % | ||||||||||||||||||||||||
| B | 12.54 | 0.06 | 1.53 | 1.59 | (0.03 | ) | – | (0.03 | ) | 14.10 | 12.72 | 48,096 | 2.13 | 2.03 | 0.38 | |||||||||||||||||||||||||||||||||||||
| C | 12.67 | 0.07 | 1.56 | 1.63 | (0.06 | ) | – | (0.06 | ) | 14.24 | 12.89 | 92,526 | 1.90 | 1.90 | 0.49 | |||||||||||||||||||||||||||||||||||||
| R3 | 12.81 | 0.13 | 1.58 | 1.71 | (0.14 | ) | – | (0.14 | ) | 14.38 | 13.38 | 153 | 1.55 | 1.42 | 0.91 | |||||||||||||||||||||||||||||||||||||
| R4 | 12.81 | 0.18 | 1.57 | 1.75 | (0.17 | ) | – | (0.17 | ) | 14.39 | 13.72 | 1,420 | 1.13 | 1.12 | 1.28 | |||||||||||||||||||||||||||||||||||||
| R5 | 12.82 | 0.21 | 1.58 | 1.79 | (0.21 | ) | – | (0.21 | ) | 14.40 | 14.06 | 102 | 0.85 | 0.81 | 1.51 | |||||||||||||||||||||||||||||||||||||
| Y | 12.83 | 0.23 | 1.57 | 1.80 | (0.22 | ) | – | (0.22 | ) | 14.41 | 14.14 | 1,685 | 0.73 | 0.73 | 1.66 | |||||||||||||||||||||||||||||||||||||
| (A) | Information presented relates to a share outstanding throughout the indicated period. Net investment income (loss) per share amounts are calculated based on average shares outstanding unless otherwise noted. |
| (B) | Assumes initial investment at net asset value at the beginning of each period, reinvestment of all distributions, the complete redemption of the investment at net asset value at the end of each period and no sales charge. Total return would be reduced if sales charges were taken into account. |
| (C) | Adjustments include waivers and reimbursements, if applicable. Ratios do not include fees paid indirectly (see Expenses in the accompanying Notes to Financial Statements). |
| (D) | Net investment income (loss) per share amounts have been calculated using the SEC method. |
| Portfolio Turnover Rate for All Share Classes | ||||
| For the Year Ended October 31, 2014 | 39 | % | ||
| For the Year Ended October 31, 2013 | 27 | |||
| For the Year Ended October 31, 2012 | 29 | |||
| For the Year Ended October 31, 2011 | 43 | |||
| For the Year Ended October 31, 2010 | 62 | |||
| 34 |
| Report of Independent Registered Public Accounting Firm |
| The Board of Directors and Shareholders of |
| The Hartford Mutual Funds, Inc. |
We have audited the accompanying statement of assets and liabilities, including the schedule of investments, of The Hartford Balanced Fund (one of the portfolios constituting The Hartford Mutual Funds, Inc. (the Funds)) as of October 31, 2014, and the related statement of operations for the year then ended, the statements of changes in net assets for each of the two years in the period then ended, and the financial highlights for each of the five years in the period then ended. These financial statements and financial highlights are the responsibility of the Funds’ management. Our responsibility is to express an opinion on these financial statements and financial highlights based on our audits.
We conducted our audits in accordance with the standards of the Public Company Accounting Oversight Board (United States). Those standards require that we plan and perform the audit to obtain reasonable assurance about whether the financial statements and financial highlights are free of material misstatement. We were not engaged to perform an audit of the Funds’ internal control over financial reporting. Our audits included consideration of internal control over financial reporting as a basis for designing audit procedures that are appropriate in the circumstances, but not for the purpose of expressing an opinion on the effectiveness of the Funds’ internal control over financial reporting. Accordingly, we express no such opinion. An audit also includes examining, on a test basis, evidence supporting the amounts and disclosures in the financial statements and financial highlights, assessing the accounting principles used and significant estimates made by management, and evaluating the overall financial statement presentation. Our procedures included confirmation of securities owned as of October 31, 2014, by correspondence with the custodian and brokers or by other appropriate auditing procedures where replies from brokers were not received. We believe that our audits provide a reasonable basis for our opinion.
In our opinion, the financial statements and financial highlights referred to above present fairly, in all material respects, the financial position of The Hartford Balanced Fund of The Hartford Mutual Funds, Inc. at October 31, 2014, the results of its operations for the year then ended, the changes in its net assets for each of the two years in the period then ended, and the financial highlights for each of the five years in the period then ended, in conformity with U.S. generally accepted accounting principles.
 |
| Minneapolis, Minnesota December 18, 2014 |
| 35 |
| The Hartford Balanced Fund |
| Directors and Officers (Unaudited) |
The Board of Directors of the Company (the "Directors") appoints officers who are responsible for the day-to-day operations of the Fund and who execute policies formulated by the Directors. Each Director serves until his or her death, resignation, or retirement or until the next annual meeting of shareholders is held or until his or her successor is elected and qualifies.
Directors and officers who are employed by or who have a financial interest in The Hartford Financial Services Group, Inc. ("The Hartford") are considered “interested” persons of the Fund pursuant to the 1940 Act. Each officer and two of the Company's Directors, as noted in the chart below, are “interested” persons of the Fund. Each Director serves as a director for The Hartford Mutual Funds, Inc., The Hartford Mutual Funds II, Inc., Hartford Series Fund, Inc., and Hartford HLS Series Fund II, Inc., and as a trustee for The Hartford Alternative Strategies Fund, which, as of October 31, 2014, collectively consist of 66 funds. Correspondence may be sent to Directors and officers c/o Hartford Funds, 5 Radnor Corporate Center, Suite 300, 100 Matsonford Road, Radnor, Pennsylvania 19087, except that correspondence to Mr. Annoni, Mr. Dressen and Ms. Quade may be sent to 500 Bielenberg Drive, Suite 500, Woodbury, Minnesota 55125.
The table below sets forth, for each Director and officer, his or her name, year of birth, current position with the Company and date first elected or appointed to The Hartford Mutual Funds, Inc. ("MF") and The Hartford Mutual Funds II, Inc. ("MF2"), principal occupation, and, for Directors, other directorships held. The Fund’s Statement of Additional Information contains further information on the Directors and is available free of charge by calling 1-888-843-7824 or writing to: Hartford Funds, P.O. Box 55022, Boston, MA 02205-5022.
Information on the aggregate remuneration paid to the directors of the Company can be found in the Statement of Operations herein. The Fund pays to The Hartford a portion of the Chief Compliance Officer’s compensation, but does not pay salaries or compensation to any of its other officers or Directors who are employed by The Hartford.
Non-Interested Directors
Hilary E. Ackermann (1956) Director since September 23, 2014
Ms. Ackermann served as Chief Risk Officer at Goldman Sachs Bank USA from October 2008 to November 2011 and serves as a Director of Dynegy, Inc., an independent power company, from October 2012 to present.
Lynn S. Birdsong (1946) Director since 2003, Chairman of the Investment Committee since 2014
Mr. Birdsong is a private investor. Mr. Birdsong currently serves as a Director of the Sovereign High Yield Investment Company (April 2010 to current). Mr. Birdsong currently serves as an Independent Director of Nomura Partners Funds, Inc. (formerly, The Japan Fund) (April 2003 to current). From 2003 to March 2005, Mr. Birdsong was an Independent Director of the Atlantic Whitehall Funds. From 1979 to 2002, Mr. Birdsong was a Managing Director of Zurich Scudder Investments, an investment management firm. During his employment with Scudder, Mr. Birdsong was an Interested Director of The Japan Fund. From January 1981 through December 2013, Mr. Birdsong was a partner in Birdsong Company, an advertising specialty firm.
Robert M. Gavin, Jr. (1940) Director since 2002 (MF) and 1986 (MF2), Chairman of the Board for each since 2004
Dr. Gavin is an educational consultant. Prior to September 1, 2001, he was President of Cranbrook Education Community and prior to July 1996, he was President of Macalester College, St. Paul, Minnesota.
Duane E. Hill (1945) Director since 2001 (MF) and 2002 (MF2), Chairman of the Nominating Committee since 2003
Mr. Hill is a Partner of TSG Ventures L.P., a private equity investment company. Mr. Hill is a former partner of TSG Capital Group, a private equity investment firm that served as sponsor and lead investor in leveraged buyouts of middle market companies.
Sandra S. Jaffee (1941) Director since 2005
Ms. Jaffee is the founder and Chief Executive Officer of a private company, Homeworks Concierge, LLC, which provides residential property management services in Westchester County, New York (January 2012 to present). Ms. Jaffee served as Chairman (2008 to 2009) and Chief Executive Officer of Fortent (formerly Searchspace Group), a leading provider of compliance/regulatory technology to financial institutions from August 2005 to August 2009. From August 2004 to August 2005, Ms. Jaffee served as an Entrepreneur in Residence with Warburg Pincus, a private equity firm. Prior to joining Warburg Pincus, Ms. Jaffee served as Executive Vice President at Citigroup, from September 1995 to July 2004, where she was President and Chief Executive Officer of Citibank’s Global Securities Services (1995 to 2003). Ms. Jaffee currently serves as a member of the Board of Directors of Broadridge Financial Solutions as well as a Trustee of Muhlenberg College.
| 36 |
| The Hartford Balanced Fund |
| Directors and Officers (Unaudited) – (continued) |
William P. Johnston (1944) Director since 2005, Chairman of the Compliance Committee since 2005
In June 2006, Mr. Johnston was appointed as Senior Advisor to The Carlyle Group, a global private equity and other alternative asset investment firm and currently serves as an Operating Executive. In July 2006, Mr. Johnston was elected to the Board of Directors of MultiPlan, Inc. and served as a Director (July 2006 to August 2010). In August 2007, Mr. Johnston was elected to the Board of Directors of LifeCare Holdings, Inc. and served as a Director (August 2007 to June 2013). In February 2008, Mr. Johnston was elected to the Board of Directors of HCR-ManorCare, Inc. In May 2006, Mr. Johnston was elected to the Supervisory Board of Fresenius Medical Care AG & Co. KGaA, after its acquisition of Renal Care Group, Inc. in March 2006. Mr. Johnston joined Renal Care Group in November 2002 as a member of the Board of Directors and served as Chairman of the Board from March 2003 through March 2006. From 2002 through 2013, Mr. Johnston served as a Board member of the Georgia O’Keefe Museum. From September 1987 to December 2002, Mr. Johnston was with Equitable Securities Corporation (and its successors, SunTrust Equitable Securities and SunTrust Robinson Humphrey) serving in various investment banking and managerial positions, including Managing Director and Head of Investment Banking, Chief Executive Officer and Vice Chairman.
Phillip O. Peterson (1944) Director since 2002 (MF) and 2000 (MF2), Chairman of the Audit Committee since 2002
Mr. Peterson is a mutual fund industry consultant. He was a partner of KPMG LLP (an accounting firm) until July 1999. Mr. Peterson joined William Blair Funds in February 2007 as a member of the Board of Trustees. From February 2012 to February 2014, Mr. Peterson served as a Trustee of Symetra Variable Mutual Funds. From January 2004 to April 2005, Mr. Peterson served as Independent President of the Strong Mutual Funds.
Lemma W. Senbet (1946) Director since 2005
Dr. Senbet is the William E. Mayer Chair Professor of Finance and Founding Director, Center for Financial Policy, at the University of Maryland, Robert H. Smith School of Business. He was chair of the Finance Department of the University of Maryland, Robert H. Smith School of Business from 1998 to 2006. Since June 2013, he has been on leave from the University to serve as Executive Director of African Economic Research Consortium which focuses on economic policy research and training. Previously, he was a chaired professor of finance at the University of Wisconsin-Madison. Also, he was a Director of the Fortis Funds from March 2000 to July 2002. Dr. Senbet served as Director of the American Finance Association and President of the Western Finance Association. In 2006, Dr. Senbet was inducted Fellow of Financial Management Association International for his career-long distinguished scholarship and professional service.
Interested Directors and Officers
James E. Davey (1964) Director since 2012, President and Chief Executive Officer since 2010
Mr. Davey serves as Executive Vice President of Hartford Life Insurance Company (“HLIC”) and The Hartford. Additionally, Mr. Davey serves as Chairman of the Board, Manager and Senior Managing Director of Hartford Funds Distributors, LLC (“HFD”). He also currently serves as Director, Chairman of the Board, President and Senior Managing Director of Hartford Administrative Services Company (“HASCO”). Mr. Davey also serves as Manager, Chairman of the Board and Senior Managing Director for Hartford Funds Management Company, LLC (“HFMC”) and Director, Chairman of the Board and Senior Managing Director for Hartford Funds Management Group, Inc. ("HFMG"). Mr. Davey has served in various positions within The Hartford and its subsidiaries in connection with the operation of the Hartford Funds. Mr. Davey joined The Hartford in 2002.
Lowndes A. Smith* (1939) Director since 1996 (MF) and 2002 (MF2)
Mr. Smith served as Vice Chairman of The Hartford from February 1997 to January 2002, as President and Chief Executive Officer of Hartford Life, Inc. from February 1997 to January 2002, and as President and Chief Operating Officer of The Hartford Life Insurance Companies from January 1989 to January 2002. Mr. Smith serves as a Director of White Mountains Insurance Group Ltd. (October 2003 to current); One Beacon Insurance (October 2006 to current); Symetra Financial (August 2007 to current) and is a Managing Director of Whittington Gray Associates (January 2007 to current).
* Mr. Smith resigned as a Director of MF, MF2, Hartford Series Fund, Inc. and Hartford HLS Series Fund II, Inc. and as a Trustee of The Hartford Alternative Strategies Fund effective September 17, 2014.
Other Officers
Mark A. Annoni (1964) Vice President, Controller and Treasurer since 2012
Mr. Annoni currently serves as the Assistant Vice President of HLIC (February 2004 to present) and Senior Vice President of HFMG (December 2013 to present). Mr. Annoni has served in various positions within The Hartford and its subsidiaries in connection with the operation of the Hartford Funds. Mr. Annoni joined The Hartford in 2001.
| 37 |
| The Hartford Balanced Fund |
| Directors and Officers (Unaudited) – (continued) |
Michael R. Dressen (1963) AML Compliance Officer since 2011
Mr. Dressen currently serves as Assistant Vice President of HLIC. He also serves as Chief Compliance Officer and AML Compliance Officer of HASCO and as AML Officer of HFD. Mr. Dressen has served in various positions within The Hartford and its subsidiaries in connection with the operation of the Hartford Funds.
Edward P. Macdonald (1967) Vice President, Secretary and Chief Legal Officer since 2005
Mr. Macdonald currently serves as Assistant Secretary, Executive Vice President and Deputy General Counsel of HFD, HASCO, HFMC and HFMG. He also serves as Vice President of HLIC. Mr. Macdonald has served in various positions within The Hartford and its subsidiaries in connection with the operation of the Hartford Funds. Mr. Macdonald joined The Hartford in 2005.
Joseph G. Melcher (1973) Vice President and Chief Compliance Officer since 2013
Mr. Melcher currently serves as Executive Vice President of HFD, HFMG and HASCO. Mr. Melcher also currently serves as Executive Vice President and Chief Compliance Officer of HFMC. Mr. Melcher has served in various positions within The Hartford and its subsidiaries in connection with the operation of the Hartford Funds since joining The Hartford in 2012. Prior to joining The Hartford, Mr. Melcher worked at Touchstone Investments, a member of the Western & Southern Financial Group, where he held the position of Vice President and Chief Compliance Officer from 2010 through 2012 and Assistant Vice President, Compliance from 2005 to 2010.
Vernon J. Meyer (1964) Vice President since 2006
Mr. Meyer currently serves as Senior Vice President of HLIC. He also currently serves as Managing Director and Chief Investment Officer of HFMC and Managing Director of HFMG. Mr. Meyer has served in various positions within The Hartford and its subsidiaries in connection with the operation of the Hartford Funds. Mr. Meyer joined The Hartford in 2004.
Laura S. Quade (1969) Vice President since 2012
Ms. Quade currently serves as Vice President of HASCO, HFD and HFMG. She is the Head of Operations of HASCO and formerly served as Director, Enterprise Operations of HLIC. Ms. Quade has served in various positions within The Hartford and its subsidiaries in connection with the operation of the Hartford Funds. Ms. Quade joined The Hartford in 2001.
Martin A. Swanson** (1962) Vice President since 2010
Mr. Swanson currently serves as Vice President of HLIC. Mr. Swanson also serves as Managing Director, Chief Marketing Officer and Principal of HFD and Managing Director of HFMG. Mr. Swanson has served in various positions within The Hartford and its subsidiaries in connection with the operation of the Hartford Funds.
** Mr. Swanson resigned as an officer effective November 6, 2014.
HOW TO OBTAIN A COPY OF THE FUND’S PROXY VOTING POLICIES AND VOTING RECORDS (UNAUDITED)
A description of the policies and procedures that the Fund uses to determine how to vote proxies relating to portfolio securities and information about how the Fund voted proxies relating to portfolio securities during the most recent twelve-month period ended June 30 are available (1) without charge, upon request, by calling 888-843-7824 and (2) on the SEC’s website at http://www.sec.gov.
QUARTERLY PORTFOLIO HOLDINGS INFORMATION (UNAUDITED)
The Fund files a complete schedule of portfolio holdings with the SEC for the first and third quarters of each fiscal year on Form N-Q. The Fund’s Forms N-Q are available (1) without charge, upon request, by calling 888-843-7824 and (2) on the SEC’s website at http://www.sec.gov. The Form N-Q may be reviewed and copied at the SEC’s Public Reference Room in Washington, DC. Information on the operation of the Public Reference Room may be obtained by calling 1-800-SEC-0330.
| 38 |
| The Hartford Balanced Fund |
| Federal Tax Information (Unaudited) |
For the fiscal year ended October 31, 2014, there is no further federal tax information required for this Fund.
| 39 |
| The Hartford Balanced Fund |
| Expense Example (Unaudited) |
Your Fund's Expenses
As a shareholder of the Fund, you incur two types of costs: (1) transaction costs, including sales charges (loads) on purchase payments, if any, and contingent deferred sales charges (CDSC), if any, and (2) ongoing costs, including investment management fees, distribution and/or service (12b-1) fees, if any, and other fund expenses. This example is intended to help you understand your ongoing costs (in dollars) of investing in the Fund and to compare these costs with the ongoing costs of investing in other mutual funds. The example is based on an investment of $1,000 invested at the beginning of the period and held for the entire period of April 30, 2014 through October 31, 2014.
Actual Expenses
The first set of columns of the table below provides information about actual account values and actual expenses. You may use the information in this column, together with the amount you invested, to estimate the expenses that you paid over the period. Simply divide your account value by $1,000 (for example, an $8,600 account value divided by $1,000 = 8.6), then multiply the result by the number in the line under the heading entitled “Expenses Paid During Period” to estimate the expenses you paid on your account during this period.
Hypothetical Example for Comparison Purposes
The second set of columns of the table below provides information about hypothetical account values and hypothetical expenses based on the Fund's actual expense ratio and an assumed rate of return of 5% per year before expenses, which is not the Fund's actual return. The hypothetical account values and expenses may not be used to estimate the actual ending account balance or expenses you paid for the period. You may use this information to compare the ongoing costs of investing in the Fund and other funds. To do so, compare this 5% hypothetical example with the 5% hypothetical examples that appear in the shareholder reports of the other funds.
Please note that the expenses shown in the table are meant to highlight your ongoing costs only and do not reflect any transactional costs, such as sales charges (loads) and CDSC. Therefore, the second set of columns of the table is useful in comparing ongoing costs only, and will not help you determine the relative total costs of owning different funds. In addition, if these transactional costs were included, your costs would be higher. Expenses are equal to the Fund's annualized expense ratios multiplied by average account value over the period, multiplied by 184/365 (to reflect the one-half year period).
| Actual return | Hypothetical (5% return before expenses) | |||||||||||||||||||||||||||||||||||
| Beginning Account Value April 30, 2014 | Ending Account Value October 31, 2014 | Expenses paid during the period April 30, 2014 through October 31, 2014 | Beginning Account Value April 30, 2014 | Ending Account Value October 31, 2014 | Expenses paid during the period April 30, 2014 through October 31, 2014 | Annualized expense ratio | Days in the current 1/2 year | Days in the full year | ||||||||||||||||||||||||||||
| Class A | $ | 1,000.00 | $ | 1,053.80 | $ | 6.02 | $ | 1,000.00 | $ | 1,019.34 | $ | 5.92 | 1.16 | % | 184 | 365 | ||||||||||||||||||||
| Class B | $ | 1,000.00 | $ | 1,049.60 | $ | 10.47 | $ | 1,000.00 | $ | 1,014.99 | $ | 10.30 | 2.03 | 184 | 365 | |||||||||||||||||||||
| Class C | $ | 1,000.00 | $ | 1,050.30 | $ | 9.58 | $ | 1,000.00 | $ | 1,015.86 | $ | 9.42 | 1.85 | 184 | 365 | |||||||||||||||||||||
| Class R3 | $ | 1,000.00 | $ | 1,052.50 | $ | 7.24 | $ | 1,000.00 | $ | 1,018.15 | $ | 7.12 | 1.40 | 184 | 365 | |||||||||||||||||||||
| Class R4 | $ | 1,000.00 | $ | 1,054.50 | $ | 5.70 | $ | 1,000.00 | $ | 1,019.66 | $ | 5.60 | 1.10 | 184 | 365 | |||||||||||||||||||||
| Class R5 | $ | 1,000.00 | $ | 1,055.50 | $ | 4.15 | $ | 1,000.00 | $ | 1,021.17 | $ | 4.08 | 0.80 | 184 | 365 | |||||||||||||||||||||
| Class Y | $ | 1,000.00 | $ | 1,056.30 | $ | 3.83 | $ | 1,000.00 | $ | 1,021.48 | $ | 3.77 | 0.74 | 184 | 365 | |||||||||||||||||||||
| 40 |
| The Hartford Balanced Fund |
| Approval of Investment Management and Investment Sub-Advisory Agreements (Unaudited) |
Section 15(c) of the Investment Company Act of 1940, as amended (the “1940 Act”), requires that each mutual fund’s board of directors, including a majority of those directors who are not “interested persons” of the mutual fund, as defined in the 1940 Act (the “Independent Directors”), annually review and consider the continuation of the mutual fund’s investment advisory and sub-advisory agreements. At its meeting held on August 5-6, 2014, the Board of Directors (the “Board”) of The Hartford Mutual Funds, Inc., including each of the Independent Directors, unanimously voted to approve the continuation of the investment management agreement for The Hartford Balanced Fund (the “Fund”) with Hartford Funds Management Company, LLC (“HFMC”) and the continuation of the investment sub-advisory agreement between HFMC and the Fund’s sub-adviser, Wellington Management Company, LLP (the “Sub-adviser,” and together with HFMC, the “Advisers”) (collectively, the “Agreements”).
In the months preceding the August 5-6, 2014 meeting, the Board requested, received and reviewed written responses from the Advisers to questions posed to them on behalf of the Independent Directors and supporting materials relating to those questions and responses. The Board considered information furnished to the Board at its meetings throughout the year, as well as information specifically prepared in connection with the annual approval of the Agreements at the Board’s meetings held on June 17-18, 2014 and August 5-6, 2014. Information provided to the Board at its meetings throughout the year included, among other things, reports on Fund performance, legal and compliance matters, sales and marketing activity, shareholder services, and the other services provided to the Fund by the Advisers and their affiliates. The Board also received in-person presentations by Fund officers and representatives of HFMC at the Board’s meetings on June 17-18, 2014 and August 5-6, 2014 concerning the Agreements.
The Independent Directors, advised by independent legal counsel, engaged service providers to assist them with evaluating the Agreements with respect to the Fund. Lipper Inc. (“Lipper”), an independent provider of investment company data, was retained to provide the Board with reports on how the Fund’s contractual management fees, actual management fees, other non-management fees, overall expense ratios and investment performance compared to those of mutual funds with similar investment objectives. The Independent Directors also engaged an independent financial services consultant (the “Consultant”) to assist them in evaluating the Fund’s management fees, sub-advisory fees, other non-management fees, overall expense ratios and investment performance. In addition, the Consultant reviewed the profitability calculations utilized by HFMC in connection with the continuation of the investment management agreement.
In determining whether to continue the Agreements for the Fund, the members of the Board reviewed and evaluated information and factors they believed to be relevant and appropriate in light of the information that the Board deemed necessary and appropriate through the exercise of its reasonable business judgment. While individual members of the Board may have weighed certain factors differently, the Board’s determination to continue the Agreements was based on a comprehensive consideration of all information provided to the Board throughout the year and specifically with respect to the continuation of the Agreements. A more detailed discussion of the factors the Board considered with respect to its approval of the Agreements is provided below.
Nature, Extent and Quality of Services Provided by the Advisers
The Board requested and considered information concerning the nature, extent and quality of the services provided to the Fund by the Advisers. The Board considered, among other things, the terms of the Agreements and the range of services provided by the Advisers. The Board considered the Advisers’ professional personnel who provide services to the Fund, including each Adviser’s ability and experience in attracting and retaining qualified personnel to service the Fund. The Board considered each Adviser’s reputation and overall financial strength, as well as its willingness to consider and implement organizational and operational changes designed to enhance services to the Hartford Funds. In addition, the Board considered the quality of each Adviser’s communications with the Board and responsiveness to Board inquiries and requests made from time to time with respect to the Fund and other Hartford Funds.
The Board also requested and evaluated information concerning each Adviser’s regulatory and compliance environment. In this regard, the Board requested and reviewed information on each Adviser’s compliance policies and procedures, compliance history, and a report from the Fund’s Chief Compliance Officer on each Adviser’s compliance with applicable laws and regulations, including responses to regulatory developments and compliance issues raised by regulators. The Board also noted the Advisers’ support of the Fund’s compliance control structure, particularly the resources devoted by the Advisers in support of the Fund’s obligations pursuant to Rule 38a-1 under the 1940 Act.
With respect to HFMC, the Board noted that, under the Agreements, HFMC is responsible for the management of the Fund, including oversight of fund operations and service providers, and provides administrative and investment advisory services in connection with selecting, monitoring and supervising the Sub-adviser. The Board considered HFMC’s ongoing monitoring of people, process and performance, including its quarterly reviews of each of the Hartford Funds, semi-annual meetings with the leaders of each Fund’s portfolio management team, and oversight of the Hartford Funds’ approximately 66 portfolio managers. The Board recognized that HFMC has demonstrated a record of making changes to the
| 41 |
| The Hartford Balanced Fund |
| Approval of Investment Management and Investment Sub-Advisory Agreements (Unaudited) – (continued) |
management and/or strategies of the Hartford Funds when warranted. The Board considered HFMC’s oversight of the Sub-adviser’s investment approach and results, process for monitoring best execution of portfolio trades by the Sub-adviser, and approach to risk management with respect to the Fund and the service providers to the Fund. The Board also considered HFMC’s oversight of compliance with the Fund’s objective and policies as well as with applicable laws and regulations, noting that regulatory and other developments had over time led to an increase in the scope of HFMC’s services in this regard.
In addition, the Board considered HFMC’s ongoing commitment to review and rationalize the Hartford Funds product line-up and the expenses that HFMC had incurred in connection with fund combinations in recent years. The Board considered that HFMC or its affiliates are responsible for providing the Fund’s officers.
With respect to the Sub-adviser, which provides certain day-to-day portfolio management services for the Fund, the Board considered the quality of the Fund’s portfolio managers, the Sub-adviser’s other investment personnel, its investment philosophy and process, investment research capabilities and resources, performance record, trade execution capabilities and experience. The Board considered the experience of the Fund’s portfolio managers, the number of accounts managed by the portfolio managers, and the Sub-adviser’s method for compensating the portfolio managers.
Based on these considerations, the Board concluded that it was satisfied with the nature, extent and quality of the services provided to the Fund by HFMC and the Sub-adviser.
Performance of the Fund and the Advisers
The Board considered the investment performance of the Fund. In this regard, the Board reviewed the performance of the Fund over different time periods presented in the materials and evaluated HFMC’s analysis of the Fund’s performance for these time periods. The Board considered information and materials provided to the Board by the Advisers concerning Fund performance, as well as information from Lipper comparing the investment performance of the Fund to an appropriate benchmark and universe of peer funds. The Board noted that the Fund’s performance was in the 3rd quintile of its performance universe for the 1- and 5-year periods and the 2nd quintile for the 3-year period. The Board also noted that the Fund’s performance was above its blended custom benchmark for the 1-year period, below its blended custom benchmark for the 3-year period and in line with its blended custom benchmark for the 5-year period.
The Board considered the detailed investment analytics reports provided by Hartford Funds’ Investment Advisory Group throughout the year. These reports include, among other things, information on the Fund’s gross and net returns, the Fund’s investment performance relative to an appropriate benchmark and peer group, various statistics concerning the Fund’s portfolio, and a narrative summary of various factors affecting Fund performance. The Board considered the Advisers’ cooperation with the Investment Committee, which assists the Board in evaluating the performance of the Fund at periodic meetings throughout the year. The Board also considered the analysis provided by the Consultant relating to the Fund’s performance track record.
In light of all the considerations noted above, the Board concluded that it had continued confidence in HFMC’s and the Sub-adviser’s overall capabilities to manage the Fund.
Costs of the Services and Profitability of the Advisers
The Board reviewed information regarding HFMC’s cost to provide investment management and related services to the Fund and HFMC’s profitability, both overall and for the Fund, on a pre-tax basis without regard to distribution expenses. The Board also requested and reviewed information about the profitability to HFMC and its affiliates from all services provided to the Fund and all aspects of their relationship with the Fund. The Board also requested and received information relating to the operations and profitability of the Sub-adviser.
The Board considered the Consultant’s review of the profitability calculations used by HFMC in connection with the continuation of the investment management agreement, noting the Consultant’s view that Hartford Funds’ process for calculating and reporting Fund profitability is reasonable. In this regard, the Board noted that the Consultant performed a full review of this process in light of the recent restructuring of the Hartford Funds business and reported that the approach to analyzing Fund profitability, including the use of common expense allocation methodologies, is reasonable, sound and well within common industry practice.
| 42 |
| The Hartford Balanced Fund |
| Approval of Investment Management and Investment Sub-Advisory Agreements (Unaudited) – (continued) |
Based on these considerations, the Board concluded that the profits anticipated to be realized by the Advisers and their affiliates from their relationships with the Fund would not be excessive.
Comparison of Fees and Services Provided by the Advisers
The Board considered comparative information with respect to the management fees to be paid by the Fund to HFMC and the total expense ratios of the Fund. The Board also considered comparative information with respect to the sub-advisory fees to be paid by HFMC to the Sub-adviser. In this regard, the Board requested and reviewed information from HFMC and the Sub-adviser relating to the management and sub-advisory fees, including the sub-advisory fee schedule for the Fund, and total operating expenses for the Fund. With respect to the sub-advisory fee schedule, the Board considered representations from HFMC and the Sub-adviser that the Sub-adviser’s fees were negotiated at arm’s length on a fund-by-fund basis. The Board also reviewed information from Lipper comparing the Fund’s contractual management fees, actual management fees and overall expense ratios relative to a group of funds selected by Lipper, in consultation with the Consultant, and a broader universe of funds selected by Lipper. The Board considered that the Fund’s contractual management fee and actual management fee were in the 2nd quintile of its expense group, while its total expenses (less 12b-1 and shareholder service fees) were in the 3rd quintile. The Board noted that the Fund has an automatically renewable contractual expense cap on certain share classes. The expense cap resulted in reimbursement of certain expenses incurred in 2013.
While the Board recognized that comparisons between the Fund and peer funds may be imprecise, given the different service levels and characteristics of mutual funds and the different business models and cost structures of the Advisers, the comparative information provided by Lipper assisted the Board in evaluating the reasonableness of the Fund’s management and sub-advisory fees and total operating expenses. In addition, the Board considered the analysis and recommendations of the Consultant relating to the Fund’s management and sub-advisory fees and total operating expenses.
Based on these considerations, the Board concluded that the Fund’s fees and total operating expenses, in conjunction with the information about quality of services, profitability, economies of scale, and other matters discussed, were reasonable in light of the services provided.
Economies of Scale
The Board requested and considered information regarding the Advisers’ realization of economies of scale with respect to the Fund and whether the fee levels reflect these economies of scale for the benefit of the Fund’s shareholders. The Board reviewed the breakpoints in the management fee schedule for the Fund, which reduce fee rates as Fund assets grow over time. The Board recognized that a fund with assets beyond the highest breakpoint level will continue to benefit from economies of scale because additional assets are charged the lowest breakpoint fee resulting in lower overall effective management fee rates. The Board also considered that expense limitations and fee waivers that reduce the Fund’s expenses at all asset levels can have the same effect as breakpoints in sharing economies of scale with shareholders and provide protection from an increase in expenses if Fund assets decline. The Board recognized that a fee schedule that reaches a lower breakpoint quickly provides shareholders with the benefit of anticipated or potential economies of scale. The Board also considered that HFMC has been active in managing expenses, which has resulted in benefits being realized by shareholders as assets within the Hartford Funds family of funds have grown over time, including through lower transfer agent costs and other operating expenses.
The Board reviewed and evaluated materials from Lipper and the Consultant showing how management fee schedules of peer funds reflect economies of scale for the benefit of shareholders as a peer fund’s assets hypothetically increase over time. Based on information provided by HFMC, Lipper, and the Consultant, the Board recognized that there is no uniform methodology for establishing breakpoints or uniform pattern in asset levels that trigger breakpoints or the amounts of breakpoints triggered.
After considering all of the information available to it, the Board concluded that it was satisfied with the extent to which economies of scale would be shared for the benefit of the Fund’s shareholders based on currently available information and the effective advisory fees and expense ratios for the Fund at its current and reasonably anticipated asset levels. The Board noted, however, that it would continue to monitor future growth in Fund assets and the appropriateness of additional breakpoints.
Other Benefits
The Board considered other benefits to the Advisers and their affiliates from their relationships with the Fund.
| 43 |
| The Hartford Balanced Fund |
| Approval of Investment Management and Investment Sub-Advisory Agreements (Unaudited) – (continued) |
The Board noted that HFMC receives fees for fund accounting and related services from the Fund, and the Board considered information on profits to HFMC for such services. The Board also considered that Hartford Administrative Services Company (“HASCO”), the Fund’s transfer agent and an affiliate of HFMC, receives transfer agency compensation from the Fund, and the Board reviewed information on the profitability of the Fund’s transfer agency function to HASCO. The Board considered information provided by HASCO indicating that the transfer agent fees charged by HASCO to the Fund were fair and reasonable based on publicly available information.
The Board also considered that Hartford Funds Distributors, LLC (“HFD”), an affiliate of HFMC, serves as principal underwriter of the Fund. As principal underwriter, HFD receives 12b-1 fees from the Fund and receives all or a portion of the sales charges on sales or redemptions of certain classes of shares. The Board also noted that certain affiliates of HFD distribute shares of the Fund and receive compensation in that connection.
The Board considered benefits to the Sub-adviser from its use of the Fund’s brokerage commissions to obtain soft dollar research, and representations from HFMC and the Sub-adviser that the Sub-adviser would not make any revenue-sharing payments or any other type of distribution payments to HFMC or its affiliates.
The Board considered the benefits to shareholders of being part of the Hartford Funds family of funds, including the right to exchange investments between the same class of funds without a sales charge, the ability to reinvest Fund dividends into other funds in the family, and the ability to combine holdings in the Fund with holdings in other funds to obtain a reduced sales charge. The Board considered HFMC’s efforts to provide investors in the family with a broad range of investment styles and asset classes and its entrepreneurial risk in initiating new funds to expand these opportunities for shareholders.
* * * *
Based upon its review of these various factors, among others, the Board concluded that it is in the best interests of the Fund and its shareholders for the Board to approve the Agreements for an additional year. In reaching this decision, the Board did not assign relative weights to the factors discussed above or deem any one or group of them to be controlling in and of themselves. In connection with their deliberations, the Independent Directors met separately in executive session on several occasions, with independent legal counsel and the Consultant, to review the relevant materials and consider their responsibilities under relevant laws and regulations.
| 44 |
| The Hartford Balanced Fund |
| Main Risks (Unaudited) |
The main risks of investing in the Fund are described below.
Market, Selection and Strategy Risk: The Fund’s share price may fluctuate due to market risk and/or security selections that may underperform the market or relevant benchmarks. If the sub-adviser's investment strategy does not perform as expected, the Fund could underperform its peers or lose money. There is no guarantee the Fund will achieve its stated objective.
Asset Allocation Strategy Risk: The portfolio managers' asset allocation strategy may not always work as intended, and asset allocation does not guarantee better performance or reduce the risk of investment loss.
Fixed Income Risk: The Fund is subject to interest rate risk (the risk that the value of an investment decreases when interest rates rise), credit risk (the risk that the issuing company of a security is unable to pay interest and principal when due) and call risk (the risk that an investment may be redeemed early).
Mortgage-Backed Securities Risk: Mortgage-backed securities are subject to interest rate risk, credit risk, prepayment risk, extension risk, and the risk that an investment’s value may be reduced or become worthless if it receives interest or income payments only after other investments in the same pool.
| 45 |
THIS PRIVACY POLICY IS NOT PART OF THIS REPORT
Privacy Policy and Practices of The Hartford Financial Services Group, Inc. and its Affiliates
(herein called “we, our and us”)
This Privacy Policy applies to our United States Operations
|
We value your trust. We are committed to the responsible: a) management; b) use; and c) protection; of Personal Information.
This notice describes how we collect, disclose, and protect Personal Information.
We collect Personal Information to: a) service your Transactions with us; and b) support our business functions.
We may obtain Personal Information from: a) You; b) your Transactions with us; and c) third parties such as a consumer-reporting agency.
Based on the type of product or service You apply for or get from us, Personal Information such as: a) your name; b) your address; c) your income; d) your payment; or e) your credit history; may be gathered from sources such as applications, Transactions, and consumer reports.
To serve You and service our business, we may share certain Personal Information. We will share Personal Information, only as allowed by law, with affiliates such as: a) our insurance companies; b) our employee agents; c) our brokerage firms; and d) our administrators.
As allowed by law, we may share Personal Financial Information with our affiliates to: a) market our products; or b) market our services; to You without providing You with an option to prevent these disclosures.
|
We may also share Personal Information, only as allowed by law, with unaffiliated third parties including: a) independent agents; b) brokerage firms; c) insurance companies; d) administrators; and e) service providers; who help us serve You and service our business.
When allowed by law, we may share certain Personal Financial Information with other unaffiliated third parties who assist us by performing services or functions such as: a) taking surveys; b) marketing our products or services; or c) offering financial products or services under a joint agreement between us and one or more financial institutions.
We, and third parties we partner with, may track some of the pages You visit through the use of: a) cookies; b) pixel tagging; or c) other technologies; and currently do not process or comply with any web browser’s “do not track” signal or similar mechanism that indicates a request to disable online tracking of individual users who visit our websites or use our services.
We will not sell or share your Personal Financial Information with anyone for purposes unrelated to our business functions without offering You the opportunity to: a) “opt-out;” or b) “opt-in;” as required by law.
We only disclose Personal Health Information with: a) your proper written authorization; or b) as otherwise allowed or required by law.
Our employees have access to Personal Information in the course of doing their jobs, such as: a) underwriting policies; b) paying claims; c) developing new products; or d) advising customers of our products and services.
|
|
We use manual and electronic security procedures to maintain: a) the confidentiality; and b) the integrity of; Personal Information that we have. We use these procedures to guard against unauthorized access.
Some techniques we use to protect Personal Information include: a) secured files; b) user authentication; c) encryption; d) firewall technology; and e) the use of detection software.
We are responsible for and must: a) identify information to be protected; b) provide an adequate level of protection for that data; c) grant access to protected data only to those people who must use it in the performance of their job-related duties.
Employees who violate our Privacy Policy will be subject to discipline, which may include ending their employment with us.
At the start of our business relationship, we will give You a copy of our current Privacy Policy.
We will also give You a copy of our current Privacy Policy once a year if You maintain a continuing business relationship with us.
We will continue to follow our Privacy Policy regarding Personal Information even when a business relationship no longer exists between us.
|
As used in this Privacy Notice:
Application means your request for our product or service.
Personal Financial Information means financial information such as: a) credit history; b) income; c) financial benefits; or d) policy or claim information.
Personal Health Information means health information such as: a) your medical records; or b) information about your illness, disability or injury.
Personal Information means information that identifies You personally and is not otherwise available to the public. It includes: a) Personal Financial Information; and b) Personal Health Information.
Transaction means your business dealings with us, such as: a) your Application; b) your request for us to pay a claim; and c) your request for us to take an action on your account.
You means an individual who has given us Personal Information in conjunction with: a) asking about; b) applying for; or c) obtaining; a financial product or service from us if the product or service is used mainly for personal, family, or household purposes.
|
This Privacy Policy is being provided on behalf of the following affiliates of The Hartford Financial Services Group, Inc.:
1stAGChoice, Inc.; Access CoverageCorp, Inc.; Access CoverageCorp Technologies, Inc.; American Maturity Life Insurance Company; Archway 60 R, LLC; Business Management Group, Inc.; Champlain Life Reinsurance Company; DMS R, LLC; Eloy R, LLC; Ersatz Corporation; First State Insurance Company; Hartford Accident and Indemnity Company; Hartford Administrative Services Company; Hartford Casualty General Agency, Inc.; Hartford Casualty Insurance Company; Hartford-Comprehensive Employee Benefit Service Company; Hartford Equity Sales Company, Inc.; Hartford Fire General Agency, Inc.; Hartford Fire Insurance Company; Hartford Funds Management Company, LLC; Hartford Funds Management Group, Inc.; Hartford HLS Series Fund II, Inc.; Hartford Insurance Company of Illinois; Hartford Insurance Company of the Midwest; Hartford Insurance Company of the Southeast; Hartford Integrated Technologies, Inc.; Hartford International Life Reassurance Corporation; Hartford Funds Distributors, LLC; Hartford Investment Management Company; Hartford Life and Accident Insurance Company; Hartford Life and Annuity Insurance Company; Hartford Life Insurance Company; Hartford Life Private Placement, LLC; Hartford Lloyd’s Corporation; Hartford Lloyd’s Insurance Company; Hartford Mezzanine Investors I, LLC; Hartford Residual Market, L.C.C.; Hartford Retirement Services, LLC; Hartford Securities Distribution Company, Inc.; Hartford Series Fund, Inc.; Hartford Specialty Insurance Services of Texas, LLC; Hartford Strategic Investments, LLC; Hartford Underwriters Insurance Company; Hartford Technology Services Company, L.L.C.; Hartford of Texas General Agency, Inc.; Hartford Underwriters General Agency, Inc.; HARTRE Company, L.C.C.; HL Investment Advisors, LLC; HLA LLC; Horizon Management Group, LLC; HRA Brokerage Services, Inc.; Lanidex Class B, LLC; M-CAP Insurance Agency, LLC; New England Insurance Company; New England Reinsurance Corporation; Nutmeg Insurance Agency, Inc.; Nutmeg Insurance Company; Pacific Insurance Company, Limited; Planco, LLC: Property and Casualty Insurance Company of Hartford; Revere R, LLC; RVR R, LLC; Sentinel Insurance Company, Ltd.; Sunstone R, LLC; Symphony R, LLC; The Evergreen Group Incorporated; The Hartford Alternative Strategies Fund; The Hartford Mutual Funds, Inc.; The Hartford Mutual Funds II, Inc.; Trumbull Flood Management, L.L.C.; Trumbull Insurance Company; Twin City Fire Insurance Company; White River Life Reinsurance Company.
HPP Revised January 2014
HARTFORDFUNDS
hartfordfunds.com
This information is written in connection with the promotion or marketing of the matter(s) addressed in this material.
This report is submitted for the general information of the shareholders of the Fund. It is not authorized for distribution unless preceded or accompanied by a current prospectus for the Fund.
The information cannot be used or relied upon for the purpose of avoiding IRS penalties. These materials are not intended to provide tax, accounting or legal advice. As with all matters of a tax or legal nature, you should consult your own tax or legal counsel for advice.
Investors should carefully consider the investment objectives, risks, charges, and expenses of Hartford Funds before investing. This and other information can be found in the prospectus and summary prospectus, which can be obtained by calling 888-843-7824 (retail) or 800-279-1541 (institutional). Investors should read them carefully before they invest.
Hartford Funds are underwritten and distributed by Hartford Funds Distributors, LLC.
MFAR-B14 12/14 113290-4 Printed in U.S.A.
HARTFORDFUNDS
|
THE HARTFORD
BALANCED INCOME FUND
2014 Annual Report |
A MESSAGE FROM THE PRESIDENT
Dear Fellow Shareholders:
Thank you for investing in Hartford Funds.
Market Review
U.S. equities (as represented by the S&P 500 Index) rose steadily for the fiscal year ended October 31, 2014, with a return of 17.27% for the period. With the exception of short-lived geopolitical scares early in 2014 and concerns about continuing global growth near the end of the period, stocks generally rose on solid fundamentals and encouraging macroeconomic data during the year.
September 2014 marked the six-year anniversary of the start of the financial crisis. Within weeks of that anniversary, both the S&P 500 Index and the Dow Jones Industrial Average set new all-time highs, closing at 2,018 and 17,391, respectively, on October 31. Although the fallout of the crisis continues to influence investor behavior, stocks have recovered and risen dramatically, up 198% from their low in March 2009. Meanwhile, the domestic economy is notching strong growth, and the unemployment rate has reached its lowest level since August 2008.
While the U.S. economy appears to have stabilized and to have reverted to a solid growth path, the outlook for the global economy appears to have gotten cloudier. The U.S. Federal Reserve has ended quantitative easing, while Europe and Japan are pursuing stimulus options to avoid a double-dip recession and deflation, respectively. Diverging central-bank policies will likely continue to play an important role in market movements going forward as investors wait to see the reactions to their efforts and their impacts on global markets.
How have market movements impacted your portfolio throughout the last year? Are your investments still on track to provide the growth or income you need, and are you comfortable with their progress during times of volatility?
Your financial professional can help you navigate today’s markets with confidence, as well as assist you to achieve your investment goals by providing advice on the best options within our fund family to help you work toward overcoming today’s investing challenges. Meet with your financial advisor regularly to examine your portfolio and your investment strategy, and to determine if you’re still on track to meet your goals.
Thank you again for investing with Hartford Funds.
James Davey
President
Hartford Funds
1 The S&P 500 Index is a market capitalization-weighted price index composed of 500 widely held common stocks.
2 The Dow Jones Industrial Average is an unmanaged, price-weighted index of 30 of the largest, most widely held stocks traded on the NYSE
The Hartford Balanced Income Fund
The views expressed in the Fund’s Manager Discussion under ‘‘Why did the Fund perform this way?’’ and ‘‘What is the outlook?’’ are views of the Fund’s sub-adviser and portfolio management team through the end of the period and are subject to change based on market and other conditions. The Fund’s Manager Discussion is for informational purposes only and does not represent an offer, recommendation or solicitation to buy, hold or sell any security. The specific securities identified and described, if any, do not represent all of the securities purchased or sold and you should not assume that investments in the securities identified and discussed will be profitable.
| The Hartford Balanced Income Fund inception 07/31/2006 |
| (sub-advised by Wellington Management Company, LLP) |
| Investment objective – The Fund seeks to provide current income with growth of capital as a secondary objective. |
Performance Overview 7/31/06 - 10/31/14
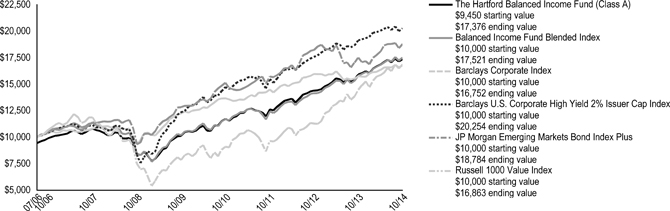
The chart above represents the hypothetical growth of a $10,000 investment in Class A, which includes a sales charge. Growth results in classes other than Class A will vary from what is seen above due to differences in the expenses charged to those share classes.
Average Annual Total Returns (as of 10/31/14)
| 1 Year | 5 Years | Since Inception▲ | ||||||||||
| Balanced Income A# | 9.19 | % | 11.39 | % | 7.66 | % | ||||||
| Balanced Income A## | 3.18 | % | 10.14 | % | 6.92 | % | ||||||
| Balanced Income B# | 9.25 | % | 10.95 | % | 7.08 | %* | ||||||
| Balanced Income B## | 4.25 | % | 10.69 | % | 7.08 | %* | ||||||
| Balanced Income C# | 8.39 | % | 10.56 | % | 6.86 | % | ||||||
| Balanced Income C## | 7.39 | % | 10.56 | % | 6.86 | % | ||||||
| Balanced Income I# | 9.47 | % | 11.65 | % | 7.81 | % | ||||||
| Balanced Income R3# | 8.90 | % | 11.17 | % | 7.68 | % | ||||||
| Balanced Income R4# | 9.19 | % | 11.46 | % | 7.85 | % | ||||||
| Balanced Income R5# | 9.44 | % | 11.71 | % | 7.99 | % | ||||||
| Balanced Income Y# | 9.55 | % | 11.87 | % | 8.09 | % | ||||||
| Balanced Income Fund Blended Index | 10.88 | % | 11.43 | % | 7.03 | % | ||||||
| Barclays Corporate Index | 6.29 | % | 6.48 | % | 6.45 | % | ||||||
| Barclays U.S. Corporate High Yield 2% Issuer Cap Index | 5.82 | % | 10.38 | % | 8.93 | % | ||||||
| JP Morgan Emerging Markets Bond Index Plus | 7.19 | % | 7.92 | % | 7.94 | % | ||||||
| Russell 1000 Value Index | 16.46 | % | 16.49 | % | 6.54 | % | ||||||
| ▲ | Inception: 07/31/2006 |
| # | Without sales charge |
| ## | With sales charge |
| * | Class B shares convert to Class A shares after 8 years. The return shown reflects the conversion to Class A shares, which had different operating expenses, for the period after conversion. |
PERFORMANCE DATA QUOTED REPRESENTS PAST PERFORMANCE AND DOES NOT GUARANTEE FUTURE RESULTS. The investment return and principal value of the investment will fluctuate so that investors’ shares, when redeemed, may be worth more or less than their original cost. Current performance may be lower or higher than the performance data quoted. To obtain performance data current to the most recent month-end, please visit our website www.hartfordfunds.com.
The initial investment in Class A shares reflects the maximum sales charge of 5.50% and returns for Class B shares reflect a contingent deferred sales charge of up to 5.00% and declining to zero, depending on the period of time the shares are held. Returns for Class C shares reflect a contingent deferred sales charge of up to 1.00% on shares redeemed within twelve months of purchase.
Total returns presented above were calculated using the Fund’s net asset value available to shareholders for sale or redemption of Fund shares on October 31, 2014, which may exclude investment transactions as of this date. All share class returns assume the reinvestment of all distributions at net asset value and the deduction of all fund expenses.
Effective 9/30/09, Class B shares of the Fund were closed to new investments.
Class I shares commenced operations on 2/26/10. Performance prior to that date is that of the Fund’s Class A shares (excluding sales charges), which had different operating expenses. Class R3, R4 and R5 shares commenced operations on 5/28/10. Performance prior to that date is that of the Fund’s Class Y shares, which had different operating expenses.
Balanced Income Fund Blended Index is calculated by Hartford Funds Management Company, LLC and represents the weighted return of 45% Russell 1000 Value Index, 44% Barclays Corporate Index, 5.5% JP Morgan Emerging Markets Bond Index Plus and 5.5% Barclays U.S. Corporate High-Yield Bond 2% Issuer Cap Index.
Barclays Corporate Index is an unmanaged index and is the Corporate component of the U.S. Credit Index within the Barclays U.S. Aggregate Bond Index.
Barclays U.S. Corporate High Yield Bond 2% Issuer Cap Index is the 2% issuer cap component of the Barclays U.S. High Yield Index, which is an unmanaged broad-based market-value-weighted index that tracks the total return performance of non-investment grade, fixed-rate, publicly placed, dollar denominated and nonconvertible debt registered with the Securities and Exchange Commission.
JP Morgan Emerging Markets Bond Index Plus (EMBI+) is JP Morgan's most liquid U.S. dollar emerging market debt benchmark, and tracks total returns for actively traded external debt instruments in emerging markets. Included in the EMBI+ are U.S. dollar-denominated Brady bonds, Eurobonds, and traded loans issued by sovereign entities.
Russell 1000 Value Index is an unmanaged index that measures the performance of those Russell 1000 Index companies with lower price-to-book ratios and lower forecasted growth values. The Russell 1000 Index is an unmanaged index that measures the performance of the 1,000 largest companies in the Russell 3000 Index, which measures the performance of the 3,000 largest U.S. companies, based on total market capitalizations.
You cannot invest directly in an index.
The chart and table do not reflect the deductions of taxes that a shareholder would pay on Fund distributions or the redemption of Fund shares.
Performance information may reflect historical or current expense waivers/reimbursements from the investment adviser, without which performance would have been lower. For information on current expense waivers/reimbursements, please see the prospectus.
| 2 |
| The Hartford Balanced Income Fund |
| Manager Discussion |
| October 31, 2014 (Unaudited) |
Operating Expenses*
| Net | Gross | |||||||
| Balanced Income Class A | 0.99 | % | 0.99 | % | ||||
| Balanced Income Class B | 1.74 | % | 1.85 | % | ||||
| Balanced Income Class C | 1.72 | % | 1.72 | % | ||||
| Balanced Income Class I | 0.73 | % | 0.73 | % | ||||
| Balanced Income Class R3 | 1.24 | % | 1.33 | % | ||||
| Balanced Income Class R4 | 0.94 | % | 1.03 | % | ||||
| Balanced Income Class R5 | 0.69 | % | 0.73 | % | ||||
| Balanced Income Class Y | 0.63 | % | 0.63 | % | ||||
| * | As shown in the Fund's prospectus dated March 1, 2014. Actual expenses may be higher or lower. Please see accompanying Financial Highlights for expense ratios for the year ended October 31, 2014. |
Gross expenses are the Fund's total annual operating expenses shown in the Fund's prospectus dated March 1, 2014. Net expenses are the Fund's total annual operating expenses shown in the Fund's prospectus dated March 1, 2014 and reflect contractual expense reimbursements in instances when these reductions reduce the Fund's gross expenses. Contractual reimbursements remain in effect until February 28, 2015, and automatically renew for one-year terms unless terminated.
The Fund filed an updated prospectus, dated November 7, 2014, with the U.S. Securities and Exchange Commission that became effective on that date. However, the information in this annual report is as of October 31, 2014 and does not reflect any changes made to the total annual fund operating expense table in the November 7, 2014 prospectus.
All investments are subject to risk including the possible loss of principal. For a discussion of the Fund’s risks, please see the Main Risks section of this report. For more detailed information on the risks associated with an investment in the Fund, please see the prospectus.
| Portfolio Managers | ||
| Lucius T. Hill, III | W. Michael Reckmeyer, III, CFA | Ian R. Link, CFA |
| Senior Vice President and Fixed Income Portfolio Manager | Senior Vice President and Equity Portfolio Manager | Director and Equity Portfolio Manager |
| Scott I. St. John, CFA | Karen H. Grimes, CFA | |
| Senior Vice President and Fixed Income Portfolio Manager | Senior Vice President and Equity Portfolio Manager |
How did the Fund perform?
The Class A shares of The Hartford Balanced Income Fund returned 9.19%, before sales charge, for the twelve-month period ended October 31, 2014, underperforming the Fund’s custom benchmark (45% Russell 1000 Value Index, 44% Barclays Corporate Index, 5.5% Barclays U.S. Corporate High Yield Bond 2% Issuer Cap Index, and 5.5% JP Morgan Emerging Markets Bond Index Plus) which returned 10.88% for the same period. However, the Fund outperformed the 6.93% average return of the Lipper Mixed-Asset Target Allocation Moderate Funds peer group, a group of funds that hold between 40-60% in equity securities and the remainder in bonds, cash, and cash equivalents. For the same period, the Barclays Corporate Index returned 6.29%, the Barclays U.S. Corporate High Yield Bond 2% Issuer Cap Index returned 5.82%, the JP Morgan Emerging Markets Bond Index Plus returned 7.19% and the Russell 1000 Value Index returned 16.46%.
Why did the Fund perform this way?
Global equities rose during the period, notwithstanding bouts of significant volatility. Despite ongoing geopolitical tensions in Ukraine and the Middle East, concerns about a Chinese economic growth slowdown, and unsettling economic and political developments in several other emerging market countries, the five-year-old bull market continued on in the first half of 2014. Robust merger and acquisition activity, along with continued accommodative monetary policy from central banks around the globe, aided positive investor sentiment in May and June. However, Portuguese banking woes, European economic malaise, and the prospect of an accelerated U.S. Federal Reserve (Fed) interest-rate-hike timeline all contributed to stall the global stock rally near the tail end of the period. In addition, China's property slump and poor Gross Domestic Product (GDP) readings in Japan and the eurozone raised the specter of a slowdown in global economic growth. Nevertheless, there were several positive developments, including monetary easing by the European Central Bank (ECB) and the People's Bank of China, as well as an encouraging U.S. corporate earnings season. Despite these positives, many market participants found ample reason to reassess their risk appetites (i.e., reduce risks), given the strong performance in recent years. During the period, emerging market equities underperformed their developed market counterparts and U.S. stocks generally outperformed non-U.S. stocks.
Fixed income markets gained throughout much of the period as expectations of prolonged easy monetary policy by major central banks and a supportive macroeconomic environment kept rates low and suppressed volatility. Early in the period emerging markets dominated headlines as economic and political developments sparked risk aversion across global markets, pushing bond prices higher and yields lower amid a flight to quality.
The period was also highlighted by a divergence in central bank policies. The ECB cut its benchmark lending and deposit rates and announced a host of stimulus measures in an effort to encourage lending and fend off fears of deflation. China’s central bank joined the ECB in boosting liquidity by injecting funds into the nation’s largest banks in an attempt to combat weakening growth. The Bank
| 3 |
| The Hartford Balanced Income Fund |
| Manager Discussion – (continued) |
| October 31, 2014 (Unaudited) |
of Japan pre-emptively announced incremental monetary easing to counter the risk of missing the country’s inflation and growth targets. In contrast, the Bank of England and the Fed leaned toward tighter policies. The Fed ended its quantitative easing program as U.S. data largely suggested the economy was on a sustainable growth path. Second quarter GDP rebounded after the first quarter’s steep contraction. The labor market strengthened as the unemployment rate dropped to a six-year low. Housing regained some lost ground after a weak start to the year, though the pace of home price appreciation started to slow after a strong 2013. Inflation pressures were muted overall, alleviating pressure on the Fed to raise rates. The U.S. Treasury curve flattened as markets contemplated bringing interest rates to normal levels; short-term yields rose while longer term rates declined. Most credit sectors posted positive absolute returns and outperformed government bonds as credit spreads tightened.
The Fund underperformed its custom benchmark due to weak security selection in the equity portion of the Fund; this more than offset strong relative results against the Barclays Corporate Index in the fixed income portion of the Fund and the benefit of being overweight equities during the period. Among the top detractors from relative returns in the equity portion of the Fund were Eaton Corp (Industrials), Mattel (Consumer Discretionary), and Schneider Electric (Industrials). Shares of Eaton Corp, a global diversified electric equipment manufacturer, fell during the period due to slower global growth, which led to lowered forward guidance by the company’s management team. Shares of Mattel, a worldwide leader in the design, manufacture, and marketing of toys and family products, fell due to slow sales growth. We believe the company is struggling to adapt to children moving away from traditional toys in favor of electronic products at a younger age. Shares of Schneider Electric, an electrical equipment manufacturer, declined during the period on disappointing earnings and low organic growth. Occidental Petroleum (Energy) and Plum Creek Timber (Financials) were also top detractors from absolute returns for the period.
Among the top contributors to relative returns in the equity portion of the Fund were Microsoft (Information Technology), Merck (Healthcare), and AstraZeneca (Healthcare). Shares of Microsoft, the world’s largest software company, rose during the period as their technology advantage has finally begun to improve. Shares of Merck, a U.S.-based global pharmaceutical company, rose during the period due to positive results for their new hepatitis C drug, along with continued expansion of their immuno-oncology drug testing and research scope. Shares of AstraZeneca, a UK-based multinational pharmaceutical company, outperformed after Pfizer attempted to renew negotiations on a possible merger. Although the merger did not come to fruition, AstraZeneca reported Q2 results in July that were well ahead of expectations though most of this upside was generated by more one-time items with the underlying performance in-line with our estimates/thesis. Wells Fargo (Financials) was also a top contributor to absolute returns for the period.
The fixed income component of the Fund outperformed the Barclays Corporate Index for the period due primarily to strong security selection within investment grade credit. Security selection within high yield credit and emerging market debt also contributed to relative outperformance compared to the Barclays Corporate Index. The Fund’s yield curve positioning detracted during the period due primarily to an underweight to the 20-year portion of the curve, as long-term rates came down during the period. Modest exposure to high yield index derivatives contributed slightly to relative performance during the period.
Asset allocation between equities and fixed income contributed positively to relative results during the period due to an underweight to fixed income and an overweight to equities in an environment where equities outperformed the broad fixed income markets.
Derivatives are not used in a significant manner in this Fund and did not have an impact on performance during the period.
What is the outlook?
We believe U.S. fundamentals remain supportive of moderate growth, but acknowledge some risks have increased since the start of the year including continued conflicts in the Middle East, potential terrorist threats, Ebola worries, tougher Russian sanctions, and the highly publicized cyber-security attacks. Based on bottom-up stock decisions in the equity portion of the Fund, we ended the period most overweight Consumer Staples, Healthcare, and Telecommunication Services. Our largest equity underweights at the end of the period were Financials, Consumer Discretionary, and Energy relative to the Russell 1000 Value Index. On the fixed income side we ended the period with a moderately positive risk posture, continuing to favor financial issuers within investment grade credit. At the end of the period we were overweight high yield and held an out-of-benchmark allocation to non-agency Mortgage-Backed Securities relative to the Barclays Corporate Index.
The equity and fixed income managers will continue to work collaboratively to make decisions regarding the Fund’s mix of equities and fixed income. At the end of the period, the Fund had a bias towards equities relative to its custom benchmark.
| 4 |
| The Hartford Balanced Income Fund |
| Manager Discussion – (continued) |
| October 31, 2014 (Unaudited) |
Credit Exposure
as of October 31, 2014
| Credit Rating * | Percentage of Net Assets | |||
| Aaa/ AAA | 0.2 | % | ||
| Aa/ AA | 1.7 | |||
| A | 10.2 | |||
| Baa/ BBB | 28.3 | |||
| Ba/ BB | 3.8 | |||
| B | 3.2 | |||
| Caa/ CCC or Lower | 2.9 | |||
| Not Rated | 0.5 | |||
| Non-Debt Securities and Other Short-Term Instruments | 49.0 | |||
| Other Assets and Liabilities | 0.2 | |||
| Total | 100.0 | % | ||
| * | Credit exposure is the long-term credit ratings for the Fund's holdings, as of the date noted, as provided by Standard and Poor's (S&P) or Moody's Investors Service (Moody's) and typically range from AAA/Aaa (highest) to C/D (lowest). Presentation of S&P and Moody's credit ratings in this report have been selected for informational purposes for shareholders, as well as the Fund's consideration of industry practice. If Moody's and S&P assign different ratings, the lower rating is used. Fixed income securities that are not rated by either agency are listed as "Not Rated." Ratings do not apply to the Fund itself or to the Fund's shares. Ratings may change. |
| Diversification by Security Type |
| as of October 31, 2014 |
| Category | Percentage of Net Assets | |||
| Equity Securities | ||||
| Common Stocks | 46.3 | % | ||
| Preferred Stocks | 0.1 | |||
| Total | 46.4 | % | ||
| Fixed Income Securities | ||||
| Asset & Commercial Mortgage Backed Securities | 1.7 | % | ||
| Corporate Bonds | 43.3 | |||
| Foreign Government Obligations | 5.2 | |||
| Municipal Bonds | 0.3 | |||
| Senior Floating Rate Interests | 0.2 | |||
| U.S. Government Securities | 0.1 | |||
| Total | 50.8 | % | ||
| Short-Term Investments | 2.6 | |||
| Other Assets and Liabilities | 0.2 | |||
| Total | 100.0 | % | ||
| 5 |
| The Hartford Balanced Income Fund |
| Schedule of Investments |
| October 31, 2014 |
| (000’s Omitted) |
| Shares or Principal Amount ╬ | Market Value ╪ | |||||||
| Common Stocks - 46.3% | ||||||||
| Banks - 5.1% | ||||||||
| 745 | BB&T Corp. | $ | 28,239 | |||||
| 591 | M&T Bank Corp. | 72,200 | ||||||
| 702 | National Bank of Canada | 32,831 | ||||||
| 702 | US Bancorp | 29,901 | ||||||
| 2,137 | Wells Fargo & Co. | 113,430 | ||||||
| 276,601 | ||||||||
| Capital Goods - 3.7% | ||||||||
| 168 | Caterpillar, Inc. | 17,057 | ||||||
| 949 | Eaton Corp. plc | 64,873 | ||||||
| 2,555 | General Electric Co. | 65,934 | ||||||
| 125 | Lockheed Martin Corp. | 23,880 | ||||||
| 403 | Schneider Electric S.A. | 31,771 | ||||||
| 203,515 | ||||||||
| Commercial and Professional Services - 0.4% | ||||||||
| 401 | Waste Management, Inc. | 19,626 | ||||||
| Consumer Services - 0.7% | ||||||||
| 394 | McDonald's Corp. | 36,973 | ||||||
| Diversified Financials - 2.8% | ||||||||
| 191 | BlackRock, Inc. | 64,992 | ||||||
| 1,451 | JP Morgan Chase & Co. | 87,751 | ||||||
| 152,743 | ||||||||
| Energy - 5.5% | ||||||||
| 734 | Chevron Corp. | 88,096 | ||||||
| 452 | ConocoPhillips Holding Co. | 32,591 | ||||||
| 532 | Enbridge, Inc. | 25,191 | ||||||
| 908 | Exxon Mobil Corp. | 87,785 | ||||||
| 326 | Occidental Petroleum Corp. | 28,973 | ||||||
| 754 | Royal Dutch Shell plc Class B | 27,872 | ||||||
| 217 | Suncor Energy, Inc. | 7,709 | ||||||
| 298,217 | ||||||||
| Food and Staples Retailing - 0.5% | ||||||||
| 730 | Sysco Corp. | 28,132 | ||||||
| Food, Beverage and Tobacco - 4.1% | ||||||||
| 379 | Altria Group, Inc. | 18,309 | ||||||
| 451 | British American Tobacco plc | 25,535 | ||||||
| 349 | Coca-Cola Co. | 14,604 | ||||||
| 203 | Diageo plc ADR | 23,924 | ||||||
| 1,170 | Kraft Foods Group, Inc. | 65,920 | ||||||
| 129 | PepsiCo, Inc. | 12,445 | ||||||
| 430 | Philip Morris International, Inc. | 38,314 | ||||||
| 698 | Unilever N.V. NY Shares ADR | 27,040 | ||||||
| 226,091 | ||||||||
| Health Care Equipment and Services - 0.3% | ||||||||
| 265 | Baxter International, Inc. | 18,589 | ||||||
| Household and Personal Products - 0.9% | ||||||||
| 168 | Kimberly-Clark Corp. | 19,208 | ||||||
| 342 | Procter & Gamble Co. | 29,861 | ||||||
| 49,069 | ||||||||
| Insurance - 1.8% | ||||||||
| 292 | ACE Ltd. | 31,914 | ||||||
| 699 | Marsh & McLennan Cos., Inc. | 37,984 | ||||||
| 540 | MetLife, Inc. | 29,273 | ||||||
| 99,171 | ||||||||
| Materials - 1.5% | ||||||||
| 679 | Dow Chemical Co. | 33,551 | ||||||
| 349 | E.I. DuPont de Nemours & Co. | 24,135 | ||||||
| 395 | Nucor Corp. | 21,380 | ||||||
| 79,066 | ||||||||
| Media - 0.7% | ||||||||
| 524 | Thomson Reuters Corp. | 19,509 | ||||||
| 993 | WPP plc | 19,391 | ||||||
| 38,900 | ||||||||
| Pharmaceuticals, Biotechnology and Life Sciences - 7.2% | ||||||||
| 400 | AstraZeneca plc ADR | 29,181 | ||||||
| 507 | Bristol-Myers Squibb Co. | 29,497 | ||||||
| 491 | Eli Lilly & Co. | 32,581 | ||||||
| 918 | Johnson & Johnson | 98,939 | ||||||
| 1,561 | Merck & Co., Inc. | 90,430 | ||||||
| 2,215 | Pfizer, Inc. | 66,349 | ||||||
| 159 | Roche Holding AG | 46,887 | ||||||
| 393,864 | ||||||||
| Semiconductors and Semiconductor Equipment - 2.6% | ||||||||
| 954 | Analog Devices, Inc. | 47,361 | ||||||
| 1,820 | Intel Corp. | 61,914 | ||||||
| 636 | Maxim Integrated Products, Inc. | 18,666 | ||||||
| 313 | Texas Instruments, Inc. | 15,539 | ||||||
| 143,480 | ||||||||
| Software and Services - 1.9% | ||||||||
| 2,237 | Microsoft Corp. | 105,011 | ||||||
| Technology Hardware and Equipment - 0.8% | ||||||||
| 1,740 | Cisco Systems, Inc. | 42,580 | ||||||
| Telecommunication Services - 2.2% | ||||||||
| 677 | BCE, Inc. | 30,073 | ||||||
| 1,773 | Verizon Communications, Inc. | 89,095 | ||||||
| 119,168 | ||||||||
| Transportation - 0.5% | ||||||||
| 258 | United Parcel Service, Inc. Class B | 27,081 | ||||||
| Utilities - 3.1% | ||||||||
| 383 | Duke Energy Corp. | 31,439 | ||||||
| 3,003 | National Grid plc | 44,565 | ||||||
| 633 | Northeast Utilities | 31,235 | ||||||
| 772 | UGI Corp. | 29,110 | ||||||
| 890 | Xcel Energy, Inc. | 29,804 | ||||||
| 166,153 | ||||||||
| Total Common Stocks | ||||||||
| ( Cost $2,072,906) | $ | 2,524,030 | ||||||
| Preferred Stocks - 0.1% | ||||||||
| Diversified Financials - 0.1% | ||||||||
| — | Citigroup Capital XIII | $ | 4 | |||||
| 9 | Discover Financial Services | 223 | ||||||
| 77 | GMAC Capital Trust I β | 2,068 | ||||||
| 2,295 | ||||||||
| Insurance - 0.0% | ||||||||
| 45 | Allstate (The) Corp. | 1,116 | ||||||
The accompanying notes are an integral part of these financial statements.
| 6 |
| The Hartford Balanced Income Fund |
| Schedule of Investments – (continued) |
| October 31, 2014 |
| (000’s Omitted) |
| Shares or Principal Amount ╬ | Market Value ╪ | |||||||
| Preferred Stocks - 0.1% - (continued) | ||||||||
| Telecommunication Services - 0.0% | ||||||||
| 17 | Intelsat S.A., 5.75% β | $ | 894 | |||||
| Total Preferred Stocks | ||||||||
| (Cost $4,341) | $ | 4,305 | ||||||
| Asset and Commercial Mortgage Backed Securities - 1.7% | ||||||||
| Finance and Insurance - 1.7% | ||||||||
| Adjustable Rate Mortgage Trust | ||||||||
| $ | 291 | 0.42%, 11/25/2035 Δ | $ | 268 | ||||
| American Home Mortgage Assets Trust | ||||||||
| 334 | 1.06%, 10/25/2046 Δ | 243 | ||||||
| Asset Backed Funding Certificates | ||||||||
| 295 | 0.37%, 01/25/2037 Δ | 185 | ||||||
| Banc of America Funding Corp. | ||||||||
| 1,933 | 0.39%, 02/20/2047 Δ | 1,664 | ||||||
| 1,063 | 0.46%, 05/20/2047 Δ | 867 | ||||||
| 1,124 | 5.77%, 05/25/2037 | 948 | ||||||
| 262 | 5.85%, 01/25/2037 | 212 | ||||||
| BCAP LLC Trust | ||||||||
| 537 | 0.32%, 01/25/2037 Δ | 404 | ||||||
| Bear Stearns Adjustable Rate Mortgage Trust | ||||||||
| 861 | 2.26%, 08/25/2035 Δ | 865 | ||||||
| 1,332 | 2.43%, 10/25/2035 Δ | 1,310 | ||||||
| 592 | 4.99%, 06/25/2047 Δ | 528 | ||||||
| Bear Stearns Alt-A Trust | ||||||||
| 2,470 | 0.47%, 08/25/2036 Δ | 1,868 | ||||||
| 377 | 0.53%, 05/25/2036 Δ | 276 | ||||||
| 1,573 | 0.63%, 02/25/2036 Δ | 1,299 | ||||||
| Bear Stearns Commercial Mortgage Securities, Inc. | ||||||||
| 455 | 5.20%, 12/11/2038 | 487 | ||||||
| 525 | 5.54%, 09/11/2041 - 10/12/2041 | 559 | ||||||
| Capital One Multi-Asset Execution Trust | ||||||||
| 8,430 | 0.20%, 11/15/2019 ‡Δ | 8,387 | ||||||
| Chase Mortgage Finance Corp. | ||||||||
| 585 | 5.50%, 11/25/2035 | 578 | ||||||
| CHL Mortgage Pass-Through Trust | ||||||||
| 2,499 | 0.49%, 03/25/2035 Δ | 2,152 | ||||||
| 3,441 | 2.42%, 06/20/2035 Δ | 3,303 | ||||||
| 743 | 2.66%, 04/25/2037 Δ | 677 | ||||||
| Citigroup Mortgage Loan Trust, Inc. | ||||||||
| 676 | 2.44%, 07/25/2036 Δ | 444 | ||||||
| Commercial Mortgage Pass-Through Certificates | ||||||||
| 815 | 4.40%, 07/10/2045 ■Δ | 760 | ||||||
| 1,100 | 4.73%, 10/15/2045 ■Δ | 1,086 | ||||||
| 1,130 | 4.93%, 11/15/2045 ■Δ | 1,122 | ||||||
| 93 | 5.95%, 06/10/2046 Δ | 99 | ||||||
| Community or Commercial Mortgage Trust | ||||||||
| 380 | 4.48%, 12/10/2045 ■Δ | 374 | ||||||
| Countrywide Alternative Loan Trust | ||||||||
| 506 | 0.42%, 01/25/2036 Δ | 450 | ||||||
| 291 | 0.47%, 11/25/2035 Δ | 235 | ||||||
| 4,101 | 0.60%, 04/25/2037 Δ | 2,746 | ||||||
| 859 | 0.65%, 12/25/2035 Δ | 619 | ||||||
| 1,256 | 5.75%, 05/25/2036 | 1,069 | ||||||
| 763 | 6.00%, 12/25/2036 | 602 | ||||||
| 1,380 | 6.50%, 08/25/2037 | 998 | ||||||
| Countrywide Home Loans, Inc. | ||||||||
| 764 | 2.58%, 09/25/2047 Δ | 680 | ||||||
| 330 | 2.73%, 04/20/2036 Δ | 231 | ||||||
| 3,849 | 4.87%, 11/20/2035 Δ | 3,452 | ||||||
| 1,328 | 5.75%, 08/25/2037 | 1,271 | ||||||
| CS First Boston Mortgage Securities Corp. | ||||||||
| 618 | 5.50%, 06/25/2035 | 590 | ||||||
| Deutsche Alt-A Securities, Inc. Mortgage | ||||||||
| 657 | 0.30%, 03/25/2037 Δ | 449 | ||||||
| First Franklin Mortgage Loan Trust | ||||||||
| 1,602 | 0.39%, 04/25/2036 Δ | 1,036 | ||||||
| First Horizon Alternative Mortgage Securities | ||||||||
| 735 | 2.21%, 04/25/2036 Δ | 614 | ||||||
| 2,032 | 2.24%, 09/25/2035 Δ | 1,775 | ||||||
| GMAC Mortgage Corp. Loan Trust | ||||||||
| 301 | 2.95%, 04/19/2036 Δ | 265 | ||||||
| GS Mortgage Securities Trust | ||||||||
| 855 | 5.02%, 11/10/2045 ■Δ | 839 | ||||||
| 1,000 | 5.03%, 04/10/2047 ■Δ | 943 | ||||||
| GSAA Home Equity Trust | ||||||||
| 2,232 | 0.23%, 02/25/2037 Δ | 1,215 | ||||||
| 1,340 | 0.24%, 12/25/2036 Δ | 667 | ||||||
| 1,061 | 0.25%, 03/25/2037 Δ | 550 | ||||||
| 857 | 0.38%, 04/25/2047 Δ | 550 | ||||||
| 1,227 | 0.47%, 04/25/2047 Δ | 791 | ||||||
| 1,555 | 5.98%, 06/25/2036 | 914 | ||||||
| GSR Mortgage Loan Trust | ||||||||
| 311 | 0.65%, 11/25/2035 Δ | 230 | ||||||
| 2,313 | 2.74%, 01/25/2036 Δ | 2,141 | ||||||
| Harborview Mortgage Loan Trust | ||||||||
| 420 | 0.35%, 01/19/2038 Δ | 354 | ||||||
| 651 | 0.38%, 05/19/2047 Δ | 255 | ||||||
| 2,624 | 0.40%, 12/19/2036 Δ | 1,857 | ||||||
| 495 | 0.49%, 09/19/2035 Δ | 382 | ||||||
| 549 | 0.51%, 01/19/2035 Δ | 384 | ||||||
| Home Equity Loan Trust | ||||||||
| 2,100 | 0.31%, 04/25/2037 Δ | 1,446 | ||||||
| IndyMac Index Mortgage Loan Trust | ||||||||
| 398 | 0.35%, 10/25/2036 Δ | 341 | ||||||
| 444 | 0.39%, 07/25/2035 Δ | 395 | ||||||
| 682 | 0.43%, 07/25/2035 Δ | 582 | ||||||
| 236 | 0.44%, 01/25/2036 Δ | 163 | ||||||
| 797 | 0.55%, 07/25/2046 Δ | 391 | ||||||
| 348 | 2.46%, 01/25/2036 Δ | 324 | ||||||
| 507 | 2.47%, 08/25/2035 Δ | 407 | ||||||
| 550 | 2.55%, 09/25/2036 Δ | 464 | ||||||
| 1,043 | 2.60%, 12/25/2036 Δ | 912 | ||||||
| 653 | 4.54%, 02/25/2036 Δ | 561 | ||||||
| JP Morgan Chase Commercial Mortgage Securities Corp. | ||||||||
| 1,000 | 4.00%, 08/15/2046 ■ | 865 | ||||||
| 1,248 | 4.82%, 10/15/2045 ■Δ | 1,238 | ||||||
| 264 | 5.47%, 04/15/2043 Δ | 275 | ||||||
| 850 | 5.50%, 08/15/2046 ■Δ | 897 | ||||||
| JP Morgan Mortgage Trust | ||||||||
| 349 | 2.55%, 04/25/2037 Δ | 313 | ||||||
| 1,326 | 2.71%, 05/25/2036 Δ | 1,196 | ||||||
| Lehman XS Trust | ||||||||
| 356 | 0.36%, 07/25/2046 Δ | 282 | ||||||
| 1,423 | 0.39%, 06/25/2047 Δ | 956 | ||||||
| 1,117 | 0.41%, 11/25/2035 Δ | 788 | ||||||
| 482 | 1.00%, 09/25/2047 Δ | 394 | ||||||
The accompanying notes are an integral part of these financial statements.
| 7 |
| The Hartford Balanced Income Fund |
| Schedule of Investments – (continued) |
| October 31, 2014 |
| (000’s Omitted) |
| Shares or Principal Amount ╬ | Market Value ╪ | |||||||
| Asset and Commercial Mortgage Backed Securities - 1.7% - (continued) | ||||||||
| Finance and Insurance - 1.7% - (continued) | ||||||||
| Luminent Mortgage Trust | ||||||||
| $ | 171 | 0.35%, 02/25/2046 Δ | $ | 126 | ||||
| Merrill Lynch Mortgage Investors Trust | ||||||||
| 402 | 2.52%, 07/25/2035 Δ | 334 | ||||||
| Merrill Lynch Mortgage Trust | ||||||||
| 100 | 5.05%, 07/12/2038 | 102 | ||||||
| Morgan Stanley ABS Capital I | ||||||||
| 2,762 | 0.30%, 06/25/2036 Δ | 2,025 | ||||||
| Morgan Stanley BAML Trust | ||||||||
| 960 | 4.50%, 08/15/2045 ■ | 732 | ||||||
| Morgan Stanley Capital I | ||||||||
| 73 | 5.23%, 09/15/2042 | 75 | ||||||
| Morgan Stanley Mortgage Loan Trust | ||||||||
| 3,379 | 0.32%, 05/25/2036 - 11/25/2036 Δ | 1,701 | ||||||
| 752 | 2.59%, 05/25/2036 Δ | 546 | ||||||
| RBSGC Mortage Pass Through Certificates | ||||||||
| 1,175 | 6.25%, 01/25/2037 | 1,102 | ||||||
| Residential Accredit Loans, Inc. | ||||||||
| 1,174 | 0.92%, 09/25/2046 Δ | 788 | ||||||
| 1,309 | 1.41%, 11/25/2037 Δ | 833 | ||||||
| Residential Asset Securitization Trust | ||||||||
| 479 | 0.60%, 03/25/2035 Δ | 370 | ||||||
| 1,625 | 6.25%, 11/25/2036 | 1,220 | ||||||
| Residential Funding Mortgage Securities, Inc. | ||||||||
| 393 | 3.05%, 04/25/2037 Δ | 343 | ||||||
| 1,317 | 6.00%, 07/25/2037 | 1,194 | ||||||
| Securitized Asset Backed Receivables LLC | ||||||||
| 1,037 | 0.24%, 07/25/2036 Δ | 499 | ||||||
| Sequoia Mortgage Trust | ||||||||
| 820 | 0.43%, 01/20/2035 Δ | 784 | ||||||
| 349 | 2.52%, 07/20/2037 Δ | 285 | ||||||
| Springleaf Funding Trust | ||||||||
| 525 | 2.41%, 12/15/2022 ■ | 526 | ||||||
| Springleaf Mortgage Loan Trust | ||||||||
| 225 | 2.31%, 06/25/2058 ■ | 220 | ||||||
| Structured Adjustable Rate Mortgage Loan Trust | ||||||||
| 1,241 | 0.34%, 07/25/2037 Δ | 911 | ||||||
| 796 | 0.45%, 09/25/2034 Δ | 707 | ||||||
| Structured Asset Mortgage Investments, Inc. | ||||||||
| 1,283 | 0.38%, 02/25/2036 Δ | 1,046 | ||||||
| 398 | 0.43%, 02/25/2036 Δ | 319 | ||||||
| UBS-Barclays Commercial Mortgage Trust | ||||||||
| 605 | 4.23%, 03/10/2046 ■Δ | 504 | ||||||
| WaMu Mortgage Pass-Through Certificates | ||||||||
| 1,910 | 1.10%, 07/25/2046 Δ | 1,625 | ||||||
| Washington Mutual, Inc. | ||||||||
| 540 | 0.94%, 12/25/2046 Δ | 443 | ||||||
| Wells Fargo Commercial Mortgage Trust | ||||||||
| 360 | 4.94%, 10/15/2045 ■Δ | 359 | ||||||
| Wells Fargo Mortgage Backed Securities Trust | ||||||||
| 274 | 5.21%, 10/25/2035 Δ | 271 | ||||||
| Westlake Automobile Receivables Trust | ||||||||
| 335 | 0.97%, 10/16/2017 ■ | 335 | ||||||
| WF-RBS Commercial Mortgage Trust | ||||||||
| 441 | 5.00%, 04/15/2045 ■ | 337 | ||||||
| 93,971 | ||||||||
| Total Asset and Commercial Mortgage Backed Securities | ||||||||
| (Cost $91,445) | $ | 93,971 | ||||||
| Corporate Bonds - 43.3% | ||||||||
| Accommodation and Food Services - 0.1% | ||||||||
| Sysco Corp. | ||||||||
| $ | 2,425 | 2.35%, 10/02/2019 | $ | 2,440 | ||||
| 2,160 | 4.50%, 10/02/2044 | 2,213 | ||||||
| Wynn Las Vegas LLC | ||||||||
| 130 | 5.38%, 03/15/2022 | 137 | ||||||
| 250 | 7.75%, 08/15/2020 | 269 | ||||||
| 260 | 7.88%, 05/01/2020 | 276 | ||||||
| 5,335 | ||||||||
| Administrative, Support, Waste Management and Remediation Services - 0.6% | ||||||||
| Casella Waste Systems, Inc. | ||||||||
| 635 | 7.75%, 02/15/2019 | 648 | ||||||
| Clean Harbors, Inc. | ||||||||
| 120 | 5.13%, 06/01/2021 | 122 | ||||||
| 150 | 5.25%, 08/01/2020 | 154 | ||||||
| Equinix, Inc. | ||||||||
| 45 | 4.88%, 04/01/2020 | 46 | ||||||
| 200 | 5.38%, 04/01/2023 | 206 | ||||||
| 570 | 7.00%, 07/15/2021 | 621 | ||||||
| Iron Mountain, Inc. | ||||||||
| 785 | 7.75%, 10/01/2019 | 844 | ||||||
| 525 | 8.38%, 08/15/2021 | 546 | ||||||
| Republic Services, Inc. | ||||||||
| 6,550 | 3.55%, 06/01/2022 | 6,716 | ||||||
| 9,221 | 5.00%, 03/01/2020 | 10,275 | ||||||
| ServiceMaster (The) Co. | ||||||||
| 2,403 | 7.00%, 08/15/2020 | 2,541 | ||||||
| Waste Management, Inc. | ||||||||
| 11,390 | 3.50%, 05/15/2024 | 11,462 | ||||||
| 300 | 7.38%, 05/15/2029 | 402 | ||||||
| 34,583 | ||||||||
| Agriculture, Forestry, Fishing and Hunting - 0.0% | ||||||||
| Weyerhaeuser Co. | ||||||||
| 175 | 7.38%, 10/01/2019 | 212 | ||||||
| Air Transportation - 0.0% | ||||||||
| Continental Airlines, Inc. | ||||||||
| 9 | 6.90%, 04/19/2022 | 10 | ||||||
| Arts, Entertainment and Recreation - 2.3% | ||||||||
| 21st Century Fox America | ||||||||
| 4,810 | 4.75%, 09/15/2044 ■ | 4,972 | ||||||
| AMC Entertainment, Inc. | ||||||||
| 1,840 | 9.75%, 12/01/2020 | 2,042 | ||||||
| British Sky Broadcasting Group plc | ||||||||
| 4,130 | 2.63%, 09/16/2019 ■ | 4,141 | ||||||
| BSKYB Finance UK plc | ||||||||
| 350 | 6.50%, 10/15/2035 ■ | 425 | ||||||
| CBS Corp. | ||||||||
| 7,065 | 4.90%, 08/15/2044 | 7,053 | ||||||
The accompanying notes are an integral part of these financial statements.
| 8 |
| The Hartford Balanced Income Fund |
| Schedule of Investments – (continued) |
| October 31, 2014 |
| (000’s Omitted) |
| Shares or Principal Amount ╬ | Market Value ╪ | |||||||
| Corporate Bonds - 43.3% - (continued) | ||||||||
| Arts, Entertainment and Recreation - 2.3% - (continued) | ||||||||
| CCO Holdings LLC | ||||||||
| $ | 90 | 5.13%, 02/15/2023 | $ | 90 | ||||
| 275 | 5.25%, 09/30/2022 | 277 | ||||||
| 395 | 5.75%, 09/01/2023 | 404 | ||||||
| 45 | 6.50%, 04/30/2021 | 48 | ||||||
| 500 | 6.63%, 01/31/2022 | 531 | ||||||
| 309 | 7.25%, 10/30/2017 | 322 | ||||||
| 575 | 7.38%, 06/01/2020 | 616 | ||||||
| 215 | 8.13%, 04/30/2020 | 228 | ||||||
| Cequel Communications Holdings I LLC | ||||||||
| 1,625 | 5.13%, 12/15/2021 ■ | 1,586 | ||||||
| Comcast Corp. | ||||||||
| 4,975 | 4.25%, 01/15/2033 | 5,073 | ||||||
| 2,725 | 4.75%, 03/01/2044 | 2,928 | ||||||
| 975 | 5.65%, 06/15/2035 | 1,169 | ||||||
| 4,825 | 5.70%, 05/15/2018 - 07/01/2019 | 5,523 | ||||||
| 1,250 | 6.40%, 05/15/2038 | 1,603 | ||||||
| 1,980 | 6.45%, 03/15/2037 | 2,547 | ||||||
| 4,200 | 6.95%, 08/15/2037 | 5,700 | ||||||
| 510 | 7.05%, 03/15/2033 | 696 | ||||||
| DirecTV Holdings LLC | ||||||||
| 2,300 | 2.40%, 03/15/2017 | 2,356 | ||||||
| 3,500 | 3.13%, 02/15/2016 | 3,596 | ||||||
| 400 | 6.38%, 03/01/2041 | 468 | ||||||
| Emdeon, Inc. | ||||||||
| 1,621 | 11.00%, 12/31/2019 | 1,797 | ||||||
| Gannett Co., Inc. | ||||||||
| 1,425 | 4.88%, 09/15/2021 ■ | 1,436 | ||||||
| 1,880 | 5.13%, 10/15/2019 | 1,955 | ||||||
| 235 | 5.50%, 09/15/2024 ■ | 243 | ||||||
| 700 | 6.38%, 10/15/2023 | 752 | ||||||
| GLP Capital L.P./Financing II, Inc. | ||||||||
| 200 | 4.88%, 11/01/2020 | 208 | ||||||
| Gray Television, Inc. | ||||||||
| 1,515 | 7.50%, 10/01/2020 | 1,585 | ||||||
| NBC Universal Enterprise | ||||||||
| 600 | 5.25%, 12/19/2049 ■ | 625 | ||||||
| NBC Universal Media LLC | ||||||||
| 1,350 | 5.95%, 04/01/2041 | 1,664 | ||||||
| NCR Corp. | ||||||||
| 430 | 4.63%, 02/15/2021 | 428 | ||||||
| News America, Inc. | ||||||||
| 4,925 | 3.00%, 09/15/2022 | 4,844 | ||||||
| 850 | 6.15%, 02/15/2041 | 1,047 | ||||||
| 2,450 | 6.90%, 03/01/2019 | 2,913 | ||||||
| Sirius XM Radio, Inc. | ||||||||
| 120 | 4.25%, 05/15/2020 ■ | 119 | ||||||
| 335 | 4.63%, 05/15/2023 ■ | 323 | ||||||
| 985 | 5.25%, 08/15/2022 ■ | 1,037 | ||||||
| Time Warner Cable, Inc. | ||||||||
| 2,700 | 4.00%, 09/01/2021 | 2,859 | ||||||
| 1,775 | 5.00%, 02/01/2020 | 1,987 | ||||||
| 4,425 | 5.88%, 11/15/2040 | 5,208 | ||||||
| 14,930 | 6.75%, 07/01/2018 - 06/15/2039 | 17,386 | ||||||
| Time Warner Entertainment Co., L.P. | ||||||||
| 95 | 8.38%, 03/15/2023 | 128 | ||||||
| Time Warner, Inc. | ||||||||
| 5,170 | 2.10%, 06/01/2019 | 5,095 | ||||||
| 600 | 4.00%, 01/15/2022 | 630 | ||||||
| 2,275 | 4.88%, 03/15/2020 | 2,507 | ||||||
| 7,145 | 5.35%, 12/15/2043 | 7,852 | ||||||
| 1,985 | 6.10%, 07/15/2040 | 2,350 | ||||||
| 1,010 | 7.63%, 04/15/2031 | 1,380 | ||||||
| Viacom, Inc. | ||||||||
| 1,404 | 4.38%, 03/15/2043 | 1,293 | ||||||
| 835 | 4.50%, 03/01/2021 - 02/27/2042 | 859 | ||||||
| 124,904 | ||||||||
| Beverage and Tobacco Product Manufacturing - 0.5% | ||||||||
| Altria Group, Inc. | ||||||||
| 3,800 | 2.85%, 08/09/2022 | 3,682 | ||||||
| 60 | 10.20%, 02/06/2039 | 103 | ||||||
| Anheuser-Busch InBev Worldwide, Inc. | ||||||||
| 2,000 | 4.63%, 02/01/2044 | 2,080 | ||||||
| 3,240 | 5.38%, 01/15/2020 | 3,679 | ||||||
| 500 | 8.20%, 01/15/2039 | 761 | ||||||
| Constellation Brands, Inc. | ||||||||
| 190 | 4.25%, 05/01/2023 | 191 | ||||||
| 585 | 6.00%, 05/01/2022 | 654 | ||||||
| Imperial Tobacco Finance plc | ||||||||
| 5,525 | 2.05%, 02/11/2018 ■ | 5,520 | ||||||
| Japan Tobacco, Inc. | ||||||||
| 1,335 | 2.10%, 07/23/2018 ■ | 1,353 | ||||||
| Molson Coors Brewing Co. | ||||||||
| 3,810 | 5.00%, 05/01/2042 | 3,955 | ||||||
| Philip Morris International, Inc. | ||||||||
| 3,085 | 3.60%, 11/15/2023 | 3,176 | ||||||
| Reynolds American, Inc. | ||||||||
| 1,345 | 3.25%, 11/01/2022 | 1,314 | ||||||
| 2,885 | 6.15%, 09/15/2043 | 3,364 | ||||||
| 29,832 | ||||||||
| Chemical Manufacturing - 0.4% | ||||||||
| Agrium, Inc. | ||||||||
| 1,650 | 3.15%, 10/01/2022 | 1,613 | ||||||
| CF Industries Holdings, Inc. | ||||||||
| 1,235 | 3.45%, 06/01/2023 | 1,219 | ||||||
| 3,000 | 5.15%, 03/15/2034 | 3,194 | ||||||
| 3,885 | 5.38%, 03/15/2044 | 4,132 | ||||||
| Hexion Specialty Chemicals | ||||||||
| 245 | 8.88%, 02/01/2018 | 242 | ||||||
| Hexion U.S. Finance Corp. | ||||||||
| 725 | 6.63%, 04/15/2020 | 725 | ||||||
| Ineos Group Holdings plc | ||||||||
| 1,125 | 5.88%, 02/15/2019 ■ | 1,123 | ||||||
| 3,650 | 6.13%, 08/15/2018 ■ | 3,682 | ||||||
| Monsanto Co. | ||||||||
| 145 | 2.75%, 07/15/2021 | 144 | ||||||
| 3,720 | 3.38%, 07/15/2024 | 3,736 | ||||||
| 19,810 | ||||||||
| Computer and Electronic Product Manufacturing - 1.0% | ||||||||
| Alcatel-Lucent USA, Inc. | ||||||||
| 1,550 | 6.75%, 11/15/2020 ■ | 1,596 | ||||||
| Apple, Inc. | ||||||||
| 10,925 | 2.85%, 05/06/2021 ‡ | 11,089 | ||||||
| 1,500 | 4.45%, 05/06/2044 | 1,570 | ||||||
| CDW Escrow Corp. | ||||||||
| 1,963 | 8.50%, 04/01/2019 | 2,081 | ||||||
The accompanying notes are an integral part of these financial statements.
| 9 |
| The Hartford Balanced Income Fund |
| Schedule of Investments – (continued) |
| October 31, 2014 |
| (000’s Omitted) |
| Shares or Principal Amount ╬ | Market Value ╪ | |||||||
| Corporate Bonds - 43.3% - (continued) | ||||||||
| Computer and Electronic Product Manufacturing - 1.0% - (continued) | ||||||||
| CDW LLC / CDW Finance Corp. | ||||||||
| $ | 2,740 | 6.00%, 08/15/2022 | $ | 2,891 | ||||
| Cisco Systems, Inc. | ||||||||
| 4,395 | 2.13%, 03/01/2019 | 4,412 | ||||||
| EMC Corp. | ||||||||
| 7,280 | 1.88%, 06/01/2018 | 7,237 | ||||||
| Freescale Semiconductor, Inc. | ||||||||
| 2,730 | 6.00%, 01/15/2022 ■ | 2,798 | ||||||
| 72 | 8.05%, 02/01/2020 | 76 | ||||||
| 44 | 10.75%, 08/01/2020 | 48 | ||||||
| Hewlett-Packard Co. | ||||||||
| 320 | 1.17%, 01/14/2019 Δ | 319 | ||||||
| 5,400 | 2.75%, 01/14/2019 | 5,431 | ||||||
| 1,000 | 4.05%, 09/15/2022 | 1,025 | ||||||
| 635 | 4.30%, 06/01/2021 | 666 | ||||||
| 1,475 | 4.65%, 12/09/2021 | 1,583 | ||||||
| Lucent Technologies, Inc. | ||||||||
| 2,055 | 6.45%, 03/15/2029 | 1,978 | ||||||
| 315 | 6.50%, 01/15/2028 | 303 | ||||||
| Raytheon Co. | ||||||||
| 2,600 | 4.70%, 12/15/2041 | 2,876 | ||||||
| 1,250 | 4.88%, 10/15/2040 | 1,408 | ||||||
| Semiconductor Manufacturing International | ||||||||
| 225 | 4.13%, 10/07/2019 ■ | 226 | ||||||
| Thermo Fisher Scientific, Inc. | ||||||||
| 2,895 | 1.30%, 02/01/2017 | 2,892 | ||||||
| YMobile Corp. | ||||||||
| 75 | 8.25%, 04/01/2018 ■ | 79 | ||||||
| 52,584 | ||||||||
| Construction - 0.3% | ||||||||
| Aguila 3 S.A. | ||||||||
| 165 | 7.88%, 01/31/2018 ■ | 166 | ||||||
| K Hovnanian Enterprises, Inc. | ||||||||
| 785 | 7.00%, 01/15/2019 ■ | 766 | ||||||
| 900 | 8.00%, 11/01/2019 ■ | 900 | ||||||
| 1,110 | 9.13%, 11/15/2020 ■ | 1,204 | ||||||
| KB Home | ||||||||
| 340 | 4.75%, 05/15/2019 | 338 | ||||||
| 1,050 | 7.00%, 12/15/2021 | 1,124 | ||||||
| 520 | 7.50%, 09/15/2022 | 560 | ||||||
| 1,586 | 8.00%, 03/15/2020 | 1,768 | ||||||
| Lennar Corp. | ||||||||
| 1,480 | 4.75%, 12/15/2017 - 11/15/2022 | 1,519 | ||||||
| 95 | 5.60%, 05/31/2015 | 97 | ||||||
| M/I Homes, Inc. | ||||||||
| 180 | 3.00%, 03/01/2018 β | 182 | ||||||
| MPH Acquisition Holdings LLC | ||||||||
| 1,410 | 6.63%, 04/01/2022 ■ | 1,475 | ||||||
| Paragon Offshore plc | ||||||||
| 2,100 | 6.75%, 07/15/2022 ■ | 1,601 | ||||||
| Ply Gem Industries, Inc. | ||||||||
| 2,140 | 6.50%, 02/01/2022 | 2,105 | ||||||
| Pulte Homes, Inc. | ||||||||
| 130 | 6.38%, 05/15/2033 | 130 | ||||||
| Ryland Group, Inc. | ||||||||
| 150 | 5.38%, 10/01/2022 | 147 | ||||||
| Toll Bros Finance Corp. | ||||||||
| 1,420 | 4.00%, 12/31/2018 | 1,438 | ||||||
| 15,520 | ||||||||
| Couriers and Messengers - 0.0% | ||||||||
| United Parcel Service, Inc. | ||||||||
| 1,540 | 2.45%, 10/01/2022 | 1,500 | ||||||
| Electrical Equipment and Appliance Manufacturing - 0.1% | ||||||||
| General Electric Co. | ||||||||
| 795 | 4.13%, 10/09/2042 | 802 | ||||||
| 4,000 | 4.50%, 03/11/2044 | 4,264 | ||||||
| Sensata Technologies B.V. | ||||||||
| 530 | 5.63%, 11/01/2024 ■ | 560 | ||||||
| 5,626 | ||||||||
| Fabricated Metal Product Manufacturing - 0.0% | ||||||||
| Ball Corp. | ||||||||
| 135 | 5.00%, 03/15/2022 | 141 | ||||||
| 240 | 5.75%, 05/15/2021 | 252 | ||||||
| Entegris, Inc. | ||||||||
| 1,385 | 6.00%, 04/01/2022 ■ | 1,409 | ||||||
| Masco Corp. | ||||||||
| 155 | 6.13%, 10/03/2016 | 166 | ||||||
| 25 | 6.50%, 08/15/2032 | 26 | ||||||
| 310 | 7.13%, 03/15/2020 | 354 | ||||||
| 160 | 7.75%, 08/01/2029 | 187 | ||||||
| 2,535 | ||||||||
| Finance and Insurance - 19.1% | ||||||||
| Abbey National Treasury Services plc | ||||||||
| 6,855 | 2.35%, 09/10/2019 | 6,814 | ||||||
| ACE Capital Trust II | ||||||||
| 1,905 | 9.70%, 04/01/2030 | 2,800 | ||||||
| ACE INA Holdings, Inc. | ||||||||
| 4,000 | 3.35%, 05/15/2024 | 4,028 | ||||||
| AerCap Ireland Capital Ltd. | ||||||||
| 1,180 | 4.50%, 05/15/2021 ■ | 1,192 | ||||||
| 3,720 | 5.00%, 10/01/2021 ■ | 3,869 | ||||||
| Allstate (The) Corp. | ||||||||
| 1,175 | 5.75%, 08/15/2053 | 1,250 | ||||||
| Ally Financial, Inc. | ||||||||
| 4,895 | 5.13%, 09/30/2024 | 5,091 | ||||||
| American Express Co. | ||||||||
| 5,127 | 2.65%, 12/02/2022 | 4,999 | ||||||
| 4,700 | 7.00%, 03/19/2018 | 5,478 | ||||||
| American Express Credit Corp. | ||||||||
| 6,165 | 0.53%, 09/22/2017 Δ | 6,158 | ||||||
| American International Group, Inc. | ||||||||
| 1,795 | 4.13%, 02/15/2024 | 1,891 | ||||||
| 4,005 | 4.50%, 07/16/2044 | 4,067 | ||||||
| 3,350 | 6.40%, 12/15/2020 | 4,000 | ||||||
| 3,265 | 8.18%, 05/15/2058 | 4,432 | ||||||
| American Tower Corp. | ||||||||
| 200 | 4.50%, 01/15/2018 | 214 | ||||||
| 10,315 | 5.00%, 02/15/2024 | 10,858 | ||||||
| 275 | 7.00%, 10/15/2017 | 311 | ||||||
| Ameriprise Financial, Inc. | ||||||||
| 3,310 | 4.00%, 10/15/2023 | 3,470 | ||||||
| 2,465 | 5.30%, 03/15/2020 | 2,801 | ||||||
| Aon plc | ||||||||
| 4,775 | 3.50%, 06/14/2024 | 4,771 | ||||||
| 2,300 | 4.25%, 12/12/2042 | 2,136 | ||||||
| Aquarius Invest. plc Swiss Reinsurance Co., Ltd. | ||||||||
| 350 | 6.38%, 09/01/2024 § | 365 | ||||||
| AXA S.A. | ||||||||
| 180 | 6.46%, 12/14/2018 §♠ | 188 | ||||||
The accompanying notes are an integral part of these financial statements.
| 10 |
| The Hartford Balanced Income Fund |
| Schedule of Investments – (continued) |
| October 31, 2014 |
| (000’s Omitted) |
| Shares or Principal Amount ╬ | Market Value ╪ | |||||||
| Corporate Bonds - 43.3% - (continued) | ||||||||
| Finance and Insurance - 19.1% - (continued) | ||||||||
| BAE Systems Holdings, Inc. | ||||||||
| $ | 4,085 | 3.80%, 10/07/2024 ■ | $ | 4,112 | ||||
| Banco Bilbao Vizcaya Argentaria S.A. | ||||||||
| EUR | 3,000 | 7.00%, 12/29/2049 § | 3,856 | |||||
| 800 | 9.00%, 05/09/2018 §♠ | 865 | ||||||
| Banco Davivienda S.A. | ||||||||
| 335 | 2.95%, 01/29/2018 ■ | 335 | ||||||
| Banco de Credito del Peru/Panama | ||||||||
| 652 | 2.75%, 01/09/2018 ■ | 652 | ||||||
| Banco Nacional de Desenvolvimento | ||||||||
| 565 | 5.75%, 09/26/2023 ■ | 606 | ||||||
| Bank of America Corp. | ||||||||
| 3,010 | 2.60%, 01/15/2019 | 3,039 | ||||||
| 1,360 | 4.00%, 04/01/2024 | 1,405 | ||||||
| 4,260 | 4.10%, 07/24/2023 | 4,447 | ||||||
| 2,880 | 4.20%, 08/26/2024 | 2,901 | ||||||
| 200 | 4.88%, 04/01/2044 | 214 | ||||||
| 657 | 5.13%, 06/17/2019 ♠ | 637 | ||||||
| 5,425 | 5.63%, 07/01/2020 | 6,161 | ||||||
| 915 | 5.65%, 05/01/2018 | 1,022 | ||||||
| 2,990 | 5.75%, 12/01/2017 | 3,328 | ||||||
| 2,840 | 5.88%, 01/05/2021 | 3,282 | ||||||
| 4,960 | 6.00%, 09/01/2017 | 5,532 | ||||||
| 3,970 | 7.63%, 06/01/2019 | 4,815 | ||||||
| Bank of New York Mellon Corp. | ||||||||
| 6,225 | 2.20%, 03/04/2019 | 6,243 | ||||||
| Bank of Tokyo-Mitsubishi UFJ Ltd. | ||||||||
| 5,925 | 1.55%, 09/09/2016 ■ | 5,976 | ||||||
| Bankia S.A. | ||||||||
| EUR | 200 | 4.00%, 05/22/2024 §Δ | 246 | |||||
| Barclays Bank plc | ||||||||
| 2,200 | 2.50%, 02/20/2019 | 2,217 | ||||||
| 4,820 | 4.38%, 09/11/2024 | 4,676 | ||||||
| 15,756 | 6.05%, 12/04/2017 ■ | 17,457 | ||||||
| 2,815 | 8.25%, 12/15/2018 ♠β | 2,906 | ||||||
| BBVA Banco Continental S.A. | ||||||||
| 475 | 3.25%, 04/08/2018 ■ | 485 | ||||||
| BBVA International PFD Uniperson | ||||||||
| 275 | 5.92%, 04/18/2017 ♠ | 281 | ||||||
| Bear Stearns & Co., Inc. | ||||||||
| 1,210 | 7.25%, 02/01/2018 | 1,407 | ||||||
| BNP Paribas | ||||||||
| 8,430 | 2.38%, 09/14/2017 | 8,592 | ||||||
| 3,650 | 2.40%, 12/12/2018 | 3,677 | ||||||
| BP Capital Markets plc | ||||||||
| 7,975 | 2.24%, 09/26/2018 | 8,041 | ||||||
| 3,030 | 2.52%, 01/15/2020 | 3,043 | ||||||
| BPCE S.A. | ||||||||
| 250 | 0.84%, 06/23/2017 Δ | 250 | ||||||
| 6,635 | 2.50%, 12/10/2018 - 07/15/2019 | 6,651 | ||||||
| 3,530 | 4.00%, 04/15/2024 | 3,649 | ||||||
| 550 | 4.50%, 03/15/2025 ■ | 534 | ||||||
| 3,840 | 5.15%, 07/21/2024 ■ | 3,952 | ||||||
| 4,430 | 5.70%, 10/22/2023 ■ | 4,757 | ||||||
| Brandywine Operating Partnership L.P. | ||||||||
| 3,550 | 3.95%, 02/15/2023 | 3,567 | ||||||
| 4,880 | 4.10%, 10/01/2024 | 4,880 | ||||||
| 1,100 | 4.95%, 04/15/2018 | 1,186 | ||||||
| Brazil Minas SPE via State of Minas Gerais | ||||||||
| 1,775 | 5.33%, 02/15/2028 ■ | 1,784 | ||||||
| 1,605 | 5.33%, 02/15/2028 § | 1,613 | ||||||
| Camden Property Trust REIT | ||||||||
| 730 | 4.25%, 01/15/2024 | 769 | ||||||
| Capital One Bank | ||||||||
| 5,000 | 1.30%, 06/05/2017 | 4,981 | ||||||
| 4,600 | 2.40%, 09/05/2019 | 4,572 | ||||||
| Capital One Financial Corp. | ||||||||
| 2,800 | 1.00%, 11/06/2015 | 2,807 | ||||||
| 500 | 4.75%, 07/15/2021 | 551 | ||||||
| 3,075 | 6.15%, 09/01/2016 | 3,346 | ||||||
| CIGNA Corp. | ||||||||
| 785 | 5.38%, 02/15/2042 | 887 | ||||||
| 900 | 5.88%, 03/15/2041 | 1,068 | ||||||
| CIT Group, Inc. | ||||||||
| 335 | 5.00%, 05/15/2017 | 351 | ||||||
| 686 | 5.25%, 03/15/2018 | 724 | ||||||
| 545 | 5.38%, 05/15/2020 | 582 | ||||||
| 1,555 | 5.50%, 02/15/2019 ■ | 1,659 | ||||||
| 70 | 6.63%, 04/01/2018 ■ | 77 | ||||||
| Citigroup, Inc. | ||||||||
| 2,700 | 1.70%, 07/25/2016 | 2,727 | ||||||
| 6,275 | 2.50%, 09/26/2018 | 6,351 | ||||||
| 7,000 | 2.55%, 04/08/2019 | 7,074 | ||||||
| 3,400 | 3.88%, 10/25/2023 | 3,500 | ||||||
| 170 | 5.30%, 05/06/2044 | 181 | ||||||
| 700 | 5.38%, 08/09/2020 | 795 | ||||||
| 7,960 | 5.50%, 09/13/2025 | 8,818 | ||||||
| 1,485 | 6.00%, 10/31/2033 | 1,697 | ||||||
| 9,750 | 6.13%, 05/15/2018 - 08/25/2036 | 11,280 | ||||||
| 1,620 | 6.68%, 09/13/2043 | 2,060 | ||||||
| CNH Capital LLC | ||||||||
| 245 | 3.88%, 11/01/2015 | 248 | ||||||
| 1,070 | 6.25%, 11/01/2016 | 1,132 | ||||||
| CNH Industrial Capital LLC | ||||||||
| 575 | 3.38%, 07/15/2019 ■ | 559 | ||||||
| Compass Bank | ||||||||
| 5,550 | 1.85%, 09/29/2017 | 5,572 | ||||||
| Coventry Health Care, Inc. | ||||||||
| 2,060 | 5.45%, 06/15/2021 | 2,361 | ||||||
| Credit Agricole S.A. | ||||||||
| 350 | 6.63%, 09/23/2019 §♠ | 341 | ||||||
| 890 | 7.88%, 01/23/2024 ■♠ | 919 | ||||||
| Credit Suisse Group AG | ||||||||
| 2,990 | 6.50%, 08/08/2023 ■ | 3,296 | ||||||
| 875 | 7.50%, 12/11/2023 ■♠ | 930 | ||||||
| Credit Suisse New York | ||||||||
| 3,115 | 2.30%, 05/28/2019 | 3,109 | ||||||
| 275 | 3.00%, 10/29/2021 | 272 | ||||||
| 6,235 | 3.63%, 09/09/2024 | 6,258 | ||||||
| 3,685 | 5.40%, 01/14/2020 | 4,127 | ||||||
| DDR Corp. | ||||||||
| 6,925 | 3.50%, 01/15/2021 | 6,969 | ||||||
| Deutsche Bank AG | ||||||||
| 4,910 | 4.30%, 05/24/2028 | 4,765 | ||||||
| Deutsche Bank AG London | ||||||||
| 7,545 | 2.50%, 02/13/2019 | 7,628 | ||||||
| Discover Bank/Greenwood DE | ||||||||
| 6,520 | 4.20%, 08/08/2023 | 6,831 | ||||||
The accompanying notes are an integral part of these financial statements.
| 11 |
| The Hartford Balanced Income Fund |
| Schedule of Investments – (continued) |
| October 31, 2014 |
| (000’s Omitted) |
| Shares or Principal Amount ╬ | Market Value ╪ | |||||||
| Corporate Bonds - 43.3% - (continued) | ||||||||
| Finance and Insurance - 19.1% - (continued) | ||||||||
| Discover Financial Services | ||||||||
| $ | 960 | 5.20%, 04/27/2022 | $ | 1,055 | ||||
| El Fondo Mivivienda S.A. | ||||||||
| 285 | 3.50%, 01/31/2023 ■ | 273 | ||||||
| Fifth Third Bancorp | ||||||||
| 4,210 | 2.30%, 03/01/2019 | 4,220 | ||||||
| 2,750 | 2.88%, 10/01/2021 | 2,730 | ||||||
| 2,780 | 4.30%, 01/16/2024 | 2,893 | ||||||
| 325 | 4.90%, 09/30/2019 ♠ | 320 | ||||||
| 3,195 | 5.45%, 01/15/2017 | 3,467 | ||||||
| 1,300 | 8.25%, 03/01/2038 | 1,940 | ||||||
| FMR LLC | ||||||||
| 3,825 | 4.95%, 02/01/2033 ■ | 4,182 | ||||||
| Ford Motor Credit Co. LLC | ||||||||
| 6,000 | 1.68%, 09/08/2017 | 5,972 | ||||||
| 11,365 | 2.38%, 03/12/2019 | 11,349 | ||||||
| 4,220 | 2.60%, 11/04/2019 ☼ | 4,206 | ||||||
| 5,100 | 3.88%, 01/15/2015 | 5,132 | ||||||
| 4,445 | 4.25%, 09/20/2022 | 4,668 | ||||||
| 240 | 5.00%, 05/15/2018 | 263 | ||||||
| 2,835 | 5.88%, 08/02/2021 | 3,276 | ||||||
| General Electric Capital Corp. | ||||||||
| 7,500 | 3.45%, 05/15/2024 | 7,650 | ||||||
| 4,625 | 4.65%, 10/17/2021 | 5,168 | ||||||
| 725 | 5.55%, 05/04/2020 | 835 | ||||||
| 2,995 | 5.88%, 01/14/2038 | 3,675 | ||||||
| 1,000 | 6.25%, 12/15/2022 ♠ | 1,094 | ||||||
| 4,530 | 6.75%, 03/15/2032 | 6,023 | ||||||
| Goldman Sachs Group, Inc. | ||||||||
| 1,925 | 2.38%, 01/22/2018 | 1,943 | ||||||
| 2,500 | 2.90%, 07/19/2018 | 2,557 | ||||||
| 3,180 | 3.63%, 02/07/2016 | 3,282 | ||||||
| 90 | 3.85%, 07/08/2024 | 91 | ||||||
| 3,315 | 4.00%, 03/03/2024 | 3,387 | ||||||
| 2,800 | 4.80%, 07/08/2044 | 2,891 | ||||||
| 4,200 | 5.38%, 03/15/2020 | 4,710 | ||||||
| 4,740 | 5.75%, 01/24/2022 | 5,461 | ||||||
| 4,550 | 6.15%, 04/01/2018 | 5,141 | ||||||
| 1,665 | 6.25%, 02/01/2041 | 2,063 | ||||||
| 2,470 | 6.45%, 05/01/2036 | 2,913 | ||||||
| 8,645 | 6.75%, 10/01/2037 | 10,599 | ||||||
| 2,921 | 7.50%, 02/15/2019 | 3,488 | ||||||
| Guardian Life Insurance Co. | ||||||||
| 250 | 7.38%, 09/30/2039 ■ | 342 | ||||||
| Harley-Davidson Financial Services, Inc. | ||||||||
| 11,490 | 2.40%, 09/15/2019 ■ | 11,506 | ||||||
| HBOS Capital Funding L.P. | ||||||||
| 750 | 6.85%, 12/23/2014 §♠ | 753 | ||||||
| HCP, Inc. | ||||||||
| 4,525 | 3.88%, 08/15/2024 | 4,523 | ||||||
| 7,200 | 4.25%, 11/15/2023 | 7,467 | ||||||
| 1,000 | 6.70%, 01/30/2018 | 1,152 | ||||||
| Health Care REIT, Inc. | ||||||||
| 2,500 | 3.63%, 03/15/2016 | 2,590 | ||||||
| 2,320 | 4.13%, 04/01/2019 | 2,486 | ||||||
| 4,350 | 4.50%, 01/15/2024 | 4,518 | ||||||
| 840 | 5.25%, 01/15/2022 | 931 | ||||||
| HSBC Bank USA | ||||||||
| 1,050 | 4.88%, 08/24/2020 | 1,156 | ||||||
| HSBC Holdings plc | ||||||||
| 7,655 | 4.25%, 03/14/2024 | 7,869 | ||||||
| 1,665 | 5.10%, 04/05/2021 | 1,879 | ||||||
| 1,000 | 6.50%, 09/15/2037 | 1,244 | ||||||
| 7,800 | 6.80%, 06/01/2038 | 10,052 | ||||||
| HSBC USA, Inc. | ||||||||
| 1,295 | 1.63%, 01/16/2018 | 1,294 | ||||||
| Humana, Inc. | ||||||||
| 5,475 | 3.85%, 10/01/2024 | 5,523 | ||||||
| 3,360 | 4.95%, 10/01/2044 | 3,455 | ||||||
| Intesa Sanpaolo S.p.A. | ||||||||
| 7,025 | 5.25%, 01/12/2024 | 7,649 | ||||||
| John Deere Capital Corp. | ||||||||
| 3,835 | 3.15%, 10/15/2021 | 3,925 | ||||||
| JP Morgan Chase & Co. | ||||||||
| 6,625 | 1.35%, 02/15/2017 | 6,635 | ||||||
| 3,375 | 1.63%, 05/15/2018 | 3,337 | ||||||
| 2,270 | 3.25%, 09/23/2022 | 2,273 | ||||||
| 2,200 | 3.63%, 05/13/2024 | 2,228 | ||||||
| 6,600 | 3.88%, 02/01/2024 - 09/10/2024 | 6,655 | ||||||
| 5,300 | 4.35%, 08/15/2021 | 5,692 | ||||||
| 2,220 | 4.63%, 05/10/2021 | 2,432 | ||||||
| 430 | 5.00%, 07/01/2019 ♠ | 423 | ||||||
| 785 | 5.50%, 10/15/2040 | 915 | ||||||
| 4,320 | 5.63%, 08/16/2043 | 4,931 | ||||||
| 9,195 | 6.00%, 01/15/2018 | 10,364 | ||||||
| 930 | 6.30%, 04/23/2019 | 1,079 | ||||||
| 1,000 | 6.40%, 05/15/2038 | 1,284 | ||||||
| JP Morgan Chase Bank | ||||||||
| 1,886 | 6.00%, 07/05/2017 | 2,100 | ||||||
| KeyCorp | ||||||||
| 10,750 | 2.30%, 12/13/2018 | 10,779 | ||||||
| Kimco Realty Corp. | ||||||||
| 5,385 | 3.20%, 05/01/2021 | 5,431 | ||||||
| 1,380 | 4.30%, 02/01/2018 | 1,485 | ||||||
| Liberty Mutual Group, Inc. | ||||||||
| 1,385 | 4.25%, 06/15/2023 ■ | 1,432 | ||||||
| Liberty Property L.P. | ||||||||
| 635 | 3.38%, 06/15/2023 | 619 | ||||||
| 775 | 4.13%, 06/15/2022 | 806 | ||||||
| Lincoln National Corp. | ||||||||
| 3,000 | 4.85%, 06/24/2021 | 3,310 | ||||||
| 1,035 | 6.15%, 04/07/2036 | 1,257 | ||||||
| 625 | 6.30%, 10/09/2037 | 784 | ||||||
| 2,000 | 8.75%, 07/01/2019 | 2,540 | ||||||
| Lloyds Bank plc | ||||||||
| 5,650 | 2.35%, 09/05/2019 | 5,645 | ||||||
| Lloyds Banking Group plc | ||||||||
| 165 | 6.50%, 09/14/2020 ■ | 191 | ||||||
| Macquarie Group Ltd. | ||||||||
| 5,450 | 3.00%, 12/03/2018 ■ | 5,611 | ||||||
| Mapfre S.A. | ||||||||
| EUR | 200 | 5.92%, 07/24/2037 | 266 | |||||
| Marsh & McLennan Cos., Inc. | ||||||||
| 6,675 | 2.30%, 04/01/2017 | 6,800 | ||||||
| 3,875 | 2.35%, 09/10/2019 | 3,891 | ||||||
| 3,900 | 4.05%, 10/15/2023 | 4,126 | ||||||
| Massachusetts Mutual Life Insurance Co. | ||||||||
| 3,350 | 8.88%, 06/01/2039 ■ | 5,253 | ||||||
The accompanying notes are an integral part of these financial statements.
| 12 |
| The Hartford Balanced Income Fund |
| Schedule of Investments – (continued) |
| October 31, 2014 |
| (000’s Omitted) |
| Shares or Principal Amount ╬ | Market Value ╪ | |||||||
| Corporate Bonds - 43.3% - (continued) | ||||||||
| Finance and Insurance - 19.1% - (continued) | ||||||||
| Massmutual Global Funding | ||||||||
| $ | 2,625 | 2.10%, 08/02/2018 ■ | $ | 2,648 | ||||
| MasterCard, Inc. | ||||||||
| 11,575 | 3.38%, 04/01/2024 | 11,823 | ||||||
| Merrill Lynch & Co., Inc. | ||||||||
| 2,496 | 5.70%, 05/02/2017 | 2,722 | ||||||
| 4,890 | 6.05%, 05/16/2016 | 5,235 | ||||||
| 4,515 | 6.88%, 04/25/2018 | 5,223 | ||||||
| 11,230 | 7.75%, 05/14/2038 | 15,531 | ||||||
| MetLife, Inc. | ||||||||
| 2,905 | 3.60%, 04/10/2024 | 2,961 | ||||||
| Mizuho Bank Ltd. | ||||||||
| 5,000 | 0.68%, 09/25/2017 ■Δ | 4,997 | ||||||
| 5,340 | 2.45%, 04/16/2019 ■ | 5,345 | ||||||
| Morgan Stanley | ||||||||
| 5,030 | 1.75%, 02/25/2016 | 5,075 | ||||||
| 5,735 | 2.13%, 04/25/2018 | 5,751 | ||||||
| 7,450 | 2.50%, 01/24/2019 | 7,501 | ||||||
| 11,230 | 3.70%, 10/23/2024 | 11,207 | ||||||
| 1,000 | 3.75%, 02/25/2023 | 1,013 | ||||||
| 4,270 | 4.10%, 05/22/2023 | 4,310 | ||||||
| 4,820 | 4.35%, 09/08/2026 | 4,833 | ||||||
| 1,770 | 4.88%, 11/01/2022 | 1,885 | ||||||
| 1,550 | 5.50%, 01/26/2020 | 1,747 | ||||||
| 2,371 | 5.55%, 04/27/2017 | 2,596 | ||||||
| 3,361 | 5.75%, 01/25/2021 | 3,859 | ||||||
| 1,250 | 6.38%, 07/24/2042 | 1,609 | ||||||
| 2,460 | 6.63%, 04/01/2018 | 2,817 | ||||||
| 2,600 | 7.30%, 05/13/2019 | 3,104 | ||||||
| National City Corp. | ||||||||
| 355 | 6.88%, 05/15/2019 | 420 | ||||||
| Nationstar Mortgage LLC | ||||||||
| 2,395 | 6.50%, 08/01/2018 - 07/01/2021 | 2,333 | ||||||
| 350 | 7.88%, 10/01/2020 | 345 | ||||||
| Nationwide Mutual Insurance Co. | ||||||||
| 4,975 | 9.38%, 08/15/2039 ■ | 7,667 | ||||||
| Navient Corp. | ||||||||
| 625 | 6.25%, 01/25/2016 | 650 | ||||||
| 465 | 8.00%, 03/25/2020 | 534 | ||||||
| 395 | 8.45%, 06/15/2018 | 451 | ||||||
| NN Group N.V. | ||||||||
| EUR | 250 | 4.63%, 04/08/2044 § | 326 | |||||
| Nordea Bank AB | ||||||||
| 760 | 4.88%, 05/13/2021 ■ | 823 | ||||||
| Nuveen Investments, Inc. | ||||||||
| 970 | 9.13%, 10/15/2017 ■ | 1,036 | ||||||
| Pacific Life Insurance Co. | ||||||||
| 2,075 | 9.25%, 06/15/2039 ■ | 3,254 | ||||||
| PNC Bank NA | ||||||||
| 13,070 | 2.40%, 10/18/2019 | 13,119 | ||||||
| 2,465 | 2.70%, 11/01/2022 | 2,368 | ||||||
| PNC Financial Services Group, Inc. | ||||||||
| 1,240 | 2.85%, 11/09/2022 Δ | 1,216 | ||||||
| 4,310 | 3.90%, 04/29/2024 | 4,368 | ||||||
| PNC Funding Corp. | ||||||||
| 3,000 | 5.25%, 11/15/2015 | 3,138 | ||||||
| Principal Financial Group, Inc. | ||||||||
| 620 | 3.30%, 09/15/2022 | 623 | ||||||
| Provident Companies, Inc. | ||||||||
| 4,435 | 7.00%, 07/15/2018 | 5,100 | ||||||
| Provident Funding Associates L.P. | ||||||||
| 3,710 | 6.75%, 06/15/2021 ■ | 3,701 | ||||||
| Prudential Financial, Inc. | ||||||||
| 550 | 4.60%, 05/15/2044 | 557 | ||||||
| 1,660 | 5.80%, 11/16/2041 | 1,969 | ||||||
| 5,320 | 7.38%, 06/15/2019 | 6,474 | ||||||
| Rabobank Nederland | ||||||||
| 5,925 | 2.25%, 01/14/2019 ╦ | 5,996 | ||||||
| 1,000 | 5.25%, 05/24/2041 | 1,156 | ||||||
| 3,835 | 5.75%, 12/01/2043 | 4,463 | ||||||
| Realty Income Corp. | ||||||||
| 2,676 | 3.25%, 10/15/2022 | 2,628 | ||||||
| 1,130 | 4.65%, 08/01/2023 | 1,211 | ||||||
| 1,085 | 6.75%, 08/15/2019 | 1,285 | ||||||
| Royal Bank of Scotland Group plc | ||||||||
| 6,165 | 5.13%, 05/28/2024 | 6,246 | ||||||
| 1,260 | 6.99%, 10/05/2017 ■♠ | 1,430 | ||||||
| 1,400 | 7.64%, 09/27/2017 ♠Δ | 1,480 | ||||||
| 725 | 9.50%, 03/16/2022 § | 829 | ||||||
| Santander UK plc | ||||||||
| 2,290 | 5.00%, 11/07/2023 ■ | 2,427 | ||||||
| SBA Tower Trust | ||||||||
| 1,050 | 2.93%, 12/15/2017 ■ | 1,064 | ||||||
| Simon Property Group L.P. | ||||||||
| 2,115 | 5.65%, 02/01/2020 | 2,446 | ||||||
| Skandinaviska Enskilda Banken AB | ||||||||
| 3,810 | 2.38%, 11/20/2018 ■ | 3,865 | ||||||
| Societe Generale | ||||||||
| 2,535 | 2.63%, 10/01/2018 | 2,576 | ||||||
| 2,670 | 5.00%, 01/17/2024 ■ | 2,727 | ||||||
| 875 | 6.00%, 01/27/2020 ■♠ | 825 | ||||||
| 2,855 | 7.88%, 12/18/2023 ■♠ | 2,855 | ||||||
| 200 | 7.88%, 12/18/2023 §♠ | 200 | ||||||
| 1,055 | 8.25%, 11/29/2018 §♠ | 1,115 | ||||||
| SoftBank Corp. | ||||||||
| 850 | 4.50%, 04/15/2020 ■ | 861 | ||||||
| Standard Bank plc | ||||||||
| 100 | 8.13%, 12/02/2019 § | 115 | ||||||
| Standard Chartered plc | ||||||||
| 225 | 0.57%, 09/08/2017 ■Δ | 225 | ||||||
| 5,975 | 1.50%, 09/08/2017 ■ | 5,959 | ||||||
| 825 | 4.00%, 07/12/2022 § | 848 | ||||||
| State Street Capital Trust IV | ||||||||
| 100 | 1.23%, 06/15/2037 Δ | 85 | ||||||
| State Street Corp. | ||||||||
| 1,445 | 3.10%, 05/15/2023 | 1,399 | ||||||
| 4,840 | 3.70%, 11/20/2023 | 5,017 | ||||||
| 775 | 4.96%, 03/15/2018 | 845 | ||||||
| Sumitomo Mitsui Financial Group, Inc. | ||||||||
| 5,800 | 4.44%, 04/02/2024 ■ | 6,038 | ||||||
| SunTrust Banks, Inc. | ||||||||
| 4,940 | 2.35%, 11/01/2018 | 4,971 | ||||||
| 3,700 | 2.50%, 05/01/2019 | 3,728 | ||||||
| Swedbank AB | ||||||||
| 7,071 | 2.38%, 02/27/2019 ■ | 7,125 | ||||||
| Synchrony Financial | ||||||||
| 3,810 | 3.00%, 08/15/2019 | 3,852 | ||||||
| 5,410 | 3.75%, 08/15/2021 | 5,516 | ||||||
The accompanying notes are an integral part of these financial statements.
| 13 |
| The Hartford Balanced Income Fund |
| Schedule of Investments – (continued) |
| October 31, 2014 |
| (000’s Omitted) |
| Shares or Principal Amount ╬ | Market Value ╪ | |||||||
| Corporate Bonds - 43.3% - (continued) | ||||||||
| Finance and Insurance - 19.1% - (continued) | ||||||||
| Teachers Insurance & Annuity Association of America | ||||||||
| $ | 3,000 | 6.85%, 12/16/2039 ■ | $ | 3,966 | ||||
| TIAA Asset Management Finance LLC | ||||||||
| 2,015 | 2.95%, 11/01/2019 ■ | 2,019 | ||||||
| TMX Finance LLC | ||||||||
| 1,645 | 8.50%, 09/15/2018 ■ | 1,604 | ||||||
| Toyota Motor Credit Corp. | ||||||||
| 3,500 | 2.13%, 07/18/2019 | 3,504 | ||||||
| TSMC Global Ltd. | ||||||||
| 675 | 1.63%, 04/03/2018 ■ | 671 | ||||||
| UBS AG Stamford CT | ||||||||
| 2,850 | 5.88%, 07/15/2016 | 3,074 | ||||||
| UNIQA Insurance Group AG | ||||||||
| EUR | 300 | 6.88%, 07/31/2043 § | 431 | |||||
| UnitedHealth Group, Inc. | ||||||||
| 1,981 | 6.88%, 02/15/2038 | 2,715 | ||||||
| Ventas Realty L.P. | ||||||||
| 1,000 | 1.25%, 04/17/2017 | 998 | ||||||
| 1,240 | 2.70%, 04/01/2020 | 1,230 | ||||||
| 3,975 | 3.25%, 08/15/2022 | 3,897 | ||||||
| 1,280 | 3.75%, 05/01/2024 | 1,272 | ||||||
| Voya Financial, Inc. | ||||||||
| 1,100 | 5.65%, 05/15/2053 | 1,100 | ||||||
| Wachovia Capital Trust III | ||||||||
| 325 | 5.57%, 11/03/2014 ♠Δ | 314 | ||||||
| Wachovia Corp. | ||||||||
| 2,850 | 5.50%, 08/01/2035 | 3,227 | ||||||
| Wellpoint, Inc. | ||||||||
| 1,365 | 3.13%, 05/15/2022 | 1,351 | ||||||
| 3,315 | 4.63%, 05/15/2042 | 3,338 | ||||||
| 1,000 | 5.85%, 01/15/2036 | 1,189 | ||||||
| 2,330 | 6.38%, 06/15/2037 | 2,885 | ||||||
| Wells Fargo & Co. | ||||||||
| 9,560 | 2.13%, 04/22/2019 | 9,560 | ||||||
| 3,710 | 3.00%, 01/22/2021 | 3,774 | ||||||
| 4,965 | 3.45%, 02/13/2023 | 4,958 | ||||||
| 8,100 | 4.10%, 06/03/2026 | 8,216 | ||||||
| 4,080 | 4.13%, 08/15/2023 | 4,255 | ||||||
| 759 | 4.48%, 01/16/2024 | 803 | ||||||
| 3,000 | 4.60%, 04/01/2021 | 3,314 | ||||||
| 3,055 | 4.65%, 11/04/2044 ☼ | 3,045 | ||||||
| 60 | 5.38%, 11/02/2043 | 67 | ||||||
| 4,868 | 5.61%, 01/15/2044 | 5,577 | ||||||
| WPP Finance 2010 | ||||||||
| 8,195 | 3.75%, 09/19/2024 | 8,155 | ||||||
| XLIT Ltd. | ||||||||
| 6,325 | 2.30%, 12/15/2018 | 6,338 | ||||||
| Xstrata Finance Canada Ltd. | ||||||||
| 4,200 | 2.70%, 10/25/2017 ■ | 4,277 | ||||||
| 800 | 3.60%, 01/15/2017 ■ | 833 | ||||||
| YPF S.A. | ||||||||
| 685 | 8.75%, 04/04/2024 ■ | 708 | ||||||
| 1,038,778 | ||||||||
| Food Manufacturing - 0.3% | ||||||||
| Cargill, Inc. | ||||||||
| 325 | 3.25%, 11/15/2021 ■ | 334 | ||||||
| 2,925 | 4.10%, 11/01/2042 ■ | 2,858 | ||||||
| 1,000 | 6.00%, 11/27/2017 ■ | 1,132 | ||||||
| ConAgra Foods, Inc. | ||||||||
| 3,000 | 7.13%, 10/01/2026 | 3,780 | ||||||
| Kellogg Co. | ||||||||
| 550 | 7.45%, 04/01/2031 | 721 | ||||||
| Kraft Foods Group, Inc. | ||||||||
| 1,450 | 3.50%, 06/06/2022 | 1,484 | ||||||
| 770 | 5.00%, 06/04/2042 | 822 | ||||||
| Mondelez International, Inc. | ||||||||
| 3,975 | 4.00%, 02/01/2024 | 4,102 | ||||||
| TreeHouse Foods, Inc. | ||||||||
| 2,340 | 4.88%, 03/15/2022 | 2,375 | ||||||
| 17,608 | ||||||||
| Food Services - 0.1% | ||||||||
| ARAMARK Corp. | ||||||||
| 2,700 | 5.75%, 03/15/2020 | 2,821 | ||||||
| CEC Entertainment, Inc. | ||||||||
| 820 | 8.00%, 02/15/2022 ■ | 787 | ||||||
| McDonald's Corp. | ||||||||
| 400 | 6.30%, 10/15/2037 | 517 | ||||||
| 4,125 | ||||||||
| Health Care and Social Assistance - 2.7% | ||||||||
| AbbVie, Inc. | ||||||||
| 5,740 | 1.75%, 11/06/2017 | 5,756 | ||||||
| Actavis Funding SCS | ||||||||
| 3,825 | 3.85%, 06/15/2024 ■ | 3,723 | ||||||
| Aetna, Inc. | ||||||||
| 1,600 | 4.50%, 05/15/2042 | 1,605 | ||||||
| Alere, Inc. | ||||||||
| 2,815 | 6.50%, 06/15/2020 | 2,899 | ||||||
| Amgen, Inc. | ||||||||
| 7,475 | 1.25%, 05/22/2017 | 7,424 | ||||||
| 5,070 | 3.63%, 05/22/2024 | 5,072 | ||||||
| 700 | 4.10%, 06/15/2021 | 741 | ||||||
| 4,340 | 5.15%, 11/15/2041 | 4,655 | ||||||
| 1,475 | 6.90%, 06/01/2038 | 1,914 | ||||||
| AmSurg Corp. | ||||||||
| 780 | 5.63%, 07/15/2022 ■ | 808 | ||||||
| Bayer Finance LLC | ||||||||
| 3,390 | 1.50%, 10/06/2017 ■ | 3,402 | ||||||
| 3,010 | 3.00%, 10/08/2021 ■ | 3,024 | ||||||
| Biomet, Inc. | ||||||||
| 1,005 | 6.50%, 08/01/2020 - 10/01/2020 | 1,066 | ||||||
| Catholic Health Initiatives | ||||||||
| 1,290 | 2.60%, 08/01/2018 | 1,315 | ||||||
| Celgene Corp. | ||||||||
| 2,945 | 3.63%, 05/15/2024 | 2,976 | ||||||
| 2,725 | 4.63%, 05/15/2044 | 2,780 | ||||||
| Community Health Systems, Inc. | ||||||||
| 545 | 5.13%, 08/15/2018 | 567 | ||||||
| 5,740 | 6.88%, 02/01/2022 | 6,184 | ||||||
| 1,440 | 7.13%, 07/15/2020 | 1,559 | ||||||
| Cubist Pharmaceuticals | ||||||||
| 327 | 1.88%, 09/01/2020 β | 382 | ||||||
| CVS Caremark Corp. | ||||||||
| 1,730 | 2.75%, 12/01/2022 | 1,681 | ||||||
| 4,000 | 4.00%, 12/05/2023 | 4,210 | ||||||
| 33 | 6.94%, 01/10/2030 | 40 | ||||||
| CVS Pass-Through Trust | ||||||||
| 16 | 6.04%, 12/10/2028 | 18 | ||||||
The accompanying notes are an integral part of these financial statements.
| 14 |
| The Hartford Balanced Income Fund |
| Schedule of Investments – (continued) |
| October 31, 2014 |
| (000’s Omitted) |
| Shares or Principal Amount ╬ | Market Value ╪ | |||||||
| Corporate Bonds - 43.3% - (continued) | ||||||||
| Health Care and Social Assistance - 2.7% - (continued) | ||||||||
| Dignity Health | ||||||||
| $ | 1,515 | 2.64%, 11/01/2019 | $ | 1,528 | ||||
| 2,260 | 5.27%, 11/01/2064 | 2,286 | ||||||
| Envision Healthcare Corp. | ||||||||
| 600 | 5.13%, 07/01/2022 ■ | 608 | ||||||
| Express Scripts Holding Co. | ||||||||
| 10,645 | 3.50%, 06/15/2024 | 10,550 | ||||||
| Gilead Sciences, Inc. | ||||||||
| 1,565 | 2.05%, 04/01/2019 | 1,562 | ||||||
| 1,765 | 3.70%, 04/01/2024 | 1,815 | ||||||
| 3,700 | 4.40%, 12/01/2021 | 4,048 | ||||||
| GlaxoSmithKline Capital, Inc. | ||||||||
| 1,090 | 2.80%, 03/18/2023 | 1,072 | ||||||
| Grifols Worldwide Operations Ltd. | ||||||||
| 245 | 5.25%, 04/01/2022 ■ | 251 | ||||||
| HCA Holdings, Inc. | ||||||||
| 1,310 | 6.25%, 02/15/2021 | 1,410 | ||||||
| 315 | 7.50%, 11/15/2095 | 302 | ||||||
| HCA, Inc. | ||||||||
| 1,490 | 5.88%, 03/15/2022 - 05/01/2023 | 1,606 | ||||||
| 645 | 6.38%, 01/15/2015 | 651 | ||||||
| 2,160 | 6.50%, 02/15/2016 - 02/15/2020 | 2,382 | ||||||
| 115 | 7.25%, 09/15/2020 | 122 | ||||||
| InVentiv Health, Inc. | ||||||||
| 705 | 9.00%, 01/15/2018 ■ | 731 | ||||||
| McKesson Corp. | ||||||||
| 1,390 | 4.88%, 03/15/2044 | 1,473 | ||||||
| Memorial Sloan-Kettering Cancer Center | ||||||||
| 695 | 5.00%, 07/01/2042 | 795 | ||||||
| Mylan, Inc. | ||||||||
| 5,073 | 2.55%, 03/28/2019 | 5,054 | ||||||
| 3,575 | 4.20%, 11/29/2023 | 3,694 | ||||||
| 12,950 | 6.00%, 11/15/2018 ■ | 13,342 | ||||||
| Perrigo Co. plc | ||||||||
| 2,620 | 2.30%, 11/08/2018 | 2,597 | ||||||
| 1,565 | 5.30%, 11/15/2043 | 1,704 | ||||||
| Pfizer, Inc. | ||||||||
| 1,000 | 4.30%, 06/15/2043 | 1,008 | ||||||
| 1,000 | 6.20%, 03/15/2019 | 1,169 | ||||||
| 1,450 | 7.20%, 03/15/2039 | 2,039 | ||||||
| Pinnacle Merger Sub, Inc. | ||||||||
| 2,115 | 9.50%, 10/01/2023 ■ | 2,305 | ||||||
| Roche Holdings, Inc. | ||||||||
| 7,030 | 0.32%, 09/29/2017 ■Δ | 7,034 | ||||||
| Salix Pharmaceuticals Ltd. | ||||||||
| 4,340 | 6.00%, 01/15/2021 ■ | 4,698 | ||||||
| Savient Pharmaceuticals, Inc. | ||||||||
| 565 | 0.00%, 02/01/2018 Ω | 1 | ||||||
| Tenet Healthcare Corp. | ||||||||
| 345 | 4.75%, 06/01/2020 | 353 | ||||||
| 1,660 | 5.00%, 03/01/2019 ■ | 1,662 | ||||||
| 315 | 6.25%, 11/01/2018 | 342 | ||||||
| 1,455 | 8.13%, 04/01/2022 | 1,668 | ||||||
| Watson Pharmaceuticals, Inc. | ||||||||
| 470 | 4.63%, 10/01/2042 | 428 | ||||||
| Wellcare Health Plans, Inc. | ||||||||
| 1,055 | 5.75%, 11/15/2020 | 1,086 | ||||||
| Zoetis, Inc. | ||||||||
| 2,125 | 4.70%, 02/01/2043 | 2,187 | ||||||
| 149,364 | ||||||||
| Information - 3.8% | ||||||||
| Activision Blizzard, Inc. | ||||||||
| 4,290 | 5.63%, 09/15/2021 ■ | 4,563 | ||||||
| 1,065 | 6.13%, 09/15/2023 ■ | 1,153 | ||||||
| Altice Financing S.A. | ||||||||
| 800 | 6.50%, 01/15/2022 ■ | 822 | ||||||
| 765 | 7.88%, 12/15/2019 ■ | 816 | ||||||
| 925 | 9.88%, 12/15/2020 ■ | 1,031 | ||||||
| AT&T, Inc. | ||||||||
| 3,000 | 2.38%, 11/27/2018 | 3,034 | ||||||
| 6,070 | 4.30%, 12/15/2042 | 5,662 | ||||||
| 7,600 | 4.80%, 06/15/2044 | 7,671 | ||||||
| 1,170 | 5.35%, 09/01/2040 | 1,249 | ||||||
| 1,250 | 5.50%, 02/01/2018 | 1,399 | ||||||
| Audatex North America, Inc. | ||||||||
| 2,357 | 6.00%, 06/15/2021 ■ | 2,493 | ||||||
| British Telecommunications plc | ||||||||
| 2,590 | 1.63%, 06/28/2016 | 2,617 | ||||||
| CCOH Safari LLC | ||||||||
| 2,755 | 5.75%, 12/01/2024 ☼ | 2,771 | ||||||
| Cox Communications, Inc. | ||||||||
| 1,485 | 2.95%, 06/30/2023 ■ | 1,408 | ||||||
| 3,755 | 4.50%, 06/30/2043 ■ | 3,591 | ||||||
| 395 | 8.38%, 03/01/2039 ■ | 565 | ||||||
| Deutsche Telekom International Finance B.V. | ||||||||
| 1,130 | 4.88%, 03/06/2042 ■ | 1,169 | ||||||
| 1,470 | 8.75%, 06/15/2030 | 2,133 | ||||||
| DISH DBS Corp. | ||||||||
| 1,905 | 5.00%, 03/15/2023 | 1,898 | ||||||
| 675 | 5.88%, 07/15/2022 | 715 | ||||||
| 2,570 | 6.75%, 06/01/2021 | 2,853 | ||||||
| 1,935 | 7.88%, 09/01/2019 | 2,247 | ||||||
| First Data Corp. | ||||||||
| 298 | 6.75%, 11/01/2020 ■ | 319 | ||||||
| 2,335 | 7.38%, 06/15/2019 ■ | 2,475 | ||||||
| 3,730 | 8.25%, 01/15/2021 ■ | 4,047 | ||||||
| 36 | 8.75%, 01/15/2022 ■Þ | 39 | ||||||
| 350 | 12.63%, 01/15/2021 | 423 | ||||||
| 315 | 14.50%, 09/24/2019 ■Þ | 329 | ||||||
| Harron Communications L.P. | ||||||||
| 595 | 9.13%, 04/01/2020 ■ | 649 | ||||||
| Infor Software Parent LLC | ||||||||
| 2,555 | 7.13%, 05/01/2021 ■ | 2,587 | ||||||
| Infor US, Inc. | ||||||||
| 530 | 9.38%, 04/01/2019 | 576 | ||||||
| Intelsat Jackson Holdings S.A. | ||||||||
| 410 | 6.63%, 12/15/2022 | 432 | ||||||
| 1,295 | 7.25%, 04/01/2019 | 1,360 | ||||||
| 635 | 7.50%, 04/01/2021 | 687 | ||||||
| 10 | 8.50%, 11/01/2019 | 10 | ||||||
| Intelsat Luxembourg S.A. | ||||||||
| 1,095 | 6.75%, 06/01/2018 | 1,133 | ||||||
| 3,265 | 7.75%, 06/01/2021 | 3,412 | ||||||
| InterActiveCorp | ||||||||
| 250 | 4.75%, 12/15/2022 | 244 | ||||||
| Level 3 Communications, Inc. | ||||||||
| 80 | 8.88%, 06/01/2019 | 86 | ||||||
| Level 3 Escrow, Inc. | ||||||||
| 1,545 | 5.38%, 08/15/2022 ■ | 1,572 | ||||||
| 466 | 8.13%, 07/01/2019 | 499 | ||||||
The accompanying notes are an integral part of these financial statements.
| 15 |
| The Hartford Balanced Income Fund |
| Schedule of Investments – (continued) |
| October 31, 2014 |
| (000’s Omitted) |
| Shares or Principal Amount ╬ | Market Value ╪ | |||||||
| Corporate Bonds - 43.3% - (continued) | ||||||||
| Information - 3.8% - (continued) | ||||||||
| Level 3 Financing, Inc. | ||||||||
| $ | 1,480 | 6.13%, 01/15/2021 | $ | 1,552 | ||||
| 1,444 | 7.00%, 06/01/2020 | 1,541 | ||||||
| 415 | 8.63%, 07/15/2020 | 457 | ||||||
| MetroPCS Wireless, Inc. | ||||||||
| 1,450 | 6.63%, 11/15/2020 | 1,528 | ||||||
| Nara Cable Funding Ltd. | ||||||||
| 1,285 | 8.88%, 12/01/2018 ■ | 1,348 | ||||||
| Oracle Corp. | ||||||||
| 2,325 | 5.38%, 07/15/2040 | 2,691 | ||||||
| Softbrands, Inc. | ||||||||
| 140 | 11.50%, 07/15/2018 | 155 | ||||||
| Sprint Communications, Inc. | ||||||||
| 2,440 | 7.00%, 03/01/2020 ■ | 2,722 | ||||||
| 900 | 9.00%, 11/15/2018 ■ | 1,058 | ||||||
| Sprint Corp. | ||||||||
| 300 | 7.13%, 06/15/2024 ■ | 308 | ||||||
| 3,410 | 7.25%, 09/15/2021 ■ | 3,606 | ||||||
| 4,270 | 7.88%, 09/15/2023 ■ | 4,623 | ||||||
| Syniverse Holdings, Inc. | ||||||||
| 2,025 | 9.13%, 01/15/2019 | 2,126 | ||||||
| Telefonica Emisiones SAU | ||||||||
| 2,875 | 7.05%, 06/20/2036 | 3,691 | ||||||
| T-Mobile USA, Inc. | ||||||||
| 210 | 5.25%, 09/01/2018 | 218 | ||||||
| 180 | 6.13%, 01/15/2022 | 187 | ||||||
| 890 | 6.46%, 04/28/2019 | 928 | ||||||
| 260 | 6.50%, 01/15/2024 | 272 | ||||||
| 2,380 | 6.63%, 04/28/2021 | 2,508 | ||||||
| 1,030 | 6.73%, 04/28/2022 | 1,089 | ||||||
| 145 | 6.84%, 04/28/2023 | 153 | ||||||
| Unitymedia Hessen GmbH & Co. | ||||||||
| 1,800 | 5.50%, 01/15/2023 ■ | 1,877 | ||||||
| UPCB Finance V Ltd. | ||||||||
| 475 | 7.25%, 11/15/2021 ■ | 523 | ||||||
| UPCB Finance VI Ltd. | ||||||||
| 470 | 6.88%, 01/15/2022 ■ | 514 | ||||||
| Verint Systems, Inc. | ||||||||
| 626 | 1.50%, 06/01/2021 β | 698 | ||||||
| Verizon Communications, Inc. | ||||||||
| 11,683 | 2.63%, 02/21/2020 ■ | 11,621 | ||||||
| 2,765 | 3.00%, 11/01/2021 | 2,744 | ||||||
| 4,575 | 3.45%, 03/15/2021 | 4,674 | ||||||
| 5,010 | 3.50%, 11/01/2024 | 4,931 | ||||||
| 9,825 | 4.15%, 03/15/2024 | 10,219 | ||||||
| 1,813 | 4.86%, 08/21/2046 ■ | 1,849 | ||||||
| 5,380 | 5.01%, 08/21/2054 ■ | 5,475 | ||||||
| 9,770 | 5.15%, 09/15/2023 | 10,941 | ||||||
| 1,150 | 6.35%, 04/01/2019 | 1,341 | ||||||
| 6,370 | 6.40%, 09/15/2033 - 02/15/2038 | 7,773 | ||||||
| 15,335 | 6.55%, 09/15/2043 | 19,331 | ||||||
| 2,300 | 6.90%, 04/15/2038 | 2,971 | ||||||
| Videotron Ltd. | ||||||||
| 245 | 5.00%, 07/15/2022 | 252 | ||||||
| Vodafone Group plc | ||||||||
| 2,000 | 1.25%, 09/26/2017 | 1,980 | ||||||
| 2,100 | 1.50%, 02/19/2018 | 2,071 | ||||||
| Wind Acquisition Finance S.A. | ||||||||
| EUR | 3,855 | 4.00%, 07/15/2020 ■ | 4,758 | |||||
| 225 | 6.50%, 04/30/2020 ■ | 234 | ||||||
| Windstream Corp. | ||||||||
| 615 | 6.38%, 08/01/2023 | 620 | ||||||
| 280 | 7.50%, 06/01/2022 | 297 | ||||||
| 480 | 7.75%, 10/15/2020 | 511 | ||||||
| 165 | 8.13%, 09/01/2018 | 172 | ||||||
| Zayo Group LLC | ||||||||
| 755 | 8.13%, 01/01/2020 | 806 | ||||||
| 60 | 10.13%, 07/01/2020 | 67 | ||||||
| 204,750 | ||||||||
| Leather and Allied Product Manufacturing - 0.0% | ||||||||
| Nike, Inc. | ||||||||
| 1,940 | 3.63%, 05/01/2043 | 1,865 | ||||||
| Machinery Manufacturing - 0.3% | ||||||||
| Case New Holland Industrial, Inc. | ||||||||
| 290 | 7.88%, 12/01/2017 | 326 | ||||||
| Caterpillar, Inc. | ||||||||
| 1,920 | 3.40%, 05/15/2024 | 1,962 | ||||||
| Hutchison Whampoa International Ltd. | ||||||||
| 9,650 | 1.63%, 10/31/2017 ■ | 9,634 | ||||||
| 2,800 | 2.00%, 11/08/2017 ■ | 2,819 | ||||||
| 965 | 3.50%, 01/13/2017 ■ | 1,007 | ||||||
| 900 | 5.75%, 09/11/2019 ■ | 1,031 | ||||||
| Perusahaan Listrik Negara | ||||||||
| 200 | 5.50%, 11/22/2021 ■ | 212 | ||||||
| 16,991 | ||||||||
| Mining - 0.6% | ||||||||
| AK Steel Corp. | ||||||||
| 3,275 | 7.63%, 05/15/2020 - 10/01/2021 | 3,292 | ||||||
| 795 | 8.38%, 04/01/2022 | 811 | ||||||
| Barrick Gold Corp. | ||||||||
| 2,450 | 4.10%, 05/01/2023 | 2,368 | ||||||
| Barrick North America Finance LLC | ||||||||
| 1,625 | 4.40%, 05/30/2021 | 1,667 | ||||||
| 3,850 | 5.75%, 05/01/2043 | 3,724 | ||||||
| BHP Billiton Finance USA Ltd. | ||||||||
| 1,850 | 5.00%, 09/30/2043 | 2,066 | ||||||
| Codelco, Inc. | ||||||||
| 100 | 3.75%, 11/04/2020 ■ | 103 | ||||||
| 115 | 3.75%, 11/04/2020 § | 118 | ||||||
| 235 | 3.88%, 11/03/2021 § | 243 | ||||||
| Falconbridge Ltd. | ||||||||
| 75 | 5.38%, 06/01/2015 | 77 | ||||||
| 75 | 6.00%, 10/15/2015 | 78 | ||||||
| FMG Resources Aug 2006 | ||||||||
| 5,760 | 6.88%, 04/01/2022 ■ | 5,947 | ||||||
| Freeport-McMoRan Copper & Gold, Inc. | ||||||||
| 4,665 | 3.55%, 03/01/2022 | 4,559 | ||||||
| 300 | 5.45%, 03/15/2043 | 307 | ||||||
| Glencore Funding LLC | ||||||||
| 2,225 | 2.50%, 01/15/2019 ■ | 2,207 | ||||||
| Newmont Mining Corp. | ||||||||
| 150 | 4.88%, 03/15/2042 | 126 | ||||||
| Rio Tinto Finance USA Ltd. | ||||||||
| 1,100 | 3.50%, 11/02/2020 | 1,142 | ||||||
| Steel Dynamics, Inc. | ||||||||
| 665 | 5.13%, 10/01/2021 ■ | 688 | ||||||
| 730 | 5.50%, 10/01/2024 ■ | 772 | ||||||
| 30,295 | ||||||||
The accompanying notes are an integral part of these financial statements.
| 16 |
| The Hartford Balanced Income Fund |
| Schedule of Investments – (continued) |
| October 31, 2014 |
| (000’s Omitted) |
| Shares or Principal Amount ╬ | Market Value ╪ | |||||||
| Corporate Bonds - 43.3% - (continued) | ||||||||
| Miscellaneous Manufacturing - 0.1% | ||||||||
| DigitalGlobe, Inc. | ||||||||
| $ | 690 | 5.25%, 02/01/2021 ■ | $ | 671 | ||||
| S.C. Johnson & Son, Inc. | ||||||||
| 2,520 | 4.00%, 05/15/2043 ■ | 2,384 | ||||||
| United Technologies Corp. | ||||||||
| 1,925 | 4.50%, 06/01/2042 | 2,055 | ||||||
| 950 | 6.13%, 07/15/2038 | 1,232 | ||||||
| 6,342 | ||||||||
| Motor Vehicle and Parts Manufacturing - 0.6% | ||||||||
| American Axle & Manufacturing Holdings, Inc. | ||||||||
| 295 | 6.63%, 10/15/2022 | 315 | ||||||
| Chrysler Group LLC | ||||||||
| 1,790 | 8.00%, 06/15/2019 | 1,918 | ||||||
| 2,990 | 8.25%, 06/15/2021 | 3,341 | ||||||
| Daimler Finance NA LLC | ||||||||
| 6,460 | 1.38%, 08/01/2017 ■ | 6,446 | ||||||
| 7,300 | 3.25%, 08/01/2024 ■ | 7,312 | ||||||
| Ford Motor Co. | ||||||||
| 370 | 7.45%, 07/16/2031 | 496 | ||||||
| General Motors Co. | ||||||||
| 1,405 | 4.88%, 10/02/2023 | 1,505 | ||||||
| 1,436 | 6.25%, 10/02/2043 | 1,709 | ||||||
| General Motors Financial Co., Inc. | ||||||||
| 7,860 | 3.50%, 07/10/2019 | 8,102 | ||||||
| TRW Automotive, Inc. | ||||||||
| 375 | 7.25%, 03/15/2017 ■ | 412 | ||||||
| 31,556 | ||||||||
| Nonmetallic Mineral Product Manufacturing - 0.1% | ||||||||
| Ardagh Finance Holdings S.A. | ||||||||
| 740 | 8.63%, 06/15/2019 ■ | 757 | ||||||
| Ardagh Packaging Finance plc | ||||||||
| 1,015 | 6.00%, 06/30/2021 ■ | 1,001 | ||||||
| 72 | 7.00%, 11/15/2020 ■ | 74 | ||||||
| 240 | 9.13%, 10/15/2020 ■ | 258 | ||||||
| Cemex Finance LLC | ||||||||
| 1,660 | 6.00%, 04/01/2024 ■ | 1,693 | ||||||
| Cemex S.A.B. de C.V. | ||||||||
| 2,290 | 5.70%, 01/11/2025 ■ | 2,243 | ||||||
| Silgan Holdings, Inc. | ||||||||
| 500 | 5.00%, 04/01/2020 | 510 | ||||||
| 6,536 | ||||||||
| Other Services - 0.3% | ||||||||
| Abengoa Finance | ||||||||
| EUR | 2,395 | 6.00%, 03/31/2021 ■ | 2,919 | |||||
| 850 | 7.75%, 02/01/2020 ■ | 888 | ||||||
| Abengoa Greenfield S.A. | ||||||||
| 1,770 | 6.50%, 10/01/2019 ■ | 1,774 | ||||||
| Delphi Corp. | ||||||||
| 1,875 | 4.15%, 03/15/2024 | 1,924 | ||||||
| 2,510 | 5.00%, 02/15/2023 | 2,689 | ||||||
| Service Corp. International | ||||||||
| 960 | 4.50%, 11/15/2020 | 941 | ||||||
| 1,185 | 5.38%, 01/15/2022 | 1,227 | ||||||
| 120 | 6.75%, 04/01/2016 | 127 | ||||||
| 885 | 7.63%, 10/01/2018 | 991 | ||||||
| Sonic Automotive, Inc. | ||||||||
| 590 | 7.00%, 07/15/2022 | 643 | ||||||
| 14,123 | ||||||||
| Petroleum and Coal Products Manufacturing - 3.1% | ||||||||
| Anadarko Petroleum Corp. | ||||||||
| 1,485 | 3.45%, 07/15/2024 | 1,464 | ||||||
| 1,250 | 4.50%, 07/15/2044 | 1,228 | ||||||
| 1,650 | 5.95%, 09/15/2016 | 1,793 | ||||||
| 1,300 | 6.45%, 09/15/2036 | 1,604 | ||||||
| 2,110 | 8.70%, 03/15/2019 | 2,646 | ||||||
| Antero Resources Corp. | ||||||||
| 340 | 5.38%, 11/01/2021 | 345 | ||||||
| Antero Resources Finance Corp. | ||||||||
| 1,250 | 6.00%, 12/01/2020 | 1,300 | ||||||
| Apache Corp. | ||||||||
| 755 | 4.25%, 01/15/2044 | 700 | ||||||
| 1,045 | 4.75%, 04/15/2043 | 1,047 | ||||||
| Bonanza Creek Energy, Inc. | ||||||||
| 1,880 | 6.75%, 04/15/2021 | 1,885 | ||||||
| California Resources Corp. | ||||||||
| 3,945 | 5.00%, 01/15/2020 ■ | 4,004 | ||||||
| Canadian Natural Resources Ltd. | ||||||||
| 5,930 | 3.80%, 04/15/2024 | 5,967 | ||||||
| Chesapeake Energy Corp. | ||||||||
| 160 | 6.63%, 08/15/2020 | 181 | ||||||
| 255 | 6.88%, 11/15/2020 | 291 | ||||||
| CNOOC Finance 2012 Ltd. | ||||||||
| 2,466 | 3.88%, 05/02/2022 ■ | 2,521 | ||||||
| 430 | 5.00%, 05/02/2042 § | 466 | ||||||
| CNPC General Capital | ||||||||
| 2,270 | 1.95%, 04/16/2018 ■ | 2,236 | ||||||
| 1,900 | 2.75%, 04/19/2017 ■ | 1,934 | ||||||
| CNPC HK Overseas Capital Ltd. | ||||||||
| 315 | 4.50%, 04/28/2021 ■ | 337 | ||||||
| Cobalt International Energy, Inc. | ||||||||
| 795 | 2.63%, 12/01/2019 β | 591 | ||||||
| Concho Resources, Inc. | ||||||||
| 1,400 | 5.50%, 10/01/2022 - 04/01/2023 | 1,479 | ||||||
| ConocoPhillips | ||||||||
| 1,775 | 6.50%, 02/01/2039 | 2,354 | ||||||
| Continental Resources, Inc. | ||||||||
| 3,155 | 3.80%, 06/01/2024 | 3,117 | ||||||
| 1,550 | 4.90%, 06/01/2044 | 1,531 | ||||||
| Devon Energy Corp. | ||||||||
| 2,000 | 5.60%, 07/15/2041 | 2,260 | ||||||
| 260 | 7.95%, 04/15/2032 | 369 | ||||||
| Devon Financing Corp. | ||||||||
| 350 | 7.88%, 09/30/2031 | 488 | ||||||
| Diamondback Energy, Inc. | ||||||||
| 2,315 | 7.63%, 10/01/2021 | 2,460 | ||||||
| Empresa Nacional del Petroleo | ||||||||
| 615 | 4.38%, 10/30/2024 ■ | 609 | ||||||
| 100 | 4.75%, 12/06/2021 § | 104 | ||||||
| Enable Midstream Partners L.P. | ||||||||
| 5,100 | 3.90%, 05/15/2024 ■ | 5,100 | ||||||
| 65 | 5.00%, 05/15/2044 ■ | 66 | ||||||
| Enbridge, Inc. | ||||||||
| 3,385 | 3.50%, 06/10/2024 | 3,349 | ||||||
| 755 | 4.50%, 06/10/2044 | 742 | ||||||
| EnCana Corp. | ||||||||
| 1,100 | 3.90%, 11/15/2021 | 1,148 | ||||||
| 725 | 5.15%, 11/15/2041 | 775 | ||||||
| 3,000 | 6.50%, 08/15/2034 | 3,694 | ||||||
The accompanying notes are an integral part of these financial statements.
| 17 |
| The Hartford Balanced Income Fund |
| Schedule of Investments – (continued) |
| October 31, 2014 |
| (000’s Omitted) |
| Shares or Principal Amount ╬ | Market Value ╪ | |||||||
| Corporate Bonds - 43.3% - (continued) | ||||||||
| Petroleum and Coal Products Manufacturing - 3.1% - (continued) | ||||||||
| Everest Acquisition LLC | ||||||||
| $ | 1,520 | 9.38%, 05/01/2020 | $ | 1,661 | ||||
| Harvest Operations Corp. | ||||||||
| 520 | 6.88%, 10/01/2017 | 530 | ||||||
| Hess Corp. | ||||||||
| 1,735 | 1.30%, 06/15/2017 | 1,725 | ||||||
| 2,550 | 3.50%, 07/15/2024 | 2,533 | ||||||
| 1,150 | 5.60%, 02/15/2041 | 1,303 | ||||||
| 500 | 6.00%, 01/15/2040 | 584 | ||||||
| 1,325 | 7.30%, 08/15/2031 | 1,741 | ||||||
| KazMunayGas National Co. JSC | ||||||||
| 740 | 6.00%, 11/07/2044 ■☼ | 730 | ||||||
| 320 | 11.75%, 01/23/2015 § | 326 | ||||||
| Kosmos Energy Ltd. | ||||||||
| 325 | 7.88%, 08/01/2021 § | 299 | ||||||
| Lukoil International Finance B.V. | ||||||||
| 3,035 | 3.42%, 04/24/2018 ■ | 2,895 | ||||||
| Marathon Oil Corp. | ||||||||
| 3,310 | 2.80%, 11/01/2022 | 3,220 | ||||||
| MEG Energy Corp. | ||||||||
| 980 | 6.38%, 01/30/2023 ■ | 970 | ||||||
| Nexen, Inc. | ||||||||
| 400 | 6.40%, 05/15/2037 | 498 | ||||||
| 1,450 | 7.50%, 07/30/2039 | 2,037 | ||||||
| Pemex Project Funding Master Trust | ||||||||
| 195 | 6.63%, 06/15/2035 | 230 | ||||||
| Petrobras Global Finance Co. | ||||||||
| 398 | 7.25%, 03/17/2044 | 436 | ||||||
| Petrobras International Finance Co. | ||||||||
| 525 | 6.88%, 01/20/2040 | 550 | ||||||
| Petroleos de Venezuela S.A. | ||||||||
| 3,645 | 5.25%, 04/12/2017 § | 2,417 | ||||||
| 15,241 | 6.00%, 05/16/2024 - 11/15/2026 § | 7,722 | ||||||
| 755 | 8.50%, 11/02/2017 § | 572 | ||||||
| 1,980 | 9.00%, 11/17/2021 § | 1,255 | ||||||
| Petroleos Mexicanos | ||||||||
| 400 | 4.25%, 01/15/2025 ■ | 405 | ||||||
| 645 | 4.88%, 01/18/2024 | 682 | ||||||
| 1,445 | 5.50%, 06/27/2044 ■ | 1,506 | ||||||
| 500 | 6.38%, 01/23/2045 | 574 | ||||||
| 1,245 | 6.50%, 06/02/2041 | 1,457 | ||||||
| Plains Exploration & Production Co. | ||||||||
| 10,813 | 6.63%, 05/01/2021 | 11,826 | ||||||
| 603 | 6.88%, 02/15/2023 | 682 | ||||||
| Range Resources Corp. | ||||||||
| 205 | 5.00%, 08/15/2022 | 215 | ||||||
| 430 | 5.75%, 06/01/2021 | 453 | ||||||
| 15 | 6.75%, 08/01/2020 | 16 | ||||||
| Ras Laffan Liquefied Natural Gas Co., Ltd. | ||||||||
| 758 | 5.83%, 09/30/2016 ■ | 798 | ||||||
| Reliance Holdings USA, Inc. | ||||||||
| 255 | 5.40%, 02/14/2022 ■ | 278 | ||||||
| 250 | 5.40%, 02/14/2022 § | 272 | ||||||
| Rosetta Resources, Inc. | ||||||||
| 1,320 | 5.63%, 05/01/2021 | 1,281 | ||||||
| 595 | 5.88%, 06/01/2022 | 571 | ||||||
| San Diego Gas & Electric Co. | ||||||||
| 4,770 | 3.60%, 09/01/2023 | 5,021 | ||||||
| Seadrill Ltd. | ||||||||
| 940 | 6.13%, 09/15/2017 ■ | 915 | ||||||
| Sempra Energy | ||||||||
| 5,000 | 3.55%, 06/15/2024 | 5,102 | ||||||
| 3,135 | 4.05%, 12/01/2023 | 3,329 | ||||||
| Shell International Finance B.V. | ||||||||
| 4,040 | 2.00%, 11/15/2018 | 4,073 | ||||||
| 2,650 | 4.55%, 08/12/2043 | 2,845 | ||||||
| 2,400 | 6.38%, 12/15/2038 | 3,178 | ||||||
| Statoil ASA | ||||||||
| 4,125 | 2.90%, 11/08/2020 | 4,231 | ||||||
| Tosco Corp. | ||||||||
| 500 | 8.13%, 02/15/2030 | 736 | ||||||
| Total Capital International S.A. | ||||||||
| 3,065 | 2.88%, 02/17/2022 | 3,066 | ||||||
| Transocean, Inc. | ||||||||
| 1,000 | 6.38%, 12/15/2021 | 1,051 | ||||||
| 500 | 6.50%, 11/15/2020 | 514 | ||||||
| Tullow Oil plc | ||||||||
| 1,490 | 6.00%, 11/01/2020 ■ | 1,393 | ||||||
| 1,625 | 6.25%, 04/15/2022 ■ | 1,511 | ||||||
| Williams Partners L.P. | ||||||||
| 2,295 | 3.35%, 08/15/2022 | 2,237 | ||||||
| 6,750 | 3.90%, 01/15/2025 | 6,696 | ||||||
| 2,330 | 4.30%, 03/04/2024 | 2,411 | ||||||
| 2,000 | 5.40%, 03/04/2044 | 2,090 | ||||||
| 750 | 6.30%, 04/15/2040 | 866 | ||||||
| WPX Energy, Inc. | ||||||||
| 2,325 | 5.25%, 09/15/2024 ☼ | 2,267 | ||||||
| 615 | 6.00%, 01/15/2022 | 644 | ||||||
| 171,611 | ||||||||
| Pipeline Transportation - 0.6% | ||||||||
| DCP Midstream LLC | ||||||||
| 600 | 4.75%, 09/30/2021 ■ | 646 | ||||||
| El Paso Corp. | ||||||||
| 255 | 6.50%, 09/15/2020 | 290 | ||||||
| 494 | 7.00%, 06/15/2017 | 550 | ||||||
| El Paso Natural Gas Co. | ||||||||
| 15 | 7.25%, 06/01/2018 | 17 | ||||||
| Energy Transfer Equity L.P. | ||||||||
| 3,655 | 3.60%, 02/01/2023 | 3,581 | ||||||
| 2,900 | 4.15%, 10/01/2020 | 3,023 | ||||||
| 660 | 5.20%, 02/01/2022 | 722 | ||||||
| 835 | 6.13%, 02/15/2017 | 917 | ||||||
| 125 | 6.63%, 10/15/2036 | 146 | ||||||
| 1,425 | 7.50%, 10/15/2020 - 07/01/2038 | 1,755 | ||||||
| Enterprise Products Operating LLC | ||||||||
| 4,450 | 3.35%, 03/15/2023 | 4,412 | ||||||
| 2,050 | 4.85%, 03/15/2044 | 2,111 | ||||||
| 480 | 4.95%, 10/15/2054 | 489 | ||||||
| 1,300 | 5.95%, 02/01/2041 | 1,552 | ||||||
| Kinder Morgan Energy Partners L.P. | ||||||||
| 4,500 | 5.00%, 08/15/2042 | 4,181 | ||||||
| Kinder Morgan Finance Co. | ||||||||
| 110 | 5.70%, 01/05/2016 | 115 | ||||||
| 45 | 6.00%, 01/15/2018 ■ | 49 | ||||||
| MarkWest Energy Partners L.P. | ||||||||
| 175 | 5.50%, 02/15/2023 | 186 | ||||||
| 88 | 6.25%, 06/15/2022 | 95 | ||||||
The accompanying notes are an integral part of these financial statements.
| 18 |
| The Hartford Balanced Income Fund |
| Schedule of Investments – (continued) |
| October 31, 2014 |
| (000’s Omitted) |
| Shares or Principal Amount ╬ | Market Value ╪ | |||||||
| Corporate Bonds - 43.3% - (continued) | ||||||||
| Pipeline Transportation - 0.6% - (continued) | ||||||||
| Plains All American Pipeline L.P. | ||||||||
| $ | 980 | 2.85%, 01/31/2023 | $ | 942 | ||||
| 1,375 | 3.85%, 10/15/2023 | 1,400 | ||||||
| Sunoco Logistics Partners Operations L.P. | ||||||||
| 980 | 4.25%, 04/01/2024 | 1,006 | ||||||
| 1,830 | 5.30%, 04/01/2044 | 1,893 | ||||||
| 30,078 | ||||||||
| Plastics and Rubber Products Manufacturing - 0.0% | ||||||||
| Associated Materials LLC | ||||||||
| 310 | 9.13%, 11/01/2017 | 303 | ||||||
| Continental Rubber of America Corp. | ||||||||
| 400 | 4.50%, 09/15/2019 ■ | 418 | ||||||
| Nortek, Inc. | ||||||||
| 1,155 | 8.50%, 04/15/2021 | 1,242 | ||||||
| 1,963 | ||||||||
| Primary Metal Manufacturing - 0.2% | ||||||||
| ArcelorMittal | ||||||||
| 2,475 | 5.00%, 02/25/2017 | 2,586 | ||||||
| 540 | 7.25%, 03/01/2041 | 558 | ||||||
| 900 | 7.50%, 10/15/2039 | 961 | ||||||
| Goldcorp, Inc. | ||||||||
| 5,555 | 3.63%, 06/09/2021 | 5,563 | ||||||
| Novelis, Inc. | ||||||||
| 125 | 8.38%, 12/15/2017 | 131 | ||||||
| United States Steel Corp. | ||||||||
| 1,752 | 7.38%, 04/01/2020 | 1,962 | ||||||
| 11,761 | ||||||||
| Printing and Related Support Activities - 0.1% | ||||||||
| Deluxe Corp. | ||||||||
| 640 | 6.00%, 11/15/2020 | 662 | ||||||
| Quad Graphics, Inc. | ||||||||
| 1,985 | 7.00%, 05/01/2022 ■ | 1,906 | ||||||
| Quebecor Media, Inc. | ||||||||
| 335 | 5.75%, 01/15/2023 | 345 | ||||||
| 2,913 | ||||||||
| Professional, Scientific and Technical Services - 0.1% | ||||||||
| Getty Images, Inc. | ||||||||
| 2,920 | 7.00%, 10/15/2020 ■ | 2,249 | ||||||
| Lamar Media Corp. | ||||||||
| 625 | 5.00%, 05/01/2023 | 625 | ||||||
| 95 | 5.88%, 02/01/2022 | 100 | ||||||
| Lender Processing Services, Inc. | ||||||||
| 330 | 5.75%, 04/15/2023 | 350 | ||||||
| SunGard Data Systems, Inc. | ||||||||
| 1,645 | 6.63%, 11/01/2019 | 1,702 | ||||||
| 486 | 7.38%, 11/15/2018 | 507 | ||||||
| 45 | 7.63%, 11/15/2020 | 48 | ||||||
| 5,581 | ||||||||
| Rail Transportation - 0.3% | ||||||||
| Burlington Northern Santa Fe Corp. | ||||||||
| 2,131 | 3.00%, 03/15/2023 | 2,101 | ||||||
| 2,980 | 3.05%, 09/01/2022 | 2,976 | ||||||
| 3,825 | 3.85%, 09/01/2023 | 3,987 | ||||||
| Canadian Pacific Railway Co. | ||||||||
| 1,000 | 4.45%, 03/15/2023 | 1,100 | ||||||
| 1,415 | 4.50%, 01/15/2022 | 1,559 | ||||||
| 1,596 | 6.50%, 05/15/2018 | 1,842 | ||||||
| CSX Corp. | ||||||||
| 1,000 | 4.75%, 05/30/2042 | 1,053 | ||||||
| Union Pacific Corp. | ||||||||
| 765 | 4.85%, 06/15/2044 | 847 | ||||||
| 15,465 | ||||||||
| Real Estate, Rental and Leasing - 1.1% | ||||||||
| Air Lease Corp. | ||||||||
| 425 | 2.13%, 01/15/2018 | 420 | ||||||
| 7,770 | 4.50%, 01/15/2016 | 8,023 | ||||||
| 5,495 | 5.63%, 04/01/2017 Δ | 5,921 | ||||||
| Boston Properties L.P. | ||||||||
| 2,580 | 3.13%, 09/01/2023 | 2,505 | ||||||
| Duke Realty L.P. | ||||||||
| 2,200 | 3.63%, 04/15/2023 | 2,169 | ||||||
| 7,311 | 3.88%, 02/15/2021 - 10/15/2022 | 7,503 | ||||||
| 895 | 6.75%, 03/15/2020 | 1,057 | ||||||
| ERAC USA Finance Co. | ||||||||
| 105 | 2.35%, 10/15/2019 ■ | 104 | ||||||
| 925 | 2.80%, 11/01/2018 ■ | 948 | ||||||
| 1,370 | 3.30%, 10/15/2022 ■ | 1,365 | ||||||
| 1,000 | 5.63%, 03/15/2042 ■ | 1,138 | ||||||
| ERP Operating L.P. | ||||||||
| 1,275 | 4.50%, 07/01/2044 | 1,279 | ||||||
| Hertz Corp. | ||||||||
| 275 | 6.75%, 04/15/2019 | 287 | ||||||
| Hertz Global Holdings, Inc. | ||||||||
| 195 | 5.88%, 10/15/2020 | 196 | ||||||
| 130 | 6.25%, 10/15/2022 | 133 | ||||||
| International Lease Finance Corp. | ||||||||
| 1,250 | 5.88%, 04/01/2019 - 08/15/2022 | 1,353 | ||||||
| 3,350 | 6.25%, 05/15/2019 | 3,664 | ||||||
| 350 | 7.13%, 09/01/2018 ■ | 396 | ||||||
| 380 | 8.75%, 03/15/2017 | 428 | ||||||
| Kennedy-Wilson, Inc. | ||||||||
| 9,585 | 8.75%, 04/01/2019 | 10,184 | ||||||
| Penske Automotive Group, Inc. | ||||||||
| 2,700 | 3.13%, 05/11/2015 ■ | 2,731 | ||||||
| ProLogis L.P. | ||||||||
| 1,500 | 3.35%, 02/01/2021 | 1,516 | ||||||
| 6,500 | 4.25%, 08/15/2023 | 6,774 | ||||||
| Realogy Corp. | ||||||||
| 673 | 7.63%, 01/15/2020 ■ | 730 | ||||||
| 60,824 | ||||||||
| Retail Trade - 1.2% | ||||||||
| 99 Cents Only Stores | ||||||||
| 1,437 | 11.00%, 12/15/2019 | 1,556 | ||||||
| Albertson's Holdings LLC | ||||||||
| 1,550 | 7.75%, 10/15/2022 ■ | 1,527 | ||||||
| American Builders & Contractors Supply Co., Inc. | ||||||||
| 190 | 5.63%, 04/15/2021 ■ | 192 | ||||||
| AutoZone, Inc. | ||||||||
| 1,823 | 3.70%, 04/15/2022 | 1,866 | ||||||
| 700 | 7.13%, 08/01/2018 | 820 | ||||||
| Building Materials Corp. | ||||||||
| 2,870 | 5.38%, 11/15/2024 ■☼ | 2,877 | ||||||
| 200 | 6.75%, 05/01/2021 ■ | 215 | ||||||
| Eaton Corp. | ||||||||
| 2,800 | 2.75%, 11/02/2022 | 2,721 | ||||||
| Energy Transfer Partners | ||||||||
| 2,000 | 6.70%, 07/01/2018 | 2,295 | ||||||
| GRD Holding III Corp. | ||||||||
| 2,255 | 10.75%, 06/01/2019 ■ | 2,489 | ||||||
The accompanying notes are an integral part of these financial statements.
| 19 |
| The Hartford Balanced Income Fund |
| Schedule of Investments – (continued) |
| October 31, 2014 |
| (000’s Omitted) |
| Shares or Principal Amount ╬ | Market Value ╪ | |||||||
| Corporate Bonds - 43.3% - (continued) | ||||||||
| Retail Trade - 1.2% - (continued) | ||||||||
| Home Depot, Inc. | ||||||||
| $ | 220 | 4.20%, 04/01/2043 | $ | 225 | ||||
| 1,265 | 4.88%, 02/15/2044 | 1,425 | ||||||
| 2,050 | 5.88%, 12/16/2036 | 2,589 | ||||||
| Jaguar Land Rover plc | ||||||||
| 375 | 8.13%, 05/15/2021 ■ | 413 | ||||||
| Kroger (The) Co. | ||||||||
| 2,750 | 2.95%, 11/01/2021 | 2,723 | ||||||
| 360 | 3.85%, 08/01/2023 | 370 | ||||||
| 1,580 | 5.15%, 08/01/2043 | 1,718 | ||||||
| Lowe's Cos., Inc. | ||||||||
| 1,510 | 5.00%, 09/15/2043 | 1,717 | ||||||
| Macy's Retail Holdings, Inc. | ||||||||
| 20 | 6.70%, 09/15/2028 | 24 | ||||||
| 20 | 7.00%, 02/15/2028 | 25 | ||||||
| Michaels Stores, Inc. | ||||||||
| 1,475 | 5.88%, 12/15/2020 ■ | 1,494 | ||||||
| Party City Holdings, Inc. | ||||||||
| 1,920 | 8.88%, 08/01/2020 | 2,083 | ||||||
| PC Nextco Holdings LLC/PC Nextco Finance, Inc. | ||||||||
| 1,150 | 8.75%, 08/15/2019 | 1,167 | ||||||
| Sally Holdings LLC | ||||||||
| 135 | 5.75%, 06/01/2022 | 144 | ||||||
| 225 | 6.88%, 11/15/2019 | 241 | ||||||
| Sotheby's | ||||||||
| 595 | 5.25%, 10/01/2022 ■ | 583 | ||||||
| Target Corp. | ||||||||
| 3,240 | 3.88%, 07/15/2020 | 3,488 | ||||||
| Wal-Mart Stores, Inc. | ||||||||
| 4,380 | 3.30%, 04/22/2024 ╦ | 4,474 | ||||||
| 6,500 | 4.00%, 04/11/2043 | 6,499 | ||||||
| 6,170 | 4.30%, 04/22/2044 | 6,431 | ||||||
| 1,000 | 5.00%, 10/25/2040 | 1,152 | ||||||
| 600 | 5.25%, 09/01/2035 | 709 | ||||||
| 703 | 5.63%, 04/15/2041 | 874 | ||||||
| 2,000 | 6.20%, 04/15/2038 | 2,625 | ||||||
| 2,800 | 6.50%, 08/15/2037 | 3,773 | ||||||
| 63,524 | ||||||||
| Soap, Cleaning Compound and Toilet Manufacturing - 0.1% | ||||||||
| Procter & Gamble Co. | ||||||||
| 1,200 | 5.55%, 03/05/2037 | 1,497 | ||||||
| Sun Products Corp. | ||||||||
| 2,500 | 7.75%, 03/15/2021 ■ | 1,850 | ||||||
| 3,347 | ||||||||
| Support Activities For Transportation - 0.0% | ||||||||
| GNL Quintero S.A. | ||||||||
| 380 | 4.63%, 07/31/2029 ■ | 392 | ||||||
| Transportation Equipment Manufacturing - 0.0% | ||||||||
| Huntington Ingalls Industries, Inc. | ||||||||
| 1,315 | 6.88%, 03/15/2018 | 1,374 | ||||||
| 106 | 7.13%, 03/15/2021 | 114 | ||||||
| 1,488 | ||||||||
| Truck Transportation - 0.3% | ||||||||
| Penske Truck Leasing Co. | ||||||||
| 5,000 | 2.50%, 03/15/2016 - 06/15/2019 ■ | 5,007 | ||||||
| 9,895 | 4.88%, 07/11/2022 ■ | 10,707 | ||||||
| 15,714 | ||||||||
| Utilities - 2.5% | ||||||||
| AES (The) Corp. | ||||||||
| 49 | 7.75%, 10/15/2015 | 52 | ||||||
| 123 | 8.00%, 10/15/2017 | 139 | ||||||
| AES Panama S.A. | ||||||||
| 15 | 6.35%, 12/21/2016 § | 15 | ||||||
| Appalachian Power Co. | ||||||||
| 75 | 4.40%, 05/15/2044 | 76 | ||||||
| Berkshire Hathaway Energy Co. | ||||||||
| 500 | 5.95%, 05/15/2037 | 617 | ||||||
| Carolina Power & Light Co. | ||||||||
| 2,060 | 4.10%, 05/15/2042 | 2,087 | ||||||
| Centrais Eletricas Brasileiras S.A. | ||||||||
| 960 | 5.75%, 10/27/2021 § | 976 | ||||||
| Comision Federal de Electricidad | ||||||||
| 370 | 4.88%, 01/15/2024 ■ | 390 | ||||||
| Commonwealth Edison Co. | ||||||||
| 1,505 | 6.95%, 07/15/2018 | 1,751 | ||||||
| Consolidated Edison Co. of NY | ||||||||
| 1,400 | 4.20%, 03/15/2042 | 1,404 | ||||||
| Dolphin Subsidiary II, Inc. | ||||||||
| 2,160 | 7.25%, 10/15/2021 | 2,295 | ||||||
| Dominion Resources, Inc. | ||||||||
| 5,000 | 1.05%, 11/01/2016 | 5,000 | ||||||
| 3,390 | 7.00%, 06/15/2038 | 4,554 | ||||||
| Duke Energy Corp. | ||||||||
| 1,350 | 3.55%, 09/15/2021 | 1,405 | ||||||
| 2,935 | 3.75%, 04/15/2024 | 3,046 | ||||||
| 3,000 | 3.95%, 10/15/2023 | 3,162 | ||||||
| 3,000 | 5.30%, 02/15/2040 | 3,598 | ||||||
| Duke Energy Indiana, Inc. | ||||||||
| 1,870 | 4.90%, 07/15/2043 | 2,152 | ||||||
| Duke Energy Ohio, Inc. | ||||||||
| 995 | 3.80%, 09/01/2023 | 1,052 | ||||||
| Duke Energy Progress, Inc. | ||||||||
| 6,475 | 2.80%, 05/15/2022 | 6,506 | ||||||
| E CL S.A. | ||||||||
| 100 | 5.63%, 01/15/2021 § | 108 | ||||||
| EDP Finance B.V. | ||||||||
| 760 | 5.25%, 01/14/2021 ■ | 789 | ||||||
| Electricitie De France | ||||||||
| 3,095 | 4.88%, 01/22/2044 ■ | 3,296 | ||||||
| 5,450 | 5.63%, 01/22/2024 ■♠ | 5,777 | ||||||
| Eskom Holdings Ltd. | ||||||||
| 800 | 5.75%, 01/26/2021 § | 826 | ||||||
| 235 | 6.75%, 08/06/2023 ■ | 253 | ||||||
| 1,460 | 6.75%, 08/06/2023 § | 1,571 | ||||||
| Exelon Generation Co. LLC | ||||||||
| 2,725 | 4.25%, 06/15/2022 | 2,844 | ||||||
| FirstEnergy Transmission LLC | ||||||||
| 7,475 | 5.45%, 07/15/2044 ■ | 7,697 | ||||||
| Florida Power & Light Co. | ||||||||
| 4,930 | 3.25%, 06/01/2024 | 5,040 | ||||||
| 1,300 | 4.13%, 02/01/2042 | 1,340 | ||||||
| GenOn Americas Generation LLC | ||||||||
| 785 | 9.13%, 05/01/2031 | 734 | ||||||
| National Power Corp. | ||||||||
| 15 | 9.63%, 05/15/2028 | 23 | ||||||
| Nevada Power Co. | ||||||||
| 2,140 | 6.50%, 08/01/2018 | 2,501 | ||||||
The accompanying notes are an integral part of these financial statements.
| 20 |
| The Hartford Balanced Income Fund |
| Schedule of Investments – (continued) |
| October 31, 2014 |
| (000’s Omitted) |
| Shares or Principal Amount ╬ | Market Value ╪ | |||||||
| Corporate Bonds - 43.3% - (continued) | ||||||||
| Utilities - 2.5% - (continued) | ||||||||
| NiSource Finance Corp. | ||||||||
| $ | 1,450 | 3.85%, 02/15/2023 | $ | 1,503 | ||||
| 3,450 | 4.80%, 02/15/2044 | 3,644 | ||||||
| 1,450 | 5.25%, 02/15/2043 | 1,582 | ||||||
| Northeast Utilities | ||||||||
| 2,775 | 2.80%, 05/01/2023 | 2,682 | ||||||
| Oncor Electric Delivery Co. LLC | ||||||||
| 2,000 | 4.10%, 06/01/2022 | 2,151 | ||||||
| 615 | 5.25%, 09/30/2040 | 724 | ||||||
| Pacific Gas & Electric Co. | ||||||||
| 625 | 2.45%, 08/15/2022 | 599 | ||||||
| 2,285 | 3.75%, 02/15/2024 | 2,370 | ||||||
| 2,400 | 6.05%, 03/01/2034 | 2,994 | ||||||
| 725 | 8.25%, 10/15/2018 | 884 | ||||||
| PacifiCorp | ||||||||
| 840 | 4.10%, 02/01/2042 | 855 | ||||||
| 1,000 | 5.50%, 01/15/2019 | 1,136 | ||||||
| Potomac Electric Power | ||||||||
| 2,700 | 4.15%, 03/15/2043 | 2,740 | ||||||
| PPL Capital Funding, Inc. | ||||||||
| 4,495 | 3.95%, 03/15/2024 | 4,670 | ||||||
| Progress Energy, Inc. | ||||||||
| 1,750 | 7.00%, 10/30/2031 | 2,346 | ||||||
| 3,051 | 7.05%, 03/15/2019 | 3,645 | ||||||
| 540 | 7.75%, 03/01/2031 | 769 | ||||||
| PSEG Power LLC | ||||||||
| 975 | 8.63%, 04/15/2031 | 1,408 | ||||||
| Public Service Co. of Colorado | ||||||||
| 1,930 | 3.60%, 09/15/2042 | 1,819 | ||||||
| Southern California Edison Co. | ||||||||
| 925 | 4.50%, 09/01/2040 | 1,000 | ||||||
| 500 | 6.00%, 01/15/2034 | 640 | ||||||
| 1,010 | 6.05%, 03/15/2039 | 1,310 | ||||||
| Southern Power Co. | ||||||||
| 15,293 | 4.88%, 07/15/2015 | 15,726 | ||||||
| 1,615 | 5.25%, 07/15/2043 | 1,806 | ||||||
| Tampa Electric Co. | ||||||||
| 2,095 | 2.60%, 09/15/2022 | 2,050 | ||||||
| Texas Competitive Electric Holdings Co. LLC | ||||||||
| 1,075 | 11.50%, 10/01/2020 ■Ϫ | 863 | ||||||
| Virginia Electric & Power Co. | ||||||||
| 665 | 4.45%, 02/15/2044 | 703 | ||||||
| 135,695 | ||||||||
| Wholesale Trade - 0.4% | ||||||||
| Dynegy, Inc. | ||||||||
| 450 | 5.88%, 06/01/2023 | 441 | ||||||
| 415 | 7.38%, 11/01/2022 ■ | 439 | ||||||
| 205 | 7.63%, 11/01/2024 ■ | 217 | ||||||
| HD Supply, Inc. | ||||||||
| 220 | 8.13%, 04/15/2019 | 238 | ||||||
| Heineken N.V. | ||||||||
| 3,585 | 3.40%, 04/01/2022 ■ | 3,648 | ||||||
| International Paper Co. | ||||||||
| 12,650 | 3.65%, 06/15/2024 | 12,508 | ||||||
| 775 | 4.80%, 06/15/2044 | 763 | ||||||
| 500 | 7.30%, 11/15/2039 | 655 | ||||||
| J.M. Huber Corp. | ||||||||
| 962 | 9.88%, 11/01/2019 ■ | 1,056 | ||||||
| SABMiller Holdings, Inc. | ||||||||
| 1,500 | 2.45%, 01/15/2017 ■ | 1,533 | ||||||
| 1,475 | 3.75%, 01/15/2022 ■ | 1,524 | ||||||
| 800 | 4.95%, 01/15/2042 ■ | 861 | ||||||
| 23,883 | ||||||||
| Total Corporate Bonds | ||||||||
| (Cost $2,314,723) | $ | 2,359,023 | ||||||
| Foreign Government Obligations - 5.2% | ||||||||
| Argentina - 0.1% | ||||||||
| Argentina (Republic of) | ||||||||
| $ | 7,120 | 0.00%, 10/03/2015 - 12/31/2038 ● | $ | 5,088 | ||||
| EUR | 303 | 0.00%, 12/31/2033 ● | 322 | |||||
| 3,470 | 8.28%, 12/31/2033 | 2,759 | ||||||
| $ | 8,169 | |||||||
| Azerbaijan - 0.0% | ||||||||
| Azerbaijan (Republic of) | ||||||||
| 1,210 | 4.75%, 03/18/2024 ■ | 1,260 | ||||||
| Brazil - 0.4% | ||||||||
| Brazil (Federative Republic of) | ||||||||
| 2,325 | 2.63%, 01/05/2023 | 2,142 | ||||||
| 8,265 | 5.00%, 01/27/2045 | 8,100 | ||||||
| BRL | 2,632 | 6.00%, 08/15/2050 ◄ | 1,073 | |||||
| 2,246 | 8.00%, 01/15/2018 | 2,485 | ||||||
| 3,159 | 8.25%, 01/20/2034 | 4,375 | ||||||
| BRL | 13,222 | 10.00%, 01/01/2021 - 01/01/2025 | 4,772 | |||||
| 22,947 | ||||||||
| Chile - 0.0% | ||||||||
| Chile (Republic of) | ||||||||
| 490 | 3.63%, 10/30/2042 | 443 | ||||||
| Colombia - 0.4% | ||||||||
| Colombia (Republic of) | ||||||||
| COP | 630,225 | 3.50%, 03/10/2021 ◄ | 315 | |||||
| 5,880 | 4.00%, 02/26/2024 | 6,033 | ||||||
| 3,245 | 4.38%, 07/12/2021 | 3,461 | ||||||
| COP | 484,458 | 4.75%, 02/23/2023 ◄ | 262 | |||||
| 370 | 5.63%, 02/26/2044 | 413 | ||||||
| 2,600 | 7.38%, 09/18/2037 | 3,504 | ||||||
| COP | 1,295,400 | 7.50%, 08/26/2026 | 659 | |||||
| COP | 1,450,000 | 7.75%, 04/14/2021 | 767 | |||||
| 1,539 | 8.13%, 05/21/2024 | 2,051 | ||||||
| COP | 10,000 | 9.85%, 06/28/2027 | 6 | |||||
| 85 | 10.38%, 01/28/2033 | 133 | ||||||
| 1,536 | 11.75%, 02/25/2020 | 2,185 | ||||||
| COP | 108,000 | 12.00%, 10/22/2015 | 56 | |||||
| 19,845 | ||||||||
| Croatia - 0.1% | ||||||||
| Croatia (Republic of) | ||||||||
| 460 | 6.25%, 04/27/2017 ■ | 492 | ||||||
| 1,720 | 6.25%, 04/27/2017 § | 1,842 | ||||||
| 520 | 6.63%, 07/14/2020 § | 577 | ||||||
| 255 | 6.75%, 11/05/2019 § | 283 | ||||||
| 3,194 | ||||||||
The accompanying notes are an integral part of these financial statements.
| 21 |
| The Hartford Balanced Income Fund |
| Schedule of Investments – (continued) |
| October 31, 2014 |
| (000’s Omitted) |
| Shares or Principal Amount ╬ | Market Value ╪ | |||||||
| Foreign Government Obligations - 5.2% - (continued) | ||||||||
| Dominican Republic - 0.1% | ||||||||
| Dominican (Republic of) | ||||||||
| $ | 595 | 6.60%, 01/28/2024 ■ | $ | 659 | ||||
| 1,420 | 7.45%, 04/30/2044 ■ | 1,587 | ||||||
| 235 | 7.45%, 04/30/2044 § | 263 | ||||||
| 250 | 7.50%, 05/06/2021 § | 284 | ||||||
| 2,793 | ||||||||
| Ecuador - 0.1% | ||||||||
| Ecuador (Republic of) | ||||||||
| 3,180 | 9.38%, 12/15/2015 § | 3,307 | ||||||
| Hungary - 0.1% | ||||||||
| Hungary (Republic of) | ||||||||
| 2,996 | 4.00%, 03/25/2019 | 3,069 | ||||||
| 1,518 | 4.13%, 02/19/2018 | 1,568 | ||||||
| 1,584 | 5.38%, 03/25/2024 | 1,695 | ||||||
| EUR | 550 | 5.75%, 06/11/2018 § | 776 | |||||
| 363 | 6.25%, 01/29/2020 | 408 | ||||||
| 7,516 | ||||||||
| Iceland - 0.0% | ||||||||
| Iceland (Republic of) | ||||||||
| 1,755 | 4.88%, 06/16/2016 § | 1,842 | ||||||
| 226 | 5.88%, 05/11/2022 ■ | 255 | ||||||
| 2,097 | ||||||||
| Indonesia - 0.6% | ||||||||
| Indonesia (Republic of) | ||||||||
| 3,766 | 3.75%, 04/25/2022 § | 3,747 | ||||||
| 6,515 | 4.88%, 05/05/2021 § | 6,963 | ||||||
| 1,340 | 5.25%, 01/17/2042 § | 1,343 | ||||||
| 465 | 5.38%, 10/17/2023 ■ | 511 | ||||||
| 260 | 5.38%, 10/17/2023 § | 286 | ||||||
| 2,120 | 5.88%, 03/13/2020 § | 2,372 | ||||||
| 6,106 | 6.63%, 02/17/2037 § | 7,129 | ||||||
| 2,650 | 7.75%, 01/17/2038 § | 3,488 | ||||||
| 3,157 | 8.50%, 10/12/2035 § | 4,404 | ||||||
| 1,365 | 11.63%, 03/04/2019 § | 1,829 | ||||||
| 32,072 | ||||||||
| Ivory Coast - 0.0% | ||||||||
| Cote d'Ivoire (Republic of) | ||||||||
| 1,595 | 5.38%, 07/23/2024 § | 1,535 | ||||||
| Jamaica - 0.0% | ||||||||
| Jamaica (Government of) | ||||||||
| 585 | 7.63%, 07/09/2025 | 625 | ||||||
| Kazakhstan - 0.0% | ||||||||
| Kazakhstan (Republic of) | ||||||||
| 1,435 | 3.88%, 10/14/2024 ■ | 1,410 | ||||||
| 715 | 4.88%, 10/14/2044 ■ | 690 | ||||||
| 2,100 | ||||||||
| Kenya - 0.0% | ||||||||
| Kenya (Republic of) | ||||||||
| 375 | 5.88%, 06/24/2019 ■ | 389 | ||||||
| 835 | 6.88%, 06/24/2024 ■ | 889 | ||||||
| 1,278 | ||||||||
| Latvia - 0.2% | ||||||||
| Latvia (Republic of) | ||||||||
| 1,095 | 2.75%, 01/12/2020 ■ | 1,083 | ||||||
| 5,340 | 2.75%, 01/12/2020 § | 5,280 | ||||||
| 385 | 5.25%, 02/22/2017 ■ | 419 | ||||||
| 2,340 | 5.25%, 02/22/2017 - 06/16/2021 § | 2,609 | ||||||
| 9,391 | ||||||||
| Lithuania - 0.1% | ||||||||
| Lithuania (Republic of) | ||||||||
| 2,160 | 6.13%, 03/09/2021 § | 2,517 | ||||||
| 4,435 | 7.38%, 02/11/2020 § | 5,366 | ||||||
| 7,883 | ||||||||
| Mexico - 0.6% | ||||||||
| Mexico (United Mexican States) | ||||||||
| 4,528 | 3.63%, 03/15/2022 | 4,641 | ||||||
| MXN | 9,852 | 4.50%, 12/04/2025 - 11/22/2035 ◄ | 862 | |||||
| 4,726 | 4.75%, 03/08/2044 | 4,799 | ||||||
| 6,252 | 5.55%, 01/21/2045 | 7,096 | ||||||
| 2,006 | 5.75%, 10/12/2110 | 2,124 | ||||||
| 6,224 | 6.05%, 01/11/2040 | 7,516 | ||||||
| 1,949 | 6.75%, 09/27/2034 | 2,517 | ||||||
| MXN | 26,330 | 10.00%, 12/05/2024 | 2,556 | |||||
| 32,111 | ||||||||
| Morocco - 0.1% | ||||||||
| Morocco (Kingdom of) | ||||||||
| EUR | 1,325 | 3.50%, 06/19/2024 § | 1,699 | |||||
| EUR | 460 | 4.50%, 10/05/2020 § | 636 | |||||
| 800 | 5.50%, 12/11/2042 § | 814 | ||||||
| 3,149 | ||||||||
| Panama - 0.1% | ||||||||
| Panama (Republic of) | ||||||||
| 450 | 4.00%, 09/22/2024 | 460 | ||||||
| 122 | 7.25%, 03/15/2015 | 125 | ||||||
| 651 | 8.88%, 09/30/2027 | 933 | ||||||
| 1,302 | 9.38%, 04/01/2029 | 1,946 | ||||||
| 3,464 | ||||||||
| Peru - 0.1% | ||||||||
| Peru (Republic of) | ||||||||
| PEN | 3,325 | 5.20%, 09/12/2023 | 1,122 | |||||
| 1,010 | 5.63%, 11/18/2050 | 1,141 | ||||||
| PEN | 1,450 | 6.95%, 08/12/2031 | 529 | |||||
| PEN | 75 | 7.84%, 08/12/2020 | 30 | |||||
| 1,455 | 8.38%, 05/03/2016 | 1,611 | ||||||
| 435 | 8.75%, 11/21/2033 | 669 | ||||||
| 25 | 9.88%, 02/06/2015 | 25 | ||||||
| 5,127 | ||||||||
| Philippines - 0.3% | ||||||||
| Philippines (Republic of) | ||||||||
| 1,910 | 5.50%, 03/30/2026 | 2,230 | ||||||
| 3,085 | 7.75%, 01/14/2031 | 4,381 | ||||||
| 1,165 | 8.38%, 06/17/2019 | 1,468 | ||||||
| 5,040 | 9.50%, 02/02/2030 | 8,045 | ||||||
| 1,080 | 10.63%, 03/16/2025 | 1,709 | ||||||
| 17,833 | ||||||||
| Poland - 0.1% | ||||||||
| Poland (Republic of) | ||||||||
| 765 | 4.00%, 01/22/2024 | 804 | ||||||
| 2,055 | 5.00%, 03/23/2022 | 2,309 | ||||||
| 3,113 | ||||||||
The accompanying notes are an integral part of these financial statements.
| 22 |
| The Hartford Balanced Income Fund |
| Schedule of Investments – (continued) |
| October 31, 2014 |
| (000’s Omitted) |
| Shares or Principal Amount ╬ | Market Value ╪ | |||||||
| Foreign Government Obligations - 5.2% - (continued) | ||||||||
| Romania - 0.2% | ||||||||
| Romania (Republic of) | ||||||||
| EUR | 1,395 | 3.63%, 04/24/2024 § | $ | 1,865 | ||||
| 1,372 | 4.38%, 08/22/2023 § | 1,429 | ||||||
| EUR | 355 | 4.63%, 09/18/2020 § | 506 | |||||
| 392 | 4.88%, 01/22/2024 ■ | 422 | ||||||
| 1,462 | 4.88%, 01/22/2024 § | 1,575 | ||||||
| EUR | 510 | 4.88%, 11/07/2019 § | 727 | |||||
| 894 | 6.13%, 01/22/2044 ■ | 1,047 | ||||||
| 1,420 | 6.13%, 01/22/2044 § | 1,663 | ||||||
| 2,666 | 6.75%, 02/07/2022 § | 3,194 | ||||||
| 12,428 | ||||||||
| Russia - 0.5% | ||||||||
| Russia (Federation of) | ||||||||
| 200 | 3.63%, 04/29/2015 ■ | 201 | ||||||
| 800 | 3.63%, 04/29/2015 § | 803 | ||||||
| 1,600 | 4.88%, 09/16/2023 ■ | 1,602 | ||||||
| 5,600 | 4.88%, 09/16/2023 § | 5,608 | ||||||
| 400 | 5.00%, 04/29/2020 § | 412 | ||||||
| 17,623 | 7.50%, 03/31/2030 § | 19,994 | ||||||
| 28,620 | ||||||||
| Slovenia - 0.1% | ||||||||
| Slovenia (Republic of) | ||||||||
| 1,210 | 5.25%, 02/18/2024 ■ | 1,303 | ||||||
| 995 | 5.50%, 10/26/2022 § | 1,093 | ||||||
| 1,045 | 5.85%, 05/10/2023 ■ | 1,173 | ||||||
| 3,569 | ||||||||
| South Africa - 0.1% | ||||||||
| South Africa (Republic of) | ||||||||
| ZAR | 20,800 | 7.00%, 02/28/2031 | 1,660 | |||||
| ZAR | 14,645 | 8.75%, 02/28/2048 | 1,340 | |||||
| 3,000 | ||||||||
| Sri Lanka - 0.0% | ||||||||
| Sri Lanka (Republic of) | ||||||||
| 230 | 5.13%, 04/11/2019 ■ | 237 | ||||||
| 2,235 | 6.00%, 01/14/2019 ■ | 2,369 | ||||||
| 2,606 | ||||||||
| Turkey - 0.4% | ||||||||
| Turkey (Republic of) | ||||||||
| 545 | 5.13%, 03/25/2022 | 579 | ||||||
| 4,370 | 5.63%, 03/30/2021 ☼ | 4,785 | ||||||
| 3,210 | 5.75%, 03/22/2024 | 3,545 | ||||||
| 2,983 | 6.75%, 04/03/2018 | 3,333 | ||||||
| 2,970 | 7.00%, 09/26/2016 | 3,247 | ||||||
| 1,990 | 7.38%, 02/05/2025 | 2,460 | ||||||
| 4,125 | 7.50%, 07/14/2017 | 4,641 | ||||||
| 22,590 | ||||||||
| Ukraine - 0.1% | ||||||||
| Ukraine (Government of) | ||||||||
| 350 | 6.25%, 06/17/2016 ■ | 312 | ||||||
| 1,300 | 6.25%, 06/17/2016 § | 1,157 | ||||||
| 2,320 | 6.58%, 11/21/2016 § | 2,042 | ||||||
| 105 | 6.88%, 09/23/2015 § | 96 | ||||||
| 600 | 7.95%, 02/23/2021 § | 527 | ||||||
| 4,134 | ||||||||
| Uruguay - 0.1% | ||||||||
| Uruguay (Republic of) | ||||||||
| 545 | 4.13%, 11/20/2045 | 476 | ||||||
| 4,749 | 4.50%, 08/14/2024 | 5,010 | ||||||
| 2,087 | 5.10%, 06/18/2050 | 2,069 | ||||||
| 7,555 | ||||||||
| Venezuela - 0.2% | ||||||||
| Venezuela (Republic of) | ||||||||
| 2,355 | 6.00%, 12/09/2020 § | 1,401 | ||||||
| 3,110 | 7.75%, 10/13/2019 § | 2,014 | ||||||
| 3,280 | 9.25%, 05/07/2028 § | 2,083 | ||||||
| 3,080 | 9.38%, 01/13/2034 | 1,971 | ||||||
| 1,085 | 11.95%, 08/05/2031 § | 789 | ||||||
| 8,258 | ||||||||
| Total Foreign Government Obligations | ||||||||
| (Cost $278,989) | $ | 284,012 | ||||||
| Municipal Bonds - 0.3% | ||||||||
| General Obligations - 0.2% | ||||||||
| California State GO, | ||||||||
| $ | 725 | 7.30%, 10/01/2039 | $ | 1,039 | ||||
| 1,730 | 7.60%, 11/01/2040 | 2,627 | ||||||
| 550 | 7.63%, 03/01/2040 | 821 | ||||||
| California State GO, Taxable, | ||||||||
| 2,795 | 7.55%, 04/01/2039 | 4,198 | ||||||
| Illinois State GO, | ||||||||
| 155 | 5.10%, 06/01/2033 | 152 | ||||||
| 585 | 5.67%, 03/01/2018 | 645 | ||||||
| 9,482 | ||||||||
| Higher Education (Univ., Dorms, etc.) - 0.0% | ||||||||
| Massachusetts State Development Fin Agency Rev, | ||||||||
| 110 | 5.35%, 12/01/2028 | 122 | ||||||
| Miscellaneous - 0.0% | ||||||||
| California State Public Works Board Lease Rev, | ||||||||
| 50 | 8.36%, 10/01/2034 | 72 | ||||||
| Transportation - 0.1% | ||||||||
| Grand Parkway Transportation Corp TX, Toll Rev, | ||||||||
| 1,195 | 5.18%, 10/01/2042 | 1,414 | ||||||
| New Jersey State Turnpike Auth, Taxable, | ||||||||
| 50 | 7.41%, 01/01/2040 | 73 | ||||||
| New York & New Jersey PA, | ||||||||
| 1,850 | 4.46%, 10/01/2062 | 1,864 | ||||||
| 15 | 4.93%, 10/01/2051 | 16 | ||||||
| 900 | 4.96%, 08/01/2046 | 1,001 | ||||||
| 4,165 | 5.31%, 08/01/2046 | 4,424 | ||||||
| North Texas Tollway Auth Rev, | ||||||||
| 455 | 6.72%, 01/01/2049 | 633 | ||||||
| 9,425 | ||||||||
| Total Municipal Bonds | ||||||||
| (Cost $17,104) | $ | 19,101 | ||||||
| Senior Floating Rate Interests ♦ - 0.2% | ||||||||
| Computer and Electronic Product Manufacturing - 0.0% | ||||||||
| Freescale Semiconductor, Inc. | ||||||||
| $ | 837 | 5.00%, 01/15/2021 | $ | 835 | ||||
The accompanying notes are an integral part of these financial statements.
| 23 |
| The Hartford Balanced Income Fund |
| Schedule of Investments – (continued) |
| October 31, 2014 |
| (000’s Omitted) |
| Shares or Principal Amount ╬ | Market Value ╪ | |||||||
| Senior Floating Rate Interests ♦ - 0.2% - (continued) | ||||||||
| Finance and Insurance - 0.0% | ||||||||
| Asurion LLC | ||||||||
| $ | 775 | 8.50%, 03/03/2021 ☼ | $ | 787 | ||||
| Mining - 0.0% | ||||||||
| Arch Coal, Inc. | ||||||||
| 1,675 | 6.25%, 05/16/2018 ☼ | 1,477 | ||||||
| Other Services - 0.0% | ||||||||
| Gardner Denver, Inc. | ||||||||
| 1,929 | 4.25%, 07/30/2020 ☼ | 1,900 | ||||||
| Petroleum and Coal Products Manufacturing - 0.0% | ||||||||
| Crosby Worldwide Ltd. | ||||||||
| 1,558 | 4.00%, 11/23/2020 ☼ | 1,490 | ||||||
| Retail Trade - 0.1% | ||||||||
| Lands' End, Inc. | ||||||||
| 1,141 | 4.25%, 04/04/2021 ☼ | 1,114 | ||||||
| Neiman Marcus (The) Group, Inc. | ||||||||
| 1,840 | 4.25%, 10/25/2020 ☼ | 1,814 | ||||||
| 2,928 | ||||||||
| Utilities - 0.1% | ||||||||
| Texas Competitive Electric Holdings Co. LLC | ||||||||
| 3,799 | 4.65%, 10/10/2017 ☼Ψ | 2,763 | ||||||
| Total Senior Floating Rate Interests | ||||||||
| (Cost $12,508) | $ | 12,180 | ||||||
| U.S. Government Securities - 0.1% | ||||||||
| U.S. Treasury Securities - 0.1% | ||||||||
| U.S. Treasury Bonds - 0.0% | ||||||||
| $ | 1,350 | 3.13%, 08/15/2044 ╦ | $ | 1,367 | ||||
| 410 | 3.38%, 05/15/2044 Θ | 435 | ||||||
| 1,802 | ||||||||
| U.S. Treasury Notes - 0.1% | ||||||||
| 850 | 0.50%, 09/30/2016 ‡ | 850 | ||||||
| 1,250 | 2.38%, 08/15/2024 ‡ | 1,255 | ||||||
| 2,105 | ||||||||
| 3,907 | ||||||||
| Total U.S. Government Securities | ||||||||
| (Cost $3,885) | $ | 3,907 | ||||||
| Total Long-Term Investments Excluding Purchased Options | ||||||||
| (Cost $4,795,901) | $ | 5,300,529 | ||||||
| Short-Term Investments - 2.6% | ||||||||
| Repurchase Agreements - 2.6% | ||||||||
| Bank of America Merrill Lynch TriParty Repurchase Agreement (maturing on 11/03/2014 in the amount of $400, collateralized by U.S. Treasury Note 1.50%, 2019, value of $408) | ||||||||
| $ | 400 | 0.08%, 10/31/2014 | $ | 400 | ||||
| Bank of America Merrill Lynch TriParty Repurchase Agreement (maturing on 11/03/2014 in the amount of $6,808, collateralized by GNMA 1.63% - 7.00%, 2031 - 2054, value of $6,945) | ||||||||
| 6,808 | 0.09%, 10/31/2014 | 6,808 | ||||||
| Bank of Montreal TriParty Repurchase Agreement (maturing on 11/03/2014 in the amount of $1,829, collateralized by U.S. Treasury Bond 2.88% - 5.25%, 2029 - 2043, U.S. Treasury Note 0.38% - 4.50%, 2015 - 2022, value of $1,866) | ||||||||
| 1,829 | 0.08%, 10/31/2014 | 1,829 | ||||||
| Bank of Montreal TriParty Repurchase Agreement (maturing on 11/03/2014 in the amount of $6,201, collateralized by FHLMC 2.00% - 5.50%, 2022 - 2034, FNMA 2.00% - 4.50%, 2024 - 2039, GNMA 3.00%, 2043, U.S. Treasury Note 4.63%, 2017, value of $6,325) | ||||||||
| 6,201 | 0.10%, 10/31/2014 | 6,201 | ||||||
| Barclays Capital TriParty Repurchase Agreement (maturing on 11/03/2014 in the amount of $23,365, collateralized by U.S. Treasury Bond 4.50% - 6.25%, 2023 - 2036, U.S. Treasury Note 1.63% - 2.13%, 2015 - 2019, value of $23,832) | ||||||||
| 23,365 | 0.08%, 10/31/2014 | 23,365 | ||||||
| Citigroup Global Markets, Inc. TriParty Repurchase Agreement (maturing on 11/03/2014 in the amount of $26,856, collateralized by U.S. Treasury Bill 0.02%, 2015, U.S. Treasury Bond 3.88% - 11.25%, 2015 - 2040, U.S. Treasury Note 2.00% - 3.38%, 2019 - 2021, value of $27,393) | ||||||||
| 26,856 | 0.09%, 10/31/2014 | 26,856 | ||||||
| Deutsche Bank Securities TriParty Repurchase Agreement (maturing on 11/03/2014 in the amount of $1,550, collateralized by U.S. Treasury Note 0.88%, 2017, value of $1,581) | ||||||||
| 1,550 | 0.13%, 10/31/2014 | 1,550 | ||||||
| RBS Securities, Inc. TriParty Repurchase Agreement (maturing on 11/03/2014 in the amount of $2,282, collateralized by U.S. Treasury Bond 3.63% - 5.00%, 2037 - 2043, U.S. Treasury Note 2.13%, 2020, value of $2,328) | ||||||||
| 2,282 | 0.07%, 10/31/2014 | 2,282 | ||||||
| Societe Generale TriParty Repurchase Agreement (maturing on 11/03/2014 in the amount of $24,041, collateralized by U.S. Treasury Bill 0.02%, 2015, U.S. Treasury Bond 3.75% - 11.25%, 2015 - 2043, U.S. Treasury Note 1.38% - 4.25%, 2015 - 2022, value of $24,521) | ||||||||
| 24,040 | 0.08%, 10/31/2014 | 24,040 | ||||||
The accompanying notes are an integral part of these financial statements.
| 24 |
| The Hartford Balanced Income Fund |
| Schedule of Investments – (continued) |
| October 31, 2014 |
| (000’s Omitted) |
| Shares or Principal Amount ╬ | Market Value ╪ | |||||||||||
| Short-Term Investments - 2.6% - (continued) | ||||||||||||
| Repurchase Agreements - 2.6% - (continued) | ||||||||||||
| TD Securities TriParty Repurchase Agreement (maturing on 11/03/2014 in the amount of $46,587, collateralized by FHLMC 3.00% - 4.00%, 2026 - 2044, FNMA 2.50% - 5.00%, 2025 - 2044, U.S. Treasury Bond 3.50% - 6.50%, 2026 - 2041, U.S. Treasury Note 1.75% - 2.88%, 2018 - 2019, value of $47,518) |
||||||||||||
| $ | 46,586 | 0.10%, 10/31/2014 | $ | 46,586 | ||||||||
| 139,917 | ||||||||||||
| Total Short-Term Investments | ||||||||||||
| (Cost $139,917) | $ | 139,917 | ||||||||||
| Total Investments Excluding Purchased Options | ||||||||||||
| (Cost $4,935,818) | 99.8 | % | $ | 5,440,446 | ||||||||
| Total Purchased Options | ||||||||||||
| (Cost $2) | — | % | — | |||||||||
| Total Investments | ||||||||||||
| (Cost $4,935,820) ▲ | 99.8 | % | $ | 5,440,446 | ||||||||
| Other Assets and Liabilities | 0.2 | % | 10,956 | |||||||||
| Total Net Assets | 100.0 | % | $ | 5,451,402 | ||||||||
The accompanying notes are an integral part of these financial statements.
| 25 |
| The Hartford Balanced Income Fund |
| Schedule of Investments – (continued) |
| October 31, 2014 |
| (000’s Omitted) |
| Note: | Percentage of investments as shown is the ratio of the total market value to total net assets. |
Prices of foreign equities that are principally traded on certain foreign markets may be adjusted daily pursuant to a fair value pricing service approved by the Board of Directors in order to reflect an adjustment for factors occurring after the close of certain foreign markets but before the close of the New York Stock Exchange.
The Fund may refer to any one or more of the industry classifications used by one or more widely recognized market indices, ratings group indices and/or as defined by Fund management. Industry classifications may not be identical across all security types.
Equity industry classifications used in this report are the Global Industry Classification Standard, which was developed by and is the exclusive property and service mark of MSCI, Inc. and Standard & Poor’s.
For Fund compliance purposes, the Fund may not use the same classification system shown in this report as these classifications are used for reporting ease.
| ▲ | At October 31, 2014, the cost of securities for federal income tax purposes was $4,937,748 and the aggregate gross unrealized appreciation and depreciation based on that cost were: |
| Unrealized Appreciation | $ | 527,796 | ||
| Unrealized Depreciation | (25,098 | ) | ||
| Net Unrealized Appreciation | $ | 502,698 |
| ╬ | All principal amounts are in U.S. dollars unless otherwise indicated. |
| ● | Non-income producing. For long-term debt securities, items identified are in default as to payment of interest and/or principal. |
| Ψ | The issuer is in bankruptcy. However, the investment held by the Fund is current with respect to interest payments. |
| Ϫ | The issuer is in bankruptcy. The investment held by the Fund has made partial interest payments. |
| Ω | Debt security in default due to bankruptcy. |
| Δ | Variable rate securities; the rate reported is the coupon rate in effect at October 31, 2014. |
| ◄ | The principal amount for this security is adjusted for inflation and the interest payments equal a fixed percentage of the inflation-adjusted principal amount. |
| ♦ | Senior floating rate interests generally pay interest rates which are periodically adjusted by reference to a base short-term, floating lending rate plus a premium. The base lending rates are primarily the LIBOR, and secondarily the prime rate offered by one or more major United States banks (the "Prime Rate") and the certificate of deposit rate or other base lending rates used by commercial lenders. Senior floating rate interests often require prepayments from excess cash flows or permit the borrower to repay at its election. The rate at which the borrower repays cannot be predicted with accuracy. As a result, the actual remaining maturity may be substantially less than the stated maturities shown. Unless otherwise noted, the interest rate disclosed for these securities represents the average coupon as of October 31, 2014. |
| ■ | Securities issued within terms of a private placement memorandum, exempt from registration under Rule 144A under the Securities Act of 1933, as amended, and may be sold only to qualified institutional buyers. Unless otherwise indicated, these holdings are determined to be liquid. At October 31, 2014, the aggregate value of these securities was $496,775, which represents 9.1% of total net assets. |
| § | These securities were sold to the Fund under Regulation S, rules governing offers and sales made outside the United States without registration under the Securities Act of 1933, as amended. The Fund may only be able to resell these securities in the United States if an exemption from registration under the federal and state securities laws is available, or the Fund may only be able to sell these securities outside of the United States (such as on a foreign exchange) to a non-U.S. person. Unless otherwise indicated, these holdings are determined to be liquid. At October 31, 2014, the aggregate value of these securities was $139,550, which represents 2.6% of total net assets. |
| β | Convertible security. |
| ♠ | Perpetual maturity security. Maturity date shown is the next call date or final legal maturity date, whichever comes first. |
| Þ | This security may pay interest in the form of additional principal in lieu of cash. |
| ☼ | This security, or a portion of this security, was purchased on a when-issued or delayed-delivery basis. The cost of these securities was $21,530 at October 31, 2014. |
| ‡ | This security, or a portion of this security, has been segregated to cover funding requirements on investment transactions settling in the future. |
| ╦ | This security, or a portion of this security, has been pledged as collateral in connection with OTC swap contracts. |
| Θ | This security, or a portion of this security, has been pledged as collateral in connection with OTC option and/or swaption contracts. |
The accompanying notes are an integral part of these financial statements.
| 26 |
| The Hartford Balanced Income Fund |
| Schedule of Investments – (continued) |
| October 31, 2014 |
| (000’s Omitted) |
Cash pledged and received as collateral in connection with derivatives at October 31, 2014:
| Pledged | Received | |||||||
| OTC option and/or OTC swap contracts | $ | – | $ | 575 | ||||
| Futures contracts | 5,059 | – | ||||||
| Centrally cleared swaps contracts | 129 | – | ||||||
| Total | $ | 5,188 | $ | 575 | ||||
OTC Swaption Contracts Outstanding at October 31, 2014
Description | Counter - | Risk | Exercise
Price/ FX Rate/ | Expiration | Number of | Market | Premiums | Unrealized | ||||||||||||||||||
| Purchased swaption contracts: | ||||||||||||||||||||||||||
| Puts | ||||||||||||||||||||||||||
| Credit Default Swaption CDX.NA.IG.22 | BNP | CR | 0.73 | % | 11/19/14 | USD | 1,775,000 | $ | – | $ | 2 | $ | (2 | ) | ||||||||||||
| Written swaption contracts: | ||||||||||||||||||||||||||
| Calls | ||||||||||||||||||||||||||
| Credit Default Swaption CDX.NA.IG.22 | BNP | CR | 0.60 | % | 11/19/14 | USD | 1,775,000 | $ | 1 | $ | 1 | $ | – | |||||||||||||
| Credit Default Swaption CDX.NA.IG.23 | BNP | CR | 0.70 | % | 11/19/14 | USD | 2,204,000 | 7 | 5 | (2 | ) | |||||||||||||||
| Total Calls | 3,979,000 | $ | 8 | $ | 6 | $ | (2 | ) | ||||||||||||||||||
| Puts | ||||||||||||||||||||||||||
| Credit Default Swaption CDX.NA.IG.23 | BNP | CR | 0.70 | % | 11/19/14 | USD | 2,204,000 | $ | 1 | $ | 3 | $ | 2 | |||||||||||||
| Total written swaption contracts | 6,183,000 | $ | 9 | $ | 9 | $ | – | |||||||||||||||||||
| * | The number of contracts does not omit 000's. |
| Δ | For purchased swaptions, premiums are paid by the Fund, for written swaptions, premiums are received. |
Futures Contracts Outstanding at October 31, 2014
| Number of | Expiration | Notional | Market | Unrealized | Variation | |||||||||||||||||||||||||
Description | Contracts* | Date | Amount | Value ╪ | Asset | Liability | Asset | Liability | ||||||||||||||||||||||
| Long position contracts: | ||||||||||||||||||||||||||||||
| U.S. Treasury 2-Year Note Future | 760 | 12/31/2014 | $ | 166,347 | $ | 166,868 | $ | 521 | $ | – | $ | – | $ | (47 | ) | |||||||||||||||
| U.S. Treasury 5-Year Note Future | 7,357 | 12/31/2014 | 873,438 | 878,644 | 5,206 | – | – | (1207 | ) | |||||||||||||||||||||
| U.S. Treasury Long Bond Future | 1,775 | 12/19/2014 | 246,479 | 250,441 | 3,962 | – | – | (832 | ) | |||||||||||||||||||||
| Total | $ | 9,689 | $ | – | $ | – | $ | (2,086 | ) | |||||||||||||||||||||
| Short position contracts: | ||||||||||||||||||||||||||||||
| Euro-BOBL Future | 1 | 12/08/2014 | $ | 159 | $ | 160 | $ | – | $ | (1 | ) | $ | – | $ | – | |||||||||||||||
| Euro-BUND Future | 18 | 12/08/2014 | 3,356 | 3,404 | – | (48 | ) | – | (1 | ) | ||||||||||||||||||||
| U.S. Treasury 10-Year Note Future | 8,649 | 12/19/2014 | 1,087,126 | 1,092,882 | – | (5,756 | ) | 2,431 | (91 | ) | ||||||||||||||||||||
| U.S. Treasury CME Ultra Long Term Bond Future | 167 | 12/19/2014 | 25,773 | 26,188 | – | (415 | ) | 98 | (2 | ) | ||||||||||||||||||||
| Total | $ | – | $ | (6,220 | ) | $ | 2,529 | $ | (94 | ) | ||||||||||||||||||||
| Total futures contracts | $ | 9,689 | $ | (6,220 | ) | $ | 2,529 | $ | (2,180 | ) | ||||||||||||||||||||
* The number of contracts does not omit 000's.
The accompanying notes are an integral part of these financial statements.
| 27 |
| The Hartford Balanced Income Fund |
| Schedule of Investments – (continued) |
| October 31, 2014 |
| (000’s Omitted) |
OTC Credit Default Swap Contracts Outstanding at October 31, 2014
| Counter- | Notional | (Pay)/ Receive Fixed Rate/ Implied | Expiration | Upfront Premiums | Upfront Premiums | Market | Unrealized Appreciation/ | |||||||||||||||||||||||
Reference Entity | party | Amount (a) | Credit Spread (b) | Date | Paid | Received | Value ╪ | Asset | Liability | |||||||||||||||||||||
| Credit default swaps on single-name issues: | ||||||||||||||||||||||||||||||
| Buy protection: | ||||||||||||||||||||||||||||||
| Colombia (Republic of) | BCLY | USD | 855 | (1.00)% / (0.75)% | 03/20/19 | $ | 10 | $ | – | $ | (9 | ) | $ | – | $ | (19 | ) | |||||||||||||
| Colombia (Republic of) | BOA | USD | 425 | (1.00)% / (0.75)% | 03/20/19 | 3 | – | (5 | ) | – | (8 | ) | ||||||||||||||||||
| ConAgra Foods, Inc. | GSC | USD | 1,075 | (1.00)% / (0.53)% | 12/20/19 | – | (17 | ) | (25 | ) | – | (8 | ) | |||||||||||||||||
| Indonesia (Republic of) | BCLY | USD | 320 | (1.00)% / (1.35)% | 09/20/19 | 7 | – | 5 | – | (2 | ) | |||||||||||||||||||
| Indonesia (Republic of) | BNP | USD | 1,100 | (1.00)% / (1.35)% | 09/20/19 | 25 | – | 18 | – | (7 | ) | |||||||||||||||||||
| Indonesia (Republic of) | GSC | USD | 145 | (1.00)% / (1.35)% | 09/20/19 | 3 | – | 2 | – | (1 | ) | |||||||||||||||||||
| Venezuela (Republic of) | BOA | USD | 745 | (5.00)% / (18.38)% | 03/20/19 | 139 | – | 253 | 114 | – | ||||||||||||||||||||
| Venezuela (Republic of) | DEUT | USD | 1,315 | (5.00)% / (18.38)% | 03/20/19 | 248 | – | 447 | 199 | – | ||||||||||||||||||||
| Total | $ | 435 | $ | (17 | ) | $ | 686 | $ | 313 | $ | (45 | ) | ||||||||||||||||||
| Sell protection: | ||||||||||||||||||||||||||||||
| Illinois State GO | GSC | USD | 900 | 1.00% / 1.11% | 06/20/17 | $ | 4 | $ | – | $ | (2 | ) | $ | – | $ | (6 | ) | |||||||||||||
| International Lease Finance Corp. | BCLY | USD | 473 | 5.00% / 2.15% | 12/20/19 | 60 | – | 63 | 3 | – | ||||||||||||||||||||
| Kazakhstan (Republic of) | BCLY | USD | 435 | 1.00% / 1.53% | 06/20/19 | – | (16 | ) | (10 | ) | 6 | – | ||||||||||||||||||
| Kazakhstan (Republic of) | DEUT | USD | 90 | 1.00% / 1.53% | 06/20/19 | – | (4 | ) | (2 | ) | 2 | – | ||||||||||||||||||
| Kazakhstan (Republic of) | MSC | USD | 140 | 1.00% / 1.53% | 06/20/19 | – | (5 | ) | (3 | ) | 2 | – | ||||||||||||||||||
| Peru (Republic of) | BCLY | USD | 860 | 1.00% / 0.83% | 03/20/19 | – | (11 | ) | 6 | 17 | – | |||||||||||||||||||
| Peru (Republic of) | BOA | USD | 420 | 1.00% / 0.83% | 03/20/19 | – | (4 | ) | 3 | 7 | – | |||||||||||||||||||
| Turkey (Republic of) | BNP | USD | 1,420 | 1.00% / 1.66% | 09/20/19 | – | (51 | ) | (43 | ) | 8 | – | ||||||||||||||||||
| Turkey (Republic of) | DEUT | USD | 1,655 | 1.00% / 1.72% | 12/20/19 | – | (76 | ) | (58 | ) | 18 | – | ||||||||||||||||||
| Turkey (Republic of) | GSC | USD | 145 | 1.00% / 1.66% | 09/20/19 | – | (6 | ) | (5 | ) | 1 | – | ||||||||||||||||||
| Turkey (Republic of) | GSC | USD | 3,270 | 1.00% / 1.72% | 12/20/19 | – | (147 | ) | (115 | ) | 32 | – | ||||||||||||||||||
| Total | $ | 64 | $ | (320 | ) | $ | (166 | ) | $ | 96 | $ | (6 | ) | |||||||||||||||||
| Total single-name issues | $ | 499 | $ | (337 | ) | $ | 520 | $ | 409 | $ | (51 | ) | ||||||||||||||||||
| (a) | The maximum potential amount the Fund could be required to pay as a seller of credit protection or receive as a buyer of credit protection if a credit event occurs as defined under the terms of that particular swap agreement. |
| (b) | Implied credit spreads, utilized in determining the market value of credit default swap agreements on corporate issues, U.S. municipal issues or sovereign government issues as of period end serve as an indicator of the current status of the payment/performance risk and represent the likelihood of risk of default for the credit derivative. The implied credit spread of a particular entity reflects the cost of buying/selling protection and may include upfront payments required to be made to enter into the agreement. Wider credit spreads represent a deterioration of the reference entity's credit soundness and a greater likelihood or risk of default or other credit event occurring as defined under the terms of the agreement. The percentage shown is the implied credit spread on October 31, 2014. For credit default swap agreements on indices, the quoted market prices and resulting values serve as the indicator of the current status of the payment/performance risk. |
Centrally Cleared Credit Default Swap Contracts Outstanding at October 31, 2014
| Clearing | Notional | (Pay)/ Receive Fixed | Expiration | Market | Unrealized | Variation Margin | ||||||||||||||||||||||||||||||
Reference Entity | House (a) | Amount (b) | Rate | Date | Cost Basis | Value ╪ | Asset | Liability | Asset | Liability | ||||||||||||||||||||||||||
| Credit default swaps on indices: | ||||||||||||||||||||||||||||||||||||
| Sell protection: | ||||||||||||||||||||||||||||||||||||
| CDX.NA.HY.22 | CME | USD | 2,807 | 5.00 | % | 06/20/19 | $ | 193 | $ | 210 | $ | 17 | $ | – | $ | 9 | $ | – | ||||||||||||||||||
| (a) | The FCM to the contracts is GSC. |
| (b) | The maximum potential amount the Fund could be required to pay as a seller of credit protection or receive as a buyer of credit protection if a credit event occurs as defined under the terms of that particular swap agreement. |
The accompanying notes are an integral part of these financial statements.
| 28 |
| The Hartford Balanced Income Fund |
| Schedule of Investments – (continued) |
| October 31, 2014 |
| (000’s Omitted) |
Centrally Cleared Interest Rate Swap Contracts Outstanding at October 31, 2014
| Clearing | Payments made | Payments received | Notional | Expiration | Upfront Premiums Paid | Market | Unrealized
| Variation Margin | ||||||||||||||||||||||||||
House (a) | by Fund | by Fund | Amount | Date | (Received) | Value ╪ | Asset | Liability | Asset | Liability | ||||||||||||||||||||||||
| LCH | 0.43% Fixed | 6M EURIBOR | EUR | 200 | 09/17/17 | $ | – | $ | (1 | ) | $ | – | $ | (1 | ) | $ | – | $ | – | |||||||||||||||
| (a) | The FCM to the contracts is GSC. |
Foreign Currency Contracts Outstanding at October 31, 2014
Unrealized Appreciation/(Depreciation) | ||||||||||||||||||||||
Currency | Buy / Sell | Delivery Date | Counterparty | Contract Amount | Market Value ╪ | Asset | Liability | |||||||||||||||
| BRL | Buy | 12/02/2014 | DEUT | $ | 416 | $ | 420 | $ | 4 | $ | – | |||||||||||
| BRL | Sell | 12/02/2014 | JPM | 215 | 214 | 1 | – | |||||||||||||||
| BRL | Sell | 12/02/2014 | MSC | 1,553 | 1,563 | – | (10 | ) | ||||||||||||||
| BRL | Sell | 12/02/2014 | UBS | 3,406 | 3,169 | 237 | – | |||||||||||||||
| BRL | Sell | 12/02/2014 | UBS | 1,553 | 1,563 | – | (10 | ) | ||||||||||||||
| CAD | Buy | 11/28/2014 | BOA | 180 | 179 | – | (1 | ) | ||||||||||||||
| CAD | Sell | 11/28/2014 | BOA | 180 | 179 | 1 | – | |||||||||||||||
| CLP | Buy | 12/17/2014 | BNP | 1,522 | 1,565 | 43 | – | |||||||||||||||
| CLP | Sell | 12/17/2014 | BNP | 378 | 391 | – | (13 | ) | ||||||||||||||
| CLP | Sell | 12/17/2014 | BOA | 759 | 783 | – | (24 | ) | ||||||||||||||
| CLP | Sell | 12/17/2014 | SCB | 377 | 391 | – | (14 | ) | ||||||||||||||
| COP | Sell | 12/17/2014 | BOA | 683 | 660 | 23 | – | |||||||||||||||
| COP | Sell | 12/17/2014 | BOA | 1,440 | 1,441 | – | (1 | ) | ||||||||||||||
| EUR | Buy | 12/17/2014 | CBK | 139 | 137 | – | (2 | ) | ||||||||||||||
| EUR | Buy | 12/17/2014 | CSFB | 235 | 233 | – | (2 | ) | ||||||||||||||
| EUR | Buy | 12/17/2014 | DEUT | 705 | 691 | – | (14 | ) | ||||||||||||||
| EUR | Buy | 11/04/2014 | HSBC | 2,615 | 2,615 | – | – | |||||||||||||||
| EUR | Sell | 12/17/2014 | DEUT | 9,145 | 8,854 | 291 | – | |||||||||||||||
| EUR | Sell | 11/28/2014 | HSBC | 2,616 | 2,616 | – | – | |||||||||||||||
| EUR | Sell | 12/17/2014 | HSBC | 270 | 262 | 8 | – | |||||||||||||||
| EUR | Sell | 11/28/2014 | JPM | 9,039 | 8,944 | 95 | – | |||||||||||||||
| EUR | Sell | 12/17/2014 | RBS | 71 | 69 | 2 | – | |||||||||||||||
| IDR | Buy | 12/17/2014 | UBS | 1,494 | 1,476 | – | (18 | ) | ||||||||||||||
| INR | Buy | 12/17/2014 | CBK | 2,893 | 2,878 | – | (15 | ) | ||||||||||||||
| INR | Sell | 12/17/2014 | JPM | 1,492 | 1,488 | 4 | – | |||||||||||||||
| INR | Sell | 12/17/2014 | SSG | 1,394 | 1,389 | 5 | – | |||||||||||||||
| MXN | Buy | 12/17/2014 | DEUT | 283 | 282 | – | (1 | ) | ||||||||||||||
| MXN | Buy | 12/17/2014 | JPM | 2,442 | 2,400 | – | (42 | ) | ||||||||||||||
| MYR | Buy | 12/17/2014 | UBS | 1,489 | 1,448 | – | (41 | ) | ||||||||||||||
| PEN | Sell | 12/17/2014 | SCB | 1,766 | 1,738 | 28 | – | |||||||||||||||
| PHP | Buy | 12/17/2014 | JPM | 1,539 | 1,538 | – | (1 | ) | ||||||||||||||
| ZAR | Sell | 12/17/2014 | DEUT | 1,483 | 1,490 | – | (7 | ) | ||||||||||||||
| ZAR | Sell | 12/17/2014 | RBS | 1,422 | 1,425 | – | (3 | ) | ||||||||||||||
| Total | $ | 742 | $ | (219 | ) | |||||||||||||||||
| ╪ | See Significant Accounting Policies of accompanying Notes to Financial Statements regarding valuation of securities. |
The accompanying notes are an integral part of these financial statements.
| 29 |
| The Hartford Balanced Income Fund |
| Schedule of Investments – (continued) |
| October 31, 2014 |
| (000’s Omitted) |
| GLOSSARY: (abbreviations used in preceding Schedule of Investments) | ||
| Counterparty Abbreviations: | ||
| BCLY | Barclays | |
| BNP | BNP Paribas Securities Services | |
| BOA | Banc of America Securities LLC | |
| CBK | Citibank NA | |
| CME | Chicago Mercantile Exchange | |
| CSFB | Credit Suisse First Boston Corp. | |
| DEUT | Deutsche Bank Securities, Inc. | |
| FCM | Futures Commission Merchant | |
| GSC | Goldman Sachs & Co. | |
| HSBC | HSBC Bank USA | |
| JPM | JP Morgan Chase & Co. | |
| LCH | LCH Clearnet | |
| MSC | Morgan Stanley | |
| RBS | RBS Greenwich Capital | |
| SCB | Standard Chartered Bank | |
| SSG | State Street Global Markets LLC | |
| UBS | UBS AG | |
| Currency Abbreviations: | ||
| BRL | Brazilian Real | |
| CAD | Canadian Dollar | |
| CLP | Chilean Peso | |
| COP | Colombian Peso | |
| EUR | EURO | |
| IDR | Indonesian New Rupiah | |
| INR | Indian Rupee | |
| MXN | Mexican New Peso | |
| MYR | Malaysian Ringgit | |
| PEN | Peruvian New Sol | |
| PHP | Philippine Peso | |
| USD | U.S. Dollar | |
| ZAR | South African Rand | |
| Index Abbreviations: | ||
| CDX.NA.HY | Credit Derivatives North American High Yield | |
| CDX.NA.IG | Credit Derivatives North American Investment Grade | |
| Municipal Bond Abbreviations: | ||
| GO | General Obligation | |
| PA | Port Authority | |
| Rev | Revenue | |
| Other Abbreviations: | ||
| ADR | American Depositary Receipt | |
| CR | Credit | |
| EURIBOR | Euro Interbank Offered Rate | |
| FHLMC | Federal Home Loan Mortgage Corp. | |
| FNMA | Federal National Mortgage Association | |
| FX | Foreign Exchange | |
| GNMA | Government National Mortgage Association | |
| LIBOR | London Interbank Offered Rate | |
| OTC | Over-the-Counter | |
| REIT | Real Estate Investment Trust | |
The accompanying notes are an integral part of these financial statements.
| 30 |
| The Hartford Balanced Income Fund |
| Schedule of Investments – (continued) |
| October 31, 2014 |
| (000’s Omitted) |
| Investment Valuation Hierarchy Level Summary |
| October 31, 2014 |
| Total | Level 1 ♦ | Level 2 ♦ | Level 3 | |||||||||||||
| Assets: | ||||||||||||||||
| Asset and Commercial Mortgage Backed Securities | $ | 93,971 | $ | – | $ | 66,975 | $ | 26,996 | ||||||||
| Common Stocks ‡ | 2,524,030 | 2,328,009 | 196,021 | – | ||||||||||||
| Corporate Bonds | 2,359,023 | – | 2,359,013 | 10 | ||||||||||||
| Foreign Government Obligations | 284,012 | – | 284,012 | – | ||||||||||||
| Municipal Bonds | 19,101 | – | 19,101 | – | ||||||||||||
| Preferred Stocks | 4,305 | 4,305 | – | – | ||||||||||||
| Senior Floating Rate Interests | 12,180 | – | 12,180 | – | ||||||||||||
| U.S. Government Securities | 3,907 | 2,622 | 1,285 | – | ||||||||||||
| Short-Term Investments | 139,917 | – | 139,917 | – | ||||||||||||
| Purchased Options | – | – | – | – | ||||||||||||
| Total | $ | 5,440,446 | $ | 2,334,936 | $ | 3,078,504 | $ | 27,006 | ||||||||
| Foreign Currency Contracts * | $ | 742 | $ | – | $ | 742 | $ | – | ||||||||
| Futures * | 9,689 | 9,689 | – | – | ||||||||||||
| Swaps - Credit Default * | 426 | – | 426 | – | ||||||||||||
| Total | $ | 10,857 | $ | 9,689 | $ | 1,168 | $ | – | ||||||||
| Liabilities: | ||||||||||||||||
| Written Options | 9 | – | 9 | – | ||||||||||||
| Total | $ | 9 | $ | – | $ | 9 | $ | – | ||||||||
| Foreign Currency Contracts * | $ | 219 | $ | – | $ | 219 | $ | – | ||||||||
| Futures * | 6,220 | 6,220 | – | – | ||||||||||||
| Swaps - Credit Default * | 51 | – | 51 | – | ||||||||||||
| Swaps - Interest Rate * | 1 | – | 1 | – | ||||||||||||
| Total | $ | 6,491 | $ | 6,220 | $ | 271 | $ | – | ||||||||
| ♦ | For the year ended October 31, 2014, investments valued at $388 were transferred from Level 2 to Level 1, and there were no transfers from Level 1 to Level 2. Investments are transferred between Level 1 and Level 2 for a variety of reasons including, but not limited to: |
1) Foreign equities for which a fair value price is more representative of exit value than the local market close (transfer into Level 2). Foreign equities for which the local market close is more representative of exit value (transfer into Level 1).
2) U.S. Treasury securities that no longer represent the most recent issue (transfer into Level 2).
3) Equity investments with no observable trading but a bid or mean price is used (transfer into Level 2). Equity investments using observable quoted prices in an active market (transfer into Level 1).
| ‡ | The Fund has all or primarily all of the equity securities categorized in a particular level. Refer to the Schedule of Investments for further industry breakout. |
| * | Derivative instruments (excluding purchased and written options, if applicable) are valued at the unrealized appreciation/depreciation on the investments. |
Following is a reconciliation of Level 3 assets for which significant unobservable inputs were used to determine fair value:
Balance as | Realized | Change in | Net | Purchases | Sales | Transfers | Transfers | Balance as | ||||||||||||||||||||||||||||
| Assets: | ||||||||||||||||||||||||||||||||||||
| Asset & Commercial Mortgage Backed Securities | $ | 12,771 | $ | 444 | $ | 258 | † | $ | 590 | $ | 17,925 | $ | (4,758 | ) | $ | 504 | $ | (738 | ) | $ | 26,996 | |||||||||||||||
| Corporate Bonds | 1,746 | 48 | 42 | ‡ | 1 | — | (1,827 | ) | — | — | 10 | |||||||||||||||||||||||||
| Total | $ | 14,517 | $ | 492 | $ | 300 | $ | 591 | $ | 17,925 | $ | (6,585 | ) | $ | 504 | $ | (738 | ) | $ | 27,006 | ||||||||||||||||
| * | Investments are transferred into and out of Level 3 for a variety of reasons including, but not limited to: |
1) Investments where trading has been halted (transfer into Level 3) or investments where trading has resumed (transfer out of Level 3).
2) Broker quoted investments (transfer into Level 3) or quoted prices in active markets (transfer out of Level 3).
3) Investments that have certain restrictions on trading (transfer into Level 3) or investments where trading restrictions have expired (transfer out of Level 3).
| † | Change in unrealized appreciation (depreciation) in the current period relating to assets still held at October 31, 2014 was $260. |
| ‡ | Change in unrealized appreciation (depreciation) in the current period relating to assets still held at October 31, 2014 was $(10). |
| Note: | For purposes of reporting transfers between different hierarchy levels, both transfers in and out of each level, as applicable, are shown as if they occurred at the beginning of the period. |
The accompanying notes are an integral part of these financial statements.
| 31 |
| The Hartford Balanced Income Fund |
| Statement of Assets and Liabilities |
| October 31, 2014 |
| (000’s Omitted) |
| Assets: | ||||
| Investments in securities, at market value (cost $4,935,820) | $ | 5,440,446 | ||
| Cash | 7,255 | * | ||
| Unrealized appreciation on foreign currency contracts | 742 | |||
| Unrealized appreciation on OTC swap contracts | 409 | |||
| Receivables: | ||||
| Investment securities sold | 11,306 | |||
| Fund shares sold | 25,208 | |||
| Dividends and interest | 33,735 | |||
| Variation margin on financial derivative instruments | 2,538 | |||
| OTC swap premiums paid | 499 | |||
| Other assets | 195 | |||
| Total assets | 5,522,333 | |||
| Liabilities: | ||||
| Unrealized depreciation on foreign currency contracts | 219 | |||
| Unrealized depreciation on OTC swap contracts | 51 | |||
| Payables: | ||||
| Investment securities purchased | 59,378 | |||
| Fund shares redeemed | 6,081 | |||
| Investment management fees | 587 | |||
| Administrative fees | 6 | |||
| Distribution fees | 482 | |||
| Collateral received from broker | 575 | |||
| Variation margin on financial derivative instruments | 2,180 | |||
| Accrued expenses | 598 | |||
| OTC swap premiums received | 337 | |||
| Written option contracts (proceeds $9) | 9 | |||
| Other liabilities | 428 | |||
| Total liabilities | 70,931 | |||
| Net assets | $ | 5,451,402 | ||
| Summary of Net Assets: | ||||
| Capital stock and paid-in-capital | $ | 4,852,806 | ||
| Undistributed net investment income | 8,415 | |||
| Accumulated net realized gain | 81,252 | |||
| Unrealized appreciation of investments and the translation of assets and liabilities denominated in foreign currency | 508,929 | |||
| Net assets | $ | 5,451,402 |
* Cash of $5,188 was pledged as collateral for open financial derivative instruments at October 31, 2014.
The accompanying notes are an integral part of these financial statements.
| 32 |
| The Hartford Balanced Income Fund |
| Statement of Assets and Liabilities – (continued) |
| October 31, 2014 |
| (000’s Omitted) |
| Shares authorized | 1,450,000 | |||
| Par value | $ | 0.001 | ||
| Class A: Net asset value per share/Maximum offering price per share | $13.72/$14.52 | |||
| Shares outstanding | 168,878 | |||
| Net assets | $ | 2,317,429 | ||
| Class B: Net asset value per share | $ | 13.69 | ||
| Shares outstanding | 1,377 | |||
| Net assets | $ | 18,846 | ||
| Class C: Net asset value per share | $ | 13.56 | ||
| Shares outstanding | 138,985 | |||
| Net assets | $ | 1,884,930 | ||
| Class I: Net asset value per share | $ | 13.72 | ||
| Shares outstanding | 75,170 | |||
| Net assets | $ | 1,031,554 | ||
| Class R3: Net asset value per share | $ | 13.77 | ||
| Shares outstanding | 7,765 | |||
| Net assets | $ | 106,894 | ||
| Class R4: Net asset value per share | $ | 13.77 | ||
| Shares outstanding | 3,936 | |||
| Net assets | $ | 54,196 | ||
| Class R5: Net asset value per share | $ | 13.78 | ||
| Shares outstanding | 948 | |||
| Net assets | $ | 13,069 | ||
| Class Y: Net asset value per share | $ | 13.84 | ||
| Shares outstanding | 1,769 | |||
| Net assets | $ | 24,484 |
The accompanying notes are an integral part of these financial statements.
| 33 |
| The Hartford Balanced Income Fund |
| Statement of Operations |
| For the Year Ended October 31, 2014 |
| (000’s Omitted) |
| Investment Income: | ||||
| Dividends | $ | 69,744 | ||
| Interest | 95,003 | |||
| Less: Foreign tax withheld | (1,443 | ) | ||
| Total investment income | 163,304 | |||
| Expenses: | ||||
| Investment management fees | 26,639 | |||
| Administrative services fees | ||||
| Class R3 | 162 | |||
| Class R4 | 74 | |||
| Class R5 | 12 | |||
| Transfer agent fees | ||||
| Class A | 2,042 | |||
| Class B | 41 | |||
| Class C | 1,290 | |||
| Class I | 640 | |||
| Class R3 | 2 | |||
| Class R4 | 1 | |||
| Class R5 | 1 | |||
| Class Y | — | |||
| Distribution fees | ||||
| Class A | 5,278 | |||
| Class B | 51 | |||
| Class C | 15,852 | |||
| Class R3 | 404 | |||
| Class R4 | 124 | |||
| Custodian fees | 49 | |||
| Accounting services fees | 925 | |||
| Registration and filing fees | 324 | |||
| Board of Directors' fees | 114 | |||
| Audit fees | 44 | |||
| Other expenses | 703 | |||
| Total expenses (before waivers and fees paid indirectly) | 54,772 | |||
| Expense waivers | (128 | ) | ||
| Commission recapture | (14 | ) | ||
| Custodian fee offset | — | |||
| Total waivers and fees paid indirectly | (142 | ) | ||
| Total expenses, net | 54,630 | |||
| Net Investment Income | 108,674 | |||
| Net Realized Gain on Investments, Other Financial Instruments and Foreign Currency Transactions: | ||||
| Net realized gain on investments | 83,149 | |||
| Net realized loss on purchased option contracts | (7 | ) | ||
| Net realized loss on futures contracts | (4,311 | ) | ||
| Net realized gain on written option contracts | 4 | |||
| Net realized gain on swap contracts | 3,331 | |||
| Net realized gain on foreign currency contracts | 633 | |||
| Net realized gain on other foreign currency transactions | 155 | |||
| Net Realized Gain on Investments, Other Financial Instruments and Foreign Currency Transactions | 82,954 | |||
| Net Changes in Unrealized Appreciation of Investments, Other Financial Instruments and Foreign Currency Transactions: | ||||
| Net unrealized appreciation of investments | 197,189 | |||
| Net unrealized depreciation of purchased option contracts | (2 | ) | ||
| Net unrealized appreciation of futures contracts | 3,335 | |||
| Net unrealized appreciation of written option contracts | — | |||
| Net unrealized depreciation of swap contracts | (2,695 | ) | ||
| Net unrealized appreciation of foreign currency contracts | 789 | |||
| Net unrealized depreciation of translation of other assets and liabilities in foreign currencies | (76 | ) | ||
| Net Changes in Unrealized Appreciation of Investments, Other Financial Instruments and Foreign Currency Transactions | 198,540 | |||
| Net Gain on Investments, Other Financial Instruments and Foreign Currency Transactions | 281,494 | |||
| Net Increase in Net Assets Resulting from Operations | $ | 390,168 |
The accompanying notes are an integral part of these financial statements.
| 34 |
| The Hartford Balanced Income Fund |
| Statement of Changes in Net Assets |
| (000’s Omitted) |
| For the Year Ended October 31, 2014 | For the Year Ended October 31, 2013 | |||||||
| Operations: | ||||||||
| Net investment income | $ | 108,674 | $ | 71,749 | ||||
| Net realized gain on investments, other financial instruments and foreign currency transactions | 82,954 | 51,350 | ||||||
| Net unrealized appreciation of investments, other financial instruments and foreign currency transactions | 198,540 | 175,930 | ||||||
| Net Increase in Net Assets Resulting from Operations | 390,168 | 299,029 | ||||||
| Distributions to Shareholders: | ||||||||
| From net investment income | ||||||||
| Class A | (51,722 | ) | (36,895 | ) | ||||
| Class B | (480 | ) | (454 | ) | ||||
| Class C | (28,398 | ) | (17,560 | ) | ||||
| Class I | (20,830 | ) | (12,046 | ) | ||||
| Class R3 | (1,787 | ) | (895 | ) | ||||
| Class R4 | (1,231 | ) | (584 | ) | ||||
| Class R5 | (316 | ) | (158 | ) | ||||
| Class Y | (518 | ) | (240 | ) | ||||
| Total from net investment income | (105,282 | ) | (68,832 | ) | ||||
| From net realized gain on investments | ||||||||
| Class A | (25,647 | ) | (14,201 | ) | ||||
| Class B | (280 | ) | (205 | ) | ||||
| Class C | (18,534 | ) | (8,323 | ) | ||||
| Class I | (8,332 | ) | (3,831 | ) | ||||
| Class R3 | (849 | ) | (354 | ) | ||||
| Class R4 | (515 | ) | (187 | ) | ||||
| Class R5 | (125 | ) | (2 | ) | ||||
| Class Y | (207 | ) | (31 | ) | ||||
| Total from net realized gain on investments | (54,489 | ) | (27,134 | ) | ||||
| Total distributions | (159,771 | ) | (95,966 | ) | ||||
| Capital Share Transactions: | ||||||||
| Class A | 331,849 | 647,022 | ||||||
| Class B | (3,146 | ) | 3,266 | |||||
| Class C | 480,007 | 612,834 | ||||||
| Class I | 396,094 | 261,056 | ||||||
| Class R3 | 43,669 | 28,556 | ||||||
| Class R4 | 14,585 | 20,396 | ||||||
| Class R5 | 3,184 | 8,675 | ||||||
| Class Y | 9,177 | 11,938 | ||||||
| Net increase from capital share transactions | 1,275,419 | 1,593,743 | ||||||
| Net Increase in Net Assets | 1,505,816 | 1,796,806 | ||||||
| Net Assets: | ||||||||
| Beginning of period | 3,945,586 | 2,148,780 | ||||||
| End of period | $ | 5,451,402 | $ | 3,945,586 | ||||
| Undistributed (distributions in excess of) net investment income | $ | 8,415 | $ | 6,636 | ||||
The accompanying notes are an integral part of these financial statements.
| 35 |
| The Hartford Balanced Income Fund |
| Notes to Financial Statements |
| October 31, 2014 |
| (000’s Omitted) |
Organization:
The Hartford Mutual Funds, Inc. (“Company”) is an open-end management investment company comprised of forty-two portfolios. Financial statements for The Hartford Balanced Income Fund (the "Fund"), a series of the Company, are included in this report.
The Company is organized under the laws of the State of Maryland and is registered with the Securities and Exchange Commission (“SEC”) under the Investment Company Act of 1940, as amended (“1940 Act”). The Fund is a diversified open-end management investment company. The Fund is an investment company and applies specialized accounting and reporting under Accounting Standards Codification Topic 946, Financial Services - Investment Companies.
Class A shares are sold with a front-end sales charge of up to 5.50%. Class B shares were sold with a contingent deferred sales charge which is assessed on the lesser of the per share net asset value (“NAV”) of the shares at the time of redemption or the original purchase price, and declines from up to 5.00% to zero depending on the period of time the shares are held (see note below regarding the closing of Class B shares). Class C shares are sold with a contingent deferred sales charge of up to 1.00% on shares redeemed within twelve months of purchase. Class I shares are sold without sales charges to certain eligible investors primarily through advisory fee-based wrap programs. Class R3, R4 and R5 shares, which are offered to employer-sponsored retirement plans, and Class Y shares, which are sold to certain eligible institutional investors, are sold without a sales charge. All classes of shares have identical voting, redemption, dividend, liquidation and other rights and the same terms and conditions, with the exceptions that each class may have different expenses, which may affect performance, and that Class B shares automatically convert to Class A shares after 8 years.
No new or additional investments are allowed in Class B shares of the Fund (including investments through any systematic investment plan). Existing shareholders of Class B shares may continue to hold their Class B shares, exchange their Class B shares for Class B shares of another Hartford Fund (as permitted by existing exchange privileges), or redeem their Class B shares as described in the Fund’s prospectus. Reinstatement privileges with respect to Class B shares are set forth in the Fund's prospectus. For investors electing to reinvest capital gains and dividends, any such capital gains or dividends on Class B shares will continue to be reinvested in Class B shares of the Fund. All Class B share attributes, including the 12b-1 fee, contingent deferred sales charge schedule, and conversion to Class A shares, remain unchanged.
Significant Accounting Policies:
The following is a summary of significant accounting policies of the Fund in the preparation of its financial statements, which are in accordance with United States generally accepted accounting principles (“U.S. GAAP”). The preparation of financial statements in accordance with U.S. GAAP may require management to make estimates and assumptions that affect the reported amounts of assets and liabilities and disclosure of contingent assets and liabilities at the date of the financial statements and the reported amounts of increases and decreases in net assets from operations during the reporting period. Actual results could differ from those estimates.
Determination of Net Asset Value – The NAV of each class of the Fund's shares is determined as of the close of regular trading (normally 4:00 p.m. Eastern Time) (the “NYSE Close”) on each day that the New York Stock Exchange (the “Exchange”) is open (“Valuation Date”). Information that becomes known to the Fund after the NAV has been calculated on a particular day will not generally be used to retroactively adjust the NAV determined earlier that day.
Investment Valuation and Fair Value Measurements – For purposes of calculating the NAV, portfolio investments and other assets held by the Fund's portfolio for which market quotes are readily available are valued at market value. Market value is generally determined on the basis of last reported sales prices or official close price. If no sales are reported, market value is based on quotes obtained from a quotation reporting system, established market makers, or independent pricing services. If market prices are not readily available or are deemed unreliable, the Fund will use the fair value of the investment as determined in good faith under policies and procedures established by and under the supervision of the Company's Board of Directors. Market quotes are considered not readily available where there is an absence of current or reliable market-based data (e.g., trade information or indicative market quotes), including where events occur after the close of the relevant market, but prior to the NYSE Close, that materially affect the values of the Fund's portfolio investments or assets. In addition, market quotes are considered not readily available when, due to extraordinary circumstances, the exchanges or markets on which the investments trade do not open for trading for the entire day and no other market prices are available. In addition, prices of foreign equities that are principally traded on certain foreign markets may
| 36 |
| The Hartford Balanced Income Fund |
| Notes to Financial Statements – (continued) |
| October 31, 2014 |
| (000’s Omitted) |
be adjusted daily pursuant to a fair value pricing service approved by the Board of Directors in order to reflect an adjustment for the factors occurring after the close of certain foreign markets but before the NYSE Close. Investments that are primarily traded on foreign markets may trade on days that are not business days of the Fund. The value of the foreign investments in which the Fund invests may change on days when a shareholder will not be able to purchase or redeem shares of the Fund. Fair value pricing is subjective in nature and the use of fair value pricing by the Fund may cause the NAV of its shares to differ significantly from the NAV that would have been calculated using market prices at the close of the exchange on which a portfolio investment is primarily traded. There can be no assurance that the Fund could obtain the fair market value assigned to an investment if the Fund were to sell the investment at approximately the time at which the Fund determines its NAV.
Fixed income investments (other than short-term obligations), non-exchange traded derivatives and centrally cleared swaps held by the Fund are normally valued on the basis of quotes obtained from independent pricing services or brokers and dealers in accordance with procedures established by the Company's Board of Directors. Prices obtained from independent pricing services use information provided by market makers or estimates of market values through accepted market modeling, trading and pricing conventions. Inputs to the models may include, but are not limited to, prepayment speeds, pricing spread, yield, trade information, dealer quotes, market color, cash flow models and the investment’s terms and conditions. Generally, the Fund may use fair valuation in regard to fixed income investments when the Fund holds defaulted or distressed investments or investments in a company in which a reorganization is pending. Senior floating rate interests generally trade in over-the-counter (“OTC”) markets and are priced through an independent pricing service utilizing independent market quotations from loan dealers or financial institutions. A composite bid price is used, which is an average of the dealer marks and dealer runs. Short-term investments maturing in 60 days or less are generally valued at amortized cost, if their original term to maturity was 60 days or less, or by amortizing their value on the 61st day prior to maturity, if the original term to maturity exceeded 60 days, which approximates fair value.
Exchange traded options, futures and options on futures are valued at the settlement price or last trade price determined by the relevant exchange as of the NYSE Close. If the last trade price for exchange traded options does not fall between the bid and ask prices, the value will be the mean of the bid and ask prices as of the NYSE Close. If a last trade price is not available, the value will be the mean of the bid and ask prices as of the NYSE Close. If a mean of the bid and ask prices cannot be calculated for the day, the value will be the bid price as of the NYSE Close. In the case of OTC options and such instruments that do not trade on an exchange, values may be supplied by a pricing service using a formula or other objective method that may take into consideration the style, direction, expiration, strike price, notional value and volatility or other special adjustments.
Investments valued in currencies other than U.S. dollars are converted to U.S. dollars using exchange rates obtained from independent pricing services for calculation of the NAV. As a result, the NAV of the Fund’s shares may be affected by changes in the value of currencies in relation to the U.S. dollar. The value of investments traded in markets outside the United States or denominated in currencies other than the U.S. dollar may be affected significantly on a day that the NYSE is closed and the market value may change on days when an investor is not able to purchase, redeem or exchange shares of the Fund.
Foreign currency contracts represent agreements to exchange currencies on specific future dates at predetermined rates. Foreign currency contracts are valued using foreign currency exchange rates and forward rates as provided by an independent pricing service on the Valuation Date.
Financial instruments for which prices are not available from an independent pricing service may be valued using market quotations obtained from one or more dealers that make markets in the respective financial instrument in accordance with procedures established by the Company's Board of Directors.
U.S. GAAP defines fair value as the price that the Fund would receive to sell an asset or pay to transfer a liability in an orderly transaction between market participants. The U.S. GAAP fair value measurement standards require disclosure of a fair value hierarchy for each major category of assets and liabilities. Various inputs are used in determining the fair value of the Fund’s investments. These inputs are summarized into three broad hierarchy levels. This hierarchy is based on whether the valuation inputs are observable or unobservable. These levels are:
Level 1 – Quoted prices in active markets for identical investments. Level 1 may include exchange traded instruments, such as domestic equities, some foreign equities, options, futures, mutual funds, exchange traded funds, rights and warrants.
| 37 |
| The Hartford Balanced Income Fund |
| Notes to Financial Statements – (continued) |
| October 31, 2014 |
| (000’s Omitted) |
Level 2 – Observable inputs other than Level 1 prices, such as quoted prices for similar investments; quoted prices in markets that are not active; or other inputs that are observable or can be corroborated by observable market data. Level 2 may include debt investments that are traded less frequently than exchange traded instruments and which are valued using independent pricing services; foreign equities, which are principally traded on certain foreign markets and are adjusted daily pursuant to a fair value pricing service in order to reflect an adjustment for the factors occurring after the close of certain foreign markets but before the NYSE Close; senior floating rate interests, which are valued using an aggregate of dealer bids; short-term investments, which are valued at amortized cost; and swaps, which are valued based upon the terms of each swap contract.
Level 3 – Significant unobservable inputs that are supported by limited or no market activity. Level 3 may include financial instruments whose values are determined using indicative market quotes or require significant management judgment or estimation. These unobservable valuation inputs may include estimates for current yields, maturity/duration, prepayment speed, and indicative market quotes for comparable investments along with other assumptions relating to credit quality, collateral value, complexity of the investment structure, general market conditions and liquidity. This category may include investments where trading has been halted or there are certain restrictions on trading. While these investments are priced using unobservable inputs, the valuation of these investments reflects the best available data and management believes the prices are a reasonable representation of exit price.
The Board of Directors of the Company generally reviews and approves the “Procedures for Valuation of Portfolio Securities” at least once a year. These procedures define how investments are to be valued, including the formation and activities of a Valuation Committee. The Valuation Committee is responsible for determining in good faith the fair value of investments when the value cannot be obtained from primary pricing services or alternative sources or if the valuation of an investment as provided by the primary pricing service or alternative source is believed not to reflect the investment’s fair value as of the Valuation Date. Voting members of the Valuation Committee include the Fund's Treasurer or designee and a Vice President of the investment manager or designee. An Assistant Vice President of the Fund with legal expertise or designee is also included on the Valuation Committee as a non-voting advisory member. In addition, the Fund’s Chief Compliance Officer shall designate a member of the compliance group to attend Valuation Committee meetings as a non-voting resource, to monitor for and provide guidance with respect to compliance with these procedures. Two members of the Valuation Committee or their designees, representing different departments, shall constitute a quorum for purposes of permitting the Valuation Committee to take action. The Valuation Committee will consider all relevant factors in determining an investment’s fair value, and may seek the advice of the Fund’s sub-adviser, knowledgeable brokers, and legal counsel in making such determination. The Valuation Committee reports to the Audit Committee of the Company's Board of Directors. The Audit Committee receives quarterly written reports which include details of all fair-valued investments, including the reason for the fair valuation, and an indication, when possible, of the accuracy of the valuation by disclosing the next available reliable public price quotation or the disposition price of such investments (the “look-back” test). The Board of Directors then must consider for ratification all of the fair value determinations made during the previous quarter.
Valuation levels are not necessarily indicative of the risk associated with investing in such investments. Individual investments within any of the above mentioned asset classes may be assigned a different hierarchical level than those presented above, as individual circumstances dictate.
For additional information, refer to the Investment Valuation Hierarchy Level Summary and the Level 3 roll-forward reconciliation, if applicable, which follow the Schedule of Investments.
Investment Transactions and Investment Income – Investment transactions are recorded as of the trade date (the date the order to buy or sell is executed) for financial reporting purposes. Investments purchased or sold on a when-issued or delayed-delivery basis may be settled a month or more after the trade date. Realized gains and losses are determined on the basis of identified cost.
Trade date for senior floating rate interests purchased in the primary loan market is considered the date on which the loan allocations are determined. Trade date for senior floating rate interests purchased in the secondary loan market is the date on which the transaction is entered into.
| 38 |
| The Hartford Balanced Income Fund |
| Notes to Financial Statements – (continued) |
| October 31, 2014 |
| (000’s Omitted) |
Dividend income from domestic securities is accrued on the ex-dividend date. In general, dividend income from foreign securities is recorded on the ex-date; however, dividend notifications in certain foreign jurisdictions may not be available in a timely manner and as a result, the Fund will record the dividend as soon as the relevant details (i.e., rate per share, payment date, shareholders of record, etc.) are publicly available. Interest income, including amortization of premium, accretion of discounts and additional principal received in-kind in lieu of cash, is accrued on a daily basis. Paydown gains and losses on mortgage related and other asset backed securities are included in interest income in the Statement of Operations, as applicable.
Foreign Currency Transactions – Assets and liabilities denominated in currencies other than U.S. dollars are translated into U.S. dollars at the exchange rates in effect on the valuation date. Purchases and sales of investments, income and expenses are translated into U.S. dollars at the exchange rates on the dates of such transactions.
The Fund does not isolate that portion of portfolio investment valuation resulting from fluctuations in the foreign currency exchange rates from the fluctuations arising from changes in the market prices of investments held. Exchange rate fluctuations are included with the net realized and unrealized gain or loss on investments in the accompanying financial statements.
Net realized foreign exchange gains or losses arise from sales of foreign currencies and the difference between asset and liability amounts initially stated in foreign currencies and the U.S. dollar value of the amounts actually received or paid. Net unrealized foreign exchange gains or losses arise from changes in the value of other assets and liabilities at the end of the reporting period, resulting from changes in the exchange rates.
Joint Trading Account – The Fund may invest cash balances into a joint trading account that may be invested in one or more repurchase agreements.
Fund Share Valuation and Dividend Distributions to Shareholders – Orders for the Fund’s shares are executed in accordance with the investment instructions of the shareholders. The NAV of the Fund’s shares is determined as of the close of business on each business day of the Exchange. The NAV is determined separately for each class of shares of the Fund by dividing the Fund’s net assets attributable to that class by the number of shares of the class outstanding. Each class of shares offered by the Fund has equal rights as to assets and voting privileges (except that shareholders of a class have exclusive voting rights regarding any matter relating solely to that class of shares). Income and non-class specific expenses are allocated daily to each class on the basis of the relative net assets of the class. Realized and unrealized gains and losses are allocated daily based on the relative net assets of each class of shares of the Fund.
Orders for the purchase of the Fund’s shares received prior to the close of the Exchange on any day the Exchange is open for business are priced at the NAV determined as of the close of the Exchange. Orders received after the close of the Exchange, or on a day on which the Exchange and/or the Fund is not open for business, are priced at the next determined NAV.
Dividends are declared pursuant to a policy adopted by the Company's Board of Directors based upon the investment performance of the Fund. The policy of the Fund is to pay dividends from net investment income, if any, quarterly and realized gains, if any, at least once a year.
Net investment income, dividends and distributions from net realized gains and capital are determined in accordance with federal income tax regulations, which may differ from U.S. GAAP with respect to character and timing (see Federal Income Taxes: Distributions and Components of Distributable Earnings and Reclassification of Capital Accounts).
Securities and Other Investments:
Repurchase Agreements – A repurchase agreement is an agreement by which a counterparty agrees to sell an investment and agrees to repurchase the investment sold from the buyer at a mutually agreed upon time and price. During the period of the repurchase agreement, the counterparty will deposit cash and or securities in a third party custodial account to serve as collateral. At the time the Fund enters into a repurchase agreement, the value of the underlying collateral, including accrued interest, will be equal to or exceed the value of the repurchase agreement. Repurchase agreements expose the Fund to counterparty risk - that is, the risk that the counterparty will not fulfill its obligations. To minimize counterparty risk, the investments that serve to collateralize the
| 39 |
| The Hartford Balanced Income Fund |
| Notes to Financial Statements – (continued) |
| October 31, 2014 |
| (000’s Omitted) |
repurchase agreement are held by the Fund’s custodian in book entry or physical form in the custodial account of the Fund or in a third party custodial account. Repurchase agreements are valued at cost plus accrued interest, which approximates fair value. Repurchase agreements have master netting arrangements which allow the Fund to offset amounts owed to a counterparty with amounts owed by the counterparty, including any collateral. Upon an event of default under a master repurchase agreement, the non-defaulting party may close out all transactions traded under such agreement and net amounts owed under each transaction to one net amount payable by one party to the other. Absent an event of default, the master repurchase agreement does not result in an offset of reported amounts of assets and liabilities in the Statement of Assets and Liabilities across transactions between the Fund and the applicable counterparty. The Fund, as shown on the Schedule of Investments, had outstanding repurchase agreements and related collateral as of October 31, 2014.
Illiquid and Restricted Investments – The Fund is permitted to invest up to 15% of its net assets in illiquid investments. Illiquid investments are those that may not be sold or disposed of in the ordinary course of business within seven days, at approximately the price used to determine the Fund’s NAV. The Fund may not be able to sell illiquid investments when its sub-adviser considers it desirable to do so or may have to sell such investments at a price that is lower than the price that could be obtained if the investments were more liquid. A sale of illiquid investments may require more time and may result in higher dealer discounts and other selling expenses than does the sale of those that are liquid. Illiquid investments also may be more difficult to value due to the unavailability of reliable market quotations for such investments, and an investment in them may have an adverse impact on the Fund’s NAV. The Fund may also purchase certain restricted investments that can only be resold to certain qualified investors and may be determined to be liquid pursuant to policies and guidelines established by the Company's Board of Directors. The Fund, as shown on the Schedule of Investments, had illiquid or restricted investments as of October 31, 2014.
Investments Purchased on a When-Issued or Delayed-Delivery Basis – Delivery and payment for investments that have been purchased by the Fund on a forward commitment, or when-issued or delayed-delivery basis, take place beyond the customary settlement period. The Fund may dispose of or renegotiate a delayed-delivery transaction after it is entered into, and may sell delayed-delivery investments before they are delivered, which may result in a realized gain or loss. During this period, such investments are subject to market fluctuations, and the Fund identifies investments segregated in its records with a value at least equal to the amount of the commitment. The Fund, as shown on the Schedule of Investments, had when-issued or delayed-delivery investments as of October 31, 2014.
Senior Floating Rate Interests – The Fund may invest in senior floating rate interests. Senior floating rate interests hold the most senior position in the capital structure of a business entity (the “Borrower”), are typically secured by specific collateral and have a claim on the assets and/or stock of the Borrower that is senior to the assets held by subordinated debtholders and stockholders of the Borrower. Senior floating rate interests are typically structured and administered by a financial institution that acts as the agent of the lenders participating in the senior floating rate interest. The Fund may invest in multiple series or tranches of a senior floating rate interest, which may have varying terms and carry different associated risks. The Fund may also enter into unfunded loan commitments, which are contractual obligations for future funding. Unfunded loan commitments may include revolving credit facilities, which may obligate the Fund to supply additional cash to the borrower on demand, representing a potential financial obligation by the Fund in the future. The Fund may receive a commitment fee based on the undrawn portion of the underlying line of credit portion of a senior floating rate interest. In certain circumstances, the Fund may receive various fees upon the restructure of a senior floating rate interest by a borrower. Fees earned/paid are recorded as a component of income or realized gain/loss in the Statement of Operations.
Senior floating rate interests are typically rated below-investment-grade, which suggests the risk of default is higher, and generally pay higher interest rates than investment-grade debt securities. A default could lead to non-payment of income or principal, which would result in a reduction of investment income to the Fund, and there can be no assurance that the liquidation of any collateral would satisfy the Borrower’s obligation in the event of non-payment of scheduled interest or principal payments, or that such collateral could be readily liquidated. The Fund, as shown on the Schedule of Investments, had senior floating rate interests as of October 31, 2014.
Inflation Indexed Bonds – The Fund may invest in inflation indexed bonds. Inflation indexed bonds are fixed income investments whose principal value is periodically adjusted to the rate of inflation. The interest rate on these bonds is generally fixed at issuance at a rate lower than typical bonds. Over the life of an inflation indexed bond, however, interest will be paid based on a principal value, which is adjusted for inflation. Any increase or decrease in the principal amount of an inflation indexed bond will be included as
| 40 |
| The Hartford Balanced Income Fund |
| Notes to Financial Statements – (continued) |
| October 31, 2014 |
| (000’s Omitted) |
interest income on the Statement of Operations, even though investors do not receive the principal amount until maturity. The Fund, as shown on the Schedule of Investments, had inflation indexed bonds as of October 31, 2014.
Mortgage Related and Other Asset Backed Securities – The Fund may invest in mortgage related and other asset backed securities. These securities include mortgage pass-through securities, collateralized mortgage obligations, commercial mortgage backed securities, stripped mortgage backed securities, asset backed securities, collateralized debt obligations and other securities that directly or indirectly represent a participation in, or are secured by and payable from, mortgage loans on real property. Mortgage related securities are created from pools of residential or commercial mortgage loans, including mortgage loans made by savings and loan institutions, mortgage bankers, commercial banks and other similar financial institutions. Asset backed securities are created from many types of assets, including auto loans, credit card receivables, home equity loans, and student loans. These securities provide a monthly payment that consists of both interest and principal payments. Interest payments may be determined by fixed or adjustable rates. The rate of pre-payments on underlying mortgages will affect the price and volatility of a mortgage related security, and may have the effect of shortening or extending the effective duration of the security relative to what was anticipated at the time of purchase. The timely payment of principal and interest of certain mortgage related securities is guaranteed by the full faith and credit of the United States Government. Mortgage related and other asset backed securities created and guaranteed by non-governmental issuers, including government-sponsored corporations, may be supported by various forms of insurance or guarantees, but there can be no assurance that the private insurers or guarantors can meet their obligations under the insurance policies or guarantee arrangements. The Fund, as shown on the Schedule of Investments, had outstanding mortgage related and other asset backed securities as of October 31, 2014.
Financial Derivative Instruments:
The following disclosures contain information on how and why the Fund uses derivative instruments, the credit-risk-related contingent features in certain derivative instruments and how derivative instruments affect the Fund’s financial position and results of operations. The location and fair value amounts of these instruments on the Statement of Assets and Liabilities and the realized gains and losses and changes in unrealized gains and losses on the Statement of Operations, each categorized by type of derivative contract, are included in the following Additional Derivative Instrument Information footnote. The derivative instruments outstanding as of year-end are disclosed in the notes to the Schedule of Investments, if applicable. The amounts of realized gains and losses and changes in unrealized gains and losses on derivative instruments during the year are disclosed in the Statement of Operations.
Foreign Currency Contracts – The Fund may enter into foreign currency contracts that obligate the Fund to purchase or sell currencies at specified future dates. Foreign currency contracts are used to hedge the currency exposure associated with some or all of the Fund’s investments and/or as part of an investment strategy. Foreign currency contracts are marked to market daily and the change in value is recorded by the Fund as an unrealized gain or loss. The Fund will record a realized gain or loss when the foreign currency contract is settled.
Foreign currency contracts involve elements of market risk in excess of the amounts reflected in the Statement of Assets and Liabilities. In addition, risks may arise upon entering into these contracts from the potential inability of the counterparties to meet the terms of the contracts and from unanticipated movements in the value of the foreign currencies relative to the U.S. dollar. The Fund, as shown on the Schedule of Investments, had outstanding foreign currency contracts as of October 31, 2014.
Futures Contracts – The Fund may enter into futures contracts. A futures contract is an agreement between two parties to buy or sell an asset at a set price on a future date. The Fund uses futures contracts to manage or obtain exposure to the investment markets, commodities, or movements in interest rates and currency values. The primary risks associated with the use of futures contracts are the imperfect correlation between the change in market value of the investments held by the Fund and the prices of futures contracts and the possibility of an illiquid market. Upon entering into a futures contract, the Fund is required to deposit with a futures commission merchant (“FCM”) an amount of cash or U.S. Government or Agency Obligations in accordance with the initial margin requirements of the broker or exchange. Futures contracts are marked to market daily at the most recent settlement price reported by an exchange on which, over time, they are traded most extensively, and an appropriate payable or receivable for the change in value (“variation margin”) is recorded by the Fund. Gains or losses are recognized but not considered realized until the contracts expire or are closed. Futures contracts involve, to varying degrees, risk of loss in excess of the variation margin disclosed on the Statement of
| 41 |
| The Hartford Balanced Income Fund |
| Notes to Financial Statements – (continued) |
| October 31, 2014 |
| (000’s Omitted) |
Assets and Liabilities; however, the Fund seeks to reduce this risk through the use of an FCM. The Fund, as shown on the Schedule of Investments, had outstanding futures contracts as of October 31, 2014.
Options Contracts – An option contract is a contract sold by one party to another party that offers the buyer the right, but not the obligation, to buy (call) or sell (put) an investment or other financial asset at an agreed-upon price during a specific period of time or on a specific date. Options contracts are either privately negotiated in the over-the-counter market ("OTC options") or executed in a registered exchange ("exchange traded options"). The Fund may write (sell) covered call and put options on futures, swaps (“swaptions”), securities, commodities or currencies. “Covered” means that so long as the Fund is obligated as the writer of an option, it will own either the underlying investments or currency or an option to purchase the same underlying investments or currency having an expiration date of the covered option and an exercise price equal to or less than the exercise price of the covered option, or will pledge cash or other liquid investments having a value equal to or greater than the fluctuating market value of the option investment or currency. Writing put options increases the Fund’s exposure to the underlying instrument. Writing call options decreases the Fund’s exposure to the underlying instrument. Premiums received from writing options that expire are treated as realized gains. Premiums received from writing options that are exercised or closed are added to the proceeds or offset amounts paid on the underlying futures, swap, investment or currency transaction to determine the realized gain or loss. The Fund as a writer of an option has no control over whether the underlying instrument may be sold (call) or purchased (put) and as a result bears the market risk of an unfavorable change in the price of the instrument underlying the written option. There is the risk the Fund may not be able to enter into a closing transaction because of an illiquid market. The Fund may also purchase put and call options. Purchasing call options increases the Fund’s exposure to the underlying instrument. Purchasing put options decreases the Fund’s exposure to the underlying instrument. The Fund pays a premium, which is included on the Fund’s Statement of Assets and Liabilities as an investment and is subsequently marked to market to reflect the current value of the option. Premiums paid for purchasing options that expire are treated as realized losses. Certain options may be purchased with premiums to be determined on a future date. The premiums for these options are based upon implied volatility parameters at specified terms. The risk associated with purchasing put and call options is generally limited to the premium paid. Premiums paid for purchasing options that are exercised or closed are added to the amounts paid or offset against the proceeds on the underlying investment transaction to determine the realized gain or loss. Entering into over-the-counter options also exposes the Fund to counterparty risk. Counterparty risk is the possibility that the counterparty to the agreements may default on its obligation to perform or disagree as to the meaning of the contractual terms in the agreements.
The Fund, as shown on the Schedule of Investments, had outstanding purchased and written option contracts as of October 31, 2014. Transactions involving written option contracts during the year ended October 31, 2014, are summarized below:
| Options Contract Activity During the Year Ended October 31, 2014: | ||||||||
| Call Options Written During the Year | Number of Contracts* | Premium Amounts | ||||||
| Beginning of the period | — | $ | — | |||||
| Written | 3,979,016 | 9 | ||||||
| Expired | — | — | ||||||
| Closed | (16 | ) | (3 | ) | ||||
| Exercised | — | — | ||||||
| End of period | 3,979,000 | $ | 6 | |||||
| Put Options Written During the Year | Number of Contracts* | Premium Amounts | ||||||
| Beginning of the period | — | $ | — | |||||
| Written | 3,979,000 | 4 | ||||||
| Expired | — | — | ||||||
| Closed | (1,775,000 | ) | (1 | ) | ||||
| Exercised | — | — | ||||||
| End of period | 2,204,000 | $ | 3 | |||||
* The number of contracts does not omit 000's.
Swap Contracts – The Fund may invest in swap contracts. Swap contracts are agreements to exchange or swap investment cash flows, assets, foreign currencies or market-linked returns at specified, future intervals. Swap contracts are either privately negotiated in the over-the-counter market (“OTC swaps”) or cleared in a central clearing house (“centrally cleared swaps”). The Fund may enter into credit default, total return, cross-currency, interest rate, inflation and other forms of swap contracts to manage its exposure to credit, currency, interest rate, commodity and inflation risk. Swap contracts are also used to gain exposure to certain markets. In
| 42 |
| The Hartford Balanced Income Fund |
| Notes to Financial Statements – (continued) |
| October 31, 2014 |
| (000’s Omitted) |
connection with these contracts, investments or cash may be identified as collateral or margin in accordance with the terms of the respective swap contracts and/or master netting arrangement to provide assets of value and recourse in the event of default or bankruptcy/insolvency.
Swaps are valued based on custom valuations furnished by an independent pricing service. Swaps for which prices are not available from an independent pricing service are valued in accordance with procedures established by the Company's Board of Directors. Changes in market value, if any, are reflected as a component of net changes in unrealized appreciation or depreciation on the Statement of Operations. Daily changes in valuation of centrally cleared swaps, if any, are recorded as a receivable or payable for the change in value (“variation margin”) on the Statement of Assets and Liabilities. Realized gains or losses on centrally cleared swaps are recorded upon the termination of the swap. OTC swap payments received or paid at the beginning of the measurement period are reflected as such on the Statement of Assets and Liabilities and represent premiums paid or received upon entering into the swap contract to compensate for differences between the stated terms of the swap contract and prevailing market conditions (credit spreads, currency exchange rates, interest rates and other relevant factors). These upfront premiums are recorded as realized gains or losses on the Statement of Operations upon termination or maturity of the swap. A liquidation payment received or made at the termination or maturity of the swap is recorded as a realized gain or loss on the Statement of Operations. Net periodic payments received or paid by the Fund are included as part of realized gains or losses on the Statement of Operations.
Entering into these contracts involves, to varying degrees, elements of liquidation, counterparty, credit and market risk in excess of the amounts recognized on the Statement of Assets and Liabilities. Such risks involve the possibility that there will be no liquid market for these contracts, that the counterparty to the contracts may default on its obligation to perform or disagree as to the meaning of contractual terms in the contracts, and that there may be unfavorable changes in market conditions (credit spreads, currency exchange rates, interest rates and other relevant factors).
The Fund’s maximum risk of loss from counterparty risk for OTC swaps is the net value of the discounted cash flows to be received from the counterparty over the contract’s remaining life, and current market value, to the extent that amount is positive. The risk is mitigated by having a master netting arrangement between the Fund and the counterparty, which allows for the netting of payments made or received (although such amounts are presented on a gross basis within the Statement of Assets and Liabilities, as applicable) as well as the posting of collateral to the Fund to cover the Fund’s exposure to the counterparty. In a centrally cleared swap, while the Fund enters into an agreement with a clearing broker to execute contracts with a counterparty, the performance of the swap is guaranteed by the central clearinghouse, which reduces the Fund’s exposure to counterparty risk. The Fund is still exposed to the counterparty risk through the clearing broker and clearinghouse. The clearinghouse attempts to minimize this risk to its participants through the use of mandatory margin requirements, daily cash settlements and other procedures. Likewise, the clearing broker reduces its risk through margin requirements and required segregation of customer balances.
Credit Default Swap Contracts – The credit default swap market allows the Fund to manage its exposure to the market or certain sectors of the market, to reduce its risk exposure to defaults of corporate and sovereign issuers, or to create exposure to corporate or sovereign issuers to which it is not otherwise exposed. Certain credit default swaps involve the exchange of a fixed rate premium for protection against the loss in value of an underlying investment or index in the event of a credit event, such as payment default or bankruptcy.
Under a credit default swap contract, one party acts as guarantor by receiving the fixed periodic payment in exchange for the commitment to purchase the underlying investment at par if the defined credit event occurs. Upon the occurrence of a defined credit event, the difference between the value of the reference obligation and the swap’s notional amount is recorded as realized gain or loss on swap transactions in the Statement of Operations. A “buyer” of credit protection agrees to pay a counterparty to assume the credit risk of an issuer upon the occurrence of certain events. The “seller” of the protection receives periodic payments and agrees to assume the credit risk of an issuer upon the occurrence of certain events. Although specified events are contract specific, credit events are generally defined as bankruptcy, failure to pay, restructuring, obligation acceleration, obligation default or repudiation/moratorium. A “seller’s” exposure is limited to the total notional amount of the credit default swap contract. These potential amounts would be partially offset by any recovery values of the respective referenced obligations or upfront payments received upon entering into the contract.
| 43 |
| The Hartford Balanced Income Fund |
| Notes to Financial Statements – (continued) |
| October 31, 2014 |
| (000’s Omitted) |
Implied credit spreads, represented in absolute terms, utilized in determining the market value of credit default swap contracts on corporate issues, sovereign government issues or U.S. municipal issues as of year-end are disclosed in the notes to the Schedule of Investments, as applicable, and serve as an indicator of the current status of the payment/performance risk and represent the likelihood or risk of default for the credit derivative. The implied credit spread of a particular referenced entity reflects the cost of buying/selling protection and there may also be upfront payments required to be made to enter into the contract. Wider credit spreads represent a deterioration of the referenced entity’s credit soundness and a greater likelihood or risk of default or other credit event occurring as defined under the terms of the contract. For credit default swap contracts on credit indices, the quoted market prices and resulting values serve as the indicator of the current status of the payment/performance risk. Increasing market values, in absolute terms when compared to the notional amount of the swap, represent a deterioration of the referenced equity’s credit soundness and a greater likelihood or risk of default or other credit event occurring as defined under the terms of the contract. The Fund, as shown on the Schedule of Investments, had outstanding credit default swap contracts as of October 31, 2014.
Interest Rate Swap Contracts – The Fund is subject to interest rate risk exposure in the normal course of pursuing its investment objectives. Because the Fund holds fixed rate bonds, the value of these bonds may decrease if interest rates rise. To hedge against this risk and to maintain its ability to generate income at prevailing market rates, the Fund may enter into interest rate swap contracts. In a typical interest rate swap, one party agrees to make regular payments equal to a floating interest rate, based on a specified interest rate or benchmark (e.g. London Interbank Offered Rate (“LIBOR”)), multiplied by a notional amount, in return for payments equal to a fixed rate multiplied by the same amount, for a specific period of time. The net interest received or paid on interest rate swap contracts is recorded as a realized gain or loss. Interest rate swaps are marked to market daily and the change, if any, is recorded as an unrealized gain or loss in the Statement of Operations. When the interest rate swap contract is terminated early, the Fund records a realized gain or loss equal to the difference between the current market value and the upfront premium or cost.
If an interest rate swap contract provides for payments in different currencies, the parties might agree to exchange the notional amount as well. Interest rate swaps may also depend on other prices or rates, such as the value of an index. The risks of interest rate swaps include changes in market conditions which will affect the value of the contract or the cash flows and the possible inability of the counterparty to fulfill its obligations under the contract. The Fund’s maximum risk of loss from counterparty credit risk is the discounted net value of the cash flows to be received from the counterparty over the contract’s remaining life, to the extent that amount is positive. The Fund, as shown on the Schedule of Investments, had outstanding interest rate swap contracts as of October 31, 2014.
Additional Derivative Instrument Information:
Fair Value of Derivative Instruments on the Statement of Assets and Liabilities as of October 31, 2014:
| Risk Exposure Category | ||||||||||||||||||||||||||||
Interest Rate | Foreign | Credit | Equity | Commodity | Other | Total | ||||||||||||||||||||||
| Assets: | ||||||||||||||||||||||||||||
| Investments in securities, at value (purchased option contracts), market value | $ | — | $ | — | $ | — | $ | — | $ | — | $ | — | $ | — | ||||||||||||||
| Unrealized appreciation on foreign currency contracts | — | 742 | — | — | — | — | 742 | |||||||||||||||||||||
| Unrealized appreciation on OTC swap contracts | — | — | 409 | — | — | — | 409 | |||||||||||||||||||||
| Variation margin receivable * | 2,529 | — | 9 | — | — | — | 2,538 | |||||||||||||||||||||
| Total | $ | 2,529 | $ | 742 | $ | 418 | $ | — | $ | — | $ | — | $ | 3,689 | ||||||||||||||
| Liabilities: | ||||||||||||||||||||||||||||
| Unrealized depreciation on foreign currency contracts | $ | — | $ | 219 | $ | — | $ | — | $ | — | $ | — | $ | 219 | ||||||||||||||
| Unrealized depreciation on OTC swap contracts | — | — | 51 | — | — | — | 51 | |||||||||||||||||||||
| Variation margin payable * | 2,180 | — | — | — | — | — | 2,180 | |||||||||||||||||||||
| Written option contracts, market value | — | — | 9 | — | — | — | 9 | |||||||||||||||||||||
| Total | $ | 2,180 | $ | 219 | $ | 60 | $ | — | $ | — | $ | — | $ | 2,459 | ||||||||||||||
* Only current day's variation margin is reported within the Statement of Assets and Liabilities. The variation margin is included in the open futures net cumulative appreciation of $3,469 and open centrally cleared swaps net cumulative appreciation of $16 as reported in the Schedule of Investments.
| 44 |
| The Hartford Balanced Income Fund |
| Notes to Financial Statements – (continued) |
| October 31, 2014 |
| (000’s Omitted) |
The ratio of futures market value to net assets at October 31, 2014 was 30.79%, compared to the twelve-month average ratio of 13.63% during the year ended October 31, 2014.
The Effect of Derivative Instruments on the Statement of Operations for the year ended October 31, 2014:
| Risk Exposure Category | ||||||||||||||||||||||||||||
Interest Rate | Foreign | Credit | Equity | Commodity | Other | Total | ||||||||||||||||||||||
| Realized Gain (Loss) on Derivatives Recognized as a Result of Operations: | ||||||||||||||||||||||||||||
| Net realized loss on purchased option contracts | $ | (7 | ) | $ | — | $ | — | $ | — | $ | — | $ | — | $ | (7 | ) | ||||||||||||
| Net realized loss on futures contracts | (4,311 | ) | — | — | — | — | — | (4,311 | ) | |||||||||||||||||||
| Net realized gain on written option contracts | 3 | — | 1 | — | — | — | 4 | |||||||||||||||||||||
| Net realized gain on swap contracts | — | — | 3,331 | — | — | — | 3,331 | |||||||||||||||||||||
| Net realized gain on foreign currency contracts | — | 633 | — | — | — | — | 633 | |||||||||||||||||||||
| Total | $ | (4,315 | ) | $ | 633 | $ | 3,332 | $ | — | $ | — | $ | — | $ | (350 | ) | ||||||||||||
| Net Change in Unrealized Appreciation (Depreciation) on Derivatives Recognized as a Result of Operations: | ||||||||||||||||||||||||||||
| Net change in unrealized depreciation of purchased option contracts | $ | — | $ | — | $ | (2 | ) | $ | — | $ | — | $ | — | $ | (2 | ) | ||||||||||||
| Net change in unrealized appreciation of futures contracts | 3,335 | — | — | — | — | — | 3,335 | |||||||||||||||||||||
| Net change in unrealized appreciation of written option contracts | — | — | — | — | — | — | — | |||||||||||||||||||||
| Net change in unrealized depreciation of swap contracts | (1 | ) | — | (2,694 | ) | — | — | — | (2,695 | ) | ||||||||||||||||||
| Net change in unrealized appreciation of foreign currency contracts | — | 789 | — | — | — | — | 789 | |||||||||||||||||||||
| Total | $ | 3,334 | $ | 789 | $ | (2,696 | ) | $ | — | $ | — | $ | — | $ | 1,427 | |||||||||||||
Balance Sheet Offsetting Information - The following discloses both gross information and net information about instruments and transactions eligible for offset in the financial statements, and instruments and transactions that are subject to a master netting arrangement, as well as amounts related to margin, reflected as financial collateral (including cash collateral), held at clearing brokers, counterparties and the Fund’s custodian. The master netting arrangements allow the clearing brokers to net any collateral held in or on behalf of the Fund, or liabilities or payment obligations of the clearing brokers to the Fund, against any liabilities or payment obligations of the Fund to the clearing brokers. The Fund is required to deposit financial collateral (including cash collateral) at the FCM's custodian on behalf of clearing brokers and counterparties to continually meet the original and maintenance requirements established by the clearing brokers and counterparties. Such requirements are specific to the respective clearing broker or counterparty. Certain master netting arrangements may not be enforceable in the bankruptcy proceedings of a counterparty.
Offsetting of Financial Assets and Derivative Assets as of October 31, 2014:
Gross Amounts* | Financial | Non-cash | Cash Collateral | Net Amount (not | ||||||||||||||||
| Description | ||||||||||||||||||||
| OTC purchased option and OTC swap contracts at market value | $ | 797 | $ | (104 | ) | $ | — | $ | (566 | )† | $ | 127 | ||||||||
| Futures contracts - variation margin receivable | 2,529 | (2,180 | ) | — | — | 349 | ||||||||||||||
| Swap contracts - variation margin receivable | 9 | — | — | — | 9 | |||||||||||||||
| Unrealized appreciation on foreign currency contracts | 742 | (187 | ) | — | — | 555 | ||||||||||||||
| Total subject to a master netting or similar arrangement | $ | 4,077 | $ | (2,471 | ) | $ | — | $ | (566 | ) | $ | 1,040 | ||||||||
| * | Gross amounts are presented here as there are no amounts that are netted within the Statement of Assets and Liabilities. |
| † | An additional $9 of cash collateral was received by the Fund related to derivative assets. |
| 45 |
| The Hartford Balanced Income Fund |
| Notes to Financial Statements – (continued) |
| October 31, 2014 |
| (000’s Omitted) |
Offsetting of Financial Liabilities and Derivative Liabilities as of October 31, 2014:
Gross Amounts* | Financial | Non-cash | Cash Collateral | Net Amount (not | ||||||||||||||||
| Description | ||||||||||||||||||||
| OTC written option and OTC swap contracts at market value | $ | 286 | $ | (104 | ) | $ | — | $ | — | $ | 182 | |||||||||
| Futures contracts - variation margin payable | 2,180 | (2,180 | ) | — | (5,059 | ) | — | |||||||||||||
| Swaps contracts - variation margin payable | — | — | — | — | — | |||||||||||||||
| Unrealized depreciation on foreign currency contracts | 219 | (187 | ) | — | — | 32 | ||||||||||||||
| Total subject to a master netting or similar arrangement | $ | 2,685 | $ | (2,471 | ) | $ | — | $ | (5,059 | ) | $ | 214 | ||||||||
| * | Gross amounts are presented here as there are no amounts that are netted within the Statement of Assets and Liabilities. |
Certain derivatives held by the Fund, as of October 31, 2014, are not subject to a master netting arrangement and are excluded from the table above.
Principal Risks:
Credit risk depends largely on the perceived financial health of bond issuers. In general, the credit rating is inversely related to the credit risk of the issuer. Higher rated bonds generally are deemed to have less credit risk, while lower or unrated bonds are deemed to have higher risk of default. The share price, yield and total return of a fund that holds securities with higher credit risk may be more volatile than those of a fund that holds bonds with lower credit risk. Similar to credit risk, the Fund may be exposed to counterparty risk, or the risk that an institution or other entity with which the Fund has unsettled or open transactions will default.
The Fund’s investments expose the Fund to various risks including, but not limited to, interest rate, prepayment, extension, foreign currency and equity risks. Interest rate risk is the risk that fixed income securities will decline in value because of changes in interest rates. As nominal interest rates rise, the values of certain fixed income securities held by the Fund are likely to decrease. A nominal interest rate can be described as the sum of a real interest rate and an expected inflation rate. Fixed income securities with longer durations tend to be more sensitive to changes in interest rates, usually making them more volatile than securities with shorter durations. Duration is useful primarily as a measure of the sensitivity of a fixed income security’s market price to interest rate (i.e., yield) movements. Senior floating rate interests and securities subject to prepayment and extension risk generally offer less potential for gains when interest rates decline. Rising interest rates may cause prepayments to occur at a slower than expected rate, thereby effectively lengthening the maturity of the security and making the security more sensitive to interest rate changes. Prepayment and extension risk are major risks of mortgage backed securities, senior floating rate interests and certain asset backed securities. For certain asset backed securities, the actual maturity may be less than the stated maturity shown in the Schedule of Investments, if applicable. As a result, the timing of income recognition relating to these securities may vary based upon the actual maturity.
If the Fund invests directly in foreign currencies or in securities that trade in, and receive revenues in, foreign currencies, or in derivatives that provide exposure to foreign currencies, it will be subject to the risk that those currencies will decline in value relative to the base currency (U.S. dollars) of the Fund, or, in the case of hedging positions, that the Fund’s base currency will decline in value relative to the currency being hedged. Currency rates in foreign countries may fluctuate significantly over short periods of time for a number of reasons, including changes in interest rates, intervention (or the failure to intervene) by U.S. or foreign governments, central banks or supranational entities, such as the International Monetary Fund, or by the imposition of currency controls or other political developments in the United States or abroad. As a result, the Fund’s investments in foreign currency denominated securities may reduce the returns of the Fund. The market values of equity securities, such as common stocks and preferred stocks, or equity related investments, such as futures and options, may decline due to general market conditions which are not specifically related to a particular company, such as real or perceived adverse economic conditions, changes in the general outlook for corporate earnings, changes in interest or currency rates or adverse investor sentiment generally. The market value of equity securities may also decline due to factors which affect a particular industry or industries, such as labor shortages or increased production costs and competitive conditions within an industry. Equity securities and equity related investments generally have greater market price volatility than fixed income securities.
| 46 |
| The Hartford Balanced Income Fund |
| Notes to Financial Statements – (continued) |
| October 31, 2014 |
| (000’s Omitted) |
Federal Income Taxes:
Federal Income Taxes – For federal income tax purposes, the Fund intends to continue to qualify as a Regulated Investment Company ("RIC") under Subchapter M of the Internal Revenue Code (“IRC”) by distributing substantially all of its taxable net investment income and net realized capital gains to its shareholders and otherwise complying with the requirements of the IRC. The Fund has distributed substantially all of its income and capital gains in prior years, if applicable, and intends to distribute substantially all of its income and capital gains during the calendar year ending December 31, 2014. Accordingly, no provision for federal income or excise taxes has been made in the accompanying financial statements. Distributions from short-term capital gains are treated as ordinary income distributions for federal income tax purposes.
Net Investment Income (Loss), Net Realized Gains (Losses) and Distributions – Net investment income (loss) and net realized gains (losses) may differ for financial statement and tax purposes primarily because of losses deferred due to wash sale adjustments, foreign currency gains and losses, adjustments related to Passive Foreign Investment Companies ("PFICs"), Real Estate Investment Trusts ("REITs"), RICs, certain derivatives and partnerships. The character of distributions made during the year from net investment income or net realized gains may differ from their ultimate characterization for federal income tax purposes. Also, due to the timing of dividend distributions, the fiscal year in which amounts are distributed may differ from the year that the income or realized gains (losses) were recorded by the Fund.
Distributions and Components of Distributable Earnings – The tax character of distributions paid by the Fund for the periods indicated is as follows (as adjusted for dividends payable, if applicable):
| For the Year Ended October 31, 2014 | For the Year Ended October 31, 2013 | |||||||
| Ordinary Income | $ | 115,187 | $ | 82,184 | ||||
| Long-Term Capital Gains ‡ | 44,584 | 13,782 | ||||||
| ‡ | The Fund designates these distributions as long-term capital gain dividends pursuant to IRC Sec. 852(b)(3)(C). |
As of October 31, 2014, the Fund’s components of distributable earnings (deficit) on a tax basis are as follows:
| Amount | ||||
| Undistributed Ordinary Income | $ | 26,524 | ||
| Undistributed Long-Term Capital Gain | 69,258 | |||
| Unrealized Appreciation* | 502,897 | |||
| Total Accumulated Earnings | $ | 598,679 | ||
| * | Differences between book-basis and tax-basis unrealized appreciation (depreciation) may be attributable to the losses deferred due to wash sale adjustments, foreign currency gains and losses, adjustments related to PFICs, REITs, RICs, certain derivatives and partnerships. |
Reclassification of Capital Accounts – The Fund may record reclassifications in its capital accounts. These reclassifications have no impact on the total net assets of the Fund. The reclassifications are a result of permanent differences between U.S. GAAP and tax accounting for such items as foreign currency, PFICs, expiration or utilization of capital loss carryforwards or net operating losses. Adjustments are made to reflect the impact these items have on current and future distributions to shareholders. Therefore, the source of the Fund’s distributions may be shown in the accompanying Statement of Changes in Net Assets as from undistributed net investment income, from accumulated net realized gains on investments or from capital depending on the type of book and tax differences that exist. For the year ended October 31, 2014, the Fund recorded reclassifications to increase (decrease) the accounts listed below:
| Amount | ||||
| Undistributed Net Investment Income (Loss) | $ | (1,613 | ) | |
| Accumulated Net Realized Gain (Loss) | 1,613 | |||
| 47 |
| The Hartford Balanced Income Fund |
| Notes to Financial Statements – (continued) |
| October 31, 2014 |
| (000’s Omitted) |
Capital Loss Carryforward – On December 22, 2010, the Regulated Investment Company Modernization Act of 2010 (the “Act”) was enacted, which made changes to the capital loss carryforward rules. The changes are effective for taxable years beginning after the date of enactment. Under the Act, funds are permitted to carry forward capital losses for an unlimited period. Additionally, capital loss carryforwards retain their character as either short-term or long-term capital losses rather than being considered all short-term as permitted under prior regulation.
The Fund had no capital loss carryforward for U.S. federal income tax purposes as of October 31, 2014.
Accounting for Uncertainty in Income Taxes – The Fund has adopted financial reporting rules that require the Fund to analyze all open tax years, as defined by the statute of limitations, for all major jurisdictions. Generally, tax authorities can examine all tax returns filed for the last three years. The Fund does not have an examination in progress.
The Fund has reviewed all open tax years and major jurisdictions and concluded that these financial reporting rules had no effect on the Fund’s financial position or results of operations. There is no tax liability resulting from unrecognized tax benefits relating to uncertain income tax positions taken or expected to be taken on the tax return for the fiscal year ended October 31, 2014. The Fund is also not aware of any tax positions for which it is reasonably possible that the total amounts of unrecognized tax benefits will significantly change in the next twelve months.
Expenses:
Investment Management Agreement – Hartford Funds Management Company, LLC ("HFMC") serves as the Fund’s investment manager pursuant to an Investment Management Agreement with the Company. HFMC is an indirect wholly owned subsidiary of The Hartford Financial Services Group, Inc. ("The Hartford"). The investment manager has overall investment supervisory responsibility for the Fund. In addition, the investment manager provides administrative personnel, services, equipment, facilities and office space for proper operation of the Fund. HFMC has contracted with Wellington Management Company, LLP ("Wellington Management") under a sub-advisory agreement for the provision of day-to-day investment management services to the Fund in accordance with the Fund’s investment objective and policies. The Fund pays a fee to the investment manager, a portion of which may be used to compensate Wellington Management.
The schedule below reflects the rates of compensation paid to the investment manager for investment management services rendered as of October 31, 2014; the rates are accrued daily and paid monthly:
| Average Daily Net Assets | Annual Fee |
| On first $250 million | 0.700% |
| On next $250 million | 0.630% |
| On next $500 million | 0.600% |
| On next $1.5 billion | 0.570% |
| On next $2.5 billion | 0.550% |
| On next $5 billion | 0.530% |
| Over $10 billion | 0.525% |
Accounting Services Agreement – Pursuant to the Fund Accounting Agreement between HFMC and the Company, on behalf of the Fund, HFMC provides accounting services to the Fund and receives monthly compensation based on the Fund’s average daily net assets at the rates set forth below. The Fund’s accounting services fees are accrued daily and paid monthly.
| Average Daily Net Assets | Annual Fee |
| On first $5 billion | 0.020% |
| On next $5 billion | 0.015% |
| Over $10 billion | 0.010% |
| 48 |
| The Hartford Balanced Income Fund |
| Notes to Financial Statements – (continued) |
| October 31, 2014 |
| (000’s Omitted) |
Operating Expenses – Allocable expenses incurred by the Company are allocated to each Fund and allocated to classes within the Fund in proportion to the average daily net assets of the Fund and each class, except where allocation of certain expenses is more fairly made directly to the Fund or to specific classes within a Fund. As of October 31, 2014, HFMC contractually limited the total operating expenses of this Fund, exclusive of taxes, interest expense, brokerage commissions, acquired fund fees and expenses and extraordinary expenses, through February 28, 2015 as follows:
| Class A | Class B* | Class C | Class I | Class R3 | Class R4 | Class R5 | Class Y |
| 0.99% | 1.74% | 1.74% | 0.74% | 1.24% | 0.94% | 0.69% | 0.64% |
* The reduction in amounts charged in connection with Class B Distribution and Service Plan (12b-1) fees that took effect June 30, 2012, in order to comply with applicable FINRA rules, caused the limit on net operating expenses attributable to Class B shares to be, effectively, 0.99%.
Fees Paid Indirectly – The Fund has entered into agreements with State Street Global Markets, LLC and Russell Implementation Services, Inc. to partially recapture non-discounted trade commissions. Such rebates are used to pay a portion of the Fund’s expenses. In addition, the Fund's custodian bank has agreed to reduce its fees when the Fund maintains cash on deposit in a non-interest-bearing custody account. For the year ended October 31, 2014, these amounts, if any, are included in the Statement of Operations.
The ratio of expenses to average net assets in the accompanying financial highlights excludes the reduction in expenses related to fees paid indirectly. The annualized expense ratio after waivers for the period listed below reflecting the reduction for fees paid indirectly is as follows:
| Year Ended October 31, 2014 | ||||
| Class A | 0.97 | % | ||
| Class B | 0.99 | |||
| Class C | 1.70 | |||
| Class I | 0.70 | |||
| Class R3 | 1.24 | |||
| Class R4 | 0.94 | |||
| Class R5 | 0.69 | |||
| Class Y | 0.62 | |||
Distribution and Service Plan for Class A, B, C, R3 and R4 Shares – Hartford Funds Distributors, LLC ("HFD"), an indirect wholly owned subsidiary of The Hartford, is the principal underwriter and distributor of the Fund. HFD is engaged in distribution activities, which include marketing and distribution of shares through broker/dealers, financing distribution costs and maintaining financial books and records. For the year ended October 31, 2014, HFD received front-end load sales charges of $15,439 and contingent deferred sales charges of $321 from the Fund.
The Fund has adopted a Distribution and Service Plan in accordance with Rule 12b-1 of the 1940 Act to compensate the distributor (HFD) for activities intended to result in the sale and distribution of Class A, B, C, R3 and R4 shares and for providing services for shareholders. The Rule 12b-1 plan applicable to Class A shares of the Fund provides for payment of a Rule 12b-1 fee of 0.25% of average daily net assets. Some or all of the fee may be used for shareholder servicing expenses with the remainder used for distribution expenses. Under the Class B Plan, the Fund pays the distributor 1.00% of the average daily net assets of Class B shares that are outstanding for 8 years or less, 0.25% of which is a fee for services provided to existing shareholders with the remainder used for distribution expenses. Effective June 30, 2012, there was a reduction in the amount charged in connection with the Class B shares’ Rule 12b-1 fee from 1.00% to 0.25% in accordance with applicable FINRA rules, although it is possible that such fees may be charged in the future. Some or the entire Rule 12b-1 fee for Class B shares may be remitted to broker/dealers for distribution and/or shareholder account services. After eight years, Class B shares convert to Class A shares. Upon conversion to Class A shares, the Class A plan described above will apply to those shares. Under the Class C Plan, the Fund pays the distributor 1.00% of the average daily net assets of Class C shares outstanding, 0.25% of which is intended as a fee for services provided to existing shareholders with
| 49 |
| The Hartford Balanced Income Fund |
| Notes to Financial Statements – (continued) |
| October 31, 2014 |
| (000’s Omitted) |
the remainder used for distribution expenses. For Class C shares, some or the entire fee may be remitted to broker/dealers for distribution and/or shareholder account services. Class R3 shares have a distribution fee of 0.50% of average daily net assets and Class R4 shares have a distribution fee of 0.25% of average daily net assets. For Class R3 and R4 shares, some or the entire fee may be remitted to broker/dealers for distribution and/or shareholder account services. The Fund’s 12b-1 fees are accrued daily and paid monthly or at such other intervals as the Board of Directors may determine.
Other Related Party Transactions – Certain officers of the Fund are directors and/or officers of HFMC and/or The Hartford or its subsidiaries. For the year ended October 31, 2014, a portion of the Fund’s Chief Compliance Officer’s compensation was paid by all of the investment companies in the Hartford fund complex. The portion allocated to the Fund, as represented in other expenses on the Statement of Operations, was in the amount of $8. Hartford Administrative Services Company (“HASCO”), an indirect wholly-owned subsidiary of The Hartford, provides transfer agent services to the Fund. HASCO has contractually agreed to reimburse any portion of the transfer agency fees over 0.30% of average daily net assets per fiscal year for each class. Any transfer agency fee reimbursement is determined before considering the contractual operating expense limitation. For providing such services, HASCO is compensated on a per account basis that varies by account type, except with respect to Class Y, for which it is compensated based on average daily net assets. The amount paid to HASCO and any related contractual reimbursement amounts, if applicable, can be found in the Statement of Operations. These fees are accrued daily and paid monthly.
Administrative services fees are paid to HASCO for third-party recordkeeping services that are payable as a percentage of net assets in the amount of up to 0.20%, 0.15% and 0.10% for Classes R3, R4 and R5 shares, respectively. The total administrative services fees are shown on the Statement of Operations. These fees are accrued daily and paid monthly.
Investment Transactions:
For the year ended October 31, 2014, the cost of purchases and proceeds from sales of investment securities (excluding short-term investments) were as follows:
| Excluding U.S. Government Obligations | U.S. Government Obligations | Total | ||||||||||
| Cost of Purchases | $ | 2,933,652 | $ | 27,000 | $ | 2,960,652 | ||||||
| Sales Proceeds | 1,727,444 | 66,033 | 1,793,477 | |||||||||
| 50 |
| The Hartford Balanced Income Fund |
| Notes to Financial Statements – (continued) |
| October 31, 2014 |
| (000’s Omitted) |
Capital Share Transactions:
The following information is for the year ended October 31, 2014, and the year ended October 31, 2013:
For the Year Ended October 31, 2014 | For the Year Ended October 31, 2013 | |||||||||||||||||||||||||||||||
Shares Sold | Shares Issued | Shares | Net Increase (Decrease) of Shares | Shares | Shares Issued | Shares | Net Increase (Decrease) of Shares | |||||||||||||||||||||||||
| Class A | ||||||||||||||||||||||||||||||||
| Shares | 51,873 | 5,684 | (32,666 | ) | 24,891 | 69,317 | 3,998 | (21,724 | ) | 51,591 | ||||||||||||||||||||||
| Amount | $ | 694,460 | $ | 75,233 | $ | (437,844 | ) | $ | 331,849 | $ | 871,692 | $ | 49,453 | $ | (274,123 | ) | $ | 647,022 | ||||||||||||||
| Class B | ||||||||||||||||||||||||||||||||
| Shares | 213 | 51 | (498 | ) | (234 | ) | 551 | 47 | (335 | ) | 263 | |||||||||||||||||||||
| Amount | $ | 2,828 | $ | 676 | $ | (6,650 | ) | $ | (3,146 | ) | $ | 6,896 | $ | 573 | $ | (4,203 | ) | $ | 3,266 | |||||||||||||
| Class C | ||||||||||||||||||||||||||||||||
| Shares | 49,862 | 3,183 | (16,831 | ) | 36,214 | 58,722 | 1,850 | (11,341 | ) | 49,231 | ||||||||||||||||||||||
| Amount | $ | 661,025 | $ | 41,562 | $ | (222,580 | ) | $ | 480,007 | $ | 731,990 | $ | 22,616 | $ | (141,772 | ) | $ | 612,834 | ||||||||||||||
| Class I | ||||||||||||||||||||||||||||||||
| Shares | 41,224 | 1,817 | (13,707 | ) | 29,334 | 33,806 | 1,019 | (14,100 | ) | 20,725 | ||||||||||||||||||||||
| Amount | $ | 555,342 | $ | 24,120 | $ | (183,368 | ) | $ | 396,094 | $ | 426,625 | $ | 12,635 | $ | (178,204 | ) | $ | 261,056 | ||||||||||||||
| Class R3 | ||||||||||||||||||||||||||||||||
| Shares | 4,024 | 196 | (972 | ) | 3,248 | 3,229 | 100 | (1,082 | ) | 2,247 | ||||||||||||||||||||||
| Amount | $ | 54,134 | $ | 2,613 | $ | (13,078 | ) | $ | 43,669 | $ | 41,043 | $ | 1,238 | $ | (13,725 | ) | $ | 28,556 | ||||||||||||||
| Class R4 | ||||||||||||||||||||||||||||||||
| Shares | 1,857 | 123 | (879 | ) | 1,101 | 3,315 | 56 | (1,722 | ) | 1,649 | ||||||||||||||||||||||
| Amount | $ | 24,762 | $ | 1,635 | $ | (11,812 | ) | $ | 14,585 | $ | 41,439 | $ | 702 | $ | (21,745 | ) | $ | 20,396 | ||||||||||||||
| Class R5 | ||||||||||||||||||||||||||||||||
| Shares | 363 | 33 | (155 | ) | 241 | 766 | 13 | (85 | ) | 694 | ||||||||||||||||||||||
| Amount | $ | 4,835 | $ | 441 | $ | (2,092 | ) | $ | 3,184 | $ | 9,590 | $ | 160 | $ | (1,075 | ) | $ | 8,675 | ||||||||||||||
| Class Y | ||||||||||||||||||||||||||||||||
| Shares | 915 | 53 | (292 | ) | 676 | 1,005 | 21 | (81 | ) | 945 | ||||||||||||||||||||||
| Amount | $ | 12,385 | $ | 705 | $ | (3,913 | ) | $ | 9,177 | $ | 12,714 | $ | 263 | $ | (1,039 | ) | $ | 11,938 | ||||||||||||||
| Total | ||||||||||||||||||||||||||||||||
| Shares | 150,331 | 11,140 | (66,000 | ) | 95,471 | 170,711 | 7,104 | (50,470 | ) | 127,345 | ||||||||||||||||||||||
| Amount | $ | 2,009,771 | $ | 146,985 | $ | (881,337 | ) | $ | 1,275,419 | $ | 2,141,989 | $ | 87,640 | $ | (635,886 | ) | $ | 1,593,743 | ||||||||||||||
The following reflects the conversion of Class B shares into Class A shares (reflected as Class A shares sold) for the year ended October 31, 2014, and the year ended October 31, 2013:
| Shares | Dollars | |||||||
| For the Year Ended October 31, 2014 | 50 | $ | 665 | |||||
| For the Year Ended October 31, 2013 | 29 | $ | 370 | |||||
Line of Credit:
The Fund is one of several Hartford Funds that participate in a $500 million committed revolving line of credit facility. The facility is to be used for temporary or emergency purposes. Under the arrangement, the funds are required to own securities having a market value in excess of 300% of the total bank borrowings. The interest rate on borrowings varies depending on the nature of the loan. The facility also requires a fee to be paid based on the amount of the commitment. This commitment fee is allocated to all the funds participating in the line of credit based on the average net assets of the funds. During the year ended October 31, 2014, the Fund did not have any borrowings under this facility.
Pending Legal Proceedings:
On February 25, 2011, Jennifer L. Kasilag, Louis Mellinger, Judith M. Menendez, Jacqueline M. Robinson, and Linda A. Russell filed a derivative lawsuit against Hartford Investment Financial Services, LLC (“HIFSCO”) (now known as HFD) on behalf of six Hartford retail mutual funds in the United States District Court for the District of New Jersey, alleging that HIFSCO received excessive advisory and distribution fees in violation of its statutory fiduciary duty under Section 36(b) of the 1940 Act when serving as investment manager and principal underwriter, respectively, to the Hartford retail mutual funds. Although this action was purportedly filed on behalf of certain of the
| 51 |
| The Hartford Balanced Income Fund |
| Notes to Financial Statements – (continued) |
| October 31, 2014 |
| (000’s Omitted) |
Hartford Funds, none of the Hartford Funds is itself a defendant to the suit. HIFSCO moved to dismiss and, in September 2011, the motion was granted in part and denied in part, with leave to amend the complaint. In November 2011, plaintiffs filed an amended complaint on behalf of certain Hartford retail mutual funds, The Hartford Global Health Fund (now known as The Hartford Healthcare Fund), The Hartford Conservative Allocation Fund, The Hartford Growth Opportunities Fund, The Hartford Inflation Plus Fund, The Hartford Advisers Fund (now known as The Hartford Balanced Fund), and The Hartford Capital Appreciation Fund. Plaintiffs seek to rescind the investment management agreements and distribution plans between HIFSCO and these funds and to recover the total fees charged thereunder or, in the alternative, to recover any improper compensation HIFSCO received, in addition to lost earnings. HIFSCO filed a partial motion to dismiss the amended complaint and, in December 2012, the court dismissed without prejudice the claims regarding distribution fees and denied the motion with respect to the advisory fees claims. HIFSCO disputes the allegations and intends to defend vigorously.
In March 2014, the plaintiffs filed a new complaint that added as new plaintiffs The Hartford Floating Rate Fund and The Hartford Small Company Fund and named as a defendant HFMC, which assumed the role as investment manager to the funds as of January 2013. HFMC and HIFSCO dispute the allegations and intend to defend vigorously.
No accrual for litigation relating to this matter has been recorded in the financial statements of the Fund because the Fund is not party to the suit.
Indemnifications:
Under the Company's organizational documents, the Company shall indemnify its officers and directors to the full extent required or permitted under Maryland General Corporation Law and the federal securities laws. In addition, the Company, on behalf of the Fund, may enter into contracts that contain a variety of indemnifications. The Company's maximum exposure under these arrangements is unknown. However, as of the date of these financial statements, the Company has not had prior claims or losses pursuant to these contracts and expects the risk of loss to be remote.
Subsequent Events:
At the August 5-6, 2014 meeting, the Board of Directors approved the creation of Class R6 shares for the Fund. Class R6 shares launched on November 7, 2014. In connection with the launch of the Class R6 shares, an updated prospectus, dated November 7, 2014, and Statement of Additional Information, dated March 1, 2014, as amended November 7, 2014, for the Fund were filed with the U.S. Securities and Exchange Commission.
Effective December 1, 2014, pursuant to a sub-transfer agency agreement between HASCO and Boston Financial Data Services, Inc. (“BFDS”), HASCO has delegated certain transfer agent, dividend disbursing agent and shareholder servicing agent functions to BFDS. The costs and expenses of such delegation are borne by HASCO, not by the Fund.
| 52 |
| The Hartford Balanced Income Fund |
| Financial Highlights |
| - Selected Per-Share Data - (A) | - Ratios and Supplemental Data - | |||||||||||||||||||||||||||||||||||||||||||||||||||
| Class | Net Asset Value at Beginning of Period | Net Investment Income (Loss) | Net Realized and Unrealized Gain (Loss) on Invest- ments | Total from Investment Operations | Dividends from Net Investment Income | Distribu- tions from Realized Capital Gains | Total Dividends and Distributions | Net Asset Value at End of Period | Total Return(B) | Net Assets at End of Period (000's) | Ratio of Expenses to Average Net Assets Before Adjust- ments(C) | Ratio of Expenses to Average Net Assets After Adjust- ments(C) | Ratio of Net Investment Income (Loss) to Average Net Assets | |||||||||||||||||||||||||||||||||||||||
| For the Year Ended October 31, 2014 | ||||||||||||||||||||||||||||||||||||||||||||||||||||
| A | $ | 13.05 | $ | 0.34 | $ | 0.83 | $ | 1.17 | $ | (0.32 | ) | $ | (0.18 | ) | $ | (0.50 | ) | $ | 13.72 | 9.19 | % | $ | 2,317,429 | 0.97 | % | 0.97 | % | 2.56 | % | |||||||||||||||||||||||
| B | 13.01 | 0.34 | 0.84 | 1.18 | (0.32 | ) | (0.18 | ) | (0.50 | ) | 13.69 | 9.25 | 18,846 | 1.07 | 0.99 | 2.56 | ||||||||||||||||||||||||||||||||||||
| C | 12.91 | 0.24 | 0.82 | 1.06 | (0.23 | ) | (0.18 | ) | (0.41 | ) | 13.56 | 8.39 | 1,884,930 | 1.70 | 1.70 | 1.81 | ||||||||||||||||||||||||||||||||||||
| I | 13.05 | 0.38 | 0.83 | 1.21 | (0.36 | ) | (0.18 | ) | (0.54 | ) | 13.72 | 9.47 | 1,031,554 | 0.70 | 0.70 | 2.80 | ||||||||||||||||||||||||||||||||||||
| R3 | 13.10 | 0.30 | 0.84 | 1.14 | (0.29 | ) | (0.18 | ) | (0.47 | ) | 13.77 | 8.90 | 106,894 | 1.32 | 1.24 | 2.26 | ||||||||||||||||||||||||||||||||||||
| R4 | 13.10 | 0.35 | 0.83 | 1.18 | (0.33 | ) | (0.18 | ) | (0.51 | ) | 13.77 | 9.19 | 54,196 | 1.02 | 0.94 | 2.58 | ||||||||||||||||||||||||||||||||||||
| R5 | 13.11 | 0.38 | 0.83 | 1.21 | (0.36 | ) | (0.18 | ) | (0.54 | ) | 13.78 | 9.44 | 13,069 | 0.73 | 0.69 | 2.83 | ||||||||||||||||||||||||||||||||||||
| Y | 13.16 | 0.39 | 0.84 | 1.23 | (0.37 | ) | (0.18 | ) | (0.55 | ) | 13.84 | 9.55 | 24,484 | 0.62 | 0.62 | 2.89 | ||||||||||||||||||||||||||||||||||||
| For the Year Ended October 31, 2013 | ||||||||||||||||||||||||||||||||||||||||||||||||||||
| A | $ | 12.24 | $ | 0.32 | $ | 0.94 | $ | 1.26 | $ | (0.30 | ) | $ | (0.15 | ) | $ | (0.45 | ) | $ | 13.05 | 10.57 | % | $ | 1,879,401 | 0.99 | % | 0.96 | % | 2.53 | % | |||||||||||||||||||||||
| B | 12.20 | 0.32 | 0.94 | 1.26 | (0.30 | ) | (0.15 | ) | (0.45 | ) | 13.01 | 10.60 | 20,966 | 1.10 | 0.96 | 2.55 | ||||||||||||||||||||||||||||||||||||
| C | 12.13 | 0.22 | 0.93 | 1.15 | (0.22 | ) | (0.15 | ) | (0.37 | ) | 12.91 | 9.70 | 1,326,973 | 1.72 | 1.70 | 1.78 | ||||||||||||||||||||||||||||||||||||
| I | 12.24 | 0.35 | 0.94 | 1.29 | (0.33 | ) | (0.15 | ) | (0.48 | ) | 13.05 | 10.84 | 598,310 | 0.73 | 0.71 | 2.77 | ||||||||||||||||||||||||||||||||||||
| R3 | 12.29 | 0.29 | 0.94 | 1.23 | (0.27 | ) | (0.15 | ) | (0.42 | ) | 13.10 | 10.27 | 59,155 | 1.33 | 1.22 | 2.26 | ||||||||||||||||||||||||||||||||||||
| R4 | 12.28 | 0.32 | 0.95 | 1.27 | (0.30 | ) | (0.15 | ) | (0.45 | ) | 13.10 | 10.64 | 37,128 | 1.03 | 0.91 | 2.55 | ||||||||||||||||||||||||||||||||||||
| R5 | 12.29 | 0.36 | 0.94 | 1.30 | (0.33 | ) | (0.15 | ) | (0.48 | ) | 13.11 | 10.90 | 9,269 | 0.73 | 0.69 | 2.80 | ||||||||||||||||||||||||||||||||||||
| Y | 12.34 | 0.36 | 0.95 | 1.31 | (0.34 | ) | (0.15 | ) | (0.49 | ) | 13.16 | 10.91 | 14,384 | 0.63 | 0.62 | 2.81 | ||||||||||||||||||||||||||||||||||||
| For the Year Ended October 31, 2012 | ||||||||||||||||||||||||||||||||||||||||||||||||||||
| A | $ | 11.02 | $ | 0.35 | $ | 1.18 | $ | 1.53 | $ | (0.31 | ) | $ | – | $ | (0.31 | ) | $ | 12.24 | 14.05 | % | $ | 1,131,250 | 1.04 | % | 0.83 | % | 2.98 | % | ||||||||||||||||||||||||
| B | 10.98 | 0.30 | 1.16 | 1.46 | (0.24 | ) | – | (0.24 | ) | 12.20 | 13.44 | 16,451 | 1.54 | 1.30 | 2.55 | |||||||||||||||||||||||||||||||||||||
| C | 10.94 | 0.25 | 1.18 | 1.43 | (0.24 | ) | – | (0.24 | ) | 12.13 | 13.22 | 649,208 | 1.79 | 1.58 | 2.19 | |||||||||||||||||||||||||||||||||||||
| I | 11.02 | 0.37 | 1.18 | 1.55 | (0.33 | ) | – | (0.33 | ) | 12.24 | 14.31 | 307,422 | 0.81 | 0.59 | 3.19 | |||||||||||||||||||||||||||||||||||||
| R3 | 11.06 | 0.31 | 1.20 | 1.51 | (0.28 | ) | – | (0.28 | ) | 12.29 | 13.84 | 27,888 | 1.41 | 1.11 | 2.64 | |||||||||||||||||||||||||||||||||||||
| R4 | 11.06 | 0.33 | 1.21 | 1.54 | (0.32 | ) | – | (0.32 | ) | 12.28 | 14.08 | 14,568 | 1.17 | 0.83 | 2.77 | |||||||||||||||||||||||||||||||||||||
| R5 | 11.06 | 0.38 | 1.18 | 1.56 | (0.33 | ) | – | (0.33 | ) | 12.29 | 14.33 | 164 | 0.76 | 0.56 | 3.29 | |||||||||||||||||||||||||||||||||||||
| Y | 11.05 | 0.37 | 1.26 | 1.63 | (0.34 | ) | – | (0.34 | ) | 12.34 | 14.98 | 1,829 | 0.74 | 0.56 | 3.14 | |||||||||||||||||||||||||||||||||||||
| For the Year Ended October 31, 2011 | ||||||||||||||||||||||||||||||||||||||||||||||||||||
| A | $ | 10.55 | $ | 0.37 | $ | 0.44 | $ | 0.81 | $ | (0.34 | ) | $ | – | $ | (0.34 | ) | $ | 11.02 | 7.78 | % | $ | 395,347 | 1.17 | % | 0.67 | % | 3.44 | % | ||||||||||||||||||||||||
| B | 10.51 | 0.28 | 0.44 | 0.72 | (0.25 | ) | – | (0.25 | ) | 10.98 | 6.96 | 9,328 | 2.05 | 1.50 | 2.61 | |||||||||||||||||||||||||||||||||||||
| C | 10.48 | 0.29 | 0.44 | 0.73 | (0.27 | ) | – | (0.27 | ) | 10.94 | 7.05 | 140,127 | 1.90 | 1.40 | 2.70 | |||||||||||||||||||||||||||||||||||||
| I | 10.54 | 0.39 | 0.45 | 0.84 | (0.36 | ) | – | (0.36 | ) | 11.02 | 8.11 | 62,139 | 0.94 | 0.44 | 3.62 | |||||||||||||||||||||||||||||||||||||
| R3 | 10.58 | 0.32 | 0.46 | 0.78 | (0.30 | ) | – | (0.30 | ) | 11.06 | 7.45 | 5,333 | 1.50 | 1.00 | 2.96 | |||||||||||||||||||||||||||||||||||||
| R4 | 10.58 | 0.37 | 0.44 | 0.81 | (0.33 | ) | – | (0.33 | ) | 11.06 | 7.82 | 463 | 1.22 | 0.70 | 3.37 | |||||||||||||||||||||||||||||||||||||
| R5 | 10.58 | 0.41 | 0.44 | 0.85 | (0.37 | ) | – | (0.37 | ) | 11.06 | 8.13 | 119 | 0.91 | 0.40 | 3.75 | |||||||||||||||||||||||||||||||||||||
| Y | 10.57 | 0.42 | 0.43 | 0.85 | (0.37 | ) | – | (0.37 | ) | 11.05 | 8.23 | 136 | 0.81 | 0.31 | 3.84 | |||||||||||||||||||||||||||||||||||||
See Portfolio Turnover information on the next page.
| 53 |
| The Hartford Balanced Income Fund |
| Financial Highlights – (continued) |
| - Selected Per-Share Data - (A) | - Ratios and Supplemental Data - | |||||||||||||||||||||||||||||||||||||||||||||||||||
| Class | Net Asset Value at Beginning of Period | Net Investment Income (Loss) | Net Realized and Unrealized Gain (Loss) on Invest- ments | Total from Investment Operations | Dividends from Net Investment Income | Distribu- tions from Realized Capital Gains | Total Dividends and Distributions | Net Asset Value at End of Period | Total Return(B) | Net Assets at End of Period (000's) | Ratio of Expenses to Average Net Assets Before Adjust- ments(C) | Ratio of Expenses to Average Net Assets After Adjust- ments(C) | Ratio of Net Investment Income (Loss) to Average Net Assets | |||||||||||||||||||||||||||||||||||||||
| For the Year Ended October 31, 2010 (D) | ||||||||||||||||||||||||||||||||||||||||||||||||||||
| A | $ | 9.44 | $ | 0.33 | $ | 1.11 | $ | 1.44 | $ | (0.33 | ) | $ | – | $ | (0.33 | ) | $ | 10.55 | 15.55 | % | $ | 178,227 | 1.24 | % | 0.74 | % | 3.73 | % | ||||||||||||||||||||||||
| B | 9.40 | 0.29 | 1.07 | 1.36 | (0.25 | ) | – | (0.25 | ) | 10.51 | 14.69 | 5,008 | 2.13 | 1.50 | 3.07 | |||||||||||||||||||||||||||||||||||||
| C | 9.40 | 0.26 | 1.10 | 1.36 | (0.28 | ) | – | (0.28 | ) | 10.48 | 14.66 | 52,740 | 1.98 | 1.48 | 2.82 | |||||||||||||||||||||||||||||||||||||
| I(E) | 9.81 | 0.25 | 0.74 | 0.99 | (0.26 | ) | – | (0.26 | ) | 10.54 | 10.23 | (F) | 17,593 | 0.99 | (G) | 0.49 | (G) | 3.52 | (G) | |||||||||||||||||||||||||||||||||
| R3(H) | 9.75 | 0.13 | 0.84 | 0.97 | (0.14 | ) | – | (0.14 | ) | 10.58 | 10.03 | (F) | 166 | 1.58 | (G) | 1.01 | (G) | 3.03 | (G) | |||||||||||||||||||||||||||||||||
| R4(H) | 9.75 | 0.14 | 0.84 | 0.98 | (0.15 | ) | – | (0.15 | ) | 10.58 | 10.17 | (F) | 112 | 1.28 | (G) | 0.71 | (G) | 3.40 | (G) | |||||||||||||||||||||||||||||||||
| R5(H) | 9.75 | 0.16 | 0.84 | 1.00 | (0.17 | ) | – | (0.17 | ) | 10.58 | 10.33 | (F) | 110 | 0.96 | (G) | 0.41 | (G) | 3.70 | (G) | |||||||||||||||||||||||||||||||||
| Y | 9.46 | 0.42 | 1.05 | 1.47 | (0.36 | ) | – | (0.36 | ) | 10.57 | 15.87 | 126 | 0.86 | 0.35 | 4.24 | |||||||||||||||||||||||||||||||||||||
| (A) | Information presented relates to a share outstanding throughout the indicated period. Net investment income (loss) per share amounts are calculated based on average shares outstanding unless otherwise noted. |
| (B) | Assumes initial investment at net asset value at the beginning of each period, reinvestment of all distributions, the complete redemption of the investment at net asset value at the end of each period and no sales charge. Total return would be reduced if sales charges were taken into account. |
| (C) | Adjustments include waivers and reimbursements, if applicable. Ratios do not include fees paid indirectly (see Expenses in the accompanying Notes to Financial Statements). |
| (D) | Net investment income (loss) per share amounts have been calculated using the SEC method. |
| (E) | Commenced operations on February 26, 2010. |
| (F) | Not annualized. |
| (G) | Annualized. |
| (H) | Commenced operations on May 28, 2010. |
| Portfolio
Turnover Rate for All Share Classes | ||||
| For the Year Ended October 31, 2014 | 40 | % | ||
| For the Year Ended October 31, 2013 | 32 | |||
| For the Year Ended October 31, 2012 | 30 | |||
| For the Year Ended October 31, 2011 | 29 | |||
| For the Year Ended October 31, 2010 | 34 | |||
| 54 |
| Report of Independent Registered Public Accounting Firm |
| The Board of Directors and Shareholders of |
| The Hartford Mutual Funds, Inc. |
We have audited the accompanying statement of assets and liabilities, including the schedule of investments, of The Hartford Balanced Income Fund (one of the portfolios constituting The Hartford Mutual Funds, Inc. (the Funds)) as of October 31, 2014, and the related statement of operations for the year then ended, the statements of changes in net assets for each of the two years in the period then ended, and the financial highlights for the periods indicated therein. These financial statements and financial highlights are the responsibility of the Funds’ management. Our responsibility is to express an opinion on these financial statements and financial highlights based on our audits.
We conducted our audits in accordance with the standards of the Public Company Accounting Oversight Board (United States). Those standards require that we plan and perform the audit to obtain reasonable assurance about whether the financial statements and financial highlights are free of material misstatement. We were not engaged to perform an audit of the Funds’ internal control over financial reporting. Our audits included consideration of internal control over financial reporting as a basis for designing audit procedures that are appropriate in the circumstances, but not for the purpose of expressing an opinion on the effectiveness of the Funds’ internal control over financial reporting. Accordingly, we express no such opinion. An audit also includes examining, on a test basis, evidence supporting the amounts and disclosures in the financial statements and financial highlights, assessing the accounting principles used and significant estimates made by management, and evaluating the overall financial statement presentation. Our procedures included confirmation of securities owned as of October 31, 2014, by correspondence with the custodian, agent banks and brokers or by other appropriate auditing procedures where replies from agent banks and brokers were not received. We believe that our audits provide a reasonable basis for our opinion.
In our opinion, the financial statements and financial highlights referred to above present fairly, in all material respects, the financial position of The Hartford Balanced Income Fund of The Hartford Mutual Funds, Inc. at October 31, 2014, the results of its operations for the year then ended, the changes in its net assets for each of the two years in the period then ended, and the financial highlights for the periods indicated therein, in conformity with U.S. generally accepted accounting principles.
Minneapolis, Minnesota
December 18, 2014
| 55 |
| The Hartford Balanced Income Fund |
| Directors and Officers (Unaudited) |
The Board of Directors of the Company (the "Directors") appoints officers who are responsible for the day-to-day operations of the Fund and who execute policies formulated by the Directors. Each Director serves until his or her death, resignation, or retirement or until the next annual meeting of shareholders is held or until his or her successor is elected and qualifies.
Directors and officers who are employed by or who have a financial interest in The Hartford Financial Services Group, Inc. ("The Hartford") are considered “interested” persons of the Fund pursuant to the 1940 Act. Each officer and two of the Company's Directors, as noted in the chart below, are “interested” persons of the Fund. Each Director serves as a director for The Hartford Mutual Funds, Inc., The Hartford Mutual Funds II, Inc., Hartford Series Fund, Inc., and Hartford HLS Series Fund II, Inc., and as a trustee for The Hartford Alternative Strategies Fund, which, as of October 31, 2014, collectively consist of 66 funds. Correspondence may be sent to Directors and officers c/o Hartford Funds, 5 Radnor Corporate Center, Suite 300, 100 Matsonford Road, Radnor, Pennsylvania 19087, except that correspondence to Mr. Annoni, Mr. Dressen and Ms. Quade may be sent to 500 Bielenberg Drive, Suite 500, Woodbury, Minnesota 55125.
The table below sets forth, for each Director and officer, his or her name, year of birth, current position with the Company and date first elected or appointed to The Hartford Mutual Funds, Inc. ("MF") and The Hartford Mutual Funds II, Inc. ("MF2"), principal occupation, and, for Directors, other directorships held. The Fund’s Statement of Additional Information contains further information on the Directors and is available free of charge by calling 1-888-843-7824 or writing to: Hartford Funds, P.O. Box 55022, Boston, MA 02205-5022.
Information on the aggregate remuneration paid to the directors of the Company can be found in the Statement of Operations herein. The Fund pays to The Hartford a portion of the Chief Compliance Officer’s compensation, but does not pay salaries or compensation to any of its other officers or Directors who are employed by The Hartford.
Non-Interested Directors
Hilary E. Ackermann (1956) Director since September 23, 2014
Ms. Ackermann served as Chief Risk Officer at Goldman Sachs Bank USA from October 2008 to November 2011 and serves as a Director of Dynegy, Inc., an independent power company, from October 2012 to present.
Lynn S. Birdsong (1946) Director since 2003, Chairman of the Investment Committee since 2014
Mr. Birdsong is a private investor. Mr. Birdsong currently serves as a Director of the Sovereign High Yield Investment Company (April 2010 to current). Mr. Birdsong currently serves as an Independent Director of Nomura Partners Funds, Inc. (formerly, The Japan Fund) (April 2003 to current). From 2003 to March 2005, Mr. Birdsong was an Independent Director of the Atlantic Whitehall Funds. From 1979 to 2002, Mr. Birdsong was a Managing Director of Zurich Scudder Investments, an investment management firm. During his employment with Scudder, Mr. Birdsong was an Interested Director of The Japan Fund. From January 1981 through December 2013, Mr. Birdsong was a partner in Birdsong Company, an advertising specialty firm.
Robert M. Gavin, Jr. (1940) Director since 2002 (MF) and 1986 (MF2), Chairman of the Board for each since 2004
Dr. Gavin is an educational consultant. Prior to September 1, 2001, he was President of Cranbrook Education Community and prior to July 1996, he was President of Macalester College, St. Paul, Minnesota.
Duane E. Hill (1945) Director since 2001 (MF) and 2002 (MF2), Chairman of the Nominating Committee since 2003
Mr. Hill is a Partner of TSG Ventures L.P., a private equity investment company. Mr. Hill is a former partner of TSG Capital Group, a private equity investment firm that served as sponsor and lead investor in leveraged buyouts of middle market companies.
Sandra S. Jaffee (1941) Director since 2005
Ms. Jaffee is the founder and Chief Executive Officer of a private company, Homeworks Concierge, LLC, which provides residential property management services in Westchester County, New York (January 2012 to present). Ms. Jaffee served as Chairman (2008 to 2009) and Chief Executive Officer of Fortent (formerly Searchspace Group), a leading provider of compliance/regulatory technology to financial institutions from August 2005 to August 2009. From August 2004 to August 2005, Ms. Jaffee served as an Entrepreneur in Residence with Warburg Pincus, a private equity firm. Prior to joining Warburg Pincus, Ms. Jaffee served as Executive Vice President at Citigroup, from September 1995 to July 2004, where she was President and Chief Executive Officer of Citibank’s Global Securities Services (1995 to 2003). Ms. Jaffee currently serves as a member of the Board of Directors of Broadridge Financial Solutions as well as a Trustee of Muhlenberg College.
| 56 |
| The Hartford Balanced Income Fund |
| Directors and Officers (Unaudited) – (continued) |
William P. Johnston (1944) Director since 2005, Chairman of the Compliance Committee since 2005
In June 2006, Mr. Johnston was appointed as Senior Advisor to The Carlyle Group, a global private equity and other alternative asset investment firm and currently serves as an Operating Executive. In July 2006, Mr. Johnston was elected to the Board of Directors of MultiPlan, Inc. and served as a Director (July 2006 to August 2010). In August 2007, Mr. Johnston was elected to the Board of Directors of LifeCare Holdings, Inc. and served as a Director (August 2007 to June 2013). In February 2008, Mr. Johnston was elected to the Board of Directors of HCR-ManorCare, Inc. In May 2006, Mr. Johnston was elected to the Supervisory Board of Fresenius Medical Care AG & Co. KGaA, after its acquisition of Renal Care Group, Inc. in March 2006. Mr. Johnston joined Renal Care Group in November 2002 as a member of the Board of Directors and served as Chairman of the Board from March 2003 through March 2006. From 2002 through 2013, Mr. Johnston served as a Board member of the Georgia O’Keefe Museum. From September 1987 to December 2002, Mr. Johnston was with Equitable Securities Corporation (and its successors, SunTrust Equitable Securities and SunTrust Robinson Humphrey) serving in various investment banking and managerial positions, including Managing Director and Head of Investment Banking, Chief Executive Officer and Vice Chairman.
Phillip O. Peterson (1944) Director since 2002 (MF) and 2000 (MF2), Chairman of the Audit Committee since 2002
Mr. Peterson is a mutual fund industry consultant. He was a partner of KPMG LLP (an accounting firm) until July 1999. Mr. Peterson joined William Blair Funds in February 2007 as a member of the Board of Trustees. From February 2012 to February 2014, Mr. Peterson served as a Trustee of Symetra Variable Mutual Funds. From January 2004 to April 2005, Mr. Peterson served as Independent President of the Strong Mutual Funds.
Lemma W. Senbet (1946) Director since 2005
Dr. Senbet is the William E. Mayer Chair Professor of Finance and Founding Director, Center for Financial Policy, at the University of Maryland, Robert H. Smith School of Business. He was chair of the Finance Department of the University of Maryland, Robert H. Smith School of Business from 1998 to 2006. Since June 2013, he has been on leave from the University to serve as Executive Director of African Economic Research Consortium which focuses on economic policy research and training. Previously, he was a chaired professor of finance at the University of Wisconsin-Madison. Also, he was a Director of the Fortis Funds from March 2000 to July 2002. Dr. Senbet served as Director of the American Finance Association and President of the Western Finance Association. In 2006, Dr. Senbet was inducted Fellow of Financial Management Association International for his career-long distinguished scholarship and professional service.
Interested Directors and Officers
James E. Davey (1964) Director since 2012, President and Chief Executive Officer since 2010
Mr. Davey serves as Executive Vice President of Hartford Life Insurance Company (“HLIC”) and The Hartford. Additionally, Mr. Davey serves as Chairman of the Board, Manager and Senior Managing Director of Hartford Funds Distributors, LLC (“HFD”). He also currently serves as Director, Chairman of the Board, President and Senior Managing Director of Hartford Administrative Services Company (“HASCO”). Mr. Davey also serves as Manager, Chairman of the Board and Senior Managing Director for Hartford Funds Management Company, LLC (“HFMC”) and Director, Chairman of the Board and Senior Managing Director for Hartford Funds Management Group, Inc. ("HFMG"). Mr. Davey has served in various positions within The Hartford and its subsidiaries in connection with the operation of the Hartford Funds. Mr. Davey joined The Hartford in 2002.
Lowndes A. Smith* (1939) Director since 1996 (MF) and 2002 (MF2)
Mr. Smith served as Vice Chairman of The Hartford from February 1997 to January 2002, as President and Chief Executive Officer of Hartford Life, Inc. from February 1997 to January 2002, and as President and Chief Operating Officer of The Hartford Life Insurance Companies from January 1989 to January 2002. Mr. Smith serves as a Director of White Mountains Insurance Group Ltd. (October 2003 to current); One Beacon Insurance (October 2006 to current); Symetra Financial (August 2007 to current) and is a Managing Director of Whittington Gray Associates (January 2007 to current).
* Mr. Smith resigned as a Director of MF, MF2, Hartford Series Fund, Inc. and Hartford HLS Series Fund II, Inc. and as a Trustee of The Hartford Alternative Strategies Fund effective September 17, 2014.
Other Officers
Mark A. Annoni (1964) Vice President, Controller and Treasurer since 2012
Mr. Annoni currently serves as the Assistant Vice President of HLIC (February 2004 to present) and Senior Vice President of HFMG (December 2013 to present). Mr. Annoni has served in various positions within The Hartford and its subsidiaries in connection with the operation of the Hartford Funds. Mr. Annoni joined The Hartford in 2001.
| 57 |
| The Hartford Balanced Income Fund |
| Directors and Officers (Unaudited) – (continued) |
Michael R. Dressen (1963) AML Compliance Officer since 2011
Mr. Dressen currently serves as Assistant Vice President of HLIC. He also serves as Chief Compliance Officer and AML Compliance Officer of HASCO and as AML Officer of HFD. Mr. Dressen has served in various positions within The Hartford and its subsidiaries in connection with the operation of the Hartford Funds.
Edward P. Macdonald (1967) Vice President, Secretary and Chief Legal Officer since 2005
Mr. Macdonald currently serves as Assistant Secretary, Executive Vice President and Deputy General Counsel of HFD, HASCO, HFMC and HFMG. He also serves as Vice President of HLIC. Mr. Macdonald has served in various positions within The Hartford and its subsidiaries in connection with the operation of the Hartford Funds. Mr. Macdonald joined The Hartford in 2005.
Joseph G. Melcher (1973) Vice President and Chief Compliance Officer since 2013
Mr. Melcher currently serves as Executive Vice President of HFD, HFMG and HASCO. Mr. Melcher also currently serves as Executive Vice President and Chief Compliance Officer of HFMC. Mr. Melcher has served in various positions within The Hartford and its subsidiaries in connection with the operation of the Hartford Funds since joining The Hartford in 2012. Prior to joining The Hartford, Mr. Melcher worked at Touchstone Investments, a member of the Western & Southern Financial Group, where he held the position of Vice President and Chief Compliance Officer from 2010 through 2012 and Assistant Vice President, Compliance from 2005 to 2010.
Vernon J. Meyer (1964) Vice President since 2006
Mr. Meyer currently serves as Senior Vice President of HLIC. He also currently serves as Managing Director and Chief Investment Officer of HFMC and Managing Director of HFMG. Mr. Meyer has served in various positions within The Hartford and its subsidiaries in connection with the operation of the Hartford Funds. Mr. Meyer joined The Hartford in 2004.
Laura S. Quade (1969) Vice President since 2012
Ms. Quade currently serves as Vice President of HASCO, HFD and HFMG. She is the Head of Operations of HASCO and formerly served as Director, Enterprise Operations of HLIC. Ms. Quade has served in various positions within The Hartford and its subsidiaries in connection with the operation of the Hartford Funds. Ms. Quade joined The Hartford in 2001.
Martin A. Swanson** (1962) Vice President since 2010
Mr. Swanson currently serves as Vice President of HLIC. Mr. Swanson also serves as Managing Director, Chief Marketing Officer and Principal of HFD and Managing Director of HFMG. Mr. Swanson has served in various positions within The Hartford and its subsidiaries in connection with the operation of the Hartford Funds.
** Mr. Swanson resigned as an officer effective November 6, 2014.
HOW TO OBTAIN A COPY OF THE FUND’S PROXY VOTING POLICIES AND VOTING RECORDS (UNAUDITED)
A description of the policies and procedures that the Fund uses to determine how to vote proxies relating to portfolio securities and information about how the Fund voted proxies relating to portfolio securities during the most recent twelve-month period ended June 30 are available (1) without charge, upon request, by calling 888-843-7824 and (2) on the SEC’s website at http://www.sec.gov.
QUARTERLY PORTFOLIO HOLDINGS INFORMATION (UNAUDITED)
The Fund files a complete schedule of portfolio holdings with the SEC for the first and third quarters of each fiscal year on Form N-Q. The Fund’s Forms N-Q are available (1) without charge, upon request, by calling 888-843-7824 and (2) on the SEC’s website at http://www.sec.gov. The Form N-Q may be reviewed and copied at the SEC’s Public Reference Room in Washington, DC. Information on the operation of the Public Reference Room may be obtained by calling 1-800-SEC-0330.
| 58 |
| The Hartford Balanced Income Fund |
| Federal Tax Information (Unaudited) |
For the fiscal year ended October 31, 2014, there is no further federal tax information required for this Fund.
| 59 |
| The Hartford Balanced Income Fund |
| Expense Example (Unaudited) |
Your Fund's Expenses
As a shareholder of the Fund, you incur two types of costs: (1) transaction costs, including sales charges (loads) on purchase payments, if any, and contingent deferred sales charges (CDSC), if any, and (2) ongoing costs, including investment management fees, distribution and/or service (12b-1) fees, if any, and other fund expenses. This example is intended to help you understand your ongoing costs (in dollars) of investing in the Fund and to compare these costs with the ongoing costs of investing in other mutual funds. The example is based on an investment of $1,000 invested at the beginning of the period and held for the entire period of April 30, 2014 through October 31, 2014.
Actual Expenses
The first set of columns of the table below provides information about actual account values and actual expenses. You may use the information in this column, together with the amount you invested, to estimate the expenses that you paid over the period. Simply divide your account value by $1,000 (for example, an $8,600 account value divided by $1,000 = 8.6), then multiply the result by the number in the line under the heading entitled “Expenses Paid During Period” to estimate the expenses you paid on your account during this period.
Hypothetical Example for Comparison Purposes
The second set of columns of the table below provides information about hypothetical account values and hypothetical expenses based on the Fund's actual expense ratio and an assumed rate of return of 5% per year before expenses, which is not the Fund's actual return. The hypothetical account values and expenses may not be used to estimate the actual ending account balance or expenses you paid for the period. You may use this information to compare the ongoing costs of investing in the Fund and other funds. To do so, compare this 5% hypothetical example with the 5% hypothetical examples that appear in the shareholder reports of the other funds.
Please note that the expenses shown in the table are meant to highlight your ongoing costs only and do not reflect any transactional costs, such as sales charges (loads) and CDSC. Therefore, the second set of columns of the table is useful in comparing ongoing costs only, and will not help you determine the relative total costs of owning different funds. In addition, if these transactional costs were included, your costs would be higher. Expenses are equal to the Fund's annualized expense ratios multiplied by average account value over the period, multiplied by 184/365 (to reflect the one-half year period).
| Actual return | Hypothetical (5% return before expenses) | |||||||||||||||||||||||||||||||
Beginning | Ending Account | Expenses paid during the period April 30, 2014 through October 31, 2014 | Beginning | Ending
Account | Expenses
paid | Annualized | Days | Days | ||||||||||||||||||||||||
| Class A | $ | 1,000.00 | $ | 1,029.40 | $ | 4.95 | $ | 1,000.00 | $ | 1,020.33 | $ | 4.92 | 0.97 | % | 184 | 365 | ||||||||||||||||
| Class B | $ | 1,000.00 | $ | 1,029.30 | $ | 5.06 | $ | 1,000.00 | $ | 1,020.21 | $ | 5.04 | 0.99 | 184 | 365 | |||||||||||||||||
| Class C | $ | 1,000.00 | $ | 1,025.50 | $ | 8.69 | $ | 1,000.00 | $ | 1,016.62 | $ | 8.65 | 1.70 | 184 | 365 | |||||||||||||||||
| Class I | $ | 1,000.00 | $ | 1,030.00 | $ | 3.60 | $ | 1,000.00 | $ | 1,021.65 | $ | 3.59 | 0.70 | 184 | 365 | |||||||||||||||||
| Class R3 | $ | 1,000.00 | $ | 1,028.10 | $ | 6.34 | $ | 1,000.00 | $ | 1,018.95 | $ | 6.31 | 1.24 | 184 | 365 | |||||||||||||||||
| Class R4 | $ | 1,000.00 | $ | 1,029.50 | $ | 4.81 | $ | 1,000.00 | $ | 1,020.47 | $ | 4.79 | 0.94 | 184 | 365 | |||||||||||||||||
| Class R5 | $ | 1,000.00 | $ | 1,030.70 | $ | 3.53 | $ | 1,000.00 | $ | 1,021.73 | $ | 3.52 | 0.69 | 184 | 365 | |||||||||||||||||
| Class Y | $ | 1,000.00 | $ | 1,030.90 | $ | 3.19 | $ | 1,000.00 | $ | 1,022.06 | $ | 3.18 | 0.62 | 184 | 365 | |||||||||||||||||
| 60 |
| The Hartford Balanced Income Fund |
| Approval of Investment Management and Investment Sub-Advisory Agreements (Unaudited) |
Section 15(c) of the Investment Company Act of 1940, as amended (the “1940 Act”), requires that each mutual fund’s board of directors, including a majority of those directors who are not “interested persons” of the mutual fund, as defined in the 1940 Act (the “Independent Directors”), annually review and consider the continuation of the mutual fund’s investment advisory and sub-advisory agreements. At its meeting held on August 5-6, 2014, the Board of Directors (the “Board”) of The Hartford Mutual Funds, Inc., including each of the Independent Directors, unanimously voted to approve the continuation of the investment management agreement for The Hartford Balanced Income Fund (the “Fund”) with Hartford Funds Management Company, LLC (“HFMC”) and the continuation of the investment sub-advisory agreement between HFMC and the Fund’s sub-adviser, Wellington Management Company, LLP (the “Sub-adviser,” and together with HFMC, the “Advisers”) (collectively, the “Agreements”).
In the months preceding the August 5-6, 2014 meeting, the Board requested, received and reviewed written responses from the Advisers to questions posed to them on behalf of the Independent Directors and supporting materials relating to those questions and responses. The Board considered information furnished to the Board at its meetings throughout the year, as well as information specifically prepared in connection with the annual approval of the Agreements at the Board’s meetings held on June 17-18, 2014 and August 5-6, 2014. Information provided to the Board at its meetings throughout the year included, among other things, reports on Fund performance, legal and compliance matters, sales and marketing activity, shareholder services, and the other services provided to the Fund by the Advisers and their affiliates. The Board also received in-person presentations by Fund officers and representatives of HFMC at the Board’s meetings on June 17-18, 2014 and August 5-6, 2014 concerning the Agreements.
The Independent Directors, advised by independent legal counsel, engaged service providers to assist them with evaluating the Agreements with respect to the Fund. Lipper Inc. (“Lipper”), an independent provider of investment company data, was retained to provide the Board with reports on how the Fund’s contractual management fees, actual management fees, other non-management fees, overall expense ratios and investment performance compared to those of mutual funds with similar investment objectives. The Independent Directors also engaged an independent financial services consultant (the “Consultant”) to assist them in evaluating the Fund’s management fees, sub-advisory fees, other non-management fees, overall expense ratios and investment performance. In addition, the Consultant reviewed the profitability calculations utilized by HFMC in connection with the continuation of the investment management agreement.
In determining whether to continue the Agreements for the Fund, the members of the Board reviewed and evaluated information and factors they believed to be relevant and appropriate in light of the information that the Board deemed necessary and appropriate through the exercise of its reasonable business judgment. While individual members of the Board may have weighed certain factors differently, the Board’s determination to continue the Agreements was based on a comprehensive consideration of all information provided to the Board throughout the year and specifically with respect to the continuation of the Agreements. A more detailed discussion of the factors the Board considered with respect to its approval of the Agreements is provided below.
Nature, Extent and Quality of Services Provided by the Advisers
The Board requested and considered information concerning the nature, extent and quality of the services provided to the Fund by the Advisers. The Board considered, among other things, the terms of the Agreements and the range of services provided by the Advisers. The Board considered the Advisers’ professional personnel who provide services to the Fund, including each Adviser’s ability and experience in attracting and retaining qualified personnel to service the Fund. The Board considered each Adviser’s reputation and overall financial strength, as well as its willingness to consider and implement organizational and operational changes designed to enhance services to the Hartford Funds. In addition, the Board considered the quality of each Adviser’s communications with the Board and responsiveness to Board inquiries and requests made from time to time with respect to the Fund and other Hartford Funds.
The Board also requested and evaluated information concerning each Adviser’s regulatory and compliance environment. In this regard, the Board requested and reviewed information on each Adviser’s compliance policies and procedures, compliance history, and a report from the Fund’s Chief Compliance Officer on each Adviser’s compliance with applicable laws and regulations, including responses to regulatory developments and compliance issues raised by regulators. The Board also noted the Advisers’ support of the Fund’s compliance control structure, particularly the resources devoted by the Advisers in support of the Fund’s obligations pursuant to Rule 38a-1 under the 1940 Act.
With respect to HFMC, the Board noted that, under the Agreements, HFMC is responsible for the management of the Fund, including oversight of fund operations and service providers, and provides administrative and investment advisory services in connection with selecting, monitoring and supervising the Sub-adviser. The Board considered HFMC’s ongoing monitoring of people, process and performance, including its quarterly reviews of each of the Hartford Funds, semi-annual meetings with the leaders of each Fund’s portfolio management team, and oversight of the Hartford Funds’ approximately 66 portfolio managers. The Board recognized that HFMC has demonstrated a record of making changes to the
| 61 |
| The Hartford Balanced Income Fund |
| Approval of Investment Management and Investment Sub-Advisory Agreements (Unaudited) - (continued) |
management and/or strategies of the Hartford Funds when warranted. The Board considered HFMC’s oversight of the Sub-adviser’s investment approach and results, process for monitoring best execution of portfolio trades by the Sub-adviser, and approach to risk management with respect to the Fund and the service providers to the Fund. The Board also considered HFMC’s oversight of compliance with the Fund’s objective and policies as well as with applicable laws and regulations, noting that regulatory and other developments had over time led to an increase in the scope of HFMC’s services in this regard.
In addition, the Board considered HFMC’s ongoing commitment to review and rationalize the Hartford Funds product line-up and the expenses that HFMC had incurred in connection with fund combinations in recent years. The Board considered that HFMC or its affiliates are responsible for providing the Fund’s officers.
With respect to the Sub-adviser, which provides certain day-to-day portfolio management services for the Fund, the Board considered the quality of the Fund’s portfolio managers, the Sub-adviser’s other investment personnel, its investment philosophy and process, investment research capabilities and resources, performance record, trade execution capabilities and experience. The Board considered the experience of the Fund’s portfolio managers, the number of accounts managed by the portfolio managers, and the Sub-adviser’s method for compensating the portfolio managers.
Based on these considerations, the Board concluded that it was satisfied with the nature, extent and quality of the services provided to the Fund by HFMC and the Sub-adviser.
Performance of the Fund and the Advisers
The Board considered the investment performance of the Fund. In this regard, the Board reviewed the performance of the Fund over different time periods presented in the materials and evaluated HFMC’s analysis of the Fund’s performance for these time periods. The Board considered information and materials provided to the Board by the Advisers concerning Fund performance, as well as information from Lipper comparing the investment performance of the Fund to an appropriate benchmark and universe of peer funds. The Board noted that the Fund’s performance was in the 4th quintile of its performance universe for the 1-year period and the 1st quintile for the 3- and 5-year periods. The Board also noted that the Fund’s performance was in line with its blended custom benchmark for the 1-year period and above its blended custom benchmark for the 3- and 5-year periods.
The Board considered the detailed investment analytics reports provided by Hartford Funds’ Investment Advisory Group throughout the year. These reports include, among other things, information on the Fund’s gross and net returns, the Fund’s investment performance relative to an appropriate benchmark and peer group, various statistics concerning the Fund’s portfolio, and a narrative summary of various factors affecting Fund performance. The Board considered the Advisers’ cooperation with the Investment Committee, which assists the Board in evaluating the performance of the Fund at periodic meetings throughout the year. The Board also considered the analysis provided by the Consultant relating to the Fund’s performance track record.
In light of all the considerations noted above, the Board concluded that it had continued confidence in HFMC’s and the Sub-adviser’s overall capabilities to manage the Fund.
Costs of the Services and Profitability of the Advisers
The Board reviewed information regarding HFMC’s cost to provide investment management and related services to the Fund and HFMC’s profitability, both overall and for the Fund, on a pre-tax basis without regard to distribution expenses. The Board also requested and reviewed information about the profitability to HFMC and its affiliates from all services provided to the Fund and all aspects of their relationship with the Fund. The Board also requested and received information relating to the operations and profitability of the Sub-adviser.
The Board considered the Consultant’s review of the profitability calculations used by HFMC in connection with the continuation of the investment management agreement, noting the Consultant’s view that Hartford Funds’ process for calculating and reporting Fund profitability is reasonable. In this regard, the Board noted that the Consultant performed a full review of this process in light of the recent restructuring of the Hartford Funds business and reported that the approach to analyzing Fund profitability, including the use of common expense allocation methodologies, is reasonable, sound and well within common industry practice.
| 62 |
| The Hartford Balanced Income Fund |
| Approval of Investment Management and Investment Sub-Advisory Agreements (Unaudited) - (continued) |
Based on these considerations, the Board concluded that the profits anticipated to be realized by the Advisers and their affiliates from their relationships with the Fund would not be excessive.
Comparison of Fees and Services Provided by the Advisers
The Board considered comparative information with respect to the management fees to be paid by the Fund to HFMC and the total expense ratios of the Fund. The Board also considered comparative information with respect to the sub-advisory fees to be paid by HFMC to the Sub-adviser. In this regard, the Board requested and reviewed information from HFMC and the Sub-adviser relating to the management and sub-advisory fees, including the sub-advisory fee schedule for the Fund, and total operating expenses for the Fund. With respect to the sub-advisory fee schedule, the Board considered representations from HFMC and the Sub-adviser that the Sub-adviser’s fees were negotiated at arm’s length on a fund-by-fund basis. The Board also reviewed information from Lipper comparing the Fund’s contractual management fees, actual management fees and overall expense ratios relative to a group of funds selected by Lipper, in consultation with the Consultant, and a broader universe of funds selected by Lipper. The Board considered that the Fund’s contractual management fee and actual management fee were in the 4th quintile of its expense group, while its total expenses (less 12b-1 and shareholder service fees) were in the 2nd quintile. The Board noted that the Fund has an automatically renewable contractual expense cap on each share class. The expense cap resulted in reimbursement of certain expenses incurred in 2013.
While the Board recognized that comparisons between the Fund and peer funds may be imprecise, given the different service levels and characteristics of mutual funds and the different business models and cost structures of the Advisers, the comparative information provided by Lipper assisted the Board in evaluating the reasonableness of the Fund’s management and sub-advisory fees and total operating expenses. In addition, the Board considered the analysis and recommendations of the Consultant relating to the Fund’s management and sub-advisory fees and total operating expenses.
Based on these considerations, the Board concluded that the Fund’s fees and total operating expenses, in conjunction with the information about quality of services, profitability, economies of scale, and other matters discussed, were reasonable in light of the services provided.
Economies of Scale
The Board requested and considered information regarding the Advisers’ realization of economies of scale with respect to the Fund and whether the fee levels reflect these economies of scale for the benefit of the Fund’s shareholders. The Board reviewed the breakpoints in the management fee schedule for the Fund, which reduce fee rates as Fund assets grow over time. The Board recognized that a fund with assets beyond the highest breakpoint level will continue to benefit from economies of scale because additional assets are charged the lowest breakpoint fee resulting in lower overall effective management fee rates. The Board also considered that expense limitations and fee waivers that reduce the Fund’s expenses at all asset levels can have the same effect as breakpoints in sharing economies of scale with shareholders and provide protection from an increase in expenses if Fund assets decline. The Board recognized that a fee schedule that reaches a lower breakpoint quickly provides shareholders with the benefit of anticipated or potential economies of scale. The Board also considered that HFMC has been active in managing expenses, which has resulted in benefits being realized by shareholders as assets within the Hartford Funds family of funds have grown over time, including through lower transfer agent costs and other operating expenses.
The Board reviewed and evaluated materials from Lipper and the Consultant showing how management fee schedules of peer funds reflect economies of scale for the benefit of shareholders as a peer fund’s assets hypothetically increase over time. Based on information provided by HFMC, Lipper, and the Consultant, the Board recognized that there is no uniform methodology for establishing breakpoints or uniform pattern in asset levels that trigger breakpoints or the amounts of breakpoints triggered.
After considering all of the information available to it, the Board concluded that it was satisfied with the extent to which economies of scale would be shared for the benefit of the Fund’s shareholders based on currently available information and the effective advisory fees and expense ratios for the Fund at its current and reasonably anticipated asset levels. The Board noted, however, that it would continue to monitor future growth in Fund assets and the appropriateness of additional breakpoints.
Other Benefits
The Board considered other benefits to the Advisers and their affiliates from their relationships with the Fund.
| 63 |
| The Hartford Balanced Income Fund |
| Approval of Investment Management and Investment Sub-Advisory Agreements (Unaudited) - (continued) |
The Board noted that HFMC receives fees for fund accounting and related services from the Fund, and the Board considered information on profits to HFMC for such services. The Board also considered that Hartford Administrative Services Company (“HASCO”), the Fund’s transfer agent and an affiliate of HFMC, receives transfer agency compensation from the Fund, and the Board reviewed information on the profitability of the Fund’s transfer agency function to HASCO. The Board considered information provided by HASCO indicating that the transfer agent fees charged by HASCO to the Fund were fair and reasonable based on publicly available information.
The Board also considered that Hartford Funds Distributors, LLC (“HFD”), an affiliate of HFMC, serves as principal underwriter of the Fund. As principal underwriter, HFD receives 12b-1 fees from the Fund and receives all or a portion of the sales charges on sales or redemptions of certain classes of shares. The Board also noted that certain affiliates of HFD distribute shares of the Fund and receive compensation in that connection.
The Board considered benefits to the Sub-adviser from its use of the Fund’s brokerage commissions to obtain soft dollar research, and representations from HFMC and the Sub-adviser that the Sub-adviser would not make any revenue-sharing payments or any other type of distribution payments to HFMC or its affiliates.
The Board considered the benefits to shareholders of being part of the Hartford Funds family of funds, including the right to exchange investments between the same class of funds without a sales charge, the ability to reinvest Fund dividends into other funds in the family, and the ability to combine holdings in the Fund with holdings in other funds to obtain a reduced sales charge. The Board considered HFMC’s efforts to provide investors in the family with a broad range of investment styles and asset classes and its entrepreneurial risk in initiating new funds to expand these opportunities for shareholders.
* * * *
Based upon its review of these various factors, among others, the Board concluded that it is in the best interests of the Fund and its shareholders for the Board to approve the Agreements for an additional year. In reaching this decision, the Board did not assign relative weights to the factors discussed above or deem any one or group of them to be controlling in and of themselves. In connection with their deliberations, the Independent Directors met separately in executive session on several occasions, with independent legal counsel and the Consultant, to review the relevant materials and consider their responsibilities under relevant laws and regulations.
| 64 |
| The Hartford Balanced Income Fund |
| Main Risks (Unaudited) |
The main risks of investing in the Fund are described below.
Market, Selection and Strategy Risk: The Fund’s share price may fluctuate due to market risk and/or security selections that may underperform the market or relevant benchmarks. If the sub-adviser's investment strategy does not perform as expected, the Fund could underperform its peers or lose money. There is no guarantee the Fund will achieve its stated objective.
Fixed Income Risk: The Fund is subject to interest rate risk (the risk that the value of an investment decreases when interest rates rise), credit risk (the risk that the issuing company of a security is unable to pay interest and principal when due) and call risk (the risk that an investment may be redeemed early).
Foreign Investment Risk: Investments in foreign securities may be riskier than investments in U.S. securities. Potential risks include the risks of illiquidity, increased price volatility, less government regulation, less extensive and less frequent accounting and other reporting requirements, unfavorable changes in currency exchange rates, and economic and political disruptions.
Asset Allocation Strategy Risk: The portfolio managers' asset allocation strategy may not always work as intended, and asset allocation does not guarantee better performance or reduce the risk of investment loss.
Dividend Paying Security Investment Risk: Dividends are not guaranteed and are subject to change. Dividend paying securities as a group can fall out of favor with the market, causing the Fund to underperform.
Value Investing Risk: Value investments are considered to be undervalued, but they may never attain their potential value. Value-style investing falls in and out of favor, which may result in periods of underperformance.
| 65 |
THIS PRIVACY POLICY IS NOT PART OF THIS REPORT
Privacy Policy and Practices of The Hartford Financial Services Group, Inc. and its Affiliates
(herein called “we, our and us”)
This Privacy Policy applies to our United States Operations
|
We value your trust. We are committed to the responsible: a) management; b) use; and c) protection; of Personal Information.
This notice describes how we collect, disclose, and protect Personal Information.
We collect Personal Information to: a) service your Transactions with us; and b) support our business functions.
We may obtain Personal Information from: a) You; b) your Transactions with us; and c) third parties such as a consumer-reporting agency.
Based on the type of product or service You apply for or get from us, Personal Information such as: a) your name; b) your address; c) your income; d) your payment; or e) your credit history; may be gathered from sources such as applications, Transactions, and consumer reports.
To serve You and service our business, we may share certain Personal Information. We will share Personal Information, only as allowed by law, with affiliates such as: a) our insurance companies; b) our employee agents; c) our brokerage firms; and d) our administrators.
As allowed by law, we may share Personal Financial Information with our affiliates to: a) market our products; or b) market our services; to You without providing You with an option to prevent these disclosures.
|
We may also share Personal Information, only as allowed by law, with unaffiliated third parties including: a) independent agents; b) brokerage firms; c) insurance companies; d) administrators; and e) service providers; who help us serve You and service our business.
When allowed by law, we may share certain Personal Financial Information with other unaffiliated third parties who assist us by performing services or functions such as: a) taking surveys; b) marketing our products or services; or c) offering financial products or services under a joint agreement between us and one or more financial institutions.
We, and third parties we partner with, may track some of the pages You visit through the use of: a) cookies; b) pixel tagging; or c) other technologies; and currently do not process or comply with any web browser’s “do not track” signal or similar mechanism that indicates a request to disable online tracking of individual users who visit our websites or use our services.
We will not sell or share your Personal Financial Information with anyone for purposes unrelated to our business functions without offering You the opportunity to: a) “opt-out;” or b) “opt-in;” as required by law.
We only disclose Personal Health Information with: a) your proper written authorization; or b) as otherwise allowed or required by law.
Our employees have access to Personal Information in the course of doing their jobs, such as: a) underwriting policies; b) paying claims; c) developing new products; or d) advising customers of our products and services.
|
|
We use manual and electronic security procedures to maintain: a) the confidentiality; and b) the integrity of; Personal Information that we have. We use these procedures to guard against unauthorized access.
Some techniques we use to protect Personal Information include: a) secured files; b) user authentication; c) encryption; d) firewall technology; and e) the use of detection software.
We are responsible for and must: a) identify information to be protected; b) provide an adequate level of protection for that data; c) grant access to protected data only to those people who must use it in the performance of their job-related duties.
Employees who violate our Privacy Policy will be subject to discipline, which may include ending their employment with us.
At the start of our business relationship, we will give You a copy of our current Privacy Policy.
We will also give You a copy of our current Privacy Policy once a year if You maintain a continuing business relationship with us.
We will continue to follow our Privacy Policy regarding Personal Information even when a business relationship no longer exists between us.
|
As used in this Privacy Notice:
Application means your request for our product or service.
Personal Financial Information means financial information such as: a) credit history; b) income; c) financial benefits; or d) policy or claim information.
Personal Health Information means health information such as: a) your medical records; or b) information about your illness, disability or injury.
Personal Information means information that identifies You personally and is not otherwise available to the public. It includes: a) Personal Financial Information; and b) Personal Health Information.
Transaction means your business dealings with us, such as: a) your Application; b) your request for us to pay a claim; and c) your request for us to take an action on your account.
You means an individual who has given us Personal Information in conjunction with: a) asking about; b) applying for; or c) obtaining; a financial product or service from us if the product or service is used mainly for personal, family, or household purposes.
|
This Privacy Policy is being provided on behalf of the following affiliates of The Hartford Financial Services Group, Inc.:
1stAGChoice, Inc.; Access CoverageCorp, Inc.; Access CoverageCorp Technologies, Inc.; American Maturity Life Insurance Company; Archway 60 R, LLC; Business Management Group, Inc.; Champlain Life Reinsurance Company; DMS R, LLC; Eloy R, LLC; Ersatz Corporation; First State Insurance Company; Hartford Accident and Indemnity Company; Hartford Administrative Services Company; Hartford Casualty General Agency, Inc.; Hartford Casualty Insurance Company; Hartford-Comprehensive Employee Benefit Service Company; Hartford Equity Sales Company, Inc.; Hartford Fire General Agency, Inc.; Hartford Fire Insurance Company; Hartford Funds Management Company, LLC; Hartford Funds Management Group, Inc.; Hartford HLS Series Fund II, Inc.; Hartford Insurance Company of Illinois; Hartford Insurance Company of the Midwest; Hartford Insurance Company of the Southeast; Hartford Integrated Technologies, Inc.; Hartford International Life Reassurance Corporation; Hartford Funds Distributors, LLC; Hartford Investment Management Company; Hartford Life and Accident Insurance Company; Hartford Life and Annuity Insurance Company; Hartford Life Insurance Company; Hartford Life Private Placement, LLC; Hartford Lloyd’s Corporation; Hartford Lloyd’s Insurance Company; Hartford Mezzanine Investors I, LLC; Hartford Residual Market, L.C.C.; Hartford Retirement Services, LLC; Hartford Securities Distribution Company, Inc.; Hartford Series Fund, Inc.; Hartford Specialty Insurance Services of Texas, LLC; Hartford Strategic Investments, LLC; Hartford Underwriters Insurance Company; Hartford Technology Services Company, L.L.C.; Hartford of Texas General Agency, Inc.; Hartford Underwriters General Agency, Inc.; HARTRE Company, L.C.C.; HL Investment Advisors, LLC; HLA LLC; Horizon Management Group, LLC; HRA Brokerage Services, Inc.; Lanidex Class B, LLC; M-CAP Insurance Agency, LLC; New England Insurance Company; New England Reinsurance Corporation; Nutmeg Insurance Agency, Inc.; Nutmeg Insurance Company; Pacific Insurance Company, Limited; Planco, LLC: Property and Casualty Insurance Company of Hartford; Revere R, LLC; RVR R, LLC; Sentinel Insurance Company, Ltd.; Sunstone R, LLC; Symphony R, LLC; The Evergreen Group Incorporated; The Hartford Alternative Strategies Fund; The Hartford Mutual Funds, Inc.; The Hartford Mutual Funds II, Inc.; Trumbull Flood Management, L.L.C.; Trumbull Insurance Company; Twin City Fire Insurance Company; White River Life Reinsurance Company.
HPP Revised January 2014
HARTFORDFUNDS
hartfordfunds.com
This information is written in connection with the promotion or marketing of the matter(s) addressed in this material.
This report is submitted for the general information of the shareholders of the Fund. It is not authorized for distribution unless preceded or accompanied by a current prospectus for the Fund.
The information cannot be used or relied upon for the purpose of avoiding IRS penalties. These materials are not intended to provide tax, accounting or legal advice. As with all matters of a tax or legal nature, you should consult your own tax or legal counsel for advice.
Investors should carefully consider the investment objectives, risks, charges, and expenses of Hartford Funds before investing. This and other information can be found in the prospectus and summary prospectus, which can be obtained by calling 888-843-7824 (retail) or 800-279-1541 (institutional). Investors should read them carefully before they invest.
Hartford Funds are underwritten and distributed by Hartford Funds Distributors, LLC.
MFAR-BI14 12/14 113963-3 Printed in U.S.A.
HARTFORDFUNDS
|
THE HARTFORD
2014 Annual Report |
A MESSAGE FROM THE PRESIDENT
Dear Fellow Shareholders:
Thank you for investing in Hartford Funds.
Market Review
U.S. equities (as represented by the S&P 500 Index) rose steadily for the fiscal year ended October 31, 2014, with a return of 17.27% for the period. With the exception of short-lived geopolitical scares early in 2014 and concerns about continuing global growth near the end of the period, stocks generally rose on solid fundamentals and encouraging macroeconomic data during the year.
September 2014 marked the six-year anniversary of the start of the financial crisis. Within weeks of that anniversary, both the S&P 500 Index and the Dow Jones Industrial Average set new all-time highs, closing at 2,018 and 17,391, respectively, on October 31. Although the fallout of the crisis continues to influence investor behavior, stocks have recovered and risen dramatically, up 198% from their low in March 2009. Meanwhile, the domestic economy is notching strong growth, and the unemployment rate has reached its lowest level since August 2008.
While the U.S. economy appears to have stabilized and to have reverted to a solid growth path, the outlook for the global economy appears to have gotten cloudier. The U.S. Federal Reserve has ended quantitative easing, while Europe and Japan are pursuing stimulus options to avoid a double-dip recession and deflation, respectively. Diverging central-bank policies will likely continue to play an important role in market movements going forward as investors wait to see the reactions to their efforts and their impacts on global markets.
How have market movements impacted your portfolio throughout the last year? Are your investments still on track to provide the growth or income you need, and are you comfortable with their progress during times of volatility?
Your financial professional can help you navigate today’s markets with confidence, as well as assist you to achieve your investment goals by providing advice on the best options within our fund family to help you work toward overcoming today’s investing challenges. Meet with your financial advisor regularly to examine your portfolio and your investment strategy, and to determine if you’re still on track to meet your goals.
Thank you again for investing with Hartford Funds.
James Davey
President
Hartford Funds
1 The S&P 500 Index is a market capitalization-weighted price index composed of 500 widely held common stocks.
2 The Dow Jones Industrial Average is an unmanaged, price-weighted index of 30 of the largest, most widely held stocks traded on the NYSE
The Hartford Capital Appreciation Fund
Table of Contents
The views expressed in the Fund’s Manager Discussion under ‘‘Why did the Fund perform this way?’’ and ‘‘What is the outlook?’’ are views of the Fund’s sub-adviser and portfolio management team through the end of the period and are subject to change based on market and other conditions. The Fund’s Manager Discussion is for informational purposes only and does not represent an offer, recommendation or solicitation to buy, hold or sell any security. The specific securities identified and described, if any, do not represent all of the securities purchased or sold and you should not assume that investments in the securities identified and discussed will be profitable.
| The Hartford Capital Appreciation Fund inception 07/22/1996 |
| (sub-advised by Wellington Management Company, LLP) |
| Investment objective – The Fund seeks growth of capital. |
Performance Overview 10/31/04 - 10/31/14

The chart above represents the hypothetical growth of a $10,000 investment in Class A, which includes a sales charge. Growth results in classes other than Class A will vary from what is seen above due to differences in the expenses charged to those share classes.
Average Annual Total Returns (as of 10/31/14)
| 1 Year | 5 Years | 10 Years | ||||||||||
| Capital Appreciation A# | 12.49 | % | 13.57 | % | 8.58 | % | ||||||
| Capital Appreciation A## | 6.30 | % | 12.30 | % | 7.97 | % | ||||||
| Capital Appreciation B# | 11.55 | % | 12.63 | % | 7.88 | %* | ||||||
| Capital Appreciation B## | 6.55 | % | 12.38 | % | 7.88 | %* | ||||||
| Capital Appreciation C# | 11.69 | % | 12.77 | % | 7.81 | % | ||||||
| Capital Appreciation C## | 10.69 | % | 12.77 | % | 7.81 | % | ||||||
| Capital Appreciation I# | 12.87 | % | 13.91 | % | 8.85 | % | ||||||
| Capital Appreciation R3# | 12.16 | % | 13.27 | % | 8.45 | % | ||||||
| Capital Appreciation R4# | 12.50 | % | 13.61 | % | 8.72 | % | ||||||
| Capital Appreciation R5# | 12.82 | % | 13.95 | % | 8.97 | % | ||||||
| Capital Appreciation Y# | 12.94 | % | 14.07 | % | 9.06 | % | ||||||
| Russell 3000 Index | 16.07 | % | 17.01 | % | 8.55 | % | ||||||
| S&P 500 Index | 17.27 | % | 16.69 | % | 8.20 | % | ||||||
| # | Without sales charge |
| ## | With sales charge |
| * | Class B shares convert to Class A shares after 8 years. The return shown reflects the conversion to Class A shares, which had different operating expenses, for the period after conversion. |
PERFORMANCE DATA QUOTED REPRESENTS PAST PERFORMANCE AND DOES NOT GUARANTEE FUTURE RESULTS. The investment return and principal value of the investment will fluctuate so that investors’ shares, when redeemed, may be worth more or less than their original cost. Current performance may be lower or higher than the performance data quoted. To obtain performance data current to the most recent month-end, please visit our website www.hartfordfunds.com.
The initial investment in Class A shares reflects the maximum sales charge of 5.50% and returns for Class B shares reflect a contingent deferred sales charge of up to 5.00% and declining to zero, depending on the period of time the shares are held. Returns for Class C shares reflect a contingent deferred sales charge of up to 1.00% on shares redeemed within twelve months of purchase.
Total returns presented above were calculated using the Fund’s net asset value available to shareholders for sale or redemption of Fund shares on October 31, 2014, which may exclude investment transactions as of this date. All share class returns assume the reinvestment of all distributions at net asset value and the deduction of all fund expenses.
Effective 9/30/09, Class B shares of the Fund were closed to new investments.
Class I shares commenced operations on 8/31/06. Performance prior to that date is that of the Fund's Class A shares (excluding sales charges), which had different operating expenses. Class R3, R4 and R5 shares commenced operations on 12/22/06. Performance prior to that date is that of the Fund's Class Y shares, which had different operating expenses.
Russell 3000 Index is an unmanaged index that measures the performance of the 3,000 largest U.S. companies based on total market capitalization.
S&P 500 Index is a market capitalization-weighted price index composed of 500 widely held common stocks.
You cannot invest directly in an index.
The chart and table do not reflect the deductions of taxes that a shareholder would pay on Fund distributions or the redemption of Fund shares.
Performance information may reflect historical or current expense waivers/reimbursements from the investment adviser, without which performance would have been lower. For information on current expense waivers/reimbursements, please see the prospectus.
| 2 |
The Hartford Capital Appreciation Fund
Manager Discussion
|
October 31, 2014 (Unaudited) |
| Operating Expenses* | ||||||||
| Net | Gross | |||||||
| Capital Appreciation Class A | 1.14 | % | 1.14 | % | ||||
| Capital Appreciation Class B | 1.99 | % | 1.99 | % | ||||
| Capital Appreciation Class C | 1.85 | % | 1.85 | % | ||||
| Capital Appreciation Class I | 0.84 | % | 0.84 | % | ||||
| Capital Appreciation Class R3 | 1.40 | % | 1.41 | % | ||||
| Capital Appreciation Class R4 | 1.10 | % | 1.10 | % | ||||
| Capital Appreciation Class R5 | 0.80 | % | 0.80 | % | ||||
| Capital Appreciation Class Y | 0.70 | % | 0.70 | % | ||||
| * | As shown in the Fund's prospectus dated March 1, 2014. Actual expenses may be higher or lower. Please see accompanying Financial Highlights for expense ratios for the year ended October 31, 2014. |
Gross expenses are the Fund's total annual operating expenses shown in the Fund's prospectus dated March 1, 2014. Net expenses are the Fund's total annual operating expenses shown in the Fund's prospectus dated March 1, 2014 and reflect contractual expense reimbursements in instances when these reductions reduce the Fund's gross expenses. Contractual reimbursements remain in effect until February 28, 2015, and automatically renew for one-year terms unless terminated.
The Fund filed an updated prospectus, dated November 7, 2014, with the U.S. Securities and Exchange Commission that became effective on that date. However, the information in this annual report is as of October 31, 2014 and does not reflect any changes made to the total annual fund operating expense table in the November 7, 2014 prospectus.
All investments are subject to risk including the possible loss of principal. For a discussion of the Fund’s risks, please see the Main Risks section of this report. For more detailed information on the risks associated with an investment in the Fund, please see the prospectus.
| Portfolio Managers | ||||
| Saul J. Pannell, CFA | Kent M. Stahl, CFA | Gregg R. Thomas, CFA | ||
| Senior Vice President and Equity Portfolio Manager | Senior Vice President and Director, Investments and Risk Management | Senior Vice President and Director, Risk Management | ||
| Frank D. Catrickes, CFA | ||||
| Senior Vice President and Equity Portfolio Manager |
How did the Fund perform?
The Class A shares of The Hartford Capital Appreciation Fund returned 12.49%, before sales charge, for the twelve-month period ended October 31, 2014, underperforming the Fund’s benchmarks, the Russell 3000 Index and the S&P 500 Index, which returned 16.07% and 17.27%, respectively, for the same period. The Fund also underperformed the 13.21% average return of the Lipper Multi-Cap Core Funds peer group, a group of funds with investment strategies similar to those of the Fund.
Why did the Fund perform this way?
U.S. equities surged during the period, despite bouts of volatility throughout the period. After finishing their best year since 1997, U.S. stocks began 2014 with their worst month in nearly two years. Worries about an economic slowdown in China and general angst surrounding emerging markets overshadowed a fairly benign domestic environment. However, robust merger and acquisition activity and an uncontested increase in the debt ceiling from Congress helped stoke investors' risk appetites in February. The rally continued in May amid renewed signs of life in the housing market and the best payroll gain in more than two years. However, a pullback in July ended a streak of five consecutive monthly gains. Fear gripped the market as heightened geopolitical risks, a potential Portuguese banking crisis, and worries of U.S. Federal Reserve (Fed) tightening took center stage. Stocks rebounded in August as investors were emboldened by encouraging economic data, headlined by better-than-expected gross domestic product (GDP) growth and signs that the housing recovery still had legs. In September, U.S. equities retreated for just the third month this year. Despite solid manufacturing and consumer confidence readings, the reality of quantitative easing ending and the prospect of higher federal funds rates in mid-2015 contributed to increased risk aversion levels. The market rose again in October on the heels of a positive earnings season and strong GDP growth for the third quarter.
All ten sectors in the Russell 3000 Index posted positive returns during the period. Strong performers included the Healthcare (+30%), Information Technology (+23%) and Utilities (+21%) sectors, while the Energy (+3%) and Telecommunication Services (+6%) and Consumer Discretionary (+9%) sectors lagged on a relative basis.
The Fund underperformed the Russell 3000 Index driven by weak stock selection within the Financials, Consumer Discretionary, and Materials sectors. Stock selection within Information Technology and Energy also detracted from returns as did our overweight to the Consumer Discretionary sector. Sector allocation, a result of bottom-up stock selection, contributed modestly to benchmark-relative results driven by our overweight to Healthcare.
Best Buy (Consumer Discretionary), Standard Chartered (Financials) and Apple (Information Technology) detracted most from relative returns during the period. U.S.-based electronics retailer Best Buy reported unfavorable domestic 2013 holiday sales that fell below expectations, sending the stock lower, and efforts to reduce costs
| 3 |
The Hartford Capital Appreciation Fund
Manager Discussion – (continued)
|
October 31, 2014 (Unaudited) |
have also eroded profits. Shares of Standard Chartered, a UK-based bank holding company, declined after the bank posted a drop in third-quarter profits from a year ago as impairments for bad loans almost doubled and regulatory compliance costs increased. Shares of Apple, a maker of an interconnected ecosystem of computing and mobile devices, rose after the company posted better-than-expected quarterly earnings and gave solid guidance for the fourth quarter; our benchmark-relative underweight to the Russell 3000 Index was a detractor. Ford Motor (Consumer Discretionary) detracted from results on an absolute basis over the period.
The top contributors to relative performance included Micron Technology (Information Technology), United Continental (Industrials), and NXP Semiconductors (Information Technology). Shares of Micron Technology, a U.S.-based semiconductor manufacturer, rose on improving expectations of constructive industry consolidation, a profitable acquisition, and improving margins. The share price of Netherlands-based semiconductor company NXP Semiconductors moved higher as it continued to maintain its status as a well-positioned semiconductor manufacturers. Overall, NXP continued to benefit from a powerful combination of product cycles, structural cost savings, margin expansion, and a competitive advantage in sizable markets such as identification and smart mobile businesses. U.S.-based global airline United Continental’s shares outperformed amid falling oil prices, one of the company's largest operating expense inputs. The company also raised guidance during the third quarter, indicating better-than-expected revenues and expenses for the quarter. Gilead Sciences also contributed to results on an absolute basis over the period.
Derivatives are not used in a significant manner in this Fund and did not have a material impact on performance during the period.
What is the outlook?
We believe the global cycle continues to advance at a moderate pace with a mix of stronger growth in the U.S. and more sluggish activity in Europe, Japan, and China. We believe the U.S. economy is on track for a self-sustaining expansion. After three years of fiscal consolidation, it appears that this policy drag is starting to fade, which we believe should support growth. Meanwhile, investment spending appears to be picking up. Wage trends and inflation have been quite muted in the U.S., yet below the surface it appears that U.S. firms are having a tougher time finding qualified labor. This is suggestive of growing wage pressures in 2015 along with an improving labor market. At the end of the period, our largest overweights were to the Information Technology and Healthcare sectors, while our largest underweights were to the Financials and Consumer Staples, relative to the Fund’s benchmark the Russell 3000 Index.
| Diversification by Sector | ||||
| as of October 31, 2014 | ||||
| Sector | Percentage of Net Assets | |||
| Equity Securities | ||||
| Consumer Discretionary | 13.5 | % | ||
| Consumer Staples | 5.6 | |||
| Energy | 6.7 | |||
| Financials | 14.1 | |||
| Health Care | 15.6 | |||
| Industrials | 9.8 | |||
| Information Technology | 26.1 | |||
| Materials | 3.7 | |||
| Services | 0.7 | |||
| Utilities | 0.9 | |||
| Total | 96.7 | % | ||
| Short-Term Investments | 3.7 | |||
| Other Assets and Liabilities | (0.4 | ) | ||
| Total | 100.0 | % | ||
A sector may be comprised of several industries. For Fund compliance purposes, the Fund may not use the same classification system and these sector classifications are used for reporting ease.
| 4 |
The Hartford Capital Appreciation Fund
Schedule of Investments
October 31, 2014
| (000’s Omitted) |
| Shares or Principal Amount | Market Value ╪ | |||||||
Common Stocks - 96.2% | ||||||||
| Automobiles and Components - 1.4% | ||||||||
| 113 | Delphi Automotive plc | $ | 7,789 | |||||
| 600 | Fiat Chrysler Automobiles N.V. ● | 6,712 | ||||||
| 4,914 | Goodyear (The) Tire & Rubber Co. | 119,078 | ||||||
| 506 | Harley-Davidson, Inc. | 33,271 | ||||||
| 166,850 | ||||||||
| Banks - 3.6% | ||||||||
| 13,282 | Alpha Bank A.E. ● | 8,659 | ||||||
| 19,773 | Bank of Ireland ● | 7,784 | ||||||
| 11,965 | China Construction Bank | 8,927 | ||||||
| 185 | First Republic Bank | 9,410 | ||||||
| 552 | ICICI Bank Ltd. | 14,665 | ||||||
| 2,009 | Itau Unibanco Banco Multiplo S.A. ADR | 29,654 | ||||||
| 126 | M&T Bank Corp. | 15,366 | ||||||
| 19,851 | Mitsubishi UFJ Financial Group, Inc. | 115,718 | ||||||
| 864 | PNC Financial Services Group, Inc. | 74,672 | ||||||
| 7,316 | Standard Chartered plc | 110,118 | ||||||
| 647 | Wells Fargo & Co. | 34,352 | ||||||
| 429,325 | ||||||||
| Capital Goods - 7.6% | ||||||||
| 103 | 3M Co. | 15,823 | ||||||
| 111 | Acuity Brands, Inc. | 15,532 | ||||||
| 1,804 | AECOM Technology Corp. ● | 58,715 | ||||||
| 277 | AMETEK, Inc. | 14,429 | ||||||
| 109 | Arcam AB ● | 2,545 | ||||||
| 247 | Assa Abloy Ab | 13,123 | ||||||
| 452 | Belden, Inc. | 32,148 | ||||||
| 192 | Danaher Corp. | 15,437 | ||||||
| 292 | DigitalGlobe, Inc. ● | 8,351 | ||||||
| 484 | Eaton Corp. plc | 33,130 | ||||||
| 44 | Esterline Technologies Corp. ● | 5,134 | ||||||
| 164 | Flowserve Corp. | 11,125 | ||||||
| 135 | Generac Holdings, Inc. ● | 6,134 | ||||||
| 715 | HD Supply Holdings, Inc. ● | 20,608 | ||||||
| 195 | Jacobs Engineering Group, Inc. ● | 9,273 | ||||||
| 153 | KBR, Inc. | 2,918 | ||||||
| 191 | Lockheed Martin Corp. | 36,436 | ||||||
| 30 | Moog, Inc. Class A ● | 2,259 | ||||||
| 875 | Nidec Corp. | 57,844 | ||||||
| 246 | Northrop Grumman Corp. | 33,965 | ||||||
| 472 | Owens Corning, Inc. | 15,134 | ||||||
| 227 | Polypore International, Inc. ● | 9,980 | ||||||
| 1,955 | Raytheon Co. | 203,080 | ||||||
| 810 | Rexel S.A. | 13,613 | ||||||
| 1,636 | Safran S.A. | 103,586 | ||||||
| 42 | Sulzer AG | 4,817 | ||||||
| 117 | Teledyne Technologies, Inc. ● | 12,103 | ||||||
| 17 | Textron, Inc. | 716 | ||||||
| 360 | TransDigm Group, Inc. | 67,296 | ||||||
| 235 | United Technologies Corp. | 25,132 | ||||||
| 851 | Vallourec S.A. | 31,100 | ||||||
| 314 | WESCO International, Inc. ● | 25,862 | ||||||
| 907,348 | ||||||||
| Commercial and Professional Services - 0.8% | ||||||||
| 111 | Clean Harbors, Inc. ● | 5,516 | ||||||
| 363 | Equifax, Inc. | 27,473 | ||||||
| 533 | Herman Miller, Inc. | 17,061 | ||||||
| 104 | IHS, Inc. ● | 13,622 | ||||||
| 692 | Knoll, Inc. | 13,771 | ||||||
| 48 | Manpowergroup, Inc. | 3,224 | ||||||
| 156 | Nielsen N.V. | 6,639 | ||||||
| 174 | Robert Half International, Inc. | 9,510 | ||||||
| 96,816 | ||||||||
| Consumer Durables and Apparel - 1.7% | ||||||||
| 1,015 | D.R. Horton, Inc. | 23,139 | ||||||
| 388 | Electrolux AB Series B | 11,001 | ||||||
| 115 | Fossil Group, Inc. ● | 11,723 | ||||||
| 403 | Kate Spade & Co. ● | 10,941 | ||||||
| 213 | Lennar Corp. | 9,167 | ||||||
| 251 | Luxottica Group S.p.A. | 12,792 | ||||||
| 112 | Michael Kors Holdings Ltd. ● | 8,802 | ||||||
| 4,056 | Pulte Group, Inc. | 77,835 | ||||||
| 94 | PVH Corp. | 10,773 | ||||||
| 1,718 | Samsonite International S.A. | 5,710 | ||||||
| 344 | Vera Bradley, Inc. ● | 7,834 | ||||||
| 90 | Whirlpool Corp. | 15,492 | ||||||
| 205,209 | ||||||||
| Consumer Services - 2.0% | ||||||||
| 511 | American Public Education, Inc. ● | 15,851 | ||||||
| 342 | Boyd Gaming Corp. ● | 3,945 | ||||||
| 404 | Grand Canyon Education, Inc. ● | 19,371 | ||||||
| 525 | Hilton Worldwide Holdings, Inc. ● | 13,255 | ||||||
| 290 | Las Vegas Sands Corp. | 18,076 | ||||||
| 497 | McDonald's Corp. | 46,545 | ||||||
| 295 | Norwegian Cruise Line Holdings Ltd. ● | 11,493 | ||||||
| 120 | Outerwall, Inc. ● | 7,562 | ||||||
| 916 | Sands China Ltd. | 5,713 | ||||||
| 1,173 | Wyndham Worldwide Corp. | 91,077 | ||||||
| 232,888 | ||||||||
| Diversified Financials - 5.0% | ||||||||
| 95 | Ameriprise Financial, Inc. | 12,008 | ||||||
| 361 | Banca Generali S.p.A. | 9,572 | ||||||
| 208 | BlackRock, Inc. | 71,057 | ||||||
| 3,446 | Citigroup, Inc. | 184,479 | ||||||
| 18 | Goldman Sachs Group, Inc. | 3,502 | ||||||
| 284 | Hong Kong Exchanges & Clearing Ltd. | 6,286 | ||||||
| 146 | Japan Exchange Group, Inc. | 3,621 | ||||||
| 3,185 | JP Morgan Chase & Co. | 192,608 | ||||||
| 404 | Julius Baer Group Ltd. | 17,720 | ||||||
| 366 | Legg Mason, Inc. | 19,008 | ||||||
| 177 | Northern Trust Corp. | 11,704 | ||||||
| 373 | Platform Specialty Products Corp. ● | 9,703 | ||||||
| 243 | Platform Specialty Products Corp. PIPE ⌂●† | 5,837 | ||||||
| 183 | Portfolio Recovery Associates, Inc. ● | 11,556 | ||||||
| 155 | Raymond James Financial, Inc. | 8,700 | ||||||
| 562 | Waddell & Reed Financial, Inc. Class A | 26,817 | ||||||
| 206 | Wisdomtree Investment, Inc. ● | 3,039 | ||||||
| 597,217 | ||||||||
| Energy - 6.7% | ||||||||
| 208 | Anadarko Petroleum Corp. | 19,100 | ||||||
| 23 | Antero Resources Corp. ● | 1,197 | ||||||
| 317 | Atwood Oceanics, Inc. ● | 12,889 | ||||||
| 62 | Baker Hughes, Inc. | 3,303 | ||||||
| 2,268 | BG Group plc | 37,791 | ||||||
| 407 | Cabot Oil & Gas Corp. | 12,666 | ||||||
| 1,665 | Cameco Corp. | 28,935 | ||||||
| 243 | Cameron International Corp. ● | 14,455 | ||||||
| 251 | Canadian Natural Resources Ltd. ADR | 8,755 | ||||||
| 536 | Chesapeake Energy Corp. | 11,897 | ||||||
| 431 | Chevron Corp. | 51,698 | ||||||
| 803 | Cobalt International Energy, Inc. ● | 9,403 | ||||||
The accompanying notes are an integral part of these financial statements.
| 5 |
The Hartford Capital Appreciation Fund
Schedule of Investments – (continued)
October 31, 2014
| (000’s Omitted) |
| Shares or Principal Amount | Market Value ╪ | |||||||
Common Stocks - 96.2% - (continued) | ||||||||
| Energy - 6.7% - (continued) | ||||||||
| 230 | Continental Resources, Inc. ● | $ | 12,963 | |||||
| 15 | Diamondback Energy, Inc. ● | 994 | ||||||
| 330 | Energen Corp. | 22,327 | ||||||
| 122 | EQT Corp. | 11,432 | ||||||
| 265 | Exxon Mobil Corp. | 25,668 | ||||||
| 247 | Halliburton Co. | 13,621 | ||||||
| 306 | HollyFrontier Corp. | 13,886 | ||||||
| 60 | Hornbeck Offshore Services, Inc. ● | 1,851 | ||||||
| 1,055 | Imperial Oil Ltd. | 50,584 | ||||||
| 946 | Karoon Gas Australia Ltd. ● | 2,471 | ||||||
| 1,575 | McDermott International, Inc. ● | 6,048 | ||||||
| 213 | National Oilwell Varco, Inc. | 15,466 | ||||||
| 131 | Occidental Petroleum Corp. | 11,664 | ||||||
| 9,899 | Petroleo Brasileiro S.A. ADR | 120,983 | ||||||
| 144 | Phillips 66 | 11,314 | ||||||
| 684 | Pioneer Natural Resources Co. | 129,262 | ||||||
| 219 | QEP Resources, Inc. | 5,489 | ||||||
| 329 | Range Resources Corp. | 22,482 | ||||||
| 444 | Southwestern Energy Co. ● | 14,447 | ||||||
| 509 | Suncor Energy, Inc. | 18,091 | ||||||
| 38 | Superior Energy Services, Inc. | 948 | ||||||
| 2,214 | Trican Well Service Ltd. | 19,844 | ||||||
| 1,538 | YPF Sociedad Anonima ADR | 54,094 | ||||||
| 798,018 | ||||||||
| Food and Staples Retailing - 1.4% | ||||||||
| 1,577 | CVS Health Corp. | 135,336 | ||||||
| 374 | Seven & I Holdings Co., Ltd. | 14,600 | ||||||
| 268 | Wal-Mart Stores, Inc. | 20,429 | ||||||
| 170,365 | ||||||||
| Food, Beverage and Tobacco - 3.5% | ||||||||
| 276 | Anheuser-Busch InBev N.V. | 30,651 | ||||||
| 256 | Anheuser-Busch InBev N.V. ADR | 28,435 | ||||||
| 1,305 | Coca-Cola Co. | 54,671 | ||||||
| 1,061 | Diageo Capital plc | 31,290 | ||||||
| 114 | Diageo plc ADR | 13,500 | ||||||
| 897 | Greencore Group plc | 3,765 | ||||||
| 50 | Hershey Co. | 4,793 | ||||||
| 497 | Imperial Tobacco Group plc | 21,588 | ||||||
| 394 | Kraft Foods Group, Inc. | 22,179 | ||||||
| 3,707 | Mondelez International, Inc. | 130,696 | ||||||
| 469 | Monster Beverage Corp. ● | 47,268 | ||||||
| 127 | Philip Morris International, Inc. | 11,344 | ||||||
| 172 | Post Holdings, Inc. ● | 6,463 | ||||||
| 1,516 | Treasury Wine Estates Ltd. | 6,188 | ||||||
| 412,831 | ||||||||
| Health Care Equipment and Services - 2.7% | ||||||||
| 274 | Aetna, Inc. | 22,626 | ||||||
| 592 | Becton, Dickinson & Co. | 76,146 | ||||||
| 421 | Cardinal Health, Inc. | 33,058 | ||||||
| 760 | CareView Communications, Inc. ●† | 233 | ||||||
| 274 | Envision Healthcare Holdings ● | 9,582 | ||||||
| 962 | HCA Holdings, Inc. ● | 67,393 | ||||||
| 508 | IMS Health Holdings, Inc. ● | 12,307 | ||||||
| 424 | Medtronic, Inc. | 28,927 | ||||||
| 433 | UnitedHealth Group, Inc. | 41,115 | ||||||
| 176 | Universal Health Services, Inc. Class B | 18,247 | ||||||
| 116 | Wellpoint, Inc. | 14,756 | ||||||
| 324,390 | ||||||||
| Household and Personal Products - 0.7% | ||||||||
| 415 | Coty, Inc. | 6,883 | ||||||
| 173 | Procter & Gamble Co. | 15,063 | ||||||
| 2,587 | Svenska Cellulosa AB Class B | 57,955 | ||||||
| 79,901 | ||||||||
| Insurance - 4.5% | ||||||||
| 456 | ACE Ltd. | 49,834 | ||||||
| 2,823 | AIA Group Ltd. | 15,751 | ||||||
| 3,167 | American International Group, Inc. | 169,656 | ||||||
| 664 | Assicurazioni Generali S.p.A. | 13,623 | ||||||
| 766 | Assured Guaranty Ltd. | 17,682 | ||||||
| 25 | Fairfax Financial Holdings Ltd. | 11,531 | ||||||
| 386 | Lincoln National Corp. | 21,151 | ||||||
| 23 | Markel Corp. ● | 15,831 | ||||||
| 1,129 | Marsh & McLennan Cos., Inc. | 61,365 | ||||||
| 962 | MetLife, Inc. | 52,173 | ||||||
| 357 | Principal Financial Group, Inc. | 18,684 | ||||||
| 957 | Prudential Financial, Inc. | 84,759 | ||||||
| 532,040 | ||||||||
| Materials - 3.7% | ||||||||
| 164 | Air Liquide | 19,816 | ||||||
| 2,110 | Barrick Gold Corp. | 25,049 | ||||||
| 109 | Berry Plastics Group, Inc. ● | 2,843 | ||||||
| 29 | Cabot Corp. | 1,346 | ||||||
| 243 | Celanese Corp. | 14,262 | ||||||
| 346 | Constellium N.V. ● | 7,015 | ||||||
| 377 | Continental Gold Ltd. ● | 632 | ||||||
| 352 | Dow Chemical Co. | 17,379 | ||||||
| 316 | Ecolab, Inc. | 35,117 | ||||||
| 2 | Givaudan | 3,200 | ||||||
| 2,014 | Gold Resource Corp. | 7,833 | ||||||
| 9,854 | Ivanhoe Mines Ltd. ● | 7,432 | ||||||
| 1,946 | JSR Corp. | 35,044 | ||||||
| 499 | Louisiana-Pacific Corp. ● | 7,281 | ||||||
| 115 | Martin Marietta Materials, Inc. | 13,455 | ||||||
| 171 | Methanex Corp. ADR | 10,130 | ||||||
| 532 | Norbord, Inc. | 10,418 | ||||||
| 980 | Packaging Corp. of America | 70,651 | ||||||
| 298 | Praxair, Inc. | 37,559 | ||||||
| 279 | Reliance Steel & Aluminum | 18,841 | ||||||
| 225 | Rio Tinto plc ADR | 10,786 | ||||||
| 227 | Vulcan Materials Co. | 13,983 | ||||||
| 532 | Wacker Chemie AG | 64,463 | ||||||
| 434,535 | ||||||||
| Media - 0.8% | ||||||||
| 153 | CBS Corp. Class B | 8,284 | ||||||
| 823 | DHX Media Ltd. ● | 7,309 | ||||||
| 110 | DISH Network Corp. ● | 6,985 | ||||||
| 25 | Harvey Weinstein Co. Holdings Class A-1 ⌂●†∞ | — | ||||||
| 428 | McGraw Hill Financial, Inc. | 38,711 | ||||||
| 887 | Pandora Media, Inc. ● | 17,103 | ||||||
| 399 | Quebecor, Inc. | 10,247 | ||||||
| 6 | Time Warner Cable, Inc. | 847 | ||||||
| 38 | Tribune Media Co. Class A ● | 2,555 | ||||||
| 92,041 | ||||||||
| Pharmaceuticals, Biotechnology and Life Sciences - 12.9% | ||||||||
| 829 | Actavis plc ● | 201,255 | ||||||
| 32 | Agios Pharmaceuticals, Inc. ● | 2,674 | ||||||
| 114 | Alkermes plc ● | 5,748 | ||||||
| 356 | Almirall S.A. ● | 5,843 | ||||||
| 87 | Alnylam Pharmaceuticals, Inc. ● | 8,052 | ||||||
| 67 | Amgen, Inc. | 10,929 | ||||||
The accompanying notes are an integral part of these financial statements.
| 6 |
The Hartford Capital Appreciation Fund
Schedule of Investments – (continued)
October 31, 2014
| (000’s Omitted) |
| Shares or Principal Amount | Market Value ╪ | |||||||
Common Stocks - 96.2% - (continued) | ||||||||
| Pharmaceuticals, Biotechnology and Life Sciences - 12.9% - (continued) | ||||||||
| 1,081 | Arena Pharmaceuticals, Inc. ● | $ | 4,712 | |||||
| 2,732 | AstraZeneca plc | 199,559 | ||||||
| 217 | AstraZeneca plc ADR | 15,858 | ||||||
| 46 | Biogen Idec, Inc. ● | 14,866 | ||||||
| 7,416 | Bristol-Myers Squibb Co. | 431,517 | ||||||
| 192 | Celgene Corp. ● | 20,583 | ||||||
| 1,067 | Gilead Sciences, Inc. ● | 119,460 | ||||||
| 34 | Illumina, Inc. ● | 6,542 | ||||||
| 348 | Incyte Corp. ● | 23,316 | ||||||
| 204 | Innate Pharma S.A. ● | 1,875 | ||||||
| 499 | Johnson & Johnson | 53,806 | ||||||
| 176 | Medivation, Inc. ● | 18,613 | ||||||
| 3,240 | Merck & Co., Inc. | 187,753 | ||||||
| 133 | Ono Pharmaceutical Co., Ltd. | 13,429 | ||||||
| 816 | Pfizer, Inc. | 24,430 | ||||||
| 337 | Portola Pharmaceuticals, Inc. ● | 9,609 | ||||||
| 64 | PTC Therapeutics, Inc. ●‡ | 2,611 | ||||||
| 10 | Receptos, Inc. ● | 1,026 | ||||||
| 109 | Regeneron Pharmaceuticals, Inc. ● | 42,978 | ||||||
| 96 | Roche Holding AG | 28,299 | ||||||
| 51 | Salix Pharmaceuticals Ltd. ● | 7,359 | ||||||
| 240 | Tesaro, Inc. ● | 6,681 | ||||||
| 1,051 | TherapeuticsMD, Inc. ● | 4,666 | ||||||
| 439 | Vertex Pharmaceuticals, Inc. ● | 49,502 | ||||||
| 423 | Zoetis, Inc. | 15,723 | ||||||
| 1,539,274 | ||||||||
| Real Estate - 1.0% | ||||||||
| 118 | AvalonBay Communities, Inc. REIT | 18,429 | ||||||
| 100 | Boston Properties, Inc. REIT | 12,728 | ||||||
| 330 | CBRE Group, Inc. ● | 10,565 | ||||||
| 17,338 | Macquarie Mexico Real Estate Management S.A. de C. V. REIT | 31,596 | ||||||
| 474 | Mitsui Fudosan Co., Ltd. | 15,238 | ||||||
| 145 | Plum Creek Timber Co., Inc. REIT | 5,934 | ||||||
| 396 | Realogy Holdings Corp. ● | 16,251 | ||||||
| 217 | Weyerhaeuser Co. REIT | 7,351 | ||||||
| 118,092 | ||||||||
| Retailing - 7.6% | ||||||||
| 644 | Advance Automotive Parts, Inc. | 94,642 | ||||||
| 63 | Amazon.com, Inc. ● | 19,342 | ||||||
| 157 | AutoZone, Inc. ● | 87,045 | ||||||
| 327 | CarMax, Inc. ● | 18,285 | ||||||
| 2,420 | Chico's FAS, Inc. | 36,488 | ||||||
| 369 | Conn's, Inc. ● | 11,491 | ||||||
| 15 | Dollar General Corp. ● | 969 | ||||||
| 232 | Dollar Tree, Inc. ● | 14,058 | ||||||
| 186 | GNC Holdings, Inc. | 7,711 | ||||||
| 3,941 | Groupon, Inc. ● | 28,808 | ||||||
| 439 | Home Depot, Inc. | 42,775 | ||||||
| 12 | Honest (The) Co. ⌂●† | 292 | ||||||
| 76 | HSN, Inc. | 4,998 | ||||||
| 1,429 | L Brands, Inc. | 103,036 | ||||||
| 965 | Lowe's Cos., Inc. | 55,193 | ||||||
| 530 | Michaels (The) Cos., Inc. ● | 9,681 | ||||||
| 49 | Netflix, Inc. ● | 19,068 | ||||||
| 1,060 | Office Depot, Inc. ● | 5,532 | ||||||
| 19 | Priceline (The) Group, Inc. ● | 22,572 | ||||||
| 654 | Rakuten, Inc. | 7,373 | ||||||
| 2 | Restoration Hardware Holdings, Inc. ● | 188 | ||||||
| 713 | Signet Jewelers Ltd. | 85,609 | ||||||
| 2,530 | TJX Cos., Inc. | 160,225 | ||||||
| 771 | Tory Burch LLC ⌂●† | 50,507 | ||||||
| 190 | TripAdvisor, Inc. ● | 16,810 | ||||||
| 290 | Tuesday Morning Corp. ● | 5,906 | ||||||
| 908,604 | ||||||||
| Semiconductors and Semiconductor Equipment - 8.2% | ||||||||
| 196 | Analog Devices, Inc. | 9,734 | ||||||
| 6,611 | Applied Materials, Inc. | 146,029 | ||||||
| 135,604 | GCL-Poly Energy Holdings Ltd. ● | 45,702 | ||||||
| 271 | Hynix Semiconductor, Inc. ● | 12,088 | ||||||
| 5,649 | Intel Corp. | 192,128 | ||||||
| 773 | Maxim Integrated Products, Inc. | 22,680 | ||||||
| 6,381 | Micron Technology, Inc. ● | 211,148 | ||||||
| 2,472 | NXP Semiconductors N.V. ● | 169,726 | ||||||
| 579 | RF Micro Devices, Inc. ● | 7,534 | ||||||
| 7 | Samsung Electronics Co., Ltd. | 8,055 | ||||||
| 2,038 | Sumco Corp. ☼ | 27,406 | ||||||
| 1,466 | SunEdison, Inc. ● | 28,608 | ||||||
| 3,048 | SunPower Corp. ● | 97,063 | ||||||
| 977,901 | ||||||||
| Software and Services - 10.1% | ||||||||
| 444 | Accenture plc | 36,051 | ||||||
| 9,216 | Activision Blizzard, Inc. | 183,866 | ||||||
| 1,233 | Adobe Systems, Inc. ● | 86,447 | ||||||
| 572 | Akamai Technologies, Inc. ● | 34,509 | ||||||
| 933 | Alibaba Group Holding Ltd. ● | 91,945 | ||||||
| 292 | Angie's List, Inc. ●‡ | 2,032 | ||||||
| 517 | AOL, Inc. ● | 22,495 | ||||||
| 328 | Automatic Data Processing, Inc. | 26,804 | ||||||
| 313 | Baidu, Inc. ADR ● | 74,663 | ||||||
| 694 | Cadence Design Systems, Inc. ● | 12,459 | ||||||
| — | CDK Global, Inc. ● | — | ||||||
| 313 | Cognizant Technology Solutions Corp. ● | 15,310 | ||||||
| 272 | CoStar Group, Inc. ● | 43,817 | ||||||
| 450 | Facebook, Inc. ● | 33,736 | ||||||
| 300 | Google, Inc. Class C ● | 167,686 | ||||||
| 188 | IAC/InterActiveCorp. | 12,737 | ||||||
| 190 | Intuit, Inc. | 16,703 | ||||||
| 261 | Markit Ltd. ● | 6,669 | ||||||
| 4,142 | Microsoft Corp. | 194,446 | ||||||
| 794 | Optimal Payments plc ● | 5,640 | ||||||
| 287 | Rovi Corp. ● | 5,984 | ||||||
| 248 | Salesforce.com, Inc. ● | 15,865 | ||||||
| 501 | Symantec Corp. | 12,425 | ||||||
| 61 | Tableau Software, Inc. ● | 5,055 | ||||||
| 425 | Teradata Corp. ● | 18,000 | ||||||
| 317 | UbiSoft Entertainment S.A. ● | 5,737 | ||||||
| 269 | Verint Systems, Inc. ● | 15,436 | ||||||
| 253 | VeriSign, Inc. ● | 15,127 | ||||||
| 1,109 | Web.com Group, Inc. ● | 22,777 | ||||||
| 247 | Yelp, Inc. ● | 14,829 | ||||||
| 1,199,250 | ||||||||
| Technology Hardware and Equipment - 7.3% | ||||||||
| 293 | Amphenol Corp. Class A | 14,840 | ||||||
| 2,883 | Apple, Inc. | 311,346 | ||||||
| 2,034 | Aruba Networks, Inc. ● | 43,898 | ||||||
| 6,127 | Brocade Communications Systems, Inc. | 65,740 | ||||||
| 679 | CDW Corp. of Delaware | 20,953 | ||||||
| 3,682 | Cisco Systems, Inc. | 90,095 | ||||||
The accompanying notes are an integral part of these financial statements.
| 7 |
The Hartford Capital Appreciation Fund
Schedule of Investments – (continued)
October 31, 2014
| (000’s Omitted) |
| Shares or Principal Amount | Market Value ╪ | |||||||
Common Stocks - 96.2% - (continued) | ||||||||
| Technology Hardware and Equipment - 7.3% - (continued) | ||||||||
| 443 | EMC Corp. | $ | 12,733 | |||||
| 58 | F5 Networks, Inc. ● | 7,117 | ||||||
| 193 | Hewlett-Packard Co. | 6,933 | ||||||
| 1,072 | Hitachi Ltd. | 8,423 | ||||||
| 3,024 | Japan Display, Inc. ● | 8,977 | ||||||
| 6,033 | Lenovo Group Ltd. | 8,893 | ||||||
| 59 | Loral Space & Communications, Inc. ● | 4,533 | ||||||
| 109 | Motorola Solutions, Inc. | 7,008 | ||||||
| 7,573 | NEC Corp. | 26,781 | ||||||
| 1,140 | ParkerVision, Inc. ● | 1,493 | ||||||
| 1,213 | Qualcomm, Inc. | 95,260 | ||||||
| 265 | Stratasys Ltd. ● | 31,870 | ||||||
| 1,348 | TE Connectivity Ltd. | 82,409 | ||||||
| 424 | Trimble Navigation Ltd. ● | 11,394 | ||||||
| 139 | Western Digital Corp. | 13,688 | ||||||
| 874,384 | ||||||||
| Telecommunication Services - 0.7% | ||||||||
| 1,233 | Gogo, Inc. ● | 20,485 | ||||||
| 3,536 | Koninklijke (Royal) KPN N.V. | 11,641 | ||||||
| 723 | NTT DoCoMo, Inc. | 12,194 | ||||||
| 274 | SoftBank Corp. | 19,954 | ||||||
| 439 | Verizon Communications, Inc. | 22,043 | ||||||
| 36 | Zayo Group Holdings, Inc. ● | 831 | ||||||
| 87,148 | ||||||||
| Transportation - 1.4% | ||||||||
| 42,097 | AirAsia Berhad | 32,000 | ||||||
| 204 | Canadian National Railway Co. | 14,382 | ||||||
| 99 | FedEx Corp. | 16,613 | ||||||
| 59 | Hertz Global Holdings, Inc. ● | 1,295 | ||||||
| 1,333 | International Consolidated Airlines Group S.A. ● | 8,743 | ||||||
| 29 | Kansas City Southern | 3,554 | ||||||
| 778 | Mitsui O.S.K. Lines Ltd. | 2,457 | ||||||
| 388 | Nippon Yusen ‡ | 1,005 | ||||||
| 135 | Norfolk Southern Corp. | 14,963 | ||||||
| 80 | United Continental Holdings, Inc. ● | 4,209 | ||||||
| 641 | United Parcel Service, Inc. Class B | 67,223 | ||||||
| 460 | UTI Worldwide, Inc. ● | 5,033 | ||||||
| 171,477 | ||||||||
| Utilities - 0.9% | ||||||||
| 27,187 | China Longyuan Power Group Corp. | 28,992 | ||||||
| 219 | Duke Energy Corp. | 18,024 | ||||||
| 221 | PG&E Corp. | 11,100 | ||||||
| 1,830 | Snam S.p.A. | 9,898 | ||||||
| 538 | UGI Corp. | 20,284 | ||||||
| 572 | Xcel Energy, Inc. | 19,152 | ||||||
| 107,450 | ||||||||
| Total Common Stocks | ||||||||
| ( Cost $10,594,020) | $ | 11,463,354 | ||||||
Preferred Stocks - 0.5% | ||||||||
| Capital Goods - 0.0% | ||||||||
| 266 | Lithium Technology Corp. ⌂●† | $ | 1,481 | |||||
| Consumer Durables and Apparel - 0.0% | ||||||||
| 26 | Cloudera, Inc. ⌂●† | 631 | ||||||
| 83 | One Kings Lane, Inc. ⌂●† | 1,267 | ||||||
| 1,898 | ||||||||
| Retailing - 0.0% | ||||||||
| 28 | Honest (The) Co. Series C ⌂●†β | 683 | ||||||
| Software and Services - 0.3% | ||||||||
| 371 | Apigee Corp. ⌂●† | 1,220 | ||||||
| 18 | Dropbox, Inc. ⌂●† | 368 | ||||||
| 567 | Essence Holding Group ⌂●† | 807 | ||||||
| 47 | LendingClub Corp. ⌂●† | 426 | ||||||
| 78 | Lookout, Inc. ⌂●† | 799 | ||||||
| 28 | New Relic, Inc. ⌂●† | 728 | ||||||
| 118 | Nutanix, Inc. ⌂●† | 1,424 | ||||||
| 500 | Uber Technologies, Inc. ⌂●† | 27,935 | ||||||
| 58 | Veracode, Inc. ⌂●† | 967 | ||||||
| 34,674 | ||||||||
| Technology Hardware and Equipment - 0.2% | ||||||||
| 143 | DataLogix Holdings ⌂●† | 1,329 | ||||||
| 1,220 | Pure Storage, Inc. ⌂●† | 17,262 | ||||||
| 18,591 | ||||||||
| Telecommunication Services - 0.0% | ||||||||
| 40 | DocuSign, Inc. ⌂●† | 669 | ||||||
| 669 | ||||||||
| Total Preferred Stocks | ||||||||
| (Cost $63,088) | $ | 57,996 | ||||||
Exchange Traded Funds - 0.0% | ||||||||
| Other Investment Pools and Funds - 0.0% | ||||||||
| 9 | S&P 500 Depositary Receipt | $ | 1,807 | |||||
| Total Exchange Traded Funds | ||||||||
| (Cost $1,746) | $ | 1,807 | ||||||
| Total Long-Term Investments | ||||||||
| (Cost $10,658,854) | $ | 11,523,157 | ||||||
| Short-Term Investments - 3.7% | ||||||||
| Repurchase Agreements - 3.7% | ||||||||
| Bank of America Merrill Lynch TriParty Repurchase Agreement (maturing on 11/03/2014 in the amount of $1,276, collateralized by U.S. Treasury Note 1.50%, 2019, value of $1,302) | ||||||||
| $ | 1,276 | 0.08%, 10/31/2014 | $ | 1,276 | ||||
| Bank of America Merrill Lynch TriParty Repurchase Agreement (maturing on 11/03/2014 in the amount of $21,725, collateralized by GNMA 1.63% - 7.00%, 2031 - 2054, value of $22,159) | ||||||||
| 21,725 | 0.09%, 10/31/2014 | 21,725 | ||||||
| Bank of Montreal TriParty Repurchase Agreement (maturing on 11/03/2014 in the amount of $5,837, collateralized by U.S. Treasury Bond 2.88% - 5.25%, 2029 - 2043, U.S. Treasury Note 0.38% - 4.50%, 2015 - 2022, value of $5,954) | ||||||||
| 5,837 | 0.08%, 10/31/2014 | 5,837 | ||||||
The accompanying notes are an integral part of these financial statements.
| 8 |
The Hartford Capital Appreciation Fund
Schedule of Investments – (continued)
October 31, 2014
| (000’s Omitted) |
| Shares or Principal Amount | Market Value ╪ | |||||||||||
| Short-Term Investments - 3.7% - (continued) | ||||||||||||
| Repurchase Agreements - 3.7% - (continued) | ||||||||||||
| Bank of Montreal TriParty Repurchase Agreement (maturing on 11/03/2014 in the amount of $19,786, collateralized by FHLMC 2.00% - 5.50%, 2022 - 2034, FNMA 2.00% - 4.50%, 2024 - 2039, GNMA 3.00%, 2043, U.S. Treasury Note 4.63%, 2017, value of $20,182) |
||||||||||||
| $ | 19,786 | 0.10%, 10/31/2014 | $ | 19,786 | ||||||||
| Barclays Capital TriParty Repurchase Agreement (maturing on 11/03/2014 in the amount of $74,554, collateralized by U.S. Treasury Bond 4.50% - 6.25%, 2023 - 2036, U.S. Treasury Note 1.63% - 2.13%, 2015 - 2019, value of $76,044) |
||||||||||||
| 74,553 | 0.08%, 10/31/2014 | 74,553 | ||||||||||
| Citigroup Global Markets, Inc. TriParty Repurchase Agreement (maturing on 11/03/2014 in the amount of $85,693, collateralized by U.S. Treasury Bill 0.02%, 2015, U.S. Treasury Bond 3.88% - 11.25%, 2015 - 2040, U.S. Treasury Note 2.00% - 3.38%, 2019 - 2021, value of $87,406) |
||||||||||||
| 85,692 | 0.09%, 10/31/2014 | 85,692 | ||||||||||
| Deutsche Bank Securities TriParty Repurchase Agreement (maturing on 11/03/2014 in the amount of $4,946, collateralized by U.S. Treasury Note 0.88%, 2017, value of $5,045) |
||||||||||||
| 4,946 | 0.13%, 10/31/2014 | 4,946 | ||||||||||
| RBS Securities, Inc. TriParty Repurchase Agreement (maturing on 11/03/2014 in the amount of $7,281, collateralized by U.S. Treasury Bond 3.63% - 5.00%, 2037 - 2043, U.S. Treasury Note 2.13%, 2020, value of $7,427) |
||||||||||||
| 7,281 | 0.07%, 10/31/2014 | 7,281 | ||||||||||
| Societe Generale TriParty Repurchase Agreement (maturing on 11/03/2014 in the amount of $76,710, collateralized by U.S. Treasury Bill 0.02%, 2015, U.S. Treasury Bond 3.75% - 11.25%, 2015 - 2043, U.S. Treasury Note 1.38% - 4.25%, 2015 - 2022, value of $78,244) |
||||||||||||
| 76,710 | 0.08%, 10/31/2014 | 76,710 | ||||||||||
| TD Securities TriParty Repurchase Agreement (maturing on 11/03/2014 in the amount of $148,652, collateralized by FHLMC 3.00% - 4.00%, 2026 - 2044, FNMA 2.50% - 5.00%, 2025 - 2044, U.S. Treasury Bond 3.50% - 6.50%, 2026 - 2041, U.S. Treasury Note 1.75% - 2.88%, 2018 - 2019, value of $151,624) |
||||||||||||
| 148,651 | 0.10%, 10/31/2014 | 148,651 | ||||||||||
| 446,457 | ||||||||||||
| Total Short-Term Investments | ||||||||||||
| (Cost $446,457) | $ | 446,457 | ||||||||||
| Total Investments | ||||||||||||
| (Cost $11,105,311) ▲ | 100.4 | % | $ | 11,969,614 | ||||||||
| Other Assets and Liabilities | (0.4 | )% | (51,380 | ) | ||||||||
| Total Net Assets | 100.0 | % | $ | 11,918,234 | ||||||||
The accompanying notes are an integral part of these financial statements.
| 9 |
The Hartford Capital Appreciation Fund
Schedule of Investments – (continued)
October 31, 2014
| (000’s Omitted) |
Note: Percentage
of investments as shown is the ratio of the total market value to total net assets.
Prices of foreign equities that are principally traded on certain foreign markets may be adjusted
daily pursuant to a fair value pricing service approved by the Board of Directors in order to reflect an adjustment for factors
occurring after the close of certain foreign markets but before the close of the New York Stock Exchange.
The Fund may refer to any one
or more of the industry classifications used by one or more widely recognized market indices, ratings group indices and/or as defined
by Fund management. Industry classifications may not be identical across all security types.
Other than the industry classifications "Other Investment Pools and Funds" and "Exchange
Traded Funds," equity industry classifications used in this report are the Global Industry Classification Standard, which
was developed by and is the exclusive property and service mark of MSCI, Inc. and Standard & Poor’s.
For Fund compliance purposes, the Fund may not use the same classification system shown in this report
as these classifications are used for reporting ease.
| ▲ | At October 31, 2014, the cost of securities for federal income tax purposes was $11,123,117 and the aggregate gross unrealized appreciation and depreciation based on that cost were: |
| Unrealized Appreciation | $ | 1,256,978 | ||
| Unrealized Depreciation | (410,481 | ) | ||
| Net Unrealized Appreciation | $ | 846,497 |
| † | These securities were valued in good faith at fair value as determined under policies and procedures established by and under the supervision of the Board of Directors. At October 31, 2014, the aggregate fair value of these securities was $114,865, which represents 1.0% of total net assets. This amount excludes securities that are principally traded in certain foreign markets and whose prices are adjusted pursuant to a third party pricing service methodology approved by the Board of Directors. |
| ● | Non-income producing. |
| ∞ | Securities exempt from registration under Regulation D of the Securities Act of 1933, as amended. The Fund may only be able to resell these securities if they are subsequently registered or if an exemption from registration under the federal and state securities laws is available. Unless otherwise indicated, these holdings are determined to be liquid. At October 31, 2014, the aggregate value and percentage of net assets of these securities rounds to zero. |
| ⌂ | The following securities are considered illiquid. Illiquid securities are often purchased in private placement transactions, are often not registered under the Securities Act of 1933, as amended, and may have contractual restrictions on resale. A security may also be considered illiquid if the security lacks a readily available market or if its valuation has not changed for a certain period of time. |
| Period Acquired | Shares/ Par | Security | Cost Basis | |||||||
| 04/2014 | 371 | Apigee Corp. Preferred | $ | 1,079 | ||||||
| 02/2014 | 26 | Cloudera, Inc. Preferred | 377 | |||||||
| 05/2014 | 143 | DataLogix Holdings Preferred | 1,477 | |||||||
| 02/2014 | 40 | DocuSign, Inc. Preferred | 521 | |||||||
| 01/2014 | 18 | Dropbox, Inc. Preferred | 351 | |||||||
| 05/2014 | 567 | Essence Holding Group Preferred | 896 | |||||||
| 10/2005 | 25 | Harvey Weinstein Co. Holdings Class A-1 - Reg D | 23,636 | |||||||
| 08/2014 | 12 | Honest (The) Co. | 325 | |||||||
| 08/2014 | 28 | Honest (The) Co. Series C Preferred | 758 | |||||||
| 04/2014 | 47 | LendingClub Corp. Preferred | 473 | |||||||
| 08/2014 | 266 | Lithium Technology Corp. Preferred | 1,299 | |||||||
| 07/2014 | 78 | Lookout, Inc. Preferred | 888 | |||||||
| 04/2014 | 28 | New Relic, Inc. Preferred | 809 | |||||||
| 08/2014 | 118 | Nutanix, Inc. Preferred | 1,582 | |||||||
| 01/2014 | 83 | One Kings Lane, Inc. Preferred | 1,285 | |||||||
| 10/2014 | 243 | Platform Specialty Products Corp. PIPE | 6,207 | |||||||
| 04/2014 | 1,220 | Pure Storage, Inc. Preferred | 19,180 | |||||||
| 11/2013 | 771 | Tory Burch LLC | 60,400 | |||||||
| 06/2014 | 500 | Uber Technologies, Inc. Preferred | 31,039 | |||||||
| 08/2014 | 58 | Veracode, Inc. Preferred | 1,075 | |||||||
At October 31, 2014, the aggregate value of these securities was $114,632, which represents 1.0% of total net assets.
| β | Convertible security. |
| ☼ | This security, or a portion of this security, was purchased on a when-issued or delayed-delivery basis. The cost of these securities was $4,972 at October 31, 2014. |
| ‡ | This security, or a portion of this security, has been segregated to cover funding requirements on investment transactions settling in the future. |
The accompanying notes are an integral part of these financial statements.
| 10 |
The Hartford Capital Appreciation Fund
Schedule of Investments – (continued)
October 31, 2014
| (000’s Omitted) |
Foreign Currency Contracts Outstanding at October 31, 2014
| Unrealized Appreciation/(Depreciation) | ||||||||||||||||||||||
| Currency | Buy / Sell | Delivery Date | Counterparty | Contract Amount | Market Value ╪ | Asset | Liability | |||||||||||||||
| CAD | Buy | 11/04/2014 | BCLY | $ | 705 | $ | 700 | $ | – | $ | (5 | ) | ||||||||||
| CHF | Buy | 11/03/2014 | BMO | 26 | 26 | – | – | |||||||||||||||
| EUR | Buy | 11/03/2014 | RBC | 805 | 800 | – | (5 | ) | ||||||||||||||
| EUR | Sell | 12/03/2014 | BCLY | 52,329 | 52,502 | – | (173 | ) | ||||||||||||||
| EUR | Sell | 12/03/2014 | BOA | 119,329 | 115,734 | 3,595 | – | |||||||||||||||
| EUR | Sell | 12/17/2014 | JPM | 42,880 | 42,970 | – | (90 | ) | ||||||||||||||
| HKD | Sell | 11/03/2014 | UBS | 6,437 | 6,437 | – | – | |||||||||||||||
| JPY | Buy | 12/03/2014 | BCLY | 38,202 | 34,493 | – | (3,709 | ) | ||||||||||||||
| JPY | Buy | 12/03/2014 | BMO | 55,195 | 49,990 | – | (5,205 | ) | ||||||||||||||
| JPY | Buy | 12/03/2014 | CBA | 57,326 | 52,277 | – | (5,049 | ) | ||||||||||||||
| JPY | Buy | 11/06/2014 | DEUT | 1,454 | 1,446 | – | (8 | ) | ||||||||||||||
| JPY | Buy | 12/03/2014 | DEUT | 33,317 | 30,383 | – | (2,934 | ) | ||||||||||||||
| JPY | Buy | 12/03/2014 | MSC | 19,157 | 17,378 | – | (1,779 | ) | ||||||||||||||
| JPY | Buy | 12/03/2014 | SCB | 32,533 | 29,358 | – | (3,175 | ) | ||||||||||||||
| JPY | Buy | 11/04/2014 | SSG | 1,756 | 1,689 | – | (67 | ) | ||||||||||||||
| JPY | Buy | 11/05/2014 | UBS | 1,941 | 1,885 | – | (56 | ) | ||||||||||||||
| JPY | Sell | 12/03/2014 | BCLY | 238,997 | 216,834 | 22,163 | – | |||||||||||||||
| JPY | Sell | 12/03/2014 | BOA | 110,179 | 99,889 | 10,290 | – | |||||||||||||||
| JPY | Sell | 12/03/2014 | CBK | 110,136 | 99,888 | 10,248 | – | |||||||||||||||
| JPY | Sell | 11/06/2014 | DEUT | 5,497 | 5,465 | 32 | – | |||||||||||||||
| JPY | Sell | 12/03/2014 | DEUT | 22,325 | 20,658 | 1,667 | – | |||||||||||||||
| JPY | Sell | 12/17/2014 | JPM | 10,477 | 9,945 | 532 | – | |||||||||||||||
| JPY | Sell | 11/04/2014 | SSG | 246 | 237 | 9 | – | |||||||||||||||
| JPY | Sell | 11/05/2014 | UBS | 630 | 612 | 18 | – | |||||||||||||||
| Total | $ | 48,554 | $ | (22,255 | ) | |||||||||||||||||
| ╪ | See Significant Accounting Policies of accompanying Notes to Financial Statements regarding valuation of securities. |
| GLOSSARY: (abbreviations used in preceding Schedule of Investments) | |
| Counterparty Abbreviations: | |
| BCLY | Barclays |
| BMO | Bank of Montreal |
| BOA | Banc of America Securities LLC |
| CBA | Commonwealth Bank of Australia |
| CBK | Citibank NA |
| DEUT | Deutsche Bank Securities, Inc. |
| JPM | JP Morgan Chase & Co. |
| MSC | Morgan Stanley |
| RBC | RBC Dominion Securities, Inc. |
| SCB | Standard Chartered Bank |
| SSG | State Street Global Markets LLC |
| UBS | UBS AG |
| Currency Abbreviations: | |
| CAD | Canadian Dollar |
| CHF | Swiss Franc |
| EUR | EURO |
| HKD | Hong Kong Dollar |
| JPY | Japanese Yen |
| Index Abbreviations: | |
| S&P | Standard & Poors |
| Other Abbreviations: | |
| ADR | American Depositary Receipt |
| FHLMC | Federal Home Loan Mortgage Corp. |
| FNMA | Federal National Mortgage Association |
| GNMA | Government National Mortgage Association |
| PIPE | Private Investment in Public Equity |
| REIT | Real Estate Investment Trust |
The accompanying notes are an integral part of these financial statements.
| 11 |
The Hartford Capital Appreciation Fund
Schedule of Investments – (continued)
October 31, 2014
| (000’s Omitted) |
| Investment Valuation Hierarchy Level Summary |
| October 31, 2014 |
| Total | Level 1 ♦ | Level 2 ♦ | Level 3 | |||||||||||||
| Assets: | ||||||||||||||||
| Common Stocks | ||||||||||||||||
| Automobiles and Components | $ | 166,850 | $ | 160,138 | $ | 6,712 | $ | – | ||||||||
| Banks | 429,325 | 163,454 | 265,871 | – | ||||||||||||
| Capital Goods | 907,348 | 680,720 | 226,628 | – | ||||||||||||
| Commercial and Professional Services | 96,816 | 96,816 | – | – | ||||||||||||
| Consumer Durables and Apparel | 205,209 | 175,706 | 29,503 | – | ||||||||||||
| Consumer Services | 232,888 | 227,175 | 5,713 | – | ||||||||||||
| Diversified Financials | 597,217 | 554,181 | 37,199 | 5,837 | ||||||||||||
| Energy | 798,018 | 757,756 | 40,262 | – | ||||||||||||
| Food and Staples Retailing | 170,365 | 155,765 | 14,600 | – | ||||||||||||
| Food, Beverage and Tobacco | 412,831 | 319,349 | 93,482 | – | ||||||||||||
| Health Care Equipment and Services | 324,390 | 324,390 | – | – | ||||||||||||
| Household and Personal Products | 79,901 | 21,946 | 57,955 | – | ||||||||||||
| Insurance | 532,040 | 502,666 | 29,374 | – | ||||||||||||
| Materials | 434,535 | 312,012 | 122,523 | – | ||||||||||||
| Media | 92,041 | 92,041 | – | – | ||||||||||||
| Pharmaceuticals, Biotechnology and Life Sciences | 1,539,274 | 1,290,269 | 249,005 | – | ||||||||||||
| Real Estate | 118,092 | 102,854 | 15,238 | – | ||||||||||||
| Retailing | 908,604 | 850,432 | 7,373 | 50,799 | ||||||||||||
| Semiconductors and Semiconductor Equipment | 977,901 | 884,650 | 93,251 | – | ||||||||||||
| Software and Services | 1,199,250 | 1,187,873 | 11,377 | – | ||||||||||||
| Technology Hardware and Equipment | 874,384 | 821,310 | 53,074 | – | ||||||||||||
| Telecommunication Services | 87,148 | 43,359 | 43,789 | – | ||||||||||||
| Transportation | 171,477 | 127,272 | 44,205 | – | ||||||||||||
| Utilities | 107,450 | 68,560 | 38,890 | – | ||||||||||||
| Total | 11,463,354 | 9,920,694 | 1,486,024 | 56,636 | ||||||||||||
| Exchange Traded Funds | 1,807 | 1,807 | – | – | ||||||||||||
| Preferred Stocks | 57,996 | – | – | 57,996 | ||||||||||||
| Short-Term Investments | 446,457 | – | 446,457 | – | ||||||||||||
| Total | $ | 11,969,614 | $ | 9,922,501 | $ | 1,932,481 | $ | 114,632 | ||||||||
| Foreign Currency Contracts* | $ | 48,554 | $ | – | $ | 48,554 | $ | – | ||||||||
| Total | $ | 48,554 | $ | – | $ | 48,554 | $ | – | ||||||||
| Liabilities: | ||||||||||||||||
| Foreign Currency Contracts* | $ | 22,255 | $ | – | $ | 22,255 | $ | – | ||||||||
| Total | $ | 22,255 | $ | – | $ | 22,255 | $ | – | ||||||||
| ♦ | For the year ended October 31, 2014, investments valued at $60,696 were transferred from Level 1 to Level 2, and there were no transfers from Level 2 to Level 1. Investments are transferred between Level 1 and Level 2 for a variety of reasons including, but not limited to: |
| 1) | Foreign equities for which a fair value price is more representative of exit value than the local market close (transfer into Level 2). Foreign equities for which the local market close is more representative of exit value (transfer into Level 1). | |
| 2) | U.S. Treasury securities that no longer represent the most recent issue (transfer into Level 2). | |
| 3) | Equity investments with no observable trading but a bid or mean price is used (transfer into Level 2). Equity investments using observable quoted prices in an active market (transfer into Level 1). |
| * | Derivative instruments (excluding purchased and written options, if applicable) are valued at the unrealized appreciation/depreciation on the investments. |
The accompanying notes are an integral part of these financial statements.
| 12 |
The Hartford Capital Appreciation Fund
Schedule of Investments – (continued)
October 31, 2014
| (000’s Omitted) |
Following is a reconciliation of Level 3 assets for which significant unobservable inputs were used to determine fair value:
| Balance as of October 31, 2013 | Realized Gain (Loss) | Change in Unrealized Appreciation (Depreciation) | Net Amortization | Purchases | Sales | Transfers Into Level 3 * | Transfers Out of Level 3 * | Balance as of October 31, 2014 | ||||||||||||||||||||||||||||
| Assets: | ||||||||||||||||||||||||||||||||||||
| Common Stocks | $ | 160,513 | $ | (1,224 | ) | $ | (9,411 | )† | $ | — | $ | 67,374 | $ | (9,675 | ) | $ | — | $ | (150,941 | ) | $ | 56,636 | ||||||||||||||
| Preferred Stocks | — | — | (5,092 | )‡ | — | 63,088 | — | — | — | 57,996 | ||||||||||||||||||||||||||
| Warrants | 6 | — | — | — | — | — | — | (6 | ) | — | ||||||||||||||||||||||||||
| Total | $ | 160,519 | $ | (1,224 | ) | $ | (14,503 | ) | $ | — | $ | 130,462 | $ | (9,675 | ) | $ | — | $ | (150,947 | ) | $ | 114,632 | ||||||||||||||
| * | Investments are transferred into and out of Level 3 for a variety of reasons including, but not limited to: |
| 1) | Investments where trading has been halted (transfer into Level 3) or investments where trading has resumed (transfer out of Level 3). | |
| 2) | Broker quoted investments (transfer into Level 3) or quoted prices in active markets (transfer out of Level 3). | |
| 3) | Investments that have certain restrictions on trading (transfer into Level 3) or investments where trading restrictions have expired (transfer out of Level 3). |
| † | Change in unrealized appreciation (depreciation) in the current period relating to assets still held at October 31, 2014 was $(10,295). |
| ‡ | Change in unrealized appreciation (depreciation) in the current period relating to assets still held at October 31, 2014 was $(5,092). |
| Note: | For purposes of reporting transfers between different hierarchy levels, both transfers in and out of each level, as applicable, are shown as if they occurred at the beginning of the period. |
The accompanying notes are an integral part of these financial statements.
| 13 |
The Hartford Capital Appreciation Fund
Statement of Assets and Liabilities
October 31, 2014
|
(000’s Omitted) |
| Assets: | ||||
| Investments in securities, at market value (cost $11,105,311) | $ | 11,969,614 | ||
| Cash | 1 | |||
| Foreign currency on deposit with custodian (cost $—) | — | |||
| Unrealized appreciation on foreign currency contracts | 48,554 | |||
| Receivables: | ||||
| Investment securities sold | 73,675 | |||
| Fund shares sold | 5,716 | |||
| Dividends and interest | 14,164 | |||
| Other assets | 176 | |||
| Total assets | 12,111,900 | |||
| Liabilities: | ||||
| Unrealized depreciation on foreign currency contracts | 22,255 | |||
| Payables: | ||||
| Investment securities purchased | 154,425 | |||
| Fund shares redeemed | 13,085 | |||
| Investment management fees | 1,466 | |||
| Administrative fees | 12 | |||
| Distribution fees | 716 | |||
| Accrued expenses | 1,707 | |||
| Total liabilities | 193,666 | |||
| Net assets | $ | 11,918,234 | ||
| Summary of Net Assets: | ||||
| Capital stock and paid-in-capital | $ | 8,019,232 | ||
| Undistributed net investment income | 32,697 | |||
| Accumulated net realized gain | 2,975,846 | |||
| Unrealized appreciation of investments and the translation of assets and liabilities denominated in foreign currency | 890,459 | |||
| Net assets | $ | 11,918,234 | ||
| Shares authorized | 1,615,000 | |||
| Par value | $ | 0.001 | ||
| Class A: Net asset value per share/Maximum offering price per share | $49.44/$52.32 | |||
| Shares outstanding | 117,110 | |||
| Net assets | $ | 5,789,682 | ||
| Class B: Net asset value per share | $ | 42.72 | ||
| Shares outstanding | 6,326 | |||
| Net assets | $ | 270,227 | ||
| Class C: Net asset value per share | $ | 43.13 | ||
| Shares outstanding | 46,191 | |||
| Net assets | $ | 1,992,142 | ||
| Class I: Net asset value per share | $ | 49.60 | ||
| Shares outstanding | 44,247 | |||
| Net assets | $ | 2,194,464 | ||
| Class R3: Net asset value per share | $ | 52.24 | ||
| Shares outstanding | 2,615 | |||
| Net assets | $ | 136,576 | ||
| Class R4: Net asset value per share | $ | 53.19 | ||
| Shares outstanding | 3,597 | |||
| Net assets | $ | 191,319 | ||
| Class R5: Net asset value per share | $ | 53.92 | ||
| Shares outstanding | 1,100 | |||
| Net assets | $ | 59,285 | ||
| Class Y: Net asset value per share | $ | 54.12 | ||
| Shares outstanding | 23,736 | |||
| Net assets | $ | 1,284,539 |
The accompanying notes are an integral part of these financial statements.
| 14 |
The Hartford Capital Appreciation Fund
Statement of Operations
For the Year Ended October 31, 2014
|
(000’s Omitted) |
| Investment Income: | ||||
| Dividends | $ | 196,371 | ||
| Interest | 203 | |||
| Less: Foreign tax withheld | (8,814 | ) | ||
| Total investment income | 187,760 | |||
| Expenses: | ||||
| Investment management fees | 79,163 | |||
| Administrative services fees | ||||
| Class R3 | 273 | |||
| Class R4 | 282 | |||
| Class R5 | 70 | |||
| Transfer agent fees | ||||
| Class A | 8,900 | |||
| Class B | 820 | |||
| Class C | 2,384 | |||
| Class I | 1,418 | |||
| Class R3 | 13 | |||
| Class R4 | 4 | |||
| Class R5 | 1 | |||
| Class Y | 22 | |||
| Distribution fees | ||||
| Class A | 14,832 | |||
| Class B | 3,294 | |||
| Class C | 19,956 | |||
| Class R3 | 682 | |||
| Class R4 | 469 | |||
| Custodian fees | 252 | |||
| Accounting services fees | 1,806 | |||
| Registration and filing fees | 313 | |||
| Board of Directors' fees | 323 | |||
| Audit fees | 98 | |||
| Other expenses | 1,856 | |||
| Total expenses (before waivers and fees paid indirectly) | 137,231 | |||
| Expense waivers | (6 | ) | ||
| Commission recapture | (334 | ) | ||
| Custodian fee offset | — | |||
| Total waivers and fees paid indirectly | (340 | ) | ||
| Total expenses, net | 136,891 | |||
| Net Investment Income | 50,869 | |||
| Net Realized Gain on Investments, Other Financial Instruments and Foreign Currency Transactions: | ||||
| Net realized gain on investments | 2,898,819 | |||
| Net realized loss on purchased option contracts | (25 | ) | ||
| Net realized gain on foreign currency contracts | 80,763 | |||
| Net realized gain on other foreign currency transactions | 796 | |||
| Net Realized Gain on Investments, Other Financial Instruments and Foreign Currency Transactions | 2,980,353 | |||
| Net Changes in Unrealized Depreciation of Investments and Foreign Currency Transactions: | ||||
| Net unrealized depreciation of investments | (1,567,990 | ) | ||
| Net unrealized depreciation of foreign currency contracts | (46,105 | ) | ||
| Net unrealized depreciation of translation of other assets and liabilities in foreign currencies | (308 | ) | ||
| Net Changes in Unrealized Depreciation of Investments and Foreign Currency Transactions | (1,614,403 | ) | ||
| Net Gain on Investments, Other Financial Instruments and Foreign Currency Transactions | 1,365,950 | |||
| Net Increase in Net Assets Resulting from Operations | $ | 1,416,819 |
The accompanying notes are an integral part of these financial statements.
| 15 |
The Hartford Capital Appreciation Fund
Statement of Changes in Net Assets
| (000’s Omitted) |
| For the Year Ended October 31, 2014 | For the Year Ended October 31, 2013 | |||||||
| Operations: | ||||||||
| Net investment income | $ | 50,869 | $ | 53,532 | ||||
| Net realized gain on investments, other financial instruments and foreign currency transactions | 2,980,353 | 1,882,921 | ||||||
| Net unrealized appreciation (depreciation) of investments and foreign currency transactions | (1,614,403 | ) | 2,167,935 | |||||
| Net Increase in Net Assets Resulting from Operations | 1,416,819 | 4,104,388 | ||||||
| Distributions to Shareholders: | ||||||||
| From net investment income | ||||||||
| Class A | (16,001 | ) | (33,216 | ) | ||||
| Class C | — | (758 | ) | |||||
| Class I | (10,300 | ) | (31,552 | ) | ||||
| Class R3 | — | (420 | ) | |||||
| Class R4 | (465 | ) | (999 | ) | ||||
| Class R5 | (214 | ) | (1,806 | ) | ||||
| Class Y | (8,226 | ) | (13,888 | ) | ||||
| Total from net investment income | (35,206 | ) | (82,639 | ) | ||||
| From net realized gain on investments | ||||||||
| Class A | (234,951 | ) | — | |||||
| Class B | (17,287 | ) | — | |||||
| Class C | (89,367 | ) | — | |||||
| Class I | (80,991 | ) | — | |||||
| Class R3 | (5,105 | ) | — | |||||
| Class R4 | (6,898 | ) | — | |||||
| Class R5 | (5,136 | ) | — | |||||
| Class Y | (49,496 | ) | — | |||||
| Total from net realized gain on investments | (489,231 | ) | — | |||||
| Total distributions | (524,437 | ) | (82,639 | ) | ||||
| Capital Share Transactions: | ||||||||
| Class A | (454,816 | ) | (850,316 | ) | ||||
| Class B | (131,106 | ) | (141,765 | ) | ||||
| Class C | (78,747 | ) | (299,644 | ) | ||||
| Class I | 21,041 | (1,907,024 | ) | |||||
| Class R3 | (7,992 | ) | (30,581 | ) | ||||
| Class R4 | (7,885 | ) | (41,402 | ) | ||||
| Class R5 | (87,055 | ) | (96,287 | ) | ||||
| Class Y | (174,747 | ) | (407,354 | ) | ||||
| Net decrease from capital share transactions | (921,307 | ) | (3,774,373 | ) | ||||
| Net Increase (Decrease) in Net Assets | (28,925 | ) | 247,376 | |||||
| Net Assets: | ||||||||
| Beginning of period | 11,947,159 | 11,699,783 | ||||||
| End of period | $ | 11,918,234 | $ | 11,947,159 | ||||
| Undistributed (distributions in excess of) net investment income | $ | 32,697 | $ | 23,267 | ||||
The accompanying notes are an integral part of these financial statements.
| 16 |
The Hartford Capital Appreciation Fund
Notes to Financial Statements
October 31, 2014
|
(000’s Omitted) |
Organization:
The Hartford Mutual Funds, Inc. (“Company”) is an open-end management investment company comprised of forty-two portfolios. Financial statements for The Hartford Capital Appreciation Fund (the "Fund"), a series of the Company, are included in this report.
The Company is organized under the laws of the State of Maryland and is registered with the Securities and Exchange Commission (“SEC”) under the Investment Company Act of 1940, as amended (“1940 Act”). The Fund is a diversified open-end management investment company. The Fund is an investment company and applies specialized accounting and reporting under Accounting Standards Codification Topic 946, Financial Services - Investment Companies.
Class A shares are sold with a front-end sales charge of up to 5.50%. Class B shares were sold with a contingent deferred sales charge which is assessed on the lesser of the per share net asset value (“NAV”) of the shares at the time of redemption or the original purchase price, and declines from up to 5.00% to zero depending on the period of time the shares are held (see note below regarding the closing of Class B shares). Class C shares are sold with a contingent deferred sales charge of up to 1.00% on shares redeemed within twelve months of purchase. Class I shares are sold without sales charges to certain eligible investors primarily through advisory fee-based wrap programs. Class R3, R4 and R5 shares, which are offered to employer-sponsored retirement plans, and Class Y shares, which are sold to certain eligible institutional investors, are sold without a sales charge. All classes of shares have identical voting, redemption, dividend, liquidation and other rights and the same terms and conditions, with the exceptions that each class may have different expenses, which may affect performance, and that Class B shares automatically convert to Class A shares after 8 years.
No new or additional investments are allowed in Class B shares of the Fund (including investments through any systematic investment plan). Existing shareholders of Class B shares may continue to hold their Class B shares, exchange their Class B shares for Class B shares of another Hartford Fund (as permitted by existing exchange privileges), or redeem their Class B shares as described in the Fund’s prospectus. Reinstatement privileges with respect to Class B shares are set forth in the Fund's prospectus. For investors electing to reinvest capital gains and dividends, any such capital gains or dividends on Class B shares will continue to be reinvested in Class B shares of the Fund. All Class B share attributes, including the 12b-1 fee, contingent deferred sales charge schedule, and conversion to Class A shares, remain unchanged.
Significant Accounting Policies:
The following is a summary of significant accounting policies of the Fund in the preparation of its financial statements, which are in accordance with United States generally accepted accounting principles (“U.S. GAAP”). The preparation of financial statements in accordance with U.S. GAAP may require management to make estimates and assumptions that affect the reported amounts of assets and liabilities and disclosure of contingent assets and liabilities at the date of the financial statements and the reported amounts of increases and decreases in net assets from operations during the reporting period. Actual results could differ from those estimates.
Determination of Net Asset Value – The NAV of each class of the Fund's shares is determined as of the close of regular trading (normally 4:00 p.m. Eastern Time) (the “NYSE Close”) on each day that the New York Stock Exchange (the “Exchange”) is open (“Valuation Date”). Information that becomes known to the Fund after the NAV has been calculated on a particular day will not generally be used to retroactively adjust the NAV determined earlier that day.
Investment Valuation and Fair Value Measurements – For purposes of calculating the NAV, portfolio investments and other assets held by the Fund's portfolio for which market quotes are readily available are valued at market value. Market value is generally determined on the basis of last reported sales prices or official close price. If no sales are reported, market value is based on quotes obtained from a quotation reporting system, established market makers, or independent pricing services. If market prices are not readily available or are deemed unreliable, the Fund will use the fair value of the investment as determined in good faith under policies and procedures established by and under the supervision of the Company's Board of Directors. Market quotes are considered not readily available where there is an absence of current or reliable market-based data (e.g., trade information or indicative market quotes), including where events occur after the close of the relevant market, but prior to the NYSE Close, that materially affect the values of the Fund's portfolio investments or assets. In addition, market quotes are considered not readily available when, due to extraordinary circumstances, the exchanges or markets on which the investments trade do not open for trading for the entire day and no other market prices are available. In addition, prices of foreign equities that are principally traded on certain foreign markets may
| 17 |
The Hartford Capital Appreciation Fund
Notes to Financial Statements – (continued)
October 31, 2014
| (000’s Omitted) |
be adjusted daily pursuant to a fair value pricing service approved by the Board of Directors in order to reflect an adjustment for the factors occurring after the close of certain foreign markets but before the NYSE Close. Investments that are primarily traded on foreign markets may trade on days that are not business days of the Fund. The value of the foreign investments in which the Fund invests may change on days when a shareholder will not be able to purchase or redeem shares of the Fund. Fair value pricing is subjective in nature and the use of fair value pricing by the Fund may cause the NAV of its shares to differ significantly from the NAV that would have been calculated using market prices at the close of the exchange on which a portfolio investment is primarily traded. There can be no assurance that the Fund could obtain the fair market value assigned to an investment if the Fund were to sell the investment at approximately the time at which the Fund determines its NAV.
Fixed income investments (other than short-term obligations), non-exchange traded derivatives and centrally cleared swaps held by the Fund are normally valued on the basis of quotes obtained from independent pricing services or brokers and dealers in accordance with procedures established by the Company's Board of Directors. Prices obtained from independent pricing services use information provided by market makers or estimates of market values through accepted market modeling, trading and pricing conventions. Inputs to the models may include, but are not limited to, prepayment speeds, pricing spread, yield, trade information, dealer quotes, market color, cash flow models and the investment’s terms and conditions. Generally, the Fund may use fair valuation in regard to fixed income investments when the Fund holds defaulted or distressed investments or investments in a company in which a reorganization is pending. Short-term investments maturing in 60 days or less are generally valued at amortized cost, if their original term to maturity was 60 days or less, or by amortizing their value on the 61st day prior to maturity, if the original term to maturity exceeded 60 days, which approximates fair value.
Investments valued in currencies other than U.S. dollars are converted to U.S. dollars using exchange rates obtained from independent pricing services for calculation of the NAV. As a result, the NAV of the Fund’s shares may be affected by changes in the value of currencies in relation to the U.S. dollar. The value of investments traded in markets outside the United States or denominated in currencies other than the U.S. dollar may be affected significantly on a day that the NYSE is closed and the market value may change on days when an investor is not able to purchase, redeem or exchange shares of the Fund.
Foreign currency contracts represent agreements to exchange currencies on specific future dates at predetermined rates. Foreign currency contracts are valued using foreign currency exchange rates and forward rates as provided by an independent pricing service on the Valuation Date.
Financial instruments for which prices are not available from an independent pricing service may be valued using market quotations obtained from one or more dealers that make markets in the respective financial instrument in accordance with procedures established by the Company's Board of Directors.
U.S. GAAP defines fair value as the price that the Fund would receive to sell an asset or pay to transfer a liability in an orderly transaction between market participants. The U.S. GAAP fair value measurement standards require disclosure of a fair value hierarchy for each major category of assets and liabilities. Various inputs are used in determining the fair value of the Fund’s investments. These inputs are summarized into three broad hierarchy levels. This hierarchy is based on whether the valuation inputs are observable or unobservable. These levels are:
Level 1 – Quoted prices in active markets for identical investments. Level 1 may include exchange traded instruments, such as domestic equities, some foreign equities, options, futures, mutual funds, exchange traded funds, rights and warrants.
Level 2 – Observable inputs other than Level 1 prices, such as quoted prices for similar investments; quoted prices in markets that are not active; or other inputs that are observable or can be corroborated by observable market data. Level 2 may include debt investments that are traded less frequently than exchange traded instruments and which are valued using independent pricing services; foreign equities, which are principally traded on certain foreign markets and are adjusted daily pursuant to a fair value pricing service in order to reflect an adjustment for the factors occurring after the close of certain foreign markets but before the NYSE Close; senior floating rate interests, which are valued using an aggregate of dealer bids; short-term investments, which are valued at amortized cost; and swaps, which are valued based upon the terms of each swap contract.
| 18 |
The Hartford Capital Appreciation Fund
Notes to Financial Statements – (continued)
October 31, 2014
| (000’s Omitted) |
Level 3 – Significant unobservable inputs that are supported by limited or no market activity. Level 3 may include financial instruments whose values are determined using indicative market quotes or require significant management judgment or estimation. These unobservable valuation inputs may include estimates for current yields, maturity/duration, prepayment speed, and indicative market quotes for comparable investments along with other assumptions relating to credit quality, collateral value, complexity of the investment structure, general market conditions and liquidity. This category may include investments where trading has been halted or there are certain restrictions on trading. While these investments are priced using unobservable inputs, the valuation of these investments reflects the best available data and management believes the prices are a reasonable representation of exit price.
The Board of Directors of the Company generally reviews and approves the “Procedures for Valuation of Portfolio Securities” at least once a year. These procedures define how investments are to be valued, including the formation and activities of a Valuation Committee. The Valuation Committee is responsible for determining in good faith the fair value of investments when the value cannot be obtained from primary pricing services or alternative sources or if the valuation of an investment as provided by the primary pricing service or alternative source is believed not to reflect the investment’s fair value as of the Valuation Date. Voting members of the Valuation Committee include the Fund's Treasurer or designee and a Vice President of the investment manager or designee. An Assistant Vice President of the Fund with legal expertise or designee is also included on the Valuation Committee as a non-voting advisory member. In addition, the Fund’s Chief Compliance Officer shall designate a member of the compliance group to attend Valuation Committee meetings as a non-voting resource, to monitor for and provide guidance with respect to compliance with these procedures. Two members of the Valuation Committee or their designees, representing different departments, shall constitute a quorum for purposes of permitting the Valuation Committee to take action. The Valuation Committee will consider all relevant factors in determining an investment’s fair value, and may seek the advice of the Fund’s sub-adviser, knowledgeable brokers, and legal counsel in making such determination. The Valuation Committee reports to the Audit Committee of the Company's Board of Directors. The Audit Committee receives quarterly written reports which include details of all fair-valued investments, including the reason for the fair valuation, and an indication, when possible, of the accuracy of the valuation by disclosing the next available reliable public price quotation or the disposition price of such investments (the “look-back” test). The Board of Directors then must consider for ratification all of the fair value determinations made during the previous quarter.
Valuation levels are not necessarily indicative of the risk associated with investing in such investments. Individual investments within any of the above mentioned asset classes may be assigned a different hierarchical level than those presented above, as individual circumstances dictate.
For additional information, refer to the Investment Valuation Hierarchy Level Summary and the Level 3 roll-forward reconciliation, if applicable, which follow the Schedule of Investments.
Investment Transactions and Investment Income – Investment transactions are recorded as of the trade date (the date the order to buy or sell is executed) for financial reporting purposes. Investments purchased or sold on a when-issued or delayed-delivery basis may be settled a month or more after the trade date. Realized gains and losses are determined on the basis of identified cost.
Dividend income from domestic securities is accrued on the ex-dividend date. In general, dividend income from foreign securities is recorded on the ex-date; however, dividend notifications in certain foreign jurisdictions may not be available in a timely manner and as a result, the Fund will record the dividend as soon as the relevant details (i.e., rate per share, payment date, shareholders of record, etc.) are publicly available. Interest income, including amortization of premium, accretion of discounts and additional principal received in-kind in lieu of cash, is accrued on a daily basis.
Foreign Currency Transactions – Assets and liabilities denominated in currencies other than U.S. dollars are translated into U.S. dollars at the exchange rates in effect on the valuation date. Purchases and sales of investments, income and expenses are translated into U.S. dollars at the exchange rates on the dates of such transactions.
The Fund does not isolate that portion of portfolio investment valuation resulting from fluctuations in the foreign currency exchange rates from the fluctuations arising from changes in the market prices of investments held. Exchange rate fluctuations are included with the net realized and unrealized gain or loss on investments in the accompanying financial statements.
| 19 |
The Hartford Capital Appreciation Fund
Notes to Financial Statements – (continued)
October 31, 2014
| (000’s Omitted) |
Net realized foreign exchange gains or losses arise from sales of foreign currencies and the difference between asset and liability amounts initially stated in foreign currencies and the U.S. dollar value of the amounts actually received or paid. Net unrealized foreign exchange gains or losses arise from changes in the value of other assets and liabilities at the end of the reporting period, resulting from changes in the exchange rates.
Joint Trading Account – The Fund may invest cash balances into a joint trading account that may be invested in one or more repurchase agreements.
Fund Share Valuation and Dividend Distributions to Shareholders – Orders for the Fund’s shares are executed in accordance with the investment instructions of the shareholders. The NAV of the Fund’s shares is determined as of the close of business on each business day of the Exchange. The NAV is determined separately for each class of shares of the Fund by dividing the Fund’s net assets attributable to that class by the number of shares of the class outstanding. Each class of shares offered by the Fund has equal rights as to assets and voting privileges (except that shareholders of a class have exclusive voting rights regarding any matter relating solely to that class of shares). Income and non-class specific expenses are allocated daily to each class on the basis of the relative net assets of the class. Realized and unrealized gains and losses are allocated daily based on the relative net assets of each class of shares of the Fund.
Orders for the purchase of the Fund’s shares received prior to the close of the Exchange on any day the Exchange is open for business are priced at the NAV determined as of the close of the Exchange. Orders received after the close of the Exchange, or on a day on which the Exchange and/or the Fund is not open for business, are priced at the next determined NAV.
Dividends are declared pursuant to a policy adopted by the Company's Board of Directors based upon the investment performance of the Fund. The policy of the Fund is to pay dividends from net investment income and realized gains, if any, at least once a year.
Net investment income, dividends and distributions from net realized gains and capital are determined in accordance with federal income tax regulations, which may differ from U.S. GAAP with respect to character and timing (see Federal Income Taxes: Distributions and Components of Distributable Earnings and Reclassification of Capital Accounts).
Securities and Other Investments:
Repurchase Agreements – A repurchase agreement is an agreement by which a counterparty agrees to sell an investment and agrees to repurchase the investment sold from the buyer at a mutually agreed upon time and price. During the period of the repurchase agreement, the counterparty will deposit cash and or securities in a third party custodial account to serve as collateral. At the time the Fund enters into a repurchase agreement, the value of the underlying collateral, including accrued interest, will be equal to or exceed the value of the repurchase agreement. Repurchase agreements expose the Fund to counterparty risk - that is, the risk that the counterparty will not fulfill its obligations. To minimize counterparty risk, the investments that serve to collateralize the repurchase agreement are held by the Fund’s custodian in book entry or physical form in the custodial account of the Fund or in a third party custodial account. Repurchase agreements are valued at cost plus accrued interest, which approximates fair value. Repurchase agreements have master netting arrangements which allow the Fund to offset amounts owed to a counterparty with amounts owed by the counterparty, including any collateral. Upon an event of default under a master repurchase agreement, the non-defaulting party may close out all transactions traded under such agreement and net amounts owed under each transaction to one net amount payable by one party to the other. Absent an event of default, the master repurchase agreement does not result in an offset of reported amounts of assets and liabilities in the Statement of Assets and Liabilities across transactions between the Fund and the applicable counterparty. The Fund, as shown on the Schedule of Investments, had outstanding repurchase agreements and related collateral as of October 31, 2014.
Illiquid and Restricted Investments – The Fund is permitted to invest up to 15% of its net assets in illiquid investments. Illiquid investments are those that may not be sold or disposed of in the ordinary course of business within seven days, at approximately the price used to determine the Fund’s NAV. The Fund may not be able to sell illiquid investments when its sub-adviser considers it desirable to do so or may have to sell such investments at a price that is lower than the price that could be obtained if the investments were more liquid. A sale of illiquid investments may require more time and may result in higher dealer discounts and other selling expenses than does the sale of those that are liquid. Illiquid investments also may be more difficult to value due to the unavailability of
| 20 |
The Hartford Capital Appreciation Fund
Notes to Financial Statements – (continued)
October 31, 2014
| (000’s Omitted) |
reliable market quotations for such investments, and an investment in them may have an adverse impact on the Fund’s NAV. The Fund may also purchase certain restricted investments that can only be resold to certain qualified investors and may be determined to be liquid pursuant to policies and guidelines established by the Company's Board of Directors. The Fund, as shown on the Schedule of Investments, had illiquid or restricted investments as of October 31, 2014.
Investments Purchased on a When-Issued or Delayed-Delivery Basis – Delivery and payment for investments that have been purchased by the Fund on a forward commitment, or when-issued or delayed-delivery basis, take place beyond the customary settlement period. The Fund may dispose of or renegotiate a delayed-delivery transaction after it is entered into, and may sell delayed-delivery investments before they are delivered, which may result in a realized gain or loss. During this period, such investments are subject to market fluctuations, and the Fund identifies investments segregated in its records with a value at least equal to the amount of the commitment. The Fund, as shown on the Schedule of Investments, had when-issued or delayed-delivery investments as of October 31, 2014.
Financial Derivative Instruments:
The following disclosures contain information on how and why the Fund uses derivative instruments, the credit-risk-related contingent features in certain derivative instruments and how derivative instruments affect the Fund’s financial position and results of operations. The location and fair value amounts of these instruments on the Statement of Assets and Liabilities and the realized gains and losses and changes in unrealized gains and losses on the Statement of Operations, each categorized by type of derivative contract, are included in the following Additional Derivative Instrument Information footnote. The derivative instruments outstanding as of year-end are disclosed in the notes to the Schedule of Investments, if applicable. The amounts of realized gains and losses and changes in unrealized gains and losses on derivative instruments during the year are disclosed in the Statement of Operations.
Foreign Currency Contracts – The Fund may enter into foreign currency contracts that obligate the Fund to purchase or sell currencies at specified future dates. Foreign currency contracts are used to hedge the currency exposure associated with some or all of the Fund’s investments and/or as part of an investment strategy. Foreign currency contracts are marked to market daily and the change in value is recorded by the Fund as an unrealized gain or loss. The Fund will record a realized gain or loss when the foreign currency contract is settled.
Foreign currency contracts involve elements of market risk in excess of the amounts reflected in the Statement of Assets and Liabilities. In addition, risks may arise upon entering into these contracts from the potential inability of the counterparties to meet the terms of the contracts and from unanticipated movements in the value of the foreign currencies relative to the U.S. dollar. The Fund, as shown on the Schedule of Investments, had outstanding foreign currency contracts as of October 31, 2014.
Options Contracts – An option contract is a contract sold by one party to another party that offers the buyer the right, but not the obligation, to buy (call) or sell (put) an investment or other financial asset at an agreed-upon price during a specific period of time or on a specific date. Options contracts are either privately negotiated in the over-the-counter market ("OTC options") or executed in a registered exchange ("exchange traded options"). The Fund may write (sell) covered call and put options on futures, swaps (“swaptions”), securities, commodities or currencies. “Covered” means that so long as the Fund is obligated as the writer of an option, it will own either the underlying investments or currency or an option to purchase the same underlying investments or currency having an expiration date of the covered option and an exercise price equal to or less than the exercise price of the covered option, or will pledge cash or other liquid investments having a value equal to or greater than the fluctuating market value of the option investment or currency. Writing put options increases the Fund’s exposure to the underlying instrument. Writing call options decreases the Fund’s exposure to the underlying instrument. Premiums received from writing options that expire are treated as realized gains. Premiums received from writing options that are exercised or closed are added to the proceeds or offset amounts paid on the underlying futures, swap, investment or currency transaction to determine the realized gain or loss. The Fund as a writer of an option has no control over whether the underlying instrument may be sold (call) or purchased (put) and as a result bears the market risk of an unfavorable change in the price of the instrument underlying the written option. There is the risk the Fund may not be able to enter into a closing transaction because of an illiquid market. The Fund may also purchase put and call options. Purchasing call options increases the Fund’s exposure to the underlying instrument. Purchasing put options decreases the Fund’s exposure to the underlying instrument. The Fund pays a premium, which is included on the Fund’s Statement of Assets and Liabilities as an investment and is subsequently marked to market to reflect the current value of the option. Premiums paid for purchasing options that expire are treated as realized
| 21 |
The Hartford Capital Appreciation Fund
Notes to Financial Statements – (continued)
October 31, 2014
| (000’s Omitted) |
losses. Certain options may be purchased with premiums to be determined on a future date. The premiums for these options are based upon implied volatility parameters at specified terms. The risk associated with purchasing put and call options is generally limited to the premium paid. Premiums paid for purchasing options that are exercised or closed are added to the amounts paid or offset against the proceeds on the underlying investment transaction to determine the realized gain or loss. Entering into over-the-counter options also exposes the Fund to counterparty risk. Counterparty risk is the possibility that the counterparty to the agreements may default on its obligation to perform or disagree as to the meaning of the contractual terms in the agreements.
As of October 31, 2014 the Fund had no outstanding purchased option or written option contracts. There were no transactions involving written option contracts during the year ended October 31, 2014.
Additional Derivative Instrument Information:
Fair Value of Derivative Instruments on the Statement of Assets and Liabilities as of October 31, 2014:
| Risk Exposure Category | ||||||||||||||||||||||||||||
| Interest Rate Contracts | Foreign Exchange Contracts | Credit Contracts | Equity Contracts | Commodity Contracts | Other Contracts | Total | ||||||||||||||||||||||
| Assets: | ||||||||||||||||||||||||||||
| Unrealized appreciation on foreign currency contracts | $ | — | $ | 48,554 | $ | — | $ | — | $ | — | $ | — | $ | 48,554 | ||||||||||||||
| Total | $ | — | $ | 48,554 | $ | — | $ | — | $ | — | $ | — | $ | 48,554 | ||||||||||||||
| Liabilities: | ||||||||||||||||||||||||||||
| Unrealized depreciation on foreign currency contracts | $ | — | $ | 22,255 | $ | — | $ | — | $ | — | $ | — | $ | 22,255 | ||||||||||||||
| Total | $ | — | $ | 22,255 | $ | — | $ | — | $ | — | $ | — | $ | 22,255 | ||||||||||||||
The volume of derivatives that is presented in the Schedule of Investments is consistent with the derivative activity during the year ended October 31, 2014.
The Effect of Derivative Instruments on the Statement of Operations for the year ended October 31, 2014:
| Risk Exposure Category | ||||||||||||||||||||||||||||
| Interest Rate Contracts | Foreign Exchange Contracts | Credit Contracts | Equity Contracts | Commodity Contracts | Other Contracts | Total | ||||||||||||||||||||||
| Realized Gain (Loss) on Derivatives Recognized as a Result of Operations: | ||||||||||||||||||||||||||||
| Net realized loss on purchased option contracts | $ | — | $ | — | $ | — | $ | (25 | ) | $ | — | $ | — | $ | (25 | ) | ||||||||||||
| Net realized gain on foreign currency contracts | — | 80,763 | — | — | — | — | 80,763 | |||||||||||||||||||||
| Total | $ | — | $ | 80,763 | $ | — | $ | (25 | ) | $ | — | $ | — | $ | 80,738 | |||||||||||||
| Net Change in Unrealized Appreciation (Depreciation) on Derivatives Recognized as a Result of Operations: | ||||||||||||||||||||||||||||
| Net change in unrealized depreciation of foreign currency contracts | $ | — | $ | (46,105 | ) | $ | — | $ | — | $ | — | $ | — | $ | (46,105 | ) | ||||||||||||
| Total | $ | — | $ | (46,105 | ) | $ | — | $ | — | $ | — | $ | — | $ | (46,105 | ) | ||||||||||||
Balance Sheet Offsetting Information - The following discloses both gross information and net information about instruments and transactions eligible for offset in the financial statements, and instruments and transactions that are subject to a master netting arrangement, as well as amounts related to margin, reflected as financial collateral (including cash collateral), held at clearing brokers, counterparties and the Fund’s custodian. The master netting arrangements allow the clearing brokers to net any collateral held in or on behalf of the Fund, or liabilities or payment obligations of the clearing brokers to the Fund, against any liabilities or payment obligations of the Fund to the clearing brokers. The Fund is required to deposit financial collateral (including cash collateral) at the Futures Commission Merchant's ("FCM") custodian on behalf of clearing brokers and counterparties to continually meet the original and maintenance requirements established by the clearing brokers and counterparties. Such requirements are specific to the respective clearing broker or counterparty. Certain master netting arrangements may not be enforceable in the bankruptcy proceedings of a counterparty.
| 22 |
The Hartford Capital Appreciation Fund
Notes to Financial Statements – (continued)
October 31, 2014
| (000’s Omitted) |
| Offsetting of Financial Assets and Derivative Assets as of October 31, 2014: | ||||||||||||||||||||
| Gross
Amounts* of Assets Presented in Statement of Assets and Liabilities | Financial Instruments with Allowable Netting | Non-cash Collateral Received | Cash
Collateral Received | Net
Amount (not less than $0) | ||||||||||||||||
| Description | ||||||||||||||||||||
| Unrealized appreciation on foreign currency contracts | $ | 48,495 | $ | (5,639 | ) | $ | — | $ | — | $ | 42,856 | |||||||||
| Total subject to a master netting or similar arrangement | $ | 48,495 | $ | (5,639 | ) | $ | — | $ | — | $ | 42,856 | |||||||||
* Gross amounts are presented here as there are no amounts that are netted within the Statement of Assets and Liabilities.
| Offsetting of Financial Liabilities and Derivative Liabilities as of October 31, 2014: | ||||||||||||||||||||
| Gross
Amounts* of Liabilities Presented in Statement of Assets and Liabilities | Financial Instruments with Allowable Netting | Non-cash Collateral Pledged | Cash
Collateral Pledged | Net
Amount (not less than $0) | ||||||||||||||||
| Description | ||||||||||||||||||||
| Unrealized depreciation on foreign currency contracts | $ | 22,114 | $ | (5,639 | ) | $ | — | $ | — | $ | 16,475 | |||||||||
| Total subject to a master netting or similar arrangement | $ | 22,114 | $ | (5,639 | ) | $ | — | $ | — | $ | 16,475 | |||||||||
| * | Gross amounts are presented here as there are no amounts that are netted within the Statement of Assets and Liabilities. |
Certain derivatives held by the Fund, as of October 31, 2014, are not subject to a master netting arrangement and are excluded from the table above.
Principal Risks:
Credit risk depends largely on the perceived financial health of bond issuers. In general, the credit rating is inversely related to the credit risk of the issuer. Higher rated bonds generally are deemed to have less credit risk, while lower or unrated bonds are deemed to have higher risk of default. The share price, yield and total return of a fund that holds securities with higher credit risk may be more volatile than those of a fund that holds bonds with lower credit risk. Similar to credit risk, the Fund may be exposed to counterparty risk, or the risk that an institution or other entity with which the Fund has unsettled or open transactions will default.
The Fund’s investments expose the Fund to various risks including, but not limited to, interest rate, prepayment, extension, foreign currency and equity risks. Interest rate risk is the risk that fixed income securities will decline in value because of changes in interest rates. As nominal interest rates rise, the values of certain fixed income securities held by the Fund are likely to decrease. A nominal interest rate can be described as the sum of a real interest rate and an expected inflation rate. Fixed income securities with longer durations tend to be more sensitive to changes in interest rates, usually making them more volatile than securities with shorter durations. Duration is useful primarily as a measure of the sensitivity of a fixed income security’s market price to interest rate (i.e., yield) movements. Rising interest rates may cause prepayments to occur at a slower than expected rate, thereby effectively lengthening the maturity of the security and making the security more sensitive to interest rate changes. Prepayment and extension risk are major risks of mortgage backed securities and certain asset backed securities. For certain asset backed securities, the actual maturity may be less than the stated maturity shown in the Schedule of Investments, if applicable. As a result, the timing of income recognition relating to these securities may vary based upon the actual maturity.
If the Fund invests directly in foreign currencies or in securities that trade in, and receive revenues in, foreign currencies, or in derivatives that provide exposure to foreign currencies, it will be subject to the risk that those currencies will decline in value relative to the base currency (U.S. dollars) of the Fund, or, in the case of hedging positions, that the Fund’s base currency will decline in value relative to the currency being hedged. Currency rates in foreign countries may fluctuate significantly over short periods of time for a number of reasons, including changes in interest rates, intervention (or the failure to intervene) by U.S. or foreign governments,
| 23 |
The Hartford Capital Appreciation Fund
Notes to Financial Statements – (continued)
October 31, 2014
| (000’s Omitted) |
central banks or supranational entities, such as the International Monetary Fund, or by the imposition of currency controls or other political developments in the United States or abroad. As a result, the Fund’s investments in foreign currency denominated securities may reduce the returns of the Fund. The market values of equity securities, such as common stocks and preferred stocks, or equity related investments, such as futures and options, may decline due to general market conditions which are not specifically related to a particular company, such as real or perceived adverse economic conditions, changes in the general outlook for corporate earnings, changes in interest or currency rates or adverse investor sentiment generally. The market value of equity securities may also decline due to factors which affect a particular industry or industries, such as labor shortages or increased production costs and competitive conditions within an industry. Equity securities and equity related investments generally have greater market price volatility than fixed income securities.
Federal Income Taxes:
Federal Income Taxes – For federal income tax purposes, the Fund intends to continue to qualify as a Regulated Investment Company ("RIC") under Subchapter M of the Internal Revenue Code (“IRC”) by distributing substantially all of its taxable net investment income and net realized capital gains to its shareholders and otherwise complying with the requirements of the IRC. The Fund has distributed substantially all of its income and capital gains in prior years, if applicable, and intends to distribute substantially all of its income and capital gains during the calendar year ending December 31, 2014. Accordingly, no provision for federal income or excise taxes has been made in the accompanying financial statements. Distributions from short-term capital gains are treated as ordinary income distributions for federal income tax purposes.
Net Investment Income (Loss), Net Realized Gains (Losses) and Distributions – Net investment income (loss) and net realized gains (losses) may differ for financial statement and tax purposes primarily because of losses deferred due to wash sale adjustments, foreign currency gains and losses, adjustments related to Passive Foreign Investment Companies ("PFICs"), Real Estate Investment Trusts ("REITs"), RICs, certain derivatives and partnerships. The character of distributions made during the year from net investment income or net realized gains may differ from their ultimate characterization for federal income tax purposes. Also, due to the timing of dividend distributions, the fiscal year in which amounts are distributed may differ from the year that the income or realized gains (losses) were recorded by the Fund.
Distributions and Components of Distributable Earnings – The tax character of distributions paid by the Fund for the periods indicated is as follows (as adjusted for dividends payable, if applicable):
| For the Year Ended October 31, 2014 | For the Year Ended October 31, 2013 | |||||||
| Ordinary Income | $ | 35,206 | $ | 82,639 | ||||
| Long-Term Capital Gains ‡ | 489,231 | — | ||||||
‡ The Fund designates these distributions as long-term capital gain dividends pursuant to IRC Sec. 852(b)(3)(C).
As of October 31, 2014, the Fund’s components of distributable earnings (deficit) on a tax basis are as follows:
| Amount | ||||
| Undistributed Ordinary Income | $ | 815,315 | ||
| Undistributed Long-Term Capital Gain | 2,237,415 | |||
| Unrealized Appreciation* | 846,272 | |||
| Total Accumulated Earnings | $ | 3,899,002 | ||
| * | Differences between book-basis and tax-basis unrealized appreciation (depreciation) may be attributable to the losses deferred due to wash sale adjustments, foreign currency gains and losses, adjustments related to PFICs, REITs, RICs, certain derivatives and partnerships. |
Reclassification of Capital Accounts – The Fund may record reclassifications in its capital accounts. These reclassifications have no impact on the total net assets of the Fund. The reclassifications are a result of permanent differences between U.S. GAAP and tax accounting for such items as foreign currency, PFICs, expiration or utilization of capital loss carryforwards or net operating losses.
| 24 |
The Hartford Capital Appreciation Fund
Notes to Financial Statements – (continued)
October 31, 2014
| (000’s Omitted) |
Adjustments are made to reflect the impact these items have on current and future distributions to shareholders. Therefore, the source of the Fund’s distributions may be shown in the accompanying Statement of Changes in Net Assets as from undistributed net investment income, from accumulated net realized gains on investments or from capital depending on the type of book and tax differences that exist. For the year ended October 31, 2014, the Fund recorded reclassifications to increase (decrease) the accounts listed below:
| Amount | ||||
| Undistributed Net Investment Income (Loss) | $ | (6,233 | ) | |
| Accumulated Net Realized Gain (Loss) | 6,233 | |||
Capital Loss Carryforward – On December 22, 2010, the Regulated Investment Company Modernization Act of 2010 (the “Act”) was enacted, which made changes to the capital loss carryforward rules. The changes are effective for taxable years beginning after the date of enactment. Under the Act, funds are permitted to carry forward capital losses for an unlimited period. Additionally, capital loss carryforwards retain their character as either short-term or long-term capital losses rather than being considered all short-term as permitted under prior regulation.
The Fund had no capital loss carryforward for U.S. federal income tax purposes as of October 31, 2014.
Accounting for Uncertainty in Income Taxes – The Fund has adopted financial reporting rules that require the Fund to analyze all open tax years, as defined by the statute of limitations, for all major jurisdictions. Generally, tax authorities can examine all tax returns filed for the last three years. The Fund does not have an examination in progress.
The Fund has reviewed all open tax years and major jurisdictions and concluded that these financial reporting rules had no effect on the Fund’s financial position or results of operations. There is no tax liability resulting from unrecognized tax benefits relating to uncertain income tax positions taken or expected to be taken on the tax return for the fiscal year ended October 31, 2014. The Fund is also not aware of any tax positions for which it is reasonably possible that the total amounts of unrecognized tax benefits will significantly change in the next twelve months.
Expenses:
Investment Management Agreement – Hartford Funds Management Company, LLC ("HFMC") serves as the Fund’s investment manager pursuant to an Investment Management Agreement with the Company. HFMC is an indirect wholly owned subsidiary of The Hartford Financial Services Group, Inc. ("The Hartford"). The investment manager has overall investment supervisory responsibility for the Fund. In addition, the investment manager provides administrative personnel, services, equipment, facilities and office space for proper operation of the Fund. HFMC has contracted with Wellington Management Company, LLP ("Wellington Management") under a sub-advisory agreement for the provision of day-to-day investment management services to the Fund in accordance with the Fund’s investment objective and policies. The Fund pays a fee to the investment manager, a portion of which may be used to compensate Wellington Management.
The schedule below reflects the rates of compensation paid to the investment manager for investment management services rendered as of October 31, 2014; the rates are accrued daily and paid monthly:
| Average Daily Net Assets | Annual Fee | |||
| On first $500 million | 0.8000% | |||
| On next $500 million | 0.7000% | |||
| On next $4 billion | 0.6500% | |||
| On next $5 billion | 0.6475% | |||
| Over $10 billion | 0.6450% | |||
| 25 |
The Hartford Capital Appreciation Fund
Notes to Financial Statements – (continued)
October 31, 2014
| (000’s Omitted) |
Accounting Services Agreement – Pursuant to the Fund Accounting Agreement between HFMC and the Company, on behalf of the Fund, HFMC provides accounting services to the Fund and receives monthly compensation based on the Fund’s average daily net assets at the rates set forth below. The Fund’s accounting services fees are accrued daily and paid monthly.
| Average Daily Net Assets | Annual Fee | |||
| On first $5 billion | 0.018% | |||
| On next $5 billion | 0.014% | |||
| Over $10 billion | 0.010% | |||
Operating Expenses – Allocable expenses incurred by the Company are allocated to each Fund and allocated to classes within the Fund in proportion to the average daily net assets of the Fund and each class, except where allocation of certain expenses is more fairly made directly to the Fund or to specific classes within a Fund. As of October 31, 2014, HFMC contractually limited the total operating expenses of this Fund, exclusive of taxes, interest expense, brokerage commissions, acquired fund fees and expenses and extraordinary expenses, through February 28, 2015 as follows:
| Class A | Class B | Class C | Class I | Class R3 | Class R4 | Class R5 | Class Y | |||||||
| 1.29% | NA | NA | 1.04% | 1.40% | 1.10% | 0.80% | NA |
Fees Paid Indirectly – The Fund has entered into agreements with State Street Global Markets, LLC and Russell Implementation Services, Inc. to partially recapture non-discounted trade commissions. Such rebates are used to pay a portion of the Fund’s expenses. In addition, the Fund's custodian bank has agreed to reduce its fees when the Fund maintains cash on deposit in a non-interest-bearing custody account. For the year ended October 31, 2014, these amounts, if any, are included in the Statement of Operations.
The ratio of expenses to average net assets in the accompanying financial highlights excludes the reduction in expenses related to fees paid indirectly. The annualized expense ratio after waivers for the period listed below reflecting the reduction for fees paid indirectly is as follows:
| Year Ended October 31, 2014 | ||||
| Class A | 1.09 | % | ||
| Class B | 1.94 | |||
| Class C | 1.81 | |||
| Class I | 0.76 | |||
| Class R3 | 1.40 | |||
| Class R4 | 1.09 | |||
| Class R5 | 0.79 | |||
| Class Y | 0.69 | |||
Distribution and Service Plan for Class A, B, C, R3 and R4 Shares – Hartford Funds Distributors, LLC ("HFD"), an indirect wholly owned subsidiary of The Hartford, is the principal underwriter and distributor of the Fund. HFD is engaged in distribution activities, which include marketing and distribution of shares through broker/dealers, financing distribution costs and maintaining financial books and records. For the year ended October 31, 2014, HFD received front-end load sales charges of $7,441 and contingent deferred sales charges of $150 from the Fund.
The Fund has adopted a Distribution and Service Plan in accordance with Rule 12b-1 of the 1940 Act to compensate the distributor (HFD) for activities intended to result in the sale and distribution of Class A, B, C, R3 and R4 shares and for providing services for shareholders. The Rule 12b-1 plan applicable to Class A shares of the Fund provides for payment of a Rule 12b-1 fee of 0.25% of average daily net assets. Some or all of the fee may be used for shareholder servicing expenses with the remainder used for distribution expenses. Under the Class B Plan, the Fund pays the distributor 1.00% of the average daily net assets of Class B shares that are outstanding for 8 years or less, 0.25% of which is a fee for services provided to existing shareholders with the remainder used
| 26 |
The Hartford Capital Appreciation Fund
Notes to Financial Statements – (continued)
October 31, 2014
| (000’s Omitted) |
for distribution expenses. Some or the entire Rule 12b-1 fee for Class B shares may be remitted to broker/dealers for distribution and/or shareholder account services. After eight years, Class B shares convert to Class A shares. Upon conversion to Class A shares, the Class A plan described above will apply to those shares. Under the Class C Plan, the Fund pays the distributor 1.00% of the average daily net assets of Class C shares outstanding, 0.25% of which is intended as a fee for services provided to existing shareholders with the remainder used for distribution expenses. For Class C shares, some or the entire fee may be remitted to broker/dealers for distribution and/or shareholder account services. Class R3 shares have a distribution fee of 0.50% of average daily net assets and Class R4 shares have a distribution fee of 0.25% of average daily net assets. For Class R3 and R4 shares, some or the entire fee may be remitted to broker/dealers for distribution and/or shareholder account services. The Fund’s 12b-1 fees are accrued daily and paid monthly or at such other intervals as the Board of Directors may determine.
Other Related Party Transactions – Certain officers of the Fund are directors and/or officers of HFMC and/or The Hartford or its subsidiaries. For the year ended October 31, 2014, a portion of the Fund’s Chief Compliance Officer’s compensation was paid by all of the investment companies in the Hartford fund complex. The portion allocated to the Fund, as represented in other expenses on the Statement of Operations, was in the amount of $21. Hartford Administrative Services Company (“HASCO”), an indirect wholly-owned subsidiary of The Hartford, provides transfer agent services to the Fund. HASCO has contractually agreed to reimburse any portion of the transfer agency fees over 0.30% of average daily net assets per fiscal year for each class. Any transfer agency fee reimbursement is determined before considering the contractual operating expense limitation. For providing such services, HASCO is compensated on a per account basis that varies by account type, except with respect to Class Y, for which it is compensated based on average daily net assets. The amount paid to HASCO and any related contractual reimbursement amounts, if applicable, can be found in the Statement of Operations. These fees are accrued daily and paid monthly.
Administrative services fees are paid to HASCO for third-party recordkeeping services that are payable as a percentage of net assets in the amount of up to 0.20%, 0.15% and 0.10% for Classes R3, R4 and R5 shares, respectively. The total administrative services fees are shown on the Statement of Operations. These fees are accrued daily and paid monthly.
Affiliate Holdings:
As of October 31, 2014, the Fund's shares were owned in aggregate by affiliated fund of funds. Therefore, the Fund may experience relatively large purchases or redemptions of its shares from these affiliated fund of funds. Affiliated fund of funds owned shares in the Fund as follows:
| Percentage of Fund | ||||
| Class Y | 5 | % | ||
Investment Transactions:
For the year ended October 31, 2014, the cost of purchases and proceeds from sales of investment securities (excluding short-term investments) were as follows:
| Excluding U.S. Government Obligations | U.S. Government Obligations | Total | ||||||||||
| Cost of Purchases | $ | 13,163,823 | $ | — | $ | 13,163,823 | ||||||
| Sales Proceeds | 14,410,185 | — | 14,410,185 | |||||||||
| 27 |
The Hartford Capital Appreciation Fund
Notes to Financial Statements – (continued)
October 31, 2014
| (000’s Omitted) |
Capital Share Transactions:
The following information is for the year ended October 31, 2014, and the year ended October 31, 2013:
| For the Year Ended October 31, 2014 | For the Year Ended October 31, 2013 | |||||||||||||||||||||||||||||||
| Shares Sold | Shares
Issued for Reinvested Dividends | Shares Redeemed | Net
Increase (Decrease) of Shares | Shares Sold | Shares
Issued for Reinvested Dividends | Shares Redeemed | Net
Increase (Decrease) of Shares | |||||||||||||||||||||||||
| Class A | ||||||||||||||||||||||||||||||||
| Shares | 9,102 | 5,419 | (23,671 | ) | (9,150 | ) | 9,099 | 931 | (32,605 | ) | (22,575 | ) | ||||||||||||||||||||
| Amount | $ | 429,894 | $ | 244,200 | $ | (1,128,910 | ) | $ | (454,816 | ) | $ | 356,694 | $ | 32,223 | $ | (1,239,233 | ) | $ | (850,316 | ) | ||||||||||||
| Class B | ||||||||||||||||||||||||||||||||
| Shares | 68 | 412 | (3,645 | ) | (3,165 | ) | 65 | — | (4,257 | ) | (4,192 | ) | ||||||||||||||||||||
| Amount | $ | 2,715 | $ | 16,080 | $ | (149,901 | ) | $ | (131,106 | ) | $ | 2,242 | $ | — | $ | (144,007 | ) | $ | (141,765 | ) | ||||||||||||
| Class C | ||||||||||||||||||||||||||||||||
| Shares | 2,904 | 1,984 | (6,659 | ) | (1,771 | ) | 2,492 | 21 | (11,580 | ) | (9,067 | ) | ||||||||||||||||||||
| Amount | $ | 119,458 | $ | 78,118 | $ | (276,323 | ) | $ | (78,747 | ) | $ | 87,798 | $ | 656 | $ | (388,098 | ) | $ | (299,644 | ) | ||||||||||||
| Class I | ||||||||||||||||||||||||||||||||
| Shares | 10,755 | 943 | (11,343 | ) | 355 | 14,659 | 656 | (63,844 | ) | (48,529 | ) | |||||||||||||||||||||
| Amount | $ | 517,316 | $ | 42,645 | $ | (538,920 | ) | $ | 21,041 | $ | 562,871 | $ | 22,696 | $ | (2,492,591 | ) | $ | (1,907,024 | ) | |||||||||||||
| Class R3 | ||||||||||||||||||||||||||||||||
| Shares | 330 | 106 | (590 | ) | (154 | ) | 470 | 11 | (1,264 | ) | (783 | ) | ||||||||||||||||||||
| Amount | $ | 16,497 | $ | 5,009 | $ | (29,498 | ) | $ | (7,992 | ) | $ | 19,399 | $ | 412 | $ | (50,392 | ) | $ | (30,581 | ) | ||||||||||||
| Class R4 | ||||||||||||||||||||||||||||||||
| Shares | 845 | 144 | (1,142 | ) | (153 | ) | 1,069 | 26 | (2,167 | ) | (1,072 | ) | ||||||||||||||||||||
| Amount | $ | 43,086 | $ | 6,981 | $ | (57,952 | ) | $ | (7,885 | ) | $ | 44,695 | $ | 957 | $ | (87,054 | ) | $ | (41,402 | ) | ||||||||||||
| Class R5 | ||||||||||||||||||||||||||||||||
| Shares | 127 | 107 | (2,001 | ) | (1,767 | ) | 652 | 48 | (3,078 | ) | (2,378 | ) | ||||||||||||||||||||
| Amount | $ | 6,506 | $ | 5,261 | $ | (98,822 | ) | $ | (87,055 | ) | $ | 27,000 | $ | 1,803 | $ | (125,090 | ) | $ | (96,287 | ) | ||||||||||||
| Class Y | ||||||||||||||||||||||||||||||||
| Shares | 4,352 | 1,160 | (8,712 | ) | (3,200 | ) | 2,289 | 365 | (12,394 | ) | (9,740 | ) | ||||||||||||||||||||
| Amount | $ | 222,764 | $ | 57,313 | $ | (454,824 | ) | $ | (174,747 | ) | $ | 95,232 | $ | 13,688 | $ | (516,274 | ) | $ | (407,354 | ) | ||||||||||||
| Total | ||||||||||||||||||||||||||||||||
| Shares | 28,483 | 10,275 | (57,763 | ) | (19,005 | ) | 30,795 | 2,058 | (131,189 | ) | (98,336 | ) | ||||||||||||||||||||
| Amount | $ | 1,358,236 | $ | 455,607 | $ | (2,735,150 | ) | $ | (921,307 | ) | $ | 1,195,931 | $ | 72,435 | $ | (5,042,739 | ) | $ | (3,774,373 | ) | ||||||||||||
The following reflects the conversion of Class B shares into Class A shares (reflected as Class A shares sold) for the year ended October 31, 2014, and the year ended October 31, 2013:
| Shares | Dollars | |||||||
| For the Year Ended October 31, 2014 | 477 | $ | 22,596 | |||||
| For the Year Ended October 31, 2013 | 489 | $ | 18,983 | |||||
Line of Credit:
The Fund is one of several Hartford Funds that participate in a $500 million committed revolving line of credit facility. The facility is to be used for temporary or emergency purposes. Under the arrangement, the funds are required to own securities having a market value in excess of 300% of the total bank borrowings. The interest rate on borrowings varies depending on the nature of the loan. The facility also requires a fee to be paid based on the amount of the commitment. This commitment fee is allocated to all the funds participating in the line of credit based on the average net assets of the funds. During the year ended October 31, 2014, the Fund did not have any borrowings under this facility.
Pending Legal Proceedings:
On February 25, 2011, Jennifer L. Kasilag, Louis Mellinger, Judith M. Menendez, Jacqueline M. Robinson, and Linda A. Russell filed a derivative lawsuit against Hartford Investment Financial Services, LLC (“HIFSCO”) (now known as HFD) on behalf of six Hartford retail mutual funds in the United States District Court for the District of New Jersey, alleging that HIFSCO received excessive advisory and distribution fees in violation of its statutory fiduciary duty under Section 36(b) of the 1940 Act when serving as investment manager and principal underwriter, respectively, to the Hartford retail mutual funds. Although this action was purportedly filed on behalf of certain of the
| 28 |
The Hartford Capital Appreciation Fund
Notes to Financial Statements – (continued)
October 31, 2014
| (000’s Omitted) |
Hartford Funds, none of the Hartford Funds is itself a defendant to the suit. HIFSCO moved to dismiss and, in September 2011, the motion was granted in part and denied in part, with leave to amend the complaint. In November 2011, plaintiffs filed an amended complaint on behalf of certain Hartford retail mutual funds, The Hartford Global Health Fund (now known as The Hartford Healthcare Fund), The Hartford Conservative Allocation Fund, The Hartford Growth Opportunities Fund, The Hartford Inflation Plus Fund, The Hartford Advisers Fund (now known as The Hartford Balanced Fund), and The Hartford Capital Appreciation Fund. Plaintiffs seek to rescind the investment management agreements and distribution plans between HIFSCO and these funds and to recover the total fees charged thereunder or, in the alternative, to recover any improper compensation HIFSCO received, in addition to lost earnings. HIFSCO filed a partial motion to dismiss the amended complaint and, in December 2012, the court dismissed without prejudice the claims regarding distribution fees and denied the motion with respect to the advisory fees claims. HIFSCO disputes the allegations and intends to defend vigorously.
In March 2014, the plaintiffs filed a new complaint that added as new plaintiffs The Hartford Floating Rate Fund and The Hartford Small Company Fund and named as a defendant HFMC, which assumed the role as investment manager to the funds as of January 2013. HFMC and HIFSCO dispute the allegations and intend to defend vigorously.
No accrual for litigation relating to this matter has been recorded in the financial statements of the Fund because the Fund is not party to the suit.
Indemnifications:
Under the Company's organizational documents, the Company shall indemnify its officers and directors to the full extent required or permitted under Maryland General Corporation Law and the federal securities laws. In addition, the Company, on behalf of the Fund, may enter into contracts that contain a variety of indemnifications. The Company's maximum exposure under these arrangements is unknown. However, as of the date of these financial statements, the Company has not had prior claims or losses pursuant to these contracts and expects the risk of loss to be remote.
Subsequent Events:
At the August 5-6, 2014 meeting, the Board of Directors approved the creation of Class R6 shares for the Fund. Class R6 shares launched on November 7, 2014. In connection with the launch of the Class R6 shares, an updated prospectus, dated November 7, 2014, and Statement of Additional Information, dated March 1, 2014, as amended November 7, 2014, for the Fund were filed with the U.S. Securities and Exchange Commission.
Effective December 1, 2014, pursuant to a sub-transfer agency agreement between HASCO and Boston Financial Data Services, Inc. (“BFDS”), HASCO has delegated certain transfer agent, dividend disbursing agent and shareholder servicing agent functions to BFDS. The costs and expenses of such delegation are borne by HASCO, not by the Fund.
| 29 |
The Hartford Capital Appreciation Fund
| Financial Highlights |
| - Selected Per-Share Data - (A) | - Ratios and Supplemental Data - | |||||||||||||||||||||||||||||||||||||||||||||||||||
| Class | Net Asset Value at Beginning of Period | Net Investment Income (Loss) | Net Realized and Unrealized Gain (Loss) on Invest- ments | Total from Investment Operations | Dividends from Net Investment Income | Distribu- tions from Realized Capital Gains | Total Dividends and Distributions | Net Asset Value at End of Period | Total Return(B) | Net Assets at End of Period (000's) | Ratio of Expenses to Average Net Assets Before Adjust- ments(C) | Ratio of Expenses to Average Net Assets After Adjust- ments(C) | Ratio of Net Investment Income (Loss) to Average Net Assets | |||||||||||||||||||||||||||||||||||||||
| For the Year Ended October 31, 2014 | ||||||||||||||||||||||||||||||||||||||||||||||||||||
| A | $ | 45.91 | $ | 0.22 | $ | 5.31 | $ | 5.53 | $ | (0.12 | ) | $ | (1.88 | ) | $ | (2.00 | ) | $ | 49.44 | 12.49 | % | $ | 5,789,682 | 1.10 | % | 1.10 | % | 0.46 | % | |||||||||||||||||||||||
| B | 40.14 | (0.16 | ) | 4.62 | 4.46 | – | (1.88 | ) | (1.88 | ) | 42.72 | 11.55 | 270,227 | 1.95 | 1.95 | (0.39 | ) | |||||||||||||||||||||||||||||||||||
| C | 40.46 | (0.11 | ) | 4.66 | 4.55 | – | (1.88 | ) | (1.88 | ) | 43.13 | 11.69 | 1,992,142 | 1.81 | 1.81 | (0.26 | ) | |||||||||||||||||||||||||||||||||||
| I | 46.01 | 0.37 | 5.34 | 5.71 | (0.24 | ) | (1.88 | ) | (2.12 | ) | 49.60 | 12.87 | 2,194,464 | 0.76 | 0.76 | 0.79 | ||||||||||||||||||||||||||||||||||||
| R3 | 48.42 | 0.08 | 5.62 | 5.70 | – | (1.88 | ) | (1.88 | ) | 52.24 | 12.16 | 136,576 | 1.40 | 1.40 | 0.16 | |||||||||||||||||||||||||||||||||||||
| R4 | 49.24 | 0.23 | 5.72 | 5.95 | (0.12 | ) | (1.88 | ) | (2.00 | ) | 53.19 | 12.50 | 191,319 | 1.10 | 1.10 | 0.46 | ||||||||||||||||||||||||||||||||||||
| R5 | 49.80 | 0.37 | 5.81 | 6.18 | (0.18 | ) | (1.88 | ) | (2.06 | ) | 53.92 | 12.82 | 59,285 | 0.80 | 0.80 | 0.72 | ||||||||||||||||||||||||||||||||||||
| Y | 50.05 | 0.46 | 5.79 | 6.25 | (0.30 | ) | (1.88 | ) | (2.18 | ) | 54.12 | 12.94 | 1,284,539 | 0.70 | 0.70 | 0.88 | ||||||||||||||||||||||||||||||||||||
| For the Year Ended October 31, 2013 | ||||||||||||||||||||||||||||||||||||||||||||||||||||
| A | $ | 32.65 | $ | 0.18 | $ | 13.31 | $ | 13.49 | $ | (0.23 | ) | $ | – | $ | (0.23 | ) | $ | 45.91 | 41.56 | % | $ | 5,796,609 | 1.14 | % | 1.14 | % | 0.46 | % | ||||||||||||||||||||||||
| B | 28.60 | (0.13 | ) | 11.67 | 11.54 | – | – | – | 40.14 | 40.35 | 381,022 | 1.99 | 1.99 | (0.37 | ) | |||||||||||||||||||||||||||||||||||||
| C | 28.80 | (0.09 | ) | 11.76 | 11.67 | (0.01 | ) | – | (0.01 | ) | 40.46 | 40.55 | 1,940,617 | 1.85 | 1.85 | (0.25 | ) | |||||||||||||||||||||||||||||||||||
| I | 32.72 | 0.31 | 13.33 | 13.64 | (0.35 | ) | – | (0.35 | ) | 46.01 | 42.02 | 2,019,281 | 0.84 | 0.84 | 0.82 | |||||||||||||||||||||||||||||||||||||
| R3 | 34.41 | 0.08 | 14.06 | 14.14 | (0.13 | ) | – | (0.13 | ) | 48.42 | 41.20 | 134,084 | 1.41 | 1.40 | 0.21 | |||||||||||||||||||||||||||||||||||||
| R4 | 34.98 | 0.21 | 14.28 | 14.49 | (0.23 | ) | – | (0.23 | ) | 49.24 | 41.63 | 184,618 | 1.10 | 1.10 | 0.51 | |||||||||||||||||||||||||||||||||||||
| R5 | 35.40 | 0.35 | 14.41 | 14.76 | (0.36 | ) | – | (0.36 | ) | 49.80 | 42.04 | 142,768 | 0.80 | 0.80 | 0.84 | |||||||||||||||||||||||||||||||||||||
| Y | 35.58 | 0.39 | 14.48 | 14.87 | (0.40 | ) | – | (0.40 | ) | 50.05 | 42.17 | 1,348,160 | 0.70 | 0.70 | 0.91 | |||||||||||||||||||||||||||||||||||||
| For the Year Ended October 31, 2012 (D) | ||||||||||||||||||||||||||||||||||||||||||||||||||||
| A | $ | 30.55 | $ | 0.25 | $ | 2.38 | $ | 2.63 | $ | (0.53 | ) | $ | – | $ | (0.53 | ) | $ | 32.65 | 8.84 | % | $ | 4,859,760 | 1.16 | % | 1.16 | % | 0.63 | % | ||||||||||||||||||||||||
| B | 26.76 | (0.31 | ) | 2.40 | 2.09 | (0.25 | ) | – | (0.25 | ) | 28.60 | 7.93 | 391,388 | 2.01 | 2.00 | (0.23 | ) | |||||||||||||||||||||||||||||||||||
| C | 26.94 | (0.16 | ) | 2.31 | 2.15 | (0.29 | ) | – | (0.29 | ) | 28.80 | 8.11 | 1,642,578 | 1.87 | 1.87 | (0.09 | ) | |||||||||||||||||||||||||||||||||||
| I | 30.61 | 0.36 | 2.37 | 2.73 | (0.62 | ) | – | (0.62 | ) | 32.72 | 9.19 | 3,024,465 | 0.86 | 0.86 | 0.93 | |||||||||||||||||||||||||||||||||||||
| R3 | 32.17 | 0.10 | 2.61 | 2.71 | (0.47 | ) | – | (0.47 | ) | 34.41 | 8.59 | 122,235 | 1.41 | 1.40 | 0.39 | |||||||||||||||||||||||||||||||||||||
| R4 | 32.68 | 0.28 | 2.57 | 2.85 | (0.55 | ) | – | (0.55 | ) | 34.98 | 8.92 | 168,689 | 1.11 | 1.10 | 0.68 | |||||||||||||||||||||||||||||||||||||
| R5 | 33.09 | 0.40 | 2.58 | 2.98 | (0.67 | ) | – | (0.67 | ) | 35.40 | 9.25 | 185,705 | 0.80 | 0.80 | 1.00 | |||||||||||||||||||||||||||||||||||||
| Y | 33.26 | 0.55 | 2.47 | 3.02 | (0.70 | ) | – | (0.70 | ) | 35.58 | 9.36 | 1,304,963 | 0.70 | 0.70 | 1.09 | |||||||||||||||||||||||||||||||||||||
| For the Year Ended October 31, 2011 | ||||||||||||||||||||||||||||||||||||||||||||||||||||
| A | $ | 32.40 | $ | 0.19 | $ | (2.04 | ) | $ | (1.85 | ) | $ | – | $ | – | $ | – | $ | 30.55 | (5.71 | )% | $ | 5,859,434 | 1.12 | % | 1.12 | % | 0.55 | % | ||||||||||||||||||||||||
| B | 28.62 | (0.08 | ) | (1.78 | ) | (1.86 | ) | – | – | – | 26.76 | (6.50 | ) | 559,856 | 1.95 | 1.95 | (0.28 | ) | ||||||||||||||||||||||||||||||||||
| C | 28.79 | (0.05 | ) | (1.80 | ) | (1.85 | ) | – | – | – | 26.94 | (6.43 | ) | 2,096,461 | 1.84 | 1.84 | (0.16 | ) | ||||||||||||||||||||||||||||||||||
| I | 32.39 | 0.27 | (2.05 | ) | (1.78 | ) | – | – | – | 30.61 | (5.50 | ) | 3,254,198 | 0.87 | 0.87 | 0.81 | ||||||||||||||||||||||||||||||||||||
| R3 | 34.22 | 0.10 | (2.15 | ) | (2.05 | ) | – | – | – | 32.17 | (5.99 | ) | 137,767 | 1.41 | 1.40 | 0.30 | ||||||||||||||||||||||||||||||||||||
| R4 | 34.66 | 0.21 | (2.19 | ) | (1.98 | ) | – | – | – | 32.68 | (5.71 | ) | 224,653 | 1.10 | 1.10 | 0.59 | ||||||||||||||||||||||||||||||||||||
| R5 | 34.99 | 0.32 | (2.22 | ) | (1.90 | ) | – | – | – | 33.09 | (5.43 | ) | 204,417 | 0.80 | 0.80 | 0.89 | ||||||||||||||||||||||||||||||||||||
| Y | 35.13 | 0.36 | (2.23 | ) | (1.87 | ) | – | – | – | 33.26 | (5.32 | ) | 1,460,367 | 0.70 | 0.70 | 0.98 | ||||||||||||||||||||||||||||||||||||
See Portfolio Turnover information on the next page.
| 30 |
The Hartford Capital Appreciation Fund
| Financial Highlights – (continued) |
| - Selected Per-Share Data - (A) | - Ratios and Supplemental Data - | |||||||||||||||||||||||||||||||||||||||||||||||||||
| Class | Net Asset Value at Beginning of Period | Net Investment Income (Loss) | Net Realized and Unrealized Gain (Loss) on Invest- ments | Total from Investment Operations | Dividends from Net Investment Income | Distribu- tions from Realized Capital Gains | Total Dividends and Distributions | Net Asset Value at End of Period | Total Return(B) | Net Assets at End of Period (000's) | Ratio of Expenses to Average Net Assets Before Adjust- ments(C) | Ratio of Expenses to Average Net Assets After Adjust- ments(C) | Ratio of Net Investment Income (Loss) to Average Net Assets | |||||||||||||||||||||||||||||||||||||||
| For the Year Ended October 31, 2010 | ||||||||||||||||||||||||||||||||||||||||||||||||||||
| A | $ | 28.02 | $ | 0.14 | $ | 4.24 | $ | 4.38 | $ | – | $ | – | $ | – | $ | 32.40 | 15.63 | % | $ | 8,535,338 | 1.15 | % | 1.15 | % | 0.45 | % | ||||||||||||||||||||||||||
| B | 24.95 | (0.10 | ) | 3.77 | 3.67 | – | – | – | 28.62 | 14.71 | 828,754 | 1.95 | 1.95 | (0.36 | ) | |||||||||||||||||||||||||||||||||||||
| C | 25.07 | (0.07 | ) | 3.79 | 3.72 | – | – | – | 28.79 | 14.84 | 3,001,079 | 1.85 | 1.85 | (0.25 | ) | |||||||||||||||||||||||||||||||||||||
| I | 27.94 | 0.21 | 4.24 | 4.45 | – | – | – | 32.39 | 15.93 | 4,781,187 | 0.88 | 0.88 | 0.70 | |||||||||||||||||||||||||||||||||||||||
| R3 | 29.67 | 0.05 | 4.50 | 4.55 | – | – | – | 34.22 | 15.34 | 126,972 | 1.42 | 1.41 | 0.17 | |||||||||||||||||||||||||||||||||||||||
| R4 | 29.96 | 0.16 | 4.54 | 4.70 | – | – | – | 34.66 | 15.69 | 270,804 | 1.10 | 1.10 | 0.49 | |||||||||||||||||||||||||||||||||||||||
| R5 | 30.15 | 0.26 | 4.58 | 4.84 | – | – | – | 34.99 | 16.05 | 215,999 | 0.80 | 0.80 | 0.79 | |||||||||||||||||||||||||||||||||||||||
| Y | 30.24 | 0.29 | 4.60 | 4.89 | – | – | – | 35.13 | 16.17 | 2,196,541 | 0.70 | 0.70 | 0.89 | |||||||||||||||||||||||||||||||||||||||
| (A) | Information presented relates to a share outstanding throughout the indicated period. Net investment income (loss) per share amounts are calculated based on average shares outstanding unless otherwise noted. |
| (B) | Assumes initial investment at net asset value at the beginning of each period, reinvestment of all distributions, the complete redemption of the investment at net asset value at the end of each period and no sales charge. Total return would be reduced if sales charges were taken into account. |
| (C) | Adjustments include waivers and reimbursements, if applicable. Ratios do not include fees paid indirectly (see Expenses in the accompanying Notes to Financial Statements). |
| (D) | Net investment income (loss) per share amounts have been calculated using the SEC method. |
| Portfolio Turnover Rate for All Share Classes | ||||
| For the Year Ended October 31, 2014 | 111 | % | ||
| For the Year Ended October 31, 2013 | 91 | |||
| For the Year Ended October 31, 2012 | 74 | |||
| For the Year Ended October 31, 2011 | 75 | |||
| For the Year Ended October 31, 2010 | 70 | |||
| 31 |
Report of Independent Registered Public Accounting Firm
The Board of Directors and Shareholders of
| The Hartford Mutual Funds, Inc. |
We have audited the accompanying statement of assets and liabilities, including the schedule of investments, of The Hartford Capital Appreciation Fund (one of the portfolios constituting The Hartford Mutual Funds, Inc. (the Funds)) as of October 31, 2014, and the related statement of operations for the year then ended, the statements of changes in net assets for each of the two years in the period then ended, and the financial highlights for each of the five years in the period then ended. These financial statements and financial highlights are the responsibility of the Funds’ management. Our responsibility is to express an opinion on these financial statements and financial highlights based on our audits.
We conducted our audits in accordance with the standards of the Public Company Accounting Oversight Board (United States). Those standards require that we plan and perform the audit to obtain reasonable assurance about whether the financial statements and financial highlights are free of material misstatement. We were not engaged to perform an audit of the Funds’ internal control over financial reporting. Our audits included consideration of internal control over financial reporting as a basis for designing audit procedures that are appropriate in the circumstances, but not for the purpose of expressing an opinion on the effectiveness of the Funds’ internal control over financial reporting. Accordingly, we express no such opinion. An audit also includes examining, on a test basis, evidence supporting the amounts and disclosures in the financial statements and financial highlights, assessing the accounting principles used and significant estimates made by management, and evaluating the overall financial statement presentation. Our procedures included confirmation of securities owned as of October 31, 2014, by correspondence with the custodian and brokers or by other appropriate auditing procedures where replies from brokers were not received. We believe that our audits provide a reasonable basis for our opinion.
In our opinion, the financial statements and financial highlights referred to above present fairly, in all material respects, the financial position of The Hartford Capital Appreciation Fund of The Hartford Mutual Funds, Inc. at October 31, 2014, the results of its operations for the year then ended, the changes in its net assets for each of the two years in the period then ended, and the financial highlights for each of the five years in the period then ended, in conformity with U.S. generally accepted accounting principles.
Minneapolis, Minnesota
December 18, 2014
| 32 |
The Hartford Capital Appreciation Fund
| Directors and Officers (Unaudited) |
The Board of Directors of the Company (the "Directors") appoints officers who are responsible for the day-to-day operations of the Fund and who execute policies formulated by the Directors. Each Director serves until his or her death, resignation, or retirement or until the next annual meeting of shareholders is held or until his or her successor is elected and qualifies.
Directors and officers who are employed by or who have a financial interest in The Hartford Financial Services Group, Inc. ("The Hartford") are considered “interested” persons of the Fund pursuant to the 1940 Act. Each officer and two of the Company's Directors, as noted in the chart below, are “interested” persons of the Fund. Each Director serves as a director for The Hartford Mutual Funds, Inc., The Hartford Mutual Funds II, Inc., Hartford Series Fund, Inc., and Hartford HLS Series Fund II, Inc., and as a trustee for The Hartford Alternative Strategies Fund, which, as of October 31, 2014, collectively consist of 66 funds. Correspondence may be sent to Directors and officers c/o Hartford Funds, 5 Radnor Corporate Center, Suite 300, 100 Matsonford Road, Radnor, Pennsylvania 19087, except that correspondence to Mr. Annoni, Mr. Dressen and Ms. Quade may be sent to 500 Bielenberg Drive, Suite 500, Woodbury, Minnesota 55125.
The table below sets forth, for each Director and officer, his or her name, year of birth, current position with the Company and date first elected or appointed to The Hartford Mutual Funds, Inc. ("MF") and The Hartford Mutual Funds II, Inc. ("MF2"), principal occupation, and, for Directors, other directorships held. The Fund’s Statement of Additional Information contains further information on the Directors and is available free of charge by calling 1-888-843-7824 or writing to: Hartford Funds, P.O. Box 55022, Boston, MA 02205-5022.
Information on the aggregate remuneration paid to the directors of the Company can be found in the Statement of Operations herein. The Fund pays to The Hartford a portion of the Chief Compliance Officer’s compensation, but does not pay salaries or compensation to any of its other officers or Directors who are employed by The Hartford.
Non-Interested Directors
Hilary E. Ackermann (1956) Director since September 23, 2014
Ms. Ackermann served as Chief Risk Officer at Goldman Sachs Bank USA from October 2008 to November 2011 and serves as a Director of Dynegy, Inc., an independent power company, from October 2012 to present.
Lynn S. Birdsong (1946) Director since 2003, Chairman of the Investment Committee since 2014
Mr. Birdsong is a private investor. Mr. Birdsong currently serves as a Director of the Sovereign High Yield Investment Company (April 2010 to current). Mr. Birdsong currently serves as an Independent Director of Nomura Partners Funds, Inc. (formerly, The Japan Fund) (April 2003 to current). From 2003 to March 2005, Mr. Birdsong was an Independent Director of the Atlantic Whitehall Funds. From 1979 to 2002, Mr. Birdsong was a Managing Director of Zurich Scudder Investments, an investment management firm. During his employment with Scudder, Mr. Birdsong was an Interested Director of The Japan Fund. From January 1981 through December 2013, Mr. Birdsong was a partner in Birdsong Company, an advertising specialty firm.
Robert M. Gavin, Jr. (1940) Director since 2002 (MF) and 1986 (MF2), Chairman of the Board for each since 2004
Dr. Gavin is an educational consultant. Prior to September 1, 2001, he was President of Cranbrook Education Community and prior to July 1996, he was President of Macalester College, St. Paul, Minnesota.
Duane E. Hill (1945) Director since 2001 (MF) and 2002 (MF2), Chairman of the Nominating Committee since 2003
Mr. Hill is a Partner of TSG Ventures L.P., a private equity investment company. Mr. Hill is a former partner of TSG Capital Group, a private equity investment firm that served as sponsor and lead investor in leveraged buyouts of middle market companies.
Sandra S. Jaffee (1941) Director since 2005
Ms. Jaffee is the founder and Chief Executive Officer of a private company, Homeworks Concierge, LLC, which provides residential property management services in Westchester County, New York (January 2012 to present). Ms. Jaffee served as Chairman (2008 to 2009) and Chief Executive Officer of Fortent (formerly Searchspace Group), a leading provider of compliance/regulatory technology to financial institutions from August 2005 to August 2009. From August 2004 to August 2005, Ms. Jaffee served as an Entrepreneur in Residence with Warburg Pincus, a private equity firm. Prior to joining Warburg Pincus, Ms. Jaffee served as Executive Vice President at Citigroup, from September 1995 to July 2004, where she was President and Chief Executive Officer of Citibank’s Global Securities Services (1995 to 2003). Ms. Jaffee currently serves as a member of the Board of Directors of Broadridge Financial Solutions as well as a Trustee of Muhlenberg College.
| 33 |
The Hartford Capital Appreciation Fund
| Directors and Officers (Unaudited) – (continued) |
William P. Johnston (1944) Director since 2005, Chairman of the Compliance Committee since 2005
In June 2006, Mr. Johnston was appointed as Senior Advisor to The Carlyle Group, a global private equity and other alternative asset investment firm and currently serves as an Operating Executive. In July 2006, Mr. Johnston was elected to the Board of Directors of MultiPlan, Inc. and served as a Director (July 2006 to August 2010). In August 2007, Mr. Johnston was elected to the Board of Directors of LifeCare Holdings, Inc. and served as a Director (August 2007 to June 2013). In February 2008, Mr. Johnston was elected to the Board of Directors of HCR-ManorCare, Inc. In May 2006, Mr. Johnston was elected to the Supervisory Board of Fresenius Medical Care AG & Co. KGaA, after its acquisition of Renal Care Group, Inc. in March 2006. Mr. Johnston joined Renal Care Group in November 2002 as a member of the Board of Directors and served as Chairman of the Board from March 2003 through March 2006. From 2002 through 2013, Mr. Johnston served as a Board member of the Georgia O’Keefe Museum. From September 1987 to December 2002, Mr. Johnston was with Equitable Securities Corporation (and its successors, SunTrust Equitable Securities and SunTrust Robinson Humphrey) serving in various investment banking and managerial positions, including Managing Director and Head of Investment Banking, Chief Executive Officer and Vice Chairman.
Phillip O. Peterson (1944) Director since 2002 (MF) and 2000 (MF2), Chairman of the Audit Committee since 2002
Mr. Peterson is a mutual fund industry consultant. He was a partner of KPMG LLP (an accounting firm) until July 1999. Mr. Peterson joined William Blair Funds in February 2007 as a member of the Board of Trustees. From February 2012 to February 2014, Mr. Peterson served as a Trustee of Symetra Variable Mutual Funds. From January 2004 to April 2005, Mr. Peterson served as Independent President of the Strong Mutual Funds.
Lemma W. Senbet (1946) Director since 2005
Dr. Senbet is the William E. Mayer Chair Professor of Finance and Founding Director, Center for Financial Policy, at the University of Maryland, Robert H. Smith School of Business. He was chair of the Finance Department of the University of Maryland, Robert H. Smith School of Business from 1998 to 2006. Since June 2013, he has been on leave from the University to serve as Executive Director of African Economic Research Consortium which focuses on economic policy research and training. Previously, he was a chaired professor of finance at the University of Wisconsin-Madison. Also, he was a Director of the Fortis Funds from March 2000 to July 2002. Dr. Senbet served as Director of the American Finance Association and President of the Western Finance Association. In 2006, Dr. Senbet was inducted Fellow of Financial Management Association International for his career-long distinguished scholarship and professional service.
Interested Directors and Officers
James E. Davey (1964) Director since 2012, President and Chief Executive Officer since 2010
Mr. Davey serves as Executive Vice President of Hartford Life Insurance Company (“HLIC”) and The Hartford. Additionally, Mr. Davey serves as Chairman of the Board, Manager and Senior Managing Director of Hartford Funds Distributors, LLC (“HFD”). He also currently serves as Director, Chairman of the Board, President and Senior Managing Director of Hartford Administrative Services Company (“HASCO”). Mr. Davey also serves as Manager, Chairman of the Board and Senior Managing Director for Hartford Funds Management Company, LLC (“HFMC”) and Director, Chairman of the Board and Senior Managing Director for Hartford Funds Management Group, Inc. ("HFMG"). Mr. Davey has served in various positions within The Hartford and its subsidiaries in connection with the operation of the Hartford Funds. Mr. Davey joined The Hartford in 2002.
Lowndes A. Smith* (1939) Director since 1996 (MF) and 2002 (MF2)
Mr. Smith served as Vice Chairman of The Hartford from February 1997 to January 2002, as President and Chief Executive Officer of Hartford Life, Inc. from February 1997 to January 2002, and as President and Chief Operating Officer of The Hartford Life Insurance Companies from January 1989 to January 2002. Mr. Smith serves as a Director of White Mountains Insurance Group Ltd. (October 2003 to current); One Beacon Insurance (October 2006 to current); Symetra Financial (August 2007 to current) and is a Managing Director of Whittington Gray Associates (January 2007 to current).
* Mr. Smith resigned as a Director of MF, MF2, Hartford Series Fund, Inc. and Hartford HLS Series Fund II, Inc. and as a Trustee of The Hartford Alternative Strategies Fund effective September 17, 2014.
Other Officers
Mark A. Annoni (1964) Vice President, Controller and Treasurer since 2012
Mr. Annoni currently serves as the Assistant Vice President of HLIC (February 2004 to present) and Senior Vice President of HFMG (December 2013 to present). Mr. Annoni has served in various positions within The Hartford and its subsidiaries in connection with the operation of the Hartford Funds. Mr. Annoni joined The Hartford in 2001.
| 34 |
The Hartford Capital Appreciation Fund
| Directors and Officers (Unaudited) – (continued) |
Michael R. Dressen (1963) AML Compliance Officer since 2011
Mr. Dressen currently serves as Assistant Vice President of HLIC. He also serves as Chief Compliance Officer and AML Compliance Officer of HASCO and as AML Officer of HFD. Mr. Dressen has served in various positions within The Hartford and its subsidiaries in connection with the operation of the Hartford Funds.
Edward P. Macdonald (1967) Vice President, Secretary and Chief Legal Officer since 2005
Mr. Macdonald currently serves as Assistant Secretary, Executive Vice President and Deputy General Counsel of HFD, HASCO, HFMC and HFMG. He also serves as Vice President of HLIC. Mr. Macdonald has served in various positions within The Hartford and its subsidiaries in connection with the operation of the Hartford Funds. Mr. Macdonald joined The Hartford in 2005.
Joseph G. Melcher (1973) Vice President and Chief Compliance Officer since 2013
Mr. Melcher currently serves as Executive Vice President of HFD, HFMG and HASCO. Mr. Melcher also currently serves as Executive Vice President and Chief Compliance Officer of HFMC. Mr. Melcher has served in various positions within The Hartford and its subsidiaries in connection with the operation of the Hartford Funds since joining The Hartford in 2012. Prior to joining The Hartford, Mr. Melcher worked at Touchstone Investments, a member of the Western & Southern Financial Group, where he held the position of Vice President and Chief Compliance Officer from 2010 through 2012 and Assistant Vice President, Compliance from 2005 to 2010.
Vernon J. Meyer (1964) Vice President since 2006
Mr. Meyer currently serves as Senior Vice President of HLIC. He also currently serves as Managing Director and Chief Investment Officer of HFMC and Managing Director of HFMG. Mr. Meyer has served in various positions within The Hartford and its subsidiaries in connection with the operation of the Hartford Funds. Mr. Meyer joined The Hartford in 2004.
Laura S. Quade (1969) Vice President since 2012
Ms. Quade currently serves as Vice President of HASCO, HFD and HFMG. She is the Head of Operations of HASCO and formerly served as Director, Enterprise Operations of HLIC. Ms. Quade has served in various positions within The Hartford and its subsidiaries in connection with the operation of the Hartford Funds. Ms. Quade joined The Hartford in 2001.
Martin A. Swanson** (1962) Vice President since 2010
Mr. Swanson currently serves as Vice President of HLIC. Mr. Swanson also serves as Managing Director, Chief Marketing Officer and Principal of HFD and Managing Director of HFMG. Mr. Swanson has served in various positions within The Hartford and its subsidiaries in connection with the operation of the Hartford Funds.
** Mr. Swanson resigned as an officer effective November 6, 2014.
HOW TO OBTAIN A COPY OF THE FUND’S PROXY VOTING POLICIES AND VOTING RECORDS (UNAUDITED)
A description of the policies and procedures that the Fund uses to determine how to vote proxies relating to portfolio securities and information about how the Fund voted proxies relating to portfolio securities during the most recent twelve-month period ended June 30 are available (1) without charge, upon request, by calling 888-843-7824 and (2) on the SEC’s website at http://www.sec.gov.
QUARTERLY PORTFOLIO HOLDINGS INFORMATION (UNAUDITED)
The Fund files a complete schedule of portfolio holdings with the SEC for the first and third quarters of each fiscal year on Form N-Q. The Fund’s Forms N-Q are available (1) without charge, upon request, by calling 888-843-7824 and (2) on the SEC’s website at http://www.sec.gov. The Form N-Q may be reviewed and copied at the SEC’s Public Reference Room in Washington, DC. Information on the operation of the Public Reference Room may be obtained by calling 1-800-SEC-0330.
| 35 |
The Hartford Capital Appreciation Fund
| Federal Tax Information (Unaudited) |
For the fiscal year ended October 31, 2014, there is no further federal tax information required for this Fund.
| 36 |
The Hartford Capital Appreciation Fund
| Expense Example (Unaudited) |
Your Fund's Expenses
As a shareholder of the Fund, you incur two types of costs: (1) transaction costs, including sales charges (loads) on purchase payments, if any, and contingent deferred sales charges (CDSC), if any, and (2) ongoing costs, including investment management fees, distribution and/or service (12b-1) fees, if any, and other fund expenses. This example is intended to help you understand your ongoing costs (in dollars) of investing in the Fund and to compare these costs with the ongoing costs of investing in other mutual funds. The example is based on an investment of $1,000 invested at the beginning of the period and held for the entire period of April 30, 2014 through October 31, 2014.
Actual Expenses
The first set of columns of the table below provides information about actual account values and actual expenses. You may use the information in this column, together with the amount you invested, to estimate the expenses that you paid over the period. Simply divide your account value by $1,000 (for example, an $8,600 account value divided by $1,000 = 8.6), then multiply the result by the number in the line under the heading entitled “Expenses Paid During Period” to estimate the expenses you paid on your account during this period.
Hypothetical Example for Comparison Purposes
The second set of columns of the table below provides information about hypothetical account values and hypothetical expenses based on the Fund's actual expense ratio and an assumed rate of return of 5% per year before expenses, which is not the Fund's actual return. The hypothetical account values and expenses may not be used to estimate the actual ending account balance or expenses you paid for the period. You may use this information to compare the ongoing costs of investing in the Fund and other funds. To do so, compare this 5% hypothetical example with the 5% hypothetical examples that appear in the shareholder reports of the other funds.
Please note that the expenses shown in the table are meant to highlight your ongoing costs only and do not reflect any transactional costs, such as sales charges (loads) and CDSC. Therefore, the second set of columns of the table is useful in comparing ongoing costs only, and will not help you determine the relative total costs of owning different funds. In addition, if these transactional costs were included, your costs would be higher. Expenses are equal to the Fund's annualized expense ratios multiplied by average account value over the period, multiplied by 184/365 (to reflect the one-half year period).
| Actual return | Hypothetical (5% return before expenses) | |||||||||||||||||||||||||||||||||||
| Beginning
Account Value April 30, 2014 | Ending
Account Value October 31, 2014 | Expenses
paid during the period April 30, 2014 through October 31, 2014 | Beginning
Account Value April 30, 2014 | Ending
Account Value October 31, 2014 | Expenses
paid during the period April 30, 2014 through October 31, 2014 | Annualized
expense ratio | Days
in the current 1/2 year | Days
in the full year | ||||||||||||||||||||||||||||
| Class A | $ | 1,000.00 | $ | 1,060.90 | $ | 5.67 | $ | 1,000.00 | $ | 1,019.70 | $ | 5.56 | 1.09 | % | 184 | 365 | ||||||||||||||||||||
| Class B | $ | 1,000.00 | $ | 1,056.40 | $ | 10.00 | $ | 1,000.00 | $ | 1,015.48 | $ | 9.80 | 1.93 | 184 | 365 | |||||||||||||||||||||
| Class C | $ | 1,000.00 | $ | 1,056.90 | $ | 9.39 | $ | 1,000.00 | $ | 1,016.08 | $ | 9.20 | 1.81 | 184 | 365 | |||||||||||||||||||||
| Class I | $ | 1,000.00 | $ | 1,062.70 | $ | 3.94 | $ | 1,000.00 | $ | 1,021.38 | $ | 3.86 | 0.76 | 184 | 365 | |||||||||||||||||||||
| Class R3 | $ | 1,000.00 | $ | 1,059.20 | $ | 7.27 | $ | 1,000.00 | $ | 1,018.15 | $ | 7.12 | 1.40 | 184 | 365 | |||||||||||||||||||||
| Class R4 | $ | 1,000.00 | $ | 1,061.00 | $ | 5.70 | $ | 1,000.00 | $ | 1,019.67 | $ | 5.59 | 1.10 | 184 | 365 | |||||||||||||||||||||
| Class R5 | $ | 1,000.00 | $ | 1,062.40 | $ | 4.14 | $ | 1,000.00 | $ | 1,021.19 | $ | 4.06 | 0.80 | 184 | 365 | |||||||||||||||||||||
| Class Y | $ | 1,000.00 | $ | 1,062.80 | $ | 3.62 | $ | 1,000.00 | $ | 1,021.69 | $ | 3.55 | 0.70 | 184 | 365 | |||||||||||||||||||||
| 37 |
The Hartford Capital Appreciation Fund
| Approval of Investment Management and Investment Sub-Advisory Agreements (Unaudited) |
Section 15(c) of the Investment Company Act of 1940, as amended (the “1940 Act”), requires that each mutual fund’s board of directors, including a majority of those directors who are not “interested persons” of the mutual fund, as defined in the 1940 Act (the “Independent Directors”), annually review and consider the continuation of the mutual fund’s investment advisory and sub-advisory agreements. At its meeting held on August 5-6, 2014, the Board of Directors (the “Board”) of The Hartford Mutual Funds, Inc., including each of the Independent Directors, unanimously voted to approve the continuation of the investment management agreement for The Hartford Capital Appreciation Fund (the “Fund”) with Hartford Funds Management Company, LLC (“HFMC”) and the continuation of the investment sub-advisory agreement between HFMC and the Fund’s sub-adviser, Wellington Management Company, LLP (the “Sub-adviser,” and together with HFMC, the “Advisers”) (collectively, the “Agreements”).
In the months preceding the August 5-6, 2014 meeting, the Board requested, received and reviewed written responses from the Advisers to questions posed to them on behalf of the Independent Directors and supporting materials relating to those questions and responses. The Board considered information furnished to the Board at its meetings throughout the year, as well as information specifically prepared in connection with the annual approval of the Agreements at the Board’s meetings held on June 17-18, 2014 and August 5-6, 2014. Information provided to the Board at its meetings throughout the year included, among other things, reports on Fund performance, legal and compliance matters, sales and marketing activity, shareholder services, and the other services provided to the Fund by the Advisers and their affiliates. The Board also received in-person presentations by Fund officers and representatives of HFMC at the Board’s meetings on June 17-18, 2014 and August 5-6, 2014 concerning the Agreements.
The Independent Directors, advised by independent legal counsel, engaged service providers to assist them with evaluating the Agreements with respect to the Fund. Lipper Inc. (“Lipper”), an independent provider of investment company data, was retained to provide the Board with reports on how the Fund’s contractual management fees, actual management fees, other non-management fees, overall expense ratios and investment performance compared to those of mutual funds with similar investment objectives. The Independent Directors also engaged an independent financial services consultant (the “Consultant”) to assist them in evaluating the Fund’s management fees, sub-advisory fees, other non-management fees, overall expense ratios and investment performance. In addition, the Consultant reviewed the profitability calculations utilized by HFMC in connection with the continuation of the investment management agreement.
In determining whether to continue the Agreements for the Fund, the members of the Board reviewed and evaluated information and factors they believed to be relevant and appropriate in light of the information that the Board deemed necessary and appropriate through the exercise of its reasonable business judgment. While individual members of the Board may have weighed certain factors differently, the Board’s determination to continue the Agreements was based on a comprehensive consideration of all information provided to the Board throughout the year and specifically with respect to the continuation of the Agreements. A more detailed discussion of the factors the Board considered with respect to its approval of the Agreements is provided below.
Nature, Extent and Quality of Services Provided by the Advisers
The Board requested and considered information concerning the nature, extent and quality of the services provided to the Fund by the Advisers. The Board considered, among other things, the terms of the Agreements and the range of services provided by the Advisers. The Board considered the Advisers’ professional personnel who provide services to the Fund, including each Adviser’s ability and experience in attracting and retaining qualified personnel to service the Fund. The Board considered each Adviser’s reputation and overall financial strength, as well as its willingness to consider and implement organizational and operational changes designed to enhance services to the Hartford Funds. In addition, the Board considered the quality of each Adviser’s communications with the Board and responsiveness to Board inquiries and requests made from time to time with respect to the Fund and other Hartford Funds.
The Board also requested and evaluated information concerning each Adviser’s regulatory and compliance environment. In this regard, the Board requested and reviewed information on each Adviser’s compliance policies and procedures, compliance history, and a report from the Fund’s Chief Compliance Officer on each Adviser’s compliance with applicable laws and regulations, including responses to regulatory developments and compliance issues raised by regulators. The Board also noted the Advisers’ support of the Fund’s compliance control structure, particularly the resources devoted by the Advisers in support of the Fund’s obligations pursuant to Rule 38a-1 under the 1940 Act.
With respect to HFMC, the Board noted that, under the Agreements, HFMC is responsible for the management of the Fund, including oversight of fund operations and service providers, and provides administrative and investment advisory services in connection with selecting, monitoring and supervising the Sub-adviser. The Board considered HFMC’s ongoing monitoring of people, process and performance, including its quarterly
| 38 |
The Hartford Capital Appreciation Fund
| Approval of Investment Management and Investment Sub-Advisory Agreements (Unaudited) – (continued) |
reviews of each of the Hartford Funds, semi-annual meetings with the leaders of each Fund’s portfolio management team, and oversight of the Hartford Funds’ approximately 66 portfolio managers. The Board recognized that HFMC has demonstrated a record of making changes to the
management and/or strategies of the Hartford Funds when warranted. The Board considered HFMC’s oversight of the Sub-adviser’s investment approach and results, process for monitoring best execution of portfolio trades by the Sub-adviser, and approach to risk management with respect to the Fund and the service providers to the Fund. The Board also considered HFMC’s oversight of compliance with the Fund’s objective and policies as well as with applicable laws and regulations, noting that regulatory and other developments had over time led to an increase in the scope of HFMC’s services in this regard.
In addition, the Board considered HFMC’s ongoing commitment to review and rationalize the Hartford Funds product line-up and the expenses that HFMC had incurred in connection with fund combinations in recent years. The Board considered that HFMC or its affiliates are responsible for providing the Fund’s officers.
With respect to the Sub-adviser, which provides certain day-to-day portfolio management services for the Fund, the Board considered the quality of the Fund’s portfolio managers, the Sub-adviser’s other investment personnel, its investment philosophy and process, investment research capabilities and resources, performance record, trade execution capabilities and experience. The Board considered the experience of the Fund’s portfolio managers, the number of accounts managed by the portfolio managers, and the Sub-adviser’s method for compensating the portfolio managers.
Based on these considerations, the Board concluded that it was satisfied with the nature, extent and quality of the services provided to the Fund by HFMC and the Sub-adviser.
Performance of the Fund and the Advisers
The Board considered the investment performance of the Fund. In this regard, the Board reviewed the performance of the Fund over different time periods presented in the materials and evaluated HFMC’s analysis of the Fund’s performance for these time periods. The Board considered information and materials provided to the Board by the Advisers concerning Fund performance, as well as information from Lipper comparing the investment performance of the Fund to an appropriate benchmark and universe of peer funds. The Board noted that the Fund’s performance was in the 1st quintile of its performance universe for the 1-year period and the 3rd quintile for the 3- and 5-year periods. The Board also noted that the Fund’s performance was above its benchmark for the 1-year period, below its benchmark for the 3-year period and in line with its benchmark for the 5-year period. The Board considered that, in response to questions raised concerning the Fund’s performance, HFMC stated that it has confidence in the Fund’s portfolio management team and investment strategy.
The Board considered the detailed investment analytics reports provided by Hartford Funds’ Investment Advisory Group throughout the year. These reports include, among other things, information on the Fund’s gross and net returns, the Fund’s investment performance relative to an appropriate benchmark and peer group, various statistics concerning the Fund’s portfolio, and a narrative summary of various factors affecting Fund performance. The Board considered the Advisers’ cooperation with the Investment Committee, which assists the Board in evaluating the performance of the Fund at periodic meetings throughout the year. The Board also considered the analysis provided by the Consultant relating to the Fund’s performance track record.
In light of all the considerations noted above, the Board concluded that it had continued confidence in HFMC’s and the Sub-adviser’s overall capabilities to manage the Fund.
Costs of the Services and Profitability of the Advisers
The Board reviewed information regarding HFMC’s cost to provide investment management and related services to the Fund and HFMC’s profitability, both overall and for the Fund, on a pre-tax basis without regard to distribution expenses. The Board also requested and reviewed information about the profitability to HFMC and its affiliates from all services provided to the Fund and all aspects of their relationship with the Fund. The Board also requested and received information relating to the operations and profitability of the Sub-adviser.
The Board considered the Consultant’s review of the profitability calculations used by HFMC in connection with the continuation of the investment management agreement, noting the Consultant’s view that Hartford Funds’ process for calculating and reporting Fund profitability is reasonable. In this regard, the Board noted that the Consultant performed a full review of this process in light of the recent restructuring of the
| 39 |
The Hartford Capital Appreciation Fund
| Approval of Investment Management and Investment Sub-Advisory Agreements (Unaudited) – (continued) |
Hartford Funds business and reported that the approach to analyzing Fund profitability, including the use of common expense allocation methodologies, is reasonable, sound and well within common industry practice.
Based on these considerations, the Board concluded that the profits anticipated to be realized by the Advisers and their affiliates from their relationships with the Fund would not be excessive.
Comparison of Fees and Services Provided by the Advisers
The Board considered comparative information with respect to the management fees to be paid by the Fund to HFMC and the total expense ratios of the Fund. The Board also considered comparative information with respect to the sub-advisory fees to be paid by HFMC to the Sub-adviser. In this regard, the Board requested and reviewed information from HFMC and the Sub-adviser relating to the management and sub-advisory fees, including the sub-advisory fee schedule for the Fund, and total operating expenses for the Fund. With respect to the sub-advisory fee schedule, the Board considered representations from HFMC and the Sub-adviser that the Sub-adviser’s fees were negotiated at arm’s length on a fund-by-fund basis. The Board also reviewed information from Lipper comparing the Fund’s contractual management fees, actual management fees and overall expense ratios relative to a group of funds selected by Lipper, in consultation with the Consultant, and a broader universe of funds selected by Lipper. The Board considered that the Fund’s contractual management fee, actual management fee and total expenses (less 12b-1 and shareholder service fees) were in the 4th quintile of its expense group. The Board noted that the Fund has an automatically renewable contractual expense cap on certain share classes. The expense cap resulted in reimbursement of certain expenses incurred in 2013.
While the Board recognized that comparisons between the Fund and peer funds may be imprecise, given the different service levels and characteristics of mutual funds and the different business models and cost structures of the Advisers, the comparative information provided by Lipper assisted the Board in evaluating the reasonableness of the Fund’s management and sub-advisory fees and total operating expenses. In addition, the Board considered the analysis and recommendations of the Consultant relating to the Fund’s management and sub-advisory fees and total operating expenses.
Based on these considerations, the Board concluded that the Fund’s fees and total operating expenses, in conjunction with the information about quality of services, profitability, economies of scale, and other matters discussed, were reasonable in light of the services provided.
Economies of Scale
The Board requested and considered information regarding the Advisers’ realization of economies of scale with respect to the Fund and whether the fee levels reflect these economies of scale for the benefit of the Fund’s shareholders. The Board reviewed the breakpoints in the management fee schedule for the Fund, which reduce fee rates as Fund assets grow over time. The Board recognized that a fund with assets beyond the highest breakpoint level will continue to benefit from economies of scale because additional assets are charged the lowest breakpoint fee resulting in lower overall effective management fee rates. The Board also considered that expense limitations and fee waivers that reduce the Fund’s expenses at all asset levels can have the same effect as breakpoints in sharing economies of scale with shareholders and provide protection from an increase in expenses if Fund assets decline. The Board recognized that a fee schedule that reaches a lower breakpoint quickly provides shareholders with the benefit of anticipated or potential economies of scale. The Board also considered that HFMC has been active in managing expenses, which has resulted in benefits being realized by shareholders as assets within the Hartford Funds family of funds have grown over time, including through lower transfer agent costs and other operating expenses.
The Board reviewed and evaluated materials from Lipper and the Consultant showing how management fee schedules of peer funds reflect economies of scale for the benefit of shareholders as a peer fund’s assets hypothetically increase over time. Based on information provided by HFMC, Lipper, and the Consultant, the Board recognized that there is no uniform methodology for establishing breakpoints or uniform pattern in asset levels that trigger breakpoints or the amounts of breakpoints triggered.
After considering all of the information available to it, the Board concluded that it was satisfied with the extent to which economies of scale would be shared for the benefit of the Fund’s shareholders based on currently available information and the effective advisory fees and expense ratios for the Fund at its current and reasonably anticipated asset levels. The Board noted, however, that it would continue to monitor future growth in Fund assets and the appropriateness of additional breakpoints.
| 40 |
The Hartford Capital Appreciation Fund
| Approval of Investment Management and Investment Sub-Advisory Agreements (Unaudited) – (continued) |
Other Benefits
The Board considered other benefits to the Advisers and their affiliates from their relationships with the Fund.
The Board noted that HFMC receives fees for fund accounting and related services from the Fund, and the Board considered information on profits to HFMC for such services. The Board also considered that Hartford Administrative Services Company (“HASCO”), the Fund’s transfer agent and an affiliate of HFMC, receives transfer agency compensation from the Fund, and the Board reviewed information on the profitability of the Fund’s transfer agency function to HASCO. The Board considered information provided by HASCO indicating that the transfer agent fees charged by HASCO to the Fund were fair and reasonable based on publicly available information.
The Board also considered that Hartford Funds Distributors, LLC (“HFD”), an affiliate of HFMC, serves as principal underwriter of the Fund. As principal underwriter, HFD receives 12b-1 fees from the Fund and receives all or a portion of the sales charges on sales or redemptions of certain classes of shares. The Board also noted that certain affiliates of HFD distribute shares of the Fund and receive compensation in that connection.
The Board considered benefits to the Sub-adviser from its use of the Fund’s brokerage commissions to obtain soft dollar research, and representations from HFMC and the Sub-adviser that the Sub-adviser would not make any revenue-sharing payments or any other type of distribution payments to HFMC or its affiliates.
The Board considered the benefits to shareholders of being part of the Hartford Funds family of funds, including the right to exchange investments between the same class of funds without a sales charge, the ability to reinvest Fund dividends into other funds in the family, and the ability to combine holdings in the Fund with holdings in other funds to obtain a reduced sales charge. The Board considered HFMC’s efforts to provide investors in the family with a broad range of investment styles and asset classes and its entrepreneurial risk in initiating new funds to expand these opportunities for shareholders.
* * * *
Based upon its review of these various factors, among others, the Board concluded that it is in the best interests of the Fund and its shareholders for the Board to approve the Agreements for an additional year. In reaching this decision, the Board did not assign relative weights to the factors discussed above or deem any one or group of them to be controlling in and of themselves. In connection with their deliberations, the Independent Directors met separately in executive session on several occasions, with independent legal counsel and the Consultant, to review the relevant materials and consider their responsibilities under relevant laws and regulations.
| 41 |
The Hartford Capital Appreciation Fund
| Main Risks (Unaudited) |
The main risks of investing in the Fund are described below.
Market, Selection and Strategy Risk: The Fund’s share price may fluctuate due to market risk and/or security selections that may underperform the market or relevant benchmarks. If the sub-adviser's investment strategy does not perform as expected, the Fund could underperform its peers or lose money. There is no guarantee the Fund will achieve its stated objective.
Asset Allocation Strategy Risk: The portfolio managers' asset allocation strategy may not always work as intended, and asset allocation does not guarantee better performance or reduce the risk of investment loss. The investment styles employed by the portfolio managers may not be complimentary, which could adversely affect the performance of the Fund.
Mid-Cap Stock Risk: Mid-cap stocks are generally more volatile and risky and may be less liquid than large-cap stocks because they may have limited operating histories, narrow product lines, and focus on niche markets.
Foreign Investment and Emerging Markets Risk: Investments in foreign securities may be riskier than investments in U.S. securities. Potential risks include the risks of illiquidity, increased price volatility, less government regulation, less extensive and less frequent accounting and other reporting requirements, unfavorable changes in currency exchange rates, and economic and political disruptions. These risks are generally greater for investments in emerging markets.
Active Trading Risk: Actively trading investments may result in higher costs and higher taxable income.
| 42 |
THIS PRIVACY POLICY IS NOT PART OF THIS REPORT
Privacy Policy and Practices of The Hartford Financial Services Group, Inc. and its Affiliates
(herein called “we, our and us”)
This Privacy Policy applies to our United States Operations
|
We value your trust. We are committed to the responsible: a) management; b) use; and c) protection; of Personal Information.
This notice describes how we collect, disclose, and protect Personal Information.
We collect Personal Information to: a) service your Transactions with us; and b) support our business functions.
We may obtain Personal Information from: a) You; b) your Transactions with us; and c) third parties such as a consumer-reporting agency.
Based on the type of product or service You apply for or get from us, Personal Information such as: a) your name; b) your address; c) your income; d) your payment; or e) your credit history; may be gathered from sources such as applications, Transactions, and consumer reports.
To serve You and service our business, we may share certain Personal Information. We will share Personal Information, only as allowed by law, with affiliates such as: a) our insurance companies; b) our employee agents; c) our brokerage firms; and d) our administrators.
As allowed by law, we may share Personal Financial Information with our affiliates to: a) market our products; or b) market our services; to You without providing You with an option to prevent these disclosures.
|
We may also share Personal Information, only as allowed by law, with unaffiliated third parties including: a) independent agents; b) brokerage firms; c) insurance companies; d) administrators; and e) service providers; who help us serve You and service our business.
When allowed by law, we may share certain Personal Financial Information with other unaffiliated third parties who assist us by performing services or functions such as: a) taking surveys; b) marketing our products or services; or c) offering financial products or services under a joint agreement between us and one or more financial institutions.
We, and third parties we partner with, may track some of the pages You visit through the use of: a) cookies; b) pixel tagging; or c) other technologies; and currently do not process or comply with any web browser’s “do not track” signal or similar mechanism that indicates a request to disable online tracking of individual users who visit our websites or use our services.
We will not sell or share your Personal Financial Information with anyone for purposes unrelated to our business functions without offering You the opportunity to: a) “opt-out;” or b) “opt-in;” as required by law.
We only disclose Personal Health Information with: a) your proper written authorization; or b) as otherwise allowed or required by law.
Our employees have access to Personal Information in the course of doing their jobs, such as: a) underwriting policies; b) paying claims; c) developing new products; or d) advising customers of our products and services.
|
|
We use manual and electronic security procedures to maintain: a) the confidentiality; and b) the integrity of; Personal Information that we have. We use these procedures to guard against unauthorized access.
Some techniques we use to protect Personal Information include: a) secured files; b) user authentication; c) encryption; d) firewall technology; and e) the use of detection software.
We are responsible for and must: a) identify information to be protected; b) provide an adequate level of protection for that data; c) grant access to protected data only to those people who must use it in the performance of their job-related duties.
Employees who violate our Privacy Policy will be subject to discipline, which may include ending their employment with us.
At the start of our business relationship, we will give You a copy of our current Privacy Policy.
We will also give You a copy of our current Privacy Policy once a year if You maintain a continuing business relationship with us.
We will continue to follow our Privacy Policy regarding Personal Information even when a business relationship no longer exists between us.
|
As used in this Privacy Notice:
Application means your request for our product or service.
Personal Financial Information means financial information such as: a) credit history; b) income; c) financial benefits; or d) policy or claim information.
Personal Health Information means health information such as: a) your medical records; or b) information about your illness, disability or injury.
Personal Information means information that identifies You personally and is not otherwise available to the public. It includes: a) Personal Financial Information; and b) Personal Health Information.
Transaction means your business dealings with us, such as: a) your Application; b) your request for us to pay a claim; and c) your request for us to take an action on your account.
You means an individual who has given us Personal Information in conjunction with: a) asking about; b) applying for; or c) obtaining; a financial product or service from us if the product or service is used mainly for personal, family, or household purposes.
|
This Privacy Policy is being provided on behalf of the following affiliates of The Hartford Financial Services Group, Inc.:
1stAGChoice, Inc.; Access CoverageCorp, Inc.; Access CoverageCorp Technologies, Inc.; American Maturity Life Insurance Company; Archway 60 R, LLC; Business Management Group, Inc.; Champlain Life Reinsurance Company; DMS R, LLC; Eloy R, LLC; Ersatz Corporation; First State Insurance Company; Hartford Accident and Indemnity Company; Hartford Administrative Services Company; Hartford Casualty General Agency, Inc.; Hartford Casualty Insurance Company; Hartford-Comprehensive Employee Benefit Service Company; Hartford Equity Sales Company, Inc.; Hartford Fire General Agency, Inc.; Hartford Fire Insurance Company; Hartford Funds Management Company, LLC; Hartford Funds Management Group, Inc.; Hartford HLS Series Fund II, Inc.; Hartford Insurance Company of Illinois; Hartford Insurance Company of the Midwest; Hartford Insurance Company of the Southeast; Hartford Integrated Technologies, Inc.; Hartford International Life Reassurance Corporation; Hartford Funds Distributors, LLC; Hartford Investment Management Company; Hartford Life and Accident Insurance Company; Hartford Life and Annuity Insurance Company; Hartford Life Insurance Company; Hartford Life Private Placement, LLC; Hartford Lloyd’s Corporation; Hartford Lloyd’s Insurance Company; Hartford Mezzanine Investors I, LLC; Hartford Residual Market, L.C.C.; Hartford Retirement Services, LLC; Hartford Securities Distribution Company, Inc.; Hartford Series Fund, Inc.; Hartford Specialty Insurance Services of Texas, LLC; Hartford Strategic Investments, LLC; Hartford Underwriters Insurance Company; Hartford Technology Services Company, L.L.C.; Hartford of Texas General Agency, Inc.; Hartford Underwriters General Agency, Inc.; HARTRE Company, L.C.C.; HL Investment Advisors, LLC; HLA LLC; Horizon Management Group, LLC; HRA Brokerage Services, Inc.; Lanidex Class B, LLC; M-CAP Insurance Agency, LLC; New England Insurance Company; New England Reinsurance Corporation; Nutmeg Insurance Agency, Inc.; Nutmeg Insurance Company; Pacific Insurance Company, Limited; Planco, LLC: Property and Casualty Insurance Company of Hartford; Revere R, LLC; RVR R, LLC; Sentinel Insurance Company, Ltd.; Sunstone R, LLC; Symphony R, LLC; The Evergreen Group Incorporated; The Hartford Alternative Strategies Fund; The Hartford Mutual Funds, Inc.; The Hartford Mutual Funds II, Inc.; Trumbull Flood Management, L.L.C.; Trumbull Insurance Company; Twin City Fire Insurance Company; White River Life Reinsurance Company.
HPP Revised January 2014
HARTFORDFUNDS
hartfordfunds.com
This information is written in connection with the promotion or marketing of the matter(s) addressed in this material.
This report is submitted for the general information of the shareholders of the Fund. It is not authorized for distribution unless preceded or accompanied by a current prospectus for the Fund.
The information cannot be used or relied upon for the purpose of avoiding IRS penalties. These materials are not intended to provide tax, accounting or legal advice. As with all matters of a tax or legal nature, you should consult your own tax or legal counsel for advice.
Investors should carefully consider the investment objectives, risks, charges, and expenses of Hartford Funds before investing. This and other information can be found in the prospectus and summary prospectus, which can be obtained by calling 888-843-7824 (retail) or 800-279-1541 (institutional). Investors should read them carefully before they invest.
Hartford Funds are underwritten and distributed by Hartford Funds Distributors, LLC.
MFAR-CA14 12/14 113964-3 Printed in U.S.A.
HARTFORDFUNDS
|
THE HARTFORD CHECKS AND BALANCES FUND
2014 Annual Report |
A MESSAGE FROM THE PRESIDENT
Dear Fellow Shareholders:
Thank you for investing in Hartford Funds.
Market Review
U.S. equities (as represented by the S&P 500 Index) rose steadily for the fiscal year ended October 31, 2014, with a return of 17.27% for the period. With the exception of short-lived geopolitical scares early in 2014 and concerns about continuing global growth near the end of the period, stocks generally rose on solid fundamentals and encouraging macroeconomic data during the year.
September 2014 marked the six-year anniversary of the start of the financial crisis. Within weeks of that anniversary, both the S&P 500 Index and the Dow Jones Industrial Average set new all-time highs, closing at 2,018 and 17,391, respectively, on October 31. Although the fallout of the crisis continues to influence investor behavior, stocks have recovered and risen dramatically, up 198% from their low in March 2009. Meanwhile, the domestic economy is notching strong growth, and the unemployment rate has reached its lowest level since August 2008.
While the U.S. economy appears to have stabilized and to have reverted to a solid growth path, the outlook for the global economy appears to have gotten cloudier. The U.S. Federal Reserve has ended quantitative easing, while Europe and Japan are pursuing stimulus options to avoid a double-dip recession and deflation, respectively. Diverging central-bank policies will likely continue to play an important role in market movements going forward as investors wait to see the reactions to their efforts and their impacts on global markets.
How have market movements impacted your portfolio throughout the last year? Are your investments still on track to provide the growth or income you need, and are you comfortable with their progress during times of volatility?
Your financial professional can help you navigate today’s markets with confidence, as well as assist you to achieve your investment goals by providing advice on the best options within our fund family to help you work toward overcoming today’s investing challenges. Meet with your financial advisor regularly to examine your portfolio and your investment strategy, and to determine if you’re still on track to meet your goals.
Thank you again for investing with Hartford Funds.
James Davey
President
Hartford Funds
1 The S&P 500 Index is a market capitalization-weighted price index composed of 500 widely held common stocks.
2 The Dow Jones Industrial Average is an unmanaged, price-weighted index of 30 of the largest, most widely held stocks traded on the NYSE
The Hartford Checks and Balances Fund
Table of Contents
The views expressed in the Fund’s Manager Discussion under ‘‘Why did the Fund perform this way?’’ and ‘‘What is the outlook?’’ are views of the Fund’s investment manager through the end of the period and are subject to change based on market and other conditions. The Fund’s Manager Discussion is for informational purposes only and does not represent an offer, recommendation or solicitation to buy, hold or sell any security. The specific securities identified and described, if any, do not represent all of the securities purchased or sold and you should not assume that investments in the securities identified and discussed will be profitable.
| The Hartford Checks and Balances Fund inception 05/31/2007 |
| (advised by Hartford Funds Management Company, LLC) |
| Investment objective – The Fund seeks long-term capital appreciation and income. |
Performance Overview 5/31/07 - 10/31/14

The chart above represents the hypothetical growth of a $10,000 investment in Class A, which includes a sales charge. Growth results in classes other than Class A will vary from what is seen above due to differences in the expenses charged to those share classes.
Average Annual Total Returns (as of 10/31/14)
| 1 Year | 5 Years | Since Inception▲ | ||||||||||
| Checks and Balances A# | 11.07 | % | 11.16 | % | 5.59 | % | ||||||
| Checks and Balances A## | 4.96 | % | 9.91 | % | 4.79 | % | ||||||
| Checks and Balances B# | 10.09 | % | 10.25 | % | 4.76 | % | ||||||
| Checks and Balances B## | 5.09 | % | 9.98 | % | 4.76 | % | ||||||
| Checks and Balances C# | 10.17 | % | 10.33 | % | 4.82 | % | ||||||
| Checks and Balances C## | 9.17 | % | 10.33 | % | 4.82 | % | ||||||
| Checks and Balances I# | 11.35 | % | 11.45 | % | 5.86 | % | ||||||
| Checks and Balances R3# | 10.70 | % | 10.76 | % | 5.29 | % | ||||||
| Checks and Balances R4# | 11.06 | % | 11.12 | % | 5.56 | % | ||||||
| Checks and Balances R5# | 11.34 | % | 11.46 | % | 5.83 | % | ||||||
| Barclays U.S. Aggregate Bond Index | 4.14 | % | 4.22 | % | 5.16 | % | ||||||
| Checks and Balances Fund Blended Index | 12.44 | % | 12.75 | % | 6.16 | % | ||||||
| Russell 3000 Index | 16.07 | % | 17.01 | % | 6.22 | % | ||||||
| S&P 500 Index | 17.27 | % | 16.69 | % | 6.06 | % | ||||||
| ▲ | Inception: 05/31/2007 |
| # | Without sales charge |
| ## | With sales charge |
PERFORMANCE DATA QUOTED REPRESENTS PAST PERFORMANCE AND DOES NOT GUARANTEE FUTURE RESULTS. The investment return and principal value of the investment will fluctuate so that investors’ shares, when redeemed, may be worth more or less than their original cost. Current performance may be lower or higher than the performance data quoted. To obtain performance data current to the most recent month-end, please visit our website www.hartfordfunds.com.
The initial investment in Class A shares reflects the maximum sales charge of 5.50% and returns for Class B shares reflect a contingent deferred sales charge of up to 5.00% and declining to zero, depending on the period of time the shares are held. Returns for Class C shares reflect a contingent deferred sales charge of up to 1.00% on shares redeemed within twelve months of purchase.
Total returns presented above were calculated using the Fund’s net asset value available to shareholders for sale or redemption of Fund shares on October 31, 2014, which may exclude investment transactions as of this date. All share class returns assume the reinvestment of all distributions at net asset value and the deduction of all fund expenses.
Effective 9/30/09, Class B shares of the Fund were closed to new investments.
Class I shares commenced operations on 2/29/08. Performance prior to that date is that of the Fund’s Class A shares (excluding sales charges), which had different operating expenses. Class R3, R4 and R5 shares commenced operations on 8/29/08. Performance prior to that date is that of the Fund’s Class A shares (excluding sales charges), which had different operating expenses.
Barclays U.S. Aggregate Bond Index is an unmanaged index and is composed of securities from the Barclays Government/Credit Bond Index, Mortgage-Backed Securities Index, Asset-Backed Securities Index and Commercial Mortgage-Backed Securities Index.
Checks and Balances Fund Blended Index is calculated by Hartford Funds Management Company, LLC and represents the weighted return of 33.3% Barclays U.S. Aggregate Bond Index, 33.4% Russell 3000 Index and 33.3% S&P 500 Index.
Russell 3000 Index is an unmanaged index that measures the performance of the 3,000 largest U.S. companies based on total market capitalization.
S&P 500 Index is a market capitalization-weighted price index composed of 500 widely held common stocks.
You cannot invest directly in an index.
The chart and table do not reflect the deductions of taxes that a shareholder would pay on Fund distributions or the redemption of Fund shares.
Performance information may reflect historical or current expense waivers/reimbursements from the investment adviser, without which performance would have been lower. For information on current expense waivers/reimbursements, please see the prospectus.
| 2 |
| The Hartford Checks and Balances Fund |
| Manager Discussion |
| October 31, 2014 (Unaudited) |
| Operating Expenses* | ||||||||
| Net | Gross | |||||||
| Checks and Balances Class A | 1.04 | % | 1.04 | % | ||||
| Checks and Balances Class B | 1.84 | % | 1.84 | % | ||||
| Checks and Balances Class C | 1.79 | % | 1.79 | % | ||||
| Checks and Balances Class I | 0.78 | % | 0.78 | % | ||||
| Checks and Balances Class R3 | 1.38 | % | 1.38 | % | ||||
| Checks and Balances Class R4 | 1.09 | % | 1.09 | % | ||||
| Checks and Balances Class R5 | 0.78 | % | 0.78 | % | ||||
| * | As shown in the Fund's current prospectus dated March 1, 2014. Actual expenses may be higher or lower. Expenses shown include expenses of the Underlying Funds. Please see accompanying Financial Highlights for expense ratios for the year ended October 31, 2014. |
Gross expenses are the Fund's total annual operating expenses shown in the Fund's most recent prospectus. Net expenses are the Fund's total annual operating expenses shown in the Fund's most recent prospectus and reflect contractual expense reimbursements in instances when these reductions reduce the Fund's gross expenses. Contractual reimbursements remain in effect until February 28, 2015, and automatically renew for one-year terms unless terminated.
All investments are subject to risk including the possible loss of principal. For a discussion of the Fund’s risks, please see the Main Risks section of this report. For more detailed information on the risks associated with an investment in the Fund, please see the prospectus.
| Portfolio Manager |
| Vernon J. Meyer, CFA |
| Managing Director and Chief Investment Officer of Hartford Funds Management Company, LLC (“HFMC”) and Chairman of HFMC Investment Oversight Committee |
How did the Fund perform?
The Class A shares of The Hartford Checks and Balances Fund returned 11.07%, before sales charge, for the twelve-month period ended October 31, 2014, underperforming the Fund’s blended benchmark (33.3% Barclays U.S. Aggregate Bond Index, 33.4% Russell 3000 Index, 33.3% S&P 500 Index) which returned 12.44% for the same period. In comparison, the Barclays U.S. Aggregate Bond Index, the Russell 3000 Index and the S&P 500 Index returned 4.14%, 16.07%, and 17.27%, respectively, for the same period. The Fund outperformed the 8.98% average return of the Lipper Mixed-Asset Target Allocation Growth Funds average.
Why did the Fund perform this way?
The Fund makes equal allocations of its assets to Class Y shares of certain Hartford Mutual Funds (“Underlying Funds”): The Hartford Capital Appreciation Fund, The Hartford Dividend and Growth Fund, and The Hartford Total Return Bond Fund. The Underlying Funds may invest in a wide variety of instruments which primarily include U.S. and foreign equity securities and fixed income and money market securities. The Fund is not actively managed, and the Fund’s assets will be rebalanced back to one-third in each Underlying Fund as soon as reasonably practicable whenever the Fund’s investment in any single Underlying Fund deviates from the target allocation by more than 5%.
The Fund’s relative performance benefited most from the performance of The Hartford Total Return Bond Fund. The return of The Hartford Capital Appreciation Fund detracted most from relative performance.
What is the outlook?
The Fund will continue to make equal allocations of its assets to the three Underlying Funds. Please refer to www.hartfordfunds.com for the shareholder report of each Underlying Fund.
| Composition by Investments | ||||
| as of October 31, 2014 | ||||
| Fund Name | Percentage of Net Assets | |||
| The Hartford Capital Appreciation Fund | 33.7 | % | ||
| The Hartford Dividend and Growth Fund | 33.5 | |||
| The Hartford Total Return Bond Fund | 32.7 | |||
| Other Assets and Liabilities | 0.1 | |||
| Total | 100.0 | % | ||
| 3 |
| The Hartford Checks and Balances Fund |
| Schedule of Investments |
| October 31, 2014 |
| (000’s Omitted) |
| Shares or Principal Amount | Market Value ╪ | |||||||||||
| Affiliated Investment Companies - 99.9% | ||||||||||||
| Domestic Equity Funds - 67.2% | ||||||||||||
| 11,800 | The Hartford Capital Appreciation Fund | $ | 638,624 | |||||||||
| 23,122 | The Hartford Dividend and Growth Fund | 635,862 | ||||||||||
| 1,274,486 | ||||||||||||
| Total Domestic Equity Funds | ||||||||||||
| (Cost $861,959) | $ | 1,274,486 | ||||||||||
| Taxable Fixed Income Funds - 32.7% | ||||||||||||
| 57,186 | The Hartford Total Return Bond Fund | $ | 621,614 | |||||||||
| Total Taxable Fixed Income Funds | ||||||||||||
| (Cost $617,740) | $ | 621,614 | ||||||||||
| Total Investments in Affiliated Investment Companies | ||||||||||||
| (Cost $1,479,699) | $ | 1,896,100 | ||||||||||
| Total Long-Term Investments | ||||||||||||
| (Cost $1,479,699) | $ | 1,896,100 | ||||||||||
| Total Investments | ||||||||||||
| (Cost $1,479,699) ▲ | 99.9 | % | $ | 1,896,100 | ||||||||
| Other Assets and Liabilities | 0.1 | % | 1,132 | |||||||||
| Total Net Assets | 100.0 | % | $ | 1,897,232 | ||||||||
The accompanying notes are an integral part of these financial statements.
| 4 |
| The Hartford Checks and Balances Fund |
| Schedule of Investments – (continued) |
| October 31, 2014 |
| (000’s Omitted) |
| Note: | Percentage of investments as shown is the ratio of the total market value to total net assets. |
For Fund compliance purposes, the Fund may not use the same classification system shown in this report as these classifications are used for reporting ease.
| ▲ | At October 31, 2014, the cost of securities for federal income tax purposes was $1,545,032 and the aggregate gross unrealized appreciation and depreciation based on that cost were: |
| Unrealized Appreciation | $ | 351,068 | ||
| Unrealized Depreciation | — | |||
| Net Unrealized Appreciation | $ | 351,068 |
| ╪ | See Significant Accounting Policies of accompanying Notes to Financial Statements regarding valuation of securities. |
The accompanying notes are an integral part of these financial statements.
| 5 |
| The Hartford Checks and Balances Fund |
| Schedule of Investments – (continued) |
| October 31, 2014 |
| (000’s Omitted) |
Investment Valuation Hierarchy Level Summary
October 31, 2014
| Total | Level 1 ♦ | Level 2 ♦ | Level 3 | |||||||||||||
| Assets: | ||||||||||||||||
| Affiliated Investment Companies | $ | 1,896,100 | $ | 1,896,100 | $ | – | $ | – | ||||||||
| Total | $ | 1,896,100 | $ | 1,896,100 | $ | – | $ | – | ||||||||
| ♦ | For the year ended October 31, 2014, there were no transfers between Level 1 and Level 2. |
| Note: | For purposes of reporting transfers between different hierarchy levels, both transfers in and out of each level, as applicable, are shown as if they occurred at the beginning of the period. |
The accompanying notes are an integral part of these financial statements.
| 6 |
| The Hartford Checks and Balances Fund |
| Statement of Assets and Liabilities |
| October 31, 2014 |
| (000’s Omitted) |
| Assets: | ||||
| Investments in affiliated investment companies, at market value (cost $1,479,699) | $ | 1,896,100 | ||
| Receivables: | ||||
| Investment securities sold | 969 | |||
| Fund shares sold | 2,608 | |||
| Dividends | 1,176 | |||
| Other assets | 65 | |||
| Total assets | 1,900,918 | |||
| Liabilities: | ||||
| Payables: | ||||
| Investment securities purchased | 1,328 | |||
| Fund shares redeemed | 1,939 | |||
| Administrative fees | 1 | |||
| Distribution fees | 151 | |||
| Accrued expenses | 267 | |||
| Total liabilities | 3,686 | |||
| Net assets | $ | 1,897,232 | ||
| Summary of Net Assets: | ||||
| Capital stock and paid-in-capital | $ | 1,401,766 | ||
| Undistributed net investment income | 288 | |||
| Accumulated net realized gain | 78,777 | |||
| Unrealized appreciation of investments | 416,401 | |||
| Net assets | $ | 1,897,232 | ||
| Shares authorized | 1,000,000 | |||
| Par value | $ | 0.001 | ||
| Class A: Net asset value per share/Maximum offering price per share | $11.89/$12.58 | |||
| Shares outstanding | 118,150 | |||
| Net assets | $ | 1,404,632 | ||
| Class B: Net asset value per share | $ | 11.83 | ||
| Shares outstanding | 9,195 | |||
| Net assets | $ | 108,791 | ||
| Class C: Net asset value per share | $ | 11.83 | ||
| Shares outstanding | 28,299 | |||
| Net assets | $ | 334,810 | ||
| Class I: Net asset value per share | $ | 11.90 | ||
| Shares outstanding | 2,880 | |||
| Net assets | $ | 34,269 | ||
| Class R3: Net asset value per share | $ | 11.86 | ||
| Shares outstanding | 897 | |||
| Net assets | $ | 10,635 | ||
| Class R4: Net asset value per share | $ | 11.87 | ||
| Shares outstanding | 331 | |||
| Net assets | $ | 3,932 | ||
| Class R5: Net asset value per share | $ | 11.90 | ||
| Shares outstanding | 14 | |||
| Net assets | $ | 163 |
The accompanying notes are an integral part of these financial statements.
| 7 |
| The Hartford Checks and Balances Fund |
| Statement of Operations |
| For the Year Ended October 31, 2014 |
| (000’s Omitted) |
| Investment Income: | ||||
| Dividends from affiliated investment companies | $ | 30,542 | ||
| Total investment income | 30,542 | |||
| Expenses: | ||||
| Administrative services fees | ||||
| Class R3 | 21 | |||
| Class R4 | 3 | |||
| Class R5 | — | |||
| Transfer agent fees | ||||
| Class A | 1,437 | |||
| Class B | 178 | |||
| Class C | 329 | |||
| Class I | 30 | |||
| Class R3 | 1 | |||
| Class R4 | — | |||
| Class R5 | — | |||
| Distribution fees | ||||
| Class A | 3,451 | |||
| Class B | 1,143 | |||
| Class C | 3,219 | |||
| Class R3 | 54 | |||
| Class R4 | 5 | |||
| Custodian fees | — | |||
| Accounting services fees | 223 | |||
| Registration and filing fees | 147 | |||
| Board of Directors' fees | 50 | |||
| Audit fees | 22 | |||
| Other expenses | 276 | |||
| Total expenses | 10,589 | |||
| Net Investment Income | 19,953 | |||
| Net Realized Gain on Investments: | ||||
| Capital gain distributions received from affiliated investment companies | 60,842 | |||
| Net realized gain on investments in affiliated investment companies | 91,101 | |||
| Net Realized Gain on Investments | 151,943 | |||
| Net Changes in Unrealized Appreciation of Investments: | ||||
| Net unrealized appreciation of investments in affiliated investment companies | 19,284 | |||
| Net Changes in Unrealized Appreciation of Investments | 19,284 | |||
| Net Gain on Investments | 171,227 | |||
| Net Increase in Net Assets Resulting from Operations | $ | 191,180 |
The accompanying notes are an integral part of these financial statements.
| 8 |
| The Hartford Checks and Balances Fund |
| Statement of Changes in Net Assets |
| (000’s Omitted) |
| For the Year Ended October 31, 2014 | For the Year Ended October 31, 2013 | |||||||
| Operations: | ||||||||
| Net investment income | $ | 19,953 | $ | 23,596 | ||||
| Net realized gain on investments | 151,943 | 143,280 | ||||||
| Net unrealized appreciation of investments | 19,284 | 163,897 | ||||||
| Net Increase in Net Assets Resulting from Operations | 191,180 | 330,773 | ||||||
| Distributions to Shareholders: | ||||||||
| From net investment income | ||||||||
| Class A | (24,672 | ) | (21,517 | ) | ||||
| Class B | (444 | ) | (1,711 | ) | ||||
| Class C | (1,765 | ) | (4,229 | ) | ||||
| Class I | (689 | ) | (379 | ) | ||||
| Class R3 | (126 | ) | (181 | ) | ||||
| Class R4 | (34 | ) | (22 | ) | ||||
| Class R5 | (3 | ) | (2 | ) | ||||
| Total from net investment income | (27,733 | ) | (28,041 | ) | ||||
| From net realized gain on investments | ||||||||
| Class A | (98,305 | ) | (4,264 | ) | ||||
| Class B | (8,577 | ) | (386 | ) | ||||
| Class C | (22,727 | ) | (954 | ) | ||||
| Class I | (2,162 | ) | (71 | ) | ||||
| Class R3 | (784 | ) | (37 | ) | ||||
| Class R4 | (113 | ) | (5 | ) | ||||
| Class R5 | (10 | ) | — | |||||
| Total from net realized gain on investments | (132,678 | ) | (5,717 | ) | ||||
| Total distributions | (160,411 | ) | (33,758 | ) | ||||
| Capital Share Transactions: | ||||||||
| Class A | 29,180 | (146,673 | ) | |||||
| Class B | (10,857 | ) | (16,189 | ) | ||||
| Class C | 19,957 | (24,086 | ) | |||||
| Class I | 4,499 | 3,801 | ||||||
| Class R3 | (438 | ) | (1,741 | ) | ||||
| Class R4 | 2,345 | (77 | ) | |||||
| Class R5 | 17 | 3 | ||||||
| Net increase (decrease) from capital share transactions | 44,703 | (184,962 | ) | |||||
| Net Increase in Net Assets | 75,472 | 112,053 | ||||||
| Net Assets: | ||||||||
| Beginning of period | 1,821,760 | 1,709,707 | ||||||
| End of period | $ | 1,897,232 | $ | 1,821,760 | ||||
| Undistributed (distributions in excess of) net investment income | $ | 288 | $ | 5,336 | ||||
The accompanying notes are an integral part of these financial statements.
| 9 |
| The Hartford Checks and Balances Fund |
| Notes to Financial Statements |
| October 31, 2014 |
| (000’s Omitted) |
Organization:
The Hartford Mutual Funds, Inc. (“Company”) is an open-end management investment company comprised of forty-two portfolios. Financial statements for The Hartford Checks and Balances Fund (the "Fund"), a series of the Company, are included in this report.
The Company is organized under the laws of the State of Maryland and is registered with the Securities and Exchange Commission (“SEC”) under the Investment Company Act of 1940, as amended (“1940 Act”). The Fund is a diversified open-end management investment company. The Fund is an investment company and applies specialized accounting and reporting under Accounting Standards Codification Topic 946, Financial Services - Investment Companies.
Class A shares are sold with a front-end sales charge of up to 5.50%. Class B shares were sold with a contingent deferred sales charge which is assessed on the lesser of the per share net asset value (“NAV”) of the shares at the time of redemption or the original purchase price, and declines from up to 5.00% to zero depending on the period of time the shares are held (see note below regarding the closing of Class B shares). Class C shares are sold with a contingent deferred sales charge of up to 1.00% on shares redeemed within twelve months of purchase. Class I shares are sold without sales charges to certain eligible investors primarily through advisory fee-based wrap programs. Class R3, R4 and R5 shares, which are offered to employer-sponsored retirement plans, are sold without a sales charge. All classes of shares have identical voting, redemption, dividend, liquidation and other rights and the same terms and conditions, with the exceptions that each class may have different expenses, which may affect performance, and that Class B shares automatically convert to Class A shares after 8 years.
The Fund, as a “Fund of Funds,” seeks its investment goal through investment in Class Y shares of a combination of Hartford Funds (“Underlying Funds”): The Hartford Capital Appreciation Fund, The Hartford Dividend and Growth Fund and The Hartford Total Return Bond Fund. The Fund is managed by Hartford Funds Management Company, LLC (“HFMC”). HFMC is an indirect wholly owned subsidiary of The Hartford Financial Services Group, Inc. (“The Hartford”).
No new or additional investments are allowed in Class B shares of the Fund (including investments through any systematic investment plan). Existing shareholders of Class B shares may continue to hold their Class B shares, exchange their Class B shares for Class B shares of another Hartford Fund (as permitted by existing exchange privileges), or redeem their Class B shares as described in the Fund’s prospectus. Reinstatement privileges with respect to Class B shares are set forth in the Fund's prospectus. For investors electing to reinvest capital gains and dividends, any such capital gains or dividends on Class B shares will continue to be reinvested in Class B shares of the Fund. All Class B share attributes, including the 12b-1 fee, contingent deferred sales charge schedule, and conversion to Class A shares, remain unchanged.
Significant Accounting Policies:
The significant accounting policies of the Underlying Funds are outlined in the shareholder reports for such funds, available (1) without charge, upon request, by calling 888-843-7824, (2) on our website www.hartfordfunds.com and (3) on the SEC’s website at www.sec.gov. The reports may be reviewed and copied at the Commission’s Public Reference Room in Washington, DC. Information on the operation of the Public Reference Room may be obtained by calling 1-800-SEC-0330. The significant accounting policies of the Underlying Funds are not covered by this report.
The following is a summary of significant accounting policies of the Fund in the preparation of its financial statements, which are in accordance with United States generally accepted accounting principles (“U.S. GAAP”). The preparation of financial statements in accordance with U.S. GAAP may require management to make estimates and assumptions that affect the reported amounts of assets and liabilities and disclosure of contingent assets and liabilities at the date of the financial statements and the reported amounts of increases and decreases in net assets from operations during the reporting period. Actual results could differ from those estimates.
Determination of Net Asset Value – The NAV of each class of the Fund's shares is determined as of the close of regular trading (normally 4:00 p.m. Eastern Time) (the “NYSE Close”) on each day that the New York Stock Exchange (the “Exchange”) is open (“Valuation Date”). Information that becomes known to the Fund after the NAV has been calculated on a particular day will not generally be used to retroactively adjust the NAV determined earlier that day.
| 10 |
| The Hartford Checks and Balances Fund |
| Notes to Financial Statements – (continued) |
| October 31, 2014 |
| (000’s Omitted) |
Investment Valuation and Fair Value Measurements – Investments in open-end mutual funds are valued at the respective NAV of each Underlying Fund as determined as of the NYSE Close on the Valuation Date. The Fund generally uses market prices in valuing the remaining portfolio investments. If market prices are not readily available or are deemed unreliable, the Fund will use the fair value of the investment as determined in good faith under policies and procedures established by and under the supervision of the Company’s Board of Directors.
U.S. GAAP defines fair value as the price that the Fund would receive to sell an asset or pay to transfer a liability in an orderly transaction between market participants. The U.S. GAAP fair value measurement standards require disclosure of a fair value hierarchy for each major category of assets and liabilities. Various inputs are used in determining the fair value of the Fund’s investments. These inputs are summarized into three broad hierarchy levels. This hierarchy is based on whether the valuation inputs are observable or unobservable. These levels are:
Level 1 – Quoted prices in active markets for identical investments. Level 1 may include exchange traded instruments, such as domestic equities, some foreign equities, options, futures, mutual funds, exchange traded funds, rights and warrants.
Level 2 – Observable inputs other than Level 1 prices, such as quoted prices for similar investments; quoted prices in markets that are not active; or other inputs that are observable or can be corroborated by observable market data. Level 2 may include debt investments that are traded less frequently than exchange traded instruments and which are valued using independent pricing services; foreign equities, which are principally traded on certain foreign markets and are adjusted daily pursuant to a fair value pricing service in order to reflect an adjustment for the factors occurring after the close of certain foreign markets but before the NYSE Close; senior floating rate interests, which are valued using an aggregate of dealer bids; short-term investments, which are valued at amortized cost; and swaps, which are valued based upon the terms of each swap contract.
Level 3 – Significant unobservable inputs that are supported by limited or no market activity. Level 3 may include financial instruments whose values are determined using indicative market quotes or require significant management judgment or estimation. These unobservable valuation inputs may include estimates for current yields, maturity/duration, prepayment speed, and indicative market quotes for comparable investments along with other assumptions relating to credit quality, collateral value, complexity of the investment structure, general market conditions and liquidity. This category may include investments where trading has been halted or there are certain restrictions on trading. While these investments are priced using unobservable inputs, the valuation of these investments reflects the best available data and management believes the prices are a reasonable representation of exit price.
Valuation levels are not necessarily indicative of the risk associated with investing in such investments. Individual investments within any of the above mentioned asset classes may be assigned a different hierarchical level than those presented above, as individual circumstances dictate.
For additional information, refer to the Investment Valuation Hierarchy Level Summary which follows the Schedule of Investments.
Investment Transactions and Investment Income – Investment transactions are recorded as of the trade date (the date the order to buy or sell is executed) for financial reporting purposes. Realized gains and losses are determined on the basis of identified cost.
Dividend income is accrued on the ex-dividend date. Income and capital gain distributions from the Underlying Funds are accrued on the ex-dividend date.
Fund Share Valuation and Dividend Distributions to Shareholders – Orders for the Fund’s shares are executed in accordance with the investment instructions of the shareholders. The NAV of the Fund’s shares is determined as of the close of business on each business day of the Exchange. The NAV is determined separately for each class of shares of the Fund by dividing the Fund’s net assets attributable to that class by the number of shares of the class outstanding. Each class of shares offered by the Fund has equal rights as to assets and voting privileges (except that shareholders of a class have exclusive voting rights regarding any matter relating solely to that class of shares). Income and non-class specific expenses are allocated daily to each class on the basis of the relative net assets of the class. Realized and unrealized gains and losses are allocated daily based on the relative net assets of each class of shares of the Fund.
| 11 |
| The Hartford Checks and Balances Fund |
| Notes to Financial Statements – (continued) |
| October 31, 2014 |
| (000’s Omitted) |
Orders for the purchase of the Fund’s shares received prior to the close of the Exchange on any day the Exchange is open for business are priced at the NAV determined as of the close of the Exchange. Orders received after the close of the Exchange, or on a day on which the Exchange and/or the Fund is not open for business, are priced at the next determined NAV.
Dividends are declared pursuant to a policy adopted by the Company's Board of Directors based upon the investment performance of the Fund. The policy of the Fund is to pay dividends from net investment income, if any, quarterly and realized gains, if any, at least once a year. Long-term capital gain distributions are distributed by the Underlying Funds at least annually, when required. Unless shareholders specify otherwise, all dividends and distributions will be automatically reinvested in additional full or fractional shares of the Fund.
Net investment income, dividends and distributions from net realized gains and capital are determined in accordance with federal income tax regulations, which may differ from U.S. GAAP with respect to character and timing (see Federal Income Taxes: Distributions and Components of Distributable Earnings and Reclassification of Capital Accounts).
Principal Risks:
The Fund is exposed to the risks of the Underlying Funds in direct proportion to the amount of assets the Fund allocates to each Underlying Fund. The market values of the Underlying Funds may decline due to general market conditions which are not specifically related to a particular company in which the Underlying Fund invested, such as real or perceived adverse economic conditions, changes in the general outlook for corporate earnings, changes in interest or currency rates or adverse investor sentiment generally. The market value of equity securities in which the Underlying Funds invest may also decline due to factors which affect a particular industry or industries, such as labor shortages or increased production costs and competitive conditions within an industry.
Federal Income Taxes:
Federal Income Taxes – For federal income tax purposes, the Fund intends to continue to qualify as a Regulated Investment Company ("RIC") under Subchapter M of the Internal Revenue Code (“IRC”) by distributing substantially all of its taxable net investment income and net realized capital gains to its shareholders and otherwise complying with the requirements of the IRC. The Fund has distributed substantially all of its income and capital gains in prior years, if applicable, and intends to distribute substantially all of its income and capital gains during the calendar year ending December 31, 2014. Accordingly, no provision for federal income or excise taxes has been made in the accompanying financial statements. Distributions from short-term capital gains are treated as ordinary income distributions for federal income tax purposes.
Net Investment Income (Loss), Net Realized Gains (Losses) and Distributions – Net investment income (loss) and net realized gains (losses) may differ for financial statement and tax purposes primarily because of losses deferred due to wash sale adjustments and short-term capital gain adjustments. The character of distributions made during the year from net investment income or net realized gains may differ from their ultimate characterization for federal income tax purposes. Also, due to the timing of dividend distributions, the fiscal year in which amounts are distributed may differ from the year that the income or realized gains (losses) were recorded by the Fund.
Distributions and Components of Distributable Earnings – The tax character of distributions paid by the Fund for the periods indicated is as follows (as adjusted for dividends payable, if applicable):
| For the Year Ended October 31, 2014 | For the Year Ended October 31, 2013 | |||||||
| Ordinary Income | $ | 27,733 | $ | 28,041 | ||||
| Long-Term Capital Gains ‡ | 132,678 | 5,717 | ||||||
| ‡ | The Fund designates these distributions as long-term capital gain dividends pursuant to IRC Sec. 852(b)(3)(C). |
| 12 |
| The Hartford Checks and Balances Fund |
| Notes to Financial Statements – (continued) |
| October 31, 2014 |
| (000’s Omitted) |
As of October 31, 2014, the Fund’s components of distributable earnings (deficit) on a tax basis are as follows:
| Amount | ||||
| Undistributed Ordinary Income | $ | 288 | ||
| Undistributed Long-Term Capital Gain | 144,110 | |||
| Unrealized Appreciation* | 351,068 | |||
| Total Accumulated Earnings | $ | 495,466 | ||
| * | Differences between book-basis and tax-basis unrealized appreciation (depreciation) may be attributable to the losses deferred due to wash sale adjustments, foreign currency gains and losses, adjustments related to PFICs, REITs, RICs, certain derivatives and partnerships. |
Reclassification of Capital Accounts – The Fund may record reclassifications in its capital accounts. These reclassifications have no impact on the total net assets of the Fund. The reclassifications are a result of permanent differences between U.S. GAAP and tax accounting for such items as expiration or utilization of capital loss carryforwards or net operating losses. Adjustments are made to reflect the impact these items have on current and future distributions to shareholders. Therefore, the source of the Fund’s distributions may be shown in the accompanying Statement of Changes in Net Assets as from undistributed net investment income, from accumulated net realized gains on investments or from capital depending on the type of book and tax differences that exist. For the year ended October 31, 2014, the Fund recorded reclassifications to increase (decrease) the accounts listed below:
| Amount | ||||
| Undistributed Net Investment Income (Loss) | $ | 2,732 | ||
| Accumulated Net Realized Gain (Loss) | (2,732 | ) | ||
Capital Loss Carryforward – On December 22, 2010, the Regulated Investment Company Modernization Act of 2010 (the “Act”) was enacted, which made changes to the capital loss carryforward rules. The changes are effective for taxable years beginning after the date of enactment. Under the Act, funds are permitted to carry forward capital losses for an unlimited period. Additionally, capital loss carryforwards retain their character as either short-term or long-term capital losses rather than being considered all short-term as permitted under prior regulation.
The Fund had no capital loss carryforward for U.S. federal income tax purposes as of October 31, 2014.
Accounting for Uncertainty in Income Taxes – The Fund has adopted financial reporting rules that require the Fund to analyze all open tax years, as defined by the statute of limitations, for all major jurisdictions. Generally, tax authorities can examine all tax returns filed for the last three years. The Fund does not have an examination in progress.
The Fund has reviewed all open tax years and major jurisdictions and concluded that these financial reporting rules had no effect on the Fund’s financial position or results of operations. There is no tax liability resulting from unrecognized tax benefits relating to uncertain income tax positions taken or expected to be taken on the tax return for the fiscal year ended October 31, 2014. The Fund is also not aware of any tax positions for which it is reasonably possible that the total amounts of unrecognized tax benefits will significantly change in the next twelve months.
Expenses:
Investment Management Agreement – HFMC serves as the Fund’s investment manager pursuant to an Investment Management Agreement with the Company. The investment manager has overall investment supervisory responsibility for the Fund. In addition, the investment manager provides administrative personnel, services, equipment, facilities and office space for proper operation of the Fund. The Fund is managed by HFMC in accordance with the Fund’s investment objective and policies. The Fund does not currently pay any fees to HFMC for managing the Fund.
| 13 |
| The Hartford Checks and Balances Fund |
| Notes to Financial Statements – (continued) |
| October 31, 2014 |
| (000’s Omitted) |
Accounting Services Agreement – Pursuant to the Fund Accounting Agreement between HFMC and the Company, on behalf of the Fund, HFMC provides accounting services to the Fund and receives monthly compensation based on the Fund’s average daily net assets at the rates set forth below. The Fund’s accounting services fees are accrued daily and paid monthly.
| Average Daily Net Assets | Annual Fee |
| On first $5 billion | 0.012% |
| Over $5 billion | 0.010% |
Operating Expenses – Allocable expenses incurred by the Company are allocated to each Fund and allocated to classes within the Fund in proportion to the average daily net assets of the Fund and each class, except where allocation of certain expenses is more fairly made directly to the Fund or to specific classes within a Fund. As of October 31, 2014, HFMC contractually limited the total operating expenses of this Fund, exclusive of taxes, interest expense, brokerage commissions and extraordinary expenses, through February 28, 2015 as follows:
| Class A | Class B | Class C | Class I | Class R3 | Class R4 | Class R5 |
| 1.25% | 2.00% | 2.00% | 1.00% | 1.40% | 1.10% | 0.80% |
Contractual limitations for total operating expenses include expenses incurred as the result of investing in other investment companies including the Underlying Funds. Amounts incurred which exceed the above limits are deducted from expenses and are reported as expense waivers on the accompanying Statement of Operations, as applicable.
Distribution and Service Plan for Class A, B, C, R3 and R4 Shares – Hartford Funds Distributors, LLC ("HFD"), an indirect wholly owned subsidiary of The Hartford, is the principal underwriter and distributor of the Fund. HFD is engaged in distribution activities, which include marketing and distribution of shares through broker/dealers, financing distribution costs and maintaining financial books and records. For the year ended October 31, 2014, HFD received front-end load sales charges of $4,503 and contingent deferred sales charges of $77 from the Fund.
The Fund has adopted a Distribution and Service Plan in accordance with Rule 12b-1 of the 1940 Act to compensate the distributor (HFD) for activities intended to result in the sale and distribution of Class A, B, C, R3 and R4 shares and for providing services for shareholders. The Rule 12b-1 plan applicable to Class A shares of the Fund provides for payment of a Rule 12b-1 fee of 0.25% of average daily net assets. Some or all of the fee may be used for shareholder servicing expenses with the remainder used for distribution expenses. Under the Class B Plan, the Fund pays the distributor 1.00% of the average daily net assets of Class B shares that are outstanding for 8 years or less, 0.25% of which is a fee for services provided to existing shareholders with the remainder used for distribution expenses. Some or the entire Rule 12b-1 fee for Class B shares may be remitted to broker/dealers for distribution and/or shareholder account services. After eight years, Class B shares convert to Class A shares. Upon conversion to Class A shares, the Class A plan described above will apply to those shares. Under the Class C Plan, the Fund pays the distributor 1.00% of the average daily net assets of Class C shares outstanding, 0.25% of which is intended as a fee for services provided to existing shareholders with the remainder used for distribution expenses. For Class C shares, some or the entire fee may be remitted to broker/dealers for distribution and/or shareholder account services. Class R3 shares have a distribution fee of 0.50% of average daily net assets and Class R4 shares have a distribution fee of 0.25% of average daily net assets. For Class R3 and R4 shares, some or the entire fee may be remitted to broker/dealers for distribution and/or shareholder account services. The Fund’s 12b-1 fees are accrued daily and paid monthly or at such other intervals as the Board of Directors may determine.
Other Related Party Transactions – Certain officers of the Fund are directors and/or officers of HFMC and/or The Hartford or its subsidiaries. For the year ended October 31, 2014, a portion of the Fund’s Chief Compliance Officer’s compensation was paid by all of the investment companies in the Hartford fund complex. The portion allocated to the Fund, as represented in other expenses on the Statement of Operations, was in the amount of $3. Hartford Administrative Services Company (“HASCO”), an indirect wholly-owned subsidiary of The Hartford, provides transfer agent services to the Fund. HASCO has contractually agreed to reimburse any portion of the transfer agency fees over 0.30% of average daily net assets per fiscal year for each class. Any transfer agency fee reimbursement is determined before considering the contractual operating expense limitation. For providing such services, HASCO is
| 14 |
| The Hartford Checks and Balances Fund |
| Notes to Financial Statements – (continued) |
| October 31, 2014 |
| (000’s Omitted) |
compensated on a per account basis that varies by account type. The amount paid to HASCO and any related contractual reimbursement amounts, if applicable, can be found in the Statement of Operations. These fees are accrued daily and paid monthly.
Administrative services fees are paid to HASCO for third-party recordkeeping services that are payable as a percentage of net assets in the amount of up to 0.20%, 0.15% and 0.10% for Classes R3, R4 and R5 shares, respectively. The total administrative services fees are shown on the Statement of Operations. These fees are accrued daily and paid monthly.
Affiliate Holdings:
As of October 31, 2014, affiliates of The Hartford had ownership of shares in the Fund as follows:
| Percentage of Class | Percentage of Fund | |||||||
| Class R5 | 98 | % | — | %* | ||||
| * | Percentage rounds to zero. |
Investment Transactions:
For the year ended October 31, 2014, the cost of purchases and proceeds from sales of investment securities (excluding short-term investments) were as follows:
| Excluding U.S. Government Obligations | U.S. Government Obligations | Total | ||||||||||
| Cost of Purchases | $ | 286,006 | $ | — | $ | 286,006 | ||||||
| Sales Proceeds | 321,372 | — | 321,372 | |||||||||
| 15 |
| The Hartford Checks and Balances Fund |
| Notes to Financial Statements – (continued) |
| October 31, 2014 |
| (000’s Omitted) |
Capital Share Transactions:
The following information is for the year ended October 31, 2014, and the year ended October 31, 2013:
| For the Year Ended October 31, 2014 | For the Year Ended October 31, 2013 | |||||||||||||||||||||||||||||||
| Shares Sold | Shares
Issued for Reinvested Dividends | Shares Redeemed | Net
Increase (Decrease) of Shares | Shares Sold | Shares
Issued for Reinvested Dividends | Shares Redeemed | Net
Increase (Decrease) of Shares | |||||||||||||||||||||||||
| Class A | ||||||||||||||||||||||||||||||||
| Shares | 12,125 | 11,017 | (20,222 | ) | 2,920 | 10,858 | 2,567 | (26,934 | ) | (13,509 | ) | |||||||||||||||||||||
| Amount | $ | 140,091 | $ | 122,198 | $ | (233,109 | ) | $ | 29,180 | $ | 116,579 | $ | 25,519 | $ | (288,771 | ) | $ | (146,673 | ) | |||||||||||||
| Class B | ||||||||||||||||||||||||||||||||
| Shares | 59 | 812 | (1,779 | ) | (908 | ) | 145 | 206 | (1,852 | ) | (1,501 | ) | ||||||||||||||||||||
| Amount | $ | 676 | $ | 8,860 | $ | (20,393 | ) | $ | (10,857 | ) | $ | 1,557 | $ | 2,040 | $ | (19,786 | ) | $ | (16,189 | ) | ||||||||||||
| Class C | ||||||||||||||||||||||||||||||||
| Shares | 3,552 | 2,175 | (3,894 | ) | 1,833 | 2,579 | 502 | (5,354 | ) | (2,273 | ) | |||||||||||||||||||||
| Amount | $ | 40,804 | $ | 23,779 | $ | (44,626 | ) | $ | 19,957 | $ | 27,773 | $ | 4,975 | $ | (56,834 | ) | $ | (24,086 | ) | |||||||||||||
| Class I | ||||||||||||||||||||||||||||||||
| Shares | 1,111 | 205 | (923 | ) | 393 | 986 | 35 | (675 | ) | 346 | ||||||||||||||||||||||
| Amount | $ | 12,828 | $ | 2,287 | $ | (10,616 | ) | $ | 4,499 | $ | 10,717 | $ | 345 | $ | (7,261 | ) | $ | 3,801 | ||||||||||||||
| Class R3 | ||||||||||||||||||||||||||||||||
| Shares | 237 | 83 | (353 | ) | (33 | ) | 279 | 22 | (458 | ) | (157 | ) | ||||||||||||||||||||
| Amount | $ | 2,740 | $ | 910 | $ | (4,088 | ) | $ | (438 | ) | $ | 3,018 | $ | 218 | $ | (4,977 | ) | $ | (1,741 | ) | ||||||||||||
| Class R4 | ||||||||||||||||||||||||||||||||
| Shares | 260 | 13 | (73 | ) | 200 | 42 | 3 | (53 | ) | (8 | ) | |||||||||||||||||||||
| Amount | $ | 3,043 | $ | 147 | $ | (845 | ) | $ | 2,345 | $ | 450 | $ | 27 | $ | (554 | ) | $ | (77 | ) | |||||||||||||
| Class R5 | ||||||||||||||||||||||||||||||||
| Shares | 1 | 1 | — | 2 | — | — | — | — | ||||||||||||||||||||||||
| Amount | $ | 4 | $ | 13 | $ | — | $ | 17 | $ | 1 | $ | 2 | $ | — | $ | 3 | ||||||||||||||||
| Total | ||||||||||||||||||||||||||||||||
| Shares | 17,345 | 14,306 | (27,244 | ) | 4,407 | 14,889 | 3,335 | (35,326 | ) | (17,102 | ) | |||||||||||||||||||||
| Amount | $ | 200,186 | $ | 158,194 | $ | (313,677 | ) | $ | 44,703 | $ | 160,095 | $ | 33,126 | $ | (378,183 | ) | $ | (184,962 | ) | |||||||||||||
The following reflects the conversion of Class B shares into Class A shares (reflected as Class A shares sold) for the year ended October 31, 2014, and the year ended October 31, 2013:
| Shares | Dollars | |||||||
| For the Year Ended October 31, 2014 | 37 | $ | 429 | |||||
| For the Year Ended October 31, 2013 | 44 | $ | 485 | |||||
Line of Credit:
The Fund is one of several Hartford Funds that participate in a $500 million committed revolving line of credit facility. The facility is to be used for temporary or emergency purposes. Under the arrangement, the funds are required to own securities having a market value in excess of 300% of the total bank borrowings. The interest rate on borrowings varies depending on the nature of the loan. The facility also requires a fee to be paid based on the amount of the commitment. This commitment fee is allocated to all the funds participating in the line of credit based on the average net assets of the funds. During the year ended October 31, 2014, the Fund did not have any borrowings under this facility.
Pending Legal Proceedings:
On February 25, 2011, Jennifer L. Kasilag, Louis Mellinger, Judith M. Menendez, Jacqueline M. Robinson, and Linda A. Russell filed a derivative lawsuit against Hartford Investment Financial Services, LLC (“HIFSCO”) (now known as HFD) on behalf of six Hartford retail mutual funds in the United States District Court for the District of New Jersey, alleging that HIFSCO received excessive advisory and distribution fees in violation of its statutory fiduciary duty under Section 36(b) of the 1940 Act when serving as investment manager and principal underwriter, respectively, to the Hartford retail mutual funds. Although this action was purportedly filed on behalf of certain of the Hartford Funds, none of the Hartford Funds is itself a defendant to the suit. HIFSCO moved to dismiss and, in September 2011, the motion was granted in part and denied in part, with leave to amend the complaint. In November 2011, plaintiffs filed an amended complaint on
| 16 |
| The Hartford Checks and Balances Fund |
| Notes to Financial Statements – (continued) |
| October 31, 2014 |
| (000’s Omitted) |
behalf of certain Hartford retail mutual funds, The Hartford Global Health Fund (now known as The Hartford Healthcare Fund), The Hartford Conservative Allocation Fund, The Hartford Growth Opportunities Fund, The Hartford Inflation Plus Fund, The Hartford Advisers Fund (now known as The Hartford Balanced Fund), and The Hartford Capital Appreciation Fund. Plaintiffs seek to rescind the investment management agreements and distribution plans between HIFSCO and these funds and to recover the total fees charged thereunder or, in the alternative, to recover any improper compensation HIFSCO received, in addition to lost earnings. HIFSCO filed a partial motion to dismiss the amended complaint and, in December 2012, the court dismissed without prejudice the claims regarding distribution fees and denied the motion with respect to the advisory fees claims. HIFSCO disputes the allegations and intends to defend vigorously.
In March 2014, the plaintiffs filed a new complaint that added as new plaintiffs The Hartford Floating Rate Fund and The Hartford Small Company Fund and named as a defendant HFMC, which assumed the role as investment manager to the funds as of January 2013. HFMC and HIFSCO dispute the allegations and intend to defend vigorously.
No accrual for litigation relating to this matter has been recorded in the financial statements of the Fund because the Fund is not party to the suit.
Indemnifications:
Under the Company's organizational documents, the Company shall indemnify its officers and directors to the full extent required or permitted under Maryland General Corporation Law and the federal securities laws. In addition, the Company, on behalf of the Fund, may enter into contracts that contain a variety of indemnifications. The Company's maximum exposure under these arrangements is unknown. However, as of the date of these financial statements, the Company has not had prior claims or losses pursuant to these contracts and expects the risk of loss to be remote.
Subsequent Event:
Effective December 1, 2014, pursuant to a sub-transfer agency agreement between HASCO and Boston Financial Data Services, Inc. (“BFDS”), HASCO has delegated certain transfer agent, dividend disbursing agent and shareholder servicing agent functions to BFDS. The costs and expenses of such delegation are borne by HASCO, not by the Fund.
| 17 |
| The Hartford Checks and Balances Fund |
| Financial Highlights |
| - Selected Per-Share Data - (A) | - Ratios and Supplemental Data - | |||||||||||||||||||||||||||||||||||||||||||||||||||
| Class | Net
Asset Value at Beginning of Period | Net Investment Income (Loss) | Net Realized and Unrealized Gain (Loss) on Invest- ments | Total
from Investment Operations | Dividends from Net Investment Income | Distribu- tions from Realized Capital Gains | Total Dividends and Distributions | Net Asset Value at End of Period | Total Return(B) | Net
Assets at End of Period (000's) | Ratio
of Expenses to Average Net Assets Before Adjust- ments(C),(D) | Ratio
of Expenses to Average Net Assets After Adjust- ments(C),(D) | Ratio
of Net Investment Income (Loss) to Average Net Assets(D) | |||||||||||||||||||||||||||||||||||||||
| For the Year Ended October 31, 2014 | ||||||||||||||||||||||||||||||||||||||||||||||||||||
| A | $ | 11.75 | $ | 0.14 | $ | 1.07 | $ | 1.21 | $ | (0.21 | ) | $ | (0.86 | ) | $ | (1.07 | ) | $ | 11.89 | 11.07 | % | $ | 1,404,632 | 0.39 | % | 0.39 | % | 1.25 | % | |||||||||||||||||||||||
| B | 11.64 | 0.05 | 1.05 | 1.10 | (0.05 | ) | (0.86 | ) | (0.91 | ) | 11.83 | 10.09 | 108,791 | 1.19 | 1.19 | 0.46 | ||||||||||||||||||||||||||||||||||||
| C | 11.65 | 0.06 | 1.04 | 1.10 | (0.06 | ) | (0.86 | ) | (0.92 | ) | 11.83 | 10.17 | 334,810 | 1.14 | 1.14 | 0.50 | ||||||||||||||||||||||||||||||||||||
| I | 11.78 | 0.18 | 1.06 | 1.24 | (0.26 | ) | (0.86 | ) | (1.12 | ) | 11.90 | 11.35 | 34,269 | 0.14 | 0.14 | 1.53 | ||||||||||||||||||||||||||||||||||||
| R3 | 11.69 | 0.10 | 1.06 | 1.16 | (0.13 | ) | (0.86 | ) | (0.99 | ) | 11.86 | 10.70 | 10,635 | 0.75 | 0.75 | 0.88 | ||||||||||||||||||||||||||||||||||||
| R4 | 11.73 | 0.13 | 1.07 | 1.20 | (0.20 | ) | (0.86 | ) | (1.06 | ) | 11.87 | 11.06 | 3,932 | 0.45 | 0.45 | 1.14 | ||||||||||||||||||||||||||||||||||||
| R5 | 11.78 | 0.17 | 1.07 | 1.24 | (0.26 | ) | (0.86 | ) | (1.12 | ) | 11.90 | 11.34 | 163 | 0.15 | 0.15 | 1.48 | ||||||||||||||||||||||||||||||||||||
| For the Year Ended October 31, 2013 | ||||||||||||||||||||||||||||||||||||||||||||||||||||
| A | $ | 9.92 | $ | 0.16 | $ | 1.88 | $ | 2.04 | $ | (0.18 | ) | $ | (0.03 | ) | $ | (0.21 | ) | $ | 11.75 | 20.89 | % | $ | 1,354,101 | 0.41 | % | 0.41 | % | 1.51 | % | |||||||||||||||||||||||
| B | 9.88 | 0.08 | 1.86 | 1.94 | (0.15 | ) | (0.03 | ) | (0.18 | ) | 11.64 | 20.01 | 117,550 | 1.21 | 1.21 | 0.72 | ||||||||||||||||||||||||||||||||||||
| C | 9.89 | 0.08 | 1.87 | 1.95 | (0.16 | ) | (0.03 | ) | (0.19 | ) | 11.65 | 20.00 | 308,250 | 1.16 | 1.16 | 0.76 | ||||||||||||||||||||||||||||||||||||
| I | 9.93 | 0.18 | 1.88 | 2.06 | (0.18 | ) | (0.03 | ) | (0.21 | ) | 11.78 | 21.15 | 29,305 | 0.15 | 0.15 | 1.70 | ||||||||||||||||||||||||||||||||||||
| R3 | 9.90 | 0.13 | 1.86 | 1.99 | (0.17 | ) | (0.03 | ) | (0.20 | ) | 11.69 | 20.43 | 10,875 | 0.75 | 0.75 | 1.19 | ||||||||||||||||||||||||||||||||||||
| R4 | 9.91 | 0.16 | 1.86 | 2.02 | (0.17 | ) | (0.03 | ) | (0.20 | ) | 11.73 | 20.79 | 1,535 | 0.46 | 0.46 | 1.46 | ||||||||||||||||||||||||||||||||||||
| R5 | 9.93 | 0.19 | 1.87 | 2.06 | (0.18 | ) | (0.03 | ) | (0.21 | ) | 11.78 | 21.16 | 144 | 0.15 | 0.15 | 1.74 | ||||||||||||||||||||||||||||||||||||
| For the Year Ended October 31, 2012 (E) | ||||||||||||||||||||||||||||||||||||||||||||||||||||
| A | $ | 9.22 | $ | 0.20 | $ | 0.74 | $ | 0.94 | $ | (0.20 | ) | $ | (0.04 | ) | $ | (0.24 | ) | $ | 9.92 | 10.43 | % | $ | 1,277,312 | 0.41 | % | 0.41 | % | 2.15 | % | |||||||||||||||||||||||
| B | 9.19 | 0.13 | 0.72 | 0.85 | (0.12 | ) | (0.04 | ) | (0.16 | ) | 9.88 | 9.45 | 114,693 | 1.22 | 1.22 | 1.35 | ||||||||||||||||||||||||||||||||||||
| C | 9.19 | 0.13 | 0.74 | 0.87 | (0.13 | ) | (0.04 | ) | (0.17 | ) | 9.89 | 9.63 | 284,190 | 1.16 | 1.16 | 1.41 | ||||||||||||||||||||||||||||||||||||
| I | 9.23 | 0.23 | 0.74 | 0.97 | (0.23 | ) | (0.04 | ) | (0.27 | ) | 9.93 | 10.70 | 21,254 | 0.16 | 0.16 | 2.38 | ||||||||||||||||||||||||||||||||||||
| R3 | 9.20 | 0.17 | 0.74 | 0.91 | (0.17 | ) | (0.04 | ) | (0.21 | ) | 9.90 | 10.08 | 10,764 | 0.76 | 0.76 | 1.71 | ||||||||||||||||||||||||||||||||||||
| R4 | 9.22 | 0.20 | 0.73 | 0.93 | (0.20 | ) | (0.04 | ) | (0.24 | ) | 9.91 | 10.29 | 1,375 | 0.47 | 0.47 | 1.92 | ||||||||||||||||||||||||||||||||||||
| R5 | 9.23 | 0.23 | 0.74 | 0.97 | (0.23 | ) | (0.04 | ) | (0.27 | ) | 9.93 | 10.70 | 119 | 0.16 | 0.16 | 2.37 | ||||||||||||||||||||||||||||||||||||
| For the Year Ended October 31, 2011 (E) | ||||||||||||||||||||||||||||||||||||||||||||||||||||
| A | $ | 9.22 | $ | 0.13 | $ | – | $ | 0.13 | $ | (0.13 | ) | $ | – | $ | (0.13 | ) | $ | 9.22 | 1.44 | % | $ | 1,337,009 | 0.41 | % | 0.41 | % | 1.36 | % | ||||||||||||||||||||||||
| B | 9.18 | 0.05 | 0.02 | 0.07 | (0.06 | ) | – | (0.06 | ) | 9.19 | 0.71 | 123,183 | 1.21 | 1.21 | 0.55 | |||||||||||||||||||||||||||||||||||||
| C | 9.19 | 0.06 | – | 0.06 | (0.06 | ) | – | (0.06 | ) | 9.19 | 0.66 | 310,632 | 1.16 | 1.16 | 0.61 | |||||||||||||||||||||||||||||||||||||
| I | 9.22 | 0.15 | 0.02 | 0.17 | (0.16 | ) | – | (0.16 | ) | 9.23 | 1.81 | 19,854 | 0.15 | 0.15 | 1.61 | |||||||||||||||||||||||||||||||||||||
| R3 | 9.21 | 0.10 | – | 0.10 | (0.11 | ) | – | (0.11 | ) | 9.20 | 1.05 | 9,211 | 0.76 | 0.76 | 1.00 | |||||||||||||||||||||||||||||||||||||
| R4 | 9.21 | 0.12 | 0.02 | 0.14 | (0.13 | ) | – | (0.13 | ) | 9.22 | 1.53 | 822 | 0.47 | 0.46 | 1.29 | |||||||||||||||||||||||||||||||||||||
| R5 | 9.22 | 0.15 | 0.02 | 0.17 | (0.16 | ) | – | (0.16 | ) | 9.23 | 1.83 | 107 | 0.15 | 0.15 | 1.62 | |||||||||||||||||||||||||||||||||||||
See Portfolio Turnover information on the next page.
| 18 |
| The Hartford Checks and Balances Fund |
| Financial Highlights – (continued) |
| - Selected Per-Share Data - (A) | - Ratios and Supplemental Data - | |||||||||||||||||||||||||||||||||||||||||||||||||||
| Class | Net
Asset Value at Beginning of Period | Net Investment Income (Loss) | Net Realized and Unrealized Gain (Loss) on Invest- ments | Total
from Investment Operations | Dividends from Net Investment Income | Distribu- tions from Realized Capital Gains | Total Dividends and Distributions | Net Asset Value at End of Period | Total Return(B) | Net
Assets at End of Period (000's) | Ratio
of Expenses to Average Net Assets Before Adjust- ments(C),(D) | Ratio
of Expenses to Average Net Assets After Adjust- ments(C),(D) | Ratio
of Net Investment Income (Loss) to Average Net Assets(D) | |||||||||||||||||||||||||||||||||||||||
| For the Year Ended October 31, 2010 | ||||||||||||||||||||||||||||||||||||||||||||||||||||
| A | $ | 8.29 | $ | 0.13 | $ | 0.93 | $ | 1.06 | $ | (0.13 | ) | $ | – | $ | (0.13 | ) | $ | 9.22 | 12.85 | % | $ | 1,429,438 | 0.42 | % | 0.42 | % | 1.51 | % | ||||||||||||||||||||||||
| B | 8.26 | 0.06 | 0.92 | 0.98 | (0.06 | ) | – | (0.06 | ) | 9.18 | 11.87 | 143,627 | 1.23 | 1.23 | 0.69 | |||||||||||||||||||||||||||||||||||||
| C | 8.26 | 0.07 | 0.92 | 0.99 | (0.06 | ) | – | (0.06 | ) | 9.19 | 12.06 | 355,504 | 1.16 | 1.16 | 0.75 | |||||||||||||||||||||||||||||||||||||
| I | 8.29 | 0.15 | 0.93 | 1.08 | (0.15 | ) | – | (0.15 | ) | 9.22 | 13.09 | 21,297 | 0.17 | 0.17 | 1.75 | |||||||||||||||||||||||||||||||||||||
| R3 | 8.29 | 0.10 | 0.92 | 1.02 | (0.10 | ) | – | (0.10 | ) | 9.21 | 12.40 | 2,206 | 0.81 | 0.78 | 1.15 | |||||||||||||||||||||||||||||||||||||
| R4 | 8.29 | 0.14 | 0.91 | 1.05 | (0.13 | ) | – | (0.13 | ) | 9.21 | 12.76 | 241 | 0.50 | 0.47 | 1.75 | |||||||||||||||||||||||||||||||||||||
| R5 | 8.29 | 0.16 | 0.92 | 1.08 | (0.15 | ) | – | (0.15 | ) | 9.22 | 13.13 | 115 | 0.16 | 0.15 | 1.76 | |||||||||||||||||||||||||||||||||||||
| (A) | Information presented relates to a share outstanding throughout the indicated period. Net investment income (loss) per share amounts are calculated based on average shares outstanding unless otherwise noted. |
| (B) | Assumes initial investment at net asset value at the beginning of each period, reinvestment of all distributions, the complete redemption of the investment at net asset value at the end of each period and no sales charge. Total return would be reduced if sales charges were taken into account. |
| (C) | Adjustments include waivers and reimbursements, if applicable. |
| (D) | Ratios do not include expenses of the Underlying Funds. |
| (E) | Net investment income (loss) per share amounts have been calculated using the SEC method. |
| Portfolio Turnover Rate for All Share Classes | ||||
| For the Year Ended October 31, 2014 | 15 | % | ||
| For the Year Ended October 31, 2013 | 12 | |||
| For the Year Ended October 31, 2012 | 12 | |||
| For the Year Ended October 31, 2011 | 19 | |||
| For the Year Ended October 31, 2010 | 19 | |||
| 19 |
| Report of Independent Registered Public Accounting Firm |
The Board of Directors and Shareholders of The Hartford Mutual Funds, Inc. |
We have audited the accompanying statement of assets and liabilities, including the schedule of investments, of The Hartford Checks and Balances Fund (one of the portfolios constituting The Hartford Mutual Funds, Inc. (the Funds)) as of October 31, 2014, and the related statement of operations for the year then ended, the statements of changes in net assets for each of the two years in the period then ended, and the financial highlights for each of the five years in the period then ended. These financial statements and financial highlights are the responsibility of the Funds’ management. Our responsibility is to express an opinion on these financial statements and financial highlights based on our audits.
We conducted our audits in accordance with the standards of the Public Company Accounting Oversight Board (United States). Those standards require that we plan and perform the audit to obtain reasonable assurance about whether the financial statements and financial highlights are free of material misstatement. We were not engaged to perform an audit of the Funds’ internal control over financial reporting. Our audits included consideration of internal control over financial reporting as a basis for designing audit procedures that are appropriate in the circumstances, but not for the purpose of expressing an opinion on the effectiveness of the Funds’ internal control over financial reporting. Accordingly, we express no such opinion. An audit also includes examining, on a test basis, evidence supporting the amounts and disclosures in the financial statements and financial highlights, assessing the accounting principles used and significant estimates made by management, and evaluating the overall financial statement presentation. Our procedures included confirmation of securities owned as of October 31, 2014, by correspondence with the custodian and brokers or by other appropriate auditing procedures where replies from brokers were not received. We believe that our audits provide a reasonable basis for our opinion.
In our opinion, the financial statements and financial highlights referred to above present fairly, in all material respects, the financial position of The Hartford Checks and Balances Fund of The Hartford Mutual Funds, Inc. at October 31, 2014, the results of its operations for the year then ended, the changes in its net assets for each of the two years in the period then ended, and the financial highlights for each of the five years in the period then ended, in conformity with U.S. generally accepted accounting principles.
|
Minneapolis, Minnesota
December 18, 2014
| 20 |
| The Hartford Checks and Balances Fund |
| Directors and Officers (Unaudited) |
The Board of Directors of the Company (the "Directors") appoints officers who are responsible for the day-to-day operations of the Fund and who execute policies formulated by the Directors. Each Director serves until his or her death, resignation, or retirement or until the next annual meeting of shareholders is held or until his or her successor is elected and qualifies.
Directors and officers who are employed by or who have a financial interest in The Hartford Financial Services Group, Inc. ("The Hartford") are considered “interested” persons of the Fund pursuant to the 1940 Act. Each officer and two of the Company's Directors, as noted in the chart below, are “interested” persons of the Fund. Each Director serves as a director for The Hartford Mutual Funds, Inc., The Hartford Mutual Funds II, Inc., Hartford Series Fund, Inc., and Hartford HLS Series Fund II, Inc., and as a trustee for The Hartford Alternative Strategies Fund, which, as of October 31, 2014, collectively consist of 66 funds. Correspondence may be sent to Directors and officers c/o Hartford Funds, 5 Radnor Corporate Center, Suite 300, 100 Matsonford Road, Radnor, Pennsylvania 19087, except that correspondence to Mr. Annoni, Mr. Dressen and Ms. Quade may be sent to 500 Bielenberg Drive, Suite 500, Woodbury, Minnesota 55125.
The table below sets forth, for each Director and officer, his or her name, year of birth, current position with the Company and date first elected or appointed to The Hartford Mutual Funds, Inc. ("MF") and The Hartford Mutual Funds II, Inc. ("MF2"), principal occupation, and, for Directors, other directorships held. The Fund’s Statement of Additional Information contains further information on the Directors and is available free of charge by calling 1-888-843-7824 or writing to: Hartford Funds, P.O. Box 55022, Boston, MA 02205-5022.
Information on the aggregate remuneration paid to the directors of the Company can be found in the Statement of Operations herein. The Fund pays to The Hartford a portion of the Chief Compliance Officer’s compensation, but does not pay salaries or compensation to any of its other officers or Directors who are employed by The Hartford.
Non-Interested Directors
Hilary E. Ackermann (1956) Director since September 23, 2014
Ms. Ackermann served as Chief Risk Officer at Goldman Sachs Bank USA from October 2008 to November 2011 and serves as a Director of Dynegy, Inc., an independent power company, from October 2012 to present.
Lynn S. Birdsong (1946) Director since 2003, Chairman of the Investment Committee since 2014
Mr. Birdsong is a private investor. Mr. Birdsong currently serves as a Director of the Sovereign High Yield Investment Company (April 2010 to current). Mr. Birdsong currently serves as an Independent Director of Nomura Partners Funds, Inc. (formerly, The Japan Fund) (April 2003 to current). From 2003 to March 2005, Mr. Birdsong was an Independent Director of the Atlantic Whitehall Funds. From 1979 to 2002, Mr. Birdsong was a Managing Director of Zurich Scudder Investments, an investment management firm. During his employment with Scudder, Mr. Birdsong was an Interested Director of The Japan Fund. From January 1981 through December 2013, Mr. Birdsong was a partner in Birdsong Company, an advertising specialty firm.
Robert M. Gavin, Jr. (1940) Director since 2002 (MF) and 1986 (MF2), Chairman of the Board for each since 2004
Dr. Gavin is an educational consultant. Prior to September 1, 2001, he was President of Cranbrook Education Community and prior to July 1996, he was President of Macalester College, St. Paul, Minnesota.
Duane E. Hill (1945) Director since 2001 (MF) and 2002 (MF2), Chairman of the Nominating Committee since 2003
Mr. Hill is a Partner of TSG Ventures L.P., a private equity investment company. Mr. Hill is a former partner of TSG Capital Group, a private equity investment firm that served as sponsor and lead investor in leveraged buyouts of middle market companies.
Sandra S. Jaffee (1941) Director since 2005
Ms. Jaffee is the founder and Chief Executive Officer of a private company, Homeworks Concierge, LLC, which provides residential property management services in Westchester County, New York (January 2012 to present). Ms. Jaffee served as Chairman (2008 to 2009) and Chief Executive Officer of Fortent (formerly Searchspace Group), a leading provider of compliance/regulatory technology to financial institutions from August 2005 to August 2009. From August 2004 to August 2005, Ms. Jaffee served as an Entrepreneur in Residence with Warburg Pincus, a private equity firm. Prior to joining Warburg Pincus, Ms. Jaffee served as Executive Vice President at Citigroup, from September 1995 to July 2004, where she was President and Chief Executive Officer of Citibank’s Global Securities Services (1995 to 2003). Ms. Jaffee currently serves as a member of the Board of Directors of Broadridge Financial Solutions as well as a Trustee of Muhlenberg College.
| 21 |
| The Hartford Checks and Balances Fund |
| Directors and Officers (Unaudited) – (continued) |
William P. Johnston (1944) Director since 2005, Chairman of the Compliance Committee since 2005
In June 2006, Mr. Johnston was appointed as Senior Advisor to The Carlyle Group, a global private equity and other alternative asset investment firm and currently serves as an Operating Executive. In July 2006, Mr. Johnston was elected to the Board of Directors of MultiPlan, Inc. and served as a Director (July 2006 to August 2010). In August 2007, Mr. Johnston was elected to the Board of Directors of LifeCare Holdings, Inc. and served as a Director (August 2007 to June 2013). In February 2008, Mr. Johnston was elected to the Board of Directors of HCR-ManorCare, Inc. In May 2006, Mr. Johnston was elected to the Supervisory Board of Fresenius Medical Care AG & Co. KGaA, after its acquisition of Renal Care Group, Inc. in March 2006. Mr. Johnston joined Renal Care Group in November 2002 as a member of the Board of Directors and served as Chairman of the Board from March 2003 through March 2006. From 2002 through 2013, Mr. Johnston served as a Board member of the Georgia O’Keefe Museum. From September 1987 to December 2002, Mr. Johnston was with Equitable Securities Corporation (and its successors, SunTrust Equitable Securities and SunTrust Robinson Humphrey) serving in various investment banking and managerial positions, including Managing Director and Head of Investment Banking, Chief Executive Officer and Vice Chairman.
Phillip O. Peterson (1944) Director since 2002 (MF) and 2000 (MF2), Chairman of the Audit Committee since 2002
Mr. Peterson is a mutual fund industry consultant. He was a partner of KPMG LLP (an accounting firm) until July 1999. Mr. Peterson joined William Blair Funds in February 2007 as a member of the Board of Trustees. From February 2012 to February 2014, Mr. Peterson served as a Trustee of Symetra Variable Mutual Funds. From January 2004 to April 2005, Mr. Peterson served as Independent President of the Strong Mutual Funds.
Lemma W. Senbet (1946) Director since 2005
Dr. Senbet is the William E. Mayer Chair Professor of Finance and Founding Director, Center for Financial Policy, at the University of Maryland, Robert H. Smith School of Business. He was chair of the Finance Department of the University of Maryland, Robert H. Smith School of Business from 1998 to 2006. Since June 2013, he has been on leave from the University to serve as Executive Director of African Economic Research Consortium which focuses on economic policy research and training. Previously, he was a chaired professor of finance at the University of Wisconsin-Madison. Also, he was a Director of the Fortis Funds from March 2000 to July 2002. Dr. Senbet served as Director of the American Finance Association and President of the Western Finance Association. In 2006, Dr. Senbet was inducted Fellow of Financial Management Association International for his career-long distinguished scholarship and professional service.
Interested Directors and Officers
James E. Davey (1964) Director since 2012, President and Chief Executive Officer since 2010
Mr. Davey serves as Executive Vice President of Hartford Life Insurance Company (“HLIC”) and The Hartford. Additionally, Mr. Davey serves as Chairman of the Board, Manager and Senior Managing Director of Hartford Funds Distributors, LLC (“HFD”). He also currently serves as Director, Chairman of the Board, President and Senior Managing Director of Hartford Administrative Services Company (“HASCO”). Mr. Davey also serves as Manager, Chairman of the Board and Senior Managing Director for Hartford Funds Management Company, LLC (“HFMC”) and Director, Chairman of the Board and Senior Managing Director for Hartford Funds Management Group, Inc. ("HFMG"). Mr. Davey has served in various positions within The Hartford and its subsidiaries in connection with the operation of the Hartford Funds. Mr. Davey joined The Hartford in 2002.
Lowndes A. Smith* (1939) Director since 1996 (MF) and 2002 (MF2)
Mr. Smith served as Vice Chairman of The Hartford from February 1997 to January 2002, as President and Chief Executive Officer of Hartford Life, Inc. from February 1997 to January 2002, and as President and Chief Operating Officer of The Hartford Life Insurance Companies from January 1989 to January 2002. Mr. Smith serves as a Director of White Mountains Insurance Group Ltd. (October 2003 to current); One Beacon Insurance (October 2006 to current); Symetra Financial (August 2007 to current) and is a Managing Director of Whittington Gray Associates (January 2007 to current).
* Mr. Smith resigned as a Director of MF, MF2, Hartford Series Fund, Inc. and Hartford HLS Series Fund II, Inc. and as a Trustee of The Hartford Alternative Strategies Fund effective September 17, 2014.
Other Officers
Mark A. Annoni (1964) Vice President, Controller and Treasurer since 2012
Mr. Annoni currently serves as the Assistant Vice President of HLIC (February 2004 to present) and Senior Vice President of HFMG (December 2013 to present). Mr. Annoni has served in various positions within The Hartford and its subsidiaries in connection with the operation of the Hartford Funds. Mr. Annoni joined The Hartford in 2001.
| 22 |
| The Hartford Checks and Balances Fund |
| Directors and Officers (Unaudited) – (continued) |
Michael R. Dressen (1963) AML Compliance Officer since 2011
Mr. Dressen currently serves as Assistant Vice President of HLIC. He also serves as Chief Compliance Officer and AML Compliance Officer of HASCO and as AML Officer of HFD. Mr. Dressen has served in various positions within The Hartford and its subsidiaries in connection with the operation of the Hartford Funds.
Edward P. Macdonald (1967) Vice President, Secretary and Chief Legal Officer since 2005
Mr. Macdonald currently serves as Assistant Secretary, Executive Vice President and Deputy General Counsel of HFD, HASCO, HFMC and HFMG. He also serves as Vice President of HLIC. Mr. Macdonald has served in various positions within The Hartford and its subsidiaries in connection with the operation of the Hartford Funds. Mr. Macdonald joined The Hartford in 2005.
Joseph G. Melcher (1973) Vice President and Chief Compliance Officer since 2013
Mr. Melcher currently serves as Executive Vice President of HFD, HFMG and HASCO. Mr. Melcher also currently serves as Executive Vice President and Chief Compliance Officer of HFMC. Mr. Melcher has served in various positions within The Hartford and its subsidiaries in connection with the operation of the Hartford Funds since joining The Hartford in 2012. Prior to joining The Hartford, Mr. Melcher worked at Touchstone Investments, a member of the Western & Southern Financial Group, where he held the position of Vice President and Chief Compliance Officer from 2010 through 2012 and Assistant Vice President, Compliance from 2005 to 2010.
Vernon J. Meyer (1964) Vice President since 2006
Mr. Meyer currently serves as Senior Vice President of HLIC. He also currently serves as Managing Director and Chief Investment Officer of HFMC and Managing Director of HFMG. Mr. Meyer has served in various positions within The Hartford and its subsidiaries in connection with the operation of the Hartford Funds. Mr. Meyer joined The Hartford in 2004.
Laura S. Quade (1969) Vice President since 2012
Ms. Quade currently serves as Vice President of HASCO, HFD and HFMG. She is the Head of Operations of HASCO and formerly served as Director, Enterprise Operations of HLIC. Ms. Quade has served in various positions within The Hartford and its subsidiaries in connection with the operation of the Hartford Funds. Ms. Quade joined The Hartford in 2001.
Martin A. Swanson** (1962) Vice President since 2010
Mr. Swanson currently serves as Vice President of HLIC. Mr. Swanson also serves as Managing Director, Chief Marketing Officer and Principal of HFD and Managing Director of HFMG. Mr. Swanson has served in various positions within The Hartford and its subsidiaries in connection with the operation of the Hartford Funds.
** Mr. Swanson resigned as an officer effective November 6, 2014.
HOW TO OBTAIN A COPY OF THE FUND’S PROXY VOTING POLICIES AND VOTING RECORDS (UNAUDITED)
A description of the policies and procedures that the Fund uses to determine how to vote proxies relating to portfolio securities and information about how the Fund voted proxies relating to portfolio securities during the most recent twelve-month period ended June 30 are available (1) without charge, upon request, by calling 888-843-7824 and (2) on the SEC’s website at http://www.sec.gov.
QUARTERLY PORTFOLIO HOLDINGS INFORMATION (UNAUDITED)
The Fund files a complete schedule of portfolio holdings with the SEC for the first and third quarters of each fiscal year on Form N-Q. The Fund’s Forms N-Q are available (1) without charge, upon request, by calling 888-843-7824 and (2) on the SEC’s website at http://www.sec.gov. The Form N-Q may be reviewed and copied at the SEC’s Public Reference Room in Washington, DC. Information on the operation of the Public Reference Room may be obtained by calling 1-800-SEC-0330.
| 23 |
| The Hartford Checks and Balances Fund |
| Federal Tax Information (Unaudited) |
For the fiscal year ended October 31, 2014, there is no further federal tax information required for this Fund.
| 24 |
| The Hartford Checks and Balances Fund |
| Expense Example (Unaudited) |
Your Fund's Expenses
As a shareholder of the Fund, you incur two types of costs: (1) transaction costs, including sales charges (loads) on purchase payments, if any, and contingent deferred sales charges (CDSC), if any, and (2) ongoing costs, including distribution and/or service (12b-1) fees, if any, and other fund expenses. This example is intended to help you understand your ongoing costs (in dollars) of investing in the Fund and to compare these costs with the ongoing costs of investing in other mutual funds. The example is based on an investment of $1,000 invested at the beginning of the period and held for the entire period of April 30, 2014 through October 31, 2014.
Actual Expenses
The first set of columns of the table below provides information about actual account values and actual expenses. You may use the information in this column, together with the amount you invested, to estimate the expenses that you paid over the period. Simply divide your account value by $1,000 (for example, an $8,600 account value divided by $1,000 = 8.6), then multiply the result by the number in the line under the heading entitled “Expenses Paid During Period” to estimate the expenses you paid on your account during this period.
Hypothetical Example for Comparison Purposes
The second set of columns of the table below provides information about hypothetical account values and hypothetical expenses based on the Fund's actual expense ratio and an assumed rate of return of 5% per year before expenses, which is not the Fund's actual return. The hypothetical account values and expenses may not be used to estimate the actual ending account balance or expenses you paid for the period. You may use this information to compare the ongoing costs of investing in the Fund and other funds. To do so, compare this 5% hypothetical example with the 5% hypothetical examples that appear in the shareholder reports of the other funds.
Please note that the expenses shown in the table are meant to highlight your ongoing costs only and do not reflect any transactional costs, such as sales charges (loads) and CDSC. Therefore, the second set of columns of the table is useful in comparing ongoing costs only, and will not help you determine the relative total costs of owning different funds. In addition, if these transactional costs were included, your costs would be higher. Expenses are equal to the Fund's annualized expense ratios multiplied by average account value over the period, multiplied by 184/365 (to reflect the one-half year period).
| Actual return | Hypothetical (5% return before expenses) | |||||||||||||||||||||||||||||||
| Beginning Account Value April 30, 2014 | Ending
Account Value October 31, 2014 | Expenses
paid during the period April 30, 2014 through October 31, 2014 | Beginning Account Value April 30, 2014 | Ending
Account Value October 31, 2014 | Expenses
paid during the period April 30, 2014 through October 31, 2014 | Annualized expense ratio(A) | Days in the current 1/2 year | Days in the full year | ||||||||||||||||||||||||
| Class A | $ | 1,000.00 | $ | 1,046.20 | $ | 2.02 | $ | 1,000.00 | $ | 1,023.24 | $ | 1.99 | 0.39 | % | 184 | 365 | ||||||||||||||||
| Class B | $ | 1,000.00 | $ | 1,042.20 | $ | 6.13 | $ | 1,000.00 | $ | 1,019.20 | $ | 6.06 | 1.19 | 184 | 365 | |||||||||||||||||
| Class C | $ | 1,000.00 | $ | 1,042.60 | $ | 5.86 | $ | 1,000.00 | $ | 1,019.46 | $ | 5.80 | 1.14 | 184 | 365 | |||||||||||||||||
| Class I | $ | 1,000.00 | $ | 1,047.50 | $ | 0.69 | $ | 1,000.00 | $ | 1,024.53 | $ | 0.69 | 0.13 | 184 | 365 | |||||||||||||||||
| Class R3 | $ | 1,000.00 | $ | 1,044.40 | $ | 3.88 | $ | 1,000.00 | $ | 1,021.41 | $ | 3.83 | 0.75 | 184 | 365 | |||||||||||||||||
| Class R4 | $ | 1,000.00 | $ | 1,046.40 | $ | 2.32 | $ | 1,000.00 | $ | 1,022.94 | $ | 2.29 | 0.45 | 184 | 365 | |||||||||||||||||
| Class R5 | $ | 1,000.00 | $ | 1,047.40 | $ | 0.78 | $ | 1,000.00 | $ | 1,024.44 | $ | 0.77 | 0.15 | 184 | 365 | |||||||||||||||||
| (A) | Ratios do not include expenses of the Underlying Funds. |
| 25 |
| The Hartford Checks and Balances Fund |
| Approval of Investment Management Agreement (Unaudited) |
Section 15(c) of the Investment Company Act of 1940, as amended (the “1940 Act”), requires that each mutual fund’s board of directors, including a majority of those directors who are not “interested persons” of the mutual fund, as defined in the 1940 Act (the “Independent Directors”), annually review and consider the continuation of the mutual fund’s investment advisory agreement. At its meeting held on August 5-6, 2014, the Board of Directors (the “Board”) of The Hartford Mutual Funds, Inc., including each of the Independent Directors, unanimously voted to approve the continuation of the investment management agreement for The Hartford Checks and Balances Fund (the “Fund”) with Hartford Funds Management Company, LLC (the “Adviser”) (the “Agreement”).
In the months preceding the August 5-6, 2014 meeting, the Board requested, received and reviewed written responses from the Adviser to questions posed to it on behalf of the Independent Directors and supporting materials relating to those questions and responses. The Board considered information furnished to the Board at its meetings throughout the year, as well as information specifically prepared in connection with the annual approval of the Agreement at the Board’s meetings held on June 17-18, 2014 and August 5-6, 2014. Information provided to the Board at its meetings throughout the year included, among other things, reports on Fund performance, legal and compliance matters, sales and marketing activity, shareholder services, and the other services provided to the Fund by the Adviser and its affiliates. The Board also received in-person presentations by Fund officers and representatives of the Adviser at the Board’s meetings on June 17-18, 2014 and August 5-6, 2014 concerning the Agreement.
The Independent Directors, advised by independent legal counsel, engaged service providers to assist them with evaluating the Agreement with respect to the Fund. Lipper Inc. (“Lipper”), an independent provider of investment company data, was retained to provide the Board with reports on how the Fund’s non-management fees, overall expense ratios and investment performance compared to those of mutual funds with similar investment objectives. The Independent Directors also engaged an independent financial services consultant (the “Consultant”) to assist them in evaluating the Fund’s non-management fees, overall expense ratios and investment performance. In addition, the Consultant reviewed the profitability calculations utilized by the Adviser in connection with the continuation of the Agreement.
In determining whether to continue the Agreement for the Fund, the members of the Board reviewed and evaluated information and factors they believed to be relevant and appropriate in light of the information that the Board deemed necessary and appropriate through the exercise of its reasonable business judgment. While individual members of the Board may have weighed certain factors differently, the Board’s determination to continue the Agreement was based on a comprehensive consideration of all information provided to the Board throughout the year and specifically with respect to the continuation of the Agreement. A more detailed discussion of the factors the Board considered with respect to its approval of the Agreement is provided below.
Nature, Extent and Quality of Services Provided by the Adviser
The Board requested and considered information concerning the nature, extent and quality of the services provided to the Fund by the Adviser. The Board considered, among other things, the terms of the Agreement and the range of services provided by the Adviser. The Board considered the Adviser’s professional personnel who provide services to the Fund, including the Adviser’s ability and experience in attracting and retaining qualified personnel to service the Fund. The Board considered the Adviser’s reputation and overall financial strength, as well as its willingness to consider and implement organizational and operational changes designed to enhance services to the Hartford Funds. In addition, the Board considered the quality of the Adviser’s communications with the Board and responsiveness to Board inquiries and requests made from time to time with respect to the Fund and other Hartford Funds.
The Board also requested and evaluated information concerning the Adviser’s regulatory and compliance environment. In this regard, the Board requested and reviewed information on the Adviser’s compliance policies and procedures, compliance history, and a report from the Fund’s Chief Compliance Officer on the Adviser’s compliance with applicable laws and regulations, including responses to regulatory developments and compliance issues raised by regulators. The Board also noted the Adviser’s support of the Fund’s compliance control structure, particularly the resources devoted by the Adviser in support of the Fund’s obligations pursuant to Rule 38a-1 under the 1940 Act.
The Board noted that under the Agreement, the Adviser is responsible for the management of the Fund, including oversight of fund operations and service providers, and provides administrative and investment advisory services. The Board considered the Adviser’s ongoing monitoring of people, process and performance, including its quarterly reviews of each of the Hartford Funds, semi-annual meetings with the leaders of each Fund’s portfolio management team, and oversight of the Hartford Funds’ approximately 66 portfolio managers. The Board recognized that the Adviser has demonstrated a record of making changes to the management and/or strategies of the Hartford Funds when warranted. The Board considered the Adviser’s approach to risk management with respect to the Fund and the service providers to the Fund. The Board also considered the Adviser’s oversight of compliance with the Fund’s objective and policies as well as with applicable laws and regulations, noting that regulatory and other developments had over time led to an increase in the scope of the Adviser’s services in this regard.
| 26 |
| The Hartford Checks and Balances Fund |
| Approval of Investment Management Agreement (Unaudited) – (continued) |
In addition, the Board considered the Adviser’s ongoing commitment to review and rationalize the Hartford Funds product line-up and the expenses that the Adviser had incurred in connection with fund combinations in recent years. The Board considered that the Adviser or its affiliates are responsible for providing the Fund’s officers.
Based on these considerations, the Board concluded that it was satisfied with the nature, extent and quality of the services provided to the Fund by the Adviser.
Performance of the Fund and the Adviser
The Board considered the investment performance of the Fund. In this regard, the Board reviewed the performance of the Fund over different time periods presented in the materials and evaluated the Adviser’s analysis of the Fund’s performance for these time periods. The Board considered information and materials provided to the Board by the Adviser concerning Fund performance, as well as information from Lipper comparing the investment performance of the Fund to an appropriate benchmark and universe of peer funds. The Board noted that the Fund’s performance was in the 2nd quintile of its performance universe for the 1- and 3-year periods and in the 3rd quintile for the 5-year period. The Board also noted that the Fund’s performance was above its blended custom benchmark for the 1-year period and below its blended custom benchmark for the 3- and 5-year periods.
The Board considered the detailed investment analytics reports provided by Hartford Funds’ Investment Advisory Group throughout the year. These reports include, among other things, information on the Fund’s gross and net returns, the Fund’s investment performance relative to an appropriate benchmark and peer group, various statistics concerning the Fund’s portfolio, and a narrative summary of various factors affecting Fund performance. The Board considered the Adviser’s cooperation with the Investment Committee, which assists the Board in evaluating the performance of the Fund at periodic meetings throughout the year. The Board also considered the analysis provided by the Consultant relating to the Fund’s performance track record.
In light of all the considerations noted above, the Board concluded that it had continued confidence in the Adviser’s overall capabilities to manage the Fund.
Costs of the Services and Profitability of the Adviser
The Board reviewed information regarding the Adviser’s cost to provide investment management and related services to the Fund and the Adviser’s profitability, both overall and for the Fund, on a pre-tax basis without regard to distribution expenses. The Board also requested and reviewed information about the profitability to the Adviser and its affiliates from all services provided to the Fund and all aspects of their relationship with the Fund.
The Board considered the Consultant’s review of the profitability calculations used by the Adviser in connection with the continuation of the investment management agreement, noting the Consultant’s view that Hartford Funds’ process for calculating and reporting Fund profitability is reasonable. In this regard, the Board noted that the Consultant performed a full review of this process in light of the recent restructuring of the Hartford Funds business and reported that the approach to analyzing Fund profitability, including the use of common expense allocation methodologies, is reasonable, sound and well within common industry practice.
Based on these considerations, the Board concluded that the profits anticipated to be realized by the Adviser and its affiliates from their relationships with the Fund would not be excessive.
Comparison of Fees and Services Provided by the Adviser
The Board considered comparative information with respect to the total expense ratios of the Fund, noting that there is no management fee for the Fund. In this regard, the Board requested and reviewed information from the Adviser relating to the total operating expenses for the Fund. The Board also reviewed information from Lipper comparing the Fund’s overall expense ratios relative to a group of funds selected by Lipper, in consultation with the Consultant, and a broader universe of funds selected by Lipper. The Board considered that the Fund’s total expenses (less 12b-1 and shareholder service fees) were in the 1st quintile. The Board noted that the Fund has an automatically renewable contractual expense cap on each share class.
| 27 |
| The Hartford Checks and Balances Fund |
| Approval of Investment Management Agreement (Unaudited) – (continued) |
While the Board recognized that comparisons between the Fund and peer funds may be imprecise, given the different service levels and characteristics of mutual funds and the different business models and cost structures of the Adviser, the comparative information provided by Lipper assisted the Board in evaluating the reasonableness of the Fund’s total operating expenses. In addition, the Board considered the analysis and recommendations of the Consultant relating to the Fund’s total operating expenses.
Based on these considerations, the Board concluded that the Fund’s total operating expenses, in conjunction with the information about quality of services, profitability, economies of scale, and other matters discussed, were reasonable in light of the services provided.
Economies of Scale
The Board requested and considered information regarding the Adviser’s realization of economies of scale with respect to the Fund and whether the expense levels reflect these economies of scale for the benefit of the Fund’s shareholders.
After considering all of the information available to it, the Board concluded that it was satisfied with the extent to which economies of scale would be shared for the benefit of the Fund’s shareholders based on currently available information and the expense ratios for the Fund at its current and reasonably anticipated asset levels.
Other Benefits
The Board considered other benefits to the Adviser and its affiliates from their relationships with the Fund.
The Board noted that the Adviser receives fees for fund accounting and related services from the Fund, and the Board considered information on profits to the Adviser for such services. The Board also considered that Hartford Administrative Services Company (“HASCO”), the Fund’s transfer agent and an affiliate of the Adviser, receives transfer agency compensation from the Fund, and the Board reviewed information on the profitability of the Fund’s transfer agency function to HASCO. The Board considered information provided by HASCO indicating that the transfer agent fees charged by HASCO to the Fund were fair and reasonable based on publicly available information.
The Board also considered that Hartford Funds Distributors, LLC (“HFD”), an affiliate of the Adviser, serves as principal underwriter of the Fund. As principal underwriter, HFD receives 12b-1 fees from the Fund and receives all or a portion of the sales charges on sales or redemptions of certain classes of shares. The Board also noted that certain affiliates of HFD distribute shares of the Fund and receive compensation in that connection.
The Board considered the benefits to shareholders of being part of the Hartford Funds family of funds, including the right to exchange investments between the same class of funds without a sales charge, the ability to reinvest Fund dividends into other funds in the family, and the ability to combine holdings in the Fund with holdings in other funds to obtain a reduced sales charge. The Board considered the Adviser’s efforts to provide investors in the family with a broad range of investment styles and asset classes and its entrepreneurial risk in initiating new funds to expand these opportunities for shareholders.
* * * *
Based upon its review of these various factors, among others, the Board concluded that it is in the best interests of the Fund and its shareholders for the Board to approve the Agreement for an additional year. In reaching this decision, the Board did not assign relative weights to the factors discussed above or deem any one or group of them to be controlling in and of themselves. In connection with their deliberations, the Independent Directors met separately in executive session on several occasions, with independent legal counsel and the Consultant, to review the relevant materials and consider their responsibilities under relevant laws and regulations.
| 28 |
| The Hartford Checks and Balances Fund |
| Main Risks (Unaudited) |
The main risks of investing in the Fund are described below.
Market, Selection and Strategy Risk: The Fund’s share price may fluctuate due to market risk and/or security selections that may underperform the market or relevant benchmarks. If the investment manager's investment strategy does not perform as expected, the Fund could underperform its peers or lose money. There is no guarantee the Fund will achieve its stated objective.
Asset Allocation Strategy Risk: The portfolio manager's asset allocation strategy may not always work as intended, and asset allocation does not guarantee better performance or reduce the risk of investment loss.
Fund of Funds Risk:The Fund invests in a number of Underlying Funds, and is subject to the risks of the Underlying Funds in direct proportion to the amount of assets it invests in each Underlying Fund. The Underlying Funds may invest in the following: foreign securities including emerging markets, fixed income securities (which carry credit and interest rate risk) including junk bonds, small- and mid-cap stocks, mortgage- and asset-backed securities, and derivatives.
| 29 |
THIS PRIVACY POLICY IS NOT PART OF THIS REPORT
Privacy Policy and Practices of The Hartford Financial Services Group, Inc. and its Affiliates
(herein called “we, our and us”)
This Privacy Policy applies to our United States Operations
We value your trust. We are committed to the responsible: a) management; b) use; and c) protection; of Personal Information.
This notice describes how we collect, disclose, and protect Personal Information.
We collect Personal Information to: a) service your Transactions with us; and b) support our business functions.
We may obtain Personal Information from: a) You; b) your Transactions with us; and c) third parties such as a consumer-reporting agency.
Based on the type of product or service You apply for or get from us, Personal Information such as: a) your name; b) your address; c) your income; d) your payment; or e) your credit history; may be gathered from sources such as applications, Transactions, and consumer reports.
To serve You and service our business, we may share certain Personal Information. We will share Personal Information, only as allowed by law, with affiliates such as: a) our insurance companies; b) our employee agents; c) our brokerage firms; and d) our administrators.
As allowed by law, we may share Personal Financial Information with our affiliates to: a) market our products; or b) market our services; to You without providing You with an option to prevent these disclosures.
|
We may also share Personal Information, only as allowed by law, with unaffiliated third parties including: a) independent agents; b) brokerage firms; c) insurance companies; d) administrators; and e) service providers; who help us serve You and service our business.
When allowed by law, we may share certain Personal Financial Information with other unaffiliated third parties who assist us by performing services or functions such as: a) taking surveys; b) marketing our products or services; or c) offering financial products or services under a joint agreement between us and one or more financial institutions.
We, and third parties we partner with, may track some of the pages You visit through the use of: a) cookies; b) pixel tagging; or c) other technologies; and currently do not process or comply with any web browser’s “do not track” signal or similar mechanism that indicates a request to disable online tracking of individual users who visit our websites or use our services.
We will not sell or share your Personal Financial Information with anyone for purposes unrelated to our business functions without offering You the opportunity to: a) “opt-out;” or b) “opt-in;” as required by law.
We only disclose Personal Health Information with: a) your proper written authorization; or b) as otherwise allowed or required by law.
Our employees have access to Personal Information in the course of doing their jobs, such as: a) underwriting policies; b) paying claims; c) developing new products; or d) advising customers of our products and services.
|
We use manual and electronic security procedures to maintain: a) the confidentiality; and b) the integrity of; Personal Information that we have. We use these procedures to guard against unauthorized access.
Some techniques we use to protect Personal Information include: a) secured files; b) user authentication; c) encryption; d) firewall technology; and e) the use of detection software.
We are responsible for and must: a) identify information to be protected; b) provide an adequate level of protection for that data; c) grant access to protected data only to those people who must use it in the performance of their job-related duties.
Employees who violate our Privacy Policy will be subject to discipline, which may include ending their employment with us.
At the start of our business relationship, we will give You a copy of our current Privacy Policy.
We will also give You a copy of our current Privacy Policy once a year if You maintain a continuing business relationship with us.
We will continue to follow our Privacy Policy regarding Personal Information even when a business relationship no longer exists between us.
|
As used in this Privacy Notice:
Application means your request for our product or service.
Personal Financial Information means financial information such as: a) credit history; b) income; c) financial benefits; or d) policy or claim information.
Personal Health Information means health information such as: a) your medical records; or b) information about your illness, disability or injury.
Personal Information means information that identifies You personally and is not otherwise available to the public. It includes: a) Personal Financial Information; and b) Personal Health Information.
Transaction means your business dealings with us, such as: a) your Application; b) your request for us to pay a claim; and c) your request for us to take an action on your account.
You means an individual who has given us Personal Information in conjunction with: a) asking about; b) applying for; or c) obtaining; a financial product or service from us if the product or service is used mainly for personal, family, or household purposes.
|
This Privacy Policy is being provided on behalf of the following affiliates of The Hartford Financial Services Group, Inc.:
1stAGChoice, Inc.; Access CoverageCorp, Inc.; Access CoverageCorp Technologies, Inc.; American Maturity Life Insurance Company; Archway 60 R, LLC; Business Management Group, Inc.; Champlain Life Reinsurance Company; DMS R, LLC; Eloy R, LLC; Ersatz Corporation; First State Insurance Company; Hartford Accident and Indemnity Company; Hartford Administrative Services Company; Hartford Casualty General Agency, Inc.; Hartford Casualty Insurance Company; Hartford-Comprehensive Employee Benefit Service Company; Hartford Equity Sales Company, Inc.; Hartford Fire General Agency, Inc.; Hartford Fire Insurance Company; Hartford Funds Management Company, LLC; Hartford Funds Management Group, Inc.; Hartford HLS Series Fund II, Inc.; Hartford Insurance Company of Illinois; Hartford Insurance Company of the Midwest; Hartford Insurance Company of the Southeast; Hartford Integrated Technologies, Inc.; Hartford International Life Reassurance Corporation; Hartford Funds Distributors, LLC; Hartford Investment Management Company; Hartford Life and Accident Insurance Company; Hartford Life and Annuity Insurance Company; Hartford Life Insurance Company; Hartford Life Private Placement, LLC; Hartford Lloyd’s Corporation; Hartford Lloyd’s Insurance Company; Hartford Mezzanine Investors I, LLC; Hartford Residual Market, L.C.C.; Hartford Retirement Services, LLC; Hartford Securities Distribution Company, Inc.; Hartford Series Fund, Inc.; Hartford Specialty Insurance Services of Texas, LLC; Hartford Strategic Investments, LLC; Hartford Underwriters Insurance Company; Hartford Technology Services Company, L.L.C.; Hartford of Texas General Agency, Inc.; Hartford Underwriters General Agency, Inc.; HARTRE Company, L.C.C.; HL Investment Advisors, LLC; HLA LLC; Horizon Management Group, LLC; HRA Brokerage Services, Inc.; Lanidex Class B, LLC; M-CAP Insurance Agency, LLC; New England Insurance Company; New England Reinsurance Corporation; Nutmeg Insurance Agency, Inc.; Nutmeg Insurance Company; Pacific Insurance Company, Limited; Planco, LLC: Property and Casualty Insurance Company of Hartford; Revere R, LLC; RVR R, LLC; Sentinel Insurance Company, Ltd.; Sunstone R, LLC; Symphony R, LLC; The Evergreen Group Incorporated; The Hartford Alternative Strategies Fund; The Hartford Mutual Funds, Inc.; The Hartford Mutual Funds II, Inc.; Trumbull Flood Management, L.L.C.; Trumbull Insurance Company; Twin City Fire Insurance Company; White River Life Reinsurance Company.
HPP Revised January 2014
HARTFORDFUNDS
hartfordfunds.com
This information is written in connection with the promotion or marketing of the matter(s) addressed in this material.
This report is submitted for the general information of the shareholders of the Fund. It is not authorized for distribution unless preceded or accompanied by a current prospectus for the Fund.
The information cannot be used or relied upon for the purpose of avoiding IRS penalties. These materials are not intended to provide tax, accounting or legal advice. As with all matters of a tax or legal nature, you should consult your own tax or legal counsel for advice.
Investors should carefully consider the investment objectives, risks, charges, and expenses of Hartford Funds before investing. This and other information can be found in the prospectus and summary prospectus, which can be obtained by calling 888-843-7824 (retail) or 800-279-1541 (institutional). Investors should read them carefully before they invest.
Hartford Funds are underwritten and distributed by Hartford Funds Distributors, LLC.
MFAR-CB14 12/14 113966-3 Printed in U.S.A.
HARTFORDFUNDS
|
THE HARTFORD CONSERVATIVE
2014 Annual Report |
A MESSAGE FROM THE PRESIDENT
Dear Fellow Shareholders:
Thank you for investing in Hartford Funds.
Market Review
U.S. equities (as represented by the S&P 500 Index) rose steadily for the fiscal year ended October 31, 2014, with a return of 17.27% for the period. With the exception of short-lived geopolitical scares early in 2014 and concerns about continuing global growth near the end of the period, stocks generally rose on solid fundamentals and encouraging macroeconomic data during the year.
September 2014 marked the six-year anniversary of the start of the financial crisis. Within weeks of that anniversary, both the S&P 500 Index and the Dow Jones Industrial Average set new all-time highs, closing at 2,018 and 17,391, respectively, on October 31. Although the fallout of the crisis continues to influence investor behavior, stocks have recovered and risen dramatically, up 198% from their low in March 2009. Meanwhile, the domestic economy is notching strong growth, and the unemployment rate has reached its lowest level since August 2008.
While the U.S. economy appears to have stabilized and to have reverted to a solid growth path, the outlook for the global economy appears to have gotten cloudier. The U.S. Federal Reserve has ended quantitative easing, while Europe and Japan are pursuing stimulus options to avoid a double-dip recession and deflation, respectively. Diverging central-bank policies will likely continue to play an important role in market movements going forward as investors wait to see the reactions to their efforts and their impacts on global markets.
How have market movements impacted your portfolio throughout the last year? Are your investments still on track to provide the growth or income you need, and are you comfortable with their progress during times of volatility?
Your financial professional can help you navigate today’s markets with confidence, as well as assist you to achieve your investment goals by providing advice on the best options within our fund family to help you work toward overcoming today’s investing challenges. Meet with your financial advisor regularly to examine your portfolio and your investment strategy, and to determine if you’re still on track to meet your goals.
Thank you again for investing with Hartford Funds.
James Davey
President
Hartford Funds
1 The S&P 500 Index is a market capitalization-weighted price index composed of 500 widely held common stocks.
2 The Dow Jones Industrial Average is an unmanaged, price-weighted index of 30 of the largest, most widely held stocks traded on the NYSE
The Hartford Conservative Allocation Fund
Table of Contents
The views expressed in the Fund’s Manager Discussion under ‘‘Why did the Fund perform this way?’’ and ‘‘What is the outlook?’’ are views of the Fund’s sub-adviser and portfolio management team through the end of the period and are subject to change based on market and other conditions. The Fund’s Manager Discussion is for informational purposes only and does not represent an offer, recommendation or solicitation to buy, hold or sell any security. The specific securities identified and described, if any, do not represent all of the securities purchased or sold and you should not assume that investments in the securities identified and discussed will be profitable.
| The Hartford Conservative Allocation Fund inception 05/28/2004 |
| (sub-advised by Wellington Management Company, LLP) |
| Investment objective – The Fund seeks current income and long-term capital appreciation. |
Performance Overview 10/31/04 - 10/31/14
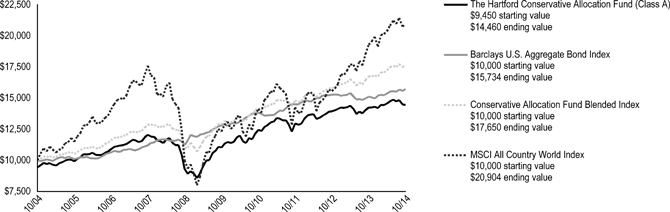
The chart above represents the hypothetical growth of a $10,000 investment in Class A, which includes a sales charge. Growth results in classes other than Class A will vary from what is seen above due to differences in the expenses charged to those share classes.
Average Annual Total Returns (as of 10/31/14)
| 1 Year | 5 Years | 10 Years | ||||||||||
| Conservative Allocation A# | 1.50 | % | 5.55 | % | 4.35 | % | ||||||
| Conservative Allocation A## | -4.08 | % | 4.36 | % | 3.76 | % | ||||||
| Conservative Allocation B# | 0.71 | % | 4.70 | % | 3.73 | %* | ||||||
| Conservative Allocation B## | -4.17 | % | 4.36 | % | 3.73 | %* | ||||||
| Conservative Allocation C# | 0.71 | % | 4.77 | % | 3.60 | % | ||||||
| Conservative Allocation C## | -0.26 | % | 4.77 | % | 3.60 | % | ||||||
| Conservative Allocation I# | 1.76 | % | 5.83 | % | 4.57 | % | ||||||
| Conservative Allocation R3# | 1.17 | % | 5.20 | % | 4.03 | % | ||||||
| Conservative Allocation R4# | 1.45 | % | 5.51 | % | 4.31 | % | ||||||
| Conservative Allocation R5# | 1.74 | % | 5.83 | % | 4.55 | % | ||||||
| Barclays U.S. Aggregate Bond Index | 4.14 | % | 4.22 | % | 4.64 | % | ||||||
| Conservative Allocation Fund Blended Index | 5.45 | % | 6.51 | % | 5.85 | % | ||||||
| MSCI All Country World Index | 8.32 | % | 11.15 | % | 7.65 | % | ||||||
| # | Without sales charge |
| ## | With sales charge |
| * | Class B shares convert to Class A shares after 8 years. The return shown reflects the conversion to Class A shares, which had different operating expenses, for the period after conversion. |
PERFORMANCE DATA QUOTED REPRESENTS PAST PERFORMANCE AND DOES NOT GUARANTEE FUTURE RESULTS. The investment return and principal value of the investment will fluctuate so that investors’ shares, when redeemed, may be worth more or less than their original cost. Current performance may be lower or higher than the performance data quoted. To obtain performance data current to the most recent month-end, please visit our website www.hartfordfunds.com.
The initial investment in Class A shares reflects the maximum sales charge of 5.50% and returns for Class B shares reflect a contingent deferred sales charge of up to 5.00% and declining to zero, depending on the period of time the shares are held. Returns for Class C shares reflect a contingent deferred sales charge of up to 1.00% on shares redeemed within twelve months of purchase.
Total returns presented above were calculated using the Fund’s net asset value available to shareholders for sale or redemption of Fund shares on October 31, 2014, which may exclude investment transactions as of this date. All share class returns assume the reinvestment of all distributions at net asset value and the deduction of all fund expenses.
Effective 9/30/09, Class B shares of the Fund were closed to new investments.
Class I shares commenced operations on 8/31/06. Performance prior to that date is that of the Fund’s Class A shares (excluding sales charges), which had different operating expenses. Class R3, R4 and R5 shares commenced operations on 12/22/06. Performance prior to that date is that of the Fund’s Class A shares (excluding sales charges), which had different operating expenses.
Performance information includes performance under the Fund’s previous sub-adviser, Hartford Investment Management Company, using a modified investment strategy. As of June 4, 2012, Hartford Investment Management Company no longer served as the sub-adviser to the Fund.
Barclays U.S. Aggregate Bond Index is an unmanaged index and is composed of securities from the Barclays Government/Credit Bond Index, Mortgage-Backed Securities Index, Asset-Backed Securities Index and Commercial Mortgage-Backed Securities Index.
Conservative Allocation Fund Blended Index is calculated by Hartford Funds Management Company, LLC and represents the weighted return of 70% Barclays U.S. Aggregate Bond Index and 30% MSCI All Country World Index.
MSCI All Country World Index is a free float-adjusted market capitalization index that measures equity market performance in the global developed and emerging markets, consisting of 45 developed and emerging market country indices.
You cannot invest directly in an index.
The chart and table do not reflect the deductions of taxes that a shareholder would pay on Fund distributions or the redemption of Fund shares.
Performance information may reflect historical or current expense waivers/reimbursements from the investment adviser, without which performance would have been lower. For information on current expense waivers/reimbursements, please see the prospectus.
| 2 |
| The Hartford Conservative Allocation Fund |
| Manager Discussion |
| October 31, 2014 (Unaudited) |
| Operating Expenses* | ||||||||
| Net | Gross | |||||||
| Conservative Allocation Class A | 1.24 | % | 1.24 | % | ||||
| Conservative Allocation Class B | 2.06 | % | 2.06 | % | ||||
| Conservative Allocation Class C | 1.98 | % | 1.98 | % | ||||
| Conservative Allocation Class I | 0.96 | % | 0.96 | % | ||||
| Conservative Allocation Class R3 | 1.59 | % | 1.59 | % | ||||
| Conservative Allocation Class R4 | 1.28 | % | 1.28 | % | ||||
| Conservative Allocation Class R5 | 0.98 | % | 0.98 | % | ||||
| * | As shown in the Fund's current prospectus dated March 1, 2014. Actual expenses may be higher or lower. Expenses shown include expenses of the Underlying Funds. Please see accompanying Financial Highlights for expense ratios for the year ended October 31, 2014. |
Gross expenses are the Fund's total annual operating expenses shown in the Fund's most recent prospectus. Net expenses are the Fund's total annual operating expenses shown in the Fund's most recent prospectus and reflect contractual expense reimbursements in instances when these reductions reduce the Fund's gross expenses. Contractual reimbursements remain in effect until February 28, 2015, and automatically renew for one-year terms unless terminated.
All investments are subject to risk including the possible loss of principal. For a discussion of the Fund’s risks, please see the Main Risks section of this report. For more detailed information on the risks associated with an investment in the Fund, please see the prospectus.
| Portfolio Managers | |
| Richard P. Meagher, CFA | Wendy M. Cromwell, CFA |
| Vice President, Asset Allocation Strategist and Portfolio Manager | Senior Vice President, Director of Strategic Asset Allocation, Asset Allocation Strategies Group, and Portfolio Manager |
How did the Fund perform?
The Class A shares of The Hartford Conservative Allocation Fund returned 1.50%, before sales charge, for the twelve-month period ended October 31, 2014 underperforming the Fund’s blended benchmark, 70% Barclays U.S. Aggregate Bond Index and 30% MSCI All Country World Index, which returned 5.45% for the same period. In comparison, the MSCI All Country World Index and the Barclays U.S. Aggregate Bond Index returned 8.32% and 4.14%, respectively, for the same period. The Fund also underperformed the 5.31% average return of the Lipper Mixed-Asset Target Allocation Conservative Funds category, a group of funds with equity weights of 20%-40%.
Why did the Fund perform this way?
Fixed income markets gained throughout much of the period as expectations of prolonged easy monetary policy by major central banks and a supportive macroeconomic environment kept rates low and suppressed volatility. Early in the period emerging markets dominated headlines as economic and political developments sparked risk aversion across global markets, pushing bond prices higher and yields lower amid a flight to quality. Toward the end of the period, however, persistent geopolitical risks – tensions between Ukraine and Russia and violence in Iraq – and Chinese economic slowdown concerns raised questions about the global growth rate, keeping a lid on risk appetites overall.
The period was also highlighted by a divergence in central bank policies. The European Central Bank (ECB) cut its benchmark lending and deposit rates and announced a host of stimulus measures in an effort to encourage lending and fend off fears of deflation. China’s central bank joined the ECB in boosting liquidity by injecting funds into the nation’s largest banks in an attempt to combat weakening growth. The Bank of Japan pre-emptively announced incremental monetary easing to counter the risk of missing the country’s inflation and growth targets. In contrast, the Bank of England and U.S. Federal Reserve (Fed) leaned toward tighter policies. The Fed ended its quantitative easing program as U.S. data largely suggested the economy was on a sustainable growth path. In the U.S., second quarter Gross Domestic Product rebounded after the first quarter’s steep contraction. The labor market strengthened as the unemployment rate dropped to a six-year low. Housing regained some lost ground after a weak start to the year, though the pace of home price appreciation started to slow after a strong 2013. Inflation pressures were muted overall, alleviating pressure on the Fed to raise rates.
The U.S. Treasury curve flattened as markets contemplated bringing interest rates to normal levels; short-term yields rose while longer term rates declined. Most credit risk sectors posted positive absolute returns and outperformed duration-equivalent government bonds as credit spreads tightened.
Global equities rose during the period, notwithstanding bouts of significant volatility. Despite ongoing geopolitical tensions in Ukraine and the Middle East, concerns about a Chinese growth slowdown, and unsettling economic and political developments in several other emerging market countries, the five-year-old bull market marched on in the first half of 2014. Robust merger and acquisition activity, along with continued accommodative monetary policy from central banks around the globe, aided positive investor sentiment in May and June. However, Portuguese banking woes, European economic malaise, and the prospect of an accelerated Fed interest-rate-hike timeline all contributed to stall the global stock rally near the tail end of the period. In addition, China's property slump and poor GDP readings in Japan and the Eurozone raised the specter of a slowdown in global economic growth. Nevertheless, there were several positive developments, including monetary easing by the European Central Bank and the People's Bank of China, as well as an encouraging
| 3 |
| The Hartford Conservative Allocation Fund |
| Manager Discussion – (continued) |
| October 31, 2014 (Unaudited) |
U.S. corporate earnings season. During the period, emerging market equities underperformed their developed market counterparts and U.S. stocks generally outperformed non-U.S. stocks.
There are two main drivers of Fund performance: the asset allocation among various asset classes and the performance of the underlying funds. Value added from Asset Allocation includes the value added by both the Fund’s strategic asset allocation across a diverse set of asset classes and how those allocations are implemented within the asset classes. With regard to the strategic allocation, the stock / bond mix of the Fund was approximately 30% equities and 70% fixed income during the period, in line with its blended benchmark. Performance of the underlying funds measures the results of the underlying funds versus their respective benchmarks. The portfolio managers have control over the selection of the underlying funds.
In aggregate, asset allocation detracted from benchmark-relative performance. Exposure to natural resource related equities and TIPS along with overweight positioning to non-U.S. equities detracted from relative performance. This was partially offset by exposure to global fixed income and high yield credit which contributed on a relative basis.
Beyond asset class decisions, we seek to add value by selecting the underlying Funds available in our investment universe using both quantitative and qualitative criteria. In aggregate, performance from the underlying funds (net of fees) detracted on a benchmark relative basis. Weak benchmark-relative results from the Hartford Real Total Return Fund, The Hartford Alternative Strategies Fund, and The Hartford Global Real Asset Fund more than offset strong benchmark-relative performance in The Hartford World Bond Fund, The Hartford Total Return Bond Fund and The Hartford Small Company Fund. Derivatives are not utilized at the aggregate fund level but are utilized at the underlying fund level.
What is the outlook?
In our view, the global cycle continues to advance at a moderate pace with a mix of stronger growth in the U.S. and more sluggish activity in Europe, Japan, and China. We believe the U.S. economy is on track for a self-sustaining expansion. After three years of fiscal consolidation, it appears that this policy drag is starting to fade, which we believe should support growth. Meanwhile, investment spending appears to be picking up. The euro area and Japan are easing aggressively to help boost inflation and growth. This environment should contribute to a stronger U.S. dollar. Additionally, we retain a constructive view on capital markets and risk assets. The Fund ended the period with an overweight to international equities and an underweight to both large cap U.S. equities and fixed income relative to the Fund’s blended benchmark.
| Composition by Investments | ||||
| as of October 31, 2014 | ||||
| Fund Name | Percentage of Net Assets | |||
| Hartford Real Total Return Fund | 6.7 | % | ||
| The Hartford Alternative Strategies Fund | 3.4 | |||
| The Hartford Capital Appreciation Fund | 2.7 | |||
| The Hartford Dividend and Growth Fund | 4.4 | |||
| The Hartford Emerging Markets Research Fund | 2.3 | |||
| The Hartford Global Real Asset Fund | 12.2 | |||
| The Hartford Inflation Plus Fund | 22.7 | |||
| The Hartford International Growth Fund | 1.5 | |||
| The Hartford International Opportunities Fund | 3.1 | |||
| The Hartford International Small Company Fund | 1.9 | |||
| The Hartford International Value Fund | 1.5 | |||
| The Hartford MidCap Value Fund | 0.9 | |||
| The Hartford Small Company Fund | 0.9 | |||
| The Hartford Strategic Income Fund | 2.0 | |||
| The Hartford Total Return Bond Fund | 13.9 | |||
| The Hartford World Bond Fund | 19.9 | |||
| Other Assets and Liabilities | 0.0 | |||
| Total | 100.0 | % | ||
| 4 |
| The Hartford Conservative Allocation Fund |
| Schedule of Investments |
| October 31, 2014 |
| (000’s Omitted) |
| Shares or Principal Amount | Market Value ╪ | |||||||||||
| Affiliated Investment Companies - 100.0% | ||||||||||||
| Alternative Strategy Funds - 22.3% | ||||||||||||
| 1,367 | Hartford Real Total Return Fund● | $ | 13,864 | |||||||||
| 727 | The Hartford Alternative Strategies Fund | 7,067 | ||||||||||
| 2,580 | The Hartford Global Real Asset Fund | 25,519 | ||||||||||
| 46,450 | ||||||||||||
| Total Alternative Strategy Funds | ||||||||||||
| (Cost $48,245) | $ | 46,450 | ||||||||||
| Domestic Equity Funds - 8.9% | ||||||||||||
| 104 | The Hartford Capital Appreciation Fund | $ | 5,644 | |||||||||
| 329 | The Hartford Dividend and Growth Fund | 9,049 | ||||||||||
| 106 | The Hartford MidCap Value Fund | 1,891 | ||||||||||
| 69 | The Hartford Small Company Fund | 1,942 | ||||||||||
| 18,526 | ||||||||||||
| Total Domestic Equity Funds | ||||||||||||
| (Cost $14,545) | $ | 18,526 | ||||||||||
| International/Global Equity Funds - 10.3% | ||||||||||||
| 520 | The Hartford Emerging Markets Research Fund | $ | 4,724 | |||||||||
| 247 | The Hartford International Growth Fund | 3,229 | ||||||||||
| 363 | The Hartford International Opportunities Fund | 6,417 | ||||||||||
| 228 | The Hartford International Small Company Fund | 3,895 | ||||||||||
| 218 | The Hartford International Value Fund● | 3,212 | ||||||||||
| 21,477 | ||||||||||||
| Total International/Global Equity Funds | ||||||||||||
| (Cost $20,603) | $ | 21,477 | ||||||||||
| Taxable Fixed Income Funds - 58.5% | ||||||||||||
| 4,308 | The Hartford Inflation Plus Fund | $ | 47,176 | |||||||||
| 458 | The Hartford Strategic Income Fund | 4,255 | ||||||||||
| 2,668 | The Hartford Total Return Bond Fund | 29,005 | ||||||||||
| 3,840 | The Hartford World Bond Fund | 41,355 | ||||||||||
| 121,791 | ||||||||||||
| Total Taxable Fixed Income Funds | ||||||||||||
| (Cost $125,752) | $ | 121,791 | ||||||||||
| Total Investments in Affiliated Investment Companies | ||||||||||||
| (Cost $209,145) | $ | 208,244 | ||||||||||
| Total Long-Term Investments | ||||||||||||
| (Cost $209,145) | $ | 208,244 | ||||||||||
| Total Investments | ||||||||||||
| (Cost $209,145) ▲ | 100.0 | % | $ | 208,244 | ||||||||
| Other Assets and Liabilities | — | % | 20 | |||||||||
| Total Net Assets | 100.0 | % | $ | 208,264 | ||||||||
The accompanying notes are an integral part of these financial statements.
| 5 |
| The Hartford Conservative Allocation Fund |
| Schedule of Investments – (continued) |
| October 31, 2014 |
| (000’s Omitted) |
| Note: | Percentage of investments as shown is the ratio of the total market value to total net assets. |
For Fund compliance purposes, the Fund may not use the same classification system shown in this report as these classifications are used for reporting ease.
| ▲ | At October 31, 2014, the cost of securities for federal income tax purposes was $209,802 and the aggregate gross unrealized appreciation and depreciation based on that cost were: |
| Unrealized Appreciation | $ | 5,987 | ||
| Unrealized Depreciation | (7,545 | ) | ||
| Net Unrealized Depreciation | $ | (1,558 | ) |
| ● | Non-income producing. |
| ╪ | See Significant Accounting Policies of accompanying Notes to Financial Statements regarding valuation of securities. |
The accompanying notes are an integral part of these financial statements.
| 6 |
| The Hartford Conservative Allocation Fund |
| Schedule of Investments – (continued) |
| October 31, 2014 |
| (000’s Omitted) |
Investment Valuation Hierarchy Level Summary
October 31, 2014
| Total | Level 1 ♦ | Level 2 ♦ | Level 3 | |||||||||||||
| Assets: | ||||||||||||||||
| Affiliated Investment Companies | $ | 208,244 | $ | 208,244 | $ | – | $ | – | ||||||||
| Total | $ | 208,244 | $ | 208,244 | $ | – | $ | – | ||||||||
| ♦ | For the year ended October 31, 2014, there were no transfers between Level 1 and Level 2. |
| Note: | For purposes of reporting transfers between different hierarchy levels, both transfers in and out of each level, as applicable, are shown as if they occurred at the beginning of the period. |
The accompanying notes are an integral part of these financial statements.
| 7 |
| The Hartford Conservative Allocation Fund |
| Statement of Assets and Liabilities |
| October 31, 2014 |
| (000’s Omitted) |
| Assets: | ||||
| Investments in affiliated investment companies, at market value (cost $209,145) | $ | 208,244 | ||
| Receivables: | ||||
| Investment securities sold | 81 | |||
| Fund shares sold | 233 | |||
| Dividends | 55 | |||
| Other assets | 36 | |||
| Total assets | 208,649 | |||
| Liabilities: | ||||
| Payables: | ||||
| Investment securities purchased | 200 | |||
| Fund shares redeemed | 122 | |||
| Investment management fees | 6 | |||
| Administrative fees | 1 | |||
| Distribution fees | 18 | |||
| Accrued expenses | 38 | |||
| Total liabilities | 385 | |||
| Net assets | $ | 208,264 | ||
| Summary of Net Assets: | ||||
| Capital stock and paid-in-capital | $ | 201,365 | ||
| Undistributed net investment income | — | |||
| Accumulated net realized gain | 7,800 | |||
| Unrealized depreciation of investments | (901 | ) | ||
| Net assets | $ | 208,264 | ||
| Shares authorized | 400,000 | |||
| Par value | $ | 0.001 | ||
| Class A: Net asset value per share/Maximum offering price per share | $10.78/$11.41 | |||
| Shares outstanding | 12,453 | |||
| Net assets | $ | 134,286 | ||
| Class B: Net asset value per share | $ | 10.72 | ||
| Shares outstanding | 641 | |||
| Net assets | $ | 6,872 | ||
| Class C: Net asset value per share | $ | 10.71 | ||
| Shares outstanding | 4,365 | |||
| Net assets | $ | 46,745 | ||
| Class I: Net asset value per share | $ | 10.77 | ||
| Shares outstanding | 170 | |||
| Net assets | $ | 1,829 | ||
| Class R3: Net asset value per share | $ | 10.81 | ||
| Shares outstanding | 938 | |||
| Net assets | $ | 10,141 | ||
| Class R4: Net asset value per share | $ | 10.79 | ||
| Shares outstanding | 445 | |||
| Net assets | $ | 4,806 | ||
| Class R5: Net asset value per share | $ | 10.79 | ||
| Shares outstanding | 332 | |||
| Net assets | $ | 3,585 |
The accompanying notes are an integral part of these financial statements.
| 8 |
| The Hartford Conservative Allocation Fund |
| Statement of Operations |
| For the Year Ended October 31, 2014 |
| (000’s Omitted) |
| Investment Income: | ||||
| Dividends from affiliated investment companies | $ | 2,724 | ||
| Total investment income | 2,724 | |||
| Expenses: | ||||
| Investment management fees | 331 | |||
| Administrative services fees | ||||
| Class R3 | 22 | |||
| Class R4 | 9 | |||
| Class R5 | 3 | |||
| Transfer agent fees | ||||
| Class A | 152 | |||
| Class B | 18 | |||
| Class C | 50 | |||
| Class I | 1 | |||
| Class R3 | — | |||
| Class R4 | — | |||
| Class R5 | — | |||
| Distribution fees | ||||
| Class A | 350 | |||
| Class B | 91 | |||
| Class C | 494 | |||
| Class R3 | 54 | |||
| Class R4 | 15 | |||
| Custodian fees | — | |||
| Accounting services fees | 26 | |||
| Registration and filing fees | 102 | |||
| Board of Directors' fees | 7 | |||
| Audit fees | 13 | |||
| Other expenses | 38 | |||
| Total expenses (before waivers) | 1,776 | |||
| Expense waivers | (11 | ) | ||
| Total waivers | (11 | ) | ||
| Total expenses, net | 1,765 | |||
| Net Investment Income | 959 | |||
| Net Realized Gain on Investments: | ||||
| Capital gain distributions received from affiliated investment companies | 3,767 | |||
| Net realized gain on investments in affiliated investment companies | 4,846 | |||
| Net Realized Gain on Investments | 8,613 | |||
| Net Changes in Unrealized Depreciation of Investments: | ||||
| Net unrealized depreciation of investments in affiliated investment companies | (6,598 | ) | ||
| Net Changes in Unrealized Depreciation of Investments | (6,598 | ) | ||
| Net Gain on Investments | 2,015 | |||
| Net Increase in Net Assets Resulting from Operations | $ | 2,974 |
The accompanying notes are an integral part of these financial statements.
| 9 |
| The Hartford Conservative Allocation Fund |
| Statement of Changes in Net Assets |
| (000’s Omitted) |
| For the Year Ended October 31, 2014 | For the Year Ended October 31, 2013 | |||||||
| Operations: | ||||||||
| Net investment income | $ | 959 | $ | 1,863 | ||||
| Net realized gain on investments | 8,613 | 13,403 | ||||||
| Net unrealized depreciation of investments | (6,598 | ) | (10,393 | ) | ||||
| Net Increase in Net Assets Resulting from Operations | 2,974 | 4,873 | ||||||
| Distributions to Shareholders: | ||||||||
| From net investment income | ||||||||
| Class A | (1,116 | ) | (4,708 | ) | ||||
| Class B | — | (396 | ) | |||||
| Class C | — | (1,445 | ) | |||||
| Class I | (16 | ) | (51 | ) | ||||
| Class R3 | (28 | ) | (273 | ) | ||||
| Class R4 | (36 | ) | (369 | ) | ||||
| Class R5 | (42 | ) | (109 | ) | ||||
| Total from net investment income | (1,238 | ) | (7,351 | ) | ||||
| From net realized gain on investments | ||||||||
| Class A | (4,476 | ) | (3,331 | ) | ||||
| Class B | (339 | ) | (346 | ) | ||||
| Class C | (1,635 | ) | (1,182 | ) | ||||
| Class I | (42 | ) | (30 | ) | ||||
| Class R3 | (333 | ) | (187 | ) | ||||
| Class R4 | (216 | ) | (283 | ) | ||||
| Class R5 | (106 | ) | (85 | ) | ||||
| Total from net realized gain on investments | (7,147 | ) | (5,444 | ) | ||||
| Total distributions | (8,385 | ) | (12,795 | ) | ||||
| Capital Share Transactions: | ||||||||
| Class A | (9,898 | ) | (14,537 | ) | ||||
| Class B | (4,133 | ) | (5,764 | ) | ||||
| Class C | (5,566 | ) | (3,615 | ) | ||||
| Class I | 461 | (36 | ) | |||||
| Class R3 | (134 | ) | 1,153 | |||||
| Class R4 | (2,664 | ) | (6,185 | ) | ||||
| Class R5 | 307 | (702 | ) | |||||
| Net decrease from capital share transactions | (21,627 | ) | (29,686 | ) | ||||
| Net Decrease in Net Assets | (27,038 | ) | (37,608 | ) | ||||
| Net Assets: | ||||||||
| Beginning of period | 235,302 | 272,910 | ||||||
| End of period | $ | 208,264 | $ | 235,302 | ||||
| Undistributed (distributions in excess of) net investment income | $ | — | $ | — | ||||
The accompanying notes are an integral part of these financial statements.
| 10 |
| The Hartford Conservative Allocation Fund |
| Notes to Financial Statements |
| October 31, 2014 |
| (000’s Omitted) |
Organization:
The Hartford Mutual Funds, Inc. (“Company”) is an open-end management investment company comprised of forty-two portfolios. Financial statements for The Hartford Conservative Allocation Fund (the "Fund"), a series of the Company, are included in this report.
The Company is organized under the laws of the State of Maryland and is registered with the Securities and Exchange Commission (“SEC”) under the Investment Company Act of 1940, as amended (“1940 Act”). The Fund is a diversified open-end management investment company. The Fund is an investment company and applies specialized accounting and reporting under Accounting Standards Codification Topic 946, Financial Services - Investment Companies.
Class A shares are sold with a front-end sales charge of up to 5.50%. Class B shares were sold with a contingent deferred sales charge which is assessed on the lesser of the per share net asset value (“NAV”) of the shares at the time of redemption or the original purchase price, and declines from up to 5.00% to zero depending on the period of time the shares are held (see note below regarding the closing of Class B shares). Class C shares are sold with a contingent deferred sales charge of up to 1.00% on shares redeemed within twelve months of purchase. Class I shares are sold without sales charges to certain eligible investors primarily through advisory fee-based wrap programs. Class R3, R4 and R5 shares, which are offered to employer-sponsored retirement plans, are sold without a sales charge. All classes of shares have identical voting, redemption, dividend, liquidation and other rights and the same terms and conditions, with the exceptions that each class may have different expenses, which may affect performance, and that Class B shares automatically convert to Class A shares after 8 years.
The Fund, as a “Fund of Funds,” invests the majority of its assets in Class Y shares of other Hartford Funds ("Affiliated Investment Companies") and may also invest in one or more unaffiliated money market funds (together with the Affiliated Investment Companies, the "Underlying Funds"), certain exchange traded funds (“ETFs”) and/or exchange traded notes (“ETNs”). The Fund seeks its investment goal through implementation of a strategic asset allocation recommendation provided by Wellington Management Company, LLP (“Wellington Management”), the sub-adviser to the Fund.
No new or additional investments are allowed in Class B shares of the Fund (including investments through any systematic investment plan). Existing shareholders of Class B shares may continue to hold their Class B shares, exchange their Class B shares for Class B shares of another Hartford Fund (as permitted by existing exchange privileges), or redeem their Class B shares as described in the Fund’s prospectus. Reinstatement privileges with respect to Class B shares are set forth in the Fund's prospectus. For investors electing to reinvest capital gains and dividends, any such capital gains or dividends on Class B shares will continue to be reinvested in Class B shares of the Fund. All Class B share attributes, including the 12b-1 fee, contingent deferred sales charge schedule, and conversion to Class A shares, remain unchanged.
Significant Accounting Policies:
The significant accounting policies of the Affiliated Investment Companies are outlined in the shareholder reports for such funds, available (1) without charge, upon request, by calling 888-843-7824, (2) on our website www.hartfordfunds.com and (3) on the SEC’s website at www.sec.gov. The reports may be reviewed and copied at the Commission’s Public Reference Room in Washington, DC. Information on the operation of the Public Reference Room may be obtained by calling 1-800-SEC-0330. The significant accounting policies of the Affiliated Investment Companies are not covered by this report.
The following is a summary of significant accounting policies of the Fund in the preparation of its financial statements, which are in accordance with United States generally accepted accounting principles (“U.S. GAAP”). The preparation of financial statements in accordance with U.S. GAAP may require management to make estimates and assumptions that affect the reported amounts of assets and liabilities and disclosure of contingent assets and liabilities at the date of the financial statements and the reported amounts of increases and decreases in net assets from operations during the reporting period. Actual results could differ from those estimates.
Determination of Net Asset Value – The NAV of each class of the Fund's shares is determined as of the close of regular trading (normally 4:00 p.m. Eastern Time) (the “NYSE Close”) on each day that the New York Stock Exchange (the “Exchange”) is open (“Valuation Date”). Information that becomes known to the Fund after the NAV has been calculated on a particular day will not generally be used to retroactively adjust the NAV determined earlier that day.
| 11 |
| The Hartford Conservative Allocation Fund |
| Notes to Financial Statements – (continued) |
| October 31, 2014 |
| (000’s Omitted) |
Investment Valuation and Fair Value Measurements – Investments in open-end mutual funds are valued at the respective NAV of each Underlying Fund as determined as of the NYSE Close on the Valuation Date. The Fund generally uses market prices in valuing the remaining portfolio investments. If market prices are not readily available or are deemed unreliable, the Fund will use the fair value of the investment as determined in good faith under policies and procedures established by and under the supervision of the Company’s Board of Directors.
U.S. GAAP defines fair value as the price that the Fund would receive to sell an asset or pay to transfer a liability in an orderly transaction between market participants. The U.S. GAAP fair value measurement standards require disclosure of a fair value hierarchy for each major category of assets and liabilities. Various inputs are used in determining the fair value of the Fund’s investments. These inputs are summarized into three broad hierarchy levels. This hierarchy is based on whether the valuation inputs are observable or unobservable. These levels are:
Level 1 – Quoted prices in active markets for identical investments. Level 1 may include exchange traded instruments, such as domestic equities, some foreign equities, options, futures, mutual funds, exchange traded funds, rights and warrants.
Level 2 – Observable inputs other than Level 1 prices, such as quoted prices for similar investments; quoted prices in markets that are not active; or other inputs that are observable or can be corroborated by observable market data. Level 2 may include debt investments that are traded less frequently than exchange traded instruments and which are valued using independent pricing services; foreign equities, which are principally traded on certain foreign markets and are adjusted daily pursuant to a fair value pricing service in order to reflect an adjustment for the factors occurring after the close of certain foreign markets but before the NYSE Close; senior floating rate interests, which are valued using an aggregate of dealer bids; short-term investments, which are valued at amortized cost; and swaps, which are valued based upon the terms of each swap contract.
Level 3 – Significant unobservable inputs that are supported by limited or no market activity. Level 3 may include financial instruments whose values are determined using indicative market quotes or require significant management judgment or estimation. These unobservable valuation inputs may include estimates for current yields, maturity/duration, prepayment speed, and indicative market quotes for comparable investments along with other assumptions relating to credit quality, collateral value, complexity of the investment structure, general market conditions and liquidity. This category may include investments where trading has been halted or there are certain restrictions on trading. While these investments are priced using unobservable inputs, the valuation of these investments reflects the best available data and management believes the prices are a reasonable representation of exit price.
Valuation levels are not necessarily indicative of the risk associated with investing in such investments. Individual investments within any of the above mentioned asset classes may be assigned a different hierarchical level than those presented above, as individual circumstances dictate.
For additional information, refer to the Investment Valuation Hierarchy Level Summary which follows the Schedule of Investments.
Investment Transactions and Investment Income – Investment transactions are recorded as of the trade date (the date the order to buy or sell is executed) for financial reporting purposes. Realized gains and losses are determined on the basis of identified cost.
Dividend income is accrued on the ex-dividend date. Income and capital gain distributions from the Underlying Funds are accrued on the ex-dividend date.
Fund Share Valuation and Dividend Distributions to Shareholders – Orders for the Fund’s shares are executed in accordance with the investment instructions of the shareholders. The NAV of the Fund’s shares is determined as of the close of business on each business day of the Exchange. The NAV is determined separately for each class of shares of the Fund by dividing the Fund’s net assets attributable to that class by the number of shares of the class outstanding. Each class of shares offered by the Fund has equal rights as to assets and voting privileges (except that shareholders of a class have exclusive voting rights regarding any matter relating solely to that class of shares). Income and non-class specific expenses are allocated daily to each class on the basis of the relative net assets of the class. Realized and unrealized gains and losses are allocated daily based on the relative net assets of each class of shares of the Fund.
| 12 |
| The Hartford Conservative Allocation Fund |
| Notes to Financial Statements – (continued) |
| October 31, 2014 |
| (000’s Omitted) |
Orders for the purchase of the Fund’s shares received prior to the close of the Exchange on any day the Exchange is open for business are priced at the NAV determined as of the close of the Exchange. Orders received after the close of the Exchange, or on a day on which the Exchange and/or the Fund is not open for business, are priced at the next determined NAV.
Dividends are declared pursuant to a policy adopted by the Company's Board of Directors based upon the investment performance of the Fund. The policy of the Fund is to pay dividends from net investment income, if any, quarterly and realized gains, if any, at least once a year. Long-term capital gain distributions are distributed by the Underlying Funds at least annually, when required. Unless shareholders specify otherwise, all dividends and distributions will be automatically reinvested in additional full or fractional shares of the Fund.
Net investment income, dividends and distributions from net realized gains and capital are determined in accordance with federal income tax regulations, which may differ from U.S. GAAP with respect to character and timing (see Federal Income Taxes: Distributions and Components of Distributable Earnings and Reclassification of Capital Accounts).
Principal Risks:
The Fund is exposed to the risks of the Underlying Funds and/or ETFs/ETNs in direct proportion to the amount of assets the Fund allocates to each Underlying Fund and/or ETF/ETN. The market values of the Underlying Funds and/or ETFs/ETNs may decline due to general market conditions which are not specifically related to a particular company in which the Underlying Fund and/or ETF/ETN invested, such as real or perceived adverse economic conditions, changes in the general outlook for corporate earnings, changes in interest or currency rates or adverse investor sentiment generally. The market value of equity securities in which the Underlying Funds and/or ETFs/ETNs invest may also decline due to factors which affect a particular industry or industries, such as labor shortages or increased production costs and competitive conditions within an industry.
Federal Income Taxes:
Federal Income Taxes – For federal income tax purposes, the Fund intends to continue to qualify as a Regulated Investment Company ("RIC") under Subchapter M of the Internal Revenue Code (“IRC”) by distributing substantially all of its taxable net investment income and net realized capital gains to its shareholders and otherwise complying with the requirements of the IRC. The Fund has distributed substantially all of its income and capital gains in prior years, if applicable, and intends to distribute substantially all of its income and capital gains during the calendar year ending December 31, 2014. Accordingly, no provision for federal income or excise taxes has been made in the accompanying financial statements. Distributions from short-term capital gains are treated as ordinary income distributions for federal income tax purposes.
Net Investment Income (Loss), Net Realized Gains (Losses) and Distributions – Net investment income (loss) and net realized gains (losses) may differ for financial statement and tax purposes primarily because of losses deferred due to wash sale adjustments and short-term capital gain adjustments. The character of distributions made during the year from net investment income or net realized gains may differ from their ultimate characterization for federal income tax purposes. Also, due to the timing of dividend distributions, the fiscal year in which amounts are distributed may differ from the year that the income or realized gains (losses) were recorded by the Fund.
Distributions and Components of Distributable Earnings – The tax character of distributions paid by the Fund for the periods indicated is as follows (as adjusted for dividends payable, if applicable):
| For the Year Ended October 31, 2014 | For the Year Ended October 31, 2013 | |||||||
| Ordinary Income | $ | 2,126 | $ | 7,351 | ||||
| Long-Term Capital Gains ‡ | 6,259 | 5,444 | ||||||
| ‡ | The Fund designates these distributions as long-term capital gain dividends pursuant to IRC Sec. 852(b)(3)(C). |
| 13 |
| The Hartford Conservative Allocation Fund |
| Notes to Financial Statements – (continued) |
| October 31, 2014 |
| (000’s Omitted) |
As of October 31, 2014, the Fund’s components of distributable earnings (deficit) on a tax basis are as follows:
| Amount | ||||
| Undistributed Long-Term Capital Gain | $ | 8,694 | ||
| Accumulated Capital and Other Losses* | (237 | ) | ||
| Unrealized Depreciation† | (1,558 | ) | ||
| Total Accumulated Earnings | $ | 6,899 | ||
| * | The Fund has capital loss carryforwards that are identified in the Capital Loss Carryforward note that follows. |
| † | Differences between book-basis and tax-basis unrealized appreciation (depreciation) may be attributable to the losses deferred due to wash sale adjustments, foreign currency gains and losses, adjustments related to PFICs, REITs, RICs, certain derivatives and partnerships. |
Reclassification of Capital Accounts – The Fund may record reclassifications in its capital accounts. These reclassifications have no impact on the total net assets of the Fund. The reclassifications are a result of permanent differences between U.S. GAAP and tax accounting for such items as expiration or utilization of capital loss carryforwards or net operating losses. Adjustments are made to reflect the impact these items have on current and future distributions to shareholders. Therefore, the source of the Fund’s distributions may be shown in the accompanying Statement of Changes in Net Assets as from undistributed net investment income, from accumulated net realized gains on investments or from capital depending on the type of book and tax differences that exist. For the year ended October 31, 2014, the Fund recorded reclassifications to increase (decrease) the accounts listed below:
| Amount | ||||
| Undistributed Net Investment Income (Loss) | $ | 279 | ||
| Accumulated Net Realized Gain (Loss) | (279 | ) | ||
Capital Loss Carryforward – On December 22, 2010, the Regulated Investment Company Modernization Act of 2010 (the “Act”) was enacted, which made changes to the capital loss carryforward rules. The changes are effective for taxable years beginning after the date of enactment. Under the Act, funds are permitted to carry forward capital losses for an unlimited period. However, any losses incurred during those future taxable years will be required to be utilized prior to the losses incurred in pre-enactment taxable years, which carry an expiration date. As a result of this ordering rule, pre-enactment capital loss carryforwards may be more likely to expire unused. Additionally, post-enactment capital loss carryforwards retain their character as either short-term or long-term capital losses rather than being considered all short-term as permitted under prior regulation.
At October 31, 2014 (tax year end), the Fund had capital loss carryforwards for U.S. federal income tax purposes as follows:
| Year of Expiration | Amount | |||
| 2016 | $ | 237 | ||
| Total | $ | 237 | ||
As a result of mergers in the Fund, certain provisions in the IRC may limit the future utilization of capital losses. During the year ended October 31, 2014, the Fund utilized $211 of prior year capital loss carryforwards.
Accounting for Uncertainty in Income Taxes – The Fund has adopted financial reporting rules that require the Fund to analyze all open tax years, as defined by the statute of limitations, for all major jurisdictions. Generally, tax authorities can examine all tax returns filed for the last three years. The Fund does not have an examination in progress.
The Fund has reviewed all open tax years and major jurisdictions and concluded that these financial reporting rules had no effect on the Fund’s financial position or results of operations. There is no tax liability resulting from unrecognized tax benefits relating to uncertain income tax positions taken or expected to be taken on the tax return for the fiscal year ended October 31, 2014. The Fund is also not aware of any tax positions for which it is reasonably possible that the total amounts of unrecognized tax benefits will significantly change in the next twelve months.
| 14 |
| The Hartford Conservative Allocation Fund |
| Notes to Financial Statements – (continued) |
| October 31, 2014 |
| (000’s Omitted) |
Expenses:
Investment Management Agreement – Hartford Funds Management Company, LLC ("HFMC") serves as the Fund’s investment manager pursuant to an Investment Management Agreement with the Company. HFMC is an indirect wholly owned subsidiary of The Hartford Financial Services Group, Inc. ("The Hartford"). The investment manager has overall investment supervisory responsibility for the Fund. In addition, the investment manager provides administrative personnel, services, equipment, facilities and office space for proper operation of the Fund. HFMC has contracted with Wellington Management under a sub-advisory agreement for the provision of day-to-day investment management services to the Fund in accordance with the Fund’s investment objective and policies. The Fund pays a fee to the investment manager, a portion of which may be used to compensate Wellington Management.
The schedule below reflects the rates of compensation paid to the investment manager for investment management services rendered as of October 31, 2014; the rates are accrued daily and paid monthly:
| Average Daily Net Assets | Annual Fee |
| On first $500 million | 0.15% |
| On next $500 million | 0.10% |
| On next $1.5 billion | 0.09% |
| On next $2.5 billion | 0.08% |
| On next $2.5 billion | 0.07% |
| On next $2.5 billion | 0.06% |
| Over $10 billion | 0.05% |
Accounting Services Agreement – Pursuant to the Fund Accounting Agreement between HFMC and the Company, on behalf of the Fund, HFMC provides accounting services to the Fund and receives monthly compensation based on the Fund’s average daily net assets at the rates set forth below. The Fund’s accounting services fees are accrued daily and paid monthly.
| Average Daily Net Assets | Annual Fee |
| On first $5 billion | 0.012% |
| Over $5 billion | 0.010% |
Operating Expenses – Allocable expenses incurred by the Company are allocated to each Fund and allocated to classes within the Fund in proportion to the average daily net assets of the Fund and each class, except where allocation of certain expenses is more fairly made directly to the Fund or to specific classes within a Fund. As of October 31, 2014, HFMC contractually limited the total operating expenses of this Fund, exclusive of taxes, interest expense, brokerage commissions and extraordinary expenses, through February 28, 2015 as follows:
| Class A | Class B | Class C | Class I | Class R3 | Class R4 | Class R5 |
| 1.35% | 2.10% | 2.10% | 1.10% | 1.60% | 1.30% | 1.00% |
Contractual limitations for total operating expenses include expenses incurred as the result of investing in other investment companies including the Underlying Funds. Amounts incurred which exceed the above limits are deducted from expenses and are reported as expense waivers on the accompanying Statement of Operations, as applicable.
Distribution and Service Plan for Class A, B, C, R3 and R4 Shares – Hartford Funds Distributors, LLC ("HFD"), an indirect wholly owned subsidiary of The Hartford, is the principal underwriter and distributor of the Fund. HFD is engaged in distribution activities, which include marketing and distribution of shares through broker/dealers, financing distribution costs and maintaining financial books and records. For the year ended October 31, 2014, HFD received front-end load sales charges of $309 and contingent deferred sales charges of $8 from the Fund.
The Fund has adopted a Distribution and Service Plan in accordance with Rule 12b-1 of the 1940 Act to compensate the distributor (HFD) for activities intended to result in the sale and distribution of Class A, B, C, R3 and R4 shares and for providing services for
| 15 |
| The Hartford Conservative Allocation Fund |
| Notes to Financial Statements – (continued) |
| October 31, 2014 |
| (000’s Omitted) |
shareholders. The Rule 12b-1 plan applicable to Class A shares of the Fund provides for payment of a Rule 12b-1 fee of 0.25% of average daily net assets. Some or all of the fee may be used for shareholder servicing expenses with the remainder used for distribution expenses. Under the Class B Plan, the Fund pays the distributor 1.00% of the average daily net assets of Class B shares that are outstanding for 8 years or less, 0.25% of which is a fee for services provided to existing shareholders with the remainder used for distribution expenses. Some or the entire Rule 12b-1 fee for Class B shares may be remitted to broker/dealers for distribution and/or shareholder account services. After eight years, Class B shares convert to Class A shares. Upon conversion to Class A shares, the Class A plan described above will apply to those shares. Under the Class C Plan, the Fund pays the distributor 1.00% of the average daily net assets of Class C shares outstanding, 0.25% of which is intended as a fee for services provided to existing shareholders with the remainder used for distribution expenses. For Class C shares, some or the entire fee may be remitted to broker/dealers for distribution and/or shareholder account services. Class R3 shares have a distribution fee of 0.50% of average daily net assets and Class R4 shares have a distribution fee of 0.25% of average daily net assets. For Class R3 and R4 shares, some or the entire fee may be remitted to broker/dealers for distribution and/or shareholder account services. The Fund’s 12b-1 fees are accrued daily and paid monthly or at such other intervals as the Board of Directors may determine.
Other Related Party Transactions – Certain officers of the Fund are directors and/or officers of HFMC and/or The Hartford or its subsidiaries. For the year ended October 31, 2014, a portion of the Fund’s Chief Compliance Officer’s compensation was paid by all of the investment companies in the Hartford fund complex. The portion allocated to the Fund, as represented in other expenses on the Statement of Operations, rounds to zero. Hartford Administrative Services Company (“HASCO”), an indirect wholly-owned subsidiary of The Hartford, provides transfer agent services to the Fund. HASCO has contractually agreed to reimburse any portion of the transfer agency fees over 0.30% of average daily net assets per fiscal year for each class. Any transfer agency fee reimbursement is determined before considering the contractual operating expense limitation. For providing such services, HASCO is compensated on a per account basis that varies by account type. The amount paid to HASCO and any related contractual reimbursement amounts, if applicable, can be found in the Statement of Operations. These fees are accrued daily and paid monthly.
Administrative services fees are paid to HASCO for third-party recordkeeping services that are payable as a percentage of net assets in the amount of up to 0.20%, 0.15% and 0.10% for Classes R3, R4 and R5 shares, respectively. The total administrative services fees are shown on the Statement of Operations. These fees are accrued daily and paid monthly.
Investment Transactions:
For the year ended October 31, 2014, the cost of purchases and proceeds from sales of investment securities (excluding short-term investments) were as follows:
| Excluding U.S. Government Obligations | U.S. Government Obligations | Total | ||||||||||
| Cost of Purchases | $ | 59,567 | $ | — | $ | 59,567 | ||||||
| Sales Proceeds | 84,952 | — | 84,952 | |||||||||
| 16 |
| The Hartford Conservative Allocation Fund |
| Notes to Financial Statements – (continued) |
| October 31, 2014 |
| (000’s Omitted) |
Capital Share Transactions:
The following information is for the year ended October 31, 2014, and the year ended October 31, 2013:
| For the Year Ended October 31, 2014 | For the Year Ended October 31, 2013 | |||||||||||||||||||||||||||||||
| Shares Sold | Shares
Issued for Reinvested Dividends | Shares Redeemed | Net
Increase (Decrease) of Shares | Shares Sold | Shares
Issued for Reinvested Dividends | Shares Redeemed | Net
Increase (Decrease) of Shares | |||||||||||||||||||||||||
| Class A | ||||||||||||||||||||||||||||||||
| Shares | 1,844 | 517 | (3,262 | ) | (901 | ) | 2,522 | 713 | (4,576 | ) | (1,341 | ) | ||||||||||||||||||||
| Amount | $ | 20,008 | $ | 5,490 | $ | (35,396 | ) | $ | (9,898 | ) | $ | 27,828 | $ | 7,843 | $ | (50,208 | ) | $ | (14,537 | ) | ||||||||||||
| Class B | ||||||||||||||||||||||||||||||||
| Shares | 22 | 32 | (435 | ) | (381 | ) | 67 | 65 | (658 | ) | (526 | ) | ||||||||||||||||||||
| Amount | $ | 235 | $ | 335 | $ | (4,703 | ) | $ | (4,133 | ) | $ | 741 | $ | 713 | $ | (7,218 | ) | $ | (5,764 | ) | ||||||||||||
| Class C | ||||||||||||||||||||||||||||||||
| Shares | 576 | 148 | (1,238 | ) | (514 | ) | 914 | 223 | (1,476 | ) | (339 | ) | ||||||||||||||||||||
| Amount | $ | 6,211 | $ | 1,553 | $ | (13,330 | ) | $ | (5,566 | ) | $ | 10,023 | $ | 2,452 | $ | (16,090 | ) | $ | (3,615 | ) | ||||||||||||
| Class I | ||||||||||||||||||||||||||||||||
| Shares | 149 | 5 | (110 | ) | 44 | 90 | 7 | (102 | ) | (5 | ) | |||||||||||||||||||||
| Amount | $ | 1,591 | $ | 55 | $ | (1,185 | ) | $ | 461 | $ | 1,007 | $ | 76 | $ | (1,119 | ) | $ | (36 | ) | |||||||||||||
| Class R3 | ||||||||||||||||||||||||||||||||
| Shares | 239 | 34 | (284 | ) | (11 | ) | 310 | 42 | (248 | ) | 104 | |||||||||||||||||||||
| Amount | $ | 2,589 | $ | 361 | $ | (3,084 | ) | $ | (134 | ) | $ | 3,434 | $ | 460 | $ | (2,741 | ) | $ | 1,153 | |||||||||||||
| Class R4 | ||||||||||||||||||||||||||||||||
| Shares | 123 | 24 | (392 | ) | (245 | ) | 125 | 59 | (747 | ) | (563 | ) | ||||||||||||||||||||
| Amount | $ | 1,350 | $ | 250 | $ | (4,264 | ) | $ | (2,664 | ) | $ | 1,389 | $ | 651 | $ | (8,225 | ) | $ | (6,185 | ) | ||||||||||||
| Class R5 | ||||||||||||||||||||||||||||||||
| Shares | 71 | 14 | (58 | ) | 27 | 70 | 18 | (152 | ) | (64 | ) | |||||||||||||||||||||
| Amount | $ | 785 | $ | 147 | $ | (625 | ) | $ | 307 | $ | 777 | $ | 194 | $ | (1,673 | ) | $ | (702 | ) | |||||||||||||
| Total | ||||||||||||||||||||||||||||||||
| Shares | 3,024 | 774 | (5,779 | ) | (1,981 | ) | 4,098 | 1,127 | (7,959 | ) | (2,734 | ) | ||||||||||||||||||||
| Amount | $ | 32,769 | $ | 8,191 | $ | (62,587 | ) | $ | (21,627 | ) | $ | 45,199 | $ | 12,389 | $ | (87,274 | ) | $ | (29,686 | ) | ||||||||||||
The following reflects the conversion of Class B shares into Class A shares (reflected as Class A shares sold) for the year ended October 31, 2014, and the year ended October 31, 2013:
| Shares | Dollars | |||||||
| For the Year Ended October 31, 2014 | 79 | $ | 861 | |||||
| For the Year Ended October 31, 2013 | 111 | $ | 1,225 | |||||
Line of Credit:
The Fund is one of several Hartford Funds that participate in a $500 million committed revolving line of credit facility. The facility is to be used for temporary or emergency purposes. Under the arrangement, the funds are required to own securities having a market value in excess of 300% of the total bank borrowings. The interest rate on borrowings varies depending on the nature of the loan. The facility also requires a fee to be paid based on the amount of the commitment. This commitment fee is allocated to all the funds participating in the line of credit based on the average net assets of the funds. During the year ended October 31, 2014, the Fund did not have any borrowings under this facility.
Pending Legal Proceedings:
On February 25, 2011, Jennifer L. Kasilag, Louis Mellinger, Judith M. Menendez, Jacqueline M. Robinson, and Linda A. Russell filed a derivative lawsuit against Hartford Investment Financial Services, LLC (“HIFSCO”) (now known as HFD) on behalf of six Hartford retail mutual funds in the United States District Court for the District of New Jersey, alleging that HIFSCO received excessive advisory and distribution fees in violation of its statutory fiduciary duty under Section 36(b) of the 1940 Act when serving as investment manager and principal underwriter, respectively, to the Hartford retail mutual funds. Although this action was purportedly filed on behalf of certain of the Hartford Funds, none of the Hartford Funds is itself a defendant to the suit. HIFSCO moved to dismiss and, in September 2011, the motion was granted in part and denied in part, with leave to amend the complaint. In November 2011, plaintiffs filed an amended complaint on
| 17 |
| The Hartford Conservative Allocation Fund |
| Notes to Financial Statements – (continued) |
| October 31, 2014 |
| (000’s Omitted) |
behalf of certain Hartford retail mutual funds, The Hartford Global Health Fund (now known as The Hartford Healthcare Fund), The Hartford Conservative Allocation Fund, The Hartford Growth Opportunities Fund, The Hartford Inflation Plus Fund, The Hartford Advisers Fund (now known as The Hartford Balanced Fund), and The Hartford Capital Appreciation Fund. Plaintiffs seek to rescind the investment management agreements and distribution plans between HIFSCO and these funds and to recover the total fees charged thereunder or, in the alternative, to recover any improper compensation HIFSCO received, in addition to lost earnings. HIFSCO filed a partial motion to dismiss the amended complaint and, in December 2012, the court dismissed without prejudice the claims regarding distribution fees and denied the motion with respect to the advisory fees claims. HIFSCO disputes the allegations and intends to defend vigorously.
In March 2014, the plaintiffs filed a new complaint that added as new plaintiffs The Hartford Floating Rate Fund and The Hartford Small Company Fund and named as a defendant HFMC, which assumed the role as investment manager to the funds as of January 2013. HFMC and HIFSCO dispute the allegations and intend to defend vigorously.
No accrual for litigation relating to this matter has been recorded in the financial statements of the Fund because the Fund is not party to the suit.
Indemnifications:
Under the Company's organizational documents, the Company shall indemnify its officers and directors to the full extent required or permitted under Maryland General Corporation Law and the federal securities laws. In addition, the Company, on behalf of the Fund, may enter into contracts that contain a variety of indemnifications. The Company's maximum exposure under these arrangements is unknown. However, as of the date of these financial statements, the Company has not had prior claims or losses pursuant to these contracts and expects the risk of loss to be remote.
Subsequent Event:
Effective December 1, 2014, pursuant to a sub-transfer agency agreement between HASCO and Boston Financial Data Services, Inc. (“BFDS”), HASCO has delegated certain transfer agent, dividend disbursing agent and shareholder servicing agent functions to BFDS. The costs and expenses of such delegation are borne by HASCO, not by the Fund.
| 18 |
| The Hartford Conservative Allocation Fund |
| Financial Highlights |
| - Selected Per-Share Data - (A) | - Ratios and Supplemental Data - | |||||||||||||||||||||||||||||||||||||||||||||||||||
| Class | Net
Asset Value at Beginning of Period | Net Investment Income (Loss) | Net Realized and Unrealized Gain (Loss) on Invest- ments | Total
from Investment Operations | Dividends from Net Investment Income | Distribu- tions from Realized Capital Gains | Total Dividends and Distributions | Net Asset Value at End of Period | Total Return(B) | Net Assets at End of Period (000's) | Ratio
of Expenses to Average Net Assets Before Adjust- ments(C),(D) | Ratio
of Expenses to Average Net Assets After Adjust- ments(C),(D) | Ratio
of Net Investment Income (Loss) to Average Net Assets(D) | |||||||||||||||||||||||||||||||||||||||
| For the Year Ended October 31, 2014 | ||||||||||||||||||||||||||||||||||||||||||||||||||||
| A | $ | 11.05 | $ | 0.07 | $ | 0.09 | $ | 0.16 | $ | (0.09 | ) | $ | (0.34 | ) | $ | (0.43 | ) | $ | 10.78 | 1.50 | % | $ | 134,286 | 0.59 | % | 0.59 | % | 0.64 | % | |||||||||||||||||||||||
| B | 10.99 | (0.01 | ) | 0.08 | 0.07 | – | (0.34 | ) | (0.34 | ) | 10.72 | 0.71 | 6,872 | 1.43 | 1.40 | (0.13 | ) | |||||||||||||||||||||||||||||||||||
| C | 10.98 | (0.01 | ) | 0.08 | 0.07 | – | (0.34 | ) | (0.34 | ) | 10.71 | 0.71 | 46,745 | 1.34 | 1.34 | (0.09 | ) | |||||||||||||||||||||||||||||||||||
| I | 11.06 | 0.10 | 0.08 | 0.18 | (0.13 | ) | (0.34 | ) | (0.47 | ) | 10.77 | 1.76 | 1,829 | 0.32 | 0.32 | 0.91 | ||||||||||||||||||||||||||||||||||||
| R3 | 11.06 | 0.03 | 0.09 | 0.12 | (0.03 | ) | (0.34 | ) | (0.37 | ) | 10.81 | 1.17 | 10,141 | 0.94 | 0.90 | 0.31 | ||||||||||||||||||||||||||||||||||||
| R4 | 11.04 | 0.07 | 0.08 | 0.15 | (0.06 | ) | (0.34 | ) | (0.40 | ) | 10.79 | 1.45 | 4,806 | 0.64 | 0.60 | 0.65 | ||||||||||||||||||||||||||||||||||||
| R5 | 11.08 | 0.10 | 0.08 | 0.18 | (0.13 | ) | (0.34 | ) | (0.47 | ) | 10.79 | 1.74 | 3,585 | 0.34 | 0.30 | 0.92 | ||||||||||||||||||||||||||||||||||||
| For the Year Ended October 31, 2013 | ||||||||||||||||||||||||||||||||||||||||||||||||||||
| A | $ | 11.35 | $ | 0.10 | $ | 0.15 | $ | 0.25 | $ | (0.32 | ) | $ | (0.23 | ) | $ | (0.55 | ) | $ | 11.05 | 2.26 | % | $ | 147,617 | 0.58 | % | 0.58 | % | 0.93 | % | |||||||||||||||||||||||
| B | 11.33 | 0.03 | 0.13 | 0.16 | (0.27 | ) | (0.23 | ) | (0.50 | ) | 10.99 | 1.42 | 11,240 | 1.40 | 1.40 | 0.27 | ||||||||||||||||||||||||||||||||||||
| C | 11.32 | 0.02 | 0.15 | 0.17 | (0.28 | ) | (0.23 | ) | (0.51 | ) | 10.98 | 1.51 | 53,554 | 1.32 | 1.32 | 0.17 | ||||||||||||||||||||||||||||||||||||
| I | 11.34 | 0.12 | 0.16 | 0.28 | (0.33 | ) | (0.23 | ) | (0.56 | ) | 11.06 | 2.60 | 1,397 | 0.30 | 0.30 | 1.13 | ||||||||||||||||||||||||||||||||||||
| R3 | 11.37 | 0.05 | 0.17 | 0.22 | (0.30 | ) | (0.23 | ) | (0.53 | ) | 11.06 | 1.99 | 10,496 | 0.93 | 0.93 | 0.48 | ||||||||||||||||||||||||||||||||||||
| R4 | 11.33 | 0.12 | 0.13 | 0.25 | (0.31 | ) | (0.23 | ) | (0.54 | ) | 11.04 | 2.29 | 7,620 | 0.62 | 0.62 | 1.08 | ||||||||||||||||||||||||||||||||||||
| R5 | 11.36 | 0.15 | 0.13 | 0.28 | (0.33 | ) | (0.23 | ) | (0.56 | ) | 11.08 | 2.57 | 3,378 | 0.32 | 0.32 | 1.35 | ||||||||||||||||||||||||||||||||||||
| For the Year Ended October 31, 2012 (E) | ||||||||||||||||||||||||||||||||||||||||||||||||||||
| A | $ | 10.71 | $ | 0.12 | $ | 0.68 | $ | 0.80 | $ | (0.16 | ) | $ | – | $ | (0.16 | ) | $ | 11.35 | 7.55 | % | $ | 166,842 | 0.58 | % | 0.58 | % | 1.13 | % | ||||||||||||||||||||||||
| B | 10.71 | 0.03 | 0.68 | 0.71 | (0.09 | ) | – | (0.09 | ) | 11.33 | 6.69 | 17,538 | 1.39 | 1.39 | 0.38 | |||||||||||||||||||||||||||||||||||||
| C | 10.70 | 0.04 | 0.68 | 0.72 | (0.10 | ) | – | (0.10 | ) | 11.32 | 6.78 | 59,053 | 1.33 | 1.33 | 0.37 | |||||||||||||||||||||||||||||||||||||
| I | 10.69 | 0.16 | 0.67 | 0.83 | (0.18 | ) | – | (0.18 | ) | 11.34 | 7.89 | 1,481 | 0.30 | 0.30 | 1.39 | |||||||||||||||||||||||||||||||||||||
| R3 | 10.74 | 0.08 | 0.68 | 0.76 | (0.13 | ) | – | (0.13 | ) | 11.37 | 7.18 | 9,608 | 0.93 | 0.93 | 0.62 | |||||||||||||||||||||||||||||||||||||
| R4 | 10.69 | 0.11 | 0.69 | 0.80 | (0.16 | ) | – | (0.16 | ) | 11.33 | 7.55 | 14,196 | 0.63 | 0.63 | 1.00 | |||||||||||||||||||||||||||||||||||||
| R5 | 10.71 | 0.15 | 0.68 | 0.83 | (0.18 | ) | – | (0.18 | ) | 11.36 | 7.86 | 4,192 | 0.33 | 0.33 | 1.43 | |||||||||||||||||||||||||||||||||||||
| For the Year Ended October 31, 2011 (E) | ||||||||||||||||||||||||||||||||||||||||||||||||||||
| A | $ | 10.55 | $ | 0.21 | $ | 0.22 | $ | 0.43 | $ | (0.27 | ) | $ | – | $ | (0.27 | ) | $ | 10.71 | 4.09 | % | $ | 163,779 | 0.58 | % | 0.58 | % | 1.99 | % | ||||||||||||||||||||||||
| B | 10.55 | 0.13 | 0.21 | 0.34 | (0.18 | ) | – | (0.18 | ) | 10.71 | 3.24 | 21,454 | 1.37 | 1.37 | 1.20 | |||||||||||||||||||||||||||||||||||||
| C | 10.54 | 0.13 | 0.22 | 0.35 | (0.19 | ) | – | (0.19 | ) | 10.70 | 3.32 | 55,946 | 1.32 | 1.32 | 1.23 | |||||||||||||||||||||||||||||||||||||
| I | 10.54 | 0.23 | 0.22 | 0.45 | (0.30 | ) | – | (0.30 | ) | 10.69 | 4.29 | 1,248 | 0.30 | 0.30 | 2.16 | |||||||||||||||||||||||||||||||||||||
| R3 | 10.59 | 0.18 | 0.21 | 0.39 | (0.24 | ) | – | (0.24 | ) | 10.74 | 3.67 | 7,324 | 0.93 | 0.93 | 1.48 | |||||||||||||||||||||||||||||||||||||
| R4 | 10.54 | 0.21 | 0.20 | 0.41 | (0.26 | ) | – | (0.26 | ) | 10.69 | 3.95 | 13,142 | 0.62 | 0.62 | 1.93 | |||||||||||||||||||||||||||||||||||||
| R5 | 10.55 | 0.23 | 0.23 | 0.46 | (0.30 | ) | – | (0.30 | ) | 10.71 | 4.36 | 4,788 | 0.32 | 0.32 | 2.30 | |||||||||||||||||||||||||||||||||||||
See Portfolio Turnover information on the next page.
| 19 |
| The Hartford Conservative Allocation Fund |
| Financial Highlights – (continued) |
| - Selected Per-Share Data - (A) | - Ratios and Supplemental Data - | |||||||||||||||||||||||||||||||||||||||||||||||||||
| Class | Net
Asset Value at Beginning of Period | Net Investment Income (Loss) | Net Realized and Unrealized Gain (Loss) on Invest- ments | Total
from Investment Operations | Dividends from Net Investment Income | Distribu- tions from Realized Capital Gains | Total Dividends and Distributions | Net Asset Value at End of Period | Total Return(B) | Net Assets at End of Period (000's) | Ratio
of Expenses to Average Net Assets Before Adjust- ments(C),(D) | Ratio
of Expenses to Average Net Assets After Adjust- ments(C),(D) | Ratio
of Net Investment Income (Loss) to Average Net Assets(D) | |||||||||||||||||||||||||||||||||||||||
| For the Year Ended October 31, 2010 (E) | ||||||||||||||||||||||||||||||||||||||||||||||||||||
| A | $ | 9.57 | $ | 0.23 | $ | 0.98 | $ | 1.21 | $ | (0.23 | ) | $ | – | $ | (0.23 | ) | $ | 10.55 | 12.74 | % | $ | 163,353 | 0.58 | % | 0.58 | % | 2.26 | % | ||||||||||||||||||||||||
| B | 9.57 | 0.15 | 0.97 | 1.12 | (0.14 | ) | – | (0.14 | ) | 10.55 | 11.83 | 23,697 | 1.38 | 1.38 | 1.48 | |||||||||||||||||||||||||||||||||||||
| C | 9.56 | 0.15 | 0.98 | 1.13 | (0.15 | ) | – | (0.15 | ) | 10.54 | 11.92 | 53,036 | 1.33 | 1.33 | 1.51 | |||||||||||||||||||||||||||||||||||||
| I | 9.56 | 0.28 | 0.95 | 1.23 | (0.25 | ) | – | (0.25 | ) | 10.54 | 13.02 | 741 | 0.33 | 0.33 | 2.51 | |||||||||||||||||||||||||||||||||||||
| R3 | 9.61 | 0.18 | 1.00 | 1.18 | (0.20 | ) | – | (0.20 | ) | 10.59 | 12.41 | 3,357 | 0.94 | 0.93 | 1.75 | |||||||||||||||||||||||||||||||||||||
| R4 | 9.56 | 0.22 | 0.98 | 1.20 | (0.22 | ) | – | (0.22 | ) | 10.54 | 12.71 | 12,932 | 0.62 | 0.62 | 2.19 | |||||||||||||||||||||||||||||||||||||
| R5 | 9.57 | 0.25 | 0.98 | 1.23 | (0.25 | ) | – | (0.25 | ) | 10.55 | 13.02 | 6,107 | 0.32 | 0.32 | 2.51 | |||||||||||||||||||||||||||||||||||||
| (A) | Information presented relates to a share outstanding throughout the indicated period. Net investment income (loss) per share amounts are calculated based on average shares outstanding unless otherwise noted. |
| (B) | Assumes initial investment at net asset value at the beginning of each period, reinvestment of all distributions, the complete redemption of the investment at net asset value at the end of each period and no sales charge. Total return would be reduced if sales charges were taken into account. |
| (C) | Adjustments include waivers and reimbursements, if applicable. |
| (D) | Ratios do not include expenses of the Underlying Funds and/or ETFs/ETNs, if applicable. |
| (E) | Net investment income (loss) per share amounts have been calculated using the SEC method. |
| Portfolio Turnover Rate for All Share Classes | ||||
| For the Year Ended October 31, 2014 | 27 | % | ||
| For the Year Ended October 31, 2013 | 22 | |||
| For the Year Ended October 31, 2012 | 83 | |||
| For the Year Ended October 31, 2011 | 41 | |||
| For the Year Ended October 31, 2010 | 28 | |||
| 20 |
| Report of Independent Registered Public Accounting Firm |
The Board of Directors and Shareholders of The Hartford Mutual Funds, Inc. |
We have audited the accompanying statement of assets and liabilities, including the schedule of investments, of The Hartford Conservative Allocation Fund (one of the portfolios constituting The Hartford Mutual Funds, Inc. (the Funds)) as of October 31, 2014, and the related statement of operations for the year then ended, the statements of changes in net assets for each of the two years in the period then ended, and the financial highlights for each of the five years in the period then ended. These financial statements and financial highlights are the responsibility of the Funds’ management. Our responsibility is to express an opinion on these financial statements and financial highlights based on our audits.
We conducted our audits in accordance with the standards of the Public Company Accounting Oversight Board (United States). Those standards require that we plan and perform the audit to obtain reasonable assurance about whether the financial statements and financial highlights are free of material misstatement. We were not engaged to perform an audit of the Funds’ internal control over financial reporting. Our audits included consideration of internal control over financial reporting as a basis for designing audit procedures that are appropriate in the circumstances, but not for the purpose of expressing an opinion on the effectiveness of the Funds’ internal control over financial reporting. Accordingly, we express no such opinion. An audit also includes examining, on a test basis, evidence supporting the amounts and disclosures in the financial statements and financial highlights, assessing the accounting principles used and significant estimates made by management, and evaluating the overall financial statement presentation. Our procedures included confirmation of securities owned as of October 31, 2014, by correspondence with the custodian and brokers or by other appropriate auditing procedures where replies from brokers were not received. We believe that our audits provide a reasonable basis for our opinion.
In our opinion, the financial statements and financial highlights referred to above present fairly, in all material respects, the financial position of The Hartford Conservative Allocation Fund of The Hartford Mutual Funds, Inc. at October 31, 2014, the results of its operations for the year then ended, the changes in its net assets for each of the two years in the period then ended, and the financial highlights for each of the five years in the period then ended, in conformity with U.S. generally accepted accounting principles.
|
Minneapolis, Minnesota
December 18, 2014
| 21 |
| The Hartford Conservative Allocation Fund |
| Directors and Officers (Unaudited) |
The Board of Directors of the Company (the "Directors") appoints officers who are responsible for the day-to-day operations of the Fund and who execute policies formulated by the Directors. Each Director serves until his or her death, resignation, or retirement or until the next annual meeting of shareholders is held or until his or her successor is elected and qualifies.
Directors and officers who are employed by or who have a financial interest in The Hartford Financial Services Group, Inc. ("The Hartford") are considered “interested” persons of the Fund pursuant to the 1940 Act. Each officer and two of the Company's Directors, as noted in the chart below, are “interested” persons of the Fund. Each Director serves as a director for The Hartford Mutual Funds, Inc., The Hartford Mutual Funds II, Inc., Hartford Series Fund, Inc., and Hartford HLS Series Fund II, Inc., and as a trustee for The Hartford Alternative Strategies Fund, which, as of October 31, 2014, collectively consist of 66 funds. Correspondence may be sent to Directors and officers c/o Hartford Funds, 5 Radnor Corporate Center, Suite 300, 100 Matsonford Road, Radnor, Pennsylvania 19087, except that correspondence to Mr. Annoni, Mr. Dressen and Ms. Quade may be sent to 500 Bielenberg Drive, Suite 500, Woodbury, Minnesota 55125.
The table below sets forth, for each Director and officer, his or her name, year of birth, current position with the Company and date first elected or appointed to The Hartford Mutual Funds, Inc. ("MF") and The Hartford Mutual Funds II, Inc. ("MF2"), principal occupation, and, for Directors, other directorships held. The Fund’s Statement of Additional Information contains further information on the Directors and is available free of charge by calling 1-888-843-7824 or writing to: Hartford Funds, P.O. Box 55022, Boston, MA 02205-5022.
Information on the aggregate remuneration paid to the directors of the Company can be found in the Statement of Operations herein. The Fund pays to The Hartford a portion of the Chief Compliance Officer’s compensation, but does not pay salaries or compensation to any of its other officers or Directors who are employed by The Hartford.
Non-Interested Directors
Hilary E. Ackermann (1956) Director since September 23, 2014
Ms. Ackermann served as Chief Risk Officer at Goldman Sachs Bank USA from October 2008 to November 2011 and serves as a Director of Dynegy, Inc., an independent power company, from October 2012 to present.
Lynn S. Birdsong (1946) Director since 2003, Chairman of the Investment Committee since 2014
Mr. Birdsong is a private investor. Mr. Birdsong currently serves as a Director of the Sovereign High Yield Investment Company (April 2010 to current). Mr. Birdsong currently serves as an Independent Director of Nomura Partners Funds, Inc. (formerly, The Japan Fund) (April 2003 to current). From 2003 to March 2005, Mr. Birdsong was an Independent Director of the Atlantic Whitehall Funds. From 1979 to 2002, Mr. Birdsong was a Managing Director of Zurich Scudder Investments, an investment management firm. During his employment with Scudder, Mr. Birdsong was an Interested Director of The Japan Fund. From January 1981 through December 2013, Mr. Birdsong was a partner in Birdsong Company, an advertising specialty firm.
Robert M. Gavin, Jr. (1940) Director since 2002 (MF) and 1986 (MF2), Chairman of the Board for each since 2004
Dr. Gavin is an educational consultant. Prior to September 1, 2001, he was President of Cranbrook Education Community and prior to July 1996, he was President of Macalester College, St. Paul, Minnesota.
Duane E. Hill (1945) Director since 2001 (MF) and 2002 (MF2), Chairman of the Nominating Committee since 2003
Mr. Hill is a Partner of TSG Ventures L.P., a private equity investment company. Mr. Hill is a former partner of TSG Capital Group, a private equity investment firm that served as sponsor and lead investor in leveraged buyouts of middle market companies.
Sandra S. Jaffee (1941) Director since 2005
Ms. Jaffee is the founder and Chief Executive Officer of a private company, Homeworks Concierge, LLC, which provides residential property management services in Westchester County, New York (January 2012 to present). Ms. Jaffee served as Chairman (2008 to 2009) and Chief Executive Officer of Fortent (formerly Searchspace Group), a leading provider of compliance/regulatory technology to financial institutions from August 2005 to August 2009. From August 2004 to August 2005, Ms. Jaffee served as an Entrepreneur in Residence with Warburg Pincus, a private equity firm. Prior to joining Warburg Pincus, Ms. Jaffee served as Executive Vice President at Citigroup, from September 1995 to July 2004, where she was President and Chief Executive Officer of Citibank’s Global Securities Services (1995 to 2003). Ms. Jaffee currently serves as a member of the Board of Directors of Broadridge Financial Solutions as well as a Trustee of Muhlenberg College.
| 22 |
| The Hartford Conservative Allocation Fund |
| Directors and Officers (Unaudited) – (continued) |
William P. Johnston (1944) Director since 2005, Chairman of the Compliance Committee since 2005
In June 2006, Mr. Johnston was appointed as Senior Advisor to The Carlyle Group, a global private equity and other alternative asset investment firm and currently serves as an Operating Executive. In July 2006, Mr. Johnston was elected to the Board of Directors of MultiPlan, Inc. and served as a Director (July 2006 to August 2010). In August 2007, Mr. Johnston was elected to the Board of Directors of LifeCare Holdings, Inc. and served as a Director (August 2007 to June 2013). In February 2008, Mr. Johnston was elected to the Board of Directors of HCR-ManorCare, Inc. In May 2006, Mr. Johnston was elected to the Supervisory Board of Fresenius Medical Care AG & Co. KGaA, after its acquisition of Renal Care Group, Inc. in March 2006. Mr. Johnston joined Renal Care Group in November 2002 as a member of the Board of Directors and served as Chairman of the Board from March 2003 through March 2006. From 2002 through 2013, Mr. Johnston served as a Board member of the Georgia O’Keefe Museum. From September 1987 to December 2002, Mr. Johnston was with Equitable Securities Corporation (and its successors, SunTrust Equitable Securities and SunTrust Robinson Humphrey) serving in various investment banking and managerial positions, including Managing Director and Head of Investment Banking, Chief Executive Officer and Vice Chairman.
Phillip O. Peterson (1944) Director since 2002 (MF) and 2000 (MF2), Chairman of the Audit Committee since 2002
Mr. Peterson is a mutual fund industry consultant. He was a partner of KPMG LLP (an accounting firm) until July 1999. Mr. Peterson joined William Blair Funds in February 2007 as a member of the Board of Trustees. From February 2012 to February 2014, Mr. Peterson served as a Trustee of Symetra Variable Mutual Funds. From January 2004 to April 2005, Mr. Peterson served as Independent President of the Strong Mutual Funds.
Lemma W. Senbet (1946) Director since 2005
Dr. Senbet is the William E. Mayer Chair Professor of Finance and Founding Director, Center for Financial Policy, at the University of Maryland, Robert H. Smith School of Business. He was chair of the Finance Department of the University of Maryland, Robert H. Smith School of Business from 1998 to 2006. Since June 2013, he has been on leave from the University to serve as Executive Director of African Economic Research Consortium which focuses on economic policy research and training. Previously, he was a chaired professor of finance at the University of Wisconsin-Madison. Also, he was a Director of the Fortis Funds from March 2000 to July 2002. Dr. Senbet served as Director of the American Finance Association and President of the Western Finance Association. In 2006, Dr. Senbet was inducted Fellow of Financial Management Association International for his career-long distinguished scholarship and professional service.
Interested Directors and Officers
James E. Davey (1964) Director since 2012, President and Chief Executive Officer since 2010
Mr. Davey serves as Executive Vice President of Hartford Life Insurance Company (“HLIC”) and The Hartford. Additionally, Mr. Davey serves as Chairman of the Board, Manager and Senior Managing Director of Hartford Funds Distributors, LLC (“HFD”). He also currently serves as Director, Chairman of the Board, President and Senior Managing Director of Hartford Administrative Services Company (“HASCO”). Mr. Davey also serves as Manager, Chairman of the Board and Senior Managing Director for Hartford Funds Management Company, LLC (“HFMC”) and Director, Chairman of the Board and Senior Managing Director for Hartford Funds Management Group, Inc. ("HFMG"). Mr. Davey has served in various positions within The Hartford and its subsidiaries in connection with the operation of the Hartford Funds. Mr. Davey joined The Hartford in 2002.
Lowndes A. Smith* (1939) Director since 1996 (MF) and 2002 (MF2)
Mr. Smith served as Vice Chairman of The Hartford from February 1997 to January 2002, as President and Chief Executive Officer of Hartford Life, Inc. from February 1997 to January 2002, and as President and Chief Operating Officer of The Hartford Life Insurance Companies from January 1989 to January 2002. Mr. Smith serves as a Director of White Mountains Insurance Group Ltd. (October 2003 to current); One Beacon Insurance (October 2006 to current); Symetra Financial (August 2007 to current) and is a Managing Director of Whittington Gray Associates (January 2007 to current).
* Mr. Smith resigned as a Director of MF, MF2, Hartford Series Fund, Inc. and Hartford HLS Series Fund II, Inc. and as a Trustee of The Hartford Alternative Strategies Fund effective September 17, 2014.
Other Officers
Mark A. Annoni (1964) Vice President, Controller and Treasurer since 2012
Mr. Annoni currently serves as the Assistant Vice President of HLIC (February 2004 to present) and Senior Vice President of HFMG (December 2013 to present). Mr. Annoni has served in various positions within The Hartford and its subsidiaries in connection with the operation of the Hartford Funds. Mr. Annoni joined The Hartford in 2001.
| 23 |
| The Hartford Conservative Allocation Fund |
| Directors and Officers (Unaudited) – (continued) |
Michael R. Dressen (1963) AML Compliance Officer since 2011
Mr. Dressen currently serves as Assistant Vice President of HLIC. He also serves as Chief Compliance Officer and AML Compliance Officer of HASCO and as AML Officer of HFD. Mr. Dressen has served in various positions within The Hartford and its subsidiaries in connection with the operation of the Hartford Funds.
Edward P. Macdonald (1967) Vice President, Secretary and Chief Legal Officer since 2005
Mr. Macdonald currently serves as Assistant Secretary, Executive Vice President and Deputy General Counsel of HFD, HASCO, HFMC and HFMG. He also serves as Vice President of HLIC. Mr. Macdonald has served in various positions within The Hartford and its subsidiaries in connection with the operation of the Hartford Funds. Mr. Macdonald joined The Hartford in 2005.
Joseph G. Melcher (1973) Vice President and Chief Compliance Officer since 2013
Mr. Melcher currently serves as Executive Vice President of HFD, HFMG and HASCO. Mr. Melcher also currently serves as Executive Vice President and Chief Compliance Officer of HFMC. Mr. Melcher has served in various positions within The Hartford and its subsidiaries in connection with the operation of the Hartford Funds since joining The Hartford in 2012. Prior to joining The Hartford, Mr. Melcher worked at Touchstone Investments, a member of the Western & Southern Financial Group, where he held the position of Vice President and Chief Compliance Officer from 2010 through 2012 and Assistant Vice President, Compliance from 2005 to 2010.
Vernon J. Meyer (1964) Vice President since 2006
Mr. Meyer currently serves as Senior Vice President of HLIC. He also currently serves as Managing Director and Chief Investment Officer of HFMC and Managing Director of HFMG. Mr. Meyer has served in various positions within The Hartford and its subsidiaries in connection with the operation of the Hartford Funds. Mr. Meyer joined The Hartford in 2004.
Laura S. Quade (1969) Vice President since 2012
Ms. Quade currently serves as Vice President of HASCO, HFD and HFMG. She is the Head of Operations of HASCO and formerly served as Director, Enterprise Operations of HLIC. Ms. Quade has served in various positions within The Hartford and its subsidiaries in connection with the operation of the Hartford Funds. Ms. Quade joined The Hartford in 2001.
Martin A. Swanson** (1962) Vice President since 2010
Mr. Swanson currently serves as Vice President of HLIC. Mr. Swanson also serves as Managing Director, Chief Marketing Officer and Principal of HFD and Managing Director of HFMG. Mr. Swanson has served in various positions within The Hartford and its subsidiaries in connection with the operation of the Hartford Funds.
** Mr. Swanson resigned as an officer effective November 6, 2014.
HOW TO OBTAIN A COPY OF THE FUND’S PROXY VOTING POLICIES AND VOTING RECORDS (UNAUDITED)
A description of the policies and procedures that the Fund uses to determine how to vote proxies relating to portfolio securities and information about how the Fund voted proxies relating to portfolio securities during the most recent twelve-month period ended June 30 are available (1) without charge, upon request, by calling 888-843-7824 and (2) on the SEC’s website at http://www.sec.gov.
QUARTERLY PORTFOLIO HOLDINGS INFORMATION (UNAUDITED)
The Fund files a complete schedule of portfolio holdings with the SEC for the first and third quarters of each fiscal year on Form N-Q. The Fund’s Forms N-Q are available (1) without charge, upon request, by calling 888-843-7824 and (2) on the SEC’s website at http://www.sec.gov. The Form N-Q may be reviewed and copied at the SEC’s Public Reference Room in Washington, DC. Information on the operation of the Public Reference Room may be obtained by calling 1-800-SEC-0330.
| 24 |
| The Hartford Conservative Allocation Fund |
| Federal Tax Information (Unaudited) |
For the fiscal year ended October 31, 2014, there is no further federal tax information required for this Fund.
| 25 |
| The Hartford Conservative Allocation Fund |
| Expense Example (Unaudited) |
Your Fund's Expenses
As a shareholder of the Fund, you incur two types of costs: (1) transaction costs, including sales charges (loads) on purchase payments, if any, and contingent deferred sales charges (CDSC), if any, and (2) ongoing costs, including investment management fees, distribution and/or service (12b-1) fees, if any, and other fund expenses. This example is intended to help you understand your ongoing costs (in dollars) of investing in the Fund and to compare these costs with the ongoing costs of investing in other mutual funds. The example is based on an investment of $1,000 invested at the beginning of the period and held for the entire period of April 30, 2014 through October 31, 2014.
Actual Expenses
The first set of columns of the table below provides information about actual account values and actual expenses. You may use the information in this column, together with the amount you invested, to estimate the expenses that you paid over the period. Simply divide your account value by $1,000 (for example, an $8,600 account value divided by $1,000 = 8.6), then multiply the result by the number in the line under the heading entitled “Expenses Paid During Period” to estimate the expenses you paid on your account during this period.
Hypothetical Example for Comparison Purposes
The second set of columns of the table below provides information about hypothetical account values and hypothetical expenses based on the Fund's actual expense ratio and an assumed rate of return of 5% per year before expenses, which is not the Fund's actual return. The hypothetical account values and expenses may not be used to estimate the actual ending account balance or expenses you paid for the period. You may use this information to compare the ongoing costs of investing in the Fund and other funds. To do so, compare this 5% hypothetical example with the 5% hypothetical examples that appear in the shareholder reports of the other funds.
Please note that the expenses shown in the table are meant to highlight your ongoing costs only and do not reflect any transactional costs, such as sales charges (loads) and CDSC. Therefore, the second set of columns of the table is useful in comparing ongoing costs only, and will not help you determine the relative total costs of owning different funds. In addition, if these transactional costs were included, your costs would be higher. Expenses are equal to the Fund's annualized expense ratios multiplied by average account value over the period, multiplied by 184/365 (to reflect the one-half year period).
| Actual return | Hypothetical (5% return before expenses) | |||||||||||||||||||||||||||||||||||
| Beginning Account Value April 30, 2014 | Ending
Account Value October 31, 2014 | Expenses
paid during the period April 30, 2014 through October 31, 2014 | Beginning Account Value April 30, 2014 | Ending
Account Value October 31, 2014 | Expenses
paid during the period April 30, 2014 through October 31, 2014 | Annualized expense ratio(A) | Days in the current 1/2 year | Days in the full year | ||||||||||||||||||||||||||||
| Class A | $ | 1,000.00 | $ | 992.70 | $ | 2.98 | $ | 1,000.00 | $ | 1,022.21 | $ | 3.02 | 0.59 | % | 184 | 365 | ||||||||||||||||||||
| Class B | $ | 1,000.00 | $ | 989.80 | $ | 6.96 | $ | 1,000.00 | $ | 1,018.21 | $ | 7.06 | 1.39 | 184 | 365 | |||||||||||||||||||||
| Class C | $ | 1,000.00 | $ | 989.80 | $ | 6.69 | $ | 1,000.00 | $ | 1,018.48 | $ | 6.79 | 1.33 | 184 | 365 | |||||||||||||||||||||
| Class I | $ | 1,000.00 | $ | 995.00 | $ | 1.59 | $ | 1,000.00 | $ | 1,023.62 | $ | 1.61 | 0.32 | 184 | 365 | |||||||||||||||||||||
| Class R3 | $ | 1,000.00 | $ | 991.70 | $ | 4.47 | $ | 1,000.00 | $ | 1,020.72 | $ | 4.53 | 0.89 | 184 | 365 | |||||||||||||||||||||
| Class R4 | $ | 1,000.00 | $ | 993.40 | $ | 2.96 | $ | 1,000.00 | $ | 1,022.24 | $ | 3.00 | 0.59 | 184 | 365 | |||||||||||||||||||||
| Class R5 | $ | 1,000.00 | $ | 995.00 | $ | 1.46 | $ | 1,000.00 | $ | 1,023.74 | $ | 1.48 | 0.29 | 184 | 365 | |||||||||||||||||||||
| (A) | Ratios do not include expenses of the Underlying Funds and/or ETFs/ETNs, if applicable. |
| 26 |
| The Hartford Conservative Allocation Fund |
| Shareholder Meeting Results (Unaudited) |
A special meeting of shareholders of the Fund was held on April 4, 2014, which was adjourned until May 9, 2014 (“Shareholder Meeting”). Each of the three proposals listed below were approved by shareholders. The final results of the Shareholder Meeting are reported below.
Proposal one:
The ratification and approval of the sub-advisory agreement between HFMC, the investment manager of the Fund, and Wellington Management pursuant to which Wellington Management serves as the sub-adviser to the Fund and manages the Fund's assets.
| For | Against | Abstain | Uninstructed |
| 8,220,283.415 | 380,868.772 | 739,804.308 | 1,642,314.000 |
Proposal two:
The approval of the retention of fees paid and the payment of fees payable by Hartford Investment Financial Services, LLC, the Fund’s former investment manager, and HFMC (as applicable) to Wellington Management for its sub-advisory services to the Fund.
| For | Against | Abstain | Uninstructed |
| 8,183,371.719 | 402,518.572 | 755,066.204 | 1,642,314.000 |
Proposal three:
The authorization of HFMC to select and contract with sub-advisers that are not affiliated with HFMC or the Fund (other than by reason of serving as a sub-adviser to one or more Hartford-sponsored mutual funds) and to materially amend investment sub-advisory agreements without obtaining shareholder approval.
| For | Against | Abstain | Uninstructed |
| 7,971,252.187 | 612,139.762 | 757,564.546 | 1,642,314.000 |
| 27 |
| The Hartford Conservative Allocation Fund |
| Approval of Investment Management and Investment Sub-Advisory Agreements (Unaudited) |
Section 15(c) of the Investment Company Act of 1940, as amended (the “1940 Act”), requires that each mutual fund’s board of directors, including a majority of those directors who are not “interested persons” of the mutual fund, as defined in the 1940 Act (the “Independent Directors”), annually review and consider the continuation of the mutual fund’s investment advisory and sub-advisory agreements. At its meeting held on August 5-6, 2014, the Board of Directors (the “Board”) of The Hartford Mutual Funds, Inc., including each of the Independent Directors, unanimously voted to approve the continuation of the investment management agreement for The Hartford Conservative Allocation Fund (the “Fund”) with Hartford Funds Management Company, LLC (“HFMC”) and the continuation of the investment sub-advisory agreement between HFMC and the Fund’s sub-adviser, Wellington Management Company, LLP (the “Sub-adviser,” and together with HFMC, the “Advisers”) (collectively, the “Agreements”).
In the months preceding the August 5-6, 2014 meeting, the Board requested, received and reviewed written responses from the Advisers to questions posed to them on behalf of the Independent Directors and supporting materials relating to those questions and responses. The Board considered information furnished to the Board at its meetings throughout the year, as well as information specifically prepared in connection with the annual approval of the Agreements at the Board’s meetings held on June 17-18, 2014 and August 5-6, 2014. Information provided to the Board at its meetings throughout the year included, among other things, reports on Fund performance, legal and compliance matters, sales and marketing activity, shareholder services, and the other services provided to the Fund by the Advisers and their affiliates. The Board also received in-person presentations by Fund officers and representatives of HFMC at the Board’s meetings on June 17-18, 2014 and August 5-6, 2014 concerning the Agreements.
The Independent Directors, advised by independent legal counsel, engaged service providers to assist them with evaluating the Agreements with respect to the Fund. Lipper Inc. (“Lipper”), an independent provider of investment company data, was retained to provide the Board with reports on how the Fund’s non-management fees, overall expense ratios and investment performance compared to those of mutual funds with similar investment objectives. The Independent Directors also engaged an independent financial services consultant (the “Consultant”) to assist them in evaluating the Fund’s non-management fees, overall expense ratios and investment performance. In addition, the Consultant reviewed the profitability calculations utilized by HFMC in connection with the continuation of the investment management agreement.
In determining whether to continue the Agreements for the Fund, the members of the Board reviewed and evaluated information and factors they believed to be relevant and appropriate in light of the information that the Board deemed necessary and appropriate through the exercise of its reasonable business judgment. While individual members of the Board may have weighed certain factors differently, the Board’s determination to continue the Agreements was based on a comprehensive consideration of all information provided to the Board throughout the year and specifically with respect to the continuation of the Agreements. A more detailed discussion of the factors the Board considered with respect to its approval of the Agreements is provided below.
Nature, Extent and Quality of Services Provided by the Advisers
The Board requested and considered information concerning the nature, extent and quality of the services provided to the Fund by the Advisers. The Board considered, among other things, the terms of the Agreements and the range of services provided by the Advisers. The Board considered the Advisers’ professional personnel who provide services to the Fund, including each Adviser’s ability and experience in attracting and retaining qualified personnel to service the Fund. The Board considered each Adviser’s reputation and overall financial strength, as well as its willingness to consider and implement organizational and operational changes designed to enhance services to the Hartford Funds. In addition, the Board considered the quality of each Adviser’s communications with the Board and responsiveness to Board inquiries and requests made from time to time with respect to the Fund and other Hartford Funds.
The Board also requested and evaluated information concerning each Adviser’s regulatory and compliance environment. In this regard, the Board requested and reviewed information on each Adviser’s compliance policies and procedures, compliance history, and a report from the Fund’s Chief Compliance Officer on each Adviser’s compliance with applicable laws and regulations, including responses to regulatory developments and compliance issues raised by regulators. The Board also noted the Advisers’ support of the Fund’s compliance control structure, particularly the resources devoted by the Advisers in support of the Fund’s obligations pursuant to Rule 38a-1 under the 1940 Act.
With respect to HFMC, the Board noted that, under the Agreements, HFMC is responsible for the management of the Fund, including oversight of fund operations and service providers, and provides administrative and investment advisory services in connection with selecting, monitoring and supervising the Sub-adviser. The Board considered HFMC’s ongoing monitoring of people, process and performance, including its quarterly reviews of each of the Hartford Funds, semi-annual meetings with the leaders of each Fund’s portfolio management team, and oversight of the Hartford Funds’ approximately 66 portfolio managers. The Board recognized that HFMC has demonstrated a record of making changes to the management and/or strategies of the Hartford Funds when warranted. The Board considered HFMC’s oversight of the Sub-adviser’s investment
| 28 |
| The Hartford Conservative Allocation Fund |
| Approval of Investment Management and Investment Sub-Advisory Agreements (Unaudited) – (continued) |
approach and results, process for monitoring best execution of portfolio trades by the Sub-adviser, and approach to risk management with respect to the Fund and the service providers to the Fund. The Board also considered HFMC’s oversight of compliance with the Fund’s objective and policies as well as with applicable laws and regulations, noting that regulatory and other developments had over time led to an increase in the scope of HFMC’s services in this regard.
In addition, the Board considered HFMC’s ongoing commitment to review and rationalize the Hartford Funds product line-up and the expenses that HFMC had incurred in connection with fund combinations in recent years. The Board considered that HFMC or its affiliates are responsible for providing the Fund’s officers.
With respect to the Sub-adviser, which provides certain day-to-day portfolio management services for the Fund, the Board considered the quality of the Fund’s portfolio managers, the Sub-adviser’s other investment personnel, its investment philosophy and process, investment research capabilities and resources, performance record, trade execution capabilities and experience. The Board considered the experience of the Fund’s portfolio managers, the number of accounts managed by the portfolio managers, and the Sub-adviser’s method for compensating the portfolio managers.
Based on these considerations, the Board concluded that it was satisfied with the nature, extent and quality of the services provided to the Fund by HFMC and the Sub-adviser.
Performance of the Fund and the Advisers
The Board considered the investment performance of the Fund. In this regard, the Board reviewed the performance of the Fund over different time periods presented in the materials and evaluated HFMC’s analysis of the Fund’s performance for these time periods. The Board considered information and materials provided to the Board by the Advisers concerning Fund performance, as well as information from Lipper comparing the investment performance of the Fund to an appropriate benchmark and universe of peer funds. The Board noted that the Fund’s performance was in the 5th quintile of its performance universe for the 1- and 3-year periods and in the 4th quintile for the 5-year period. The Board also noted that the Fund’s performance was below its blended custom benchmark for the 1-, 3- and 5-year periods. In considering the Fund’s performance record, the Board noted that the Fund had transitioned to Wellington Management Company, LLP as sub-adviser in 2012.
The Board considered the detailed investment analytics reports provided by Hartford Funds’ Investment Advisory Group throughout the year. These reports include, among other things, information on the Fund’s gross and net returns, the Fund’s investment performance relative to an appropriate benchmark and peer group, various statistics concerning the Fund’s portfolio, and a narrative summary of various factors affecting Fund performance. The Board considered the Advisers’ cooperation with the Investment Committee, which assists the Board in evaluating the performance of the Fund at periodic meetings throughout the year. The Board also considered the analysis provided by the Consultant relating to the Fund’s performance track record.
In light of all the considerations noted above, the Board concluded that it had continued confidence in HFMC’s and the Sub-adviser’s overall capabilities to manage the Fund.
Costs of the Services and Profitability of the Advisers
The Board reviewed information regarding HFMC’s cost to provide investment management and related services to the Fund and HFMC’s profitability, both overall and for the Fund, on a pre-tax basis without regard to distribution expenses. The Board also requested and reviewed information about the profitability to HFMC and its affiliates from all services provided to the Fund and all aspects of their relationship with the Fund. The Board also requested and received information relating to the operations and profitability of the Sub-adviser.
The Board considered the Consultant’s review of the profitability calculations used by HFMC in connection with the continuation of the investment management agreement, noting the Consultant’s view that Hartford Funds’ process for calculating and reporting Fund profitability is reasonable. In this regard, the Board noted that the Consultant performed a full review of this process in light of the recent restructuring of the Hartford Funds business and reported that the approach to analyzing Fund profitability, including the use of common expense allocation methodologies, is reasonable, sound and well within common industry practice.
Based on these considerations, the Board concluded that the profits anticipated to be realized by the Advisers and their affiliates from their relationships with the Fund would not be excessive.
| 29 |
| The Hartford Conservative Allocation Fund |
| Approval of Investment Management and Investment Sub-Advisory Agreements (Unaudited) – (continued) |
Comparison of Fees and Services Provided by the Advisers
The Board considered comparative information with respect to the management fees to be paid by the Fund to HFMC and the total expense ratios of the Fund. The Board also considered comparative information with respect to the sub-advisory fees to be paid by HFMC to the Sub-adviser. In this regard, the Board requested and reviewed information from HFMC and the Sub-adviser relating to the management and sub-advisory fees, including the sub-advisory fee schedule for the Fund, and total operating expenses for the Fund. With respect to the sub-advisory fee schedule, the Board considered representations from HFMC and the Sub-adviser that the Sub-adviser’s fees were negotiated at arm’s length on a fund-by-fund basis. The Board also reviewed information from Lipper comparing the Fund’s overall expense ratios relative to a group of funds selected by Lipper, in consultation with the Consultant, and a broader universe of funds selected by Lipper. The Board considered that the Fund’s total expenses (less 12b-1 and shareholder service fees) were in the 3rd quintile. The Board noted that the Fund has an automatically renewable contractual expense cap on each share class. The expense cap resulted in reimbursement of certain expenses incurred in 2013.
While the Board recognized that comparisons between the Fund and peer funds may be imprecise, given the different service levels and characteristics of mutual funds and the different business models and cost structures of the Advisers, the comparative information provided by Lipper assisted the Board in evaluating the reasonableness of the Fund’s total operating expenses. In addition, the Board considered the analysis and recommendations of the Consultant relating to the Fund’s total operating expenses.
Based on these considerations, the Board concluded that the Fund’s fees and total operating expenses, in conjunction with the information about quality of services, profitability, economies of scale, and other matters discussed, were reasonable in light of the services provided.
Economies of Scale
The Board requested and considered information regarding the Advisers’ realization of economies of scale with respect to the Fund and whether the fee levels reflect these economies of scale for the benefit of the Fund’s shareholders. The Board reviewed the breakpoints in the management fee schedule for the Fund, which reduce fee rates as Fund assets grow over time. The Board recognized that a fund with assets beyond the highest breakpoint level will continue to benefit from economies of scale because additional assets are charged the lowest breakpoint fee resulting in lower overall effective management fee rates. The Board also considered that expense limitations and fee waivers that reduce the Fund’s expenses at all asset levels can have the same effect as breakpoints in sharing economies of scale with shareholders and provide protection from an increase in expenses if Fund assets decline. The Board recognized that a fee schedule that reaches a lower breakpoint quickly provides shareholders with the benefit of anticipated or potential economies of scale, although the Board noted that the Fund’s current low asset levels have kept the Fund from fully realizing this benefit. The Board also considered that HFMC has been active in managing expenses, which has resulted in benefits being realized by shareholders as assets within the Hartford Funds family of funds have grown over time, including through lower transfer agent costs and other operating expenses.
After considering all of the information available to it, the Board concluded that it was satisfied with the extent to which economies of scale would be shared for the benefit of the Fund’s shareholders based on currently available information and the effective advisory fees and expense ratios for the Fund at its current and reasonably anticipated asset levels. The Board noted, however, that it would continue to monitor future growth in Fund assets and the appropriateness of additional breakpoints.
Other Benefits
The Board considered other benefits to the Advisers and their affiliates from their relationships with the Fund.
The Board noted that HFMC receives fees for fund accounting and related services from the Fund, and the Board considered information on profits to HFMC for such services. The Board also considered that Hartford Administrative Services Company (“HASCO”), the Fund’s transfer agent and an affiliate of HFMC, receives transfer agency compensation from the Fund, and the Board reviewed information on the profitability of the Fund’s transfer agency function to HASCO. The Board considered information provided by HASCO indicating that the transfer agent fees charged by HASCO to the Fund were fair and reasonable based on publicly available information.
The Board also considered that Hartford Funds Distributors, LLC (“HFD”), an affiliate of HFMC, serves as principal underwriter of the Fund. As principal underwriter, HFD receives 12b-1 fees from the Fund and receives all or a portion of the sales charges on sales or redemptions of
| 30 |
| The Hartford Conservative Allocation Fund |
| Approval of Investment Management and Investment Sub-Advisory Agreements (Unaudited) – (continued) |
certain classes of shares. The Board also noted that certain affiliates of HFD distribute shares of the Fund and receive compensation in that connection.
The Board considered the benefits, if any, to the Sub-adviser from any use of the Fund’s brokerage commissions to obtain soft dollar research, and representations from HFMC and the Sub-adviser that the Sub-adviser would not make any revenue-sharing payments or any other type of distribution payments to HFMC or its affiliates.
The Board considered the benefits to shareholders of being part of the Hartford Funds family of funds, including the right to exchange investments between the same class of funds without a sales charge, the ability to reinvest Fund dividends into other funds in the family, and the ability to combine holdings in the Fund with holdings in other funds to obtain a reduced sales charge. The Board considered HFMC’s efforts to provide investors in the family with a broad range of investment styles and asset classes and its entrepreneurial risk in initiating new funds to expand these opportunities for shareholders.
* * * *
Based upon its review of these various factors, among others, the Board concluded that it is in the best interests of the Fund and its shareholders for the Board to approve the Agreements for an additional year. In reaching this decision, the Board did not assign relative weights to the factors discussed above or deem any one or group of them to be controlling in and of themselves. In connection with their deliberations, the Independent Directors met separately in executive session on several occasions, with independent legal counsel and the Consultant, to review the relevant materials and consider their responsibilities under relevant laws and regulations.
| 31 |
| The Hartford Conservative Allocation Fund |
| Main Risks (Unaudited) |
The main risks of investing in the Fund are described below.
Market, Selection and Strategy Risk: The Fund’s share price may fluctuate due to market risk and/or security selections that may underperform the market or relevant benchmarks. If the sub-adviser's investment strategy does not perform as expected, the Fund could underperform its peers or lose money. There is no guarantee the Fund will achieve its stated objective.
Asset Allocation Strategy Risk: The portfolio managers' asset allocation strategy may not always work as intended, and asset allocation does not guarantee better performance or reduce the risk of investment loss.
Fund of Funds Risk:The Fund invests in a number of Underlying Funds, and is subject to the risks of the Underlying Funds in direct proportion to the amount of assets it invests in each Underlying Fund. The Underlying Funds may invest in the following: foreign securities including emerging markets, fixed income securities (which carry credit and interest rate risk) including junk bonds, small- and mid-cap stocks, mortgage- and asset-backed securities, and derivatives.
| 32 |
THIS PRIVACY POLICY IS NOT PART OF THIS REPORT
Privacy Policy and Practices of The Hartford Financial Services Group, Inc. and its Affiliates
(herein called “we, our and us”)
This Privacy Policy applies to our United States Operations
We value your trust. We are committed to the responsible: a) management; b) use; and c) protection; of Personal Information.
This notice describes how we collect, disclose, and protect Personal Information.
We collect Personal Information to: a) service your Transactions with us; and b) support our business functions.
We may obtain Personal Information from: a) You; b) your Transactions with us; and c) third parties such as a consumer-reporting agency.
Based on the type of product or service You apply for or get from us, Personal Information such as: a) your name; b) your address; c) your income; d) your payment; or e) your credit history; may be gathered from sources such as applications, Transactions, and consumer reports.
To serve You and service our business, we may share certain Personal Information. We will share Personal Information, only as allowed by law, with affiliates such as: a) our insurance companies; b) our employee agents; c) our brokerage firms; and d) our administrators.
As allowed by law, we may share Personal Financial Information with our affiliates to: a) market our products; or b) market our services; to You without providing You with an option to prevent these disclosures.
|
We may also share Personal Information, only as allowed by law, with unaffiliated third parties including: a) independent agents; b) brokerage firms; c) insurance companies; d) administrators; and e) service providers; who help us serve You and service our business.
When allowed by law, we may share certain Personal Financial Information with other unaffiliated third parties who assist us by performing services or functions such as: a) taking surveys; b) marketing our products or services; or c) offering financial products or services under a joint agreement between us and one or more financial institutions.
We, and third parties we partner with, may track some of the pages You visit through the use of: a) cookies; b) pixel tagging; or c) other technologies; and currently do not process or comply with any web browser’s “do not track” signal or similar mechanism that indicates a request to disable online tracking of individual users who visit our websites or use our services.
We will not sell or share your Personal Financial Information with anyone for purposes unrelated to our business functions without offering You the opportunity to: a) “opt-out;” or b) “opt-in;” as required by law.
We only disclose Personal Health Information with: a) your proper written authorization; or b) as otherwise allowed or required by law.
Our employees have access to Personal Information in the course of doing their jobs, such as: a) underwriting policies; b) paying claims; c) developing new products; or d) advising customers of our products and services. |
We use manual and electronic security procedures to maintain: a) the confidentiality; and b) the integrity of; Personal Information that we have. We use these procedures to guard against unauthorized access.
Some techniques we use to protect Personal Information include: a) secured files; b) user authentication; c) encryption; d) firewall technology; and e) the use of detection software.
We are responsible for and must: a) identify information to be protected; b) provide an adequate level of protection for that data; c) grant access to protected data only to those people who must use it in the performance of their job-related duties.
Employees who violate our Privacy Policy will be subject to discipline, which may include ending their employment with us.
At the start of our business relationship, we will give You a copy of our current Privacy Policy.
We will also give You a copy of our current Privacy Policy once a year if You maintain a continuing business relationship with us.
We will continue to follow our Privacy Policy regarding Personal Information even when a business relationship no longer exists between us.
|
As used in this Privacy Notice:
Application means your request for our product or service.
Personal Financial Information means financial information such as: a) credit history; b) income; c) financial benefits; or d) policy or claim information.
Personal Health Information means health information such as: a) your medical records; or b) information about your illness, disability or injury.
Personal Information means information that identifies You personally and is not otherwise available to the public. It includes: a) Personal Financial Information; and b) Personal Health Information.
Transaction means your business dealings with us, such as: a) your Application; b) your request for us to pay a claim; and c) your request for us to take an action on your account.
You means an individual who has given us Personal Information in conjunction with: a) asking about; b) applying for; or c) obtaining; a financial product or service from us if the product or service is used mainly for personal, family, or household purposes. |
This Privacy Policy is being provided on behalf of the following affiliates of The Hartford Financial Services Group, Inc.:
1stAGChoice, Inc.; Access CoverageCorp, Inc.; Access CoverageCorp Technologies, Inc.; American Maturity Life Insurance Company; Archway 60 R, LLC; Business Management Group, Inc.; Champlain Life Reinsurance Company; DMS R, LLC; Eloy R, LLC; Ersatz Corporation; First State Insurance Company; Hartford Accident and Indemnity Company; Hartford Administrative Services Company; Hartford Casualty General Agency, Inc.; Hartford Casualty Insurance Company; Hartford-Comprehensive Employee Benefit Service Company; Hartford Equity Sales Company, Inc.; Hartford Fire General Agency, Inc.; Hartford Fire Insurance Company; Hartford Funds Management Company, LLC; Hartford Funds Management Group, Inc.; Hartford HLS Series Fund II, Inc.; Hartford Insurance Company of Illinois; Hartford Insurance Company of the Midwest; Hartford Insurance Company of the Southeast; Hartford Integrated Technologies, Inc.; Hartford International Life Reassurance Corporation; Hartford Funds Distributors, LLC; Hartford Investment Management Company; Hartford Life and Accident Insurance Company; Hartford Life and Annuity Insurance Company; Hartford Life Insurance Company; Hartford Life Private Placement, LLC; Hartford Lloyd’s Corporation; Hartford Lloyd’s Insurance Company; Hartford Mezzanine Investors I, LLC; Hartford Residual Market, L.C.C.; Hartford Retirement Services, LLC; Hartford Securities Distribution Company, Inc.; Hartford Series Fund, Inc.; Hartford Specialty Insurance Services of Texas, LLC; Hartford Strategic Investments, LLC; Hartford Underwriters Insurance Company; Hartford Technology Services Company, L.L.C.; Hartford of Texas General Agency, Inc.; Hartford Underwriters General Agency, Inc.; HARTRE Company, L.C.C.; HL Investment Advisors, LLC; HLA LLC; Horizon Management Group, LLC; HRA Brokerage Services, Inc.; Lanidex Class B, LLC; M-CAP Insurance Agency, LLC; New England Insurance Company; New England Reinsurance Corporation; Nutmeg Insurance Agency, Inc.; Nutmeg Insurance Company; Pacific Insurance Company, Limited; Planco, LLC: Property and Casualty Insurance Company of Hartford; Revere R, LLC; RVR R, LLC; Sentinel Insurance Company, Ltd.; Sunstone R, LLC; Symphony R, LLC; The Evergreen Group Incorporated; The Hartford Alternative Strategies Fund; The Hartford Mutual Funds, Inc.; The Hartford Mutual Funds II, Inc.; Trumbull Flood Management, L.L.C.; Trumbull Insurance Company; Twin City Fire Insurance Company; White River Life Reinsurance Company.
HPP Revised January 2014
HARTFORDFUNDS
hartfordfunds.com
This information is written in connection with the promotion or marketing of the matter(s) addressed in this material.
This report is submitted for the general information of the shareholders of the Fund. It is not authorized for distribution unless preceded or accompanied by a current prospectus for the Fund.
The information cannot be used or relied upon for the purpose of avoiding IRS penalties. These materials are not intended to provide tax, accounting or legal advice. As with all matters of a tax or legal nature, you should consult your own tax or legal counsel for advice.
Investors should carefully consider the investment objectives, risks, charges, and expenses of Hartford Funds before investing. This and other information can be found in the prospectus and summary prospectus, which can be obtained by calling 888-843-7824 (retail) or 800-279-1541 (institutional). Investors should read them carefully before they invest.
Hartford Funds are underwritten and distributed by Hartford Funds Distributors, LLC.
MFAR-CAL14 12/14 113967-3 Printed in U.S.A.
HARTFORDFUNDS
|
THE HARTFORD
2014 Annual Report |
A MESSAGE FROM THE PRESIDENT
Dear Fellow Shareholders:
Thank you for investing in Hartford Funds.
Market Review
U.S. equities (as represented by the S&P 500 Index) rose steadily for the fiscal year ended October 31, 2014, with a return of 17.27% for the period. With the exception of short-lived geopolitical scares early in 2014 and concerns about continuing global growth near the end of the period, stocks generally rose on solid fundamentals and encouraging macroeconomic data during the year.
September 2014 marked the six-year anniversary of the start of the financial crisis. Within weeks of that anniversary, both the S&P 500 Index and the Dow Jones Industrial Average set new all-time highs, closing at 2,018 and 17,391, respectively, on October 31. Although the fallout of the crisis continues to influence investor behavior, stocks have recovered and risen dramatically, up 198% from their low in March 2009. Meanwhile, the domestic economy is notching strong growth, and the unemployment rate has reached its lowest level since August 2008.
While the U.S. economy appears to have stabilized and to have reverted to a solid growth path, the outlook for the global economy appears to have gotten cloudier. The U.S. Federal Reserve has ended quantitative easing, while Europe and Japan are pursuing stimulus options to avoid a double-dip recession and deflation, respectively. Diverging central-bank policies will likely continue to play an important role in market movements going forward as investors wait to see the reactions to their efforts and their impacts on global markets.
How have market movements impacted your portfolio throughout the last year? Are your investments still on track to provide the growth or income you need, and are you comfortable with their progress during times of volatility?
Your financial professional can help you navigate today’s markets with confidence, as well as assist you to achieve your investment goals by providing advice on the best options within our fund family to help you work toward overcoming today’s investing challenges. Meet with your financial advisor regularly to examine your portfolio and your investment strategy, and to determine if you’re still on track to meet your goals.
Thank you again for investing with Hartford Funds.
James Davey
President
Hartford Funds
1 The S&P 500 Index is a market capitalization-weighted price index composed of 500 widely held common stocks.
2 The Dow Jones Industrial Average is an unmanaged, price-weighted index of 30 of the largest, most widely held stocks traded on the NYSE
The Hartford Disciplined Equity Fund
Table of Contents
The views expressed in the Fund’s Manager Discussion under ‘‘Why did the Fund perform this way?’’ and ‘‘What is the outlook?’’ are views of the Fund’s sub-adviser and portfolio management team through the end of the period and are subject to change based on market and other conditions. The Fund’s Manager Discussion is for informational purposes only and does not represent an offer, recommendation or solicitation to buy, hold or sell any security. The specific securities identified and described, if any, do not represent all of the securities purchased or sold and you should not assume that investments in the securities identified and discussed will be profitable.
| The Hartford Disciplined Equity Fund inception 04/30/1998 |
| (sub-advised by Wellington Management Company, LLP) |
| Investment objective – The Fund seeks growth of capital. |
Performance Overview 10/31/04 - 10/31/14
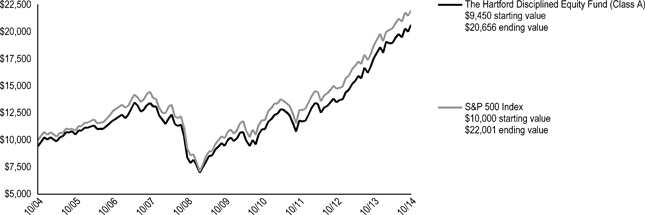
The chart above represents the hypothetical growth of a $10,000 investment in Class A, which includes a sales charge. Growth results in classes other than Class A will vary from what is seen above due to differences in the expenses charged to those share classes.
Average Annual Total Returns (as of 10/31/14)
| 1 Year | 5 Years | 10 Years | ||||||||||
| Disciplined Equity A# | 17.56 | % | 16.89 | % | 8.13 | % | ||||||
| Disciplined Equity A## | 11.09 | % | 15.57 | % | 7.52 | % | ||||||
| Disciplined Equity B# | 16.65 | % | 16.00 | % | 7.56 | %* | ||||||
| Disciplined Equity B## | 11.65 | % | 15.78 | % | 7.56 | %* | ||||||
| Disciplined Equity C# | 16.77 | % | 16.06 | % | 7.34 | % | ||||||
| Disciplined Equity C## | 15.77 | % | 16.06 | % | 7.34 | % | ||||||
| Disciplined Equity R3# | 17.30 | % | 16.67 | % | 8.07 | % | ||||||
| Disciplined Equity R4# | 17.71 | % | 17.02 | % | 8.31 | % | ||||||
| Disciplined Equity R5# | 18.03 | % | 17.40 | % | 8.58 | % | ||||||
| Disciplined Equity Y# | 18.07 | % | 17.45 | % | 8.64 | % | ||||||
| S&P 500 Index | 17.27 | % | 16.69 | % | 8.20 | % | ||||||
| # | Without sales charge |
| ## | With sales charge |
| * | Class B shares convert to Class A shares after 8 years. The return shown reflects the conversion to Class A shares, which had different operating expenses, for the period after conversion. |
PERFORMANCE DATA QUOTED REPRESENTS PAST PERFORMANCE AND DOES NOT GUARANTEE FUTURE RESULTS. The investment return and principal value of the investment will fluctuate so that investors’ shares, when redeemed, may be worth more or less than their original cost. Current performance may be lower or higher than the performance data quoted. To obtain performance data current to the most recent month-end, please visit our website www.hartfordfunds.com.
The initial investment in Class A shares reflects the maximum sales charge of 5.50% and returns for Class B shares reflect a contingent deferred sales charge of up to 5.00% and declining to zero, depending on the period of time the shares are held. Returns for Class C shares reflect a contingent deferred sales charge of up to 1.00% on shares redeemed within twelve months of purchase.
Total returns presented above were calculated using the Fund’s net asset value available to shareholders for sale or redemption of Fund shares on October 31, 2014, which may exclude investment transactions as of this date. All share class returns assume the reinvestment of all distributions at net asset value and the deduction of all fund expenses.
Effective 9/30/09, Class B shares of the Fund were closed to new investments.
Class R3, R4 and R5 shares commenced operations on 12/22/06. Performance prior to that date is that of the Fund's Class Y shares, which had different operating expenses.
S&P 500 Index is a market capitalization-weighted price index composed of 500 widely held common stocks.
You cannot invest directly in an index.
The chart and table do not reflect the deductions of taxes that a shareholder would pay on Fund distributions or the redemption of Fund shares.
Performance information may reflect historical or current expense waivers/reimbursements from the investment adviser, without which performance would have been lower. For information on current expense waivers/reimbursements, please see the prospectus.
| 2 |
| The Hartford Disciplined Equity Fund |
| Manager Discussion |
| October 31, 2014 (Unaudited) |
| Operating Expenses* | ||||||||
| Net | Gross | |||||||
| Disciplined Equity Class A | 1.35 | % | 1.40 | % | ||||
| Disciplined Equity Class B | 2.10 | % | 2.50 | % | ||||
| Disciplined Equity Class C | 2.07 | % | 2.07 | % | ||||
| Disciplined Equity Class R3 | 1.50 | % | 1.69 | % | ||||
| Disciplined Equity Class R4 | 1.20 | % | 1.29 | % | ||||
| Disciplined Equity Class R5 | 0.90 | % | 1.00 | % | ||||
| Disciplined Equity Class Y | 0.85 | % | 0.88 | % | ||||
| * | As shown in the Fund's current prospectus dated March 1, 2014. Actual expenses may be higher or lower. Please see accompanying Financial Highlights for expense ratios for the year ended October 31, 2014. |
Gross expenses are the Fund's total annual operating expenses shown in the Fund's most recent prospectus. Net expenses are the Fund's total annual operating expenses shown in the Fund's most recent prospectus and reflect contractual expense reimbursements in instances when these reductions reduce the Fund's gross expenses. Contractual reimbursements remain in effect until February 28, 2015, and automatically renew for one-year terms unless terminated.
All investments are subject to risk including the possible loss of principal. For a discussion of the Fund’s risks, please see the Main Risks section of this report. For more detailed information on the risks associated with an investment in the Fund, please see the prospectus.
| Portfolio Manager |
| Mammen Chally, CFA |
| Vice President and Equity Portfolio Manager |
How did the Fund perform?
The Class A shares of The Hartford Disciplined Equity Fund returned 17.56%, before sales charge, for the twelve-month period ended October 31, 2014, outperforming the Fund’s benchmark, the S&P 500 Index, which returned 17.27% for the same period. The Fund outperformed the 15.14% average return of the Lipper Large-Cap Core Funds peer group, a group of funds with investment strategies similar to those of the Fund.
Why did the Fund perform this way?
U.S. equities surged during the period, despite bouts of significant volatility. After finishing their best year since 1997, U.S. stocks began 2014 with their worst month in nearly two years. Worries about a slowdown in China and general angst surrounding emerging markets overshadowed a fairly benign domestic environment. However, robust merger and acquisition activity and an uncontested increase in the debt ceiling from Congress helped stoke investors' risk appetites in February. The rally continued in May amid renewed signs of life in the housing market and the best payroll gain in more than two years. However, a pullback in July ended a streak of five consecutive monthly gains. Fear gripped the market as heightened geopolitical risks, a potential Portuguese banking crisis, and worries of U.S. Federal Reserve (Fed) tightening took center stage. Stocks rebounded in August as investors were emboldened by encouraging economic data, headlined by better-than-expected Gross Domestic Product growth and signs that the housing recovery still had legs. In September, U.S. equities retreated for just the third month this year. Despite solid manufacturing and consumer confidence readings, the reality of quantitative easing ending and the prospect of higher federal funds rates in mid-2015 contributed to increased risk aversion levels. Stocks finished a volatile October at an all-time high on the heels of a positive earnings season and generally solid economic data. Returns also varied noticeably by market-cap, as small- and mid-cap stocks underperformed large-cap stocks.
All ten sectors in the S&P 500 Index rose during the period, with Healthcare (+30%), Information Technology (+26%), and Utilities (+22%) performing the best. Energy (+4%) and Telecommunication Services (+5%) lagged on a relative basis during the period.
Overall sector allocation, a result of the bottom up stock selection process, was the largest contributor to benchmark relative outperformance during the period, in part due to our overweight to Healthcare and underweight to Energy. This was partially offset by our overweight to Consumer Discretionary and underweight to Information Technology. The Fund’s modest cash position detracted from relative performance in an upward-trending market. Security selection in the Healthcare and Consumer Staples sectors contributed to relative performance, while selection in Information Technology and Industrials detracted.
The top contributors to relative performance were Forest Laboratories (Healthcare), Monster Beverage (Consumer Staples), and Salix Pharmaceutical (Healthcare). Shares of Forest Laboratories, a pharmaceutical company, moved higher on news that Actavis, the world's second-largest generic-drug maker by market value, agreed to buy Forest Laboratories for about $25 billion. Shares of Monster Beverage, a U.S.-based maker of energy drinks, surged after the company announced a long-term strategic partnership with Coca-Cola. As part of the deal, Coca-Cola purchased a 17% stake in Monster. We believe the deal will expedite Monster’s growth around the globe due to Coke’s existing distribution system. Shares of Salix Pharmaceutical, a pharmaceutical company focused on the treatment of gastrointestinal diseases, moved higher in anticipation of its Xifaxin drug receiving a secondary indication for irritable bowel syndrome with diarrhea. This has the potential to provide an additional $1 billion in sales. In addition, our position in Gilead Sciences (Healthcare) was a top contributor to absolute performance.
| 3 |
| The Hartford Disciplined Equity Fund |
| Manager Discussion – (continued) |
| October 31, 2014 (Unaudited) |
The top detractors from relative performance were Apple (Information Technology), PVH (Consumer Discretionary), and Genpact (Information Technology). Shares of Apple, a U.S.-based designer and manufacturer of consumer electronics, software, and computers, outperformed due to strong earnings and strong initial sales of the newly released iPhone 6 and 6+. Not owning this benchmark component detracted from relative results. Shares of PVH, a leading global apparel company, fell during the period. The stock underperformed after the company slightly adjusted down their guidance for the year due to weak results in their legacy low-growth department store business. Shares of Genpact, an Indian company engaged in business process management, outsourcing, shared services and information outsourcing, fell after management issued 2014 revenue guidance that was below consensus estimates. Top absolute detractors also included Philip Morris (Consumer Staples), Ocwen Financial (Financials), and AT&T (Telecommunication Services).
Derivatives are not used in a significant manner in this Fund and did not have a material impact on performance during the period.
What is the outlook?
In our view, the global cycle continues to advance at a moderate pace with a mix of stronger growth in the U.S. and more sluggish activity in Europe, Japan, and China. We believe the U.S. economy is on track for a self-sustaining expansion. After three years of fiscal consolidation, it appears that this policy drag is starting to fade, which we believe should support growth. Meanwhile, investment spending appears to be picking up.
We remain consistent in adhering to our disciplined portfolio construction process that allows us to assess risk, weight individual positions accordingly, and in the process build a portfolio that focuses largely on stock selection as a way to seek benchmark-relative outperformance. At the end of the period, our largest overweight positions relative to the Fund’s benchmark were to Healthcare, Consumer Discretionary, and Utilities, while our largest underweights were in Financials and Energy.
| Diversification by Sector | ||||
| as of October 31, 2014 | ||||
| Sector | Percentage of Net Assets | |||
| Equity Securities | ||||
| Consumer Discretionary | 14.5 | % | ||
| Consumer Staples | 10.3 | |||
| Energy | 4.8 | |||
| Financials | 9.5 | |||
| Health Care | 19.6 | |||
| Industrials | 8.9 | |||
| Information Technology | 20.0 | |||
| Materials | 2.8 | |||
| Utilities | 4.3 | |||
| Total | 94.7 | % | ||
| Short-Term Investments | 5.0 | |||
| Other Assets and Liabilities | 0.3 | |||
| Total | 100.0 | % | ||
A sector may be comprised of several industries. For Fund compliance purposes, the Fund may not use the same classification system and these sector classifications are used for reporting ease.
| 4 |
| The Hartford Disciplined Equity Fund |
| Schedule of Investments |
| October 31, 2014 |
| (000’s Omitted) |
| Shares or Principal Amount | Market Value ╪ | |||||||
| Common Stocks - 94.7% | ||||||||
| Banks - 3.1% | ||||||||
| 120 | EverBank Financial Corp. | $ | 2,300 | |||||
| 27 | PNC Financial Services Group, Inc. | 2,374 | ||||||
| 4,674 | ||||||||
| Capital Goods - 4.3% | ||||||||
| 25 | AMETEK, Inc. | 1,295 | ||||||
| 15 | Dover Corp. | 1,171 | ||||||
| 18 | Illinois Tool Works, Inc. | 1,653 | ||||||
| 23 | United Technologies Corp. | 2,444 | ||||||
| 6,563 | ||||||||
| Commercial and Professional Services - 3.1% | ||||||||
| 25 | Equifax, Inc. | 1,889 | ||||||
| 28 | Nielsen N.V. | 1,189 | ||||||
| 25 | Verisk Analytics, Inc. ● | 1,577 | ||||||
| 4,655 | ||||||||
| Consumer Durables and Apparel - 2.2% | ||||||||
| 14 | PVH Corp. | 1,564 | ||||||
| 11 | Ralph Lauren Corp. | 1,760 | ||||||
| 3,324 | ||||||||
| Consumer Services - 0.9% | ||||||||
| 17 | Starwood Hotels & Resorts, Inc. | 1,293 | ||||||
| Diversified Financials - 2.4% | ||||||||
| 60 | JP Morgan Chase & Co. | 3,609 | ||||||
| Energy - 4.8% | ||||||||
| 17 | Anadarko Petroleum Corp. | 1,547 | ||||||
| 25 | Chevron Corp. | 3,023 | ||||||
| 13 | EOG Resources, Inc. | 1,239 | ||||||
| 27 | Halliburton Co. | 1,473 | ||||||
| 7,282 | ||||||||
| Food and Staples Retailing - 4.2% | ||||||||
| 22 | Costco Wholesale Corp. | 2,981 | ||||||
| 40 | CVS Health Corp. | 3,473 | ||||||
| 6,454 | ||||||||
| Food, Beverage and Tobacco - 4.0% | ||||||||
| 35 | Altria Group, Inc. | 1,715 | ||||||
| 75 | Mondelez International, Inc. | 2,638 | ||||||
| 18 | Monster Beverage Corp. ● | 1,794 | ||||||
| 6,147 | ||||||||
| Health Care Equipment and Services - 10.1% | ||||||||
| 15 | Aetna, Inc. | 1,271 | ||||||
| 21 | Cerner Corp. ● | 1,353 | ||||||
| 38 | Envision Healthcare Holdings ● | 1,344 | ||||||
| 16 | McKesson Corp. | 3,293 | ||||||
| 32 | MEDNAX, Inc. ● | 1,991 | ||||||
| 32 | Omnicare, Inc. | 2,130 | ||||||
| 26 | UnitedHealth Group, Inc. | 2,514 | ||||||
| 14 | Zimmer Holdings, Inc. | 1,541 | ||||||
| 15,437 | ||||||||
| Household and Personal Products - 2.1% | ||||||||
| 81 | Coty, Inc. | 1,336 | ||||||
| 24 | Estee Lauder Co., Inc. | 1,812 | ||||||
| 3,148 | ||||||||
| Insurance - 4.0% | ||||||||
| 26 | ACE Ltd. | 2,839 | ||||||
| 29 | American International Group, Inc. | 1,556 | ||||||
| 20 | Aon plc | 1,706 | ||||||
| 6,101 | ||||||||
| Materials - 2.8% | ||||||||
| 10 | Airgas, Inc. | 1,094 | ||||||
| 31 | Crown Holdings, Inc. ● | 1,467 | ||||||
| 8 | Sherwin-Williams Co. | 1,751 | ||||||
| 4,312 | ||||||||
| Media - 3.6% | ||||||||
| 46 | Comcast Corp. Special Class A | 2,528 | ||||||
| 34 | DirecTV ● | 2,934 | ||||||
| 5,462 | ||||||||
| Pharmaceuticals, Biotechnology and Life Sciences - 9.5% | ||||||||
| 8 | Actavis plc ● | 1,858 | ||||||
| 49 | Bristol-Myers Squibb Co. | 2,839 | ||||||
| 48 | Eli Lilly & Co. | 3,201 | ||||||
| 23 | Gilead Sciences, Inc. ● | 2,617 | ||||||
| 52 | Merck & Co., Inc. | 2,991 | ||||||
| 7 | Salix Pharmaceuticals Ltd. ● | 937 | ||||||
| 14,443 | ||||||||
| Retailing - 7.8% | ||||||||
| 6 | AutoZone, Inc. ● | 3,044 | ||||||
| 41 | Dollar Tree, Inc. ● | 2,470 | ||||||
| 41 | Lowe's Cos., Inc. | 2,354 | ||||||
| 24 | Ross Stores, Inc. | 1,970 | ||||||
| 33 | TJX Cos., Inc. | 2,058 | ||||||
| 11,896 | ||||||||
| Semiconductors and Semiconductor Equipment - 1.1% | ||||||||
| 48 | Intel Corp. | 1,648 | ||||||
| Software and Services - 13.7% | ||||||||
| 23 | Accenture plc | 1,860 | ||||||
| 87 | Activision Blizzard, Inc. | 1,734 | ||||||
| 32 | Automatic Data Processing, Inc. | 2,645 | ||||||
| 63 | Genpact Ltd. ● | 1,104 | ||||||
| 3 | Google, Inc. Class A ● | 1,874 | ||||||
| 3 | Google, Inc. Class C ● | 1,909 | ||||||
| 26 | Intuit, Inc. | 2,324 | ||||||
| 24 | Jack Henry & Associates, Inc. | 1,449 | ||||||
| 19 | MasterCard, Inc. | 1,567 | ||||||
| 76 | Microsoft Corp. | 3,577 | ||||||
| 16 | Solera Holdings, Inc. | 854 | ||||||
| 20,897 | ||||||||
| Technology Hardware and Equipment - 5.2% | ||||||||
| 35 | Apple, Inc. | 3,816 | ||||||
| 69 | Cisco Systems, Inc. | 1,676 | ||||||
| 32 | Qualcomm, Inc. | 2,486 | ||||||
| 7,978 | ||||||||
| Transportation - 1.5% | ||||||||
| 21 | United Parcel Service, Inc. Class B | 2,212 | ||||||
| Utilities - 4.3% | ||||||||
| 43 | American Electric Power Co., Inc. | 2,486 | ||||||
| 25 | NextEra Energy, Inc. | 2,554 | ||||||
| 25 | Pinnacle West Capital Corp. | 1,521 | ||||||
| 6,561 | ||||||||
| Total Common Stocks | ||||||||
| (Cost $112,685) | $ | 144,096 | ||||||
| Total Long-Term Investments | ||||||||
| (Cost $112,685) | $ | 144,096 | ||||||
The accompanying notes are an integral part of these financial statements.
| 5 |
| The Hartford Disciplined Equity Fund |
| Schedule of Investments – (continued) |
| October 31, 2014 |
| (000’s Omitted) |
| Shares or Principal Amount | Market Value ╪ | |||||||||||
| Short-Term Investments - 5.0% | ||||||||||||
| Repurchase Agreements - 5.0% | ||||||||||||
| Bank of America Merrill Lynch TriParty Repurchase Agreement (maturing on 11/03/2014 in the amount of $22, collateralized by U.S. Treasury Note 1.50%, 2019, value of $22) | ||||||||||||
| $ | 22 | 0.08%, 10/31/2014 | $ | 22 | ||||||||
| Bank of America Merrill Lynch TriParty Repurchase Agreement (maturing on 11/03/2014 in the amount of $370, collateralized by GNMA 1.63% - 7.00%, 2031 - 2054, value of $378) | ||||||||||||
| 370 | 0.09%, 10/31/2014 | 370 | ||||||||||
| Bank of Montreal TriParty Repurchase Agreement (maturing on 11/03/2014 in the amount of $99, collateralized by U.S. Treasury Bond 2.88% - 5.25%, 2029 - 2043, U.S. Treasury Note 0.38% - 4.50%, 2015 - 2022, value of $101) | ||||||||||||
| 99 | 0.08%, 10/31/2014 | 99 | ||||||||||
| Bank of Montreal TriParty Repurchase Agreement (maturing on 11/03/2014 in the amount of $337, collateralized by FHLMC 2.00% - 5.50%, 2022 - 2034, FNMA 2.00% - 4.50%, 2024 - 2039, GNMA 3.00%, 2043, U.S. Treasury Note 4.63%, 2017, value of $344) | ||||||||||||
| 337 | 0.10%, 10/31/2014 | 337 | ||||||||||
| Barclays Capital TriParty Repurchase Agreement (maturing on 11/03/2014 in the amount of $1,271, collateralized by U.S. Treasury Bond 4.50% - 6.25%, 2023 - 2036, U.S. Treasury Note 1.63% - 2.13%, 2015 - 2019, value of $1,296) | ||||||||||||
| 1,271 | 0.08%, 10/31/2014 | 1,271 | ||||||||||
| Citigroup Global Markets, Inc. TriParty Repurchase Agreement (maturing on 11/03/2014 in the amount of $1,461, collateralized by U.S. Treasury Bill 0.02%, 2015, U.S. Treasury Bond 3.88% - 11.25%, 2015 - 2040, U.S. Treasury Note 2.00% - 3.38%, 2019 - 2021, value of $1,490) | ||||||||||||
| 1,461 | 0.09%, 10/31/2014 | 1,461 | ||||||||||
| Deutsche Bank Securities TriParty Repurchase Agreement (maturing on 11/03/2014 in the amount of $84, collateralized by U.S. Treasury Note 0.88%, 2017, value of $86) | ||||||||||||
| 84 | 0.13%, 10/31/2014 | 84 | ||||||||||
| RBS Securities, Inc. TriParty Repurchase Agreement (maturing on 11/03/2014 in the amount of $124, collateralized by U.S. Treasury Bond 3.63% - 5.00%, 2037 - 2043, U.S. Treasury Note 2.13%, 2020, value of $127) | ||||||||||||
| 124 | 0.07%, 10/31/2014 | 124 | ||||||||||
| Societe Generale TriParty Repurchase Agreement (maturing on 11/03/2014 in the amount of $1,308, collateralized by U.S. Treasury Bill 0.02%, 2015, U.S. Treasury Bond 3.75% - 11.25%, 2015 - 2043, U.S. Treasury Note 1.38% - 4.25%, 2015 - 2022, value of $1,334) | ||||||||||||
| 1,308 | 0.08%, 10/31/2014 | 1,308 | ||||||||||
| TD Securities TriParty Repurchase Agreement (maturing on 11/03/2014 in the amount of $2,534, collateralized by FHLMC 3.00% - 4.00%, 2026 - 2044, FNMA 2.50% - 5.00%, 2025 - 2044, U.S. Treasury Bond 3.50% - 6.50%, 2026 - 2041, U.S. Treasury Note 1.75% - 2.88%, 2018 - 2019, value of $2,584) | ||||||||||||
| 2,534 | 0.10%, 10/31/2014 | 2,534 | ||||||||||
| 7,610 | ||||||||||||
| Total Short-Term Investments | ||||||||||||
| (Cost $7,610) | $ | 7,610 | ||||||||||
| Total Investments | ||||||||||||
| (Cost $120,295) ▲ | 99.7 | % | $ | 151,706 | ||||||||
| Other Assets and Liabilities | 0.3 | % | 528 | |||||||||
| Total Net Assets | 100.0 | % | $ | 152,234 | ||||||||
The accompanying notes are an integral part of these financial statements.
| 6 |
| The Hartford Disciplined Equity Fund |
| Schedule of Investments – (continued) |
| October 31, 2014 |
| (000’s Omitted) |
| Note: | Percentage of investments as shown is the ratio of the total market value to total net assets. |
Equity industry classifications used in this report are the Global Industry Classification Standard, which was developed by and is the exclusive property and service mark of MSCI, Inc. and Standard & Poor’s.
For Fund compliance purposes, the Fund may not use the same classification system shown in this report as these classifications are used for reporting ease.
| ▲ | At October 31, 2014, the cost of securities for federal income tax purposes was $120,406 and the aggregate gross unrealized appreciation and depreciation based on that cost were: |
| Unrealized Appreciation | $ | 31,816 | ||
| Unrealized Depreciation | (516 | ) | ||
| Net Unrealized Appreciation | $ | 31,300 |
| ● | Non-income producing. |
Cash pledged and received as collateral in connection with derivatives at October 31, 2014:
| Pledged | Received | |||||||
| Futures contracts | $ | 230 | $ | – | ||||
| Total | $ | 230 | $ | – | ||||
| Futures Contracts Outstanding at October 31, 2014 | ||||||||||||||||||||||||||||
| Number of | Expiration | Notional | Market | Unrealized Appreciation/(Depreciation) | Variation Margin | |||||||||||||||||||||||
| Description | Contracts* | Date | Amount | Value ╪ | Asset | Liability | Asset | Liability | ||||||||||||||||||||
| Long position contracts: | ||||||||||||||||||||||||||||
| S&P 500 (E-Mini) Future | 50 | 12/19/2014 | $ | 4,817 | $ | 5,029 | $ | 212 | $ | – | $ | 57 | $ | – | ||||||||||||||
* The number of contracts does not omit 000's.
| ╪ | See Significant Accounting Policies of accompanying Notes to Financial Statements regarding valuation of securities. |
| GLOSSARY: (abbreviations used in preceding Schedule of Investments) | |
| Index Abbreviations: | |
| S&P | Standard & Poors |
| Other Abbreviations: | |
| FHLMC | Federal Home Loan Mortgage Corp. |
| FNMA | Federal National Mortgage Association |
| GNMA | Government National Mortgage Association |
The accompanying notes are an integral part of these financial statements.
| 7 |
| The Hartford Disciplined Equity Fund |
| Schedule of Investments – (continued) |
| October 31, 2014 |
| (000’s Omitted) |
Investment Valuation Hierarchy Level Summary
October 31, 2014
| Total | Level 1 ♦ | Level 2 ♦ | Level 3 | |||||||||||||
| Assets: | ||||||||||||||||
| Common Stocks ‡ | $ | 144,096 | $ | 144,096 | $ | – | $ | – | ||||||||
| Short-Term Investments | 7,610 | – | 7,610 | – | ||||||||||||
| Total | $ | 151,706 | $ | 144,096 | $ | 7,610 | $ | – | ||||||||
| Futures * | $ | 212 | $ | 212 | $ | – | $ | – | ||||||||
| Total | $ | 212 | $ | 212 | $ | – | $ | – | ||||||||
| ♦ | For the year ended October 31, 2014, there were no transfers between Level 1 and Level 2. |
| ‡ | The Fund has all or primarily all of the equity securities categorized in a particular level. Refer to the Schedule of Investments for further industry breakout. |
| * | Derivative instruments (excluding purchased and written options, if applicable) are valued at the unrealized appreciation/depreciation on the investments. |
| Note: | For purposes of reporting transfers between different hierarchy levels, both transfers in and out of each level, as applicable, are shown as if they occurred at the beginning of the period. |
The accompanying notes are an integral part of these financial statements.
| 8 |
| The Hartford Disciplined Equity Fund |
| Statement of Assets and Liabilities |
| October 31, 2014 |
| (000’s Omitted) |
| Assets: | ||||
| Investments in securities, at market value (cost $120,295) | $ | 151,706 | ||
| Cash | 231 | * | ||
| Receivables: | ||||
| Fund shares sold | 314 | |||
| Dividends and interest | 96 | |||
| Variation margin on financial derivative instruments | 57 | |||
| Other assets | 71 | |||
| Total assets | 152,475 | |||
| Liabilities: | ||||
| Payables: | ||||
| Investment securities purchased | 82 | |||
| Fund shares redeemed | 85 | |||
| Investment management fees | 21 | |||
| Administrative fees | — | |||
| Distribution fees | 10 | |||
| Accrued expenses | 43 | |||
| Total liabilities | 241 | |||
| Net assets | $ | 152,234 | ||
| Summary of Net Assets: | ||||
| Capital stock and paid-in-capital | $ | 118,738 | ||
| Undistributed net investment income | 91 | |||
| Accumulated net realized gain | 1,782 | |||
| Unrealized appreciation of investments | 31,623 | |||
| Net assets | $ | 152,234 | ||
| Shares authorized | 450,000 | |||
| Par value | $ | 0.001 | ||
| Class A: Net asset value per share/Maximum offering price per share | $22.00/$23.28 | |||
| Shares outstanding | 5,742 | |||
| Net assets | $ | 126,308 | ||
| Class B: Net asset value per share | $ | 20.60 | ||
| Shares outstanding | 92 | |||
| Net assets | $ | 1,898 | ||
| Class C: Net asset value per share | $ | 20.54 | ||
| Shares outstanding | 964 | |||
| Net assets | $ | 19,798 | ||
| Class R3: Net asset value per share | $ | 22.41 | ||
| Shares outstanding | 21 | |||
| Net assets | $ | 481 | ||
| Class R4: Net asset value per share | $ | 22.60 | ||
| Shares outstanding | 39 | |||
| Net assets | $ | 889 | ||
| Class R5: Net asset value per share | $ | 22.72 | ||
| Shares outstanding | 16 | |||
| Net assets | $ | 374 | ||
| Class Y: Net asset value per share | $ | 22.79 | ||
| Shares outstanding | 109 | |||
| Net assets | $ | 2,486 |
* Cash of $230 was pledged as collateral for open financial derivative instruments at October 31, 2014.
The accompanying notes are an integral part of these financial statements.
| 9 |
| The Hartford Disciplined Equity Fund |
| Statement of Operations |
| For the Year Ended October 31, 2014 |
| (000’s Omitted) |
| Investment Income: | ||||
| Dividends | $ | 1,996 | ||
| Interest | 1 | |||
| Total investment income | 1,997 | |||
| Expenses: | ||||
| Investment management fees | 1,020 | |||
| Administrative services fees | ||||
| Class R3 | 1 | |||
| Class R4 | 1 | |||
| Class R5 | — | |||
| Transfer agent fees | ||||
| Class A | 236 | |||
| Class B | 13 | |||
| Class C | 26 | |||
| Class R3 | — | |||
| Class R4 | — | |||
| Class R5 | — | |||
| Class Y | — | |||
| Distribution fees | ||||
| Class A | 282 | |||
| Class B | 22 | |||
| Class C | 175 | |||
| Class R3 | 2 | |||
| Class R4 | 1 | |||
| Custodian fees | 3 | |||
| Accounting services fees | 22 | |||
| Registration and filing fees | 148 | |||
| Board of Directors' fees | 4 | |||
| Audit fees | 12 | |||
| Other expenses | 32 | |||
| Total expenses (before waivers and fees paid indirectly) | 2,000 | |||
| Expense waivers | (88 | ) | ||
| Transfer agent fee waivers | (6 | ) | ||
| Commission recapture | — | |||
| Total waivers and fees paid indirectly | (94 | ) | ||
| Total expenses, net | 1,906 | |||
| Net Investment Income | 91 | |||
| Net Realized Gain on Investments and Other Financial Instruments: | ||||
| Net realized gain on investments | 25,687 | |||
| Net realized gain on futures contracts | 94 | |||
| Net realized gain on written option contracts | 29 | |||
| Net Realized Gain on Investments and Other Financial Instruments | 25,810 | |||
| Net Changes in Unrealized Depreciation of Investments and Other Financial Instruments: | ||||
| Net unrealized depreciation of investments | (4,149 | ) | ||
| Net unrealized appreciation of futures contracts | 187 | |||
| Net unrealized depreciation of written option contracts | (13 | ) | ||
| Net Changes in Unrealized Depreciation of Investments and Other Financial Instruments | (3,975 | ) | ||
| Net Gain on Investments and Other Financial Instruments | 21,835 | |||
| Net Increase in Net Assets Resulting from Operations | $ | 21,926 |
The accompanying notes are an integral part of these financial statements.
| 10 |
| The Hartford Disciplined Equity Fund |
| Statement of Changes in Net Assets |
| (000’s Omitted) |
| For the Year Ended October 31, 2014 | For the Year Ended October 31, 2013 | |||||||
| Operations: | ||||||||
| Net investment income | $ | 91 | $ | 657 | ||||
| Net realized gain on investments and other financial instruments | 25,810 | 6,827 | ||||||
| Net unrealized appreciation (depreciation) of investments and other financial instruments | (3,975 | ) | 21,753 | |||||
| Net Increase in Net Assets Resulting from Operations | 21,926 | 29,237 | ||||||
| Distributions to Shareholders: | ||||||||
| From net investment income | ||||||||
| Class A | (323 | ) | (851 | ) | ||||
| Class B | — | (4 | ) | |||||
| Class C | — | (38 | ) | |||||
| Class R3 | (1 | ) | (2 | ) | ||||
| Class R4 | — | (2 | ) | |||||
| Class R5 | (1 | ) | (2 | ) | ||||
| Class Y | (15 | ) | (20 | ) | ||||
| Total distributions | (340 | ) | (919 | ) | ||||
| Capital Share Transactions: | ||||||||
| Class A | 5,184 | (3,903 | ) | |||||
| Class B | (924 | ) | (952 | ) | ||||
| Class C | 1,777 | 15 | ||||||
| Class R3 | 94 | 53 | ||||||
| Class R4 | (422 | ) | 852 | |||||
| Class R5 | 124 | 15 | ||||||
| Class Y | 183 | (88 | ) | |||||
| Net increase (decrease) from capital share transactions | 6,016 | (4,008 | ) | |||||
| Net Increase in Net Assets | 27,602 | 24,310 | ||||||
| Net Assets: | ||||||||
| Beginning of period | 124,632 | 100,322 | ||||||
| End of period | $ | 152,234 | $ | 124,632 | ||||
| Undistributed (distributions in excess of) net investment income | $ | 91 | $ | 337 | ||||
The accompanying notes are an integral part of these financial statements.
| 11 |
| The Hartford Disciplined Equity Fund |
| Notes to Financial Statements |
| October 31, 2014 |
| (000’s Omitted) |
Organization:
The Hartford Mutual Funds, Inc. (“Company”) is an open-end management investment company comprised of forty-two portfolios. Financial statements for The Hartford Disciplined Equity Fund (the "Fund"), a series of the Company, are included in this report.
The Company is organized under the laws of the State of Maryland and is registered with the Securities and Exchange Commission (“SEC”) under the Investment Company Act of 1940, as amended (“1940 Act”). The Fund is a diversified open-end management investment company. The Fund is an investment company and applies specialized accounting and reporting under Accounting Standards Codification Topic 946, Financial Services - Investment Companies.
Class A shares are sold with a front-end sales charge of up to 5.50%. Class B shares were sold with a contingent deferred sales charge which is assessed on the lesser of the per share net asset value (“NAV”) of the shares at the time of redemption or the original purchase price, and declines from up to 5.00% to zero depending on the period of time the shares are held (see note below regarding the closing of Class B shares). Class C shares are sold with a contingent deferred sales charge of up to 1.00% on shares redeemed within twelve months of purchase. Class R3, R4 and R5 shares, which are offered to employer-sponsored retirement plans, and Class Y shares, which are sold to certain eligible institutional investors, are sold without a sales charge. All classes of shares have identical voting, redemption, dividend, liquidation and other rights and the same terms and conditions, with the exceptions that each class may have different expenses, which may affect performance, and that Class B shares automatically convert to Class A shares after 8 years.
No new or additional investments are allowed in Class B shares of the Fund (including investments through any systematic investment plan). Existing shareholders of Class B shares may continue to hold their Class B shares, exchange their Class B shares for Class B shares of another Hartford Fund (as permitted by existing exchange privileges), or redeem their Class B shares as described in the Fund’s prospectus. Reinstatement privileges with respect to Class B shares are set forth in the Fund's prospectus. For investors electing to reinvest capital gains and dividends, any such capital gains or dividends on Class B shares will continue to be reinvested in Class B shares of the Fund. All Class B share attributes, including the 12b-1 fee, contingent deferred sales charge schedule, and conversion to Class A shares, remain unchanged.
Significant Accounting Policies:
The following is a summary of significant accounting policies of the Fund in the preparation of its financial statements, which are in accordance with United States generally accepted accounting principles (“U.S. GAAP”). The preparation of financial statements in accordance with U.S. GAAP may require management to make estimates and assumptions that affect the reported amounts of assets and liabilities and disclosure of contingent assets and liabilities at the date of the financial statements and the reported amounts of increases and decreases in net assets from operations during the reporting period. Actual results could differ from those estimates.
Determination of Net Asset Value – The NAV of each class of the Fund's shares is determined as of the close of regular trading (normally 4:00 p.m. Eastern Time) (the “NYSE Close”) on each day that the New York Stock Exchange (the “Exchange”) is open (“Valuation Date”). Information that becomes known to the Fund after the NAV has been calculated on a particular day will not generally be used to retroactively adjust the NAV determined earlier that day.
Investment Valuation and Fair Value Measurements – For purposes of calculating the NAV, portfolio investments and other assets held by the Fund's portfolio for which market quotes are readily available are valued at market value. Market value is generally determined on the basis of last reported sales prices or official close price. If no sales are reported, market value is based on quotes obtained from a quotation reporting system, established market makers, or independent pricing services. If market prices are not readily available or are deemed unreliable, the Fund will use the fair value of the investment as determined in good faith under policies and procedures established by and under the supervision of the Company's Board of Directors. Market quotes are considered not readily available where there is an absence of current or reliable market-based data (e.g., trade information or indicative market quotes), including where events occur after the close of the relevant market, but prior to the NYSE Close, that materially affect the values of the Fund's portfolio investments or assets. In addition, market quotes are considered not readily available when, due to extraordinary circumstances, the exchanges or markets on which the investments trade do not open for trading for the entire day and no other market prices are available. There can be no assurance that the Fund could obtain the fair market value assigned to an investment if the Fund were to sell the investment at approximately the time at which the Fund determines its NAV.
| 12 |
| The Hartford Disciplined Equity Fund |
| Notes to Financial Statements – (continued) |
| October 31, 2014 |
| (000’s Omitted) |
Exchange traded options, futures and options on futures are valued at the settlement price or last trade price determined by the relevant exchange as of the NYSE Close. If the last trade price for exchange traded options does not fall between the bid and ask prices, the value will be the mean of the bid and ask prices as of the NYSE Close. If a last trade price is not available, the value will be the mean of the bid and ask prices as of the NYSE Close. If a mean of the bid and ask prices cannot be calculated for the day, the value will be the bid price as of the NYSE Close. In the case of over-the-counter ("OTC") options and such instruments that do not trade on an exchange, values may be supplied by a pricing service using a formula or other objective method that may take into consideration the style, direction, expiration, strike price, notional value and volatility or other special adjustments.
Financial instruments for which prices are not available from an independent pricing service may be valued using market quotations obtained from one or more dealers that make markets in the respective financial instrument in accordance with procedures established by the Company's Board of Directors.
U.S. GAAP defines fair value as the price that the Fund would receive to sell an asset or pay to transfer a liability in an orderly transaction between market participants. The U.S. GAAP fair value measurement standards require disclosure of a fair value hierarchy for each major category of assets and liabilities. Various inputs are used in determining the fair value of the Fund’s investments. These inputs are summarized into three broad hierarchy levels. This hierarchy is based on whether the valuation inputs are observable or unobservable. These levels are:
Level 1 – Quoted prices in active markets for identical investments. Level 1 may include exchange traded instruments, such as domestic equities, some foreign equities, options, futures, mutual funds, exchange traded funds, rights and warrants.
Level 2 – Observable inputs other than Level 1 prices, such as quoted prices for similar investments; quoted prices in markets that are not active; or other inputs that are observable or can be corroborated by observable market data. Level 2 may include debt investments that are traded less frequently than exchange traded instruments and which are valued using independent pricing services; foreign equities, which are principally traded on certain foreign markets and are adjusted daily pursuant to a fair value pricing service in order to reflect an adjustment for the factors occurring after the close of certain foreign markets but before the NYSE Close; senior floating rate interests, which are valued using an aggregate of dealer bids; short-term investments, which are valued at amortized cost; and swaps, which are valued based upon the terms of each swap contract.
Level 3 – Significant unobservable inputs that are supported by limited or no market activity. Level 3 may include financial instruments whose values are determined using indicative market quotes or require significant management judgment or estimation. These unobservable valuation inputs may include estimates for current yields, maturity/duration, prepayment speed, and indicative market quotes for comparable investments along with other assumptions relating to credit quality, collateral value, complexity of the investment structure, general market conditions and liquidity. This category may include investments where trading has been halted or there are certain restrictions on trading. While these investments are priced using unobservable inputs, the valuation of these investments reflects the best available data and management believes the prices are a reasonable representation of exit price.
The Board of Directors of the Company generally reviews and approves the “Procedures for Valuation of Portfolio Securities” at least once a year. These procedures define how investments are to be valued, including the formation and activities of a Valuation Committee. The Valuation Committee is responsible for determining in good faith the fair value of investments when the value cannot be obtained from primary pricing services or alternative sources or if the valuation of an investment as provided by the primary pricing service or alternative source is believed not to reflect the investment’s fair value as of the Valuation Date. Voting members of the Valuation Committee include the Fund's Treasurer or designee and a Vice President of the investment manager or designee. An Assistant Vice President of the Fund with legal expertise or designee is also included on the Valuation Committee as a non-voting advisory member. In addition, the Fund’s Chief Compliance Officer shall designate a member of the compliance group to attend Valuation Committee meetings as a non-voting resource, to monitor for and provide guidance with respect to compliance with these procedures. Two members of the Valuation Committee or their designees, representing different departments, shall constitute a quorum for purposes of permitting the Valuation Committee to take action. The Valuation Committee will consider all relevant factors in determining an investment’s fair value, and may seek the advice of the Fund’s sub-adviser, knowledgeable brokers, and legal counsel in making such determination. The Valuation Committee reports to the Audit
| 13 |
| The Hartford Disciplined Equity Fund |
| Notes to Financial Statements – (continued) |
| October 31, 2014 |
| (000’s Omitted) |
Committee of the Company's Board of Directors. The Audit Committee receives quarterly written reports which include details of all fair-valued investments, including the reason for the fair valuation, and an indication, when possible, of the accuracy of the valuation by disclosing the next available reliable public price quotation or the disposition price of such investments (the “look-back” test). The Board of Directors then must consider for ratification all of the fair value determinations made during the previous quarter.
Valuation levels are not necessarily indicative of the risk associated with investing in such investments. Individual investments within any of the above mentioned asset classes may be assigned a different hierarchical level than those presented above, as individual circumstances dictate.
For additional information, refer to the Investment Valuation Hierarchy Level Summary which follows the Schedule of Investments.
Investment Transactions and Investment Income – Investment transactions are recorded as of the trade date (the date the order to buy or sell is executed) for financial reporting purposes. Investments purchased or sold on a when-issued or delayed-delivery basis may be settled a month or more after the trade date. Realized gains and losses are determined on the basis of identified cost.
Dividend income from domestic securities is accrued on the ex-dividend date. Interest income, including amortization of premium, accretion of discounts and additional principal received in-kind in lieu of cash, is accrued on a daily basis.
Joint Trading Account – The Fund may invest cash balances into a joint trading account that may be invested in one or more repurchase agreements.
Fund Share Valuation and Dividend Distributions to Shareholders – Orders for the Fund’s shares are executed in accordance with the investment instructions of the shareholders. The NAV of the Fund’s shares is determined as of the close of business on each business day of the Exchange. The NAV is determined separately for each class of shares of the Fund by dividing the Fund’s net assets attributable to that class by the number of shares of the class outstanding. Each class of shares offered by the Fund has equal rights as to assets and voting privileges (except that shareholders of a class have exclusive voting rights regarding any matter relating solely to that class of shares). Income and non-class specific expenses are allocated daily to each class on the basis of the relative net assets of the class. Realized and unrealized gains and losses are allocated daily based on the relative net assets of each class of shares of the Fund.
Orders for the purchase of the Fund’s shares received prior to the close of the Exchange on any day the Exchange is open for business are priced at the NAV determined as of the close of the Exchange. Orders received after the close of the Exchange, or on a day on which the Exchange and/or the Fund is not open for business, are priced at the next determined NAV.
Dividends are declared pursuant to a policy adopted by the Company's Board of Directors based upon the investment performance of the Fund. The policy of the Fund is to pay dividends from net investment income and realized gains, if any, at least once a year.
Net investment income, dividends and distributions from net realized gains and capital are determined in accordance with federal income tax regulations, which may differ from U.S. GAAP with respect to character and timing (see Federal Income Taxes: Distributions and Components of Distributable Earnings and Reclassification of Capital Accounts).
Securities and Other Investments:
Repurchase Agreements – A repurchase agreement is an agreement by which a counterparty agrees to sell an investment and agrees to repurchase the investment sold from the buyer at a mutually agreed upon time and price. During the period of the repurchase agreement, the counterparty will deposit cash and or securities in a third party custodial account to serve as collateral. At the time the Fund enters into a repurchase agreement, the value of the underlying collateral, including accrued interest, will be equal to or exceed the value of the repurchase agreement. Repurchase agreements expose the Fund to counterparty risk - that is, the risk that the counterparty will not fulfill its obligations. To minimize counterparty risk, the investments that serve to collateralize the repurchase agreement are held by the Fund’s custodian in book entry or physical form in the custodial account of the Fund or in a third party custodial account. Repurchase agreements are valued at cost plus accrued interest, which approximates fair value.
| 14 |
| The Hartford Disciplined Equity Fund |
| Notes to Financial Statements – (continued) |
| October 31, 2014 |
| (000’s Omitted) |
Repurchase agreements have master netting arrangements which allow the Fund to offset amounts owed to a counterparty with amounts owed by the counterparty, including any collateral. Upon an event of default under a master repurchase agreement, the non-defaulting party may close out all transactions traded under such agreement and net amounts owed under each transaction to one net amount payable by one party to the other. Absent an event of default, the master repurchase agreement does not result in an offset of reported amounts of assets and liabilities in the Statement of Assets and Liabilities across transactions between the Fund and the applicable counterparty. The Fund, as shown on the Schedule of Investments, had outstanding repurchase agreements and related collateral as of October 31, 2014.
Financial Derivative Instruments:
The following disclosures contain information on how and why the Fund uses derivative instruments, the credit-risk-related contingent features in certain derivative instruments and how derivative instruments affect the Fund’s financial position and results of operations. The location and fair value amounts of these instruments on the Statement of Assets and Liabilities and the realized gains and losses and changes in unrealized gains and losses on the Statement of Operations, each categorized by type of derivative contract, are included in the following Additional Derivative Instrument Information footnote. The derivative instruments outstanding as of year-end are disclosed in the notes to the Schedule of Investments, if applicable. The amounts of realized gains and losses and changes in unrealized gains and losses on derivative instruments during the year are disclosed in the Statement of Operations.
Futures Contracts – The Fund may enter into futures contracts. A futures contract is an agreement between two parties to buy or sell an asset at a set price on a future date. The Fund uses futures contracts to manage or obtain exposure to the investment markets, commodities, or movements in interest rates and currency values. The primary risks associated with the use of futures contracts are the imperfect correlation between the change in market value of the investments held by the Fund and the prices of futures contracts and the possibility of an illiquid market. Upon entering into a futures contract, the Fund is required to deposit with a futures commission merchant (“FCM”) an amount of cash or U.S. Government or Agency Obligations in accordance with the initial margin requirements of the broker or exchange. Futures contracts are marked to market daily at the most recent settlement price reported by an exchange on which, over time, they are traded most extensively, and an appropriate payable or receivable for the change in value (“variation margin”) is recorded by the Fund. Gains or losses are recognized but not considered realized until the contracts expire or are closed. Futures contracts involve, to varying degrees, risk of loss in excess of the variation margin disclosed on the Statement of Assets and Liabilities; however, the Fund seeks to reduce this risk through the use of an FCM. The Fund, as shown on the Schedule of Investments, had outstanding futures contracts as of October 31, 2014.
Options Contracts – An option contract is a contract sold by one party to another party that offers the buyer the right, but not the obligation, to buy (call) or sell (put) an investment or other financial asset at an agreed-upon price during a specific period of time or on a specific date. Options contracts are either privately negotiated in the over-the-counter market ("OTC options") or executed in a registered exchange ("exchange traded options"). The Fund may write (sell) covered call and put options on futures, swaps (“swaptions”), securities, commodities or currencies. “Covered” means that so long as the Fund is obligated as the writer of an option, it will own either the underlying investments or currency or an option to purchase the same underlying investments or currency having an expiration date of the covered option and an exercise price equal to or less than the exercise price of the covered option, or will pledge cash or other liquid investments having a value equal to or greater than the fluctuating market value of the option investment or currency. Writing put options increases the Fund’s exposure to the underlying instrument. Writing call options decreases the Fund’s exposure to the underlying instrument. Premiums received from writing options that expire are treated as realized gains. Premiums received from writing options that are exercised or closed are added to the proceeds or offset amounts paid on the underlying futures, swap, investment or currency transaction to determine the realized gain or loss. The Fund as a writer of an option has no control over whether the underlying instrument may be sold (call) or purchased (put) and as a result bears the market risk of an unfavorable change in the price of the instrument underlying the written option. There is the risk the Fund may not be able to enter into a closing transaction because of an illiquid market. The Fund may also purchase put and call options. Purchasing call options increases the Fund’s exposure to the underlying instrument. Purchasing put options decreases the Fund’s exposure to the underlying instrument. The Fund pays a premium, which is included on the Fund’s Statement of Assets and Liabilities as an investment and is subsequently marked to market to reflect the current value of the option. Premiums paid for purchasing options that expire are treated as realized losses. Certain options may be purchased with premiums to be determined on a future date. The premiums for these options are based upon implied volatility parameters at specified terms. The risk associated with purchasing put and call options is generally limited to the premium paid. Premiums paid for purchasing options that are exercised or closed are added to the amounts paid or
| 15 |
| The Hartford Disciplined Equity Fund |
| Notes to Financial Statements – (continued) |
| October 31, 2014 |
| (000’s Omitted) |
offset against the proceeds on the underlying investment transaction to determine the realized gain or loss. Entering into over-the-counter options also exposes the Fund to counterparty risk. Counterparty risk is the possibility that the counterparty to the agreements may default on its obligation to perform or disagree as to the meaning of the contractual terms in the agreements.
As of October 31, 2014 the Fund had no outstanding purchased option or written option contracts. Transactions involving written option contracts during the year ended October 31, 2014, are summarized below:
| Options Contract Activity During the Year Ended October 31, 2014: | ||||||||
| Call Options Written During the Year | Number of Contracts* | Premium Amounts | ||||||
| Beginning of the period | 164 | $ | 16 | |||||
| Written | 360 | 31 | ||||||
| Expired | (205 | ) | (15 | ) | ||||
| Closed | (283 | ) | (28 | ) | ||||
| Exercised | (36 | ) | (4 | ) | ||||
| End of period | — | $ | — | |||||
| Put Options Written During the Year | Number of Contracts* | Premium Amounts | ||||||
| Beginning of the period | 120 | $ | 11 | |||||
| Written | 205 | 14 | ||||||
| Expired | (189 | ) | (18 | ) | ||||
| Closed | (136 | ) | (7 | ) | ||||
| Exercised | — | — | ||||||
| End of period | — | $ | — | |||||
* The number of contracts does not omit 000's.
Additional Derivative Instrument Information:
Fair Value of Derivative Instruments on the Statement of Assets and Liabilities as of October 31, 2014:
| Risk Exposure Category | ||||||||||||||||||||||||||||
| Interest
Rate Contracts | Foreign Exchange Contracts | Credit Contracts | Equity Contracts | Commodity Contracts | Other Contracts | Total | ||||||||||||||||||||||
| Assets: | ||||||||||||||||||||||||||||
| Variation margin receivable * | $ | — | $ | — | $ | — | $ | 57 | $ | — | $ | — | $ | 57 | ||||||||||||||
| Total | $ | — | $ | — | $ | — | $ | 57 | $ | — | $ | — | $ | 57 | ||||||||||||||
| * | Only current day's variation margin is reported within the Statement of Assets and Liabilities. The variation margin is included in the open futures net cumulative appreciation of $212 as reported in the Schedule of Investments. |
The volume of derivatives that is presented in the Schedule of Investments is consistent with the derivative activity during the year ended October 31, 2014.
| 16 |
| The Hartford Disciplined Equity Fund |
| Notes to Financial Statements – (continued) |
| October 31, 2014 |
| (000’s Omitted) |
The Effect of Derivative Instruments on the Statement of Operations for the year ended October 31, 2014:
| Risk Exposure Category | ||||||||||||||||||||||||||||
| Interest
Rate Contracts | Foreign Exchange Contracts | Credit Contracts | Equity Contracts | Commodity Contracts | Other Contracts | Total | ||||||||||||||||||||||
| Realized Gain on Derivatives Recognized as a Result of Operations: | ||||||||||||||||||||||||||||
| Net realized gain on futures contracts | $ | — | $ | — | $ | — | $ | 94 | $ | — | $ | — | $ | 94 | ||||||||||||||
| Net realized gain on written option contracts | — | — | — | 29 | — | — | 29 | |||||||||||||||||||||
| Total | $ | — | $ | — | $ | — | $ | 123 | $ | — | $ | — | $ | 123 | ||||||||||||||
| Net Change in Unrealized Appreciation (Depreciation) on Derivatives Recognized as a Result of Operations: | ||||||||||||||||||||||||||||
| Net change in unrealized appreciation of futures contracts | $ | — | $ | — | $ | — | $ | 187 | $ | — | $ | — | $ | 187 | ||||||||||||||
| Net change in unrealized depreciation of written option contracts | — | — | — | (13 | ) | — | — | (13 | ) | |||||||||||||||||||
| Total | $ | — | $ | — | $ | — | $ | 174 | $ | — | $ | — | $ | 174 | ||||||||||||||
Balance Sheet Offsetting Information - The following discloses both gross information and net information about instruments and transactions eligible for offset in the financial statements, and instruments and transactions that are subject to a master netting arrangement, as well as amounts related to margin, reflected as financial collateral (including cash collateral), held at clearing brokers, counterparties and the Fund’s custodian. The master netting arrangements allow the clearing brokers to net any collateral held in or on behalf of the Fund, or liabilities or payment obligations of the clearing brokers to the Fund, against any liabilities or payment obligations of the Fund to the clearing brokers. The Fund is required to deposit financial collateral (including cash collateral) at the FCM's custodian on behalf of clearing brokers and counterparties to continually meet the original and maintenance requirements established by the clearing brokers and counterparties. Such requirements are specific to the respective clearing broker or counterparty. Certain master netting arrangements may not be enforceable in the bankruptcy proceedings of a counterparty.
Offsetting of Financial Assets and Derivative Assets as of October 31, 2014:
| Gross
Amounts* of Assets Presented in Statement of Assets and Liabilities | Financial Instruments with Allowable Netting | Non-cash Collateral Received | Cash
Collateral Received | Net
Amount (not less than $0) | ||||||||||||||||
| Description | ||||||||||||||||||||
| Futures contracts - variation margin receivable | $ | 57 | $ | — | $ | — | $ | — | ♦ | $ | 57 | |||||||||
| Total subject to a master netting or similar arrangement | $ | 57 | $ | — | $ | — | $ | — | $ | 57 | ||||||||||
| * | Gross amounts are presented here as there are no amounts that are netted within the Statement of Assets and Liabilities. |
| ♦ | The Fund has pledged $230 as collateral for open futures contracts held at October 31, 2014. |
Principal Risks:
The Fund may be exposed to counterparty risk, or the risk that an institution or other entity with which the Fund has unsettled or open transactions will default.
The market values of equity securities, such as common stocks and preferred stocks, or equity related investments, such as futures and options, may decline due to general market conditions which are not specifically related to a particular company, such as real or perceived adverse economic conditions, changes in the general outlook for corporate earnings, changes in interest or currency rates or adverse investor sentiment generally. The market value of equity securities may also decline due to factors which affect a particular industry or industries, such as labor shortages or increased production costs and competitive conditions within an industry. Equity securities and equity related investments generally have greater market price volatility than fixed income securities.
| 17 |
| The Hartford Disciplined Equity Fund |
| Notes to Financial Statements – (continued) |
| October 31, 2014 |
| (000’s Omitted) |
Federal Income Taxes:
Federal Income Taxes – For federal income tax purposes, the Fund intends to continue to qualify as a Regulated Investment Company ("RIC") under Subchapter M of the Internal Revenue Code (“IRC”) by distributing substantially all of its taxable net investment income and net realized capital gains to its shareholders and otherwise complying with the requirements of the IRC. The Fund has distributed substantially all of its income and capital gains in prior years, if applicable, and intends to distribute substantially all of its income and capital gains during the calendar year ending December 31, 2014. Accordingly, no provision for federal income or excise taxes has been made in the accompanying financial statements. Distributions from short-term capital gains are treated as ordinary income distributions for federal income tax purposes.
Net Investment Income (Loss), Net Realized Gains (Losses) and Distributions – Net investment income (loss) and net realized gains (losses) may differ for financial statement and tax purposes primarily because of losses deferred due to wash sale adjustments, foreign currency gains and losses, adjustments related to Passive Foreign Investment Companies ("PFICs"), Real Estate Investment Trusts ("REITs"), RICs, certain derivatives and partnerships. The character of distributions made during the year from net investment income or net realized gains may differ from their ultimate characterization for federal income tax purposes. Also, due to the timing of dividend distributions, the fiscal year in which amounts are distributed may differ from the year that the income or realized gains (losses) were recorded by the Fund.
Distributions and Components of Distributable Earnings – The tax character of distributions paid by the Fund for the periods indicated is as follows (as adjusted for dividends payable, if applicable):
| For the Year Ended October 31, 2014 | For the Year Ended October 31, 2013 | |||||||
| Ordinary Income | $ | 340 | $ | 919 | ||||
As of October 31, 2014, the Fund’s components of distributable earnings (deficit) on a tax basis are as follows:
| Amount | ||||
| Undistributed Ordinary Income | $ | 91 | ||
| Undistributed Long-Term Capital Gain | 2,105 | |||
| Unrealized Appreciation* | 31,300 | |||
| Total Accumulated Earnings | $ | 33,496 | ||
| * | Differences between book-basis and tax-basis unrealized appreciation (depreciation) may be attributable to the losses deferred due to wash sale adjustments, foreign currency gains and losses, adjustments related to PFICs, REITs, RICs, certain derivatives and partnerships. |
Reclassification of Capital Accounts – The Fund may record reclassifications in its capital accounts. These reclassifications have no impact on the total net assets of the Fund. The reclassifications are a result of permanent differences between U.S. GAAP and tax accounting for such items as foreign currency, PFICs, expiration or utilization of capital loss carryforwards or net operating losses. Adjustments are made to reflect the impact these items have on current and future distributions to shareholders. Therefore, the source of the Fund’s distributions may be shown in the accompanying Statement of Changes in Net Assets as from undistributed net investment income, from accumulated net realized gains on investments or from capital depending on the type of book and tax differences that exist. For the year ended October 31, 2014, the Fund recorded reclassifications to increase (decrease) the accounts listed below:
| Amount | ||||
| Undistributed Net Investment Income (Loss) | $ | 3 | ||
| Accumulated Net Realized Gain (Loss) | (3 | ) | ||
Capital Loss Carryforward – On December 22, 2010, the Regulated Investment Company Modernization Act of 2010 (the “Act”) was enacted, which made changes to the capital loss carryforward rules. The changes are effective for taxable years beginning after the
| 18 |
| The Hartford Disciplined Equity Fund |
| Notes to Financial Statements – (continued) |
| October 31, 2014 |
| (000’s Omitted) |
date of enactment. Under the Act, funds are permitted to carry forward capital losses for an unlimited period. Additionally, capital loss carryforwards retain their character as either short-term or long-term capital losses rather than being considered all short-term as permitted under prior regulation.
The Fund had no capital loss carryforward for U.S. federal income tax purposes as of October 31, 2014.
During the year ended October 31, 2014, the Fund utilized $23,915 of prior year capital loss carryforwards.
Accounting for Uncertainty in Income Taxes – The Fund has adopted financial reporting rules that require the Fund to analyze all open tax years, as defined by the statute of limitations, for all major jurisdictions. Generally, tax authorities can examine all tax returns filed for the last three years. The Fund does not have an examination in progress.
The Fund has reviewed all open tax years and major jurisdictions and concluded that these financial reporting rules had no effect on the Fund’s financial position or results of operations. There is no tax liability resulting from unrecognized tax benefits relating to uncertain income tax positions taken or expected to be taken on the tax return for the fiscal year ended October 31, 2014. The Fund is also not aware of any tax positions for which it is reasonably possible that the total amounts of unrecognized tax benefits will significantly change in the next twelve months.
Expenses:
Investment Management Agreement – Hartford Funds Management Company, LLC ("HFMC") serves as the Fund’s investment manager pursuant to an Investment Management Agreement with the Company. HFMC is an indirect wholly owned subsidiary of The Hartford Financial Services Group, Inc. ("The Hartford"). The investment manager has overall investment supervisory responsibility for the Fund. In addition, the investment manager provides administrative personnel, services, equipment, facilities and office space for proper operation of the Fund. HFMC has contracted with Wellington Management Company, LLP ("Wellington Management") under a sub-advisory agreement for the provision of day-to-day investment management services to the Fund in accordance with the Fund’s investment objective and policies. The Fund pays a fee to the investment manager, a portion of which may be used to compensate Wellington Management.
The schedule below reflects the rates of compensation paid to the investment manager for investment management services rendered as of October 31, 2014; the rates are accrued daily and paid monthly:
| Average Daily Net Assets | Annual Fee |
| On first $500 million | 0.7500% |
| On next $500 million | 0.6750% |
| On next $4 billion | 0.6250% |
| On next $5 billion | 0.6225% |
| Over $10 billion | 0.6200% |
Accounting Services Agreement – Pursuant to the Fund Accounting Agreement between HFMC and the Company, on behalf of the Fund, HFMC provides accounting services to the Fund and receives monthly compensation based on the Fund’s average daily net assets at the rates set forth below. The Fund’s accounting services fees are accrued daily and paid monthly.
| Average Daily Net Assets | Annual Fee |
| On first $5 billion | 0.016% |
| On next $5 billion | 0.013% |
| Over $10 billion | 0.010% |
Operating Expenses – Allocable expenses incurred by the Company are allocated to each Fund and allocated to classes within the Fund in proportion to the average daily net assets of the Fund and each class, except where allocation of certain expenses is more
| 19 |
| The Hartford Disciplined Equity Fund |
| Notes to Financial Statements – (continued) |
| October 31, 2014 |
| (000’s Omitted) |
fairly made directly to the Fund or to specific classes within a Fund. As of October 31, 2014, HFMC contractually limited the total operating expenses of this Fund, exclusive of taxes, interest expense, brokerage commissions, acquired fund fees and expenses and extraordinary expenses, through February 28, 2015 as follows:
| Class A | Class B | Class C | Class R3 | Class R4 | Class R5 | Class Y |
| 1.35% | 2.10% | 2.10% | 1.50% | 1.20% | 0.90% | 0.85% |
Fees Paid Indirectly – The Fund has entered into agreements with State Street Global Markets, LLC and Russell Implementation Services, Inc. to partially recapture non-discounted trade commissions. Such rebates are used to pay a portion of the Fund's expenses. For the year ended October 31, 2014, this amount, if any, is included in the Statement of Operations.
The ratio of expenses to average net assets in the accompanying financial highlights excludes the reduction in expenses related to fees paid indirectly. The annualized expense ratio after waivers for the period listed below reflecting the reduction for fees paid indirectly is as follows:
| Year Ended October 31, 2014 | ||||
| Class A | 1.31% | |||
| Class B | 2.10 | |||
| Class C | 2.00 | |||
| Class R3 | 1.50 | |||
| Class R4 | 1.20 | |||
| Class R5 | 0.90 | |||
| Class Y | 0.85 | |||
Distribution and Service Plan for Class A, B, C, R3 and R4 Shares – Hartford Funds Distributors, LLC ("HFD"), an indirect wholly owned subsidiary of The Hartford, is the principal underwriter and distributor of the Fund. HFD is engaged in distribution activities, which include marketing and distribution of shares through broker/dealers, financing distribution costs and maintaining financial books and records. For the year ended October 31, 2014, HFD received front-end load sales charges of $214 and contingent deferred sales charges of $3 from the Fund.
The Fund has adopted a Distribution and Service Plan in accordance with Rule 12b-1 of the 1940 Act to compensate the distributor (HFD) for activities intended to result in the sale and distribution of Class A, B, C, R3 and R4 shares and for providing services for shareholders. The Rule 12b-1 plan applicable to Class A shares of the Fund provides for payment of a Rule 12b-1 fee of 0.25% of average daily net assets. Some or all of the fee may be used for shareholder servicing expenses with the remainder used for distribution expenses. Under the Class B Plan, the Fund pays the distributor 1.00% of the average daily net assets of Class B shares that are outstanding for 8 years or less, 0.25% of which is a fee for services provided to existing shareholders with the remainder used for distribution expenses. Some or the entire Rule 12b-1 fee for Class B shares may be remitted to broker/dealers for distribution and/or shareholder account services. After eight years, Class B shares convert to Class A shares. Upon conversion to Class A shares, the Class A plan described above will apply to those shares. Under the Class C Plan, the Fund pays the distributor 1.00% of the average daily net assets of Class C shares outstanding, 0.25% of which is intended as a fee for services provided to existing shareholders with the remainder used for distribution expenses. For Class C shares, some or the entire fee may be remitted to broker/dealers for distribution and/or shareholder account services. Class R3 shares have a distribution fee of 0.50% of average daily net assets and Class R4 shares have a distribution fee of 0.25% of average daily net assets. For Class R3 and R4 shares, some or the entire fee may be remitted to broker/dealers for distribution and/or shareholder account services. The Fund’s 12b-1 fees are accrued daily and paid monthly or at such other intervals as the Board of Directors may determine.
Other Related Party Transactions – Certain officers of the Fund are directors and/or officers of HFMC and/or The Hartford or its subsidiaries. For the year ended October 31, 2014, a portion of the Fund’s Chief Compliance Officer’s compensation was paid by all of the investment companies in the Hartford fund complex. The portion allocated to the Fund, as represented in other expenses on the Statement of Operations, rounds to zero. Hartford Administrative Services Company (“HASCO”), an indirect wholly-owned
| 20 |
| The Hartford Disciplined Equity Fund |
| Notes to Financial Statements – (continued) |
| October 31, 2014 |
| (000’s Omitted) |
subsidiary of The Hartford, provides transfer agent services to the Fund. HASCO has contractually agreed to reimburse any portion of the transfer agency fees over 0.30% of average daily net assets per fiscal year for each class. Any transfer agency fee reimbursement is determined before considering the contractual operating expense limitation. For providing such services, HASCO is compensated on a per account basis that varies by account type, except with respect to Class Y, for which it is compensated based on average daily net assets. The amount paid to HASCO and any related contractual reimbursement amounts, if applicable, can be found in the Statement of Operations. These fees are accrued daily and paid monthly.
Administrative services fees are paid to HASCO for third-party recordkeeping services that are payable as a percentage of net assets in the amount of up to 0.20%, 0.15% and 0.10% for Classes R3, R4 and R5 shares, respectively. The total administrative services fees are shown on the Statement of Operations. These fees are accrued daily and paid monthly.
Affiliate Holdings:
As of October 31, 2014, affiliates of The Hartford had ownership of shares in the Fund as follows:
| Percentage of Class | Percentage of Fund | |||||||
| Class R4 | 22 | % | — | %* | ||||
| Class R5 | 54 | — | * | |||||
| * | Percentage rounds to zero. |
Investment Transactions:
For the year ended October 31, 2014, the cost of purchases and proceeds from sales of investment securities (excluding short-term investments) were as follows:
| Excluding U.S. Government Obligations | U.S. Government Obligations | Total | ||||||||||
| Cost of Purchases | $ | 80,509 | $ | — | $ | 80,509 | ||||||
| Sales Proceeds | 81,040 | — | 81,040 | |||||||||
| 21 |
| The Hartford Disciplined Equity Fund |
| Notes to Financial Statements – (continued) |
| October 31, 2014 |
| (000’s Omitted) |
Capital Share Transactions:
The following information is for the year ended October 31, 2014, and the year ended October 31, 2013:
| For the Year Ended October 31, 2014 | For the Year Ended October 31, 2013 | |||||||||||||||||||||||||||||||
| Shares Sold | Shares
Issued for Reinvested Dividends | Shares Redeemed | Net
Increase (Decrease) of Shares | Shares Sold | Shares
Issued for Reinvested Dividends | Shares Redeemed | Net
Increase (Decrease) of Shares | |||||||||||||||||||||||||
| Class A | ||||||||||||||||||||||||||||||||
| Shares | 1,007 | 16 | (775 | ) | 248 | 723 | 56 | (1,017 | ) | (238 | ) | |||||||||||||||||||||
| Amount | $ | 20,659 | $ | 319 | $ | (15,794 | ) | $ | 5,184 | $ | 11,909 | $ | 840 | $ | (16,652 | ) | $ | (3,903 | ) | |||||||||||||
| Class B | ||||||||||||||||||||||||||||||||
| Shares | 8 | — | (56 | ) | (48 | ) | 17 | — | (79 | ) | (62 | ) | ||||||||||||||||||||
| Amount | $ | 141 | $ | — | $ | (1,065 | ) | $ | (924 | ) | $ | 255 | $ | 4 | $ | (1,211 | ) | $ | (952 | ) | ||||||||||||
| Class C | ||||||||||||||||||||||||||||||||
| Shares | 210 | — | (117 | ) | 93 | 139 | 2 | (142 | ) | (1 | ) | |||||||||||||||||||||
| Amount | $ | 4,009 | $ | — | $ | (2,232 | ) | $ | 1,777 | $ | 2,130 | $ | 36 | $ | (2,151 | ) | $ | 15 | ||||||||||||||
| Class R3 | ||||||||||||||||||||||||||||||||
| Shares | 18 | — | (14 | ) | 4 | 3 | — | — | 3 | |||||||||||||||||||||||
| Amount | $ | 386 | $ | — | $ | (292 | ) | $ | 94 | $ | 56 | $ | 2 | $ | (5 | ) | $ | 53 | ||||||||||||||
| Class R4 | ||||||||||||||||||||||||||||||||
| Shares | 29 | — | (54 | ) | (25 | ) | 77 | — | (24 | ) | 53 | |||||||||||||||||||||
| Amount | $ | 609 | $ | — | $ | (1,031 | ) | $ | (422 | ) | $ | 1,271 | $ | 2 | $ | (421 | ) | $ | 852 | |||||||||||||
| Class R5 | ||||||||||||||||||||||||||||||||
| Shares | 5 | — | — | 5 | 1 | — | — | 1 | ||||||||||||||||||||||||
| Amount | $ | 125 | $ | — | $ | (1 | ) | $ | 124 | $ | 13 | $ | 2 | $ | — | $ | 15 | |||||||||||||||
| Class Y | ||||||||||||||||||||||||||||||||
| Shares | 23 | 1 | (16 | ) | 8 | 21 | 1 | (27 | ) | (5 | ) | |||||||||||||||||||||
| Amount | $ | 480 | $ | 15 | $ | (312 | ) | $ | 183 | $ | 329 | $ | 20 | $ | (437 | ) | $ | (88 | ) | |||||||||||||
| Total | ||||||||||||||||||||||||||||||||
| Shares | 1,300 | 17 | (1,032 | ) | 285 | 981 | 59 | (1,289 | ) | (249 | ) | |||||||||||||||||||||
| Amount | $ | 26,409 | $ | 334 | $ | (20,727 | ) | $ | 6,016 | $ | 15,963 | $ | 906 | $ | (20,877 | ) | $ | (4,008 | ) | |||||||||||||
The following reflects the conversion of Class B shares into Class A shares (reflected as Class A shares sold) for the year ended October 31, 2014, and the year ended October 31, 2013:
| Shares | Dollars | |||||||
| For the Year Ended October 31, 2014 | 24 | $ | 498 | |||||
| For the Year Ended October 31, 2013 | 35 | $ | 564 | |||||
Line of Credit:
The Fund is one of several Hartford Funds that participate in a $500 million committed revolving line of credit facility. The facility is to be used for temporary or emergency purposes. Under the arrangement, the funds are required to own securities having a market value in excess of 300% of the total bank borrowings. The interest rate on borrowings varies depending on the nature of the loan. The facility also requires a fee to be paid based on the amount of the commitment. This commitment fee is allocated to all the funds participating in the line of credit based on the average net assets of the funds. During the year ended October 31, 2014, the Fund did not have any borrowings under this facility.
| 22 |
| The Hartford Disciplined Equity Fund |
| Notes to Financial Statements – (continued) |
| October 31, 2014 |
| (000’s Omitted) |
Pending Legal Proceedings:
On February 25, 2011, Jennifer L. Kasilag, Louis Mellinger, Judith M. Menendez, Jacqueline M. Robinson, and Linda A. Russell filed a derivative lawsuit against Hartford Investment Financial Services, LLC (“HIFSCO”) (now known as HFD) on behalf of six Hartford retail mutual funds in the United States District Court for the District of New Jersey, alleging that HIFSCO received excessive advisory and distribution fees in violation of its statutory fiduciary duty under Section 36(b) of the 1940 Act when serving as investment manager and principal underwriter, respectively, to the Hartford retail mutual funds. Although this action was purportedly filed on behalf of certain of the Hartford Funds, none of the Hartford Funds is itself a defendant to the suit. HIFSCO moved to dismiss and, in September 2011, the motion was granted in part and denied in part, with leave to amend the complaint. In November 2011, plaintiffs filed an amended complaint on behalf of certain Hartford retail mutual funds, The Hartford Global Health Fund (now known as The Hartford Healthcare Fund), The Hartford Conservative Allocation Fund, The Hartford Growth Opportunities Fund, The Hartford Inflation Plus Fund, The Hartford Advisers Fund (now known as The Hartford Balanced Fund), and The Hartford Capital Appreciation Fund. Plaintiffs seek to rescind the investment management agreements and distribution plans between HIFSCO and these funds and to recover the total fees charged thereunder or, in the alternative, to recover any improper compensation HIFSCO received, in addition to lost earnings. HIFSCO filed a partial motion to dismiss the amended complaint and, in December 2012, the court dismissed without prejudice the claims regarding distribution fees and denied the motion with respect to the advisory fees claims. HIFSCO disputes the allegations and intends to defend vigorously.
In March 2014, the plaintiffs filed a new complaint that added as new plaintiffs The Hartford Floating Rate Fund and The Hartford Small Company Fund and named as a defendant HFMC, which assumed the role as investment manager to the funds as of January 2013. HFMC and HIFSCO dispute the allegations and intend to defend vigorously.
No accrual for litigation relating to this matter has been recorded in the financial statements of the Fund because the Fund is not party to the suit.
Indemnifications:
Under the Company's organizational documents, the Company shall indemnify its officers and directors to the full extent required or permitted under Maryland General Corporation Law and the federal securities laws. In addition, the Company, on behalf of the Fund, may enter into contracts that contain a variety of indemnifications. The Company's maximum exposure under these arrangements is unknown. However, as of the date of these financial statements, the Company has not had prior claims or losses pursuant to these contracts and expects the risk of loss to be remote.
Subsequent Event:
Effective December 1, 2014, pursuant to a sub-transfer agency agreement between HASCO and Boston Financial Data Services, Inc. (“BFDS”), HASCO has delegated certain transfer agent, dividend disbursing agent and shareholder servicing agent functions to BFDS. The costs and expenses of such delegation are borne by HASCO, not by the Fund.
| 23 |
| The Hartford Disciplined Equity Fund |
| Financial Highlights |
| - Selected Per-Share Data - (A) | - Ratios and Supplemental Data - | |||||||||||||||||||||||||||||||||||||||||||||||||||
| Class | Net
Asset Value at Beginning of Period | Net Investment Income (Loss) | Net Realized and Unrealized Gain (Loss) on Invest- ments | Total
from Investment Operations | Dividends from Net Investment Income | Distribu- tions from Realized Capital Gains | Total Dividends and Distributions | Net
Asset Value at End of Period | Total Return(B) | Net
Assets at End of Period (000's) | Ratio
of Expenses to Average Net Assets Before Adjust- ments(C) | Ratio
of Expenses to Average Net Assets After Adjust- ments(C) | Ratio
of Net Investment Income (Loss) to Average Net Assets | |||||||||||||||||||||||||||||||||||||||
| For the Year Ended October 31, 2014 | ||||||||||||||||||||||||||||||||||||||||||||||||||||
| A | $ | 18.77 | $ | 0.03 | $ | 3.26 | $ | 3.29 | $ | (0.06 | ) | $ | – | $ | (0.06 | ) | $ | 22.00 | 17.56 | % | $ | 126,308 | 1.37 | % | 1.31 | % | 0.16 | % | ||||||||||||||||||||||||
| B | 17.66 | (0.12 | ) | 3.06 | 2.94 | – | – | – | 20.60 | 16.65 | 1,898 | 2.49 | 2.10 | (0.62 | ) | |||||||||||||||||||||||||||||||||||||
| C | 17.59 | (0.10 | ) | 3.05 | 2.95 | – | – | – | 20.54 | 16.77 | 19,798 | 2.06 | 2.00 | (0.53 | ) | |||||||||||||||||||||||||||||||||||||
| R3 | 19.14 | (0.01 | ) | 3.32 | 3.31 | (0.04 | ) | – | (0.04 | ) | 22.41 | 17.30 | 481 | 1.70 | 1.50 | (0.05 | ) | |||||||||||||||||||||||||||||||||||
| R4 | 19.20 | 0.05 | 3.35 | 3.40 | – | – | – | 22.60 | 17.71 | 889 | 1.34 | 1.20 | 0.21 | |||||||||||||||||||||||||||||||||||||||
| R5 | 19.38 | 0.12 | 3.36 | 3.48 | (0.14 | ) | – | (0.14 | ) | 22.72 | 18.03 | 374 | 1.04 | 0.90 | 0.56 | |||||||||||||||||||||||||||||||||||||
| Y | 19.44 | 0.13 | 3.37 | 3.50 | (0.15 | ) | – | (0.15 | ) | 22.79 | 18.07 | 2,486 | 0.91 | 0.85 | 0.62 | |||||||||||||||||||||||||||||||||||||
| For the Year Ended October 31, 2013 | ||||||||||||||||||||||||||||||||||||||||||||||||||||
| A | $ | 14.57 | $ | 0.11 | $ | 4.24 | $ | 4.35 | $ | (0.15 | ) | $ | – | $ | (0.15 | ) | $ | 18.77 | 30.12 | % | $ | 103,104 | 1.40 | % | 1.35 | % | 0.68 | % | ||||||||||||||||||||||||
| B | 13.70 | (0.01 | ) | 3.99 | 3.98 | (0.02 | ) | – | (0.02 | ) | 17.66 | 29.10 | 2,480 | 2.50 | 2.10 | (0.04 | ) | |||||||||||||||||||||||||||||||||||
| C | 13.66 | – | 3.98 | 3.98 | (0.05 | ) | – | (0.05 | ) | 17.59 | 29.19 | 15,324 | 2.07 | 2.04 | (0.01 | ) | ||||||||||||||||||||||||||||||||||||
| R3 | 14.86 | 0.09 | 4.32 | 4.41 | (0.13 | ) | – | (0.13 | ) | 19.14 | 29.88 | 330 | 1.69 | 1.50 | 0.51 | |||||||||||||||||||||||||||||||||||||
| R4 | 14.91 | 0.12 | 4.34 | 4.46 | (0.17 | ) | – | (0.17 | ) | 19.20 | 30.24 | 1,227 | 1.29 | 1.20 | 0.69 | |||||||||||||||||||||||||||||||||||||
| R5 | 15.04 | 0.19 | 4.37 | 4.56 | (0.22 | ) | – | (0.22 | ) | 19.38 | 30.68 | 204 | 1.00 | 0.90 | 1.12 | |||||||||||||||||||||||||||||||||||||
| Y | 15.05 | 0.20 | 4.38 | 4.58 | (0.19 | ) | – | (0.19 | ) | 19.44 | 30.73 | 1,963 | 0.88 | 0.85 | 1.19 | |||||||||||||||||||||||||||||||||||||
| For the Year Ended October 31, 2012 | ||||||||||||||||||||||||||||||||||||||||||||||||||||
| A | $ | 12.77 | $ | 0.09 | $ | 1.74 | $ | 1.83 | $ | (0.03 | ) | $ | – | $ | (0.03 | ) | $ | 14.57 | 14.39 | % | $ | 83,534 | 1.44 | % | 1.35 | % | 0.69 | % | ||||||||||||||||||||||||
| B | 12.07 | (0.01 | ) | 1.64 | 1.63 | – | – | – | 13.70 | 13.50 | 2,761 | 2.50 | 2.10 | (0.08 | ) | |||||||||||||||||||||||||||||||||||||
| C | 12.03 | (0.01 | ) | 1.64 | 1.63 | – | – | – | 13.66 | 13.55 | 11,913 | 2.09 | 2.09 | (0.06 | ) | |||||||||||||||||||||||||||||||||||||
| R3 | 13.05 | 0.08 | 1.77 | 1.85 | (0.04 | ) | – | (0.04 | ) | 14.86 | 14.22 | 209 | 1.70 | 1.50 | 0.53 | |||||||||||||||||||||||||||||||||||||
| R4 | 13.07 | 0.12 | 1.78 | 1.90 | (0.06 | ) | – | (0.06 | ) | 14.91 | 14.57 | 167 | 1.31 | 1.20 | 0.85 | |||||||||||||||||||||||||||||||||||||
| R5 | 13.18 | 0.16 | 1.79 | 1.95 | (0.09 | ) | – | (0.09 | ) | 15.04 | 14.93 | 144 | 1.01 | 0.90 | 1.14 | |||||||||||||||||||||||||||||||||||||
| Y | 13.20 | 0.15 | 1.80 | 1.95 | (0.10 | ) | – | (0.10 | ) | 15.05 | 14.90 | 1,594 | 0.85 | 0.85 | 1.04 | |||||||||||||||||||||||||||||||||||||
| For the Year Ended October 31, 2011 | ||||||||||||||||||||||||||||||||||||||||||||||||||||
| A | $ | 11.90 | $ | 0.07 | $ | 0.82 | $ | 0.89 | $ | (0.02 | ) | $ | – | $ | (0.02 | ) | $ | 12.77 | 7.50 | % | $ | 80,470 | 1.44 | % | 1.35 | % | 0.51 | % | ||||||||||||||||||||||||
| B | 11.32 | (0.03 | ) | 0.79 | 0.76 | (0.01 | ) | – | (0.01 | ) | 12.07 | 6.69 | 4,020 | 2.42 | 2.10 | (0.21 | ) | |||||||||||||||||||||||||||||||||||
| C | 11.28 | (0.03 | ) | 0.79 | 0.76 | (0.01 | ) | – | (0.01 | ) | 12.03 | 6.72 | 11,221 | 2.10 | 2.09 | (0.23 | ) | |||||||||||||||||||||||||||||||||||
| R3 | 12.18 | 0.04 | 0.85 | 0.89 | (0.02 | ) | – | (0.02 | ) | 13.05 | 7.30 | 165 | 1.65 | 1.50 | 0.34 | |||||||||||||||||||||||||||||||||||||
| R4 | 12.16 | 0.08 | 0.86 | 0.94 | (0.03 | ) | – | (0.03 | ) | 13.07 | 7.70 | 134 | 1.28 | 1.20 | 0.64 | |||||||||||||||||||||||||||||||||||||
| R5 | 12.24 | 0.13 | 0.84 | 0.97 | (0.03 | ) | – | (0.03 | ) | 13.18 | 7.94 | 117 | 0.96 | 0.90 | 0.96 | |||||||||||||||||||||||||||||||||||||
| Y | 12.25 | 0.13 | 0.85 | 0.98 | (0.03 | ) | – | (0.03 | ) | 13.20 | 8.03 | 72,307 | 0.86 | 0.85 | 0.98 | |||||||||||||||||||||||||||||||||||||
See Portfolio Turnover information on the next page.
| 24 |
| The Hartford Disciplined Equity Fund |
| Financial Highlights – (continued) |
| - Selected Per-Share Data - (A) | - Ratios and Supplemental Data - | |||||||||||||||||||||||||||||||||||||||||||||||||||
| Class | Net
Asset Value at Beginning of Period | Net Investment Income (Loss) | Net Realized and Unrealized Gain (Loss) on Invest- ments | Total
from Investment Operations | Dividends from Net Investment Income | Distribu- tions from Realized Capital Gains | Total Dividends and Distributions | Net
Asset Value at End of Period | Total Return(B) | Net
Assets at End of Period (000's) | Ratio
of Expenses to Average Net Assets Before Adjust- ments(C) | Ratio
of Expenses to Average Net Assets After Adjust- ments(C) | Ratio
of Net Investment Income (Loss) to Average Net Assets | |||||||||||||||||||||||||||||||||||||||
| For the Year Ended October 31, 2010 | ||||||||||||||||||||||||||||||||||||||||||||||||||||
| A | $ | 10.44 | $ | 0.08 | $ | 1.58 | $ | 1.66 | $ | (0.20 | ) | $ | – | $ | (0.20 | ) | $ | 11.90 | 16.00 | % | $ | 81,949 | 1.47 | % | 1.35 | % | 0.71 | % | ||||||||||||||||||||||||
| B | 9.89 | – | 1.50 | 1.50 | (0.07 | ) | – | (0.07 | ) | 11.32 | 15.18 | 5,770 | 2.46 | 2.10 | (0.04 | ) | ||||||||||||||||||||||||||||||||||||
| C | 9.84 | – | 1.49 | 1.49 | (0.05 | ) | – | (0.05 | ) | 11.28 | 15.18 | 11,519 | 2.12 | 2.10 | (0.04 | ) | ||||||||||||||||||||||||||||||||||||
| R3 | 10.71 | 0.05 | 1.63 | 1.68 | (0.21 | ) | – | (0.21 | ) | 12.18 | 15.77 | 113 | 1.66 | 1.55 | 0.47 | |||||||||||||||||||||||||||||||||||||
| R4 | 10.68 | 0.09 | 1.61 | 1.70 | (0.22 | ) | – | (0.22 | ) | 12.16 | 16.01 | 105 | 1.25 | 1.23 | 0.82 | |||||||||||||||||||||||||||||||||||||
| R5 | 10.75 | 0.12 | 1.65 | 1.77 | (0.28 | ) | – | (0.28 | ) | 12.24 | 16.55 | 105 | 0.95 | 0.92 | 1.09 | |||||||||||||||||||||||||||||||||||||
| Y | 10.76 | 0.14 | 1.64 | 1.78 | (0.29 | ) | – | (0.29 | ) | 12.25 | 16.63 | 45,376 | 0.85 | 0.85 | 1.21 | |||||||||||||||||||||||||||||||||||||
| (A) | Information presented relates to a share outstanding throughout the indicated period. Net investment income (loss) per share amounts are calculated based on average shares outstanding unless otherwise noted. |
| (B) | Assumes initial investment at net asset value at the beginning of each period, reinvestment of all distributions, the complete redemption of the investment at net asset value at the end of each period and no sales charge. Total return would be reduced if sales charges were taken into account. |
| (C) | Adjustments include waivers and reimbursements, if applicable. Ratios do not include fees paid indirectly (see Expenses in the accompanying Notes to Financial Statements). |
| Portfolio Turnover Rate for All Share Classes | ||||
| For the Year Ended October 31, 2014 | 60 | % | ||
| For the Year Ended October 31, 2013 | 28 | |||
| For the Year Ended October 31, 2012 | 46 | |||
| For the Year Ended October 31, 2011 | 56 | |||
| For the Year Ended October 31, 2010 | 41 | |||
| 25 |
| Report of Independent Registered Public Accounting Firm |
The Board of Directors and Shareholders of The Hartford Mutual Funds, Inc. |
We have audited the accompanying statement of assets and liabilities, including the schedule of investments, of The Hartford Disciplined Equity Fund (one of the portfolios constituting The Hartford Mutual Funds, Inc. (the Funds)) as of October 31, 2014, and the related statement of operations for the year then ended, the statements of changes in net assets for each of the two years in the period then ended, and the financial highlights for each of the five years in the period then ended. These financial statements and financial highlights are the responsibility of the Funds’ management. Our responsibility is to express an opinion on these financial statements and financial highlights based on our audits.
We conducted our audits in accordance with the standards of the Public Company Accounting Oversight Board (United States). Those standards require that we plan and perform the audit to obtain reasonable assurance about whether the financial statements and financial highlights are free of material misstatement. We were not engaged to perform an audit of the Funds’ internal control over financial reporting. Our audits included consideration of internal control over financial reporting as a basis for designing audit procedures that are appropriate in the circumstances, but not for the purpose of expressing an opinion on the effectiveness of the Funds’ internal control over financial reporting. Accordingly, we express no such opinion. An audit also includes examining, on a test basis, evidence supporting the amounts and disclosures in the financial statements and financial highlights, assessing the accounting principles used and significant estimates made by management, and evaluating the overall financial statement presentation. Our procedures included confirmation of securities owned as of October 31, 2014, by correspondence with the custodian and brokers or by other appropriate auditing procedures where replies from brokers were not received. We believe that our audits provide a reasonable basis for our opinion.
In our opinion, the financial statements and financial highlights referred to above present fairly, in all material respects, the financial position of The Hartford Disciplined Equity Fund of The Hartford Mutual Funds, Inc. at October 31, 2014, the results of its operations for the year then ended, the changes in its net assets for each of the two years in the period then ended, and the financial highlights for each of the five years in the period then ended, in conformity with U.S. generally accepted accounting principles.
|
Minneapolis, Minnesota
December 18, 2014
| 26 |
| The Hartford Disciplined Equity Fund |
| Directors and Officers (Unaudited) |
The Board of Directors of the Company (the "Directors") appoints officers who are responsible for the day-to-day operations of the Fund and who execute policies formulated by the Directors. Each Director serves until his or her death, resignation, or retirement or until the next annual meeting of shareholders is held or until his or her successor is elected and qualifies.
Directors and officers who are employed by or who have a financial interest in The Hartford Financial Services Group, Inc. ("The Hartford") are considered “interested” persons of the Fund pursuant to the 1940 Act. Each officer and two of the Company's Directors, as noted in the chart below, are “interested” persons of the Fund. Each Director serves as a director for The Hartford Mutual Funds, Inc., The Hartford Mutual Funds II, Inc., Hartford Series Fund, Inc., and Hartford HLS Series Fund II, Inc., and as a trustee for The Hartford Alternative Strategies Fund, which, as of October 31, 2014, collectively consist of 66 funds. Correspondence may be sent to Directors and officers c/o Hartford Funds, 5 Radnor Corporate Center, Suite 300, 100 Matsonford Road, Radnor, Pennsylvania 19087, except that correspondence to Mr. Annoni, Mr. Dressen and Ms. Quade may be sent to 500 Bielenberg Drive, Suite 500, Woodbury, Minnesota 55125.
The table below sets forth, for each Director and officer, his or her name, year of birth, current position with the Company and date first elected or appointed to The Hartford Mutual Funds, Inc. ("MF") and The Hartford Mutual Funds II, Inc. ("MF2"), principal occupation, and, for Directors, other directorships held. The Fund’s Statement of Additional Information contains further information on the Directors and is available free of charge by calling 1-888-843-7824 or writing to: Hartford Funds, P.O. Box 55022, Boston, MA 02205-5022.
Information on the aggregate remuneration paid to the directors of the Company can be found in the Statement of Operations herein. The Fund pays to The Hartford a portion of the Chief Compliance Officer’s compensation, but does not pay salaries or compensation to any of its other officers or Directors who are employed by The Hartford.
Non-Interested Directors
Hilary E. Ackermann (1956) Director since September 23, 2014
Ms. Ackermann served as Chief Risk Officer at Goldman Sachs Bank USA from October 2008 to November 2011 and serves as a Director of Dynegy, Inc., an independent power company, from October 2012 to present.
Lynn S. Birdsong (1946) Director since 2003, Chairman of the Investment Committee since 2014
Mr. Birdsong is a private investor. Mr. Birdsong currently serves as a Director of the Sovereign High Yield Investment Company (April 2010 to current). Mr. Birdsong currently serves as an Independent Director of Nomura Partners Funds, Inc. (formerly, The Japan Fund) (April 2003 to current). From 2003 to March 2005, Mr. Birdsong was an Independent Director of the Atlantic Whitehall Funds. From 1979 to 2002, Mr. Birdsong was a Managing Director of Zurich Scudder Investments, an investment management firm. During his employment with Scudder, Mr. Birdsong was an Interested Director of The Japan Fund. From January 1981 through December 2013, Mr. Birdsong was a partner in Birdsong Company, an advertising specialty firm.
Robert M. Gavin, Jr. (1940) Director since 2002 (MF) and 1986 (MF2), Chairman of the Board for each since 2004
Dr. Gavin is an educational consultant. Prior to September 1, 2001, he was President of Cranbrook Education Community and prior to July 1996, he was President of Macalester College, St. Paul, Minnesota.
Duane E. Hill (1945) Director since 2001 (MF) and 2002 (MF2), Chairman of the Nominating Committee since 2003
Mr. Hill is a Partner of TSG Ventures L.P., a private equity investment company. Mr. Hill is a former partner of TSG Capital Group, a private equity investment firm that served as sponsor and lead investor in leveraged buyouts of middle market companies.
Sandra S. Jaffee (1941) Director since 2005
Ms. Jaffee is the founder and Chief Executive Officer of a private company, Homeworks Concierge, LLC, which provides residential property management services in Westchester County, New York (January 2012 to present). Ms. Jaffee served as Chairman (2008 to 2009) and Chief Executive Officer of Fortent (formerly Searchspace Group), a leading provider of compliance/regulatory technology to financial institutions from August 2005 to August 2009. From August 2004 to August 2005, Ms. Jaffee served as an Entrepreneur in Residence with Warburg Pincus, a private equity firm. Prior to joining Warburg Pincus, Ms. Jaffee served as Executive Vice President at Citigroup, from September 1995 to July 2004, where she was President and Chief Executive Officer of Citibank’s Global Securities Services (1995 to 2003). Ms. Jaffee currently serves as a member of the Board of Directors of Broadridge Financial Solutions as well as a Trustee of Muhlenberg College.
| 27 |
| The Hartford Disciplined Equity Fund |
| Directors and Officers (Unaudited) – (continued) |
William P. Johnston (1944) Director since 2005, Chairman of the Compliance Committee since 2005
In June 2006, Mr. Johnston was appointed as Senior Advisor to The Carlyle Group, a global private equity and other alternative asset investment firm and currently serves as an Operating Executive. In July 2006, Mr. Johnston was elected to the Board of Directors of MultiPlan, Inc. and served as a Director (July 2006 to August 2010). In August 2007, Mr. Johnston was elected to the Board of Directors of LifeCare Holdings, Inc. and served as a Director (August 2007 to June 2013). In February 2008, Mr. Johnston was elected to the Board of Directors of HCR-ManorCare, Inc. In May 2006, Mr. Johnston was elected to the Supervisory Board of Fresenius Medical Care AG & Co. KGaA, after its acquisition of Renal Care Group, Inc. in March 2006. Mr. Johnston joined Renal Care Group in November 2002 as a member of the Board of Directors and served as Chairman of the Board from March 2003 through March 2006. From 2002 through 2013, Mr. Johnston served as a Board member of the Georgia O’Keefe Museum. From September 1987 to December 2002, Mr. Johnston was with Equitable Securities Corporation (and its successors, SunTrust Equitable Securities and SunTrust Robinson Humphrey) serving in various investment banking and managerial positions, including Managing Director and Head of Investment Banking, Chief Executive Officer and Vice Chairman.
Phillip O. Peterson (1944) Director since 2002 (MF) and 2000 (MF2), Chairman of the Audit Committee since 2002
Mr. Peterson is a mutual fund industry consultant. He was a partner of KPMG LLP (an accounting firm) until July 1999. Mr. Peterson joined William Blair Funds in February 2007 as a member of the Board of Trustees. From February 2012 to February 2014, Mr. Peterson served as a Trustee of Symetra Variable Mutual Funds. From January 2004 to April 2005, Mr. Peterson served as Independent President of the Strong Mutual Funds.
Lemma W. Senbet (1946) Director since 2005
Dr. Senbet is the William E. Mayer Chair Professor of Finance and Founding Director, Center for Financial Policy, at the University of Maryland, Robert H. Smith School of Business. He was chair of the Finance Department of the University of Maryland, Robert H. Smith School of Business from 1998 to 2006. Since June 2013, he has been on leave from the University to serve as Executive Director of African Economic Research Consortium which focuses on economic policy research and training. Previously, he was a chaired professor of finance at the University of Wisconsin-Madison. Also, he was a Director of the Fortis Funds from March 2000 to July 2002. Dr. Senbet served as Director of the American Finance Association and President of the Western Finance Association. In 2006, Dr. Senbet was inducted Fellow of Financial Management Association International for his career-long distinguished scholarship and professional service.
Interested Directors and Officers
James E. Davey (1964) Director since 2012, President and Chief Executive Officer since 2010
Mr. Davey serves as Executive Vice President of Hartford Life Insurance Company (“HLIC”) and The Hartford. Additionally, Mr. Davey serves as Chairman of the Board, Manager and Senior Managing Director of Hartford Funds Distributors, LLC (“HFD”). He also currently serves as Director, Chairman of the Board, President and Senior Managing Director of Hartford Administrative Services Company (“HASCO”). Mr. Davey also serves as Manager, Chairman of the Board and Senior Managing Director for Hartford Funds Management Company, LLC (“HFMC”) and Director, Chairman of the Board and Senior Managing Director for Hartford Funds Management Group, Inc. ("HFMG"). Mr. Davey has served in various positions within The Hartford and its subsidiaries in connection with the operation of the Hartford Funds. Mr. Davey joined The Hartford in 2002.
Lowndes A. Smith* (1939) Director since 1996 (MF) and 2002 (MF2)
Mr. Smith served as Vice Chairman of The Hartford from February 1997 to January 2002, as President and Chief Executive Officer of Hartford Life, Inc. from February 1997 to January 2002, and as President and Chief Operating Officer of The Hartford Life Insurance Companies from January 1989 to January 2002. Mr. Smith serves as a Director of White Mountains Insurance Group Ltd. (October 2003 to current); One Beacon Insurance (October 2006 to current); Symetra Financial (August 2007 to current) and is a Managing Director of Whittington Gray Associates (January 2007 to current).
* Mr. Smith resigned as a Director of MF, MF2, Hartford Series Fund, Inc. and Hartford HLS Series Fund II, Inc. and as a Trustee of The Hartford Alternative Strategies Fund effective September 17, 2014.
Other Officers
Mark A. Annoni (1964) Vice President, Controller and Treasurer since 2012
Mr. Annoni currently serves as the Assistant Vice President of HLIC (February 2004 to present) and Senior Vice President of HFMG (December 2013 to present). Mr. Annoni has served in various positions within The Hartford and its subsidiaries in connection with the operation of the Hartford Funds. Mr. Annoni joined The Hartford in 2001.
| 28 |
| The Hartford Disciplined Equity Fund |
| Directors and Officers (Unaudited) – (continued) |
Michael R. Dressen (1963) AML Compliance Officer since 2011
Mr. Dressen currently serves as Assistant Vice President of HLIC. He also serves as Chief Compliance Officer and AML Compliance Officer of HASCO and as AML Officer of HFD. Mr. Dressen has served in various positions within The Hartford and its subsidiaries in connection with the operation of the Hartford Funds.
Edward P. Macdonald (1967) Vice President, Secretary and Chief Legal Officer since 2005
Mr. Macdonald currently serves as Assistant Secretary, Executive Vice President and Deputy General Counsel of HFD, HASCO, HFMC and HFMG. He also serves as Vice President of HLIC. Mr. Macdonald has served in various positions within The Hartford and its subsidiaries in connection with the operation of the Hartford Funds. Mr. Macdonald joined The Hartford in 2005.
Joseph G. Melcher (1973) Vice President and Chief Compliance Officer since 2013
Mr. Melcher currently serves as Executive Vice President of HFD, HFMG and HASCO. Mr. Melcher also currently serves as Executive Vice President and Chief Compliance Officer of HFMC. Mr. Melcher has served in various positions within The Hartford and its subsidiaries in connection with the operation of the Hartford Funds since joining The Hartford in 2012. Prior to joining The Hartford, Mr. Melcher worked at Touchstone Investments, a member of the Western & Southern Financial Group, where he held the position of Vice President and Chief Compliance Officer from 2010 through 2012 and Assistant Vice President, Compliance from 2005 to 2010.
Vernon J. Meyer (1964) Vice President since 2006
Mr. Meyer currently serves as Senior Vice President of HLIC. He also currently serves as Managing Director and Chief Investment Officer of HFMC and Managing Director of HFMG. Mr. Meyer has served in various positions within The Hartford and its subsidiaries in connection with the operation of the Hartford Funds. Mr. Meyer joined The Hartford in 2004.
Laura S. Quade (1969) Vice President since 2012
Ms. Quade currently serves as Vice President of HASCO, HFD and HFMG. She is the Head of Operations of HASCO and formerly served as Director, Enterprise Operations of HLIC. Ms. Quade has served in various positions within The Hartford and its subsidiaries in connection with the operation of the Hartford Funds. Ms. Quade joined The Hartford in 2001.
Martin A. Swanson** (1962) Vice President since 2010
Mr. Swanson currently serves as Vice President of HLIC. Mr. Swanson also serves as Managing Director, Chief Marketing Officer and Principal of HFD and Managing Director of HFMG. Mr. Swanson has served in various positions within The Hartford and its subsidiaries in connection with the operation of the Hartford Funds.
** Mr. Swanson resigned as an officer effective November 6, 2014.
HOW TO OBTAIN A COPY OF THE FUND’S PROXY VOTING POLICIES AND VOTING RECORDS (UNAUDITED)
A description of the policies and procedures that the Fund uses to determine how to vote proxies relating to portfolio securities and information about how the Fund voted proxies relating to portfolio securities during the most recent twelve-month period ended June 30 are available (1) without charge, upon request, by calling 888-843-7824 and (2) on the SEC’s website at http://www.sec.gov.
QUARTERLY PORTFOLIO HOLDINGS INFORMATION (UNAUDITED)
The Fund files a complete schedule of portfolio holdings with the SEC for the first and third quarters of each fiscal year on Form N-Q. The Fund’s Forms N-Q are available (1) without charge, upon request, by calling 888-843-7824 and (2) on the SEC’s website at http://www.sec.gov. The Form N-Q may be reviewed and copied at the SEC’s Public Reference Room in Washington, DC. Information on the operation of the Public Reference Room may be obtained by calling 1-800-SEC-0330.
| 29 |
| The Hartford Disciplined Equity Fund |
| Federal Tax Information (Unaudited) |
For the fiscal year ended October 31, 2014, there is no further federal tax information required for this Fund.
| 30 |
| The Hartford Disciplined Equity Fund |
| Expense Example (Unaudited) |
Your Fund's Expenses
As a shareholder of the Fund, you incur two types of costs: (1) transaction costs, including sales charges (loads) on purchase payments, if any, and contingent deferred sales charges (CDSC), if any, and (2) ongoing costs, including investment management fees, distribution and/or service (12b-1) fees, if any, and other fund expenses. This example is intended to help you understand your ongoing costs (in dollars) of investing in the Fund and to compare these costs with the ongoing costs of investing in other mutual funds. The example is based on an investment of $1,000 invested at the beginning of the period and held for the entire period of April 30, 2014 through October 31, 2014.
Actual Expenses
The first set of columns of the table below provides information about actual account values and actual expenses. You may use the information in this column, together with the amount you invested, to estimate the expenses that you paid over the period. Simply divide your account value by $1,000 (for example, an $8,600 account value divided by $1,000 = 8.6), then multiply the result by the number in the line under the heading entitled “Expenses Paid During Period” to estimate the expenses you paid on your account during this period.
Hypothetical Example for Comparison Purposes
The second set of columns of the table below provides information about hypothetical account values and hypothetical expenses based on the Fund's actual expense ratio and an assumed rate of return of 5% per year before expenses, which is not the Fund's actual return. The hypothetical account values and expenses may not be used to estimate the actual ending account balance or expenses you paid for the period. You may use this information to compare the ongoing costs of investing in the Fund and other funds. To do so, compare this 5% hypothetical example with the 5% hypothetical examples that appear in the shareholder reports of the other funds.
Please note that the expenses shown in the table are meant to highlight your ongoing costs only and do not reflect any transactional costs, such as sales charges (loads) and CDSC. Therefore, the second set of columns of the table is useful in comparing ongoing costs only, and will not help you determine the relative total costs of owning different funds. In addition, if these transactional costs were included, your costs would be higher. Expenses are equal to the Fund's annualized expense ratios multiplied by average account value over the period, multiplied by 184/365 (to reflect the one-half year period).
| Actual return | Hypothetical (5% return before expenses) | |||||||||||||||||||||||||||||||
| Beginning Account Value April 30, 2014 | Ending
Account Value October 31, 2014 | Expenses
paid during the period April 30, 2014 through October 31, 2014 | Beginning Account Value April 30, 2014 | Ending
Account Value October 31, 2014 | Expenses
paid during the period April 30, 2014 through October 31, 2014 | Annualized expense ratio | Days in the current 1/2 year | Days in the full year | ||||||||||||||||||||||||
| Class A | $ | 1,000.00 | $ | 1,087.50 | $ | 6.84 | $ | 1,000.00 | $ | 1,018.65 | $ | 6.61 | 1.30 | % | 184 | 365 | ||||||||||||||||
| Class B | $ | 1,000.00 | $ | 1,083.10 | $ | 11.03 | $ | 1,000.00 | $ | 1,014.61 | $ | 10.67 | 2.10 | 184 | 365 | |||||||||||||||||
| Class C | $ | 1,000.00 | $ | 1,083.90 | $ | 10.45 | $ | 1,000.00 | $ | 1,015.17 | $ | 10.11 | 1.99 | 184 | 365 | |||||||||||||||||
| Class R3 | $ | 1,000.00 | $ | 1,085.80 | $ | 7.89 | $ | 1,000.00 | $ | 1,017.64 | $ | 7.63 | 1.50 | 184 | 365 | |||||||||||||||||
| Class R4 | $ | 1,000.00 | $ | 1,087.60 | $ | 6.32 | $ | 1,000.00 | $ | 1,019.15 | $ | 6.11 | 1.20 | 184 | 365 | |||||||||||||||||
| Class R5 | $ | 1,000.00 | $ | 1,089.70 | $ | 4.74 | $ | 1,000.00 | $ | 1,020.67 | $ | 4.59 | 0.90 | 184 | 365 | |||||||||||||||||
| Class Y | $ | 1,000.00 | $ | 1,089.40 | $ | 4.48 | $ | 1,000.00 | $ | 1,020.92 | $ | 4.33 | 0.85 | 184 | 365 | |||||||||||||||||
| 31 |
| The Hartford Disciplined Equity Fund |
| Approval of Investment Management and Investment Sub-Advisory Agreements (Unaudited) |
Section 15(c) of the Investment Company Act of 1940, as amended (the “1940 Act”), requires that each mutual fund’s board of directors, including a majority of those directors who are not “interested persons” of the mutual fund, as defined in the 1940 Act (the “Independent Directors”), annually review and consider the continuation of the mutual fund’s investment advisory and sub-advisory agreements. At its meeting held on August 5-6, 2014, the Board of Directors (the “Board”) of The Hartford Mutual Funds, Inc., including each of the Independent Directors, unanimously voted to approve the continuation of the investment management agreement for The Hartford Disciplined Equity Fund (the “Fund”) with Hartford Funds Management Company, LLC (“HFMC”) and the continuation of the investment sub-advisory agreement between HFMC and the Fund’s sub-adviser, Wellington Management Company, LLP (the “Sub-adviser,” and together with HFMC, the “Advisers”) (collectively, the “Agreements”).
In the months preceding the August 5-6, 2014 meeting, the Board requested, received and reviewed written responses from the Advisers to questions posed to them on behalf of the Independent Directors and supporting materials relating to those questions and responses. The Board considered information furnished to the Board at its meetings throughout the year, as well as information specifically prepared in connection with the annual approval of the Agreements at the Board’s meetings held on June 17-18, 2014 and August 5-6, 2014. Information provided to the Board at its meetings throughout the year included, among other things, reports on Fund performance, legal and compliance matters, sales and marketing activity, shareholder services, and the other services provided to the Fund by the Advisers and their affiliates. The Board also received in-person presentations by Fund officers and representatives of HFMC at the Board’s meetings on June 17-18, 2014 and August 5-6, 2014 concerning the Agreements.
The Independent Directors, advised by independent legal counsel, engaged service providers to assist them with evaluating the Agreements with respect to the Fund. Lipper Inc. (“Lipper”), an independent provider of investment company data, was retained to provide the Board with reports on how the Fund’s contractual management fees, actual management fees, other non-management fees, overall expense ratios and investment performance compared to those of mutual funds with similar investment objectives. The Independent Directors also engaged an independent financial services consultant (the “Consultant”) to assist them in evaluating the Fund’s management fees, sub-advisory fees, other non-management fees, overall expense ratios and investment performance. In addition, the Consultant reviewed the profitability calculations utilized by HFMC in connection with the continuation of the investment management agreement.
In determining whether to continue the Agreements for the Fund, the members of the Board reviewed and evaluated information and factors they believed to be relevant and appropriate in light of the information that the Board deemed necessary and appropriate through the exercise of its reasonable business judgment. While individual members of the Board may have weighed certain factors differently, the Board’s determination to continue the Agreements was based on a comprehensive consideration of all information provided to the Board throughout the year and specifically with respect to the continuation of the Agreements. A more detailed discussion of the factors the Board considered with respect to its approval of the Agreements is provided below.
Nature, Extent and Quality of Services Provided by the Advisers
The Board requested and considered information concerning the nature, extent and quality of the services provided to the Fund by the Advisers. The Board considered, among other things, the terms of the Agreements and the range of services provided by the Advisers. The Board considered the Advisers’ professional personnel who provide services to the Fund, including each Adviser’s ability and experience in attracting and retaining qualified personnel to service the Fund. The Board considered each Adviser’s reputation and overall financial strength, as well as its willingness to consider and implement organizational and operational changes designed to enhance services to the Hartford Funds. In addition, the Board considered the quality of each Adviser’s communications with the Board and responsiveness to Board inquiries and requests made from time to time with respect to the Fund and other Hartford Funds.
The Board also requested and evaluated information concerning each Adviser’s regulatory and compliance environment. In this regard, the Board requested and reviewed information on each Adviser’s compliance policies and procedures, compliance history, and a report from the Fund’s Chief Compliance Officer on each Adviser’s compliance with applicable laws and regulations, including responses to regulatory developments and compliance issues raised by regulators. The Board also noted the Advisers’ support of the Fund’s compliance control structure, particularly the resources devoted by the Advisers in support of the Fund’s obligations pursuant to Rule 38a-1 under the 1940 Act.
With respect to HFMC, the Board noted that, under the Agreements, HFMC is responsible for the management of the Fund, including oversight of fund operations and service providers, and provides administrative and investment advisory services in connection with selecting, monitoring and supervising the Sub-adviser. The Board considered HFMC’s ongoing monitoring of people, process and performance, including its quarterly reviews of each of the Hartford Funds, semi-annual meetings with the leaders of each Fund’s portfolio management team, and oversight of the Hartford Funds’ approximately 66 portfolio managers. The Board recognized that HFMC has demonstrated a record of making changes to the
| 32 |
| The Hartford Disciplined Equity Fund |
| Approval of Investment Management and Investment Sub-Advisory Agreements (Unaudited) – (continued) |
management and/or strategies of the Hartford Funds when warranted. The Board considered HFMC’s oversight of the Sub-adviser’s investment approach and results, process for monitoring best execution of portfolio trades by the Sub-adviser, and approach to risk management with respect to the Fund and the service providers to the Fund. The Board also considered HFMC’s oversight of compliance with the Fund’s objective and policies as well as with applicable laws and regulations, noting that regulatory and other developments had over time led to an increase in the scope of HFMC’s services in this regard.
In addition, the Board considered HFMC’s ongoing commitment to review and rationalize the Hartford Funds product line-up and the expenses that HFMC had incurred in connection with fund combinations in recent years. The Board considered that HFMC or its affiliates are responsible for providing the Fund’s officers.
With respect to the Sub-adviser, which provides certain day-to-day portfolio management services for the Fund, the Board considered the quality of the Fund’s portfolio manager, the Sub-adviser’s other investment personnel, its investment philosophy and process, investment research capabilities and resources, performance record, trade execution capabilities and experience. The Board considered the experience of the Fund’s portfolio manager, the number of accounts managed by the portfolio manager, and the Sub-adviser’s method for compensating the portfolio manager.
Based on these considerations, the Board concluded that it was satisfied with the nature, extent and quality of the services provided to the Fund by HFMC and the Sub-adviser.
Performance of the Fund and the Advisers
The Board considered the investment performance of the Fund. In this regard, the Board reviewed the performance of the Fund over different time periods presented in the materials and evaluated HFMC’s analysis of the Fund’s performance for these time periods. The Board considered information and materials provided to the Board by the Advisers concerning Fund performance, as well as information from Lipper comparing the investment performance of the Fund to an appropriate benchmark and universe of peer funds. The Board noted that the Fund’s performance was in the 1st quintile of its performance universe for the 1-year period and the 2nd quintile for the 3- and 5-year periods. The Board also noted that the Fund’s performance was above its benchmark for the 1-, 3- and 5-year periods.
The Board considered the detailed investment analytics reports provided by Hartford Funds’ Investment Advisory Group throughout the year. These reports include, among other things, information on the Fund’s gross and net returns, the Fund’s investment performance relative to an appropriate benchmark and peer group, various statistics concerning the Fund’s portfolio, and a narrative summary of various factors affecting Fund performance. The Board considered the Advisers’ cooperation with the Investment Committee, which assists the Board in evaluating the performance of the Fund at periodic meetings throughout the year. The Board also considered the analysis provided by the Consultant relating to the Fund’s performance track record.
In light of all the considerations noted above, the Board concluded that it had continued confidence in HFMC’s and the Sub-adviser’s overall capabilities to manage the Fund.
Costs of the Services and Profitability of the Advisers
The Board reviewed information regarding HFMC’s cost to provide investment management and related services to the Fund and HFMC’s profitability, both overall and for the Fund, on a pre-tax basis without regard to distribution expenses. The Board also requested and reviewed information about the profitability to HFMC and its affiliates from all services provided to the Fund and all aspects of their relationship with the Fund. The Board also requested and received information relating to the operations and profitability of the Sub-adviser.
The Board considered the Consultant’s review of the profitability calculations used by HFMC in connection with the continuation of the investment management agreement, noting the Consultant’s view that Hartford Funds’ process for calculating and reporting Fund profitability is reasonable. In this regard, the Board noted that the Consultant performed a full review of this process in light of the recent restructuring of the Hartford Funds business and reported that the approach to analyzing Fund profitability, including the use of common expense allocation methodologies, is reasonable, sound and well within common industry practice.
Based on these considerations, the Board concluded that the profits anticipated to be realized by the Advisers and their affiliates from their relationships with the Fund would not be excessive.
| 33 |
| The Hartford Disciplined Equity Fund |
| Approval of Investment Management and Investment Sub-Advisory Agreements (Unaudited) – (continued) |
Comparison of Fees and Services Provided by the Advisers
The Board considered comparative information with respect to the management fees to be paid by the Fund to HFMC and the total expense ratios of the Fund. The Board also considered comparative information with respect to the sub-advisory fees to be paid by HFMC to the Sub-adviser. In this regard, the Board requested and reviewed information from HFMC and the Sub-adviser relating to the management and sub-advisory fees, including the sub-advisory fee schedule for the Fund, and total operating expenses for the Fund. With respect to the sub-advisory fee schedule, the Board considered representations from HFMC and the Sub-adviser that the Sub-adviser’s fees were negotiated at arm’s length on a fund-by-fund basis. The Board also reviewed information from Lipper comparing the Fund’s contractual management fees, actual management fees and overall expense ratios relative to a group of funds selected by Lipper, in consultation with the Consultant, and a broader universe of funds selected by Lipper. The Board considered that the Fund’s contractual management fee and its total expenses (less 12b-1 and shareholder service fees) were in the 3rd quintile of its expense group, while its actual management fee was in the 2nd quintile. The Board noted that the Fund has an automatically renewable contractual expense cap on each share class. The expense cap resulted in reimbursement of certain expenses incurred in 2013.
While the Board recognized that comparisons between the Fund and peer funds may be imprecise, given the different service levels and characteristics of mutual funds and the different business models and cost structures of the Advisers, the comparative information provided by Lipper assisted the Board in evaluating the reasonableness of the Fund’s management and sub-advisory fees and total operating expenses. In addition, the Board considered the analysis and recommendations of the Consultant relating to the Fund’s management and sub-advisory fees and total operating expenses.
Based on these considerations, the Board concluded that the Fund’s fees and total operating expenses, in conjunction with the information about quality of services, profitability, economies of scale, and other matters discussed, were reasonable in light of the services provided.
Economies of Scale
The Board requested and considered information regarding the Advisers’ realization of economies of scale with respect to the Fund and whether the fee levels reflect these economies of scale for the benefit of the Fund’s shareholders. The Board reviewed the breakpoints in the management fee schedule for the Fund, which reduce fee rates as Fund assets grow over time. The Board recognized that a fund with assets beyond the highest breakpoint level will continue to benefit from economies of scale because additional assets are charged the lowest breakpoint fee resulting in lower overall effective management fee rates. The Board also considered that expense limitations and fee waivers that reduce the Fund’s expenses at all asset levels can have the same effect as breakpoints in sharing economies of scale with shareholders and provide protection from an increase in expenses if Fund assets decline. The Board recognized that a fee schedule that reaches a lower breakpoint quickly provides shareholders with the benefit of anticipated or potential economies of scale, although the Board noted that the Fund’s current low asset levels have kept the Fund from fully realizing this benefit. The Board also considered that HFMC has been active in managing expenses, which has resulted in benefits being realized by shareholders as assets within the Hartford Funds family of funds have grown over time, including through lower transfer agent costs and other operating expenses.
The Board reviewed and evaluated materials from Lipper and the Consultant showing how management fee schedules of peer funds reflect economies of scale for the benefit of shareholders as a peer fund’s assets hypothetically increase over time. Based on information provided by HFMC, Lipper, and the Consultant, the Board recognized that there is no uniform methodology for establishing breakpoints or uniform pattern in asset levels that trigger breakpoints or the amounts of breakpoints triggered.
After considering all of the information available to it, the Board concluded that it was satisfied with the extent to which economies of scale would be shared for the benefit of the Fund’s shareholders based on currently available information and the effective advisory fees and expense ratios for the Fund at its current and reasonably anticipated asset levels. The Board noted, however, that it would continue to monitor future growth in Fund assets and the appropriateness of additional breakpoints.
Other Benefits
The Board considered other benefits to the Advisers and their affiliates from their relationships with the Fund.
The Board noted that HFMC receives fees for fund accounting and related services from the Fund, and the Board considered information on profits to HFMC for such services. The Board also considered that Hartford Administrative Services Company (“HASCO”), the Fund’s transfer
| 34 |
| The Hartford Disciplined Equity Fund |
| Approval of Investment Management and Investment Sub-Advisory Agreements (Unaudited) – (continued) |
agent and an affiliate of HFMC, receives transfer agency compensation from the Fund, and the Board reviewed information on the profitability of the Fund’s transfer agency function to HASCO. The Board considered information provided by HASCO indicating that the transfer agent fees charged by HASCO to the Fund were fair and reasonable based on publicly available information.
The Board also considered that Hartford Funds Distributors, LLC (“HFD”), an affiliate of HFMC, serves as principal underwriter of the Fund. As principal underwriter, HFD receives 12b-1 fees from the Fund and receives all or a portion of the sales charges on sales or redemptions of certain classes of shares. The Board also noted that certain affiliates of HFD distribute shares of the Fund and receive compensation in that connection.
The Board considered benefits to the Sub-adviser from its use of the Fund’s brokerage commissions to obtain soft dollar research, and representations from HFMC and the Sub-adviser that the Sub-adviser would not make any revenue-sharing payments or any other type of distribution payments to HFMC or its affiliates.
The Board considered the benefits to shareholders of being part of the Hartford Funds family of funds, including the right to exchange investments between the same class of funds without a sales charge, the ability to reinvest Fund dividends into other funds in the family, and the ability to combine holdings in the Fund with holdings in other funds to obtain a reduced sales charge. The Board considered HFMC’s efforts to provide investors in the family with a broad range of investment styles and asset classes and its entrepreneurial risk in initiating new funds to expand these opportunities for shareholders.
* * * *
Based upon its review of these various factors, among others, the Board concluded that it is in the best interests of the Fund and its shareholders for the Board to approve the Agreements for an additional year. In reaching this decision, the Board did not assign relative weights to the factors discussed above or deem any one or group of them to be controlling in and of themselves. In connection with their deliberations, the Independent Directors met separately in executive session on several occasions, with independent legal counsel and the Consultant, to review the relevant materials and consider their responsibilities under relevant laws and regulations.
| 35 |
| The Hartford Disciplined Equity Fund |
| Main Risks (Unaudited) |
The main risks of investing in the Fund are described below.
Market, Selection and Strategy Risk: The Fund’s share price may fluctuate due to market risk and/or security selections that may underperform the market or relevant benchmarks. If the sub-adviser's investment strategy does not perform as expected, the Fund could underperform its peers or lose money. There is no guarantee the Fund will achieve its stated objective.
Foreign Investment Risk: Investments in foreign securities may be riskier than investments in U.S. securities. Potential risks include the risks of illiquidity, increased price volatility, less government regulation, less extensive and less frequent accounting and other reporting requirements, unfavorable changes in currency exchange rates, and economic and political disruptions.
Quantitative Analysis Risk: The Fund uses quantitative analysis in its securities selection; securities selected by this method may perform differently from the broader stock market.
Active Trading Risk: Actively trading investments may result in higher costs and higher taxable income.
| 36 |
THIS PRIVACY POLICY IS NOT PART OF THIS REPORT
Privacy Policy and Practices of The Hartford Financial Services Group, Inc. and its Affiliates
(herein called “we, our and us”)
This Privacy Policy applies to our United States Operations
We value your trust. We are committed to the responsible: a) management; b) use; and c) protection; of Personal Information.
This notice describes how we collect, disclose, and protect Personal Information.
We collect Personal Information to: a) service your Transactions with us; and b) support our business functions.
We may obtain Personal Information from: a) You; b) your Transactions with us; and c) third parties such as a consumer-reporting agency.
Based on the type of product or service You apply for or get from us, Personal Information such as: a) your name; b) your address; c) your income; d) your payment; or e) your credit history; may be gathered from sources such as applications, Transactions, and consumer reports.
To serve You and service our business, we may share certain Personal Information. We will share Personal Information, only as allowed by law, with affiliates such as: a) our insurance companies; b) our employee agents; c) our brokerage firms; and d) our administrators.
As allowed by law, we may share Personal Financial Information with our affiliates to: a) market our products; or b) market our services; to You without providing You with an option to prevent these disclosures.
|
We may also share Personal Information, only as allowed by law, with unaffiliated third parties including: a) independent agents; b) brokerage firms; c) insurance companies; d) administrators; and e) service providers; who help us serve You and service our business.
When allowed by law, we may share certain Personal Financial Information with other unaffiliated third parties who assist us by performing services or functions such as: a) taking surveys; b) marketing our products or services; or c) offering financial products or services under a joint agreement between us and one or more financial institutions.
We, and third parties we partner with, may track some of the pages You visit through the use of: a) cookies; b) pixel tagging; or c) other technologies; and currently do not process or comply with any web browser’s “do not track” signal or similar mechanism that indicates a request to disable online tracking of individual users who visit our websites or use our services.
We will not sell or share your Personal Financial Information with anyone for purposes unrelated to our business functions without offering You the opportunity to: a) “opt-out;” or b) “opt-in;” as required by law.
We only disclose Personal Health Information with: a) your proper written authorization; or b) as otherwise allowed or required by law.
Our employees have access to Personal Information in the course of doing their jobs, such as: a) underwriting policies; b) paying claims; c) developing new products; or d) advising customers of our products and services.
|
We use manual and electronic security procedures to maintain: a) the confidentiality; and b) the integrity of; Personal Information that we have. We use these procedures to guard against unauthorized access.
Some techniques we use to protect Personal Information include: a) secured files; b) user authentication; c) encryption; d) firewall technology; and e) the use of detection software.
We are responsible for and must: a) identify information to be protected; b) provide an adequate level of protection for that data; c) grant access to protected data only to those people who must use it in the performance of their job-related duties.
Employees who violate our Privacy Policy will be subject to discipline, which may include ending their employment with us.
At the start of our business relationship, we will give You a copy of our current Privacy Policy.
We will also give You a copy of our current Privacy Policy once a year if You maintain a continuing business relationship with us.
We will continue to follow our Privacy Policy regarding Personal Information even when a business relationship no longer exists between us.
|
As used in this Privacy Notice:
Application means your request for our product or service.
Personal Financial Information means financial information such as: a) credit history; b) income; c) financial benefits; or d) policy or claim information.
Personal Health Information means health information such as: a) your medical records; or b) information about your illness, disability or injury.
Personal Information means information that identifies You personally and is not otherwise available to the public. It includes: a) Personal Financial Information; and b) Personal Health Information.
Transaction means your business dealings with us, such as: a) your Application; b) your request for us to pay a claim; and c) your request for us to take an action on your account.
You means an individual who has given us Personal Information in conjunction with: a) asking about; b) applying for; or c) obtaining; a financial product or service from us if the product or service is used mainly for personal, family, or household purposes.
|
This Privacy Policy is being provided on behalf of the following affiliates of The Hartford Financial Services Group, Inc.:
1stAGChoice, Inc.; Access CoverageCorp, Inc.; Access CoverageCorp Technologies, Inc.; American Maturity Life Insurance Company; Archway 60 R, LLC; Business Management Group, Inc.; Champlain Life Reinsurance Company; DMS R, LLC; Eloy R, LLC; Ersatz Corporation; First State Insurance Company; Hartford Accident and Indemnity Company; Hartford Administrative Services Company; Hartford Casualty General Agency, Inc.; Hartford Casualty Insurance Company; Hartford-Comprehensive Employee Benefit Service Company; Hartford Equity Sales Company, Inc.; Hartford Fire General Agency, Inc.; Hartford Fire Insurance Company; Hartford Funds Management Company, LLC; Hartford Funds Management Group, Inc.; Hartford HLS Series Fund II, Inc.; Hartford Insurance Company of Illinois; Hartford Insurance Company of the Midwest; Hartford Insurance Company of the Southeast; Hartford Integrated Technologies, Inc.; Hartford International Life Reassurance Corporation; Hartford Funds Distributors, LLC; Hartford Investment Management Company; Hartford Life and Accident Insurance Company; Hartford Life and Annuity Insurance Company; Hartford Life Insurance Company; Hartford Life Private Placement, LLC; Hartford Lloyd’s Corporation; Hartford Lloyd’s Insurance Company; Hartford Mezzanine Investors I, LLC; Hartford Residual Market, L.C.C.; Hartford Retirement Services, LLC; Hartford Securities Distribution Company, Inc.; Hartford Series Fund, Inc.; Hartford Specialty Insurance Services of Texas, LLC; Hartford Strategic Investments, LLC; Hartford Underwriters Insurance Company; Hartford Technology Services Company, L.L.C.; Hartford of Texas General Agency, Inc.; Hartford Underwriters General Agency, Inc.; HARTRE Company, L.C.C.; HL Investment Advisors, LLC; HLA LLC; Horizon Management Group, LLC; HRA Brokerage Services, Inc.; Lanidex Class B, LLC; M-CAP Insurance Agency, LLC; New England Insurance Company; New England Reinsurance Corporation; Nutmeg Insurance Agency, Inc.; Nutmeg Insurance Company; Pacific Insurance Company, Limited; Planco, LLC: Property and Casualty Insurance Company of Hartford; Revere R, LLC; RVR R, LLC; Sentinel Insurance Company, Ltd.; Sunstone R, LLC; Symphony R, LLC; The Evergreen Group Incorporated; The Hartford Alternative Strategies Fund; The Hartford Mutual Funds, Inc.; The Hartford Mutual Funds II, Inc.; Trumbull Flood Management, L.L.C.; Trumbull Insurance Company; Twin City Fire Insurance Company; White River Life Reinsurance Company.
HPP Revised January 2014
HARTFORDFUNDS
hartfordfunds.com
This information is written in connection with the promotion or marketing of the matter(s) addressed in this material.
This report is submitted for the general information of the shareholders of the Fund. It is not authorized for distribution unless preceded or accompanied by a current prospectus for the Fund.
The information cannot be used or relied upon for the purpose of avoiding IRS penalties. These materials are not intended to provide tax, accounting or legal advice. As with all matters of a tax or legal nature, you should consult your own tax or legal counsel for advice.
Investors should carefully consider the investment objectives, risks, charges, and expenses of Hartford Funds before investing. This and other information can be found in the prospectus and summary prospectus, which can be obtained by calling 888-843-7824 (retail) or 800-279-1541 (institutional). Investors should read them carefully before they invest.
Hartford Funds are underwritten and distributed by Hartford Funds Distributors, LLC.
MFAR-DE14 12/14 113968-3 Printed in U.S.A.
HARTFORDFUNDS
|
THE HARTFORD
2014 Annual Report |
A MESSAGE FROM THE PRESIDENT
Dear Fellow Shareholders:
Thank you for investing in Hartford Funds.
Market Review
U.S. equities (as represented by the S&P 500 Index) rose steadily for the fiscal year ended October 31, 2014, with a return of 17.27% for the period. With the exception of short-lived geopolitical scares early in 2014 and concerns about continuing global growth near the end of the period, stocks generally rose on solid fundamentals and encouraging macroeconomic data during the year.
September 2014 marked the six-year anniversary of the start of the financial crisis. Within weeks of that anniversary, both the S&P 500 Index and the Dow Jones Industrial Average set new all-time highs, closing at 2,018 and 17,391, respectively, on October 31. Although the fallout of the crisis continues to influence investor behavior, stocks have recovered and risen dramatically, up 198% from their low in March 2009. Meanwhile, the domestic economy is notching strong growth, and the unemployment rate has reached its lowest level since August 2008.
While the U.S. economy appears to have stabilized and to have reverted to a solid growth path, the outlook for the global economy appears to have gotten cloudier. The U.S. Federal Reserve has ended quantitative easing, while Europe and Japan are pursuing stimulus options to avoid a double-dip recession and deflation, respectively. Diverging central-bank policies will likely continue to play an important role in market movements going forward as investors wait to see the reactions to their efforts and their impacts on global markets.
How have market movements impacted your portfolio throughout the last year? Are your investments still on track to provide the growth or income you need, and are you comfortable with their progress during times of volatility?
Your financial professional can help you navigate today’s markets with confidence, as well as assist you to achieve your investment goals by providing advice on the best options within our fund family to help you work toward overcoming today’s investing challenges. Meet with your financial advisor regularly to examine your portfolio and your investment strategy, and to determine if you’re still on track to meet your goals.
Thank you again for investing with Hartford Funds.
James Davey
President
Hartford Funds
1 The S&P 500 Index is a market capitalization-weighted price index composed of 500 widely held common stocks.
2 The Dow Jones Industrial Average is an unmanaged, price-weighted index of 30 of the largest, most widely held stocks traded on the NYSE
The Hartford Dividend and Growth Fund
The views expressed in the Fund’s Manager Discussion under “Why did the Fund perform this way?” and “What is the outlook?” are views of the Fund’s sub-adviser and portfolio management team through the end of the period and are subject to change based on market and other conditions. The Fund’s Manager Discussion is for informational purposes only and does not represent an offer, recommendation or solicitation to buy, hold or sell any security. The specific securities identified and described, if any, do not represent all of the securities purchased or sold and you should not assume that investments in the securities identified and discussed will be profitable.
| The Hartford Dividend and Growth Fund inception 07/22/1996 |
| (sub-advised by Wellington Management Company, LLP) |
| Investment objective – The Fund seeks a high level of current income consistent with growth of capital. |
Performance Overview 10/31/04 - 10/31/14

The chart above represents the hypothetical growth of a $10,000 investment in Class A, which includes a sales charge. Growth results in classes other than Class A will vary from what is seen above due to differences in the expenses charged to those share classes.
Average Annual Total Returns (as of 10/31/14)
| 1 Year | 5 Years | 10 Years | ||||||||||
| Dividend & Growth A# | 16.01 | % | 14.61 | % | 8.58 | % | ||||||
| Dividend & Growth A## | 9.63 | % | 13.32 | % | 7.96 | % | ||||||
| Dividend & Growth B# | 14.91 | % | 13.60 | % | 7.83 | %* | ||||||
| Dividend & Growth B## | 9.91 | % | 13.36 | % | 7.83 | %* | ||||||
| Dividend & Growth C# | 15.12 | % | 13.77 | % | 7.78 | % | ||||||
| Dividend & Growth C## | 14.12 | % | 13.77 | % | 7.78 | % | ||||||
| Dividend & Growth I# | 16.22 | % | 14.90 | % | 8.82 | % | ||||||
| Dividend & Growth R3# | 15.61 | % | 14.28 | % | 8.41 | % | ||||||
| Dividend & Growth R4# | 15.98 | % | 14.64 | % | 8.70 | % | ||||||
| Dividend & Growth R5# | 16.32 | % | 14.99 | % | 8.95 | % | ||||||
| Dividend & Growth Y# | 16.42 | % | 15.09 | % | 9.04 | % | ||||||
| Russell 1000 Value Index | 16.46 | % | 16.49 | % | 7.90 | % | ||||||
| S&P 500 Index | 17.27 | % | 16.69 | % | 8.20 | % | ||||||
| # | Without sales charge |
| ## | With sales charge |
| * | Class B shares convert to Class A shares after 8 years. The return shown reflects the conversion to Class A shares, which had different operating expenses, for the period after conversion. |
PERFORMANCE DATA QUOTED REPRESENTS PAST PERFORMANCE AND DOES NOT GUARANTEE FUTURE RESULTS. The investment return and principal value of the investment will fluctuate so that investors’ shares, when redeemed, may be worth more or less than their original cost. Current performance may be lower or higher than the performance data quoted. To obtain performance data current to the most recent month-end, please visit our website www.hartfordfunds.com.
The initial investment in Class A shares reflects the maximum sales charge of 5.50% and returns for Class B shares reflect a contingent deferred sales charge of up to 5.00% and declining to zero, depending on the period of time the shares are held. Returns for Class C shares reflect a contingent deferred sales charge of up to 1.00% on shares redeemed within twelve months of purchase.
Total returns presented above were calculated using the Fund’s net asset value available to shareholders for sale or redemption of Fund shares on October 31, 2014, which may exclude investment transactions as of this date. All share class returns assume the reinvestment of all distributions at net asset value and the deduction of all fund expenses.
Effective 9/30/09, Class B shares of the Fund were closed to new investments.
Class I shares commenced operations on 8/31/06. Performance prior to that date is that of the Fund's Class A shares (excluding sales charges), which had different operating expenses. Class R3, R4 and R5 shares commenced operations on 12/22/06. Performance prior to that date is that of the Fund's Class Y shares, which had different operating expenses.
Russell 1000 Value Index is an unmanaged index that measures the performance of those Russell 1000 Index companies with lower price-to-book ratios and lower forecasted growth values. The Russell 1000 Index is an unmanaged index that measures the performance of the 1,000 largest companies in the Russell 3000 Index, which measures the performance of the 3,000 largest U.S. companies, based on total market capitalizations.
S&P 500 Index is a market capitalization-weighted price index composed of 500 widely held common stocks.
You cannot invest directly in an index.
The chart and table do not reflect the deductions of taxes that a shareholder would pay on Fund distributions or the redemption of Fund shares.
Performance information may reflect historical or current expense waivers/reimbursements from the investment adviser, without which performance would have been lower. For information on current expense waivers/reimbursements, please see the prospectus.
| 2 |
| The Hartford Dividend and Growth Fund |
| Manager Discussion |
| October 31, 2014 (Unaudited) |
Operating Expenses*
| Net | Gross | |||||||
| Dividend & Growth Class A | 1.05 | % | 1.05 | % | ||||
| Dividend & Growth Class B | 1.95 | % | 2.00 | % | ||||
| Dividend & Growth Class C | 1.79 | % | 1.79 | % | ||||
| Dividend & Growth Class I | 0.83 | % | 0.83 | % | ||||
| Dividend & Growth Class R3 | 1.35 | % | 1.35 | % | ||||
| Dividend & Growth Class R4 | 1.05 | % | 1.05 | % | ||||
| Dividend & Growth Class R5 | 0.75 | % | 0.75 | % | ||||
| Dividend & Growth Class Y | 0.65 | % | 0.65 | % | ||||
| * | As shown in the Fund's prospectus dated March 1, 2014. Actual expenses may be higher or lower. Please see accompanying Financial Highlights for expense ratios for the year ended October 31, 2014. |
Gross expenses are the Fund's total annual operating expenses shown in the Fund's prospectus dated March 1, 2014. Net expenses are the Fund's total annual operating expenses shown in the Fund's prospectus dated March 1, 2014 and reflect contractual expense reimbursements in instances when these reductions reduce the Fund's gross expenses. Contractual reimbursements remain in effect until February 28, 2015, and automatically renew for one-year terms unless terminated.
The Fund filed an updated prospectus, dated November 7, 2014, with the U.S. Securities and Exchange Commission that became effective on that date. However, the information in this annual report is as of October 31, 2014 and does not reflect any changes made to the total annual fund operating expense table in the November 7, 2014 prospectus. The net expense ratios shown in the November 7, 2014 prospectus are 1.05%, 2.00%, 1.79%, 0.83%, 1.35%, 1.05%, 0.75% and 0.65% for Class A, Class B, Class C, Class I, Class R3, Class R4, Class R5 and Class Y, respectively, and reflect contractual expense reimbursements in place until February 29, 2016. The gross expense ratios shown in the November 7, 2014 prospectus are 1.05%, 2.00%, 1.79%, 0.83%, 1.35%, 1.05%, 0.75% and 0.65% for Class A, Class B, Class C, Class I, Class R3, Class R4, Class R5 and Class Y, respectively.
All investments are subject to risk including the possible loss of principal. For a discussion of the Fund’s risks, please see the Main Risks section of this report. For more detailed information on the risks associated with an investment in the Fund, please see the prospectus.
| Portfolio Managers | ||
| Edward P. Bousa, CFA | Donald J. Kilbride | Matthew G. Baker |
| Senior Vice President and Equity Portfolio Manager | Senior Vice President and Equity Portfolio Manager | Senior Vice President and Equity Portfolio Manager |
How did the Fund perform?
The Class A shares of The Hartford Dividend and Growth Fund returned 16.01%, before sales charge, for the twelve-month period ended October 31, 2014, underperforming the Fund’s benchmark, the S&P 500 Index, which returned 17.27% for the same period. The Fund also underperformed the Russell 1000 Value Index, the Fund’s other benchmark, which returned 16.46% for the same period. The Fund outperformed the 12.41% average return of the Lipper Equity Income Funds peer group, a group of funds with investment strategies similar to those of the Fund.
Why did the Fund perform this way?
U.S. equities surged during the period, despite bouts of significant volatility. After finishing their best year since 1997, U.S. stocks began 2014 with their worst month in nearly two years. Worries about a slowdown in China and general angst surrounding emerging markets overshadowed a fairly benign domestic environment. However, robust merger and acquisition activity and an uncontested increase in the debt ceiling from Congress helped stoke investors' risk appetites in February. The rally continued in May amid renewed signs of life in the housing market and the best payroll gain in more than two years. However, a pullback in July ended a streak of five consecutive monthly gains. Fear gripped the market as heightened geopolitical risks, a potential Portuguese banking crisis, and worries of U.S. Federal Reserve (Fed) tightening took center stage. Stocks rebounded in August as investors were emboldened by encouraging economic data, headlined by better-than-expected Gross Domestic Product (GDP) growth and signs that the housing recovery still had legs. In September, U.S. equities retreated for just the third month this year. Despite solid manufacturing and consumer confidence readings, the reality of quantitative easing ending and the prospect of higher federal funds rates in mid-2015 contributed to increased risk aversion levels. Stocks finished a volatile October at an all-time high on the heels of a positive earnings season and generally solid economic data. Returns also varied noticeably by market-cap, as small- and mid-cap stocks underperformed large-cap stocks.
During the twelve-month period, all of the ten sectors within the S&P 500 Index posted positive returns, led by Healthcare (+30%), Information Technology(+26%), and Utilities (+22%). Energy (+4%), Telecommunication Services (+5%), and Consumer Discretionary (+9%) lagged on a relative basis.
Several factors led to the Fund’s underperformance relative to the S&P 500 Index, including our underweight to and weak stock selection within Information Technology as well as weak stock selection in Healthcare. However, these factors were somewhat offset by our underweight to Consumer Discretionary and our overweight to the Healthcare sector. Holding a modest cash position in an upward trending market also detracted from results relative to the S&P 500 Index.
| 3 |
| The Hartford Dividend and Growth Fund |
| Manager Discussion – (continued) |
| October 31, 2014 (Unaudited) |
The Fund’s top detractors from performance relative to the S&P 500 Index included an underweight to Apple (Information Technology), an overweight to Ford (Consumer Discretionary) and not owning Gilead (Healthcare). Shares of Apple, a maker of an interconnected ecosystem of computing and mobile devices, rose after the company posted better-than-expected quarterly earnings and gave solid guidance for the fourth quarter; we owned a position in this stock but were underweight relative to the Fund’s benchmark. During the period shares of Ford, a global automobile maker, underperformed as the company lowered its guidance regarding pre-tax profit. Shares of Gilead, a U.S.-based biopharmaceutical company, rose after the firm reported better-than-expected earnings, led by record sales from the hepatitis C franchise. Not owning this S&P 500 Index stock detracted from relative performance during the period. Top absolute detractors also included Goldcorp (Materials) and United Technologies (Industrials).
The Fund’s top contributors to performance relative to the S&P 500 Index during the period were AstraZeneca (Healthcare), Merck (Healthcare), and Wells Fargo (Financials). Shares of AstraZeneca, a U.K.-based multinational pharmaceutical company, outperformed on news that U.S.-based pharmaceutical giant Pfizer offered to acquire the company at a price that AstraZeneca dismissed as being too low. We view AstraZeneca as an undervalued company offering exposure to the immuno-oncology market, a new area of medicine that could transform the way many cancers are treated. Shares of Merck, a global pharmaceutical company, rose as the stock benefited from improved investor sentiment regarding the firm's large opportunity with its immuno-oncology program. Shares of Wells Fargo, a U.S.-based diversified bank, outperformed after the company reported better-than-expected quarterly earnings, in part due to strong loan and deposit growth, as well as improving credit quality. Top absolute performers also included Microsoft (Information Technology).
Derivatives are not used in a significant manner in this Fund and did not have a material impact on performance during the period.
What is the outlook?
Relative to the rest of the world, we believe that the U.S. economy appears to be holding up better. However, our outlook for the U.S. has also declined and we believe the consensus GDP estimates are too optimistic at this point. The housing market recovery has slowed in our estimation and the general consensus appears to be that the Fed is likely to raise policy rates by at least 1% next year as an insurance against future inflation pressures. Recently, we have been very active to position the Fund slightly more defensively, taking some profits in stocks that have approached our price targets, and swapping between comparable companies where we have found what we believe to be better risk/reward opportunities. We continue to seek a solid portfolio comprised of firms with strong management teams, good balance sheets, and a commitment to returning cash to shareholders via dividends and share repurchases.
At the end of the period, our largest overweights were to Financials, Healthcare, and Industrials, while we remained underweight Consumer Discretionary, Information Technology, and Consumer Staples, relative to the S&P 500 Index.
Diversification by Sector
as of October 31, 2014
| Sector | Percentage of Net Assets | |||
| Equity Securities | ||||
| Consumer Discretionary | 6.9 | % | ||
| Consumer Staples | 7.3 | |||
| Energy | 10.0 | |||
| Financials | 20.5 | |||
| Health Care | 17.0 | |||
| Industrials | 12.9 | |||
| Information Technology | 14.5 | |||
| Materials | 2.2 | |||
| Services | 2.6 | |||
| Utilities | 3.0 | |||
| Total | 96.9 | % | ||
| Short-Term Investments | 3.2 | |||
| Other Assets and Liabilities | (0.1 | ) | ||
| Total | 100.0 | % | ||
A sector may be comprised of several industries. For Fund compliance purposes, the Fund may not use the same classification system and these sector classifications are used for reporting ease.
| 4 |
| The Hartford Dividend and Growth Fund |
| Schedule of Investments |
| October 31, 2014 |
| (000’s Omitted) |
| Shares or Principal Amount | Market Value ╪ | |||||||
| Common Stocks - 96.9% | ||||||||
| Automobiles and Components - 1.5% | ||||||||
| 6,399 | Ford Motor Co. | $ | 90,161 | |||||
| 1,050 | Honda Motor Co., Ltd. ADR | 33,710 | ||||||
| 123,871 | ||||||||
| Banks - 7.3% | ||||||||
| 900 | Bank of Nova Scotia | 55,155 | ||||||
| 1,496 | PNC Financial Services Group, Inc. | 129,252 | ||||||
| 1,294 | US Bancorp | 55,117 | ||||||
| 6,538 | Wells Fargo & Co. | 347,088 | ||||||
| 586,612 | ||||||||
| Capital Goods - 6.5% | ||||||||
| 391 | Caterpillar, Inc. | 39,632 | ||||||
| 178 | Deere & Co. | 15,223 | ||||||
| 970 | Eaton Corp. plc | 66,365 | ||||||
| 2,999 | General Electric Co. | 77,410 | ||||||
| 950 | Honeywell International, Inc. | 91,271 | ||||||
| 132 | Lockheed Martin Corp. | 25,193 | ||||||
| 818 | Raytheon Co. | 85,016 | ||||||
| 1,226 | Textron, Inc. | 50,904 | ||||||
| 676 | United Technologies Corp. | 72,295 | ||||||
| 523,309 | ||||||||
| Commercial and Professional Services - 2.2% | ||||||||
| 1,012 | Equifax, Inc. | 76,654 | ||||||
| 2,246 | Nielsen N.V. | 95,440 | ||||||
| 172,094 | ||||||||
| Consumer Services - 0.6% | ||||||||
| 765 | Las Vegas Sands Corp. | 47,644 | ||||||
| Diversified Financials - 6.3% | ||||||||
| 262 | Ameriprise Financial, Inc. | 33,098 | ||||||
| 3,472 | Bank of America Corp. | 59,586 | ||||||
| 341 | BlackRock, Inc. | 116,397 | ||||||
| 1,761 | Citigroup, Inc. | 94,267 | ||||||
| 3,286 | JP Morgan Chase & Co. | 198,726 | ||||||
| 502,074 | ||||||||
| Energy - 10.0% | ||||||||
| 1,148 | Anadarko Petroleum Corp. | 105,383 | ||||||
| 1,808 | Chevron Corp. | 216,870 | ||||||
| 2,000 | Exxon Mobil Corp. | 193,458 | ||||||
| 680 | Halliburton Co. | 37,497 | ||||||
| 1,168 | Imperial Oil Ltd. | 55,900 | ||||||
| 1,303 | Marathon Oil Corp. | 46,112 | ||||||
| 318 | Phillips 66 | 24,952 | ||||||
| 496 | Schlumberger Ltd. | 48,894 | ||||||
| 1,081 | Suncor Energy, Inc. | 38,418 | ||||||
| 537 | Total S.A. ADR | 32,147 | ||||||
| 799,631 | ||||||||
| Food and Staples Retailing - 3.1% | ||||||||
| 1,797 | CVS Health Corp. | 154,208 | ||||||
| 252 | Walgreen Co. | 16,171 | ||||||
| 1,064 | Wal-Mart Stores, Inc. | 81,122 | ||||||
| 251,501 | ||||||||
| Food, Beverage and Tobacco - 3.1% | ||||||||
| 484 | Coca-Cola Co. | 20,268 | ||||||
| 522 | Kraft Foods Group, Inc. | 29,424 | ||||||
| 1,244 | Mondelez International, Inc. | 43,846 | ||||||
| 904 | Philip Morris International, Inc. | 80,434 | ||||||
| 1,870 | Unilever N.V. NY Shares ADR | 72,429 | ||||||
| 246,401 | ||||||||
| Health Care Equipment and Services - 4.3% | ||||||||
| 1,479 | Cardinal Health, Inc. | 116,076 | ||||||
| 1,992 | Medtronic, Inc. | 135,748 | ||||||
| 969 | UnitedHealth Group, Inc. | 92,018 | ||||||
| 343,842 | ||||||||
| Household and Personal Products - 1.1% | ||||||||
| 996 | Procter & Gamble Co. | 86,920 | ||||||
| Insurance - 6.9% | ||||||||
| 1,352 | ACE Ltd. | 147,804 | ||||||
| 594 | Aflac, Inc. | 35,487 | ||||||
| 1,140 | Marsh & McLennan Cos., Inc. | 61,989 | ||||||
| 1,419 | MetLife, Inc. | 76,983 | ||||||
| 1,659 | Principal Financial Group, Inc. | 86,860 | ||||||
| 1,667 | Prudential Financial, Inc. | 147,560 | ||||||
| 556,683 | ||||||||
| Materials - 2.2% | ||||||||
| 1,492 | Dow Chemical Co. | 73,719 | ||||||
| 1,495 | Goldcorp, Inc. | 28,083 | ||||||
| 1,426 | International Paper Co. | 72,172 | ||||||
| 173,974 | ||||||||
| Media - 3.4% | ||||||||
| 3,626 | Comcast Corp. Class A | 200,714 | ||||||
| 758 | Walt Disney Co. | 69,228 | ||||||
| 269,942 | ||||||||
| Pharmaceuticals, Biotechnology and Life Sciences - 12.7% | ||||||||
| 1,441 | AstraZeneca plc ADR | 105,097 | ||||||
| 2,230 | Bristol-Myers Squibb Co. | 129,769 | ||||||
| 2,112 | Eli Lilly & Co. | 140,085 | ||||||
| 1,659 | Johnson & Johnson | 178,842 | ||||||
| 4,829 | Merck & Co., Inc. | 279,813 | ||||||
| 4,091 | Pfizer, Inc. | 122,524 | ||||||
| 1,683 | Zoetis, Inc. | 62,544 | ||||||
| 1,018,674 | ||||||||
| Retailing - 1.4% | ||||||||
| 1,910 | Lowe's Cos., Inc. | 109,274 | ||||||
| Semiconductors and Semiconductor Equipment - 3.6% | ||||||||
| 1,117 | Altera Corp. | 38,386 | ||||||
| 1,089 | Analog Devices, Inc. | 54,031 | ||||||
| 4,392 | Intel Corp. | 149,384 | ||||||
| 879 | Texas Instruments, Inc. | 43,660 | ||||||
| 285,461 | ||||||||
| Software and Services - 6.9% | ||||||||
| 1,459 | Accenture plc | 118,371 | ||||||
| 244 | IBM Corp. | 40,130 | ||||||
| 4,963 | Microsoft Corp. | 233,006 | ||||||
| 1,443 | Oracle Corp. | 56,351 | ||||||
| 2,609 | Symantec Corp. | 64,763 | ||||||
| 3,230 | Xerox Corp. | 42,893 | ||||||
| 555,514 | ||||||||
| Technology Hardware and Equipment - 4.0% | ||||||||
| 1,184 | Apple, Inc. | 127,837 | ||||||
| 382 | Avnet, Inc. | 16,508 | ||||||
| 4,642 | Cisco Systems, Inc. | 113,582 | ||||||
| 846 | Qualcomm, Inc. | 66,401 | ||||||
| 324,328 | ||||||||
| Telecommunication Services - 2.6% | ||||||||
| 4,212 | Verizon Communications, Inc. | 211,673 | ||||||
The accompanying notes are an integral part of these financial statements.
| 5 |
| The Hartford Dividend and Growth Fund |
| Schedule of Investments – (continued) |
| October 31, 2014 |
| (000’s Omitted) |
| Shares or Principal Amount | Market Value ╪ | |||||||||||
| Common Stocks - 96.9% - (continued) | ||||||||||||
| Transportation - 4.2% | ||||||||||||
| 2,008 | CSX Corp. | $ | 71,548 | |||||||||
| 1,660 | Delta Air Lines, Inc. | 66,793 | ||||||||||
| 459 | FedEx Corp. | 76,821 | ||||||||||
| 1,171 | United Parcel Service, Inc. Class B | 122,805 | ||||||||||
| 337,967 | ||||||||||||
| Utilities - 3.0% | ||||||||||||
| 907 | Dominion Resources, Inc. | 64,665 | ||||||||||
| 1,404 | Exelon Corp. | 51,372 | ||||||||||
| 967 | NextEra Energy, Inc. | 96,943 | ||||||||||
| 1,041 | NRG Energy, Inc. | 31,218 | ||||||||||
| 244,198 | ||||||||||||
| Total Common Stocks | ||||||||||||
| (Cost $5,411,674) | $ | 7,771,587 | ||||||||||
| Total Long-Term Investments | ||||||||||||
| (Cost $5,411,674) | $ | 7,771,587 | ||||||||||
| Short-Term Investments - 3.2% | ||||||||||||
| Repurchase Agreements - 3.2% | ||||||||||||
| Bank of America Merrill Lynch TriParty Repurchase Agreement (maturing on 11/03/2014 in the amount of $745, collateralized by U.S. Treasury Note 1.50%, 2019, value of $760) |
||||||||||||
| $ | 745 | 0.08%, 10/31/2014 | $ | 745 | ||||||||
| Bank of America Merrill Lynch TriParty Repurchase Agreement (maturing on 11/03/2014 in the amount of $12,681, collateralized by GNMA 1.63% - 7.00%, 2031 - 2054, value of $12,934) |
||||||||||||
| 12,680 | 0.09%, 10/31/2014 | 12,680 | ||||||||||
| Bank of Montreal TriParty Repurchase Agreement (maturing on 11/03/2014 in the amount of $3,407, collateralized by U.S. Treasury Bond 2.88% - 5.25%, 2029 - 2043, U.S. Treasury Note 0.38% - 4.50%, 2015 - 2022, value of $3,475) |
||||||||||||
| 3,407 | 0.08%, 10/31/2014 | 3,407 | ||||||||||
| Bank of Montreal TriParty Repurchase Agreement (maturing on 11/03/2014 in the amount of $11,549, collateralized by FHLMC 2.00% - 5.50%, 2022 - 2034, FNMA 2.00% - 4.50%, 2024 - 2039, GNMA 3.00%, 2043, U.S. Treasury Note 4.63%, 2017, value of $11,780) |
||||||||||||
| 11,549 | 0.10%, 10/31/2014 | 11,549 | ||||||||||
| Barclays Capital TriParty Repurchase Agreement (maturing on 11/03/2014 in the amount of $43,516, collateralized by U.S. Treasury Bond 4.50% - 6.25%, 2023 - 2036, U.S. Treasury Note 1.63% - 2.13%, 2015 - 2019, value of $44,386) |
||||||||||||
| 43,516 | 0.08%, 10/31/2014 | 43,516 | ||||||||||
| Citigroup Global Markets, Inc. TriParty Repurchase Agreement (maturing on 11/03/2014 in the amount of $50,018, collateralized by U.S. Treasury Bill 0.02%, 2015, U.S. Treasury Bond 3.88% - 11.25%, 2015 - 2040, U.S. Treasury Note 2.00% - 3.38%, 2019 - 2021, value of $51,018) |
||||||||||||
| 50,018 | 0.09%, 10/31/2014 | 50,018 | ||||||||||
| Deutsche Bank Securities TriParty Repurchase Agreement (maturing on 11/03/2014 in the amount of $2,887, collateralized by U.S. Treasury Note 0.88%, 2017, value of $2,945) |
||||||||||||
| 2,887 | 0.13%, 10/31/2014 | 2,887 | ||||||||||
| RBS Securities, Inc. TriParty Repurchase Agreement (maturing on 11/03/2014 in the amount of $4,250, collateralized by U.S. Treasury Bond 3.63% - 5.00%, 2037 - 2043, U.S. Treasury Note 2.13%, 2020, value of $4,335) |
||||||||||||
| 4,250 | 0.07%, 10/31/2014 | 4,250 | ||||||||||
| Societe Generale TriParty Repurchase Agreement (maturing on 11/03/2014 in the amount of $44,775, collateralized by U.S. Treasury Bill 0.02%, 2015, U.S. Treasury Bond 3.75% - 11.25%, 2015 - 2043, U.S. Treasury Note 1.38% - 4.25%, 2015 - 2022, value of $45,670) |
||||||||||||
| 44,775 | 0.08%, 10/31/2014 | 44,775 | ||||||||||
| TD Securities TriParty Repurchase Agreement (maturing on 11/03/2014 in the amount of $86,767, collateralized by FHLMC 3.00% - 4.00%, 2026 - 2044, FNMA 2.50% - 5.00%, 2025 - 2044, U.S. Treasury Bond 3.50% - 6.50%, 2026 - 2041, U.S. Treasury Note 1.75% - 2.88%, 2018 - 2019, value of $88,502) |
||||||||||||
| 86,766 | 0.10%, 10/31/2014 | 86,766 | ||||||||||
| 260,593 | ||||||||||||
| Total Short-Term Investments | ||||||||||||
| (Cost $260,593) | $ | 260,593 | ||||||||||
| Total Investments | ||||||||||||
| (Cost $5,672,267) ▲ | 100.1 | % | $ | 8,032,180 | ||||||||
| Other Assets and Liabilities | (0.1 | )% | (7,868 | ) | ||||||||
| Total Net Assets | 100.0 | % | $ | 8,024,312 | ||||||||
The accompanying notes are an integral part of these financial statements.
| 6 |
| The Hartford Dividend and Growth Fund |
| Schedule of Investments – (continued) |
| October 31, 2014 |
| (000’s Omitted) |
| Note: | Percentage of investments as shown is the ratio of the total market value to total net assets. |
Equity industry classifications used in this report are the Global Industry Classification Standard, which was developed by and is the exclusive property and service mark of MSCI, Inc. and Standard & Poor’s.
For Fund compliance purposes, the Fund may not use the same classification system shown in this report as these classifications are used for reporting ease.
| ▲ | At October 31, 2014, the cost of securities for federal income tax purposes was $5,690,389 and the aggregate gross unrealized appreciation and depreciation based on that cost were: |
| Unrealized Appreciation | $ | 2,398,312 | ||
| Unrealized Depreciation | (56,521 | ) | ||
| Net Unrealized Appreciation | $ | 2,341,791 |
| ╪ | See Significant Accounting Policies of accompanying Notes to Financial Statements regarding valuation of securities. |
| GLOSSARY: (abbreviations used in preceding Schedule of Investments) | ||
| Other Abbreviations: | ||
| ADR | American Depositary Receipt | |
| FHLMC | Federal Home Loan Mortgage Corp. | |
| FNMA | Federal National Mortgage Association | |
| GNMA | Government National Mortgage Association | |
The accompanying notes are an integral part of these financial statements.
| 7 |
| The Hartford Dividend and Growth Fund |
| Schedule of Investments – (continued) |
| October 31, 2014 |
| (000’s Omitted) |
Investment Valuation Hierarchy Level Summary
October 31, 2014
| Total | Level 1 ♦ | Level 2 ♦ | Level 3 | |||||||||||||
| Assets: | ||||||||||||||||
| Common Stocks ‡ | $ | 7,771,587 | $ | 7,771,587 | $ | – | $ | – | ||||||||
| Short-Term Investments | 260,593 | – | 260,593 | – | ||||||||||||
| Total | $ | 8,032,180 | $ | 7,771,587 | $ | 260,593 | $ | – | ||||||||
| ♦ | For the year ended October 31, 2014, there were no transfers between Level 1 and Level 2. |
| ‡ | The Fund has all or primarily all of the equity securities categorized in a particular level. Refer to the Schedule of Investments for further industry breakout. |
Following is a reconciliation of Level 3 assets for which significant unobservable inputs were used to determine fair value:
Balance
as | Realized | Change in | Net | Purchases | Sales | Transfers | Transfers | Balance
as | ||||||||||||||||||||||||||||
| Assets: | ||||||||||||||||||||||||||||||||||||
| Common Stocks | $ | 178 | $ | 159 | $ | (130 | ) | $ | — | $ | — | $ | (207 | ) | $ | — | $ | — | $ | — | ||||||||||||||||
| Total | $ | 178 | $ | 159 | $ | (130 | ) | $ | — | $ | — | $ | (207 | ) | $ | — | $ | — | $ | — | ||||||||||||||||
| Note: | For purposes of reporting transfers between different hierarchy levels, both transfers in and out of each level, as applicable, are shown as if they occurred at the beginning of the period. |
The accompanying notes are an integral part of these financial statements.
| 8 |
| The Hartford Dividend and Growth Fund |
| Statement of Assets and Liabilities |
| October 31, 2014 |
| (000’s Omitted) |
| Assets: | ||||
| Investments in securities, at market value (cost $5,672,267) | $ | 8,032,180 | ||
| Cash | 1 | |||
| Receivables: | ||||
| Investment securities sold | 9,641 | |||
| Fund shares sold | 6,737 | |||
| Dividends and interest | 9,300 | |||
| Other assets | 193 | |||
| Total assets | 8,058,052 | |||
| Liabilities: | ||||
| Payables: | ||||
| Investment securities purchased | 24,058 | |||
| Fund shares redeemed | 7,351 | |||
| Investment management fees | 915 | |||
| Dividends | — | |||
| Administrative fees | 12 | |||
| Distribution fees | 295 | |||
| Accrued expenses | 1,109 | |||
| Total liabilities | 33,740 | |||
| Net assets | $ | 8,024,312 | ||
| Summary of Net Assets: | ||||
| Capital stock and paid-in-capital | $ | 5,029,238 | ||
| Undistributed net investment income | 10,600 | |||
| Accumulated net realized gain | 624,561 | |||
| Unrealized appreciation of investments | 2,359,913 | |||
| Net assets | $ | 8,024,312 | ||
| Shares authorized | 1,000,000 | |||
| Par value | $ | 0.001 | ||
| Class A: Net asset value per share/Maximum offering price per share | $27.05/$28.62 | |||
| Shares outstanding | 139,774 | |||
| Net assets | $ | 3,780,786 | ||
| Class B: Net asset value per share | $ | 26.59 | ||
| Shares outstanding | 2,788 | |||
| Net assets | $ | 74,126 | ||
| Class C: Net asset value per share | $ | 26.42 | ||
| Shares outstanding | 17,713 | |||
| Net assets | $ | 467,932 | ||
| Class I: Net asset value per share | $ | 26.95 | ||
| Shares outstanding | 69,885 | |||
| Net assets | $ | 1,883,434 | ||
| Class R3: Net asset value per share | $ | 27.29 | ||
| Shares outstanding | 3,365 | |||
| Net assets | $ | 91,839 | ||
| Class R4: Net asset value per share | $ | 27.42 | ||
| Shares outstanding | 5,800 | |||
| Net assets | $ | 159,018 | ||
| Class R5: Net asset value per share | $ | 27.49 | ||
| Shares outstanding | 8,231 | |||
| Net assets | $ | 226,236 | ||
| Class Y: Net asset value per share | $ | 27.50 | ||
| Shares outstanding | 48,759 | |||
| Net assets | $ | 1,340,941 |
The accompanying notes are an integral part of these financial statements.
| 9 |
| The Hartford Dividend and Growth Fund |
| Statement of Operations |
| For the Year Ended October 31, 2014 |
| (000’s Omitted) |
| Investment Income: | ||||
| Dividends | $ | 192,665 | ||
| Interest | 116 | |||
| Less: Foreign tax withheld | (1,596 | ) | ||
| Total investment income | 191,185 | |||
| Expenses: | ||||
| Investment management fees | 47,902 | |||
| Administrative services fees | ||||
| Class R3 | 180 | |||
| Class R4 | 226 | |||
| Class R5 | 216 | |||
| Transfer agent fees | ||||
| Class A | 4,796 | |||
| Class B | 280 | |||
| Class C | 540 | |||
| Class I | 2,985 | |||
| Class R3 | 6 | |||
| Class R4 | 2 | |||
| Class R5 | 1 | |||
| Class Y | 26 | |||
| Distribution fees | ||||
| Class A | 9,140 | |||
| Class B | 875 | |||
| Class C | 4,400 | |||
| Class R3 | 449 | |||
| Class R4 | 376 | |||
| Custodian fees | 21 | |||
| Accounting services fees | 1,046 | |||
| Registration and filing fees | 301 | |||
| Board of Directors' fees | 209 | |||
| Audit fees | 67 | |||
| Other expenses | 1,118 | |||
| Total expenses (before waivers and fees paid indirectly) | 75,162 | |||
| Transfer agent fee waivers | (17 | ) | ||
| Commission recapture | (71 | ) | ||
| Total waivers and fees paid indirectly | (88 | ) | ||
| Total expenses, net | 75,074 | |||
| Net Investment Income | 116,111 | |||
| Net Realized Gain on Investments and Foreign Currency Transactions: | ||||
| Net realized gain on investments | 694,245 | |||
| Net realized gain on foreign currency contracts | 1 | |||
| Net realized loss on other foreign currency transactions | (12 | ) | ||
| Net Realized Gain on Investments and Foreign Currency Transactions | 694,234 | |||
| Net Changes in Unrealized Appreciation of Investments: | ||||
| Net unrealized appreciation of investments | 365,334 | |||
| Net Changes in Unrealized Appreciation of Investments | 365,334 | |||
| Net Gain on Investments and Foreign Currency Transactions | 1,059,568 | |||
| Net Increase in Net Assets Resulting from Operations | $ | 1,175,679 |
The accompanying notes are an integral part of these financial statements.
| 10 |
| The Hartford Dividend and Growth Fund |
| Statement of Changes in Net Assets |
| (000’s Omitted) |
| For the Year Ended October 31, 2014 | For the Year Ended October 31, 2013 | |||||||
| Operations: | ||||||||
| Net investment income | $ | 116,111 | $ | 116,994 | ||||
| Net realized gain on investments and foreign currency transactions | 694,234 | 528,429 | ||||||
| Net unrealized appreciation of investments | 365,334 | 942,357 | ||||||
| Net Increase in Net Assets Resulting from Operations | 1,175,679 | 1,587,780 | ||||||
| Distributions to Shareholders: | ||||||||
| From net investment income | ||||||||
| Class A | (51,845 | ) | (49,319 | ) | ||||
| Class B | (412 | ) | (681 | ) | ||||
| Class C | (3,224 | ) | (3,238 | ) | ||||
| Class I | (28,595 | ) | (25,683 | ) | ||||
| Class R3 | (961 | ) | (999 | ) | ||||
| Class R4 | (2,078 | ) | (2,039 | ) | ||||
| Class R5 | (3,613 | ) | (2,853 | ) | ||||
| Class Y | (25,884 | ) | (30,320 | ) | ||||
| Total from net investment income | (116,612 | ) | (115,132 | ) | ||||
| From net realized gain on investments | ||||||||
| Class A | (224,789 | ) | (48,692 | ) | ||||
| Class B | (6,351 | ) | (1,796 | ) | ||||
| Class C | (27,381 | ) | (5,743 | ) | ||||
| Class I | (103,448 | ) | (22,402 | ) | ||||
| Class R3 | (5,498 | ) | (1,187 | ) | ||||
| Class R4 | (9,021 | ) | (1,977 | ) | ||||
| Class R5 | (12,871 | ) | (2,121 | ) | ||||
| Class Y | (101,247 | ) | (25,685 | ) | ||||
| Total from net realized gain on investments | (490,606 | ) | (109,603 | ) | ||||
| Total distributions | (607,218 | ) | (224,735 | ) | ||||
| Capital Share Transactions: | ||||||||
| Class A | 64,388 | (101,025 | ) | |||||
| Class B | (29,745 | ) | (30,473 | ) | ||||
| Class C | 25,380 | (8 | ) | |||||
| Class I | 177,440 | (41,319 | ) | |||||
| Class R3 | (2,169 | ) | (903 | ) | ||||
| Class R4 | 8,230 | (7,610 | ) | |||||
| Class R5 | 10,343 | 25,534 | ||||||
| Class Y | (365,984 | ) | (267,527 | ) | ||||
| Net decrease from capital share transactions | (112,117 | ) | (423,331 | ) | ||||
| Net Increase in Net Assets | 456,344 | 939,714 | ||||||
| Net Assets: | ||||||||
| Beginning of period | 7,567,968 | 6,628,254 | ||||||
| End of period | $ | 8,024,312 | $ | 7,567,968 | ||||
| Undistributed (distributions in excess of) net investment income | $ | 10,600 | $ | 11,282 | ||||
The accompanying notes are an integral part of these financial statements.
| 11 |
| The Hartford Dividend and Growth Fund |
| Notes to Financial Statements |
| October 31, 2014 |
| (000’s Omitted) |
Organization:
The Hartford Mutual Funds, Inc. (“Company”) is an open-end management investment company comprised of forty-two portfolios. Financial statements for The Hartford Dividend and Growth Fund (the "Fund"), a series of the Company, are included in this report.
The Company is organized under the laws of the State of Maryland and is registered with the Securities and Exchange Commission (“SEC”) under the Investment Company Act of 1940, as amended (“1940 Act”). The Fund is a diversified open-end management investment company. The Fund is an investment company and applies specialized accounting and reporting under Accounting Standards Codification Topic 946, Financial Services - Investment Companies.
Class A shares are sold with a front-end sales charge of up to 5.50%. Class B shares were sold with a contingent deferred sales charge which is assessed on the lesser of the per share net asset value (“NAV”) of the shares at the time of redemption or the original purchase price, and declines from up to 5.00% to zero depending on the period of time the shares are held (see note below regarding the closing of Class B shares). Class C shares are sold with a contingent deferred sales charge of up to 1.00% on shares redeemed within twelve months of purchase. Class I shares are sold without sales charges to certain eligible investors primarily through advisory fee-based wrap programs. Class R3, R4 and R5 shares, which are offered to employer-sponsored retirement plans, and Class Y shares, which are sold to certain eligible institutional investors, are sold without a sales charge. All classes of shares have identical voting, redemption, dividend, liquidation and other rights and the same terms and conditions, with the exceptions that each class may have different expenses, which may affect performance, and that Class B shares automatically convert to Class A shares after 8 years.
No new or additional investments are allowed in Class B shares of the Fund (including investments through any systematic investment plan). Existing shareholders of Class B shares may continue to hold their Class B shares, exchange their Class B shares for Class B shares of another Hartford Fund (as permitted by existing exchange privileges), or redeem their Class B shares as described in the Fund’s prospectus. Reinstatement privileges with respect to Class B shares are set forth in the Fund's prospectus. For investors electing to reinvest capital gains and dividends, any such capital gains or dividends on Class B shares will continue to be reinvested in Class B shares of the Fund. All Class B share attributes, including the 12b-1 fee, contingent deferred sales charge schedule, and conversion to Class A shares, remain unchanged.
Significant Accounting Policies:
The following is a summary of significant accounting policies of the Fund in the preparation of its financial statements, which are in accordance with United States generally accepted accounting principles (“U.S. GAAP”). The preparation of financial statements in accordance with U.S. GAAP may require management to make estimates and assumptions that affect the reported amounts of assets and liabilities and disclosure of contingent assets and liabilities at the date of the financial statements and the reported amounts of increases and decreases in net assets from operations during the reporting period. Actual results could differ from those estimates.
Determination of Net Asset Value – The NAV of each class of the Fund's shares is determined as of the close of regular trading (normally 4:00 p.m. Eastern Time) (the “NYSE Close”) on each day that the New York Stock Exchange (the “Exchange”) is open (“Valuation Date”). Information that becomes known to the Fund after the NAV has been calculated on a particular day will not generally be used to retroactively adjust the NAV determined earlier that day.
Investment Valuation and Fair Value Measurements – For purposes of calculating the NAV, portfolio investments and other assets held by the Fund's portfolio for which market quotes are readily available are valued at market value. Market value is generally determined on the basis of last reported sales prices or official close price. If no sales are reported, market value is based on quotes obtained from a quotation reporting system, established market makers, or independent pricing services. If market prices are not readily available or are deemed unreliable, the Fund will use the fair value of the investment as determined in good faith under policies and procedures established by and under the supervision of the Company's Board of Directors. Market quotes are considered not readily available where there is an absence of current or reliable market-based data (e.g., trade information or indicative market quotes), including where events occur after the close of the relevant market, but prior to the NYSE Close, that materially affect the values of the Fund's portfolio investments or assets. In addition, market quotes are considered not readily available when, due to extraordinary circumstances, the exchanges or markets on which the investments trade do not open for trading for the entire day and no other market prices are available. In addition, prices of foreign equities that are principally traded on certain foreign markets may
| 12 |
| The Hartford Dividend and Growth Fund |
| Notes to Financial Statements – (continued) |
| October 31, 2014 |
| (000’s Omitted) |
be adjusted daily pursuant to a fair value pricing service approved by the Board of Directors in order to reflect an adjustment for the factors occurring after the close of certain foreign markets but before the NYSE Close. Investments that are primarily traded on foreign markets may trade on days that are not business days of the Fund. The value of the foreign investments in which the Fund invests may change on days when a shareholder will not be able to purchase or redeem shares of the Fund. Fair value pricing is subjective in nature and the use of fair value pricing by the Fund may cause the NAV of its shares to differ significantly from the NAV that would have been calculated using market prices at the close of the exchange on which a portfolio investment is primarily traded. There can be no assurance that the Fund could obtain the fair market value assigned to an investment if the Fund were to sell the investment at approximately the time at which the Fund determines its NAV.
Investments valued in currencies other than U.S. dollars are converted to U.S. dollars using exchange rates obtained from independent pricing services for calculation of the NAV. As a result, the NAV of the Fund’s shares may be affected by changes in the value of currencies in relation to the U.S. dollar. The value of investments traded in markets outside the United States or denominated in currencies other than the U.S. dollar may be affected significantly on a day that the NYSE is closed and the market value may change on days when an investor is not able to purchase, redeem or exchange shares of the Fund.
Foreign currency contracts represent agreements to exchange currencies on specific future dates at predetermined rates. Foreign currency contracts are valued using foreign currency exchange rates and forward rates as provided by an independent pricing service on the Valuation Date.
Financial instruments for which prices are not available from an independent pricing service may be valued using market quotations obtained from one or more dealers that make markets in the respective financial instrument in accordance with procedures established by the Company's Board of Directors.
U.S. GAAP defines fair value as the price that the Fund would receive to sell an asset or pay to transfer a liability in an orderly transaction between market participants. The U.S. GAAP fair value measurement standards require disclosure of a fair value hierarchy for each major category of assets and liabilities. Various inputs are used in determining the fair value of the Fund’s investments. These inputs are summarized into three broad hierarchy levels. This hierarchy is based on whether the valuation inputs are observable or unobservable. These levels are:
Level 1 – Quoted prices in active markets for identical investments. Level 1 may include exchange traded instruments, such as domestic equities, some foreign equities, options, futures, mutual funds, exchange traded funds, rights and warrants.
Level 2 – Observable inputs other than Level 1 prices, such as quoted prices for similar investments; quoted prices in markets that are not active; or other inputs that are observable or can be corroborated by observable market data. Level 2 may include debt investments that are traded less frequently than exchange traded instruments and which are valued using independent pricing services; foreign equities, which are principally traded on certain foreign markets and are adjusted daily pursuant to a fair value pricing service in order to reflect an adjustment for the factors occurring after the close of certain foreign markets but before the NYSE Close; senior floating rate interests, which are valued using an aggregate of dealer bids; short-term investments, which are valued at amortized cost; and swaps, which are valued based upon the terms of each swap contract.
Level 3 – Significant unobservable inputs that are supported by limited or no market activity. Level 3 may include financial instruments whose values are determined using indicative market quotes or require significant management judgment or estimation. These unobservable valuation inputs may include estimates for current yields, maturity/duration, prepayment speed, and indicative market quotes for comparable investments along with other assumptions relating to credit quality, collateral value, complexity of the investment structure, general market conditions and liquidity. This category may include investments where trading has been halted or there are certain restrictions on trading. While these investments are priced using unobservable inputs, the valuation of these investments reflects the best available data and management believes the prices are a reasonable representation of exit price.
The Board of Directors of the Company generally reviews and approves the “Procedures for Valuation of Portfolio Securities” at least once a year. These procedures define how investments are to be valued, including the formation and activities of a Valuation Committee. The Valuation Committee is responsible for determining in good faith the fair value of investments when
| 13 |
| The Hartford Dividend and Growth Fund |
| Notes to Financial Statements – (continued) |
| October 31, 2014 |
| (000’s Omitted) |
the value cannot be obtained from primary pricing services or alternative sources or if the valuation of an investment as provided by the primary pricing service or alternative source is believed not to reflect the investment’s fair value as of the Valuation Date. Voting members of the Valuation Committee include the Fund's Treasurer or designee and a Vice President of the investment manager or designee. An Assistant Vice President of the Fund with legal expertise or designee is also included on the Valuation Committee as a non-voting advisory member. In addition, the Fund’s Chief Compliance Officer shall designate a member of the compliance group to attend Valuation Committee meetings as a non-voting resource, to monitor for and provide guidance with respect to compliance with these procedures. Two members of the Valuation Committee or their designees, representing different departments, shall constitute a quorum for purposes of permitting the Valuation Committee to take action. The Valuation Committee will consider all relevant factors in determining an investment’s fair value, and may seek the advice of the Fund’s sub-adviser, knowledgeable brokers, and legal counsel in making such determination. The Valuation Committee reports to the Audit Committee of the Company's Board of Directors. The Audit Committee receives quarterly written reports which include details of all fair-valued investments, including the reason for the fair valuation, and an indication, when possible, of the accuracy of the valuation by disclosing the next available reliable public price quotation or the disposition price of such investments (the “look-back” test). The Board of Directors then must consider for ratification all of the fair value determinations made during the previous quarter.
Valuation levels are not necessarily indicative of the risk associated with investing in such investments. Individual investments within any of the above mentioned asset classes may be assigned a different hierarchical level than those presented above, as individual circumstances dictate.
For additional information, refer to the Investment Valuation Hierarchy Level Summary and the Level 3 roll-forward reconciliation, if applicable, which follow the Schedule of Investments.
Investment Transactions and Investment Income – Investment transactions are recorded as of the trade date (the date the order to buy or sell is executed) for financial reporting purposes. Investments purchased or sold on a when-issued or delayed-delivery basis may be settled a month or more after the trade date. Realized gains and losses are determined on the basis of identified cost.
Dividend income from domestic securities is accrued on the ex-dividend date. Interest income, including amortization of premium, accretion of discounts and additional principal received in-kind in lieu of cash, is accrued on a daily basis.
Foreign Currency Transactions – Assets and liabilities denominated in currencies other than U.S. dollars are translated into U.S. dollars at the exchange rates in effect on the valuation date. Purchases and sales of investments, income and expenses are translated into U.S. dollars at the exchange rates on the dates of such transactions.
The Fund does not isolate that portion of portfolio investment valuation resulting from fluctuations in the foreign currency exchange rates from the fluctuations arising from changes in the market prices of investments held. Exchange rate fluctuations are included with the net realized and unrealized gain or loss on investments in the accompanying financial statements.
Net realized foreign exchange gains or losses arise from sales of foreign currencies and the difference between asset and liability amounts initially stated in foreign currencies and the U.S. dollar value of the amounts actually received or paid. Net unrealized foreign exchange gains or losses arise from changes in the value of other assets and liabilities at the end of the reporting period, resulting from changes in the exchange rates.
Joint Trading Account – The Fund may invest cash balances into a joint trading account that may be invested in one or more repurchase agreements.
Fund Share Valuation and Dividend Distributions to Shareholders – Orders for the Fund’s shares are executed in accordance with the investment instructions of the shareholders. The NAV of the Fund’s shares is determined as of the close of business on each business day of the Exchange. The NAV is determined separately for each class of shares of the Fund by dividing the Fund’s net assets attributable to that class by the number of shares of the class outstanding. Each class of shares offered by the Fund has equal rights as to assets and voting privileges (except that shareholders of a class have exclusive voting rights regarding any matter relating solely to that class of shares). Income and non-class specific expenses are allocated daily to each class on the basis of the relative
| 14 |
| The Hartford Dividend and Growth Fund |
| Notes to Financial Statements – (continued) |
| October 31, 2014 |
| (000’s Omitted) |
net assets of the class. Realized and unrealized gains and losses are allocated daily based on the relative net assets of each class of shares of the Fund.
Orders for the purchase of the Fund’s shares received prior to the close of the Exchange on any day the Exchange is open for business are priced at the NAV determined as of the close of the Exchange. Orders received after the close of the Exchange, or on a day on which the Exchange and/or the Fund is not open for business, are priced at the next determined NAV.
Dividends are declared pursuant to a policy adopted by the Company's Board of Directors based upon the investment performance of the Fund. The policy of the Fund is to pay dividends from net investment income, if any, quarterly and realized gains, if any, at least once a year.
Net investment income, dividends and distributions from net realized gains and capital are determined in accordance with federal income tax regulations, which may differ from U.S. GAAP with respect to character and timing (see Federal Income Taxes: Distributions and Components of Distributable Earnings and Reclassification of Capital Accounts).
Securities and Other Investments:
Repurchase Agreements – A repurchase agreement is an agreement by which a counterparty agrees to sell an investment and agrees to repurchase the investment sold from the buyer at a mutually agreed upon time and price. During the period of the repurchase agreement, the counterparty will deposit cash and or securities in a third party custodial account to serve as collateral. At the time the Fund enters into a repurchase agreement, the value of the underlying collateral, including accrued interest, will be equal to or exceed the value of the repurchase agreement. Repurchase agreements expose the Fund to counterparty risk - that is, the risk that the counterparty will not fulfill its obligations. To minimize counterparty risk, the investments that serve to collateralize the repurchase agreement are held by the Fund’s custodian in book entry or physical form in the custodial account of the Fund or in a third party custodial account. Repurchase agreements are valued at cost plus accrued interest, which approximates fair value. Repurchase agreements have master netting arrangements which allow the Fund to offset amounts owed to a counterparty with amounts owed by the counterparty, including any collateral. Upon an event of default under a master repurchase agreement, the non-defaulting party may close out all transactions traded under such agreement and net amounts owed under each transaction to one net amount payable by one party to the other. Absent an event of default, the master repurchase agreement does not result in an offset of reported amounts of assets and liabilities in the Statement of Assets and Liabilities across transactions between the Fund and the applicable counterparty. The Fund, as shown on the Schedule of Investments, had outstanding repurchase agreements and related collateral as of October 31, 2014.
Illiquid and Restricted Investments – The Fund is permitted to invest up to 15% of its net assets in illiquid investments. Illiquid investments are those that may not be sold or disposed of in the ordinary course of business within seven days, at approximately the price used to determine the Fund’s NAV. The Fund may not be able to sell illiquid investments when its sub-adviser considers it desirable to do so or may have to sell such investments at a price that is lower than the price that could be obtained if the investments were more liquid. A sale of illiquid investments may require more time and may result in higher dealer discounts and other selling expenses than does the sale of those that are liquid. Illiquid investments also may be more difficult to value due to the unavailability of reliable market quotations for such investments, and an investment in them may have an adverse impact on the Fund’s NAV. The Fund may also purchase certain restricted investments that can only be resold to certain qualified investors and may be determined to be liquid pursuant to policies and guidelines established by the Company's Board of Directors. The Fund had no illiquid or restricted investments as of October 31, 2014.
Investments Purchased on a When-Issued or Delayed-Delivery Basis – Delivery and payment for investments that have been purchased by the Fund on a forward commitment, or when-issued or delayed-delivery basis, take place beyond the customary settlement period. The Fund may dispose of or renegotiate a delayed-delivery transaction after it is entered into, and may sell delayed-delivery investments before they are delivered, which may result in a realized gain or loss. During this period, such investments are subject to market fluctuations, and the Fund identifies investments segregated in its records with a value at least equal to the amount of the commitment. The Fund had no when-issued or delayed-delivery investments as of October 31, 2014.
| 15 |
| The Hartford Dividend and Growth Fund |
| Notes to Financial Statements – (continued) |
| October 31, 2014 |
| (000’s Omitted) |
Financial Derivative Instruments:
The following disclosures contain information on how and why the Fund uses derivative instruments, the credit-risk-related contingent features in certain derivative instruments and how derivative instruments affect the Fund’s financial position and results of operations. The location and fair value amounts of these instruments on the Statement of Assets and Liabilities and the realized gains and losses and changes in unrealized gains and losses on the Statement of Operations, each categorized by type of derivative contract, are included in the following Additional Derivative Instrument Information footnote. The derivative instruments outstanding as of year-end are disclosed in the notes to the Schedule of Investments, if applicable. The amounts of realized gains and losses and changes in unrealized gains and losses on derivative instruments during the year are disclosed in the Statement of Operations.
Foreign Currency Contracts – The Fund may enter into foreign currency contracts that obligate the Fund to purchase or sell currencies at specified future dates. Foreign currency contracts are used to hedge the currency exposure associated with some or all of the Fund’s investments and/or as part of an investment strategy. Foreign currency contracts are marked to market daily and the change in value is recorded by the Fund as an unrealized gain or loss. The Fund will record a realized gain or loss when the foreign currency contract is settled.
Foreign currency contracts involve elements of market risk in excess of the amounts reflected in the Statement of Assets and Liabilities. In addition, risks may arise upon entering into these contracts from the potential inability of the counterparties to meet the terms of the contracts and from unanticipated movements in the value of the foreign currencies relative to the U.S. dollar. The Fund had no outstanding foreign currency contracts as of October 31, 2014.
Additional Derivative Instrument Information:
The volume of derivative activity was minimal during the year ended October 31, 2014.
The Effect of Derivative Instruments on the Statement of Operations for the year ended October 31, 2014:
| Risk Exposure Category | ||||||||||||||||||||||||||||
Interest
Rate | Foreign | Credit | Equity | Commodity | Other | Total | ||||||||||||||||||||||
| Realized Gain on Derivatives Recognized as a Result of Operations: | ||||||||||||||||||||||||||||
| Net realized gain on foreign currency contracts | $ | — | $ | 1 | $ | — | $ | — | $ | — | $ | — | $ | 1 | ||||||||||||||
| Total | $ | — | $ | 1 | $ | — | $ | — | $ | — | $ | — | $ | 1 | ||||||||||||||
Principal Risks:
The Fund may be exposed to counterparty risk, or the risk that an institution or other entity with which the Fund has unsettled or open transactions will default.
If the Fund invests directly in foreign currencies or in securities that trade in, and receive revenues in, foreign currencies, or in derivatives that provide exposure to foreign currencies, it will be subject to the risk that those currencies will decline in value relative to the base currency (U.S. dollars) of the Fund, or, in the case of hedging positions, that the Fund’s base currency will decline in value relative to the currency being hedged. Currency rates in foreign countries may fluctuate significantly over short periods of time for a number of reasons, including changes in interest rates, intervention (or the failure to intervene) by U.S. or foreign governments, central banks or supranational entities, such as the International Monetary Fund, or by the imposition of currency controls or other political developments in the United States or abroad. As a result, the Fund’s investments in foreign currency denominated securities may reduce the returns of the Fund. The market values of equity securities, such as common stocks and preferred stocks, or equity related investments, such as futures and options, may decline due to general market conditions which are not specifically related to a particular company, such as real or perceived adverse economic conditions, changes in the general outlook for corporate earnings, changes in interest or currency rates or adverse investor sentiment generally. The market value of equity securities may also decline due to factors which affect a particular industry or industries, such as labor shortages or increased production costs and competitive conditions within an industry. Equity securities and equity related investments generally have greater market price volatility than fixed income securities.
| 16 |
| The Hartford Dividend and Growth Fund |
| Notes to Financial Statements – (continued) |
| October 31, 2014 |
| (000’s Omitted) |
Federal Income Taxes:
Federal Income Taxes – For federal income tax purposes, the Fund intends to continue to qualify as a Regulated Investment Company ("RIC") under Subchapter M of the Internal Revenue Code (“IRC”) by distributing substantially all of its taxable net investment income and net realized capital gains to its shareholders and otherwise complying with the requirements of the IRC. The Fund has distributed substantially all of its income and capital gains in prior years, if applicable, and intends to distribute substantially all of its income and capital gains during the calendar year ending December 31, 2014. Accordingly, no provision for federal income or excise taxes has been made in the accompanying financial statements. Distributions from short-term capital gains are treated as ordinary income distributions for federal income tax purposes.
Net Investment Income (Loss), Net Realized Gains (Losses) and Distributions – Net investment income (loss) and net realized gains (losses) may differ for financial statement and tax purposes primarily because of losses deferred due to wash sale adjustments, foreign currency gains and losses, adjustments related to Passive Foreign Investment Companies ("PFICs"), Real Estate Investment Trusts ("REITs"), RICs, certain derivatives and partnerships. The character of distributions made during the year from net investment income or net realized gains may differ from their ultimate characterization for federal income tax purposes. Also, due to the timing of dividend distributions, the fiscal year in which amounts are distributed may differ from the year that the income or realized gains (losses) were recorded by the Fund.
Distributions and Components of Distributable Earnings – The tax character of distributions paid by the Fund for the periods indicated is as follows (as adjusted for dividends payable, if applicable):
| For the Year Ended October 31, 2014 | For the Year Ended October 31, 2013 | |||||||
| Ordinary Income | $ | 151,446 | $ | 115,132 | ||||
| Long-Term Capital Gains ‡ | 455,772 | 109,603 | ||||||
| ‡ | The Fund designates these distributions as long-term capital gain dividends pursuant to IRC Sec. 852(b)(3)(C). |
As of October 31, 2014, the Fund’s components of distributable earnings (deficit) on a tax basis are as follows:
| Amount | ||||
| Undistributed Ordinary Income | $ | 56,738 | ||
| Undistributed Long-Term Capital Gain | 629,492 | |||
| Accumulated Capital and Other Losses* | (32,947 | ) | ||
| Unrealized Appreciation† | 2,341,791 | |||
| Total Accumulated Earnings | $ | 2,995,074 | ||
| * | The Fund has capital loss carryforwards that are identified in the Capital Loss Carryforward note that follows. |
| † | Differences between book-basis and tax-basis unrealized appreciation (depreciation) may be attributable to the losses deferred due to wash sale adjustments, foreign currency gains and losses, adjustments related to PFICs, REITs, RICs, certain derivatives and partnerships. |
| 17 |
| The Hartford Dividend and Growth Fund |
| Notes to Financial Statements – (continued) |
| October 31, 2014 |
| (000’s Omitted) |
Reclassification of Capital Accounts – The Fund may record reclassifications in its capital accounts. These reclassifications have no impact on the total net assets of the Fund. The reclassifications are a result of permanent differences between U.S. GAAP and tax accounting for such items as foreign currency, PFICs, expiration or utilization of capital loss carryforwards or net operating losses. Adjustments are made to reflect the impact these items have on current and future distributions to shareholders. Therefore, the source of the Fund’s distributions may be shown in the accompanying Statement of Changes in Net Assets as from undistributed net investment income, from accumulated net realized gains on investments or from capital depending on the type of book and tax differences that exist. For the year ended October 31, 2014, the Fund recorded reclassifications to increase (decrease) the accounts listed below:
| Amount | ||||
| Undistributed Net Investment Income (Loss) | $ | (181 | ) | |
| Accumulated Net Realized Gain (Loss) | 181 | |||
Capital Loss Carryforward – On December 22, 2010, the Regulated Investment Company Modernization Act of 2010 (the “Act”) was enacted, which made changes to the capital loss carryforward rules. The changes are effective for taxable years beginning after the date of enactment. Under the Act, funds are permitted to carry forward capital losses for an unlimited period. However, any losses incurred during those future taxable years will be required to be utilized prior to the losses incurred in pre-enactment taxable years, which carry an expiration date. As a result of this ordering rule, pre-enactment capital loss carryforwards may be more likely to expire unused. Additionally, post-enactment capital loss carryforwards retain their character as either short-term or long-term capital losses rather than being considered all short-term as permitted under prior regulation.
At October 31, 2014 (tax year end), the Fund had capital loss carryforwards for U.S. federal income tax purposes as follows:
| Year of Expiration | Amount | |||
| 2015 | $ | 13,936 | ||
| 2016 | 19,011 | |||
| Total | $ | 32,947 | ||
As a result of mergers in the Fund, certain provisions in the IRC may limit the future utilization of capital losses. During the year ended October 31, 2014, the Fund utilized $19,011 of prior year capital loss carryforwards.
Accounting for Uncertainty in Income Taxes – The Fund has adopted financial reporting rules that require the Fund to analyze all open tax years, as defined by the statute of limitations, for all major jurisdictions. Generally, tax authorities can examine all tax returns filed for the last three years. The Fund does not have an examination in progress.
The Fund has reviewed all open tax years and major jurisdictions and concluded that these financial reporting rules had no effect on the Fund’s financial position or results of operations. There is no tax liability resulting from unrecognized tax benefits relating to uncertain income tax positions taken or expected to be taken on the tax return for the fiscal year ended October 31, 2014. The Fund is also not aware of any tax positions for which it is reasonably possible that the total amounts of unrecognized tax benefits will significantly change in the next twelve months.
Expenses:
Investment Management Agreement – Hartford Funds Management Company, LLC ("HFMC") serves as the Fund’s investment manager pursuant to an Investment Management Agreement with the Company. HFMC is an indirect wholly owned subsidiary of The Hartford Financial Services Group, Inc. ("The Hartford"). The investment manager has overall investment supervisory responsibility for the Fund. In addition, the investment manager provides administrative personnel, services, equipment, facilities and office space for proper operation of the Fund. HFMC has contracted with Wellington Management Company, LLP ("Wellington Management") under a sub-advisory agreement for the provision of day-to-day investment management services to the Fund in accordance with the Fund’s investment objective and policies. The Fund pays a fee to the investment manager, a portion of which may be used to compensate Wellington Management.
| 18 |
| The Hartford Dividend and Growth Fund |
| Notes to Financial Statements – (continued) |
| October 31, 2014 |
| (000’s Omitted) |
The schedule below reflects the rates of compensation paid to the investment manager for investment management services rendered as of October 31, 2014; the rates are accrued daily and paid monthly:
| Average Daily Net Assets | Annual Fee |
| On first $500 million | 0.7500% |
| On next $500 million | 0.6500% |
| On next $1.5 billion | 0.6000% |
| On next $2.5 billion | 0.5950% |
| On next $5 billion | 0.5900% |
| Over $10 billion | 0.5850% |
Accounting Services Agreement – Pursuant to the Fund Accounting Agreement between HFMC and the Company, on behalf of the Fund, HFMC provides accounting services to the Fund and receives monthly compensation based on the Fund’s average daily net assets at the rates set forth below. The Fund’s accounting services fees are accrued daily and paid monthly.
| Average Daily Net Assets | Annual Fee |
| On first $5 billion | 0.014% |
| On next $5 billion | 0.012% |
| Over $10 billion | 0.010% |
Operating Expenses – Allocable expenses incurred by the Company are allocated to each Fund and allocated to classes within the Fund in proportion to the average daily net assets of the Fund and each class, except where allocation of certain expenses is more fairly made directly to the Fund or to specific classes within a Fund. As of October 31, 2014, HFMC contractually limited the total operating expenses of this Fund, exclusive of taxes, interest expense, brokerage commissions, acquired fund fees and expenses and extraordinary expenses, through February 28, 2015 as follows:
| Class A | Class B | Class C | Class I | Class R3 | Class R4 | Class R5 | Class Y |
| 1.25% | NA | NA | 1.00% | 1.35% | 1.05% | 0.75% | NA |
Fees Paid Indirectly – The Fund has entered into agreements with State Street Global Markets, LLC and Russell Implementation Services, Inc. to partially recapture non-discounted trade commissions. Such rebates are used to pay a portion of the Fund's expenses. For the year ended October 31, 2014, this amount, if any, is included in the Statement of Operations.
The ratio of expenses to average net assets in the accompanying financial highlights excludes the reduction in expenses related to fees paid indirectly. The annualized expense ratio after waivers for the period listed below reflecting the reduction for fees paid indirectly is as follows:
| Year Ended October 31, 2014 | ||||
| Class A | 1.02 | % | ||
| Class B | 1.94 | |||
| Class C | 1.76 | |||
| Class I | 0.81 | |||
| Class R3 | 1.35 | |||
| Class R4 | 1.04 | |||
| Class R5 | 0.74 | |||
| Class Y | 0.64 | |||
Distribution and Service Plan for Class A, B, C, R3 and R4 Shares – Hartford Funds Distributors, LLC ("HFD"), an indirect wholly owned subsidiary of The Hartford, is the principal underwriter and distributor of the Fund. HFD is engaged in distribution activities, which include marketing and distribution of shares through broker/dealers, financing distribution costs and
| 19 |
| The Hartford Dividend and Growth Fund |
| Notes to Financial Statements – (continued) |
| October 31, 2014 |
| (000’s Omitted) |
maintaining financial books and records. For the year ended October 31, 2014, HFD received front-end load sales charges of $7,013 and contingent deferred sales charges of $63 from the Fund.
The Fund has adopted a Distribution and Service Plan in accordance with Rule 12b-1 of the 1940 Act to compensate the distributor (HFD) for activities intended to result in the sale and distribution of Class A, B, C, R3 and R4 shares and for providing services for shareholders. The Rule 12b-1 plan applicable to Class A shares of the Fund provides for payment of a Rule 12b-1 fee of 0.25% of average daily net assets. Some or all of the fee may be used for shareholder servicing expenses with the remainder used for distribution expenses. Under the Class B Plan, the Fund pays the distributor 1.00% of the average daily net assets of Class B shares that are outstanding for 8 years or less, 0.25% of which is a fee for services provided to existing shareholders with the remainder used for distribution expenses. Some or the entire Rule 12b-1 fee for Class B shares may be remitted to broker/dealers for distribution and/or shareholder account services. After eight years, Class B shares convert to Class A shares. Upon conversion to Class A shares, the Class A plan described above will apply to those shares. Under the Class C Plan, the Fund pays the distributor 1.00% of the average daily net assets of Class C shares outstanding, 0.25% of which is intended as a fee for services provided to existing shareholders with the remainder used for distribution expenses. For Class C shares, some or the entire fee may be remitted to broker/dealers for distribution and/or shareholder account services. Class R3 shares have a distribution fee of 0.50% of average daily net assets and Class R4 shares have a distribution fee of 0.25% of average daily net assets. For Class R3 and R4 shares, some or the entire fee may be remitted to broker/dealers for distribution and/or shareholder account services. The Fund’s 12b-1 fees are accrued daily and paid monthly or at such other intervals as the Board of Directors may determine.
Other Related Party Transactions – Certain officers of the Fund are directors and/or officers of HFMC and/or The Hartford or its subsidiaries. For the year ended October 31, 2014, a portion of the Fund’s Chief Compliance Officer’s compensation was paid by all of the investment companies in the Hartford fund complex. The portion allocated to the Fund, as represented in other expenses on the Statement of Operations, was in the amount of $14. Hartford Administrative Services Company (“HASCO”), an indirect wholly-owned subsidiary of The Hartford, provides transfer agent services to the Fund. HASCO has contractually agreed to reimburse any portion of the transfer agency fees over 0.30% of average daily net assets per fiscal year for each class. Any transfer agency fee reimbursement is determined before considering the contractual operating expense limitation. For providing such services, HASCO is compensated on a per account basis that varies by account type, except with respect to Class Y, for which it is compensated based on average daily net assets. The amount paid to HASCO and any related contractual reimbursement amounts, if applicable, can be found in the Statement of Operations. These fees are accrued daily and paid monthly.
Administrative services fees are paid to HASCO for third-party recordkeeping services that are payable as a percentage of net assets in the amount of up to 0.20%, 0.15% and 0.10% for Classes R3, R4 and R5 shares, respectively. The total administrative services fees are shown on the Statement of Operations. These fees are accrued daily and paid monthly.
Affiliate Holdings:
As of October 31, 2014, the Fund's shares were owned in aggregate by affiliated fund of funds. Therefore, the Fund may experience relatively large purchases or redemptions of its shares from these affiliated fund of funds. Affiliated fund of funds owned shares in the Fund as follows:
| Percentage of Fund | ||||
| Class Y | 9 | % | ||
| 20 |
| The Hartford Dividend and Growth Fund |
| Notes to Financial Statements – (continued) |
| October 31, 2014 |
| (000’s Omitted) |
Investment Transactions:
For the year ended October 31, 2014, the cost of purchases and proceeds from sales of investment securities (excluding short-term investments) were as follows:
| Excluding U.S. Government Obligations | U.S. Government Obligations | Total | ||||||||||
| Cost of Purchases | $ | 1,776,699 | $ | — | $ | 1,776,699 | ||||||
| Sales Proceeds | 2,394,196 | — | 2,394,196 | |||||||||
Capital Share Transactions:
The following information is for the year ended October 31, 2014, and the year ended October 31, 2013:
For the Year Ended October 31, 2014 | For the Year Ended October 31, 2013 | |||||||||||||||||||||||||||||||
Shares Sold | Shares
Issued | Shares | Net Increase (Decrease) of Shares | Shares | Shares
Issued | Shares | Net Increase (Decrease) of Shares | |||||||||||||||||||||||||
| Class A | ||||||||||||||||||||||||||||||||
| Shares | 12,008 | 11,233 | (20,081 | ) | 3,160 | 13,591 | 4,525 | (22,497 | ) | (4,381 | ) | |||||||||||||||||||||
| Amount | $ | 308,252 | $ | 273,099 | $ | (516,963 | ) | $ | 64,388 | $ | 312,680 | $ | 96,559 | $ | (510,264 | ) | $ | (101,025 | ) | |||||||||||||
| Class B | ||||||||||||||||||||||||||||||||
| Shares | 52 | 278 | (1,488 | ) | (1,158 | ) | 157 | 118 | (1,621 | ) | (1,346 | ) | ||||||||||||||||||||
| Amount | $ | 1,307 | $ | 6,572 | $ | (37,624 | ) | $ | (29,745 | ) | $ | 3,540 | $ | 2,398 | $ | (36,411 | ) | $ | (30,473 | ) | ||||||||||||
| Class C | ||||||||||||||||||||||||||||||||
| Shares | 2,089 | 1,228 | (2,229 | ) | 1,088 | 2,044 | 413 | (2,464 | ) | (7 | ) | |||||||||||||||||||||
| Amount | $ | 52,441 | $ | 29,000 | $ | (56,061 | ) | $ | 25,380 | $ | 46,181 | $ | 8,472 | $ | (54,661 | ) | $ | (8 | ) | |||||||||||||
| Class I | ||||||||||||||||||||||||||||||||
| Shares | 14,965 | 5,323 | (13,146 | ) | 7,142 | 15,394 | 2,201 | (19,345 | ) | (1,750 | ) | |||||||||||||||||||||
| Amount | $ | 385,019 | $ | 129,253 | $ | (336,832 | ) | $ | 177,440 | $ | 351,414 | $ | 47,001 | $ | (439,734 | ) | $ | (41,319 | ) | |||||||||||||
| Class R3 | ||||||||||||||||||||||||||||||||
| Shares | 563 | 248 | (874 | ) | (63 | ) | 722 | 94 | (854 | ) | (38 | ) | ||||||||||||||||||||
| Amount | $ | 14,515 | $ | 6,058 | $ | (22,742 | ) | $ | (2,169 | ) | $ | 16,567 | $ | 2,009 | $ | (19,479 | ) | $ | (903 | ) | ||||||||||||
| Class R4 | ||||||||||||||||||||||||||||||||
| Shares | 1,404 | 305 | (1,370 | ) | 339 | 1,663 | 119 | (2,104 | ) | (322 | ) | |||||||||||||||||||||
| Amount | $ | 36,330 | $ | 7,518 | $ | (35,618 | ) | $ | 8,230 | $ | 38,329 | $ | 2,580 | $ | (48,519 | ) | $ | (7,610 | ) | |||||||||||||
| Class R5 | ||||||||||||||||||||||||||||||||
| Shares | 2,252 | 423 | (2,215 | ) | 460 | 3,249 | 155 | (2,385 | ) | 1,019 | ||||||||||||||||||||||
| Amount | $ | 57,856 | $ | 10,493 | $ | (58,006 | ) | $ | 10,343 | $ | 76,066 | $ | 3,421 | $ | (53,953 | ) | $ | 25,534 | ||||||||||||||
| Class Y | ||||||||||||||||||||||||||||||||
| Shares | 4,534 | 5,064 | (23,033 | ) | (13,435 | ) | 8,116 | 2,484 | (21,917 | ) | (11,317 | ) | ||||||||||||||||||||
| Amount | $ | 117,995 | $ | 125,197 | $ | (609,176 | ) | $ | (365,984 | ) | $ | 183,802 | $ | 53,965 | $ | (505,294 | ) | $ | (267,527 | ) | ||||||||||||
| Total | ||||||||||||||||||||||||||||||||
| Shares | 37,867 | 24,102 | (64,436 | ) | (2,467 | ) | 44,936 | 10,109 | (73,187 | ) | (18,142 | ) | ||||||||||||||||||||
| Amount | $ | 973,715 | $ | 587,190 | $ | (1,673,022 | ) | $ | (112,117 | ) | $ | 1,028,579 | $ | 216,405 | $ | (1,668,315 | ) | $ | (423,331 | ) | ||||||||||||
The following reflects the conversion of Class B shares into Class A shares (reflected as Class A shares sold) for the year ended October 31, 2014, and the year ended October 31, 2013:
| Shares | Dollars | |||||||
| For the Year Ended October 31, 2014 | 348 | $ | 8,954 | |||||
| For the Year Ended October 31, 2013 | 375 | $ | 8,597 | |||||
Line of Credit:
The Fund is one of several Hartford Funds that participate in a $500 million committed revolving line of credit facility. The facility is to be used for temporary or emergency purposes. Under the arrangement, the funds are required to own securities having a market value in
| 21 |
| The Hartford Dividend and Growth Fund |
| Notes to Financial Statements – (continued) |
| October 31, 2014 |
| (000’s Omitted) |
excess of 300% of the total bank borrowings. The interest rate on borrowings varies depending on the nature of the loan. The facility also requires a fee to be paid based on the amount of the commitment. This commitment fee is allocated to all the funds participating in the line of credit based on the average net assets of the funds. During the year ended October 31, 2014, the Fund did not have any borrowings under this facility.
Pending Legal Proceedings:
On February 25, 2011, Jennifer L. Kasilag, Louis Mellinger, Judith M. Menendez, Jacqueline M. Robinson, and Linda A. Russell filed a derivative lawsuit against Hartford Investment Financial Services, LLC (“HIFSCO”) (now known as HFD) on behalf of six Hartford retail mutual funds in the United States District Court for the District of New Jersey, alleging that HIFSCO received excessive advisory and distribution fees in violation of its statutory fiduciary duty under Section 36(b) of the 1940 Act when serving as investment manager and principal underwriter, respectively, to the Hartford retail mutual funds. Although this action was purportedly filed on behalf of certain of the Hartford Funds, none of the Hartford Funds is itself a defendant to the suit. HIFSCO moved to dismiss and, in September 2011, the motion was granted in part and denied in part, with leave to amend the complaint. In November 2011, plaintiffs filed an amended complaint on behalf of certain Hartford retail mutual funds, The Hartford Global Health Fund (now known as The Hartford Healthcare Fund), The Hartford Conservative Allocation Fund, The Hartford Growth Opportunities Fund, The Hartford Inflation Plus Fund, The Hartford Advisers Fund (now known as The Hartford Balanced Fund), and The Hartford Capital Appreciation Fund. Plaintiffs seek to rescind the investment management agreements and distribution plans between HIFSCO and these funds and to recover the total fees charged thereunder or, in the alternative, to recover any improper compensation HIFSCO received, in addition to lost earnings. HIFSCO filed a partial motion to dismiss the amended complaint and, in December 2012, the court dismissed without prejudice the claims regarding distribution fees and denied the motion with respect to the advisory fees claims. HIFSCO disputes the allegations and intends to defend vigorously.
In March 2014, the plaintiffs filed a new complaint that added as new plaintiffs The Hartford Floating Rate Fund and The Hartford Small Company Fund and named as a defendant HFMC, which assumed the role as investment manager to the funds as of January 2013. HFMC and HIFSCO dispute the allegations and intend to defend vigorously.
No accrual for litigation relating to this matter has been recorded in the financial statements of the Fund because the Fund is not party to the suit.
Indemnifications:
Under the Company's organizational documents, the Company shall indemnify its officers and directors to the full extent required or permitted under Maryland General Corporation Law and the federal securities laws. In addition, the Company, on behalf of the Fund, may enter into contracts that contain a variety of indemnifications. The Company's maximum exposure under these arrangements is unknown. However, as of the date of these financial statements, the Company has not had prior claims or losses pursuant to these contracts and expects the risk of loss to be remote.
Subsequent Events:
At the August 5-6, 2014 meeting, the Board of Directors approved the creation of Class R6 shares for the Fund. Class R6 shares launched on November 7, 2014. In connection with the launch of the Class R6 shares, an updated prospectus, dated November 7, 2014, and Statement of Additional Information, dated March 1, 2014, as amended November 7, 2014, for the Fund were filed with the U.S. Securities and Exchange Commission.
Effective December 1, 2014, pursuant to a sub-transfer agency agreement between HASCO and Boston Financial Data Services, Inc. (“BFDS”), HASCO has delegated certain transfer agent, dividend disbursing agent and shareholder servicing agent functions to BFDS. The costs and expenses of such delegation are borne by HASCO, not by the Fund.
| 22 |
| The Hartford Dividend and Growth Fund |
| Financial Highlights |
| - Selected Per-Share Data - (A) | - Ratios and Supplemental Data - | |||||||||||||||||||||||||||||||||||||||||||||||||||
Class | Net Asset | Net | Net | Total from | Dividends | Distribu- | Total | Net
Asset | Total | Net Assets | Ratio of | Ratio of | Ratio of | |||||||||||||||||||||||||||||||||||||||
| For the Year Ended October 31, 2014 | ||||||||||||||||||||||||||||||||||||||||||||||||||||
| A | $ | 25.28 | $ | 0.36 | $ | 3.43 | $ | 3.79 | $ | (0.36 | ) | $ | (1.66 | ) | $ | (2.02 | ) | $ | 27.05 | 16.01 | % | $ | 3,780,786 | 1.02 | % | 1.02 | % | 1.40 | % | |||||||||||||||||||||||
| B | 24.88 | 0.13 | 3.35 | 3.48 | (0.11 | ) | (1.66 | ) | (1.77 | ) | 26.59 | 14.91 | 74,126 | 1.96 | 1.94 | 0.50 | ||||||||||||||||||||||||||||||||||||
| C | 24.75 | 0.16 | 3.35 | 3.51 | (0.18 | ) | (1.66 | ) | (1.84 | ) | 26.42 | 15.12 | 467,932 | 1.77 | 1.77 | 0.65 | ||||||||||||||||||||||||||||||||||||
| I | 25.20 | 0.41 | 3.42 | 3.83 | (0.42 | ) | (1.66 | ) | (2.08 | ) | 26.95 | 16.22 | 1,883,434 | 0.81 | 0.81 | 1.60 | ||||||||||||||||||||||||||||||||||||
| R3 | 25.49 | 0.28 | 3.45 | 3.73 | (0.27 | ) | (1.66 | ) | (1.93 | ) | 27.29 | 15.61 | 91,839 | 1.35 | 1.35 | 1.07 | ||||||||||||||||||||||||||||||||||||
| R4 | 25.60 | 0.36 | 3.47 | 3.83 | (0.35 | ) | (1.66 | ) | (2.01 | ) | 27.42 | 15.98 | 159,018 | 1.04 | 1.04 | 1.37 | ||||||||||||||||||||||||||||||||||||
| R5 | 25.66 | 0.44 | 3.48 | 3.92 | (0.43 | ) | (1.66 | ) | (2.09 | ) | 27.49 | 16.32 | 226,236 | 0.74 | 0.74 | 1.68 | ||||||||||||||||||||||||||||||||||||
| Y | 25.67 | 0.47 | 3.48 | 3.95 | (0.46 | ) | (1.66 | ) | (2.12 | ) | 27.50 | 16.42 | 1,340,941 | 0.64 | 0.64 | 1.81 | ||||||||||||||||||||||||||||||||||||
| For the Year Ended October 31, 2013 | ||||||||||||||||||||||||||||||||||||||||||||||||||||
| A | $ | 20.87 | $ | 0.36 | $ | 4.75 | $ | 5.11 | $ | (0.35 | ) | $ | (0.35 | ) | $ | (0.70 | ) | $ | 25.28 | 25.17 | % | $ | 3,454,165 | 1.05 | % | 1.05 | % | 1.57 | % | |||||||||||||||||||||||
| B | 20.54 | 0.16 | 4.68 | 4.84 | (0.15 | ) | (0.35 | ) | (0.50 | ) | 24.88 | 24.08 | 98,179 | 2.00 | 1.95 | 0.71 | ||||||||||||||||||||||||||||||||||||
| C | 20.45 | 0.19 | 4.65 | 4.84 | (0.19 | ) | (0.35 | ) | (0.54 | ) | 24.75 | 24.26 | 411,405 | 1.79 | 1.79 | 0.83 | ||||||||||||||||||||||||||||||||||||
| I | 20.80 | 0.41 | 4.74 | 5.15 | (0.40 | ) | (0.35 | ) | (0.75 | ) | 25.20 | 25.48 | 1,581,081 | 0.83 | 0.83 | 1.79 | ||||||||||||||||||||||||||||||||||||
| R3 | 21.04 | 0.29 | 4.80 | 5.09 | (0.29 | ) | (0.35 | ) | (0.64 | ) | 25.49 | 24.79 | 87,399 | 1.35 | 1.35 | 1.27 | ||||||||||||||||||||||||||||||||||||
| R4 | 21.12 | 0.37 | 4.82 | 5.19 | (0.36 | ) | (0.35 | ) | (0.71 | ) | 25.60 | 25.21 | 139,811 | 1.05 | 1.05 | 1.58 | ||||||||||||||||||||||||||||||||||||
| R5 | 21.17 | 0.43 | 4.83 | 5.26 | (0.42 | ) | (0.35 | ) | (0.77 | ) | 25.66 | 25.57 | 199,409 | 0.75 | 0.75 | 1.85 | ||||||||||||||||||||||||||||||||||||
| Y | 21.18 | 0.46 | 4.83 | 5.29 | (0.45 | ) | (0.35 | ) | (0.80 | ) | 25.67 | 25.68 | 1,596,519 | 0.65 | 0.65 | 1.99 | ||||||||||||||||||||||||||||||||||||
| For the Year Ended October 31, 2012 (D) | ||||||||||||||||||||||||||||||||||||||||||||||||||||
| A | $ | 18.61 | $ | 0.34 | $ | 2.26 | $ | 2.60 | $ | (0.34 | ) | $ | – | $ | (0.34 | ) | $ | 20.87 | 14.07 | % | $ | 2,942,844 | 1.08 | % | 1.08 | % | 1.69 | % | ||||||||||||||||||||||||
| B | 18.32 | 0.17 | 2.21 | 2.38 | (0.16 | ) | – | (0.16 | ) | 20.54 | 13.03 | 108,710 | 2.02 | 1.95 | 0.84 | |||||||||||||||||||||||||||||||||||||
| C | 18.25 | 0.18 | 2.22 | 2.40 | (0.20 | ) | – | (0.20 | ) | 20.45 | 13.20 | 340,069 | 1.82 | 1.82 | 0.94 | |||||||||||||||||||||||||||||||||||||
| I | 18.56 | 0.40 | 2.23 | 2.63 | (0.39 | ) | – | (0.39 | ) | 20.80 | 14.30 | 1,341,707 | 0.81 | 0.81 | 1.96 | |||||||||||||||||||||||||||||||||||||
| R3 | 18.76 | 0.28 | 2.29 | 2.57 | (0.29 | ) | – | (0.29 | ) | 21.04 | 13.77 | 72,926 | 1.36 | 1.35 | 1.40 | |||||||||||||||||||||||||||||||||||||
| R4 | 18.84 | 0.34 | 2.29 | 2.63 | (0.35 | ) | – | (0.35 | ) | 21.12 | 14.04 | 122,160 | 1.05 | 1.05 | 1.68 | |||||||||||||||||||||||||||||||||||||
| R5 | 18.88 | 0.39 | 2.30 | 2.69 | (0.40 | ) | – | (0.40 | ) | 21.17 | 14.39 | 142,940 | 0.75 | 0.75 | 1.99 | |||||||||||||||||||||||||||||||||||||
| Y | 18.88 | 0.41 | 2.31 | 2.72 | (0.42 | ) | – | (0.42 | ) | 21.18 | 14.55 | 1,556,898 | 0.65 | 0.65 | 2.08 | |||||||||||||||||||||||||||||||||||||
| For the Year Ended October 31, 2011 | ||||||||||||||||||||||||||||||||||||||||||||||||||||
| A | $ | 17.93 | $ | 0.27 | $ | 0.67 | $ | 0.94 | $ | (0.26 | ) | $ | – | $ | (0.26 | ) | $ | 18.61 | 5.22 | % | $ | 2,791,444 | 1.08 | % | 1.08 | % | 1.42 | % | ||||||||||||||||||||||||
| B | 17.64 | 0.10 | 0.66 | 0.76 | (0.08 | ) | – | (0.08 | ) | 18.32 | 4.32 | 137,071 | 2.01 | 1.96 | 0.55 | |||||||||||||||||||||||||||||||||||||
| C | 17.58 | 0.13 | 0.66 | 0.79 | (0.12 | ) | – | (0.12 | ) | 18.25 | 4.49 | 309,846 | 1.83 | 1.83 | 0.68 | |||||||||||||||||||||||||||||||||||||
| I | 17.87 | 0.32 | 0.68 | 1.00 | (0.31 | ) | – | (0.31 | ) | 18.56 | 5.60 | 1,428,333 | 0.80 | 0.80 | 1.69 | |||||||||||||||||||||||||||||||||||||
| R3 | 18.08 | 0.22 | 0.67 | 0.89 | (0.21 | ) | – | (0.21 | ) | 18.76 | 4.94 | 57,684 | 1.37 | 1.35 | 1.14 | |||||||||||||||||||||||||||||||||||||
| R4 | 18.14 | 0.28 | 0.69 | 0.97 | (0.27 | ) | – | (0.27 | ) | 18.84 | 5.32 | 79,535 | 1.06 | 1.05 | 1.43 | |||||||||||||||||||||||||||||||||||||
| R5 | 18.18 | 0.34 | 0.68 | 1.02 | (0.32 | ) | – | (0.32 | ) | 18.88 | 5.62 | 101,281 | 0.76 | 0.75 | 1.75 | |||||||||||||||||||||||||||||||||||||
| Y | 18.18 | 0.36 | 0.68 | 1.04 | (0.34 | ) | – | (0.34 | ) | 18.88 | 5.71 | 1,111,199 | 0.66 | 0.66 | 1.84 | |||||||||||||||||||||||||||||||||||||
See Portfolio Turnover information on the next page.
| 23 |
| The Hartford Dividend and Growth Fund |
| Financial Highlights – (continued) |
| - Selected Per-Share Data - (A) | - Ratios and Supplemental Data - | |||||||||||||||||||||||||||||||||||||||||||||||||||
Class | Net Asset | Net | Net | Total from | Dividends | Distribu- | Total | Net
Asset | Total | Net Assets | Ratio of | Ratio of | Ratio of | |||||||||||||||||||||||||||||||||||||||
| For the Year Ended October 31, 2010 (D) | ||||||||||||||||||||||||||||||||||||||||||||||||||||
| A | $ | 16.03 | $ | 0.25 | $ | 1.90 | $ | 2.15 | $ | (0.25 | ) | $ | – | $ | (0.25 | ) | $ | 17.93 | 13.46 | % | $ | 2,850,636 | 1.11 | % | 1.11 | % | 1.46 | % | ||||||||||||||||||||||||
| B | 15.76 | 0.11 | 1.86 | 1.97 | (0.09 | ) | – | (0.09 | ) | 17.64 | 12.54 | 182,506 | 2.02 | 1.97 | 0.63 | |||||||||||||||||||||||||||||||||||||
| C | 15.72 | 0.12 | 1.86 | 1.98 | (0.12 | ) | – | (0.12 | ) | 17.58 | 12.65 | 314,729 | 1.85 | 1.85 | 0.71 | |||||||||||||||||||||||||||||||||||||
| I | 15.98 | 0.29 | 1.90 | 2.19 | (0.30 | ) | – | (0.30 | ) | 17.87 | 13.78 | 1,129,059 | 0.82 | 0.82 | 1.71 | |||||||||||||||||||||||||||||||||||||
| R3 | 16.18 | 0.19 | 1.93 | 2.12 | (0.22 | ) | – | (0.22 | ) | 18.08 | 13.15 | 33,933 | 1.39 | 1.38 | 1.06 | |||||||||||||||||||||||||||||||||||||
| R4 | 16.22 | 0.25 | 1.93 | 2.18 | (0.26 | ) | – | (0.26 | ) | 18.14 | 13.51 | 57,684 | 1.07 | 1.06 | 1.46 | |||||||||||||||||||||||||||||||||||||
| R5 | 16.24 | 0.29 | 1.96 | 2.25 | (0.31 | ) | – | (0.31 | ) | 18.18 | 13.93 | 65,379 | 0.78 | 0.78 | 0.81 | |||||||||||||||||||||||||||||||||||||
| Y | 16.25 | 0.32 | 1.93 | 2.25 | (0.32 | ) | – | (0.32 | ) | 18.18 | 13.96 | 1,018,263 | 0.67 | 0.67 | 1.88 | |||||||||||||||||||||||||||||||||||||
| (A) | Information presented relates to a share outstanding throughout the indicated period. Net investment income (loss) per share amounts are calculated based on average shares outstanding unless otherwise noted. |
| (B) | Assumes initial investment at net asset value at the beginning of each period, reinvestment of all distributions, the complete redemption of the investment at net asset value at the end of each period and no sales charge. Total return would be reduced if sales charges were taken into account. |
| (C) | Adjustments include waivers and reimbursements, if applicable. Ratios do not include fees paid indirectly (see Expenses in the accompanying Notes to Financial Statements). |
| (D) | Net investment income (loss) per share amounts have been calculated using the SEC method. |
| Portfolio Turnover Rate for All Share Classes | ||||
| For the Year Ended October 31, 2014 | 23 | % | ||
| For the Year Ended October 31, 2013 | 30 | |||
| For the Year Ended October 31, 2012 | 28 | |||
| For the Year Ended October 31, 2011 | 30 | |||
| For the Year Ended October 31, 2010 | 33 | |||
| 24 |
| Report of Independent Registered Public Accounting Firm |
| The Board of Directors and Shareholders of |
| The Hartford Mutual Funds, Inc. |
We have audited the accompanying statement of assets and liabilities, including the schedule of investments, of The Hartford Dividend and Growth Fund (one of the portfolios constituting The Hartford Mutual Funds, Inc. (the Funds)) as of October 31, 2014, and the related statement of operations for the year then ended, the statements of changes in net assets for each of the two years in the period then ended, and the financial highlights for each of the five years in the period then ended. These financial statements and financial highlights are the responsibility of the Funds’ management. Our responsibility is to express an opinion on these financial statements and financial highlights based on our audits.
We conducted our audits in accordance with the standards of the Public Company Accounting Oversight Board (United States). Those standards require that we plan and perform the audit to obtain reasonable assurance about whether the financial statements and financial highlights are free of material misstatement. We were not engaged to perform an audit of the Funds’ internal control over financial reporting. Our audits included consideration of internal control over financial reporting as a basis for designing audit procedures that are appropriate in the circumstances, but not for the purpose of expressing an opinion on the effectiveness of the Funds’ internal control over financial reporting. Accordingly, we express no such opinion. An audit also includes examining, on a test basis, evidence supporting the amounts and disclosures in the financial statements and financial highlights, assessing the accounting principles used and significant estimates made by management, and evaluating the overall financial statement presentation. Our procedures included confirmation of securities owned as of October 31, 2014, by correspondence with the custodian and brokers or by other appropriate auditing procedures where replies from brokers were not received. We believe that our audits provide a reasonable basis for our opinion.
In our opinion, the financial statements and financial highlights referred to above present fairly, in all material respects, the financial position of The Hartford Dividend and Growth Fund of The Hartford Mutual Funds, Inc. at October 31, 2014, the results of its operations for the year then ended, the changes in its net assets for each of the two years in the period then ended, and the financial highlights for each of the five years in the period then ended, in conformity with U.S. generally accepted accounting principles.
|
Minneapolis, Minnesota
December 18, 2014
| 25 |
| The Hartford Dividend and Growth Fund |
| Directors and Officers (Unaudited) |
The Board of Directors of the Company (the "Directors") appoints officers who are responsible for the day-to-day operations of the Fund and who execute policies formulated by the Directors. Each Director serves until his or her death, resignation, or retirement or until the next annual meeting of shareholders is held or until his or her successor is elected and qualifies.
Directors and officers who are employed by or who have a financial interest in The Hartford Financial Services Group, Inc. ("The Hartford") are considered “interested” persons of the Fund pursuant to the 1940 Act. Each officer and two of the Company's Directors, as noted in the chart below, are “interested” persons of the Fund. Each Director serves as a director for The Hartford Mutual Funds, Inc., The Hartford Mutual Funds II, Inc., Hartford Series Fund, Inc., and Hartford HLS Series Fund II, Inc., and as a trustee for The Hartford Alternative Strategies Fund, which, as of October 31, 2014, collectively consist of 66 funds. Correspondence may be sent to Directors and officers c/o Hartford Funds, 5 Radnor Corporate Center, Suite 300, 100 Matsonford Road, Radnor, Pennsylvania 19087, except that correspondence to Mr. Annoni, Mr. Dressen and Ms. Quade may be sent to 500 Bielenberg Drive, Suite 500, Woodbury, Minnesota 55125.
The table below sets forth, for each Director and officer, his or her name, year of birth, current position with the Company and date first elected or appointed to The Hartford Mutual Funds, Inc. ("MF") and The Hartford Mutual Funds II, Inc. ("MF2"), principal occupation, and, for Directors, other directorships held. The Fund’s Statement of Additional Information contains further information on the Directors and is available free of charge by calling 1-888-843-7824 or writing to: Hartford Funds, P.O. Box 55022, Boston, MA 02205-5022.
Information on the aggregate remuneration paid to the directors of the Company can be found in the Statement of Operations herein. The Fund pays to The Hartford a portion of the Chief Compliance Officer’s compensation, but does not pay salaries or compensation to any of its other officers or Directors who are employed by The Hartford.
Non-Interested Directors
Hilary E. Ackermann (1956) Director since September 23, 2014
Ms. Ackermann served as Chief Risk Officer at Goldman Sachs Bank USA from October 2008 to November 2011 and serves as a Director of Dynegy, Inc., an independent power company, from October 2012 to present.
Lynn S. Birdsong (1946) Director since 2003, Chairman of the Investment Committee since 2014
Mr. Birdsong is a private investor. Mr. Birdsong currently serves as a Director of the Sovereign High Yield Investment Company (April 2010 to current). Mr. Birdsong currently serves as an Independent Director of Nomura Partners Funds, Inc. (formerly, The Japan Fund) (April 2003 to current). From 2003 to March 2005, Mr. Birdsong was an Independent Director of the Atlantic Whitehall Funds. From 1979 to 2002, Mr. Birdsong was a Managing Director of Zurich Scudder Investments, an investment management firm. During his employment with Scudder, Mr. Birdsong was an Interested Director of The Japan Fund. From January 1981 through December 2013, Mr. Birdsong was a partner in Birdsong Company, an advertising specialty firm.
Robert M. Gavin, Jr. (1940) Director since 2002 (MF) and 1986 (MF2), Chairman of the Board for each since 2004
Dr. Gavin is an educational consultant. Prior to September 1, 2001, he was President of Cranbrook Education Community and prior to July 1996, he was President of Macalester College, St. Paul, Minnesota.
Duane E. Hill (1945) Director since 2001 (MF) and 2002 (MF2), Chairman of the Nominating Committee since 2003
Mr. Hill is a Partner of TSG Ventures L.P., a private equity investment company. Mr. Hill is a former partner of TSG Capital Group, a private equity investment firm that served as sponsor and lead investor in leveraged buyouts of middle market companies.
Sandra S. Jaffee (1941) Director since 2005
Ms. Jaffee is the founder and Chief Executive Officer of a private company, Homeworks Concierge, LLC, which provides residential property management services in Westchester County, New York (January 2012 to present). Ms. Jaffee served as Chairman (2008 to 2009) and Chief Executive Officer of Fortent (formerly Searchspace Group), a leading provider of compliance/regulatory technology to financial institutions from August 2005 to August 2009. From August 2004 to August 2005, Ms. Jaffee served as an Entrepreneur in Residence with Warburg Pincus, a private equity firm. Prior to joining Warburg Pincus, Ms. Jaffee served as Executive Vice President at Citigroup, from September 1995 to July 2004, where she was President and Chief Executive Officer of Citibank’s Global Securities Services (1995 to 2003). Ms. Jaffee currently serves as a member of the Board of Directors of Broadridge Financial Solutions as well as a Trustee of Muhlenberg College.
| 26 |
| The Hartford Dividend and Growth Fund |
| Directors and Officers (Unaudited) – (continued) |
William P. Johnston (1944) Director since 2005, Chairman of the Compliance Committee since 2005
In June 2006, Mr. Johnston was appointed as Senior Advisor to The Carlyle Group, a global private equity and other alternative asset investment firm and currently serves as an Operating Executive. In July 2006, Mr. Johnston was elected to the Board of Directors of MultiPlan, Inc. and served as a Director (July 2006 to August 2010). In August 2007, Mr. Johnston was elected to the Board of Directors of LifeCare Holdings, Inc. and served as a Director (August 2007 to June 2013). In February 2008, Mr. Johnston was elected to the Board of Directors of HCR-ManorCare, Inc. In May 2006, Mr. Johnston was elected to the Supervisory Board of Fresenius Medical Care AG & Co. KGaA, after its acquisition of Renal Care Group, Inc. in March 2006. Mr. Johnston joined Renal Care Group in November 2002 as a member of the Board of Directors and served as Chairman of the Board from March 2003 through March 2006. From 2002 through 2013, Mr. Johnston served as a Board member of the Georgia O’Keefe Museum. From September 1987 to December 2002, Mr. Johnston was with Equitable Securities Corporation (and its successors, SunTrust Equitable Securities and SunTrust Robinson Humphrey) serving in various investment banking and managerial positions, including Managing Director and Head of Investment Banking, Chief Executive Officer and Vice Chairman.
Phillip O. Peterson (1944) Director since 2002 (MF) and 2000 (MF2), Chairman of the Audit Committee since 2002
Mr. Peterson is a mutual fund industry consultant. He was a partner of KPMG LLP (an accounting firm) until July 1999. Mr. Peterson joined William Blair Funds in February 2007 as a member of the Board of Trustees. From February 2012 to February 2014, Mr. Peterson served as a Trustee of Symetra Variable Mutual Funds. From January 2004 to April 2005, Mr. Peterson served as Independent President of the Strong Mutual Funds.
Lemma W. Senbet (1946) Director since 2005
Dr. Senbet is the William E. Mayer Chair Professor of Finance and Founding Director, Center for Financial Policy, at the University of Maryland, Robert H. Smith School of Business. He was chair of the Finance Department of the University of Maryland, Robert H. Smith School of Business from 1998 to 2006. Since June 2013, he has been on leave from the University to serve as Executive Director of African Economic Research Consortium which focuses on economic policy research and training. Previously, he was a chaired professor of finance at the University of Wisconsin-Madison. Also, he was a Director of the Fortis Funds from March 2000 to July 2002. Dr. Senbet served as Director of the American Finance Association and President of the Western Finance Association. In 2006, Dr. Senbet was inducted Fellow of Financial Management Association International for his career-long distinguished scholarship and professional service.
Interested Directors and Officers
James E. Davey (1964) Director since 2012, President and Chief Executive Officer since 2010
Mr. Davey serves as Executive Vice President of Hartford Life Insurance Company (“HLIC”) and The Hartford. Additionally, Mr. Davey serves as Chairman of the Board, Manager and Senior Managing Director of Hartford Funds Distributors, LLC (“HFD”). He also currently serves as Director, Chairman of the Board, President and Senior Managing Director of Hartford Administrative Services Company (“HASCO”). Mr. Davey also serves as Manager, Chairman of the Board and Senior Managing Director for Hartford Funds Management Company, LLC (“HFMC”) and Director, Chairman of the Board and Senior Managing Director for Hartford Funds Management Group, Inc. ("HFMG"). Mr. Davey has served in various positions within The Hartford and its subsidiaries in connection with the operation of the Hartford Funds. Mr. Davey joined The Hartford in 2002.
Lowndes A. Smith* (1939) Director since 1996 (MF) and 2002 (MF2)
Mr. Smith served as Vice Chairman of The Hartford from February 1997 to January 2002, as President and Chief Executive Officer of Hartford Life, Inc. from February 1997 to January 2002, and as President and Chief Operating Officer of The Hartford Life Insurance Companies from January 1989 to January 2002. Mr. Smith serves as a Director of White Mountains Insurance Group Ltd. (October 2003 to current); One Beacon Insurance (October 2006 to current); Symetra Financial (August 2007 to current) and is a Managing Director of Whittington Gray Associates (January 2007 to current).
* Mr. Smith resigned as a Director of MF, MF2, Hartford Series Fund, Inc. and Hartford HLS Series Fund II, Inc. and as a Trustee of The Hartford Alternative Strategies Fund effective September 17, 2014.
Other Officers
Mark A. Annoni (1964) Vice President, Controller and Treasurer since 2012
Mr. Annoni currently serves as the Assistant Vice President of HLIC (February 2004 to present) and Senior Vice President of HFMG (December 2013 to present). Mr. Annoni has served in various positions within The Hartford and its subsidiaries in connection with the operation of the Hartford Funds. Mr. Annoni joined The Hartford in 2001.
| 27 |
| The Hartford Dividend and Growth Fund |
| Directors and Officers (Unaudited) – (continued) |
Michael R. Dressen (1963) AML Compliance Officer since 2011
Mr. Dressen currently serves as Assistant Vice President of HLIC. He also serves as Chief Compliance Officer and AML Compliance Officer of HASCO and as AML Officer of HFD. Mr. Dressen has served in various positions within The Hartford and its subsidiaries in connection with the operation of the Hartford Funds.
Edward P. Macdonald (1967) Vice President, Secretary and Chief Legal Officer since 2005
Mr. Macdonald currently serves as Assistant Secretary, Executive Vice President and Deputy General Counsel of HFD, HASCO, HFMC and HFMG. He also serves as Vice President of HLIC. Mr. Macdonald has served in various positions within The Hartford and its subsidiaries in connection with the operation of the Hartford Funds. Mr. Macdonald joined The Hartford in 2005.
Joseph G. Melcher (1973) Vice President and Chief Compliance Officer since 2013
Mr. Melcher currently serves as Executive Vice President of HFD, HFMG and HASCO. Mr. Melcher also currently serves as Executive Vice President and Chief Compliance Officer of HFMC. Mr. Melcher has served in various positions within The Hartford and its subsidiaries in connection with the operation of the Hartford Funds since joining The Hartford in 2012. Prior to joining The Hartford, Mr. Melcher worked at Touchstone Investments, a member of the Western & Southern Financial Group, where he held the position of Vice President and Chief Compliance Officer from 2010 through 2012 and Assistant Vice President, Compliance from 2005 to 2010.
Vernon J. Meyer (1964) Vice President since 2006
Mr. Meyer currently serves as Senior Vice President of HLIC. He also currently serves as Managing Director and Chief Investment Officer of HFMC and Managing Director of HFMG. Mr. Meyer has served in various positions within The Hartford and its subsidiaries in connection with the operation of the Hartford Funds. Mr. Meyer joined The Hartford in 2004.
Laura S. Quade (1969) Vice President since 2012
Ms. Quade currently serves as Vice President of HASCO, HFD and HFMG. She is the Head of Operations of HASCO and formerly served as Director, Enterprise Operations of HLIC. Ms. Quade has served in various positions within The Hartford and its subsidiaries in connection with the operation of the Hartford Funds. Ms. Quade joined The Hartford in 2001.
Martin A. Swanson** (1962) Vice President since 2010
Mr. Swanson currently serves as Vice President of HLIC. Mr. Swanson also serves as Managing Director, Chief Marketing Officer and Principal of HFD and Managing Director of HFMG. Mr. Swanson has served in various positions within The Hartford and its subsidiaries in connection with the operation of the Hartford Funds.
** Mr. Swanson resigned as an officer effective November 6, 2014.
HOW TO OBTAIN A COPY OF THE FUND’S PROXY VOTING POLICIES AND VOTING RECORDS (UNAUDITED)
A description of the policies and procedures that the Fund uses to determine how to vote proxies relating to portfolio securities and information about how the Fund voted proxies relating to portfolio securities during the most recent twelve-month period ended June 30 are available (1) without charge, upon request, by calling 888-843-7824 and (2) on the SEC’s website at http://www.sec.gov.
QUARTERLY PORTFOLIO HOLDINGS INFORMATION (UNAUDITED)
The Fund files a complete schedule of portfolio holdings with the SEC for the first and third quarters of each fiscal year on Form N-Q. The Fund’s Forms N-Q are available (1) without charge, upon request, by calling 888-843-7824 and (2) on the SEC’s website at http://www.sec.gov. The Form N-Q may be reviewed and copied at the SEC’s Public Reference Room in Washington, DC. Information on the operation of the Public Reference Room may be obtained by calling 1-800-SEC-0330.
| 28 |
| The Hartford Dividend and Growth Fund |
| Federal Tax Information (Unaudited) |
For the fiscal year ended October 31, 2014, there is no further federal tax information required for this Fund.
| 29 |
| The Hartford Dividend and Growth Fund |
| Expense Example (Unaudited) |
Your Fund's Expenses
As a shareholder of the Fund, you incur two types of costs: (1) transaction costs, including sales charges (loads) on purchase payments, if any, and contingent deferred sales charges (CDSC), if any, and (2) ongoing costs, including investment management fees, distribution and/or service (12b-1) fees, if any, and other fund expenses. This example is intended to help you understand your ongoing costs (in dollars) of investing in the Fund and to compare these costs with the ongoing costs of investing in other mutual funds. The example is based on an investment of $1,000 invested at the beginning of the period and held for the entire period of April 30, 2014 through October 31, 2014.
Actual Expenses
The first set of columns of the table below provides information about actual account values and actual expenses. You may use the information in this column, together with the amount you invested, to estimate the expenses that you paid over the period. Simply divide your account value by $1,000 (for example, an $8,600 account value divided by $1,000 = 8.6), then multiply the result by the number in the line under the heading entitled “Expenses Paid During Period” to estimate the expenses you paid on your account during this period.
Hypothetical Example for Comparison Purposes
The second set of columns of the table below provides information about hypothetical account values and hypothetical expenses based on the Fund's actual expense ratio and an assumed rate of return of 5% per year before expenses, which is not the Fund's actual return. The hypothetical account values and expenses may not be used to estimate the actual ending account balance or expenses you paid for the period. You may use this information to compare the ongoing costs of investing in the Fund and other funds. To do so, compare this 5% hypothetical example with the 5% hypothetical examples that appear in the shareholder reports of the other funds.
Please note that the expenses shown in the table are meant to highlight your ongoing costs only and do not reflect any transactional costs, such as sales charges (loads) and CDSC. Therefore, the second set of columns of the table is useful in comparing ongoing costs only, and will not help you determine the relative total costs of owning different funds. In addition, if these transactional costs were included, your costs would be higher. Expenses are equal to the Fund's annualized expense ratios multiplied by average account value over the period, multiplied by 184/365 (to reflect the one-half year period).
| Actual return | Hypothetical (5% return before expenses) | |||||||||||||||||||||||||||||||
Beginning | Ending
Account | Expenses paid during the period April 30, 2014 through October 31, 2014 | Beginning | Ending
Account | Expenses
paid | Annualized | Days | Days | ||||||||||||||||||||||||
| Class A | $ | 1,000.00 | $ | 1,057.90 | $ | 5.30 | $ | 1,000.00 | $ | 1,020.06 | $ | 5.20 | 1.02 | % | 184 | 365 | ||||||||||||||||
| Class B | $ | 1,000.00 | $ | 1,052.90 | $ | 10.03 | $ | 1,000.00 | $ | 1,015.44 | $ | 9.85 | 1.94 | 184 | 365 | |||||||||||||||||
| Class C | $ | 1,000.00 | $ | 1,053.90 | $ | 9.13 | $ | 1,000.00 | $ | 1,016.32 | $ | 8.96 | 1.76 | 184 | 365 | |||||||||||||||||
| Class I | $ | 1,000.00 | $ | 1,058.90 | $ | 4.23 | $ | 1,000.00 | $ | 1,021.10 | $ | 4.15 | 0.81 | 184 | 365 | |||||||||||||||||
| Class R3 | $ | 1,000.00 | $ | 1,056.00 | $ | 7.00 | $ | 1,000.00 | $ | 1,018.39 | $ | 6.88 | 1.35 | 184 | 365 | |||||||||||||||||
| Class R4 | $ | 1,000.00 | $ | 1,057.80 | $ | 5.42 | $ | 1,000.00 | $ | 1,019.93 | $ | 5.32 | 1.05 | 184 | 365 | |||||||||||||||||
| Class R5 | $ | 1,000.00 | $ | 1,059.20 | $ | 3.87 | $ | 1,000.00 | $ | 1,021.45 | $ | 3.80 | 0.75 | 184 | 365 | |||||||||||||||||
| Class Y | $ | 1,000.00 | $ | 1,059.70 | $ | 3.35 | $ | 1,000.00 | $ | 1,021.95 | $ | 3.29 | 0.65 | 184 | 365 | |||||||||||||||||
| 30 |
| The Hartford Dividend and Growth Fund |
| Approval of Investment Management and Investment Sub-Advisory Agreements (Unaudited) |
Section 15(c) of the Investment Company Act of 1940, as amended (the “1940 Act”), requires that each mutual fund’s board of directors, including a majority of those directors who are not “interested persons” of the mutual fund, as defined in the 1940 Act (the “Independent Directors”), annually review and consider the continuation of the mutual fund’s investment advisory and sub-advisory agreements. At its meeting held on August 5-6, 2014, the Board of Directors (the “Board”) of The Hartford Mutual Funds, Inc., including each of the Independent Directors, unanimously voted to approve the continuation of the investment management agreement for The Hartford Dividend and Growth Fund (the “Fund”) with Hartford Funds Management Company, LLC (“HFMC”) and the continuation of the investment sub-advisory agreement between HFMC and the Fund’s sub-adviser, Wellington Management Company, LLP (the “Sub-adviser,” and together with HFMC, the “Advisers”) (collectively, the “Agreements”).
In the months preceding the August 5-6, 2014 meeting, the Board requested, received and reviewed written responses from the Advisers to questions posed to them on behalf of the Independent Directors and supporting materials relating to those questions and responses. The Board considered information furnished to the Board at its meetings throughout the year, as well as information specifically prepared in connection with the annual approval of the Agreements at the Board’s meetings held on June 17-18, 2014 and August 5-6, 2014. Information provided to the Board at its meetings throughout the year included, among other things, reports on Fund performance, legal and compliance matters, sales and marketing activity, shareholder services, and the other services provided to the Fund by the Advisers and their affiliates. The Board also received in-person presentations by Fund officers and representatives of HFMC at the Board’s meetings on June 17-18, 2014 and August 5-6, 2014 concerning the Agreements.
The Independent Directors, advised by independent legal counsel, engaged service providers to assist them with evaluating the Agreements with respect to the Fund. Lipper Inc. (“Lipper”), an independent provider of investment company data, was retained to provide the Board with reports on how the Fund’s contractual management fees, actual management fees, other non-management fees, overall expense ratios and investment performance compared to those of mutual funds with similar investment objectives. The Independent Directors also engaged an independent financial services consultant (the “Consultant”) to assist them in evaluating the Fund’s management fees, sub-advisory fees, other non-management fees, overall expense ratios and investment performance. In addition, the Consultant reviewed the profitability calculations utilized by HFMC in connection with the continuation of the investment management agreement.
In determining whether to continue the Agreements for the Fund, the members of the Board reviewed and evaluated information and factors they believed to be relevant and appropriate in light of the information that the Board deemed necessary and appropriate through the exercise of its reasonable business judgment. While individual members of the Board may have weighed certain factors differently, the Board’s determination to continue the Agreements was based on a comprehensive consideration of all information provided to the Board throughout the year and specifically with respect to the continuation of the Agreements. A more detailed discussion of the factors the Board considered with respect to its approval of the Agreements is provided below.
Nature, Extent and Quality of Services Provided by the Advisers
The Board requested and considered information concerning the nature, extent and quality of the services provided to the Fund by the Advisers. The Board considered, among other things, the terms of the Agreements and the range of services provided by the Advisers. The Board considered the Advisers’ professional personnel who provide services to the Fund, including each Adviser’s ability and experience in attracting and retaining qualified personnel to service the Fund. The Board considered each Adviser’s reputation and overall financial strength, as well as its willingness to consider and implement organizational and operational changes designed to enhance services to the Hartford Funds. In addition, the Board considered the quality of each Adviser’s communications with the Board and responsiveness to Board inquiries and requests made from time to time with respect to the Fund and other Hartford Funds.
The Board also requested and evaluated information concerning each Adviser’s regulatory and compliance environment. In this regard, the Board requested and reviewed information on each Adviser’s compliance policies and procedures, compliance history, and a report from the Fund’s Chief Compliance Officer on each Adviser’s compliance with applicable laws and regulations, including responses to regulatory developments and compliance issues raised by regulators. The Board also noted the Advisers’ support of the Fund’s compliance control structure, particularly the resources devoted by the Advisers in support of the Fund’s obligations pursuant to Rule 38a-1 under the 1940 Act.
With respect to HFMC, the Board noted that, under the Agreements, HFMC is responsible for the management of the Fund, including oversight of fund operations and service providers, and provides administrative and investment advisory services in connection with selecting, monitoring and supervising the Sub-adviser. The Board considered HFMC’s ongoing monitoring of people, process and performance, including its quarterly reviews of each of the Hartford Funds, semi-annual meetings with the leaders of each Fund’s portfolio management team, and oversight of the Hartford Funds’ approximately 66 portfolio managers. The Board recognized that HFMC has demonstrated a record of making changes to the
| 31 |
| The Hartford Dividend and Growth Fund |
| Approval of Investment Management and Investment Sub-Advisory Agreements (Unaudited) - (continued) |
management and/or strategies of the Hartford Funds when warranted. The Board considered HFMC’s oversight of the Sub-adviser’s investment approach and results, process for monitoring best execution of portfolio trades by the Sub-adviser, and approach to risk management with respect to the Fund and the service providers to the Fund. The Board also considered HFMC’s oversight of compliance with the Fund’s objective and policies as well as with applicable laws and regulations, noting that regulatory and other developments had over time led to an increase in the scope of HFMC’s services in this regard.
In addition, the Board considered HFMC’s ongoing commitment to review and rationalize the Hartford Funds product line-up and the expenses that HFMC had incurred in connection with fund combinations in recent years. The Board considered that HFMC or its affiliates are responsible for providing the Fund’s officers.
With respect to the Sub-adviser, which provides certain day-to-day portfolio management services for the Fund, the Board considered the quality of the Fund’s portfolio managers, the Sub-adviser’s other investment personnel, its investment philosophy and process, investment research capabilities and resources, performance record, trade execution capabilities and experience. The Board considered the experience of the Fund’s portfolio managers, the number of accounts managed by the portfolio managers, and the Sub-adviser’s method for compensating the portfolio managers.
Based on these considerations, the Board concluded that it was satisfied with the nature, extent and quality of the services provided to the Fund by HFMC and the Sub-adviser.
Performance of the Fund and the Advisers
The Board considered the investment performance of the Fund. In this regard, the Board reviewed the performance of the Fund over different time periods presented in the materials and evaluated HFMC’s analysis of the Fund’s performance for these time periods. The Board considered information and materials provided to the Board by the Advisers concerning Fund performance, as well as information from Lipper comparing the investment performance of the Fund to an appropriate benchmark and universe of peer funds. The Board noted that the Fund’s performance was in the 1st quintile of its performance universe for the 1-year period and the 3rd quintile for the 3-and 5-year periods. The Board also noted that the Fund’s performance was above its benchmark for the 1-year period, in line with its benchmark for the 3-year period and below its benchmark for the 5-year period.
The Board considered the detailed investment analytics reports provided by Hartford Funds’ Investment Advisory Group throughout the year. These reports include, among other things, information on the Fund’s gross and net returns, the Fund’s investment performance relative to an appropriate benchmark and peer group, various statistics concerning the Fund’s portfolio, and a narrative summary of various factors affecting Fund performance. The Board considered the Advisers’ cooperation with the Investment Committee, which assists the Board in evaluating the performance of the Fund at periodic meetings throughout the year. The Board also considered the analysis provided by the Consultant relating to the Fund’s performance track record.
In light of all the considerations noted above, the Board concluded that it had continued confidence in HFMC’s and the Sub-adviser’s overall capabilities to manage the Fund.
Costs of the Services and Profitability of the Advisers
The Board reviewed information regarding HFMC’s cost to provide investment management and related services to the Fund and HFMC’s profitability, both overall and for the Fund, on a pre-tax basis without regard to distribution expenses. The Board also requested and reviewed information about the profitability to HFMC and its affiliates from all services provided to the Fund and all aspects of their relationship with the Fund. The Board also requested and received information relating to the operations and profitability of the Sub-adviser.
The Board considered the Consultant’s review of the profitability calculations used by HFMC in connection with the continuation of the investment management agreement, noting the Consultant’s view that Hartford Funds’ process for calculating and reporting Fund profitability is reasonable. In this regard, the Board noted that the Consultant performed a full review of this process in light of the recent restructuring of the Hartford Funds business and reported that the approach to analyzing Fund profitability, including the use of common expense allocation methodologies, is reasonable, sound and well within common industry practice.
Based on these considerations, the Board concluded that the profits anticipated to be realized by the Advisers and their affiliates from their relationships with the Fund would not be excessive.
| 32 |
| The Hartford Dividend and Growth Fund |
| Approval of Investment Management and Investment Sub-Advisory Agreements (Unaudited) - (continued) |
Comparison of Fees and Services Provided by the Advisers
The Board considered comparative information with respect to the management fees to be paid by the Fund to HFMC and the total expense ratios of the Fund. The Board also considered comparative information with respect to the sub-advisory fees to be paid by HFMC to the Sub-adviser. In this regard, the Board requested and reviewed information from HFMC and the Sub-adviser relating to the management and sub-advisory fees, including the sub-advisory fee schedule for the Fund, and total operating expenses for the Fund. With respect to the sub-advisory fee schedule, the Board considered representations from HFMC and the Sub-adviser that the Sub-adviser’s fees were negotiated at arm’s length on a fund-by-fund basis. The Board also reviewed information from Lipper comparing the Fund’s contractual management fees, actual management fees and overall expense ratios relative to a group of funds selected by Lipper, in consultation with the Consultant, and a broader universe of funds selected by Lipper. The Board considered that the Fund’s contractual management fee, actual management fee and total expenses (less 12b-1 and shareholder service fees) were in the 4th quintile of its expense group. The Board noted that the Fund has an automatically renewable contractual expense cap on certain share classes.
While the Board recognized that comparisons between the Fund and peer funds may be imprecise, given the different service levels and characteristics of mutual funds and the different business models and cost structures of the Advisers, the comparative information provided by Lipper assisted the Board in evaluating the reasonableness of the Fund’s management and sub-advisory fees and total operating expenses. In addition, the Board considered the analysis and recommendations of the Consultant relating to the Fund’s management and sub-advisory fees and total operating expenses.
Based on these considerations, the Board concluded that the Fund’s fees and total operating expenses, in conjunction with the information about quality of services, profitability, economies of scale, and other matters discussed, were reasonable in light of the services provided.
Economies of Scale
The Board requested and considered information regarding the Advisers’ realization of economies of scale with respect to the Fund and whether the fee levels reflect these economies of scale for the benefit of the Fund’s shareholders. The Board reviewed the breakpoints in the management fee schedule for the Fund, which reduce fee rates as Fund assets grow over time. The Board recognized that a fund with assets beyond the highest breakpoint level will continue to benefit from economies of scale because additional assets are charged the lowest breakpoint fee resulting in lower overall effective management fee rates. The Board also considered that expense limitations and fee waivers that reduce the Fund’s expenses at all asset levels can have the same effect as breakpoints in sharing economies of scale with shareholders and provide protection from an increase in expenses if Fund assets decline. The Board recognized that a fee schedule that reaches a lower breakpoint quickly provides shareholders with the benefit of anticipated or potential economies of scale. The Board also considered that HFMC has been active in managing expenses, which has resulted in benefits being realized by shareholders as assets within the Hartford Funds family of funds have grown over time, including through lower transfer agent costs and other operating expenses.
The Board reviewed and evaluated materials from Lipper and the Consultant showing how management fee schedules of peer funds reflect economies of scale for the benefit of shareholders as a peer fund’s assets hypothetically increase over time. Based on information provided by HFMC, Lipper, and the Consultant, the Board recognized that there is no uniform methodology for establishing breakpoints or uniform pattern in asset levels that trigger breakpoints or the amounts of breakpoints triggered.
After considering all of the information available to it, the Board concluded that it was satisfied with the extent to which economies of scale would be shared for the benefit of the Fund’s shareholders based on currently available information and the effective advisory fees and expense ratios for the Fund at its current and reasonably anticipated asset levels. The Board noted, however, that it would continue to monitor future growth in Fund assets and the appropriateness of additional breakpoints.
Other Benefits
The Board considered other benefits to the Advisers and their affiliates from their relationships with the Fund.
The Board noted that HFMC receives fees for fund accounting and related services from the Fund, and the Board considered information on profits to HFMC for such services. The Board also considered that Hartford Administrative Services Company (“HASCO”), the Fund’s transfer agent and an affiliate of HFMC, receives transfer agency compensation from the Fund, and the Board reviewed information on the profitability of the Fund’s transfer agency function to HASCO. The Board considered information provided by HASCO indicating that the transfer agent fees charged by HASCO to the Fund were fair and reasonable based on publicly available information.
| 33 |
| The Hartford Dividend and Growth Fund |
| Approval of Investment Management and Investment Sub-Advisory Agreements (Unaudited) - (continued) |
The Board also considered that Hartford Funds Distributors, LLC (“HFD”), an affiliate of HFMC, serves as principal underwriter of the Fund. As principal underwriter, HFD receives 12b-1 fees from the Fund and receives all or a portion of the sales charges on sales or redemptions of certain classes of shares. The Board also noted that certain affiliates of HFD distribute shares of the Fund and receive compensation in that connection.
The Board considered benefits to the Sub-adviser from its use of the Fund’s brokerage commissions to obtain soft dollar research, and representations from HFMC and the Sub-adviser that the Sub-adviser would not make any revenue-sharing payments or any other type of distribution payments to HFMC or its affiliates.
The Board considered the benefits to shareholders of being part of the Hartford Funds family of funds, including the right to exchange investments between the same class of funds without a sales charge, the ability to reinvest Fund dividends into other funds in the family, and the ability to combine holdings in the Fund with holdings in other funds to obtain a reduced sales charge. The Board considered HFMC’s efforts to provide investors in the family with a broad range of investment styles and asset classes and its entrepreneurial risk in initiating new funds to expand these opportunities for shareholders.
* * * *
Based upon its review of these various factors, among others, the Board concluded that it is in the best interests of the Fund and its shareholders for the Board to approve the Agreements for an additional year. In reaching this decision, the Board did not assign relative weights to the factors discussed above or deem any one or group of them to be controlling in and of themselves. In connection with their deliberations, the Independent Directors met separately in executive session on several occasions, with independent legal counsel and the Consultant, to review the relevant materials and consider their responsibilities under relevant laws and regulations.
| 34 |
| The Hartford Dividend and Growth Fund |
| Main Risks (Unaudited) |
The main risks of investing in the Fund are described below.
Market, Selection and Strategy Risk: The Fund’s share price may fluctuate due to market risk and/or security selections that may underperform the market or relevant benchmarks. If the sub-adviser's investment strategy does not perform as expected, the Fund could underperform its peers or lose money. There is no guarantee the Fund will achieve its stated objective.
Foreign Investment Risk: Investments in foreign securities may be riskier than investments in U.S. securities. Potential risks include the risks of illiquidity, increased price volatility, less government regulation, less extensive and less frequent accounting and other reporting requirements, unfavorable changes in currency exchange rates, and economic and political disruptions.
Dividend Paying Security Investment Risk: Dividends are not guaranteed and are subject to change. Dividend paying securities as a group can fall out of favor with the market, causing the Fund to underperform.
| 35 |
THIS PRIVACY POLICY IS NOT PART OF THIS REPORT
Privacy Policy and Practices of The Hartford Financial Services Group, Inc. and its Affiliates
(herein called “we, our and us”)
This Privacy Policy applies to our United States Operations
|
We value your trust. We are committed to the responsible: a) management; b) use; and c) protection; of Personal Information.
This notice describes how we collect, disclose, and protect Personal Information.
We collect Personal Information to: a) service your Transactions with us; and b) support our business functions.
We may obtain Personal Information from: a) You; b) your Transactions with us; and c) third parties such as a consumer-reporting agency.
Based on the type of product or service You apply for or get from us, Personal Information such as: a) your name; b) your address; c) your income; d) your payment; or e) your credit history; may be gathered from sources such as applications, Transactions, and consumer reports.
To serve You and service our business, we may share certain Personal Information. We will share Personal Information, only as allowed by law, with affiliates such as: a) our insurance companies; b) our employee agents; c) our brokerage firms; and d) our administrators.
As allowed by law, we may share Personal Financial Information with our affiliates to: a) market our products; or b) market our services; to You without providing You with an option to prevent these disclosures.
|
We may also share Personal Information, only as allowed by law, with unaffiliated third parties including: a) independent agents; b) brokerage firms; c) insurance companies; d) administrators; and e) service providers; who help us serve You and service our business.
When allowed by law, we may share certain Personal Financial Information with other unaffiliated third parties who assist us by performing services or functions such as: a) taking surveys; b) marketing our products or services; or c) offering financial products or services under a joint agreement between us and one or more financial institutions.
We, and third parties we partner with, may track some of the pages You visit through the use of: a) cookies; b) pixel tagging; or c) other technologies; and currently do not process or comply with any web browser’s “do not track” signal or similar mechanism that indicates a request to disable online tracking of individual users who visit our websites or use our services.
We will not sell or share your Personal Financial Information with anyone for purposes unrelated to our business functions without offering You the opportunity to: a) “opt-out;” or b) “opt-in;” as required by law.
We only disclose Personal Health Information with: a) your proper written authorization; or b) as otherwise allowed or required by law.
Our employees have access to Personal Information in the course of doing their jobs, such as: a) underwriting policies; b) paying claims; c) developing new products; or d) advising customers of our products and services.
|
|
We use manual and electronic security procedures to maintain: a) the confidentiality; and b) the integrity of; Personal Information that we have. We use these procedures to guard against unauthorized access.
Some techniques we use to protect Personal Information include: a) secured files; b) user authentication; c) encryption; d) firewall technology; and e) the use of detection software.
We are responsible for and must: a) identify information to be protected; b) provide an adequate level of protection for that data; c) grant access to protected data only to those people who must use it in the performance of their job-related duties.
Employees who violate our Privacy Policy will be subject to discipline, which may include ending their employment with us.
At the start of our business relationship, we will give You a copy of our current Privacy Policy.
We will also give You a copy of our current Privacy Policy once a year if You maintain a continuing business relationship with us.
We will continue to follow our Privacy Policy regarding Personal Information even when a business relationship no longer exists between us.
|
As used in this Privacy Notice:
Application means your request for our product or service.
Personal Financial Information means financial information such as: a) credit history; b) income; c) financial benefits; or d) policy or claim information.
Personal Health Information means health information such as: a) your medical records; or b) information about your illness, disability or injury.
Personal Information means information that identifies You personally and is not otherwise available to the public. It includes: a) Personal Financial Information; and b) Personal Health Information.
Transaction means your business dealings with us, such as: a) your Application; b) your request for us to pay a claim; and c) your request for us to take an action on your account.
You means an individual who has given us Personal Information in conjunction with: a) asking about; b) applying for; or c) obtaining; a financial product or service from us if the product or service is used mainly for personal, family, or household purposes.
|
This Privacy Policy is being provided on behalf of the following affiliates of The Hartford Financial Services Group, Inc.:
1stAGChoice, Inc.; Access CoverageCorp, Inc.; Access CoverageCorp Technologies, Inc.; American Maturity Life Insurance Company; Archway 60 R, LLC; Business Management Group, Inc.; Champlain Life Reinsurance Company; DMS R, LLC; Eloy R, LLC; Ersatz Corporation; First State Insurance Company; Hartford Accident and Indemnity Company; Hartford Administrative Services Company; Hartford Casualty General Agency, Inc.; Hartford Casualty Insurance Company; Hartford-Comprehensive Employee Benefit Service Company; Hartford Equity Sales Company, Inc.; Hartford Fire General Agency, Inc.; Hartford Fire Insurance Company; Hartford Funds Management Company, LLC; Hartford Funds Management Group, Inc.; Hartford HLS Series Fund II, Inc.; Hartford Insurance Company of Illinois; Hartford Insurance Company of the Midwest; Hartford Insurance Company of the Southeast; Hartford Integrated Technologies, Inc.; Hartford International Life Reassurance Corporation; Hartford Funds Distributors, LLC; Hartford Investment Management Company; Hartford Life and Accident Insurance Company; Hartford Life and Annuity Insurance Company; Hartford Life Insurance Company; Hartford Life Private Placement, LLC; Hartford Lloyd’s Corporation; Hartford Lloyd’s Insurance Company; Hartford Mezzanine Investors I, LLC; Hartford Residual Market, L.C.C.; Hartford Retirement Services, LLC; Hartford Securities Distribution Company, Inc.; Hartford Series Fund, Inc.; Hartford Specialty Insurance Services of Texas, LLC; Hartford Strategic Investments, LLC; Hartford Underwriters Insurance Company; Hartford Technology Services Company, L.L.C.; Hartford of Texas General Agency, Inc.; Hartford Underwriters General Agency, Inc.; HARTRE Company, L.C.C.; HL Investment Advisors, LLC; HLA LLC; Horizon Management Group, LLC; HRA Brokerage Services, Inc.; Lanidex Class B, LLC; M-CAP Insurance Agency, LLC; New England Insurance Company; New England Reinsurance Corporation; Nutmeg Insurance Agency, Inc.; Nutmeg Insurance Company; Pacific Insurance Company, Limited; Planco, LLC: Property and Casualty Insurance Company of Hartford; Revere R, LLC; RVR R, LLC; Sentinel Insurance Company, Ltd.; Sunstone R, LLC; Symphony R, LLC; The Evergreen Group Incorporated; The Hartford Alternative Strategies Fund; The Hartford Mutual Funds, Inc.; The Hartford Mutual Funds II, Inc.; Trumbull Flood Management, L.L.C.; Trumbull Insurance Company; Twin City Fire Insurance Company; White River Life Reinsurance Company.
HPP Revised January 2014
HARTFORDFUNDS
hartfordfunds.com
This information is written in connection with the promotion or marketing of the matter(s) addressed in this material.
This report is submitted for the general information of the shareholders of the Fund. It is not authorized for distribution unless preceded or accompanied by a current prospectus for the Fund.
The information cannot be used or relied upon for the purpose of avoiding IRS penalties. These materials are not intended to provide tax, accounting or legal advice. As with all matters of a tax or legal nature, you should consult your own tax or legal counsel for advice.
Investors should carefully consider the investment objectives, risks, charges, and expenses of Hartford Funds before investing. This and other information can be found in the prospectus and summary prospectus, which can be obtained by calling 888-843-7824 (retail) or 800-279-1541 (institutional). Investors should read them carefully before they invest.
Hartford Funds are underwritten and distributed by Hartford Funds Distributors, LLC.
MFAR-DG14 12/14 113970-3 Printed in U.S.A.
HARTFORDFUNDS
|
HARTFORD DURATION-HEDGED
STRATEGIC INCOME FUND
2014 Annual Report |
A MESSAGE FROM THE PRESIDENT
Dear Fellow Shareholders:
Thank you for investing in Hartford Funds.
Market Review
U.S. equities (as represented by the S&P 500 Index) rose steadily for the fiscal year ended October 31, 2014, with a return of 17.27% for the period. With the exception of short-lived geopolitical scares early in 2014 and concerns about continuing global growth near the end of the period, stocks generally rose on solid fundamentals and encouraging macroeconomic data during the year.
September 2014 marked the six-year anniversary of the start of the financial crisis. Within weeks of that anniversary, both the S&P 500 Index and the Dow Jones Industrial Average set new all-time highs, closing at 2,018 and 17,391, respectively, on October 31. Although the fallout of the crisis continues to influence investor behavior, stocks have recovered and risen dramatically, up 198% from their low in March 2009. Meanwhile, the domestic economy is notching strong growth, and the unemployment rate has reached its lowest level since August 2008.
While the U.S. economy appears to have stabilized and to have reverted to a solid growth path, the outlook for the global economy appears to have gotten cloudier. The U.S. Federal Reserve has ended quantitative easing, while Europe and Japan are pursuing stimulus options to avoid a double-dip recession and deflation, respectively. Diverging central-bank policies will likely continue to play an important role in market movements going forward as investors wait to see the reactions to their efforts and their impacts on global markets.
How have market movements impacted your portfolio throughout the last year? Are your investments still on track to provide the growth or income you need, and are you comfortable with their progress during times of volatility?
Your financial professional can help you navigate today’s markets with confidence, as well as assist you to achieve your investment goals by providing advice on the best options within our fund family to help you work toward overcoming today’s investing challenges. Meet with your financial advisor regularly to examine your portfolio and your investment strategy, and to determine if you’re still on track to meet your goals.
Thank you again for investing with Hartford Funds.
James Davey
President
Hartford Funds
1 The S&P 500 Index is a market capitalization-weighted price index composed of 500 widely held common stocks.
2 The Dow Jones Industrial Average is an unmanaged, price-weighted index of 30 of the largest, most widely held stocks traded on the NYSE
Hartford Duration-Hedged Strategic Income Fund
Table of Contents
The views expressed in the Fund’s Manager Discussion under ‘‘Why did the Fund perform this way?’’ and ‘‘What is the outlook?’’ are views of the Fund’s sub-adviser and portfolio management team through the end of the period and are subject to change based on market and other conditions. The Fund’s Manager Discussion is for informational purposes only and does not represent an offer, recommendation or solicitation to buy, hold or sell any security. The specific securities identified and described, if any, do not represent all of the securities purchased or sold and you should not assume that investments in the securities identified and discussed will be profitable.
Hartford Duration-Hedged Strategic
Income Fund inception 11/29/2013
(sub-advised by Wellington Management Company, LLP)
Investment objective – The Fund seeks to provide current income and long-term total return while seeking to reduce exposure to interest rate risk.
Performance Overview 11/29/13 - 10/31/14

The chart above represents the hypothetical growth of a $10,000 investment in Class A, which includes a sales charge. Growth results in classes other than Class A will vary from what is seen above due to differences in the expenses charged to those share classes.
Cumulative Returns (as of 10/31/14)
| Since Inception▲ | ||||
| Duration-Hedged Strategic Income A# | 2.17 | % | ||
| Duration-Hedged Strategic Income A## | -2.43 | % | ||
| Duration-Hedged Strategic Income C# | 1.60 | % | ||
| Duration-Hedged Strategic Income C## | 0.61 | % | ||
| Duration-Hedged Strategic Income I# | 2.45 | % | ||
| Duration-Hedged Strategic Income R3# | 1.83 | % | ||
| Duration-Hedged Strategic Income R4# | 2.10 | % | ||
| Duration-Hedged Strategic Income R5# | 2.38 | % | ||
| Duration-Hedged Strategic Income Y# | 2.47 | % | ||
| Barclays U.S. Aggregate Bond Index | 4.53 | % | ||
| ▲ | Inception: 11/29/2013. Cumulative returns not annualized. |
| # | Without sales charge |
| ## | With sales charge |
PERFORMANCE DATA QUOTED REPRESENTS PAST PERFORMANCE AND DOES NOT GUARANTEE FUTURE RESULTS. The investment return and principal value of the investment will fluctuate so that investors’ shares, when redeemed, may be worth more or less than their original cost. Current performance may be lower or higher than the performance data quoted. To obtain performance data current to the most recent month-end, please visit our website www.hartfordfunds.com.
The initial investment in Class A shares reflects the maximum sales charge of 4.50% and returns for Class C shares reflect a contingent deferred sales charge of up to 1.00% on shares redeemed within twelve months of purchase.
Total returns presented above were calculated using the Fund’s net asset value available to shareholders for sale or redemption of Fund shares on October 31, 2014, which may exclude investment transactions as of this date. All share class returns assume the reinvestment of all distributions at net asset value and the deduction of all fund expenses.
Barclays U.S. Aggregate Bond Index is an unmanaged index and is composed of securities from the Barclays Government/Credit Bond Index, Mortgage-Backed Securities Index, Asset-Backed Securities Index and Commercial Mortgage-Backed Securities Index.
You cannot invest directly in an index.
The chart and table do not reflect the deductions of taxes that a shareholder would pay on Fund distributions or the redemption of Fund shares.
Performance information may reflect historical or current expense waivers/reimbursements from the investment adviser, without which performance would have been lower. For information on current expense waivers/reimbursements, please see the prospectus.
| 2 |
Hartford Duration-Hedged Strategic Income Fund
Manager Discussion
October 31, 2014 (Unaudited)
Operating Expenses*
| Net | Gross | |||||||
| Duration-Hedged Strategic Income Class A | 1.15 | % | 1.15 | % | ||||
| Duration-Hedged Strategic Income Class C | 1.90 | % | 1.90 | % | ||||
| Duration-Hedged Strategic Income Class I | 0.90 | % | 0.90 | % | ||||
| Duration-Hedged Strategic Income Class R3 | 1.45 | % | 1.45 | % | ||||
| Duration-Hedged Strategic Income Class R4 | 1.15 | % | 1.15 | % | ||||
| Duration-Hedged Strategic Income Class R5 | 0.85 | % | 0.85 | % | ||||
| Duration-Hedged Strategic Income Class Y | 0.75 | % | 0.75 | % | ||||
| * | As shown in the Fund's most recent prospectus. Actual expenses may be higher or lower. Please see accompanying Financial Highlights for expense ratios for November 29, 2013 (commencement of operations) through October 31, 2014. |
Gross expenses are the Fund's total annual operating expenses shown in the Fund's most recent prospectus. Net expenses are the Fund's total annual operating expenses shown in the Fund's most recent prospectus and reflect contractual expense reimbursements in instances when these reductions reduce the Fund's gross expenses. Contractual reimbursements remain in effect until February 28, 2015, and automatically renew for one-year terms unless terminated.
All investments are subject to risk including the possible loss of principal. For a discussion of the Fund’s risks, please see the Main Risks section of this report. For more detailed information on the risks associated with an investment in the Fund, please see the prospectus.
| Portfolio Managers | ||
| Campe Goodman, CFA | Lucius T. Hill, III | Joseph F. Marvan, CFA |
| Senior Vice President and Fixed Income Portfolio Manager | Senior Vice President and Fixed Income Portfolio Manager | Senior Vice President and Fixed Income Portfolio Manager |
How did the Fund perform?
The Class A shares of the Hartford Duration-Hedged Strategic Income Fund returned 2.17%, before sales charge, for the period from November 29, 2013 (commencement of operations) through October 31, 2014, underperforming the Fund’s benchmark, the Barclays U.S. Aggregate Bond Index, which returned 4.53% for the same period. The Fund also underperformed the 5.23% average return of the Lipper Multi-Sector Income Funds peer group, a group of funds that seeks current income by allocating assets among several different fixed income securities sectors (with no more than 65% in any one sector except for defensive purposes), including U.S. government and foreign governments, with a significant portion of assets in securities rated below investment-grade.
Why did the Fund perform this way?
Fixed income markets gained throughout much of the period as expectations of prolonged easy monetary policy by major central banks and a supportive macroeconomic environment kept rates low and suppressed volatility. Early in the period emerging markets dominated headlines as economic and political developments sparked risk aversion across global markets, pushing bond prices higher and yields lower amid a flight to quality. Toward the end of the period, persistent geopolitical risks – tensions between Ukraine and Russia and violence in Iraq – and Chinese economic slowdown concerns raised questions about the global growth rate, keeping a lid on risk appetites overall.
The period was also highlighted by a divergence in central bank policies. The European Central Bank (ECB) cut its benchmark lending and deposit rates and announced a host of stimulus measures in an effort to encourage lending and fend off fears of deflation. China’s central bank joined the ECB in boosting liquidity by injecting funds into the nation’s largest banks in an attempt to combat weakening growth. The Bank of Japan pre-emptively announced incremental monetary easing to counter market fears that a change from a historical inflationary environment would be delayed. In contrast, the Bank of England and U.S. Federal Reserve (Fed) leaned toward tighter policies. The Fed ended its quantitative easing program as U.S. data largely suggested the economy was on a sustainable growth path. Second quarter gross domestic product (GDP) rebounded after the first quarter’s steep contraction. The labor market strengthened as the unemployment rate dropped to a six-year low. Housing regained some lost ground after a weak start to the year, though the pace of home price appreciation started to slow after a strong 2013. Inflation pressures were muted overall, allowing the Fed to maintain an accommodative stance.
The U.S. Treasury curve flattened as markets contemplated bringing interest rates to normal levels; short-term yields rose while longer term rates declined. Most credit sectors posted positive absolute returns and outperformed duration-equivalent government bonds as credit spreads tightened.
The Fund seeks to achieve its goal by investing primarily in Class Y shares of The Hartford Strategic Income Fund (“Underlying Fund”). The Fund also seeks to reduce its exposure to interest rate risk by hedging much of the Fund’s duration through the use of derivative transactions. During the period, we continued to position the Underlying Fund with an overweight to credit sectors, including high yield credit, bank loans, and emerging market debt. The relative underperformance during the period was largely driven by the Fund’s low structural duration relative to the benchmark due to the Fund’s hedge as rates declined over the period as well an allocation to developed non-U.S. dollar denominated debt, which detracted from relative results as the dollar strengthened over the period. Additionally, security selection within taxable municipals and an underweight to investment grade industrials detracted from relative returns. Security selection within high yield credit, specifically industrials, and an out-of-benchmark allocation to bank loans contributed positively to benchmark-relative performance as higher
| 3 |
Hartford Duration-Hedged Strategic Income Fund
Manager Discussion – (continued)
October 31, 2014 (Unaudited)
yielding securities embraced the Fed’s forward guidance that continued to be accommodating and improving U.S. economic data. We tactically managed exposures to investment grade credit and high yield through credit default swap index exposure which contributed positively to performance overall. The Fund’s allocation to bank loans, emphasizing the high and middle quality portions of the market, was based on strong credit fundamentals and reasonable valuations. The bank loan sector generated strong performance for the period and contributed significantly to benchmark-relative results. Mortgage backed securities (MBS) exposure, particularly an allocation to non-agency MBS, and commercial mortgage backed securities (CMBS) also contributed positively to relative results.
What is the outlook?
At the end of the period, we maintained a moderately pro-cyclical risk posture as we see continued positive U.S. economic momentum, underpinned by still supportive monetary policy, improved investment spending, and much less fiscal drag compared to 2013. We continue to maintain a favorable outlook on global high yield based on low default expectations and positive corporate fundamentals. Within bank loans, we believe that overall credit fundamentals remain strong despite some lower-quality first-time issuers entering the market. We expect short-term interest rates to move higher as the Fed shifts to tighter U.S. monetary policy.
At the end of the period, we maintained underweights to the front-end and long-end of the yield curve and maintained a structural emphasis on higher income-producing sectors such as bank loans, emerging market debt, non-agency MBS, CMBS, and high yield. We expect economic growth and increasing inflation expectations to put upward pressure on interest rates. Therefore, we positioned the portfolio with a short duration bias relative to the duration-hedged benchmark at the end of the period. At the end of the period, the Fund’s effective duration was -1.18 years.
Composition by Investments
as of October 31, 2014
| Fund Name | Percentage of Net Assets | |||
| JP Morgan Prime Money Market Fund | 3.3 | % | ||
| The Hartford Strategic Income Fund | 95.3 | |||
| Other Assets and Liabilities | 1.4 | |||
| Total | 100.0 | % | ||
| 4 |
Hartford Duration-Hedged Strategic Income Fund
Schedule of Investments
October 31, 2014
(000’s Omitted)
| Shares or Principal Amount | Market Value ╪ | |||||||||||
| Affiliated Investment Companies - 95.3% | ||||||||||||
| Taxable Fixed Income Funds - 95.3% | ||||||||||||
| 1,293 | The Hartford Strategic Income Fund | $ | 12,024 | |||||||||
| Total Taxable Fixed Income Funds | ||||||||||||
| (Cost $11,972) | $ | 12,024 | ||||||||||
| Total Investments in Affiliated Investment Companies | ||||||||||||
| (Cost $11,972) | $ | 12,024 | ||||||||||
| Total Long-Term Investments | ||||||||||||
| (Cost $11,972) | $ | 12,024 | ||||||||||
| Short-Term Investments - 3.3% | ||||||||||||
| Other Investment Pools and Funds - 3.3% | ||||||||||||
| 419 | JP Morgan Prime Money Market Fund | $ | 419 | |||||||||
| Total Short-Term Investments | ||||||||||||
| (Cost $419) | $ | 419 | ||||||||||
| Total Investments | ||||||||||||
| (Cost $12,391) ▲ | 98.6 | % | $ | 12,443 | ||||||||
| Other Assets and Liabilities | 1.4 | % | 175 | |||||||||
| Total Net Assets | 100.0 | % | $ | 12,618 | ||||||||
The accompanying notes are an integral part of these financial statements.
| 5 |
Hartford Duration-Hedged Strategic Income Fund
Schedule of Investments – (continued)
October 31, 2014
(000’s Omitted)
| Note: | Percentage of investments as shown is the ratio of the total market value to total net assets. |
For Fund compliance purposes, the Fund may not use the same classification system shown in this report
as these classifications are used for reporting ease.
| ▲ | At October 31, 2014, the cost of securities for federal income tax purposes was $12,391 and the aggregate gross unrealized appreciation and depreciation based on that cost were: |
| Unrealized Appreciation | $ | 52 | ||
| Unrealized Depreciation | — | |||
| Net Unrealized Appreciation | $ | 52 |
Cash pledged and received as collateral in connection with derivatives at October 31, 2014:
| Pledged | Received | |||||||
| Futures contracts | $ | 88 | $ | – | ||||
| Total | $ | 88 | $ | – | ||||
Futures Contracts Outstanding at October 31, 2014
| Number of | Expiration | Notional | Market | Unrealized
Appreciation/(Depreciation) | Variation Margin | |||||||||||||||||||||||||
| Description | Contracts* | Date | Amount | Value ╪ | Asset | Liability | Asset | Liability | ||||||||||||||||||||||
| Short position contracts: | ||||||||||||||||||||||||||||||
| U.S. Treasury 10-Year Note Future | 23 | 12/19/2014 | $ | 2,890 | $ | 2,906 | $ | – | $ | (16 | ) | $ | 6 | $ | – | |||||||||||||||
| U.S. Treasury 2-Year Note Future | 14 | 12/31/2014 | 3,067 | 3,074 | – | (7 | ) | 1 | – | |||||||||||||||||||||
| U.S. Treasury 5-Year Note Future | 29 | 12/31/2014 | 3,441 | 3,464 | – | (23 | ) | 5 | – | |||||||||||||||||||||
| U.S. Treasury CME Ultra Long Term Bond Future | 1 | 12/19/2014 | 154 | 157 | – | (3 | ) | 1 | – | |||||||||||||||||||||
| U.S. Treasury Long Bond Future | 14 | 12/19/2014 | 1,944 | 1,975 | – | (31 | ) | 6 | – | |||||||||||||||||||||
| Total | $ | – | $ | (80 | ) | $ | 19 | $ | – | |||||||||||||||||||||
* The number of contracts does not omit 000's.
| ╪ | See Significant Accounting Policies of accompanying Notes to Financial Statements regarding valuation of securities. |
The accompanying notes are an integral part of these financial statements.
| 6 |
Hartford Duration-Hedged Strategic Income Fund
Schedule of Investments – (continued)
October 31, 2014
(000’s Omitted)
Investment Valuation Hierarchy Level Summary
October 31, 2014
| Total | Level 1 | Level 2 | Level 3 | |||||||||||||
| Assets: | ||||||||||||||||
| Affiliated Investment Companies | $ | 12,024 | $ | 12,024 | $ | – | $ | – | ||||||||
| Short-Term Investments | 419 | 419 | – | – | ||||||||||||
| Total | $ | 12,443 | $ | 12,443 | $ | – | $ | – | ||||||||
| Liabilities: | ||||||||||||||||
| Futures * | $ | 80 | $ | 80 | $ | – | $ | – | ||||||||
| Total | $ | 80 | $ | 80 | $ | – | $ | – | ||||||||
| ♦ | For the period November 29, 2013 (commencement of operations) through October 31, 2014, there were no transfers between Level 1 and Level 2. |
| * | Derivative instruments (excluding purchased and written options, if applicable) are valued at the unrealized appreciation/depreciation on the investments. |
The accompanying notes are an integral part of these financial statements.
| 7 |
Hartford Duration-Hedged Strategic Income Fund
Statement of Assets and Liabilities
October 31, 2014
(000’s Omitted)
| Assets: | ||||
| Investments in securities, at market value (cost $419) | $ | 419 | ||
| Investments in affiliated investment companies, at market value (cost $11,972) | 12,024 | |||
| Cash | 88 | * | ||
| Receivables: | ||||
| Investment securities sold | 63 | |||
| Fund shares sold | 23 | |||
| Dividends and interest | — | |||
| Variation margin on financial derivative instruments | 19 | |||
| Other assets | 73 | |||
| Total assets | 12,709 | |||
| Liabilities: | ||||
| Bank overdraft | 12 | |||
| Payables: | ||||
| Fund shares redeemed | 66 | |||
| Investment management fees | — | |||
| Dividends | — | |||
| Administrative fees | — | |||
| Distribution fees | 1 | |||
| Accrued expenses | 12 | |||
| Total liabilities | 91 | |||
| Net assets | $ | 12,618 | ||
| Summary of Net Assets: | ||||
| Capital stock and paid-in-capital | $ | 12,847 | ||
| Undistributed net investment income | 2 | |||
| Accumulated net realized loss | (203 | ) | ||
| Unrealized depreciation of investments | (28 | ) | ||
| Net assets | $ | 12,618 | ||
| Shares authorized | 450,000 | |||
| Par value | $ | 0.001 | ||
| Class A: Net asset value per share/Maximum offering price per share | $9.90/$10.37 | |||
| Shares outstanding | 734 | |||
| Net assets | $ | 7,266 | ||
| Class C: Net asset value per share | $ | 9.90 | ||
| Shares outstanding | 184 | |||
| Net assets | $ | 1,824 | ||
| Class I: Net asset value per share | $ | 9.90 | ||
| Shares outstanding | 46 | |||
| Net assets | $ | 458 | ||
| Class R3: Net asset value per share | $ | 9.90 | ||
| Shares outstanding | 41 | |||
| Net assets | $ | 407 | ||
| Class R4: Net asset value per share | $ | 9.90 | ||
| Shares outstanding | 41 | |||
| Net assets | $ | 408 | ||
| Class R5: Net asset value per share | $ | 9.90 | ||
| Shares outstanding | 41 | |||
| Net assets | $ | 410 | ||
| Class Y: Net asset value per share | $ | 9.90 | ||
| Shares outstanding | 186 | |||
| Net assets | $ | 1,845 |
* Cash of $88 was pledged as collateral for open financial derivative instruments at October 31, 2014.
The accompanying notes are an integral part of these financial statements.
| 8 |
Hartford Duration-Hedged Strategic Income Fund
Statement of Operations
For the Period November 29, 2013 (commencement of operations) through October 31, 2014
(000’s Omitted)
| Investment Income: | ||||
| Dividends from affiliated investment companies | $ | 337 | ||
| Interest | — | |||
| Total investment income | 337 | |||
| Expenses: | ||||
| Investment management fees | 8 | |||
| Administrative services fees | ||||
| Class R3 | 1 | |||
| Class R4 | 1 | |||
| Class R5 | — | |||
| Transfer agent fees | ||||
| Class A | 6 | |||
| Class C | — | |||
| Class I | — | |||
| Class Y | — | |||
| Distribution fees | ||||
| Class A | 11 | |||
| Class C | 8 | |||
| Class R3 | 2 | |||
| Class R4 | 1 | |||
| Custodian fees | 1 | |||
| Accounting services fees | 1 | |||
| Registration and filing fees | 93 | |||
| Board of Directors' fees | 1 | |||
| Audit fees | 11 | |||
| Other expenses | 15 | |||
| Total expenses (before waivers) | 160 | |||
| Expense waivers | (125 | ) | ||
| Total waivers | (125 | ) | ||
| Total expenses, net | 35 | |||
| Net Investment Income | 302 | |||
| Net Realized Loss on Investments and Other Financial Instruments: | ||||
| Net realized gain on investments in affiliated investment companies | 31 | |||
| Net realized loss on futures contracts | (234 | ) | ||
| Net Realized Loss on Investments and Other Financial Instruments | (203 | ) | ||
| Net Changes in Unrealized Depreciation of Investments and Other Financial Instruments: | ||||
| Net unrealized appreciation of investments in affiliated investment companies | 52 | |||
| Net unrealized depreciation of futures contracts | (80 | ) | ||
| Net Changes in Unrealized Depreciation of Investments and Other Financial Instruments | (28 | ) | ||
| Net Loss on Investments and Other Financial Instruments | (231 | ) | ||
| Net Increase in Net Assets Resulting from Operations | $ | 71 |
The accompanying notes are an integral part of these financial statements.
| 9 |
Hartford Duration-Hedged Strategic Income Fund
Statement of Changes in Net Assets
(000’s Omitted)
For the Period | ||||
| Operations: | ||||
| Net investment income | $ | 302 | ||
| Net realized loss on investments and other financial instruments | (203 | ) | ||
| Net unrealized depreciation of investments and other financial instruments | (28 | ) | ||
| Net Increase in Net Assets Resulting from Operations | 71 | |||
| Distributions to Shareholders: | ||||
| From net investment income | ||||
| Class A | (158 | ) | ||
| Class C | (25 | ) | ||
| Class I | (15 | ) | ||
| Class R3 | (11 | ) | ||
| Class R4 | (13 | ) | ||
| Class R5 | (14 | ) | ||
| Class Y | (64 | ) | ||
| Total distributions | (300 | ) | ||
| Capital Share Transactions: | ||||
| Class A | 7,421 | |||
| Class C | 1,858 | |||
| Class I | 465 | |||
| Class R3 | 411 | |||
| Class R4 | 413 | |||
| Class R5 | 414 | |||
| Class Y | 1,865 | |||
| Net increase from capital share transactions | 12,847 | |||
| Net Increase in Net Assets | 12,618 | |||
| Net Assets: | ||||
| Beginning of period | — | |||
| End of period | $ | 12,618 | ||
| Undistributed (distributions in excess of) net investment income | $ | 2 | ||
* Commencement of operations.
The accompanying notes are an integral part of these financial statements.
| 10 |
Hartford Duration-Hedged Strategic Income Fund
Notes to Financial Statements
October 31, 2014
(000’s Omitted)
Organization:
The Hartford Mutual Funds, Inc. (“Company”) is an open-end management investment company comprised of forty-two portfolios. Financial statements for Hartford Duration-Hedged Strategic Income Fund (the "Fund"), a series of the Company, are included in this report.
The Company is organized under the laws of the State of Maryland and is registered with the Securities and Exchange Commission (“SEC”) under the Investment Company Act of 1940, as amended (“1940 Act”). The Fund is a diversified open-end management investment company. The Fund is an investment company and applies specialized accounting and reporting under Accounting Standards Codification Topic 946, Financial Services - Investment Companies.
Class A shares are sold with a front-end sales charge of up to 4.50%. Class C shares are sold with a contingent deferred sales charge of up to 1.00% on shares redeemed within twelve months of purchase. Class I shares are sold without sales charges to certain eligible investors primarily through advisory fee-based wrap programs. Class R3, R4 and R5 shares, which are offered to employer-sponsored retirement plans, and Class Y shares, which are sold to certain eligible institutional investors, are sold without a sales charge. All classes of shares have identical voting, redemption, dividend, liquidation and other rights and the same terms and conditions, with the exceptions that each class may have different expenses, which may affect performance.
The Fund, as a "Fund of Funds," seeks its investment goal through investment in Class Y shares of The Hartford Strategic Income Fund ("Affiliated Investment Company") and may also invest in one or more unaffiliated money market funds (together with the Affiliated Investment Company, the "Underlying Funds").
Significant Accounting Policies:
The significant accounting policies of the Affiliated Investment Companies are outlined in the shareholder reports for such funds, available (1) without charge, upon request, by calling 888-843-7824, (2) on our website www.hartfordfunds.com and (3) on the SEC’s website at www.sec.gov. The reports may be reviewed and copied at the Commission’s Public Reference Room in Washington, DC. Information on the operation of the Public Reference Room may be obtained by calling 1-800-SEC-0330. The significant accounting policies of the Affiliated Investment Companies are not covered by this report.
The following is a summary of significant accounting policies of the Fund in the preparation of its financial statements, which are in accordance with United States generally accepted accounting principles (“U.S. GAAP”). The preparation of financial statements in accordance with U.S. GAAP may require management to make estimates and assumptions that affect the reported amounts of assets and liabilities and disclosure of contingent assets and liabilities at the date of the financial statements and the reported amounts of increases and decreases in net assets from operations during the reporting period. Actual results could differ from those estimates.
Determination of Net Asset Value – The per share net asset value ("NAV") of each class of the Fund's shares is determined as of the close of regular trading (normally 4:00 p.m. Eastern Time) (the “NYSE Close”) on each day that the New York Stock Exchange (the “Exchange”) is open (“Valuation Date”). Information that becomes known to the Fund after the NAV has been calculated on a particular day will not generally be used to retroactively adjust the NAV determined earlier that day.
Investment Valuation and Fair Value Measurements – Investments in open-end mutual funds are valued at the respective NAV of each Underlying Fund as determined as of the NYSE Close on the Valuation Date. The Fund generally uses market prices in valuing the remaining portfolio investments. If market prices are not readily available or are deemed unreliable, the Fund will use the fair value of the investment as determined in good faith under policies and procedures established by and under the supervision of the Company’s Board of Directors.
Exchange traded options, futures and options on futures are valued at the settlement price or last trade price determined by the relevant exchange as of the NYSE Close. If the last trade price for exchange traded options does not fall between the bid and ask prices, the value will be the mean of the bid and ask prices as of the NYSE Close. If a last trade price is not available, the value will be the mean of the bid and ask prices as of the NYSE Close. If a mean of the bid and ask prices cannot be calculated for the day, the value will be the bid price as of the NYSE Close. In the case of over-the-counter ("OTC") options and such instruments that do not
| 11 |
Hartford Duration-Hedged Strategic Income Fund
Notes to Financial Statements – (continued)
October 31, 2014
(000’s Omitted)
trade on an exchange, values may be supplied by a pricing service using a formula or other objective method that may take into consideration the style, direction, expiration, strike price, notional value and volatility or other special adjustments.
U.S. GAAP defines fair value as the price that the Fund would receive to sell an asset or pay to transfer a liability in an orderly transaction between market participants. The U.S. GAAP fair value measurement standards require disclosure of a fair value hierarchy for each major category of assets and liabilities. Various inputs are used in determining the fair value of the Fund’s investments. These inputs are summarized into three broad hierarchy levels. This hierarchy is based on whether the valuation inputs are observable or unobservable. These levels are:
Level 1 – Quoted prices in active markets for identical investments. Level 1 may include exchange traded instruments, such as domestic equities, some foreign equities, options, futures, mutual funds, exchange traded funds, rights and warrants.
Level 2 – Observable inputs other than Level 1 prices, such as quoted prices for similar investments; quoted prices in markets that are not active; or other inputs that are observable or can be corroborated by observable market data. Level 2 may include debt investments that are traded less frequently than exchange traded instruments and which are valued using independent pricing services; foreign equities, which are principally traded on certain foreign markets and are adjusted daily pursuant to a fair value pricing service in order to reflect an adjustment for the factors occurring after the close of certain foreign markets but before the NYSE Close; senior floating rate interests, which are valued using an aggregate of dealer bids; short-term investments, which are valued at amortized cost; and swaps, which are valued based upon the terms of each swap contract.
Level 3 – Significant unobservable inputs that are supported by limited or no market activity. Level 3 may include financial instruments whose values are determined using indicative market quotes or require significant management judgment or estimation. These unobservable valuation inputs may include estimates for current yields, maturity/duration, prepayment speed, and indicative market quotes for comparable investments along with other assumptions relating to credit quality, collateral value, complexity of the investment structure, general market conditions and liquidity. This category may include investments where trading has been halted or there are certain restrictions on trading. While these investments are priced using unobservable inputs, the valuation of these investments reflects the best available data and management believes the prices are a reasonable representation of exit price.
Valuation levels are not necessarily indicative of the risk associated with investing in such investments. Individual investments within any of the above mentioned asset classes may be assigned a different hierarchical level than those presented above, as individual circumstances dictate.
For additional information, refer to the Investment Valuation Hierarchy Level Summary which follows the Schedule of Investments.
Investment Transactions and Investment Income – Investment transactions are recorded as of the trade date (the date the order to buy or sell is executed) for financial reporting purposes. Investments purchased or sold on a when-issued or delayed-delivery basis may be settled a month or more after the trade date. Realized gains and losses are determined on the basis of identified cost.
Dividend income is accrued on the ex-dividend date. Income and capital gain distributions from the Underlying Funds are accrued on the ex-dividend date. Interest income is accrued on a daily basis.
Fund Share Valuation and Dividend Distributions to Shareholders – Orders for the Fund’s shares are executed in accordance with the investment instructions of the shareholders. The NAV of the Fund’s shares is determined as of the close of business on each business day of the Exchange. The NAV is determined separately for each class of shares of the Fund by dividing the Fund’s net assets attributable to that class by the number of shares of the class outstanding. Each class of shares offered by the Fund has equal rights as to assets and voting privileges (except that shareholders of a class have exclusive voting rights regarding any matter relating solely to that class of shares). Income and non-class specific expenses are allocated daily to each class on the basis of the relative net assets of the class. Realized and unrealized gains and losses are allocated daily based on the relative net assets of each class of shares of the Fund.
| 12 |
Hartford Duration-Hedged Strategic Income Fund
Notes to Financial Statements – (continued)
October 31, 2014
(000’s Omitted)
Orders for the purchase of the Fund’s shares received prior to the close of the Exchange on any day the Exchange is open for business are priced at the NAV determined as of the close of the Exchange. Orders received after the close of the Exchange, or on a day on which the Exchange and/or the Fund is not open for business, are priced at the next determined NAV.
Dividends are declared pursuant to a policy adopted by the Company's Board of Directors based upon the investment performance of the Fund. The policy of the Fund is to pay dividends from net investment income, if any, monthly and realized gains, if any, at least once a year. Long-term capital gain distributions are distributed by the Underlying Funds at least annually, when required. Unless shareholders specify otherwise, all dividends and distributions will be automatically reinvested in additional full or fractional shares of the Fund.
Net investment income, dividends and distributions from net realized gains and capital are determined in accordance with federal income tax regulations, which may differ from U.S. GAAP with respect to character and timing (see Federal Income Taxes: Distributions and Components of Distributable Earnings and Reclassification of Capital Accounts).
Financial Derivative Instruments:
The following disclosures contain information on how and why the Fund uses derivative instruments, the credit-risk-related contingent features in certain derivative instruments and how derivative instruments affect the Fund’s financial position and results of operations. The location and fair value amounts of these instruments on the Statement of Assets and Liabilities and the realized gains and losses and changes in unrealized gains and losses on the Statement of Operations, each categorized by type of derivative contract, are included in the following Additional Derivative Instrument Information footnote. The derivative instruments outstanding as of period-end are disclosed in the notes to the Schedule of Investments, if applicable. The amounts of realized gains and losses and changes in unrealized gains and losses on derivative instruments during the period are disclosed in the Statement of Operations.
Futures Contracts – The Fund may enter into futures contracts. A futures contract is an agreement between two parties to buy or sell an asset at a set price on a future date. The Fund uses futures contracts to manage or obtain exposure to the investment markets, commodities, or movements in interest rates and currency values. The primary risks associated with the use of futures contracts are the imperfect correlation between the change in market value of the investments held by the Fund and the prices of futures contracts and the possibility of an illiquid market. Upon entering into a futures contract, the Fund is required to deposit with a futures commission merchant (“FCM”) an amount of cash or U.S. Government or Agency Obligations in accordance with the initial margin requirements of the broker or exchange. Futures contracts are marked to market daily at the most recent settlement price reported by an exchange on which, over time, they are traded most extensively, and an appropriate payable or receivable for the change in value (“variation margin”) is recorded by the Fund. Gains or losses are recognized but not considered realized until the contracts expire or are closed. Futures contracts involve, to varying degrees, risk of loss in excess of the variation margin disclosed on the Statement of Assets and Liabilities; however, the Fund seeks to reduce this risk through the use of an FCM. The Fund, as shown on the Schedule of Investments, had outstanding futures contracts as of October 31, 2014.
Additional Derivative Instrument Information:
Fair Value of Derivative Instruments on the Statement of Assets and Liabilities as of October 31, 2014:
| Risk Exposure Category | ||||||||||||||||||||||||||||
| Interest Rate Contracts | Foreign Exchange Contracts | Credit Contracts | Equity Contracts | Commodity Contracts | Other Contracts | Total | ||||||||||||||||||||||
| Assets: | ||||||||||||||||||||||||||||
| Variation margin receivable * | $ | 19 | $ | — | $ | — | $ | — | $ | — | $ | — | $ | 19 | ||||||||||||||
| Total | $ | 19 | $ | — | $ | — | $ | — | $ | — | $ | — | $ | 19 | ||||||||||||||
| * | Only current day's variation margin is reported within the Statement of Assets and Liabilities. The variation margin is included in the open futures net cumulative depreciation of $(80) as reported in the Schedule of Investments. |
The volume of derivatives that is presented in the Schedule of Investments is consistent with the derivative activity during the period November 29, 2013 (commencement of operations) through October 31, 2014.
| 13 |
Hartford Duration-Hedged Strategic Income Fund
Notes to Financial Statements – (continued)
October 31, 2014
(000’s Omitted)
The Effect of Derivative Instruments on the Statement of Operations for the period November 29, 2013 (commencement of operations) through October 31, 2014:
| Risk Exposure Category | ||||||||||||||||||||||||||||
| Interest Rate Contracts | Foreign Exchange Contracts | Credit Contracts | Equity Contracts | Commodity Contracts | Other Contracts | Total | ||||||||||||||||||||||
| Realized Loss on Derivatives Recognized as a Result of Operations: | ||||||||||||||||||||||||||||
| Net realized loss on futures contracts | $ | (234 | ) | $ | — | $ | — | $ | — | $ | — | $ | — | $ | (234 | ) | ||||||||||||
| Total | $ | (234 | ) | $ | — | $ | — | $ | — | $ | — | $ | — | $ | (234 | ) | ||||||||||||
| Net Change in Unrealized Appreciation (Depreciation) on Derivatives Recognized as a Result of Operations: | ||||||||||||||||||||||||||||
| Net change in unrealized depreciation of futures contracts | $ | (80 | ) | $ | — | $ | — | $ | — | $ | — | $ | — | $ | (80 | ) | ||||||||||||
| Total | $ | (80 | ) | $ | — | $ | — | $ | — | $ | — | $ | — | $ | (80 | ) | ||||||||||||
Balance Sheet Offsetting Information - The following discloses both gross information and net information about instruments and transactions eligible for offset in the financial statements, and instruments and transactions that are subject to a master netting arrangement, as well as amounts related to margin, reflected as financial collateral (including cash collateral), held at clearing brokers, counterparties and the Fund’s custodian. The master netting arrangements allow the clearing brokers to net any collateral held in or on behalf of the Fund, or liabilities or payment obligations of the clearing brokers to the Fund, against any liabilities or payment obligations of the Fund to the clearing brokers. The Fund is required to deposit financial collateral (including cash collateral) at the FCM's custodian on behalf of clearing brokers and counterparties to continually meet the original and maintenance requirements established by the clearing brokers and counterparties. Such requirements are specific to the respective clearing broker or counterparty. Certain master netting arrangements may not be enforceable in the bankruptcy proceedings of a counterparty.
Offsetting of Financial Assets and Derivative Assets as of October 31, 2014:
| Gross
Amounts* of Assets Presented in Statement of Assets and Liabilities | Financial Instruments with Allowable Netting | Non-cash Collateral Received | Cash
Collateral Received | Net
Amount (not less than $0) | ||||||||||||||||
| Description | ||||||||||||||||||||
| Futures contracts - variation margin receivable | $ | 19 | $ | — | $ | — | $ | — | ♦ | $ | 19 | |||||||||
| Total subject to a master netting or similar arrangement | $ | 19 | $ | — | $ | — | $ | — | $ | 19 | ||||||||||
| * | Gross amounts are presented here as there are no amounts that are netted within the Statement of Assets and Liabilities. |
| ♦ | The Fund has pledged $88 as collateral for open futures contracts held at October 31, 2014. |
Principal Risks:
The Fund may be exposed to counterparty risk, or the risk that an institution or other entity with which the Fund has unsettled or open transactions will default.
The Fund is exposed to the risks of the Underlying Funds in direct proportion to the amount of assets the Fund allocates to each Underlying Fund. The market values of the Underlying Funds may decline due to general market conditions which are not specifically related to a particular company in which the Underlying Fund invested, such as real or perceived adverse economic conditions, changes in the general outlook for corporate earnings, changes in interest or currency rates or adverse investor sentiment generally. The market value of equity securities in which the Underlying Funds invest may also decline due to factors which affect a particular industry or industries, such as labor shortages or increased production costs and competitive conditions within an industry.
Federal Income Taxes:
Federal Income Taxes – For federal income tax purposes, the Fund intends to continue to qualify as a Regulated Investment Company ("RIC") under Subchapter M of the Internal Revenue Code (“IRC”) by distributing substantially all of its taxable net
| 14 |
Hartford Duration-Hedged Strategic Income Fund
Notes to Financial Statements – (continued)
October 31, 2014
(000’s Omitted)
investment income and net realized capital gains to its shareholders and otherwise complying with the requirements of the IRC. The Fund has distributed substantially all of its income and capital gains in prior years, if applicable, and intends to distribute substantially all of its income and capital gains during the calendar year ending December 31, 2014. Accordingly, no provision for federal income or excise taxes has been made in the accompanying financial statements. Distributions from short-term capital gains are treated as ordinary income distributions for federal income tax purposes.
Net Investment Income (Loss), Net Realized Gains (Losses) and Distributions – Net investment income (loss) and net realized gains (losses) may differ for financial statement and tax purposes primarily because of losses deferred due to wash sale adjustments, foreign currency gains and losses, adjustments related to Passive Foreign Investment Companies ("PFICs"), Real Estate Investment Trusts ("REITs"), RICs, certain derivatives and partnerships. The character of distributions made during the year from net investment income or net realized gains may differ from their ultimate characterization for federal income tax purposes. Also, due to the timing of dividend distributions, the fiscal year in which amounts are distributed may differ from the year that the income or realized gains (losses) were recorded by the Fund.
Distributions and Components of Distributable Earnings – The tax character of distributions paid by the Fund for the periods indicated is as follows (as adjusted for dividends payable, if applicable):
| For the Year Ended October 31, 2014 * | ||||
| Ordinary Income | $ | 300 | ||
| * | Commenced operations on November 29, 2013. |
As of October 31, 2014, the Fund’s components of distributable earnings (deficit) on a tax basis are as follows:
| Amount | ||||
| Undistributed Ordinary Income | $ | 2 | ||
| Accumulated Capital and Other Losses* | (283 | ) | ||
| Unrealized Appreciation† | 52 | |||
| Total Accumulated Deficit | $ | (229 | ) | |
| * | The Fund has capital loss carryforwards that are identified in the Capital Loss Carryforward note that follows. | |
| † | Differences between book-basis and tax-basis unrealized appreciation (depreciation) may be attributable to the losses deferred due to wash sale adjustments, foreign currency gains and losses, adjustments related to PFICs, REITs, RICs, certain derivatives and partnerships. |
Capital Loss Carryforward – Under the Regulated Investment Company Modernization Act of 2010 funds are permitted to carry forward capital losses for an unlimited period. Additionally, capital loss carryforwards retain their character as either short-term or long-term capital losses rather than being considered all short-term as permitted under prior regulation.
At October 31, 2014 (tax year end), the Fund had capital loss carryforwards for U.S. federal income tax purposes as follows:
| Amount | ||||
| Short-Term Capital Loss Carryforward | $ | 94 | ||
| Long-Term Capital Loss Carryforward | 189 | |||
| Total | $ | 283 | ||
Accounting for Uncertainty in Income Taxes – The Fund has adopted financial reporting rules that require the Fund to analyze all open tax years, as defined by the statute of limitations, for all major jurisdictions. Generally, tax authorities can examine all tax returns filed for the last three years. The Fund does not have an examination in progress.
The Fund is also not aware of any tax positions for which it is reasonably possible that the total amounts of unrecognized tax benefits will significantly change in the next twelve months.
| 15 |
Hartford Duration-Hedged Strategic Income Fund
Notes to Financial Statements – (continued)
October 31, 2014
(000’s Omitted)
Expenses:
Investment Management Agreement – Hartford Funds Management Company, LLC ("HFMC") serves as the Fund’s investment manager pursuant to an Investment Management Agreement with the Company. HFMC is an indirect wholly owned subsidiary of The Hartford Financial Services Group, Inc. ("The Hartford"). The investment manager has overall investment supervisory responsibility for the Fund. In addition, the investment manager provides administrative personnel, services, equipment, facilities and office space for proper operation of the Fund. HFMC has contracted with Wellington Management Company, LLP ("Wellington Management") under a sub-advisory agreement for the provision of day-to-day investment management services to the Fund in accordance with the Fund’s investment objective and policies. The Fund pays a fee to the investment manager, a portion of which may be used to compensate Wellington Management.
The schedule below reflects the rates of compensation paid to the investment manager for investment management services rendered as of October 31, 2014; the rates are accrued daily and paid monthly:
| Average Daily Net Assets | Annual Fee | |
| On first $500 million | 0.100% | |
| On next $500 million | 0.090% | |
| On next $1.5 billion | 0.085% | |
| On next $2.5 billion | 0.080% | |
| On next $2.5 billion | 0.075% | |
| On next $2.5 billion | 0.070% | |
| Over $10 billion | 0.065% |
Accounting Services Agreement – Pursuant to the Fund Accounting Agreement between HFMC and the Company, on behalf of the Fund, HFMC provides accounting services to the Fund and receives monthly compensation based on the Fund’s average daily net assets at the rates set forth below. The Fund’s accounting services fees are accrued daily and paid monthly.
| Average Daily Net Assets | Annual Fee | |
| On first $5 billion | 0.014% | |
| On next $5 billion | 0.012% | |
| Over $10 billion | 0.010% |
Operating Expenses – Allocable expenses incurred by the Company are allocated to each Fund and allocated to classes within the Fund in proportion to the average daily net assets of the Fund and each class, except where allocation of certain expenses is more fairly made directly to the Fund or to specific classes within a Fund. As of October 31, 2014, HFMC contractually limited the total operating expenses of this Fund, exclusive of taxes, interest expense, brokerage commissions and extraordinary expenses, through February 28, 2015 as follows:
| Class A | Class C | Class I | Class R3 | Class R4 | Class R5 | Class Y | ||||||
| 1.15% | 1.90% | 0.90% | 1.45% | 1.15% | 0.85% | 0.75% |
Contractual limitations for total operating expenses include expenses incurred as the result of investing in other investment companies including the Underlying Funds. Amounts incurred which exceed the above limits are deducted from expenses and are reported as expense waivers on the accompanying Statement of Operations, as applicable.
Distribution and Service Plan for Class A, C, R3 and R4 Shares – Hartford Funds Distributors, LLC ("HFD"), an indirect wholly owned subsidiary of The Hartford, is the principal underwriter and distributor of the Fund. HFD is engaged in distribution activities, which include marketing and distribution of shares through broker/dealers, financing distribution costs and maintaining financial books and records. For the period November 29, 2013 (commencement of operations) through October 31, 2014, HFD received front-end load sales charges of $3 and contingent deferred sales charges of an amount which rounds to zero from the Fund.
| 16 |
Hartford Duration-Hedged Strategic Income Fund
Notes to Financial Statements – (continued)
October 31, 2014
(000’s Omitted)
The Fund has adopted a Distribution and Service Plan in accordance with Rule 12b-1 of the 1940 Act to compensate the distributor (HFD) for activities intended to result in the sale and distribution of Class A, C, R3 and R4 shares and for providing services for shareholders. The Rule 12b-1 plan applicable to Class A shares of the Fund provides for payment of a Rule 12b-1 fee of 0.25% of average daily net assets. Some or all of the fee may be used for shareholder servicing expenses with the remainder used for distribution expenses. Under the Class C Plan, the Fund pays the distributor 1.00% of the average daily net assets of Class C shares outstanding, 0.25% of which is intended as a fee for services provided to existing shareholders with the remainder used for distribution expenses. For Class C shares, some or the entire fee may be remitted to broker/dealers for distribution and/or shareholder account services. Class R3 shares have a distribution fee of 0.50% of average daily net assets and Class R4 shares have a distribution fee of 0.25% of average daily net assets. For Class R3 and R4 shares, some or the entire fee may be remitted to broker/dealers for distribution and/or shareholder account services. The Fund’s 12b-1 fees are accrued daily and paid monthly or at such other intervals as the Board of Directors may determine.
Other Related Party Transactions – Certain officers of the Fund are directors and/or officers of HFMC and/or The Hartford or its subsidiaries. For the period November 29, 2013 (commencement of operations) through October 31, 2014, a portion of the Fund’s Chief Compliance Officer’s compensation was paid by all of the investment companies in the Hartford fund complex. The portion allocated to the Fund, as represented in other expenses on the Statement of Operations, rounds to zero. Hartford Administrative Services Company (“HASCO”), an indirect wholly-owned subsidiary of The Hartford, provides transfer agent services to the Fund. HASCO has contractually agreed to reimburse any portion of the transfer agency fees over 0.30% of average daily net assets per fiscal year for each class. Any transfer agency fee reimbursement is determined before considering the contractual operating expense limitation. For providing such services, HASCO is compensated on a per account basis that varies by account type, except with respect to Class Y, for which it is compensated based on average daily net assets. The amount paid to HASCO and any related contractual reimbursement amounts, if applicable, can be found in the Statement of Operations. These fees are accrued daily and paid monthly.
Administrative services fees are paid to HASCO for third-party recordkeeping services that are payable as a percentage of net assets in the amount of up to 0.20%, 0.15% and 0.10% for Classes R3, R4 and R5 shares, respectively. The total administrative services fees are shown on the Statement of Operations. These fees are accrued daily and paid monthly.
Affiliate Holdings:
As of October 31, 2014, affiliates of The Hartford had ownership of shares in the Fund as follows:
| Percentage of Class | Percentage of Fund | |||||||
| Class A | 17 | % | 10 | % | ||||
| Class C | 22 | 3 | ||||||
| Class I | 89 | 3 | ||||||
| Class R3 | 100 | 3 | ||||||
| Class R4 | 100 | 3 | ||||||
| Class R5 | 100 | 3 | ||||||
| Class Y | 100 | 15 | ||||||
Investment Transactions:
For the period November 29, 2013 (commencement of operations) through October 31, 2014, the cost of purchases and proceeds from sales of investment securities (excluding short-term investments) were as follows:
| Excluding U.S. Government Obligations | U.S. Government Obligations | Total | ||||||||||
| Cost of Purchases | $ | 14,241 | $ | — | $ | 14,241 | ||||||
| Sales Proceeds | 2,300 | — | 2,300 | |||||||||
| 17 |
Hartford Duration-Hedged Strategic Income Fund
Notes to Financial Statements – (continued)
October 31, 2014
(000’s Omitted)
Capital Share Transactions:
The following information is for the period November 29, 2013 (commencement of operations) through October 31, 2014:
| For the Period Ended October 31, 2014 | ||||||||||||||||
| Shares Sold | Shares Issued for Reinvested Dividends | Shares Redeemed | Net Increase (Decrease) of Shares | |||||||||||||
| Class A | ||||||||||||||||
| Shares | 930 | 16 | (212 | ) | 734 | |||||||||||
| Amount | $ | 9,367 | $ | 158 | $ | (2,104 | ) | $ | 7,421 | |||||||
| Class C | ||||||||||||||||
| Shares | 184 | 2 | (2 | ) | 184 | |||||||||||
| Amount | $ | 1,856 | $ | 25 | $ | (23 | ) | $ | 1,858 | |||||||
| Class I | ||||||||||||||||
| Shares | 48 | 1 | (3 | ) | 46 | |||||||||||
| Amount | $ | 481 | $ | 15 | $ | (31 | ) | $ | 465 | |||||||
| Class R3 | ||||||||||||||||
| Shares | 40 | 1 | — | 41 | ||||||||||||
| Amount | $ | 400 | $ | 11 | $ | — | $ | 411 | ||||||||
| Class R4 | ||||||||||||||||
| Shares | 40 | 1 | — | 41 | ||||||||||||
| Amount | $ | 400 | $ | 13 | $ | — | $ | 413 | ||||||||
| Class R5 | ||||||||||||||||
| Shares | 40 | 1 | — | 41 | ||||||||||||
| Amount | $ | 400 | $ | 14 | $ | — | $ | 414 | ||||||||
| Class Y | ||||||||||||||||
| Shares | 180 | 6 | — | 186 | ||||||||||||
| Amount | $ | 1,801 | $ | 64 | $ | — | $ | 1,865 | ||||||||
| Total | ||||||||||||||||
| Shares | 1,462 | 28 | (217 | ) | 1,273 | |||||||||||
| Amount | $ | 14,705 | $ | 300 | $ | (2,158 | ) | $ | 12,847 | |||||||
Line of Credit:
The Fund is one of several Hartford Funds that participate in a $500 million committed revolving line of credit facility. The facility is to be used for temporary or emergency purposes. Under the arrangement, the funds are required to own securities having a market value in excess of 300% of the total bank borrowings. The interest rate on borrowings varies depending on the nature of the loan. The facility also requires a fee to be paid based on the amount of the commitment. This commitment fee is allocated to all the funds participating in the line of credit based on the average net assets of the funds. During the period November 29, 2013 (commencement of operations) through October 31, 2014, the Fund did not have any borrowings under this facility.
Pending Legal Proceedings:
On February 25, 2011, Jennifer L. Kasilag, Louis Mellinger, Judith M. Menendez, Jacqueline M. Robinson, and Linda A. Russell filed a derivative lawsuit against Hartford Investment Financial Services, LLC (“HIFSCO”) (now known as HFD) on behalf of six Hartford retail mutual funds in the United States District Court for the District of New Jersey, alleging that HIFSCO received excessive advisory and distribution fees in violation of its statutory fiduciary duty under Section 36(b) of the 1940 Act when serving as investment manager and principal underwriter, respectively, to the Hartford retail mutual funds. Although this action was purportedly filed on behalf of certain of the Hartford Funds, none of the Hartford Funds is itself a defendant to the suit. HIFSCO moved to dismiss and, in September 2011, the motion was granted in part and denied in part, with leave to amend the complaint. In November 2011, plaintiffs filed an amended complaint on behalf of certain Hartford retail mutual funds, The Hartford Global Health Fund (now known as The Hartford Healthcare Fund), The Hartford Conservative Allocation Fund, The Hartford Growth Opportunities Fund, The Hartford Inflation Plus Fund, The Hartford Advisers Fund (now known as The Hartford Balanced Fund), and The Hartford Capital Appreciation Fund. Plaintiffs seek to rescind the investment management agreements and distribution plans between HIFSCO and these funds and to recover the total fees charged thereunder or, in the alternative, to recover any improper compensation HIFSCO received, in addition to lost earnings. HIFSCO filed a partial motion to
| 18 |
Hartford Duration-Hedged Strategic Income Fund
Notes to Financial Statements – (continued)
October 31, 2014
(000’s Omitted)
dismiss the amended complaint and, in December 2012, the court dismissed without prejudice the claims regarding distribution fees and denied the motion with respect to the advisory fees claims. HIFSCO disputes the allegations and intends to defend vigorously.
In March 2014, the plaintiffs filed a new complaint that added as new plaintiffs The Hartford Floating Rate Fund and The Hartford Small Company Fund and named as a defendant HFMC, which assumed the role as investment manager to the funds as of January 2013. HFMC and HIFSCO dispute the allegations and intend to defend vigorously.
No accrual for litigation relating to this matter has been recorded in the financial statements of the Fund because the Fund is not party to the suit.
Indemnifications:
Under the Company's organizational documents, the Company shall indemnify its officers and directors to the full extent required or permitted under Maryland General Corporation Law and the federal securities laws. In addition, the Company, on behalf of the Fund, may enter into contracts that contain a variety of indemnifications. The Company's maximum exposure under these arrangements is unknown. However, as of the date of these financial statements, the Company has not had prior claims or losses pursuant to these contracts and expects the risk of loss to be remote.
Subsequent Event:
Effective December 1, 2014, pursuant to a sub-transfer agency agreement between HASCO and Boston Financial Data Services, Inc. (“BFDS”), HASCO has delegated certain transfer agent, dividend disbursing agent and shareholder servicing agent functions to BFDS. The costs and expenses of such delegation are borne by HASCO, not by the Fund.
| 19 |
Hartford Duration-Hedged Strategic Income Fund
Financial Highlights
| - Selected Per-Share Data - (A) | - Ratios and Supplemental Data - | |||||||||||||||||||||||||||||||||||||||||||||||||||
| Class | Net
Asset Value at Beginning of Period | Net
Investment Income (Loss) | Net
Realized and Unrealized Gain (Loss) on Invest- ments | Total
from Investment Operations | Dividends
from Net Investment Income | Distribu- tions from Realized Capital Gains | Total
Dividends and Distributions | Net
Asset Value at End of Period | Total
Return(B) | Net
Assets at End of Period (000's) | Ratio
of Expenses to Average Net Assets Before Adjust- ments(C),(D) | Ratio
of Expenses to Average Net Assets After Adjust- ments(C),(D) | Ratio
of Net Investment Income (Loss) to Average Net Assets(D) | |||||||||||||||||||||||||||||||||||||||
| From November 29, 2013 (commencement of operations), through October 31, 2014 | ||||||||||||||||||||||||||||||||||||||||||||||||||||
| A(E) | $ | 10.00 | $ | 0.34 | $ | (0.12 | ) | $ | 0.22 | $ | (0.32 | ) | $ | – | $ | (0.32 | ) | $ | 9.90 | 2.17 | %(F) | $ | 7,266 | 1.87 | %(G) | 0.41 | %(G) | 3.60 | %(G) | |||||||||||||||||||||||
| C(E) | 10.00 | 0.29 | (0.13 | ) | 0.16 | (0.26 | ) | – | (0.26 | ) | 9.90 | 1.60 | (F) | 1,824 | 2.55 | (G) | 1.09 | (G) | 3.02 | (G) | ||||||||||||||||||||||||||||||||
| I(E) | 10.00 | 0.35 | (0.10 | ) | 0.25 | (0.35 | ) | – | (0.35 | ) | 9.90 | 2.45 | (F) | 458 | 1.62 | (G) | 0.16 | (G) | 3.72 | (G) | ||||||||||||||||||||||||||||||||
| R3(E) | 10.00 | 0.29 | (0.10 | ) | 0.19 | (0.29 | ) | – | (0.29 | ) | 9.90 | 1.83 | (F) | 407 | 2.32 | (G) | 0.86 | (G) | 3.01 | (G) | ||||||||||||||||||||||||||||||||
| R4(E) | 10.00 | 0.31 | (0.10 | ) | 0.21 | (0.31 | ) | – | (0.31 | ) | 9.90 | 2.10 | (F) | 408 | 2.02 | (G) | 0.56 | (G) | 3.31 | (G) | ||||||||||||||||||||||||||||||||
| R5(E) | 10.00 | 0.34 | (0.10 | ) | 0.24 | (0.34 | ) | – | (0.34 | ) | 9.90 | 2.38 | (F) | 410 | 1.72 | (G) | 0.26 | (G) | 3.60 | (G) | ||||||||||||||||||||||||||||||||
| Y(E) | 10.00 | 0.35 | (0.10 | ) | 0.25 | (0.35 | ) | – | (0.35 | ) | 9.90 | 2.47 | (F) | 1,845 | 1.62 | (G) | 0.16 | (G) | 3.70 | (G) | ||||||||||||||||||||||||||||||||
| (A) | Information presented relates to a share outstanding throughout the indicated period. Net investment income (loss) per share amounts are calculated based on average shares outstanding unless otherwise noted. |
| (B) | Assumes initial investment at net asset value at the beginning of each period, reinvestment of all distributions, the complete redemption of the investment at net asset value at the end of each period and no sales charge. Total return would be reduced if sales charges were taken into account. |
| (C) | Adjustments include waivers and reimbursements, if applicable. |
| (D) | Ratios do not include expenses of the Underlying Funds and/or other investment companies, if applicable. |
| (E) | Commenced operations on November 29, 2013. |
| (F) | Not annualized. |
| (G) | Annualized. |
| Portfolio Turnover Rate for All Share Classes | ||||
| From November 29, 2013 (commencement of operations) through October 31, 2014 | 27 | %(A) | ||
| (A) | Not annualized. |
| 20 |
Report of Independent Registered Public Accounting Firm
The Board of Directors and Shareholders of
The Hartford Mutual Funds, Inc.
We have audited the accompanying statement of assets and liabilities, including the schedule of investments, of Hartford Duration-Hedged Strategic Income Fund (one of the portfolios constituting The Hartford Mutual Funds, Inc. (the Funds)) as of October 31, 2014, and the related statement of operations, the statement of changes in net assets, and the financial highlights for the period from November 29, 2013 (commencement of operations) to October 31, 2014. These financial statements and financial highlights are the responsibility of the Funds’ management. Our responsibility is to express an opinion on these financial statements and financial highlights based on our audit.
We conducted our audit in accordance with the standards of the Public Company Accounting Oversight Board (United States). Those standards require that we plan and perform the audit to obtain reasonable assurance about whether the financial statements and financial highlights are free of material misstatement. We were not engaged to perform an audit of the Funds’ internal control over financial reporting. Our audit included consideration of internal control over financial reporting as a basis for designing audit procedures that are appropriate in the circumstances, but not for the purpose of expressing an opinion on the effectiveness of the Funds’ internal control over financial reporting. Accordingly, we express no such opinion. An audit also includes examining, on a test basis, evidence supporting the amounts and disclosures in the financial statements and financial highlights, assessing the accounting principles used and significant estimates made by management, and evaluating the overall financial statement presentation. Our procedures included confirmation of securities owned as of October 31, 2014, by correspondence with the custodian. We believe that our audit provides a reasonable basis for our opinion.
In our opinion, the financial statements and financial highlights referred to above present fairly, in all material respects, the financial position of Hartford Duration-Hedged Strategic Income Fund of The Hartford Mutual Funds, Inc. at October 31, 2014, the results of its operations, the changes in its net assets, and the financial highlights for the period from November 29, 2013 (commencement of operations) to October 31, 2014, in conformity with U.S. generally accepted accounting principles.
Minneapolis, Minnesota
December 18, 2014
| 21 |
Hartford Duration-Hedged Strategic Income Fund
Directors and Officers (Unaudited)
The Board of Directors of the Company (the "Directors") appoints officers who are responsible for the day-to-day operations of the Fund and who execute policies formulated by the Directors. Each Director serves until his or her death, resignation, or retirement or until the next annual meeting of shareholders is held or until his or her successor is elected and qualifies.
Directors and officers who are employed by or who have a financial interest in The Hartford Financial Services Group, Inc. ("The Hartford") are considered “interested” persons of the Fund pursuant to the 1940 Act. Each officer and two of the Company's Directors, as noted in the chart below, are “interested” persons of the Fund. Each Director serves as a director for The Hartford Mutual Funds, Inc., The Hartford Mutual Funds II, Inc., Hartford Series Fund, Inc., and Hartford HLS Series Fund II, Inc., and as a trustee for The Hartford Alternative Strategies Fund, which, as of October 31, 2014, collectively consist of 66 funds. Correspondence may be sent to Directors and officers c/o Hartford Funds, 5 Radnor Corporate Center, Suite 300, 100 Matsonford Road, Radnor, Pennsylvania 19087, except that correspondence to Mr. Annoni, Mr. Dressen and Ms. Quade may be sent to 500 Bielenberg Drive, Suite 500, Woodbury, Minnesota 55125.
The table below sets forth, for each Director and officer, his or her name, year of birth, current position with the Company and date first elected or appointed to The Hartford Mutual Funds, Inc. ("MF") and The Hartford Mutual Funds II, Inc. ("MF2"), principal occupation, and, for Directors, other directorships held. The Fund’s Statement of Additional Information contains further information on the Directors and is available free of charge by calling 1-888-843-7824 or writing to: Hartford Funds, P.O. Box 55022, Boston, MA 02205-5022.
Information on the aggregate remuneration paid to the directors of the Company can be found in the Statement of Operations herein. The Fund pays to The Hartford a portion of the Chief Compliance Officer’s compensation, but does not pay salaries or compensation to any of its other officers or Directors who are employed by The Hartford.
Non-Interested Directors
Hilary E. Ackermann (1956) Director since September 23, 2014
Ms. Ackermann served as Chief Risk Officer at Goldman Sachs Bank USA from October 2008 to November 2011 and serves as a Director of Dynegy, Inc., an independent power company, from October 2012 to present.
Lynn S. Birdsong (1946) Director since 2003, Chairman of the Investment Committee since 2014
| Mr. Birdsong is a private investor. Mr. Birdsong currently serves as a Director of the Sovereign High Yield Investment Company (April 2010 to current). Mr. Birdsong currently serves as an Independent Director of Nomura Partners Funds, Inc. (formerly, The Japan Fund) (April 2003 to current). From 2003 to March 2005, Mr. Birdsong was an Independent Director of the Atlantic Whitehall Funds. From 1979 to 2002, Mr. Birdsong was a Managing Director of Zurich Scudder Investments, an investment management firm. During his employment with Scudder, Mr. Birdsong was an Interested Director of The Japan Fund. From January 1981 through December 2013, Mr. Birdsong was a partner in Birdsong Company, an advertising specialty firm. |
Robert M. Gavin, Jr. (1940) Director since 2002 (MF) and 1986 (MF2), Chairman of the Board for each since 2004
| Dr. Gavin is an educational consultant. Prior to September 1, 2001, he was President of Cranbrook Education Community and prior to July 1996, he was President of Macalester College, St. Paul, Minnesota. |
Duane E. Hill (1945) Director since 2001 (MF) and 2002 (MF2), Chairman of the Nominating Committee since 2003
| Mr. Hill is a Partner of TSG Ventures L.P., a private equity investment company. Mr. Hill is a former partner of TSG Capital Group, a private equity investment firm that served as sponsor and lead investor in leveraged buyouts of middle market companies. |
Sandra S. Jaffee (1941) Director since 2005
| Ms. Jaffee is the founder and Chief Executive Officer of a private company, Homeworks Concierge, LLC, which provides residential property management services in Westchester County, New York (January 2012 to present). Ms. Jaffee served as Chairman (2008 to 2009) and Chief Executive Officer of Fortent (formerly Searchspace Group), a leading provider of compliance/regulatory technology to financial institutions from August 2005 to August 2009. From August 2004 to August 2005, Ms. Jaffee served as an Entrepreneur in Residence with Warburg Pincus, a private equity firm. Prior to joining Warburg Pincus, Ms. Jaffee served as Executive Vice President at Citigroup, from September 1995 to July 2004, where she was President and Chief Executive Officer of Citibank’s Global Securities Services (1995 to 2003). Ms. Jaffee currently serves as a member of the Board of Directors of Broadridge Financial Solutions as well as a Trustee of Muhlenberg College. |
| 22 |
Hartford Duration-Hedged Strategic Income Fund
Directors and Officers (Unaudited) – (continued)
William P. Johnston (1944) Director since 2005, Chairman of the Compliance Committee since 2005
| In June 2006, Mr. Johnston was appointed as Senior Advisor to The Carlyle Group, a global private equity and other alternative asset investment firm and currently serves as an Operating Executive. In July 2006, Mr. Johnston was elected to the Board of Directors of MultiPlan, Inc. and served as a Director (July 2006 to August 2010). In August 2007, Mr. Johnston was elected to the Board of Directors of LifeCare Holdings, Inc. and served as a Director (August 2007 to June 2013). In February 2008, Mr. Johnston was elected to the Board of Directors of HCR-ManorCare, Inc. In May 2006, Mr. Johnston was elected to the Supervisory Board of Fresenius Medical Care AG & Co. KGaA, after its acquisition of Renal Care Group, Inc. in March 2006. Mr. Johnston joined Renal Care Group in November 2002 as a member of the Board of Directors and served as Chairman of the Board from March 2003 through March 2006. From 2002 through 2013, Mr. Johnston served as a Board member of the Georgia O’Keefe Museum. From September 1987 to December 2002, Mr. Johnston was with Equitable Securities Corporation (and its successors, SunTrust Equitable Securities and SunTrust Robinson Humphrey) serving in various investment banking and managerial positions, including Managing Director and Head of Investment Banking, Chief Executive Officer and Vice Chairman. |
Phillip O. Peterson (1944) Director since 2002 (MF) and 2000 (MF2), Chairman of the Audit Committee since 2002
| Mr. Peterson is a mutual fund industry consultant. He was a partner of KPMG LLP (an accounting firm) until July 1999. Mr. Peterson joined William Blair Funds in February 2007 as a member of the Board of Trustees. From February 2012 to February 2014, Mr. Peterson served as a Trustee of Symetra Variable Mutual Funds. From January 2004 to April 2005, Mr. Peterson served as Independent President of the Strong Mutual Funds. |
Lemma W. Senbet (1946) Director since 2005
| Dr. Senbet is the William E. Mayer Chair Professor of Finance and Founding Director, Center for Financial Policy, at the University of Maryland, Robert H. Smith School of Business. He was chair of the Finance Department of the University of Maryland, Robert H. Smith School of Business from 1998 to 2006. Since June 2013, he has been on leave from the University to serve as Executive Director of African Economic Research Consortium which focuses on economic policy research and training. Previously, he was a chaired professor of finance at the University of Wisconsin-Madison. Also, he was a Director of the Fortis Funds from March 2000 to July 2002. Dr. Senbet served as Director of the American Finance Association and President of the Western Finance Association. In 2006, Dr. Senbet was inducted Fellow of Financial Management Association International for his career-long distinguished scholarship and professional service. |
Interested Directors and Officers
James E. Davey (1964) Director since 2012, President and Chief Executive Officer since 2010
| Mr. Davey serves as Executive Vice President of Hartford Life Insurance Company (“HLIC”) and The Hartford. Additionally, Mr. Davey serves as Chairman of the Board, Manager and Senior Managing Director of Hartford Funds Distributors, LLC (“HFD”). He also currently serves as Director, Chairman of the Board, President and Senior Managing Director of Hartford Administrative Services Company (“HASCO”). Mr. Davey also serves as Manager, Chairman of the Board and Senior Managing Director for Hartford Funds Management Company, LLC (“HFMC”) and Director, Chairman of the Board and Senior Managing Director for Hartford Funds Management Group, Inc. ("HFMG"). Mr. Davey has served in various positions within The Hartford and its subsidiaries in connection with the operation of the Hartford Funds. Mr. Davey joined The Hartford in 2002. |
Lowndes A. Smith* (1939) Director since 1996 (MF) and 2002 (MF2)
| Mr. Smith served as Vice Chairman of The Hartford from February 1997 to January 2002, as President and Chief Executive Officer of Hartford Life, Inc. from February 1997 to January 2002, and as President and Chief Operating Officer of The Hartford Life Insurance Companies from January 1989 to January 2002. Mr. Smith serves as a Director of White Mountains Insurance Group Ltd. (October 2003 to current); One Beacon Insurance (October 2006 to current); Symetra Financial (August 2007 to current) and is a Managing Director of Whittington Gray Associates (January 2007 to current). |
* Mr. Smith resigned as a Director of MF, MF2, Hartford Series Fund, Inc. and Hartford HLS Series Fund II, Inc. and as a Trustee of The Hartford Alternative Strategies Fund effective September 17, 2014.
Other Officers
Mark A. Annoni (1964) Vice President, Controller and Treasurer since 2012
| Mr. Annoni currently serves as the Assistant Vice President of HLIC (February 2004 to present) and Senior Vice President of HFMG (December 2013 to present). Mr. Annoni has served in various positions within The Hartford and its subsidiaries in connection with the operation of the Hartford Funds. Mr. Annoni joined The Hartford in 2001. |
| 23 |
Hartford Duration-Hedged Strategic Income Fund
Directors and Officers (Unaudited) – (continued)
Michael R. Dressen (1963) AML Compliance Officer since 2011
| Mr. Dressen currently serves as Assistant Vice President of HLIC. He also serves as Chief Compliance Officer and AML Compliance Officer of HASCO and as AML Officer of HFD. Mr. Dressen has served in various positions within The Hartford and its subsidiaries in connection with the operation of the Hartford Funds. |
Edward P. Macdonald (1967) Vice President, Secretary and Chief Legal Officer since 2005
| Mr. Macdonald currently serves as Assistant Secretary, Executive Vice President and Deputy General Counsel of HFD, HASCO, HFMC and HFMG. He also serves as Vice President of HLIC. Mr. Macdonald has served in various positions within The Hartford and its subsidiaries in connection with the operation of the Hartford Funds. Mr. Macdonald joined The Hartford in 2005. |
Joseph G. Melcher (1973) Vice President and Chief Compliance Officer since 2013
| Mr. Melcher currently serves as Executive Vice President of HFD, HFMG and HASCO. Mr. Melcher also currently serves as Executive Vice President and Chief Compliance Officer of HFMC. Mr. Melcher has served in various positions within The Hartford and its subsidiaries in connection with the operation of the Hartford Funds since joining The Hartford in 2012. Prior to joining The Hartford, Mr. Melcher worked at Touchstone Investments, a member of the Western & Southern Financial Group, where he held the position of Vice President and Chief Compliance Officer from 2010 through 2012 and Assistant Vice President, Compliance from 2005 to 2010. |
Vernon J. Meyer (1964) Vice President since 2006
| Mr. Meyer currently serves as Senior Vice President of HLIC. He also currently serves as Managing Director and Chief Investment Officer of HFMC and Managing Director of HFMG. Mr. Meyer has served in various positions within The Hartford and its subsidiaries in connection with the operation of the Hartford Funds. Mr. Meyer joined The Hartford in 2004. |
Laura S. Quade (1969) Vice President since 2012
| Ms. Quade currently serves as Vice President of HASCO, HFD and HFMG. She is the Head of Operations of HASCO and formerly served as Director, Enterprise Operations of HLIC. Ms. Quade has served in various positions within The Hartford and its subsidiaries in connection with the operation of the Hartford Funds. Ms. Quade joined The Hartford in 2001. |
Martin A. Swanson** (1962) Vice President since 2010
| Mr. Swanson currently serves as Vice President of HLIC. Mr. Swanson also serves as Managing Director, Chief Marketing Officer and Principal of HFD and Managing Director of HFMG. Mr. Swanson has served in various positions within The Hartford and its subsidiaries in connection with the operation of the Hartford Funds. |
** Mr. Swanson resigned as an officer effective November 6, 2014.
HOW TO OBTAIN A COPY OF THE FUND’S PROXY VOTING POLICIES AND VOTING RECORDS (UNAUDITED)
A description of the policies and procedures that the Fund uses to determine how to vote proxies relating to portfolio securities and information about how the Fund voted proxies relating to portfolio securities during the most recent twelve-month period ended June 30 are available (1) without charge, upon request, by calling 888-843-7824 and (2) on the SEC’s website at http://www.sec.gov.
QUARTERLY PORTFOLIO HOLDINGS INFORMATION (UNAUDITED)
The Fund files a complete schedule of portfolio holdings with the SEC for the first and third quarters of each fiscal year on Form N-Q. The Fund’s Forms N-Q are available (1) without charge, upon request, by calling 888-843-7824 and (2) on the SEC’s website at http://www.sec.gov. The Form N-Q may be reviewed and copied at the SEC’s Public Reference Room in Washington, DC. Information on the operation of the Public Reference Room may be obtained by calling 1-800-SEC-0330.
| 24 |
Hartford Duration-Hedged Strategic Income Fund
Federal Tax Information (Unaudited)
For the fiscal year ended October 31, 2014, there is no further federal tax information required for this Fund.
| 25 |
Hartford Duration-Hedged Strategic Income Fund
Expense Example (Unaudited)
Your Fund's Expenses
As a shareholder of the Fund, you incur two types of costs: (1) transaction costs, including sales charges (loads) on purchase payments, if any, and contingent deferred sales charges (CDSC), if any, and (2) ongoing costs, including investment management fees, distribution and/or service (12b-1) fees, if any, and other fund expenses. This example is intended to help you understand your ongoing costs (in dollars) of investing in the Fund and to compare these costs with the ongoing costs of investing in other mutual funds. The example is based on an investment of $1,000 invested at the beginning of the period and held for the entire period of April 30, 2014 through October 31, 2014.
Actual Expenses
The first set of columns of the table below provides information about actual account values and actual expenses. You may use the information in this column, together with the amount you invested, to estimate the expenses that you paid over the period. Simply divide your account value by $1,000 (for example, an $8,600 account value divided by $1,000 = 8.6), then multiply the result by the number in the line under the heading entitled “Expenses Paid During Period” to estimate the expenses you paid on your account during this period.
Hypothetical Example for Comparison Purposes
The second set of columns of the table below provides information about hypothetical account values and hypothetical expenses based on the Fund's actual expense ratio and an assumed rate of return of 5% per year before expenses, which is not the Fund's actual return. The hypothetical account values and expenses may not be used to estimate the actual ending account balance or expenses you paid for the period. You may use this information to compare the ongoing costs of investing in the Fund and other funds. To do so, compare this 5% hypothetical example with the 5% hypothetical examples that appear in the shareholder reports of the other funds.
Please note that the expenses shown in the table are meant to highlight your ongoing costs only and do not reflect any transactional costs, such as sales charges (loads) and CDSC. Therefore, the second set of columns of the table is useful in comparing ongoing costs only, and will not help you determine the relative total costs of owning different funds. In addition, if these transactional costs were included, your costs would be higher. Expenses are equal to the Fund's annualized expense ratios multiplied by average account value over the period, multiplied by 184/365 (to reflect the one-half year period).
| Actual return | Hypothetical (5% return before expenses) | |||||||||||||||||||||||||||||||||||
| Beginning
Account Value April 30, 2014 | Ending
Account Value October 31, 2014 | Expenses
paid during the period April 30, 2014 through October 31, 2014 | Beginning
Account Value April 30, 2014 | Ending
Account Value October 31, 2014 | Expenses
paid during the period April 30, 2014 through October 31, 2014 | Annualized
expense ratio(A) | Days
in the current 1/2 year | Days
in the full year | ||||||||||||||||||||||||||||
| Class A | $ | 1,000.00 | $ | 996.80 | $ | 2.62 | $ | 1,000.00 | $ | 1,022.58 | $ | 2.65 | 0.52 | % | 184 | 365 | ||||||||||||||||||||
| Class C | $ | 1,000.00 | $ | 994.90 | $ | 6.08 | $ | 1,000.00 | $ | 1,019.11 | $ | 6.16 | 1.21 | 184 | 365 | |||||||||||||||||||||
| Class I | $ | 1,000.00 | $ | 998.50 | $ | 0.81 | $ | 1,000.00 | $ | 1,024.40 | $ | 0.82 | 0.16 | 184 | 365 | |||||||||||||||||||||
| Class R3 | $ | 1,000.00 | $ | 995.10 | $ | 4.32 | $ | 1,000.00 | $ | 1,020.87 | $ | 4.38 | 0.86 | 184 | 365 | |||||||||||||||||||||
| Class R4 | $ | 1,000.00 | $ | 996.60 | $ | 2.82 | $ | 1,000.00 | $ | 1,022.38 | $ | 2.85 | 0.56 | 184 | 365 | |||||||||||||||||||||
| Class R5 | $ | 1,000.00 | $ | 998.10 | $ | 1.31 | $ | 1,000.00 | $ | 1,023.90 | $ | 1.33 | 0.26 | 184 | 365 | |||||||||||||||||||||
| Class Y | $ | 1,000.00 | $ | 998.60 | $ | 0.81 | $ | 1,000.00 | $ | 1,024.40 | $ | 0.82 | 0.16 | 184 | 365 | |||||||||||||||||||||
| (A) | Ratios do not include expenses of the Underlying Funds and/or other investment companies, if applicable. |
| 26 |
Hartford Duration-Hedged Strategic Income Fund
Approval of Investment Management and Investment Sub-Advisory Agreements (Unaudited)
Section 15(c) of the Investment Company Act of 1940, as amended (the “1940 Act”), requires that each mutual fund’s board of directors, including a majority of those directors who are not “interested persons” of the mutual fund, as defined in the 1940 Act (the “Independent Directors”), annually review and consider the continuation of the mutual fund’s investment advisory and sub-advisory agreements. At its meeting held on August 5-6, 2014, the Board of Directors (the “Board”) of The Hartford Mutual Funds, Inc., including each of the Independent Directors, unanimously voted to approve the continuation of the investment management agreement for Hartford Duration-Hedged Strategic Income Fund (the “Fund”) with Hartford Funds Management Company, LLC (“HFMC”) and the continuation of the investment sub-advisory agreement between HFMC and the Fund’s sub-adviser, Wellington Management Company, LLP (the “Sub-adviser,” and together with HFMC, the “Advisers”) (collectively, the “Agreements”).
In the months preceding the August 5-6, 2014 meeting, the Board requested, received and reviewed written responses from the Advisers to questions posed to them on behalf of the Independent Directors and supporting materials relating to those questions and responses. The Board considered information furnished to the Board at its meetings throughout the year, as well as information specifically prepared in connection with the annual approval of the Agreements at the Board’s meetings held on June 17-18, 2014 and August 5-6, 2014. Information provided to the Board at its meetings throughout the year included, among other things, reports on Fund performance, legal and compliance matters, sales and marketing activity, shareholder services, and the other services provided to the Fund by the Advisers and their affiliates. The Board also received in-person presentations by Fund officers and representatives of HFMC at the Board’s meetings on June 17-18, 2014 and August 5-6, 2014 concerning the Agreements.
The Independent Directors, advised by independent legal counsel, engaged service providers to assist them with evaluating the Agreements with respect to the Fund. Lipper Inc. (“Lipper”), an independent provider of investment company data, was retained to provide the Board with reports on how the Fund’s non-management fees, overall expense ratios and investment performance compared to those of mutual funds with similar investment objectives. The Independent Directors also engaged an independent financial services consultant (the “Consultant”) to assist them in evaluating the Fund’s non-management fees, overall expense ratios and investment performance. In addition, the Consultant reviewed the profitability calculations utilized by HFMC in connection with the continuation of the investment management agreement.
In determining whether to continue the Agreements for the Fund, the members of the Board reviewed and evaluated information and factors they believed to be relevant and appropriate in light of the information that the Board deemed necessary and appropriate through the exercise of its reasonable business judgment. While individual members of the Board may have weighed certain factors differently, the Board’s determination to continue the Agreements was based on a comprehensive consideration of all information provided to the Board throughout the year and specifically with respect to the continuation of the Agreements. A more detailed discussion of the factors the Board considered with respect to its approval of the Agreements is provided below.
Nature, Extent and Quality of Services Provided by the Advisers
The Board requested and considered information concerning the nature, extent and quality of the services provided to the Fund by the Advisers. The Board considered, among other things, the terms of the Agreements and the range of services provided by the Advisers. The Board considered the Advisers’ professional personnel who provide services to the Fund, including each Adviser’s ability and experience in attracting and retaining qualified personnel to service the Fund. The Board considered each Adviser’s reputation and overall financial strength, as well as its willingness to consider and implement organizational and operational changes designed to enhance services to the Hartford Funds. In addition, the Board considered the quality of each Adviser’s communications with the Board and responsiveness to Board inquiries and requests made from time to time with respect to the Fund and other Hartford Funds.
The Board also requested and evaluated information concerning each Adviser’s regulatory and compliance environment. In this regard, the Board requested and reviewed information on each Adviser’s compliance policies and procedures, compliance history, and a report from the Fund’s Chief Compliance Officer on each Adviser’s compliance with applicable laws and regulations, including responses to regulatory developments and compliance issues raised by regulators. The Board also noted the Advisers’ support of the Fund’s compliance control structure, particularly the resources devoted by the Advisers in support of the Fund’s obligations pursuant to Rule 38a-1 under the 1940 Act.
With respect to HFMC, the Board noted that, under the Agreements, HFMC is responsible for the management of the Fund, including oversight of fund operations and service providers, and provides administrative and investment advisory services in connection with selecting, monitoring and supervising the Sub-adviser. The Board considered HFMC’s ongoing monitoring of people, process and performance, including its quarterly reviews of each of the Hartford Funds, semi-annual meetings with the leaders of each Fund’s portfolio management team, and oversight of the Hartford Funds’ approximately 66 portfolio managers. The Board recognized that HFMC has demonstrated a record of making changes to the
| 27 |
Hartford Duration-Hedged Strategic Income Fund
Approval of Investment Management and Investment Sub-Advisory Agreements (Unaudited) – (continued)
management and/or strategies of the Hartford Funds when warranted. The Board considered HFMC’s oversight of the Sub-adviser’s investment approach and results, process for monitoring best execution of portfolio trades by the Sub-adviser, and approach to risk management with respect to the Fund and the service providers to the Fund. The Board also considered HFMC’s oversight of compliance with the Fund’s objective and policies as well as with applicable laws and regulations, noting that regulatory and other developments had over time led to an increase in the scope of HFMC’s services in this regard.
In addition, the Board considered HFMC’s ongoing commitment to review and rationalize the Hartford Funds product line-up and the expenses that HFMC had incurred in connection with fund combinations in recent years. The Board considered that HFMC or its affiliates are responsible for providing the Fund’s officers.
With respect to the Sub-adviser, which provides certain day-to-day portfolio management services for the Fund, the Board considered the quality of the Fund’s portfolio managers, the Sub-adviser’s other investment personnel, its investment philosophy and process, investment research capabilities and resources, performance record, trade execution capabilities and experience. The Board considered the experience of the Fund’s portfolio managers, the number of accounts managed by the portfolio managers, and the Sub-adviser’s method for compensating the portfolio managers.
Based on these considerations, the Board concluded that it was satisfied with the nature, extent and quality of the services provided to the Fund by HFMC and the Sub-adviser.
Performance of the Fund and the Advisers
The Board considered the investment performance of the Fund. In this regard, the Board reviewed the performance of the Fund since inception and evaluated HFMC’s analysis of the Fund’s performance since inception, noting that the Fund invests primarily in Class Y shares of the Hartford Strategic Income Fund. The Board considered information and materials provided to the Board by the Advisers concerning Fund performance, as well as information from Lipper comparing the investment performance of the Fund to an appropriate benchmark and universe of peer funds. The Board noted that the Fund’s performance was in the 4th quintile of its performance universe for the period since its inception. The Board also noted that the Fund’s performance (gross of fees) was above its benchmark since its inception.
The Board considered the detailed investment analytics reports provided by Hartford Funds’ Investment Advisory Group throughout the year. These reports include, among other things, information on the Fund’s gross and net returns, the Fund’s investment performance relative to an appropriate benchmark and peer group, various statistics concerning the Fund’s portfolio, and a narrative summary of various factors affecting Fund performance. The Board considered the Advisers’ cooperation with the Investment Committee, which assists the Board in evaluating the performance of the Fund at periodic meetings throughout the year. The Board also considered the analysis provided by the Consultant relating to the Fund’s performance track record.
In light of all the considerations noted above, the Board concluded that it had continued confidence in HFMC’s and the Sub-adviser’s overall capabilities to manage the Fund.
Costs of the Services and Profitability of the Advisers
The Board reviewed information regarding HFMC’s cost to provide investment management and related services to the Fund and HFMC’s profitability, both overall and for the Fund, on a pre-tax basis without regard to distribution expenses. The Board also requested and reviewed information about the profitability to HFMC and its affiliates from all services provided to the Fund and all aspects of their relationship with the Fund. The Board also requested and received information relating to the operations and profitability of the Sub-adviser.
The Board considered the Consultant’s review of the profitability calculations used by HFMC in connection with the continuation of the investment management agreement, noting the Consultant’s view that Hartford Funds’ process for calculating and reporting Fund profitability is reasonable. In this regard, the Board noted that the Consultant performed a full review of this process in light of the recent restructuring of the Hartford Funds business and reported that the approach to analyzing Fund profitability, including the use of common expense allocation methodologies, is reasonable, sound and well within common industry practice.
Based on these considerations, the Board concluded that the profits anticipated to be realized by the Advisers and their affiliates from their relationships with the Fund would not be excessive.
| 28 |
Hartford Duration-Hedged Strategic Income Fund
Approval of Investment Management and Investment Sub-Advisory Agreements (Unaudited) – (continued)
Comparison of Fees and Services Provided by the Advisers
The Board considered comparative information with respect to the management fees to be paid by the Fund to HFMC and the total expense ratios of the Fund. The Board also considered comparative information with respect to the sub-advisory fees to be paid by HFMC to the Sub-adviser. In this regard, the Board requested and reviewed information from HFMC and the Sub-adviser relating to the management and sub-advisory fees, including the sub-advisory fee schedule for the Fund, and total operating expenses for the Fund. With respect to the sub-advisory fee schedule, the Board considered representations from HFMC and the Sub-adviser that the Sub-adviser’s fees were negotiated at arm’s length on a fund-by-fund basis. The Board also reviewed information from Lipper comparing the Fund’s overall expense ratios relative to a group of funds selected by Lipper, in consultation with the Consultant, and a broader universe of funds selected by Lipper. The Board considered that the Fund’s total expenses (less 12b-1 and shareholder service fees) were in the 1st quintile of its expense group. The Board noted that the Fund has an automatically renewable contractual expense cap on each share class. The expense cap resulted in reimbursement of certain expenses incurred in 2013.
While the Board recognized that comparisons between the Fund and peer funds may be imprecise, given the different service levels and characteristics of mutual funds and the different business models and cost structures of the Advisers, the comparative information provided by Lipper assisted the Board in evaluating the reasonableness of the Fund’s management and sub-advisory fees and total operating expenses. In addition, the Board considered the analysis and recommendations of the Consultant relating to the Fund’s management and sub-advisory fees and total operating expenses.
Based on these considerations, the Board concluded that the Fund’s fees and total operating expenses, in conjunction with the information about quality of services, profitability, economies of scale, and other matters discussed, were reasonable in light of the services provided.
Economies of Scale
The Board requested and considered information regarding the Advisers’ realization of economies of scale with respect to the Fund and whether the fee levels reflect these economies of scale for the benefit of the Fund’s shareholders. The Board reviewed the breakpoints in the management fee schedule for the Fund, which reduce fee rates as Fund assets grow over time. The Board recognized that a fund with assets beyond the highest breakpoint level will continue to benefit from economies of scale because additional assets are charged the lowest breakpoint fee resulting in lower overall effective management fee rates. The Board also considered that expense limitations and fee waivers that reduce the Fund’s expenses at all asset levels can have the same effect as breakpoints in sharing economies of scale with shareholders and provide protection from an increase in expenses if Fund assets decline. The Board recognized that a fee schedule that reaches a lower breakpoint quickly provides shareholders with the benefit of anticipated or potential economies of scale. The Board also considered that HFMC has been active in managing expenses, which has resulted in benefits being realized by shareholders as assets within the Hartford Funds family of funds have grown over time, including through lower transfer agent costs and other operating expenses.
After considering all of the information available to it, the Board concluded that it was satisfied with the extent to which economies of scale would be shared for the benefit of the Fund’s shareholders based on currently available information and the effective advisory fees and expense ratios for the Fund at its current and reasonably anticipated asset levels. The Board noted, however, that it would continue to monitor future growth in Fund assets and the appropriateness of additional breakpoints.
Other Benefits
The Board considered other benefits to the Advisers and their affiliates from their relationships with the Fund.
The Board noted that HFMC receives fees for fund accounting and related services from the Fund, and the Board considered information on profits to HFMC for such services. The Board also considered that Hartford Administrative Services Company (“HASCO”), the Fund’s transfer agent and an affiliate of HFMC, receives transfer agency compensation from the Fund, and the Board reviewed information on the profitability of the Fund’s transfer agency function to HASCO. The Board considered information provided by HASCO indicating that the transfer agent fees charged by HASCO to the Fund were fair and reasonable based on publicly available information.
The Board also considered that Hartford Funds Distributors, LLC (“HFD”), an affiliate of HFMC, serves as principal underwriter of the Fund. As principal underwriter, HFD receives 12b-1 fees from the Fund and receives all or a portion of the sales charges on sales or redemptions of
| 29 |
Hartford Duration-Hedged Strategic Income Fund
Approval of Investment Management and Investment Sub-Advisory Agreements (Unaudited) – (continued)
certain classes of shares. The Board also noted that certain affiliates of HFD distribute shares of the Fund and receive compensation in that connection.
The Board considered the benefits, if any, to the Sub-adviser from any use of the Fund’s brokerage commissions to obtain soft dollar research, and representations from HFMC and the Sub-adviser that the Sub-adviser would not make any revenue-sharing payments or any other type of distribution payments to HFMC or its affiliates.
The Board considered the benefits to shareholders of being part of the Hartford Funds family of funds, including the right to exchange investments between the same class of funds without a sales charge, the ability to reinvest Fund dividends into other funds in the family, and the ability to combine holdings in the Fund with holdings in other funds to obtain a reduced sales charge. The Board considered HFMC’s efforts to provide investors in the family with a broad range of investment styles and asset classes and its entrepreneurial risk in initiating new funds to expand these opportunities for shareholders.
* * * *
Based upon its review of these various factors, among others, the Board concluded that it is in the best interests of the Fund and its shareholders for the Board to approve the Agreements for an additional year. In reaching this decision, the Board did not assign relative weights to the factors discussed above or deem any one or group of them to be controlling in and of themselves. In connection with their deliberations, the Independent Directors met separately in executive session on several occasions, with independent legal counsel and the Consultant, to review the relevant materials and consider their responsibilities under relevant laws and regulations.
| 30 |
Hartford Duration-Hedged Strategic Income Fund
Main Risks (Unaudited)
The main risks of investing in the Fund are described below.
Market, Selection and Strategy Risk: The Fund’s share price may fluctuate due to market risk and/or security selections that may underperform the market or relevant benchmarks. If the sub-adviser's investment strategy does not perform as expected, the Fund could underperform its peers or lose money. There is no guarantee the Fund will achieve its stated objective.
Fund of Funds Risk:The Fund invests primarily in an Underlying Fund, The Hartford Strategic Income Fund. The ability of that Fund to meet its investment objective is directly related to the ability of the Underlying Fund to meet its objectives as well as the sub-adviser's allocation to the Underlying Fund.
Fixed Income Risk: The Fund is subject to interest rate risk (the risk that the value of an investment decreases when interest rates rise), credit risk (the risk that the issuing company of a security is unable to pay interest and principal when due), liquidity risk (the risk that an investment may be difficult to sell at an advantageous time or price) and call risk (the risk that an investment may be redeemed early). These risks also apply to the Fund’s investments in U.S. government securities, which may not be guaranteed by the U.S. government.
Junk Bond Risk: Investments in junk bonds involve greater risk of price volatility, illiquidity, and default than higher-rated debt securities.
Loan Risk: The Fund’s investments in loans may at times become difficult to value and highly illiquid; they are subject to credit risk such as nonpayment of principal or interest, and risks of bankruptcy and insolvency.
Mortgage-Backed Securities Risk: Mortgage-backed securities are subject to interest rate risk, credit risk, prepayment risk, extension risk, and the risk that an investment’s value may be reduced or become worthless if it receives interest or income payments only after other investments in the same pool.
Foreign Investment, Emerging Markets and Sovereign Debt Risk: Investments in foreign securities may be riskier than investments in U.S. securities. Potential risks include the risks of illiquidity, increased price volatility, less government regulation, less extensive and less frequent accounting and other reporting requirements, unfavorable changes in currency exchange rates, and economic and political disruptions. These risks are generally greater for investments in emerging markets. Sovereign debt investments are subject to credit risk and the risk of default.
Active Trading Risk: Actively trading investments may result in higher costs and higher taxable income.
Derivatives Risk: Investments in derivatives can be volatile. Potential risks include currency risk, leverage risk (the risk that small market movements may result in large changes in the value of an investment), liquidity risk, index risk, pricing risk, and counterparty risk (the risk that the counterparty may be unwilling or unable to honor its obligations).
| 31 |
THIS PRIVACY POLICY IS NOT PART OF THIS REPORT
Privacy Policy and Practices of The Hartford Financial Services Group, Inc. and its Affiliates
(herein called “we, our and us”)
This Privacy Policy applies to our United States Operations
|
We value your trust. We are committed to the responsible: a) management; b) use; and c) protection; of Personal Information.
This notice describes how we collect, disclose, and protect Personal Information.
We collect Personal Information to: a) service your Transactions with us; and b) support our business functions.
We may obtain Personal Information from: a) You; b) your Transactions with us; and c) third parties such as a consumer-reporting agency.
Based on the type of product or service You apply for or get from us, Personal Information such as: a) your name; b) your address; c) your income; d) your payment; or e) your credit history; may be gathered from sources such as applications, Transactions, and consumer reports.
To serve You and service our business, we may share certain Personal Information. We will share Personal Information, only as allowed by law, with affiliates such as: a) our insurance companies; b) our employee agents; c) our brokerage firms; and d) our administrators.
As allowed by law, we may share Personal Financial Information with our affiliates to: a) market our products; or b) market our services; to You without providing You with an option to prevent these disclosures.
|
We may also share Personal Information, only as allowed by law, with unaffiliated third parties including: a) independent agents; b) brokerage firms; c) insurance companies; d) administrators; and e) service providers; who help us serve You and service our business.
When allowed by law, we may share certain Personal Financial Information with other unaffiliated third parties who assist us by performing services or functions such as: a) taking surveys; b) marketing our products or services; or c) offering financial products or services under a joint agreement between us and one or more financial institutions.
We, and third parties we partner with, may track some of the pages You visit through the use of: a) cookies; b) pixel tagging; or c) other technologies; and currently do not process or comply with any web browser’s “do not track” signal or similar mechanism that indicates a request to disable online tracking of individual users who visit our websites or use our services.
We will not sell or share your Personal Financial Information with anyone for purposes unrelated to our business functions without offering You the opportunity to: a) “opt-out;” or b) “opt-in;” as required by law.
We only disclose Personal Health Information with: a) your proper written authorization; or b) as otherwise allowed or required by law.
Our employees have access to Personal Information in the course of doing their jobs, such as: a) underwriting policies; b) paying claims; c) developing new products; or d) advising customers of our products and services.
|
|
We use manual and electronic security procedures to maintain: a) the confidentiality; and b) the integrity of; Personal Information that we have. We use these procedures to guard against unauthorized access.
Some techniques we use to protect Personal Information include: a) secured files; b) user authentication; c) encryption; d) firewall technology; and e) the use of detection software.
We are responsible for and must: a) identify information to be protected; b) provide an adequate level of protection for that data; c) grant access to protected data only to those people who must use it in the performance of their job-related duties.
Employees who violate our Privacy Policy will be subject to discipline, which may include ending their employment with us.
At the start of our business relationship, we will give You a copy of our current Privacy Policy.
We will also give You a copy of our current Privacy Policy once a year if You maintain a continuing business relationship with us.
We will continue to follow our Privacy Policy regarding Personal Information even when a business relationship no longer exists between us.
|
As used in this Privacy Notice:
Application means your request for our product or service.
Personal Financial Information means financial information such as: a) credit history; b) income; c) financial benefits; or d) policy or claim information.
Personal Health Information means health information such as: a) your medical records; or b) information about your illness, disability or injury.
Personal Information means information that identifies You personally and is not otherwise available to the public. It includes: a) Personal Financial Information; and b) Personal Health Information.
Transaction means your business dealings with us, such as: a) your Application; b) your request for us to pay a claim; and c) your request for us to take an action on your account.
You means an individual who has given us Personal Information in conjunction with: a) asking about; b) applying for; or c) obtaining; a financial product or service from us if the product or service is used mainly for personal, family, or household purposes.
|
This Privacy Policy is being provided on behalf of the following affiliates of The Hartford Financial Services Group, Inc.:
1stAGChoice, Inc.; Access CoverageCorp, Inc.; Access CoverageCorp Technologies, Inc.; American Maturity Life Insurance Company; Archway 60 R, LLC; Business Management Group, Inc.; Champlain Life Reinsurance Company; DMS R, LLC; Eloy R, LLC; Ersatz Corporation; First State Insurance Company; Hartford Accident and Indemnity Company; Hartford Administrative Services Company; Hartford Casualty General Agency, Inc.; Hartford Casualty Insurance Company; Hartford-Comprehensive Employee Benefit Service Company; Hartford Equity Sales Company, Inc.; Hartford Fire General Agency, Inc.; Hartford Fire Insurance Company; Hartford Funds Management Company, LLC; Hartford Funds Management Group, Inc.; Hartford HLS Series Fund II, Inc.; Hartford Insurance Company of Illinois; Hartford Insurance Company of the Midwest; Hartford Insurance Company of the Southeast; Hartford Integrated Technologies, Inc.; Hartford International Life Reassurance Corporation; Hartford Funds Distributors, LLC; Hartford Investment Management Company; Hartford Life and Accident Insurance Company; Hartford Life and Annuity Insurance Company; Hartford Life Insurance Company; Hartford Life Private Placement, LLC; Hartford Lloyd’s Corporation; Hartford Lloyd’s Insurance Company; Hartford Mezzanine Investors I, LLC; Hartford Residual Market, L.C.C.; Hartford Retirement Services, LLC; Hartford Securities Distribution Company, Inc.; Hartford Series Fund, Inc.; Hartford Specialty Insurance Services of Texas, LLC; Hartford Strategic Investments, LLC; Hartford Underwriters Insurance Company; Hartford Technology Services Company, L.L.C.; Hartford of Texas General Agency, Inc.; Hartford Underwriters General Agency, Inc.; HARTRE Company, L.C.C.; HL Investment Advisors, LLC; HLA LLC; Horizon Management Group, LLC; HRA Brokerage Services, Inc.; Lanidex Class B, LLC; M-CAP Insurance Agency, LLC; New England Insurance Company; New England Reinsurance Corporation; Nutmeg Insurance Agency, Inc.; Nutmeg Insurance Company; Pacific Insurance Company, Limited; Planco, LLC: Property and Casualty Insurance Company of Hartford; Revere R, LLC; RVR R, LLC; Sentinel Insurance Company, Ltd.; Sunstone R, LLC; Symphony R, LLC; The Evergreen Group Incorporated; The Hartford Alternative Strategies Fund; The Hartford Mutual Funds, Inc.; The Hartford Mutual Funds II, Inc.; Trumbull Flood Management, L.L.C.; Trumbull Insurance Company; Twin City Fire Insurance Company; White River Life Reinsurance Company.
HPP Revised January 2014
HARTFORDFUNDS
hartfordfunds.com
This information is written in connection with the promotion or marketing of the matter(s) addressed in this material.
This report is submitted for the general information of the shareholders of the Fund. It is not authorized for distribution unless preceded or accompanied by a current prospectus for the Fund.
The information cannot be used or relied upon for the purpose of avoiding IRS penalties. These materials are not intended to provide tax, accounting or legal advice. As with all matters of a tax or legal nature, you should consult your own tax or legal counsel for advice.
Investors should carefully consider the investment objectives, risks, charges, and expenses of Hartford Funds before investing. This and other information can be found in the prospectus and summary prospectus, which can be obtained by calling 888-843-7824 (retail) or 800-279-1541 (institutional). Investors should read them carefully before they invest.
Hartford Funds are underwritten and distributed by Hartford Funds Distributors, LLC.
MFAR-DHSI14 12/14 115856-1 Printed in U.S.A.
HARTFORDFUNDS
|
THE HARTFORD EMERGING
2014 Annual Report |
A MESSAGE FROM THE PRESIDENT
Dear Fellow Shareholders:
Thank you for investing in Hartford Funds.
Market Review
U.S. equities (as represented by the S&P 500 Index) rose steadily for the fiscal year ended October 31, 2014, with a return of 17.27% for the period. With the exception of short-lived geopolitical scares early in 2014 and concerns about continuing global growth near the end of the period, stocks generally rose on solid fundamentals and encouraging macroeconomic data during the year.
September 2014 marked the six-year anniversary of the start of the financial crisis. Within weeks of that anniversary, both the S&P 500 Index and the Dow Jones Industrial Average set new all-time highs, closing at 2,018 and 17,391, respectively, on October 31. Although the fallout of the crisis continues to influence investor behavior, stocks have recovered and risen dramatically, up 198% from their low in March 2009. Meanwhile, the domestic economy is notching strong growth, and the unemployment rate has reached its lowest level since August 2008.
While the U.S. economy appears to have stabilized and to have reverted to a solid growth path, the outlook for the global economy appears to have gotten cloudier. The U.S. Federal Reserve has ended quantitative easing, while Europe and Japan are pursuing stimulus options to avoid a double-dip recession and deflation, respectively. Diverging central-bank policies will likely continue to play an important role in market movements going forward as investors wait to see the reactions to their efforts and their impacts on global markets.
How have market movements impacted your portfolio throughout the last year? Are your investments still on track to provide the growth or income you need, and are you comfortable with their progress during times of volatility?
Your financial professional can help you navigate today’s markets with confidence, as well as assist you to achieve your investment goals by providing advice on the best options within our fund family to help you work toward overcoming today’s investing challenges. Meet with your financial advisor regularly to examine your portfolio and your investment strategy, and to determine if you’re still on track to meet your goals.
Thank you again for investing with Hartford Funds.
James Davey
President
Hartford Funds
| 1 | The S&P 500 Index is a market capitalization-weighted price index composed of 500 widely held common stocks. |
| 2 | The Dow Jones Industrial Average is an unmanaged, price-weighted index of 30 of the largest, most widely held stocks traded on the NYSE |
The Hartford Emerging Markets Local Debt Fund
Table of Contents
The views expressed in the Fund’s Manager Discussion under ‘‘Why did the Fund perform this way?’’ and ‘‘What is the outlook?’’ are views of the Fund’s sub-adviser and portfolio management team through the end of the period and are subject to change based on market and other conditions. The Fund’s Manager Discussion is for informational purposes only and does not represent an offer, recommendation or solicitation to buy, hold or sell any security. The specific securities identified and described, if any, do not represent all of the securities purchased or sold and you should not assume that investments in the securities identified and discussed will be profitable.
| The Hartford Emerging Markets Local Debt Fund inception 05/31/2011 |
| (sub-advised by Wellington Management Company, LLP) |
| Investment objective – The Fund seeks capital appreciation and income. |
Performance Overview 5/31/11- 10/31/14

The chart above represents the hypothetical growth of a $10,000 investment in Class A, which includes a sales charge. Growth results in classes other than Class A will vary from what is seen above due to differences in the expenses charged to those share classes.
Average Annual Total Returns (as of 10/31/14)
| 1 Year | Since Inception▲ | |||||||
| Emerging Markets Local Debt A# | -1.10% | 0.85% | ||||||
| Emerging Markets Local Debt A## | -5.55% | -0.50% | ||||||
| Emerging Markets Local Debt C# | -1.85% | 0.09% | ||||||
| Emerging Markets Local Debt C## | -2.80% | 0.09% | ||||||
| Emerging Markets Local Debt I# | -0.91% | 1.07% | ||||||
| Emerging Markets Local Debt R3# | -1.38% | 0.51% | ||||||
| Emerging Markets Local Debt R4# | -1.09% | 0.81% | ||||||
| Emerging Markets Local Debt R5# | -0.89% | 1.11% | ||||||
| Emerging Markets Local Debt Y# | -0.74% | 1.08% | ||||||
| JP Morgan GBI Emerging Markets Global Diversified Index | -2.68% | -0.11% | ||||||
| ▲ | Inception: 05/31/2011 |
| # | Without sales charge |
| ## | With sales charge |
PERFORMANCE DATA QUOTED REPRESENTS PAST PERFORMANCE AND DOES NOT GUARANTEE FUTURE RESULTS. The investment return and principal value of the investment will fluctuate so that investors’ shares, when redeemed, may be worth more or less than their original cost. Current performance may be lower or higher than the performance data quoted. To obtain performance data current to the most recent month-end, please visit our website www.hartfordfunds.com.
The initial investment in Class A shares reflects the maximum sales charge of 4.50% and returns for Class C shares reflect a contingent deferred sales charge of up to 1.00% on shares redeemed within twelve months of purchase.
Total returns presented above were calculated using the Fund’s net asset value available to shareholders for sale or redemption of Fund shares on October 31, 2014, which may exclude investment transactions as of this date. All share class returns assume the reinvestment of all distributions at net asset value and the deduction of all fund expenses.
JP Morgan GBI Emerging Markets Global Diversified Index tracks local currency bonds issued by Emerging Markets governments. It is an investable index that includes only those countries that are directly accessible by most of the international investor base. The index excludes countries with explicit capital controls, but does not factor in regulatory/tax hurdles in assessing eligibility.
You cannot invest directly in an index.
The chart and table do not reflect the deductions of taxes that a shareholder would pay on Fund distributions or the redemption of Fund shares.
Performance information may reflect historical or current expense waivers/reimbursements from the investment adviser, without which performance would have been lower. For information on current expense waivers/reimbursements, please see the prospectus.
| 2 |
The Hartford Emerging Markets Local Debt Fund
| Manager Discussion |
| October 31, 2014 (Unaudited) |
| Operating Expenses* | ||||||||
| Net | Gross | |||||||
| Emerging Markets Local Debt Class A | 1.25% | 1.49% | ||||||
| Emerging Markets Local Debt Class C | 2.00% | 2.22% | ||||||
| Emerging Markets Local Debt Class I | 1.00% | 1.25% | ||||||
| Emerging Markets Local Debt Class R3 | 1.55% | 1.84% | ||||||
| Emerging Markets Local Debt Class R4 | 1.25% | 1.54% | ||||||
| Emerging Markets Local Debt Class R5 | 0.95% | 1.24% | ||||||
| Emerging Markets Local Debt Class Y | 0.90% | 1.14% | ||||||
| * | As shown in the Fund's current prospectus dated March 1, 2014. Actual expenses may be higher or lower. Please see accompanying Financial Highlights for expense ratios for the year ended October 31, 2014. |
Gross expenses are the Fund's total annual operating expenses shown in the Fund's most recent prospectus. Net expenses are the Fund's total annual operating expenses shown in the Fund's most recent prospectus and reflect contractual expense waivers/reimbursements in instances when these reductions reduce the Fund's gross expenses. Certain contractual waivers/reimbursements remain in effect until February 28, 2015. Other contractual waivers/reimbursements remain in effect until February 28, 2015, and automatically renew for one-year terms unless terminated.
All investments are subject to risk including the possible loss of principal. For a discussion of the Fund’s risks, please see the Main Risks section of this report. For more detailed information on the risks associated with an investment in the Fund, please see the prospectus.
| Portfolio Managers | |
| James W. Valone, CFA | Tieu-Bich Nguyen, CFA |
| Senior Vice President and Fixed Income Portfolio Manager |
Senior Vice President and Fixed Income Credit Analyst |
How did the Fund perform?
The Class A shares of The Hartford Emerging Markets Local Debt Fund returned -1.10%, before sales charge, for the twelve-month period ended October 31, 2014, outperforming the Fund’s benchmark, the JP Morgan GBI Emerging Markets Global Diversified Index, which returned -2.68% for the same period. The Fund also outperformed the -2.21% average return of the Lipper Emerging Markets Local Currency Debt Funds peer group, a group of funds that seek either current income or total return by investing at least 65% of total assets in debt issues denominated in the currency of their market of issuance. "Emerging Market" is defined by a country's GNP per capita or other economic measures.
Why did the Fund perform this way?
Performance across the emerging markets fixed income sectors was mixed over the period. Local markets debt underperformed external sovereign debt during the period, with the JP Morgan GBI Emerging Markets Global Diversified Index generating total returns of -2.68% in U.S. Dollar (USD) terms. Depreciation of Emerging Markets (EM) currencies versus the USD detracted from overall performance outweighing the positive contribution from decreases in interest rates and coupon income. The USD rallied versus most currencies as policy tightening expectations and strong domestic data continued to support the USD. The first half of the period was volatile as a modest slowdown in China's economic growth and manufacturing activity and idiosyncratic developments in individual EM countries put pressure on EM fixed income markets. The adjustments made by several EM countries in response to the earlier sell-off boosted their credibility amongst investors helping to stabilize EM markets. Geopolitical events in Russia and Ukraine came into and remained in the spotlight during the period. From a country perspective, Nigeria, Mexico, and Thailand were the best performers in the Index while Russia, the Philippines, and Colombia lagged.
Emerging market corporate debt finished the period with a return of 6.92% as measured by the JP Morgan CEMBI Broad Diversified Index. Credit spreads tightened by 0.24% since the beginning of the period to 3.08% by the end of the period.
Within the Fund, during the period, currency effect and security selection contributed positively to benchmark-relative performance, while duration strategies detracted from overall performance. Currency positioning was the main driver of positive relative performance during the period. The Fund’s structural allocation to corporate bonds had no impact on relative performance as generally speaking corporate bonds performed in line with the local rates component of the JP Morgan GBI Emerging Markets Global Diversified Index. However, contribution from country rotation strategies was negative, outweighing the modestly positive contribution from security selection of the corporate bonds in the Fund versus the EM corporate market (JP Morgan CEMBI Broad Diversified Index).
In Russia, both an underweight duration exposure later in the period and an underweight exposure to Russian ruble contributed to overall performance. We remained cautious on Russia due to elevated geopolitical and sanctions risk stemming from the ongoing conflict with Ukraine. In Brazil, an underweight exposure to Brazilian real contributed to overall performance. We remained cautious on the Brazilian real as there is scope for further depreciation as, in our view, the economic outlook remains negative and the government will take time to regain policy credibility. In Mexico, security selection with exposure to corporate issues in the industrial and financial sectors as well as a positioning in the Mexican peso contributed to overall performance. Our duration positioning modestly detracted. We have been reducing our duration exposure in Mexico and moved to an underweight as we find the monetary policy too expansionary at this stage of the economic cycle.
| 3 |
The Hartford Emerging Markets Local Debt Fund
| Manager Discussion – (continued) |
| October 31, 2014 (Unaudited) |
In contrast, short duration exposure in Czech Republic and negative security selection via paying fixed interest rate swaps on the long end of the yield curve, taken due to our negative valuation assessment of yields in the country in the context of inflation trends, detracted from overall performance. In Poland, an underweight duration exposure detracted from overall performance. We are cautious on local debt in Poland given the rich valuations in our view. In Thailand, an underweight duration exposure and negative security selection, namely an underweight to short- and mid-dated local sovereign debt, hurt results. We remained underweight on local debt in Thailand given the low yield level as growth is set to turn up on fiscal stimulus and improved confidence as the military appears to have restored social stability for now.
Our interest rate and credit positioning is primarily implemented through cash bond positions and derivatives such as interest rate and total return swaps and credit default swap contracts. We use local currency denominated cash bonds and currency forwards (deliverable and non-deliverable) to express our views on currency.
What is the outlook?
We expect diverging monetary policy trends across the major developed market central banks to continue to be a source of uncertainty for EM debt markets in the months ahead. We maintain our view that the U.S. Federal Reserve (Fed) will likely begin to raise interest rates in mid-2015 in response to stronger economic growth and rising wage pressures, though we expect the pace of rate hikes to be gradual. We believe recent economic weakness in Japan has prompted the Bank of Japan (BoJ) to surprise the market with an aggressive increase in monetary stimulus, and that the European Central Bank (ECB) may follow in the coming months as growth and inflation trends continue to deteriorate in that region. These offsetting policy trends, in our view, have important implications for the U.S. dollar (more strength) and commodity prices (continued weakness). We believe that the impact on EM countries, however, will vary from one country to the next, and we continue to emphasize fundamentals over valuations and expect that country differentiation will be an important source of alpha in the coming months. We expect EM fundamental trends, broadly speaking, to continue to stabilize, with the average country experiencing gradual improvements in fiscal management, current account balances, and reserves trends. The 2014 election cycle in many EM countries– one of the more active in recent memory – is largely behind us, and we believe the net outcome has generally tilted in favor of modestly positive reform momentum. We still expect negative headlines to dominate in certain countries like Russia, Ukraine, and Venezuela, for example, but we also see more positive improvement in countries like Indonesia, and India.
We ended the period with a close to neutral duration stance at the overall portfolio level on our expectation that we are likely to move into a rising interest rate environment over time, particularly if the U.S. continues to strengthen and if recent stimulus from other developed market banks begins to be more supportive of growth. Although EM growth has generally been soft, we do not see much evidence of excess slack in these economies, which we believe suggests that some markets will be more susceptible to rising rate pressures than others. We largely concentrate our underweights on those markets where yields are close to their lows and the longer term growth outlook is more constructive, such as Czech Republic and Malaysia. We continue to overweight duration in markets where we believe the level of yields is high, the curve is steep, and growth is weak – Brazil and Colombia. Broadly speaking, interest rates in Eastern Europe, ex-Czech Republic, are beginning to look more attractive, in our view, as softer developed European growth dampens near-term inflation risks. We remain cautious on Russia, however, due to elevated geopolitical and sanctions risk stemming from the ongoing conflict with Ukraine.
Although it appears that currency valuations look considerably more attractive after the September sell-off, we remain underweight EM currencies at the overall portfolio as we believe that divergent growth and monetary policy trends between the major developed market economies will prompt a period of USD strength. Latin currencies such as Colombian peso and the Uruguayan dollar are the most appealing, in our view, though we maintain a more cautious stance on the Brazilian real, where negative growth trends are a headwind. We believe Eastern European currencies, broadly speaking, are also vulnerable to weaker regional growth trends, though we have reduced the size of our underweight given improved prospects for quantitative easing from the ECB. We remain underweight Hungarian forint and Polish zloty. Here again we remain underweight the ruble, where we expect geopolitical tensions to weigh on the currency. What we view as big improvements in Turkey’s current account deficit, however, have prompted us to trim our underweight exposure in the lira. We have increased our exposure to Indian rupee for similar reasons. Low yielding Singapore dollar and Thai baht continue to be attractive funding currencies in our view, as are developed market currencies such as the Canadian dollar. We have a long U.S. dollar position in the portfolio based on our expectation of near-term dollar strength.
We are positioned with a neutral stance in EM corporate debt. The EM macro environment remains challenging due to rising U.S. treasury yields, weak EM growth, and ongoing adjustment process of macro imbalances. We believe fundamental trends are stable with the exception of Russia/Ukraine as corporates have adequate liquidity cushion and have proactively managed their balance sheet and liquidity in response to macro volatility. Geopolitical risks and governance highlight the importance of country selection. We believe sovereign risks (Russia, Ukraine, Turkey, Argentina) have been the more important drivers of EM Currency performance than idiosyncratic risks this year. Valuations appear fair but we see pockets of attractive opportunities in BBBs and high yield bonds. In
| 4 |
The Hartford Emerging Markets Local Debt Fund
| Manager Discussion – (continued) |
| October 31, 2014 (Unaudited) |
our view, valuation remains attractive versus Developed market spreads. Credit differentiation is critical to identify pockets of value in certain market segments. Our strategy remains focused on credit sectors that we believe have attractive fundamentals and valuations.
| Credit Exposure | ||||
| as of October 31, 2014 | ||||
| Credit Rating * | Percentage of Net Assets | |||
| Aaa/ AAA | 0.2 | % | ||
| Aa/ AA | 1.7 | |||
| A | 15.0 | |||
| Baa/ BBB | 36.1 | |||
| Ba/ BB | 11.9 | |||
| B | 6.9 | |||
| Caa/ CCC or Lower | 1.1 | |||
| Not Rated | 21.2 | |||
| Non-Debt Securities and Other Short-Term Instruments | 3.9 | |||
| Other Assets and Liabilities | 2.0 | |||
| Total | 100.0 | % | ||
| * | Credit exposure is the long-term credit ratings for the Fund's holdings, as of the date noted, as provided by Standard and Poor's (S&P) or Moody's Investors Service (Moody's) and typically range from AAA/Aaa (highest) to C/D (lowest). Presentation of S&P and Moody's credit ratings in this report have been selected for informational purposes for shareholders, as well as the Fund's consideration of industry practice. If Moody's and S&P assign different ratings, the lower rating is used. Fixed income securities that are not rated by either agency are listed as "Not Rated." Ratings do not apply to the Fund itself or to the Fund's shares. Ratings may change. |
| Diversification by Security Type | ||||
| as of October 31, 2014 | ||||
| Category | Percentage of Net Assets | |||
| Fixed Income Securities | ||||
| Corporate Bonds | 31.1 | % | ||
| Foreign Government Obligations | 63.0 | |||
| Total | 94.1 | % | ||
| Short-Term Investments | 3.6 | |||
| Purchased Options | 0.3 | |||
| Other Assets and Liabilities | 2.0 | |||
| Total | 100.0 | % | ||
| 5 |
The Hartford Emerging Markets Local Debt Fund
| Schedule of Investments |
| October 31, 2014 |
| (000’s Omitted) |
| Shares or Principal Amount ╬ | Market Value ╪ | |||||||
| Corporate Bonds - 31.1% | ||||||||
| Barbados - 0.3% | ||||||||
| Columbus International, Inc. | ||||||||
| $ | 1,000 | 7.38%, 03/30/2021 § | $ | 1,060 | ||||
| Bermuda - 1.1% | ||||||||
| GCX Ltd. | ||||||||
| 1,495 | 7.00%, 08/01/2019 ■ | 1,535 | ||||||
| GeoPark Latin America Ltd. Agencia en Chile | ||||||||
| 270 | 7.50%, 02/11/2020 ■ | 286 | ||||||
| 1,110 | 7.50%, 02/11/2020 § | 1,177 | ||||||
| Klabin Finance S.A. | ||||||||
| 500 | 5.25%, 07/16/2024 ■ | 489 | ||||||
| 3,487 | ||||||||
| Brazil - 2.1% | ||||||||
| Banco do Brasil S.A. | ||||||||
| 680 | 9.00%, 06/18/2024 ■♠ | 669 | ||||||
| 925 | 9.00%, 06/18/2024 §♠ | 909 | ||||||
| Cia Brasileira de Aluminio | ||||||||
| 700 | 4.75%, 06/17/2024 ■ | 677 | ||||||
| OAS Investments GmbH | ||||||||
| 545 | 8.25%, 10/19/2019 § | 530 | ||||||
| Odbrcht Offshore Drilling Finance Ltd. | ||||||||
| 1,898 | 6.75%, 10/01/2022 § | 1,988 | ||||||
| Petrobras Global Finance Co. | ||||||||
| 1,450 | 6.25%, 03/17/2024 | 1,542 | ||||||
| Tonon Luxembourg S.A. | ||||||||
| 525 | 10.50%, 05/14/2024 § | 491 | ||||||
| 6,806 | ||||||||
| British Virgin Islands - 1.1% | ||||||||
| HLP Finance Ltd. | ||||||||
| 1,485 | 4.75%, 06/25/2022 § | 1,521 | ||||||
| QGOG Atlantic/Alaskan Rigs Ltd. | ||||||||
| 121 | 5.25%, 07/30/2018 ■ | 125 | ||||||
| 704 | 5.25%, 07/30/2019 § | 721 | ||||||
| Star Energy Geothermal | ||||||||
| 940 | 6.13%, 03/27/2020 § | 961 | ||||||
| 3,328 | ||||||||
| Cayman Islands - 0.7% | ||||||||
| Alliance Global Group, Inc. | ||||||||
| 805 | 6.50%, 08/18/2017 § | 865 | ||||||
| KWG Property Holding Ltd. | ||||||||
| 750 | 8.98%, 01/14/2019 § | 748 | ||||||
| UOB Cayman Ltd. | ||||||||
| 600 | 5.80%, 03/15/2016 §♠Θ | 610 | ||||||
| 2,223 | ||||||||
| Chile - 0.5% | ||||||||
| Bonos del Banco Central de Chile en Pesos | ||||||||
| CLP | 535,000 | 6.00%, 02/01/2016 | 963 | |||||
| E CL S.A. | ||||||||
| 700 | 5.63%, 01/15/2021 § | 757 | ||||||
| 1,720 | ||||||||
| China - 1.4% | ||||||||
| CNPC General Capital | ||||||||
| 1,000 | 3.95%, 04/19/2022 § | 1,021 | ||||||
| CRCC Yupeng Ltd. | ||||||||
| 1,550 | 3.95%, 08/01/2019 §♠ | 1,550 | ||||||
| Kaisa Group Holdings Ltd. | ||||||||
| 970 | 10.25%, 01/08/2020 § | 1,008 | ||||||
| Sinopec Group Overseas Development 2013 Ltd. | ||||||||
| 350 | 4.38%, 10/17/2023 ■ | 366 | ||||||
| 635 | 4.38%, 10/17/2023 § | 663 | ||||||
| 4,608 | ||||||||
| Colombia - 1.4% | ||||||||
| Baco de Bogota S.A. | ||||||||
| 775 | 5.38%, 02/19/2023 § | 808 | ||||||
| Emgesa S.A. | ||||||||
| COP | 2,406,000 | 8.75%, 01/25/2021 § | 1,254 | |||||
| Empresa de Energia de Bogota | ||||||||
| 910 | 6.13%, 11/10/2021 § | 984 | ||||||
| Empresa de Telecomunicaciones de Bogota S.A. | ||||||||
| COP | 280,000 | 7.00%, 01/17/2023 ■ | 128 | |||||
| Empresas Publicas de Medellin E.S.P. | ||||||||
| COP | 448,000 | 8.38%, 02/01/2021 § | 232 | |||||
| Pacific Rubiales Energy Corp. | ||||||||
| 1,090 | 5.63%, 01/19/2025 ■ | 1,037 | ||||||
| 4,443 | ||||||||
| Hong Kong - 2.6% | ||||||||
| CLP Power HK Finance Ltd. | ||||||||
| 1,000 | 4.25%, 11/07/2019 §♠ | 1,005 | ||||||
| First Pacific Co., Ltd. | ||||||||
| 1,030 | 4.50%, 04/16/2023 § | 986 | ||||||
| Hongkong (The) Land Finance Co., Ltd. | ||||||||
| 850 | 4.50%, 10/07/2025 | 892 | ||||||
| Metropolitan Light International | ||||||||
| 1,455 | 5.25%, 01/17/2018 § | 1,462 | ||||||
| MIE Holdings Corp. | ||||||||
| 1,440 | 7.50%, 04/25/2019 ■ | 1,411 | ||||||
| New World Development Co., Ltd. | ||||||||
| 1,000 | 5.25%, 02/26/2021 § | 1,046 | ||||||
| Smartone Finance Ltd. | ||||||||
| 1,700 | 3.88%, 04/08/2023 § | 1,561 | ||||||
| 8,363 | ||||||||
| India - 2.1% | ||||||||
| Bank of Baroda/London | ||||||||
| 965 | 6.63%, 05/25/2022 § | 994 | ||||||
| Bharti Airtel International | ||||||||
| 1,085 | 5.13%, 03/11/2023 § | 1,146 | ||||||
| ICICI Bank Ltd. | ||||||||
| 1,485 | 6.38%, 04/30/2022 § | 1,535 | ||||||
| Indian Oil Corp., Ltd. | ||||||||
| 960 | 5.75%, 08/01/2023 § | 1,046 | ||||||
| ONGC Videsh Ltd. | ||||||||
| 1,060 | 3.75%, 05/07/2023 §‡ | 1,028 | ||||||
| Reliance Holdings USA, Inc. | ||||||||
| 955 | 5.40%, 02/14/2022 § | 1,040 | ||||||
| 6,789 | ||||||||
| Indonesia - 0.7% | ||||||||
| Berau Coal Energy Tbk | ||||||||
| 990 | 7.25%, 03/13/2017 § | 678 | ||||||
| Theta Capital Pte Ltd. | ||||||||
| 1,400 | 6.13%, 11/14/2020 § | 1,439 | ||||||
| 2,117 | ||||||||
| Israel - 1.1% | ||||||||
| Inkia Energy, Inc. | ||||||||
| 1,180 | 8.38%, 04/04/2021 § | 1,276 | ||||||
| Israel Electric Corp., Ltd. | ||||||||
| 1,900 | 9.38%, 01/28/2020 § | 2,348 | ||||||
| 3,624 | ||||||||
The accompanying notes are an integral part of these financial statements.
| 6 |
The Hartford Emerging Markets Local Debt Fund
| Schedule of Investments – (continued) |
| October 31, 2014 |
| (000’s Omitted) |
| Shares or Principal Amount ╬ | Market Value ╪ | |||||||
| Corporate Bonds - 31.1% - (continued) | ||||||||
| Jamaica - 0.6% | ||||||||
| Digicel Group Ltd. | ||||||||
| $ | 1,975 | 7.13%, 04/01/2022 ■ | $ | 1,985 | ||||
| Kazakhstan - 1.3% | ||||||||
| Halyk Savings Bank of Kazakhstan | ||||||||
| 1,315 | 7.25%, 01/28/2021 § | 1,409 | ||||||
| Kazakhstan Temir Zholy Finance B.V. | ||||||||
| 755 | 6.38%, 10/06/2020 § | 825 | ||||||
| Nostrum Oil & Gas Finance B.V. | ||||||||
| 1,600 | 6.38%, 02/14/2019 ■ | 1,604 | ||||||
| 425 | 6.38%, 02/14/2019 § | 426 | ||||||
| 4,264 | ||||||||
| Luxembourg - 1.6% | ||||||||
| Altice Financing S.A. | ||||||||
| 1,930 | 8.13%, 01/15/2024 § | 2,031 | ||||||
| Cosan Luxembourg S.A. | ||||||||
| 470 | 5.00%, 03/14/2023 ■ | 452 | ||||||
| 225 | 5.00%, 03/14/2023 § | 217 | ||||||
| European Investment Bank | ||||||||
| ZAR | 475 | 8.76%, 12/31/2018 ○ | 32 | |||||
| Offshore Drilling Holding | ||||||||
| 705 | 8.63%, 09/20/2020 ■ | 741 | ||||||
| 1,500 | 8.63%, 09/20/2020 § | 1,575 | ||||||
| 5,048 | ||||||||
| Malaysia - 0.2% | ||||||||
| Public Bank Bhd | ||||||||
| 535 | 6.84%, 08/22/2036 | 551 | ||||||
| Mexico - 2.2% | ||||||||
| Alpek S.A. de C.V. | ||||||||
| 345 | 5.38%, 08/08/2023 ■ | 366 | ||||||
| 200 | 5.38%, 08/08/2023 § | 212 | ||||||
| BBVA Bancomer S.A./Grand Cayman | ||||||||
| 1,490 | 6.01%, 05/17/2022 §‡ | 1,555 | ||||||
| Credito Real S.A. de C.V. | ||||||||
| 1,020 | 7.50%, 03/13/2019 § | 1,076 | ||||||
| Empresas ICA S.A.B de C.V. | ||||||||
| 1,540 | 8.88%, 05/29/2024 ■ | 1,563 | ||||||
| Mexichem S.A.B. de C.V. | ||||||||
| 1,000 | 6.75%, 09/19/2042 § | 1,095 | ||||||
| Tenedora Nemak S.A. | ||||||||
| 970 | 5.50%, 02/28/2023 § | 1,009 | ||||||
| 6,876 | ||||||||
| Netherlands - 1.8% | ||||||||
| Cimpor Financial Operations B.V. | ||||||||
| 1,015 | 5.75%, 07/17/2024 ■ | 976 | ||||||
| FBN Finance Co. B.V. | ||||||||
| 1,005 | 8.00%, 07/23/2021 ■ | 980 | ||||||
| Listrindo Capital B.V. | ||||||||
| 890 | 6.95%, 02/21/2019 § | 948 | ||||||
| VimpelCom Holdings B.V. | ||||||||
| 900 | 7.50%, 03/01/2022 § | 898 | ||||||
| VTR Finance B.V. | ||||||||
| 1,305 | 6.88%, 01/15/2024 ■ | 1,370 | ||||||
| 450 | 6.88%, 01/15/2024 § | 472 | ||||||
| 5,644 | ||||||||
| Peru - 1.4% | ||||||||
| Banco de Credito del Peru/Panama | ||||||||
| 896 | 6.88%, 09/16/2026 §‡ | 1,006 | ||||||
| Banco Internacional del Peru SAA | ||||||||
| 850 | 6.63%, 03/19/2029 ■ | 922 | ||||||
| 825 | 6.63%, 03/19/2029 § | 895 | ||||||
| Cia Minera Milpo SAA | ||||||||
| 960 | 4.63%, 03/28/2023 § | 963 | ||||||
| Union Andina de Cementos SAA | ||||||||
| 795 | 5.88%, 10/30/2021 ■ | 807 | ||||||
| 4,593 | ||||||||
| Philippines - 0.4% | ||||||||
| International Container Terminal Services, Inc. | ||||||||
| 1,180 | 7.38%, 03/17/2020 § | 1,338 | ||||||
| Singapore - 0.5% | ||||||||
| United Overseas Bank Ltd. | ||||||||
| 1,395 | 3.75%, 09/19/2024 ╦§ | 1,408 | ||||||
| South Africa - 0.1% | ||||||||
| Eskom Holdings Ltd. | ||||||||
| ZAR | 2,060 | 10.63%, 08/18/2027 ○ | 48 | |||||
| ZAR | 700 | 10.73%, 12/31/2032 ○ | 10 | |||||
| Transnet Ltd. | ||||||||
| ZAR | 1,000 | 10.00%, 03/30/2029 § | 88 | |||||
| 146 | ||||||||
| South Korea - 0.5% | ||||||||
| Woori Bank | ||||||||
| 1,505 | 4.75%, 04/30/2024 ■ | 1,560 | ||||||
| Thailand - 0.9% | ||||||||
| Krung Thai Bank PCL/Cayman Islands | ||||||||
| 500 | 5.20%, 12/26/2024 § | 516 | ||||||
| Krung Thai Bank Public Co., Ltd. | ||||||||
| 875 | 7.38%, 10/10/2016 ♠ | 910 | ||||||
| PTT Exploration & Production PCL | ||||||||
| 1,550 | 4.88%, 06/18/2019 ■♠ | 1,575 | ||||||
| 3,001 | ||||||||
| Turkey - 1.3% | ||||||||
| Turk Telekomunikasyon A.S. | ||||||||
| 1,055 | 4.88%, 06/19/2024 ■ | 1,047 | ||||||
| Turkiye Halk Bankasi A.S. | ||||||||
| 720 | 4.75%, 06/04/2019 ■ | 722 | ||||||
| Turkiye Is Bankasi | ||||||||
| 1,025 | 6.00%, 10/24/2022 § | 1,021 | ||||||
| Yasar Holdings | ||||||||
| 1,470 | 8.88%, 05/06/2020 ■☼ | 1,470 | ||||||
| 4,260 | ||||||||
| United Arab Emirates - 0.3% | ||||||||
| Emirates NBD Tier 1 Ltd. | ||||||||
| 1,040 | 5.75%, 05/30/2019 §♠ | 1,017 | ||||||
| United Kingdom - 1.2% | ||||||||
| European Bank for Reconstruction & Development | ||||||||
| ZAR | 550 | 8.76%, 12/31/2020 ○ | 32 | |||||
| Standard Bank plc | ||||||||
| 700 | 8.13%, 12/02/2019 § | 801 | ||||||
| Tullow Oil plc | ||||||||
| 565 | 6.00%, 11/01/2020 ■ | 528 | ||||||
| 975 | 6.25%, 04/15/2022 § | 907 | ||||||
The accompanying notes are an integral part of these financial statements.
| 7 |
The Hartford Emerging Markets Local Debt Fund
| Schedule of Investments – (continued) |
| October 31, 2014 |
| (000’s Omitted) |
| Shares or Principal Amount ╬ | Market Value ╪ | |||||||
| Corporate Bonds - 31.1% - (continued) | ||||||||
| United Kingdom - 1.2% - (continued) | ||||||||
| Vedanta Resources plc | ||||||||
| $ | 1,500 | 6.00%, 01/31/2019 § | $ | 1,530 | ||||
| 3,798 | ||||||||
| United States - 1.7% | ||||||||
| Comcel Trust | ||||||||
| 1,470 | 6.88%, 02/06/2024 ■ | 1,573 | ||||||
| 400 | 6.88%, 02/06/2024 § | 428 | ||||||
| Kosmos Energy Ltd. | ||||||||
| 1,505 | 7.88%, 08/01/2021 ■ | 1,384 | ||||||
| Semiconductor Manufacturing International | ||||||||
| 1,140 | 4.13%, 10/07/2019 ■ | 1,147 | ||||||
| Yuzhou Properties Co., Ltd. | ||||||||
| 1,015 | 8.63%, 01/24/2019 § | 1,010 | ||||||
| 5,542 | ||||||||
| Total Corporate Bonds | ||||||||
| (Cost $99,781) | $ | 99,599 | ||||||
| Foreign Government Obligations - 63.0% | ||||||||
| Brazil - 5.9% | ||||||||
| Brazil (Federative Republic of) | ||||||||
| BRL | 15,131 | 6.00%, 05/15/2015 - 08/15/2050 ◄ | $ | 6,189 | ||||
| BRL | 17,862 | 10.00%, 01/01/2017 - 01/01/2023 | 6,574 | |||||
| BRL | 5,004 | 11.39%, 01/01/2015 ○ | 1,983 | |||||
| BRL | 3,298 | 11.41%, 04/01/2015 ○ | 1,272 | |||||
| BRL | 8,491 | 12.08%, 01/01/2016 ○ | 2,996 | |||||
| 19,014 | ||||||||
| Chile - 2.0% | ||||||||
| Chile (Republic of) | ||||||||
| CLP | 1,190,795 | 3.00%, 01/01/2020 - 01/01/2034 ◄ | 2,383 | |||||
| CLP | 82,500 | 5.50%, 08/05/2020 | 151 | |||||
| CLP | 1,980,000 | 6.00%, 03/01/2018 - 01/01/2024 | 3,753 | |||||
| 6,287 | ||||||||
| Colombia - 7.2% | ||||||||
| Colombia (Republic of) | ||||||||
| COP | 7,760,122 | 3.50%, 03/10/2021 ◄ | 3,879 | |||||
| COP | 1,093,247 | 4.25%, 05/17/2017 ◄ | 559 | |||||
| COP | 8,802,800 | 6.00%, 04/28/2028 | 3,895 | |||||
| COP | 3,150,200 | 7.00%, 05/04/2022 | 1,576 | |||||
| COP | 6,859,300 | 7.25%, 06/15/2016 | 3,451 | |||||
| COP | 4,499,500 | 7.50%, 08/26/2026 | 2,290 | |||||
| COP | 10,145,900 | 10.00%, 07/24/2024 | 6,113 | |||||
| COP | 2,480,100 | 11.25%, 10/24/2018 | 1,443 | |||||
| 23,206 | ||||||||
| Hungary - 2.8% | ||||||||
| Hungary (Republic of) | ||||||||
| HUF | 840,170 | 5.50%, 02/12/2016 - 12/22/2016 | 3,644 | |||||
| HUF | 310,550 | 6.75%, 02/24/2017 | 1,382 | |||||
| HUF | 191,030 | 7.75%, 08/24/2015 | 813 | |||||
| HUF | 778,830 | 8.00%, 02/12/2015 | 3,218 | |||||
| 9,057 | ||||||||
| Indonesia - 5.6% | ||||||||
| Indonesia (Republic of) | ||||||||
| IDR | 16,505,000 | 5.63%, 05/15/2023 | 1,168 | |||||
| IDR | 19,412,000 | 6.63%, 05/15/2033 | 1,311 | |||||
| IDR | 22,065,000 | 7.00%, 05/15/2027 | 1,645 | |||||
| IDR | 4,453,000 | 7.88%, 04/15/2019 | 369 | |||||
| IDR | 14,669,000 | 8.25%, 06/15/2032 | 1,175 | |||||
| IDR | 145,154,000 | 8.38%, 03/15/2024 - 03/15/2034 | 12,169 | |||||
| IDR | 1,325,000 | 9.00%, 03/15/2029 | 115 | |||||
| 17,952 | ||||||||
| Malaysia - 4.7% | ||||||||
| Malaysia (Government of) | ||||||||
| MYR | 3,625 | 3.20%, 10/15/2015 | 1,100 | |||||
| MYR | 3,920 | 3.58%, 09/28/2018 | 1,190 | |||||
| MYR | 6,770 | 3.65%, 10/31/2019 | 2,059 | |||||
| MYR | 14,409 | 3.74%, 02/27/2015 | 4,386 | |||||
| MYR | 14,140 | 3.84%, 08/12/2015 - 04/15/2033 | 4,199 | |||||
| MYR | 7,111 | 4.26%, 09/15/2016 | 2,192 | |||||
| 15,126 | ||||||||
| Mexico - 3.3% | ||||||||
| Mexico (United Mexican States) | ||||||||
| MXN | 9,691 | 2.00%, 06/09/2022 ◄ | 708 | |||||
| MXN | 11,495 | 2.50%, 12/10/2020 ◄ | 875 | |||||
| MXN | 31,569 | 4.00%, 11/15/2040 ◄ | 2,569 | |||||
| MXN | 26,599 | 4.50%, 12/04/2025 - 11/22/2035 ◄ | 2,324 | |||||
| MXN | 13,907 | 7.25%, 12/15/2016 | 1,105 | |||||
| MXN | 21,157 | 8.00%, 12/07/2023 | 1,803 | |||||
| MXN | 11,844 | 10.00%, 12/05/2024 | 1,150 | |||||
| 10,534 | ||||||||
| Nigeria - 1.7% | ||||||||
| Nigeria (Federal Republic of) | ||||||||
| NGN | 392,305 | 4.00%, 04/23/2015 | 2,293 | |||||
| NGN | 103,335 | 7.00%, 10/23/2019 | 496 | |||||
| NGN | 150,400 | 14.20%, 03/14/2024 | 987 | |||||
| NGN | 45,345 | 16.00%, 06/29/2019 | 306 | |||||
| NGN | 179,785 | 16.39%, 01/27/2022 | 1,277 | |||||
| 5,359 | ||||||||
| Peru - 1.5% | ||||||||
| Peru (Republic of) | ||||||||
| PEN | 1,695 | 6.00%, 08/01/2024 ■☼ | 578 | |||||
| PEN | 2,143 | 6.85%, 02/12/2042 | 756 | |||||
| PEN | 2,490 | 6.90%, 08/12/2037 | 897 | |||||
| PEN | 6,243 | 6.95%, 08/12/2031 | 2,277 | |||||
| PEN | 684 | 8.20%, 08/12/2026 | 286 | |||||
| 4,794 | ||||||||
| Poland - 6.6% | ||||||||
| Poland (Republic of) | ||||||||
| PLN | 22,595 | 2.69%, 01/25/2018 - 01/25/2019 Δ | 6,703 | |||||
| PLN | 340 | 3.25%, 07/25/2025 | 107 | |||||
| PLN | 4,975 | 4.00%, 10/25/2023 | 1,658 | |||||
| PLN | 25,700 | 4.75%, 10/25/2016 | 8,074 | |||||
| PLN | 7,845 | 5.50%, 04/25/2015 | 2,370 | |||||
| PLN | 5,565 | 5.75%, 09/23/2022 - 04/25/2029 | 2,096 | |||||
| 21,008 | ||||||||
The accompanying notes are an integral part of these financial statements.
| 8 |
The Hartford Emerging Markets Local Debt Fund
| Schedule of Investments – (continued) |
| October 31, 2014 |
| (000’s Omitted) |
| Shares or Principal Amount ╬ | Market Value ╪ | |||||||
| Foreign Government Obligations - 63.0% - (continued) | ||||||||
| Romania - 3.6% | ||||||||
| Romania (Republic of) | ||||||||
| RON | 6,365 | 4.75%, 08/29/2016 - 02/24/2025 | $ | 1,910 | ||||
| RON | 8,460 | 5.80%, 10/26/2015 - 07/26/2027 | 2,545 | |||||
| RON | 12,720 | 5.85%, 04/26/2023 | 4,167 | |||||
| RON | 6,430 | 5.95%, 06/11/2021 | 2,085 | |||||
| RON | 2,700 | 6.75%, 06/11/2017 | 849 | |||||
| 11,556 | ||||||||
| Russia - 2.0% | ||||||||
| Russia (Federation of) | ||||||||
| RUB | 25,845 | 6.70%, 05/15/2019 Δ | 531 | |||||
| RUB | 5,720 | 6.80%, 12/11/2019 | 117 | |||||
| RUB | 53,455 | 7.00%, 01/25/2023 - 08/16/2023 Δ | 1,047 | |||||
| RUB | 45,315 | 7.05%, 01/19/2028 Δ | 842 | |||||
| RUB | 15,730 | 7.50%, 02/27/2019 Δ | 335 | |||||
| RUB | 80,339 | 7.60%, 04/14/2021 - 07/20/2022 Δ | 1,650 | |||||
| RUB | 20,000 | 7.85%, 03/10/2018 § | 437 | |||||
| RUB | 68,236 | 8.15%, 02/03/2027 Δ | 1,402 | |||||
| 6,361 | ||||||||
| Slovenia - 1.0% | ||||||||
| Slovenia (Republic of) | ||||||||
| EUR | 530 | 4.13%, 01/26/2020 § | 742 | |||||
| EUR | 250 | 4.38%, 01/18/2021 § | 354 | |||||
| EUR | 990 | 4.63%, 09/09/2024 § | 1,432 | |||||
| 525 | 5.85%, 05/10/2023 § | 589 | ||||||
| 3,117 | ||||||||
| South Africa - 4.8% | ||||||||
| South Africa (Republic of) | ||||||||
| ZAR | 27,517 | 6.25%, 03/31/2036 | 1,944 | |||||
| ZAR | 12,190 | 6.50%, 02/28/2041 | 860 | |||||
| ZAR | 50,800 | 7.00%, 02/28/2031 | 4,053 | |||||
| ZAR | 19,460 | 7.75%, 02/28/2023 | 1,771 | |||||
| ZAR | 50,690 | 8.00%, 01/31/2030 | 4,484 | |||||
| ZAR | 9,225 | 8.25%, 03/31/2032 | 821 | |||||
| ZAR | 14,765 | 8.75%, 02/28/2048 | 1,351 | |||||
| 15,284 | ||||||||
| South Korea - 1.7% | ||||||||
| Korea (Republic of) | ||||||||
| KRW | 1,151,680 | 2.75%, 06/10/2017 | 1,094 | |||||
| KRW | 2,628,530 | 3.25%, 12/10/2014 | 2,462 | |||||
| KRW | 1,970,990 | 4.50%, 03/10/2015 | 1,860 | |||||
| 5,416 | ||||||||
| Thailand - 1.9% | ||||||||
| Thailand (Kingdom of) | ||||||||
| THB | 104,465 | 3.63%, 06/16/2023 | 3,333 | |||||
| THB | 11,370 | 3.78%, 06/25/2032 | 344 | |||||
| THB | 74,830 | 3.88%, 06/13/2019 | 2,416 | |||||
| THB | 5,055 | 4.88%, 06/22/2029 | 178 | |||||
| 6,271 | ||||||||
| Turkey - 6.7% | ||||||||
| Turkey (Republic of) | ||||||||
| TRY | 4,071 | 2.50%, 05/04/2016 ◄ | 1,854 | |||||
| TRY | 1,406 | 2.80%, 11/08/2023 ◄ | 683 | |||||
| TRY | 5,126 | 3.00%, 01/06/2021 - 02/23/2022 ◄ | 2,483 | |||||
| TRY | 10,932 | 4.00%, 04/29/2015 - 04/01/2020 ◄ | 5,111 | |||||
| TRY | 1,391 | 4.50%, 02/11/2015 ◄ | 633 | |||||
| TRY | 2,835 | 8.80%, 09/27/2023 | 1,295 | |||||
| TRY | 3,935 | 9.00%, 01/27/2016 - 07/24/2024 | 1,829 | |||||
| TRY | 5,990 | 10.00%, 06/17/2015 | 2,721 | |||||
| TRY | 5,375 | 10.40%, 03/20/2024 | 2,701 | |||||
| TRY | 4,150 | 10.50%, 01/15/2020 | 2,042 | |||||
| 21,352 | ||||||||
| Total Foreign Government Obligations | ||||||||
| (Cost $214,214) | $ | 201,694 | ||||||
| Total Long-Term Investments Excluding Purchased Options | ||||||||
| (Cost $313,995) | $ | 301,293 | ||||||
| Short-Term Investments - 3.6% | ||||||||
| Foreign Government Obligations - 0.2% | ||||||||
| Nigeria (Federal Republic of) | ||||||||
| NGN | 105,158 | 15.15%, 3/5/2015 ○ | $ | 612 | ||||
| Repurchase Agreements - 3.4% | ||||||||
| Bank of America Merrill Lynch TriParty Repurchase Agreement (maturing on 11/03/2014 in the amount of $31, collateralized by U.S. Treasury Note 1.50%, 2019, value of $31) |
||||||||
| $ | 31 | 0.08%, 10/31/2014 | $ | 31 | ||||
| Bank of America Merrill Lynch TriParty Repurchase Agreement (maturing on 11/03/2014 in the amount of $523, collateralized by GNMA 1.63% - 7.00%, 2031 - 2054, value of $534) |
||||||||
| 523 | 0.09%, 10/31/2014 | 523 | ||||||
| Bank of Montreal TriParty Repurchase Agreement (maturing on 11/03/2014 in the amount of $141, collateralized by U.S. Treasury Bond 2.88% - 5.25%, 2029 - 2043, U.S. Treasury Note 0.38% - 4.50%, 2015 - 2022, value of $143) |
||||||||
| 141 | 0.08%, 10/31/2014 | 141 | ||||||
| Bank of Montreal TriParty Repurchase Agreement (maturing on 11/03/2014 in the amount of $477, collateralized by FHLMC 2.00% - 5.50%, 2022 - 2034, FNMA 2.00% - 4.50%, 2024 - 2039, GNMA 3.00%, 2043, U.S. Treasury Note 4.63%, 2017, value of $486) |
||||||||
| 477 | 0.10%, 10/31/2014 | 477 | ||||||
| Barclays Capital TriParty Repurchase Agreement (maturing on 11/03/2014 in the amount of $1,796, collateralized by U.S. Treasury Bond 4.50% - 6.25%, 2023 - 2036, U.S. Treasury Note 1.63% - 2.13%, 2015 - 2019, value of $1,832) |
||||||||
| 1,796 | 0.08%, 10/31/2014 | 1,796 | ||||||
The accompanying notes are an integral part of these financial statements.
| 9 |
The Hartford Emerging Markets Local Debt Fund
| Schedule of Investments – (continued) |
| October 31, 2014 |
| (000’s Omitted) |
| Shares or Principal Amount ╬ | Market Value ╪ | |||||||||||
| Short-Term Investments - 3.6% - (continued) | ||||||||||||
| Repurchase Agreements - 3.4% - (continued) | ||||||||||||
| Citigroup Global Markets, Inc. TriParty Repurchase Agreement (maturing on 11/03/2014 in the amount of $2,065, collateralized by U.S. Treasury Bill 0.02%, 2015, U.S. Treasury Bond 3.88% - 11.25%, 2015 - 2040, U.S. Treasury Note 2.00% - 3.38%, 2019 - 2021, value of $2,106) | ||||||||||||
| $ | 2,065 | 0.09%, 10/31/2014 | $ | 2,065 | ||||||||
| Deutsche Bank Securities TriParty Repurchase Agreement (maturing on 11/03/2014 in the amount of $119, collateralized by U.S. Treasury Note 0.88%, 2017, value of $122) | ||||||||||||
| 119 | 0.13%, 10/31/2014 | 119 | ||||||||||
| RBS Securities, Inc. TriParty Repurchase Agreement (maturing on 11/03/2014 in the amount of $175, collateralized by U.S. Treasury Bond 3.63% - 5.00%, 2037 - 2043, U.S. Treasury Note 2.13%, 2020, value of $179) | ||||||||||||
| 175 | 0.07%, 10/31/2014 | 175 | ||||||||||
| Societe Generale TriParty Repurchase Agreement (maturing on 11/03/2014 in the amount of $1,848, collateralized by U.S. Treasury Bill 0.02%, 2015, U.S. Treasury Bond 3.75% - 11.25%, 2015 - 2043, U.S. Treasury Note 1.38% - 4.25%, 2015 - 2022, value of $1,885) | ||||||||||||
| 1,848 | 0.08%, 10/31/2014 | 1,848 | ||||||||||
| TD Securities TriParty Repurchase Agreement (maturing on 11/03/2014 in the amount of $3,582, collateralized by FHLMC 3.00% - 4.00%, 2026 - 2044, FNMA 2.50% - 5.00%, 2025 - 2044, U.S. Treasury Bond 3.50% - 6.50%, 2026 - 2041, U.S. Treasury Note 1.75% - 2.88%, 2018 - 2019, value of $3,653) | ||||||||||||
| 3,582 | 0.10%, 10/31/2014 | 3,582 | ||||||||||
| 10,757 | ||||||||||||
| Total Short-Term Investments | ||||||||||||
| (Cost $11,367) | $ | 11,369 | ||||||||||
| Total Investments Excluding Purchased Options | ||||||||||||
| (Cost $325,362) | 97.7 | % | $ | 312,662 | ||||||||
| Total Purchased Options | ||||||||||||
| (Cost $472) | 0.3 | % | 857 | |||||||||
| Total Investments | ||||||||||||
| (Cost $325,834) ▲ | 98.0 | % | $ | 313,519 | ||||||||
| Other Assets and Liabilities | 2.0 | % | 6,602 | |||||||||
| Total Net Assets | 100.0 | % | $ | 320,121 | ||||||||
The accompanying notes are an integral part of these financial statements.
| 10 |
The Hartford Emerging Markets Local Debt Fund
| Schedule of Investments – (continued) |
| October 31, 2014 |
| (000’s Omitted) |
| Note: | Percentage of investments as shown is the ratio of the total market value to total net assets. |
The Fund may refer to any one or more of the industry classifications used by one or more widely recognized market indices, ratings group indices and/or as defined by Fund management. Industry classifications may not be identical across all security types.
For Fund compliance purposes, the Fund may not use the same classification system shown in this report as these classifications are used for reporting ease.
| ▲ | At October 31, 2014, the cost of securities for federal income tax purposes was $326,576 and the aggregate gross unrealized appreciation and depreciation based on that cost were: |
| Unrealized Appreciation | $ | 3,262 | ||
| Unrealized Depreciation | (16,319 | ) | ||
| Net Unrealized Depreciation | $ | (13,057 | ) |
| ╬ | All principal amounts are in U.S. dollars unless otherwise indicated. |
| Δ | Variable rate securities; the rate reported is the coupon rate in effect at October 31, 2014. |
| ○ | The interest rate disclosed for these securities represents the effective yield on the date of the acquisition. |
| ◄ | The principal amount for this security is adjusted for inflation and the interest payments equal a fixed percentage of the inflation-adjusted principal amount. |
| ■ | Securities issued within terms of a private placement memorandum, exempt from registration under Rule 144A under the Securities Act of 1933, as amended, and may be sold only to qualified institutional buyers. Unless otherwise indicated, these holdings are determined to be liquid. At October 31, 2014, the aggregate value of these securities was $30,073, which represents 9.4% of total net assets. |
| § | These securities were sold to the Fund under Regulation S, rules governing offers and sales made outside the United States without registration under the Securities Act of 1933, as amended. The Fund may only be able to resell these securities in the United States if an exemption from registration under the federal and state securities laws is available, or the Fund may only be able to sell these securities outside of the United States (such as on a foreign exchange) to a non-U.S. person. Unless otherwise indicated, these holdings are determined to be liquid. At October 31, 2014, the aggregate value of these securities was $68,678, which represents 21.5% of total net assets. |
| ♠ | Perpetual maturity security. Maturity date shown is the next call date or final legal maturity date, whichever comes first. |
| ☼ | This security, or a portion of this security, was purchased on a when-issued or delayed-delivery basis. The cost of these securities was $2,048 at October 31, 2014. |
| ‡ | This security, or a portion of this security, has been segregated to cover funding requirements on investment transactions settling in the future. |
| ╦ | This security, or a portion of this security, has been pledged as collateral in connection with OTC swap contracts. |
| Θ | This security, or a portion of this security, has been pledged as collateral in connection with OTC option and/or swaption contracts. |
Cash pledged and received as collateral in connection with derivatives at October 31, 2014:
| Pledged | Received | |||||||
| OTC option and/or OTC swap contracts | $ | 1,340 | $ | – | ||||
| Futures contracts | 19 | – | ||||||
| Total | $ | 1,359 | $ | – | ||||
The accompanying notes are an integral part of these financial statements.
| 11 |
The Hartford Emerging Markets Local Debt Fund
| Schedule of Investments – (continued) |
| October 31, 2014 |
| (000’s Omitted) |
OTC Option Contracts Outstanding at October 31, 2014
| Description | Counter
- party | Risk Exposure Category | Exercise Price/ FX Rate/ Rate | Expiration Date | Number of Contracts * | Market Value ╪ | Premiums Received/ Paid by Fund Δ | Unrealized Appreciation (Depreciation) | ||||||||||||||||
| Purchased Option contracts: | ||||||||||||||||||||||||
| Calls | ||||||||||||||||||||||||
| USD Call/CLP Put | MSC | FX | 642.70 CLP per USD | 03/26/15 | USD | 4,928,000 | $ | 19 | $ | 62 | $ | (43 | ) | |||||||||||
| USD Call/COP Put | GSC | FX | 2,007.70 COP per USD | 12/23/14 | USD | 6,339,469 | 205 | 63 | 142 | |||||||||||||||
| USD Call/COP Put | CBK | FX | 2,187.25 COP per USD | 04/23/15 | USD | 6,660,000 | 75 | 75 | – | |||||||||||||||
| USD Call/TRY Put | DEUT | FX | 2.34 TRY per USD | 01/16/15 | USD | 8,774,475 | 68 | 111 | (43 | ) | ||||||||||||||
| Total Calls | 26,701,944 | $ | 367 | $ | 311 | $ | 56 | |||||||||||||||||
| Puts | ||||||||||||||||||||||||
| EUR Put/PLN Call | DEUT | FX | 4.04 PLN per EUR | 05/06/15 | EUR | 2,298,000 | $ | 5 | $ | 28 | $ | (23 | ) | |||||||||||
| EUR Put/PLN Call | DEUT | FX | 4.13 PLN per EUR | 05/06/15 | EUR | 2,217,000 | 12 | 29 | (17 | ) | ||||||||||||||
| EUR Put/USD Call | GSC | FX | 1.32 USD per EUR | 02/06/15 | EUR | 7,215,303 | 473 | 69 | 404 | |||||||||||||||
| USD Put/RUB Call | JPM | FX | 35.63 RUB per USD | 01/30/15 | USD | 3,382,725 | – | 35 | (35 | ) | ||||||||||||||
| Total Puts | 15,113,028 | $ | 490 | $ | 161 | $ | 329 | |||||||||||||||||
| Total purchased option contracts | 41,814,972 | $ | 857 | $ | 472 | $ | 385 | |||||||||||||||||
| Written option contracts: | ||||||||||||||||||||||||
| Calls | ||||||||||||||||||||||||
| USD Call/BRL Put | JPM | FX | 2.83 BRL per USD | 04/01/15 | USD | 6,495,940 | $ | 84 | $ | 120 | $ | 36 | ||||||||||||
| USD Call/TRY Put | DEUT | FX | 2.54 TRY per USD | 01/16/15 | USD | 8,774,475 | 13 | 42 | 29 | |||||||||||||||
| Total Calls | 15,270,415 | $ | 97 | $ | 162 | $ | 65 | |||||||||||||||||
| Puts | ||||||||||||||||||||||||
| EUR Put/USD Call | GSC | FX | 1.28 USD per EUR | 02/06/15 | EUR | 7,215,303 | $ | 265 | $ | 50 | $ | (215 | ) | |||||||||||
| USD Put/CLP Call | MSC | FX | 581.50 CLP per USD | 03/26/15 | USD | 4,928,000 | 97 | 49 | (48 | ) | ||||||||||||||
| USD Put/COP Call | GSC | FX | 1,861.30 COP per USD | 12/23/14 | USD | 6,339,465 | – | 43 | 43 | |||||||||||||||
| USD Put/COP Call | CBK | FX | 2,007.50 COP per USD | 04/23/15 | USD | 6,660,000 | 48 | 58 | 10 | |||||||||||||||
| USD Put/TRY Call | DEUT | FX | 2.12 TRY per USD | 01/16/15 | USD | 8,774,475 | 6 | 74 | 68 | |||||||||||||||
| Total Puts | 33,917,243 | $ | 416 | $ | 274 | $ | (142 | ) | ||||||||||||||||
| Total written option contracts | 49,187,658 | $ | 513 | $ | 436 | $ | (77 | ) | ||||||||||||||||
| * | The number of contracts does not omit 000's. |
| Δ | For purchased options, premiums are paid by the Fund, for written options, premiums are received. |
Futures Contracts Outstanding at October 31, 2014
| Number of | Expiration | Notional | Market | Unrealized Appreciation/(Depreciation) | Variation Margin | |||||||||||||||||||||||
| Description | Contracts* | Date | Amount | Value ╪ | Asset | Liability | Asset | Liability | ||||||||||||||||||||
| Long position contracts: | ||||||||||||||||||||||||||||
| U.S. Treasury Long Bond Future | 7 | 12/19/2014 | $ | 974 | $ | 988 | $ | 14 | $ | – | $ | – | $ | (3 | ) | |||||||||||||
| Short position contracts: | ||||||||||||||||||||||||||||
| U.S. Treasury 10-Year Note Future | 24 | 12/19/2014 | $ | 2,991 | $ | 3,033 | $ | – | $ | (42 | ) | $ | 6 | $ | – | |||||||||||||
| Total futures contracts | $ | 14 | $ | (42 | ) | $ | 6 | $ | (3 | ) | ||||||||||||||||||
* The number of contracts does not omit 000's.
The accompanying notes are an integral part of these financial statements.
| 12 |
The Hartford Emerging Markets Local Debt Fund
| Schedule of Investments – (continued) |
| October 31, 2014 |
| (000’s Omitted) |
OTC Credit Default Swap Contracts Outstanding at October 31, 2014
| Counter- | Notional | (Pay)/ Receive
Fixed Rate/ Implied | Expiration | Upfront
Premiums | Upfront
Premiums | Market | Unrealized
Appreciation/ (Depreciation) | |||||||||||||||||||||||
| Reference Entity | party | Amount (a) | Credit Spread (b) | Date | Paid | Received | Value ╪ | Asset | Liability | |||||||||||||||||||||
| Credit default swaps on single-name issues: | ||||||||||||||||||||||||||||||
| Buy protection: | ||||||||||||||||||||||||||||||
| China (People's Republic of) | BCLY | USD | 650 | (1.00)% / (0.43)% | 12/20/17 | $ | – | $ | (9 | ) | $ | (12 | ) | $ | – | $ | (3 | ) | ||||||||||||
| China (People's Republic of) | BOA | USD | 465 | (1.00)% / (0.43)% | 12/20/17 | – | (5 | ) | (8 | ) | – | (3 | ) | |||||||||||||||||
| Total | $ | – | $ | (14 | ) | $ | (20 | ) | $ | – | $ | (6 | ) | |||||||||||||||||
| Sell protection: | ||||||||||||||||||||||||||||||
| China (People's Republic of) | BCLY | USD | 650 | 1.00% / 0.14% | 12/20/14 | $ | 12 | $ | – | $ | 1 | $ | – | $ | (11 | ) | ||||||||||||||
| China (People's Republic of) | BOA | USD | 451 | 1.00% / 0.14% | 12/20/14 | 7 | – | – | – | (7 | ) | |||||||||||||||||||
| Total | $ | 19 | $ | – | $ | 1 | $ | – | $ | (18 | ) | |||||||||||||||||||
| Total single-name issues | $ | 19 | $ | (14 | ) | $ | (19 | ) | $ | – | $ | (24 | ) | |||||||||||||||||
| (a) | The maximum potential amount the Fund could be required to pay as a seller of credit protection or receive as a buyer of credit protection if a credit event occurs as defined under the terms of that particular swap agreement. |
| (b) | Implied credit spreads, utilized in determining the market value of credit default swap agreements on corporate issues, U.S. municipal issues or sovereign government issues as of period end serve as an indicator of the current status of the payment/performance risk and represent the likelihood of risk of default for the credit derivative. The implied credit spread of a particular entity reflects the cost of buying/selling protection and may include upfront payments required to be made to enter into the agreement. Wider credit spreads represent a deterioration of the reference entity's credit soundness and a greater likelihood or risk of default or other credit event occurring as defined under the terms of the agreement. The percentage shown is the implied credit spread on October 31, 2014. For credit default swap agreements on indices, the quoted market prices and resulting values serve as the indicator of the current status of the payment/performance risk. |
OTC Interest Rate Swap Contracts Outstanding at October 31, 2014
| Payments made | Payments received | Notional | Expiration | Upfront
Premiums |
Upfront Premiums |
Market | Unrealized Appreciation/(Depreciation) |
|||||||||||||||||||||||
| Counterparty | by Fund | by Fund | Amount | Date | Paid | Received | Value ╪ | Asset | Liability | |||||||||||||||||||||
| BCLY | 4.12% Fixed | 6M WIBOR PLN | PLN | 175 | 03/19/24 | $ | – | $ | – | $ | (8 | ) | $ | – | $ | (8 | ) | |||||||||||||
| BOA | 11.28% Fixed | BZDIOVRA | BRL | 5,012 | 01/04/21 | – | – | 52 | 52 | – | ||||||||||||||||||||
| BOA | 12.32% Fixed | BZDIOVRA | BRL | 9,539 | 01/02/18 | – | – | 23 | 23 | – | ||||||||||||||||||||
| BOA | 12.61% Fixed | BZDIOVRA | BRL | 9,688 | 01/02/18 | – | – | (13 | ) | – | (13 | ) | ||||||||||||||||||
| BOA | 4.11% Fixed | 6M WIBOR PLN | PLN | 285 | 03/19/24 | – | – | (13 | ) | – | (13 | ) | ||||||||||||||||||
| BOA | 4.15% Fixed | 6M WIBOR PLN | PLN | 315 | 03/19/24 | – | – | (15 | ) | – | (15 | ) | ||||||||||||||||||
| BOA | 6.31% Fixed | MXIBTIIE | MXN | 21,280 | 09/02/24 | – | – | (22 | ) | – | (22 | ) | ||||||||||||||||||
| BOA | BZDIOVRA | 10.00% Fixed | BRL | 2,644 | 01/04/21 | – | – | (118 | ) | – | (118 | ) | ||||||||||||||||||
| BOA | BZDIOVRA | 8.23% Fixed | BRL | 7,941 | 01/02/15 | – | – | (71 | ) | – | (71 | ) | ||||||||||||||||||
| BOA | BZDIOVRA | 8.95% Fixed | BRL | 1,873 | 01/02/23 | – | – | (187 | ) | – | (187 | ) | ||||||||||||||||||
| BOA | MXIBTIIE | 6.65% Fixed | MXN | 15,975 | 12/06/23 | – | – | 55 | 55 | – | ||||||||||||||||||||
| CBK | 2.37% Fixed | 6M WIBOR PLN | PLN | 6,005 | 12/17/19 | – | – | (39 | ) | – | (39 | ) | ||||||||||||||||||
| CBK | 6M WIBOR PLN | 2.01% Fixed | PLN | 14,455 | 12/17/16 | – | – | 28 | 28 | – | ||||||||||||||||||||
| DEUT | 4.11% Fixed | 6M WIBOR PLN | PLN | 325 | 03/19/24 | – | – | (15 | ) | – | (15 | ) | ||||||||||||||||||
| DEUT | 4.16% Fixed | 6M WIBOR PLN | PLN | 325 | 03/19/24 | – | – | (15 | ) | – | (15 | ) | ||||||||||||||||||
| DEUT | 6M THBFIX | 3.60% Fixed | THB | 92,225 | 09/17/24 | – | – | 156 | 156 | – | ||||||||||||||||||||
| DEUT | BZDIOVRA | 10.50% Fixed | BRL | 333 | 01/02/17 | – | – | 1 | 1 | – | ||||||||||||||||||||
| DEUT | BZDIOVRA | 10.55% Fixed | BRL | 692 | 01/02/17 | – | – | 4 | 4 | – | ||||||||||||||||||||
| DEUT | BZDIOVRA | 10.61% Fixed | BRL | 347 | 01/02/17 | – | – | 2 | 2 | – | ||||||||||||||||||||
| DEUT | BZDIOVRA | 9.12% Fixed | BRL | 7,875 | 01/02/17 | – | – | (241 | ) | – | (241 | ) | ||||||||||||||||||
| GSC | 1.38% Fixed | 6M CZK PRIBOR | CZK | 20,820 | 03/20/23 | – | – | (34 | ) | – | (34 | ) | ||||||||||||||||||
| GSC | 1.45% Fixed | 6M CZK PRIBOR | CZK | 21,335 | 03/20/23 | – | – | (41 | ) | – | (41 | ) | ||||||||||||||||||
| GSC | 1.56% Fixed | 6M CZK PRIBOR | CZK | 5,925 | 03/20/23 | – | – | (14 | ) | – | (14 | ) | ||||||||||||||||||
| GSC | 2.18% Fixed | 6M CZK PRIBOR | CZK | 27,050 | 06/08/22 | – | – | (66 | ) | – | (66 | ) | ||||||||||||||||||
| GSC | 2.23% Fixed | 6M CZK PRIBOR | CZK | 40,358 | 09/07/22 | – | – | (97 | ) | – | (97 | ) | ||||||||||||||||||
| GSC | 2.37% Fixed | 6M WIBOR PLN | PLN | 9,870 | 12/17/19 | – | – | (64 | ) | – | (64 | ) | ||||||||||||||||||
| GSC | 3M ZAR JIBAR | 7.00% Fixed | ZAR | 7,109 | 08/21/27 | – | – | (55 | ) | – | (55 | ) | ||||||||||||||||||
| GSC | 4.10% Fixed | 6M WIBOR PLN | PLN | 165 | 03/19/24 | – | – | (8 | ) | – | (8 | ) | ||||||||||||||||||
| GSC | 4.16% Fixed | 6M WIBOR PLN | PLN | 330 | 03/19/24 | – | – | (16 | ) | – | (16 | ) | ||||||||||||||||||
| GSC | 6M WIBOR PLN | 2.00% Fixed | PLN | 23,595 | 12/17/16 | – | – | 45 | 45 | – | ||||||||||||||||||||
| GSC | BZDIOVRA | 10.64% Fixed | BRL | 2,177 | 01/02/17 | – | – | (61 | ) | – | (61 | ) | ||||||||||||||||||
The accompanying notes are an integral part of these financial statements.
| 13 |
The Hartford Emerging Markets Local Debt Fund
| Schedule of Investments – (continued) |
| October 31, 2014 |
| (000’s Omitted) |
OTC Interest Rate Swap Contracts Outstanding at October 31, 2014 - (continued)
| Payments made | Payments received | Notional | Expiration | Upfront Premiums |
Upfront
Premiums |
Market | Unrealized Appreciation/(Depreciation) |
|||||||||||||||||||||||
| Counterparty | by Fund | by Fund | Amount | Date | Paid | Received | Value ╪ | Asset | Liability | |||||||||||||||||||||
| JPM | 2.08% Fixed | 6M CZK PRIBOR | CZK | 53,650 | 12/19/22 | $ | – | $ | – | $ | (103 | ) | $ | – | $ | (103 | ) | |||||||||||||
| JPM | 2.12% Fixed | 6M CZK PRIBOR | CZK | 46,075 | 03/21/23 | – | – | (86 | ) | – | (86 | ) | ||||||||||||||||||
| JPM | 2.18% Fixed | 6M CZK PRIBOR | CZK | 12,640 | 08/21/22 | – | – | (29 | ) | – | (29 | ) | ||||||||||||||||||
| JPM | 2.23% Fixed | 6M CZK PRIBOR | CZK | 12,645 | 08/21/22 | – | – | (31 | ) | – | (31 | ) | ||||||||||||||||||
| JPM | 2.25% Fixed | 6M CZK PRIBOR | CZK | 18,965 | 08/21/22 | – | – | (47 | ) | – | (47 | ) | ||||||||||||||||||
| JPM | 2.30% Fixed | 6M CZK PRIBOR | CZK | 33,954 | 08/21/22 | – | – | (88 | ) | – | (88 | ) | ||||||||||||||||||
| JPM | 2.32% Fixed | 6M CZK PRIBOR | CZK | 6,940 | 08/21/22 | – | – | (18 | ) | – | (18 | ) | ||||||||||||||||||
| JPM | 2.34% Fixed | 6M CZK PRIBOR | CZK | 15,650 | 05/21/22 | – | – | (44 | ) | – | (44 | ) | ||||||||||||||||||
| JPM | 2.39% Fixed | 6M CZK PRIBOR | CZK | 11,440 | 05/21/22 | – | – | (34 | ) | – | (34 | ) | ||||||||||||||||||
| JPM | 3M ZAR JIBAR | 6.94% Fixed | ZAR | 994,425 | 10/01/15 | – | – | 108 | 108 | – | ||||||||||||||||||||
| JPM | 3M ZAR JIBAR | 8.03% Fixed | ZAR | 2,185 | 08/18/23 | – | – | 4 | 4 | – | ||||||||||||||||||||
| JPM | 6M CZK PRIBOR | 0.92% Fixed | CZK | 39,210 | 11/06/17 | – | – | 25 | 25 | – | ||||||||||||||||||||
| JPM | 7.62% Fixed | 3M ZAR JIBAR | ZAR | 994,425 | 10/01/16 | – | – | (131 | ) | – | (131 | ) | ||||||||||||||||||
| MSC | 2.58% Fixed | 6M CZK PRIBOR | CZK | 8,000 | 05/09/22 | – | – | (27 | ) | – | (27 | ) | ||||||||||||||||||
| MSC | 2.60% Fixed | 6M CZK PRIBOR | CZK | 34,520 | 05/09/22 | – | – | (117 | ) | – | (117 | ) | ||||||||||||||||||
| MSC | BZDIOVRA | 10.22% Fixed | BRL | 2,606 | 01/04/21 | – | – | (98 | ) | – | (98 | ) | ||||||||||||||||||
| Total | $ | – | $ | – | $ | (1,563 | ) | $ | 503 | $ | (2,066 | ) | ||||||||||||||||||
Foreign Currency Contracts Outstanding at October 31, 2014
| Unrealized Appreciation/(Depreciation) | ||||||||||||||||||||||
| Currency | Buy / Sell | Delivery Date | Counterparty | Contract Amount | Market Value ╪ | Asset | Liability | |||||||||||||||
| AUD | Buy | 12/17/2014 | DEUT | $ | 2,834 | $ | 2,846 | $ | 12 | $ | – | |||||||||||
| AUD | Sell | 12/17/2014 | RBS | 2,937 | 2,846 | 91 | – | |||||||||||||||
| BRL | Buy | 12/02/2014 | BOA | 1,051 | 1,041 | – | (10 | ) | ||||||||||||||
| BRL | Buy | 12/02/2014 | JPM | 849 | 853 | 4 | – | |||||||||||||||
| BRL | Buy | 12/02/2014 | MSC | 6,862 | 6,514 | – | (348 | ) | ||||||||||||||
| BRL | Buy | 12/02/2014 | UBS | 11,664 | 10,900 | – | (764 | ) | ||||||||||||||
| BRL | Sell | 12/02/2014 | BCLY | 523 | 478 | 45 | – | |||||||||||||||
| BRL | Sell | 04/01/2015 | JPM | 1,538 | 1,543 | – | (5 | ) | ||||||||||||||
| BRL | Sell | 12/02/2014 | MSC | 2,344 | 2,348 | – | (4 | ) | ||||||||||||||
| BRL | Sell | 12/02/2014 | UBS | 9,848 | 9,341 | 507 | – | |||||||||||||||
| CAD | Buy | 12/17/2014 | DEUT | 530 | 532 | 2 | – | |||||||||||||||
| CAD | Sell | 12/17/2014 | DEUT | 2,974 | 2,916 | 58 | – | |||||||||||||||
| CLP | Buy | 12/17/2014 | BNP | 2,171 | 2,233 | 62 | – | |||||||||||||||
| CLP | Buy | 12/17/2014 | BOA | 1,412 | 1,439 | 27 | – | |||||||||||||||
| CLP | Buy | 03/30/2015 | MSC | 2,422 | 2,526 | 104 | – | |||||||||||||||
| CLP | Sell | 12/17/2014 | BNP | 2,649 | 2,737 | – | (88 | ) | ||||||||||||||
| CLP | Sell | 12/17/2014 | BOA | 3,295 | 3,388 | – | (93 | ) | ||||||||||||||
| CLP | Sell | 12/17/2014 | CSFB | 992 | 1,023 | – | (31 | ) | ||||||||||||||
| CLP | Sell | 12/17/2014 | SCB | 4,599 | 4,742 | – | (143 | ) | ||||||||||||||
| CNY | Buy | 11/14/2014 | JPM | 2,550 | 2,715 | 165 | – | |||||||||||||||
| CNY | Sell | 11/14/2014 | DEUT | 824 | 854 | – | (30 | ) | ||||||||||||||
| CNY | Sell | 11/14/2014 | JPM | 1,800 | 1,861 | – | (61 | ) | ||||||||||||||
| COP | Buy | 12/17/2014 | BOA | 6,334 | 6,249 | – | (85 | ) | ||||||||||||||
| COP | Buy | 04/27/2015 | CBK | 2,752 | 2,744 | – | (8 | ) | ||||||||||||||
| COP | Buy | 12/26/2014 | GSC | 3,111 | 2,888 | – | (223 | ) | ||||||||||||||
| COP | Buy | 12/17/2014 | SCB | 1,612 | 1,596 | – | (16 | ) | ||||||||||||||
| COP | Buy | 12/17/2014 | SSG | 1,752 | 1,739 | – | (13 | ) | ||||||||||||||
| COP | Sell | 12/17/2014 | BOA | 2,933 | 2,834 | 99 | – | |||||||||||||||
| COP | Sell | 12/17/2014 | BOA | 1,055 | 1,056 | – | (1 | ) | ||||||||||||||
| COP | Sell | 12/17/2014 | CSFB | 1,282 | 1,244 | 38 | – | |||||||||||||||
| CZK | Buy | 12/17/2014 | DEUT | 191 | 187 | – | (4 | ) | ||||||||||||||
| CZK | Buy | 12/17/2014 | RBS | 2,943 | 2,832 | – | (111 | ) | ||||||||||||||
| CZK | Sell | 12/17/2014 | RBS | 2,327 | 2,239 | 88 | – | |||||||||||||||
| EUR | Buy | 12/17/2014 | CBA | 985 | 951 | – | (34 | ) | ||||||||||||||
| EUR | Buy | 12/17/2014 | DEUT | 1,685 | 1,631 | – | (54 | ) | ||||||||||||||
| EUR | Buy | 05/08/2015 | DEUT | 1,573 | 1,418 | – | (155 | ) | ||||||||||||||
The accompanying notes are an integral part of these financial statements.
| 14 |
The Hartford Emerging Markets Local Debt Fund
| Schedule of Investments – (continued) |
| October 31, 2014 |
| (000’s Omitted) |
Foreign Currency Contracts Outstanding at October 31, 2014 - (continued)
| Unrealized Appreciation/(Depreciation) | ||||||||||||||||||||||
| Currency | Buy / Sell | Delivery Date | Counterparty | Contract Amount | Market Value ╪ | Asset | Liability | |||||||||||||||
| EUR | Buy | 02/10/2015 | GSC | $ | 2,457 | $ | 2,264 | $ | – | $ | (193 | ) | ||||||||||
| EUR | Buy | 04/13/2015 | JPM | 843 | 831 | – | (12 | ) | ||||||||||||||
| EUR | Sell | 12/17/2014 | DEUT | 542 | 525 | 17 | – | |||||||||||||||
| EUR | Sell | 05/08/2015 | DEUT | 471 | 433 | 38 | – | |||||||||||||||
| EUR | Sell | 12/17/2014 | GSC | 1,865 | 1,849 | 16 | – | |||||||||||||||
| EUR | Sell | 02/10/2015 | GSC | 1,924 | 1,806 | 118 | – | |||||||||||||||
| EUR | Sell | 12/17/2014 | JPM | 1,519 | 1,498 | 21 | – | |||||||||||||||
| EUR | Sell | 04/13/2015 | JPM | 839 | 831 | 8 | – | |||||||||||||||
| GBP | Buy | 12/17/2014 | DEUT | 898 | 904 | 6 | – | |||||||||||||||
| GBP | Buy | 12/17/2014 | RBS | 1,413 | 1,391 | – | (22 | ) | ||||||||||||||
| GBP | Sell | 12/17/2014 | RBS | 1,413 | 1,391 | 22 | – | |||||||||||||||
| HUF | Buy | 12/17/2014 | DEUT | 5,041 | 5,015 | – | (26 | ) | ||||||||||||||
| HUF | Buy | 12/17/2014 | RBS | 1,466 | 1,453 | – | (13 | ) | ||||||||||||||
| HUF | Sell | 12/17/2014 | RBS | 3,092 | 3,064 | 28 | – | |||||||||||||||
| IDR | Buy | 12/17/2014 | BCLY | 1,550 | 1,578 | 28 | – | |||||||||||||||
| IDR | Buy | 12/17/2014 | BOA | 258 | 262 | 4 | – | |||||||||||||||
| IDR | Buy | 12/17/2014 | UBS | 5,062 | 5,001 | – | (61 | ) | ||||||||||||||
| IDR | Sell | 12/17/2014 | BCLY | 916 | 905 | 11 | – | |||||||||||||||
| IDR | Sell | 12/17/2014 | BOA | 477 | 477 | – | – | |||||||||||||||
| IDR | Sell | 12/17/2014 | HSBC | 4,188 | 4,235 | – | (47 | ) | ||||||||||||||
| IDR | Sell | 12/17/2014 | UBS | 90 | 89 | 1 | – | |||||||||||||||
| ILS | Buy | 12/17/2014 | JPM | 5,025 | 4,932 | – | (93 | ) | ||||||||||||||
| ILS | Buy | 04/13/2015 | JPM | 828 | 808 | – | (20 | ) | ||||||||||||||
| ILS | Sell | 12/17/2014 | JPM | 1,778 | 1,762 | 16 | – | |||||||||||||||
| ILS | Sell | 04/13/2015 | JPM | 815 | 808 | 7 | – | |||||||||||||||
| ILS | Sell | 12/17/2014 | RBS | 3,324 | 3,170 | 154 | – | |||||||||||||||
| INR | Buy | 12/17/2014 | CBK | 4,545 | 4,521 | – | (24 | ) | ||||||||||||||
| INR | Buy | 12/17/2014 | DEUT | 2,179 | 2,166 | – | (13 | ) | ||||||||||||||
| INR | Buy | 12/17/2014 | JPM | 1,226 | 1,223 | – | (3 | ) | ||||||||||||||
| INR | Sell | 12/17/2014 | BOA | 321 | 319 | 2 | – | |||||||||||||||
| INR | Sell | 12/17/2014 | CBK | 789 | 785 | 4 | – | |||||||||||||||
| INR | Sell | 12/17/2014 | CSFB | 483 | 485 | – | (2 | ) | ||||||||||||||
| INR | Sell | 12/17/2014 | JPM | 2,722 | 2,715 | 7 | – | |||||||||||||||
| KRW | Buy | 12/17/2014 | MSC | 4,174 | 4,148 | – | (26 | ) | ||||||||||||||
| KRW | Sell | 12/17/2014 | DEUT | 1,032 | 1,035 | – | (3 | ) | ||||||||||||||
| KRW | Sell | 12/17/2014 | UBS | 9,375 | 9,101 | 274 | – | |||||||||||||||
| MXN | Buy | 12/17/2014 | BCLY | 91 | 91 | – | – | |||||||||||||||
| MXN | Buy | 12/17/2014 | CBK | 221 | 221 | – | – | |||||||||||||||
| MXN | Buy | 12/17/2014 | CSFB | 3,850 | 3,863 | 13 | – | |||||||||||||||
| MXN | Buy | 12/17/2014 | DEUT | 192 | 190 | – | (2 | ) | ||||||||||||||
| MXN | Buy | 12/17/2014 | GSC | 1,772 | 1,748 | – | (24 | ) | ||||||||||||||
| MXN | Buy | 12/17/2014 | JPM | 18,381 | 18,068 | – | (313 | ) | ||||||||||||||
| MXN | Buy | 12/17/2014 | RBC | 1,002 | 1,003 | 1 | – | |||||||||||||||
| MXN | Sell | 12/17/2014 | BOA | 1,427 | 1,424 | 3 | – | |||||||||||||||
| MXN | Sell | 12/17/2014 | SSG | 1,429 | 1,424 | 5 | – | |||||||||||||||
| MXN | Sell | 12/17/2014 | TDS | 1,131 | 1,129 | 2 | – | |||||||||||||||
| MYR | Buy | 12/17/2014 | BCLY | 418 | 421 | 3 | – | |||||||||||||||
| MYR | Buy | 03/26/2015 | BCLY | 1,459 | 1,425 | – | (34 | ) | ||||||||||||||
| MYR | Buy | 12/17/2014 | BOA | 356 | 354 | – | (2 | ) | ||||||||||||||
| MYR | Buy | 03/26/2015 | BOA | 2,847 | 2,776 | – | (71 | ) | ||||||||||||||
| MYR | Buy | 12/17/2014 | CBK | 543 | 542 | – | (1 | ) | ||||||||||||||
| MYR | Buy | 03/26/2015 | HSBC | 2,190 | 2,137 | – | (53 | ) | ||||||||||||||
| MYR | Buy | 12/17/2014 | JPM | 1,495 | 1,457 | – | (38 | ) | ||||||||||||||
| MYR | Buy | 12/17/2014 | UBS | 21,620 | 21,042 | – | (578 | ) | ||||||||||||||
| MYR | Buy | 03/26/2015 | UBS | 2,984 | 2,914 | – | (70 | ) | ||||||||||||||
| MYR | Sell | 12/17/2014 | BCLY | 312 | 311 | 1 | – | |||||||||||||||
| MYR | Sell | 12/17/2014 | BCLY | 121 | 121 | – | – | |||||||||||||||
| MYR | Sell | 12/17/2014 | BNP | 121 | 121 | – | – | |||||||||||||||
| MYR | Sell | 12/17/2014 | CSFB | 121 | 121 | – | – | |||||||||||||||
The accompanying notes are an integral part of these financial statements.
| 15 |
The Hartford Emerging Markets Local Debt Fund
| Schedule of Investments – (continued) |
| October 31, 2014 |
| (000’s Omitted) |
Foreign Currency Contracts Outstanding at October 31, 2014 - (continued)
| Unrealized Appreciation/(Depreciation) | ||||||||||||||||||||||
| Currency | Buy / Sell | Delivery Date | Counterparty | Contract Amount | Market Value ╪ | Asset | Liability | |||||||||||||||
| MYR | Sell | 12/17/2014 | DEUT | $ | 7,500 | $ | 7,451 | $ | 49 | $ | – | |||||||||||
| MYR | Sell | 12/17/2014 | HSBC | 1,206 | 1,205 | 1 | – | |||||||||||||||
| MYR | Sell | 03/26/2015 | JPM | 9,421 | 9,252 | 169 | – | |||||||||||||||
| MYR | Sell | 12/17/2014 | SCB | 779 | 777 | 2 | – | |||||||||||||||
| NGN | Buy | 12/17/2014 | CBK | 1,724 | 1,707 | – | (17 | ) | ||||||||||||||
| NGN | Sell | 11/06/2014 | CBK | 1,590 | 1,593 | – | (3 | ) | ||||||||||||||
| NGN | Sell | 12/17/2014 | CBK | 1,723 | 1,707 | 16 | – | |||||||||||||||
| NGN | Sell | 12/17/2014 | DEUT | 744 | 740 | 4 | – | |||||||||||||||
| NZD | Buy | 12/17/2014 | DEUT | 2,597 | 2,584 | – | (13 | ) | ||||||||||||||
| NZD | Sell | 12/17/2014 | CBA | 2,703 | 2,584 | 119 | – | |||||||||||||||
| PEN | Sell | 12/17/2014 | BNP | 2,806 | 2,800 | 6 | – | |||||||||||||||
| PEN | Sell | 12/17/2014 | SCB | 1,425 | 1,402 | 23 | – | |||||||||||||||
| PHP | Buy | 12/17/2014 | CBK | 951 | 950 | – | (1 | ) | ||||||||||||||
| PHP | Buy | 12/17/2014 | HSBC | 1,504 | 1,469 | – | (35 | ) | ||||||||||||||
| PHP | Buy | 12/17/2014 | JPM | 4,253 | 4,159 | – | (94 | ) | ||||||||||||||
| PHP | Sell | 12/17/2014 | BCLY | 312 | 313 | – | (1 | ) | ||||||||||||||
| PHP | Sell | 12/17/2014 | CSFB | 121 | 122 | – | (1 | ) | ||||||||||||||
| PHP | Sell | 12/17/2014 | JPM | 783 | 786 | – | (3 | ) | ||||||||||||||
| PHP | Sell | 12/17/2014 | UBS | 1,213 | 1,220 | – | (7 | ) | ||||||||||||||
| PLN | Buy | 12/17/2014 | BCLY | 159 | 154 | – | (5 | ) | ||||||||||||||
| PLN | Buy | 12/17/2014 | BOA | 9,496 | 9,179 | – | (317 | ) | ||||||||||||||
| PLN | Buy | 12/17/2014 | DEUT | 5,006 | 4,908 | – | (98 | ) | ||||||||||||||
| PLN | Buy | 05/08/2015 | DEUT | 464 | 418 | – | (46 | ) | ||||||||||||||
| PLN | Sell | 12/17/2014 | BOA | 1,122 | 1,103 | 19 | – | |||||||||||||||
| PLN | Sell | 12/17/2014 | CSFB | 232 | 228 | 4 | – | |||||||||||||||
| PLN | Sell | 12/17/2014 | DEUT | 2,984 | 2,928 | 56 | – | |||||||||||||||
| PLN | Sell | 05/08/2015 | DEUT | 1,542 | 1,403 | 139 | – | |||||||||||||||
| PLN | Sell | 12/17/2014 | JPM | 1,121 | 1,107 | 14 | – | |||||||||||||||
| RON | Buy | 12/17/2014 | JPM | 512 | 512 | – | – | |||||||||||||||
| RON | Sell | 12/17/2014 | CBK | 1,125 | 1,120 | 5 | – | |||||||||||||||
| RON | Sell | 12/17/2014 | JPM | 5,490 | 5,357 | 133 | – | |||||||||||||||
| RUB | Buy | 12/17/2014 | CSFB | 789 | 728 | – | (61 | ) | ||||||||||||||
| RUB | Buy | 12/17/2014 | DEUT | 142 | 131 | – | (11 | ) | ||||||||||||||
| RUB | Buy | 12/17/2014 | JPM | 4,905 | 4,514 | – | (391 | ) | ||||||||||||||
| RUB | Buy | 12/17/2014 | UBS | 9,380 | 8,218 | – | (1,162 | ) | ||||||||||||||
| RUB | Sell | 12/17/2014 | BOA | 504 | 489 | 15 | – | |||||||||||||||
| RUB | Sell | 12/17/2014 | JPM | 2,144 | 2,066 | 78 | – | |||||||||||||||
| RUB | Sell | 02/02/2015 | JPM | 797 | 673 | 124 | – | |||||||||||||||
| RUB | Sell | 12/17/2014 | UBS | 786 | 689 | 97 | – | |||||||||||||||
| SGD | Buy | 12/17/2014 | GSC | 2,866 | 2,837 | – | (29 | ) | ||||||||||||||
| SGD | Sell | 12/17/2014 | DEUT | 5,990 | 5,946 | 44 | – | |||||||||||||||
| SGD | Sell | 12/17/2014 | JPM | 2,887 | 2,837 | 50 | – | |||||||||||||||
| THB | Buy | 12/17/2014 | JPM | 14,219 | 14,103 | – | (116 | ) | ||||||||||||||
| THB | Sell | 12/17/2014 | BCLY | 3,005 | 2,974 | 31 | – | |||||||||||||||
| THB | Sell | 12/17/2014 | BOA | 803 | 799 | 4 | – | |||||||||||||||
| THB | Sell | 12/17/2014 | JPM | 2,645 | 2,643 | 2 | – | |||||||||||||||
| TRY | Buy | 11/04/2014 | BOA | 827 | 818 | – | (9 | ) | ||||||||||||||
| TRY | Buy | 12/17/2014 | CBK | 1,509 | 1,551 | 42 | – | |||||||||||||||
| TRY | Buy | 12/17/2014 | DEUT | 325 | 334 | 9 | – | |||||||||||||||
| TRY | Buy | 12/17/2014 | GSC | 3,521 | 3,620 | 99 | – | |||||||||||||||
| TRY | Buy | 12/17/2014 | GSC | 18,730 | 18,707 | – | (23 | ) | ||||||||||||||
| TRY | Sell | 12/17/2014 | BCLY | 2,194 | 2,190 | 4 | – | |||||||||||||||
| TRY | Sell | 12/17/2014 | BOA | 819 | 809 | 10 | – | |||||||||||||||
| TRY | Sell | 12/17/2014 | BOA | 669 | 676 | – | (7 | ) | ||||||||||||||
| TRY | Sell | 12/17/2014 | DEUT | 1,258 | 1,248 | 10 | – | |||||||||||||||
| TRY | Sell | 12/17/2014 | DEUT | 3,721 | 3,761 | – | (40 | ) | ||||||||||||||
| TRY | Sell | 12/17/2014 | GSC | 3,521 | 3,517 | 4 | – | |||||||||||||||
| UYU | Buy | 04/08/2015 | CBK | 688 | 686 | – | (2 | ) | ||||||||||||||
| UYU | Buy | 12/09/2014 | HSBC | 396 | 391 | – | (5 | ) | ||||||||||||||
The accompanying notes are an integral part of these financial statements.
| 16 |
The Hartford Emerging Markets Local Debt Fund
| Schedule of Investments – (continued) |
| October 31, 2014 |
| (000’s Omitted) |
Foreign Currency Contracts Outstanding at October 31, 2014 - (continued)
| Unrealized Appreciation/(Depreciation) | ||||||||||||||||||||||
| Currency | Buy / Sell | Delivery Date | Counterparty | Contract Amount | Market Value ╪ | Asset | Liability | |||||||||||||||
| UYU | Buy | 01/22/2015 | HSBC | $ | 481 | $ | 468 | $ | – | $ | (13 | ) | ||||||||||
| ZAR | Buy | 11/05/2014 | BNP | 778 | 777 | – | (1 | ) | ||||||||||||||
| ZAR | Buy | 12/17/2014 | BNP | 230 | 235 | 5 | – | |||||||||||||||
| ZAR | Buy | 11/04/2014 | BOA | 464 | 457 | – | (7 | ) | ||||||||||||||
| ZAR | Buy | 12/17/2014 | BOA | 2,231 | 2,285 | 54 | – | |||||||||||||||
| ZAR | Buy | 12/17/2014 | BOA | 19 | 19 | – | – | |||||||||||||||
| ZAR | Buy | 11/03/2014 | CSFB | 1,555 | 1,531 | – | (24 | ) | ||||||||||||||
| ZAR | Buy | 12/17/2014 | CSFB | 38 | 37 | – | (1 | ) | ||||||||||||||
| ZAR | Buy | 12/17/2014 | DEUT | 973 | 991 | 18 | – | |||||||||||||||
| ZAR | Buy | 12/17/2014 | JPM | 830 | 832 | 2 | – | |||||||||||||||
| ZAR | Buy | 12/17/2014 | RBS | 15,971 | 16,006 | 35 | – | |||||||||||||||
| ZAR | Sell | 12/17/2014 | BCLY | 1,927 | 1,929 | – | (2 | ) | ||||||||||||||
| ZAR | Sell | 12/17/2014 | BNP | 772 | 771 | 1 | – | |||||||||||||||
| ZAR | Sell | 11/03/2014 | BOA | 19 | 19 | – | – | |||||||||||||||
| ZAR | Sell | 12/17/2014 | BOA | 460 | 453 | 7 | – | |||||||||||||||
| ZAR | Sell | 12/17/2014 | CSFB | 1,543 | 1,518 | 25 | – | |||||||||||||||
| ZAR | Sell | 12/17/2014 | RBS | 2,230 | 2,235 | – | (5 | ) | ||||||||||||||
| Total | $ | 3,641 | $ | (6,575 | ) | |||||||||||||||||
| ╪ | See Significant Accounting Policies of accompanying Notes to Financial Statements regarding valuation of securities. |
| GLOSSARY: (abbreviations used in preceding Schedule of Investments) | ||
| Counterparty Abbreviations: | ||
| BCLY | Barclays | |
| BNP | BNP Paribas Securities Services | |
| BOA | Banc of America Securities LLC | |
| CBA | Commonwealth Bank of Australia | |
| CBK | Citibank NA | |
| CSFB | Credit Suisse First Boston Corp. | |
| DEUT | Deutsche Bank Securities, Inc. | |
| GSC | Goldman Sachs & Co. | |
| HSBC | HSBC Bank USA | |
| JPM | JP Morgan Chase & Co. | |
| MSC | Morgan Stanley | |
| RBC | RBC Dominion Securities, Inc. | |
| RBS | RBS Greenwich Capital | |
| SCB | Standard Chartered Bank | |
| SSG | State Street Global Markets LLC | |
| TDS | TD Securities, Inc. | |
| UBS | UBS AG | |
| Currency Abbreviations: | ||
| AUD | Australian Dollar | |
| BRL | Brazilian Real | |
| CAD | Canadian Dollar | |
| CLP | Chilean Peso | |
| CNY | Chinese Yuan Renminbi | |
| COP | Colombian Peso | |
| CZK | Czech Koruna | |
| EUR | EURO | |
| GBP | British Pound | |
| HUF | Hungarian Forint | |
| IDR | Indonesian New Rupiah | |
| ILS | Israeli New Shekel | |
| INR | Indian Rupee | |
| KRW | South Korean Won | |
| MXN | Mexican New Peso | |
| MYR | Malaysian Ringgit | |
| NGN | Nigerian Naira | |
| NZD | New Zealand Dollar | |
| PEN | Peruvian New Sol | |
| PHP | Philippine Peso | |
| PLN | Polish New Zloty | |
| RON | New Romanian Leu | |
| RUB | Russian New Ruble | |
| SGD | Singapore Dollar | |
| THB | Thai Baht | |
| TRY | Turkish New Lira | |
| USD | U.S. Dollar | |
| UYU | Uruguayan Peso | |
| ZAR | South African Rand | |
| Other Abbreviations: | ||
| BZDIOVRA | Brazil Cetip Interbank Deposit Rate | |
| FHLMC | Federal Home Loan Mortgage Corp. | |
| FNMA | Federal National Mortgage Association | |
| FX | Foreign Exchange | |
| GNMA | Government National Mortgage Association | |
| JIBAR | Johannesburg Interbank Agreed Rate | |
| MXIBTIIE | Mexico Interbank Equilibrium Interest Rate | |
| OTC | Over-the-Counter | |
| PRIBOR | Prague Interbank Offered Rate | |
| THBFIX | Thai Baht Interest Rate Fixing | |
| WIBOR | Warsaw Interbank Offered Rate | |
The accompanying notes are an integral part of these financial statements.
| 17 |
The Hartford Emerging Markets Local Debt Fund
| Schedule of Investments – (continued) |
| October 31, 2014 |
| (000’s Omitted) |
| Investment Valuation Hierarchy Level Summary |
| October 31, 2014 |
| Total | Level 1 ♦ | Level 2 ♦ | Level 3 | |||||||||||||
| Assets: | ||||||||||||||||
| Corporate Bonds | $ | 99,599 | $ | – | $ | 98,129 | $ | 1,470 | ||||||||
| Foreign Government Obligations | 201,694 | – | 201,116 | 578 | ||||||||||||
| Short-Term Investments | 11,369 | – | 11,369 | – | ||||||||||||
| Purchased Options | 857 | – | 857 | – | ||||||||||||
| Total | $ | 313,519 | $ | – | $ | 311,471 | $ | 2,048 | ||||||||
| Foreign Currency Contracts * | $ | 3,641 | $ | – | $ | 3,641 | $ | – | ||||||||
| Futures * | 14 | 14 | – | – | ||||||||||||
| Swaps - Interest Rate * | 503 | – | 503 | – | ||||||||||||
| Total | $ | 4,158 | $ | 14 | $ | 4,144 | $ | – | ||||||||
| Liabilities: | ||||||||||||||||
| Written Options | $ | 513 | $ | – | $ | 513 | $ | – | ||||||||
| Total | $ | 513 | $ | – | $ | 513 | $ | – | ||||||||
| Foreign Currency Contracts * | $ | 6,575 | $ | – | $ | 6,575 | $ | – | ||||||||
| Futures * | 42 | 42 | – | – | ||||||||||||
| Swaps - Credit Default * | 24 | – | 24 | – | ||||||||||||
| Swaps - Interest Rate * | 2,066 | – | 2,066 | – | ||||||||||||
| Total | $ | 8,707 | $ | 42 | $ | 8,665 | $ | – | ||||||||
| ♦ | For the year ended October 31, 2014, there were no transfers between Level 1 and Level 2. |
| * | Derivative instruments (excluding purchased and written options, if applicable) are valued at the unrealized appreciation/depreciation on the investments. |
Following is a reconciliation of Level 3 assets for which significant unobservable inputs were used to determine fair value:
| Balance
as of October 31, 2013 | Realized Gain (Loss) | Change in Unrealized Appreciation (Depreciation) | Net Amortization | Purchases | Sales | Transfers Into Level 3 | Transfers Out of Level 3 | Balance
as of October 31, 2014 | ||||||||||||||||||||||||||||
| Assets: | ||||||||||||||||||||||||||||||||||||
| Corporate Bonds and Foreign Government Obligations | $ | 2,216 | $ | 116 | $ | (131 | )* | $ | 1 | $ | 2,049 | $ | (2,203 | ) | $ | — | $ | — | $ | 2,048 | ||||||||||||||||
| Total | $ | 2,216 | $ | 116 | $ | (131 | ) | $ | 1 | $ | 2,049 | $ | (2,203 | ) | $ | — | $ | — | $ | 2,048 | ||||||||||||||||
| * | Change in unrealized appreciation (depreciation) in the current period relating to assets still held at October 31, 2014 was $(1). |
| Note: | For purposes of reporting transfers between different hierarchy levels, both transfers in and out of each level, as applicable, are shown as if they occurred at the beginning of the period. |
The accompanying notes are an integral part of these financial statements.
| 18 |
The Hartford Emerging Markets Local Debt Fund
| Statement of Assets and Liabilities |
| October 31, 2014 |
| (000’s Omitted) |
| Assets: | ||||
| Investments in securities, at market value (cost $325,834) | $ | 313,519 | ||
| Cash | 1,913 | * | ||
| Foreign currency on deposit with custodian (cost $789) | 789 | |||
| Unrealized appreciation on foreign currency contracts | 3,641 | |||
| Unrealized appreciation on OTC swap contracts | 503 | |||
| Receivables: | ||||
| Investment securities sold | 9,554 | |||
| Fund shares sold | 3,645 | |||
| Interest | 4,309 | |||
| Variation margin on financial derivative instruments | 6 | |||
| OTC swap premiums paid | 19 | |||
| Other assets | 79 | |||
| Total assets | 337,977 | |||
| Liabilities: | ||||
| Unrealized depreciation on foreign currency contracts | 6,575 | |||
| Unrealized depreciation on OTC swap contracts | 2,090 | |||
| Payables: | ||||
| Investment securities purchased | 6,088 | |||
| Fund shares redeemed | 2,399 | |||
| Investment management fees | 61 | |||
| Administrative fees | — | |||
| Distribution fees | 1 | |||
| Variation margin on financial derivative instruments | 3 | |||
| Accrued expenses | 45 | |||
| OTC swap premiums received | 14 | |||
| Written option contracts (proceeds $436) | 513 | |||
| Other liabilities | 67 | |||
| Total liabilities | 17,856 | |||
| Net assets | $ | 320,121 | ||
| Summary of Net Assets: | ||||
| Capital stock and paid-in-capital | $ | 336,226 | ||
| Undistributed net investment income | 543 | |||
| Accumulated net realized gain | 389 | |||
| Unrealized depreciation of investments and the translation of assets and liabilities denominated in foreign currency | (17,037 | ) | ||
| Net assets | $ | 320,121 |
* Cash of $1,359 was pledged as collateral for open financial derivative instruments at October 31, 2014.
The accompanying notes are an integral part of these financial statements.
| 19 |
The Hartford Emerging Markets Local Debt Fund
| Statement of Assets and Liabilities – (continued) |
| October 31, 2014 |
| (000’s Omitted) |
| Shares authorized | 500,000 | |||
| Par value | $ | 0.001 | ||
| Class A: Net asset value per share/Maximum offering price per share | $9.00/$9.42 | |||
| Shares outstanding | 1,088 | |||
| Net assets | $ | 9,792 | ||
| Class C: Net asset value per share | $ | 8.99 | ||
| Shares outstanding | 357 | |||
| Net assets | $ | 3,208 | ||
| Class I: Net asset value per share | $ | 8.98 | ||
| Shares outstanding | 4,862 | |||
| Net assets | $ | 43,683 | ||
| Class R3: Net asset value per share | $ | 8.99 | ||
| Shares outstanding | 227 | |||
| Net assets | $ | 2,041 | ||
| Class R4: Net asset value per share | $ | 8.99 | ||
| Shares outstanding | 234 | |||
| Net assets | $ | 2,101 | ||
| Class R5: Net asset value per share | $ | 8.99 | ||
| Shares outstanding | 231 | |||
| Net assets | $ | 2,078 | ||
| Class Y: Net asset value per share | $ | 8.96 | ||
| Shares outstanding | 28,713 | |||
| Net assets | $ | 257,218 |
The accompanying notes are an integral part of these financial statements.
| 20 |
The Hartford Emerging Markets Local Debt Fund
Statement of Operations |
For the Year Ended October 31, 2014 |
| (000’s Omitted) |
| Investment Income: | ||||
| Interest | $ | 17,211 | ||
| Less: Foreign tax withheld | (199 | ) | ||
| Total investment income | 17,012 | |||
| Expenses: | ||||
| Investment management fees | 2,927 | |||
| Administrative services fees | ||||
| Class R3 | 4 | |||
| Class R4 | 3 | |||
| Class R5 | 2 | |||
| Transfer agent fees | ||||
| Class A | 21 | |||
| Class C | 6 | |||
| Class I | 34 | |||
| Class R3 | — | |||
| Class R4 | — | |||
| Class Y | 3 | |||
| Distribution fees | ||||
| Class A | 43 | |||
| Class C | 41 | |||
| Class R3 | 10 | |||
| Class R4 | 5 | |||
| Custodian fees | 107 | |||
| Accounting services fees | 74 | |||
| Registration and filing fees | 104 | |||
| Board of Directors' fees | 8 | |||
| Audit fees | 13 | |||
| Other expenses | 30 | |||
| Total expenses (before waivers) | 3,435 | |||
| Expense waivers | (533 | ) | ||
| Management fee waivers | (86 | ) | ||
| Total waivers | (619 | ) | ||
| Total expenses, net | 2,816 | |||
| Net Investment Income | 14,196 | |||
| Net Realized Loss on Investments, Other Financial Instruments and Foreign Currency Transactions: | ||||
| Net realized loss on investments | (9,912 | ) | ||
| Less: Foreign taxes paid on realized capital gains | (30 | ) | ||
| Net realized gain on purchased option contracts | 48 | |||
| Net realized gain on futures contracts | 432 | |||
| Net realized gain on written option contracts | 64 | |||
| Net realized loss on swap contracts | (885 | ) | ||
| Net realized gain on foreign currency contracts | 155 | |||
| Net realized loss on other foreign currency transactions | (89 | ) | ||
| Net Realized Loss on Investments, Other Financial Instruments and Foreign Currency Transactions | (10,217 | ) | ||
| Net Changes in Unrealized Depreciation of Investments, Other Financial Instruments and Foreign Currency Transactions: | ||||
| Net unrealized depreciation of investments | (3,901 | ) | ||
| Net unrealized appreciation of purchased option contracts | 385 | |||
| Net unrealized depreciation of futures contracts | (28 | ) | ||
| Net unrealized depreciation of written option contracts | (77 | ) | ||
| Net unrealized depreciation of swap contracts | (948 | ) | ||
| Net unrealized depreciation of foreign currency contracts | (3,051 | ) | ||
| Net unrealized depreciation of translation of other assets and liabilities in foreign currencies | (101 | ) | ||
| Net Changes in Unrealized Depreciation of Investments, Other Financial Instruments and Foreign Currency Transactions | (7,721 | ) | ||
| Net Loss on Investments, Other Financial Instruments and Foreign Currency Transactions | (17,938 | ) | ||
| Net Decrease in Net Assets Resulting from Operations | $ | (3,742 | ) |
The accompanying notes are an integral part of these financial statements.
| 21 |
The Hartford Emerging Markets Local Debt Fund
| Statement of Changes in Net Assets |
| (000’s Omitted) |
| For the Year Ended October 31, 2014 | For the Year Ended October 31, 2013 | |||||||
| Operations: | ||||||||
| Net investment income | $ | 14,196 | $ | 9,266 | ||||
| Net realized loss on investments, other financial instruments and foreign currency transactions | (10,217 | ) | (1,348 | ) | ||||
| Net unrealized depreciation of investments, other financial instruments and foreign currency transactions | (7,721 | ) | (14,337 | ) | ||||
| Net Decrease in Net Assets Resulting from Operations | (3,742 | ) | (6,419 | ) | ||||
| Distributions to Shareholders: | ||||||||
| From net investment income | ||||||||
| Class A | (71 | ) | (959 | ) | ||||
| Class C | (14 | ) | (171 | ) | ||||
| Class I | (189 | ) | (1,623 | ) | ||||
| Class R3 | (9 | ) | (78 | ) | ||||
| Class R4 | (9 | ) | (85 | ) | ||||
| Class R5 | (9 | ) | (90 | ) | ||||
| Class Y | (1,092 | ) | (5,959 | ) | ||||
| Total from net investment income | (1,393 | ) | (8,965 | ) | ||||
| From net realized gain on investments | ||||||||
| Class A | (15 | ) | (119 | ) | ||||
| Class C | (4 | ) | (22 | ) | ||||
| Class I | (26 | ) | (136 | ) | ||||
| Class R3 | (1 | ) | (12 | ) | ||||
| Class R4 | (1 | ) | (12 | ) | ||||
| Class R5 | (1 | ) | (12 | ) | ||||
| Class Y | (114 | ) | (455 | ) | ||||
| Total from net realized gain on investments | (162 | ) | (768 | ) | ||||
| From tax return of capital | ||||||||
| Class A | (633 | ) | — | |||||
| Class C | (128 | ) | — | |||||
| Class I | (1,701 | ) | — | |||||
| Class R3 | (75 | ) | — | |||||
| Class R4 | (84 | ) | — | |||||
| Class R5 | (88 | ) | — | |||||
| Class Y | (9,833 | ) | — | |||||
| Total from tax return of capital | (12,542 | ) | — | |||||
| Total distributions | (14,097 | ) | (9,733 | ) | ||||
| Capital Share Transactions: | ||||||||
| Class A | (14,078 | ) | 6,043 | |||||
| Class C | (2,709 | ) | 2,776 | |||||
| Class I | 13,281 | 13,795 | ||||||
| Class R3 | 59 | 96 | ||||||
| Class R4 | 56 | 180 | ||||||
| Class R5 | 98 | 102 | ||||||
| Class Y | 91,673 | 113,279 | ||||||
| Net increase from capital share transactions | 88,380 | 136,271 | ||||||
| Net Increase in Net Assets | 70,541 | 120,119 | ||||||
| Net Assets: | ||||||||
| Beginning of period | 249,580 | 129,461 | ||||||
| End of period | $ | 320,121 | $ | 249,580 | ||||
| Undistributed (distributions in excess of) net investment income | $ | 543 | $ | (1,574 | ) | |||
The accompanying notes are an integral part of these financial statements.
| 22 |
The Hartford Emerging Markets Local Debt Fund
| Notes to Financial Statements |
| October 31, 2014 |
| (000’s Omitted) |
Organization:
The Hartford Mutual Funds, Inc. (“Company”) is an open-end management investment company comprised of forty-two portfolios. Financial statements for The Hartford Emerging Markets Local Debt Fund (the "Fund"), a series of the Company, are included in this report.
The Company is organized under the laws of the State of Maryland and is registered with the Securities and Exchange Commission (“SEC”) under the Investment Company Act of 1940, as amended (“1940 Act”). The Fund is a non-diversified open-end management investment company. The Fund is an investment company and applies specialized accounting and reporting under Accounting Standards Codification Topic 946, Financial Services - Investment Companies.
Class A shares are sold with a front-end sales charge of up to 4.50%. Class C shares are sold with a contingent deferred sales charge of up to 1.00% on shares redeemed within twelve months of purchase. Class I shares are sold without sales charges to certain eligible investors primarily through advisory fee-based wrap programs. Class R3, R4 and R5 shares, which are offered to employer-sponsored retirement plans, and Class Y shares, which are sold to certain eligible institutional investors, are sold without a sales charge. All classes of shares have identical voting, redemption, dividend, liquidation and other rights and the same terms and conditions, with the exceptions that each class may have different expenses, which may affect performance.
Significant Accounting Policies:
The following is a summary of significant accounting policies of the Fund in the preparation of its financial statements, which are in accordance with United States generally accepted accounting principles (“U.S. GAAP”). The preparation of financial statements in accordance with U.S. GAAP may require management to make estimates and assumptions that affect the reported amounts of assets and liabilities and disclosure of contingent assets and liabilities at the date of the financial statements and the reported amounts of increases and decreases in net assets from operations during the reporting period. Actual results could differ from those estimates.
Determination of Net Asset Value – The per share net asset value ("NAV") of each class of the Fund's shares is determined as of the close of regular trading (normally 4:00 p.m. Eastern Time) (the “NYSE Close”) on each day that the New York Stock Exchange (the “Exchange”) is open (“Valuation Date”). Information that becomes known to the Fund after the NAV has been calculated on a particular day will not generally be used to retroactively adjust the NAV determined earlier that day.
Investment Valuation and Fair Value Measurements – For purposes of calculating the NAV, portfolio investments and other assets held by the Fund's portfolio for which market quotes are readily available are valued at market value. Market value is generally determined on the basis of last reported sales prices or official close price. If no sales are reported, market value is based on quotes obtained from a quotation reporting system, established market makers, or independent pricing services. If market prices are not readily available or are deemed unreliable, the Fund will use the fair value of the investment as determined in good faith under policies and procedures established by and under the supervision of the Company's Board of Directors. Market quotes are considered not readily available where there is an absence of current or reliable market-based data (e.g., trade information or indicative market quotes), including where events occur after the close of the relevant market, but prior to the NYSE Close, that materially affect the values of the Fund's portfolio investments or assets. In addition, market quotes are considered not readily available when, due to extraordinary circumstances, the exchanges or markets on which the investments trade do not open for trading for the entire day and no other market prices are available. There can be no assurance that the Fund could obtain the fair market value assigned to an investment if the Fund were to sell the investment at approximately the time at which the Fund determines its NAV.
Fixed income investments (other than short-term obligations), non-exchange traded derivatives and centrally cleared swaps held by the Fund are normally valued on the basis of quotes obtained from independent pricing services or brokers and dealers in accordance with procedures established by the Company's Board of Directors. Prices obtained from independent pricing services use information provided by market makers or estimates of market values through accepted market modeling, trading and pricing conventions. Inputs to the models may include, but are not limited to, prepayment speeds, pricing spread, yield, trade information, dealer quotes, market color, cash flow models and the investment’s terms and conditions. Generally, the Fund may use fair valuation in regard to fixed income investments when the Fund holds defaulted or distressed investments or investments in a company in which a reorganization is pending. Short-term investments maturing in 60 days or less are generally valued at amortized cost, if their original term to maturity
| 23 |
The Hartford Emerging Markets Local Debt Fund
| Notes to Financial Statements - (continued) |
| October 31, 2014 |
| (000’s Omitted) |
was 60 days or less, or by amortizing their value on the 61st day prior to maturity, if the original term to maturity exceeded 60 days, which approximates fair value.
Exchange traded options, futures and options on futures are valued at the settlement price or last trade price determined by the relevant exchange as of the NYSE Close. If the last trade price for exchange traded options does not fall between the bid and ask prices, the value will be the mean of the bid and ask prices as of the NYSE Close. If a last trade price is not available, the value will be the mean of the bid and ask prices as of the NYSE Close. If a mean of the bid and ask prices cannot be calculated for the day, the value will be the bid price as of the NYSE Close. In the case of over-the-counter ("OTC") options and such instruments that do not trade on an exchange, values may be supplied by a pricing service using a formula or other objective method that may take into consideration the style, direction, expiration, strike price, notional value and volatility or other special adjustments.
Investments valued in currencies other than U.S. dollars are converted to U.S. dollars using exchange rates obtained from independent pricing services for calculation of the NAV. As a result, the NAV of the Fund’s shares may be affected by changes in the value of currencies in relation to the U.S. dollar. The value of investments traded in markets outside the United States or denominated in currencies other than the U.S. dollar may be affected significantly on a day that the NYSE is closed and the market value may change on days when an investor is not able to purchase, redeem or exchange shares of the Fund.
Foreign currency contracts represent agreements to exchange currencies on specific future dates at predetermined rates. Foreign currency contracts are valued using foreign currency exchange rates and forward rates as provided by an independent pricing service on the Valuation Date.
Financial instruments for which prices are not available from an independent pricing service may be valued using market quotations obtained from one or more dealers that make markets in the respective financial instrument in accordance with procedures established by the Company's Board of Directors.
U.S. GAAP defines fair value as the price that the Fund would receive to sell an asset or pay to transfer a liability in an orderly transaction between market participants. The U.S. GAAP fair value measurement standards require disclosure of a fair value hierarchy for each major category of assets and liabilities. Various inputs are used in determining the fair value of the Fund’s investments. These inputs are summarized into three broad hierarchy levels. This hierarchy is based on whether the valuation inputs are observable or unobservable. These levels are:
Level 1 – Quoted prices in active markets for identical investments. Level 1 may include exchange traded instruments, such as domestic equities, some foreign equities, options, futures, mutual funds, exchange traded funds, rights and warrants.
Level 2 – Observable inputs other than Level 1 prices, such as quoted prices for similar investments; quoted prices in markets that are not active; or other inputs that are observable or can be corroborated by observable market data. Level 2 may include debt investments that are traded less frequently than exchange traded instruments and which are valued using independent pricing services; foreign equities, which are principally traded on certain foreign markets and are adjusted daily pursuant to a fair value pricing service in order to reflect an adjustment for the factors occurring after the close of certain foreign markets but before the NYSE Close; senior floating rate interests, which are valued using an aggregate of dealer bids; short-term investments, which are valued at amortized cost; and swaps, which are valued based upon the terms of each swap contract.
Level 3 – Significant unobservable inputs that are supported by limited or no market activity. Level 3 may include financial instruments whose values are determined using indicative market quotes or require significant management judgment or estimation. These unobservable valuation inputs may include estimates for current yields, maturity/duration, prepayment speed, and indicative market quotes for comparable investments along with other assumptions relating to credit quality, collateral value, complexity of the investment structure, general market conditions and liquidity. This category may include investments where trading has been halted or there are certain restrictions on trading. While these investments are priced using unobservable inputs, the valuation of these investments reflects the best available data and management believes the prices are a reasonable representation of exit price.
The Board of Directors of the Company generally reviews and approves the “Procedures for Valuation of Portfolio Securities” at
| 24 |
The Hartford Emerging Markets Local Debt Fund
| Notes to Financial Statements - (continued) |
| October 31, 2014 |
| (000’s Omitted) |
least once a year. These procedures define how investments are to be valued, including the formation and activities of a Valuation Committee. The Valuation Committee is responsible for determining in good faith the fair value of investments when the value cannot be obtained from primary pricing services or alternative sources or if the valuation of an investment as provided by the primary pricing service or alternative source is believed not to reflect the investment’s fair value as of the Valuation Date. Voting members of the Valuation Committee include the Fund's Treasurer or designee and a Vice President of the investment manager or designee. An Assistant Vice President of the Fund with legal expertise or designee is also included on the Valuation Committee as a non-voting advisory member. In addition, the Fund’s Chief Compliance Officer shall designate a member of the compliance group to attend Valuation Committee meetings as a non-voting resource, to monitor for and provide guidance with respect to compliance with these procedures. Two members of the Valuation Committee or their designees, representing different departments, shall constitute a quorum for purposes of permitting the Valuation Committee to take action. The Valuation Committee will consider all relevant factors in determining an investment’s fair value, and may seek the advice of the Fund’s sub-adviser, knowledgeable brokers, and legal counsel in making such determination. The Valuation Committee reports to the Audit Committee of the Company's Board of Directors. The Audit Committee receives quarterly written reports which include details of all fair-valued investments, including the reason for the fair valuation, and an indication, when possible, of the accuracy of the valuation by disclosing the next available reliable public price quotation or the disposition price of such investments (the “look-back” test). The Board of Directors then must consider for ratification all of the fair value determinations made during the previous quarter.
Valuation levels are not necessarily indicative of the risk associated with investing in such investments. Individual investments within any of the above mentioned asset classes may be assigned a different hierarchical level than those presented above, as individual circumstances dictate.
For additional information, refer to the Investment Valuation Hierarchy Level Summary and the Level 3 roll-forward reconciliation, if applicable, which follow the Schedule of Investments.
Investment Transactions and Investment Income – Investment transactions are recorded as of the trade date (the date the order to buy or sell is executed) for financial reporting purposes. Investments purchased or sold on a when-issued or delayed-delivery basis may be settled a month or more after the trade date. Realized gains and losses are determined on the basis of identified cost.
Interest income, including amortization of premium, accretion of discounts and additional principal received in-kind in lieu of cash, is accrued on a daily basis.
Taxes – The Fund may be subject to taxes imposed on realized gains on securities of certain foreign countries in which the Fund invests. The amount of foreign tax expense is included on the accompanying Statement of Operations as a reduction to net realized gain on investments in these securities.
Foreign Currency Transactions – Assets and liabilities denominated in currencies other than U.S. dollars are translated into U.S. dollars at the exchange rates in effect on the valuation date. Purchases and sales of investments, income and expenses are translated into U.S. dollars at the exchange rates on the dates of such transactions.
The Fund does not isolate that portion of portfolio investment valuation resulting from fluctuations in the foreign currency exchange rates from the fluctuations arising from changes in the market prices of investments held. Exchange rate fluctuations are included with the net realized and unrealized gain or loss on investments in the accompanying financial statements.
Net realized foreign exchange gains or losses arise from sales of foreign currencies and the difference between asset and liability amounts initially stated in foreign currencies and the U.S. dollar value of the amounts actually received or paid. Net unrealized foreign exchange gains or losses arise from changes in the value of other assets and liabilities at the end of the reporting period, resulting from changes in the exchange rates.
Joint Trading Account – The Fund may invest cash balances into a joint trading account that may be invested in one or more repurchase agreements.
| 25 |
The Hartford Emerging Markets Local Debt Fund
| Notes to Financial Statements - (continued) |
| October 31, 2014 |
| (000’s Omitted) |
Fund Share Valuation and Dividend Distributions to Shareholders – Orders for the Fund’s shares are executed in accordance with the investment instructions of the shareholders. The NAV of the Fund’s shares is determined as of the close of business on each business day of the Exchange. The NAV is determined separately for each class of shares of the Fund by dividing the Fund’s net assets attributable to that class by the number of shares of the class outstanding. Each class of shares offered by the Fund has equal rights as to assets and voting privileges (except that shareholders of a class have exclusive voting rights regarding any matter relating solely to that class of shares). Income and non-class specific expenses are allocated daily to each class on the basis of the relative net assets of the class. Realized and unrealized gains and losses are allocated daily based on the relative net assets of each class of shares of the Fund.
Orders for the purchase of the Fund’s shares received prior to the close of the Exchange on any day the Exchange is open for business are priced at the NAV determined as of the close of the Exchange. Orders received after the close of the Exchange, or on a day on which the Exchange and/or the Fund is not open for business, are priced at the next determined NAV.
Dividends are declared pursuant to a policy adopted by the Company's Board of Directors based upon the investment performance of the Fund. Normally, dividends from net investment income are declared and paid monthly. Dividends from realized gains, if any, are paid at least once a year.
Net investment income, dividends and distributions from net realized gains and capital are determined in accordance with federal income tax regulations, which may differ from U.S. GAAP with respect to character and timing (see Federal Income Taxes: Distributions and Components of Distributable Earnings and Reclassification of Capital Accounts).
Securities and Other Investments:
Repurchase Agreements – A repurchase agreement is an agreement by which a counterparty agrees to sell an investment and agrees to repurchase the investment sold from the buyer at a mutually agreed upon time and price. During the period of the repurchase agreement, the counterparty will deposit cash and or securities in a third party custodial account to serve as collateral. At the time the Fund enters into a repurchase agreement, the value of the underlying collateral, including accrued interest, will be equal to or exceed the value of the repurchase agreement. Repurchase agreements expose the Fund to counterparty risk - that is, the risk that the counterparty will not fulfill its obligations. To minimize counterparty risk, the investments that serve to collateralize the repurchase agreement are held by the Fund’s custodian in book entry or physical form in the custodial account of the Fund or in a third party custodial account. Repurchase agreements are valued at cost plus accrued interest, which approximates fair value. Repurchase agreements have master netting arrangements which allow the Fund to offset amounts owed to a counterparty with amounts owed by the counterparty, including any collateral. Upon an event of default under a master repurchase agreement, the non-defaulting party may close out all transactions traded under such agreement and net amounts owed under each transaction to one net amount payable by one party to the other. Absent an event of default, the master repurchase agreement does not result in an offset of reported amounts of assets and liabilities in the Statement of Assets and Liabilities across transactions between the Fund and the applicable counterparty. The Fund, as shown on the Schedule of Investments, had outstanding repurchase agreements and related collateral as of October 31, 2014.
Illiquid and Restricted Investments – The Fund is permitted to invest up to 15% of its net assets in illiquid investments. Illiquid investments are those that may not be sold or disposed of in the ordinary course of business within seven days, at approximately the price used to determine the Fund’s NAV. The Fund may not be able to sell illiquid investments when its sub-adviser considers it desirable to do so or may have to sell such investments at a price that is lower than the price that could be obtained if the investments were more liquid. A sale of illiquid investments may require more time and may result in higher dealer discounts and other selling expenses than does the sale of those that are liquid. Illiquid investments also may be more difficult to value due to the unavailability of reliable market quotations for such investments, and an investment in them may have an adverse impact on the Fund’s NAV. The Fund may also purchase certain restricted investments that can only be resold to certain qualified investors and may be determined to be liquid pursuant to policies and guidelines established by the Company's Board of Directors. The Fund, as shown on the Schedule of Investments, had illiquid or restricted investments as of October 31, 2014.
Investments Purchased on a When-Issued or Delayed-Delivery Basis – Delivery and payment for investments that have been purchased by the Fund on a forward commitment, or when-issued or delayed-delivery basis, take place beyond the customary
| 26 |
The Hartford Emerging Markets Local Debt Fund
| Notes to Financial Statements - (continued) |
| October 31, 2014 |
| (000’s Omitted) |
settlement period. The Fund may dispose of or renegotiate a delayed-delivery transaction after it is entered into, and may sell delayed-delivery investments before they are delivered, which may result in a realized gain or loss. During this period, such investments are subject to market fluctuations, and the Fund identifies investments segregated in its records with a value at least equal to the amount of the commitment. The Fund, as shown on the Schedule of Investments, had when-issued or delayed-delivery investments as of October 31, 2014.
Inflation Indexed Bonds – The Fund may invest in inflation indexed bonds. Inflation indexed bonds are fixed income investments whose principal value is periodically adjusted to the rate of inflation. The interest rate on these bonds is generally fixed at issuance at a rate lower than typical bonds. Over the life of an inflation indexed bond, however, interest will be paid based on a principal value, which is adjusted for inflation. Any increase or decrease in the principal amount of an inflation indexed bond will be included as interest income on the Statement of Operations, even though investors do not receive the principal amount until maturity. The Fund, as shown on the Schedule of Investments, had inflation indexed bonds as of October 31, 2014.
Financial Derivative Instruments:
The following disclosures contain information on how and why the Fund uses derivative instruments, the credit-risk-related contingent features in certain derivative instruments and how derivative instruments affect the Fund’s financial position and results of operations. The location and fair value amounts of these instruments on the Statement of Assets and Liabilities and the realized gains and losses and changes in unrealized gains and losses on the Statement of Operations, each categorized by type of derivative contract, are included in the following Additional Derivative Instrument Information footnote. The derivative instruments outstanding as of year-end are disclosed in the notes to the Schedule of Investments, if applicable. The amounts of realized gains and losses and changes in unrealized gains and losses on derivative instruments during the year are disclosed in the Statement of Operations.
Foreign Currency Contracts – The Fund may enter into foreign currency contracts that obligate the Fund to purchase or sell currencies at specified future dates. Foreign currency contracts are used to hedge the currency exposure associated with some or all of the Fund’s investments and/or as part of an investment strategy. Foreign currency contracts are marked to market daily and the change in value is recorded by the Fund as an unrealized gain or loss. The Fund will record a realized gain or loss when the foreign currency contract is settled.
Foreign currency contracts involve elements of market risk in excess of the amounts reflected in the Statement of Assets and Liabilities. In addition, risks may arise upon entering into these contracts from the potential inability of the counterparties to meet the terms of the contracts and from unanticipated movements in the value of the foreign currencies relative to the U.S. dollar. The Fund, as shown on the Schedule of Investments, had outstanding foreign currency contracts as of October 31, 2014.
Futures Contracts – The Fund may enter into futures contracts. A futures contract is an agreement between two parties to buy or sell an asset at a set price on a future date. The Fund uses futures contracts to manage or obtain exposure to the investment markets, commodities, or movements in interest rates and currency values. The primary risks associated with the use of futures contracts are the imperfect correlation between the change in market value of the investments held by the Fund and the prices of futures contracts and the possibility of an illiquid market. Upon entering into a futures contract, the Fund is required to deposit with a futures commission merchant (“FCM”) an amount of cash or U.S. Government or Agency Obligations in accordance with the initial margin requirements of the broker or exchange. Futures contracts are marked to market daily at the most recent settlement price reported by an exchange on which, over time, they are traded most extensively, and an appropriate payable or receivable for the change in value (“variation margin”) is recorded by the Fund. Gains or losses are recognized but not considered realized until the contracts expire or are closed. Futures contracts involve, to varying degrees, risk of loss in excess of the variation margin disclosed on the Statement of Assets and Liabilities; however, the Fund seeks to reduce this risk through the use of an FCM. The Fund, as shown on the Schedule of Investments, had outstanding futures contracts as of October 31, 2014.
Options Contracts – An option contract is a contract sold by one party to another party that offers the buyer the right, but not the obligation, to buy (call) or sell (put) an investment or other financial asset at an agreed-upon price during a specific period of time or on a specific date. Options contracts are either privately negotiated in the over-the-counter market ("OTC options") or executed in a registered exchange ("exchange traded options"). The Fund may write (sell) covered call and put options on futures, swaps (“swaptions”), securities, commodities or currencies. “Covered” means that so long as the Fund is obligated as the writer of an option,
| 27 |
The Hartford Emerging Markets Local Debt Fund
| Notes to Financial Statements - (continued) |
| October 31, 2014 |
| (000’s Omitted) |
it will own either the underlying investments or currency or an option to purchase the same underlying investments or currency having an expiration date of the covered option and an exercise price equal to or less than the exercise price of the covered option, or will pledge cash or other liquid investments having a value equal to or greater than the fluctuating market value of the option investment or currency. Writing put options increases the Fund’s exposure to the underlying instrument. Writing call options decreases the Fund’s exposure to the underlying instrument. Premiums received from writing options that expire are treated as realized gains. Premiums received from writing options that are exercised or closed are added to the proceeds or offset amounts paid on the underlying futures, swap, investment or currency transaction to determine the realized gain or loss. The Fund as a writer of an option has no control over whether the underlying instrument may be sold (call) or purchased (put) and as a result bears the market risk of an unfavorable change in the price of the instrument underlying the written option. There is the risk the Fund may not be able to enter into a closing transaction because of an illiquid market. The Fund may also purchase put and call options. Purchasing call options increases the Fund’s exposure to the underlying instrument. Purchasing put options decreases the Fund’s exposure to the underlying instrument. The Fund pays a premium, which is included on the Fund’s Statement of Assets and Liabilities as an investment and is subsequently marked to market to reflect the current value of the option. Premiums paid for purchasing options that expire are treated as realized losses. Certain options may be purchased with premiums to be determined on a future date. The premiums for these options are based upon implied volatility parameters at specified terms. The risk associated with purchasing put and call options is generally limited to the premium paid. Premiums paid for purchasing options that are exercised or closed are added to the amounts paid or offset against the proceeds on the underlying investment transaction to determine the realized gain or loss. Entering into over-the-counter options also exposes the Fund to counterparty risk. Counterparty risk is the possibility that the counterparty to the agreements may default on its obligation to perform or disagree as to the meaning of the contractual terms in the agreements.
The Fund, as shown on the Schedule of Investments, had outstanding purchased and written option contracts as of October 31, 2014. Transactions involving written option contracts during the year ended October 31, 2014, are summarized below:
| Options Contract Activity During the Year Ended October 31, 2014: | ||||||||
| Call Options Written During the Year | Number of Contracts* | Premium Amounts | ||||||
| Beginning of the period | — | $ | — | |||||
| Written | 25,182,401 | 204 | ||||||
| Expired | (3,294,986 | ) | (4 | ) | ||||
| Closed | (6,617,000 | ) | (38 | ) | ||||
| Exercised | — | — | ||||||
| End of period | 15,270,415 | $ | 162 | |||||
| Put Options Written During the Year | Number of Contracts* | Premium Amounts | ||||||
| Beginning of the period | — | $ | — | |||||
| Written | 55,220,535 | 380 | ||||||
| Expired | (11,591,973 | ) | (62 | ) | ||||
| Closed | (9,711,319 | ) | (44 | ) | ||||
| Exercised | — | — | ||||||
| End of period | 33,917,243 | $ | 274 | |||||
| * The number of contracts does not omit 000's. | ||||||||
Swap Contracts – The Fund may invest in swap contracts. Swap contracts are agreements to exchange or swap investment cash flows, assets, foreign currencies or market-linked returns at specified, future intervals. Swap contracts are either privately negotiated in the over-the-counter market (“OTC swaps”) or cleared in a central clearing house (“centrally cleared swaps”). The Fund may enter into credit default, total return, cross-currency, interest rate, inflation and other forms of swap contracts to manage its exposure to credit, currency, interest rate, commodity and inflation risk. Swap contracts are also used to gain exposure to certain markets. In connection with these contracts, investments or cash may be identified as collateral or margin in accordance with the terms of the respective swap contracts and/or master netting arrangement to provide assets of value and recourse in the event of default or bankruptcy/insolvency.
Swaps are valued based on custom valuations furnished by an independent pricing service. Swaps for which prices are not available from an independent pricing service are valued in accordance with procedures established by the Company's Board of Directors. Changes in market value, if any, are reflected as a component of net changes in unrealized appreciation or depreciation on the Statement of Operations. Daily changes in valuation of centrally cleared swaps, if any, are recorded as a receivable or payable for the
| 28 |
The Hartford Emerging Markets Local Debt Fund
| Notes to Financial Statements - (continued) |
| October 31, 2014 |
| (000’s Omitted) |
change in value (“variation margin”) on the Statement of Assets and Liabilities. Realized gains or losses on centrally cleared swaps are recorded upon the termination of the swap. OTC swap payments received or paid at the beginning of the measurement period are reflected as such on the Statement of Assets and Liabilities and represent premiums paid or received upon entering into the swap contract to compensate for differences between the stated terms of the swap contract and prevailing market conditions (credit spreads, currency exchange rates, interest rates and other relevant factors). These upfront premiums are recorded as realized gains or losses on the Statement of Operations upon termination or maturity of the swap. A liquidation payment received or made at the termination or maturity of the swap is recorded as a realized gain or loss on the Statement of Operations. Net periodic payments received or paid by the Fund are included as part of realized gains or losses on the Statement of Operations.
Entering into these contracts involves, to varying degrees, elements of liquidation, counterparty, credit and market risk in excess of the amounts recognized on the Statement of Assets and Liabilities. Such risks involve the possibility that there will be no liquid market for these contracts, that the counterparty to the contracts may default on its obligation to perform or disagree as to the meaning of contractual terms in the contracts, and that there may be unfavorable changes in market conditions (credit spreads, currency exchange rates, interest rates and other relevant factors).
The Fund’s maximum risk of loss from counterparty risk for OTC swaps is the net value of the discounted cash flows to be received from the counterparty over the contract’s remaining life, and current market value, to the extent that amount is positive. The risk is mitigated by having a master netting arrangement between the Fund and the counterparty, which allows for the netting of payments made or received (although such amounts are presented on a gross basis within the Statement of Assets and Liabilities, as applicable) as well as the posting of collateral to the Fund to cover the Fund’s exposure to the counterparty. In a centrally cleared swap, while the Fund enters into an agreement with a clearing broker to execute contracts with a counterparty, the performance of the swap is guaranteed by the central clearinghouse, which reduces the Fund’s exposure to counterparty risk. The Fund is still exposed to the counterparty risk through the clearing broker and clearinghouse. The clearinghouse attempts to minimize this risk to its participants through the use of mandatory margin requirements, daily cash settlements and other procedures. Likewise, the clearing broker reduces its risk through margin requirements and required segregation of customer balances.
Credit Default Swap Contracts – The credit default swap market allows the Fund to manage its exposure to the market or certain sectors of the market, to reduce its risk exposure to defaults of corporate and sovereign issuers, or to create exposure to corporate or sovereign issuers to which it is not otherwise exposed. Certain credit default swaps involve the exchange of a fixed rate premium for protection against the loss in value of an underlying investment or index in the event of a credit event, such as payment default or bankruptcy.
Under a credit default swap contract, one party acts as guarantor by receiving the fixed periodic payment in exchange for the commitment to purchase the underlying investment at par if the defined credit event occurs. Upon the occurrence of a defined credit event, the difference between the value of the reference obligation and the swap’s notional amount is recorded as realized gain or loss on swap transactions in the Statement of Operations. A “buyer” of credit protection agrees to pay a counterparty to assume the credit risk of an issuer upon the occurrence of certain events. The “seller” of the protection receives periodic payments and agrees to assume the credit risk of an issuer upon the occurrence of certain events. Although specified events are contract specific, credit events are generally defined as bankruptcy, failure to pay, restructuring, obligation acceleration, obligation default or repudiation/moratorium. A “seller’s” exposure is limited to the total notional amount of the credit default swap contract. These potential amounts would be partially offset by any recovery values of the respective referenced obligations or upfront payments received upon entering into the contract.
Implied credit spreads, represented in absolute terms, utilized in determining the market value of credit default swap contracts on corporate issues, sovereign government issues or U.S. municipal issues as of year-end are disclosed in the notes to the Schedule of Investments, as applicable, and serve as an indicator of the current status of the payment/performance risk and represent the likelihood or risk of default for the credit derivative. The implied credit spread of a particular referenced entity reflects the cost of buying/selling protection and there may also be upfront payments required to be made to enter into the contract. Wider credit spreads represent a deterioration of the referenced entity’s credit soundness and a greater likelihood or risk of default or other credit event occurring as defined under the terms of the contract. For credit default swap contracts on credit indices, the quoted market prices and resulting values serve as the indicator of the current status of the payment/performance risk. Increasing market values, in absolute terms when compared to the notional amount of the swap, represent a deterioration of the referenced equity’s credit soundness and a
| 29 |
The Hartford Emerging Markets Local Debt Fund
| Notes to Financial Statements - (continued) |
| October 31, 2014 |
| (000’s Omitted) |
greater likelihood or risk of default or other credit event occurring as defined under the terms of the contract. The Fund, as shown on the Schedule of Investments, had outstanding credit default swap contracts as of October 31, 2014.
Interest Rate Swap Contracts – The Fund is subject to interest rate risk exposure in the normal course of pursuing its investment objectives. Because the Fund holds fixed rate bonds, the value of these bonds may decrease if interest rates rise. To hedge against this risk and to maintain its ability to generate income at prevailing market rates, the Fund may enter into interest rate swap contracts. In a typical interest rate swap, one party agrees to make regular payments equal to a floating interest rate, based on a specified interest rate or benchmark (e.g. London Interbank Offered Rate (“LIBOR”)), multiplied by a notional amount, in return for payments equal to a fixed rate multiplied by the same amount, for a specific period of time. The net interest received or paid on interest rate swap contracts is recorded as a realized gain or loss. Interest rate swaps are marked to market daily and the change, if any, is recorded as an unrealized gain or loss in the Statement of Operations. When the interest rate swap contract is terminated early, the Fund records a realized gain or loss equal to the difference between the current market value and the upfront premium or cost.
If an interest rate swap contract provides for payments in different currencies, the parties might agree to exchange the notional amount as well. Interest rate swaps may also depend on other prices or rates, such as the value of an index. The risks of interest rate swaps include changes in market conditions which will affect the value of the contract or the cash flows and the possible inability of the counterparty to fulfill its obligations under the contract. The Fund’s maximum risk of loss from counterparty credit risk is the discounted net value of the cash flows to be received from the counterparty over the contract’s remaining life, to the extent that amount is positive. The Fund, as shown on the Schedule of Investments, had outstanding interest rate swap contracts as of October 31, 2014.
Additional Derivative Instrument Information:
Fair Value of Derivative Instruments on the Statement of Assets and Liabilities as of October 31, 2014:
| Risk Exposure Category | ||||||||||||||||||||||||||||
| Interest
Rate Contracts | Foreign Exchange Contracts | Credit
Contracts | Equity
Contracts | Commodity Contracts | Other Contracts | Total | ||||||||||||||||||||||
| Assets: | ||||||||||||||||||||||||||||
| Investments in securities, at value (purchased option contracts), market value | $ | — | $ | 857 | $ | — | $ | — | $ | — | $ | — | $ | 857 | ||||||||||||||
| Unrealized appreciation on foreign currency contracts | — | 3,641 | — | — | — | — | 3,641 | |||||||||||||||||||||
| Unrealized appreciation on OTC swap contracts | 503 | — | — | — | — | — | 503 | |||||||||||||||||||||
| Variation margin receivable * | 6 | — | — | — | — | — | 6 | |||||||||||||||||||||
| Total | $ | 509 | $ | 4,498 | $ | — | $ | — | $ | — | $ | — | $ | 5,007 | ||||||||||||||
| Liabilities: | ||||||||||||||||||||||||||||
| Unrealized depreciation on foreign currency contracts | $ | — | $ | 6,575 | $ | — | $ | — | $ | — | $ | — | $ | 6,575 | ||||||||||||||
| Unrealized depreciation on OTC swap contracts | 2,066 | — | 24 | — | — | — | 2,090 | |||||||||||||||||||||
| Variation margin payable * | 3 | — | — | — | — | — | 3 | |||||||||||||||||||||
| Written option contracts, market value | — | 513 | — | — | — | — | 513 | |||||||||||||||||||||
| Total | $ | 2,069 | $ | 7,088 | $ | 24 | $ | — | $ | — | $ | — | $ | 9,181 | ||||||||||||||
| * | Only current day's variation margin is reported within the Statement of Assets and Liabilities. The variation margin is included in the open futures net cumulative depreciation of $(28) as reported in the Schedule of Investments. |
The volume of derivatives that is presented in the Schedule of Investments is consistent with the derivative activity during the year ended October 31, 2014.
| 30 |
The Hartford Emerging Markets Local Debt Fund
| Notes to Financial Statements - (continued) |
| October 31, 2014 |
| (000’s Omitted) |
The Effect of Derivative Instruments on the Statement of Operations for the year ended October 31, 2014:
| Risk Exposure Category | ||||||||||||||||||||||||||||
| Interest
Rate Contracts | Foreign Exchange Contracts | Credit Contracts | Equity Contracts | Commodity Contracts | Other Contracts | Total | ||||||||||||||||||||||
| Realized Gain (Loss) on Derivatives Recognized as a Result of Operations: | ||||||||||||||||||||||||||||
| Net realized gain on purchased option contracts | $ | 21 | $ | 27 | $ | — | $ | — | $ | — | $ | — | $ | 48 | ||||||||||||||
| Net realized gain on futures contracts | 432 | — | — | — | — | — | 432 | |||||||||||||||||||||
| Net realized gain on written option contracts | — | 64 | — | — | — | — | 64 | |||||||||||||||||||||
| Net realized loss on swap contracts | (706 | ) | — | (179 | ) | — | — | — | (885 | ) | ||||||||||||||||||
| Net realized gain on foreign currency contracts | — | 155 | — | — | — | — | 155 | |||||||||||||||||||||
| Total | $ | (253 | ) | $ | 246 | $ | (179 | ) | $ | — | $ | — | $ | — | $ | (186 | ) | |||||||||||
| Net Change in Unrealized Appreciation (Depreciation) on Derivatives Recognized as a Result of Operations: | ||||||||||||||||||||||||||||
| Net change in unrealized appreciation of purchased option contracts | $ | — | $ | 385 | $ | — | $ | — | $ | — | $ | — | $ | 385 | ||||||||||||||
| Net change in unrealized depreciation of futures contracts | (28 | ) | — | — | — | — | — | (28 | ) | |||||||||||||||||||
| Net change in unrealized depreciation of written option contracts | — | (77 | ) | — | — | — | — | (77 | ) | |||||||||||||||||||
| Net change in unrealized appreciation (depreciation) of swap contracts | (987 | ) | — | 39 | — | — | — | (948 | ) | |||||||||||||||||||
| Net change in unrealized depreciation of foreign currency contracts | — | (3,051 | ) | — | — | — | — | (3,051 | ) | |||||||||||||||||||
| Total | $ | (1,015 | ) | $ | (2,743 | ) | $ | 39 | $ | — | $ | — | $ | — | $ | (3,719 | ) | |||||||||||
Balance Sheet Offsetting Information - The following discloses both gross information and net information about instruments and transactions eligible for offset in the financial statements, and instruments and transactions that are subject to a master netting arrangement, as well as amounts related to margin, reflected as financial collateral (including cash collateral), held at clearing brokers, counterparties and the Fund’s custodian. The master netting arrangements allow the clearing brokers to net any collateral held in or on behalf of the Fund, or liabilities or payment obligations of the clearing brokers to the Fund, against any liabilities or payment obligations of the Fund to the clearing brokers. The Fund is required to deposit financial collateral (including cash collateral) at the FCM's custodian on behalf of clearing brokers and counterparties to continually meet the original and maintenance requirements established by the clearing brokers and counterparties. Such requirements are specific to the respective clearing broker or counterparty. Certain master netting arrangements may not be enforceable in the bankruptcy proceedings of a counterparty.
Offsetting of Financial Assets and Derivative Assets as of October 31, 2014:
| Gross
Amounts* of Assets Presented in Statement of Assets and Liabilities | Financial Instruments with Allowable Netting | Non-cash
Collateral Received | Cash
Collateral Received | Net
Amount (not less than $0) | ||||||||||||||||
| Description | ||||||||||||||||||||
| OTC purchased option and OTC swap contracts at market value | $ | 1,361 | $ | (1,343 | ) | $ | — | $ — † | $ | 18 | ||||||||||
| Futures contracts - variation margin receivable | 6 | (3 | ) | — | — | 3 | ||||||||||||||
| Unrealized appreciation on foreign currency contracts | 3,641 | (3,194 | ) | — | — | 447 | ||||||||||||||
| Total subject to a master netting or similar arrangement | $ | 5,008 | $ | (4,540 | ) | $ | — | $ | — | $ | 468 | |||||||||
| * | Gross amounts are presented here as there are no amounts that are netted within the Statement of Assets and Liabilities. |
| † | An additional $255 of cash collateral was pledged to counterparties related to derivative assets. |
| 31 |
The Hartford Emerging Markets Local Debt Fund
| Notes to Financial Statements - (continued) |
| October 31, 2014 |
| (000’s Omitted) |
Offsetting of Financial Liabilities and Derivative Liabilities as of October 31, 2014:
| Gross Amounts* of Liabilities Presented in Statement of Assets and Liabilities | Financial Instruments with Allowable Netting | Non-cash Collateral Pledged | Cash Collateral Pledged | Net
Amount (not less than $0) | ||||||||||||||||
| Description | ||||||||||||||||||||
| OTC written option and OTC swap contracts at market value | $ | 2,599 | $ | (1,343 | ) | $ | — | $ | (872 | )† | $ | 384 | ||||||||
| Futures contracts - variation margin payable | 3 | (3 | ) | — | (19 | ) | — | |||||||||||||
| Unrealized depreciation on foreign currency contracts | 6,534 | (3,194 | ) | — | — | 3,340 | ||||||||||||||
| Total subject to a master netting or similar arrangement | $ | 9,136 | $ | (4,540 | ) | $ | — | $ | (891 | ) | $ | 3,724 | ||||||||
| * | Gross amounts are presented here as there are no amounts that are netted within the Statement of Assets and Liabilities. |
| † | An additional $213 of cash collateral was pledged to counterparties related to derivative liabilities. |
Certain derivatives held by the Fund, as of October 31, 2014, are not subject to a master netting arrangement and are excluded from the table above.
Principal Risks:
Credit risk depends largely on the perceived financial health of bond issuers. In general, the credit rating is inversely related to the credit risk of the issuer. Higher rated bonds generally are deemed to have less credit risk, while lower or unrated bonds are deemed to have higher risk of default. The share price, yield and total return of a fund that holds securities with higher credit risk may be more volatile than those of a fund that holds bonds with lower credit risk. Similar to credit risk, the Fund may be exposed to counterparty risk, or the risk that an institution or other entity with which the Fund has unsettled or open transactions will default.
The Fund’s investments expose the Fund to various risks including, but not limited to, interest rate, prepayment, extension and foreign currency risks. Interest rate risk is the risk that fixed income securities will decline in value because of changes in interest rates. As nominal interest rates rise, the values of certain fixed income securities held by the Fund are likely to decrease. A nominal interest rate can be described as the sum of a real interest rate and an expected inflation rate. Fixed income securities with longer durations tend to be more sensitive to changes in interest rates, usually making them more volatile than securities with shorter durations. Duration is useful primarily as a measure of the sensitivity of a fixed income security’s market price to interest rate (i.e., yield) movements. Rising interest rates may cause prepayments to occur at a slower than expected rate, thereby effectively lengthening the maturity of the security and making the security more sensitive to interest rate changes.
If the Fund invests directly in foreign currencies or in securities that trade in, and receive revenues in, foreign currencies, or in derivatives that provide exposure to foreign currencies, it will be subject to the risk that those currencies will decline in value relative to the base currency (U.S. dollars) of the Fund, or, in the case of hedging positions, that the Fund’s base currency will decline in value relative to the currency being hedged. Currency rates in foreign countries may fluctuate significantly over short periods of time for a number of reasons, including changes in interest rates, intervention (or the failure to intervene) by U.S. or foreign governments, central banks or supranational entities, such as the International Monetary Fund, or by the imposition of currency controls or other political developments in the United States or abroad. As a result, the Fund’s investments in foreign currency denominated securities may reduce the returns of the Fund. The market values of equity securities, such as common stocks and preferred stocks, or equity related investments, such as futures and options, may decline due to general market conditions which are not specifically related to a particular company, such as real or perceived adverse economic conditions, changes in the general outlook for corporate earnings, changes in interest or currency rates or adverse investor sentiment generally. The market value of equity securities may also decline due to factors which affect a particular industry or industries, such as labor shortages or increased production costs and competitive conditions within an industry. Equity securities and equity related investments generally have greater market price volatility than fixed income securities.
| 32 |
The Hartford Emerging Markets Local Debt Fund
| Notes to Financial Statements - (continued) |
| October 31, 2014 |
| (000’s Omitted) |
Federal Income Taxes:
Federal Income Taxes – For federal income tax purposes, the Fund intends to continue to qualify as a Regulated Investment Company ("RIC") under Subchapter M of the Internal Revenue Code (“IRC”) by distributing substantially all of its taxable net investment income and net realized capital gains to its shareholders and otherwise complying with the requirements of the IRC. The Fund has distributed substantially all of its income and capital gains in prior years, if applicable, and intends to distribute substantially all of its income and capital gains during the calendar year ending December 31, 2014. Accordingly, no provision for federal income or excise taxes has been made in the accompanying financial statements. Distributions from short-term capital gains are treated as ordinary income distributions for federal income tax purposes.
Net Investment Income (Loss), Net Realized Gains (Losses) and Distributions – Net investment income (loss) and net realized gains (losses) may differ for financial statement and tax purposes primarily because of losses deferred due to wash sale adjustments, foreign currency gains and losses, adjustments related to Passive Foreign Investment Companies ("PFICs"), Real Estate Investment Trusts ("REITs"), RICs, certain derivatives and partnerships. The character of distributions made during the year from net investment income or net realized gains may differ from their ultimate characterization for federal income tax purposes. Also, due to the timing of dividend distributions, the fiscal year in which amounts are distributed may differ from the year that the income or realized gains (losses) were recorded by the Fund.
Distributions and Components of Distributable Earnings – The tax character of distributions paid by the Fund for the periods indicated is as follows (as adjusted for dividends payable, if applicable):
| For the Year Ended October 31, 2014 | For the Year Ended October 31, 2013 | |||||||
| Ordinary Income | $ | 1,393 | $ | 8,056 | ||||
| Long-Term Capital Gains ‡ | 162 | 1,679 | ||||||
| Tax Return of Capital | 12,542 | — | ||||||
| ‡ | The Fund designates these distributions as long-term capital gain dividends pursuant to IRC Sec. 852(b)(3)(C). |
As of October 31, 2014, the Fund’s components of distributable earnings (deficit) on a tax basis are as follows:
| Amount | ||||
| Accumulated Capital and Other Losses* | $ | (228 | ) | |
| Unrealized Depreciation† | (15,859 | ) | ||
| Total Accumulated Deficit | $ | (16,087 | ) | |
| * | The Fund has capital loss carryforwards that are identified in the Capital Loss Carryforward note that follows. |
| † | Differences between book-basis and tax-basis unrealized appreciation (depreciation) may be attributable to the losses deferred due to wash sale adjustments, foreign currency gains and losses, adjustments related to PFICs, REITs, RICs, certain derivatives and partnerships. |
Reclassification of Capital Accounts – The Fund may record reclassifications in its capital accounts. These reclassifications have no impact on the total net assets of the Fund. The reclassifications are a result of permanent differences between U.S. GAAP and tax accounting for such items as foreign currency, PFICs, expiration or utilization of capital loss carryforwards or net operating losses. Adjustments are made to reflect the impact these items have on current and future distributions to shareholders. Therefore, the source of the Fund’s distributions may be shown in the accompanying Statement of Changes in Net Assets as from undistributed net investment income, from accumulated net realized gains on investments or from capital depending on the type of book and tax differences that exist. For the year ended October 31, 2014, the Fund recorded reclassifications to increase (decrease) the accounts listed below:
| Amount | ||||
| Undistributed Net Investment Income (Loss) | $ | (10,686 | ) | |
| Accumulated Net Realized Gain (Loss) | 10,686 | |||
| 33 |
The Hartford Emerging Markets Local Debt Fund
| Notes to Financial Statements - (continued) |
| October 31, 2014 |
| (000’s Omitted) |
Capital Loss Carryforward – On December 22, 2010, the Regulated Investment Company Modernization Act of 2010 (the “Act”) was enacted, which made changes to the capital loss carryforward rules. The changes are effective for taxable years beginning after the date of enactment. Under the Act, funds are permitted to carry forward capital losses for an unlimited period. Additionally, capital loss carryforwards retain their character as either short-term or long-term capital losses rather than being considered all short-term as permitted under prior regulation.
At October 31, 2014 (tax year end), the Fund had capital loss carryforwards for U.S. federal income tax purposes as follows:
| Amount | ||||
| Short-Term Capital Loss Carryforward | $ | 45 | ||
| Long-Term Capital Loss Carryforward | 183 | |||
| Total | $ | 228 | ||
Accounting for Uncertainty in Income Taxes – The Fund has adopted financial reporting rules that require the Fund to analyze all open tax years, as defined by the statute of limitations, for all major jurisdictions. Generally, tax authorities can examine all tax returns filed for the last three years. The Fund does not have an examination in progress.
The Fund has reviewed all open tax years and major jurisdictions and concluded that these financial reporting rules had no effect on the Fund’s financial position or results of operations. There is no tax liability resulting from unrecognized tax benefits relating to uncertain income tax positions taken or expected to be taken on the tax return for the fiscal year ended October 31, 2014. The Fund is also not aware of any tax positions for which it is reasonably possible that the total amounts of unrecognized tax benefits will significantly change in the next twelve months.
Expenses:
Investment Management Agreement – Hartford Funds Management Company, LLC ("HFMC") serves as the Fund’s investment manager pursuant to an Investment Management Agreement with the Company. HFMC is an indirect wholly owned subsidiary of The Hartford Financial Services Group, Inc. ("The Hartford"). The investment manager has overall investment supervisory responsibility for the Fund. In addition, the investment manager provides administrative personnel, services, equipment, facilities and office space for proper operation of the Fund. HFMC has contracted with Wellington Management Company, LLP ("Wellington Management") under a sub-advisory agreement for the provision of day-to-day investment management services to the Fund in accordance with the Fund’s investment objective and policies. The Fund pays a fee to the investment manager, a portion of which may be used to compensate Wellington Management.
The schedule below reflects the rates of compensation paid to the investment manager for investment management services rendered as of October 31, 2014; the rates are accrued daily and paid monthly:
| Average Daily Net Assets | Annual Fee | |
| On first $250 million | 1.0000% | |
| On next $250 million | 0.9500% | |
| On next $4.5 billion | 0.9000% | |
| On next $5 billion | 0.8975% | |
| Over $10 billion | 0.8950% |
HFMC contractually agreed to waive investment management fees of 0.10% of average daily net assets until February 28, 2014. These amounts are deducted from expenses and are reported as expense waivers on the accompanying Statement of Operations, as applicable.
| 34 |
The Hartford Emerging Markets Local Debt Fund
| Notes to Financial Statements - (continued) |
| October 31, 2014 |
| (000’s Omitted) |
Accounting Services Agreement – Pursuant to the Fund Accounting Agreement between HFMC and the Company, on behalf of the Fund, HFMC provides accounting services to the Fund and receives monthly compensation based on the Fund’s average daily net assets at the rates set forth below. The Fund’s accounting services fees are accrued daily and paid monthly.
| Average Daily Net Assets | Annual Fee | |
| On first $5 billion | 0.025% | |
| On next $5 billion | 0.020% | |
| Over $10 billion | 0.015% |
Operating Expenses – Allocable expenses incurred by the Company are allocated to each Fund and allocated to classes within the Fund in proportion to the average daily net assets of the Fund and each class, except where allocation of certain expenses is more fairly made directly to the Fund or to specific classes within a Fund. As of October 31, 2014, HFMC contractually limited the total operating expenses of this Fund, exclusive of taxes, interest expense, brokerage commissions, acquired fund fees and expenses and extraordinary expenses, through February 28, 2015 as follows:
| Class A | Class C | Class I | Class R3 | Class R4 | Class R5 | Class Y | ||||||
| 1.25% | 2.00% | 1.00% | 1.55% | 1.25% | 0.95% | 0.90% |
Distribution and Service Plan for Class A, C, R3 and R4 Shares – Hartford Funds Distributors, LLC ("HFD"), an indirect wholly owned subsidiary of The Hartford, is the principal underwriter and distributor of the Fund. HFD is engaged in distribution activities, which include marketing and distribution of shares through broker/dealers, financing distribution costs and maintaining financial books and records. For the year ended October 31, 2014, HFD received front-end load sales charges of $46 and contingent deferred sales charges of $3 from the Fund.
The Fund has adopted a Distribution and Service Plan in accordance with Rule 12b-1 of the 1940 Act to compensate the distributor (HFD) for activities intended to result in the sale and distribution of Class A, C, R3 and R4 shares and for providing services for shareholders. The Rule 12b-1 plan applicable to Class A shares of the Fund provides for payment of a Rule 12b-1 fee of 0.25% of average daily net assets. Some or all of the fee may be used for shareholder servicing expenses with the remainder used for distribution expenses. Under the Class C Plan, the Fund pays the distributor 1.00% of the average daily net assets of Class C shares outstanding, 0.25% of which is intended as a fee for services provided to existing shareholders with the remainder used for distribution expenses. For Class C shares, some or the entire fee may be remitted to broker/dealers for distribution and/or shareholder account services. Class R3 shares have a distribution fee of 0.50% of average daily net assets and Class R4 shares have a distribution fee of 0.25% of average daily net assets. For Class R3 and R4 shares, some or the entire fee may be remitted to broker/dealers for distribution and/or shareholder account services. The Fund’s 12b-1 fees are accrued daily and paid monthly or at such other intervals as the Board of Directors may determine.
Other Related Party Transactions – Certain officers of the Fund are directors and/or officers of HFMC and/or The Hartford or its subsidiaries. For the year ended October 31, 2014, a portion of the Fund’s Chief Compliance Officer’s compensation was paid by all of the investment companies in the Hartford fund complex. The portion allocated to the Fund, as represented in other expenses on the Statement of Operations, rounds to zero. Hartford Administrative Services Company (“HASCO”), an indirect wholly-owned subsidiary of The Hartford, provides transfer agent services to the Fund. HASCO has contractually agreed to reimburse any portion of the transfer agency fees over 0.30% of average daily net assets per fiscal year for each class. Any transfer agency fee reimbursement is determined before considering the contractual operating expense limitation. For providing such services, HASCO is compensated on a per account basis that varies by account type, except with respect to Class Y, for which it is compensated based on average daily net assets. The amount paid to HASCO and any related contractual reimbursement amounts, if applicable, can be found in the Statement of Operations. These fees are accrued daily and paid monthly.
Administrative services fees are paid to HASCO for third-party recordkeeping services that are payable as a percentage of net assets in the amount of up to 0.20%, 0.15% and 0.10% for Classes R3, R4 and R5 shares, respectively. The total administrative services fees are shown on the Statement of Operations. These fees are accrued daily and paid monthly.
| 35 |
The Hartford Emerging Markets Local Debt Fund
| Notes to Financial Statements - (continued) |
| October 31, 2014 |
| (000’s Omitted) |
Affiliate Holdings:
As of October 31, 2014, affiliates of The Hartford had ownership of shares in the Fund as follows:
| Percentage of Class | Percentage of Fund | |||||||
| Class R3 | 100%* | 1% | ||||||
| Class R4 | 98 | 1 | ||||||
| Class R5 | 100 | 1 | ||||||
| * | Percentage rounds to 100%. |
Investment Transactions:
For the year ended October 31, 2014, the cost of purchases and proceeds from sales of investment securities (excluding short-term investments) were as follows:
| Excluding U.S. Government Obligations | U.S. Government Obligations | Total | ||||||||||
| Cost of Purchases | $ | 491,390 | $ | — | $ | 491,390 | ||||||
| Sales Proceeds | 397,577 | — | 397,577 | |||||||||
Capital Share Transactions:
The following information is for the year ended October 31, 2014, and the year ended October 31, 2013:
| For the Year Ended October 31, 2014 | For the Year Ended October 31, 2013 | |||||||||||||||||||||||||||||||
| Shares Sold | Shares
Issued for Reinvested Dividends | Shares Redeemed | Net
Increase (Decrease) of Shares | Shares Sold | Shares
Issued for Reinvested Dividends | Shares Redeemed | Net Increase (Decrease) of Shares | |||||||||||||||||||||||||
| Class A | ||||||||||||||||||||||||||||||||
| Shares | 794 | 77 | (2,387 | ) | (1,516 | ) | 1,631 | 109 | (1,175 | ) | 565 | |||||||||||||||||||||
| Amount | $ | 7,407 | $ | 714 | $ | (22,199 | ) | $ | (14,078 | ) | $ | 16,552 | $ | 1,073 | $ | (11,582 | ) | $ | 6,043 | |||||||||||||
| Class C | ||||||||||||||||||||||||||||||||
| Shares | 133 | 11 | (448 | ) | (304 | ) | 361 | 18 | (102 | ) | 277 | |||||||||||||||||||||
| Amount | $ | 1,232 | $ | 105 | $ | (4,046 | ) | $ | (2,709 | ) | $ | 3,613 | $ | 173 | $ | (1,010 | ) | $ | 2,776 | |||||||||||||
| Class I | ||||||||||||||||||||||||||||||||
| Shares | 5,523 | 65 | (4,227 | ) | 1,361 | 4,661 | 124 | (3,648 | ) | 1,137 | ||||||||||||||||||||||
| Amount | $ | 51,533 | $ | 600 | $ | (38,852 | ) | $ | 13,281 | $ | 47,321 | $ | 1,227 | $ | (34,753 | ) | $ | 13,795 | ||||||||||||||
| Class R3 | ||||||||||||||||||||||||||||||||
| Shares | — | 9 | (3 | ) | 6 | 3 | 9 | (2 | ) | 10 | ||||||||||||||||||||||
| Amount | $ | 4 | $ | 85 | $ | (30 | ) | $ | 59 | $ | 29 | $ | 90 | $ | (23 | ) | $ | 96 | ||||||||||||||
| Class R4 | ||||||||||||||||||||||||||||||||
| Shares | — | 10 | (4 | ) | 6 | 9 | 10 | — | 19 | |||||||||||||||||||||||
| Amount | $ | 3 | $ | 93 | $ | (40 | ) | $ | 56 | $ | 84 | $ | 96 | $ | — | $ | 180 | |||||||||||||||
| Class R5 | ||||||||||||||||||||||||||||||||
| Shares | — | 11 | — | 11 | — | 10 | — | 10 | ||||||||||||||||||||||||
| Amount | $ | — | $ | 98 | $ | — | $ | 98 | $ | — | $ | 102 | $ | — | $ | 102 | ||||||||||||||||
| Class Y | ||||||||||||||||||||||||||||||||
| Shares | 24,025 | 1,172 | (15,372 | ) | 9,825 | 21,620 | 619 | (10,887 | ) | 11,352 | ||||||||||||||||||||||
| Amount | $ | 221,417 | $ | 10,795 | $ | (140,539 | ) | $ | 91,673 | $ | 211,076 | $ | 6,060 | $ | (103,857 | ) | $ | 113,279 | ||||||||||||||
| Total | ||||||||||||||||||||||||||||||||
| Shares | 30,475 | 1,355 | (22,441 | ) | 9,389 | 28,285 | 899 | (15,814 | ) | 13,370 | ||||||||||||||||||||||
| Amount | $ | 281,596 | $ | 12,490 | $ | (205,706 | ) | $ | 88,380 | $ | 278,675 | $ | 8,821 | $ | (151,225 | ) | $ | 136,271 | ||||||||||||||
| 36 |
The Hartford Emerging Markets Local Debt Fund
| Notes to Financial Statements - (continued) |
| October 31, 2014 |
| (000’s Omitted) |
Line of Credit:
The Fund is one of several Hartford Funds that participate in a $500 million committed revolving line of credit facility. The facility is to be used for temporary or emergency purposes. Under the arrangement, the funds are required to own securities having a market value in excess of 300% of the total bank borrowings. The interest rate on borrowings varies depending on the nature of the loan. The facility also requires a fee to be paid based on the amount of the commitment. This commitment fee is allocated to all the funds participating in the line of credit based on the average net assets of the funds. During the year ended October 31, 2014, the Fund did not have any borrowings under this facility.
Pending Legal Proceedings:
On February 25, 2011, Jennifer L. Kasilag, Louis Mellinger, Judith M. Menendez, Jacqueline M. Robinson, and Linda A. Russell filed a derivative lawsuit against Hartford Investment Financial Services, LLC (“HIFSCO”) (now known as HFD) on behalf of six Hartford retail mutual funds in the United States District Court for the District of New Jersey, alleging that HIFSCO received excessive advisory and distribution fees in violation of its statutory fiduciary duty under Section 36(b) of the 1940 Act when serving as investment manager and principal underwriter, respectively, to the Hartford retail mutual funds. Although this action was purportedly filed on behalf of certain of the Hartford Funds, none of the Hartford Funds is itself a defendant to the suit. HIFSCO moved to dismiss and, in September 2011, the motion was granted in part and denied in part, with leave to amend the complaint. In November 2011, plaintiffs filed an amended complaint on behalf of certain Hartford retail mutual funds, The Hartford Global Health Fund (now known as The Hartford Healthcare Fund), The Hartford Conservative Allocation Fund, The Hartford Growth Opportunities Fund, The Hartford Inflation Plus Fund, The Hartford Advisers Fund (now known as The Hartford Balanced Fund), and The Hartford Capital Appreciation Fund. Plaintiffs seek to rescind the investment management agreements and distribution plans between HIFSCO and these funds and to recover the total fees charged thereunder or, in the alternative, to recover any improper compensation HIFSCO received, in addition to lost earnings. HIFSCO filed a partial motion to dismiss the amended complaint and, in December 2012, the court dismissed without prejudice the claims regarding distribution fees and denied the motion with respect to the advisory fees claims. HIFSCO disputes the allegations and intends to defend vigorously.
In March 2014, the plaintiffs filed a new complaint that added as new plaintiffs The Hartford Floating Rate Fund and The Hartford Small Company Fund and named as a defendant HFMC, which assumed the role as investment manager to the funds as of January 2013. HFMC and HIFSCO dispute the allegations and intend to defend vigorously.
No accrual for litigation relating to this matter has been recorded in the financial statements of the Fund because the Fund is not party to the suit.
Indemnifications:
Under the Company's organizational documents, the Company shall indemnify its officers and directors to the full extent required or permitted under Maryland General Corporation Law and the federal securities laws. In addition, the Company, on behalf of the Fund, may enter into contracts that contain a variety of indemnifications. The Company's maximum exposure under these arrangements is unknown. However, as of the date of these financial statements, the Company has not had prior claims or losses pursuant to these contracts and expects the risk of loss to be remote.
Subsequent Event:
Effective December 1, 2014, pursuant to a sub-transfer agency agreement between HASCO and Boston Financial Data Services, Inc. (“BFDS”), HASCO has delegated certain transfer agent, dividend disbursing agent and shareholder servicing agent functions to BFDS. The costs and expenses of such delegation are borne by HASCO, not by the Fund.
| 37 |
The Hartford Emerging Markets Local Debt Fund
| Financial Highlights |
| - Selected Per-Share Data - (A) | - Ratios and Supplemental Data - | |||||||||||||||||||||||||||||||||||||||||||||||||||
| Class | Net
Asset Value at Beginning of Period | Net
Investment Income (Loss) | Net
Realized and Unrealized Gain (Loss) on Invest- ments | Total
from Investment Operations | Dividends from Net Investment Income | Distribu- tions from Realized Capital Gains | Total Dividends and Distributions | Net
Asset Value at End of Period | Total Return(B) | Net Assets at End of Period (000's) | Ratio
of Expenses to Average Net Assets Before Adjust- ments(C) | Ratio
of Expenses to Average Net Assets After Adjust- ments(C) | Ratio
of Net Investment Income (Loss) to Average Net Assets | |||||||||||||||||||||||||||||||||||||||
| For the Year Ended October 31, 2014 | ||||||||||||||||||||||||||||||||||||||||||||||||||||
| A | $ | 9.51 | $ | 0.42 | $ | (0.52 | ) | $ | (0.10 | ) | $ | (0.40 | )(D) | $ | (0.01 | ) | $ | (0.41 | ) | $ | 9.00 | (1.10 | )% | $ | 9,792 | 1.47 | % | 1.25 | % | 4.57 | % | |||||||||||||||||||||
| C | 9.50 | 0.35 | (0.52 | ) | (0.17 | ) | (0.33 | )(E) | (0.01 | ) | (0.34 | ) | 8.99 | (1.85 | ) | 3,208 | 2.23 | 2.00 | 3.78 | |||||||||||||||||||||||||||||||||
| I | 9.50 | 0.44 | (0.52 | ) | (0.08 | ) | (0.43 | )(F) | (0.01 | ) | (0.44 | ) | 8.98 | (0.91 | ) | 43,683 | 1.19 | 0.98 | 4.78 | |||||||||||||||||||||||||||||||||
| R3 | 9.50 | 0.39 | (0.52 | ) | (0.13 | ) | (0.37 | )(G) | (0.01 | ) | (0.38 | ) | 8.99 | (1.38 | ) | 2,041 | 1.81 | 1.55 | 4.23 | |||||||||||||||||||||||||||||||||
| R4 | 9.50 | 0.42 | (0.52 | ) | (0.10 | ) | (0.40 | )(D) | (0.01 | ) | (0.41 | ) | 8.99 | (1.09 | ) | 2,101 | 1.51 | 1.25 | 4.53 | |||||||||||||||||||||||||||||||||
| R5 | 9.51 | 0.45 | (0.53 | ) | (0.08 | ) | (0.43 | )(F) | (0.01 | ) | (0.44 | ) | 8.99 | (0.89 | ) | 2,078 | 1.20 | 0.95 | 4.83 | |||||||||||||||||||||||||||||||||
| Y | 9.47 | 0.45 | (0.52 | ) | (0.07 | ) | (0.43 | )(F) | (0.01 | ) | (0.44 | ) | 8.96 | (0.74 | ) | 257,218 | 1.11 | 0.90 | 4.86 | |||||||||||||||||||||||||||||||||
| For the Year Ended October 31, 2013 | ||||||||||||||||||||||||||||||||||||||||||||||||||||
| A | $ | 10.02 | $ | 0.41 | $ | (0.47 | ) | $ | (0.06 | ) | $ | (0.39 | ) | $ | (0.06 | ) | $ | (0.45 | ) | $ | 9.51 | (0.70 | )% | $ | 24,773 | 1.49 | % | 1.25 | % | 4.16 | % | |||||||||||||||||||||
| C | 10.01 | 0.34 | (0.47 | ) | (0.13 | ) | (0.32 | ) | (0.06 | ) | (0.38 | ) | 9.50 | (1.40 | ) | 6,280 | 2.22 | 1.99 | 3.43 | |||||||||||||||||||||||||||||||||
| I | 10.01 | 0.43 | (0.47 | ) | (0.04 | ) | (0.41 | ) | (0.06 | ) | (0.47 | ) | 9.50 | (0.45 | ) | 33,259 | 1.25 | 1.00 | 4.41 | |||||||||||||||||||||||||||||||||
| R3 | 10.01 | 0.38 | (0.47 | ) | (0.09 | ) | (0.36 | ) | (0.06 | ) | (0.42 | ) | 9.50 | (1.01 | ) | 2,097 | 1.84 | 1.55 | 3.86 | |||||||||||||||||||||||||||||||||
| R4 | 10.01 | 0.41 | (0.47 | ) | (0.06 | ) | (0.39 | ) | (0.06 | ) | (0.45 | ) | 9.50 | (0.71 | ) | 2,165 | 1.54 | 1.25 | 4.16 | |||||||||||||||||||||||||||||||||
| R5 | 10.01 | 0.44 | (0.46 | ) | (0.02 | ) | (0.42 | ) | (0.06 | ) | (0.48 | ) | 9.51 | (0.31 | ) | 2,095 | 1.24 | 0.95 | 4.46 | |||||||||||||||||||||||||||||||||
| Y | 9.98 | 0.44 | (0.47 | ) | (0.03 | ) | (0.42 | ) | (0.06 | ) | (0.48 | ) | 9.47 | (0.36 | ) | 178,911 | 1.14 | 0.90 | 4.50 | |||||||||||||||||||||||||||||||||
| For the Year Ended October 31, 2012 | ||||||||||||||||||||||||||||||||||||||||||||||||||||
| A | $ | 9.24 | $ | 0.37 | $ | 0.71 | $ | 1.08 | $ | (0.30 | ) | $ | – | $ | (0.30 | ) | $ | 10.02 | 11.96 | % | $ | 20,430 | 1.65 | % | 1.24 | % | 3.96 | % | ||||||||||||||||||||||||
| C | 9.24 | 0.30 | 0.70 | 1.00 | (0.23 | ) | – | (0.23 | ) | 10.01 | 11.03 | 3,846 | 2.38 | 1.97 | 3.22 | |||||||||||||||||||||||||||||||||||||
| I | 9.23 | 0.40 | 0.71 | 1.11 | (0.33 | ) | – | (0.33 | ) | 10.01 | 12.28 | 23,655 | 1.37 | 0.96 | 4.27 | |||||||||||||||||||||||||||||||||||||
| R3 | 9.24 | 0.34 | 0.70 | 1.04 | (0.27 | ) | – | (0.27 | ) | 10.01 | 11.48 | 2,112 | 2.02 | 1.55 | 3.65 | |||||||||||||||||||||||||||||||||||||
| R4 | 9.24 | 0.37 | 0.70 | 1.07 | (0.30 | ) | – | (0.30 | ) | 10.01 | 11.81 | 2,094 | 1.72 | 1.25 | 3.95 | |||||||||||||||||||||||||||||||||||||
| R5 | 9.24 | 0.40 | 0.70 | 1.10 | (0.33 | ) | – | (0.33 | ) | 10.01 | 12.15 | 2,103 | 1.42 | 0.95 | 4.25 | |||||||||||||||||||||||||||||||||||||
| Y | 9.21 | 0.41 | 0.69 | 1.10 | (0.33 | ) | – | (0.33 | ) | 9.98 | 12.25 | 75,221 | 1.31 | 0.90 | 4.37 | |||||||||||||||||||||||||||||||||||||
| From May 31, 2011 (commencement of operations), through October 31, 2011 (H) | ||||||||||||||||||||||||||||||||||||||||||||||||||||
| A(I) | $ | 10.00 | $ | 0.14 | $ | (0.77 | ) | $ | (0.63 | ) | $ | (0.13 | )(J) | $ | – | $ | (0.13 | ) | $ | 9.24 | (6.37 | )%(K) | $ | 17,895 | 1.66 | %(L) | 1.20 | %(L) | 3.77 | %(L) | ||||||||||||||||||||||
| C(I) | 10.00 | 0.11 | (0.77 | ) | (0.66 | ) | (0.10 | )(J) | – | (0.10 | ) | 9.24 | (6.64 | )(K) | 4,178 | 2.40 | (L) | 1.94 | (L) | 3.00 | (L) | |||||||||||||||||||||||||||||||
| I(I) | 10.00 | 0.14 | (0.77 | ) | (0.63 | ) | (0.14 | )(J) | – | (0.14 | ) | 9.23 | (6.37 | )(K) | 8,900 | 1.52 | (L) | 1.00 | (L) | 3.86 | (L) | |||||||||||||||||||||||||||||||
| R3(I) | 10.00 | 0.14 | (0.79 | ) | (0.65 | ) | (0.11 | )(J) | – | (0.11 | ) | 9.24 | (6.50 | )(K) | 1,888 | 2.05 | (L) | 1.55 | (L) | 3.48 | (L) | |||||||||||||||||||||||||||||||
| R4(I) | 10.00 | 0.15 | (0.78 | ) | (0.63 | ) | (0.13 | )(J) | – | (0.13 | ) | 9.24 | (6.39 | )(K) | 1,872 | 1.75 | (L) | 1.25 | (L) | 3.78 | (L) | |||||||||||||||||||||||||||||||
| R5(I) | 10.00 | 0.16 | (0.78 | ) | (0.62 | ) | (0.14 | )(J) | – | (0.14 | ) | 9.24 | (6.28 | )(K) | 1,874 | 1.45 | (L) | 0.95 | (L) | 4.08 | (L) | |||||||||||||||||||||||||||||||
| Y(I) | 10.00 | 0.15 | (0.80 | ) | (0.65 | ) | (0.14 | )(J) | – | (0.14 | ) | 9.21 | (6.56 | )(K) | 13,397 | 1.36 | (L) | 0.90 | (L) | 4.13 | (L) | |||||||||||||||||||||||||||||||
See Portfolio Turnover information on the next page.
| 38 |
The Hartford Emerging Markets Local Debt Fund
| Financial Highlights – (continued) |
| (A) | Information presented relates to a share outstanding throughout the indicated period. Net investment income (loss) per share amounts are calculated based on average shares outstanding unless otherwise noted. |
| (B) | Assumes initial investment at net asset value at the beginning of each period, reinvestment of all distributions, the complete redemption of the investment at net asset value at the end of each period and no sales charge. Total return would be reduced if sales charges were taken into account. |
| (C) | Adjustments include waivers and reimbursements, if applicable. |
| (D) | Included in this amount are tax distributions from capital of ($0.36). |
| (E) | Included in this amount are tax distributions from capital of ($0.30). |
| (F) | Included in this amount are tax distributions from capital of ($0.39). |
| (G) | Included in this amount are tax distributions from capital of ($0.34). |
| (H) | Net investment income (loss) per share amounts have been calculated using the SEC method. |
| (I) | Commenced operations on May 31, 2011. |
| (J) | Included in this amount are tax distributions from capital of ($0.02). |
| (K) | Not annualized. |
| (L) | Annualized. |
| Portfolio Turnover Rate for All Share Classes | ||||
| For the Year Ended October 31, 2014 | 144 | % | ||
| For the Year Ended October 31, 2013 | 95 | |||
| For the Year Ended October 31, 2012 | 99 | |||
| From May 31, 2011 (commencement of operations) through October 31, 2011 | 61 | (A) | ||
(A) Not annualized.
| 39 |
Report of Independent Registered Public Accounting Firm
| The Board of Directors and Shareholders of |
| The Hartford Mutual Funds, Inc. |
We have audited the accompanying statement of assets and liabilities, including the schedule of investments, of The Hartford Emerging Markets Local Debt Fund (one of the portfolios constituting The Hartford Mutual Funds, Inc. (the Funds)) as of October 31, 2014, and the related statement of operations for the year then ended, the statements of changes in net assets for each of the two years in the period then ended, and the financial highlights for the periods indicated therein. These financial statements and financial highlights are the responsibility of the Funds’ management. Our responsibility is to express an opinion on these financial statements and financial highlights based on our audits.
We conducted our audits in accordance with the standards of the Public Company Accounting Oversight Board (United States). Those standards require that we plan and perform the audit to obtain reasonable assurance about whether the financial statements and financial highlights are free of material misstatement. We were not engaged to perform an audit of the Funds’ internal control over financial reporting. Our audits included consideration of internal control over financial reporting as a basis for designing audit procedures that are appropriate in the circumstances, but not for the purpose of expressing an opinion on the effectiveness of the Funds’ internal control over financial reporting. Accordingly, we express no such opinion. An audit also includes examining, on a test basis, evidence supporting the amounts and disclosures in the financial statements and financial highlights, assessing the accounting principles used and significant estimates made by management, and evaluating the overall financial statement presentation. Our procedures included confirmation of securities owned as of October 31, 2014, by correspondence with the custodian and brokers or by other appropriate auditing procedures where replies from brokers were not received. We believe that our audits provide a reasonable basis for our opinion.
In our opinion, the financial statements and financial highlights referred to above present fairly, in all material respects, the financial position of The Hartford Emerging Markets Local Debt Fund of The Hartford Mutual Funds, Inc. at October 31, 2014, the results of its operations for the year then ended, the changes in its net assets for each of the two years in the period then ended, and the financial highlights for the periods indicated therein, in conformity with U.S. generally accepted accounting principles.
|
Minneapolis, Minnesota
December 18, 2014
| 40 |
The Hartford Emerging Markets Local Debt Fund
| Directors and Officers (Unaudited) |
The Board of Directors of the Company (the "Directors") appoints officers who are responsible for the day-to-day operations of the Fund and who execute policies formulated by the Directors. Each Director serves until his or her death, resignation, or retirement or until the next annual meeting of shareholders is held or until his or her successor is elected and qualifies.
Directors and officers who are employed by or who have a financial interest in The Hartford Financial Services Group, Inc. ("The Hartford") are considered “interested” persons of the Fund pursuant to the 1940 Act. Each officer and two of the Company's Directors, as noted in the chart below, are “interested” persons of the Fund. Each Director serves as a director for The Hartford Mutual Funds, Inc., The Hartford Mutual Funds II, Inc., Hartford Series Fund, Inc., and Hartford HLS Series Fund II, Inc., and as a trustee for The Hartford Alternative Strategies Fund, which, as of October 31, 2014, collectively consist of 66 funds. Correspondence may be sent to Directors and officers c/o Hartford Funds, 5 Radnor Corporate Center, Suite 300, 100 Matsonford Road, Radnor, Pennsylvania 19087, except that correspondence to Mr. Annoni, Mr. Dressen and Ms. Quade may be sent to 500 Bielenberg Drive, Suite 500, Woodbury, Minnesota 55125.
The table below sets forth, for each Director and officer, his or her name, year of birth, current position with the Company and date first elected or appointed to The Hartford Mutual Funds, Inc. ("MF") and The Hartford Mutual Funds II, Inc. ("MF2"), principal occupation, and, for Directors, other directorships held. The Fund’s Statement of Additional Information contains further information on the Directors and is available free of charge by calling 1-888-843-7824 or writing to: Hartford Funds, P.O. Box 55022, Boston, MA 02205-5022.
Information on the aggregate remuneration paid to the directors of the Company can be found in the Statement of Operations herein. The Fund pays to The Hartford a portion of the Chief Compliance Officer’s compensation, but does not pay salaries or compensation to any of its other officers or Directors who are employed by The Hartford.
Non-Interested Directors
Hilary E. Ackermann (1956) Director since September 23, 2014
Ms. Ackermann served as Chief Risk Officer at Goldman Sachs Bank USA from October 2008 to November 2011 and serves as a Director of Dynegy, Inc., an independent power company, from October 2012 to present.
Lynn S. Birdsong (1946) Director since 2003, Chairman of the Investment Committee since 2014
Mr. Birdsong is a private investor. Mr. Birdsong currently serves as a Director of the Sovereign High Yield Investment Company (April 2010 to current). Mr. Birdsong currently serves as an Independent Director of Nomura Partners Funds, Inc. (formerly, The Japan Fund) (April 2003 to current). From 2003 to March 2005, Mr. Birdsong was an Independent Director of the Atlantic Whitehall Funds. From 1979 to 2002, Mr. Birdsong was a Managing Director of Zurich Scudder Investments, an investment management firm. During his employment with Scudder, Mr. Birdsong was an Interested Director of The Japan Fund. From January 1981 through December 2013, Mr. Birdsong was a partner in Birdsong Company, an advertising specialty firm.
Robert M. Gavin, Jr. (1940) Director since 2002 (MF) and 1986 (MF2), Chairman of the Board for each since 2004
Dr. Gavin is an educational consultant. Prior to September 1, 2001, he was President of Cranbrook Education Community and prior to July 1996, he was President of Macalester College, St. Paul, Minnesota.
Duane E. Hill (1945) Director since 2001 (MF) and 2002 (MF2), Chairman of the Nominating Committee since 2003
Mr. Hill is a Partner of TSG Ventures L.P., a private equity investment company. Mr. Hill is a former partner of TSG Capital Group, a private equity investment firm that served as sponsor and lead investor in leveraged buyouts of middle market companies.
Sandra S. Jaffee (1941) Director since 2005
Ms. Jaffee is the founder and Chief Executive Officer of a private company, Homeworks Concierge, LLC, which provides residential property management services in Westchester County, New York (January 2012 to present). Ms. Jaffee served as Chairman (2008 to 2009) and Chief Executive Officer of Fortent (formerly Searchspace Group), a leading provider of compliance/regulatory technology to financial institutions from August 2005 to August 2009. From August 2004 to August 2005, Ms. Jaffee served as an Entrepreneur in Residence with Warburg Pincus, a private equity firm. Prior to joining Warburg Pincus, Ms. Jaffee served as Executive Vice President at Citigroup, from September 1995 to July 2004, where she was President and Chief Executive Officer of Citibank’s Global Securities Services (1995 to 2003). Ms. Jaffee currently serves as a member of the Board of Directors of Broadridge Financial Solutions as well as a Trustee of Muhlenberg College.
| 41 |
The Hartford Emerging Markets Local Debt Fund
| Directors and Officers (Unaudited) – (continued) |
William P. Johnston (1944) Director since 2005, Chairman of the Compliance Committee since 2005
In June 2006, Mr. Johnston was appointed as Senior Advisor to The Carlyle Group, a global private equity and other alternative asset investment firm and currently serves as an Operating Executive. In July 2006, Mr. Johnston was elected to the Board of Directors of MultiPlan, Inc. and served as a Director (July 2006 to August 2010). In August 2007, Mr. Johnston was elected to the Board of Directors of LifeCare Holdings, Inc. and served as a Director (August 2007 to June 2013). In February 2008, Mr. Johnston was elected to the Board of Directors of HCR-ManorCare, Inc. In May 2006, Mr. Johnston was elected to the Supervisory Board of Fresenius Medical Care AG & Co. KGaA, after its acquisition of Renal Care Group, Inc. in March 2006. Mr. Johnston joined Renal Care Group in November 2002 as a member of the Board of Directors and served as Chairman of the Board from March 2003 through March 2006. From 2002 through 2013, Mr. Johnston served as a Board member of the Georgia O’Keefe Museum. From September 1987 to December 2002, Mr. Johnston was with Equitable Securities Corporation (and its successors, SunTrust Equitable Securities and SunTrust Robinson Humphrey) serving in various investment banking and managerial positions, including Managing Director and Head of Investment Banking, Chief Executive Officer and Vice Chairman.
Phillip O. Peterson (1944) Director since 2002 (MF) and 2000 (MF2), Chairman of the Audit Committee since 2002
Mr. Peterson is a mutual fund industry consultant. He was a partner of KPMG LLP (an accounting firm) until July 1999. Mr. Peterson joined William Blair Funds in February 2007 as a member of the Board of Trustees. From February 2012 to February 2014, Mr. Peterson served as a Trustee of Symetra Variable Mutual Funds. From January 2004 to April 2005, Mr. Peterson served as Independent President of the Strong Mutual Funds.
Lemma W. Senbet (1946) Director since 2005
Dr. Senbet is the William E. Mayer Chair Professor of Finance and Founding Director, Center for Financial Policy, at the University of Maryland, Robert H. Smith School of Business. He was chair of the Finance Department of the University of Maryland, Robert H. Smith School of Business from 1998 to 2006. Since June 2013, he has been on leave from the University to serve as Executive Director of African Economic Research Consortium which focuses on economic policy research and training. Previously, he was a chaired professor of finance at the University of Wisconsin-Madison. Also, he was a Director of the Fortis Funds from March 2000 to July 2002. Dr. Senbet served as Director of the American Finance Association and President of the Western Finance Association. In 2006, Dr. Senbet was inducted Fellow of Financial Management Association International for his career-long distinguished scholarship and professional service.
Interested Directors and Officers
James E. Davey (1964) Director since 2012, President and Chief Executive Officer since 2010
Mr. Davey serves as Executive Vice President of Hartford Life Insurance Company (“HLIC”) and The Hartford. Additionally, Mr. Davey serves as Chairman of the Board, Manager and Senior Managing Director of Hartford Funds Distributors, LLC (“HFD”). He also currently serves as Director, Chairman of the Board, President and Senior Managing Director of Hartford Administrative Services Company (“HASCO”). Mr. Davey also serves as Manager, Chairman of the Board and Senior Managing Director for Hartford Funds Management Company, LLC (“HFMC”) and Director, Chairman of the Board and Senior Managing Director for Hartford Funds Management Group, Inc. ("HFMG"). Mr. Davey has served in various positions within The Hartford and its subsidiaries in connection with the operation of the Hartford Funds. Mr. Davey joined The Hartford in 2002.
Lowndes A. Smith* (1939) Director since 1996 (MF) and 2002 (MF2)
Mr. Smith served as Vice Chairman of The Hartford from February 1997 to January 2002, as President and Chief Executive Officer of Hartford Life, Inc. from February 1997 to January 2002, and as President and Chief Operating Officer of The Hartford Life Insurance Companies from January 1989 to January 2002. Mr. Smith serves as a Director of White Mountains Insurance Group Ltd. (October 2003 to current); One Beacon Insurance (October 2006 to current); Symetra Financial (August 2007 to current) and is a Managing Director of Whittington Gray Associates (January 2007 to current).
* Mr. Smith resigned as a Director of MF, MF2, Hartford Series Fund, Inc. and Hartford HLS Series Fund II, Inc. and as a Trustee of The Hartford Alternative Strategies Fund effective September 17, 2014.
Other Officers
Mark A. Annoni (1964) Vice President, Controller and Treasurer since 2012
Mr. Annoni currently serves as the Assistant Vice President of HLIC (February 2004 to present) and Senior Vice President of HFMG (December 2013 to present). Mr. Annoni has served in various positions within The Hartford and its subsidiaries in connection with the operation of the Hartford Funds. Mr. Annoni joined The Hartford in 2001.
| 42 |
The Hartford Emerging Markets Local Debt Fund
| Directors and Officers (Unaudited) – (continued) |
Michael R. Dressen (1963) AML Compliance Officer since 2011
Mr. Dressen currently serves as Assistant Vice President of HLIC. He also serves as Chief Compliance Officer and AML Compliance Officer of HASCO and as AML Officer of HFD. Mr. Dressen has served in various positions within The Hartford and its subsidiaries in connection with the operation of the Hartford Funds.
Edward P. Macdonald (1967) Vice President, Secretary and Chief Legal Officer since 2005
Mr. Macdonald currently serves as Assistant Secretary, Executive Vice President and Deputy General Counsel of HFD, HASCO, HFMC and HFMG. He also serves as Vice President of HLIC. Mr. Macdonald has served in various positions within The Hartford and its subsidiaries in connection with the operation of the Hartford Funds. Mr. Macdonald joined The Hartford in 2005.
Joseph G. Melcher (1973) Vice President and Chief Compliance Officer since 2013
Mr. Melcher currently serves as Executive Vice President of HFD, HFMG and HASCO. Mr. Melcher also currently serves as Executive Vice President and Chief Compliance Officer of HFMC. Mr. Melcher has served in various positions within The Hartford and its subsidiaries in connection with the operation of the Hartford Funds since joining The Hartford in 2012. Prior to joining The Hartford, Mr. Melcher worked at Touchstone Investments, a member of the Western & Southern Financial Group, where he held the position of Vice President and Chief Compliance Officer from 2010 through 2012 and Assistant Vice President, Compliance from 2005 to 2010.
Vernon J. Meyer (1964) Vice President since 2006
Mr. Meyer currently serves as Senior Vice President of HLIC. He also currently serves as Managing Director and Chief Investment Officer of HFMC and Managing Director of HFMG. Mr. Meyer has served in various positions within The Hartford and its subsidiaries in connection with the operation of the Hartford Funds. Mr. Meyer joined The Hartford in 2004.
Laura S. Quade (1969) Vice President since 2012
Ms. Quade currently serves as Vice President of HASCO, HFD and HFMG. She is the Head of Operations of HASCO and formerly served as Director, Enterprise Operations of HLIC. Ms. Quade has served in various positions within The Hartford and its subsidiaries in connection with the operation of the Hartford Funds. Ms. Quade joined The Hartford in 2001.
Martin A. Swanson** (1962) Vice President since 2010
Mr. Swanson currently serves as Vice President of HLIC. Mr. Swanson also serves as Managing Director, Chief Marketing Officer and Principal of HFD and Managing Director of HFMG. Mr. Swanson has served in various positions within The Hartford and its subsidiaries in connection with the operation of the Hartford Funds.
** Mr. Swanson resigned as an officer effective November 6, 2014.
HOW TO OBTAIN A COPY OF THE FUND’S PROXY VOTING POLICIES AND VOTING RECORDS (UNAUDITED)
A description of the policies and procedures that the Fund uses to determine how to vote proxies relating to portfolio securities and information about how the Fund voted proxies relating to portfolio securities during the most recent twelve-month period ended June 30 are available (1) without charge, upon request, by calling 888-843-7824 and (2) on the SEC’s website at http://www.sec.gov.
QUARTERLY PORTFOLIO HOLDINGS INFORMATION (UNAUDITED)
The Fund files a complete schedule of portfolio holdings with the SEC for the first and third quarters of each fiscal year on Form N-Q. The Fund’s Forms N-Q are available (1) without charge, upon request, by calling 888-843-7824 and (2) on the SEC’s website at http://www.sec.gov. The Form N-Q may be reviewed and copied at the SEC’s Public Reference Room in Washington, DC. Information on the operation of the Public Reference Room may be obtained by calling 1-800-SEC-0330.
| 43 |
The Hartford Emerging Markets Local Debt Fund
| Federal Tax Information (Unaudited) |
For the fiscal year ended October 31, 2014, there is no further federal tax information required for this Fund.
| 44 |
The Hartford Emerging Markets Local Debt Fund
| Expense Example (Unaudited) |
Your Fund's Expenses
As a shareholder of the Fund, you incur two types of costs: (1) transaction costs, including sales charges (loads) on purchase payments, if any, and contingent deferred sales charges (CDSC), if any, and (2) ongoing costs, including investment management fees, distribution and/or service (12b-1) fees, if any, and other fund expenses. This example is intended to help you understand your ongoing costs (in dollars) of investing in the Fund and to compare these costs with the ongoing costs of investing in other mutual funds. The example is based on an investment of $1,000 invested at the beginning of the period and held for the entire period of April 30, 2014 through October 31, 2014.
Actual Expenses
The first set of columns of the table below provides information about actual account values and actual expenses. You may use the information in this column, together with the amount you invested, to estimate the expenses that you paid over the period. Simply divide your account value by $1,000 (for example, an $8,600 account value divided by $1,000 = 8.6), then multiply the result by the number in the line under the heading entitled “Expenses Paid During Period” to estimate the expenses you paid on your account during this period.
Hypothetical Example for Comparison Purposes
The second set of columns of the table below provides information about hypothetical account values and hypothetical expenses based on the Fund's actual expense ratio and an assumed rate of return of 5% per year before expenses, which is not the Fund's actual return. The hypothetical account values and expenses may not be used to estimate the actual ending account balance or expenses you paid for the period. You may use this information to compare the ongoing costs of investing in the Fund and other funds. To do so, compare this 5% hypothetical example with the 5% hypothetical examples that appear in the shareholder reports of the other funds.
Please note that the expenses shown in the table are meant to highlight your ongoing costs only and do not reflect any transactional costs, such as sales charges (loads) and CDSC. Therefore, the second set of columns of the table is useful in comparing ongoing costs only, and will not help you determine the relative total costs of owning different funds. In addition, if these transactional costs were included, your costs would be higher. Expenses are equal to the Fund's annualized expense ratios multiplied by average account value over the period, multiplied by 184/365 (to reflect the one-half year period).
| Actual return | Hypothetical (5% return before expenses) | |||||||||||||||||||||||||||||||||||
| Beginning Account Value April 30, 2014 | Ending
Account Value October 31, 2014 | Expenses
paid during the period April 30, 2014 through October 31, 2014 | Beginning Account Value April 30, 2014 | Ending
Account Value October 31, 2014 | Expenses
paid during the period April 30, 2014 through October 31, 2014 | Annualized expense ratio | Days in the current 1/2 year | Days in the full year | ||||||||||||||||||||||||||||
| Class A | $ | 1,000.00 | $ | 985.50 | $ | 6.26 | $ | 1,000.00 | $ | 1,018.90 | $ | 6.36 | 1.25 | % | 184 | 365 | ||||||||||||||||||||
| Class C | $ | 1,000.00 | $ | 981.90 | $ | 9.99 | $ | 1,000.00 | $ | 1,015.12 | $ | 10.16 | 2.00 | 184 | 365 | |||||||||||||||||||||
| Class I | $ | 1,000.00 | $ | 986.00 | $ | 4.81 | $ | 1,000.00 | $ | 1,020.37 | $ | 4.89 | 0.96 | 184 | 365 | |||||||||||||||||||||
| Class R3 | $ | 1,000.00 | $ | 984.10 | $ | 7.75 | $ | 1,000.00 | $ | 1,017.39 | $ | 7.88 | 1.55 | 184 | 365 | |||||||||||||||||||||
| Class R4 | $ | 1,000.00 | $ | 985.60 | $ | 6.26 | $ | 1,000.00 | $ | 1,018.91 | $ | 6.36 | 1.25 | 184 | 365 | |||||||||||||||||||||
| Class R5 | $ | 1,000.00 | $ | 986.00 | $ | 4.75 | $ | 1,000.00 | $ | 1,020.42 | $ | 4.84 | 0.95 | 184 | 365 | |||||||||||||||||||||
| Class Y | $ | 1,000.00 | $ | 987.30 | $ | 4.51 | $ | 1,000.00 | $ | 1,020.67 | $ | 4.58 | 0.90 | 184 | 365 | |||||||||||||||||||||
| 45 |
The Hartford Emerging Markets Local Debt Fund
| Approval of Investment Management and Investment Sub-Advisory Agreements (Unaudited) |
Section 15(c) of the Investment Company Act of 1940, as amended (the “1940 Act”), requires that each mutual fund’s board of directors, including a majority of those directors who are not “interested persons” of the mutual fund, as defined in the 1940 Act (the “Independent Directors”), annually review and consider the continuation of the mutual fund’s investment advisory and sub-advisory agreements. At its meeting held on August 5-6, 2014, the Board of Directors (the “Board”) of The Hartford Mutual Funds, Inc., including each of the Independent Directors, unanimously voted to approve the continuation of the investment management agreement for The Hartford Emerging Markets Local Debt Fund (the “Fund”) with Hartford Funds Management Company, LLC (“HFMC”) and the continuation of the investment sub-advisory agreement between HFMC and the Fund’s sub-adviser, Wellington Management Company, LLP (the “Sub-adviser,” and together with HFMC, the “Advisers”) (collectively, the “Agreements”).
In the months preceding the August 5-6, 2014 meeting, the Board requested, received and reviewed written responses from the Advisers to questions posed to them on behalf of the Independent Directors and supporting materials relating to those questions and responses. The Board considered information furnished to the Board at its meetings throughout the year, as well as information specifically prepared in connection with the annual approval of the Agreements at the Board’s meetings held on June 17-18, 2014 and August 5-6, 2014. Information provided to the Board at its meetings throughout the year included, among other things, reports on Fund performance, legal and compliance matters, sales and marketing activity, shareholder services, and the other services provided to the Fund by the Advisers and their affiliates. The Board also received in-person presentations by Fund officers and representatives of HFMC at the Board’s meetings on June 17-18, 2014 and August 5-6, 2014 concerning the Agreements.
The Independent Directors, advised by independent legal counsel, engaged service providers to assist them with evaluating the Agreements with respect to the Fund. Lipper Inc. (“Lipper”), an independent provider of investment company data, was retained to provide the Board with reports on how the Fund’s contractual management fees, actual management fees, other non-management fees, overall expense ratios and investment performance compared to those of mutual funds with similar investment objectives. The Independent Directors also engaged an independent financial services consultant (the “Consultant”) to assist them in evaluating the Fund’s management fees, sub-advisory fees, other non-management fees, overall expense ratios and investment performance. In addition, the Consultant reviewed the profitability calculations utilized by HFMC in connection with the continuation of the investment management agreement.
In determining whether to continue the Agreements for the Fund, the members of the Board reviewed and evaluated information and factors they believed to be relevant and appropriate in light of the information that the Board deemed necessary and appropriate through the exercise of its reasonable business judgment. While individual members of the Board may have weighed certain factors differently, the Board’s determination to continue the Agreements was based on a comprehensive consideration of all information provided to the Board throughout the year and specifically with respect to the continuation of the Agreements. A more detailed discussion of the factors the Board considered with respect to its approval of the Agreements is provided below.
Nature, Extent and Quality of Services Provided by the Advisers
The Board requested and considered information concerning the nature, extent and quality of the services provided to the Fund by the Advisers. The Board considered, among other things, the terms of the Agreements and the range of services provided by the Advisers. The Board considered the Advisers’ professional personnel who provide services to the Fund, including each Adviser’s ability and experience in attracting and retaining qualified personnel to service the Fund. The Board considered each Adviser’s reputation and overall financial strength, as well as its willingness to consider and implement organizational and operational changes designed to enhance services to the Hartford Funds. In addition, the Board considered the quality of each Adviser’s communications with the Board and responsiveness to Board inquiries and requests made from time to time with respect to the Fund and other Hartford Funds.
The Board also requested and evaluated information concerning each Adviser’s regulatory and compliance environment. In this regard, the Board requested and reviewed information on each Adviser’s compliance policies and procedures, compliance history, and a report from the Fund’s Chief Compliance Officer on each Adviser’s compliance with applicable laws and regulations, including responses to regulatory developments and compliance issues raised by regulators. The Board also noted the Advisers’ support of the Fund’s compliance control structure, particularly the resources devoted by the Advisers in support of the Fund’s obligations pursuant to Rule 38a-1 under the 1940 Act.
With respect to HFMC, the Board noted that, under the Agreements, HFMC is responsible for the management of the Fund, including oversight of fund operations and service providers, and provides administrative and investment advisory services in connection with selecting, monitoring and supervising the Sub-adviser. The Board considered HFMC’s ongoing monitoring of people, process and performance, including its quarterly reviews of each of the Hartford Funds, semi-annual meetings with the leaders of each Fund’s portfolio management team, and oversight of the Hartford Funds’ approximately 66 portfolio managers. The Board recognized that HFMC has demonstrated a record of making changes to the
| 46 |
The Hartford Emerging Markets Local Debt Fund
| Approval of Investment Management and Investment Sub-Advisory Agreements (Unaudited) – (continued) |
management and/or strategies of the Hartford Funds when warranted. The Board considered HFMC’s oversight of the Sub-adviser’s investment approach and results, process for monitoring best execution of portfolio trades by the Sub-adviser, and approach to risk management with respect to the Fund and the service providers to the Fund. The Board also considered HFMC’s oversight of compliance with the Fund’s objective and policies as well as with applicable laws and regulations, noting that regulatory and other developments had over time led to an increase in the scope of HFMC’s services in this regard.
In addition, the Board considered HFMC’s ongoing commitment to review and rationalize the Hartford Funds product line-up and the expenses that HFMC had incurred in connection with fund combinations in recent years. The Board considered that HFMC or its affiliates are responsible for providing the Fund’s officers.
With respect to the Sub-adviser, which provides certain day-to-day portfolio management services for the Fund, the Board considered the quality of the Fund’s portfolio managers, the Sub-adviser’s other investment personnel, its investment philosophy and process, investment research capabilities and resources, performance record, trade execution capabilities and experience. The Board considered the experience of the Fund’s portfolio managers, the number of accounts managed by the portfolio managers, and the Sub-adviser’s method for compensating the portfolio managers.
Based on these considerations, the Board concluded that it was satisfied with the nature, extent and quality of the services provided to the Fund by HFMC and the Sub-adviser.
Performance of the Fund and the Advisers
The Board considered the investment performance of the Fund. In this regard, the Board reviewed the performance of the Fund over different time periods presented in the materials and evaluated HFMC’s analysis of the Fund’s performance for these time periods. The Board considered information and materials provided to the Board by the Advisers concerning Fund performance, as well as information from Lipper comparing the investment performance of the Fund to an appropriate benchmark and universe of peer funds. The Board noted that the Fund’s performance was in the 1st quintile of its performance universe for the 1-year period. The Board also noted that the Fund’s performance was above its benchmark for the 1-year period.
The Board considered the detailed investment analytics reports provided by Hartford Funds’ Investment Advisory Group throughout the year. These reports include, among other things, information on the Fund’s gross and net returns, the Fund’s investment performance relative to an appropriate benchmark and peer group, various statistics concerning the Fund’s portfolio, and a narrative summary of various factors affecting Fund performance. The Board considered the Advisers’ cooperation with the Investment Committee, which assists the Board in evaluating the performance of the Fund at periodic meetings throughout the year. The Board also considered the analysis provided by the Consultant relating to the Fund’s performance track record.
In light of all the considerations noted above, the Board concluded that it had continued confidence in HFMC’s and the Sub-adviser’s overall capabilities to manage the Fund.
Costs of the Services and Profitability of the Advisers
The Board reviewed information regarding HFMC’s cost to provide investment management and related services to the Fund and HFMC’s profitability, both overall and for the Fund, on a pre-tax basis without regard to distribution expenses. The Board also requested and reviewed information about the profitability to HFMC and its affiliates from all services provided to the Fund and all aspects of their relationship with the Fund. The Board also requested and received information relating to the operations and profitability of the Sub-adviser.
The Board considered the Consultant’s review of the profitability calculations used by HFMC in connection with the continuation of the investment management agreement, noting the Consultant’s view that Hartford Funds’ process for calculating and reporting Fund profitability is reasonable. In this regard, the Board noted that the Consultant performed a full review of this process in light of the recent restructuring of the Hartford Funds business and reported that the approach to analyzing Fund profitability, including the use of common expense allocation methodologies, is reasonable, sound and well within common industry practice.
Based on these considerations, the Board concluded that the profits anticipated to be realized by the Advisers and their affiliates from their relationships with the Fund would not be excessive.
| 47 |
The Hartford Emerging Markets Local Debt Fund
| Approval of Investment Management and Investment Sub-Advisory Agreements (Unaudited) – (continued) |
Comparison of Fees and Services Provided by the Advisers
The Board considered comparative information with respect to the management fees to be paid by the Fund to HFMC and the total expense ratios of the Fund. The Board also considered comparative information with respect to the sub-advisory fees to be paid by HFMC to the Sub-adviser. In this regard, the Board requested and reviewed information from HFMC and the Sub-adviser relating to the management and sub-advisory fees, including the sub-advisory fee schedule for the Fund, and total operating expenses for the Fund. With respect to the sub-advisory fee schedule, the Board considered representations from HFMC and the Sub-adviser that the Sub-adviser’s fees were negotiated at arm’s length on a fund-by-fund basis and that certain factors were identified by HFMC as having had a potential impact on the negotiation of the Fund’s sub-advisory fee levels. The Board also reviewed information from Lipper comparing the Fund’s contractual management fees, actual management fees and overall expense ratios relative to a group of funds selected by Lipper, in consultation with the Consultant, and a broader universe of funds selected by Lipper. The Board considered that the Fund’s contractual management fee, actual management fee and total expenses (less 12b-1 and shareholder service fees) were in the 5th quintile of its expense group. The Board noted that the Fund has a temporary contractual expense cap on each share class through February 28, 2015 as well as an automatically renewable contractual expense cap on each share class. These arrangements resulted in reimbursement of certain expenses incurred in 2013.
While the Board recognized that comparisons between the Fund and peer funds may be imprecise, given the different service levels and characteristics of mutual funds and the different business models and cost structures of the Advisers, the comparative information provided by Lipper assisted the Board in evaluating the reasonableness of the Fund’s management and sub-advisory fees and total operating expenses. In addition, the Board considered the analysis and recommendations of the Consultant relating to the Fund’s management and sub-advisory fees and total operating expenses.
Based on these considerations, the Board concluded that the Fund’s fees and total operating expenses, in conjunction with the information about quality of services, profitability, economies of scale, and other matters discussed, were reasonable in light of the services provided.
Economies of Scale
The Board requested and considered information regarding the Advisers’ realization of economies of scale with respect to the Fund and whether the fee levels reflect these economies of scale for the benefit of the Fund’s shareholders. The Board reviewed the breakpoints in the management fee schedule for the Fund, which reduce fee rates as Fund assets grow over time. The Board recognized that a fund with assets beyond the highest breakpoint level will continue to benefit from economies of scale because additional assets are charged the lowest breakpoint fee resulting in lower overall effective management fee rates. The Board also considered that expense limitations and fee waivers that reduce the Fund’s expenses at all asset levels can have the same effect as breakpoints in sharing economies of scale with shareholders and provide protection from an increase in expenses if Fund assets decline. The Board recognized that a fee schedule that reaches a lower breakpoint quickly provides shareholders with the benefit of anticipated or potential economies of scale. The Board also considered that HFMC has been active in managing expenses, which has resulted in benefits being realized by shareholders as assets within the Hartford Funds family of funds have grown over time, including through lower transfer agent costs and other operating expenses.
The Board reviewed and evaluated materials from Lipper and the Consultant showing how management fee schedules of peer funds reflect economies of scale for the benefit of shareholders as a peer fund’s assets hypothetically increase over time. Based on information provided by HFMC, Lipper, and the Consultant, the Board recognized that there is no uniform methodology for establishing breakpoints or uniform pattern in asset levels that trigger breakpoints or the amounts of breakpoints triggered.
After considering all of the information available to it, the Board concluded that it was satisfied with the extent to which economies of scale would be shared for the benefit of the Fund’s shareholders based on currently available information and the effective advisory fees and expense ratios for the Fund at its current and reasonably anticipated asset levels. The Board noted, however, that it would continue to monitor future growth in Fund assets and the appropriateness of additional breakpoints.
Other Benefits
The Board considered other benefits to the Advisers and their affiliates from their relationships with the Fund.
The Board noted that HFMC receives fees for fund accounting and related services from the Fund, and the Board considered information on profits to HFMC for such services. The Board also considered that Hartford Administrative Services Company (“HASCO”), the Fund’s transfer agent and an affiliate of HFMC, receives transfer agency compensation from the Fund, and the Board reviewed information on the profitability of
| 48 |
The Hartford Emerging Markets Local Debt Fund
| Approval of Investment Management and Investment Sub-Advisory Agreements (Unaudited) – (continued) |
the Fund’s transfer agency function to HASCO. The Board considered information provided by HASCO indicating that the transfer agent fees charged by HASCO to the Fund were fair and reasonable based on publicly available information.
The Board also considered that Hartford Funds Distributors, LLC (“HFD”), an affiliate of HFMC, serves as principal underwriter of the Fund. As principal underwriter, HFD receives 12b-1 fees from the Fund and receives all or a portion of the sales charges on sales or redemptions of certain classes of shares. The Board also noted that certain affiliates of HFD distribute shares of the Fund and receive compensation in that connection.
The Board considered the benefits, if any, to the Sub-adviser from any use of the Fund’s brokerage commissions to obtain soft dollar research, and representations from HFMC and the Sub-adviser that the Sub-adviser would not make any revenue-sharing payments or any other type of distribution payments to HFMC or its affiliates.
The Board considered the benefits to shareholders of being part of the Hartford Funds family of funds, including the right to exchange investments between the same class of funds without a sales charge, the ability to reinvest Fund dividends into other funds in the family, and the ability to combine holdings in the Fund with holdings in other funds to obtain a reduced sales charge. The Board considered HFMC’s efforts to provide investors in the family with a broad range of investment styles and asset classes and its entrepreneurial risk in initiating new funds to expand these opportunities for shareholders.
* * * *
Based upon its review of these various factors, among others, the Board concluded that it is in the best interests of the Fund and its shareholders for the Board to approve the Agreements for an additional year. In reaching this decision, the Board did not assign relative weights to the factors discussed above or deem any one or group of them to be controlling in and of themselves. In connection with their deliberations, the Independent Directors met separately in executive session on several occasions, with independent legal counsel and the Consultant, to review the relevant materials and consider their responsibilities under relevant laws and regulations.
| 49 |
The Hartford Emerging Markets Local Debt Fund
| Main Risks (Unaudited) |
The main risks of investing in the Fund are described below.
Market, Selection and Strategy Risk: The Fund’s share price may fluctuate due to market risk and/or security selections that may underperform the market or relevant benchmarks. If the sub-adviser's investment strategy does not perform as expected, the Fund could underperform its peers or lose money. There is no guarantee the Fund will achieve its stated objective.
Fixed Income Risk: The Fund is subject to interest rate risk (the risk that the value of an investment decreases when interest rates rise), credit risk (the risk that the issuing company of a security is unable to pay interest and principal when due), liquidity risk (the risk that an investment may be difficult to sell at an advantageous time or price) and call risk (the risk that an investment may be redeemed early).
Foreign Investment, Emerging Markets and Sovereign Debt Risk: Investments in foreign securities may be riskier than investments in U.S. securities. Potential risks include the risks of illiquidity, increased price volatility, less government regulation, less extensive and less frequent accounting and other reporting requirements, unfavorable changes in currency exchange rates, and economic and political disruptions. These risks are generally greater for investments in emerging markets. Sovereign debt investments are subject to credit risk and the risk of default.
Junk Bond Risk: Investments in junk bonds involve greater risk of price volatility, illiquidity, and default than higher-rated debt securities.
Derivatives Risk: Investments in derivatives can be volatile. Potential risks include currency risk, leverage risk (the risk that small market movements may result in large changes in the value of an investment), liquidity risk, index risk, pricing risk, and counterparty risk (the risk that the counterparty may be unwilling or unable to honor its obligations).
Active Trading Risk: Actively trading investments may result in higher costs and higher taxable income.
Non-Diversified Risk: The Fund is non-diversified, so it may be more exposed to the risks associated with individual issuers than a diversified fund.
| 50 |
THIS PRIVACY POLICY IS NOT PART OF THIS REPORT
Privacy Policy and Practices of The Hartford Financial Services Group, Inc. and its Affiliates
(herein called “we, our and us”)
This Privacy Policy applies to our United States Operations
|
We value your trust. We are committed to the responsible: a) management; b) use; and c) protection; of Personal Information.
This notice describes how we collect, disclose, and protect Personal Information.
We collect Personal Information to: a) service your Transactions with us; and b) support our business functions.
We may obtain Personal Information from: a) You; b) your Transactions with us; and c) third parties such as a consumer-reporting agency.
Based on the type of product or service You apply for or get from us, Personal Information such as: a) your name; b) your address; c) your income; d) your payment; or e) your credit history; may be gathered from sources such as applications, Transactions, and consumer reports.
To serve You and service our business, we may share certain Personal Information. We will share Personal Information, only as allowed by law, with affiliates such as: a) our insurance companies; b) our employee agents; c) our brokerage firms; and d) our administrators.
As allowed by law, we may share Personal Financial Information with our affiliates to: a) market our products; or b) market our services; to You without providing You with an option to prevent these disclosures.
|
We may also share Personal Information, only as allowed by law, with unaffiliated third parties including: a) independent agents; b) brokerage firms; c) insurance companies; d) administrators; and e) service providers; who help us serve You and service our business.
When allowed by law, we may share certain Personal Financial Information with other unaffiliated third parties who assist us by performing services or functions such as: a) taking surveys; b) marketing our products or services; or c) offering financial products or services under a joint agreement between us and one or more financial institutions.
We, and third parties we partner with, may track some of the pages You visit through the use of: a) cookies; b) pixel tagging; or c) other technologies; and currently do not process or comply with any web browser’s “do not track” signal or similar mechanism that indicates a request to disable online tracking of individual users who visit our websites or use our services.
We will not sell or share your Personal Financial Information with anyone for purposes unrelated to our business functions without offering You the opportunity to: a) “opt-out;” or b) “opt-in;” as required by law.
We only disclose Personal Health Information with: a) your proper written authorization; or b) as otherwise allowed or required by law.
Our employees have access to Personal Information in the course of doing their jobs, such as: a) underwriting policies; b) paying claims; c) developing new products; or d) advising customers of our products and services.
|
|
We use manual and electronic security procedures to maintain: a) the confidentiality; and b) the integrity of; Personal Information that we have. We use these procedures to guard against unauthorized access.
Some techniques we use to protect Personal Information include: a) secured files; b) user authentication; c) encryption; d) firewall technology; and e) the use of detection software.
We are responsible for and must: a) identify information to be protected; b) provide an adequate level of protection for that data; c) grant access to protected data only to those people who must use it in the performance of their job-related duties.
Employees who violate our Privacy Policy will be subject to discipline, which may include ending their employment with us.
At the start of our business relationship, we will give You a copy of our current Privacy Policy.
We will also give You a copy of our current Privacy Policy once a year if You maintain a continuing business relationship with us.
We will continue to follow our Privacy Policy regarding Personal Information even when a business relationship no longer exists between us.
|
As used in this Privacy Notice:
Application means your request for our product or service.
Personal Financial Information means financial information such as: a) credit history; b) income; c) financial benefits; or d) policy or claim information.
Personal Health Information means health information such as: a) your medical records; or b) information about your illness, disability or injury.
Personal Information means information that identifies You personally and is not otherwise available to the public. It includes: a) Personal Financial Information; and b) Personal Health Information.
Transaction means your business dealings with us, such as: a) your Application; b) your request for us to pay a claim; and c) your request for us to take an action on your account.
You means an individual who has given us Personal Information in conjunction with: a) asking about; b) applying for; or c) obtaining; a financial product or service from us if the product or service is used mainly for personal, family, or household purposes.
|
This Privacy Policy is being provided on behalf of the following affiliates of The Hartford Financial Services Group, Inc.:
1stAGChoice, Inc.; Access CoverageCorp, Inc.; Access CoverageCorp Technologies, Inc.; American Maturity Life Insurance Company; Archway 60 R, LLC; Business Management Group, Inc.; Champlain Life Reinsurance Company; DMS R, LLC; Eloy R, LLC; Ersatz Corporation; First State Insurance Company; Hartford Accident and Indemnity Company; Hartford Administrative Services Company; Hartford Casualty General Agency, Inc.; Hartford Casualty Insurance Company; Hartford-Comprehensive Employee Benefit Service Company; Hartford Equity Sales Company, Inc.; Hartford Fire General Agency, Inc.; Hartford Fire Insurance Company; Hartford Funds Management Company, LLC; Hartford Funds Management Group, Inc.; Hartford HLS Series Fund II, Inc.; Hartford Insurance Company of Illinois; Hartford Insurance Company of the Midwest; Hartford Insurance Company of the Southeast; Hartford Integrated Technologies, Inc.; Hartford International Life Reassurance Corporation; Hartford Funds Distributors, LLC; Hartford Investment Management Company; Hartford Life and Accident Insurance Company; Hartford Life and Annuity Insurance Company; Hartford Life Insurance Company; Hartford Life Private Placement, LLC; Hartford Lloyd’s Corporation; Hartford Lloyd’s Insurance Company; Hartford Mezzanine Investors I, LLC; Hartford Residual Market, L.C.C.; Hartford Retirement Services, LLC; Hartford Securities Distribution Company, Inc.; Hartford Series Fund, Inc.; Hartford Specialty Insurance Services of Texas, LLC; Hartford Strategic Investments, LLC; Hartford Underwriters Insurance Company; Hartford Technology Services Company, L.L.C.; Hartford of Texas General Agency, Inc.; Hartford Underwriters General Agency, Inc.; HARTRE Company, L.C.C.; HL Investment Advisors, LLC; HLA LLC; Horizon Management Group, LLC; HRA Brokerage Services, Inc.; Lanidex Class B, LLC; M-CAP Insurance Agency, LLC; New England Insurance Company; New England Reinsurance Corporation; Nutmeg Insurance Agency, Inc.; Nutmeg Insurance Company; Pacific Insurance Company, Limited; Planco, LLC: Property and Casualty Insurance Company of Hartford; Revere R, LLC; RVR R, LLC; Sentinel Insurance Company, Ltd.; Sunstone R, LLC; Symphony R, LLC; The Evergreen Group Incorporated; The Hartford Alternative Strategies Fund; The Hartford Mutual Funds, Inc.; The Hartford Mutual Funds II, Inc.; Trumbull Flood Management, L.L.C.; Trumbull Insurance Company; Twin City Fire Insurance Company; White River Life Reinsurance Company.
HPP Revised January 2014
HARTFORDFUNDS
hartfordfunds.com
This information is written in connection with the promotion or marketing of the matter(s) addressed in this material.
This report is submitted for the general information of the shareholders of the Fund. It is not authorized for distribution unless preceded or accompanied by a current prospectus for the Fund.
The information cannot be used or relied upon for the purpose of avoiding IRS penalties. These materials are not intended to provide tax, accounting or legal advice. As with all matters of a tax or legal nature, you should consult your own tax or legal counsel for advice.
Investors should carefully consider the investment objectives, risks, charges, and expenses of Hartford Funds before investing. This and other information can be found in the prospectus and summary prospectus, which can be obtained by calling 888-843-7824 (retail) or 800-279-1541 (institutional). Investors should read them carefully before they invest.
Hartford Funds are underwritten and distributed by Hartford Funds Distributors, LLC.
MFAR-EMLD14 12/14 113971-3 Printed in U.S.A.
HARTFORDFUNDS
|
The
Hartford Emerging
2014 Annual Report |
A MESSAGE FROM THE PRESIDENT
Dear Fellow Shareholders:
Thank you for investing in Hartford Funds.
Market Review
U.S. equities (as represented by the S&P 500 Index) rose steadily for the fiscal year ended October 31, 2014, with a return of 17.27% for the period. With the exception of short-lived geopolitical scares early in 2014 and concerns about continuing global growth near the end of the period, stocks generally rose on solid fundamentals and encouraging macroeconomic data during the year.
September 2014 marked the six-year anniversary of the start of the financial crisis. Within weeks of that anniversary, both the S&P 500 Index and the Dow Jones Industrial Average set new all-time highs, closing at 2,018 and 17,391, respectively, on October 31. Although the fallout of the crisis continues to influence investor behavior, stocks have recovered and risen dramatically, up 198% from their low in March 2009. Meanwhile, the domestic economy is notching strong growth, and the unemployment rate has reached its lowest level since August 2008.
While the U.S. economy appears to have stabilized and to have reverted to a solid growth path, the outlook for the global economy appears to have gotten cloudier. The U.S. Federal Reserve has ended quantitative easing, while Europe and Japan are pursuing stimulus options to avoid a double-dip recession and deflation, respectively. Diverging central-bank policies will likely continue to play an important role in market movements going forward as investors wait to see the reactions to their efforts and their impacts on global markets.
How have market movements impacted your portfolio throughout the last year? Are your investments still on track to provide the growth or income you need, and are you comfortable with their progress during times of volatility?
Your financial professional can help you navigate today’s markets with confidence, as well as assist you to achieve your investment goals by providing advice on the best options within our fund family to help you work toward overcoming today’s investing challenges. Meet with your financial advisor regularly to examine your portfolio and your investment strategy, and to determine if you’re still on track to meet your goals.
Thank you again for investing with Hartford Funds.
James Davey
President
Hartford Funds
1 The S&P 500 Index is a market capitalization-weighted price index composed of 500 widely held common stocks.
2 The Dow Jones Industrial Average is an unmanaged, price-weighted index of 30 of the largest, most widely held stocks traded on the NYSE
The Hartford Emerging Markets Research Fund
Table of Contents
The views expressed in the Fund’s Manager Discussion under ‘‘Why did the Fund perform this way?’’ and ‘‘What is the outlook?’’ are views of the Fund’s sub-adviser and portfolio management team through the end of the period and are subject to change based on market and other conditions. The Fund’s Manager Discussion is for informational purposes only and does not represent an offer, recommendation or solicitation to buy, hold or sell any security. The specific securities identified and described, if any, do not represent all of the securities purchased or sold and you should not assume that investments in the securities identified and discussed will be profitable.
| The Hartford Emerging Markets Research Fund inception 05/31/2011 |
| (sub-advised by Wellington Management Company, LLP) |
| Investment objective – The Fund seeks long-term capital appreciation. |
Performance Overview 5/31/11 - 10/31/14
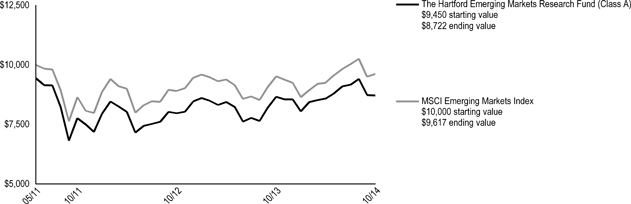
The chart above represents the hypothetical growth of a $10,000 investment in Class A, which includes a sales charge. Growth results in classes other than Class A will vary from what is seen above due to differences in the expenses charged to those share classes.
| Average Annual Total Returns (as of 10/31/14) |
| 1 Year | Since Inception▲ | |||||||
| Emerging Markets Research A# | 0.70 | % | -2.32 | % | ||||
| Emerging Markets Research A## | -4.84 | % | -3.92 | % | ||||
| Emerging Markets Research C# | -0.06 | % | -3.02 | % | ||||
| Emerging Markets Research C## | -1.05 | % | -3.02 | % | ||||
| Emerging Markets Research I# | 1.14 | % | -1.96 | % | ||||
| Emerging Markets Research R3# | 0.42 | % | -2.57 | % | ||||
| Emerging Markets Research R4# | 0.71 | % | -2.28 | % | ||||
| Emerging Markets Research R5# | 1.11 | % | -1.98 | % | ||||
| Emerging Markets Research Y# | 1.05 | % | -1.91 | % | ||||
| MSCI Emerging Markets Index | 0.98 | % | -1.14 | % | ||||
| ▲ | Inception: 05/31/2011 | |
| # | Without sales charge | |
| ## | With sales charge |
PERFORMANCE DATA QUOTED REPRESENTS PAST PERFORMANCE AND DOES NOT GUARANTEE FUTURE RESULTS. The investment return and principal value of the investment will fluctuate so that investors’ shares, when redeemed, may be worth more or less than their original cost. Current performance may be lower or higher than the performance data quoted. To obtain performance data current to the most recent month-end, please visit our website www.hartfordfunds.com.
The initial investment in Class A shares reflects the maximum sales charge of 5.50% and returns for Class C shares reflect a contingent deferred sales charge of up to 1.00% on shares redeemed within twelve months of purchase.
Total returns presented above were calculated using the Fund’s net asset value available to shareholders for sale or redemption of Fund shares on October 31, 2014, which may exclude investment transactions as of this date. All share class returns assume the reinvestment of all distributions at net asset value and the deduction of all fund expenses.
MSCI Emerging Markets Index is a free float-adjusted market capitalization index that is designed to measure equity market performance of emerging markets. The MSCI Emerging Markets Index consists of the following 21 emerging market country indices: Brazil, Chile, China, Colombia, Czech Republic, Egypt, Greece, Hungary, India, Indonesia, Korea, Malaysia, Mexico, Peru, Philippines, Poland, Russia, South Africa, Taiwan, Thailand, and Turkey.
You cannot invest directly in an index.
The chart and table do not reflect the deductions of taxes that a shareholder would pay on Fund distributions or the redemption of Fund shares.
Performance information may reflect historical or current expense waivers/reimbursements from the investment adviser, without which performance would have been lower. For information on current expense waivers/reimbursements, please see the prospectus.
| 2 |
| The Hartford Emerging Markets Research Fund |
| Manager Discussion |
| October 31, 2014 (Unaudited) |
| Operating Expenses* | ||||||||
| Net | Gross | |||||||
| Emerging Markets Research Class A | 1.75 | % | 1.83 | % | ||||
| Emerging Markets Research Class C | 2.43 | % | 2.43 | % | ||||
| Emerging Markets Research Class I | 1.35 | % | 1.35 | % | ||||
| Emerging Markets Research Class R3 | 1.95 | % | 2.04 | % | ||||
| Emerging Markets Research Class R4 | 1.65 | % | 1.74 | % | ||||
| Emerging Markets Research Class R5 | 1.35 | % | 1.44 | % | ||||
| Emerging Markets Research Class Y | 1.30 | % | 1.34 | % | ||||
| * | As shown in the Fund's current prospectus dated March 1, 2014. Actual expenses may be higher or lower. Please see accompanying Financial Highlights for expense ratios for the year ended October 31, 2014. |
Gross expenses are the Fund's total annual operating expenses shown in the Fund's most recent prospectus. Net expenses are the Fund's total annual operating expenses shown in the Fund's most recent prospectus and reflect contractual expense reimbursements in instances when these reductions reduce the Fund's gross expenses. Contractual reimbursements remain in effect until February 28, 2015, and automatically renew for one-year terms unless terminated.
All investments are subject to risk including the possible loss of principal. For a discussion of the Fund’s risks, please see the Main Risks section of this report. For more detailed information on the risks associated with an investment in the Fund, please see the prospectus.
| Portfolio Manager |
| Cheryl M. Duckworth, CFA |
| Managing Director and Associate Director, Global Industry Research |
How did the Fund perform?
The Class A shares of The Hartford Emerging Markets Research Fund returned 0.70%, before sales charge, for the twelve-month period ended October 31, 2014, underperforming the Fund’s benchmark, the MSCI Emerging Markets Index, which returned 0.98% for the same period. The Fund also underperformed the 1.16% average return of the Lipper Emerging Markets Equity Funds peer group, a group of funds with investment strategies similar to those of the Fund.
Why did the Fund perform this way?
Globally, equities rose during the period, despite bouts of volatility; however, emerging market equities underperformed their developed market counterparts. Despite ongoing geopolitical tensions in Ukraine and the Middle East, concerns about a Chinese economic growth slowdown, and unsettling economic and political developments in several other emerging market countries, the five-year-old stock rally continued in the first half of 2014. Robust merger and acquisition activity, along with continued accommodative monetary policy from central banks around the globe, aided bullish sentiment in May and June. However, Portuguese banking woes, European economic malaise, and the prospect of an accelerated U.S. Federal Reserve (Fed) interest-rate-hike timeline all contributed to stall the five-year-old global stock rally in the tail end of the period. In addition, China's property slump and poor gross domestic product (GDP) readings in Japan and the eurozone raised the specter of a slowdown in global economic growth. Nevertheless, there were several positive developments, including monetary easing by the European Central Bank (ECB) and the People's Bank of China, as well as an encouraging U.S. corporate earnings season. Despite these positives, many market participants found ample reason to reassess their risk appetites (i.e. reduce risks), given the strong bull market in recent years.
The Fund’s underperformance relative to the MSCI Emerging Markets Index was driven primarily by weak stock selection in the Telecommunications Services, Energy and Industrials sectors. This was more than offset by stronger stock selection in the Information Technology, Materials and Financials sectors over the period.
Out-of-benchmark positions in Tullow Oil (Energy), Motor Oil Hellas (Energy) and GS Holdings (Energy) were the top detractors from benchmark-relative performance during the period. Tullow Oil, a U.K.-based multinational oil and gas exploration company, underperformed as oil prices dropped and market attention turned to U.S. shale companies and smaller exploration and production companies. Tullow also reported mixed drilling results. Motor Oil Hellas is a Greek crude oil refinery company and offers petroleum products and lubricants. Shares of Motor Oil Hellas declined on general market weakness as continued political uncertainty and economic concerns weighed on stocks. GS Holdings, a South Korean holding company with oil refining as its main business line, saw its shares decline as oil prices fell over the period which negatively impacted earnings, as did South Korean won depreciation causing large foreign exchange translation losses. Petrobras (Energy) and Sberbank of Russia (Financials) detracted from absolute performance.
Top contributors to the Fund’s benchmark-relative performance were ICICI Bank (Financials), Coway (Consumer Discretionary), and Fosun International (Materials). ICICI Bank, an India-based large private bank, saw shares rise as expectations grew for increased asset quality driven by government led reforms. Shares of South Korea-based Coway, a direct marketing home appliance sales and rentals company that develops, manufactures, maintains and markets environment-related products, such as water purifiers, air cleaners and water softeners, moved higher as rental operations saw strong growth and sales in China continued to be strong. Shares of Fosun International, a China-based privately held conglomerate engaged in steel, mining, property, and pharmaceuticals, rose as the market reacted positively to the company’s recent acquisitions of Portuguese insurance companies
| 3 |
| The Hartford Emerging Markets Research Fund |
| Manager Discussion – (continued) |
| October 31, 2014 (Unaudited) |
as a signal of Fosun’s transition to an asset-light business model. Tencent Holdings (Information Technology) was also a top contributor to the Fund’s absolute performance.
Derivatives are not used in a significant manner in this Fund and did not have a material impact on performance during the period.
What is the outlook?
During the period, we increased our overweight to China as we initiated a new position in Petrochina based on our belief that significant regulatory reform is improving the transparency and profitability of the company and that Petrochina is improving capital efficiency and raising returns by divesting downstream assets. We moved from an overweight position in South Korea to an underweight position as we eliminated Samsung electronics from the Fund as we believe the company is underestimating local competition in the Chinese market which we believe will dampen their growth going forward.
At the end of the period, the Fund was overweight China, India and Greece and underweight Taiwan, Brazil and South Korea, relative to its benchmark.
| Diversification by Sector |
| as of October 31, 2014 |
| Sector | Percentage of Net Assets | |||
| Equity Securities | ||||
| Consumer Discretionary | 6.3 | % | ||
| Consumer Staples | 8.8 | |||
| Energy | 10.9 | |||
| Financials | 29.7 | |||
| Health Care | 1.9 | |||
| Industrials | 4.1 | |||
| Information Technology | 16.6 | |||
| Materials | 10.4 | |||
| Services | 7.1 | |||
| Utilities | 3.5 | |||
| Total | 99.3 | % | ||
| Short-Term Investments | 1.1 | |||
| Other Assets and Liabilities | (0.4 | ) | ||
| Total | 100.0 | % | ||
A sector may be comprised of several industries. For Fund compliance purposes, the Fund may not use the same classification system and these sector classifications are used for reporting ease.
| Currency Concentration of Securities | ||||
| as of October 31, 2014 | ||||
| Percentage of | ||||
| Description | Net Assets | |||
| Brazilian Real | 4.3 | % | ||
| British Pound | 1.0 | |||
| Canadian Dollar | 0.1 | |||
| Czech Koruna | 0.8 | |||
| Euro | 5.2 | |||
| Hong Kong Dollar | 28.2 | |||
| Indian Rupee | 11.3 | |||
| Indonesian New Rupiah | 1.3 | |||
| Kenyan Shilling | 0.9 | |||
| Malaysian Ringgit | 3.8 | |||
| Mexican New Peso | 1.8 | |||
| Nigerian Naira | 0.4 | |||
| Philippine Peso | 2.1 | |||
| Republic of Korea Won | 9.8 | |||
| Singapore Dollar | 0.5 | |||
| South African Rand | 5.8 | |||
| Sri Lankan Rupee | 0.2 | |||
| Taiwanese Dollar | 7.0 | |||
| Thai Bhat | 2.8 | |||
| Turkish New Lira | 1.1 | |||
| United Arab Emirates Dirham | 0.4 | |||
| United States Dollar | 11.6 | |||
| Other Assets and Liabilities | (0.4 | ) | ||
| Total | 100.0 | % | ||
| 4 |
| The Hartford Emerging Markets Research Fund |
| Schedule of Investments |
| October 31, 2014 |
| (000’s Omitted) |
| Shares or Principal Amount | Market Value ╪ | |||||||
| Common Stocks - 96.1% | ||||||||
| Brazil - 4.0% | ||||||||
| 99 | CETIP S.A. - Mercados Organizado | $ | 1,257 | |||||
| 92 | Hypermarcas S.A. ● | 640 | ||||||
| 52 | Itau Unibanco Banco Multiplo S.A. ADR | 772 | ||||||
| 26 | Localiza Rent a Car S.A. | 368 | ||||||
| 730 | Petroleo Brasileiro S.A. | 4,498 | ||||||
| 75 | Raia Drogasil S.A. | 676 | ||||||
| 8,211 | ||||||||
| Canada - 0.1% | ||||||||
| 360 | Ivanhoe Mines Ltd. ● | 271 | ||||||
| Cayman Islands - 0.2% | ||||||||
| 392 | HC International, Inc. ● | 481 | ||||||
| China - 20.1% | ||||||||
| 25 | 21Vianet Group, Inc. ADR ● | 524 | ||||||
| 8 | Alibaba Group Holding Ltd. ● | 818 | ||||||
| 6,162 | AMVIG Holdings Ltd. | 2,884 | ||||||
| 205 | Anta Sports Products Ltd. | 402 | ||||||
| 2 | Baidu, Inc. ADR ● | 597 | ||||||
| 5,203 | China Construction Bank | 3,882 | ||||||
| 457 | China Pacific Insurance Co., Ltd. | 1,708 | ||||||
| 3,853 | China Petroleum & Chemical Corp. Class H | 3,341 | ||||||
| 221 | China Shenhua Energy Co., Ltd. | 624 | ||||||
| 4,202 | China Suntien Green Energy | 1,116 | ||||||
| 798 | China Unicom Ltd. | 1,199 | ||||||
| 339 | ENN Energy Holdings Ltd. | 2,197 | ||||||
| 6,304 | GOME Electrical Appliances Holdings Ltd. | 993 | ||||||
| 4,459 | Greatview Aseptic Packaging Co., Ltd. | 2,921 | ||||||
| 1,086 | Guangdong Investment Ltd. | 1,429 | ||||||
| 943 | Huabao International Holdings Ltd. | 674 | ||||||
| 5,235 | Industrial & Commercial Bank of China Ltd. | 3,476 | ||||||
| 856 | Intime Retail Group Co., Ltd. | 745 | ||||||
| 12 | JD.com, Inc. ● | 294 | ||||||
| 994 | Lenovo Group Ltd. | 1,465 | ||||||
| 353 | Longfor Properties | 409 | ||||||
| 2,259 | PetroChina Co., Ltd. | 2,828 | ||||||
| 1,578 | PICC Property and Casualty Co., Ltd. | 2,894 | ||||||
| 380 | Shandong Weigao Group Medical Polymer Co., Ltd. | 384 | ||||||
| 232 | Sinopharm Medicine Holding Co., Ltd. | 908 | ||||||
| 1,082 | Sunny Optical Technology Group | 1,752 | ||||||
| 151 | Tingyi Holding Corp. | 376 | ||||||
| 40,840 | ||||||||
| Colombia - 0.5% | ||||||||
| 76 | Grupo Aval Acciones y Valores S.A. | 1,027 | ||||||
| Czech Republic - 0.8% | ||||||||
| 7 | Komercni Banka A.S. | 1,535 | ||||||
| Greece - 4.9% | ||||||||
| 3,447 | Alpha Bank A.E. ● | 2,247 | ||||||
| 137 | Hellenic Exchanges - Athens Stock Exchange S.A. | 925 | ||||||
| 246 | Hellenic Telecommunications Organization S.A. ● | 2,780 | ||||||
| 237 | Motor Oil Hellas Corinth Refineries S.A. | 1,737 | ||||||
| 1,490 | Piraeus Bank S.A. ● | 2,166 | ||||||
| 9,855 | ||||||||
| Hong Kong - 9.0% | ||||||||
| 191 | AAC Technologies Holdings, Inc. | 1,144 | ||||||
| 216 | AIA Group Ltd. | 1,207 | ||||||
| 265 | China Mengniu Dairy Co. | 1,170 | ||||||
| 208 | China Overseas Land & Investment Ltd. | 603 | ||||||
| 2,917 | Fosun International | 3,460 | ||||||
| 403 | Kingboard Chemical Holdings Ltd. | 793 | ||||||
| 2,080 | MMT Ltd. | 696 | ||||||
| 6,976 | Sinotrans Shipping Ltd. ● | 1,908 | ||||||
| 385 | Tencent Holdings Ltd. ● | 6,185 | ||||||
| 744 | Towngas China Co., Ltd. | 781 | ||||||
| 1,612 | Trinity Ltd. | 389 | ||||||
| 18,336 | ||||||||
| India - 11.9% | ||||||||
| 128 | Alstom India Ltd. | 1,102 | ||||||
| 197 | Alstom T&D India Ltd. | 1,201 | ||||||
| 210 | Bharti Airtel Ltd. | 1,368 | ||||||
| 22 | Dr. Reddy's Laboratories Ltd. ADR | 1,137 | ||||||
| 12 | Glaxosmithkline Consumer Healthcare Ltd. | 1,095 | ||||||
| 4,850 | GMR Infrastructure Ltd. | 1,707 | ||||||
| 50 | HCL Technologies Ltd. | 1,318 | ||||||
| 157 | ICICI Bank Ltd. | 4,175 | ||||||
| 368 | Idea Cellular Ltd. | 974 | ||||||
| 543 | Infrastructure Development Finance Co., Ltd. | 1,382 | ||||||
| 109 | ING Vysya Bank Ltd. | 1,140 | ||||||
| 376 | ITC Ltd. | 2,177 | ||||||
| 53 | J.K. Lakshmi Cement Ltd. ● | 316 | ||||||
| 115 | Marico Ltd. | 581 | ||||||
| 467 | Power Grid Corp. of India Ltd. | 1,108 | ||||||
| 45 | Reliance Industries Ltd. | 723 | ||||||
| 65 | Sun Pharmaceutical Industries Ltd. | 898 | ||||||
| 43 | Tata Consultancy Services Ltd. | 1,826 | ||||||
| 24,228 | ||||||||
| Indonesia - 1.3% | ||||||||
| 1,480 | Bank Tabungan Pensiunan Nasional Tbk ● | 518 | ||||||
| 387 | Matahari Department Store Tbk | 468 | ||||||
| 78 | PT Gudang Garam Tbk | 375 | ||||||
| 9,242 | Sumber Alfaria Trijaya Tbk ● | 402 | ||||||
| 2,668 | Vale Indonesia Tbk PT | 836 | ||||||
| 2,599 | ||||||||
| Kazakhstan - 0.5% | ||||||||
| 78 | Kcell JSC ■ | 1,048 | ||||||
| Kenya - 0.9% | ||||||||
| 955 | Equity Bank Ltd. ● | 540 | ||||||
| 8,674 | Safaricom Ltd. | 1,178 | ||||||
| 1,718 | ||||||||
| Malaysia - 3.8% | ||||||||
| 797 | 7-Eleven Malaysia Holdings ● | 405 | ||||||
| 1,300 | AMMB Holdings Berhad | 2,680 | ||||||
| 69 | British American Tobacco Malaysia Bhd | 1,467 | ||||||
| 290 | Genting Malaysia Berhad | 379 | ||||||
| 1,043 | MY EG Services BHD | 1,274 | ||||||
| 240 | Petronas Dagangan Berhad | 1,490 | ||||||
| 7,695 | ||||||||
| Mexico - 2.8% | ||||||||
| 84 | America Movil S.A.B. de C.V. ADR | 2,052 | ||||||
| 716 | Concentradora Fibra Hotelera | 1,205 | ||||||
| 578 | Corporacion Inmobiliaria Vesta S. de RL de C.V. | 1,270 | ||||||
| 492 | Wal-Mart de Mexico S.A.B. de C.V. | 1,141 | ||||||
| 5,668 | ||||||||
| Nigeria - 0.4% | ||||||||
| 6,974 | Zenith Bank plc | 895 | ||||||
The accompanying notes are an integral part of these financial statements.
| 5 |
| The Hartford Emerging Markets Research Fund |
| Schedule of Investments – (continued) |
| October 31, 2014 |
| (000’s Omitted) |
| Shares or Principal Amount | Market Value ╪ | |||||||
| Common Stocks - 96.1% - (continued) | ||||||||
| Papua New Guinea - 0.4% | ||||||||
| 71 | New Britain Palm Oil Ltd. | $ | 774 | |||||
| Peru - 1.4% | ||||||||
| 98 | Southern Copper Corp. | 2,823 | ||||||
| Philippines - 2.1% | ||||||||
| 180 | Jollibee Foods Corp. | 785 | ||||||
| 1,709 | LT Group, Inc. | 542 | ||||||
| 716 | Metropolitan Bank & Trust Co. | 1,317 | ||||||
| 969 | Robinsons Land Corp. | 530 | ||||||
| 249 | Universal Robina Corp. | 1,030 | ||||||
| 4,204 | ||||||||
| Romania - 0.4% | ||||||||
| 59 | Electrica S.A. ■● | 793 | ||||||
| Russia - 2.0% | ||||||||
| 36 | MegaFon OAO GDR § | 841 | ||||||
| 35 | MMC Norilsk Nickel OJSC ADR | 646 | ||||||
| 217 | OAO Gazprom Class S ADR | 1,435 | ||||||
| 221 | OAO Rosneft Oil Co. GDR § | 1,230 | ||||||
| 4,152 | ||||||||
| Singapore - 0.5% | ||||||||
| 325 | Petra Foods Ltd. | 964 | ||||||
| South Africa - 5.8% | ||||||||
| 73 | Adcock Ingram Holdings Ltd. ● | 327 | ||||||
| 404 | Discovery Ltd. | 3,676 | ||||||
| 23 | Imperial Holdings Ltd. | 391 | ||||||
| 28 | Naspers Ltd. | 3,447 | ||||||
| 78 | Pick n Pay Stores Ltd. | 376 | ||||||
| 651 | RMI Holdings | 2,319 | ||||||
| 171 | Woolworths Holdings Ltd. | 1,215 | ||||||
| 11,751 | ||||||||
| South Korea - 10.2% | ||||||||
| 7 | BGF Retail Co., Ltd. ● | 424 | ||||||
| 5 | Coway Co., Ltd. | 348 | ||||||
| 15 | Doosan Corp. | 1,560 | ||||||
| 44 | GS Holdings Corp. | 1,701 | ||||||
| 114 | Hana Financial Holdings | 3,957 | ||||||
| 85 | Hynix Semiconductor, Inc. ● | 3,787 | ||||||
| 6 | Hyundai Mobis Co., Ltd. | 1,392 | ||||||
| 4 | Hyundai Motor Co., Ltd. | 624 | ||||||
| 10 | Korea Electric Power Corp. | 434 | ||||||
| 17 | Korea Electric Power Corp. ADR | 367 | ||||||
| 2 | LG Chem Ltd. | 433 | ||||||
| 7 | Lotte Chemical Corp. | 939 | ||||||
| 2 | Posco Ltd. | 474 | ||||||
| 82 | Shinhan Financial Group Co., Ltd. | 3,838 | ||||||
| 9 | Shinhan Financial Group Co., Ltd. ADR | 432 | ||||||
| 20,710 | ||||||||
| Sri Lanka - 0.2% | ||||||||
| 39 | Ceylon Tobacco Co. plc | 342 | ||||||
| Taiwan - 7.0% | ||||||||
| 65 | Catcher Technology Co., Ltd. | 545 | ||||||
| 225 | Delta Electronics, Inc. | 1,348 | ||||||
| 16 | Hermes Microvision, Inc. | 752 | ||||||
| 9 | Largan Precision Co., Ltd. | 666 | ||||||
| 1,658 | Oriental Union Chemical Corp. | 1,254 | ||||||
| 121 | Pchome Online, Inc. | 1,228 | ||||||
| 124 | President Chain Store Corp. | 929 | ||||||
| 29 | Silergy Corp. | 200 | ||||||
| 1,555 | Taiwan Semiconductor Manufacturing Co., Ltd. | 6,741 | ||||||
| 381 | Vanguard International Semiconductor Corp. | 572 | ||||||
| 14,235 | ||||||||
| Thailand - 2.8% | ||||||||
| 1,026 | Precious Shipping Public Co., Ltd. | 671 | ||||||
| 1,594 | PTT Chemical Public Co., Ltd. | 3,025 | ||||||
| 256 | Robinson Department Store, PCL ● | 402 | ||||||
| 480 | Total Access Communication Public Co., Ltd. | 1,525 | ||||||
| 5,623 | ||||||||
| Turkey - 1.1% | ||||||||
| 26 | Coca-Cola Icecek | 592 | ||||||
| 203 | Turkcell Iletisim Hizmetleri AS ● | 1,177 | ||||||
| 55 | Ulker Biskuvi Sanayi AS ● | 404 | ||||||
| 2,173 | ||||||||
| United Arab Emirates - 0.4% | ||||||||
| 879 | Emaar Malls Group PJSC ● | 769 | ||||||
| United Kingdom - 0.6% | ||||||||
| 164 | Tullow Oil plc | 1,276 | ||||||
| Total Common Stocks | ||||||||
| (Cost $181,507) | $ | 194,996 | ||||||
Preferred Stocks - 0.7% | ||||||||
| Brazil - 0.7% | ||||||||
| 99 | Banco Itau Holding | $ | 1,473 | |||||
| Total Preferred Stocks | ||||||||
| (Cost $1,237) | $ | 1,473 | ||||||
Warrants - 1.2% |
||||||||
| Greece - 0.3% | ||||||||
| 394 | Alpha Bank A.E. | $ | 632 | |||||
| Russia - 0.5% | ||||||||
| 804 | Micex AP Generis ⌂■ | 1,084 | ||||||
| United Kingdom - 0.4% | ||||||||
| 23 | British American Tobacco ⌂† | 817 | ||||||
| Total Warrants | ||||||||
| (Cost $2,631) | $ | 2,533 | ||||||
The accompanying notes are an integral part of these financial statements.
| 6 |
The Hartford Emerging Markets Research Fund
Schedule of Investments – (continued)
October 31, 2014
(000’s Omitted)
| Shares or Principal Amount | Market Value ╪ | |||||||
| Exchange Traded Funds - 1.3% | ||||||||
| United States - 1.3% | ||||||||
| 52 | iShares Core MSCI Emerging Markets ETF | $ | 2,618 | |||||
| Total Exchange Traded Funds | ||||||||
| (Cost $2,555) | $ | 2,618 | ||||||
| Total Long-Term Investments | ||||||||
| (Cost $187,930) | $ | 201,620 | ||||||
| Short-Term Investments - 1.1% | ||||||||
| Repurchase Agreements - 1.1% | ||||||||
| Bank of America Merrill Lynch TriParty Repurchase Agreement (maturing on 11/03/2014 in the amount of $6, collateralized by U.S. Treasury Note 1.50%, 2019, value of $6) | ||||||||
| $ | 6 | 0.08%, 10/31/2014 | $ | 6 | ||||
| Bank of America Merrill Lynch TriParty Repurchase Agreement (maturing on 11/03/2014 in the amount of $104, collateralized by GNMA 1.63% - 7.00%, 2031 - 2054, value of $106) | ||||||||
| 104 | 0.09%, 10/31/2014 | 104 | ||||||
| Bank of Montreal TriParty Repurchase Agreement (maturing on 11/03/2014 in the amount of $28, collateralized by U.S. Treasury Bond 2.88% - 5.25%, 2029 - 2043, U.S. Treasury Note 0.38% - 4.50%, 2015 - 2022, value of $29) | ||||||||
| 28 | 0.08%, 10/31/2014 | 28 | ||||||
| Bank of Montreal TriParty Repurchase Agreement (maturing on 11/03/2014 in the amount of $95, collateralized by FHLMC 2.00% - 5.50%, 2022 - 2034, FNMA 2.00% - 4.50%, 2024 - 2039, GNMA 3.00%, 2043, U.S. Treasury Note 4.63%, 2017, value of $97) | ||||||||
| 95 | 0.10%, 10/31/2014 | 95 | ||||||
| Barclays Capital TriParty Repurchase Agreement (maturing on 11/03/2014 in the amount of $358, collateralized by U.S. Treasury Bond 4.50% - 6.25%, 2023 - 2036, U.S. Treasury Note 1.63% - 2.13%, 2015 - 2019, value of $365) | ||||||||
| 357 | 0.08%, 10/31/2014 | 357 | ||||||
| Citigroup Global Markets, Inc. TriParty Repurchase Agreement (maturing on 11/03/2014 in the amount of $411, collateralized by U.S. Treasury Bill 0.02%, 2015, U.S. Treasury Bond 3.88% - 11.25%, 2015 - 2040, U.S. Treasury Note 2.00% - 3.38%, 2019 - 2021, value of $419) | ||||||||
| 411 | 0.09%, 10/31/2014 | 411 | ||||||
| Deutsche Bank Securities TriParty Repurchase Agreement (maturing on 11/03/2014 in the amount of $24, collateralized by U.S. Treasury Note 0.88%, 2017, value of $24) | ||||||||
| 24 | 0.13%, 10/31/2014 | 24 | ||||||
| RBS Securities, Inc. TriParty Repurchase Agreement (maturing on 11/03/2014 in the amount of $35, collateralized by U.S. Treasury Bond 3.63% - 5.00%, 2037 - 2043, U.S. Treasury Note 2.13%, 2020, value of $36) | ||||||||
| 35 | 0.07%, 10/31/2014 | 35 | ||||||
| Societe Generale TriParty Repurchase Agreement (maturing on 11/03/2014 in the amount of $368, collateralized by U.S. Treasury Bill 0.02%, 2015, U.S. Treasury Bond 3.75% - 11.25%, 2015 - 2043, U.S. Treasury Note 1.38% - 4.25%, 2015 - 2022, value of $375) | ||||||||||||
| 368 | 0.08%, 10/31/2014 | 368 | ||||||||||
| TD Securities TriParty Repurchase Agreement (maturing on 11/03/2014 in the amount of $713, collateralized by FHLMC 3.00% - 4.00%, 2026 - 2044, FNMA 2.50% - 5.00%, 2025 - 2044, U.S. Treasury Bond 3.50% - 6.50%, 2026 - 2041, U.S. Treasury Note 1.75% - 2.88%, 2018 - 2019, value of $727) | ||||||||||||
| 713 | 0.10%, 10/31/2014 | 713 | ||||||||||
| 2,141 | ||||||||||||
| Total Short-Term Investments | ||||||||||||
| (Cost $2,141) | $ | 2,141 | ||||||||||
| Total Investments | ||||||||||||
| (Cost $190,071) ▲ | 100.4 | % | $ | 203,761 | ||||||||
| Other Assets and Liabilities | (0.4 | )% | (850 | ) | ||||||||
| Total Net Assets | 100.0 | % | $ | 202,911 | ||||||||
The accompanying notes are an integral part of these financial statements.
| 7 |
| The Hartford Emerging Markets Research Fund |
| Schedule of Investments – (continued) |
| October 31, 2014 |
| (000’s Omitted) |
| Note: | Percentage of investments as shown is the ratio of the total market value to total net assets. |
Prices of foreign equities that are principally traded on certain foreign markets may be adjusted daily pursuant to a fair value pricing service approved by the Board of Directors in order to reflect an adjustment for factors occurring after the close of certain foreign markets but before the close of the New York Stock Exchange.
The Fund may refer to any one or more of the industry classifications used by one or more widely recognized market indices, ratings group indices and/or as defined by Fund management. Industry classifications may not be identical across all security types.
Other than the industry classifications "Other Investment Pools and Funds" and "Exchange Traded Funds," equity industry classifications used in this report are the Global Industry Classification Standard, which was developed by and is the exclusive property and service mark of MSCI, Inc. and Standard & Poor’s.
For Fund compliance purposes, the Fund may not use the same classification system shown in this report as these classifications are used for reporting ease.
| ▲ | At October 31, 2014, the cost of securities for federal income tax purposes was $192,296 and the aggregate gross unrealized appreciation and depreciation based on that cost were: |
| Unrealized Appreciation | $ | 24,159 | ||
| Unrealized Depreciation | (12,694 | ) | ||
| Net Unrealized Appreciation | $ | 11,465 |
| † | These securities were valued in good faith at fair value as determined under policies and procedures established by and under the supervision of the Board of Directors. At October 31, 2014, the aggregate fair value of these securities was $817, which represents 0.4% of total net assets. This amount excludes securities that are principally traded in certain foreign markets and whose prices are adjusted pursuant to a third party pricing service methodology approved by the Board of Directors. |
| ● | Non-income producing. |
| ■ | Securities issued within terms of a private placement memorandum, exempt from registration under Rule 144A under the Securities Act of 1933, as amended, and may be sold only to qualified institutional buyers. Unless otherwise indicated, these holdings are determined to be liquid. At October 31, 2014, the aggregate value of these securities was $2,925, which represents 1.4% of total net assets. |
| § | These securities were sold to the Fund under Regulation S, rules governing offers and sales made outside the United States without registration under the Securities Act of 1933, as amended. The Fund may only be able to resell these securities in the United States if an exemption from registration under the federal and state securities laws is available, or the Fund may only be able to sell these securities outside of the United States (such as on a foreign exchange) to a non-U.S. person. Unless otherwise indicated, these holdings are determined to be liquid. At October 31, 2014, the aggregate value of these securities was $2,071, which represents 1.0% of total net assets. |
| ⌂ | The following securities are considered illiquid. Illiquid securities are often purchased in private placement transactions, are often not registered under the Securities Act of 1933, as amended, and may have contractual restrictions on resale. A security may also be considered illiquid if the security lacks a readily available market or if its valuation has not changed for a certain period of time. |
| Period Acquired | Shares/ Par | Security | Cost Basis | |||||||
| 06/2013 - 07/2013 | 23 | British American Tobacco Warrants | $ | 341 | ||||||
| 06/2013 - 03/2014 | 804 | Micex AP Generis Warrants - 144A | 1,353 | |||||||
At October 31, 2014, the aggregate value of these securities was $1,901, which represents 0.9% of total net assets.
| Foreign Currency Contracts Outstanding at October 31, 2014 | ||||||||||||||||||||||
| Unrealized Appreciation/(Depreciation) | ||||||||||||||||||||||
| Currency | Buy / Sell | Delivery Date | Counterparty | Contract Amount | Market Value ╪ | Asset | Liability | |||||||||||||||
| HKD | Buy | 11/04/2014 | BCLY | $ | 691 | $ | 691 | $ | – | $ | – | |||||||||||
| HKD | Buy | 11/03/2014 | UBS | 1,814 | 1,814 | – | – | |||||||||||||||
| IDR | Buy | 11/04/2014 | JPM | 17 | 17 | – | – | |||||||||||||||
| SGD | Sell | 11/05/2014 | BCLY | 53 | 53 | – | – | |||||||||||||||
| SGD | Sell | 11/03/2014 | SSG | 38 | 38 | – | – | |||||||||||||||
| ZAR | Sell | 11/04/2014 | NAB | 139 | 137 | 2 | – | |||||||||||||||
| Total | $ | 2 | $ | – | ||||||||||||||||||
| ╪ | See Significant Accounting Policies of accompanying Notes to Financial Statements regarding valuation of securities. |
The accompanying notes are an integral part of these financial statements.
| 8 |
| The Hartford Emerging Markets Research Fund |
| Schedule of Investments – (continued) |
| October 31, 2014 |
| (000’s Omitted) |
| GLOSSARY: (abbreviations used in preceding Schedule of Investments) | ||
| Counterparty Abbreviations: | ||
| BCLY | Barclays | |
| JPM | JP Morgan Chase & Co. | |
| NAB | National Australia Bank Limited | |
| SSG | State Street Global Markets LLC | |
| UBS | UBS AG | |
| Currency Abbreviations: | ||
| HKD | Hong Kong Dollar | |
| IDR | Indonesian New Rupiah | |
| SGD | Singapore Dollar | |
| ZAR | South African Rand | |
| Other Abbreviations: | ||
| ADR | American Depositary Receipt | |
| ETF | Exchange Traded Fund | |
| FHLMC | Federal Home Loan Mortgage Corp. | |
| FNMA | Federal National Mortgage Association | |
| GDR | Global Depositary Receipt | |
| GNMA | Government National Mortgage Association | |
The accompanying notes are an integral part of these financial statements.
| 9 |
| The Hartford Emerging Markets Research Fund |
| Schedule of Investments – (continued) |
| October 31, 2014 |
| (000’s Omitted) |
| Investment Valuation Hierarchy Level Summary |
| October 31, 2014 |
| Total | Level 1 ♦ | Level 2 ♦ | Level 3 | |||||||||||||
| Assets: | ||||||||||||||||
| Common Stocks | ||||||||||||||||
| Brazil | $ | 8,211 | $ | 8,211 | $ | – | $ | – | ||||||||
| Canada | 271 | 271 | – | – | ||||||||||||
| Cayman Islands | 481 | 481 | – | – | ||||||||||||
| China | 40,840 | 8,038 | 32,802 | – | ||||||||||||
| Colombia | 1,027 | 1,027 | – | – | ||||||||||||
| Czech Republic | 1,535 | – | 1,535 | – | ||||||||||||
| Greece | 9,855 | – | 9,855 | – | ||||||||||||
| Hong Kong | 18,336 | 603 | 17,733 | – | ||||||||||||
| India | 24,228 | 5,198 | 19,030 | – | ||||||||||||
| Indonesia | 2,599 | – | 2,599 | – | ||||||||||||
| Kazakhstan | 1,048 | 1,048 | – | – | ||||||||||||
| Kenya | 1,718 | 1,178 | 540 | – | ||||||||||||
| Malaysia | 7,695 | 1,490 | 6,205 | – | ||||||||||||
| Mexico | 5,668 | 5,668 | – | – | ||||||||||||
| Nigeria | 895 | – | 895 | – | ||||||||||||
| Papua New Guinea | 774 | 774 | – | – | ||||||||||||
| Peru | 2,823 | 2,823 | – | – | ||||||||||||
| Philippines | 4,204 | – | 4,204 | – | ||||||||||||
| Romania | 793 | – | 793 | – | ||||||||||||
| Russia | 4,152 | 4,152 | – | – | ||||||||||||
| Singapore | 964 | 964 | – | – | ||||||||||||
| South Africa | 11,751 | 2,646 | 9,105 | – | ||||||||||||
| South Korea | 20,710 | 1,223 | 19,487 | – | ||||||||||||
| Sri Lanka | 342 | 342 | – | – | ||||||||||||
| Taiwan | 14,235 | – | 14,235 | – | ||||||||||||
| Thailand | 5,623 | – | 5,623 | – | ||||||||||||
| Turkey | 2,173 | – | 2,173 | – | ||||||||||||
| United Arab Emirates | 769 | 769 | – | – | ||||||||||||
| United Kingdom | 1,276 | – | 1,276 | – | ||||||||||||
| Total | $ | 194,996 | $ | 46,906 | $ | 148,090 | $ | – | ||||||||
| Exchange Traded Funds | 2,618 | 2,618 | – | – | ||||||||||||
| Preferred Stocks | 1,473 | 1,473 | – | – | ||||||||||||
| Warrants | 2,533 | 1,716 | – | 817 | ||||||||||||
| Short-Term Investments | 2,141 | – | 2,141 | – | ||||||||||||
| Total | $ | 203,761 | $ | 52,713 | $ | 150,231 | $ | 817 | ||||||||
| Foreign Currency Contracts* | $ | 2 | $ | – | $ | 2 | $ | – | ||||||||
| Total | $ | 2 | $ | – | $ | 2 | $ | – | ||||||||
| Liabilities: | ||||||||||||||||
| Foreign Currency Contracts* | $ | – | $ | – | $ | – | $ | – | ||||||||
| Total | $ | – | $ | – | $ | – | $ | – | ||||||||
| ♦ | For the year ended October 31, 2014, investments valued at $6,628 were transferred from Level 1 to Level 2, and investments valued at $17,781 were transferred from Level 2 to Level 1. Investments are transferred between Level 1 and Level 2 for a variety of reasons including, but not limited to: |
| 1) | Foreign equities for which a fair value price is more representative of exit value than the local market close (transfer into Level 2). Foreign equities for which the local market close is more representative of exit value (transfer into Level 1). |
| 2) | U.S. Treasury securities that no longer represent the most recent issue (transfer into Level 2). |
| 3) | Equity investments with no observable trading but a bid or mean price is used (transfer into Level 2). Equity investments using observable quoted prices in an active market (transfer into Level 1). |
| * | Derivative instruments (excluding purchased and written options, if applicable) are valued at the unrealized appreciation/depreciation on the investments. |
The accompanying notes are an integral part of these financial statements.
| 10 |
| The Hartford Emerging Markets Research Fund |
| Schedule of Investments – (continued) |
| October 31, 2014 |
| (000’s Omitted) |
| Following is a reconciliation of Level 3 assets for which significant unobservable inputs were used to determine fair value: | ||||||||||||||||||||||||||||||||||||
| Balance
as of October 31, 2013 | Realized Gain (Loss) | Change
in Unrealized Appreciation (Depreciation) | Net Amortization | Purchases | Sales | Transfers
Into Level 3 * | Transfers Out of Level 3 * | Balance
as of October 31, 2014 | ||||||||||||||||||||||||||||
| Assets: | ||||||||||||||||||||||||||||||||||||
| Warrants | — | $ | 37 | $ | 332 | † | $ | — | $ | — | $ | (77 | ) | $ | 525 | $ | — | $ | 817 | |||||||||||||||||
| Total | $ | — | $ | 37 | $ | 332 | $ | — | $ | — | $ | (77 | ) | $ | 525 | $ | — | $ | 817 | |||||||||||||||||
| * | Investments are transferred into and out of Level 3 for a variety of reasons including, but not limited to: |
| 1) | Investments where trading has been halted (transfer into Level 3) or investments where trading has resumed (transfer out of Level 3). |
| 2) | Broker quoted investments (transfer into Level 3) or quoted prices in active markets (transfer out of Level 3). |
| 3) | Investments that have certain restrictions on trading (transfer into Level 3) or investments where trading restrictions have expired (transfer out of Level 3). |
| † | Change in unrealized appreciation (depreciation) in the current period relating to assets still held at October 31, 2014 was $332. |
| Note: | For purposes of reporting transfers between different hierarchy levels, both transfers in and out of each level, as applicable, are shown as if they occurred at the beginning of the period. |
The accompanying notes are an integral part of these financial statements.
| 11 |
| The Hartford Emerging Markets Research Fund |
| Statement of Assets and Liabilities |
| October 31, 2014 |
| (000’s Omitted) |
| Assets: | ||||
| Investments in securities, at market value (cost $190,071) | $ | 203,761 | ||
| Cash | 1 | |||
| Foreign currency on deposit with custodian (cost $192) | 192 | |||
| Unrealized appreciation on foreign currency contracts | 2 | |||
| Receivables: | ||||
| Investment securities sold | 2,072 | |||
| Fund shares sold | 251 | |||
| Dividends and interest | 57 | |||
| Other assets | 60 | |||
| Total assets | 206,396 | |||
| Liabilities: | ||||
| Unrealized depreciation on foreign currency contracts | — | |||
| Payables: | ||||
| Investment securities purchased | 3,403 | |||
| Fund shares redeemed | 9 | |||
| Investment management fees | 46 | |||
| Administrative fees | — | |||
| Distribution fees | 1 | |||
| Accrued expenses | 26 | |||
| Total liabilities | 3,485 | |||
| Net assets | $ | 202,911 | ||
| Summary of Net Assets: | ||||
| Capital stock and paid-in-capital | $ | 175,102 | ||
| Undistributed net investment income | 1,827 | |||
| Accumulated net realized gain | 12,293 | |||
| Unrealized appreciation of investments and the translation of assets and liabilities denominated in foreign currency | 13,689 | |||
| Net assets | $ | 202,911 | ||
| Shares authorized | 600,000 | |||
| Par value | $ | 0.001 | ||
| Class A: Net asset value per share/Maximum offering price per share | $9.09/$9.62 | |||
| Shares outstanding | 1,211 | |||
| Net assets | $ | 11,009 | ||
| Class C: Net asset value per share | $ | 8.92 | ||
| Shares outstanding | 293 | |||
| Net assets | $ | 2,617 | ||
| Class I: Net asset value per share | $ | 9.09 | ||
| Shares outstanding | 335 | |||
| Net assets | $ | 3,045 | ||
| Class R3: Net asset value per share | $ | 9.02 | ||
| Shares outstanding | 214 | |||
| Net assets | $ | 1,927 | ||
| Class R4: Net asset value per share | $ | 9.06 | ||
| Shares outstanding | 204 | |||
| Net assets | $ | 1,850 | ||
| Class R5: Net asset value per share | $ | 9.09 | ||
| Shares outstanding | 205 | |||
| Net assets | $ | 1,868 | ||
| Class Y: Net asset value per share | $ | 9.08 | ||
| Shares outstanding | 19,885 | |||
| Net assets | $ | 180,595 |
The accompanying notes are an integral part of these financial statements.
| 12 |
| The Hartford Emerging Markets Research Fund |
| Statement of Operations |
| For the Year Ended October 31, 2014 |
| (000’s Omitted) |
| Investment Income: | ||||
| Dividends | $ | 6,142 | ||
| Interest | 61 | |||
| Less: Foreign tax withheld | (677 | ) | ||
| Total investment income | 5,526 | |||
| Expenses: | ||||
| Investment management fees | 2,834 | |||
| Administrative services fees | ||||
| Class R3 | 4 | |||
| Class R4 | 3 | |||
| Class R5 | 2 | |||
| Transfer agent fees | ||||
| Class A | 25 | |||
| Class C | 4 | |||
| Class I | — | |||
| Class R3 | — | |||
| Class R4 | — | |||
| Class Y | 4 | |||
| Distribution fees | ||||
| Class A | 24 | |||
| Class C | 25 | |||
| Class R3 | 10 | |||
| Class R4 | 5 | |||
| Custodian fees | 69 | |||
| Accounting services fees | 59 | |||
| Registration and filing fees | 93 | |||
| Board of Directors' fees | 7 | |||
| Audit fees | 32 | |||
| Other expenses | 65 | |||
| Total expenses (before waivers and fees paid indirectly) | 3,265 | |||
| Expense waivers | (103 | ) | ||
| Management fee waivers | (83 | ) | ||
| Commission recapture | (12 | ) | ||
| Total waivers and fees paid indirectly | (198 | ) | ||
| Total expenses, net | 3,067 | |||
| Net Investment Income | 2,459 | |||
| Net Realized Gain on Investments and Foreign Currency Transactions: | ||||
| Net realized gain on investments | 14,011 | |||
| Less: Foreign taxes paid on realized capital gains | (206 | ) | ||
| Net realized loss on foreign currency contracts | (297 | ) | ||
| Net realized gain on other foreign currency transactions | 19 | |||
| Net Realized Gain on Investments and Foreign Currency Transactions | 13,527 | |||
| Net Changes in Unrealized Depreciation of Investments and Foreign Currency Transactions: | ||||
| Net unrealized depreciation of investments | (11,828 | ) | ||
| Net unrealized appreciation of foreign currency contracts | 5 | |||
| Net unrealized appreciation of translation of other assets and liabilities in foreign currencies | — | |||
| Net Changes in Unrealized Depreciation of Investments and Foreign Currency Transactions | (11,823 | ) | ||
| Net Gain on Investments and Foreign Currency Transactions | 1,704 | |||
| Net Increase in Net Assets Resulting from Operations | $ | 4,163 |
The accompanying notes are an integral part of these financial statements.
| 13 |
| The Hartford Emerging Markets Research Fund |
| Statement of Changes in Net Assets |
| (000’s Omitted) |
| For the Year Ended October 31, 2014 | For the Year Ended October 31, 2013 | |||||||
| Operations: | ||||||||
| Net investment income | $ | 2,459 | $ | 2,734 | ||||
| Net realized gain on investments and foreign currency transactions | 13,527 | 3,459 | ||||||
| Net unrealized appreciation (depreciation) of investments and foreign currency transactions | (11,823 | ) | 12,732 | |||||
| Net Increase in Net Assets Resulting from Operations | 4,163 | 18,925 | ||||||
| Distributions to Shareholders: | ||||||||
| From net investment income | ||||||||
| Class A | (47 | ) | (1 | ) | ||||
| Class I | (20 | ) | (17 | ) | ||||
| Class R3 | (5 | ) | (4 | ) | ||||
| Class R4 | (10 | ) | (9 | ) | ||||
| Class R5 | (15 | ) | (14 | ) | ||||
| Class Y | (2,081 | ) | (1,775 | ) | ||||
| Total from net investment income | (2,178 | ) | (1,820 | ) | ||||
| From net realized gain on investments | ||||||||
| Class A | (76 | ) | — | |||||
| Class C | (25 | ) | — | |||||
| Class I | (22 | ) | — | |||||
| Class R3 | (17 | ) | — | |||||
| Class R4 | (16 | ) | — | |||||
| Class R5 | (17 | ) | — | |||||
| Class Y | (2,145 | ) | — | |||||
| Total from net realized gain on investments | (2,318 | ) | — | |||||
| Total distributions | (4,496 | ) | (1,820 | ) | ||||
| Capital Share Transactions: | ||||||||
| Class A | 3,196 | (524 | ) | |||||
| Class C | (10 | ) | 445 | |||||
| Class I | 768 | 152 | ||||||
| Class R3 | 23 | 28 | ||||||
| Class R4 | 27 | 9 | ||||||
| Class R5 | 32 | 14 | ||||||
| Class Y | (56,023 | ) | 50,403 | |||||
| Net increase (decrease) from capital share transactions | (51,987 | ) | 50,527 | |||||
| Net Increase (Decrease) in Net Assets | (52,320 | ) | 67,632 | |||||
| Net Assets: | ||||||||
| Beginning of period | 255,231 | 187,599 | ||||||
| End of period | $ | 202,911 | $ | 255,231 | ||||
| Undistributed (distributions in excess of) net investment income | $ | 1,827 | $ | 2,000 | ||||
The accompanying notes are an integral part of these financial statements.
| 14 |
| The Hartford Emerging Markets Research Fund |
| Notes to Financial Statements |
| October 31, 2014 |
| (000’s Omitted) |
Organization:
The Hartford Mutual Funds, Inc. (“Company”) is an open-end management investment company comprised of forty-two portfolios. Financial statements for The Hartford Emerging Markets Research Fund (the "Fund"), a series of the Company, are included in this report.
The Company is organized under the laws of the State of Maryland and is registered with the Securities and Exchange Commission (“SEC”) under the Investment Company Act of 1940, as amended (“1940 Act”). The Fund is a diversified open-end management investment company. The Fund is an investment company and applies specialized accounting and reporting under Accounting Standards Codification Topic 946, Financial Services - Investment Companies.
Class A shares are sold with a front-end sales charge of up to 5.50%. Class C shares are sold with a contingent deferred sales charge of up to 1.00% on shares redeemed within twelve months of purchase. Class I shares are sold without sales charges to certain eligible investors primarily through advisory fee-based wrap programs. Class R3, R4 and R5 shares, which are offered to employer-sponsored retirement plans, and Class Y shares, which are sold to certain eligible institutional investors, are sold without a sales charge. All classes of shares have identical voting, redemption, dividend, liquidation and other rights and the same terms and conditions, with the exceptions that each class may have different expenses, which may affect performance.
Significant Accounting Policies:
The following is a summary of significant accounting policies of the Fund in the preparation of its financial statements, which are in accordance with United States generally accepted accounting principles (“U.S. GAAP”). The preparation of financial statements in accordance with U.S. GAAP may require management to make estimates and assumptions that affect the reported amounts of assets and liabilities and disclosure of contingent assets and liabilities at the date of the financial statements and the reported amounts of increases and decreases in net assets from operations during the reporting period. Actual results could differ from those estimates.
Determination of Net Asset Value – The per share net asset value ("NAV") of each class of the Fund's shares is determined as of the close of regular trading (normally 4:00 p.m. Eastern Time) (the “NYSE Close”) on each day that the New York Stock Exchange (the “Exchange”) is open (“Valuation Date”). Information that becomes known to the Fund after the NAV has been calculated on a particular day will not generally be used to retroactively adjust the NAV determined earlier that day.
Investment Valuation and Fair Value Measurements – For purposes of calculating the NAV, portfolio investments and other assets held by the Fund's portfolio for which market quotes are readily available are valued at market value. Market value is generally determined on the basis of last reported sales prices or official close price. If no sales are reported, market value is based on quotes obtained from a quotation reporting system, established market makers, or independent pricing services. If market prices are not readily available or are deemed unreliable, the Fund will use the fair value of the investment as determined in good faith under policies and procedures established by and under the supervision of the Company's Board of Directors. Market quotes are considered not readily available where there is an absence of current or reliable market-based data (e.g., trade information or indicative market quotes), including where events occur after the close of the relevant market, but prior to the NYSE Close, that materially affect the values of the Fund's portfolio investments or assets. In addition, market quotes are considered not readily available when, due to extraordinary circumstances, the exchanges or markets on which the investments trade do not open for trading for the entire day and no other market prices are available. In addition, prices of foreign equities that are principally traded on certain foreign markets may be adjusted daily pursuant to a fair value pricing service approved by the Board of Directors in order to reflect an adjustment for the factors occurring after the close of certain foreign markets but before the NYSE Close. Investments that are primarily traded on foreign markets may trade on days that are not business days of the Fund. The value of the foreign investments in which the Fund invests may change on days when a shareholder will not be able to purchase or redeem shares of the Fund. Fair value pricing is subjective in nature and the use of fair value pricing by the Fund may cause the NAV of its shares to differ significantly from the NAV that would have been calculated using market prices at the close of the exchange on which a portfolio investment is primarily traded. There can be no assurance that the Fund could obtain the fair market value assigned to an investment if the Fund were to sell the investment at approximately the time at which the Fund determines its NAV.
Investments valued in currencies other than U.S. dollars are converted to U.S. dollars using exchange rates obtained from independent pricing services for calculation of the NAV. As a result, the NAV of the Fund’s shares may be affected by changes in the
| 15 |
| The Hartford Emerging Markets Research Fund |
| Notes to Financial Statements – (continued) |
| October 31, 2014 |
| (000’s Omitted) |
value of currencies in relation to the U.S. dollar. The value of investments traded in markets outside the United States or denominated in currencies other than the U.S. dollar may be affected significantly on a day that the NYSE is closed and the market value may change on days when an investor is not able to purchase, redeem or exchange shares of the Fund.
Foreign currency contracts represent agreements to exchange currencies on specific future dates at predetermined rates. Foreign currency contracts are valued using foreign currency exchange rates and forward rates as provided by an independent pricing service on the Valuation Date.
Investments in open-end mutual funds are valued at the respective NAV of each open-end mutual fund on the Valuation Date.
Financial instruments for which prices are not available from an independent pricing service may be valued using market quotations obtained from one or more dealers that make markets in the respective financial instrument in accordance with procedures established by the Company's Board of Directors.
U.S. GAAP defines fair value as the price that the Fund would receive to sell an asset or pay to transfer a liability in an orderly transaction between market participants. The U.S. GAAP fair value measurement standards require disclosure of a fair value hierarchy for each major category of assets and liabilities. Various inputs are used in determining the fair value of the Fund’s investments. These inputs are summarized into three broad hierarchy levels. This hierarchy is based on whether the valuation inputs are observable or unobservable. These levels are:
Level 1 – Quoted prices in active markets for identical investments. Level 1 may include exchange traded instruments, such as domestic equities, some foreign equities, options, futures, mutual funds, exchange traded funds, rights and warrants.
Level 2 – Observable inputs other than Level 1 prices, such as quoted prices for similar investments; quoted prices in markets that are not active; or other inputs that are observable or can be corroborated by observable market data. Level 2 may include debt investments that are traded less frequently than exchange traded instruments and which are valued using independent pricing services; foreign equities, which are principally traded on certain foreign markets and are adjusted daily pursuant to a fair value pricing service in order to reflect an adjustment for the factors occurring after the close of certain foreign markets but before the NYSE Close; senior floating rate interests, which are valued using an aggregate of dealer bids; short-term investments, which are valued at amortized cost; and swaps, which are valued based upon the terms of each swap contract.
Level 3 – Significant unobservable inputs that are supported by limited or no market activity. Level 3 may include financial instruments whose values are determined using indicative market quotes or require significant management judgment or estimation. These unobservable valuation inputs may include estimates for current yields, maturity/duration, prepayment speed, and indicative market quotes for comparable investments along with other assumptions relating to credit quality, collateral value, complexity of the investment structure, general market conditions and liquidity. This category may include investments where trading has been halted or there are certain restrictions on trading. While these investments are priced using unobservable inputs, the valuation of these investments reflects the best available data and management believes the prices are a reasonable representation of exit price.
The Board of Directors of the Company generally reviews and approves the “Procedures for Valuation of Portfolio Securities” at least once a year. These procedures define how investments are to be valued, including the formation and activities of a Valuation Committee. The Valuation Committee is responsible for determining in good faith the fair value of investments when the value cannot be obtained from primary pricing services or alternative sources or if the valuation of an investment as provided by the primary pricing service or alternative source is believed not to reflect the investment’s fair value as of the Valuation Date. Voting members of the Valuation Committee include the Fund's Treasurer or designee and a Vice President of the investment manager or designee. An Assistant Vice President of the Fund with legal expertise or designee is also included on the Valuation Committee as a non-voting advisory member. In addition, the Fund’s Chief Compliance Officer shall designate a member of the compliance group to attend Valuation Committee meetings as a non-voting resource, to monitor for and provide guidance with respect to compliance with these procedures. Two members of the Valuation Committee or their designees, representing different departments, shall constitute a quorum for purposes of permitting the Valuation Committee to take action. The Valuation Committee will consider all relevant factors in determining an investment’s fair value, and may seek the advice of the Fund’s sub-
| 16 |
| The Hartford Emerging Markets Research Fund |
| Notes to Financial Statements – (continued) |
| October 31, 2014 |
| (000’s Omitted) |
adviser, knowledgeable brokers, and legal counsel in making such determination. The Valuation Committee reports to the Audit Committee of the Company's Board of Directors. The Audit Committee receives quarterly written reports which include details of all fair-valued investments, including the reason for the fair valuation, and an indication, when possible, of the accuracy of the valuation by disclosing the next available reliable public price quotation or the disposition price of such investments (the “look-back” test). The Board of Directors then must consider for ratification all of the fair value determinations made during the previous quarter.
Valuation levels are not necessarily indicative of the risk associated with investing in such investments. Individual investments within any of the above mentioned asset classes may be assigned a different hierarchical level than those presented above, as individual circumstances dictate.
For additional information, refer to the Investment Valuation Hierarchy Level Summary and the Level 3 roll-forward reconciliation, if applicable, which follow the Schedule of Investments.
Investment Transactions and Investment Income – Investment transactions are recorded as of the trade date (the date the order to buy or sell is executed) for financial reporting purposes. Investments purchased or sold on a when-issued or delayed-delivery basis may be settled a month or more after the trade date. Realized gains and losses are determined on the basis of identified cost.
Dividend income from domestic securities is accrued on the ex-dividend date. In general, dividend income from foreign securities is recorded on the ex-date; however, dividend notifications in certain foreign jurisdictions may not be available in a timely manner and as a result, the Fund will record the dividend as soon as the relevant details (i.e., rate per share, payment date, shareholders of record, etc.) are publicly available. Interest income, including amortization of premium, accretion of discounts and additional principal received in-kind in lieu of cash, is accrued on a daily basis.
Taxes – The Fund may be subject to taxes imposed on realized gains on securities of certain foreign countries in which the Fund invests. The amount of foreign tax expense is included on the accompanying Statement of Operations as a reduction to net realized gain on investments in these securities.
Foreign Currency Transactions – Assets and liabilities denominated in currencies other than U.S. dollars are translated into U.S. dollars at the exchange rates in effect on the valuation date. Purchases and sales of investments, income and expenses are translated into U.S. dollars at the exchange rates on the dates of such transactions.
The Fund does not isolate that portion of portfolio investment valuation resulting from fluctuations in the foreign currency exchange rates from the fluctuations arising from changes in the market prices of investments held. Exchange rate fluctuations are included with the net realized and unrealized gain or loss on investments in the accompanying financial statements.
Net realized foreign exchange gains or losses arise from sales of foreign currencies and the difference between asset and liability amounts initially stated in foreign currencies and the U.S. dollar value of the amounts actually received or paid. Net unrealized foreign exchange gains or losses arise from changes in the value of other assets and liabilities at the end of the reporting period, resulting from changes in the exchange rates.
Joint Trading Account – The Fund may invest cash balances into a joint trading account that may be invested in one or more repurchase agreements.
Fund Share Valuation and Dividend Distributions to Shareholders – Orders for the Fund’s shares are executed in accordance with the investment instructions of the shareholders. The NAV of the Fund’s shares is determined as of the close of business on each business day of the Exchange. The NAV is determined separately for each class of shares of the Fund by dividing the Fund’s net assets attributable to that class by the number of shares of the class outstanding. Each class of shares offered by the Fund has equal rights as to assets and voting privileges (except that shareholders of a class have exclusive voting rights regarding any matter relating solely to that class of shares). Income and non-class specific expenses are allocated daily to each class on the basis of the relative net assets of the class. Realized and unrealized gains and losses are allocated daily based on the relative net assets of each class of shares of the Fund.
| 17 |
| The Hartford Emerging Markets Research Fund |
| Notes to Financial Statements – (continued) |
| October 31, 2014 |
| (000’s Omitted) |
Orders for the purchase of the Fund’s shares received prior to the close of the Exchange on any day the Exchange is open for business are priced at the NAV determined as of the close of the Exchange. Orders received after the close of the Exchange, or on a day on which the Exchange and/or the Fund is not open for business, are priced at the next determined NAV.
Dividends are declared pursuant to a policy adopted by the Company's Board of Directors based upon the investment performance of the Fund. The policy of the Fund is to pay dividends from net investment income and realized gains, if any, at least once a year.
Net investment income, dividends and distributions from net realized gains and capital are determined in accordance with federal income tax regulations, which may differ from U.S. GAAP with respect to character and timing (see Federal Income Taxes: Distributions and Components of Distributable Earnings and Reclassification of Capital Accounts).
Securities and Other Investments:
Repurchase Agreements – A repurchase agreement is an agreement by which a counterparty agrees to sell an investment and agrees to repurchase the investment sold from the buyer at a mutually agreed upon time and price. During the period of the repurchase agreement, the counterparty will deposit cash and or securities in a third party custodial account to serve as collateral. At the time the Fund enters into a repurchase agreement, the value of the underlying collateral, including accrued interest, will be equal to or exceed the value of the repurchase agreement. Repurchase agreements expose the Fund to counterparty risk - that is, the risk that the counterparty will not fulfill its obligations. To minimize counterparty risk, the investments that serve to collateralize the repurchase agreement are held by the Fund’s custodian in book entry or physical form in the custodial account of the Fund or in a third party custodial account. Repurchase agreements are valued at cost plus accrued interest, which approximates fair value. Repurchase agreements have master netting arrangements which allow the Fund to offset amounts owed to a counterparty with amounts owed by the counterparty, including any collateral. Upon an event of default under a master repurchase agreement, the non-defaulting party may close out all transactions traded under such agreement and net amounts owed under each transaction to one net amount payable by one party to the other. Absent an event of default, the master repurchase agreement does not result in an offset of reported amounts of assets and liabilities in the Statement of Assets and Liabilities across transactions between the Fund and the applicable counterparty. The Fund, as shown on the Schedule of Investments, had outstanding repurchase agreements and related collateral as of October 31, 2014.
Illiquid and Restricted Investments – The Fund is permitted to invest up to 15% of its net assets in illiquid investments. Illiquid investments are those that may not be sold or disposed of in the ordinary course of business within seven days, at approximately the price used to determine the Fund’s NAV. The Fund may not be able to sell illiquid investments when its sub-adviser considers it desirable to do so or may have to sell such investments at a price that is lower than the price that could be obtained if the investments were more liquid. A sale of illiquid investments may require more time and may result in higher dealer discounts and other selling expenses than does the sale of those that are liquid. Illiquid investments also may be more difficult to value due to the unavailability of reliable market quotations for such investments, and an investment in them may have an adverse impact on the Fund’s NAV. The Fund may also purchase certain restricted investments that can only be resold to certain qualified investors and may be determined to be liquid pursuant to policies and guidelines established by the Company's Board of Directors. The Fund, as shown on the Schedule of Investments, had illiquid or restricted investments as of October 31, 2014.
Investments Purchased on a When-Issued or Delayed-Delivery Basis – Delivery and payment for investments that have been purchased by the Fund on a forward commitment, or when-issued or delayed-delivery basis, take place beyond the customary settlement period. The Fund may dispose of or renegotiate a delayed-delivery transaction after it is entered into, and may sell delayed-delivery investments before they are delivered, which may result in a realized gain or loss. During this period, such investments are subject to market fluctuations, and the Fund identifies investments segregated in its records with a value at least equal to the amount of the commitment. The Fund had no when-issued or delayed-delivery investments as of October 31, 2014.
| 18 |
| The Hartford Emerging Markets Research Fund |
| Notes to Financial Statements – (continued) |
| October 31, 2014 |
| (000’s Omitted) |
Financial Derivative Instruments:
The following disclosures contain information on how and why the Fund uses derivative instruments, the credit-risk-related contingent features in certain derivative instruments and how derivative instruments affect the Fund’s financial position and results of operations. The location and fair value amounts of these instruments on the Statement of Assets and Liabilities and the realized gains and losses and changes in unrealized gains and losses on the Statement of Operations, each categorized by type of derivative contract, are included in the following Additional Derivative Instrument Information footnote. The derivative instruments outstanding as of year-end are disclosed in the notes to the Schedule of Investments, if applicable. The amounts of realized gains and losses and changes in unrealized gains and losses on derivative instruments during the year are disclosed in the Statement of Operations.
Foreign Currency Contracts – The Fund may enter into foreign currency contracts that obligate the Fund to purchase or sell currencies at specified future dates. Foreign currency contracts are used to hedge the currency exposure associated with some or all of the Fund’s investments and/or as part of an investment strategy. Foreign currency contracts are marked to market daily and the change in value is recorded by the Fund as an unrealized gain or loss. The Fund will record a realized gain or loss when the foreign currency contract is settled.
Foreign currency contracts involve elements of market risk in excess of the amounts reflected in the Statement of Assets and Liabilities. In addition, risks may arise upon entering into these contracts from the potential inability of the counterparties to meet the terms of the contracts and from unanticipated movements in the value of the foreign currencies relative to the U.S. dollar. The Fund, as shown on the Schedule of Investments, had outstanding foreign currency contracts as of October 31, 2014.
Additional Derivative Instrument Information:
| Fair Value of Derivative Instruments on the Statement of Assets and Liabilities as of October 31, 2014: | ||||||||||||||||||||||||||||
| Risk Exposure Category | ||||||||||||||||||||||||||||
| Interest
Rate Contracts | Foreign Exchange Contracts | Credit Contracts | Equity Contracts | Commodity Contracts | Other Contracts | Total | ||||||||||||||||||||||
| Assets: | ||||||||||||||||||||||||||||
| Unrealized appreciation on foreign currency contracts | $ | — | $ | 2 | $ | — | $ | — | $ | — | $ | — | $ | 2 | ||||||||||||||
| Total | $ | — | $ | 2 | $ | — | $ | — | $ | — | $ | — | $ | 2 | ||||||||||||||
| Liabilities: | ||||||||||||||||||||||||||||
| Unrealized depreciation on foreign currency contracts | $ | — | $ | — | $ | — | $ | — | $ | — | $ | — | $ | — | ||||||||||||||
| Total | $ | — | $ | — | $ | — | $ | — | $ | — | $ | — | $ | — | ||||||||||||||
The volume of derivatives that is presented in the Schedule of Investments is consistent with the derivative activity during the year ended October 31, 2014.
| The Effect of Derivative Instruments on the Statement of Operations for the year ended October 31, 2014: | ||||||||||||||||||||||||||||
| Risk Exposure Category | ||||||||||||||||||||||||||||
| Interest
Rate Contracts | Foreign
Exchange Contracts | Credit
Contracts | Equity
Contracts | Commodity
Contracts | Other
Contracts | Total | ||||||||||||||||||||||
| Realized Loss on Derivatives Recognized as a Result of Operations: | ||||||||||||||||||||||||||||
| Net realized loss on foreign currency contracts | $ | — | $ | (297 | ) | $ | — | $ | — | $ | — | $ | — | $ | (297 | ) | ||||||||||||
| Total | $ | — | $ | (297 | ) | $ | — | $ | — | $ | — | $ | — | $ | (297 | ) | ||||||||||||
| Net Change in Unrealized Appreciation (Depreciation) on Derivatives Recognized as a Result of Operations: | ||||||||||||||||||||||||||||
| Net change in unrealized appreciation of foreign currency contracts | $ | — | $ | 5 | $ | — | $ | — | $ | — | $ | — | $ | 5 | ||||||||||||||
| Total | $ | — | $ | 5 | $ | — | $ | — | $ | — | $ | — | $ | 5 | ||||||||||||||
| 19 |
| The Hartford Emerging Markets Research Fund |
| Notes to Financial Statements – (continued) |
| October 31, 2014 |
| (000’s Omitted) |
The derivatives held by the Fund as of October 31, 2014 are not subject to a master netting arrangement; therefore, no balance sheet offsetting disclosure is presented.
Principal Risks:
The Fund may be exposed to counterparty risk, or the risk that an institution or other entity with which the Fund has unsettled or open transactions will default.
The Fund’s investments expose the Fund to various risks including, but not limited to, interest rate, prepayment, extension, foreign currency and equity risks. Interest rate risk is the risk that fixed income securities will decline in value because of changes in interest rates. As nominal interest rates rise, the values of certain fixed income securities held by the Fund are likely to decrease. A nominal interest rate can be described as the sum of a real interest rate and an expected inflation rate. Fixed income securities with longer durations tend to be more sensitive to changes in interest rates, usually making them more volatile than securities with shorter durations. Duration is useful primarily as a measure of the sensitivity of a fixed income security’s market price to interest rate (i.e., yield) movements. Rising interest rates may cause prepayments to occur at a slower than expected rate, thereby effectively lengthening the maturity of the security and making the security more sensitive to interest rate changes. Prepayment and extension risk are major risks of mortgage backed securities and certain asset backed securities. For certain asset backed securities, the actual maturity may be less than the stated maturity shown in the Schedule of Investments, if applicable. As a result, the timing of income recognition relating to these securities may vary based upon the actual maturity.
If the Fund invests directly in foreign currencies or in securities that trade in, and receive revenues in, foreign currencies, or in derivatives that provide exposure to foreign currencies, it will be subject to the risk that those currencies will decline in value relative to the base currency (U.S. dollars) of the Fund, or, in the case of hedging positions, that the Fund’s base currency will decline in value relative to the currency being hedged. Currency rates in foreign countries may fluctuate significantly over short periods of time for a number of reasons, including changes in interest rates, intervention (or the failure to intervene) by U.S. or foreign governments, central banks or supranational entities, such as the International Monetary Fund, or by the imposition of currency controls or other political developments in the United States or abroad. As a result, the Fund’s investments in foreign currency denominated securities may reduce the returns of the Fund. The market values of equity securities, such as common stocks and preferred stocks, or equity related investments, such as futures and options, may decline due to general market conditions which are not specifically related to a particular company, such as real or perceived adverse economic conditions, changes in the general outlook for corporate earnings, changes in interest or currency rates or adverse investor sentiment generally. The market value of equity securities may also decline due to factors which affect a particular industry or industries, such as labor shortages or increased production costs and competitive conditions within an industry. Equity securities and equity related investments generally have greater market price volatility than fixed income securities.
Federal Income Taxes:
Federal Income Taxes – For federal income tax purposes, the Fund intends to continue to qualify as a Regulated Investment Company ("RIC") under Subchapter M of the Internal Revenue Code (“IRC”) by distributing substantially all of its taxable net investment income and net realized capital gains to its shareholders and otherwise complying with the requirements of the IRC. The Fund has distributed substantially all of its income and capital gains in prior years, if applicable, and intends to distribute substantially all of its income and capital gains during the calendar year ending December 31, 2014. Accordingly, no provision for federal income or excise taxes has been made in the accompanying financial statements. Distributions from short-term capital gains are treated as ordinary income distributions for federal income tax purposes.
Net Investment Income (Loss), Net Realized Gains (Losses) and Distributions – Net investment income (loss) and net realized gains (losses) may differ for financial statement and tax purposes primarily because of losses deferred due to wash sale adjustments, foreign currency gains and losses, adjustments related to Passive Foreign Investment Companies ("PFICs"), Real Estate Investment Trusts ("REITs"), RICs, certain derivatives and partnerships. The character of distributions made during the year from net investment income or net realized gains may differ from their ultimate characterization for federal income tax purposes. Also, due to the timing of dividend distributions, the fiscal year in which amounts are distributed may differ from the year that the income or realized gains (losses) were recorded by the Fund.
| 20 |
| The Hartford Emerging Markets Research Fund |
| Notes to Financial Statements – (continued) |
| October 31, 2014 |
| (000’s Omitted) |
Distributions and Components of Distributable Earnings – The tax character of distributions paid by the Fund for the periods indicated is as follows (as adjusted for dividends payable, if applicable):
| For the Year Ended October 31, 2014 | For the Year Ended October 31, 2013 | |||||||
| Ordinary Income | $ | 2,739 | $ | 1,820 | ||||
| Long-Term Capital Gains ‡ | 1,757 | — | ||||||
| ‡ | The Fund designates these distributions as long-term capital gain dividends pursuant to IRC Sec. 852(b)(3)(C). |
As of October 31, 2014, the Fund’s components of distributable earnings (deficit) on a tax basis are as follows:
| Amount | ||||
| Undistributed Ordinary Income | $ | 8,226 | ||
| Undistributed Long-Term Capital Gain | 8,119 | |||
| Unrealized Appreciation* | 11,464 | |||
| Total Accumulated Earnings | $ | 27,809 | ||
| * | Differences between book-basis and tax-basis unrealized appreciation (depreciation) may be attributable to the losses deferred due to wash sale adjustments, foreign currency gains and losses, adjustments related to PFICs, REITs, RICs, certain derivatives and partnerships. |
Reclassification of Capital Accounts – The Fund may record reclassifications in its capital accounts. These reclassifications have no impact on the total net assets of the Fund. The reclassifications are a result of permanent differences between U.S. GAAP and tax accounting for such items as foreign currency, PFICs, expiration or utilization of capital loss carryforwards or net operating losses. Adjustments are made to reflect the impact these items have on current and future distributions to shareholders. Therefore, the source of the Fund’s distributions may be shown in the accompanying Statement of Changes in Net Assets as from undistributed net investment income, from accumulated net realized gains on investments or from capital depending on the type of book and tax differences that exist. For the year ended October 31, 2014, the Fund recorded reclassifications to increase (decrease) the accounts listed below:
| Amount | ||||
| Undistributed Net Investment Income (Loss) | $ | (454 | ) | |
| Accumulated Net Realized Gain (Loss) | 454 | |||
Capital Loss Carryforward – On December 22, 2010, the Regulated Investment Company Modernization Act of 2010 (the “Act”) was enacted, which made changes to the capital loss carryforward rules. The changes are effective for taxable years beginning after the date of enactment. Under the Act, funds are permitted to carry forward capital losses for an unlimited period. Additionally, capital loss carryforwards retain their character as either short-term or long-term capital losses rather than being considered all short-term as permitted under prior regulation.
The Fund had no capital loss carryforward for U.S. federal income tax purposes as of October 31, 2014.
Accounting for Uncertainty in Income Taxes – The Fund has adopted financial reporting rules that require the Fund to analyze all open tax years, as defined by the statute of limitations, for all major jurisdictions. Generally, tax authorities can examine all tax returns filed for the last three years. The Fund does not have an examination in progress.
The Fund has reviewed all open tax years and major jurisdictions and concluded that these financial reporting rules had no effect on the Fund’s financial position or results of operations. There is no tax liability resulting from unrecognized tax benefits relating to uncertain income tax positions taken or expected to be taken on the tax return for the fiscal year ended October 31, 2014. The Fund is also not aware of any tax positions for which it is reasonably possible that the total amounts of unrecognized tax benefits will significantly change in the next twelve months.
| 21 |
| The Hartford Emerging Markets Research Fund |
| Notes to Financial Statements – (continued) |
| October 31, 2014 |
| (000’s Omitted) |
Expenses:
Investment Management Agreement – Hartford Funds Management Company, LLC ("HFMC") serves as the Fund’s investment manager pursuant to an Investment Management Agreement with the Company. HFMC is an indirect wholly owned subsidiary of The Hartford Financial Services Group, Inc. ("The Hartford"). The investment manager has overall investment supervisory responsibility for the Fund. In addition, the investment manager provides administrative personnel, services, equipment, facilities and office space for proper operation of the Fund. HFMC has contracted with Wellington Management Company, LLP ("Wellington Management") under a sub-advisory agreement for the provision of day-to-day investment management services to the Fund in accordance with the Fund’s investment objective and policies. The Fund pays a fee to the investment manager, a portion of which may be used to compensate Wellington Management.
The schedule below reflects the rates of compensation paid to the investment manager for investment management services rendered as of October 31, 2014; the rates are accrued daily and paid monthly:
| Average Daily Net Assets | Annual Fee |
| On first $250 million | 1.2000% |
| On next $250 million | 1.1500% |
| On next $500 million | 1.1000% |
| On next $4 billion | 1.0750% |
| On next $5 billion | 1.0725% |
| Over $10 billion | 1.0700% |
HFMC contractually agreed to waive investment management fees of 0.10% of average daily net assets until February 28, 2014. These amounts are deducted from expenses and are reported as expense waivers on the accompanying Statement of Operations, as applicable.
Accounting Services Agreement – Pursuant to the Fund Accounting Agreement between HFMC and the Company, on behalf of the Fund, HFMC provides accounting services to the Fund and receives monthly compensation based on the Fund’s average daily net assets at the rates set forth below. The Fund’s accounting services fees are accrued daily and paid monthly.
| Average Daily Net Assets | Annual Fee |
| On first $5 billion | 0.025% |
| On next $5 billion | 0.020% |
| Over $10 billion | 0.015% |
Operating Expenses – Allocable expenses incurred by the Company are allocated to each Fund and allocated to classes within the Fund in proportion to the average daily net assets of the Fund and each class, except where allocation of certain expenses is more fairly made directly to the Fund or to specific classes within a Fund. From March 1, 2014 through October 31, 2014, HFMC contractually limited the total operating expenses of this Fund, exclusive of taxes, interest expense, brokerage commissions, acquired fund fees and expenses and extraordinary expenses, through February 28, 2015 as follows:
| Class A | Class C | Class I | Class R3 | Class R4 | Class R5 | Class Y |
| 1.75% | 2.50% | 1.50% | 1.95% | 1.65% | 1.35% | 1.30% |
From November 1, 2013 through February 28, 2014, the investment manager contractually limited the total operating expenses of the Fund, exclusive of taxes, interest expense, brokerage commissions, acquired fund fees and expenses and extraordinary expense as follows:
| Class A | Class C | Class I | Class R3 | Class R4 | Class R5 | Class Y |
| 1.65% | 2.40% | 1.40% | 1.85% | 1.55% | 1.25% | 1.20% |
| 22 |
| The Hartford Emerging Markets Research Fund |
| Notes to Financial Statements – (continued) |
| October 31, 2014 |
| (000’s Omitted) |
Fees Paid Indirectly – The Fund has entered into agreements with State Street Global Markets, LLC and Russell Implementation Services, Inc. to partially recapture non-discounted trade commissions. Such rebates are used to pay a portion of the Fund's expenses. For the year ended October 31, 2014, this amount, if any, is included in the Statement of Operations.
The ratio of expenses to average net assets in the accompanying financial highlights excludes the reduction in expenses related to fees paid indirectly. The annualized expense ratio after waivers for the period listed below reflecting the reduction for fees paid indirectly is as follows:
| Year Ended October 31, 2014 | ||||
| Class A | 1.72 | % | ||
| Class C | 2.42 | |||
| Class I | 1.29 | |||
| Class R3 | 1.91 | |||
| Class R4 | 1.61 | |||
| Class R5 | 1.31 | |||
| Class Y | 1.26 | |||
Distribution and Service Plan for Class A, C, R3 and R4 Shares – Hartford Funds Distributors, LLC ("HFD"), an indirect wholly owned subsidiary of The Hartford, is the principal underwriter and distributor of the Fund. HFD is engaged in distribution activities, which include marketing and distribution of shares through broker/dealers, financing distribution costs and maintaining financial books and records. For the year ended October 31, 2014, HFD received front-end load sales charges of $62 and contingent deferred sales charges of an amount which rounds to zero from the Fund.
The Fund has adopted a Distribution and Service Plan in accordance with Rule 12b-1 of the 1940 Act to compensate the distributor (HFD) for activities intended to result in the sale and distribution of Class A, C, R3 and R4 shares and for providing services for shareholders. The Rule 12b-1 plan applicable to Class A shares of the Fund provides for payment of a Rule 12b-1 fee of 0.25% of average daily net assets. Some or all of the fee may be used for shareholder servicing expenses with the remainder used for distribution expenses. Under the Class C Plan, the Fund pays the distributor 1.00% of the average daily net assets of Class C shares outstanding, 0.25% of which is intended as a fee for services provided to existing shareholders with the remainder used for distribution expenses. For Class C shares, some or the entire fee may be remitted to broker/dealers for distribution and/or shareholder account services. Class R3 shares have a distribution fee of 0.50% of average daily net assets and Class R4 shares have a distribution fee of 0.25% of average daily net assets. For Class R3 and R4 shares, some or the entire fee may be remitted to broker/dealers for distribution and/or shareholder account services. The Fund’s 12b-1 fees are accrued daily and paid monthly or at such other intervals as the Board of Directors may determine.
Other Related Party Transactions – Certain officers of the Fund are directors and/or officers of HFMC and/or The Hartford or its subsidiaries. For the year ended October 31, 2014, a portion of the Fund’s Chief Compliance Officer’s compensation was paid by all of the investment companies in the Hartford fund complex. The portion allocated to the Fund, as represented in other expenses on the Statement of Operations, rounds to zero. Hartford Administrative Services Company (“HASCO”), an indirect wholly-owned subsidiary of The Hartford, provides transfer agent services to the Fund. HASCO has contractually agreed to reimburse any portion of the transfer agency fees over 0.30% of average daily net assets per fiscal year for each class. Any transfer agency fee reimbursement is determined before considering the contractual operating expense limitation. For providing such services, HASCO is compensated on a per account basis that varies by account type, except with respect to Class Y, for which it is compensated based on average daily net assets. The amount paid to HASCO and any related contractual reimbursement amounts, if applicable, can be found in the Statement of Operations. These fees are accrued daily and paid monthly.
Administrative services fees are paid to HASCO for third-party recordkeeping services that are payable as a percentage of net assets in the amount of up to 0.20%, 0.15% and 0.10% for Classes R3, R4 and R5 shares, respectively. The total administrative services fees are shown on the Statement of Operations. These fees are accrued daily and paid monthly.
| 23 |
| The Hartford Emerging Markets Research Fund |
| Notes to Financial Statements – (continued) |
| October 31, 2014 |
| (000’s Omitted) |
Affiliate Holdings:
As of October 31, 2014, affiliates of The Hartford had ownership of shares in the Fund as follows:
| Percentage of Class | Percentage of Fund | |||||||
| Class C | 44 | % | 1 | % | ||||
| Class I | 61 | 1 | ||||||
| Class R3 | 95 | 1 | ||||||
| Class R4 | 100 | * | 1 | |||||
| Class R5 | 100 | 1 | ||||||
As of October 31, 2014, the Fund's shares were owned in aggregate by affiliated fund of funds. Therefore, the Fund may experience relatively large purchases or redemptions of its shares from these affiliated fund of funds. Affiliated fund of funds owned shares in the Fund as follows:
| Percentage of Fund | ||||
| Class Y | 67 | % | ||
| * | Percentage rounds to 100%. |
Investment Transactions:
For the year ended October 31, 2014, the cost of purchases and proceeds from sales of investment securities (excluding short-term investments) were as follows:
| Excluding U.S. Government Obligations | U.S. Government Obligations | Total | ||||||||||
| Cost of Purchases | $ | 250,621 | $ | — | $ | 250,621 | ||||||
| Sales Proceeds | 305,687 | — | 305,687 | |||||||||
| 24 |
| The Hartford Emerging Markets Research Fund |
| Notes to Financial Statements – (continued) |
| October 31, 2014 |
| (000’s Omitted) |
Capital Share Transactions:
The following information is for the year ended October 31, 2014, and the year ended October 31, 2013:
| For the Year Ended October 31, 2014 | For the Year Ended October 31, 2013 | |||||||||||||||||||||||||||||||
| Shares Sold | Shares
Issued for Reinvested Dividends | Shares
Redeemed | Net
Increase (Decrease) of Shares | Shares Sold | Shares
Issued for Reinvested Dividends | Shares
Redeemed | Net
Increase (Decrease) of Shares | |||||||||||||||||||||||||
| Class A | ||||||||||||||||||||||||||||||||
| Shares | 886 | 14 | (578 | ) | 322 | 564 | — | (637 | ) | (73 | ) | |||||||||||||||||||||
| Amount | $ | 8,176 | $ | 123 | $ | (5,103 | ) | $ | 3,196 | $ | 4,910 | $ | 1 | $ | (5,435 | ) | $ | (524 | ) | |||||||||||||
| Class C | ||||||||||||||||||||||||||||||||
| Shares | 83 | 3 | (94 | ) | (8 | ) | 89 | — | (40 | ) | 49 | |||||||||||||||||||||
| Amount | $ | 743 | $ | 25 | $ | (778 | ) | $ | (10 | ) | $ | 779 | $ | — | $ | (334 | ) | $ | 445 | |||||||||||||
| Class I | ||||||||||||||||||||||||||||||||
| Shares | 158 | 5 | (78 | ) | 85 | 35 | 2 | (21 | ) | 16 | ||||||||||||||||||||||
| Amount | $ | 1,413 | $ | 42 | $ | (687 | ) | $ | 768 | $ | 311 | $ | 17 | $ | (176 | ) | $ | 152 | ||||||||||||||
| Class R3 | ||||||||||||||||||||||||||||||||
| Shares | 1 | 3 | (1 | ) | 3 | 3 | — | — | 3 | |||||||||||||||||||||||
| Amount | $ | 11 | $ | 22 | $ | (10 | ) | $ | 23 | $ | 27 | $ | 4 | $ | (3 | ) | $ | 28 | ||||||||||||||
| Class R4 | ||||||||||||||||||||||||||||||||
| Shares | — | 3 | — | 3 | — | 1 | — | 1 | ||||||||||||||||||||||||
| Amount | $ | 1 | $ | 26 | $ | — | $ | 27 | $ | — | $ | 9 | $ | — | $ | 9 | ||||||||||||||||
| Class R5 | ||||||||||||||||||||||||||||||||
| Shares | — | 3 | — | 3 | — | 2 | — | 2 | ||||||||||||||||||||||||
| Amount | $ | — | $ | 32 | $ | — | $ | 32 | $ | — | $ | 14 | $ | — | $ | 14 | ||||||||||||||||
| Class Y | ||||||||||||||||||||||||||||||||
| Shares | 4,315 | 481 | (10,770 | ) | (5,974 | ) | 11,941 | 200 | (6,403 | ) | 5,738 | |||||||||||||||||||||
| Amount | $ | 38,496 | $ | 4,225 | $ | (98,744 | ) | $ | (56,023 | ) | $ | 104,218 | $ | 1,775 | $ | (55,590 | ) | $ | 50,403 | |||||||||||||
| Total | ||||||||||||||||||||||||||||||||
| Shares | 5,443 | 512 | (11,521 | ) | (5,566 | ) | 12,632 | 205 | (7,101 | ) | 5,736 | |||||||||||||||||||||
| Amount | $ | 48,840 | $ | 4,495 | $ | (105,322 | ) | $ | (51,987 | ) | $ | 110,245 | $ | 1,820 | $ | (61,538 | ) | $ | 50,527 | |||||||||||||
Line of Credit:
The Fund is one of several Hartford Funds that participate in a $500 million committed revolving line of credit facility. The facility is to be used for temporary or emergency purposes. Under the arrangement, the funds are required to own securities having a market value in excess of 300% of the total bank borrowings. The interest rate on borrowings varies depending on the nature of the loan. The facility also requires a fee to be paid based on the amount of the commitment. This commitment fee is allocated to all the funds participating in the line of credit based on the average net assets of the funds. During the year ended October 31, 2014, the Fund did not have any borrowings under this facility.
Pending Legal Proceedings:
On February 25, 2011, Jennifer L. Kasilag, Louis Mellinger, Judith M. Menendez, Jacqueline M. Robinson, and Linda A. Russell filed a derivative lawsuit against Hartford Investment Financial Services, LLC (“HIFSCO”) (now known as HFD) on behalf of six Hartford retail mutual funds in the United States District Court for the District of New Jersey, alleging that HIFSCO received excessive advisory and distribution fees in violation of its statutory fiduciary duty under Section 36(b) of the 1940 Act when serving as investment manager and principal underwriter, respectively, to the Hartford retail mutual funds. Although this action was purportedly filed on behalf of certain of the Hartford Funds, none of the Hartford Funds is itself a defendant to the suit. HIFSCO moved to dismiss and, in September 2011, the motion was granted in part and denied in part, with leave to amend the complaint. In November 2011, plaintiffs filed an amended complaint on behalf of certain Hartford retail mutual funds, The Hartford Global Health Fund (now known as The Hartford Healthcare Fund), The Hartford Conservative Allocation Fund, The Hartford Growth Opportunities Fund, The Hartford Inflation Plus Fund, The Hartford Advisers Fund (now known as The Hartford Balanced Fund), and The Hartford Capital Appreciation Fund. Plaintiffs seek to rescind the investment management agreements and distribution plans between HIFSCO and these funds and to recover the total fees charged thereunder or, in the alternative, to recover any improper compensation HIFSCO received, in addition to lost earnings. HIFSCO filed a partial motion to
| 25 |
| The Hartford Emerging Markets Research Fund |
| Notes to Financial Statements – (continued) |
| October 31, 2014 |
| (000’s Omitted) |
dismiss the amended complaint and, in December 2012, the court dismissed without prejudice the claims regarding distribution fees and denied the motion with respect to the advisory fees claims. HIFSCO disputes the allegations and intends to defend vigorously.
In March 2014, the plaintiffs filed a new complaint that added as new plaintiffs The Hartford Floating Rate Fund and The Hartford Small Company Fund and named as a defendant HFMC, which assumed the role as investment manager to the funds as of January 2013. HFMC and HIFSCO dispute the allegations and intend to defend vigorously.
No accrual for litigation relating to this matter has been recorded in the financial statements of the Fund because the Fund is not party to the suit.
Indemnifications:
Under the Company's organizational documents, the Company shall indemnify its officers and directors to the full extent required or permitted under Maryland General Corporation Law and the federal securities laws. In addition, the Company, on behalf of the Fund, may enter into contracts that contain a variety of indemnifications. The Company's maximum exposure under these arrangements is unknown. However, as of the date of these financial statements, the Company has not had prior claims or losses pursuant to these contracts and expects the risk of loss to be remote.
Subsequent Event:
Effective December 1, 2014, pursuant to a sub-transfer agency agreement between HASCO and Boston Financial Data Services, Inc. (“BFDS”), HASCO has delegated certain transfer agent, dividend disbursing agent and shareholder servicing agent functions to BFDS. The costs and expenses of such delegation are borne by HASCO, not by the Fund.
| 26 |
| The Hartford Emerging Markets Research Fund |
| Financial Highlights |
| - Selected Per-Share Data - (A) | - Ratios and Supplemental Data - | |||||||||||||||||||||||||||||||||||||||||||||||||||
| Class | Net
Asset Value at Beginning of Period | Net
Investment Income (Loss) | Net
Realized and Unrealized Gain (Loss) on Invest- ments | Total
from Investment Operations | Dividends from Net Investment Income | Distribu-
tions from Realized Capital Gains | Total
Dividends and Distributions | Net Asset Value at End of Period | Total Return(B) | Net Assets at End of Period (000's) | Ratio of
Expenses to Average Net Assets Before Adjust- ments(C) | Ratio
of Expenses to Average Net Assets After Adjust- ments(C) | Ratio
of Net Investment Income (Loss) to Average Net Assets | |||||||||||||||||||||||||||||||||||||||
| For the Year Ended October 31, 2014 | ||||||||||||||||||||||||||||||||||||||||||||||||||||
| A | $ | 9.16 | $ | 0.06 | $ | – | $ | 0.06 | $ | (0.05 | ) | $ | (0.08 | ) | $ | (0.13 | ) | $ | 9.09 | 0.70 | % | $ | 11,009 | 1.86 | % | 1.72 | % | 0.64 | % | |||||||||||||||||||||||
| C | 9.01 | (0.01 | ) | – | (0.01 | ) | – | (0.08 | ) | (0.08 | ) | 8.92 | (0.06 | ) | 2,617 | 2.50 | 2.42 | (0.12 | ) | |||||||||||||||||||||||||||||||||
| I | 9.15 | 0.10 | – | 0.10 | (0.08 | ) | (0.08 | ) | (0.16 | ) | 9.09 | 1.14 | 3,045 | 1.37 | 1.29 | 1.08 | ||||||||||||||||||||||||||||||||||||
| R3 | 9.09 | 0.04 | (0.01 | ) | 0.03 | (0.02 | ) | (0.08 | ) | (0.10 | ) | 9.02 | 0.42 | 1,927 | 2.05 | 1.92 | 0.45 | |||||||||||||||||||||||||||||||||||
| R4 | 9.13 | 0.07 | (0.01 | ) | 0.06 | (0.05 | ) | (0.08 | ) | (0.13 | ) | 9.06 | 0.71 | 1,850 | 1.75 | 1.62 | 0.76 | |||||||||||||||||||||||||||||||||||
| R5 | 9.15 | 0.10 | – | 0.10 | (0.08 | ) | (0.08 | ) | (0.16 | ) | 9.09 | 1.11 | 1,868 | 1.45 | 1.32 | 1.06 | ||||||||||||||||||||||||||||||||||||
| Y | 9.15 | 0.10 | (0.01 | ) | 0.09 | (0.08 | ) | (0.08 | ) | (0.16 | ) | 9.08 | 1.05 | 180,595 | 1.34 | 1.26 | 1.08 | |||||||||||||||||||||||||||||||||||
| For the Year Ended October 31, 2013 | ||||||||||||||||||||||||||||||||||||||||||||||||||||
| A | $ | 8.43 | $ | 0.06 | $ | 0.67 | $ | 0.73 | $ | – | $ | – | $ | – | $ | 9.16 | 8.69 | % | $ | 8,141 | 1.83 | % | 1.65 | % | 0.68 | % | ||||||||||||||||||||||||||
| C | 8.34 | 0.01 | 0.66 | 0.67 | – | – | – | 9.01 | 8.03 | 2,712 | 2.43 | 2.29 | 0.06 | |||||||||||||||||||||||||||||||||||||||
| I | 8.45 | 0.10 | 0.67 | 0.77 | (0.07 | ) | – | (0.07 | ) | 9.15 | 9.14 | 2,290 | 1.35 | 1.21 | 1.11 | |||||||||||||||||||||||||||||||||||||
| R3 | 8.39 | 0.04 | 0.68 | 0.72 | (0.02 | ) | – | (0.02 | ) | 9.09 | 8.59 | 1,918 | 2.04 | 1.85 | 0.47 | |||||||||||||||||||||||||||||||||||||
| R4 | 8.43 | 0.07 | 0.67 | 0.74 | (0.04 | ) | – | (0.04 | ) | 9.13 | 8.84 | 1,835 | 1.74 | 1.55 | 0.76 | |||||||||||||||||||||||||||||||||||||
| R5 | 8.45 | 0.09 | 0.68 | 0.77 | (0.07 | ) | – | (0.07 | ) | 9.15 | 9.13 | 1,848 | 1.44 | 1.25 | 1.06 | |||||||||||||||||||||||||||||||||||||
| Y | 8.46 | 0.11 | 0.67 | 0.78 | (0.09 | ) | – | (0.09 | ) | 9.15 | 9.28 | 236,487 | 1.34 | 1.20 | 1.25 | |||||||||||||||||||||||||||||||||||||
| For the Year Ended October 31, 2012 | ||||||||||||||||||||||||||||||||||||||||||||||||||||
| A | $ | 8.22 | $ | 0.09 | $ | 0.12 | $ | 0.21 | $ | – | $ | – | $ | – | $ | 8.43 | 2.59 | % | $ | 8,104 | 2.05 | % | 1.58 | % | 1.09 | % | ||||||||||||||||||||||||||
| C | 8.20 | 0.02 | 0.12 | 0.14 | – | – | – | 8.34 | 1.71 | 2,102 | 2.78 | 2.31 | 0.30 | |||||||||||||||||||||||||||||||||||||||
| I | 8.23 | 0.11 | 0.13 | 0.24 | (0.02 | ) | – | (0.02 | ) | 8.45 | 2.88 | 1,975 | 1.73 | 1.26 | 1.37 | |||||||||||||||||||||||||||||||||||||
| R3 | 8.21 | 0.06 | 0.12 | 0.18 | – | – | – | 8.39 | 2.19 | 1,747 | 2.42 | 1.85 | 0.75 | |||||||||||||||||||||||||||||||||||||||
| R4 | 8.22 | 0.09 | 0.12 | 0.21 | – | – | – | 8.43 | 2.55 | 1,686 | 2.12 | 1.55 | 1.05 | |||||||||||||||||||||||||||||||||||||||
| R5 | 8.23 | 0.11 | 0.12 | 0.23 | (0.01 | ) | – | (0.01 | ) | 8.45 | 2.85 | 1,693 | 1.82 | 1.25 | 1.35 | |||||||||||||||||||||||||||||||||||||
| Y | 8.23 | 0.16 | 0.09 | 0.25 | (0.02 | ) | – | (0.02 | ) | 8.46 | 3.01 | 170,292 | 1.38 | 0.91 | 1.97 | |||||||||||||||||||||||||||||||||||||
| From May 31, 2011 (commencement of operations), through October 31, 2011 (D) | ||||||||||||||||||||||||||||||||||||||||||||||||||||
| A(E) | $ | 10.00 | $ | (0.01 | ) | $ | (1.77 | ) | $ | (1.78 | ) | $ | – | $ | – | $ | – | $ | 8.22 | (17.80 | )%(F) | $ | 5,931 | 1.97 | %(G) | 1.48 | %(G) | ( 0.19 | )%(G) | |||||||||||||||||||||||
| C(E) | 10.00 | (0.03 | ) | (1.77 | ) | (1.80 | ) | – | – | – | 8.20 | (18.00 | )(F) | 1,909 | 2.71 | (G) | 2.22 | (G) | ( 0.93 | )(G) | ||||||||||||||||||||||||||||||||
| I(E) | 10.00 | – | (1.77 | ) | (1.77 | ) | – | – | – | 8.23 | (17.70 | )(F) | 1,708 | 1.69 | (G) | 1.20 | (G) | 0.06 | (G) | |||||||||||||||||||||||||||||||||
| R3(E) | 10.00 | (0.02 | ) | (1.77 | ) | (1.79 | ) | – | – | – | 8.21 | (17.90 | )(F) | 1,642 | 2.38 | (G) | 1.85 | (G) | ( 0.59 | )(G) | ||||||||||||||||||||||||||||||||
| R4(E) | 10.00 | (0.01 | ) | (1.77 | ) | (1.78 | ) | – | – | – | 8.22 | (17.80 | )(F) | 1,644 | 2.08 | (G) | 1.55 | (G) | ( 0.29 | )(G) | ||||||||||||||||||||||||||||||||
| R5(E) | 10.00 | – | (1.77 | ) | (1.77 | ) | – | – | – | 8.23 | (17.70 | )(F) | 1,646 | 1.78 | (G) | 1.25 | (G) | – | (G) | |||||||||||||||||||||||||||||||||
| Y(E) | 10.00 | – | (1.77 | ) | (1.77 | ) | – | – | – | 8.23 | (17.70 | )(F) | 7,409 | 1.69 | (G) | 1.20 | (G) | 0.05 | (G) | |||||||||||||||||||||||||||||||||
See Portfolio Turnover information on the next page.
| 27 |
| The Hartford Emerging Markets Research Fund |
| Financial Highlights – (continued) |
| (A) | Information presented relates to a share outstanding throughout the indicated period. Net investment income (loss) per share amounts are calculated based on average shares outstanding unless otherwise noted. |
| (B) | Assumes initial investment at net asset value at the beginning of each period, reinvestment of all distributions, the complete redemption of the investment at net asset value at the end of each period and no sales charge. Total return would be reduced if sales charges were taken into account. |
| (C) | Adjustments include waivers and reimbursements, if applicable. Ratios do not include fees paid indirectly (see Expenses in the accompanying Notes to Financial Statements). |
| (D) | Net investment income (loss) per share amounts have been calculated using the SEC method. |
| (E) | Commenced operations on May 31, 2011. |
| (F) | Not annualized. |
| (G) | Annualized. |
| Portfolio Turnover Rate for All Share Classes | ||||
| For the Year Ended October 31, 2014 | 106 | % | ||
| For the Year Ended October 31, 2013 | 112 | |||
| For the Year Ended October 31, 2012 | 128 | |||
| From May 31, 2011 (commencement of operations) through October 31, 2011 | 39 | (A) | ||
| (A) Not annualized. |
| 28 |
Report of Independent Registered Public Accounting Firm
The Board
of Directors and Shareholders of
The Hartford Mutual Funds, Inc.
| We have audited the accompanying statement of assets and liabilities, including the schedule of investments, of The Hartford Emerging Markets Research Fund (one of the portfolios constituting The Hartford Mutual Funds, Inc. (the Funds)) as of October 31, 2014, and the related statement of operations for the year then ended, the statements of changes in net assets for each of the two years in the period then ended, and the financial highlights for the periods indicated therein. These financial statements and financial highlights are the responsibility of the Funds’ management. Our responsibility is to express an opinion on these financial statements and financial highlights based on our audits. |
| We conducted our audits in accordance with the standards of the Public Company Accounting Oversight Board (United States). Those standards require that we plan and perform the audit to obtain reasonable assurance about whether the financial statements and financial highlights are free of material misstatement. We were not engaged to perform an audit of the Funds’ internal control over financial reporting. Our audits included consideration of internal control over financial reporting as a basis for designing audit procedures that are appropriate in the circumstances, but not for the purpose of expressing an opinion on the effectiveness of the Funds’ internal control over financial reporting. Accordingly, we express no such opinion. An audit also includes examining, on a test basis, evidence supporting the amounts and disclosures in the financial statements and financial highlights, assessing the accounting principles used and significant estimates made by management, and evaluating the overall financial statement presentation. Our procedures included confirmation of securities owned as of October 31, 2014, by correspondence with the custodian and brokers or by other appropriate auditing procedures where replies from brokers were not received. We believe that our audits provide a reasonable basis for our opinion. |
| In our opinion, the financial statements and financial highlights referred to above present fairly, in all material respects, the financial position of The Hartford Emerging Markets Research Fund of The Hartford Mutual Funds, Inc. at October 31, 2014, the results of its operations for the year then ended, the changes in its net assets for each of the two years in the period then ended, and the financial highlights for the periods indicated therein, in conformity with U.S. generally accepted accounting principles. |
|
Minneapolis, Minnesota
December 18, 2014
| 29 |
The Hartford Emerging Markets Research Fund
Directors and Officers (Unaudited)
The Board of Directors of the Company (the "Directors") appoints officers who are responsible for the day-to-day operations of the Fund and who execute policies formulated by the Directors. Each Director serves until his or her death, resignation, or retirement or until the next annual meeting of shareholders is held or until his or her successor is elected and qualifies.
Directors and officers who are employed by or who have a financial interest in The Hartford Financial Services Group, Inc. ("The Hartford") are considered “interested” persons of the Fund pursuant to the 1940 Act. Each officer and two of the Company's Directors, as noted in the chart below, are “interested” persons of the Fund. Each Director serves as a director for The Hartford Mutual Funds, Inc., The Hartford Mutual Funds II, Inc., Hartford Series Fund, Inc., and Hartford HLS Series Fund II, Inc., and as a trustee for The Hartford Alternative Strategies Fund, which, as of October 31, 2014, collectively consist of 66 funds. Correspondence may be sent to Directors and officers c/o Hartford Funds, 5 Radnor Corporate Center, Suite 300, 100 Matsonford Road, Radnor, Pennsylvania 19087, except that correspondence to Mr. Annoni, Mr. Dressen and Ms. Quade may be sent to 500 Bielenberg Drive, Suite 500, Woodbury, Minnesota 55125.
The table below sets forth, for each Director and officer, his or her name, year of birth, current position with the Company and date first elected or appointed to The Hartford Mutual Funds, Inc. ("MF") and The Hartford Mutual Funds II, Inc. ("MF2"), principal occupation, and, for Directors, other directorships held. The Fund’s Statement of Additional Information contains further information on the Directors and is available free of charge by calling 1-888-843-7824 or writing to: Hartford Funds, P.O. Box 55022, Boston, MA 02205-5022.
Information on the aggregate remuneration paid to the directors of the Company can be found in the Statement of Operations herein. The Fund pays to The Hartford a portion of the Chief Compliance Officer’s compensation, but does not pay salaries or compensation to any of its other officers or Directors who are employed by The Hartford.
Non-Interested Directors
Hilary E. Ackermann (1956) Director since September 23, 2014
Ms. Ackermann served as Chief Risk Officer at Goldman Sachs Bank USA from October 2008 to November 2011 and serves as a Director of Dynegy, Inc., an independent power company, from October 2012 to present.
Lynn S. Birdsong (1946) Director since 2003, Chairman of the Investment Committee since 2014
Mr. Birdsong is a private investor. Mr. Birdsong currently serves as a Director of the Sovereign High Yield Investment Company (April 2010 to current). Mr. Birdsong currently serves as an Independent Director of Nomura Partners Funds, Inc. (formerly, The Japan Fund) (April 2003 to current). From 2003 to March 2005, Mr. Birdsong was an Independent Director of the Atlantic Whitehall Funds. From 1979 to 2002, Mr. Birdsong was a Managing Director of Zurich Scudder Investments, an investment management firm. During his employment with Scudder, Mr. Birdsong was an Interested Director of The Japan Fund. From January 1981 through December 2013, Mr. Birdsong was a partner in Birdsong Company, an advertising specialty firm.
Robert M. Gavin, Jr. (1940) Director since 2002 (MF) and 1986 (MF2), Chairman of the Board for each since 2004
Dr. Gavin is an educational consultant. Prior to September 1, 2001, he was President of Cranbrook Education Community and prior to July 1996, he was President of Macalester College, St. Paul, Minnesota.
Duane E. Hill (1945) Director since 2001 (MF) and 2002 (MF2), Chairman of the Nominating Committee since 2003
Mr. Hill is a Partner of TSG Ventures L.P., a private equity investment company. Mr. Hill is a former partner of TSG Capital Group, a private equity investment firm that served as sponsor and lead investor in leveraged buyouts of middle market companies.
Sandra S. Jaffee (1941) Director since 2005
Ms. Jaffee is the founder and Chief Executive Officer of a private company, Homeworks Concierge, LLC, which provides residential property management services in Westchester County, New York (January 2012 to present). Ms. Jaffee served as Chairman (2008 to 2009) and Chief Executive Officer of Fortent (formerly Searchspace Group), a leading provider of compliance/regulatory technology to financial institutions from August 2005 to August 2009. From August 2004 to August 2005, Ms. Jaffee served as an Entrepreneur in Residence with Warburg Pincus, a private equity firm. Prior to joining Warburg Pincus, Ms. Jaffee served as Executive Vice President at Citigroup, from September 1995 to July 2004, where she was President and Chief Executive Officer of Citibank’s Global Securities Services (1995 to 2003). Ms. Jaffee currently serves as a member of the Board of Directors of Broadridge Financial Solutions as well as a Trustee of Muhlenberg College.
| 30 |
The Hartford Emerging Markets Reseach Fund
Directors and Officers (Unaudited) – (continued)
William P. Johnston (1944) Director since 2005, Chairman of the Compliance Committee since 2005
In June 2006, Mr. Johnston was appointed as Senior Advisor to The Carlyle Group, a global private equity and other alternative asset investment firm and currently serves as an Operating Executive. In July 2006, Mr. Johnston was elected to the Board of Directors of MultiPlan, Inc. and served as a Director (July 2006 to August 2010). In August 2007, Mr. Johnston was elected to the Board of Directors of LifeCare Holdings, Inc. and served as a Director (August 2007 to June 2013). In February 2008, Mr. Johnston was elected to the Board of Directors of HCR-ManorCare, Inc. In May 2006, Mr. Johnston was elected to the Supervisory Board of Fresenius Medical Care AG & Co. KGaA, after its acquisition of Renal Care Group, Inc. in March 2006. Mr. Johnston joined Renal Care Group in November 2002 as a member of the Board of Directors and served as Chairman of the Board from March 2003 through March 2006. From 2002 through 2013, Mr. Johnston served as a Board member of the Georgia O’Keefe Museum. From September 1987 to December 2002, Mr. Johnston was with Equitable Securities Corporation (and its successors, SunTrust Equitable Securities and SunTrust Robinson Humphrey) serving in various investment banking and managerial positions, including Managing Director and Head of Investment Banking, Chief Executive Officer and Vice Chairman.
Phillip O. Peterson (1944) Director since 2002 (MF) and 2000 (MF2), Chairman of the Audit Committee since 2002
Mr. Peterson is a mutual fund industry consultant. He was a partner of KPMG LLP (an accounting firm) until July 1999. Mr. Peterson joined William Blair Funds in February 2007 as a member of the Board of Trustees. From February 2012 to February 2014, Mr. Peterson served as a Trustee of Symetra Variable Mutual Funds. From January 2004 to April 2005, Mr. Peterson served as Independent President of the Strong Mutual Funds.
Lemma W. Senbet (1946) Director since 2005
Dr. Senbet is the William E. Mayer Chair Professor of Finance and Founding Director, Center for Financial Policy, at the University of Maryland, Robert H. Smith School of Business. He was chair of the Finance Department of the University of Maryland, Robert H. Smith School of Business from 1998 to 2006. Since June 2013, he has been on leave from the University to serve as Executive Director of African Economic Research Consortium which focuses on economic policy research and training. Previously, he was a chaired professor of finance at the University of Wisconsin-Madison. Also, he was a Director of the Fortis Funds from March 2000 to July 2002. Dr. Senbet served as Director of the American Finance Association and President of the Western Finance Association. In 2006, Dr. Senbet was inducted Fellow of Financial Management Association International for his career-long distinguished scholarship and professional service.
Interested Directors and Officers
James E. Davey (1964) Director since 2012, President and Chief Executive Officer since 2010
Mr. Davey serves as Executive Vice President of Hartford Life Insurance Company (“HLIC”) and The Hartford. Additionally, Mr. Davey serves as Chairman of the Board, Manager and Senior Managing Director of Hartford Funds Distributors, LLC (“HFD”). He also currently serves as Director, Chairman of the Board, President and Senior Managing Director of Hartford Administrative Services Company (“HASCO”). Mr. Davey also serves as Manager, Chairman of the Board and Senior Managing Director for Hartford Funds Management Company, LLC (“HFMC”) and Director, Chairman of the Board and Senior Managing Director for Hartford Funds Management Group, Inc. ("HFMG"). Mr. Davey has served in various positions within The Hartford and its subsidiaries in connection with the operation of the Hartford Funds. Mr. Davey joined The Hartford in 2002.
Lowndes A. Smith* (1939) Director since 1996 (MF) and 2002 (MF2)
Mr. Smith served as Vice Chairman of The Hartford from February 1997 to January 2002, as President and Chief Executive Officer of Hartford Life, Inc. from February 1997 to January 2002, and as President and Chief Operating Officer of The Hartford Life Insurance Companies from January 1989 to January 2002. Mr. Smith serves as a Director of White Mountains Insurance Group Ltd. (October 2003 to current); One Beacon Insurance (October 2006 to current); Symetra Financial (August 2007 to current) and is a Managing Director of Whittington Gray Associates (January 2007 to current).
* Mr. Smith resigned as a Director of MF, MF2, Hartford Series Fund, Inc. and Hartford HLS Series Fund II, Inc. and as a Trustee of The Hartford Alternative Strategies Fund effective September 17, 2014.
Other Officers
Mark A. Annoni (1964) Vice President, Controller and Treasurer since 2012
Mr. Annoni currently serves as the Assistant Vice President of HLIC (February 2004 to present) and Senior Vice President of HFMG (December 2013 to present). Mr. Annoni has served in various positions within The Hartford and its subsidiaries in connection with the operation of the Hartford Funds. Mr. Annoni joined The Hartford in 2001.
| 31 |
The Hartford Emerging Markets Reseach Fund
Directors and Officers (Unaudited) – (continued)
Michael R. Dressen (1963) AML Compliance Officer since 2011
Mr. Dressen currently serves as Assistant Vice President of HLIC. He also serves as Chief Compliance Officer and AML Compliance Officer of HASCO and as AML Officer of HFD. Mr. Dressen has served in various positions within The Hartford and its subsidiaries in connection with the operation of the Hartford Funds.
Edward P. Macdonald (1967) Vice President, Secretary and Chief Legal Officer since 2005
Mr. Macdonald currently serves as Assistant Secretary, Executive Vice President and Deputy General Counsel of HFD, HASCO, HFMC and HFMG. He also serves as Vice President of HLIC. Mr. Macdonald has served in various positions within The Hartford and its subsidiaries in connection with the operation of the Hartford Funds. Mr. Macdonald joined The Hartford in 2005.
Joseph G. Melcher (1973) Vice President and Chief Compliance Officer since 2013
Mr. Melcher currently serves as Executive Vice President of HFD, HFMG and HASCO. Mr. Melcher also currently serves as Executive Vice President and Chief Compliance Officer of HFMC. Mr. Melcher has served in various positions within The Hartford and its subsidiaries in connection with the operation of the Hartford Funds since joining The Hartford in 2012. Prior to joining The Hartford, Mr. Melcher worked at Touchstone Investments, a member of the Western & Southern Financial Group, where he held the position of Vice President and Chief Compliance Officer from 2010 through 2012 and Assistant Vice President, Compliance from 2005 to 2010.
Vernon J. Meyer (1964) Vice President since 2006
Mr. Meyer currently serves as Senior Vice President of HLIC. He also currently serves as Managing Director and Chief Investment Officer of HFMC and Managing Director of HFMG. Mr. Meyer has served in various positions within The Hartford and its subsidiaries in connection with the operation of the Hartford Funds. Mr. Meyer joined The Hartford in 2004.
Laura S. Quade (1969) Vice President since 2012
Ms. Quade currently serves as Vice President of HASCO, HFD and HFMG. She is the Head of Operations of HASCO and formerly served as Director, Enterprise Operations of HLIC. Ms. Quade has served in various positions within The Hartford and its subsidiaries in connection with the operation of the Hartford Funds. Ms. Quade joined The Hartford in 2001.
Martin A. Swanson** (1962) Vice President since 2010
Mr. Swanson currently serves as Vice President of HLIC. Mr. Swanson also serves as Managing Director, Chief Marketing Officer and Principal of HFD and Managing Director of HFMG. Mr. Swanson has served in various positions within The Hartford and its subsidiaries in connection with the operation of the Hartford Funds.
** Mr. Swanson resigned as an officer effective November 6, 2014.
HOW TO OBTAIN A COPY OF THE FUND’S PROXY VOTING POLICIES AND VOTING RECORDS (UNAUDITED)
A description of the policies and procedures that the Fund uses to determine how to vote proxies relating to portfolio securities and information about how the Fund voted proxies relating to portfolio securities during the most recent twelve-month period ended June 30 are available (1) without charge, upon request, by calling 888-843-7824 and (2) on the SEC’s website at http://www.sec.gov.
QUARTERLY PORTFOLIO HOLDINGS INFORMATION (UNAUDITED)
The Fund files a complete schedule of portfolio holdings with the SEC for the first and third quarters of each fiscal year on Form N-Q. The Fund’s Forms N-Q are available (1) without charge, upon request, by calling 888-843-7824 and (2) on the SEC’s website at http://www.sec.gov. The Form N-Q may be reviewed and copied at the SEC’s Public Reference Room in Washington, DC. Information on the operation of the Public Reference Room may be obtained by calling 1-800-SEC-0330.
| 32 |
The Hartford Emerging Markets Research Fund
Federal Tax Information (Unaudited)
For the fiscal year ended October 31, 2014, there is no further federal tax information required for this Fund.
| 33 |
The Hartford Emerging Markets Research Fund
Expense Example (Unaudited)
Your Fund's Expenses
As a shareholder of the Fund, you incur two types of costs: (1) transaction costs, including sales charges (loads) on purchase payments, if any, and contingent deferred sales charges (CDSC), if any, and (2) ongoing costs, including investment management fees, distribution and/or service (12b-1) fees, if any, and other fund expenses. This example is intended to help you understand your ongoing costs (in dollars) of investing in the Fund and to compare these costs with the ongoing costs of investing in other mutual funds. The example is based on an investment of $1,000 invested at the beginning of the period and held for the entire period of April 30, 2014 through October 31, 2014.
Actual Expenses
The first set of columns of the table below provides information about actual account values and actual expenses. You may use the information in this column, together with the amount you invested, to estimate the expenses that you paid over the period. Simply divide your account value by $1,000 (for example, an $8,600 account value divided by $1,000 = 8.6), then multiply the result by the number in the line under the heading entitled “Expenses Paid During Period” to estimate the expenses you paid on your account during this period.
Hypothetical Example for Comparison Purposes
The second set of columns of the table below provides information about hypothetical account values and hypothetical expenses based on the Fund's actual expense ratio and an assumed rate of return of 5% per year before expenses, which is not the Fund's actual return. The hypothetical account values and expenses may not be used to estimate the actual ending account balance or expenses you paid for the period. You may use this information to compare the ongoing costs of investing in the Fund and other funds. To do so, compare this 5% hypothetical example with the 5% hypothetical examples that appear in the shareholder reports of the other funds.
Please note that the expenses shown in the table are meant to highlight your ongoing costs only and do not reflect any transactional costs, such as sales charges (loads) and CDSC. Therefore, the second set of columns of the table is useful in comparing ongoing costs only, and will not help you determine the relative total costs of owning different funds. In addition, if these transactional costs were included, your costs would be higher. Expenses are equal to the Fund's annualized expense ratios multiplied by average account value over the period, multiplied by 184/365 (to reflect the one-half year period).
| Actual return | Hypothetical (5% return before expenses) | |||||||||||||||||||||||||||||||
| Beginning Account Value April 30, 2014 | Ending
Account Value October 31, 2014 | Expenses
paid during the period April 30, 2014 through October 31, 2014 | Beginning Account Value April 30, 2014 | Ending
Account Value October 31, 2014 | Expenses
paid during the period April 30, 2014 through October 31, 2014 | Annualized expense ratio | Days
in the current 1/2 year | Days
in the full year | ||||||||||||||||||||||||
| Class A | $ | 1,000.00 | $ | 1,015.20 | $ | 8.89 | $ | 1,000.00 | $ | 1,016.38 | $ | 8.89 | 1.75 | % | 184 | 365 | ||||||||||||||||
| Class C | $ | 1,000.00 | $ | 1,011.30 | $ | 12.51 | $ | 1,000.00 | $ | 1,012.77 | $ | 12.52 | 2.47 | 184 | 365 | |||||||||||||||||
| Class I | $ | 1,000.00 | $ | 1,017.50 | $ | 6.76 | $ | 1,000.00 | $ | 1,018.50 | $ | 6.77 | 1.33 | 184 | 365 | |||||||||||||||||
| Class R3 | $ | 1,000.00 | $ | 1,014.20 | $ | 9.90 | $ | 1,000.00 | $ | 1,015.37 | $ | 9.91 | 1.95 | 184 | 365 | |||||||||||||||||
| Class R4 | $ | 1,000.00 | $ | 1,015.20 | $ | 8.38 | $ | 1,000.00 | $ | 1,016.89 | $ | 8.39 | 1.65 | 184 | 365 | |||||||||||||||||
| Class R5 | $ | 1,000.00 | $ | 1,017.50 | $ | 6.87 | $ | 1,000.00 | $ | 1,018.40 | $ | 6.87 | 1.35 | 184 | 365 | |||||||||||||||||
| Class Y | $ | 1,000.00 | $ | 1,017.50 | $ | 6.61 | $ | 1,000.00 | $ | 1,018.65 | $ | 6.62 | 1.30 | 184 | 365 | |||||||||||||||||
| 34 |
The Hartford Emerging Markets Research Fund
Approval of Investment Management and Investment Sub-Advisory Agreements (Unaudited)
Section 15(c) of the Investment Company Act of 1940, as amended (the “1940 Act”), requires that each mutual fund’s board of directors, including a majority of those directors who are not “interested persons” of the mutual fund, as defined in the 1940 Act (the “Independent Directors”), annually review and consider the continuation of the mutual fund’s investment advisory and sub-advisory agreements. At its meeting held on August 5-6, 2014, the Board of Directors (the “Board”) of The Hartford Mutual Funds, Inc., including each of the Independent Directors, unanimously voted to approve the continuation of the investment management agreement for The Hartford Emerging Markets Research Fund (the “Fund”) with Hartford Funds Management Company, LLC (“HFMC”) and the continuation of the investment sub-advisory agreement between HFMC and the Fund’s sub-adviser, Wellington Management Company, LLP (the “Sub-adviser,” and together with HFMC, the “Advisers”) (collectively, the “Agreements”).
In the months preceding the August 5-6, 2014 meeting, the Board requested, received and reviewed written responses from the Advisers to questions posed to them on behalf of the Independent Directors and supporting materials relating to those questions and responses. The Board considered information furnished to the Board at its meetings throughout the year, as well as information specifically prepared in connection with the annual approval of the Agreements at the Board’s meetings held on June 17-18, 2014 and August 5-6, 2014. Information provided to the Board at its meetings throughout the year included, among other things, reports on Fund performance, legal and compliance matters, sales and marketing activity, shareholder services, and the other services provided to the Fund by the Advisers and their affiliates. The Board also received in-person presentations by Fund officers and representatives of HFMC at the Board’s meetings on June 17-18, 2014 and August 5-6, 2014 concerning the Agreements.
The Independent Directors, advised by independent legal counsel, engaged service providers to assist them with evaluating the Agreements with respect to the Fund. Lipper Inc. (“Lipper”), an independent provider of investment company data, was retained to provide the Board with reports on how the Fund’s contractual management fees, actual management fees, other non-management fees, overall expense ratios and investment performance compared to those of mutual funds with similar investment objectives. The Independent Directors also engaged an independent financial services consultant (the “Consultant”) to assist them in evaluating the Fund’s management fees, sub-advisory fees, other non-management fees, overall expense ratios and investment performance. In addition, the Consultant reviewed the profitability calculations utilized by HFMC in connection with the continuation of the investment management agreement.
In determining whether to continue the Agreements for the Fund, the members of the Board reviewed and evaluated information and factors they believed to be relevant and appropriate in light of the information that the Board deemed necessary and appropriate through the exercise of its reasonable business judgment. While individual members of the Board may have weighed certain factors differently, the Board’s determination to continue the Agreements was based on a comprehensive consideration of all information provided to the Board throughout the year and specifically with respect to the continuation of the Agreements. A more detailed discussion of the factors the Board considered with respect to its approval of the Agreements is provided below.
Nature, Extent and Quality of Services Provided by the Advisers
The Board requested and considered information concerning the nature, extent and quality of the services provided to the Fund by the Advisers. The Board considered, among other things, the terms of the Agreements and the range of services provided by the Advisers. The Board considered the Advisers’ professional personnel who provide services to the Fund, including each Adviser’s ability and experience in attracting and retaining qualified personnel to service the Fund. The Board considered each Adviser’s reputation and overall financial strength, as well as its willingness to consider and implement organizational and operational changes designed to enhance services to the Hartford Funds. In addition, the Board considered the quality of each Adviser’s communications with the Board and responsiveness to Board inquiries and requests made from time to time with respect to the Fund and other Hartford Funds.
The Board also requested and evaluated information concerning each Adviser’s regulatory and compliance environment. In this regard, the Board requested and reviewed information on each Adviser’s compliance policies and procedures, compliance history, and a report from the Fund’s Chief Compliance Officer on each Adviser’s compliance with applicable laws and regulations, including responses to regulatory developments and compliance issues raised by regulators. The Board also noted the Advisers’ support of the Fund’s compliance control structure, particularly the resources devoted by the Advisers in support of the Fund’s obligations pursuant to Rule 38a-1 under the 1940 Act.
With respect to HFMC, the Board noted that, under the Agreements, HFMC is responsible for the management of the Fund, including oversight of fund operations and service providers, and provides administrative and investment advisory services in connection with selecting, monitoring and supervising the Sub-adviser. The Board considered HFMC’s ongoing monitoring of people, process and performance, including its quarterly reviews of each of the Hartford Funds, semi-annual meetings with the leaders of each Fund’s portfolio management team, and oversight of the Hartford Funds’ approximately 66 portfolio managers. The Board recognized that HFMC has demonstrated a record of making changes to the
| 35 |
The Hartford Emerging Markets Research Fund
Approval of Investment Management and Investment Sub-Advisory Agreements (Unaudited) – (continued)
management and/or strategies of the Hartford Funds when warranted. The Board considered HFMC’s oversight of the Sub-adviser’s investment approach and results, process for monitoring best execution of portfolio trades by the Sub-adviser, and approach to risk management with respect to the Fund and the service providers to the Fund. The Board also considered HFMC’s oversight of compliance with the Fund’s objective and policies as well as with applicable laws and regulations, noting that regulatory and other developments had over time led to an increase in the scope of HFMC’s services in this regard.
In addition, the Board considered HFMC’s ongoing commitment to review and rationalize the Hartford Funds product line-up and the expenses that HFMC had incurred in connection with fund combinations in recent years. The Board considered that HFMC or its affiliates are responsible for providing the Fund’s officers.
With respect to the Sub-adviser, which provides certain day-to-day portfolio management services for the Fund, the Board considered the quality of the Fund’s portfolio manager, the Sub-adviser’s other investment personnel, its investment philosophy and process, investment research capabilities and resources, performance record, trade execution capabilities and experience. The Board considered the experience of the Fund’s portfolio manager, the number of accounts managed by the portfolio manager, and the Sub-adviser’s method for compensating the portfolio manager.
Based on these considerations, the Board concluded that it was satisfied with the nature, extent and quality of the services provided to the Fund by HFMC and the Sub-adviser.
Performance of the Fund and the Advisers
The Board considered the investment performance of the Fund. In this regard, the Board reviewed the performance of the Fund over different time periods presented in the materials and evaluated HFMC’s analysis of the Fund’s performance for these time periods. The Board considered information and materials provided to the Board by the Advisers concerning Fund performance, as well as information from Lipper comparing the investment performance of the Fund to an appropriate benchmark and universe of peer funds. The Board noted that the Fund’s performance was in the 1st quintile of its performance universe for the 1-year period. The Board also noted that the Fund’s performance was above its benchmark for the 1-year period.
The Board considered the detailed investment analytics reports provided by Hartford Funds’ Investment Advisory Group throughout the year. These reports include, among other things, information on the Fund’s gross and net returns, the Fund’s investment performance relative to an appropriate benchmark and peer group, various statistics concerning the Fund’s portfolio, and a narrative summary of various factors affecting Fund performance. The Board considered the Advisers’ cooperation with the Investment Committee, which assists the Board in evaluating the performance of the Fund at periodic meetings throughout the year. The Board also considered the analysis provided by the Consultant relating to the Fund’s performance track record.
In light of all the considerations noted above, the Board concluded that it had continued confidence in HFMC’s and the Sub-adviser’s overall capabilities to manage the Fund.
Costs of the Services and Profitability of the Advisers
The Board reviewed information regarding HFMC’s cost to provide investment management and related services to the Fund and HFMC’s profitability, both overall and for the Fund, on a pre-tax basis without regard to distribution expenses. The Board also requested and reviewed information about the profitability to HFMC and its affiliates from all services provided to the Fund and all aspects of their relationship with the Fund. The Board also requested and received information relating to the operations and profitability of the Sub-adviser.
The Board considered the Consultant’s review of the profitability calculations used by HFMC in connection with the continuation of the investment management agreement, noting the Consultant’s view that Hartford Funds’ process for calculating and reporting Fund profitability is reasonable. In this regard, the Board noted that the Consultant performed a full review of this process in light of the recent restructuring of the Hartford Funds business and reported that the approach to analyzing Fund profitability, including the use of common expense allocation methodologies, is reasonable, sound and well within common industry practice.
Based on these considerations, the Board concluded that the profits anticipated to be realized by the Advisers and their affiliates from their relationships with the Fund would not be excessive.
| 36 |
The Hartford Emerging Markets Research Fund
Approval of Investment Management and Investment Sub-Advisory Agreements (Unaudited) – (continued)
Comparison of Fees and Services Provided by the Advisers
The Board considered comparative information with respect to the management fees to be paid by the Fund to HFMC and the total expense ratios of the Fund. The Board also considered comparative information with respect to the sub-advisory fees to be paid by HFMC to the Sub-adviser. In this regard, the Board requested and reviewed information from HFMC and the Sub-adviser relating to the management and sub-advisory fees, including the sub-advisory fee schedule for the Fund, and total operating expenses for the Fund. With respect to the sub-advisory fee schedule, the Board considered representations from HFMC and the Sub-adviser that the Sub-adviser’s fees were negotiated at arm’s length on a fund-by-fund basis. The Board also reviewed information from Lipper comparing the Fund’s contractual management fees, actual management fees and overall expense ratios relative to a group of funds selected by Lipper, in consultation with the Consultant, and a broader universe of funds selected by Lipper. The Board considered that the Fund’s contractual management fee and actual management fee were in the 4th quintile and its total expenses (less 12b-1 and shareholder service fees) were in the 3rd quintile. The Board noted that the Fund has an automatically renewable contractual expense cap on each share class. The expense cap resulted in reimbursement of certain expenses incurred in 2013.
While the Board recognized that comparisons between the Fund and peer funds may be imprecise, given the different service levels and characteristics of mutual funds and the different business models and cost structures of the Advisers, the comparative information provided by Lipper assisted the Board in evaluating the reasonableness of the Fund’s management and sub-advisory fees and total operating expenses. In addition, the Board considered the analysis and recommendations of the Consultant relating to the Fund’s management and sub-advisory fees and total operating expenses.
Based on these considerations, the Board concluded that the Fund’s fees and total operating expenses, in conjunction with the information about quality of services, profitability, economies of scale, and other matters discussed, were reasonable in light of the services provided.
Economies of Scale
The Board requested and considered information regarding the Advisers’ realization of economies of scale with respect to the Fund and whether the fee levels reflect these economies of scale for the benefit of the Fund’s shareholders. The Board reviewed the breakpoints in the management fee schedule for the Fund, which reduce fee rates as Fund assets grow over time. The Board recognized that a fund with assets beyond the highest breakpoint level will continue to benefit from economies of scale because additional assets are charged the lowest breakpoint fee resulting in lower overall effective management fee rates. The Board also considered that expense limitations and fee waivers that reduce the Fund’s expenses at all asset levels can have the same effect as breakpoints in sharing economies of scale with shareholders and provide protection from an increase in expenses if Fund assets decline. The Board recognized that a fee schedule that reaches a lower breakpoint quickly provides shareholders with the benefit of anticipated or potential economies of scale. The Board also considered that HFMC has been active in managing expenses, which has resulted in benefits being realized by shareholders as assets within the Hartford Funds family of funds have grown over time, including through lower transfer agent costs and other operating expenses.
The Board reviewed and evaluated materials from Lipper and the Consultant showing how management fee schedules of peer funds reflect economies of scale for the benefit of shareholders as a peer fund’s assets hypothetically increase over time. Based on information provided by HFMC, Lipper, and the Consultant, the Board recognized that there is no uniform methodology for establishing breakpoints or uniform pattern in asset levels that trigger breakpoints or the amounts of breakpoints triggered.
After considering all of the information available to it, the Board concluded that it was satisfied with the extent to which economies of scale would be shared for the benefit of the Fund’s shareholders based on currently available information and the effective advisory fees and expense ratios for the Fund at its current and reasonably anticipated asset levels. The Board noted, however, that it would continue to monitor future growth in Fund assets and the appropriateness of additional breakpoints.
Other Benefits
The Board considered other benefits to the Advisers and their affiliates from their relationships with the Fund.
The Board noted that HFMC receives fees for fund accounting and related services from the Fund, and the Board considered information on profits to HFMC for such services. The Board also considered that Hartford Administrative Services Company (“HASCO”), the Fund’s transfer agent and an affiliate of HFMC, receives transfer agency compensation from the Fund, and the Board reviewed information on the profitability of
| 37 |
The Hartford Emerging Markets Research Fund
Approval of Investment Management and Investment Sub-Advisory Agreements (Unaudited) – (continued)
the Fund’s transfer agency function to HASCO. The Board considered information provided by HASCO indicating that the transfer agent fees charged by HASCO to the Fund were fair and reasonable based on publicly available information.
The Board also considered that Hartford Funds Distributors, LLC (“HFD”), an affiliate of HFMC, serves as principal underwriter of the Fund. As principal underwriter, HFD receives 12b-1 fees from the Fund and receives all or a portion of the sales charges on sales or redemptions of certain classes of shares. The Board also noted that certain affiliates of HFD distribute shares of the Fund and receive compensation in that connection.
The Board considered benefits to the Sub-adviser from its use of the Fund’s brokerage commissions to obtain soft dollar research, and representations from HFMC and the Sub-adviser that the Sub-adviser would not make any revenue-sharing payments or any other type of distribution payments to HFMC or its affiliates.
The Board considered the benefits to shareholders of being part of the Hartford Funds family of funds, including the right to exchange investments between the same class of funds without a sales charge, the ability to reinvest Fund dividends into other funds in the family, and the ability to combine holdings in the Fund with holdings in other funds to obtain a reduced sales charge. The Board considered HFMC’s efforts to provide investors in the family with a broad range of investment styles and asset classes and its entrepreneurial risk in initiating new funds to expand these opportunities for shareholders.
* * * *
Based upon its review of these various factors, among others, the Board concluded that it is in the best interests of the Fund and its shareholders for the Board to approve the Agreements for an additional year. In reaching this decision, the Board did not assign relative weights to the factors discussed above or deem any one or group of them to be controlling in and of themselves. In connection with their deliberations, the Independent Directors met separately in executive session on several occasions, with independent legal counsel and the Consultant, to review the relevant materials and consider their responsibilities under relevant laws and regulations.
| 38 |
The Hartford Emerging Markets Research Fund
Main Risks (Unaudited)
The main risks of investing in the Fund are described below.
Market, Selection and Strategy Risk: The Fund’s share price may fluctuate due to market risk and/or security selections that may underperform the market or relevant benchmarks. If the sub-adviser's investment strategy does not perform as expected, the Fund could underperform its peers or lose money. There is no guarantee the Fund will achieve its stated objective.
Foreign Investment and Emerging Markets Risk: Investments in foreign securities may be riskier than investments in U.S. securities. Potential risks include the risks of illiquidity, increased price volatility, less government regulation, less extensive and less frequent accounting and other reporting requirements, unfavorable changes in currency exchange rates, and economic and political disruptions. These risks are generally greater for investments in emerging markets.
Small/Mid-Cap Stock Risk: Small- and mid-cap stocks are generally more volatile and risky and may be less liquid than large-cap stocks because they may have limited operating histories, narrow product lines, and focus on niche markets.
Active Trading Risk: Actively trading investments may result in higher costs and higher taxable income.
| 39 |
THIS PRIVACY POLICY IS NOT PART OF THIS REPORT
Privacy Policy and Practices of The Hartford Financial Services Group, Inc. and its Affiliates
(herein called “we, our and us”)
This Privacy Policy applies to our United States Operations
We value your trust. We are committed to the responsible: a) management; b) use; and c) protection; of Personal Information.
This notice describes how we collect, disclose, and protect Personal Information.
We collect Personal Information to: a) service your Transactions with us; and b) support our business functions.
We may obtain Personal Information from: a) You; b) your Transactions with us; and c) third parties such as a consumer-reporting agency.
Based on the type of product or service You apply for or get from us, Personal Information such as: a) your name; b) your address; c) your income; d) your payment; or e) your credit history; may be gathered from sources such as applications, Transactions, and consumer reports.
To serve You and service our business, we may share certain Personal Information. We will share Personal Information, only as allowed by law, with affiliates such as: a) our insurance companies; b) our employee agents; c) our brokerage firms; and d) our administrators.
As allowed by law, we may share Personal Financial Information with our affiliates to: a) market our products; or b) market our services; to You without providing You with an option to prevent these disclosures.
|
We may also share Personal Information, only as allowed by law, with unaffiliated third parties including: a) independent agents; b) brokerage firms; c) insurance companies; d) administrators; and e) service providers; who help us serve You and service our business.
When allowed by law, we may share certain Personal Financial Information with other unaffiliated third parties who assist us by performing services or functions such as: a) taking surveys; b) marketing our products or services; or c) offering financial products or services under a joint agreement between us and one or more financial institutions.
We, and third parties we partner with, may track some of the pages You visit through the use of: a) cookies; b) pixel tagging; or c) other technologies; and currently do not process or comply with any web browser’s “do not track” signal or similar mechanism that indicates a request to disable online tracking of individual users who visit our websites or use our services.
We will not sell or share your Personal Financial Information with anyone for purposes unrelated to our business functions without offering You the opportunity to: a) “opt-out;” or b) “opt-in;” as required by law.
We only disclose Personal Health Information with: a) your proper written authorization; or b) as otherwise allowed or required by law.
Our employees have access to Personal Information in the course of doing their jobs, such as: a) underwriting policies; b) paying claims; c) developing new products; or d) advising customers of our products and services. |
We use manual and electronic security procedures to maintain: a) the confidentiality; and b) the integrity of; Personal Information that we have. We use these procedures to guard against unauthorized access.
Some techniques we use to protect Personal Information include: a) secured files; b) user authentication; c) encryption; d) firewall technology; and e) the use of detection software.
We are responsible for and must: a) identify information to be protected; b) provide an adequate level of protection for that data; c) grant access to protected data only to those people who must use it in the performance of their job-related duties.
Employees who violate our Privacy Policy will be subject to discipline, which may include ending their employment with us.
At the start of our business relationship, we will give You a copy of our current Privacy Policy.
We will also give You a copy of our current Privacy Policy once a year if You maintain a continuing business relationship with us.
We will continue to follow our Privacy Policy regarding Personal Information even when a business relationship no longer exists between us.
|
As used in this Privacy Notice:
Application means your request for our product or service.
Personal Financial Information means financial information such as: a) credit history; b) income; c) financial benefits; or d) policy or claim information.
Personal Health Information means health information such as: a) your medical records; or b) information about your illness, disability or injury.
Personal Information means information that identifies You personally and is not otherwise available to the public. It includes: a) Personal Financial Information; and b) Personal Health Information.
Transaction means your business dealings with us, such as: a) your Application; b) your request for us to pay a claim; and c) your request for us to take an action on your account.
You means an individual who has given us Personal Information in conjunction with: a) asking about; b) applying for; or c) obtaining; a financial product or service from us if the product or service is used mainly for personal, family, or household purposes. |
This Privacy Policy is being provided on behalf of the following affiliates of The Hartford Financial Services Group, Inc.:
1stAGChoice, Inc.; Access CoverageCorp, Inc.; Access CoverageCorp Technologies, Inc.; American Maturity Life Insurance Company; Archway 60 R, LLC; Business Management Group, Inc.; Champlain Life Reinsurance Company; DMS R, LLC; Eloy R, LLC; Ersatz Corporation; First State Insurance Company; Hartford Accident and Indemnity Company; Hartford Administrative Services Company; Hartford Casualty General Agency, Inc.; Hartford Casualty Insurance Company; Hartford-Comprehensive Employee Benefit Service Company; Hartford Equity Sales Company, Inc.; Hartford Fire General Agency, Inc.; Hartford Fire Insurance Company; Hartford Funds Management Company, LLC; Hartford Funds Management Group, Inc.; Hartford HLS Series Fund II, Inc.; Hartford Insurance Company of Illinois; Hartford Insurance Company of the Midwest; Hartford Insurance Company of the Southeast; Hartford Integrated Technologies, Inc.; Hartford International Life Reassurance Corporation; Hartford Funds Distributors, LLC; Hartford Investment Management Company; Hartford Life and Accident Insurance Company; Hartford Life and Annuity Insurance Company; Hartford Life Insurance Company; Hartford Life Private Placement, LLC; Hartford Lloyd’s Corporation; Hartford Lloyd’s Insurance Company; Hartford Mezzanine Investors I, LLC; Hartford Residual Market, L.C.C.; Hartford Retirement Services, LLC; Hartford Securities Distribution Company, Inc.; Hartford Series Fund, Inc.; Hartford Specialty Insurance Services of Texas, LLC; Hartford Strategic Investments, LLC; Hartford Underwriters Insurance Company; Hartford Technology Services Company, L.L.C.; Hartford of Texas General Agency, Inc.; Hartford Underwriters General Agency, Inc.; HARTRE Company, L.C.C.; HL Investment Advisors, LLC; HLA LLC; Horizon Management Group, LLC; HRA Brokerage Services, Inc.; Lanidex Class B, LLC; M-CAP Insurance Agency, LLC; New England Insurance Company; New England Reinsurance Corporation; Nutmeg Insurance Agency, Inc.; Nutmeg Insurance Company; Pacific Insurance Company, Limited; Planco, LLC: Property and Casualty Insurance Company of Hartford; Revere R, LLC; RVR R, LLC; Sentinel Insurance Company, Ltd.; Sunstone R, LLC; Symphony R, LLC; The Evergreen Group Incorporated; The Hartford Alternative Strategies Fund; The Hartford Mutual Funds, Inc.; The Hartford Mutual Funds II, Inc.; Trumbull Flood Management, L.L.C.; Trumbull Insurance Company; Twin City Fire Insurance Company; White River Life Reinsurance Company.
HPP Revised January 2014
HARTFORDFUNDS
hartfordfunds.com
This information is written in connection with the promotion or marketing of the matter(s) addressed in this material.
This report is submitted for the general information of the shareholders of the Fund. It is not authorized for distribution unless preceded or accompanied by a current prospectus for the Fund.
The information cannot be used or relied upon for the purpose of avoiding IRS penalties. These materials are not intended to provide tax, accounting or legal advice. As with all matters of a tax or legal nature, you should consult your own tax or legal counsel for advice.
Investors should carefully consider the investment objectives, risks, charges, and expenses of Hartford Funds before investing. This and other information can be found in the prospectus and summary prospectus, which can be obtained by calling 888-843-7824 (retail) or 800-279-1541 (institutional). Investors should read them carefully before they invest.
Hartford Funds are underwritten and distributed by Hartford Funds Distributors, LLC.
MFAR-EMR14 12/14 113972-3 Printed in U.S.A.
HARTFORDFUNDS
|
THE HARTFORD
EQUITY INCOME FUND
2014 Annual Report |
A MESSAGE FROM THE PRESIDENT
Dear Fellow Shareholders:
Thank you for investing in Hartford Funds.
Market Review
U.S. equities (as represented by the S&P 500 Index) rose steadily for the fiscal year ended October 31, 2014, with a return of 17.27% for the period. With the exception of short-lived geopolitical scares early in 2014 and concerns about continuing global growth near the end of the period, stocks generally rose on solid fundamentals and encouraging macroeconomic data during the year.
September 2014 marked the six-year anniversary of the start of the financial crisis. Within weeks of that anniversary, both the S&P 500 Index and the Dow Jones Industrial Average set new all-time highs, closing at 2,018 and 17,391, respectively, on October 31. Although the fallout of the crisis continues to influence investor behavior, stocks have recovered and risen dramatically, up 198% from their low in March 2009. Meanwhile, the domestic economy is notching strong growth, and the unemployment rate has reached its lowest level since August 2008.
While the U.S. economy appears to have stabilized and to have reverted to a solid growth path, the outlook for the global economy appears to have gotten cloudier. The U.S. Federal Reserve has ended quantitative easing, while Europe and Japan are pursuing stimulus options to avoid a double-dip recession and deflation, respectively. Diverging central-bank policies will likely continue to play an important role in market movements going forward as investors wait to see the reactions to their efforts and their impacts on global markets.
How have market movements impacted your portfolio throughout the last year? Are your investments still on track to provide the growth or income you need, and are you comfortable with their progress during times of volatility?
Your financial professional can help you navigate today’s markets with confidence, as well as assist you to achieve your investment goals by providing advice on the best options within our fund family to help you work toward overcoming today’s investing challenges. Meet with your financial advisor regularly to examine your portfolio and your investment strategy, and to determine if you’re still on track to meet your goals.
Thank you again for investing with Hartford Funds.
James Davey
President
Hartford Funds
1 The S&P 500 Index is a market capitalization-weighted price index composed of 500 widely held common stocks.
2 The Dow Jones Industrial Average is an unmanaged, price-weighted index of 30 of the largest, most widely held stocks traded on the NYSE
The Hartford Equity Income Fund
Table of Contents
The views expressed in the Fund’s Manager Discussion under ‘‘Why did the Fund perform this way?’’ and ‘‘What is the outlook?’’ are views of the Fund’s sub-adviser and portfolio management team through the end of the period and are subject to change based on market and other conditions. The Fund’s Manager Discussion is for informational purposes only and does not represent an offer, recommendation or solicitation to buy, hold or sell any security. The specific securities identified and described, if any, do not represent all of the securities purchased or sold and you should not assume that investments in the securities identified and discussed will be profitable.
The Hartford Equity Income Fund
inception 08/28/2003
(sub-advised by Wellington Management Company, LLP)
| Investment objective – The Fund seeks a high level of current income consistent with growth of capital. |
Performance Overview 10/31/04 - 10/31/14

The chart above represents the hypothetical growth of a $10,000 investment in Class A, which includes a sales charge. Growth results in classes other than Class A will vary from what is seen above due to differences in the expenses charged to those share classes.
Average Annual Total Returns (as of 10/31/14)
| 1 Year | 5 Years | 10 Years | ||||||||||
| Equity Income A# | 12.19 | % | 15.34 | % | 8.86 | % | ||||||
| Equity Income A## | 6.02 | % | 14.04 | % | 8.25 | % | ||||||
| Equity Income B# | 12.15 | % | 14.61 | % | 8.14 | %* | ||||||
| Equity Income B## | 7.15 | % | 14.37 | % | 8.14 | %* | ||||||
| Equity Income C# | 11.36 | % | 14.50 | % | 8.08 | % | ||||||
| Equity Income C## | 10.36 | % | 14.50 | % | 8.08 | % | ||||||
| Equity Income I# | 12.54 | % | 15.63 | % | 9.11 | % | ||||||
| Equity Income R3# | 11.81 | % | 14.96 | % | 8.69 | % | ||||||
| Equity Income R4# | 12.13 | % | 15.30 | % | 8.94 | % | ||||||
| Equity Income R5# | 12.47 | % | 15.69 | % | 9.22 | % | ||||||
| Equity Income Y# | 12.61 | % | 15.79 | % | 9.31 | % | ||||||
| Russell 1000 Value Index | 16.46 | % | 16.49 | % | 7.90 | % | ||||||
| # | Without sales charge |
| ## | With sales charge |
| * | Class B shares convert to Class A shares after 8 years. The return shown reflects the conversion to Class A shares, which had different operating expenses, for the period after conversion. |
PERFORMANCE DATA QUOTED REPRESENTS PAST PERFORMANCE AND DOES NOT GUARANTEE FUTURE RESULTS. The investment return and principal value of the investment will fluctuate so that investors’ shares, when redeemed, may be worth more or less than their original cost. Current performance may be lower or higher than the performance data quoted. To obtain performance data current to the most recent month-end, please visit our website www.hartfordfunds.com.
The initial investment in Class A shares reflects the maximum sales charge of 5.50% and returns for Class B shares reflect a contingent deferred sales charge of up to 5.00% and declining to zero, depending on the period of time the shares are held. Returns for Class C shares reflect a contingent deferred sales charge of up to 1.00% on shares redeemed within twelve months of purchase.
Total returns presented above were calculated using the Fund’s net asset value available to shareholders for sale or redemption of Fund shares on October 31, 2014, which may exclude investment transactions as of this date. All share class returns assume the reinvestment of all distributions at net asset value and the deduction of all fund expenses.
Effective 9/30/09, Class B shares of the Fund were closed to new investments.
Class I shares commenced operations on 8/31/06. Performance prior to that date is that of the Fund's Class A shares (excluding sales charges), which had different operating expenses. Class R3, R4 and R5 shares commenced operations on 12/22/06. Performance prior to that date is that of the Fund's Class Y shares, which had different operating expenses.
Russell 1000 Value Index is an unmanaged index that measures the performance of those Russell 1000 Index companies with lower price-to-book ratios and lower forecasted growth values. The Russell 1000 Index is an unmanaged index that measures the performance of the 1,000 largest companies in the Russell 3000 Index, which measures the performance of the 3,000 largest U.S. companies, based on total market capitalizations.
You cannot invest directly in an index.
The chart and table do not reflect the deductions of taxes that a shareholder would pay on Fund distributions or the redemption of Fund shares.
Performance information may reflect historical or current expense waivers/reimbursements from the investment adviser, without which performance would have been lower. For information on current expense waivers/reimbursements, please see the prospectus.
| 2 |
The Hartford Equity Income Fund
Manager Discussion
|
October 31, 2014 (Unaudited) |
Operating Expenses*
| Net | Gross | |||||||
| Equity Income Class A | 1.06 | % | 1.06 | % | ||||
| Equity Income Class B | 1.94 | % | 1.94 | % | ||||
| Equity Income Class C | 1.79 | % | 1.79 | % | ||||
| Equity Income Class I | 0.78 | % | 0.78 | % | ||||
| Equity Income Class R3 | 1.38 | % | 1.38 | % | ||||
| Equity Income Class R4 | 1.08 | % | 1.08 | % | ||||
| Equity Income Class R5 | 0.77 | % | 0.77 | % | ||||
| Equity Income Class Y | 0.67 | % | 0.67 | % | ||||
| * | As shown in the Fund's prospectus dated March 1, 2014. Actual expenses may be higher or lower. Please see accompanying Financial Highlights for expense ratios for the year ended October 31, 2014. |
Gross expenses are the Fund's total annual operating expenses shown in the Fund's prospectus dated March 1, 2014. Net expenses are the Fund's total annual operating expenses shown in the Fund's prospectus dated March 1, 2014, and reflect contractual expense reimbursements in instances when these reductions reduce the Fund's gross expenses. Contractual reimbursements remain in effect until February 28, 2015, and automatically renew for one-year terms unless terminated.
The Fund filed an updated prospectus, dated November 7, 2014, with the U.S. Securities and Exchange Commission that became effective on that date. However, the information in this annual report is as of October 31, 2014 and does not reflect any changes made to the total annual fund operating expense table in the November 7, 2014 prospectus.
All investments are subject to risk including the possible loss of principal. For a discussion of the Fund’s risks, please see the Main Risks section of this report. For more detailed information on the risks associated with an investment in the Fund, please see the prospectus.
| Portfolio Managers | ||||
| W. Michael Reckmeyer, III, CFA | Karen H. Grimes, CFA | Ian R. Link, CFA | ||
| Senior Vice President and Equity Portfolio Manager | Senior Vice President and Equity Portfolio Manager | Director and Equity Portfolio Manager |
How did the Fund perform?
The Class A shares of The Hartford Equity Income Fund returned 12.19%, before sales charge, for the twelve-month period ended October 31, 2014, underperforming the Fund’s benchmark, the Russell 1000 Value Index, which returned 16.46% for the same period. The Fund also underperformed the 12.41% average return of the Lipper Equity Income Funds peer group, a group of funds with investment strategies similar to those of the Fund.
Why did the Fund perform this way?
U.S. equities surged during the period, despite bouts of significant volatility. After finishing their best year since 1997, U.S. stocks began 2014 with their worst month in nearly two years. Worries about a slowdown in China and general angst surrounding emerging markets overshadowed a fairly benign domestic environment. However, robust merger and acquisition activity and an uncontested increase in the debt ceiling from Congress helped stoke investors' risk appetites in February. The rally continued in May amid renewed signs of life in the housing market and the best payroll gain in more than two years. However, a pullback in July ended a streak of five consecutive monthly gains. Fear gripped the market as heightened geopolitical risks, a potential Portuguese banking crisis, and worries of the U.S. Federal Reserve tightening took center stage. Stocks rebounded in August as investors were emboldened by encouraging economic data, headlined by better-than-expected Gross Domestic Product (GDP) growth and signs that the housing recovery still had legs. In September, U.S. equities retreated for just the third month this year. Despite solid manufacturing and consumer confidence readings, the reality of quantitative easing ending and the prospect of higher federal funds rates in mid-2015 contributed to increased risk aversion levels. Stocks finished a volatile October at an all-time high on the heels of a positive earnings season and generally solid economic data. Returns also varied noticeably by market-cap, as small- and mid-cap stocks underperformed large-cap stocks.
During the period all ten sectors within the Russell 1000 Value Index posted positive absolute returns, with Information Technology (+31%), Healthcare (+25%), and Utilities (+21%) performing the best. Energy (+5%), Telecommunication Services (+5%), and Consumer Discretionary (+10%) lagged the index on a relative basis during the period.
Overall, underperformance versus the Fund’s benchmark was driven by weak security selection, primarily within the Consumer Staples and Information Technology sectors. This more than offset positive stock selection within Utilities and Financials. Sector allocation, driven by our bottom-up stock selection process, also detracted from relative returns during the period, primarily due to an underweight to Financials and an overweight to Consumer Staples. A modest cash position in an upward trending market also detracted from relative performance.
Top detractors from relative performance during the period included Eaton Corp (Industrials), Mattel (Consumer Discretionary), and Suncor (Energy). Shares of Eaton, a global diversified electric equipment manufacturer, moved lower during the quarter on slower global growth, which led to lowered earnings guidance by the company. Shares of Mattel, a worldwide leader in the design, manufacture, and marketing of toys and family products, fell due to slow sales growth - the company is struggling to adapt to children moving away from traditional toys in favor of electronic products at a younger age. Shares of Suncor, a producer of crude oil, primarily
| 3 |
The Hartford Equity Income Fund
Manager Discussion – (continued)
|
October 31, 2014 (Unaudited) |
from the oil sands in Alberta, Canada, were depressed on a misconception that revenues were dependent on the approval of the XL Pipeline. Top detractors from absolute performance also included Akzo Nobel.
Top contributors to relative returns included Home Depot (Consumer Discretionary), Microsoft (Information Technology), and UGI Corp (Utilities). Shares of Home Depot, a U.S.-based home improvement retailer, outperformed over the quarter as the company exhibited accelerating sales trends, which were broad-based across categories and geographies. Shares of Microsoft, a U.S.-based developer of a range of software products and services sold globally, rose as their technology advantage finally began to play-out. In addition, Microsoft’s new CEO has received high marks for revitalizing the business culture and direction of the company. Shares of UGI Corp, a U.S.-based utility network, rose over the period as the company continued to benefit from heating oil to natural gas conversions. Top absolute contributors for the period also included Merck & Co (Healthcare) and Wells Fargo (Financials).
Derivatives are not used in a significant manner in this Fund and did not have a material impact on performance during the period.
What is the outlook?
We believe U.S. fundamentals remain supportive of moderate growth, but acknowledge that some risks have increased since the start of the year. Geopolitical risks have picked-up, headlined by the continued conflicts in the Middle East, potential terrorist threats, Ebola worries, tougher Russian sanctions, and highly publicized cyber-security attacks.
After three years of fiscal consolidation, it appears that this policy drag is starting to fade, which we expect will support growth. We believe U.S. GDP could grow within a fairly stable 2.5% to 3% range over the next 12 to 18 months. We believe that deleveraging in the U.S. is largely behind us, with data suggesting that private-sector debt is now growing again. Corporate credit was first to rise, and recently household and financial sector credit started to grow. At the end of the period, our largest overweights were to the Industrials and Telecommunication Services sectors, while our largest underweights were to the Financials and Consumer Discretionary sectors, relative to the Fund’s benchmark.
Diversification by Sector
as of October 31, 2014
| Sector | Percentage of Net Assets | |||
| Equity Securities | ||||
| Consumer Discretionary | 5.7 | % | ||
| Consumer Staples | 8.4 | |||
| Energy | 12.1 | |||
| Financials | 23.2 | |||
| Health Care | 13.8 | |||
| Industrials | 12.5 | |||
| Information Technology | 10.4 | |||
| Materials | 3.5 | |||
| Services | 3.6 | |||
| Utilities | 6.2 | |||
| Total | 99.4 | % | ||
| Short-Term Investments | 0.5 | |||
| Other Assets and Liabilities | 0.1 | |||
| Total | 100.0 | % | ||
A sector may be comprised of several industries. For Fund compliance purposes, the Fund may not use the same classification system and these sector classifications are used for reporting ease.
| 4 |
The Hartford Equity Income Fund
Schedule of Investments
October 31, 2014
|
(000’s Omitted) |
| Shares or Principal Amount | Market Value ╪ | |||||||
Common Stocks - 99.4% | ||||||||
| Banks - 10.1% | ||||||||
| 1,090 | BB&T Corp. | $ | 41,277 | |||||
| 474 | M&T Bank Corp. | 57,926 | ||||||
| 1,067 | PNC Financial Services Group, Inc. | 92,151 | ||||||
| 1,041 | US Bancorp | 44,367 | ||||||
| 2,758 | Wells Fargo & Co. | 146,422 | ||||||
| 382,143 | ||||||||
| Capital Goods - 10.7% | ||||||||
| 409 | 3M Co. | 62,937 | ||||||
| 73 | Caterpillar, Inc. | 7,423 | ||||||
| 1,307 | Eaton Corp. plc | 89,392 | ||||||
| 2,834 | General Electric Co. | 73,140 | ||||||
| 372 | Illinois Tool Works, Inc. | 33,826 | ||||||
| 79 | Lockheed Martin Corp. | 15,048 | ||||||
| 393 | Schneider Electric S.A. | 30,958 | ||||||
| 875 | United Technologies Corp. | 93,589 | ||||||
| 406,313 | ||||||||
| Commercial and Professional Services - 0.7% | ||||||||
| 536 | Waste Management, Inc. | 26,183 | ||||||
| Consumer Services - 0.9% | ||||||||
| 363 | McDonald's Corp. | 33,991 | ||||||
| Diversified Financials - 6.0% | ||||||||
| 292 | Ameriprise Financial, Inc. | 36,824 | ||||||
| 200 | BlackRock, Inc. | 68,272 | ||||||
| 2,023 | JP Morgan Chase & Co. | 122,341 | ||||||
| 227,437 | ||||||||
| Energy - 12.1% | ||||||||
| 1,071 | Chevron Corp. | 128,445 | ||||||
| 386 | ConocoPhillips Holding Co. | 27,872 | ||||||
| 793 | Enbridge, Inc. | 37,547 | ||||||
| 1,181 | Exxon Mobil Corp. | 114,243 | ||||||
| 627 | Occidental Petroleum Corp. | 55,798 | ||||||
| 780 | Royal Dutch Shell plc Class B | 28,816 | ||||||
| 1,851 | Suncor Energy, Inc. | 65,792 | ||||||
| 458,513 | ||||||||
| Food and Staples Retailing - 1.2% | ||||||||
| 266 | Sysco Corp. | 10,264 | ||||||
| 453 | Wal-Mart Stores, Inc. | 34,526 | ||||||
| 44,790 | ||||||||
| Food, Beverage and Tobacco - 6.2% | ||||||||
| 302 | Anheuser-Busch InBev N.V. ADR | 33,549 | ||||||
| 431 | Coca-Cola Co. | 18,034 | ||||||
| 287 | Diageo plc ADR | 33,915 | ||||||
| 1,147 | Kraft Foods Group, Inc. | 64,620 | ||||||
| 470 | Philip Morris International, Inc. | 41,841 | ||||||
| 1,125 | Unilever N.V. NY Shares ADR | 43,567 | ||||||
| 235,526 | ||||||||
| Health Care Equipment and Services - 0.8% | ||||||||
| 443 | Baxter International, Inc. | 31,073 | ||||||
| Household and Personal Products - 1.0% | ||||||||
| 433 | Procter & Gamble Co. | 37,762 | ||||||
| Insurance - 7.1% | ||||||||
| 757 | ACE Ltd. | 82,730 | ||||||
| 276 | Chubb Corp. | 27,473 | ||||||
| 2,096 | Marsh & McLennan Cos., Inc. | 113,941 | ||||||
| 855 | MetLife, Inc. | 46,391 | ||||||
| 270,535 | ||||||||
| Materials - 3.5% | ||||||||
| 496 | Akzo Nobel N.V. | 33,101 | ||||||
| 818 | Dow Chemical Co. | 40,428 | ||||||
| 467 | E.I. DuPont de Nemours & Co. | 32,277 | ||||||
| 528 | Nucor Corp. | 28,565 | ||||||
| 134,371 | ||||||||
| Media - 1.8% | ||||||||
| 886 | Thomson Reuters Corp. | 32,975 | ||||||
| 1,828 | WPP plc | 35,700 | ||||||
| 68,675 | ||||||||
| Pharmaceuticals, Biotechnology and Life Sciences - 13.0% | ||||||||
| 480 | AstraZeneca plc ADR | 35,016 | ||||||
| 535 | Bristol-Myers Squibb Co. | 31,108 | ||||||
| 435 | Eli Lilly & Co. | 28,820 | ||||||
| 1,216 | Johnson & Johnson | 131,023 | ||||||
| 2,114 | Merck & Co., Inc. | 122,509 | ||||||
| 2,689 | Pfizer, Inc. | 80,538 | ||||||
| 217 | Roche Holding AG | 63,951 | ||||||
| 492,965 | ||||||||
| Retailing - 3.0% | ||||||||
| 1,180 | Home Depot, Inc. | 115,031 | ||||||
| Semiconductors and Semiconductor Equipment - 5.0% | ||||||||
| 1,299 | Analog Devices, Inc. | 64,455 | ||||||
| 2,336 | Intel Corp. | 79,435 | ||||||
| 971 | Maxim Integrated Products, Inc. | 28,477 | ||||||
| 390 | Texas Instruments, Inc. | 19,368 | ||||||
| 191,735 | ||||||||
| Software and Services - 3.7% | ||||||||
| 2,240 | Microsoft Corp. | 105,158 | ||||||
| 1,488 | Symantec Corp. | 36,938 | ||||||
| 142,096 | ||||||||
| Technology Hardware and Equipment - 1.7% | ||||||||
| 2,569 | Cisco Systems, Inc. | 62,861 | ||||||
| Telecommunication Services - 3.6% | ||||||||
| 864 | BCE, Inc. | 38,386 | ||||||
| 1,969 | Verizon Communications, Inc. | 98,919 | ||||||
| 137,305 | ||||||||
| Transportation - 1.1% | ||||||||
| 404 | United Parcel Service, Inc. Class B | 42,370 | ||||||
| Utilities - 6.2% | ||||||||
| 3,954 | National Grid plc | 58,671 | ||||||
| 328 | NextEra Energy, Inc. | 32,868 | ||||||
| 839 | Northeast Utilities | 41,396 | ||||||
| 1,447 | UGI Corp. | 54,547 | ||||||
| 1,383 | Xcel Energy, Inc. | 46,299 | ||||||
| 233,781 | ||||||||
| Total Common Stocks | ||||||||
| (Cost $2,967,174) | $ | 3,775,456 | ||||||
| Total Long-Term Investments | ||||||||
| (Cost $2,967,174) | $ | 3,775,456 | ||||||
The accompanying notes are an integral part of these financial statements.
| 5 |
The Hartford Equity Income Fund
Schedule of Investments – (continued)
October 31, 2014
|
(000’s Omitted) |
| Shares or Principal Amount | Market Value ╪ | |||||||
| Short-Term Investments - 0.5% | ||||||||
| Repurchase Agreements - 0.5% | ||||||||
| Bank of America Merrill Lynch TriParty Repurchase Agreement (maturing on 11/03/2014 in the amount of $50, collateralized by U.S. Treasury Note 1.50%, 2019, value of $51) | ||||||||
| $ | 50 | 0.08%, 10/31/2014 | $ | 50 | ||||
| Bank of America Merrill Lynch TriParty Repurchase Agreement (maturing on 11/03/2014 in the amount of $853, collateralized by GNMA 1.63% - 7.00%, 2031 - 2054, value of $870) | ||||||||
| 853 | 0.09%, 10/31/2014 | 853 | ||||||
| Bank of Montreal TriParty Repurchase Agreement (maturing on 11/03/2014 in the amount of $229, collateralized by U.S. Treasury Bond 2.88% - 5.25%, 2029 - 2043, U.S. Treasury Note 0.38% - 4.50%, 2015 - 2022, value of $234) | ||||||||
| 229 | 0.08%, 10/31/2014 | 229 | ||||||
| Bank of Montreal TriParty Repurchase Agreement (maturing on 11/03/2014 in the amount of $777, collateralized by FHLMC 2.00% - 5.50%, 2022 - 2034, FNMA 2.00% - 4.50%, 2024 - 2039, GNMA 3.00%, 2043, U.S. Treasury Note 4.63%, 2017, value of $792) | ||||||||
| 777 | 0.10%, 10/31/2014 | 777 | ||||||
| Barclays Capital TriParty Repurchase Agreement (maturing on 11/03/2014 in the amount of $2,927, collateralized by U.S. Treasury Bond 4.50% - 6.25%, 2023 - 2036, U.S. Treasury Note 1.63% - 2.13%, 2015 - 2019, value of $2,985) | ||||||||
| 2,927 | 0.08%, 10/31/2014 | 2,927 | ||||||
| Citigroup Global Markets, Inc. TriParty Repurchase Agreement (maturing on 11/03/2014 in the amount of $3,364, collateralized by U.S. Treasury Bill 0.02%, 2015, U.S. Treasury Bond 3.88% - 11.25%, 2015 - 2040, U.S. Treasury Note 2.00% - 3.38%, 2019 - 2021, value of $3,431) | ||||||||
| 3,364 | 0.09%, 10/31/2014 | 3,364 | ||||||
| Deutsche Bank Securities TriParty Repurchase Agreement (maturing on 11/03/2014 in the amount of $194, collateralized by U.S. Treasury Note 0.88%, 2017, value of $198) | ||||||||
| 194 | 0.13%, 10/31/2014 | 194 | ||||||
| RBS Securities, Inc. TriParty Repurchase Agreement (maturing on 11/03/2014 in the amount of $286, collateralized by U.S. Treasury Bond 3.63% - 5.00%, 2037 - 2043, U.S. Treasury Note 2.13%, 2020, value of $292) | ||||||||
| 286 | 0.07%, 10/31/2014 | 286 | ||||||
| Societe Generale TriParty Repurchase Agreement (maturing on 11/03/2014 in the amount of $3,011, collateralized by U.S. Treasury Bill 0.02%, 2015, U.S. Treasury Bond 3.75% - 11.25%, 2015 - 2043, U.S. Treasury Note 1.38% - 4.25%, 2015 - 2022, value of $3,072) | ||||||||
| 3,011 | 0.08%, 10/31/2014 | 3,011 | ||||||
| TD Securities TriParty Repurchase Agreement (maturing on 11/03/2014 in the amount of $5,835, collateralized by FHLMC 3.00% - 4.00%, 2026 - 2044, FNMA 2.50% - 5.00%, 2025 - 2044, U.S. Treasury Bond 3.50% - 6.50%, 2026 - 2041, U.S. Treasury Note 1.75% - 2.88%, 2018 - 2019, value of $5,952) | ||||||||
| 5,835 | 0.10%, 10/31/2014 | 5,835 | ||||||
| 17,526 | ||||||||
| Total Short-Term Investments | ||||||||
| (Cost $17,526) | $ | 17,526 | ||||||
| Total Investments | ||||||||||||
| (Cost $2,984,700) ▲ | 99.9 | % | $ | 3,792,982 | ||||||||
| Other Assets and Liabilities | 0.1 | % | 5,564 | |||||||||
| Total Net Assets | 100.0 | % | $ | 3,798,546 |
The accompanying notes are an integral part of these financial statements.
| 6 |
The Hartford Equity Income Fund
Schedule of Investments – (continued)
October 31, 2014
|
(000’s Omitted) |
| Note: | Percentage of investments as shown is the ratio of the total market value to total net assets. |
Prices of foreign equities that are principally traded on certain foreign markets may be adjusted daily pursuant to a fair value pricing service approved by the Board of Directors in order to reflect an adjustment for factors occurring after the close of certain foreign markets but before the close of the New York Stock Exchange.
Equity
industry classifications used in this report are the Global Industry Classification Standard, which was developed by and is the
exclusive property and service mark of MSCI, Inc. and Standard & Poor’s.
For Fund compliance purposes, the Fund may not use the same classification system shown in this report as these classifications
are used for reporting ease.
| ▲ | At October 31, 2014, the cost of securities for federal income tax purposes was $2,992,847 and the aggregate gross unrealized appreciation and depreciation based on that cost were: |
| Unrealized Appreciation | $ | 821,599 | ||
| Unrealized Depreciation | (21,464 | ) | ||
| Net Unrealized Appreciation | $ | 800,135 |
| ╪ | See Significant Accounting Policies of accompanying Notes to Financial Statements regarding valuation of securities. |
| GLOSSARY: (abbreviations used in preceding Schedule of Investments) | |
| Other Abbreviations: | |
| ADR | American Depositary Receipt |
| FHLMC | Federal Home Loan Mortgage Corp. |
| FNMA | Federal National Mortgage Association |
| GNMA | Government National Mortgage Association |
The accompanying notes are an integral part of these financial statements.
| 7 |
The Hartford Equity Income Fund
Schedule of Investments – (continued)
October 31, 2014
|
(000’s Omitted) |
Investment Valuation Hierarchy Level Summary
October 31, 2014
| Total | Level 1 ♦ | Level 2 ♦ | Level 3 | |||||||||||||
| Assets: | ||||||||||||||||
| Common Stocks ‡ | $ | 3,775,456 | $ | 3,524,259 | $ | 251,197 | $ | – | ||||||||
| Short-Term Investments | 17,526 | – | 17,526 | – | ||||||||||||
| Total | $ | 3,792,982 | $ | 3,524,259 | $ | 268,723 | $ | – | ||||||||
| ♦ | For the year ended October 31, 2014, there were no transfers between Level 1 and Level 2. |
| ‡ | The Fund has all or primarily all of the equity securities categorized in a particular level. Refer to the Schedule of Investments for further industry breakout. |
| Note: | For purposes of reporting transfers between different hierarchy levels, both transfers in and out of each level, as applicable, are shown as if they occurred at the beginning of the period. |
The accompanying notes are an integral part of these financial statements.
| 8 |
The Hartford Equity Income Fund
Statement of Assets and Liabilities
October 31, 2014
|
(000’s Omitted) |
| Assets: | ||||
| Investments in securities, at market value (cost $2,984,700) | $ | 3,792,982 | ||
| Cash | — | |||
| Receivables: | ||||
| Fund shares sold | 7,041 | |||
| Dividends and interest | 4,510 | |||
| Other assets | 156 | |||
| Total assets | 3,804,689 | |||
| Liabilities: | ||||
| Payables: | ||||
| Fund shares redeemed | 5,031 | |||
| Investment management fees | 441 | |||
| Dividends | — | |||
| Administrative fees | 6 | |||
| Distribution fees | 190 | |||
| Accrued expenses | 475 | |||
| Total liabilities | 6,143 | |||
| Net assets | $ | 3,798,546 | ||
| Summary of Net Assets: | ||||
| Capital stock and paid-in-capital | $ | 2,890,791 | ||
| Undistributed net investment income | 3,690 | |||
| Accumulated net realized gain | 95,833 | |||
| Unrealized appreciation of investments and the translation of assets and liabilities denominated in foreign currency | 808,232 | |||
| Net assets | $ | 3,798,546 | ||
| Shares authorized | 600,000 | |||
| Par value | $ | 0.001 | ||
| Class A: Net asset value per share/Maximum offering price per share | $19.04/$20.15 | |||
| Shares outstanding | 102,494 | |||
| Net assets | $ | 1,951,760 | ||
| Class B: Net asset value per share | $ | 19.05 | ||
| Shares outstanding | 1,135 | |||
| Net assets | $ | 21,619 | ||
| Class C: Net asset value per share | $ | 18.96 | ||
| Shares outstanding | 24,187 | |||
| Net assets | $ | 458,695 | ||
| Class I: Net asset value per share | $ | 18.97 | ||
| Shares outstanding | 47,610 | |||
| Net assets | $ | 903,048 | ||
| Class R3: Net asset value per share | $ | 19.06 | ||
| Shares outstanding | 3,061 | |||
| Net assets | $ | 58,349 | ||
| Class R4: Net asset value per share | $ | 19.08 | ||
| Shares outstanding | 4,022 | |||
| Net assets | $ | 76,746 | ||
| Class R5: Net asset value per share | $ | 19.15 | ||
| Shares outstanding | 4,794 | |||
| Net assets | $ | 91,827 | ||
| Class Y: Net asset value per share | $ | 19.19 | ||
| Shares outstanding | 12,327 | |||
| Net assets | $ | 236,502 |
The accompanying notes are an integral part of these financial statements.
| 9 |
The Hartford Equity Income Fund
Statement of Operations
For the Year Ended October 31, 2014
|
(000’s Omitted) |
| Investment Income: | ||||
| Dividends | $ | 103,655 | ||
| Interest | 38 | |||
| Less: Foreign tax withheld | (1,847 | ) | ||
| Total investment income | 101,846 | |||
| Expenses: | ||||
| Investment management fees | 22,239 | |||
| Administrative services fees | ||||
| Class R3 | 108 | |||
| Class R4 | 113 | |||
| Class R5 | 83 | |||
| Transfer agent fees | ||||
| Class A | 2,193 | |||
| Class B | 60 | |||
| Class C | 397 | |||
| Class I | 800 | |||
| Class R3 | 3 | |||
| Class R4 | 2 | |||
| Class R5 | 1 | |||
| Class Y | 3 | |||
| Distribution fees | ||||
| Class A | 4,792 | |||
| Class B | 62 | |||
| Class C | 4,087 | |||
| Class R3 | 270 | |||
| Class R4 | 188 | |||
| Custodian fees | 28 | |||
| Accounting services fees | 429 | |||
| Registration and filing fees | 350 | |||
| Board of Directors' fees | 90 | |||
| Audit fees | 37 | |||
| Other expenses | 546 | |||
| Total expenses (before fees paid indirectly) | 36,881 | |||
| Commission recapture | (22 | ) | ||
| Custodian fee offset | — | |||
| Total fees paid indirectly | (22 | ) | ||
| Total expenses, net | 36,859 | |||
| Net Investment Income | 64,987 | |||
| Net Realized Gain on Investments and Foreign Currency Transactions: | ||||
| Net realized gain on investments | 104,406 | |||
| Net realized loss on foreign currency contracts | (314 | ) | ||
| Net realized gain on other foreign currency transactions | 237 | |||
| Net Realized Gain on Investments and Foreign Currency Transactions | 104,329 | |||
| Net Changes in Unrealized Appreciation of Investments and Foreign Currency Transactions: | ||||
| Net unrealized appreciation of investments | 236,233 | |||
| Net unrealized appreciation of foreign currency contracts | 25 | |||
| Net unrealized depreciation of translation of other assets and liabilities in foreign currencies | (72 | ) | ||
| Net Changes in Unrealized Appreciation of Investments and Foreign Currency Transactions | 236,186 | |||
| Net Gain on Investments and Foreign Currency Transactions | 340,515 | |||
| Net Increase in Net Assets Resulting from Operations | $ | 405,502 |
The accompanying notes are an integral part of these financial statements.
| 10 |
The Hartford Equity Income Fund
Statement of Changes in Net Assets
| (000’s Omitted) |
| For the Year Ended October 31, 2014 | For the Year Ended October 31, 2013 | |||||||
| Operations: | ||||||||
| Net investment income | $ | 64,987 | $ | 46,208 | ||||
| Net realized gain on investments and foreign currency transactions | 104,329 | 99,920 | ||||||
| Net unrealized appreciation of investments and foreign currency transactions | 236,186 | 363,864 | ||||||
| Net Increase in Net Assets Resulting from Operations | 405,502 | 509,992 | ||||||
| Distributions to Shareholders: | ||||||||
| From net investment income | ||||||||
| Class A | (34,679 | ) | (27,383 | ) | ||||
| Class B | (404 | ) | (320 | ) | ||||
| Class C | (4,615 | ) | (2,873 | ) | ||||
| Class I | (16,809 | ) | (8,971 | ) | ||||
| Class R3 | (800 | ) | (579 | ) | ||||
| Class R4 | (1,339 | ) | (849 | ) | ||||
| Class R5 | (1,655 | ) | (609 | ) | ||||
| Class Y | (4,604 | ) | (2,779 | ) | ||||
| Total from net investment income | (64,905 | ) | (44,363 | ) | ||||
| From net realized gain on investments | ||||||||
| Class A | (55,603 | ) | (17,898 | ) | ||||
| Class B | (824 | ) | (407 | ) | ||||
| Class C | (10,991 | ) | (2,426 | ) | ||||
| Class I | (20,987 | ) | (3,825 | ) | ||||
| Class R3 | (1,527 | ) | (357 | ) | ||||
| Class R4 | (2,092 | ) | (370 | ) | ||||
| Class R5 | (2,344 | ) | (132 | ) | ||||
| Class Y | (5,214 | ) | (1,114 | ) | ||||
| Total from net realized gain on investments | (99,582 | ) | (26,529 | ) | ||||
| Total distributions | (164,487 | ) | (70,892 | ) | ||||
| Capital Share Transactions: | ||||||||
| Class A | 75,450 | 280,222 | ||||||
| Class B | (7,146 | ) | (5,855 | ) | ||||
| Class C | 95,050 | 133,201 | ||||||
| Class I | 201,333 | 327,339 | ||||||
| Class R3 | 6,780 | 17,908 | ||||||
| Class R4 | 6,256 | 32,230 | ||||||
| Class R5 | 14,257 | 58,448 | ||||||
| Class Y | 53,569 | 70,312 | ||||||
| Net increase from capital share transactions | 445,549 | 913,805 | ||||||
| Net Increase in Net Assets | 686,564 | 1,352,905 | ||||||
| Net Assets: | ||||||||
| Beginning of period | 3,111,982 | 1,759,077 | ||||||
| End of period | $ | 3,798,546 | $ | 3,111,982 | ||||
| Undistributed (distributions in excess of) net investment income | $ | 3,690 | $ | 3,707 | ||||
The accompanying notes are an integral part of these financial statements.
| 11 |
The Hartford Equity Income Fund
Notes to Financial Statements
October 31, 2014
|
(000’s Omitted) |
Organization:
The Hartford Mutual Funds, Inc. (“Company”) is an open-end management investment company comprised of forty-two portfolios. Financial statements for The Hartford Equity Income Fund (the "Fund"), a series of the Company, are included in this report.
The Company is organized under the laws of the State of Maryland and is registered with the Securities and Exchange Commission (“SEC”) under the Investment Company Act of 1940, as amended (“1940 Act”). The Fund is a diversified open-end management investment company. The Fund is an investment company and applies specialized accounting and reporting under Accounting Standards Codification Topic 946, Financial Services - Investment Companies.
Class A shares are sold with a front-end sales charge of up to 5.50%. Class B shares were sold with a contingent deferred sales charge which is assessed on the lesser of the per share net asset value (“NAV”) of the shares at the time of redemption or the original purchase price, and declines from up to 5.00% to zero depending on the period of time the shares are held (see note below regarding the closing of Class B shares). Class C shares are sold with a contingent deferred sales charge of up to 1.00% on shares redeemed within twelve months of purchase. Class I shares are sold without sales charges to certain eligible investors primarily through advisory fee-based wrap programs. Class R3, R4 and R5 shares, which are offered to employer-sponsored retirement plans, and Class Y shares, which are sold to certain eligible institutional investors, are sold without a sales charge. All classes of shares have identical voting, redemption, dividend, liquidation and other rights and the same terms and conditions, with the exceptions that each class may have different expenses, which may affect performance, and that Class B shares automatically convert to Class A shares after 8 years.
No new or additional investments are allowed in Class B shares of the Fund (including investments through any systematic investment plan). Existing shareholders of Class B shares may continue to hold their Class B shares, exchange their Class B shares for Class B shares of another Hartford Fund (as permitted by existing exchange privileges), or redeem their Class B shares as described in the Fund’s prospectus. Reinstatement privileges with respect to Class B shares are set forth in the Fund's prospectus. For investors electing to reinvest capital gains and dividends, any such capital gains or dividends on Class B shares will continue to be reinvested in Class B shares of the Fund. All Class B share attributes, including the 12b-1 fee, contingent deferred sales charge schedule, and conversion to Class A shares, remain unchanged.
Significant Accounting Policies:
The following is a summary of significant accounting policies of the Fund in the preparation of its financial statements, which are in accordance with United States generally accepted accounting principles (“U.S. GAAP”). The preparation of financial statements in accordance with U.S. GAAP may require management to make estimates and assumptions that affect the reported amounts of assets and liabilities and disclosure of contingent assets and liabilities at the date of the financial statements and the reported amounts of increases and decreases in net assets from operations during the reporting period. Actual results could differ from those estimates.
Determination of Net Asset Value – The NAV of each class of the Fund's shares is determined as of the close of regular trading (normally 4:00 p.m. Eastern Time) (the “NYSE Close”) on each day that the New York Stock Exchange (the “Exchange”) is open (“Valuation Date”). Information that becomes known to the Fund after the NAV has been calculated on a particular day will not generally be used to retroactively adjust the NAV determined earlier that day.
Investment Valuation and Fair Value Measurements – For purposes of calculating the NAV, portfolio investments and other assets held by the Fund's portfolio for which market quotes are readily available are valued at market value. Market value is generally determined on the basis of last reported sales prices or official close price. If no sales are reported, market value is based on quotes obtained from a quotation reporting system, established market makers, or independent pricing services. If market prices are not readily available or are deemed unreliable, the Fund will use the fair value of the investment as determined in good faith under policies and procedures established by and under the supervision of the Company's Board of Directors. Market quotes are considered not readily available where there is an absence of current or reliable market-based data (e.g., trade information or indicative market quotes), including where events occur after the close of the relevant market, but prior to the NYSE Close, that materially affect the values of the Fund's portfolio investments or assets. In addition, market quotes are considered not readily available when, due to extraordinary circumstances, the exchanges or markets on which the investments trade do not open for trading for the entire day and no other market prices are available. In addition, prices of foreign equities that are principally traded on certain foreign markets may
| 12 |
The Hartford Equity Income Fund
Notes to Financial Statements – (continued)
October 31, 2014
| (000’s Omitted) |
be adjusted daily pursuant to a fair value pricing service approved by the Board of Directors in order to reflect an adjustment for the factors occurring after the close of certain foreign markets but before the NYSE Close. Investments that are primarily traded on foreign markets may trade on days that are not business days of the Fund. The value of the foreign investments in which the Fund invests may change on days when a shareholder will not be able to purchase or redeem shares of the Fund. Fair value pricing is subjective in nature and the use of fair value pricing by the Fund may cause the NAV of its shares to differ significantly from the NAV that would have been calculated using market prices at the close of the exchange on which a portfolio investment is primarily traded. There can be no assurance that the Fund could obtain the fair market value assigned to an investment if the Fund were to sell the investment at approximately the time at which the Fund determines its NAV.
Investments valued in currencies other than U.S. dollars are converted to U.S. dollars using exchange rates obtained from independent pricing services for calculation of the NAV. As a result, the NAV of the Fund’s shares may be affected by changes in the value of currencies in relation to the U.S. dollar. The value of investments traded in markets outside the United States or denominated in currencies other than the U.S. dollar may be affected significantly on a day that the NYSE is closed and the market value may change on days when an investor is not able to purchase, redeem or exchange shares of the Fund.
Foreign currency contracts represent agreements to exchange currencies on specific future dates at predetermined rates. Foreign currency contracts are valued using foreign currency exchange rates and forward rates as provided by an independent pricing service on the Valuation Date.
Financial instruments for which prices are not available from an independent pricing service may be valued using market quotations obtained from one or more dealers that make markets in the respective financial instrument in accordance with procedures established by the Company's Board of Directors.
U.S. GAAP defines fair value as the price that the Fund would receive to sell an asset or pay to transfer a liability in an orderly transaction between market participants. The U.S. GAAP fair value measurement standards require disclosure of a fair value hierarchy for each major category of assets and liabilities. Various inputs are used in determining the fair value of the Fund’s investments. These inputs are summarized into three broad hierarchy levels. This hierarchy is based on whether the valuation inputs are observable or unobservable. These levels are:
Level 1 – Quoted prices in active markets for identical investments. Level 1 may include exchange traded instruments, such as domestic equities, some foreign equities, options, futures, mutual funds, exchange traded funds, rights and warrants.
Level 2 – Observable inputs other than Level 1 prices, such as quoted prices for similar investments; quoted prices in markets that are not active; or other inputs that are observable or can be corroborated by observable market data. Level 2 may include debt investments that are traded less frequently than exchange traded instruments and which are valued using independent pricing services; foreign equities, which are principally traded on certain foreign markets and are adjusted daily pursuant to a fair value pricing service in order to reflect an adjustment for the factors occurring after the close of certain foreign markets but before the NYSE Close; senior floating rate interests, which are valued using an aggregate of dealer bids; short-term investments, which are valued at amortized cost; and swaps, which are valued based upon the terms of each swap contract.
Level 3 – Significant unobservable inputs that are supported by limited or no market activity. Level 3 may include financial instruments whose values are determined using indicative market quotes or require significant management judgment or estimation. These unobservable valuation inputs may include estimates for current yields, maturity/duration, prepayment speed, and indicative market quotes for comparable investments along with other assumptions relating to credit quality, collateral value, complexity of the investment structure, general market conditions and liquidity. This category may include investments where trading has been halted or there are certain restrictions on trading. While these investments are priced using unobservable inputs, the valuation of these investments reflects the best available data and management believes the prices are a reasonable representation of exit price.
The Board of Directors of the Company generally reviews and approves the “Procedures for Valuation of Portfolio Securities” at least once a year. These procedures define how investments are to be valued, including the formation and activities of a Valuation Committee. The Valuation Committee is responsible for determining in good faith the fair value of investments when
| 13 |
The Hartford Equity Income Fund
Notes to Financial Statements – (continued)
October 31, 2014
| (000’s Omitted) |
the value cannot be obtained from primary pricing services or alternative sources or if the valuation of an investment as provided by the primary pricing service or alternative source is believed not to reflect the investment’s fair value as of the Valuation Date. Voting members of the Valuation Committee include the Fund's Treasurer or designee and a Vice President of the investment manager or designee. An Assistant Vice President of the Fund with legal expertise or designee is also included on the Valuation Committee as a non-voting advisory member. In addition, the Fund’s Chief Compliance Officer shall designate a member of the compliance group to attend Valuation Committee meetings as a non-voting resource, to monitor for and provide guidance with respect to compliance with these procedures. Two members of the Valuation Committee or their designees, representing different departments, shall constitute a quorum for purposes of permitting the Valuation Committee to take action. The Valuation Committee will consider all relevant factors in determining an investment’s fair value, and may seek the advice of the Fund’s sub-adviser, knowledgeable brokers, and legal counsel in making such determination. The Valuation Committee reports to the Audit Committee of the Company's Board of Directors. The Audit Committee receives quarterly written reports which include details of all fair-valued investments, including the reason for the fair valuation, and an indication, when possible, of the accuracy of the valuation by disclosing the next available reliable public price quotation or the disposition price of such investments (the “look-back” test). The Board of Directors then must consider for ratification all of the fair value determinations made during the previous quarter.
Valuation levels are not necessarily indicative of the risk associated with investing in such investments. Individual investments within any of the above mentioned asset classes may be assigned a different hierarchical level than those presented above, as individual circumstances dictate.
For additional information, refer to the Investment Valuation Hierarchy Level Summary which follows the Schedule of Investments.
Investment Transactions and Investment Income – Investment transactions are recorded as of the trade date (the date the order to buy or sell is executed) for financial reporting purposes. Investments purchased or sold on a when-issued or delayed-delivery basis may be settled a month or more after the trade date. Realized gains and losses are determined on the basis of identified cost.
Dividend income from domestic securities is accrued on the ex-dividend date. In general, dividend income from foreign securities is recorded on the ex-date; however, dividend notifications in certain foreign jurisdictions may not be available in a timely manner and as a result, the Fund will record the dividend as soon as the relevant details (i.e., rate per share, payment date, shareholders of record, etc.) are publicly available. Interest income, including amortization of premium, accretion of discounts and additional principal received in-kind in lieu of cash, is accrued on a daily basis.
Foreign Currency Transactions – Assets and liabilities denominated in currencies other than U.S. dollars are translated into U.S. dollars at the exchange rates in effect on the valuation date. Purchases and sales of investments, income and expenses are translated into U.S. dollars at the exchange rates on the dates of such transactions.
The Fund does not isolate that portion of portfolio investment valuation resulting from fluctuations in the foreign currency exchange rates from the fluctuations arising from changes in the market prices of investments held. Exchange rate fluctuations are included with the net realized and unrealized gain or loss on investments in the accompanying financial statements.
Net realized foreign exchange gains or losses arise from sales of foreign currencies and the difference between asset and liability amounts initially stated in foreign currencies and the U.S. dollar value of the amounts actually received or paid. Net unrealized foreign exchange gains or losses arise from changes in the value of other assets and liabilities at the end of the reporting period, resulting from changes in the exchange rates.
Joint Trading Account – The Fund may invest cash balances into a joint trading account that may be invested in one or more repurchase agreements.
Fund Share Valuation and Dividend Distributions to Shareholders – Orders for the Fund’s shares are executed in accordance with the investment instructions of the shareholders. The NAV of the Fund’s shares is determined as of the close of business on each business day of the Exchange. The NAV is determined separately for each class of shares of the Fund by dividing the Fund’s net assets attributable to that class by the number of shares of the class outstanding. Each class of shares offered by the Fund has equal
| 14 |
The Hartford Equity Income Fund
Notes to Financial Statements – (continued)
October 31, 2014
| (000’s Omitted) |
rights as to assets and voting privileges (except that shareholders of a class have exclusive voting rights regarding any matter relating solely to that class of shares). Income and non-class specific expenses are allocated daily to each class on the basis of the relative net assets of the class. Realized and unrealized gains and losses are allocated daily based on the relative net assets of each class of shares of the Fund.
Orders for the purchase of the Fund’s shares received prior to the close of the Exchange on any day the Exchange is open for business are priced at the NAV determined as of the close of the Exchange. Orders received after the close of the Exchange, or on a day on which the Exchange and/or the Fund is not open for business, are priced at the next determined NAV.
Dividends are declared pursuant to a policy adopted by the Company's Board of Directors based upon the investment performance of the Fund. The policy of the Fund is to pay dividends from net investment income, if any, quarterly and realized gains, if any, at least once a year.
Net investment income, dividends and distributions from net realized gains and capital are determined in accordance with federal income tax regulations, which may differ from U.S. GAAP with respect to character and timing (see Federal Income Taxes: Distributions and Components of Distributable Earnings and Reclassification of Capital Accounts).
Securities and Other Investments:
Repurchase Agreements – A repurchase agreement is an agreement by which a counterparty agrees to sell an investment and agrees to repurchase the investment sold from the buyer at a mutually agreed upon time and price. During the period of the repurchase agreement, the counterparty will deposit cash and or securities in a third party custodial account to serve as collateral. At the time the Fund enters into a repurchase agreement, the value of the underlying collateral, including accrued interest, will be equal to or exceed the value of the repurchase agreement. Repurchase agreements expose the Fund to counterparty risk - that is, the risk that the counterparty will not fulfill its obligations. To minimize counterparty risk, the investments that serve to collateralize the repurchase agreement are held by the Fund’s custodian in book entry or physical form in the custodial account of the Fund or in a third party custodial account. Repurchase agreements are valued at cost plus accrued interest, which approximates fair value. Repurchase agreements have master netting arrangements which allow the Fund to offset amounts owed to a counterparty with amounts owed by the counterparty, including any collateral. Upon an event of default under a master repurchase agreement, the non-defaulting party may close out all transactions traded under such agreement and net amounts owed under each transaction to one net amount payable by one party to the other. Absent an event of default, the master repurchase agreement does not result in an offset of reported amounts of assets and liabilities in the Statement of Assets and Liabilities across transactions between the Fund and the applicable counterparty. The Fund, as shown on the Schedule of Investments, had outstanding repurchase agreements and related collateral as of October 31, 2014.
Investments Purchased on a When-Issued or Delayed-Delivery Basis – Delivery and payment for investments that have been purchased by the Fund on a forward commitment, or when-issued or delayed-delivery basis, take place beyond the customary settlement period. The Fund may dispose of or renegotiate a delayed-delivery transaction after it is entered into, and may sell delayed-delivery investments before they are delivered, which may result in a realized gain or loss. During this period, such investments are subject to market fluctuations, and the Fund identifies investments segregated in its records with a value at least equal to the amount of the commitment. The Fund had no when-issued or delayed-delivery investments as of October 31, 2014.
Financial Derivative Instruments:
The following disclosures contain information on how and why the Fund uses derivative instruments, the credit-risk-related contingent features in certain derivative instruments and how derivative instruments affect the Fund’s financial position and results of operations. The location and fair value amounts of these instruments on the Statement of Assets and Liabilities and the realized gains and losses and changes in unrealized gains and losses on the Statement of Operations, each categorized by type of derivative contract, are included in the following Additional Derivative Instrument Information footnote. The derivative instruments outstanding as of year-end are disclosed in the notes to the Schedule of Investments, if applicable. The amounts of realized gains and losses and changes in unrealized gains and losses on derivative instruments during the year are disclosed in the Statement of Operations.
| 15 |
The Hartford Equity Income Fund
| Notes to Financial Statements – (continued) |
| October 31, 2014 |
| (000’s Omitted) |
Foreign Currency Contracts – The Fund may enter into foreign currency contracts that obligate the Fund to purchase or sell currencies at specified future dates. Foreign currency contracts are used to hedge the currency exposure associated with some or all of the Fund’s investments and/or as part of an investment strategy. Foreign currency contracts are marked to market daily and the change in value is recorded by the Fund as an unrealized gain or loss. The Fund will record a realized gain or loss when the foreign currency contract is settled.
Foreign currency contracts involve elements of market risk in excess of the amounts reflected in the Statement of Assets and Liabilities. In addition, risks may arise upon entering into these contracts from the potential inability of the counterparties to meet the terms of the contracts and from unanticipated movements in the value of the foreign currencies relative to the U.S. dollar. The Fund had no outstanding foreign currency contracts as of October 31, 2014.
Additional Derivative Instrument Information:
The volume of derivative activity was minimal during the year ended October 31, 2014.
The Effect of Derivative Instruments on the Statement of Operations for the year ended October 31, 2014:
| Risk Exposure Category | ||||||||||||||||||||||||||||
| Interest
Rate Contracts | Foreign Exchange Contracts | Credit Contracts | Equity Contracts | Commodity Contracts | Other Contracts | Total | ||||||||||||||||||||||
| Realized Loss on Derivatives Recognized as a Result of Operations: | ||||||||||||||||||||||||||||
| Net realized loss on foreign currency contracts | $ | — | $ | (314 | ) | $ | — | $ | — | $ | — | $ | — | $ | (314 | ) | ||||||||||||
| Total | $ | — | $ | (314 | ) | $ | — | $ | — | $ | — | $ | — | $ | (314 | ) | ||||||||||||
| Net Change in Unrealized Appreciation (Depreciation) on Derivatives Recognized as a Result of Operations: | ||||||||||||||||||||||||||||
| Net change in unrealized appreciation of foreign currency contracts | $ | — | $ | 25 | $ | — | $ | — | $ | — | $ | — | $ | 25 | ||||||||||||||
| Total | $ | — | $ | 25 | $ | — | $ | — | $ | — | $ | — | $ | 25 | ||||||||||||||
Principal Risks:
The Fund may be exposed to counterparty risk, or the risk that an institution or other entity with which the Fund has unsettled or open transactions will default.
If the Fund invests directly in foreign currencies or in securities that trade in, and receive revenues in, foreign currencies, or in derivatives that provide exposure to foreign currencies, it will be subject to the risk that those currencies will decline in value relative to the base currency (U.S. dollars) of the Fund, or, in the case of hedging positions, that the Fund’s base currency will decline in value relative to the currency being hedged. Currency rates in foreign countries may fluctuate significantly over short periods of time for a number of reasons, including changes in interest rates, intervention (or the failure to intervene) by U.S. or foreign governments, central banks or supranational entities, such as the International Monetary Fund, or by the imposition of currency controls or other political developments in the United States or abroad. As a result, the Fund’s investments in foreign currency denominated securities may reduce the returns of the Fund. The market values of equity securities, such as common stocks and preferred stocks, or equity related investments, such as futures and options, may decline due to general market conditions which are not specifically related to a particular company, such as real or perceived adverse economic conditions, changes in the general outlook for corporate earnings, changes in interest or currency rates or adverse investor sentiment generally. The market value of equity securities may also decline due to factors which affect a particular industry or industries, such as labor shortages or increased production costs and competitive conditions within an industry. Equity securities and equity related investments generally have greater market price volatility than fixed income securities.
Federal Income Taxes:
Federal Income Taxes – For federal income tax purposes, the Fund intends to continue to qualify as a Regulated Investment Company ("RIC") under Subchapter M of the Internal Revenue Code (“IRC”) by distributing substantially all of its taxable net
| 16 |
The Hartford Equity Income Fund
| Notes to Financial Statements – (continued) |
| October 31, 2014 |
| (000’s Omitted) |
investment income and net realized capital gains to its shareholders and otherwise complying with the requirements of the IRC. The Fund has distributed substantially all of its income and capital gains in prior years, if applicable, and intends to distribute substantially all of its income and capital gains during the calendar year ending December 31, 2014. Accordingly, no provision for federal income or excise taxes has been made in the accompanying financial statements. Distributions from short-term capital gains are treated as ordinary income distributions for federal income tax purposes.
Net Investment Income (Loss), Net Realized Gains (Losses) and Distributions – Net investment income (loss) and net realized gains (losses) may differ for financial statement and tax purposes primarily because of losses deferred due to wash sale adjustments, foreign currency gains and losses, adjustments related to Passive Foreign Investment Companies ("PFICs"), Real Estate Investment Trusts ("REITs"), RICs, certain derivatives and partnerships. The character of distributions made during the year from net investment income or net realized gains may differ from their ultimate characterization for federal income tax purposes. Also, due to the timing of dividend distributions, the fiscal year in which amounts are distributed may differ from the year that the income or realized gains (losses) were recorded by the Fund.
Distributions and Components of Distributable Earnings – The tax character of distributions paid by the Fund for the periods indicated is as follows (as adjusted for dividends payable, if applicable):
| For the Year Ended October 31, 2014 | For the Year Ended October 31, 2013 | |||||||
| Ordinary Income | $ | 70,154 | $ | 44,364 | ||||
| Long-Term Capital Gains ‡ | 94,333 | 26,528 | ||||||
| ‡ | The Fund designates these distributions as long-term capital gain dividends pursuant to IRC Sec. 852(b)(3)(C). |
As of October 31, 2014, the Fund’s components of distributable earnings (deficit) on a tax basis are as follows:
| Amount | ||||
| Undistributed Ordinary Income | $ | 15,727 | ||
| Undistributed Long-Term Capital Gain | 91,943 | |||
| Unrealized Appreciation* | 800,085 | |||
| Total Accumulated Earnings | $ | 907,755 | ||
| * | Differences between book-basis and tax-basis unrealized appreciation (depreciation) may be attributable to the losses deferred due to wash sale adjustments, foreign currency gains and losses, adjustments related to PFICs, REITs, RICs, certain derivatives and partnerships. |
Reclassification of Capital Accounts – The Fund may record reclassifications in its capital accounts. These reclassifications have no impact on the total net assets of the Fund. The reclassifications are a result of permanent differences between U.S. GAAP and tax accounting for such items as foreign currency, PFICs, expiration or utilization of capital loss carryforwards or net operating losses. Adjustments are made to reflect the impact these items have on current and future distributions to shareholders. Therefore, the source of the Fund’s distributions may be shown in the accompanying Statement of Changes in Net Assets as from undistributed net investment income, from accumulated net realized gains on investments or from capital depending on the type of book and tax differences that exist. For the year ended October 31, 2014, the Fund recorded reclassifications to increase (decrease) the accounts listed below:
| Amount | ||||
| Undistributed Net Investment Income (Loss) | $ | (99 | ) | |
| Accumulated Net Realized Gain (Loss) | 99 | |||
Capital Loss Carryforward – On December 22, 2010, the Regulated Investment Company Modernization Act of 2010 (the “Act”) was enacted, which made changes to the capital loss carryforward rules. The changes are effective for taxable years beginning after the date of enactment. Under the Act, funds are permitted to carry forward capital losses for an unlimited period. Additionally, capital loss
| 17 |
The Hartford Equity Income Fund
| Notes to Financial Statements – (continued) |
| October 31, 2014 |
| (000’s Omitted) |
carryforwards retain their character as either short-term or long-term capital losses rather than being considered all short-term as permitted under prior regulation.
The Fund had no capital loss carryforward for U.S. federal income tax purposes as of October 31, 2014.
Accounting for Uncertainty in Income Taxes – The Fund has adopted financial reporting rules that require the Fund to analyze all open tax years, as defined by the statute of limitations, for all major jurisdictions. Generally, tax authorities can examine all tax returns filed for the last three years. The Fund does not have an examination in progress.
The Fund has reviewed all open tax years and major jurisdictions and concluded that these financial reporting rules had no effect on the Fund’s financial position or results of operations. There is no tax liability resulting from unrecognized tax benefits relating to uncertain income tax positions taken or expected to be taken on the tax return for the fiscal year ended October 31, 2014. The Fund is also not aware of any tax positions for which it is reasonably possible that the total amounts of unrecognized tax benefits will significantly change in the next twelve months.
Expenses:
Investment Management Agreement – Hartford Funds Management Company, LLC ("HFMC") serves as the Fund’s investment manager pursuant to an Investment Management Agreement with the Company. HFMC is an indirect wholly owned subsidiary of The Hartford Financial Services Group, Inc. ("The Hartford"). The investment manager has overall investment supervisory responsibility for the Fund. In addition, the investment manager provides administrative personnel, services, equipment, facilities and office space for proper operation of the Fund. HFMC has contracted with Wellington Management Company, LLP ("Wellington Management") under a sub-advisory agreement for the provision of day-to-day investment management services to the Fund in accordance with the Fund’s investment objective and policies. The Fund pays a fee to the investment manager, a portion of which may be used to compensate Wellington Management.
The schedule below reflects the rates of compensation paid to the investment manager for investment management services rendered as of October 31, 2014; the rates are accrued daily and paid monthly:
| Average Daily Net Assets | Annual Fee | |
| On first $250 million | 0.7500% | |
| On next $250 million | 0.7000% | |
| On next $500 million | 0.6500% | |
| On next $1.5 billion | 0.6000% | |
| On next $2.5 billion | 0.5900% | |
| Over $5 billion | 0.5875% |
Accounting Services Agreement – Pursuant to the Fund Accounting Agreement between HFMC and the Company, on behalf of the Fund, HFMC provides accounting services to the Fund and receives monthly compensation based on the Fund’s average daily net assets at the rates set forth below. The Fund’s accounting services fees are accrued daily and paid monthly.
| Average Daily Net Assets | Annual Fee | |
| On first $5 billion | 0.012% | |
| Over $5 billion | 0.010% |
| 18 |
The Hartford Equity Income Fund
| Notes to Financial Statements – (continued) |
| October 31, 2014 |
| (000’s Omitted) |
Operating Expenses – Allocable expenses incurred by the Company are allocated to each Fund and allocated to classes within the Fund in proportion to the average daily net assets of the Fund and each class, except where allocation of certain expenses is more fairly made directly to the Fund or to specific classes within a Fund. As of October 31, 2014, HFMC contractually limited the total operating expenses of this Fund, exclusive of taxes, interest expense, brokerage commissions, acquired fund fees and expenses and extraordinary expenses, through February 28, 2015 as follows:
| Class A | Class B * | Class C | Class I | Class R3 | Class R4 | Class R5 | Class Y | |||||||
| 1.25% | 2.00% | 2.00% | 1.00% | 1.50% | 1.20% | 0.90% | 0.85% |
| * | The reduction in amounts charged in connection with Class B Distribution and Service Plan (12b-1) fees that took effect July 1, 2013, in order to comply with applicable FINRA rules, caused the limit on net operating expenses attributable to Class B shares to be, effectively, 1.25%. |
Fees Paid Indirectly – The Fund has entered into agreements with State Street Global Markets, LLC and Russell Implementation Services, Inc. to partially recapture non-discounted trade commissions. Such rebates are used to pay a portion of the Fund’s expenses. In addition, the Fund's custodian bank has agreed to reduce its fees when the Fund maintains cash on deposit in a non-interest-bearing custody account. For the year ended October 31, 2014, these amounts, if any, are included in the Statement of Operations.
The ratio of expenses to average net assets in the accompanying financial highlights excludes the reduction in expenses related to fees paid indirectly. The annualized expense ratio after waivers for the period listed below reflecting the reduction for fees paid indirectly is as follows:
| Year Ended October 31, 2014 | ||||
| Class A | 1.03 | % | ||
| Class B | 1.16 | |||
| Class C | 1.76 | |||
| Class I | 0.76 | |||
| Class R3 | 1.37 | |||
| Class R4 | 1.06 | |||
| Class R5 | 0.76 | |||
| Class Y | 0.66 | |||
Distribution and Service Plan for Class A, B, C, R3 and R4 Shares – Hartford Funds Distributors, LLC ("HFD"), an indirect wholly owned subsidiary of The Hartford, is the principal underwriter and distributor of the Fund. HFD is engaged in distribution activities, which include marketing and distribution of shares through broker/dealers, financing distribution costs and maintaining financial books and records. For the year ended October 31, 2014, HFD received front-end load sales charges of $6,452 and contingent deferred sales charges of $108 from the Fund.
The Fund has adopted a Distribution and Service Plan in accordance with Rule 12b-1 of the 1940 Act to compensate the distributor (HFD) for activities intended to result in the sale and distribution of Class A, B, C, R3 and R4 shares and for providing services for shareholders. The Rule 12b-1 plan applicable to Class A shares of the Fund provides for payment of a Rule 12b-1 fee of 0.25% of average daily net assets. Some or all of the fee may be used for shareholder servicing expenses with the remainder used for distribution expenses. Under the Class B Plan, the Fund pays the distributor 1.00% of the average daily net assets of Class B shares that are outstanding for 8 years or less, 0.25% of which is a fee for services provided to existing shareholders with the remainder used for distribution expenses. Effective July 1, 2013, there was a reduction in the amount charged in connection with the Class B shares’ Rule 12b-1 fee from 1.00% to 0.25% in accordance with applicable FINRA rules, although it is possible that such fees may be charged in the future. Some or the entire Rule 12b-1 fee for Class B shares may be remitted to broker/dealers for distribution and/or shareholder account services. After eight years, Class B shares convert to Class A shares. Upon conversion to Class A shares, the Class A plan described above will apply to those shares. Under the Class C Plan, the Fund pays the distributor 1.00% of the average daily net assets of Class C shares outstanding, 0.25% of which is intended as a fee for services provided to existing shareholders with
| 19 |
The Hartford Equity Income Fund
| Notes to Financial Statements – (continued) |
| October 31, 2014 |
| (000’s Omitted) |
the remainder used for distribution expenses. For Class C shares, some or the entire fee may be remitted to broker/dealers for distribution and/or shareholder account services. Class R3 shares have a distribution fee of 0.50% of average daily net assets and Class R4 shares have a distribution fee of 0.25% of average daily net assets. For Class R3 and R4 shares, some or the entire fee may be remitted to broker/dealers for distribution and/or shareholder account services. The Fund’s 12b-1 fees are accrued daily and paid monthly or at such other intervals as the Board of Directors may determine.
Other Related Party Transactions – Certain officers of the Fund are directors and/or officers of HFMC and/or The Hartford or its subsidiaries. For the year ended October 31, 2014, a portion of the Fund’s Chief Compliance Officer’s compensation was paid by all of the investment companies in the Hartford fund complex. The portion allocated to the Fund, as represented in other expenses on the Statement of Operations, was in the amount of $6. Hartford Administrative Services Company (“HASCO”), an indirect wholly-owned subsidiary of The Hartford, provides transfer agent services to the Fund. HASCO has contractually agreed to reimburse any portion of the transfer agency fees over 0.30% of average daily net assets per fiscal year for each class. Any transfer agency fee reimbursement is determined before considering the contractual operating expense limitation. For providing such services, HASCO is compensated on a per account basis that varies by account type, except with respect to Class Y, for which it is compensated based on average daily net assets. The amount paid to HASCO and any related contractual reimbursement amounts, if applicable, can be found in the Statement of Operations. These fees are accrued daily and paid monthly.
Administrative services fees are paid to HASCO for third-party recordkeeping services that are payable as a percentage of net assets in the amount of up to 0.20%, 0.15% and 0.10% for Classes R3, R4 and R5 shares, respectively. The total administrative services fees are shown on the Statement of Operations. These fees are accrued daily and paid monthly.
Investment Transactions:
For the year ended October 31, 2014, the cost of purchases and proceeds from sales of investment securities (excluding short-term investments) were as follows:
| Excluding U.S. Government Obligations | U.S. Government Obligations | Total | ||||||||||
| Cost of Purchases | $ | 850,784 | $ | — | $ | 850,784 | ||||||
| Sales Proceeds | 441,369 | — | 441,369 | |||||||||
| 20 |
The Hartford Equity Income Fund
| Notes to Financial Statements – (continued) |
| October 31, 2014 |
| (000’s Omitted) |
Capital Share Transactions:
The following information is for the year ended October 31, 2014, and the year ended October 31, 2013:
| For the Year Ended October 31, 2014 | For the Year Ended October 31, 2013 | |||||||||||||||||||||||||||||||
| Shares Sold | Shares
Issued for Reinvested Dividends | Shares Redeemed | Net
Increase (Decrease) of Shares | Shares Sold | Shares
Issued for Reinvested Dividends | Shares Redeemed | Net
Increase (Decrease) of Shares | |||||||||||||||||||||||||
| Class A | ||||||||||||||||||||||||||||||||
| Shares | 23,291 | 4,984 | (23,749 | ) | 4,526 | 29,669 | 2,880 | (15,303 | ) | 17,246 | ||||||||||||||||||||||
| Amount | $ | 424,828 | $ | 88,779 | $ | (438,157 | ) | $ | 75,450 | $ | 484,521 | $ | 44,537 | $ | (248,836 | ) | $ | 280,222 | ||||||||||||||
| Class B | ||||||||||||||||||||||||||||||||
| Shares | 58 | 66 | (511 | ) | (387 | ) | 192 | 46 | (592 | ) | (354 | ) | ||||||||||||||||||||
| Amount | $ | 1,064 | $ | 1,164 | $ | (9,374 | ) | $ | (7,146 | ) | $ | 3,136 | $ | 698 | $ | (9,689 | ) | $ | (5,855 | ) | ||||||||||||
| Class C | ||||||||||||||||||||||||||||||||
| Shares | 7,415 | 786 | (2,939 | ) | 5,262 | 9,476 | 312 | (1,708 | ) | 8,080 | ||||||||||||||||||||||
| Amount | $ | 134,841 | $ | 13,876 | $ | (53,667 | ) | $ | 95,050 | $ | 156,112 | $ | 4,787 | $ | (27,698 | ) | $ | 133,201 | ||||||||||||||
| Class I | ||||||||||||||||||||||||||||||||
| Shares | 23,322 | 1,902 | (14,129 | ) | 11,095 | 24,936 | 740 | (5,757 | ) | 19,919 | ||||||||||||||||||||||
| Amount | $ | 426,332 | $ | 33,880 | $ | (258,879 | ) | $ | 201,333 | $ | 409,508 | $ | 11,623 | $ | (93,792 | ) | $ | 327,339 | ||||||||||||||
| Class R3 | ||||||||||||||||||||||||||||||||
| Shares | 1,014 | 121 | (759 | ) | 376 | 1,572 | 56 | (499 | ) | 1,129 | ||||||||||||||||||||||
| Amount | $ | 18,525 | $ | 2,155 | $ | (13,900 | ) | $ | 6,780 | $ | 25,193 | $ | 872 | $ | (8,157 | ) | $ | 17,908 | ||||||||||||||
| Class R4 | ||||||||||||||||||||||||||||||||
| Shares | 1,318 | 164 | (1,114 | ) | 368 | 2,590 | 61 | (660 | ) | 1,991 | ||||||||||||||||||||||
| Amount | $ | 23,994 | $ | 2,931 | $ | (20,669 | ) | $ | 6,256 | $ | 42,339 | $ | 967 | $ | (11,076 | ) | $ | 32,230 | ||||||||||||||
| Class R5 | ||||||||||||||||||||||||||||||||
| Shares | 2,276 | 195 | (1,709 | ) | 762 | 3,820 | 40 | (428 | ) | 3,432 | ||||||||||||||||||||||
| Amount | $ | 42,018 | $ | 3,501 | $ | (31,262 | ) | $ | 14,257 | $ | 64,964 | $ | 659 | $ | (7,175 | ) | $ | 58,448 | ||||||||||||||
| Class Y | ||||||||||||||||||||||||||||||||
| Shares | 4,720 | 505 | (2,249 | ) | 2,976 | 5,731 | 216 | (1,602 | ) | 4,345 | ||||||||||||||||||||||
| Amount | $ | 86,202 | $ | 9,100 | $ | (41,733 | ) | $ | 53,569 | $ | 93,522 | $ | 3,417 | $ | (26,627 | ) | $ | 70,312 | ||||||||||||||
| Total | ||||||||||||||||||||||||||||||||
| Shares | 63,414 | 8,723 | (47,159 | ) | 24,978 | 77,986 | 4,351 | (26,549 | ) | 55,788 | ||||||||||||||||||||||
| Amount | $ | 1,157,804 | $ | 155,386 | $ | (867,641 | ) | $ | 445,549 | $ | 1,279,295 | $ | 67,560 | $ | (433,050 | ) | $ | 913,805 | ||||||||||||||
The following reflects the conversion of Class B shares into Class A shares (reflected as Class A shares sold) for the year ended October 31, 2014, and the year ended October 31, 2013:
| Shares | Dollars | |||||||
| For the Year Ended October 31, 2014 | 53 | $ | 978 | |||||
| For the Year Ended October 31, 2013 | 51 | $ | 837 | |||||
Line of Credit:
The Fund is one of several Hartford Funds that participate in a $500 million committed revolving line of credit facility. The facility is to be used for temporary or emergency purposes. Under the arrangement, the funds are required to own securities having a market value in excess of 300% of the total bank borrowings. The interest rate on borrowings varies depending on the nature of the loan. The facility also requires a fee to be paid based on the amount of the commitment. This commitment fee is allocated to all the funds participating in the line of credit based on the average net assets of the funds. During the year ended October 31, 2014, the Fund did not have any borrowings under this facility.
Pending Legal Proceedings:
On February 25, 2011, Jennifer L. Kasilag, Louis Mellinger, Judith M. Menendez, Jacqueline M. Robinson, and Linda A. Russell filed a derivative lawsuit against Hartford Investment Financial Services, LLC (“HIFSCO”) (now known as HFD) on behalf of six Hartford retail mutual funds in the United States District Court for the District of New Jersey, alleging that HIFSCO received excessive advisory and distribution fees in violation of its statutory fiduciary duty under Section 36(b) of the 1940 Act when serving as investment manager and principal underwriter, respectively, to the Hartford retail mutual funds. Although this action was purportedly filed on behalf of certain of the
| 21 |
The Hartford Equity Income Fund
| Notes to Financial Statements – (continued) |
| October 31, 2014 |
| (000’s Omitted) |
Hartford Funds, none of the Hartford Funds is itself a defendant to the suit. HIFSCO moved to dismiss and, in September 2011, the motion was granted in part and denied in part, with leave to amend the complaint. In November 2011, plaintiffs filed an amended complaint on behalf of certain Hartford retail mutual funds, The Hartford Global Health Fund (now known as The Hartford Healthcare Fund), The Hartford Conservative Allocation Fund, The Hartford Growth Opportunities Fund, The Hartford Inflation Plus Fund, The Hartford Advisers Fund (now known as The Hartford Balanced Fund), and The Hartford Capital Appreciation Fund. Plaintiffs seek to rescind the investment management agreements and distribution plans between HIFSCO and these funds and to recover the total fees charged thereunder or, in the alternative, to recover any improper compensation HIFSCO received, in addition to lost earnings. HIFSCO filed a partial motion to dismiss the amended complaint and, in December 2012, the court dismissed without prejudice the claims regarding distribution fees and denied the motion with respect to the advisory fees claims. HIFSCO disputes the allegations and intends to defend vigorously.
In March 2014, the plaintiffs filed a new complaint that added as new plaintiffs The Hartford Floating Rate Fund and The Hartford Small Company Fund and named as a defendant HFMC, which assumed the role as investment manager to the funds as of January 2013. HFMC and HIFSCO dispute the allegations and intend to defend vigorously.
No accrual for litigation relating to this matter has been recorded in the financial statements of the Fund because the Fund is not party to the suit.
Indemnifications:
Under the Company's organizational documents, the Company shall indemnify its officers and directors to the full extent required or permitted under Maryland General Corporation Law and the federal securities laws. In addition, the Company, on behalf of the Fund, may enter into contracts that contain a variety of indemnifications. The Company's maximum exposure under these arrangements is unknown. However, as of the date of these financial statements, the Company has not had prior claims or losses pursuant to these contracts and expects the risk of loss to be remote.
Subsequent Events:
At the August 5-6, 2014 meeting, the Board of Directors approved the creation of Class R6 shares for the Fund. Class R6 shares launched on November 7, 2014. In connection with the launch of the Class R6 shares, an updated prospectus, dated November 7, 2014, and Statement of Additional Information, dated March 1, 2014, as amended November 7, 2014, for the Fund were filed with the U.S. Securities and Exchange Commission.
Effective December 1, 2014, pursuant to a sub-transfer agency agreement between HASCO and Boston Financial Data Services, Inc. (“BFDS”), HASCO has delegated certain transfer agent, dividend disbursing agent and shareholder servicing agent functions to BFDS. The costs and expenses of such delegation are borne by HASCO, not by the Fund.
| 22 |
The Hartford Equity Income Fund
| Financial Highlights |
| - Selected Per-Share Data - (A) | - Ratios and Supplemental Data - | |||||||||||||||||||||||||||||||||||||||||||||||||||
| Class | Net Asset Value at Beginning of Period | Net Investment Income (Loss) | Net Realized and Unrealized Gain (Loss) on Invest- ments | Total from Investment Operations | Dividends from Net Investment Income | Distribu- tions from Realized Capital Gains | Total Dividends and Distributions | Net Asset Value at End of Period | Total Return(B) | Net Assets at End of Period (000's) | Ratio of Expenses to Average Net Assets Before Adjust- ments(C) | Ratio of Expenses to Average Net Assets After Adjust- ments(C) | Ratio of Net Investment Income (Loss) to Average Net Assets | |||||||||||||||||||||||||||||||||||||||
| For the Year Ended October 31, 2014 | ||||||||||||||||||||||||||||||||||||||||||||||||||||
| A | $ | 17.83 | $ | 0.34 | $ | 1.76 | $ | 2.10 | $ | (0.33 | ) | $ | (0.56 | ) | $ | (0.89 | ) | $ | 19.04 | 12.19 | % | $ | 1,951,760 | 1.03 | % | 1.03 | % | 1.83 | % | |||||||||||||||||||||||
| B | 17.82 | 0.32 | 1.77 | 2.09 | (0.30 | ) | (0.56 | ) | (0.86 | ) | 19.05 | 12.15 | 21,619 | 1.16 | 1.16 | 1.72 | ||||||||||||||||||||||||||||||||||||
| C | 17.77 | 0.20 | 1.75 | 1.95 | (0.20 | ) | (0.56 | ) | (0.76 | ) | 18.96 | 11.36 | 458,695 | 1.76 | 1.76 | 1.08 | ||||||||||||||||||||||||||||||||||||
| I | 17.76 | 0.38 | 1.77 | 2.15 | (0.38 | ) | (0.56 | ) | (0.94 | ) | 18.97 | 12.54 | 903,048 | 0.76 | 0.76 | 2.07 | ||||||||||||||||||||||||||||||||||||
| R3 | 17.85 | 0.27 | 1.77 | 2.04 | (0.27 | ) | (0.56 | ) | (0.83 | ) | 19.06 | 11.81 | 58,349 | 1.37 | 1.37 | 1.47 | ||||||||||||||||||||||||||||||||||||
| R4 | 17.87 | 0.33 | 1.76 | 2.09 | (0.32 | ) | (0.56 | ) | (0.88 | ) | 19.08 | 12.13 | 76,746 | 1.06 | 1.06 | 1.78 | ||||||||||||||||||||||||||||||||||||
| R5 | 17.93 | 0.38 | 1.78 | 2.16 | (0.38 | ) | (0.56 | ) | (0.94 | ) | 19.15 | 12.47 | 91,827 | 0.76 | 0.76 | 2.08 | ||||||||||||||||||||||||||||||||||||
| Y | 17.96 | 0.40 | 1.79 | 2.19 | (0.40 | ) | (0.56 | ) | (0.96 | ) | 19.19 | 12.61 | 236,502 | 0.66 | 0.66 | 2.17 | ||||||||||||||||||||||||||||||||||||
| For the Year Ended October 31, 2013 | ||||||||||||||||||||||||||||||||||||||||||||||||||||
| A | $ | 14.81 | $ | 0.32 | $ | 3.23 | $ | 3.55 | $ | (0.31 | ) | $ | (0.22 | ) | $ | (0.53 | ) | $ | 17.83 | 24.56 | % | $ | 1,746,629 | 1.06 | % | 1.06 | % | 1.98 | % | |||||||||||||||||||||||
| B | 14.78 | 0.23 | 3.22 | 3.45 | (0.19 | ) | (0.22 | ) | (0.41 | ) | 17.82 | 23.87 | 27,131 | 1.65 | 1.65 | 1.44 | ||||||||||||||||||||||||||||||||||||
| C | 14.77 | 0.20 | 3.22 | 3.42 | (0.20 | ) | (0.22 | ) | (0.42 | ) | 17.77 | 23.67 | 336,264 | 1.79 | 1.79 | 1.20 | ||||||||||||||||||||||||||||||||||||
| I | 14.75 | 0.36 | 3.22 | 3.58 | (0.35 | ) | (0.22 | ) | (0.57 | ) | 17.76 | 24.93 | 648,568 | 0.78 | 0.78 | 2.18 | ||||||||||||||||||||||||||||||||||||
| R3 | 14.83 | 0.27 | 3.23 | 3.50 | (0.26 | ) | (0.22 | ) | (0.48 | ) | 17.85 | 24.17 | 47,928 | 1.38 | 1.38 | 1.62 | ||||||||||||||||||||||||||||||||||||
| R4 | 14.84 | 0.31 | 3.25 | 3.56 | (0.31 | ) | (0.22 | ) | (0.53 | ) | 17.87 | 24.58 | 65,286 | 1.08 | 1.08 | 1.89 | ||||||||||||||||||||||||||||||||||||
| R5 | 14.88 | 0.35 | 3.27 | 3.62 | (0.35 | ) | (0.22 | ) | (0.57 | ) | 17.93 | 24.99 | 72,270 | 0.77 | 0.77 | 2.06 | ||||||||||||||||||||||||||||||||||||
| Y | 14.90 | 0.39 | 3.26 | 3.65 | (0.37 | ) | (0.22 | ) | (0.59 | ) | 17.96 | 25.13 | 167,906 | 0.67 | 0.67 | 2.35 | ||||||||||||||||||||||||||||||||||||
| For the Year Ended October 31, 2012 (D) | ||||||||||||||||||||||||||||||||||||||||||||||||||||
| A | $ | 12.93 | $ | 0.29 | $ | 1.89 | $ | 2.18 | $ | (0.30 | ) | $ | – | $ | (0.30 | ) | $ | 14.81 | 17.00 | % | $ | 1,195,106 | 1.11 | % | 1.11 | % | 2.12 | % | ||||||||||||||||||||||||
| B | 12.91 | 0.18 | 1.86 | 2.04 | (0.17 | ) | – | (0.17 | ) | 14.78 | 15.90 | 27,731 | 2.00 | 2.00 | 1.27 | |||||||||||||||||||||||||||||||||||||
| C | 12.91 | 0.19 | 1.88 | 2.07 | (0.21 | ) | – | (0.21 | ) | 14.77 | 16.13 | 160,153 | 1.84 | 1.84 | 1.35 | |||||||||||||||||||||||||||||||||||||
| I | 12.89 | 0.31 | 1.89 | 2.20 | (0.34 | ) | – | (0.34 | ) | 14.75 | 17.25 | 244,794 | 0.81 | 0.81 | 2.31 | |||||||||||||||||||||||||||||||||||||
| R3 | 12.96 | 0.24 | 1.90 | 2.14 | (0.27 | ) | – | (0.27 | ) | 14.83 | 16.63 | 23,077 | 1.42 | 1.42 | 1.72 | |||||||||||||||||||||||||||||||||||||
| R4 | 12.97 | 0.28 | 1.89 | 2.17 | (0.30 | ) | – | (0.30 | ) | 14.84 | 16.90 | 24,672 | 1.11 | 1.11 | 2.01 | |||||||||||||||||||||||||||||||||||||
| R5 | 12.99 | 0.32 | 1.91 | 2.23 | (0.34 | ) | – | (0.34 | ) | 14.88 | 17.33 | 8,931 | 0.82 | 0.82 | 2.48 | |||||||||||||||||||||||||||||||||||||
| Y | 13.01 | 0.55 | 1.69 | 2.24 | (0.35 | ) | – | (0.35 | ) | 14.90 | 17.41 | 74,613 | 0.72 | 0.72 | 2.68 | |||||||||||||||||||||||||||||||||||||
| For the Year Ended October 31, 2011 | ||||||||||||||||||||||||||||||||||||||||||||||||||||
| A | $ | 11.99 | $ | 0.25 | $ | 0.93 | $ | 1.18 | $ | (0.24 | ) | $ | – | $ | (0.24 | ) | $ | 12.93 | 9.87 | % | $ | 826,555 | 1.17 | % | 1.17 | % | 1.93 | % | ||||||||||||||||||||||||
| B | 11.97 | 0.14 | 0.93 | 1.07 | (0.13 | ) | – | (0.13 | ) | 12.91 | 8.94 | 29,071 | 2.05 | 2.00 | 1.11 | |||||||||||||||||||||||||||||||||||||
| C | 11.97 | 0.15 | 0.94 | 1.09 | (0.15 | ) | – | (0.15 | ) | 12.91 | 9.13 | 78,710 | 1.89 | 1.89 | 1.20 | |||||||||||||||||||||||||||||||||||||
| I | 11.95 | 0.28 | 0.94 | 1.22 | (0.28 | ) | – | (0.28 | ) | 12.89 | 10.24 | 52,965 | 0.88 | 0.88 | 2.21 | |||||||||||||||||||||||||||||||||||||
| R3 | 12.03 | 0.20 | 0.94 | 1.14 | (0.21 | ) | – | (0.21 | ) | 12.96 | 9.49 | 6,694 | 1.50 | 1.50 | 1.57 | |||||||||||||||||||||||||||||||||||||
| R4 | 12.03 | 0.25 | 0.93 | 1.18 | (0.24 | ) | – | (0.24 | ) | 12.97 | 9.87 | 5,651 | 1.18 | 1.18 | 1.92 | |||||||||||||||||||||||||||||||||||||
| R5 | 12.05 | 0.27 | 0.95 | 1.22 | (0.28 | ) | – | (0.28 | ) | 12.99 | 10.16 | 2,597 | 0.88 | 0.88 | 2.11 | |||||||||||||||||||||||||||||||||||||
| Y | 12.06 | 0.29 | 0.95 | 1.24 | (0.29 | ) | – | (0.29 | ) | 13.01 | 10.33 | 178,516 | 0.77 | 0.77 | 2.28 | |||||||||||||||||||||||||||||||||||||
See Portfolio Turnover information on the next page.
| 23 |
The Hartford Equity Income Fund
| Financial Highlights – (continued) |
| - Selected Per-Share Data - (A) | - Ratios and Supplemental Data - | |||||||||||||||||||||||||||||||||||||||||||||||||||
| Class | Net Asset Value at Beginning of Period | Net Investment Income (Loss) | Net Realized and Unrealized Gain (Loss) on Invest- ments | Total from Investment Operations | Dividends from Net Investment Income | Distribu- tions from Realized Capital Gains | Total Dividends and Distributions | Net Asset Value at End of Period | Total Return(B) | Net Assets at End of Period (000's) | Ratio of Expenses to Average Net Assets Before Adjust- ments(C) | Ratio of Expenses to Average Net Assets After Adjust- ments(C) | Ratio of Net Investment Income (Loss) to Average Net Assets | |||||||||||||||||||||||||||||||||||||||
| For the Year Ended October 31, 2010 (D) | ||||||||||||||||||||||||||||||||||||||||||||||||||||
| A | $ | 10.74 | $ | 0.21 | $ | 1.24 | $ | 1.45 | $ | (0.20 | ) | $ | – | $ | (0.20 | ) | $ | 11.99 | 13.63 | % | $ | 716,700 | 1.20 | % | 1.20 | % | 1.86 | % | ||||||||||||||||||||||||
| B | 10.72 | 0.13 | 1.23 | 1.36 | (0.11 | ) | – | (0.11 | ) | 11.97 | 12.73 | 31,038 | 2.08 | 2.00 | 1.07 | |||||||||||||||||||||||||||||||||||||
| C | 10.73 | 0.13 | 1.23 | 1.36 | (0.12 | ) | – | (0.12 | ) | 11.97 | 12.75 | 57,416 | 1.92 | 1.92 | 1.13 | |||||||||||||||||||||||||||||||||||||
| I | 10.72 | 0.23 | 1.23 | 1.46 | (0.23 | ) | – | (0.23 | ) | 11.95 | 13.76 | 16,462 | 0.93 | 0.93 | 2.06 | |||||||||||||||||||||||||||||||||||||
| R3 | 10.78 | 0.15 | 1.27 | 1.42 | (0.17 | ) | – | (0.17 | ) | 12.03 | 13.28 | 1,719 | 1.55 | 1.55 | 1.37 | |||||||||||||||||||||||||||||||||||||
| R4 | 10.78 | 0.21 | 1.24 | 1.45 | (0.20 | ) | – | (0.20 | ) | 12.03 | 13.59 | 2,926 | 1.20 | 1.20 | 1.80 | |||||||||||||||||||||||||||||||||||||
| R5 | 10.79 | 0.21 | 1.29 | 1.50 | (0.24 | ) | – | (0.24 | ) | 12.05 | 14.06 | 694 | 0.87 | 0.87 | 1.70 | |||||||||||||||||||||||||||||||||||||
| Y | 10.81 | 0.26 | 1.24 | 1.50 | (0.25 | ) | – | (0.25 | ) | 12.06 | 14.01 | 71,899 | 0.79 | 0.79 | 2.27 | |||||||||||||||||||||||||||||||||||||
| (A) | Information presented relates to a share outstanding throughout the indicated period. Net investment income (loss) per share amounts are calculated based on average shares outstanding unless otherwise noted. |
| (B) | Assumes initial investment at net asset value at the beginning of each period, reinvestment of all distributions, the complete redemption of the investment at net asset value at the end of each period and no sales charge. Total return would be reduced if sales charges were taken into account. |
| (C) | Adjustments include waivers and reimbursements, if applicable. Ratios do not include fees paid indirectly (see Expenses in the accompanying Notes to Financial Statements). |
| (D) | Net investment income (loss) per share amounts have been calculated using the SEC method. |
| Portfolio Turnover Rate for All Share Classes | ||||
| For the Year Ended October 31, 2014 | 13 | % | ||
| For the Year Ended October 31, 2013 | 17 | |||
| For the Year Ended October 31, 2012 | 27 | |||
| For the Year Ended October 31, 2011 | 18 | |||
| For the Year Ended October 31, 2010 | 27 | |||
| 24 |
Report of Independent Registered Public Accounting Firm
| The Board of Directors and Shareholders of |
| The Hartford Mutual Funds, Inc. |
We have audited the accompanying statement of assets and liabilities, including the schedule of investments, of The Hartford Equity Income Fund (one of the portfolios constituting The Hartford Mutual Funds, Inc. (the Funds)) as of October 31, 2014, and the related statement of operations for the year then ended, the statements of changes in net assets for each of the two years in the period then ended, and the financial highlights for each of the five years in the period then ended. These financial statements and financial highlights are the responsibility of the Funds’ management. Our responsibility is to express an opinion on these financial statements and financial highlights based on our audits.
We conducted our audits in accordance with the standards of the Public Company Accounting Oversight Board (United States). Those standards require that we plan and perform the audit to obtain reasonable assurance about whether the financial statements and financial highlights are free of material misstatement. We were not engaged to perform an audit of the Funds’ internal control over financial reporting. Our audits included consideration of internal control over financial reporting as a basis for designing audit procedures that are appropriate in the circumstances, but not for the purpose of expressing an opinion on the effectiveness of the Funds’ internal control over financial reporting. Accordingly, we express no such opinion. An audit also includes examining, on a test basis, evidence supporting the amounts and disclosures in the financial statements and financial highlights, assessing the accounting principles used and significant estimates made by management, and evaluating the overall financial statement presentation. Our procedures included confirmation of securities owned as of October 31, 2014, by correspondence with the custodian. We believe that our audits provide a reasonable basis for our opinion.
In our opinion, the financial statements and financial highlights referred to above present fairly, in all material respects, the financial position of The Hartford Equity Income Fund of The Hartford Mutual Funds, Inc. at October 31, 2014, the results of its operations for the year then ended, the changes in its net assets for each of the two years in the period then ended, and the financial highlights for each of the five years in the period then ended, in conformity with U.S. generally accepted accounting principles.
|
Minneapolis, Minnesota
December 18, 2014
| 25 |
The Hartford Equity Income Fund
| Directors and Officers (Unaudited) |
The Board of Directors of the Company (the "Directors") appoints officers who are responsible for the day-to-day operations of the Fund and who execute policies formulated by the Directors. Each Director serves until his or her death, resignation, or retirement or until the next annual meeting of shareholders is held or until his or her successor is elected and qualifies.
Directors and officers who are employed by or who have a financial interest in The Hartford Financial Services Group, Inc. ("The Hartford") are considered “interested” persons of the Fund pursuant to the 1940 Act. Each officer and two of the Company's Directors, as noted in the chart below, are “interested” persons of the Fund. Each Director serves as a director for The Hartford Mutual Funds, Inc., The Hartford Mutual Funds II, Inc., Hartford Series Fund, Inc., and Hartford HLS Series Fund II, Inc., and as a trustee for The Hartford Alternative Strategies Fund, which, as of October 31, 2014, collectively consist of 66 funds. Correspondence may be sent to Directors and officers c/o Hartford Funds, 5 Radnor Corporate Center, Suite 300, 100 Matsonford Road, Radnor, Pennsylvania 19087, except that correspondence to Mr. Annoni, Mr. Dressen and Ms. Quade may be sent to 500 Bielenberg Drive, Suite 500, Woodbury, Minnesota 55125.
The table below sets forth, for each Director and officer, his or her name, year of birth, current position with the Company and date first elected or appointed to The Hartford Mutual Funds, Inc. ("MF") and The Hartford Mutual Funds II, Inc. ("MF2"), principal occupation, and, for Directors, other directorships held. The Fund’s Statement of Additional Information contains further information on the Directors and is available free of charge by calling 1-888-843-7824 or writing to: Hartford Funds, P.O. Box 55022, Boston, MA 02205-5022.
Information on the aggregate remuneration paid to the directors of the Company can be found in the Statement of Operations herein. The Fund pays to The Hartford a portion of the Chief Compliance Officer’s compensation, but does not pay salaries or compensation to any of its other officers or Directors who are employed by The Hartford.
Non-Interested Directors
Hilary E. Ackermann (1956) Director since September 23, 2014
Ms. Ackermann served as Chief Risk Officer at Goldman Sachs Bank USA from October 2008 to November 2011 and serves as a Director of Dynegy, Inc., an independent power company, from October 2012 to present.
Lynn S. Birdsong (1946) Director since 2003, Chairman of the Investment Committee since 2014
Mr. Birdsong is a private investor. Mr. Birdsong currently serves as a Director of the Sovereign High Yield Investment Company (April 2010 to current). Mr. Birdsong currently serves as an Independent Director of Nomura Partners Funds, Inc. (formerly, The Japan Fund) (April 2003 to current). From 2003 to March 2005, Mr. Birdsong was an Independent Director of the Atlantic Whitehall Funds. From 1979 to 2002, Mr. Birdsong was a Managing Director of Zurich Scudder Investments, an investment management firm. During his employment with Scudder, Mr. Birdsong was an Interested Director of The Japan Fund. From January 1981 through December 2013, Mr. Birdsong was a partner in Birdsong Company, an advertising specialty firm.
Robert M. Gavin, Jr. (1940) Director since 2002 (MF) and 1986 (MF2), Chairman of the Board for each since 2004
Dr. Gavin is an educational consultant. Prior to September 1, 2001, he was President of Cranbrook Education Community and prior to July 1996, he was President of Macalester College, St. Paul, Minnesota.
Duane E. Hill (1945) Director since 2001 (MF) and 2002 (MF2), Chairman of the Nominating Committee since 2003
Mr. Hill is a Partner of TSG Ventures L.P., a private equity investment company. Mr. Hill is a former partner of TSG Capital Group, a private equity investment firm that served as sponsor and lead investor in leveraged buyouts of middle market companies.
Sandra S. Jaffee (1941) Director since 2005
Ms. Jaffee is the founder and Chief Executive Officer of a private company, Homeworks Concierge, LLC, which provides residential property management services in Westchester County, New York (January 2012 to present). Ms. Jaffee served as Chairman (2008 to 2009) and Chief Executive Officer of Fortent (formerly Searchspace Group), a leading provider of compliance/regulatory technology to financial institutions from August 2005 to August 2009. From August 2004 to August 2005, Ms. Jaffee served as an Entrepreneur in Residence with Warburg Pincus, a private equity firm. Prior to joining Warburg Pincus, Ms. Jaffee served as Executive Vice President at Citigroup, from September 1995 to July 2004, where she was President and Chief Executive Officer of Citibank’s Global Securities Services (1995 to 2003). Ms. Jaffee currently serves as a member of the Board of Directors of Broadridge Financial Solutions as well as a Trustee of Muhlenberg College.
| 26 |
The Hartford Equity Income Fund
| Directors and Officers (Unaudited) – (continued) |
William P. Johnston (1944) Director since 2005, Chairman of the Compliance Committee since 2005
In June 2006, Mr. Johnston was appointed as Senior Advisor to The Carlyle Group, a global private equity and other alternative asset investment firm and currently serves as an Operating Executive. In July 2006, Mr. Johnston was elected to the Board of Directors of MultiPlan, Inc. and served as a Director (July 2006 to August 2010). In August 2007, Mr. Johnston was elected to the Board of Directors of LifeCare Holdings, Inc. and served as a Director (August 2007 to June 2013). In February 2008, Mr. Johnston was elected to the Board of Directors of HCR-ManorCare, Inc. In May 2006, Mr. Johnston was elected to the Supervisory Board of Fresenius Medical Care AG & Co. KGaA, after its acquisition of Renal Care Group, Inc. in March 2006. Mr. Johnston joined Renal Care Group in November 2002 as a member of the Board of Directors and served as Chairman of the Board from March 2003 through March 2006. From 2002 through 2013, Mr. Johnston served as a Board member of the Georgia O’Keefe Museum. From September 1987 to December 2002, Mr. Johnston was with Equitable Securities Corporation (and its successors, SunTrust Equitable Securities and SunTrust Robinson Humphrey) serving in various investment banking and managerial positions, including Managing Director and Head of Investment Banking, Chief Executive Officer and Vice Chairman.
Phillip O. Peterson (1944) Director since 2002 (MF) and 2000 (MF2), Chairman of the Audit Committee since 2002
Mr. Peterson is a mutual fund industry consultant. He was a partner of KPMG LLP (an accounting firm) until July 1999. Mr. Peterson joined William Blair Funds in February 2007 as a member of the Board of Trustees. From February 2012 to February 2014, Mr. Peterson served as a Trustee of Symetra Variable Mutual Funds. From January 2004 to April 2005, Mr. Peterson served as Independent President of the Strong Mutual Funds.
Lemma W. Senbet (1946) Director since 2005
Dr. Senbet is the William E. Mayer Chair Professor of Finance and Founding Director, Center for Financial Policy, at the University of Maryland, Robert H. Smith School of Business. He was chair of the Finance Department of the University of Maryland, Robert H. Smith School of Business from 1998 to 2006. Since June 2013, he has been on leave from the University to serve as Executive Director of African Economic Research Consortium which focuses on economic policy research and training. Previously, he was a chaired professor of finance at the University of Wisconsin-Madison. Also, he was a Director of the Fortis Funds from March 2000 to July 2002. Dr. Senbet served as Director of the American Finance Association and President of the Western Finance Association. In 2006, Dr. Senbet was inducted Fellow of Financial Management Association International for his career-long distinguished scholarship and professional service.
Interested Directors and Officers
James E. Davey (1964) Director since 2012, President and Chief Executive Officer since 2010
Mr. Davey serves as Executive Vice President of Hartford Life Insurance Company (“HLIC”) and The Hartford. Additionally, Mr. Davey serves as Chairman of the Board, Manager and Senior Managing Director of Hartford Funds Distributors, LLC (“HFD”). He also currently serves as Director, Chairman of the Board, President and Senior Managing Director of Hartford Administrative Services Company (“HASCO”). Mr. Davey also serves as Manager, Chairman of the Board and Senior Managing Director for Hartford Funds Management Company, LLC (“HFMC”) and Director, Chairman of the Board and Senior Managing Director for Hartford Funds Management Group, Inc. ("HFMG"). Mr. Davey has served in various positions within The Hartford and its subsidiaries in connection with the operation of the Hartford Funds. Mr. Davey joined The Hartford in 2002.
Lowndes A. Smith* (1939) Director since 1996 (MF) and 2002 (MF2)
Mr. Smith served as Vice Chairman of The Hartford from February 1997 to January 2002, as President and Chief Executive Officer of Hartford Life, Inc. from February 1997 to January 2002, and as President and Chief Operating Officer of The Hartford Life Insurance Companies from January 1989 to January 2002. Mr. Smith serves as a Director of White Mountains Insurance Group Ltd. (October 2003 to current); One Beacon Insurance (October 2006 to current); Symetra Financial (August 2007 to current) and is a Managing Director of Whittington Gray Associates (January 2007 to current).
* Mr. Smith resigned as a Director of MF, MF2, Hartford Series Fund, Inc. and Hartford HLS Series Fund II, Inc. and as a Trustee of The Hartford Alternative Strategies Fund effective September 17, 2014.
Other Officers
Mark A. Annoni (1964) Vice President, Controller and Treasurer since 2012
Mr. Annoni currently serves as the Assistant Vice President of HLIC (February 2004 to present) and Senior Vice President of HFMG (December 2013 to present). Mr. Annoni has served in various positions within The Hartford and its subsidiaries in connection with the operation of the Hartford Funds. Mr. Annoni joined The Hartford in 2001.
| 27 |
The Hartford Equity Income Fund
| Directors and Officers (Unaudited) – (continued) |
Michael R. Dressen (1963) AML Compliance Officer since 2011
Mr. Dressen currently serves as Assistant Vice President of HLIC. He also serves as Chief Compliance Officer and AML Compliance Officer of HASCO and as AML Officer of HFD. Mr. Dressen has served in various positions within The Hartford and its subsidiaries in connection with the operation of the Hartford Funds.
Edward P. Macdonald (1967) Vice President, Secretary and Chief Legal Officer since 2005
Mr. Macdonald currently serves as Assistant Secretary, Executive Vice President and Deputy General Counsel of HFD, HASCO, HFMC and HFMG. He also serves as Vice President of HLIC. Mr. Macdonald has served in various positions within The Hartford and its subsidiaries in connection with the operation of the Hartford Funds. Mr. Macdonald joined The Hartford in 2005.
Joseph G. Melcher (1973) Vice President and Chief Compliance Officer since 2013
Mr. Melcher currently serves as Executive Vice President of HFD, HFMG and HASCO. Mr. Melcher also currently serves as Executive Vice President and Chief Compliance Officer of HFMC. Mr. Melcher has served in various positions within The Hartford and its subsidiaries in connection with the operation of the Hartford Funds since joining The Hartford in 2012. Prior to joining The Hartford, Mr. Melcher worked at Touchstone Investments, a member of the Western & Southern Financial Group, where he held the position of Vice President and Chief Compliance Officer from 2010 through 2012 and Assistant Vice President, Compliance from 2005 to 2010.
Vernon J. Meyer (1964) Vice President since 2006
Mr. Meyer currently serves as Senior Vice President of HLIC. He also currently serves as Managing Director and Chief Investment Officer of HFMC and Managing Director of HFMG. Mr. Meyer has served in various positions within The Hartford and its subsidiaries in connection with the operation of the Hartford Funds. Mr. Meyer joined The Hartford in 2004.
Laura S. Quade (1969) Vice President since 2012
Ms. Quade currently serves as Vice President of HASCO, HFD and HFMG. She is the Head of Operations of HASCO and formerly served as Director, Enterprise Operations of HLIC. Ms. Quade has served in various positions within The Hartford and its subsidiaries in connection with the operation of the Hartford Funds. Ms. Quade joined The Hartford in 2001.
Martin A. Swanson** (1962) Vice President since 2010
Mr. Swanson currently serves as Vice President of HLIC. Mr. Swanson also serves as Managing Director, Chief Marketing Officer and Principal of HFD and Managing Director of HFMG. Mr. Swanson has served in various positions within The Hartford and its subsidiaries in connection with the operation of the Hartford Funds.
** Mr. Swanson resigned as an officer effective November 6, 2014.
HOW TO OBTAIN A COPY OF THE FUND’S PROXY VOTING POLICIES AND VOTING RECORDS (UNAUDITED)
A description of the policies and procedures that the Fund uses to determine how to vote proxies relating to portfolio securities and information about how the Fund voted proxies relating to portfolio securities during the most recent twelve-month period ended June 30 are available (1) without charge, upon request, by calling 888-843-7824 and (2) on the SEC’s website at http://www.sec.gov.
QUARTERLY PORTFOLIO HOLDINGS INFORMATION (UNAUDITED)
The Fund files a complete schedule of portfolio holdings with the SEC for the first and third quarters of each fiscal year on Form N-Q. The Fund’s Forms N-Q are available (1) without charge, upon request, by calling 888-843-7824 and (2) on the SEC’s website at http://www.sec.gov. The Form N-Q may be reviewed and copied at the SEC’s Public Reference Room in Washington, DC. Information on the operation of the Public Reference Room may be obtained by calling 1-800-SEC-0330.
| 28 |
The Hartford Equity Income Fund
| Federal Tax Information (Unaudited) |
For the fiscal year ended October 31, 2014, there is no further federal tax information required for this Fund.
| 29 |
The Hartford Equity Income Fund
| Expense Example (Unaudited) |
Your Fund's Expenses
As a shareholder of the Fund, you incur two types of costs: (1) transaction costs, including sales charges (loads) on purchase payments, if any, and contingent deferred sales charges (CDSC), if any, and (2) ongoing costs, including investment management fees, distribution and/or service (12b-1) fees, if any, and other fund expenses. This example is intended to help you understand your ongoing costs (in dollars) of investing in the Fund and to compare these costs with the ongoing costs of investing in other mutual funds. The example is based on an investment of $1,000 invested at the beginning of the period and held for the entire period of April 30, 2014 through October 31, 2014.
Actual Expenses
The first set of columns of the table below provides information about actual account values and actual expenses. You may use the information in this column, together with the amount you invested, to estimate the expenses that you paid over the period. Simply divide your account value by $1,000 (for example, an $8,600 account value divided by $1,000 = 8.6), then multiply the result by the number in the line under the heading entitled “Expenses Paid During Period” to estimate the expenses you paid on your account during this period.
Hypothetical Example for Comparison Purposes
The second set of columns of the table below provides information about hypothetical account values and hypothetical expenses based on the Fund's actual expense ratio and an assumed rate of return of 5% per year before expenses, which is not the Fund's actual return. The hypothetical account values and expenses may not be used to estimate the actual ending account balance or expenses you paid for the period. You may use this information to compare the ongoing costs of investing in the Fund and other funds. To do so, compare this 5% hypothetical example with the 5% hypothetical examples that appear in the shareholder reports of the other funds.
Please note that the expenses shown in the table are meant to highlight your ongoing costs only and do not reflect any transactional costs, such as sales charges (loads) and CDSC. Therefore, the second set of columns of the table is useful in comparing ongoing costs only, and will not help you determine the relative total costs of owning different funds. In addition, if these transactional costs were included, your costs would be higher. Expenses are equal to the Fund's annualized expense ratios multiplied by average account value over the period, multiplied by 184/365 (to reflect the one-half year period).
| Actual return | Hypothetical (5% return before expenses) | |||||||||||||||||||||||||||||||||||
| Beginning Account Value April 30, 2014 | Ending
Account Value October 31, 2014 | Expenses
paid during the period April 30, 2014 through October 31, 2014 | Beginning Account Value April 30, 2014 | Ending
Account Value October 31, 2014 | Expenses
paid during the period April 30, 2014 through October 31, 2014 | Annualized expense ratio | Days in the current 1/2 year | Days in the full year | ||||||||||||||||||||||||||||
| Class A | $ | 1,000.00 | $ | 1,034.10 | $ | 5.28 | $ | 1,000.00 | $ | 1,020.01 | $ | 5.25 | 1.03 | % | 184 | 365 | ||||||||||||||||||||
| Class B | $ | 1,000.00 | $ | 1,033.40 | $ | 5.90 | $ | 1,000.00 | $ | 1,019.40 | $ | 5.86 | 1.15 | 184 | 365 | |||||||||||||||||||||
| Class C | $ | 1,000.00 | $ | 1,030.10 | $ | 9.02 | $ | 1,000.00 | $ | 1,016.32 | $ | 8.96 | 1.76 | 184 | 365 | |||||||||||||||||||||
| Class I | $ | 1,000.00 | $ | 1,035.60 | $ | 3.95 | $ | 1,000.00 | $ | 1,021.33 | $ | 3.92 | 0.77 | 184 | 365 | |||||||||||||||||||||
| Class R3 | $ | 1,000.00 | $ | 1,032.40 | $ | 7.03 | $ | 1,000.00 | $ | 1,018.29 | $ | 6.98 | 1.37 | 184 | 365 | |||||||||||||||||||||
| Class R4 | $ | 1,000.00 | $ | 1,033.90 | $ | 5.48 | $ | 1,000.00 | $ | 1,019.82 | $ | 5.44 | 1.07 | 184 | 365 | |||||||||||||||||||||
| Class R5 | $ | 1,000.00 | $ | 1,035.30 | $ | 3.94 | $ | 1,000.00 | $ | 1,021.33 | $ | 3.91 | 0.77 | 184 | 365 | |||||||||||||||||||||
| Class Y | $ | 1,000.00 | $ | 1,036.30 | $ | 3.43 | $ | 1,000.00 | $ | 1,021.84 | $ | 3.40 | 0.67 | 184 | 365 | |||||||||||||||||||||
| 30 |
The Hartford Equity Income Fund
| Approval of Investment Management and Investment Sub-Advisory Agreements (Unaudited) |
Section 15(c) of the Investment Company Act of 1940, as amended (the “1940 Act”), requires that each mutual fund’s board of directors, including a majority of those directors who are not “interested persons” of the mutual fund, as defined in the 1940 Act (the “Independent Directors”), annually review and consider the continuation of the mutual fund’s investment advisory and sub-advisory agreements. At its meeting held on August 5-6, 2014, the Board of Directors (the “Board”) of The Hartford Mutual Funds, Inc., including each of the Independent Directors, unanimously voted to approve the continuation of the investment management agreement for The Hartford Equity Income Fund (the “Fund”) with Hartford Funds Management Company, LLC (“HFMC”) and the continuation of the investment sub-advisory agreement between HFMC and the Fund’s sub-adviser, Wellington Management Company, LLP (the “Sub-adviser,” and together with HFMC, the “Advisers”) (collectively, the “Agreements”).
In the months preceding the August 5-6, 2014 meeting, the Board requested, received and reviewed written responses from the Advisers to questions posed to them on behalf of the Independent Directors and supporting materials relating to those questions and responses. The Board considered information furnished to the Board at its meetings throughout the year, as well as information specifically prepared in connection with the annual approval of the Agreements at the Board’s meetings held on June 17-18, 2014 and August 5-6, 2014. Information provided to the Board at its meetings throughout the year included, among other things, reports on Fund performance, legal and compliance matters, sales and marketing activity, shareholder services, and the other services provided to the Fund by the Advisers and their affiliates. The Board also received in-person presentations by Fund officers and representatives of HFMC at the Board’s meetings on June 17-18, 2014 and August 5-6, 2014 concerning the Agreements.
The Independent Directors, advised by independent legal counsel, engaged service providers to assist them with evaluating the Agreements with respect to the Fund. Lipper Inc. (“Lipper”), an independent provider of investment company data, was retained to provide the Board with reports on how the Fund’s contractual management fees, actual management fees, other non-management fees, overall expense ratios and investment performance compared to those of mutual funds with similar investment objectives. The Independent Directors also engaged an independent financial services consultant (the “Consultant”) to assist them in evaluating the Fund’s management fees, sub-advisory fees, other non-management fees, overall expense ratios and investment performance. In addition, the Consultant reviewed the profitability calculations utilized by HFMC in connection with the continuation of the investment management agreement.
In determining whether to continue the Agreements for the Fund, the members of the Board reviewed and evaluated information and factors they believed to be relevant and appropriate in light of the information that the Board deemed necessary and appropriate through the exercise of its reasonable business judgment. While individual members of the Board may have weighed certain factors differently, the Board’s determination to continue the Agreements was based on a comprehensive consideration of all information provided to the Board throughout the year and specifically with respect to the continuation of the Agreements. A more detailed discussion of the factors the Board considered with respect to its approval of the Agreements is provided below.
Nature, Extent and Quality of Services Provided by the Advisers
The Board requested and considered information concerning the nature, extent and quality of the services provided to the Fund by the Advisers. The Board considered, among other things, the terms of the Agreements and the range of services provided by the Advisers. The Board considered the Advisers’ professional personnel who provide services to the Fund, including each Adviser’s ability and experience in attracting and retaining qualified personnel to service the Fund. The Board considered each Adviser’s reputation and overall financial strength, as well as its willingness to consider and implement organizational and operational changes designed to enhance services to the Hartford Funds. In addition, the Board considered the quality of each Adviser’s communications with the Board and responsiveness to Board inquiries and requests made from time to time with respect to the Fund and other Hartford Funds.
The Board also requested and evaluated information concerning each Adviser’s regulatory and compliance environment. In this regard, the Board requested and reviewed information on each Adviser’s compliance policies and procedures, compliance history, and a report from the Fund’s Chief Compliance Officer on each Adviser’s compliance with applicable laws and regulations, including responses to regulatory developments and compliance issues raised by regulators. The Board also noted the Advisers’ support of the Fund’s compliance control structure, particularly the resources devoted by the Advisers in support of the Fund’s obligations pursuant to Rule 38a-1 under the 1940 Act.
With respect to HFMC, the Board noted that, under the Agreements, HFMC is responsible for the management of the Fund, including oversight of fund operations and service providers, and provides administrative and investment advisory services in connection with selecting, monitoring and supervising the Sub-adviser. The Board considered HFMC’s ongoing monitoring of people, process and performance, including its quarterly reviews of each of the Hartford Funds, semi-annual meetings with the leaders of each Fund’s portfolio management team, and oversight of the Hartford Funds’ approximately 66 portfolio managers. The Board recognized that HFMC has demonstrated a record of making changes to the
| 31 |
The Hartford Equity Income Fund
| Approval of Investment Management and Investment Sub-Advisory Agreements (Unaudited) – (continued) |
management and/or strategies of the Hartford Funds when warranted. The Board considered HFMC’s oversight of the Sub-adviser’s investment approach and results, process for monitoring best execution of portfolio trades by the Sub-adviser, and approach to risk management with respect to the Fund and the service providers to the Fund. The Board also considered HFMC’s oversight of compliance with the Fund’s objective and policies as well as with applicable laws and regulations, noting that regulatory and other developments had over time led to an increase in the scope of HFMC’s services in this regard.
In addition, the Board considered HFMC’s ongoing commitment to review and rationalize the Hartford Funds product line-up and the expenses that HFMC had incurred in connection with fund combinations in recent years. The Board considered that HFMC or its affiliates are responsible for providing the Fund’s officers.
With respect to the Sub-adviser, which provides certain day-to-day portfolio management services for the Fund, the Board considered the quality of the Fund’s portfolio managers, the Sub-adviser’s other investment personnel, its investment philosophy and process, investment research capabilities and resources, performance record, trade execution capabilities and experience. The Board considered the experience of the Fund’s portfolio managers, the number of accounts managed by the portfolio managers, and the Sub-adviser’s method for compensating the portfolio managers.
Based on these considerations, the Board concluded that it was satisfied with the nature, extent and quality of the services provided to the Fund by HFMC and the Sub-adviser.
Performance of the Fund and the Advisers
The Board considered the investment performance of the Fund. In this regard, the Board reviewed the performance of the Fund over different time periods presented in the materials and evaluated HFMC’s analysis of the Fund’s performance for these time periods. The Board considered information and materials provided to the Board by the Advisers concerning Fund performance, as well as information from Lipper comparing the investment performance of the Fund to an appropriate benchmark and universe of peer funds. The Board noted that the Fund’s performance was in the 2nd quintile of its performance universe for the 1- and 5-year periods and the 1st quintile for the 3-year period. The Board also noted that the Fund’s performance was below its benchmark for the 1-year period, above its benchmark for the 3-year period and in line with its benchmark for the 5-year period.
The Board considered the detailed investment analytics reports provided by Hartford Funds’ Investment Advisory Group throughout the year. These reports include, among other things, information on the Fund’s gross and net returns, the Fund’s investment performance relative to an appropriate benchmark and peer group, various statistics concerning the Fund’s portfolio, and a narrative summary of various factors affecting Fund performance. The Board considered the Advisers’ cooperation with the Investment Committee, which assists the Board in evaluating the performance of the Fund at periodic meetings throughout the year. The Board also considered the analysis provided by the Consultant relating to the Fund’s performance track record.
In light of all the considerations noted above, the Board concluded that it had continued confidence in HFMC’s and the Sub-adviser’s overall capabilities to manage the Fund.
Costs of the Services and Profitability of the Advisers
The Board reviewed information regarding HFMC’s cost to provide investment management and related services to the Fund and HFMC’s profitability, both overall and for the Fund, on a pre-tax basis without regard to distribution expenses. The Board also requested and reviewed information about the profitability to HFMC and its affiliates from all services provided to the Fund and all aspects of their relationship with the Fund. The Board also requested and received information relating to the operations and profitability of the Sub-adviser.
The Board considered the Consultant’s review of the profitability calculations used by HFMC in connection with the continuation of the investment management agreement, noting the Consultant’s view that Hartford Funds’ process for calculating and reporting Fund profitability is reasonable. In this regard, the Board noted that the Consultant performed a full review of this process in light of the recent restructuring of the Hartford Funds business and reported that the approach to analyzing Fund profitability, including the use of common expense allocation methodologies, is reasonable, sound and well within common industry practice.
Based on these considerations, the Board concluded that the profits anticipated to be realized by the Advisers and their affiliates from their relationships with the Fund would not be excessive.
| 32 |
The Hartford Equity Income Fund
| Approval of Investment Management and Investment Sub-Advisory Agreements (Unaudited) – (continued) |
Comparison of Fees and Services Provided by the Advisers
The Board considered comparative information with respect to the management fees to be paid by the Fund to HFMC and the total expense ratios of the Fund. The Board also considered comparative information with respect to the sub-advisory fees to be paid by HFMC to the Sub-adviser. In this regard, the Board requested and reviewed information from HFMC and the Sub-adviser relating to the management and sub-advisory fees, including the sub-advisory fee schedule for the Fund, and total operating expenses for the Fund. With respect to the sub-advisory fee schedule, the Board considered representations from HFMC and the Sub-adviser that the Sub-adviser’s fees were negotiated at arm’s length on a fund-by-fund basis. The Board also reviewed information from Lipper comparing the Fund’s contractual management fees, actual management fees and overall expense ratios relative to a group of funds selected by Lipper, in consultation with the Consultant, and a broader universe of funds selected by Lipper. The Board considered that the Fund’s contractual management fee was in the 3rd quintile of its expense group, while its actual management fee was in the 2nd quintile and its total expenses (less 12b-1 and shareholder service fees) were in the 1st quintile. The Board noted that the Fund has an automatically renewable contractual expense cap on each share class. The expense cap resulted in reimbursement of certain expenses incurred in 2013.
While the Board recognized that comparisons between the Fund and peer funds may be imprecise, given the different service levels and characteristics of mutual funds and the different business models and cost structures of the Advisers, the comparative information provided by Lipper assisted the Board in evaluating the reasonableness of the Fund’s management and sub-advisory fees and total operating expenses. In addition, the Board considered the analysis and recommendations of the Consultant relating to the Fund’s management and sub-advisory fees and total operating expenses.
Based on these considerations, the Board concluded that the Fund’s fees and total operating expenses, in conjunction with the information about quality of services, profitability, economies of scale, and other matters discussed, were reasonable in light of the services provided.
Economies of Scale
The Board requested and considered information regarding the Advisers’ realization of economies of scale with respect to the Fund and whether the fee levels reflect these economies of scale for the benefit of the Fund’s shareholders. The Board reviewed the breakpoints in the management fee schedule for the Fund, which reduce fee rates as Fund assets grow over time. The Board recognized that a fund with assets beyond the highest breakpoint level will continue to benefit from economies of scale because additional assets are charged the lowest breakpoint fee resulting in lower overall effective management fee rates. The Board also considered that expense limitations and fee waivers that reduce the Fund’s expenses at all asset levels can have the same effect as breakpoints in sharing economies of scale with shareholders and provide protection from an increase in expenses if Fund assets decline. The Board recognized that a fee schedule that reaches a lower breakpoint quickly provides shareholders with the benefit of anticipated or potential economies of scale. The Board also considered that HFMC has been active in managing expenses, which has resulted in benefits being realized by shareholders as assets within the Hartford Funds family of funds have grown over time, including through lower transfer agent costs and other operating expenses.
The Board reviewed and evaluated materials from Lipper and the Consultant showing how management fee schedules of peer funds reflect economies of scale for the benefit of shareholders as a peer fund’s assets hypothetically increase over time. Based on information provided by HFMC, Lipper, and the Consultant, the Board recognized that there is no uniform methodology for establishing breakpoints or uniform pattern in asset levels that trigger breakpoints or the amounts of breakpoints triggered.
After considering all of the information available to it, the Board concluded that it was satisfied with the extent to which economies of scale would be shared for the benefit of the Fund’s shareholders based on currently available information and the effective advisory fees and expense ratios for the Fund at its current and reasonably anticipated asset levels. The Board noted, however, that it would continue to monitor future growth in Fund assets and the appropriateness of additional breakpoints.
Other Benefits
The Board considered other benefits to the Advisers and their affiliates from their relationships with the Fund.
The Board noted that HFMC receives fees for fund accounting and related services from the Fund, and the Board considered information on profits to HFMC for such services. The Board also considered that Hartford Administrative Services Company (“HASCO”), the Fund’s transfer agent and an affiliate of HFMC, receives transfer agency compensation from the Fund, and the Board reviewed information on the profitability of
| 33 |
The Hartford Equity Income Fund
| Approval of Investment Management and Investment Sub-Advisory Agreements (Unaudited) – (continued) |
the Fund’s transfer agency function to HASCO. The Board considered information provided by HASCO indicating that the transfer agent fees charged by HASCO to the Fund were fair and reasonable based on publicly available information.
The Board also considered that Hartford Funds Distributors, LLC (“HFD”), an affiliate of HFMC, serves as principal underwriter of the Fund. As principal underwriter, HFD receives 12b-1 fees from the Fund and receives all or a portion of the sales charges on sales or redemptions of certain classes of shares. The Board also noted that certain affiliates of HFD distribute shares of the Fund and receive compensation in that connection.
The Board considered benefits to the Sub-adviser from its use of the Fund’s brokerage commissions to obtain soft dollar research, and representations from HFMC and the Sub-adviser that the Sub-adviser would not make any revenue-sharing payments or any other type of distribution payments to HFMC or its affiliates.
The Board considered the benefits to shareholders of being part of the Hartford Funds family of funds, including the right to exchange investments between the same class of funds without a sales charge, the ability to reinvest Fund dividends into other funds in the family, and the ability to combine holdings in the Fund with holdings in other funds to obtain a reduced sales charge. The Board considered HFMC’s efforts to provide investors in the family with a broad range of investment styles and asset classes and its entrepreneurial risk in initiating new funds to expand these opportunities for shareholders.
* * * *
Based upon its review of these various factors, among others, the Board concluded that it is in the best interests of the Fund and its shareholders for the Board to approve the Agreements for an additional year. In reaching this decision, the Board did not assign relative weights to the factors discussed above or deem any one or group of them to be controlling in and of themselves. In connection with their deliberations, the Independent Directors met separately in executive session on several occasions, with independent legal counsel and the Consultant, to review the relevant materials and consider their responsibilities under relevant laws and regulations.
| 34 |
The Hartford Equity Income Fund
| Main Risks (Unaudited) |
The main risks of investing in the Fund are described below.
Market, Selection and Strategy Risk: The Fund’s share price may fluctuate due to market risk and/or security selections that may underperform the market or relevant benchmarks. If the sub-adviser's investment strategy does not perform as expected, the Fund could underperform its peers or lose money. There is no guarantee the Fund will achieve its stated objective.
Value Investing Risk: Value investments are considered to be undervalued, but they may never attain their potential value. Value-style investing falls in and out of favor, which may result in periods of underperformance.
Foreign Investment Risk: Investments in foreign securities may be riskier than investments in U.S. securities. Potential risks include the risks of illiquidity, increased price volatility, less government regulation, less extensive and less frequent accounting and other reporting requirements, unfavorable changes in currency exchange rates, and economic and political disruptions.
Dividend Paying Security Investment Risk: Dividends are not guaranteed and are subject to change. Dividend paying securities as a group can fall out of favor with the market, causing the Fund to underperform.
| 35 |
THIS PRIVACY POLICY IS NOT PART OF THIS REPORT
Privacy Policy and Practices of The Hartford Financial Services Group, Inc. and its Affiliates
(herein called “we, our and us”)
This Privacy Policy applies to our United States Operations
|
We value your trust. We are committed to the responsible: a) management; b) use; and c) protection; of Personal Information.
This notice describes how we collect, disclose, and protect Personal Information.
We collect Personal Information to: a) service your Transactions with us; and b) support our business functions.
We may obtain Personal Information from: a) You; b) your Transactions with us; and c) third parties such as a consumer-reporting agency.
Based on the type of product or service You apply for or get from us, Personal Information such as: a) your name; b) your address; c) your income; d) your payment; or e) your credit history; may be gathered from sources such as applications, Transactions, and consumer reports.
To serve You and service our business, we may share certain Personal Information. We will share Personal Information, only as allowed by law, with affiliates such as: a) our insurance companies; b) our employee agents; c) our brokerage firms; and d) our administrators.
As allowed by law, we may share Personal Financial Information with our affiliates to: a) market our products; or b) market our services; to You without providing You with an option to prevent these disclosures.
|
We may also share Personal Information, only as allowed by law, with unaffiliated third parties including: a) independent agents; b) brokerage firms; c) insurance companies; d) administrators; and e) service providers; who help us serve You and service our business.
When allowed by law, we may share certain Personal Financial Information with other unaffiliated third parties who assist us by performing services or functions such as: a) taking surveys; b) marketing our products or services; or c) offering financial products or services under a joint agreement between us and one or more financial institutions.
We, and third parties we partner with, may track some of the pages You visit through the use of: a) cookies; b) pixel tagging; or c) other technologies; and currently do not process or comply with any web browser’s “do not track” signal or similar mechanism that indicates a request to disable online tracking of individual users who visit our websites or use our services.
We will not sell or share your Personal Financial Information with anyone for purposes unrelated to our business functions without offering You the opportunity to: a) “opt-out;” or b) “opt-in;” as required by law.
We only disclose Personal Health Information with: a) your proper written authorization; or b) as otherwise allowed or required by law.
Our employees have access to Personal Information in the course of doing their jobs, such as: a) underwriting policies; b) paying claims; c) developing new products; or d) advising customers of our products and services.
|
|
We use manual and electronic security procedures to maintain: a) the confidentiality; and b) the integrity of; Personal Information that we have. We use these procedures to guard against unauthorized access.
Some techniques we use to protect Personal Information include: a) secured files; b) user authentication; c) encryption; d) firewall technology; and e) the use of detection software.
We are responsible for and must: a) identify information to be protected; b) provide an adequate level of protection for that data; c) grant access to protected data only to those people who must use it in the performance of their job-related duties.
Employees who violate our Privacy Policy will be subject to discipline, which may include ending their employment with us.
At the start of our business relationship, we will give You a copy of our current Privacy Policy.
We will also give You a copy of our current Privacy Policy once a year if You maintain a continuing business relationship with us.
We will continue to follow our Privacy Policy regarding Personal Information even when a business relationship no longer exists between us.
|
As used in this Privacy Notice:
Application means your request for our product or service.
Personal Financial Information means financial information such as: a) credit history; b) income; c) financial benefits; or d) policy or claim information.
Personal Health Information means health information such as: a) your medical records; or b) information about your illness, disability or injury.
Personal Information means information that identifies You personally and is not otherwise available to the public. It includes: a) Personal Financial Information; and b) Personal Health Information.
Transaction means your business dealings with us, such as: a) your Application; b) your request for us to pay a claim; and c) your request for us to take an action on your account.
You means an individual who has given us Personal Information in conjunction with: a) asking about; b) applying for; or c) obtaining; a financial product or service from us if the product or service is used mainly for personal, family, or household purposes.
|
This Privacy Policy is being provided on behalf of the following affiliates of The Hartford Financial Services Group, Inc.:
1stAGChoice, Inc.; Access CoverageCorp, Inc.; Access CoverageCorp Technologies, Inc.; American Maturity Life Insurance Company; Archway 60 R, LLC; Business Management Group, Inc.; Champlain Life Reinsurance Company; DMS R, LLC; Eloy R, LLC; Ersatz Corporation; First State Insurance Company; Hartford Accident and Indemnity Company; Hartford Administrative Services Company; Hartford Casualty General Agency, Inc.; Hartford Casualty Insurance Company; Hartford-Comprehensive Employee Benefit Service Company; Hartford Equity Sales Company, Inc.; Hartford Fire General Agency, Inc.; Hartford Fire Insurance Company; Hartford Funds Management Company, LLC; Hartford Funds Management Group, Inc.; Hartford HLS Series Fund II, Inc.; Hartford Insurance Company of Illinois; Hartford Insurance Company of the Midwest; Hartford Insurance Company of the Southeast; Hartford Integrated Technologies, Inc.; Hartford International Life Reassurance Corporation; Hartford Funds Distributors, LLC; Hartford Investment Management Company; Hartford Life and Accident Insurance Company; Hartford Life and Annuity Insurance Company; Hartford Life Insurance Company; Hartford Life Private Placement, LLC; Hartford Lloyd’s Corporation; Hartford Lloyd’s Insurance Company; Hartford Mezzanine Investors I, LLC; Hartford Residual Market, L.C.C.; Hartford Retirement Services, LLC; Hartford Securities Distribution Company, Inc.; Hartford Series Fund, Inc.; Hartford Specialty Insurance Services of Texas, LLC; Hartford Strategic Investments, LLC; Hartford Underwriters Insurance Company; Hartford Technology Services Company, L.L.C.; Hartford of Texas General Agency, Inc.; Hartford Underwriters General Agency, Inc.; HARTRE Company, L.C.C.; HL Investment Advisors, LLC; HLA LLC; Horizon Management Group, LLC; HRA Brokerage Services, Inc.; Lanidex Class B, LLC; M-CAP Insurance Agency, LLC; New England Insurance Company; New England Reinsurance Corporation; Nutmeg Insurance Agency, Inc.; Nutmeg Insurance Company; Pacific Insurance Company, Limited; Planco, LLC: Property and Casualty Insurance Company of Hartford; Revere R, LLC; RVR R, LLC; Sentinel Insurance Company, Ltd.; Sunstone R, LLC; Symphony R, LLC; The Evergreen Group Incorporated; The Hartford Alternative Strategies Fund; The Hartford Mutual Funds, Inc.; The Hartford Mutual Funds II, Inc.; Trumbull Flood Management, L.L.C.; Trumbull Insurance Company; Twin City Fire Insurance Company; White River Life Reinsurance Company.
HPP Revised January 2014
HARTFORDFUNDS
hartfordfunds.com
This information is written in connection with the promotion or marketing of the matter(s) addressed in this material.
This report is submitted for the general information of the shareholders of the Fund. It is not authorized for distribution unless preceded or accompanied by a current prospectus for the Fund.
The information cannot be used or relied upon for the purpose of avoiding IRS penalties. These materials are not intended to provide tax, accounting or legal advice. As with all matters of a tax or legal nature, you should consult your own tax or legal counsel for advice.
Investors should carefully consider the investment objectives, risks, charges, and expenses of Hartford Funds before investing. This and other information can be found in the prospectus and summary prospectus, which can be obtained by calling 888-843-7824 (retail) or 800-279-1541 (institutional). Investors should read them carefully before they invest.
Hartford Funds are underwritten and distributed by Hartford Funds Distributors, LLC.
MFAR-EI14 12/14 113973-3 Printed in U.S.A.
HARTFORDFUNDS
|
THE HARTFORD
2014 Annual Report |
A MESSAGE FROM THE PRESIDENT
Dear Fellow Shareholders:
Thank you for investing in Hartford Funds.
Market Review
U.S. equities (as represented by the S&P 500 Index) rose steadily for the fiscal year ended October 31, 2014, with a return of 17.27% for the period. With the exception of short-lived geopolitical scares early in 2014 and concerns about continuing global growth near the end of the period, stocks generally rose on solid fundamentals and encouraging macroeconomic data during the year.
September 2014 marked the six-year anniversary of the start of the financial crisis. Within weeks of that anniversary, both the S&P 500 Index and the Dow Jones Industrial Average set new all-time highs, closing at 2,018 and 17,391, respectively, on October 31. Although the fallout of the crisis continues to influence investor behavior, stocks have recovered and risen dramatically, up 198% from their low in March 2009. Meanwhile, the domestic economy is notching strong growth, and the unemployment rate has reached its lowest level since August 2008.
While the U.S. economy appears to have stabilized and to have reverted to a solid growth path, the outlook for the global economy appears to have gotten cloudier. The U.S. Federal Reserve has ended quantitative easing, while Europe and Japan are pursuing stimulus options to avoid a double-dip recession and deflation, respectively. Diverging central-bank policies will likely continue to play an important role in market movements going forward as investors wait to see the reactions to their efforts and their impacts on global markets.
How have market movements impacted your portfolio throughout the last year? Are your investments still on track to provide the growth or income you need, and are you comfortable with their progress during times of volatility?
Your financial professional can help you navigate today’s markets with confidence, as well as assist you to achieve your investment goals by providing advice on the best options within our fund family to help you work toward overcoming today’s investing challenges. Meet with your financial advisor regularly to examine your portfolio and your investment strategy, and to determine if you’re still on track to meet your goals.
Thank you again for investing with Hartford Funds.
James Davey
President
Hartford Funds
1 The S&P 500 Index is a market capitalization-weighted price index composed of 500 widely held common stocks.
2 The Dow Jones Industrial Average is an unmanaged, price-weighted index of 30 of the largest, most widely held stocks traded on the NYSE
The Hartford Floating Rate Fund
Table of Contents
The views expressed in the Fund’s Manager Discussion under ‘‘Why did the Fund perform this way?’’ and ‘‘What is the outlook?’’ are views of the Fund’s sub-adviser and portfolio management team through the end of the period and are subject to change based on market and other conditions. The Fund’s Manager Discussion is for informational purposes only and does not represent an offer, recommendation or solicitation to buy, hold or sell any security. The specific securities identified and described, if any, do not represent all of the securities purchased or sold and you should not assume that investments in the securities identified and discussed will be profitable.
The Hartford Floating Rate Fund inception 04/29/2005
(sub-advised by Wellington Management Company, LLP)
Investment objective – The Fund seeks to provide high current income and long-term total return.
Performance Overview 4/29/05 - 10/31/14

The chart above represents the hypothetical growth of a $10,000 investment in Class A, which includes a sales charge. Growth results in classes other than Class A will vary from what is seen above due to differences in the expenses charged to those share classes.
Average Annual Total Returns (as of 10/31/14)
| 1 Year | 5 Years | Since Inception▲ | ||||||||||
| Floating Rate A# | 2.35 | % | 6.10 | % | 4.07 | % | ||||||
| Floating Rate A## | -0.72 | % | 5.45 | % | 3.73 | % | ||||||
| Floating Rate B# | 1.44 | % | 5.23 | % | 3.39 | %* | ||||||
| Floating Rate B## | -3.48 | % | 4.90 | % | 3.39 | %* | ||||||
| Floating Rate C# | 1.60 | % | 5.32 | % | 3.29 | % | ||||||
| Floating Rate C## | 0.61 | % | 5.32 | % | 3.29 | % | ||||||
| Floating Rate I# | 2.62 | % | 6.36 | % | 4.31 | % | ||||||
| Floating Rate R3# | 2.05 | % | 5.81 | % | 3.90 | % | ||||||
| Floating Rate R4# | 2.20 | % | 6.04 | % | 4.09 | % | ||||||
| Floating Rate R5# | 2.50 | % | 6.33 | % | 4.28 | % | ||||||
| Floating Rate Y# | 2.57 | % | 6.43 | % | 4.37 | % | ||||||
| Credit Suisse Leveraged Loan Index | 3.77 | % | 6.59 | % | 4.84 | % | ||||||
| ▲ | Inception: 04/29/2005 |
| # | Without sales charge |
| ## | With sales charge |
| * | Class B shares convert to Class A shares after 8 years. The return shown reflects the conversion to Class A shares, which had different operating expenses, for the period after conversion. |
PERFORMANCE DATA QUOTED REPRESENTS PAST PERFORMANCE AND DOES NOT GUARANTEE FUTURE RESULTS. The investment return and principal value of the investment will fluctuate so that investors’ shares, when redeemed, may be worth more or less than their original cost. Current performance may be lower or higher than the performance data quoted. To obtain performance data current to the most recent month-end, please visit our website www.hartfordfunds.com.
The initial investment in Class A shares reflects the maximum sales charge of 3.00% and returns for Class B shares reflect a contingent deferred sales charge of up to 5.00% and declining to zero, depending on the period of time the shares are held. Returns for Class C shares reflect a contingent deferred sales charge of up to 1.00% on shares redeemed within twelve months of purchase.
Total returns presented above were calculated using the Fund’s net asset value available to shareholders for sale or redemption of Fund shares on October 31, 2014, which may exclude investment transactions as of this date. All share class returns assume the reinvestment of all distributions at net asset value and the deduction of all fund expenses.
Effective 9/30/09, Class B shares of the Fund were closed to new investments.
Class I shares commenced operations on 8/31/06. Performance prior to that date is that of the Fund's Class A shares (excluding sales charges), which had different operating expenses. Class R3, R4 and R5 shares commenced operations on 12/22/06. Performance prior to that date is that of the Fund's Class Y shares, which had different operating expenses.
Performance information includes performance under the Fund’s previous sub-adviser, Hartford Investment Management Company. As of April 23, 2012, Wellington Management Company, LLP became the sub-adviser for the Fund. At the end of a transition period of approximately four weeks ending on May 18, 2012, Hartford Investment Management Company no longer served as a sub-adviser to the Fund.
Credit Suisse Leveraged Loan Index is a market-value weighted index designed to represent the investable universe of the U.S. dollar-denominated leveraged loan market.
You cannot invest directly in an index.
The chart and table do not reflect the deductions of taxes that a shareholder would pay on Fund distributions or the redemption of Fund shares.
Performance information may reflect historical or current expense waivers/reimbursements from the investment adviser, without which performance would have been lower. For information on current expense waivers/reimbursements, please see the prospectus.
| 2 |
The Hartford Floating Rate Fund
Manager Discussion
October 31, 2014 (Unaudited)
Operating Expenses*
| Net | Gross | |||||||
| Floating Rate Class A | 0.97 | % | 0.97 | % | ||||
| Floating Rate Class B | 1.76 | % | 1.81 | % | ||||
| Floating Rate Class C | 1.72 | % | 1.72 | % | ||||
| Floating Rate Class I | 0.71 | % | 0.71 | % | ||||
| Floating Rate Class R3 | 1.26 | % | 1.37 | % | ||||
| Floating Rate Class R4 | 1.01 | % | 1.05 | % | ||||
| Floating Rate Class R5 | 0.71 | % | 0.77 | % | ||||
| Floating Rate Class Y | 0.65 | % | 0.65 | % | ||||
| * | As shown in the Fund's current prospectus dated March 1, 2014. Actual expenses may be higher or lower. Please see accompanying Financial Highlights for expense ratios for the year ended October 31, 2014. |
Gross expenses are the Fund's total annual operating expenses shown in the Fund's most recent prospectus. Net expenses are the Fund's total annual operating expenses shown in the Fund's most recent prospectus and reflect contractual expense reimbursements in instances when these reductions reduce the Fund's gross expenses. Contractual reimbursements remain in effect until February 28, 2015, and automatically renew for one-year terms unless terminated.
All investments are subject to risk including the possible loss of principal. For a discussion of the Fund’s risks, please see the Main Risks section of this report. For more detailed information on the risks associated with an investment in the Fund, please see the prospectus.
| Portfolio Manager |
| Michael J. Bacevich |
| Vice President and Fixed Income Portfolio Manager |
How did the Fund perform?
The Class A shares of The Hartford Floating Rate Fund returned 2.35%, before sales charge, for the twelve-month period ended October 31, 2014, underperforming the Fund’s benchmark, the Credit Suisse Leveraged Loan Index, which returned 3.77% for the same period. The Fund also underperformed the 2.68% average return of the Lipper Loan Participation Funds peer group, a group of funds that invest primarily in interests in collateralized senior corporate loans that have floating or variable rates.
Why did the Fund perform this way?
Fixed income markets gained throughout much of the period as expectations of prolonged easy monetary policy by major central banks and a supportive macroeconomic environment kept rates low and suppressed volatility. Early in the period emerging markets dominated headlines as economic and political developments sparked risk aversion across global markets, pushing bond prices higher and yields lower amid a flight to quality. Toward the end of the period, however, persistent geopolitical risks – tensions between Ukraine and Russia and violence in Iraq – and Chinese economic slowdown concerns raised questions about the global growth rate, keeping a lid on risk appetites overall.
The period was also highlighted by a divergence in central bank policies. The European Central Bank (ECB) cut its benchmark lending and deposit rates and announced a host of stimulus measures in an effort to encourage lending and fend off fears of deflation. China’s central bank joined the ECB in boosting liquidity by injecting funds into the nation’s largest banks in an attempt to combat weakening growth. The Bank of Japan pre-emptively announced incremental monetary easing to counter the risk of missing the country’s inflation and growth targets. In contrast, the Bank of England and U.S. Federal Reserve (Fed) leaned toward tighter policies. The Fed ended its quantitative easing program as U.S. data largely suggested the economy was on a sustainable growth path. Second quarter Gross Domestic Product (GDP) rebounded after the first quarter’s steep contraction. The labor market strengthened as the unemployment rate dropped to a six-year low. Housing regained some lost ground after a weak start to the year, though the pace of home price appreciation started to slow after a strong 2013. Inflation pressures were muted overall, alleviating pressure on the Fed to raise rates.
The U.S. Treasury curve flattened as markets contemplated bringing interest rates to normal levels; short-term yields rose while longer term rates declined. Most credit risk sectors posted positive absolute returns and outperformed duration-equivalent government bonds as credit spreads tightened. The 3-year discount margin on the Credit Suisse Leveraged Loan Index widened over the twelve-month period.
In a period in which investors became less concerned about the possibility of rising interest rates, bank loan mutual funds saw periods of significant outflows. Through the first ten months of 2014, bank loans returns have lagged behind those of high yield bonds.
The Fund underperformed its benchmark, the Credit Suisse Leveraged Loan Index. An out-of-benchmark allocation to high yield bonds contributed to performance given the outperformance of high yield over bank loans over the period. With respect to sector allocations, the Fund benefitted from being underweight Retail Stores and Lodging but lost performance relative to the benchmark due to an overweight allocation to Metals and an underweight position in Diversified Manufacturing.
Security selection was the primary driver of the Fund’s relative underperformance during the period. Issuers that detracted from performance over the period included TXU, an electric utility company, which we did not have exposure to but is a large component of the benchmark. Despite filing for bankruptcy in 2014,
| 3 |
The Hartford Floating Rate Fund
Manager Discussion – (continued)
October 31, 2014 (Unaudited)
TXU had strong performance over the period. Exposure to Momentive Performance Materials, a Chemicals company that manufactures silicone and quartz products, hurt benchmark-relative performance over the period. Momentive filed for Chapter 11 bankruptcy in April 2014 and emerged after a restructuring in October 2014. Another issuer that detracted from relative returns was Caesars Entertainment in the Gaming sector. The industry has struggled due to new capacity being introduced as new states pass legislation to legalize gambling. Issuers that contributed to benchmark-relative performance over the period included Nuveen Investments, which performed strongly due to its acquisition by TIAA-CREF during the period. An overweight position to TVN Finance Corporation in the Media Non-Cable sector also helped relative performance. Lastly, underweight positions in two issuers that underperformed also helped performance – Gymboree Corporation in the retail sector and Education Management, a consumer cyclicals company.
Over the period, the Fund had a small position in high yield credit default swap index (CDX), which had a marginally positive impact on benchmark relative performance. The CDX position is used for liquidity purposes and for tactically adjusting the risk posture of the Fund.
What is the outlook?
Our outlook for bank loans remains positive, albeit with diminished return expectations. While it appears that credit quality has begun to degrade slightly with the entry of some lower-quality first-time issuers, the sector’s overall credit fundamentals seem to remain strong. Despite recent retail mutual fund outflows, we believe issuance of collateralized loan obligations (a major source of demand) continues to be robust. According to JP Morgan, there has been over $110 billion in primary market issuance of Collateralized Loan Obligations (CLOs) in the first ten months of 2014. We believe current bank loan valuations are attractive given our view of a continued benign default environment over the next few years. Additionally, we believe that the long-term potential diversification benefits of bank loans and their floating-rate nature, particularly given low absolute yields across most fixed income sectors, will eventually reassert themselves, enhancing the relative appeal of this asset class.
Our outlook for U.S. high-yield bonds remains positive, based on the steadily improving macroeconomic backdrop, our expectations that default levels will remain low, and positive corporate fundamentals. We believe that valuations are now more attractive, with spreads around their long-term historical averages, and reasonable for this point in the cycle. The trailing 12-month default rate remains below its long-term average. While we see that there has been a recent pickup in shareholder-friendly actions such as mergers & acquisition activity and leveraged buyouts at the margin, we do not believe this is likely to affect default rates in the near to medium term.
At the end of the period, we maintained an out of benchmark allocation to high yield credit and favored the metals & mining, financial services, and wireless sectors relative to the Credit Suisse Leveraged Loan Index.
| Credit Exposure | ||||
| as of October 31, 2014 | ||||
| Credit Rating * | Percentage of Net Assets | |||
| Baa/ BBB | 1.1 | % | ||
| Ba/ BB | 19.6 | |||
| B | 68.2 | |||
| Caa/ CCC or Lower | 7.4 | |||
| Not Rated | 2.2 | |||
| Non-Debt Securities and Other Short-Term Instruments | 2.0 | |||
| Other Assets and Liabilities | (0.5 | ) | ||
| Total | 100.0 | % | ||
| * | Credit exposure is the long-term credit ratings for the Fund's holdings, as of the date noted, as provided by Standard and Poor's (S&P) or Moody's Investors Service (Moody's) and typically range from AAA/Aaa (highest) to C/D (lowest). Presentation of S&P and Moody's credit ratings in this report have been selected for informational purposes for shareholders, as well as the Fund's consideration of industry practice. If Moody's and S&P assign different ratings, the lower rating is used. Fixed income securities that are not rated by either agency are listed as "Not Rated." Ratings do not apply to the Fund itself or to the Fund's shares. Ratings may change. |
| Diversification by Security Type | ||||
| as of October 31, 2014 | ||||
| Category | Percentage of Net Assets | |||
| Equity Securities | ||||
| Common Stocks | 0.1 | % | ||
| Exchange Traded Funds | 1.4 | |||
| Total | 1.5 | % | ||
| Fixed Income Securities | ||||
| Corporate Bonds | 8.7 | % | ||
| Senior Floating Rate Interests | 89.8 | |||
| Total | 98.5 | % | ||
| Short-Term Investments | 0.5 | |||
| Other Assets and Liabilities | (0.5 | ) | ||
| Total | 100.0 | % | ||
| 4 |
The Hartford Floating Rate Fund
Schedule of Investments
October 31, 2014
(000’s Omitted)
| Shares or Principal Amount ╬ | Market Value ╪ | |||||||
| Corporate Bonds - 8.7% | ||||||||
| Accommodation and Food Services - 0.2% | ||||||||
| Sugarhouse HSP Gaming Prop Mezz L.P. | ||||||||
| $ | 10,575 | 6.38%, 06/01/2021 ■‡ | $ | 10,125 | ||||
| Agriculture, Forestry, Fishing and Hunting - 0.1% | ||||||||
| Tembec Industries, Inc. | ||||||||
| 5,685 | 9.00%, 12/15/2019 ■‡ | 5,756 | ||||||
| Arts, Entertainment and Recreation - 0.5% | ||||||||
| Bougeot Bidco plc | ||||||||
| GBP | 5,000 | 7.88%, 07/15/2020 § | 7,999 | |||||
| Chester Downs & Marina LLC | ||||||||
| 10,189 | 9.25%, 02/01/2020 ■‡ | 9,068 | ||||||
| Gray Television, Inc. | ||||||||
| 4,030 | 7.50%, 10/01/2020 | 4,216 | ||||||
| Lin Television Corp. Media Genral Financial Sub | ||||||||
| 5,000 | 5.88%, 11/15/2022 ■ | 5,037 | ||||||
| Snai S.p.A. | ||||||||
| EUR | 1,925 | 7.63%, 06/15/2018 § | 2,385 | |||||
| 28,705 | ||||||||
| Chemical Manufacturing - 0.4% | ||||||||
| Hexion Specialty Chemicals | ||||||||
| 7,500 | 8.88%, 02/01/2018 ‡ | 7,415 | ||||||
| Hexion U.S. Finance Corp. | ||||||||
| 6,816 | 6.63%, 04/15/2020 ‡ | 6,816 | ||||||
| Momentive Performance Materials, Inc. | ||||||||
| 11,050 | 3.88%, 10/24/2021 | 9,614 | ||||||
| 23,845 | ||||||||
| Computer and Electronic Product Manufacturing - 0.2% | ||||||||
| Alcatel-Lucent USA, Inc. | ||||||||
| 5,035 | 6.75%, 11/15/2020 ■‡ | 5,186 | ||||||
| Ceridian LLC | ||||||||
| 5,000 | 8.13%, 11/15/2017 ■ | 5,000 | ||||||
| 10,186 | ||||||||
| Construction - 0.2% | ||||||||
| Empresas ICA S.A.B de C.V. | ||||||||
| 5,715 | 8.88%, 05/29/2024 ■‡ | 5,801 | ||||||
| Paragon Offshore plc | ||||||||
| 8,570 | 7.25%, 08/15/2024 ■‡ | 6,556 | ||||||
| 12,357 | ||||||||
| Finance and Insurance - 2.8% | ||||||||
| Access Bank plc | ||||||||
| 7,000 | 9.25%, 06/24/2021 ■ | 7,035 | ||||||
| Banco Bilbao Vizcaya Argentaria S.A. | ||||||||
| EUR | 7,400 | 7.00%, 12/29/2049 § | 9,512 | |||||
| Banco do Brasil S.A. | ||||||||
| 8,990 | 9.00%, 06/18/2024 ■‡♠ | 8,837 | ||||||
| Banco Santander S.A. | ||||||||
| EUR | 11,300 | 6.25%, 03/12/2049 § | 13,860 | |||||
| Bank of Ireland | ||||||||
| EUR | 4,925 | 10.00%, 07/30/2016 § | 6,667 | |||||
| Barclays Bank plc | ||||||||
| 8,825 | 8.25%, 12/15/2018 ♠β | 9,112 | ||||||
| BC Mountain LLC | ||||||||
| 4,393 | 7.00%, 02/01/2021 ■ | 3,954 | ||||||
| Cimpor Financial Operations B.V. | ||||||||
| 4,000 | 5.75%, 07/17/2024 ■ | 3,846 | ||||||
| Credit Agricole S.A. | ||||||||
| 4,600 | 6.63%, 09/23/2019 ■‡♠Δ | 4,487 | ||||||
| 5,150 | 7.88%, 01/23/2024 ■♠ | 5,316 | ||||||
| Credit Suisse Group AG | ||||||||
| 5,490 | 6.25%, 12/18/2024 ■♠Δ | 5,339 | ||||||
| 9,000 | 7.50%, 12/11/2023 ■♠ | 9,565 | ||||||
| HSBC Holdings plc | ||||||||
| 3,560 | 5.63%, 01/17/2020 ♠ | 3,618 | ||||||
| Marfrig Holding Europe, B.V. | ||||||||
| 9,000 | 6.88%, 06/24/2019 ■ | 9,135 | ||||||
| Nationstar Mortgage LLC | ||||||||
| 9,795 | 6.50%, 07/01/2021 ‡ | 9,109 | ||||||
| Nationwide Building Society | ||||||||
| GBP | 7,600 | 6.88%, 03/11/2049 § | 11,884 | |||||
| Nuveen Investments, Inc. | ||||||||
| 5,545 | 9.13%, 10/15/2017 ■‡ | 5,924 | ||||||
| Societe Generale | ||||||||
| 4,415 | 6.00%, 01/27/2020 ■♠ | 4,161 | ||||||
| 17,150 | 8.25%, 11/29/2018 §♠ | 18,121 | ||||||
| TMK OAO Via TMK Capital S.A. | ||||||||
| 8,000 | 6.75%, 04/03/2020 § | 7,210 | ||||||
| UniCredit S.p.A. | ||||||||
| 9,200 | 8.00%, 06/03/2024 §♠ | 9,223 | ||||||
| YPF S.A. | ||||||||
| 9,000 | 8.88%, 12/19/2018 § | 9,405 | ||||||
| 175,320 | ||||||||
| Food Manufacturing - 0.1% | ||||||||
| Galapagos S.A. | ||||||||
| EUR | 4,000 | 4.83%, 06/15/2021 ■Δ | 4,871 | |||||
| R&R Ice Cream plc | ||||||||
| GBP | 1,631 | 5.50%, 05/15/2020 ■ | 2,531 | |||||
| 7,402 | ||||||||
| Food Services - 0.2% | ||||||||
| Brakes Capital | ||||||||
| EUR | 6,665 | 5.08%, 12/15/2018 ■Δ | 8,061 | |||||
| GBP | 2,250 | 7.13%, 12/15/2018 § | 3,509 | |||||
| 11,570 | ||||||||
| Information - 1.6% | ||||||||
| Ancestry.com, Inc. | ||||||||
| 8,100 | 9.63%, 10/15/2018 ■ | 8,080 | ||||||
| Equiniti Bondco plc | ||||||||
| GBP | 7,000 | 6.31%, 12/15/2018 ■Δ | 11,170 | |||||
| First Data Corp. | ||||||||
| 2,110 | 8.25%, 01/15/2021 ■ | 2,289 | ||||||
| 6,492 | 11.75%, 08/15/2021 ‡ | 7,612 | ||||||
| 3,165 | 14.50%, 09/24/2019 ■Þ | 3,308 | ||||||
| Infor Software Parent LLC | ||||||||
| 5,165 | 7.13%, 05/01/2021 ■ | 5,230 | ||||||
| Intelsat Luxembourg S.A. | ||||||||
| 4,270 | 7.75%, 06/01/2021 | 4,462 | ||||||
| Level 3 Escrow, Inc. | ||||||||
| 7,730 | 5.38%, 08/15/2022 ■‡ | 7,865 | ||||||
| Level 3 Financing, Inc. | ||||||||
| 9,000 | 3.82%, 01/15/2018 ‡Δ | 9,023 | ||||||
| VimpelCom Holdings B.V. | ||||||||
| 5,000 | 5.20%, 02/13/2019 § | 4,857 | ||||||
| Wind Acquisition Finance S.A. | ||||||||
| EUR | 9,730 | 4.08%, 07/15/2020 ■Δ | 11,977 | |||||
| EUR | 13,375 | 5.34%, 04/30/2019 ■Δ | 16,803 | |||||
| EUR | 5,000 | 7.00%, 04/23/2021 § | 6,190 | |||||
| 98,866 | ||||||||
The accompanying notes are an integral part of these financial statements.
| 5 |
The Hartford Floating Rate Fund
Schedule of Investments – (continued)
October 31, 2014
(000’s Omitted)
| Shares or Principal Amount ╬ | Market Value ╪ | |||||||
| Corporate Bonds - 8.7% - (continued) | ||||||||
| Machinery Manufacturing - 0.1% | ||||||||
| Titan International, Inc. | ||||||||
| $ | 8,000 | 6.88%, 10/01/2020 ‡ | $ | 7,220 | ||||
| Nonmetallic Mineral Product Manufacturing - 0.2% | ||||||||
| Ardagh Finance Holdings S.A. | ||||||||
| EUR | 3,070 | 8.38%, 06/15/2019 ■ | 3,656 | |||||
| 5,520 | 8.63%, 06/15/2019 ■ | 5,644 | ||||||
| 9,300 | ||||||||
| Other Services - 0.2% | ||||||||
| Abengoa Finance | ||||||||
| EUR | 3,630 | 6.00%, 03/31/2021 ■ | 4,424 | |||||
| Abengoa Greenfield S.A. | ||||||||
| 10,000 | 6.50%, 10/01/2019 ■‡ | 10,025 | ||||||
| 14,449 | ||||||||
| Petroleum and Coal Products Manufacturing - 0.6% | ||||||||
| American Energy - Permian Basin LLC | ||||||||
| 17,600 | 6.74%, 08/01/2019 ■Δ | 15,576 | ||||||
| Borets Finance Ltd. | ||||||||
| 5,000 | 7.63%, 09/26/2018 §‡ | 4,850 | ||||||
| KCA Deutag | ||||||||
| 6,065 | 7.25%, 05/15/2021 ■ | 5,398 | ||||||
| Kosmos Energy Ltd. | ||||||||
| 770 | 7.88%, 08/01/2021 § | 709 | ||||||
| Shelf Drilling Holdings Ltd. | ||||||||
| 4,775 | 8.63%, 11/01/2018 ■‡ | 4,715 | ||||||
| Ultra Petroleum Corp. | ||||||||
| 3,180 | 6.13%, 10/01/2024 ■‡ | 3,009 | ||||||
| 34,257 | ||||||||
| Retail Trade - 1.1% | ||||||||
| Albertson's Holdings LLC | ||||||||
| 8,000 | 7.75%, 10/15/2022 ■‡ | 7,880 | ||||||
| Claire's Stores, Inc. | ||||||||
| 9,000 | 9.00%, 03/15/2019 ■ | 9,180 | ||||||
| Galaxy Bidco Ltd. | ||||||||
| GBP | 12,500 | 5.56%, 11/15/2019 ■Δ | 19,516 | |||||
| Matalan Finance plc | ||||||||
| GBP | 4,550 | 6.88%, 06/01/2019 ■‡ | 6,962 | |||||
| GBP | 2,000 | 6.88%, 06/01/2019 | 3,060 | |||||
| Michaels Stores, Inc. | ||||||||
| 2,334 | 7.50%, 08/01/2018 ■‡ | 2,369 | ||||||
| Picard Groupe S.A. | ||||||||
| EUR | 5,220 | 4.46%, 08/01/2019 ■Δ | 6,546 | |||||
| Stretford 79 plc | ||||||||
| GBP | 8,335 | 4.81%, 12/29/2049 ■Δ | 11,947 | |||||
| 67,460 | ||||||||
| Utilities - 0.1% | ||||||||
| Genon Energy, Inc. | ||||||||
| 8,000 | 7.88%, 06/15/2017 ‡ | 8,100 | ||||||
| Wholesale Trade - 0.1% | ||||||||
| Dynegy, Inc. | ||||||||
| 5,710 | 6.75%, 11/01/2019 ■‡ | 5,910 | ||||||
| Total Corporate Bonds | ||||||||
| (Cost $550,627) | $ | 530,828 | ||||||
| Senior Floating Rate Interests ♦ - 89.8% | ||||||||
| Accommodation and Food Services - 0.5% | ||||||||
| CityCenter Holdings LLC | ||||||||
| $ | 25,073 | 4.25%, 10/16/2020 | $ | 24,898 | ||||
| ESH Hospitality, Inc. | ||||||||
| 1,305 | 5.00%, 06/24/2019 | 1,309 | ||||||
| Four Seasons Holdings, Inc. | ||||||||
| 4,690 | 6.25%, 12/28/2020 | 4,702 | ||||||
| 30,909 | ||||||||
| Administrative, Support, Waste Management and Remediation Services - 4.2% | ||||||||
| Acosta Holdco, Inc. | ||||||||
| 40,000 | 5.00%, 09/26/2021 | 40,010 | ||||||
| ADS Waste Holdings, Inc. | ||||||||
| 30,711 | 3.75%, 10/09/2019 | 30,028 | ||||||
| Audio Visual Services Group, Inc. | ||||||||
| 11,109 | 4.50%, 01/25/2021 | 11,022 | ||||||
| Brickman Group Holdings, Inc. | ||||||||
| 40,797 | 4.00%, 12/18/2020 | 40,054 | ||||||
| 9,505 | 7.50%, 12/17/2021 ☼ | 9,336 | ||||||
| Filtration Group, Inc. | ||||||||
| 4,620 | 4.50%, 11/20/2020 | 4,601 | ||||||
| 2,070 | 8.25%, 11/22/2021 | 2,060 | ||||||
| Ipreo Holdings LLC | ||||||||
| 8,615 | 4.25%, 08/06/2021 | 8,421 | ||||||
| Nets Holding A/S | ||||||||
| EUR | 13,150 | 4.25%, 07/09/2021 | 16,252 | |||||
| PRA Holdings, Inc. | ||||||||
| 29,459 | 4.50%, 09/23/2020 | 29,047 | ||||||
| ServiceMaster (The) Co. | ||||||||
| 50,694 | 4.25%, 07/01/2021 | 50,198 | ||||||
| TransUnion LLC | ||||||||
| 17,161 | 4.00%, 04/09/2021 | 16,936 | ||||||
| 257,965 | ||||||||
| Agriculture, Construction, Mining and Machinery - 2.0% | ||||||||
| International Equipment Solutions LLC | ||||||||
| 10,936 | 6.75%, 08/16/2019 | 10,936 | ||||||
| Minimax | ||||||||
| EUR | 10,275 | 4.25%, 08/14/2020 | 10,908 | |||||
| Signode Industrial Group US, Inc. | ||||||||
| 39,367 | 4.00%, 05/01/2021 | 38,604 | ||||||
| EUR | 2,658 | 4.25%, 05/01/2021 | 3,317 | |||||
| Veyance Technologies, Inc. | ||||||||
| 60,969 | 5.25%, 09/08/2017 | 60,741 | ||||||
| 124,506 | ||||||||
| Air Transportation - 0.8% | ||||||||
| AMR Corp. | ||||||||
| 30,106 | 3.75%, 06/27/2019 | 29,692 | ||||||
| Landmark Aviation | ||||||||
| 17,401 | 4.75%, 10/25/2019 | 17,266 | ||||||
| 46,958 | ||||||||
| Apparel Manufacturing - 0.1% | ||||||||
| Bauer Performance Sports Ltd. | ||||||||
| 7,751 | 4.00%, 04/15/2021 | 7,688 | ||||||
| Arts, Entertainment and Recreation - 10.5% | ||||||||
| 24 Hour Fitness Worldwide, Inc. | ||||||||
| 25,935 | 4.75%, 05/28/2021 | 25,870 | ||||||
| Aristocrat Leisure Ltd. | ||||||||
| 38,745 | 4.75%, 10/20/2021 | 38,442 | ||||||
| Caesars Entertainment Operating Co., Inc. | ||||||||
| 5,100 | 6.99%, 03/01/2017 | 4,565 | ||||||
| 26,933 | 9.75%, 01/28/2018 | 24,845 | ||||||
The accompanying notes are an integral part of these financial statements.
| 6 |
The Hartford Floating Rate Fund
Schedule of Investments – (continued)
October 31, 2014
(000’s Omitted)
| Shares or Principal Amount ╬ | Market Value ╪ | |||||||
| Senior Floating Rate Interests ♦ - 89.8% - (continued) | ||||||||
| Arts, Entertainment and Recreation - 10.5% - (continued) | ||||||||
| Caesars Entertainment Resort Properties LLC | ||||||||
| $ | 30,845 | 7.00%, 10/11/2020 | $ | 29,372 | ||||
| Caesars Growth Property Holdings LLC | ||||||||
| 47,890 | 6.25%, 05/08/2021 | 45,136 | ||||||
| Dex Media West LLC | ||||||||
| 6,462 | 8.00%, 12/30/2016 | 5,774 | ||||||
| Formula One Holdings | ||||||||
| 50,344 | 4.75%, 07/30/2021 | 49,925 | ||||||
| 14,285 | 7.75%, 07/29/2022 | 14,223 | ||||||
| Hoyts Group Holdings LLC | ||||||||
| 6,695 | 4.00%, 05/29/2020 | 6,595 | ||||||
| 6,212 | 8.25%, 11/30/2020 | 6,150 | ||||||
| ION Media Networks, Inc. | ||||||||
| 8,947 | 5.00%, 12/18/2020 | 8,925 | ||||||
| MGM Resorts International | ||||||||
| 42,962 | 3.50%, 12/20/2019 | 42,425 | ||||||
| Numericable | ||||||||
| 19,660 | 4.50%, 05/21/2020 | 19,688 | ||||||
| Quebecor Media, Inc. | ||||||||
| 21,731 | 3.25%, 08/17/2020 | 21,065 | ||||||
| R.H. Donnelley, Inc. | ||||||||
| 3,944 | 9.75%, 12/31/2016 | 2,773 | ||||||
| Salem Communications Corp. | ||||||||
| 8,237 | 4.50%, 03/13/2020 | 8,103 | ||||||
| Scientific Games International, Inc. | ||||||||
| 36,320 | 6.00%, 10/01/2021 | 35,533 | ||||||
| Station Casinos LLC | ||||||||
| 39,173 | 4.25%, 03/02/2020 | 38,713 | ||||||
| Templar Energy | ||||||||
| 16,045 | 8.50%, 11/25/2020 | 14,457 | ||||||
| Tribune Co. | ||||||||
| 67,965 | 4.00%, 12/27/2020 | 67,349 | ||||||
| Univision Communications, Inc. | ||||||||
| 117,131 | 4.00%, 03/01/2020 | 115,858 | ||||||
| Warner Music Group Corp. | ||||||||
| 7,162 | 3.75%, 07/01/2020 | 6,928 | ||||||
| XO Communications LLC | ||||||||
| 14,283 | 4.25%, 03/20/2021 | 14,134 | ||||||
| 646,848 | ||||||||
| Beverage and Tobacco Product Manufacturing - 0.4% | ||||||||
| DE Master Blenders 1753 N.V. | ||||||||
| 26,250 | 3.50%, 07/23/2021 | 25,987 | ||||||
| Chemical Manufacturing - 3.7% | ||||||||
| Arysta LifeScience Corp. | ||||||||
| 11,289 | 4.50%, 05/29/2020 | 11,236 | ||||||
| Axil Coating Systems | ||||||||
| 22,987 | 3.75%, 02/01/2020 | 22,599 | ||||||
| CeramTec | ||||||||
| 4,163 | 4.25%, 08/28/2020 | 4,148 | ||||||
| EUR | 1,108 | 4.75%, 08/28/2020 | 1,391 | |||||
| Cytec Industries, Inc. | ||||||||
| 1,938 | 4.50%, 10/03/2019 | 1,923 | ||||||
| Exopack LLC | ||||||||
| 12,947 | 5.25%, 05/08/2019 | 12,980 | ||||||
| Faenza Acquisition Gmbh | ||||||||
| 1,666 | 4.25%, 08/28/2020 | 1,660 | ||||||
| EUR | 3,642 | 4.75%, 08/28/2020 | 4,574 | |||||
| Ferro Corp. | ||||||||
| 7,130 | 4.00%, 07/30/2021 | 7,019 | ||||||
| Houghton International, Inc. | ||||||||
| 13,256 | 4.00%, 12/20/2019 | 13,058 | ||||||
| Ineos US Finance LLC | ||||||||
| 43,605 | 3.75%, 05/04/2018 | 43,005 | ||||||
| Monarch, Inc. | ||||||||
| 3,735 | 4.50%, 10/03/2019 | 3,707 | ||||||
| Pinnacle Operating Corp. | ||||||||
| 15,515 | 4.75%, 11/15/2018 | 15,398 | ||||||
| PQ Corp. | ||||||||
| 14,693 | 4.00%, 08/07/2017 | 14,524 | ||||||
| Solenis International L.P. | ||||||||
| 10,035 | 4.25%, 07/31/2021 | 9,884 | ||||||
| EUR | 3,000 | 4.50%, 07/31/2021 | 3,763 | |||||
| Univar, Inc. | ||||||||
| 47,904 | 5.00%, 06/30/2017 | 47,545 | ||||||
| Utex Industries, Inc. | ||||||||
| 9,511 | 5.00%, 05/21/2021 | 9,374 | ||||||
| 3,000 | 8.25%, 05/20/2022 | 2,960 | ||||||
| 230,748 | ||||||||
| Computer and Electronic Product Manufacturing - 3.3% | ||||||||
| Avago Technologies Ltd. | ||||||||
| 34,040 | 3.75%, 05/06/2021 | 33,916 | ||||||
| CDW LLC | ||||||||
| 35,964 | 3.25%, 04/29/2020 | 35,135 | ||||||
| Ceridian LLC | ||||||||
| 15,741 | 4.12%, 05/09/2017 | 15,717 | ||||||
| 18,505 | 4.50%, 05/09/2017 | 18,338 | ||||||
| Freescale Semiconductor, Inc. | ||||||||
| 42,124 | 4.25%, 02/28/2020 | 41,507 | ||||||
| 12,425 | 5.00%, 01/15/2021 | 12,396 | ||||||
| Micro Focus International | ||||||||
| 31,500 | 5.25%, 10/07/2021 ☼ | 30,352 | ||||||
| Vantiv LLC | ||||||||
| 14,214 | 3.75%, 06/13/2021 | 14,094 | ||||||
| 201,455 | ||||||||
| Construction - 1.2% | ||||||||
| Brand Energy & Infrastructure Services, Inc. | ||||||||
| 24,520 | 4.75%, 11/26/2020 | 24,351 | ||||||
| Brock Holdings III, Inc. | ||||||||
| 17,019 | 6.00%, 03/16/2017 | 16,721 | ||||||
| 6,898 | 10.00%, 03/16/2018 | 6,726 | ||||||
| Pike Corp. | ||||||||
| 13,560 | 5.25%, 10/01/2021 ☼ | 13,458 | ||||||
| 4,125 | 8.25%, 04/03/2021 ☼ | 4,039 | ||||||
| Summit Materials LLC | ||||||||
| 10,761 | 5.00%, 01/30/2019 | 10,775 | ||||||
| 76,070 | ||||||||
| Fabricated Metal Product Manufacturing - 0.2% | ||||||||
| Ameriforge Group, Inc. | ||||||||
| 10,470 | 5.00%, 12/19/2019 | 10,382 | ||||||
| Finance and Insurance - 6.3% | ||||||||
| Asurion LLC | ||||||||
| 7,337 | 4.25%, 07/08/2020 | 7,234 | ||||||
| 37,364 | 5.00%, 05/24/2019 | 37,374 | ||||||
| 5,715 | 8.50%, 03/03/2021 | 5,802 | ||||||
| Capital Automotive L.P. | ||||||||
| 9,010 | 4.00%, 04/10/2019 | 8,961 | ||||||
| 3,805 | 6.00%, 04/30/2020 | 3,843 | ||||||
The accompanying notes are an integral part of these financial statements.
| 7 |
The Hartford Floating Rate Fund
Schedule of Investments – (continued)
October 31, 2014
(000’s Omitted)
| Shares or Principal Amount ╬ | Market Value ╪ | |||||||
| Senior Floating Rate Interests ♦ - 89.8% - (continued) | ||||||||
| Finance and Insurance - 6.3% - (continued) | ||||||||
| Cooper Gay Swett & Crawford Ltd. | ||||||||
| $ | 9,307 | 5.00%, 04/16/2020 | $ | 8,376 | ||||
| 5,140 | 8.25%, 10/16/2020 | 4,318 | ||||||
| Evertec LLC | ||||||||
| 13,614 | 3.50%, 04/17/2020 | 13,364 | ||||||
| Grosvenor Capital Management L.P. | ||||||||
| 9,925 | 3.75%, 01/04/2021 | 9,677 | ||||||
| Guggenheim Partners LLC | ||||||||
| 15,147 | 4.25%, 07/22/2020 | 15,052 | ||||||
| Hub International Ltd. | ||||||||
| 33,290 | 4.25%, 10/02/2020 | 32,832 | ||||||
| Interactive Data Corp. | ||||||||
| 21,448 | 4.75%, 05/02/2021 | 21,438 | ||||||
| ION Trading Technologies Ltd. | ||||||||
| EUR | 16,758 | 4.50%, 06/10/2021 | 20,850 | |||||
| 10,815 | 7.25%, 06/10/2022 | 10,635 | ||||||
| National Financial Partners Corp. | ||||||||
| 5,932 | 4.50%, 07/01/2020 | 5,877 | ||||||
| Santander Asset Management S.A. | ||||||||
| 33,447 | 4.25%, 12/17/2020 | 33,301 | ||||||
| EUR | 7,940 | 4.50%, 12/17/2020 | 9,943 | |||||
| Sedgwick CMS Holdings, Inc. | ||||||||
| 51,009 | 3.75%, 03/01/2021 | 49,517 | ||||||
| 13,125 | 6.75%, 02/28/2022 | 12,731 | ||||||
| USI Insurance Services LLC | ||||||||
| 25,964 | 4.25%, 12/27/2019 | 25,672 | ||||||
| Walter Investment Management Corp. | ||||||||
| 52,366 | 4.75%, 12/18/2020 | 49,224 | ||||||
| 386,021 | ||||||||
| Food Manufacturing - 2.8% | ||||||||
| Burton's Foods Ltd. | ||||||||
| GBP | 6,300 | 5.55%, 11/27/2020 | 9,826 | |||||
| Del Monte Foods Co. | ||||||||
| 46,169 | 3.50%, 03/09/2020 | 44,351 | ||||||
| Hearthside Food Solutions | ||||||||
| 12,025 | 4.50%, 06/02/2021 | 11,942 | ||||||
| Hostess Brands, Inc. | ||||||||
| 14,662 | 6.75%, 04/09/2020 | 14,910 | ||||||
| JBS USA LLC | ||||||||
| 32,928 | 3.75%, 05/25/2018 - 09/18/2020 | 32,407 | ||||||
| Milk Specialties Co. | ||||||||
| 8,714 | 7.50%, 11/09/2018 | 8,561 | ||||||
| Roundy's Supermarkets, Inc. | ||||||||
| 24,617 | 5.75%, 03/03/2021 | 21,848 | ||||||
| U.S. Foodservice, Inc. | ||||||||
| 28,881 | 4.50%, 03/31/2019 | 28,773 | ||||||
| 172,618 | ||||||||
| Furniture and Related Product Manufacturing - 1.0% | ||||||||
| AOT Bedding Super Holdings LLC | ||||||||
| 46,641 | 4.25%, 10/01/2019 | 46,163 | ||||||
| Wilsonart International Holdings LLC | ||||||||
| 16,038 | 4.00%, 10/31/2019 | 15,770 | ||||||
| 61,933 | ||||||||
| Health Care and Social Assistance - 6.4% | ||||||||
| AccentCare, Inc. | ||||||||
| 5,945 | 6.50%, 12/22/2016 | 5,172 | ||||||
| Alere, Inc. | ||||||||
| 27,081 | 4.25%, 06/30/2017 | 26,986 | ||||||
| American Renal Holdings, Inc. | ||||||||
| 20,009 | 4.50%, 08/20/2019 | 19,626 | ||||||
| 11,235 | 8.50%, 03/20/2020 | 11,010 | ||||||
| Ardent Medical Services, Inc. | ||||||||
| 6,374 | 6.75%, 07/02/2018 | 6,382 | ||||||
| DJO Finance LLC | ||||||||
| 18,074 | 4.25%, 09/15/2017 | 17,975 | ||||||
| DSI Renal, Inc. | ||||||||
| 5,661 | 4.50%, 04/23/2021 | 5,601 | ||||||
| 6,200 | 7.75%, 10/22/2021 | 6,169 | ||||||
| Healogics, Inc. | ||||||||
| 7,490 | 5.25%, 07/01/2021 | 7,443 | ||||||
| Iasis Healthcare LLC | ||||||||
| 16,219 | 4.50%, 05/03/2018 | 16,192 | ||||||
| Ikaria Acquisition, Inc. | ||||||||
| 7,338 | 5.00%, 02/12/2021 | 7,336 | ||||||
| 5,510 | 8.75%, 02/14/2022 ☼ | 5,505 | ||||||
| Immucor, Inc. | ||||||||
| 17,265 | 5.00%, 08/19/2018 | 17,227 | ||||||
| IMS Health, Inc. | ||||||||
| 12,313 | 3.50%, 03/17/2021 | 12,151 | ||||||
| inVentiv Health, Inc. | ||||||||
| 26,758 | 7.75%, 05/15/2018 | 26,385 | ||||||
| One Call Medical, Inc. | ||||||||
| 26,888 | 5.00%, 11/27/2020 | 26,754 | ||||||
| Ortho-Clinical Diagnostics, Inc. | ||||||||
| 32,491 | 4.75%, 06/30/2021 | 32,134 | ||||||
| Pharmaceutical Product Development, Inc. | ||||||||
| 6,291 | 4.00%, 12/05/2018 | 6,241 | ||||||
| Pharmedium Healthcare Corp. | ||||||||
| 4,156 | 4.25%, 01/28/2021 | 4,082 | ||||||
| 3,280 | 7.75%, 01/28/2022 | 3,272 | ||||||
| Salix Pharmaceuticals Ltd. | ||||||||
| 2,873 | 4.25%, 01/02/2020 | 2,870 | ||||||
| STHI Holding Corp. | ||||||||
| 13,155 | 4.50%, 08/06/2021 | 13,073 | ||||||
| Surgery Center Holdings, Inc. | ||||||||
| 12,930 | 5.25%, 07/24/2020 ☼ | 12,906 | ||||||
| 9,700 | 7.00%, 04/11/2019 | 9,694 | ||||||
| 11,200 | 8.50%, 07/23/2021 ☼ | 10,983 | ||||||
| Truven Health Analytics, Inc. | ||||||||
| 10,261 | 4.50%, 06/06/2019 | 10,056 | ||||||
| US Renal Care, Inc. | ||||||||
| 21,401 | 4.25%, 07/03/2019 | 21,240 | ||||||
| 3,510 | 8.50%, 01/03/2020 | 3,510 | ||||||
| 2,666 | 10.25%, 01/03/2020 | 2,673 | ||||||
| Valeant Pharmaceuticals International, Inc. | ||||||||
| 45,704 | 3.50%, 12/11/2019 - 08/05/2020 | 45,320 | ||||||
| 395,968 | ||||||||
| Health Care Providers and Services - 0.5% | ||||||||
| CRC Health Corp. | ||||||||
| 12,736 | 5.25%, 03/29/2021 | 12,768 | ||||||
| Multiplan, Inc. | ||||||||
| 17,667 | 4.00%, 03/31/2021 | 17,377 | ||||||
| 30,145 | ||||||||
| Information - 10.6% | ||||||||
| Ancestry.com, Inc. | ||||||||
| 22,814 | 4.50%, 12/28/2018 ☼ | 22,671 | ||||||
| Aspect Software, Inc. | ||||||||
| 9,519 | 7.25%, 05/07/2016 | 9,448 | ||||||
The accompanying notes are an integral part of these financial statements.
| 8 |
The Hartford Floating Rate Fund
Schedule of Investments – (continued)
October 31, 2014
(000’s Omitted)
| Shares or Principal Amount ╬ | Market Value ╪ | |||||||
| Senior Floating Rate Interests ♦ - 89.8% - (continued) | ||||||||
| Information - 10.6% - (continued) | ||||||||
| Cabovisao-Televisao Por Cabo S.A. | ||||||||
| $ | 37,640 | 5.50%, 07/02/2019 | $ | 37,828 | ||||
| Charter Communications Operating LLC | ||||||||
| 25,934 | 3.00%, 07/01/2020 - 01/03/2021 | 25,453 | ||||||
| Eagle Parent, Inc. | ||||||||
| 40,343 | 4.00%, 05/16/2018 | 39,965 | ||||||
| First Data Corp. | ||||||||
| 94,824 | 3.65%, 03/23/2018 - 09/24/2018 | 93,875 | ||||||
| 14,744 | 4.15%, 03/24/2021 | 14,643 | ||||||
| Hyland Software, Inc. | ||||||||
| 10,287 | 4.75%, 02/19/2021 | 10,251 | ||||||
| Infor US, Inc. | ||||||||
| 4,001 | 3.75%, 06/03/2020 | 3,943 | ||||||
| EUR | 3,547 | 4.00%, 06/03/2020 | 4,433 | |||||
| Intelsat Jackson Holdings S.A. | ||||||||
| 28,503 | 3.75%, 06/30/2019 | 28,254 | ||||||
| Kronos, Inc. | ||||||||
| 18,229 | 4.50%, 10/30/2019 | 18,138 | ||||||
| 4,037 | 9.75%, 04/30/2020 | 4,138 | ||||||
| Lawson Software, Inc. | ||||||||
| 24,634 | 3.75%, 06/03/2020 | 24,283 | ||||||
| Level 3 Communications, Inc. | ||||||||
| 80,488 | 4.00%, 08/01/2019 - 01/15/2020 | 80,010 | ||||||
| 26,000 | 5.25%, 06/15/2015 ☼ | 25,935 | ||||||
| Level 3 Financing, Inc. | ||||||||
| 11,685 | 4.50%, 01/31/2022 ☼ | 11,732 | ||||||
| Light Tower Fiber LLC | ||||||||
| 17,398 | 4.00%, 04/13/2020 | 17,180 | ||||||
| 2,078 | 8.00%, 04/12/2021 | 2,059 | ||||||
| Mediacom Communications Corp. | ||||||||
| 13,250 | 3.25%, 01/29/2021 | 12,947 | ||||||
| MISYS plc | ||||||||
| 25,786 | 5.00%, 12/12/2018 | 25,786 | ||||||
| NexTag, Inc. | ||||||||
| 756 | 0.00%,06/04/2019 ● | 529 | ||||||
| Novell, Inc. | ||||||||
| 15,721 | 7.25%, 11/22/2017 | 15,705 | ||||||
| Peak 10, Inc. | ||||||||
| 2,813 | 5.00%, 06/17/2021 | 2,798 | ||||||
| 4,310 | 8.25%, 06/17/2022 | 4,251 | ||||||
| RedPrairie Corp. | ||||||||
| 16,646 | 6.00%, 12/21/2018 | 16,102 | ||||||
| Syniverse Holdings, Inc. | ||||||||
| 5,429 | 4.00%, 04/23/2019 | 5,324 | ||||||
| TransFirst Holding, Inc. | ||||||||
| 16,545 | 4.25%, 12/27/2017 | 16,483 | ||||||
| 1,500 | 8.00%, 06/27/2018 | 1,498 | ||||||
| Virgin Media Finance plc | ||||||||
| 19,500 | 3.50%, 06/07/2020 | 19,213 | ||||||
| Virgin Media Investment Holdings Ltd. | ||||||||
| GBP | 21,800 | 4.25%, 06/30/2023 | 34,592 | |||||
| WideOpenWest Finance LLC | ||||||||
| 10,029 | 4.75%, 04/01/2019 | 10,012 | ||||||
| Zayo Group LLC | ||||||||
| 12,856 | 4.00%, 07/02/2019 | 12,733 | ||||||
| 652,212 | ||||||||
| Media - 0.6% | ||||||||
| Entravision Communications Corp. | ||||||||
| 16,179 | 3.50%, 05/31/2020 | 15,694 | ||||||
| Media General, Inc. | ||||||||
| 18,466 | 4.25%, 07/31/2020 | 18,316 | ||||||
| 34,010 | ||||||||
| Mining - 3.1% | ||||||||
| Alpha Natural Resources, Inc. | ||||||||
| 20,936 | 3.50%, 05/22/2020 | 17,865 | ||||||
| American Rock Salt Holdings LLC | ||||||||
| 23,940 | 4.75%, 05/20/2021 | 23,701 | ||||||
| 6,550 | 8.00%, 05/20/2022 | 6,566 | ||||||
| Arch Coal, Inc. | ||||||||
| 82,292 | 6.25%, 05/16/2018 | 72,535 | ||||||
| BWAY Holding Co. | ||||||||
| 27,396 | 5.50%, 08/14/2020 | 27,499 | ||||||
| Fortescue Metals Group Ltd. | ||||||||
| 41,324 | 3.75%, 06/30/2019 | 40,277 | ||||||
| 188,443 | ||||||||
| Miscellaneous Manufacturing - 2.3% | ||||||||
| Bombardier Recreational Products, Inc. | ||||||||
| 12,675 | 4.00%, 01/30/2019 | 12,443 | ||||||
| Hamilton Sundstrand Corp. | ||||||||
| 52,465 | 4.00%, 12/13/2019 | 51,504 | ||||||
| Provo Craft & Novelty, Inc. | ||||||||
| 7,727 | 0.00%,03/22/2016 ⌂●† | — | ||||||
| Reynolds Group Holdings, Inc. | ||||||||
| 46,115 | 4.00%, 11/30/2018 | 45,827 | ||||||
| Sequa Corp. | ||||||||
| 12,165 | 5.25%, 06/19/2017 | 11,564 | ||||||
| TransDigm Group, Inc. | ||||||||
| 22,193 | 3.75%, 02/28/2020 - 06/04/2021 | 21,805 | ||||||
| 143,143 | ||||||||
| Motor Vehicle and Parts Manufacturing - 0.8% | ||||||||
| Navistar, Inc. | ||||||||
| 43,677 | 5.75%, 08/17/2017 | 43,759 | ||||||
| Tower Automotive Holdings USA LLC | ||||||||
| 6,943 | 4.00%, 04/23/2020 | 6,845 | ||||||
| 50,604 | ||||||||
| Nonmetallic Mineral Product Manufacturing - 0.4% | ||||||||
| Ardagh Holdings USA, Inc. | ||||||||
| 8,920 | 4.00%, 12/17/2019 | 8,824 | ||||||
| Libbey Glass, Inc. | ||||||||
| 15,835 | 3.75%, 04/09/2021 | 15,578 | ||||||
| 24,402 | ||||||||
| Other Services - 2.6% | ||||||||
| Alliance Laundry Systems LLC | ||||||||
| 13,108 | 4.25%, 12/10/2018 | 12,950 | ||||||
| Apex Tool Group LLC | ||||||||
| 16,030 | 4.50%, 01/31/2020 | 15,188 | ||||||
| Gardner Denver, Inc. | ||||||||
| 48,581 | 4.25%, 07/30/2020 | 47,867 | ||||||
| EUR | 20,759 | 4.75%, 07/30/2020 | 25,964 | |||||
| Husky Injection Molding Systems Ltd. | ||||||||
| 8,677 | 4.25%, 06/30/2021 | 8,529 | ||||||
| Husky International Ltd. | ||||||||
| 4,465 | 7.25%, 06/30/2022 | 4,364 | ||||||
| Rexnord LLC | ||||||||
| 43,145 | 4.00%, 08/21/2020 | 42,508 | ||||||
| 157,370 | ||||||||
The accompanying notes are an integral part of these financial statements.
| 9 |
The Hartford Floating Rate Fund
Schedule of Investments – (continued)
October 31, 2014
(000’s Omitted)
| Shares or Principal Amount ╬ | Market Value ╪ | |||||||
| Senior Floating Rate Interests ♦ - 89.8% - (continued) | ||||||||
| Petroleum and Coal Products Manufacturing - 5.3% | ||||||||
| American Energy-Marcellus LLC | ||||||||
| $ | 21,880 | 5.25%, 08/04/2020 | $ | 21,278 | ||||
| 3,335 | 8.50%, 08/04/2021 | 3,177 | ||||||
| Callon Petroleum Co. | ||||||||
| 7,195 | 8.50%, 10/08/2021 ☼ | 7,087 | ||||||
| Chief Exploration & Development | ||||||||
| 17,650 | 7.50%, 05/16/2021 | 16,944 | ||||||
| Crosby Worldwide Ltd. | ||||||||
| 22,024 | 4.00%, 11/23/2020 | 21,074 | ||||||
| Drillships Ocean Ventures, Inc. | ||||||||
| 18,377 | 5.50%, 07/25/2021 ☼ | 17,605 | ||||||
| Fieldwood Energy LLC | ||||||||
| 10,598 | 3.88%, 09/28/2018 | 10,352 | ||||||
| Jefferson Gulf Coast Energy Partners LLC | ||||||||
| 7,500 | 9.00%, 02/27/2018 ☼ | 7,313 | ||||||
| KCA Deutag | ||||||||
| 22,090 | 6.25%, 05/15/2020 | 21,317 | ||||||
| Macquarie Infrastructure Co., Inc. | ||||||||
| 12,708 | 3.25%, 06/01/2020 | 12,507 | ||||||
| Ocean Rig ASA | ||||||||
| 22,420 | 6.00%, 03/31/2021 ☼ | 21,383 | ||||||
| Pacific Drilling S.A. | ||||||||
| 10,591 | 4.50%, 06/03/2018 | 10,124 | ||||||
| Paragon Offshore Finance Co. | ||||||||
| 15,995 | 3.75%, 07/16/2021 ☼ | 14,969 | ||||||
| Peabody Energy Corp. | ||||||||
| 19,520 | 4.25%, 09/24/2020 | 18,873 | ||||||
| Samson Investment Co. | ||||||||
| 43,075 | 5.00%, 09/25/2018 ☼ | 39,652 | ||||||
| Seadrill Ltd. | ||||||||
| 43,436 | 4.00%, 02/21/2021 | 40,986 | ||||||
| Shelf Drilling International Holdings Ltd. | ||||||||
| 21,820 | 10.00%, 10/08/2018 | 21,493 | ||||||
| Western Refining, Inc. | ||||||||
| 18,609 | 4.25%, 11/12/2020 | 18,423 | ||||||
| 324,557 | ||||||||
| Pipeline Transportation - 0.4% | ||||||||
| EMG Utica LLC | ||||||||
| 4,800 | 4.75%, 03/27/2020 | 4,752 | ||||||
| Philadelphia Energy Solutions LLC | ||||||||
| 18,142 | 6.25%, 04/04/2018 | 17,099 | ||||||
| 21,851 | ||||||||
| Plastics and Rubber Products Manufacturing - 0.6% | ||||||||
| Berry Plastics Group, Inc. | ||||||||
| 22,475 | 3.50%, 02/08/2020 | 21,984 | ||||||
| Consolidated Container Co. | ||||||||
| 6,860 | 5.00%, 07/03/2019 | 6,770 | ||||||
| Tricorbraun, Inc. | ||||||||
| 7,314 | 4.00%, 05/03/2018 | 7,199 | ||||||
| 35,953 | ||||||||
| Primary Metal Manufacturing - 0.5% | ||||||||
| Novelis, Inc. | ||||||||
| 25,836 | 3.75%, 03/10/2017 | 25,546 | ||||||
| WireCo WorldGroup, Inc. | ||||||||
| 3,231 | 6.00%, 02/15/2017 | 3,235 | ||||||
| 28,781 | ||||||||
| Professional, Scientific and Technical Services - 2.8% | ||||||||
| Advantage Sales & Marketing, Inc. | ||||||||
| 29,310 | 4.25%, 07/23/2021 | 29,032 | ||||||
| 7,580 | 7.50%, 07/25/2022 | 7,521 | ||||||
| Affinion Group, Inc. | ||||||||
| 64,593 | 6.75%, 04/30/2018 | 62,440 | ||||||
| AlixPartners LLP | ||||||||
| 14,254 | 4.00%, 07/10/2020 | 14,029 | ||||||
| 4,575 | 9.00%, 07/10/2021 | 4,632 | ||||||
| MoneyGram International, Inc. | ||||||||
| 33,214 | 4.25%, 03/27/2020 | 32,107 | ||||||
| Paradigm Ltd. | ||||||||
| 13,653 | 4.75%, 07/30/2019 | 13,311 | ||||||
| RBS Holding Co. LLC | ||||||||
| 11,665 | 9.50%, 03/23/2016 | 6,357 | ||||||
| 169,429 | ||||||||
| Real Estate, Rental and Leasing - 1.6% | ||||||||
| DTZ U.S. Borrower LLC | ||||||||
| 11,252 | 5.00%, 10/23/2021 - 10/28/2021 ☼ | 11,243 | ||||||
| 5,330 | 8.25%, 10/28/2022 ☼ | 5,343 | ||||||
| Fly Leasing Ltd. | ||||||||
| 10,252 | 4.50%, 08/09/2019 | 10,239 | ||||||
| Neff Corp. | ||||||||
| 10,090 | 7.25%, 06/09/2021 | 10,115 | ||||||
| Realogy Corp. | ||||||||
| 3,942 | 4.41%, 10/10/2016 | 3,858 | ||||||
| Realogy Group LLC | ||||||||
| 58,401 | 3.75%, 03/05/2020 | 57,890 | ||||||
| 98,688 | ||||||||
| Retail Trade - 7.6% | ||||||||
| 99 Cents Only Stores | ||||||||
| 9,938 | 4.50%, 01/11/2019 | 9,860 | ||||||
| Albertson's LLC | ||||||||
| 55,395 | 4.50%, 08/25/2021 | 55,405 | ||||||
| American Tire Distributors, Inc. | ||||||||
| 19,467 | 5.75%, 06/01/2018 | 19,443 | ||||||
| Amscan Holdings, Inc. | ||||||||
| 24,702 | 4.00%, 07/27/2019 | 24,172 | ||||||
| Armored AutoGroup, Inc. | ||||||||
| 8,316 | 6.00%, 11/05/2016 | 8,279 | ||||||
| Cooper-Standard Automotive, Inc. | ||||||||
| 11,865 | 4.00%, 04/04/2021 | 11,729 | ||||||
| FleetPride, Inc. | ||||||||
| 15,720 | 5.25%, 11/19/2019 | 15,381 | ||||||
| Hillman (The) Cos., Inc. | ||||||||
| 10,484 | 4.50%, 06/30/2021 | 10,387 | ||||||
| Lands' End, Inc. | ||||||||
| 38,989 | 4.25%, 04/04/2021 | 38,047 | ||||||
| Mauser-Werke GmbH | ||||||||
| 13,260 | 4.50%, 07/31/2021 | 13,045 | ||||||
| 12,725 | 8.25%, 07/31/2022 | 12,470 | ||||||
| Metaldyne Performance Group, Inc. | ||||||||
| 12,080 | 4.50%, 10/20/2021 ☼ | 12,080 | ||||||
| Michaels Stores, Inc. | ||||||||
| 18,150 | 3.75%, 01/28/2020 | 17,813 | ||||||
| 17,235 | 4.00%, 01/28/2020 | 17,013 | ||||||
| Neiman Marcus (The) Group, Inc. | ||||||||
| 67,318 | 4.25%, 10/25/2020 | 66,393 | ||||||
| Quikrete (The) Companies, Inc. | ||||||||
| 22,238 | 4.00%, 09/28/2020 | 22,005 | ||||||
| 8,035 | 7.00%, 03/26/2021 | 8,115 | ||||||
The accompanying notes are an integral part of these financial statements.
| 10 |
The Hartford Floating Rate Fund
Schedule of Investments – (continued)
October 31, 2014
(000’s Omitted)
| Shares or Principal Amount ╬ | Market Value ╪ | |||||||||||
| Senior Floating Rate Interests ♦ - 89.8% - (continued) | ||||||||||||
| Retail Trade - 7.6% - (continued) | ||||||||||||
| Rite Aid Corp. | ||||||||||||
| $ | 23,330 | 4.88%, 06/21/2021 | $ | 23,271 | ||||||||
| 7,755 | 5.75%, 08/21/2020 | 7,794 | ||||||||||
| Sports (The) Authority, Inc. | ||||||||||||
| 23,672 | 7.50%, 11/16/2017 | 22,252 | ||||||||||
| Supervalu, Inc. | ||||||||||||
| 28,345 | 4.50%, 03/21/2019 | 27,960 | ||||||||||
| Weight Watchers International, Inc. | ||||||||||||
| 34,783 | 4.00%, 04/02/2020 | 26,522 | ||||||||||
| 469,436 | ||||||||||||
| Soap, Cleaning Compound and Toilet Manufacturing - 0.3% | ||||||||||||
| Revlon Consumer Products Corp. | ||||||||||||
| 19,041 | 4.00%, 10/08/2019 | 18,815 | ||||||||||
| Transit and Ground Passenger Transportation - 0.6% | ||||||||||||
| Emergency Medical Services Corp. | ||||||||||||
| 40,429 | 4.00%, 05/25/2018 | 40,116 | ||||||||||
| Truck Transportation - 0.3% | ||||||||||||
| Nexeo Solutions LLC | ||||||||||||
| 21,835 | 5.00%, 09/08/2017 - 09/09/2017 | 21,535 | ||||||||||
| 21,535 | ||||||||||||
| Utilities - 4.1% | ||||||||||||
| Calpine Corp. | ||||||||||||
| 21,725 | 3.00%, 05/03/2020 | 21,091 | ||||||||||
| 33,339 | 3.25%, 01/31/2022 | 32,464 | ||||||||||
| 44,675 | 4.00%, 04/01/2018 - 10/31/2020 | 44,379 | ||||||||||
| Dynegy, Inc. | ||||||||||||
| 15,925 | 4.00%, 04/23/2020 | 15,816 | ||||||||||
| Energy Future Holdings | ||||||||||||
| 17,205 | 4.25%, 06/19/2016 | 17,162 | ||||||||||
| Exgen Texas Power LLC | ||||||||||||
| 14,000 | 5.75%, 09/18/2021 | 14,000 | ||||||||||
| La Frontera Generation LLC | ||||||||||||
| 10,976 | 4.50%, 09/30/2020 | 10,894 | ||||||||||
| PowerTeam Services LLC | ||||||||||||
| 16,563 | 4.25%, 05/06/2020 | 16,163 | ||||||||||
| 2,665 | 8.25%, 11/06/2020 | 2,585 | ||||||||||
| Sandy Creek Energy Associates L.P. | ||||||||||||
| 12,566 | 5.00%, 11/09/2020 | 12,493 | ||||||||||
| Star West Generation LLC | ||||||||||||
| 13,431 | 4.25%, 03/13/2020 | 13,296 | ||||||||||
| Texas Competitive Electric Holdings Co. LLC | ||||||||||||
| 70,000 | 4.65%, 10/10/2017 Ψ | 50,900 | ||||||||||
| 251,243 | ||||||||||||
| Wholesale Trade - 1.4% | ||||||||||||
| Gates Global LLC | ||||||||||||
| 50,490 | 4.25%, 07/05/2021 | 49,859 | ||||||||||
| Harbor Freight Tools | ||||||||||||
| 9,483 | 4.75%, 07/26/2019 | 9,474 | ||||||||||
| HD Supply, Inc. | ||||||||||||
| 24,348 | 4.00%, 06/28/2018 | 24,089 | ||||||||||
| 83,422 | ||||||||||||
| Total Senior Floating Rate Interests | ||||||||||||
| (Cost $5,619,775) | $ | 5,520,211 | ||||||||||
| Common Stocks - 0.1% | ||||||||||||
| Consumer Durables and Apparel - 0.0% | ||||||||||||
| 3 | Provo Craft & Novelty, Inc. ⌂●† | $ | — | |||||||||
| Consumer Services - 0.0% | ||||||||||||
| 3,835 | NexTag, Inc. ⌂●† | — | ||||||||||
| Energy - 0.0% | ||||||||||||
| 418,220 | KCA Deutag ⌂●† | 2,043 | ||||||||||
| Media - 0.0% | ||||||||||||
| 16 | F & W Publications, Inc. ● | 1,091 | ||||||||||
| Software and Services - 0.1% | ||||||||||||
| 138 | Momentive Performance Materials, Inc. ⌂●† | 4,703 | ||||||||||
| 4,703 | ||||||||||||
| Total Common Stocks | ||||||||||||
| (Cost $10,663) | $ | 7,837 | ||||||||||
| Exchange Traded Funds - 1.4% | ||||||||||||
| Other Investment Pools and Funds - 1.4% | ||||||||||||
| 208 | iShares 1-3 Year Credit Bond ETF | $ | 21,911 | |||||||||
| 117 | iShares iBoxx $ High Yield Corporate Bond ETF | 10,805 | ||||||||||
| 1,008 | PowerShares Senior Loan Portfolio | 24,584 | ||||||||||
| 268 | SPDR Barclays High Yield Bond ETF | 10,829 | ||||||||||
| 356 | SPDR Barclays Short Term High Yield Bond ETF | 10,667 | ||||||||||
| 175 | SPDR Blackstone/GSO Senior Loan ETF | 8,637 | ||||||||||
| 87,433 | ||||||||||||
| Total Exchange Traded Funds | ||||||||||||
| (Cost $88,760) | $ | 87,433 | ||||||||||
| Total Long-Term Investments | ||||||||||||
| (Cost $6,269,825) | $ | 6,146,309 | ||||||||||
| Short-Term Investments - 0.5% | ||||||||||||
| Other Investment Pools and Funds - 0.5% | ||||||||||||
| 31,870 | JP Morgan U.S. Government Money Market Fund | $ | 31,870 | |||||||||
| Total Short-Term Investments | ||||||||||||
| (Cost $31,870) | $ | 31,870 | ||||||||||
| Total Investments | ||||||||||||
| (Cost $6,301,695) ▲ | 100.5 | % | $ | 6,178,179 | ||||||||
| Other Assets and Liabilities | (0.5 | )% | (27,785 | ) | ||||||||
| Total Net Assets | 100.0 | % | $ | 6,150,394 | ||||||||
The accompanying notes are an integral part of these financial statements.
| 11 |
The Hartford Floating Rate Fund
Schedule of Investments – (continued)
October 31, 2014
(000’s Omitted)
| Note: | Percentage of investments as shown is the ratio of the total market value to total net assets. |
The Fund may refer to any one or more of the industry classifications used by one or more widely recognized market indices, ratings group indices and/or as defined by Fund management. Industry classifications may not be identical across all security types.
Other than the industry classifications "Other Investment Pools and Funds" and "Exchange Traded Funds," equity industry classifications used in this report are the Global Industry Classification Standard, which was developed by and is the exclusive property and service mark of MSCI, Inc. and Standard & Poor’s.
For Fund compliance purposes, the Fund may not use the same classification system shown in this report as these classifications are used for reporting ease.
| ▲ | At October 31, 2014, the cost of securities for federal income tax purposes was $6,306,356 and the aggregate gross unrealized appreciation and depreciation based on that cost were: |
| Unrealized Appreciation | $ | 15,340 | ||
| Unrealized Depreciation | (143,517 | ) | ||
| Net Unrealized Depreciation | $ | (128,177 | ) |
| ╬ | All principal amounts are in U.S. dollars unless otherwise indicated. |
| † | These securities are valued in good faith at fair value as determined under policies and procedures established by and under the supervision of the Board of Directors. At October 31, 2014, the aggregate fair value of these securities was $6,746, which represents 0.1% of total net assets. |
| ● | Non-income producing. For long-term debt securities, items identified are in default as to payment of interest and/or principal. |
| Ψ | The issuer is in bankruptcy. However, the investment held by the Fund is current with respect to interest payments. |
| Δ | Variable rate securities; the rate reported is the coupon rate in effect at October 31, 2014. |
| ♦ | Senior floating rate interests generally pay interest rates which are periodically adjusted by reference to a base short-term, floating lending rate plus a premium. The base lending rates are primarily the LIBOR, and secondarily the prime rate offered by one or more major United States banks (the "Prime Rate") and the certificate of deposit rate or other base lending rates used by commercial lenders. Senior floating rate interests often require prepayments from excess cash flows or permit the borrower to repay at its election. The rate at which the borrower repays cannot be predicted with accuracy. As a result, the actual remaining maturity may be substantially less than the stated maturities shown. Unless otherwise noted, the interest rate disclosed for these securities represents the average coupon as of October 31, 2014. |
| ■ | Securities issued within terms of a private placement memorandum, exempt from registration under Rule 144A under the Securities Act of 1933, as amended, and may be sold only to qualified institutional buyers. Unless otherwise indicated, these holdings are determined to be liquid. At October 31, 2014, the aggregate value of these securities was $325,070, which represents 5.3% of total net assets. |
| § | These securities were sold to the Fund under Regulation S, rules governing offers and sales made outside the United States without registration under the Securities Act of 1933, as amended. The Fund may only be able to resell these securities in the United States if an exemption from registration under the federal and state securities laws is available, or the Fund may only be able to sell these securities outside of the United States (such as on a foreign exchange) to a non-U.S. person. Unless otherwise indicated, these holdings are determined to be liquid. At October 31, 2014, the aggregate value of these securities was $116,381, which represents 1.9% of total net assets. |
| ⌂ | The following securities are considered illiquid. Illiquid securities are often purchased in private placement transactions, are often not registered under the Securities Act of 1933, as amended, and may have contractual restrictions on resale. A security may also be considered illiquid if the security lacks a readily available market or if its valuation has not changed for a certain period of time. |
| Period Acquired | Shares/ Par | Security | Cost Basis | |||||||
| 03/2011 | 418,220 | KCA Deutag | $ | 5,668 | ||||||
| 04/2014 | 138 | Momentive Performance Materials, Inc. | 4,994 | |||||||
| 06/2014 | 3,835 | NexTag, Inc. | – | |||||||
| 09/2011 | 3 | Provo Craft & Novelty, Inc. | – | |||||||
| 09/2013 - 10/2014 | $ | 7,727 | Provo Craft & Novelty, Inc., 0.00%, 03/22/2016 | 1,710 | ||||||
At October 31, 2014, the aggregate value of these securities was $6,746, which represents 0.1% of total net assets.
| β | Convertible security. |
| ♠ | Perpetual maturity security. Maturity date shown is the next call date or final legal maturity date, whichever comes first. |
| Þ | This security may pay interest in the form of additional principal in lieu of cash. |
The accompanying notes are an integral part of these financial statements.
| 12 |
The Hartford Floating Rate Fund
Schedule of Investments – (continued)
October 31, 2014
(000’s Omitted)
| ☼ | This security, or a portion of this security, was purchased on a when-issued or delayed-delivery basis. The cost of these securities was $165,190 at October 31, 2014. |
| ‡ | This security, or a portion of this security, has been segregated to cover funding requirements on investment transactions settling in the future. |
Foreign Currency Contracts Outstanding at October 31, 2014
| Unrealized Appreciation/(Depreciation) | ||||||||||||||||||||||
| Currency | Buy / Sell | Delivery Date | Counterparty | Contract Amount | Market Value ╪ | Asset | Liability | |||||||||||||||
| CAD | Buy | 11/28/2014 | RBC | $ | 273 | $ | 271 | $ | – | $ | (2 | ) | ||||||||||
| EUR | Buy | 11/28/2014 | BCLY | 3,823 | 3,760 | – | (63 | ) | ||||||||||||||
| EUR | Buy | 11/04/2014 | HSBC | 2,483 | 2,483 | – | – | |||||||||||||||
| EUR | Sell | 11/06/2014 | BCLY | 3,822 | 3,759 | 63 | – | |||||||||||||||
| EUR | Sell | 11/28/2014 | CBA | 40,572 | 40,113 | 459 | – | |||||||||||||||
| EUR | Sell | 11/28/2014 | CBK | 40,561 | 40,118 | 443 | – | |||||||||||||||
| EUR | Sell | 11/28/2014 | DEUT | 40,549 | 40,119 | 430 | – | |||||||||||||||
| EUR | Sell | 11/28/2014 | HSBC | 2,484 | 2,484 | – | – | |||||||||||||||
| EUR | Sell | 11/28/2014 | MSC | 40,546 | 40,119 | 427 | – | |||||||||||||||
| EUR | Sell | 11/28/2014 | RBC | 40,560 | 40,118 | 442 | – | |||||||||||||||
| GBP | Sell | 11/28/2014 | CBK | 121,876 | 121,701 | 175 | – | |||||||||||||||
| GBP | Sell | 11/28/2014 | UBS | 1,262 | 1,259 | 3 | – | |||||||||||||||
| GBP | Sell | 11/28/2014 | WEST | 3,804 | 3,787 | 17 | – | |||||||||||||||
| Total | $ | 2,459 | $ | (65 | ) | |||||||||||||||||
| ╪ | See Significant Accounting Policies of accompanying Notes to Financial Statements regarding valuation of securities. |
| GLOSSARY: (abbreviations used in preceding Schedule of Investments) | |
| Counterparty Abbreviations: | |
| BCLY | Barclays |
| CBA | Commonwealth Bank of Australia |
| CBK | Citibank NA |
| DEUT | Deutsche Bank Securities, Inc. |
| HSBC | HSBC Bank USA |
| MSC | Morgan Stanley |
| RBC | RBC Dominion Securities, Inc. |
| UBS | UBS AG |
| WEST | Westpac International |
| Currency Abbreviations: | |
| CAD | Canadian Dollar |
| EUR | EURO |
| GBP | British Pound |
| Other Abbreviations: | |
| DJ | Dow Jones |
| ETF | Exchange Traded Fund |
| LIBOR | London Interbank Offered Rate |
| SPDR | Standard & Poor's Depositary Receipt |
The accompanying notes are an integral part of these financial statements.
| 13 |
The Hartford Floating Rate Fund
Schedule of Investments – (continued)
October 31, 2014
(000’s Omitted)
Investment Valuation Hierarchy Level Summary
October 31, 2014
| Total | Level 1 ♦ | Level 2 ♦ | Level 3 | |||||||||||||
| Assets: | ||||||||||||||||
| Common Stocks | ||||||||||||||||
| Consumer Durables and Apparel | $ | – | $ | – | $ | – | $ | – | ||||||||
| Consumer Services | – | – | – | – | ||||||||||||
| Energy | 2,043 | – | – | 2,043 | ||||||||||||
| Media | 1,091 | – | 1,091 | – | ||||||||||||
| Software and Services | 4,703 | – | – | 4,703 | ||||||||||||
| Total | 7,837 | – | 1,091 | 6,746 | ||||||||||||
| Corporate Bonds | 530,828 | – | 530,828 | – | ||||||||||||
| Exchange Traded Funds | 87,433 | 87,433 | – | – | ||||||||||||
| Senior Floating Rate Interests | 5,520,211 | – | 5,520,211 | – | ||||||||||||
| Short-Term Investments | 31,870 | 31,870 | – | – | ||||||||||||
| Total | $ | 6,178,179 | $ | 119,303 | $ | 6,052,130 | $ | 6,746 | ||||||||
| Foreign Currency Contracts* | $ | 2,459 | $ | – | $ | 2,459 | $ | – | ||||||||
| Total | $ | 2,459 | $ | – | $ | 2,459 | $ | – | ||||||||
| Liabilities: | ||||||||||||||||
| Foreign Currency Contracts* | $ | 65 | $ | – | $ | 65 | $ | – | ||||||||
| Total | $ | 65 | $ | – | $ | 65 | $ | – | ||||||||
| ♦ | For the year ended October 31, 2014, there were no transfers between Level 1 and Level 2. |
| * | Derivative instruments (excluding purchased and written options, if applicable) are valued at the unrealized appreciation/depreciation on the investments. |
Following is a reconciliation of Level 3 assets for which significant unobservable inputs were used to determine fair value:
| Balance
as of October 31, 2013 | Realized Gain (Loss) | Change
in Unrealized Appreciation (Depreciation) | Net Amortization | Purchases | Sales | Transfers Into Level 3 | Transfers Out of Level 3 | Balance
as of October 31, 2014 | ||||||||||||||||||||||||||||
| Assets: | ||||||||||||||||||||||||||||||||||||
| Common Stocks | $ | 2,899 | $ | — | $ | (1,147 | )* | $ | — | $ | 4,994 | $ | — | $ | — | $ | — | $ | 6,746 | |||||||||||||||||
| Total | $ | 2,899 | $ | — | $ | (1,147 | ) | $ | — | $ | 4,994 | $ | — | $ | — | $ | — | $ | 6,746 | |||||||||||||||||
| * | Change in unrealized appreciation (depreciation) in the current period relating to assets still held at October 31, 2014 was $(1,147). |
| Note: | For purposes of reporting transfers between different hierarchy levels, both transfers in and out of each level, as applicable, are shown as if they occurred at the beginning of the period. |
The accompanying notes are an integral part of these financial statements.
| 14 |
The Hartford Floating Rate Fund
Statement of Assets and Liabilities
October 31, 2014
(000’s Omitted)
| Assets: | ||||
| Investments in securities, at market value (cost $6,301,695) | $ | 6,178,179 | ||
| Cash | 3,400 | |||
| Unrealized appreciation on foreign currency contracts | 2,459 | |||
| Receivables: | ||||
| Investment securities sold | 140,403 | |||
| Fund shares sold | 9,168 | |||
| Dividends and interest | 30,256 | |||
| Other assets | 1,131 | |||
| Total assets | 6,364,996 | |||
| Liabilities: | ||||
| Unrealized depreciation on foreign currency contracts | 65 | |||
| Bank overdraft — foreign cash | 11,686 | |||
| Payables: | ||||
| Investment securities purchased | 184,277 | |||
| Fund shares redeemed | 13,381 | |||
| Investment management fees | 702 | |||
| Dividends | 3,339 | |||
| Administrative fees | 1 | |||
| Distribution fees | 440 | |||
| Accrued expenses | 624 | |||
| Other liabilities | 87 | |||
| Total liabilities | 214,602 | |||
| Net assets | $ | 6,150,394 | ||
| Summary of Net Assets: | ||||
| Capital stock and paid-in-capital | $ | 6,653,509 | ||
| Undistributed net investment income | 6,585 | |||
| Accumulated net realized loss | (388,250 | ) | ||
| Unrealized depreciation of investments and the translation of assets and liabilities denominated in foreign currency | (121,450 | ) | ||
| Net assets | $ | 6,150,394 | ||
| Shares authorized | 3,200,000 | |||
| Par value | $ | 0.001 | ||
| Class A: Net asset value per share/Maximum offering price per share | $8.88/$9.15 | |||
| Shares outstanding | 164,420 | |||
| Net assets | $ | 1,459,463 | ||
| Class B: Net asset value per share | $ | 8.86 | ||
| Shares outstanding | 2,108 | |||
| Net assets | $ | 18,681 | ||
| Class C: Net asset value per share | $ | 8.86 | ||
| Shares outstanding | 214,349 | |||
| Net assets | $ | 1,900,141 | ||
| Class I: Net asset value per share | $ | 8.89 | ||
| Shares outstanding | 261,640 | |||
| Net assets | $ | 2,325,212 | ||
| Class R3: Net asset value per share | $ | 8.89 | ||
| Shares outstanding | 2,020 | |||
| Net assets | $ | 17,970 | ||
| Class R4: Net asset value per share | $ | 8.87 | ||
| Shares outstanding | 1,315 | |||
| Net assets | $ | 11,663 | ||
| Class R5: Net asset value per share | $ | 8.87 | ||
| Shares outstanding | 423 | |||
| Net assets | $ | 3,753 | ||
| Class Y: Net asset value per share | $ | 8.86 | ||
| Shares outstanding | 46,650 | |||
| Net assets | $ | 413,511 |
The accompanying notes are an integral part of these financial statements.
| 15 |
The Hartford Floating Rate Fund
Statement of Operations
For the Year Ended October 31, 2014
(000’s Omitted)
| Investment Income: | ||||
| Dividends | $ | 4,377 | ||
| Interest | 326,561 | |||
| Less: Foreign tax withheld | (181 | ) | ||
| Total investment income | 330,757 | |||
| Expenses: | ||||
| Investment management fees | 41,252 | |||
| Administrative services fees | ||||
| Class R3 | 37 | |||
| Class R4 | 19 | |||
| Class R5 | 4 | |||
| Transfer agent fees | ||||
| Class A | 1,464 | |||
| Class B | 44 | |||
| Class C | 1,540 | |||
| Class I | 1,522 | |||
| Class R3 | 4 | |||
| Class R4 | 1 | |||
| Class R5 | 1 | |||
| Class Y | 4 | |||
| Distribution fees | ||||
| Class A | 4,706 | |||
| Class B | 247 | |||
| Class C | 20,982 | |||
| Class R3 | 93 | |||
| Class R4 | 31 | |||
| Custodian fees | 18 | |||
| Accounting services fees | 1,172 | |||
| Registration and filing fees | 504 | |||
| Board of Directors' fees | 189 | |||
| Audit fees | 59 | |||
| Other expenses | 857 | |||
| Total expenses (before waivers) | 74,750 | |||
| Expense waivers | (43 | ) | ||
| Total waivers | (43 | ) | ||
| Total expenses, net | 74,707 | |||
| Net Investment Income | 256,050 | |||
| Net Realized Gain on Investments, Other Financial Instruments and Foreign Currency Transactions: | ||||
| Net realized gain on investments | 32,638 | |||
| Net realized gain on swap contracts | 686 | |||
| Net realized gain on foreign currency contracts | 19,154 | |||
| Net realized gain on other foreign currency transactions | 518 | |||
| Net Realized Gain on Investments, Other Financial Instruments and Foreign Currency Transactions | 52,996 | |||
| Net Changes in Unrealized Depreciation of Investments and Foreign Currency Transactions: | ||||
| Net unrealized depreciation of investments | (158,326 | ) | ||
| Net unrealized appreciation of foreign currency contracts | 2,926 | |||
| Net unrealized depreciation of translation of other assets and liabilities in foreign currencies | (714 | ) | ||
| Net Changes in Unrealized Depreciation of Investments and Foreign Currency Transactions | (156,114 | ) | ||
| Net Loss on Investments, Other Financial Instruments and Foreign Currency Transactions | (103,118 | ) | ||
| Net Increase in Net Assets Resulting from Operations | $ | 152,932 |
The accompanying notes are an integral part of these financial statements.
| 16 |
The Hartford Floating Rate Fund
Statement of Changes in Net Assets
(000’s Omitted)
| For the Year Ended October 31, 2014 | For the Year Ended October 31, 2013 | |||||||
| Operations: | ||||||||
| Net investment income | $ | 256,050 | $ | 255,000 | ||||
| Net realized gain on investments, other financial instruments and foreign currency transactions | 52,996 | 51,374 | ||||||
| Net unrealized appreciation (depreciation) of investments and foreign currency transactions | (156,114 | ) | 6,943 | |||||
| Net Increase in Net Assets Resulting from Operations | 152,932 | 313,317 | ||||||
| Distributions to Shareholders: | ||||||||
| From net investment income | ||||||||
| Class A | (71,029 | ) | (78,774 | ) | ||||
| Class B | (742 | ) | (1,087 | ) | ||||
| Class C | (63,775 | ) | (70,147 | ) | ||||
| Class I | (101,921 | ) | (100,977 | ) | ||||
| Class R3 | (650 | ) | (608 | ) | ||||
| Class R4 | (461 | ) | (488 | ) | ||||
| Class R5 | (156 | ) | (190 | ) | ||||
| Class Y | (15,430 | ) | (3,084 | ) | ||||
| Total distributions | (254,164 | ) | (255,355 | ) | ||||
| Capital Share Transactions: | ||||||||
| Class A | (581,270 | ) | 263,093 | |||||
| Class B | (11,026 | ) | (5,326 | ) | ||||
| Class C | (265,120 | ) | 144,799 | |||||
| Class I | (410,055 | ) | 934,880 | |||||
| Class R3 | (88 | ) | 4,299 | |||||
| Class R4 | (1,406 | ) | 1,851 | |||||
| Class R5 | (130 | ) | (7,911 | ) | ||||
| Class Y | 343,144 | 2,416 | ||||||
| Net increase (decrease) from capital share transactions | (925,951 | ) | 1,338,101 | |||||
| Net Increase (Decrease) in Net Assets | (1,027,183 | ) | 1,396,063 | |||||
| Net Assets: | ||||||||
| Beginning of period | 7,177,577 | 5,781,514 | ||||||
| End of period | $ | 6,150,394 | $ | 7,177,577 | ||||
| Undistributed (distributions in excess of) net investment income | $ | 6,585 | $ | 2,486 | ||||
The accompanying notes are an integral part of these financial statements.
| 17 |
The Hartford Floating Rate Fund
Notes to Financial Statements
October 31, 2014
(000’s Omitted)
Organization:
The Hartford Mutual Funds, Inc. (“Company”) is an open-end management investment company comprised of forty-two portfolios. Financial statements for The Hartford Floating Rate Fund (the "Fund"), a series of the Company, are included in this report.
The Company is organized under the laws of the State of Maryland and is registered with the Securities and Exchange Commission (“SEC”) under the Investment Company Act of 1940, as amended (“1940 Act”). The Fund is a diversified open-end management investment company. The Fund is an investment company and applies specialized accounting and reporting under Accounting Standards Codification Topic 946, Financial Services - Investment Companies.
Class A shares are sold with a front-end sales charge of up to 3.00%. Class B shares were sold with a contingent deferred sales charge which is assessed on the lesser of the per share net asset value (“NAV”) of the shares at the time of redemption or the original purchase price, and declines from up to 5.00% to zero depending on the period of time the shares are held (see note below regarding the closing of Class B shares). Class C shares are sold with a contingent deferred sales charge of up to 1.00% on shares redeemed within twelve months of purchase. Class I shares are sold without sales charges to certain eligible investors primarily through advisory fee-based wrap programs. Class R3, R4 and R5 shares, which are offered to employer-sponsored retirement plans, and Class Y shares, which are sold to certain eligible institutional investors, are sold without a sales charge. All classes of shares have identical voting, redemption, dividend, liquidation and other rights and the same terms and conditions, with the exceptions that each class may have different expenses, which may affect performance, and that Class B shares automatically convert to Class A shares after 8 years.
No new or additional investments are allowed in Class B shares of the Fund (including investments through any systematic investment plan). Existing shareholders of Class B shares may continue to hold their Class B shares, exchange their Class B shares for Class B shares of another Hartford Fund (as permitted by existing exchange privileges), or redeem their Class B shares as described in the Fund’s prospectus. Reinstatement privileges with respect to Class B shares are set forth in the Fund's prospectus. For investors electing to reinvest capital gains and dividends, any such capital gains or dividends on Class B shares will continue to be reinvested in Class B shares of the Fund. All Class B share attributes, including the 12b-1 fee, contingent deferred sales charge schedule, and conversion to Class A shares, remain unchanged.
Significant Accounting Policies:
The following is a summary of significant accounting policies of the Fund in the preparation of its financial statements, which are in accordance with United States generally accepted accounting principles (“U.S. GAAP”). The preparation of financial statements in accordance with U.S. GAAP may require management to make estimates and assumptions that affect the reported amounts of assets and liabilities and disclosure of contingent assets and liabilities at the date of the financial statements and the reported amounts of increases and decreases in net assets from operations during the reporting period. Actual results could differ from those estimates.
Determination of Net Asset Value – The NAV of each class of the Fund's shares is determined as of the close of regular trading (normally 4:00 p.m. Eastern Time) (the “NYSE Close”) on each day that the New York Stock Exchange (the “Exchange”) is open (“Valuation Date”). Information that becomes known to the Fund after the NAV has been calculated on a particular day will not generally be used to retroactively adjust the NAV determined earlier that day.
Investment Valuation and Fair Value Measurements – For purposes of calculating the NAV, portfolio investments and other assets held by the Fund's portfolio for which market quotes are readily available are valued at market value. Market value is generally determined on the basis of last reported sales prices or official close price. If no sales are reported, market value is based on quotes obtained from a quotation reporting system, established market makers, or independent pricing services. If market prices are not readily available or are deemed unreliable, the Fund will use the fair value of the investment as determined in good faith under policies and procedures established by and under the supervision of the Company's Board of Directors. Market quotes are considered not readily available where there is an absence of current or reliable market-based data (e.g., trade information or indicative market quotes), including where events occur after the close of the relevant market, but prior to the NYSE Close, that materially affect the values of the Fund's portfolio investments or assets. In addition, market quotes are considered not readily available when, due to extraordinary circumstances, the exchanges or markets on which the investments trade do not open for trading for the entire day and
| 18 |
The Hartford Floating Rate Fund
Notes to Financial Statements – (continued)
October 31, 2014
(000’s Omitted)
no other market prices are available. There can be no assurance that the Fund could obtain the fair market value assigned to an investment if the Fund were to sell the investment at approximately the time at which the Fund determines its NAV.
Fixed income investments (other than short-term obligations), non-exchange traded derivatives and centrally cleared swaps held by the Fund are normally valued on the basis of quotes obtained from independent pricing services or brokers and dealers in accordance with procedures established by the Company's Board of Directors. Prices obtained from independent pricing services use information provided by market makers or estimates of market values through accepted market modeling, trading and pricing conventions. Inputs to the models may include, but are not limited to, prepayment speeds, pricing spread, yield, trade information, dealer quotes, market color, cash flow models and the investment’s terms and conditions. Generally, the Fund may use fair valuation in regard to fixed income investments when the Fund holds defaulted or distressed investments or investments in a company in which a reorganization is pending. Senior floating rate interests generally trade in over-the-counter (“OTC”) markets and are priced through an independent pricing service utilizing independent market quotations from loan dealers or financial institutions. A composite bid price is used, which is an average of the dealer marks and dealer runs. Short-term investments maturing in 60 days or less are generally valued at amortized cost, if their original term to maturity was 60 days or less, or by amortizing their value on the 61st day prior to maturity, if the original term to maturity exceeded 60 days, which approximates fair value.
Investments valued in currencies other than U.S. dollars are converted to U.S. dollars using exchange rates obtained from independent pricing services for calculation of the NAV. As a result, the NAV of the Fund’s shares may be affected by changes in the value of currencies in relation to the U.S. dollar. The value of investments traded in markets outside the United States or denominated in currencies other than the U.S. dollar may be affected significantly on a day that the NYSE is closed and the market value may change on days when an investor is not able to purchase, redeem or exchange shares of the Fund.
Foreign currency contracts represent agreements to exchange currencies on specific future dates at predetermined rates. Foreign currency contracts are valued using foreign currency exchange rates and forward rates as provided by an independent pricing service on the Valuation Date.
Investments in open-end mutual funds are valued at the respective NAV of each open-end mutual fund on the Valuation Date.
Financial instruments for which prices are not available from an independent pricing service may be valued using market quotations obtained from one or more dealers that make markets in the respective financial instrument in accordance with procedures established by the Company's Board of Directors.
U.S. GAAP defines fair value as the price that the Fund would receive to sell an asset or pay to transfer a liability in an orderly transaction between market participants. The U.S. GAAP fair value measurement standards require disclosure of a fair value hierarchy for each major category of assets and liabilities. Various inputs are used in determining the fair value of the Fund’s investments. These inputs are summarized into three broad hierarchy levels. This hierarchy is based on whether the valuation inputs are observable or unobservable. These levels are:
Level 1 – Quoted prices in active markets for identical investments. Level 1 may include exchange traded instruments, such as domestic equities, some foreign equities, options, futures, mutual funds, exchange traded funds, rights and warrants.
Level 2 – Observable inputs other than Level 1 prices, such as quoted prices for similar investments; quoted prices in markets that are not active; or other inputs that are observable or can be corroborated by observable market data. Level 2 may include debt investments that are traded less frequently than exchange traded instruments and which are valued using independent pricing services; foreign equities, which are principally traded on certain foreign markets and are adjusted daily pursuant to a fair value pricing service in order to reflect an adjustment for the factors occurring after the close of certain foreign markets but before the NYSE Close; senior floating rate interests, which are valued using an aggregate of dealer bids; short-term investments, which are valued at amortized cost; and swaps, which are valued based upon the terms of each swap contract.
Level 3 – Significant unobservable inputs that are supported by limited or no market activity. Level 3 may include financial instruments whose values are determined using indicative market quotes or require significant management judgment or estimation. These unobservable valuation inputs may include estimates for current yields, maturity/duration, prepayment speed,
| 19 |
The Hartford Floating Rate Fund
Notes to Financial Statements – (continued)
October 31, 2014
(000’s Omitted)
and indicative market quotes for comparable investments along with other assumptions relating to credit quality, collateral value, complexity of the investment structure, general market conditions and liquidity. This category may include investments where trading has been halted or there are certain restrictions on trading. While these investments are priced using unobservable inputs, the valuation of these investments reflects the best available data and management believes the prices are a reasonable representation of exit price.
The Board of Directors of the Company generally reviews and approves the “Procedures for Valuation of Portfolio Securities” at least once a year. These procedures define how investments are to be valued, including the formation and activities of a Valuation Committee. The Valuation Committee is responsible for determining in good faith the fair value of investments when the value cannot be obtained from primary pricing services or alternative sources or if the valuation of an investment as provided by the primary pricing service or alternative source is believed not to reflect the investment’s fair value as of the Valuation Date. Voting members of the Valuation Committee include the Fund's Treasurer or designee and a Vice President of the investment manager or designee. An Assistant Vice President of the Fund with legal expertise or designee is also included on the Valuation Committee as a non-voting advisory member. In addition, the Fund’s Chief Compliance Officer shall designate a member of the compliance group to attend Valuation Committee meetings as a non-voting resource, to monitor for and provide guidance with respect to compliance with these procedures. Two members of the Valuation Committee or their designees, representing different departments, shall constitute a quorum for purposes of permitting the Valuation Committee to take action. The Valuation Committee will consider all relevant factors in determining an investment’s fair value, and may seek the advice of the Fund’s sub-adviser, knowledgeable brokers, and legal counsel in making such determination. The Valuation Committee reports to the Audit Committee of the Company's Board of Directors. The Audit Committee receives quarterly written reports which include details of all fair-valued investments, including the reason for the fair valuation, and an indication, when possible, of the accuracy of the valuation by disclosing the next available reliable public price quotation or the disposition price of such investments (the “look-back” test). The Board of Directors then must consider for ratification all of the fair value determinations made during the previous quarter.
Valuation levels are not necessarily indicative of the risk associated with investing in such investments. Individual investments within any of the above mentioned asset classes may be assigned a different hierarchical level than those presented above, as individual circumstances dictate.
For additional information, refer to the Investment Valuation Hierarchy Level Summary and the Level 3 roll-forward reconciliation, if applicable, which follow the Schedule of Investments.
Investment Transactions and Investment Income – Investment transactions are recorded as of the trade date (the date the order to buy or sell is executed) for financial reporting purposes. Investments purchased or sold on a when-issued or delayed-delivery basis may be settled a month or more after the trade date. Realized gains and losses are determined on the basis of identified cost.
Trade date for senior floating rate interests purchased in the primary loan market is considered the date on which the loan allocations are determined. Trade date for senior floating rate interests purchased in the secondary loan market is the date on which the transaction is entered into.
Dividend income from domestic securities is accrued on the ex-dividend date. Interest income, including amortization of premium, accretion of discounts and additional principal received in-kind in lieu of cash, is accrued on a daily basis.
Foreign Currency Transactions – Assets and liabilities denominated in currencies other than U.S. dollars are translated into U.S. dollars at the exchange rates in effect on the valuation date. Purchases and sales of investments, income and expenses are translated into U.S. dollars at the exchange rates on the dates of such transactions.
The Fund does not isolate that portion of portfolio investment valuation resulting from fluctuations in the foreign currency exchange rates from the fluctuations arising from changes in the market prices of investments held. Exchange rate fluctuations are included with the net realized and unrealized gain or loss on investments in the accompanying financial statements.
| 20 |
The Hartford Floating Rate Fund
Notes to Financial Statements – (continued)
October 31, 2014
(000’s Omitted)
Net realized foreign exchange gains or losses arise from sales of foreign currencies and the difference between asset and liability amounts initially stated in foreign currencies and the U.S. dollar value of the amounts actually received or paid. Net unrealized foreign exchange gains or losses arise from changes in the value of other assets and liabilities at the end of the reporting period, resulting from changes in the exchange rates.
Fund Share Valuation and Dividend Distributions to Shareholders – Orders for the Fund’s shares are executed in accordance with the investment instructions of the shareholders. The NAV of the Fund’s shares is determined as of the close of business on each business day of the Exchange. The NAV is determined separately for each class of shares of the Fund by dividing the Fund’s net assets attributable to that class by the number of shares of the class outstanding. Each class of shares offered by the Fund has equal rights as to assets and voting privileges (except that shareholders of a class have exclusive voting rights regarding any matter relating solely to that class of shares). Income and non-class specific expenses are allocated daily to each class on the basis of the relative net assets of the class. Realized and unrealized gains and losses are allocated daily based on the relative net assets of each class of shares of the Fund.
Orders for the purchase of the Fund’s shares received prior to the close of the Exchange on any day the Exchange is open for business are priced at the NAV determined as of the close of the Exchange. Orders received after the close of the Exchange, or on a day on which the Exchange and/or the Fund is not open for business, are priced at the next determined NAV.
Dividends are declared pursuant to a policy adopted by the Company's Board of Directors based upon the investment performance of the Fund. Normally, dividends from net investment income are declared daily and paid monthly. Dividends from realized gains, if any, are paid at least once a year.
Net investment income, dividends and distributions from net realized gains and capital are determined in accordance with federal income tax regulations, which may differ from U.S. GAAP with respect to character and timing (see Federal Income Taxes: Distributions and Components of Distributable Earnings and Reclassification of Capital Accounts).
Securities and Other Investments:
Illiquid and Restricted Investments – The Fund is permitted to invest up to 15% of its net assets in illiquid investments. Illiquid investments are those that may not be sold or disposed of in the ordinary course of business within seven days, at approximately the price used to determine the Fund’s NAV. The Fund may not be able to sell illiquid investments when its sub-adviser considers it desirable to do so or may have to sell such investments at a price that is lower than the price that could be obtained if the investments were more liquid. A sale of illiquid investments may require more time and may result in higher dealer discounts and other selling expenses than does the sale of those that are liquid. Illiquid investments also may be more difficult to value due to the unavailability of reliable market quotations for such investments, and an investment in them may have an adverse impact on the Fund’s NAV. The Fund may also purchase certain restricted investments that can only be resold to certain qualified investors and may be determined to be liquid pursuant to policies and guidelines established by the Company's Board of Directors. The Fund, as shown on the Schedule of Investments, had illiquid or restricted investments as of October 31, 2014.
Investments Purchased on a When-Issued or Delayed-Delivery Basis – Delivery and payment for investments that have been purchased by the Fund on a forward commitment, or when-issued or delayed-delivery basis, take place beyond the customary settlement period. The Fund may dispose of or renegotiate a delayed-delivery transaction after it is entered into, and may sell delayed-delivery investments before they are delivered, which may result in a realized gain or loss. During this period, such investments are subject to market fluctuations, and the Fund identifies investments segregated in its records with a value at least equal to the amount of the commitment. The Fund, as shown on the Schedule of Investments, had when-issued or delayed-delivery investments as of October 31, 2014.
Senior Floating Rate Interests – The Fund may invest in senior floating rate interests. Senior floating rate interests hold the most senior position in the capital structure of a business entity (the “Borrower”), are typically secured by specific collateral and have a claim on the assets and/or stock of the Borrower that is senior to the assets held by subordinated debtholders and stockholders of the Borrower. Senior floating rate interests are typically structured and administered by a financial institution that acts as the agent of the lenders participating in the senior floating rate interest. The Fund may invest in multiple series or tranches of a senior floating rate
| 21 |
The Hartford Floating Rate Fund
Notes to Financial Statements – (continued)
October 31, 2014
(000’s Omitted)
interest, which may have varying terms and carry different associated risks. The Fund may also enter into unfunded loan commitments, which are contractual obligations for future funding. Unfunded loan commitments may include revolving credit facilities, which may obligate the Fund to supply additional cash to the borrower on demand, representing a potential financial obligation by the Fund in the future. The Fund may receive a commitment fee based on the undrawn portion of the underlying line of credit portion of a senior floating rate interest. In certain circumstances, the Fund may receive various fees upon the restructure of a senior floating rate interest by a borrower. Fees earned/paid are recorded as a component of income or realized gain/loss in the Statement of Operations.
Senior floating rate interests are typically rated below-investment-grade, which suggests the risk of default is higher, and generally pay higher interest rates than investment-grade debt securities. A default could lead to non-payment of income or principal, which would result in a reduction of investment income to the Fund, and there can be no assurance that the liquidation of any collateral would satisfy the Borrower’s obligation in the event of non-payment of scheduled interest or principal payments, or that such collateral could be readily liquidated. The Fund, as shown on the Schedule of Investments, had senior floating rate interests as of October 31, 2014.
Financial Derivative Instruments:
The following disclosures contain information on how and why the Fund uses derivative instruments, the credit-risk-related contingent features in certain derivative instruments and how derivative instruments affect the Fund’s financial position and results of operations. The location and fair value amounts of these instruments on the Statement of Assets and Liabilities and the realized gains and losses and changes in unrealized gains and losses on the Statement of Operations, each categorized by type of derivative contract, are included in the following Additional Derivative Instrument Information footnote. The derivative instruments outstanding as of year-end are disclosed in the notes to the Schedule of Investments, if applicable. The amounts of realized gains and losses and changes in unrealized gains and losses on derivative instruments during the year are disclosed in the Statement of Operations.
Foreign Currency Contracts – The Fund may enter into foreign currency contracts that obligate the Fund to purchase or sell currencies at specified future dates. Foreign currency contracts are used to hedge the currency exposure associated with some or all of the Fund’s investments and/or as part of an investment strategy. Foreign currency contracts are marked to market daily and the change in value is recorded by the Fund as an unrealized gain or loss. The Fund will record a realized gain or loss when the foreign currency contract is settled.
Foreign currency contracts involve elements of market risk in excess of the amounts reflected in the Statement of Assets and Liabilities. In addition, risks may arise upon entering into these contracts from the potential inability of the counterparties to meet the terms of the contracts and from unanticipated movements in the value of the foreign currencies relative to the U.S. dollar. The Fund, as shown on the Schedule of Investments, had outstanding foreign currency contracts as of October 31, 2014.
Swap Contracts – The Fund may invest in swap contracts. Swap contracts are agreements to exchange or swap investment cash flows, assets, foreign currencies or market-linked returns at specified, future intervals. Swap contracts are either privately negotiated in the over-the-counter market (“OTC swaps”) or cleared in a central clearing house (“centrally cleared swaps”). The Fund may enter into credit default, total return, cross-currency, interest rate, inflation and other forms of swap contracts to manage its exposure to credit, currency, interest rate, commodity and inflation risk. Swap contracts are also used to gain exposure to certain markets. In connection with these contracts, investments or cash may be identified as collateral or margin in accordance with the terms of the respective swap contracts and/or master netting arrangement to provide assets of value and recourse in the event of default or bankruptcy/insolvency.
Swaps are valued based on custom valuations furnished by an independent pricing service. Swaps for which prices are not available from an independent pricing service are valued in accordance with procedures established by the Company's Board of Directors. Changes in market value, if any, are reflected as a component of net changes in unrealized appreciation or depreciation on the Statement of Operations. Daily changes in valuation of centrally cleared swaps, if any, are recorded as a receivable or payable for the change in value (“variation margin”) on the Statement of Assets and Liabilities. Realized gains or losses on centrally cleared swaps are recorded upon the termination of the swap. OTC swap payments received or paid at the beginning of the measurement period are reflected as such on the Statement of Assets and Liabilities and represent premiums paid or received upon entering into the swap contract to compensate for differences between the stated terms of the swap contract and prevailing market conditions (credit
| 22 |
The Hartford Floating Rate Fund
Notes to Financial Statements – (continued)
October 31, 2014
(000’s Omitted)
spreads, currency exchange rates, interest rates and other relevant factors). These upfront premiums are recorded as realized gains or losses on the Statement of Operations upon termination or maturity of the swap. A liquidation payment received or made at the termination or maturity of the swap is recorded as a realized gain or loss on the Statement of Operations. Net periodic payments received or paid by the Fund are included as part of realized gains or losses on the Statement of Operations.
Entering into these contracts involves, to varying degrees, elements of liquidation, counterparty, credit and market risk in excess of the amounts recognized on the Statement of Assets and Liabilities. Such risks involve the possibility that there will be no liquid market for these contracts, that the counterparty to the contracts may default on its obligation to perform or disagree as to the meaning of contractual terms in the contracts, and that there may be unfavorable changes in market conditions (credit spreads, currency exchange rates, interest rates and other relevant factors).
The Fund’s maximum risk of loss from counterparty risk for OTC swaps is the net value of the discounted cash flows to be received from the counterparty over the contract’s remaining life, and current market value, to the extent that amount is positive. The risk is mitigated by having a master netting arrangement between the Fund and the counterparty, which allows for the netting of payments made or received (although such amounts are presented on a gross basis within the Statement of Assets and Liabilities, as applicable) as well as the posting of collateral to the Fund to cover the Fund’s exposure to the counterparty. In a centrally cleared swap, while the Fund enters into an agreement with a clearing broker to execute contracts with a counterparty, the performance of the swap is guaranteed by the central clearinghouse, which reduces the Fund’s exposure to counterparty risk. The Fund is still exposed to the counterparty risk through the clearing broker and clearinghouse. The clearinghouse attempts to minimize this risk to its participants through the use of mandatory margin requirements, daily cash settlements and other procedures. Likewise, the clearing broker reduces its risk through margin requirements and required segregation of customer balances.
Credit Default Swap Contracts – The credit default swap market allows the Fund to manage its exposure to the market or certain sectors of the market, to reduce its risk exposure to defaults of corporate and sovereign issuers, or to create exposure to corporate or sovereign issuers to which it is not otherwise exposed. Certain credit default swaps involve the exchange of a fixed rate premium for protection against the loss in value of an underlying investment or index in the event of a credit event, such as payment default or bankruptcy.
Under a credit default swap contract, one party acts as guarantor by receiving the fixed periodic payment in exchange for the commitment to purchase the underlying investment at par if the defined credit event occurs. Upon the occurrence of a defined credit event, the difference between the value of the reference obligation and the swap’s notional amount is recorded as realized gain or loss on swap transactions in the Statement of Operations. A “buyer” of credit protection agrees to pay a counterparty to assume the credit risk of an issuer upon the occurrence of certain events. The “seller” of the protection receives periodic payments and agrees to assume the credit risk of an issuer upon the occurrence of certain events. Although specified events are contract specific, credit events are generally defined as bankruptcy, failure to pay, restructuring, obligation acceleration, obligation default or repudiation/moratorium. A “seller’s” exposure is limited to the total notional amount of the credit default swap contract. These potential amounts would be partially offset by any recovery values of the respective referenced obligations or upfront payments received upon entering into the contract.
Implied credit spreads, represented in absolute terms, utilized in determining the market value of credit default swap contracts on corporate issues, sovereign government issues or U.S. municipal issues as of year-end are disclosed in the notes to the Schedule of Investments, as applicable, and serve as an indicator of the current status of the payment/performance risk and represent the likelihood or risk of default for the credit derivative. The implied credit spread of a particular referenced entity reflects the cost of buying/selling protection and there may also be upfront payments required to be made to enter into the contract. Wider credit spreads represent a deterioration of the referenced entity’s credit soundness and a greater likelihood or risk of default or other credit event occurring as defined under the terms of the contract. For credit default swap contracts on credit indices, the quoted market prices and resulting values serve as the indicator of the current status of the payment/performance risk. Increasing market values, in absolute terms when compared to the notional amount of the swap, represent a deterioration of the referenced equity’s credit soundness and a greater likelihood or risk of default or other credit event occurring as defined under the terms of the contract. The Fund had no outstanding credit default swap contracts as of October 31, 2014.
| 23 |
The Hartford Floating Rate Fund
Notes to Financial Statements – (continued)
October 31, 2014
(000’s Omitted)
Additional Derivative Instrument Information:
Fair Value of Derivative Instruments on the Statement of Assets and Liabilities as of October 31, 2014:
| Risk Exposure Category | ||||||||||||||||||||||||||||
| Interest
Rate Contracts | Foreign Exchange Contracts | Credit Contracts | Equity Contracts | Commodity Contracts | Other Contracts | Total | ||||||||||||||||||||||
| Assets: | ||||||||||||||||||||||||||||
| Unrealized appreciation on foreign currency contracts | $ | — | $ | 2,459 | $ | — | $ | — | $ | — | $ | — | $ | 2,459 | ||||||||||||||
| Total | $ | — | $ | 2,459 | $ | — | $ | — | $ | — | $ | — | $ | 2,459 | ||||||||||||||
| Liabilities: | ||||||||||||||||||||||||||||
| Unrealized depreciation on foreign currency contracts | $ | — | $ | 65 | $ | — | $ | — | $ | — | $ | — | $ | 65 | ||||||||||||||
| Total | $ | — | $ | 65 | $ | — | $ | — | $ | — | $ | — | $ | 65 | ||||||||||||||
The volume of derivatives that is presented in the Schedule of Investments is consistent with the derivative activity during the year ended October 31, 2014.
The Effect of Derivative Instruments on the Statement of Operations for the year ended October 31, 2014:
| Risk Exposure Category | ||||||||||||||||||||||||||||
| Interest
Rate Contracts | Foreign Exchange Contracts | Credit Contracts | Equity Contracts | Commodity Contracts | Other Contracts | Total | ||||||||||||||||||||||
| Realized Gain on Derivatives Recognized as a Result of Operations: | ||||||||||||||||||||||||||||
| Net realized gain on swap contracts | $ | — | $ | — | $ | 686 | $ | — | $ | — | $ | — | $ | 686 | ||||||||||||||
| Net realized gain on foreign currency contracts | — | 19,154 | — | — | — | — | 19,154 | |||||||||||||||||||||
| Total | $ | — | $ | 19,154 | $ | 686 | $ | — | $ | — | $ | — | $ | 19,840 | ||||||||||||||
| Net Change in Unrealized Appreciation (Depreciation) on Derivatives Recognized as a Result of Operations: | ||||||||||||||||||||||||||||
| Net change in unrealized appreciation of foreign currency contracts | $ | — | $ | 2,926 | $ | — | $ | — | $ | — | $ | — | $ | 2,926 | ||||||||||||||
| Total | $ | — | $ | 2,926 | $ | — | $ | — | $ | — | $ | — | $ | 2,926 | ||||||||||||||
Balance Sheet Offsetting Information - The following discloses both gross information and net information about instruments and transactions eligible for offset in the financial statements, and instruments and transactions that are subject to a master netting arrangement, as well as amounts related to margin, reflected as financial collateral (including cash collateral), held at clearing brokers, counterparties and the Fund’s custodian. The master netting arrangements allow the clearing brokers to net any collateral held in or on behalf of the Fund, or liabilities or payment obligations of the clearing brokers to the Fund, against any liabilities or payment obligations of the Fund to the clearing brokers. The Fund is required to deposit financial collateral (including cash collateral) at the Futures Commission Merchant's ("FCM") custodian on behalf of clearing brokers and counterparties to continually meet the original and maintenance requirements established by the clearing brokers and counterparties. Such requirements are specific to the respective clearing broker or counterparty. Certain master netting arrangements may not be enforceable in the bankruptcy proceedings of a counterparty.
| 24 |
The Hartford Floating Rate Fund
Notes to Financial Statements – (continued)
October 31, 2014
(000’s Omitted)
Offsetting of Financial Assets and Derivative Assets as of October 31, 2014:
| Gross
Amounts* of Assets Presented in Statement of Assets and Liabilities | Financial Instruments with Allowable Netting | Non-cash Collateral Received | Cash
Collateral Received | Net
Amount (not less than $0) | ||||||||||||||||
| Description | ||||||||||||||||||||
| Unrealized appreciation on foreign currency contracts | $ | 2,396 | $ | (2 | ) | $ | — | $ | — | $ | 2,394 | |||||||||
| Total subject to a master netting or similar arrangement | $ | 2,396 | $ | (2 | ) | $ | — | $ | — | $ | 2,394 | |||||||||
* Gross amounts are presented here as there are no amounts that are netted within the Statement of Assets and Liabilities.
Offsetting of Financial Liabilities and Derivative Liabilities as of October 31, 2014:
| Gross
Amounts* of Liabilities Presented in Statement of Assets and Liabilities | Financial Instruments with Allowable Netting | Non-cash Collateral Pledged | Cash
Collateral Pledged | Net
Amount (not less than $0) | ||||||||||||||||
| Description | ||||||||||||||||||||
| Unrealized depreciation on foreign currency contracts | $ | 65 | $ | (2 | ) | $ | — | $ | — | $ | 63 | |||||||||
| Total subject to a master netting or similar arrangement | $ | 65 | $ | (2 | ) | $ | — | $ | — | $ | 63 | |||||||||
* Gross amounts are presented here as there are no amounts that are netted within the Statement of Assets and Liabilities.
Certain derivatives held by the Fund, as of October 31, 2014, are not subject to a master netting arrangement and are excluded from the table above.
Principal Risks:
Credit risk depends largely on the perceived financial health of bond issuers. In general, the credit rating is inversely related to the credit risk of the issuer. Higher rated bonds generally are deemed to have less credit risk, while lower or unrated bonds are deemed to have higher risk of default. The share price, yield and total return of a fund that holds securities with higher credit risk may be more volatile than those of a fund that holds bonds with lower credit risk. Similar to credit risk, the Fund may be exposed to counterparty risk, or the risk that an institution or other entity with which the Fund has unsettled or open transactions will default.
The Fund’s investments expose the Fund to various risks including, but not limited to, interest rate, prepayment, extension, foreign currency and equity risks. Interest rate risk is the risk that fixed income securities will decline in value because of changes in interest rates. As nominal interest rates rise, the values of certain fixed income securities held by the Fund are likely to decrease. A nominal interest rate can be described as the sum of a real interest rate and an expected inflation rate. Fixed income securities with longer durations tend to be more sensitive to changes in interest rates, usually making them more volatile than securities with shorter durations. Duration is useful primarily as a measure of the sensitivity of a fixed income security’s market price to interest rate (i.e., yield) movements. Senior floating rate interests and securities subject to prepayment and extension risk generally offer less potential for gains when interest rates decline. Rising interest rates may cause prepayments to occur at a slower than expected rate, thereby effectively lengthening the maturity of the security and making the security more sensitive to interest rate changes. Prepayment and extension risk are major risks of mortgage backed securities, senior floating rate interests and certain asset backed securities. For certain asset backed securities, the actual maturity may be less than the stated maturity shown in the Schedule of Investments, if applicable. As a result, the timing of income recognition relating to these securities may vary based upon the actual maturity.
If the Fund invests directly in foreign currencies or in securities that trade in, and receive revenues in, foreign currencies, or in derivatives that provide exposure to foreign currencies, it will be subject to the risk that those currencies will decline in value relative to the base currency (U.S. dollars) of the Fund, or, in the case of hedging positions, that the Fund’s base currency will decline in value relative to the currency being hedged. Currency rates in foreign countries may fluctuate significantly over short periods of time for a
| 25 |
The Hartford Floating Rate Fund
Notes to Financial Statements – (continued)
October 31, 2014
(000’s Omitted)
number of reasons, including changes in interest rates, intervention (or the failure to intervene) by U.S. or foreign governments, central banks or supranational entities, such as the International Monetary Fund, or by the imposition of currency controls or other political developments in the United States or abroad. As a result, the Fund’s investments in foreign currency denominated securities may reduce the returns of the Fund. The market values of equity securities, such as common stocks and preferred stocks, or equity related investments, such as futures and options, may decline due to general market conditions which are not specifically related to a particular company, such as real or perceived adverse economic conditions, changes in the general outlook for corporate earnings, changes in interest or currency rates or adverse investor sentiment generally. The market value of equity securities may also decline due to factors which affect a particular industry or industries, such as labor shortages or increased production costs and competitive conditions within an industry. Equity securities and equity related investments generally have greater market price volatility than fixed income securities.
Federal Income Taxes:
Federal Income Taxes – For federal income tax purposes, the Fund intends to continue to qualify as a Regulated Investment Company ("RIC") under Subchapter M of the Internal Revenue Code (“IRC”) by distributing substantially all of its taxable net investment income and net realized capital gains to its shareholders and otherwise complying with the requirements of the IRC. The Fund has distributed substantially all of its income and capital gains in prior years, if applicable, and intends to distribute substantially all of its income and capital gains during the calendar year ending December 31, 2014. Accordingly, no provision for federal income or excise taxes has been made in the accompanying financial statements. Distributions from short-term capital gains are treated as ordinary income distributions for federal income tax purposes.
Net Investment Income (Loss), Net Realized Gains (Losses) and Distributions – Net investment income (loss) and net realized gains (losses) may differ for financial statement and tax purposes primarily because of losses deferred due to wash sale adjustments, foreign currency gains and losses, adjustments related to Passive Foreign Investment Companies ("PFICs"), Real Estate Investment Trusts ("REITs"), RICs, certain derivatives and partnerships. The character of distributions made during the year from net investment income or net realized gains may differ from their ultimate characterization for federal income tax purposes. Also, due to the timing of dividend distributions, the fiscal year in which amounts are distributed may differ from the year that the income or realized gains (losses) were recorded by the Fund.
Distributions and Components of Distributable Earnings – The tax character of distributions paid by the Fund for the periods indicated is as follows (as adjusted for dividends payable, if applicable):
| For the Year Ended October 31, 2014 | For the Year Ended October 31, 2013 | |||||||
| Ordinary Income | $ | 255,305 | $ | 255,091 | ||||
As of October 31, 2014, the Fund’s components of distributable earnings (deficit) on a tax basis are as follows:
| Amount | ||||
| Undistributed Ordinary Income | $ | 9,949 | ||
| Accumulated Capital and Other Losses* | (381,258 | ) | ||
| Unrealized Depreciation† | (128,442 | ) | ||
| Total Accumulated Deficit | $ | (499,751 | ) | |
| * | The Fund has capital loss carryforwards that are identified in the Capital Loss Carryforward note that follows. |
| † | Differences between book-basis and tax-basis unrealized appreciation (depreciation) may be attributable to the losses deferred due to wash sale adjustments, foreign currency gains and losses, adjustments related to PFICs, REITs, RICs, certain derivatives and partnerships. |
Reclassification of Capital Accounts – The Fund may record reclassifications in its capital accounts. These reclassifications have no impact on the total net assets of the Fund. The reclassifications are a result of permanent differences between U.S. GAAP and tax accounting for such items as foreign currency, PFICs, expiration or utilization of capital loss carryforwards or net operating losses.
| 26 |
The Hartford Floating Rate Fund
Notes to Financial Statements – (continued)
October 31, 2014
(000’s Omitted)
Adjustments are made to reflect the impact these items have on current and future distributions to shareholders. Therefore, the source of the Fund’s distributions may be shown in the accompanying Statement of Changes in Net Assets as from undistributed net investment income, from accumulated net realized gains on investments or from capital depending on the type of book and tax differences that exist. For the year ended October 31, 2014, the Fund recorded reclassifications to increase (decrease) the accounts listed below:
| Amount | ||||
| Undistributed Net Investment Income (Loss) | $ | 2,213 | ||
| Accumulated Net Realized Gain (Loss) | (2,213 | ) | ||
Capital Loss Carryforward – On December 22, 2010, the Regulated Investment Company Modernization Act of 2010 (the “Act”) was enacted, which made changes to the capital loss carryforward rules. The changes are effective for taxable years beginning after the date of enactment. Under the Act, funds are permitted to carry forward capital losses for an unlimited period. However, any losses incurred during those future taxable years will be required to be utilized prior to the losses incurred in pre-enactment taxable years, which carry an expiration date. As a result of this ordering rule, pre-enactment capital loss carryforwards may be more likely to expire unused. Additionally, post-enactment capital loss carryforwards retain their character as either short-term or long-term capital losses rather than being considered all short-term as permitted under prior regulation.
At October 31, 2014 (tax year end), the Fund had capital loss carryforwards for U.S. federal income tax purposes as follows:
| Year of Expiration | Amount | |||
| 2016 | $ | 109,198 | ||
| 2017 | 272,060 | |||
| Total | $ | 381,258 | ||
During the year ended October 31, 2014, the Fund utilized $53,353 of prior year capital loss carryforwards.
Accounting for Uncertainty in Income Taxes – The Fund has adopted financial reporting rules that require the Fund to analyze all open tax years, as defined by the statute of limitations, for all major jurisdictions. Generally, tax authorities can examine all tax returns filed for the last three years. The Fund does not have an examination in progress.
The Fund has reviewed all open tax years and major jurisdictions and concluded that these financial reporting rules had no effect on the Fund’s financial position or results of operations. There is no tax liability resulting from unrecognized tax benefits relating to uncertain income tax positions taken or expected to be taken on the tax return for the fiscal year ended October 31, 2014. The Fund is also not aware of any tax positions for which it is reasonably possible that the total amounts of unrecognized tax benefits will significantly change in the next twelve months.
Expenses:
Investment Management Agreement – Hartford Funds Management Company, LLC ("HFMC") serves as the Fund’s investment manager pursuant to an Investment Management Agreement with the Company. HFMC is an indirect wholly owned subsidiary of The Hartford Financial Services Group, Inc. ("The Hartford"). The investment manager has overall investment supervisory responsibility for the Fund. In addition, the investment manager provides administrative personnel, services, equipment, facilities and office space for proper operation of the Fund. HFMC has contracted with Wellington Management Company, LLP ("Wellington Management") under a sub-advisory agreement for the provision of day-to-day investment management services to the Fund in accordance with the Fund’s investment objective and policies. The Fund pays a fee to the investment manager, a portion of which may be used to compensate Wellington Management.
| 27 |
The Hartford Floating Rate Fund
Notes to Financial Statements – (continued)
October 31, 2014
(000’s Omitted)
The schedule below reflects the rates of compensation paid to the investment manager for investment management services rendered as of October 31, 2014; the rates are accrued daily and paid monthly:
| Average Daily Net Assets | Annual Fee | |||
| On first $500 million | 0.6500% | |||
| On next $2 billion | 0.6000% | |||
| On next $2.5 billion | 0.5900% | |||
| On next $5 billion | 0.5800% | |||
| Over $10 billion | 0.5700% | |||
Accounting Services Agreement – Pursuant to the Fund Accounting Agreement between HFMC and the Company, on behalf of the Fund, HFMC provides accounting services to the Fund and receives monthly compensation based on the Fund’s average daily net assets at the rates set forth below. The Fund’s accounting services fees are accrued daily and paid monthly.
| Average Daily Net Assets | Annual Fee | |||
| On first $5 billion | 0.018% | |||
| On next $5 billion | 0.014% | |||
| Over $10 billion | 0.010% | |||
Operating Expenses – Allocable expenses incurred by the Company are allocated to each Fund and allocated to classes within the Fund in proportion to the average daily net assets of the Fund and each class, except where allocation of certain expenses is more fairly made directly to the Fund or to specific classes within a Fund. As of October 31, 2014, HFMC contractually limited the total operating expenses of this Fund, exclusive of taxes, interest expense, brokerage commissions, acquired fund fees and expenses and extraordinary expenses, through February 28, 2015 as follows:
| Class A | Class B | Class C | Class I | Class R3 | Class R4 | Class R5 | Class Y | |||||||||||||||||||||||
| 1.00% | 1.75% | 1.75% | 0.75% | 1.25% | 1.00% | 0.70% | 0.70% | |||||||||||||||||||||||
Distribution and Service Plan for Class A, B, C, R3 and R4 Shares – Hartford Funds Distributors, LLC ("HFD"), an indirect wholly owned subsidiary of The Hartford, is the principal underwriter and distributor of the Fund. HFD is engaged in distribution activities, which include marketing and distribution of shares through broker/dealers, financing distribution costs and maintaining financial books and records. For the year ended October 31, 2014, HFD received front-end load sales charges of $1,457 and contingent deferred sales charges of $385 from the Fund.
The Fund has adopted a Distribution and Service Plan in accordance with Rule 12b-1 of the 1940 Act to compensate the distributor (HFD) for activities intended to result in the sale and distribution of Class A, B, C, R3 and R4 shares and for providing services for shareholders. The Rule 12b-1 plan applicable to Class A shares of the Fund provides for payment of a Rule 12b-1 fee of 0.25% of average daily net assets. Some or all of the fee may be used for shareholder servicing expenses with the remainder used for distribution expenses. Under the Class B Plan, the Fund pays the distributor 1.00% of the average daily net assets of Class B shares that are outstanding for 8 years or less, 0.25% of which is a fee for services provided to existing shareholders with the remainder used for distribution expenses. Some or the entire Rule 12b-1 fee for Class B shares may be remitted to broker/dealers for distribution and/or shareholder account services. After eight years, Class B shares convert to Class A shares. Upon conversion to Class A shares, the Class A plan described above will apply to those shares. Under the Class C Plan, the Fund pays the distributor 1.00% of the average daily net assets of Class C shares outstanding, 0.25% of which is intended as a fee for services provided to existing shareholders with the remainder used for distribution expenses. For Class C shares, some or the entire fee may be remitted to broker/dealers for distribution and/or shareholder account services. Class R3 shares have a distribution fee of 0.50% of average daily net assets and Class R4 shares have a distribution fee of 0.25% of average daily net assets. For Class R3 and R4 shares, some or the entire fee may be remitted to broker/dealers for distribution and/or shareholder account services. The Fund’s 12b-1 fees are accrued daily and paid monthly or at such other intervals as the Board of Directors may determine.
| 28 |
The Hartford Floating Rate Fund
Notes to Financial Statements – (continued)
October 31, 2014
(000’s Omitted)
Other Related Party Transactions – Certain officers of the Fund are directors and/or officers of HFMC and/or The Hartford or its subsidiaries. For the year ended October 31, 2014, a portion of the Fund’s Chief Compliance Officer’s compensation was paid by all of the investment companies in the Hartford fund complex. The portion allocated to the Fund, as represented in other expenses on the Statement of Operations, was in the amount of $13. Hartford Administrative Services Company (“HASCO”), an indirect wholly-owned subsidiary of The Hartford, provides transfer agent services to the Fund. HASCO has contractually agreed to reimburse any portion of the transfer agency fees over 0.30% of average daily net assets per fiscal year for each class. Any transfer agency fee reimbursement is determined before considering the contractual operating expense limitation. For providing such services, HASCO is compensated on a per account basis that varies by account type, except with respect to Class Y, for which it is compensated based on average daily net assets. The amount paid to HASCO and any related contractual reimbursement amounts, if applicable, can be found in the Statement of Operations. These fees are accrued daily and paid monthly.
Administrative services fees are paid to HASCO for third-party recordkeeping services that are payable as a percentage of net assets in the amount of up to 0.20%, 0.15% and 0.10% for Classes R3, R4 and R5 shares, respectively. The total administrative services fees are shown on the Statement of Operations. These fees are accrued daily and paid monthly.
Investment Transactions:
For the year ended October 31, 2014, the cost of purchases and proceeds from sales of investment securities (excluding short-term investments) were as follows:
| Excluding U.S. Government Obligations | U.S. Government Obligations | Total | ||||||||||
| Cost of Purchases | $ | 5,162,404 | $ | — | $ | 5,162,404 | ||||||
| Sales Proceeds | 6,019,429 | — | 6,019,429 | |||||||||
| 29 |
The Hartford Floating Rate Fund
Notes to Financial Statements – (continued)
October 31, 2014
(000’s Omitted)
Capital Share Transactions:
The following information is for the year ended October 31, 2014, and the year ended October 31, 2013:
| For the Year Ended October 31, 2014 | For the Year Ended October 31, 2013 | |||||||||||||||||||||||||||||||
| Shares Sold | Shares
Issued for Reinvested Dividends | Shares Redeemed | Net
Increase (Decrease) of Shares | Shares Sold | Shares
Issued for Reinvested Dividends | Shares Redeemed | Net
Increase (Decrease) of Shares | |||||||||||||||||||||||||
| Class A | ||||||||||||||||||||||||||||||||
| Shares | 39,309 | 7,257 | (111,191 | ) | (64,625 | ) | 94,672 | 8,003 | (73,448 | ) | 29,227 | |||||||||||||||||||||
| Amount | $ | 354,360 | $ | 65,343 | $ | (1,000,973 | ) | $ | (581,270 | ) | $ | 851,185 | $ | 71,941 | $ | (660,033 | ) | $ | 263,093 | |||||||||||||
| Class B | ||||||||||||||||||||||||||||||||
| Shares | 153 | 70 | (1,449 | ) | (1,226 | ) | 453 | 100 | (1,147 | ) | (594 | ) | ||||||||||||||||||||
| Amount | $ | 1,378 | $ | 633 | $ | (13,037 | ) | $ | (11,026 | ) | $ | 4,073 | $ | 901 | $ | (10,300 | ) | $ | (5,326 | ) | ||||||||||||
| Class C | ||||||||||||||||||||||||||||||||
| Shares | 24,370 | 5,982 | (59,895 | ) | (29,543 | ) | 57,065 | 6,460 | (47,429 | ) | 16,096 | |||||||||||||||||||||
| Amount | $ | 219,463 | $ | 53,766 | $ | (538,349 | ) | $ | (265,120 | ) | $ | 512,733 | $ | 57,999 | $ | (425,933 | ) | $ | 144,799 | |||||||||||||
| Class I | ||||||||||||||||||||||||||||||||
| Shares | 111,759 | 8,350 | (165,671 | ) | (45,562 | ) | 193,208 | 8,154 | (97,575 | ) | 103,787 | |||||||||||||||||||||
| Amount | $ | 1,008,016 | $ | 75,229 | $ | (1,493,300 | ) | $ | (410,055 | ) | $ | 1,739,519 | $ | 73,382 | $ | (878,021 | ) | $ | 934,880 | |||||||||||||
| Class R3 | ||||||||||||||||||||||||||||||||
| Shares | 701 | 64 | (775 | ) | (10 | ) | 937 | 63 | (523 | ) | 477 | |||||||||||||||||||||
| Amount | $ | 6,319 | $ | 580 | $ | (6,987 | ) | $ | (88 | ) | $ | 8,444 | $ | 568 | $ | (4,713 | ) | $ | 4,299 | |||||||||||||
| Class R4 | ||||||||||||||||||||||||||||||||
| Shares | 349 | 30 | (535 | ) | (156 | ) | 635 | 31 | (460 | ) | 206 | |||||||||||||||||||||
| Amount | $ | 3,137 | $ | 272 | $ | (4,815 | ) | $ | (1,406 | ) | $ | 5,712 | $ | 281 | $ | (4,142 | ) | $ | 1,851 | |||||||||||||
| Class R5 | ||||||||||||||||||||||||||||||||
| Shares | 135 | 14 | (163 | ) | (14 | ) | 380 | 17 | (1,283 | ) | (886 | ) | ||||||||||||||||||||
| Amount | $ | 1,219 | $ | 124 | $ | (1,473 | ) | $ | (130 | ) | $ | 3,408 | $ | 148 | $ | (11,467 | ) | $ | (7,911 | ) | ||||||||||||
| Class Y | ||||||||||||||||||||||||||||||||
| Shares | 52,929 | 1,029 | (16,099 | ) | 37,859 | 4,819 | 75 | (4,625 | ) | 269 | ||||||||||||||||||||||
| Amount | $ | 477,781 | $ | 9,230 | $ | (143,867 | ) | $ | 343,144 | $ | 43,287 | $ | 671 | $ | (41,542 | ) | $ | 2,416 | ||||||||||||||
| Total | ||||||||||||||||||||||||||||||||
| Shares | 229,705 | 22,796 | (355,778 | ) | (103,277 | ) | 352,169 | 22,903 | (226,490 | ) | 148,582 | |||||||||||||||||||||
| Amount | $ | 2,071,673 | $ | 205,177 | $ | (3,202,801 | ) | $ | (925,951 | ) | $ | 3,168,361 | $ | 205,891 | $ | (2,036,151 | ) | $ | 1,338,101 | |||||||||||||
The following reflects the conversion of Class B shares into Class A shares (reflected as Class A shares sold) for the year ended October 31, 2014, and the year ended October 31, 2013:
| Shares | Dollars | |||||||
| For the Year Ended October 31, 2014 | 134 | $ | 1,203 | |||||
| For the Year Ended October 31, 2013 | 46 | $ | 418 | |||||
Line of Credit:
The Fund is one of several Hartford Funds that participate in a $500 million committed revolving line of credit facility. The facility is to be used for temporary or emergency purposes. Under the arrangement, the funds are required to own securities having a market value in excess of 300% of the total bank borrowings. The interest rate on borrowings varies depending on the nature of the loan. The facility also requires a fee to be paid based on the amount of the commitment. This commitment fee is allocated to all the funds participating in the line of credit based on the average net assets of the funds. During the year ended October 31, 2014, the Fund did not have any borrowings under this facility.
Pending Legal Proceedings:
On February 25, 2011, Jennifer L. Kasilag, Louis Mellinger, Judith M. Menendez, Jacqueline M. Robinson, and Linda A. Russell filed a derivative lawsuit against Hartford Investment Financial Services, LLC (“HIFSCO”) (now known as HFD) on behalf of six Hartford retail mutual funds in the United States District Court for the District of New Jersey, alleging that HIFSCO received excessive advisory and distribution fees in violation of its statutory fiduciary duty under Section 36(b) of the 1940 Act when serving as investment manager and principal underwriter, respectively, to the Hartford retail mutual funds. Although this action was purportedly filed on behalf of certain of the
| 30 |
The Hartford Floating Rate Fund
Notes to Financial Statements – (continued)
October 31, 2014
(000’s Omitted)
Hartford Funds, none of the Hartford Funds is itself a defendant to the suit. HIFSCO moved to dismiss and, in September 2011, the motion was granted in part and denied in part, with leave to amend the complaint. In November 2011, plaintiffs filed an amended complaint on behalf of certain Hartford retail mutual funds, The Hartford Global Health Fund (now known as The Hartford Healthcare Fund), The Hartford Conservative Allocation Fund, The Hartford Growth Opportunities Fund, The Hartford Inflation Plus Fund, The Hartford Advisers Fund (now known as The Hartford Balanced Fund), and The Hartford Capital Appreciation Fund. Plaintiffs seek to rescind the investment management agreements and distribution plans between HIFSCO and these funds and to recover the total fees charged thereunder or, in the alternative, to recover any improper compensation HIFSCO received, in addition to lost earnings. HIFSCO filed a partial motion to dismiss the amended complaint and, in December 2012, the court dismissed without prejudice the claims regarding distribution fees and denied the motion with respect to the advisory fees claims. HIFSCO disputes the allegations and intends to defend vigorously.
In March 2014, the plaintiffs filed a new complaint that added as new plaintiffs The Hartford Floating Rate Fund and The Hartford Small Company Fund and named as a defendant HFMC, which assumed the role as investment manager to the funds as of January 2013. HFMC and HIFSCO dispute the allegations and intend to defend vigorously.
No accrual for litigation relating to this matter has been recorded in the financial statements of the Fund because the Fund is not party to the suit.
In July 2007, the Fund and more than 60 other lenders (known collectively as the “Transeastern Lenders”) accepted the payoff of a guarantee from Tousa, Inc. (“Tousa”), a Florida homebuilder. In order to fund the payoff, Tousa borrowed money from certain new lenders and secured the loan by granting liens to the new lenders on the assets of certain Tousa subsidiaries (the “Subsidiaries”). Tousa entered bankruptcy in January of 2008. In July of 2008, a committee of creditors of the Subsidiaries (the “Committee”) brought suit against the Transeastern Lenders alleging that the Subsidiaries had received no benefit in return for the liens on their assets, that the Subsidiaries were co-borrowers on the loan from the new lenders, and that the Transeastern Lenders received the value of the liens when the Transeastern Lenders accepted the payoff. The Subsidiaries sought the avoidance of their liens and the return of the value of those liens to the bankruptcy estate. On October 13, 2009, the bankruptcy court in the Southern District of Florida ruled in favor of the Committee, avoided the liens, and ordered the Transeastern Lenders to return the payoff amount to the bankruptcy estate. The Transeastern Lenders, together with the Fund, appealed the decision to the district court. On February 11, 2011, the District Court ruled in favor of the Transeastern Lenders and the Fund and quashed the bankruptcy court opinion. The Committee appealed to the Eleventh Circuit. The Eleventh Circuit reinstated the bankruptcy court opinion, but remanded back to the District Court on the question of remedies. The District Court has not yet issued a decision. If found liable, the Fund would be required to return approximately $3-3.5 million to the bankruptcy estate. Management of the Fund believes resolution of this matter will not have a material impact on the Fund’s financial statements.
Indemnifications:
Under the Company's organizational documents, the Company shall indemnify its officers and directors to the full extent required or permitted under Maryland General Corporation Law and the federal securities laws. In addition, the Company, on behalf of the Fund, may enter into contracts that contain a variety of indemnifications. The Company's maximum exposure under these arrangements is unknown. However, as of the date of these financial statements, the Company has not had prior claims or losses pursuant to these contracts and expects the risk of loss to be remote.
Subsequent Event:
Effective December 1, 2014, pursuant to a sub-transfer agency agreement between HASCO and Boston Financial Data Services, Inc. (“BFDS”), HASCO has delegated certain transfer agent, dividend disbursing agent and shareholder servicing agent functions to BFDS. The costs and expenses of such delegation are borne by HASCO, not by the Fund.
| 31 |
The Hartford Floating Rate Fund
Financial Highlights
| - Selected Per-Share Data - (A) | - Ratios and Supplemental Data - | |||||||||||||||||||||||||||||||||||||||||||||||||||
| Class | Net
Asset Value at Beginning of Period | Net Investment Income (Loss) | Net Realized and Unrealized Gain (Loss) on Invest- ments | Total
from Investment Operations | Dividends from Net Investment Income | Distribu- tions from Realized Capital Gains | Total Dividends and Distributions | Net
Asset Value at End of Period | Total Return(B) | Net
Assets at End of Period (000's) | Ratio
of Expenses to Average Net Assets Before Adjust- ments(C) | Ratio
of Expenses to Average Net Assets After Adjust- ments(C) | Ratio
of Net Investment Income (Loss) to Average Net Assets | |||||||||||||||||||||||||||||||||||||||
| For the Year Ended October 31, 2014 | ||||||||||||||||||||||||||||||||||||||||||||||||||||
| A | $ | 9.01 | $ | 0.34 | $ | (0.13 | ) | $ | 0.21 | $ | (0.34 | ) | $ | – | $ | (0.34 | ) | $ | 8.88 | 2.35 | % | $ | 1,459,463 | 0.96 | % | 0.96 | % | 3.80 | % | |||||||||||||||||||||||
| B | 9.00 | 0.27 | (0.14 | ) | 0.13 | (0.27 | ) | – | (0.27 | ) | 8.86 | 1.44 | 18,681 | 1.81 | 1.75 | 3.01 | ||||||||||||||||||||||||||||||||||||
| C | 9.00 | 0.28 | (0.14 | ) | 0.14 | (0.28 | ) | – | (0.28 | ) | 8.86 | 1.48 | 1,900,141 | 1.71 | 1.71 | 3.06 | ||||||||||||||||||||||||||||||||||||
| I | 9.02 | 0.37 | (0.13 | ) | 0.24 | (0.37 | ) | – | (0.37 | ) | 8.89 | 2.62 | 2,325,212 | 0.70 | 0.70 | 4.08 | ||||||||||||||||||||||||||||||||||||
| R3 | 9.03 | 0.32 | (0.14 | ) | 0.18 | (0.32 | ) | – | (0.32 | ) | 8.89 | 1.94 | 17,970 | 1.35 | 1.25 | 3.52 | ||||||||||||||||||||||||||||||||||||
| R4 | 9.01 | 0.34 | (0.14 | ) | 0.20 | (0.34 | ) | – | (0.34 | ) | 8.87 | 2.20 | 11,663 | 1.05 | 1.00 | 3.77 | ||||||||||||||||||||||||||||||||||||
| R5 | 9.01 | 0.37 | (0.14 | ) | 0.23 | (0.37 | ) | – | (0.37 | ) | 8.87 | 2.50 | 3,753 | 0.77 | 0.70 | 4.07 | ||||||||||||||||||||||||||||||||||||
| Y | 9.00 | 0.37 | (0.14 | ) | 0.23 | (0.37 | ) | – | (0.37 | ) | 8.86 | 2.57 | 413,511 | 0.64 | 0.64 | 4.13 | ||||||||||||||||||||||||||||||||||||
| For the Year Ended October 31, 2013 | ||||||||||||||||||||||||||||||||||||||||||||||||||||
| A | $ | 8.93 | $ | 0.36 | $ | 0.09 | $ | 0.45 | $ | (0.37 | ) | $ | – | $ | (0.37 | ) | $ | 9.01 | 5.08 | % | $ | 2,064,701 | 0.96 | % | 0.96 | % | 4.04 | % | ||||||||||||||||||||||||
| B | 8.92 | 0.29 | 0.09 | 0.38 | (0.30 | ) | – | (0.30 | ) | 9.00 | 4.27 | 30,017 | 1.80 | 1.75 | 3.28 | |||||||||||||||||||||||||||||||||||||
| C | 8.92 | 0.30 | 0.08 | 0.38 | (0.30 | ) | – | (0.30 | ) | 9.00 | 4.31 | 2,195,858 | 1.71 | 1.71 | 3.30 | |||||||||||||||||||||||||||||||||||||
| I | 8.94 | 0.39 | 0.08 | 0.47 | (0.39 | ) | – | (0.39 | ) | 9.02 | 5.35 | 2,772,328 | 0.70 | 0.70 | 4.29 | |||||||||||||||||||||||||||||||||||||
| R3 | 8.95 | 0.34 | 0.08 | 0.42 | (0.34 | ) | – | (0.34 | ) | 9.03 | 4.77 | 18,334 | 1.36 | 1.25 | 3.76 | |||||||||||||||||||||||||||||||||||||
| R4 | 8.92 | 0.36 | 0.09 | 0.45 | (0.36 | ) | – | (0.36 | ) | 9.01 | 5.17 | 13,255 | 1.04 | 1.00 | 4.01 | |||||||||||||||||||||||||||||||||||||
| R5 | 8.93 | 0.39 | 0.08 | 0.47 | (0.39 | ) | – | (0.39 | ) | 9.01 | 5.36 | 3,942 | 0.76 | 0.70 | 4.33 | |||||||||||||||||||||||||||||||||||||
| Y | 8.92 | 0.39 | 0.09 | 0.48 | (0.40 | ) | – | (0.40 | ) | 9.00 | 5.43 | 79,142 | 0.64 | 0.64 | 4.39 | |||||||||||||||||||||||||||||||||||||
| For the Year Ended October 31, 2012 (D) | ||||||||||||||||||||||||||||||||||||||||||||||||||||
| A | $ | 8.64 | $ | 0.43 | $ | 0.29 | $ | 0.72 | $ | (0.43 | ) | $ | – | $ | (0.43 | ) | $ | 8.93 | 8.48 | % | $ | 1,784,029 | 0.98 | % | 0.98 | % | 4.85 | % | ||||||||||||||||||||||||
| B | 8.63 | 0.36 | 0.29 | 0.65 | (0.36 | ) | – | (0.36 | ) | 8.92 | 7.66 | 35,026 | 1.80 | 1.75 | 4.08 | |||||||||||||||||||||||||||||||||||||
| C | 8.63 | 0.36 | 0.29 | 0.65 | (0.36 | ) | – | (0.36 | ) | 8.92 | 7.69 | 2,031,516 | 1.72 | 1.72 | 4.10 | |||||||||||||||||||||||||||||||||||||
| I | 8.65 | 0.45 | 0.29 | 0.74 | (0.45 | ) | – | (0.45 | ) | 8.94 | 8.74 | 1,817,957 | 0.73 | 0.73 | 5.10 | |||||||||||||||||||||||||||||||||||||
| R3 | 8.66 | 0.40 | 0.29 | 0.69 | (0.40 | ) | – | (0.40 | ) | 8.95 | 8.17 | 13,889 | 1.37 | 1.25 | 4.57 | |||||||||||||||||||||||||||||||||||||
| R4 | 8.63 | 0.42 | 0.29 | 0.71 | (0.42 | ) | – | (0.42 | ) | 8.92 | 8.47 | 11,283 | 1.06 | 1.00 | 4.80 | |||||||||||||||||||||||||||||||||||||
| R5 | 8.64 | 0.45 | 0.29 | 0.74 | (0.45 | ) | – | (0.45 | ) | 8.93 | 8.78 | 11,820 | 0.76 | 0.70 | 5.12 | |||||||||||||||||||||||||||||||||||||
| Y | 8.63 | 0.45 | 0.29 | 0.74 | (0.45 | ) | – | (0.45 | ) | 8.92 | 8.85 | 75,994 | 0.65 | 0.65 | 5.18 | |||||||||||||||||||||||||||||||||||||
| For the Year Ended October 31, 2011 (D) | ||||||||||||||||||||||||||||||||||||||||||||||||||||
| A | $ | 8.81 | $ | 0.42 | $ | (0.16 | ) | $ | 0.26 | $ | (0.43 | ) | $ | – | $ | (0.43 | ) | $ | 8.64 | 2.91 | % | $ | 1,972,548 | 0.97 | % | 0.97 | % | 4.79 | % | |||||||||||||||||||||||
| B | 8.81 | 0.35 | (0.17 | ) | 0.18 | (0.36 | ) | – | (0.36 | ) | 8.63 | 2.00 | 41,006 | 1.79 | 1.75 | 4.01 | ||||||||||||||||||||||||||||||||||||
| C | 8.81 | 0.36 | (0.18 | ) | 0.18 | (0.36 | ) | – | (0.36 | ) | 8.63 | 2.03 | 2,106,199 | 1.72 | 1.72 | 4.05 | ||||||||||||||||||||||||||||||||||||
| I | 8.82 | 0.45 | (0.17 | ) | 0.28 | (0.45 | ) | – | (0.45 | ) | 8.65 | 3.16 | 1,568,922 | 0.72 | 0.72 | 5.03 | ||||||||||||||||||||||||||||||||||||
| R3 | 8.83 | 0.40 | (0.17 | ) | 0.23 | (0.40 | ) | – | (0.40 | ) | 8.66 | 2.62 | 11,257 | 1.37 | 1.25 | 4.52 | ||||||||||||||||||||||||||||||||||||
| R4 | 8.81 | 0.42 | (0.18 | ) | 0.24 | (0.42 | ) | – | (0.42 | ) | 8.63 | 2.76 | 6,048 | 1.06 | 1.00 | 4.78 | ||||||||||||||||||||||||||||||||||||
| R5 | 8.82 | 0.44 | (0.17 | ) | 0.27 | (0.45 | ) | – | (0.45 | ) | 8.64 | 3.07 | 7,882 | 0.75 | 0.70 | 5.04 | ||||||||||||||||||||||||||||||||||||
| Y | 8.80 | 0.45 | (0.17 | ) | 0.28 | (0.45 | ) | – | (0.45 | ) | 8.63 | 3.24 | 115,997 | 0.65 | 0.65 | 5.11 | ||||||||||||||||||||||||||||||||||||
See Portfolio Turnover information on the next page.
| 32 |
The Hartford Floating Rate Fund
Financial Highlights – (continued)
| - Selected Per-Share Data - (A) | - Ratios and Supplemental Data - | |||||||||||||||||||||||||||||||||||||||||||||||||||
| Class | Net
Asset Value at Beginning of Period | Net Investment Income (Loss) | Net Realized and Unrealized Gain (Loss) on Invest- ments | Total
from Investment Operations | Dividends from Net Investment Income | Distribu- tions from Realized Capital Gains | Total Dividends and Distributions | Net
Asset Value at End of Period | Total Return(B) | Net
Assets at End of Period (000's) | Ratio
of Expenses to Average Net Assets Before Adjust- ments(C) | Ratio
of Expenses to Average Net Assets After Adjust- ments(C) | Ratio
of Net Investment Income (Loss) to Average Net Assets | |||||||||||||||||||||||||||||||||||||||
| For the Year Ended October 31, 2010 (D) | ||||||||||||||||||||||||||||||||||||||||||||||||||||
| A | $ | 8.30 | $ | 0.46 | $ | 0.51 | $ | 0.97 | $ | (0.46 | ) | $ | – | $ | (0.46 | ) | $ | 8.81 | 11.97 | % | $ | 1,840,478 | 0.97 | % | 0.97 | % | 5.40 | % | ||||||||||||||||||||||||
| B | 8.30 | 0.40 | 0.50 | 0.90 | (0.39 | ) | – | (0.39 | ) | 8.81 | 11.11 | 47,006 | 1.78 | 1.75 | 4.64 | |||||||||||||||||||||||||||||||||||||
| C | 8.29 | 0.40 | 0.52 | 0.92 | (0.40 | ) | – | (0.40 | ) | 8.81 | 11.27 | 1,945,470 | 1.72 | 1.72 | 4.65 | |||||||||||||||||||||||||||||||||||||
| I | 8.31 | 0.48 | 0.51 | 0.99 | (0.48 | ) | – | (0.48 | ) | 8.82 | 12.22 | 1,202,589 | 0.74 | 0.74 | 5.62 | |||||||||||||||||||||||||||||||||||||
| R3 | 8.31 | 0.44 | 0.52 | 0.96 | (0.44 | ) | – | (0.44 | ) | 8.83 | 11.75 | 7,598 | 1.38 | 1.25 | 5.11 | |||||||||||||||||||||||||||||||||||||
| R4 | 8.30 | 0.46 | 0.51 | 0.97 | (0.46 | ) | – | (0.46 | ) | 8.81 | 11.93 | 2,339 | 1.07 | 1.00 | 5.37 | |||||||||||||||||||||||||||||||||||||
| R5 | 8.30 | 0.48 | 0.51 | 0.99 | (0.47 | ) | – | (0.47 | ) | 8.82 | 12.25 | 10,956 | 0.79 | 0.74 | 5.46 | |||||||||||||||||||||||||||||||||||||
| Y | 8.29 | 0.49 | 0.51 | 1.00 | (0.49 | ) | – | (0.49 | ) | 8.80 | 12.35 | 101,560 | 0.65 | 0.65 | 5.73 | |||||||||||||||||||||||||||||||||||||
| (A) | Information presented relates to a share outstanding throughout the indicated period. Net investment income (loss) per share amounts are calculated based on average shares outstanding unless otherwise noted. |
| (B) | Assumes initial investment at net asset value at the beginning of each period, reinvestment of all distributions, the complete redemption of the investment at net asset value at the end of each period and no sales charge. Total return would be reduced if sales charges were taken into account. |
| (C) | Adjustments include waivers and reimbursements, if applicable. |
| (D) | Net investment income (loss) per share amounts have been calculated using the SEC method. |
| Portfolio Turnover Rate for All Share Classes | ||||
| For the Year Ended October 31, 2014 | 75 | % | ||
| For the Year Ended October 31, 2013 | 78 | |||
| For the Year Ended October 31, 2012 | 60 | |||
| For the Year Ended October 31, 2011 | 96 | |||
| For the Year Ended October 31, 2010 | 63 | |||
| 33 |
Report of Independent Registered Public Accounting Firm
The Board of Directors and Shareholders of
The Hartford Mutual Funds, Inc.
We have audited the accompanying statement of assets and liabilities, including the schedule of investments, of The Hartford Floating Rate Fund (one of the portfolios constituting The Hartford Mutual Funds, Inc. (the Funds)) as of October 31, 2014, and the related statement of operations for the year then ended, the statements of changes in net assets for each of the two years in the period then ended, and the financial highlights for each of the five years in the period then ended. These financial statements and financial highlights are the responsibility of the Funds’ management. Our responsibility is to express an opinion on these financial statements and financial highlights based on our audits.
We conducted our audits in accordance with the standards of the Public Company Accounting Oversight Board (United States). Those standards require that we plan and perform the audit to obtain reasonable assurance about whether the financial statements and financial highlights are free of material misstatement. We were not engaged to perform an audit of the Funds’ internal control over financial reporting. Our audits included consideration of internal control over financial reporting as a basis for designing audit procedures that are appropriate in the circumstances, but not for the purpose of expressing an opinion on the effectiveness of the Funds’ internal control over financial reporting. Accordingly, we express no such opinion. An audit also includes examining, on a test basis, evidence supporting the amounts and disclosures in the financial statements and financial highlights, assessing the accounting principles used and significant estimates made by management, and evaluating the overall financial statement presentation. Our procedures included confirmation of securities owned as of October 31, 2014, by correspondence with the custodian, agent banks and brokers or by other appropriate auditing procedures where replies from agent banks and brokers were not received. We believe that our audits provide a reasonable basis for our opinion.
In our opinion, the financial statements and financial highlights referred to above present fairly, in all material respects, the financial position of The Hartford Floating Rate Fund of The Hartford Mutual Funds, Inc. at October 31, 2014, the results of its operations for the year then ended, the changes in its net assets for each of the two years in the period then ended, and the financial highlights for each of the five years in the period then ended, in conformity with U.S. generally accepted accounting principles.
| |
| Minneapolis, Minnesota | |
| December 18, 2014 |
| 34 |
The Hartford Floating Rate Fund
Directors and Officers (Unaudited)
The Board of Directors of the Company (the "Directors") appoints officers who are responsible for the day-to-day operations of the Fund and who execute policies formulated by the Directors. Each Director serves until his or her death, resignation, or retirement or until the next annual meeting of shareholders is held or until his or her successor is elected and qualifies.
Directors and officers who are employed by or who have a financial interest in The Hartford Financial Services Group, Inc. ("The Hartford") are considered “interested” persons of the Fund pursuant to the 1940 Act. Each officer and two of the Company's Directors, as noted in the chart below, are “interested” persons of the Fund. Each Director serves as a director for The Hartford Mutual Funds, Inc., The Hartford Mutual Funds II, Inc., Hartford Series Fund, Inc., and Hartford HLS Series Fund II, Inc., and as a trustee for The Hartford Alternative Strategies Fund, which, as of October 31, 2014, collectively consist of 66 funds. Correspondence may be sent to Directors and officers c/o Hartford Funds, 5 Radnor Corporate Center, Suite 300, 100 Matsonford Road, Radnor, Pennsylvania 19087, except that correspondence to Mr. Annoni, Mr. Dressen and Ms. Quade may be sent to 500 Bielenberg Drive, Suite 500, Woodbury, Minnesota 55125.
The table below sets forth, for each Director and officer, his or her name, year of birth, current position with the Company and date first elected or appointed to The Hartford Mutual Funds, Inc. ("MF") and The Hartford Mutual Funds II, Inc. ("MF2"), principal occupation, and, for Directors, other directorships held. The Fund’s Statement of Additional Information contains further information on the Directors and is available free of charge by calling 1-888-843-7824 or writing to: Hartford Funds, P.O. Box 55022, Boston, MA 02205-5022.
Information on the aggregate remuneration paid to the directors of the Company can be found in the Statement of Operations herein. The Fund pays to The Hartford a portion of the Chief Compliance Officer’s compensation, but does not pay salaries or compensation to any of its other officers or Directors who are employed by The Hartford.
Non-Interested Directors
Hilary E. Ackermann (1956) Director since September 23, 2014
Ms. Ackermann served as Chief Risk Officer at Goldman Sachs Bank USA from October 2008 to November 2011 and serves as a Director of Dynegy, Inc., an independent power company, from October 2012 to present.
Lynn S. Birdsong (1946) Director since 2003, Chairman of the Investment Committee since 2014
Mr. Birdsong is a private investor. Mr. Birdsong currently serves as a Director of the Sovereign High Yield Investment Company (April 2010 to current). Mr. Birdsong currently serves as an Independent Director of Nomura Partners Funds, Inc. (formerly, The Japan Fund) (April 2003 to current). From 2003 to March 2005, Mr. Birdsong was an Independent Director of the Atlantic Whitehall Funds. From 1979 to 2002, Mr. Birdsong was a Managing Director of Zurich Scudder Investments, an investment management firm. During his employment with Scudder, Mr. Birdsong was an Interested Director of The Japan Fund. From January 1981 through December 2013, Mr. Birdsong was a partner in Birdsong Company, an advertising specialty firm.
Robert M. Gavin, Jr. (1940) Director since 2002 (MF) and 1986 (MF2), Chairman of the Board for each since 2004
Dr. Gavin is an educational consultant. Prior to September 1, 2001, he was President of Cranbrook Education Community and prior to July 1996, he was President of Macalester College, St. Paul, Minnesota.
Duane E. Hill (1945) Director since 2001 (MF) and 2002 (MF2), Chairman of the Nominating Committee since 2003
Mr. Hill is a Partner of TSG Ventures L.P., a private equity investment company. Mr. Hill is a former partner of TSG Capital Group, a private equity investment firm that served as sponsor and lead investor in leveraged buyouts of middle market companies.
Sandra S. Jaffee (1941) Director since 2005
Ms. Jaffee is the founder and Chief Executive Officer of a private company, Homeworks Concierge, LLC, which provides residential property management services in Westchester County, New York (January 2012 to present). Ms. Jaffee served as Chairman (2008 to 2009) and Chief Executive Officer of Fortent (formerly Searchspace Group), a leading provider of compliance/regulatory technology to financial institutions from August 2005 to August 2009. From August 2004 to August 2005, Ms. Jaffee served as an Entrepreneur in Residence with Warburg Pincus, a private equity firm. Prior to joining Warburg Pincus, Ms. Jaffee served as Executive Vice President at Citigroup, from September 1995 to July 2004, where she was President and Chief Executive Officer of Citibank’s Global Securities Services (1995 to 2003). Ms. Jaffee currently serves as a member of the Board of Directors of Broadridge Financial Solutions as well as a Trustee of Muhlenberg College.
| 35 |
The Hartford Floating Rate Fund
Directors and Officers (Unaudited) – (continued)
William P. Johnston (1944) Director since 2005, Chairman of the Compliance Committee since 2005
In June 2006, Mr. Johnston was appointed as Senior Advisor to The Carlyle Group, a global private equity and other alternative asset investment firm and currently serves as an Operating Executive. In July 2006, Mr. Johnston was elected to the Board of Directors of MultiPlan, Inc. and served as a Director (July 2006 to August 2010). In August 2007, Mr. Johnston was elected to the Board of Directors of LifeCare Holdings, Inc. and served as a Director (August 2007 to June 2013). In February 2008, Mr. Johnston was elected to the Board of Directors of HCR-ManorCare, Inc. In May 2006, Mr. Johnston was elected to the Supervisory Board of Fresenius Medical Care AG & Co. KGaA, after its acquisition of Renal Care Group, Inc. in March 2006. Mr. Johnston joined Renal Care Group in November 2002 as a member of the Board of Directors and served as Chairman of the Board from March 2003 through March 2006. From 2002 through 2013, Mr. Johnston served as a Board member of the Georgia O’Keefe Museum. From September 1987 to December 2002, Mr. Johnston was with Equitable Securities Corporation (and its successors, SunTrust Equitable Securities and SunTrust Robinson Humphrey) serving in various investment banking and managerial positions, including Managing Director and Head of Investment Banking, Chief Executive Officer and Vice Chairman.
Phillip O. Peterson (1944) Director since 2002 (MF) and 2000 (MF2), Chairman of the Audit Committee since 2002
Mr. Peterson is a mutual fund industry consultant. He was a partner of KPMG LLP (an accounting firm) until July 1999. Mr. Peterson joined William Blair Funds in February 2007 as a member of the Board of Trustees. From February 2012 to February 2014, Mr. Peterson served as a Trustee of Symetra Variable Mutual Funds. From January 2004 to April 2005, Mr. Peterson served as Independent President of the Strong Mutual Funds.
Lemma W. Senbet (1946) Director since 2005
Dr. Senbet is the William E. Mayer Chair Professor of Finance and Founding Director, Center for Financial Policy, at the University of Maryland, Robert H. Smith School of Business. He was chair of the Finance Department of the University of Maryland, Robert H. Smith School of Business from 1998 to 2006. Since June 2013, he has been on leave from the University to serve as Executive Director of African Economic Research Consortium which focuses on economic policy research and training. Previously, he was a chaired professor of finance at the University of Wisconsin-Madison. Also, he was a Director of the Fortis Funds from March 2000 to July 2002. Dr. Senbet served as Director of the American Finance Association and President of the Western Finance Association. In 2006, Dr. Senbet was inducted Fellow of Financial Management Association International for his career-long distinguished scholarship and professional service.
Interested Directors and Officers
James E. Davey (1964) Director since 2012, President and Chief Executive Officer since 2010
Mr. Davey serves as Executive Vice President of Hartford Life Insurance Company (“HLIC”) and The Hartford. Additionally, Mr. Davey serves as Chairman of the Board, Manager and Senior Managing Director of Hartford Funds Distributors, LLC (“HFD”). He also currently serves as Director, Chairman of the Board, President and Senior Managing Director of Hartford Administrative Services Company (“HASCO”). Mr. Davey also serves as Manager, Chairman of the Board and Senior Managing Director for Hartford Funds Management Company, LLC (“HFMC”) and Director, Chairman of the Board and Senior Managing Director for Hartford Funds Management Group, Inc. ("HFMG"). Mr. Davey has served in various positions within The Hartford and its subsidiaries in connection with the operation of the Hartford Funds. Mr. Davey joined The Hartford in 2002.
Lowndes A. Smith* (1939) Director since 1996 (MF) and 2002 (MF2)
Mr. Smith served as Vice Chairman of The Hartford from February 1997 to January 2002, as President and Chief Executive Officer of Hartford Life, Inc. from February 1997 to January 2002, and as President and Chief Operating Officer of The Hartford Life Insurance Companies from January 1989 to January 2002. Mr. Smith serves as a Director of White Mountains Insurance Group Ltd. (October 2003 to current); One Beacon Insurance (October 2006 to current); Symetra Financial (August 2007 to current) and is a Managing Director of Whittington Gray Associates (January 2007 to current).
* Mr. Smith resigned as a Director of MF, MF2, Hartford Series Fund, Inc. and Hartford HLS Series Fund II, Inc. and as a Trustee of The Hartford Alternative Strategies Fund effective September 17, 2014.
Other Officers
Mark A. Annoni (1964) Vice President, Controller and Treasurer since 2012
Mr. Annoni currently serves as the Assistant Vice President of HLIC (February 2004 to present) and Senior Vice President of HFMG (December 2013 to present). Mr. Annoni has served in various positions within The Hartford and its subsidiaries in connection with the operation of the Hartford Funds. Mr. Annoni joined The Hartford in 2001.
| 36 |
The Hartford Floating Rate Fund
Directors and Officers (Unaudited) – (continued)
Michael R. Dressen (1963) AML Compliance Officer since 2011
Mr. Dressen currently serves as Assistant Vice President of HLIC. He also serves as Chief Compliance Officer and AML Compliance Officer of HASCO and as AML Officer of HFD. Mr. Dressen has served in various positions within The Hartford and its subsidiaries in connection with the operation of the Hartford Funds.
Edward P. Macdonald (1967) Vice President, Secretary and Chief Legal Officer since 2005
Mr. Macdonald currently serves as Assistant Secretary, Executive Vice President and Deputy General Counsel of HFD, HASCO, HFMC and HFMG. He also serves as Vice President of HLIC. Mr. Macdonald has served in various positions within The Hartford and its subsidiaries in connection with the operation of the Hartford Funds. Mr. Macdonald joined The Hartford in 2005.
Joseph G. Melcher (1973) Vice President and Chief Compliance Officer since 2013
Mr. Melcher currently serves as Executive Vice President of HFD, HFMG and HASCO. Mr. Melcher also currently serves as Executive Vice President and Chief Compliance Officer of HFMC. Mr. Melcher has served in various positions within The Hartford and its subsidiaries in connection with the operation of the Hartford Funds since joining The Hartford in 2012. Prior to joining The Hartford, Mr. Melcher worked at Touchstone Investments, a member of the Western & Southern Financial Group, where he held the position of Vice President and Chief Compliance Officer from 2010 through 2012 and Assistant Vice President, Compliance from 2005 to 2010.
Vernon J. Meyer (1964) Vice President since 2006
Mr. Meyer currently serves as Senior Vice President of HLIC. He also currently serves as Managing Director and Chief Investment Officer of HFMC and Managing Director of HFMG. Mr. Meyer has served in various positions within The Hartford and its subsidiaries in connection with the operation of the Hartford Funds. Mr. Meyer joined The Hartford in 2004.
Laura S. Quade (1969) Vice President since 2012
Ms. Quade currently serves as Vice President of HASCO, HFD and HFMG. She is the Head of Operations of HASCO and formerly served as Director, Enterprise Operations of HLIC. Ms. Quade has served in various positions within The Hartford and its subsidiaries in connection with the operation of the Hartford Funds. Ms. Quade joined The Hartford in 2001.
Martin A. Swanson** (1962) Vice President since 2010
Mr. Swanson currently serves as Vice President of HLIC. Mr. Swanson also serves as Managing Director, Chief Marketing Officer and Principal of HFD and Managing Director of HFMG. Mr. Swanson has served in various positions within The Hartford and its subsidiaries in connection with the operation of the Hartford Funds.
** Mr. Swanson resigned as an officer effective November 6, 2014.
HOW TO OBTAIN A COPY OF THE FUND’S PROXY VOTING POLICIES AND VOTING RECORDS (UNAUDITED)
A description of the policies and procedures that the Fund uses to determine how to vote proxies relating to portfolio securities and information about how the Fund voted proxies relating to portfolio securities during the most recent twelve-month period ended June 30 are available (1) without charge, upon request, by calling 888-843-7824 and (2) on the SEC’s website at http://www.sec.gov.
QUARTERLY PORTFOLIO HOLDINGS INFORMATION (UNAUDITED)
The Fund files a complete schedule of portfolio holdings with the SEC for the first and third quarters of each fiscal year on Form N-Q. The Fund’s Forms N-Q are available (1) without charge, upon request, by calling 888-843-7824 and (2) on the SEC’s website at http://www.sec.gov. The Form N-Q may be reviewed and copied at the SEC’s Public Reference Room in Washington, DC. Information on the operation of the Public Reference Room may be obtained by calling 1-800-SEC-0330.
| 37 |
The Hartford Floating Rate Fund
Federal Tax Information (Unaudited)
For the fiscal year ended October 31, 2014, there is no further federal tax information required for this Fund.
| 38 |
The Hartford Floating Rate Fund
Expense Example (Unaudited)
Your Fund's Expenses
As a shareholder of the Fund, you incur two types of costs: (1) transaction costs, including sales charges (loads) on purchase payments, if any, and contingent deferred sales charges (CDSC), if any, and (2) ongoing costs, including investment management fees, distribution and/or service (12b-1) fees, if any, and other fund expenses. This example is intended to help you understand your ongoing costs (in dollars) of investing in the Fund and to compare these costs with the ongoing costs of investing in other mutual funds. The example is based on an investment of $1,000 invested at the beginning of the period and held for the entire period of April 30, 2014 through October 31, 2014.
Actual Expenses
The first set of columns of the table below provides information about actual account values and actual expenses. You may use the information in this column, together with the amount you invested, to estimate the expenses that you paid over the period. Simply divide your account value by $1,000 (for example, an $8,600 account value divided by $1,000 = 8.6), then multiply the result by the number in the line under the heading entitled “Expenses Paid During Period” to estimate the expenses you paid on your account during this period.
Hypothetical Example for Comparison Purposes
The second set of columns of the table below provides information about hypothetical account values and hypothetical expenses based on the Fund's actual expense ratio and an assumed rate of return of 5% per year before expenses, which is not the Fund's actual return. The hypothetical account values and expenses may not be used to estimate the actual ending account balance or expenses you paid for the period. You may use this information to compare the ongoing costs of investing in the Fund and other funds. To do so, compare this 5% hypothetical example with the 5% hypothetical examples that appear in the shareholder reports of the other funds.
Please note that the expenses shown in the table are meant to highlight your ongoing costs only and do not reflect any transactional costs, such as sales charges (loads) and CDSC. Therefore, the second set of columns of the table is useful in comparing ongoing costs only, and will not help you determine the relative total costs of owning different funds. In addition, if these transactional costs were included, your costs would be higher. Expenses are equal to the Fund's annualized expense ratios multiplied by average account value over the period, multiplied by 184/365 (to reflect the one-half year period).
| Actual return | Hypothetical (5% return before expenses) | |||||||||||||||||||||||||||||||||||
| Beginning Account Value April 30, 2014 | Ending
Account Value October 31, 2014 | Expenses
paid during the period April 30, 2014 through October 31, 2014 | Beginning Account Value April 30, 2014 | Ending
Account Value October 31, 2014 | Expenses
paid during the period April 30, 2014 through October 31, 2014 | Annualized expense ratio | Days in the current 1/2 year | Days in the full year | ||||||||||||||||||||||||||||
| Class A | $ | 1,000.00 | $ | 1,005.50 | $ | 4.89 | $ | 1,000.00 | $ | 1,020.33 | $ | 4.93 | 0.97 | % | 184 | 365 | ||||||||||||||||||||
| Class B | $ | 1,000.00 | $ | 1,000.50 | $ | 8.82 | $ | 1,000.00 | $ | 1,016.38 | $ | 8.89 | 1.75 | 184 | 365 | |||||||||||||||||||||
| Class C | $ | 1,000.00 | $ | 1,001.80 | $ | 8.64 | $ | 1,000.00 | $ | 1,016.58 | $ | 8.70 | 1.71 | 184 | 365 | |||||||||||||||||||||
| Class I | $ | 1,000.00 | $ | 1,006.90 | $ | 3.54 | $ | 1,000.00 | $ | 1,021.68 | $ | 3.56 | 0.70 | 184 | 365 | |||||||||||||||||||||
| Class R3 | $ | 1,000.00 | $ | 1,004.10 | $ | 6.31 | $ | 1,000.00 | $ | 1,018.90 | $ | 6.36 | 1.25 | 184 | 365 | |||||||||||||||||||||
| Class R4 | $ | 1,000.00 | $ | 1,004.20 | $ | 5.05 | $ | 1,000.00 | $ | 1,020.16 | $ | 5.09 | 1.00 | 184 | 365 | |||||||||||||||||||||
| Class R5 | $ | 1,000.00 | $ | 1,005.70 | $ | 3.54 | $ | 1,000.00 | $ | 1,021.68 | $ | 3.57 | 0.70 | 184 | 365 | |||||||||||||||||||||
| Class Y | $ | 1,000.00 | $ | 1,006.00 | $ | 3.24 | $ | 1,000.00 | $ | 1,021.98 | $ | 3.26 | 0.64 | 184 | 365 | |||||||||||||||||||||
| 39 |
The Hartford Floating Rate Fund
Approval of Investment Management and Investment Sub-Advisory Agreements (Unaudited)
Section 15(c) of the Investment Company Act of 1940, as amended (the “1940 Act”), requires that each mutual fund’s board of directors, including a majority of those directors who are not “interested persons” of the mutual fund, as defined in the 1940 Act (the “Independent Directors”), annually review and consider the continuation of the mutual fund’s investment advisory and sub-advisory agreements. At its meeting held on August 5-6, 2014, the Board of Directors (the “Board”) of The Hartford Mutual Funds, Inc., including each of the Independent Directors, unanimously voted to approve the continuation of the investment management agreement for The Hartford Floating Rate Fund (the “Fund”) with Hartford Funds Management Company, LLC (“HFMC”) and the continuation of the investment sub-advisory agreement between HFMC and the Fund’s sub-adviser, Wellington Management Company, LLP (the “Sub-adviser,” and together with HFMC, the “Advisers”) (collectively, the “Agreements”).
In the months preceding the August 5-6, 2014 meeting, the Board requested, received and reviewed written responses from the Advisers to questions posed to them on behalf of the Independent Directors and supporting materials relating to those questions and responses. The Board considered information furnished to the Board at its meetings throughout the year, as well as information specifically prepared in connection with the annual approval of the Agreements at the Board’s meetings held on June 17-18, 2014 and August 5-6, 2014. Information provided to the Board at its meetings throughout the year included, among other things, reports on Fund performance, legal and compliance matters, sales and marketing activity, shareholder services, and the other services provided to the Fund by the Advisers and their affiliates. The Board also received in-person presentations by Fund officers and representatives of HFMC at the Board’s meetings on June 17-18, 2014 and August 5-6, 2014 concerning the Agreements.
The Independent Directors, advised by independent legal counsel, engaged service providers to assist them with evaluating the Agreements with respect to the Fund. Lipper Inc. (“Lipper”), an independent provider of investment company data, was retained to provide the Board with reports on how the Fund’s contractual management fees, actual management fees, other non-management fees, overall expense ratios and investment performance compared to those of mutual funds with similar investment objectives. The Independent Directors also engaged an independent financial services consultant (the “Consultant”) to assist them in evaluating the Fund’s management fees, sub-advisory fees, other non-management fees, overall expense ratios and investment performance. In addition, the Consultant reviewed the profitability calculations utilized by HFMC in connection with the continuation of the investment management agreement.
In determining whether to continue the Agreements for the Fund, the members of the Board reviewed and evaluated information and factors they believed to be relevant and appropriate in light of the information that the Board deemed necessary and appropriate through the exercise of its reasonable business judgment. While individual members of the Board may have weighed certain factors differently, the Board’s determination to continue the Agreements was based on a comprehensive consideration of all information provided to the Board throughout the year and specifically with respect to the continuation of the Agreements. A more detailed discussion of the factors the Board considered with respect to its approval of the Agreements is provided below.
Nature, Extent and Quality of Services Provided by the Advisers
The Board requested and considered information concerning the nature, extent and quality of the services provided to the Fund by the Advisers. The Board considered, among other things, the terms of the Agreements and the range of services provided by the Advisers. The Board considered the Advisers’ professional personnel who provide services to the Fund, including each Adviser’s ability and experience in attracting and retaining qualified personnel to service the Fund. The Board considered each Adviser’s reputation and overall financial strength, as well as its willingness to consider and implement organizational and operational changes designed to enhance services to the Hartford Funds. In addition, the Board considered the quality of each Adviser’s communications with the Board and responsiveness to Board inquiries and requests made from time to time with respect to the Fund and other Hartford Funds.
The Board also requested and evaluated information concerning each Adviser’s regulatory and compliance environment. In this regard, the Board requested and reviewed information on each Adviser’s compliance policies and procedures, compliance history, and a report from the Fund’s Chief Compliance Officer on each Adviser’s compliance with applicable laws and regulations, including responses to regulatory developments and compliance issues raised by regulators. The Board also noted the Advisers’ support of the Fund’s compliance control structure, particularly the resources devoted by the Advisers in support of the Fund’s obligations pursuant to Rule 38a-1 under the 1940 Act.
With respect to HFMC, the Board noted that, under the Agreements, HFMC is responsible for the management of the Fund, including oversight of fund operations and service providers, and provides administrative and investment advisory services in connection with selecting, monitoring and supervising the Sub-adviser. The Board considered HFMC’s ongoing monitoring of people, process and performance, including its quarterly reviews of each of the Hartford Funds, semi-annual meetings with the leaders of each Fund’s portfolio management team, and oversight of the Hartford Funds’ approximately 66 portfolio managers. The Board recognized that HFMC has demonstrated a record of making changes to the
| 40 |
The Hartford Floating Rate Fund
Approval of Investment Management and Investment Sub-Advisory Agreements (Unaudited) – (continued)
management and/or strategies of the Hartford Funds when warranted. The Board considered HFMC’s oversight of the Sub-adviser’s investment approach and results, process for monitoring best execution of portfolio trades by the Sub-adviser, and approach to risk management with respect to the Fund and the service providers to the Fund. The Board also considered HFMC’s oversight of compliance with the Fund’s objective and policies as well as with applicable laws and regulations, noting that regulatory and other developments had over time led to an increase in the scope of HFMC’s services in this regard.
In addition, the Board considered HFMC’s ongoing commitment to review and rationalize the Hartford Funds product line-up and the expenses that HFMC had incurred in connection with fund combinations in recent years. The Board considered that HFMC or its affiliates are responsible for providing the Fund’s officers.
With respect to the Sub-adviser, which provides certain day-to-day portfolio management services for the Fund, the Board considered the quality of the Fund’s portfolio manager, the Sub-adviser’s other investment personnel, its investment philosophy and process, investment research capabilities and resources, performance record, trade execution capabilities and experience. The Board considered the experience of the Fund’s portfolio manager, the number of accounts managed by the portfolio manager, and the Sub-adviser’s method for compensating the portfolio manager.
Based on these considerations, the Board concluded that it was satisfied with the nature, extent and quality of the services provided to the Fund by HFMC and the Sub-adviser.
Performance of the Fund and the Advisers
The Board considered the investment performance of the Fund. In this regard, the Board reviewed the performance of the Fund over different time periods presented in the materials and evaluated HFMC’s analysis of the Fund’s performance for these time periods. The Board considered information and materials provided to the Board by the Advisers concerning Fund performance, as well as information from Lipper comparing the investment performance of the Fund to an appropriate benchmark and universe of peer funds. The Board noted that the Fund’s performance was in the 3rd quintile of its performance universe for the 1-, 3- and 5-year periods. The Board also noted that the Fund’s performance was in line with its benchmark for the 1-, 3- and 5-year periods.
The Board considered the detailed investment analytics reports provided by Hartford Funds’ Investment Advisory Group throughout the year. These reports include, among other things, information on the Fund’s gross and net returns, the Fund’s investment performance relative to an appropriate benchmark and peer group, various statistics concerning the Fund’s portfolio, and a narrative summary of various factors affecting Fund performance. The Board considered the Advisers’ cooperation with the Investment Committee, which assists the Board in evaluating the performance of the Fund at periodic meetings throughout the year. The Board also considered the analysis provided by the Consultant relating to the Fund’s performance track record.
In light of all the considerations noted above, the Board concluded that it had continued confidence in HFMC’s and the Sub-adviser’s overall capabilities to manage the Fund.
Costs of the Services and Profitability of the Advisers
The Board reviewed information regarding HFMC’s cost to provide investment management and related services to the Fund and HFMC’s profitability, both overall and for the Fund, on a pre-tax basis without regard to distribution expenses. The Board also requested and reviewed information about the profitability to HFMC and its affiliates from all services provided to the Fund and all aspects of their relationship with the Fund. The Board also requested and received information relating to the operations and profitability of the Sub-adviser.
The Board considered the Consultant’s review of the profitability calculations used by HFMC in connection with the continuation of the investment management agreement, noting the Consultant’s view that Hartford Funds’ process for calculating and reporting Fund profitability is reasonable. In this regard, the Board noted that the Consultant performed a full review of this process in light of the recent restructuring of the Hartford Funds business and reported that the approach to analyzing Fund profitability, including the use of common expense allocation methodologies, is reasonable, sound and well within common industry practice.
Based on these considerations, the Board concluded that the profits anticipated to be realized by the Advisers and their affiliates from their relationships with the Fund would not be excessive.
| 41 |
The Hartford Floating Rate Fund
Approval of Investment Management and Investment Sub-Advisory Agreements (Unaudited) – (continued)
Comparison of Fees and Services Provided by the Advisers
The Board considered comparative information with respect to the management fees to be paid by the Fund to HFMC and the total expense ratios of the Fund. The Board also considered comparative information with respect to the sub-advisory fees to be paid by HFMC to the Sub-adviser. In this regard, the Board requested and reviewed information from HFMC and the Sub-adviser relating to the management and sub-advisory fees, including the sub-advisory fee schedule for the Fund, and total operating expenses for the Fund. With respect to the sub-advisory fee schedule, the Board considered representations from HFMC and the Sub-adviser that the Sub-adviser’s fees were negotiated at arm’s length on a fund-by-fund basis. The Board also reviewed information from Lipper comparing the Fund’s contractual management fees, actual management fees and overall expense ratios relative to a group of funds selected by Lipper, in consultation with the Consultant, and a broader universe of funds selected by Lipper. The Board considered that the Fund’s contractual management fee and actual management fee were in the 3rd quintile of its expense group, while its total expenses (less 12b-1 and shareholder service fees) were in the 2nd quintile. The Board noted that the Fund has a permanent expense cap on each share class. The expense cap resulted in reimbursement of certain expenses incurred in 2013.
While the Board recognized that comparisons between the Fund and peer funds may be imprecise, given the different service levels and characteristics of mutual funds and the different business models and cost structures of the Advisers, the comparative information provided by Lipper assisted the Board in evaluating the reasonableness of the Fund’s management and sub-advisory fees and total operating expenses. In addition, the Board considered the analysis and recommendations of the Consultant relating to the Fund’s management and sub-advisory fees and total operating expenses.
Based on these considerations, the Board concluded that the Fund’s fees and total operating expenses, in conjunction with the information about quality of services, profitability, economies of scale, and other matters discussed, were reasonable in light of the services provided.
Economies of Scale
The Board requested and considered information regarding the Advisers’ realization of economies of scale with respect to the Fund and whether the fee levels reflect these economies of scale for the benefit of the Fund’s shareholders. The Board reviewed the breakpoints in the management fee schedule for the Fund, which reduce fee rates as Fund assets grow over time. The Board recognized that a fund with assets beyond the highest breakpoint level will continue to benefit from economies of scale because additional assets are charged the lowest breakpoint fee resulting in lower overall effective management fee rates. The Board also considered that expense limitations and fee waivers that reduce the Fund’s expenses at all asset levels can have the same effect as breakpoints in sharing economies of scale with shareholders and provide protection from an increase in expenses if Fund assets decline. The Board recognized that a fee schedule that reaches a lower breakpoint quickly provides shareholders with the benefit of anticipated or potential economies of scale. The Board also considered that HFMC has been active in managing expenses, which has resulted in benefits being realized by shareholders as assets within the Hartford Funds family of funds have grown over time, including through lower transfer agent costs and other operating expenses.
The Board reviewed and evaluated materials from Lipper and the Consultant showing how management fee schedules of peer funds reflect economies of scale for the benefit of shareholders as a peer fund’s assets hypothetically increase over time. Based on information provided by HFMC, Lipper, and the Consultant, the Board recognized that there is no uniform methodology for establishing breakpoints or uniform pattern in asset levels that trigger breakpoints or the amounts of breakpoints triggered.
After considering all of the information available to it, the Board concluded that it was satisfied with the extent to which economies of scale would be shared for the benefit of the Fund’s shareholders based on currently available information and the effective advisory fees and expense ratios for the Fund at its current and reasonably anticipated asset levels. The Board noted, however, that it would continue to monitor future growth in Fund assets and the appropriateness of additional breakpoints.
Other Benefits
The Board considered other benefits to the Advisers and their affiliates from their relationships with the Fund.
The Board noted that HFMC receives fees for fund accounting and related services from the Fund, and the Board considered information on profits to HFMC for such services. The Board also considered that Hartford Administrative Services Company (“HASCO”), the Fund’s transfer agent and an affiliate of HFMC, receives transfer agency compensation from the Fund, and the Board reviewed information on the profitability of
| 42 |
The Hartford Floating Rate Fund
Approval of Investment Management and Investment Sub-Advisory Agreements (Unaudited) – (continued)
the Fund’s transfer agency function to HASCO. The Board considered information provided by HASCO indicating that the transfer agent fees charged by HASCO to the Fund were fair and reasonable based on publicly available information.
The Board also considered that Hartford Funds Distributors, LLC (“HFD”), an affiliate of HFMC, serves as principal underwriter of the Fund. As principal underwriter, HFD receives 12b-1 fees from the Fund and receives all or a portion of the sales charges on sales or redemptions of certain classes of shares. The Board also noted that certain affiliates of HFD distribute shares of the Fund and receive compensation in that connection.
The Board considered the benefits, if any, to the Sub-adviser from any use of the Fund’s brokerage commissions to obtain soft dollar research, and representations from HFMC and the Sub-adviser that the Sub-adviser would not make any revenue-sharing payments or any other type of distribution payments to HFMC or its affiliates.
The Board considered the benefits to shareholders of being part of the Hartford Funds family of funds, including the right to exchange investments between the same class of funds without a sales charge, the ability to reinvest Fund dividends into other funds in the family, and the ability to combine holdings in the Fund with holdings in other funds to obtain a reduced sales charge. The Board considered HFMC’s efforts to provide investors in the family with a broad range of investment styles and asset classes and its entrepreneurial risk in initiating new funds to expand these opportunities for shareholders.
* * * *
Based upon its review of these various factors, among others, the Board concluded that it is in the best interests of the Fund and its shareholders for the Board to approve the Agreements for an additional year. In reaching this decision, the Board did not assign relative weights to the factors discussed above or deem any one or group of them to be controlling in and of themselves. In connection with their deliberations, the Independent Directors met separately in executive session on several occasions, with independent legal counsel and the Consultant, to review the relevant materials and consider their responsibilities under relevant laws and regulations.
| 43 |
The Hartford Floating Rate Fund
Main Risks (Unaudited)
The main risks of investing in the Fund are described below.
Market, Selection and Strategy Risk: The Fund’s share price may fluctuate due to market risk and/or security selections that may underperform the market or relevant benchmarks. If the sub-adviser's investment strategy does not perform as expected, the Fund could underperform its peers or lose money. There is no guarantee the Fund will achieve its stated objective.
Fixed Income Risk: The Fund is subject to interest rate risk (the risk that the value of an investment decreases when interest rates rise), credit risk (the risk that the issuing company of a security is unable to pay interest and principal when due), liquidity risk (the risk that an investment may be difficult to sell at an advantageous time or price) and call risk (the risk that an investment may be redeemed early).
Loan Risk: The Fund’s investments in loans may at times become difficult to value and highly illiquid; they are subject to credit risk such as nonpayment of principal or interest, and risks of bankruptcy and insolvency.
Junk Bond Risk: Investments in junk bonds involve greater risk of price volatility, illiquidity, and default than higher-rated debt securities.
Foreign Investment Risk: Investments in foreign securities may be riskier than investments in U.S. securities. Potential risks include the risks of illiquidity, increased price volatility, less government regulation, less extensive and less frequent accounting and other reporting requirements, unfavorable changes in currency exchange rates, and economic and political disruptions.
The Hartford Floating Rate Fund should not be considered an alternative to CDs or money market funds. This Fund is for investors who are looking to complement their traditional fixed income investments.
| 44 |
THIS PRIVACY POLICY IS NOT PART OF THIS REPORT
Privacy Policy and Practices of The Hartford Financial Services Group, Inc. and its Affiliates
(herein called “we, our and us”)
This Privacy Policy applies to our United States Operations
We value your trust. We are committed to the responsible: a) management; b) use; and c) protection; of Personal Information.
This notice describes how we collect, disclose, and protect Personal Information.
We collect Personal Information to: a) service your Transactions with us; and b) support our business functions.
We may obtain Personal Information from: a) You; b) your Transactions with us; and c) third parties such as a consumer-reporting agency.
Based on the type of product or service You apply for or get from us, Personal Information such as: a) your name; b) your address; c) your income; d) your payment; or e) your credit history; may be gathered from sources such as applications, Transactions, and consumer reports.
To serve You and service our business, we may share certain Personal Information. We will share Personal Information, only as allowed by law, with affiliates such as: a) our insurance companies; b) our employee agents; c) our brokerage firms; and d) our administrators.
As allowed by law, we may share Personal Financial Information with our affiliates to: a) market our products; or b) market our services; to You without providing You with an option to prevent these disclosures.
|
We may also share Personal Information, only as allowed by law, with unaffiliated third parties including: a) independent agents; b) brokerage firms; c) insurance companies; d) administrators; and e) service providers; who help us serve You and service our business.
When allowed by law, we may share certain Personal Financial Information with other unaffiliated third parties who assist us by performing services or functions such as: a) taking surveys; b) marketing our products or services; or c) offering financial products or services under a joint agreement between us and one or more financial institutions.
We, and third parties we partner with, may track some of the pages You visit through the use of: a) cookies; b) pixel tagging; or c) other technologies; and currently do not process or comply with any web browser’s “do not track” signal or similar mechanism that indicates a request to disable online tracking of individual users who visit our websites or use our services.
We will not sell or share your Personal Financial Information with anyone for purposes unrelated to our business functions without offering You the opportunity to: a) “opt-out;” or b) “opt-in;” as required by law.
We only disclose Personal Health Information with: a) your proper written authorization; or b) as otherwise allowed or required by law.
Our employees have access to Personal Information in the course of doing their jobs, such as: a) underwriting policies; b) paying claims; c) developing new products; or d) advising customers of our products and services.
|
We use manual and electronic security procedures to maintain: a) the confidentiality; and b) the integrity of; Personal Information that we have. We use these procedures to guard against unauthorized access.
Some techniques we use to protect Personal Information include: a) secured files; b) user authentication; c) encryption; d) firewall technology; and e) the use of detection software.
We are responsible for and must: a) identify information to be protected; b) provide an adequate level of protection for that data; c) grant access to protected data only to those people who must use it in the performance of their job-related duties.
Employees who violate our Privacy Policy will be subject to discipline, which may include ending their employment with us.
At the start of our business relationship, we will give You a copy of our current Privacy Policy.
We will also give You a copy of our current Privacy Policy once a year if You maintain a continuing business relationship with us.
We will continue to follow our Privacy Policy regarding Personal Information even when a business relationship no longer exists between us.
|
As used in this Privacy Notice:
Application means your request for our product or service.
Personal Financial Information means financial information such as: a) credit history; b) income; c) financial benefits; or d) policy or claim information.
Personal Health Information means health information such as: a) your medical records; or b) information about your illness, disability or injury.
Personal Information means information that identifies You personally and is not otherwise available to the public. It includes: a) Personal Financial Information; and b) Personal Health Information.
Transaction means your business dealings with us, such as: a) your Application; b) your request for us to pay a claim; and c) your request for us to take an action on your account.
You means an individual who has given us Personal Information in conjunction with: a) asking about; b) applying for; or c) obtaining; a financial product or service from us if the product or service is used mainly for personal, family, or household purposes.
|
This Privacy Policy is being provided on behalf of the following affiliates of The Hartford Financial Services Group, Inc.:
1stAGChoice, Inc.; Access CoverageCorp, Inc.; Access CoverageCorp Technologies, Inc.; American Maturity Life Insurance Company; Archway 60 R, LLC; Business Management Group, Inc.; Champlain Life Reinsurance Company; DMS R, LLC; Eloy R, LLC; Ersatz Corporation; First State Insurance Company; Hartford Accident and Indemnity Company; Hartford Administrative Services Company; Hartford Casualty General Agency, Inc.; Hartford Casualty Insurance Company; Hartford-Comprehensive Employee Benefit Service Company; Hartford Equity Sales Company, Inc.; Hartford Fire General Agency, Inc.; Hartford Fire Insurance Company; Hartford Funds Management Company, LLC; Hartford Funds Management Group, Inc.; Hartford HLS Series Fund II, Inc.; Hartford Insurance Company of Illinois; Hartford Insurance Company of the Midwest; Hartford Insurance Company of the Southeast; Hartford Integrated Technologies, Inc.; Hartford International Life Reassurance Corporation; Hartford Funds Distributors, LLC; Hartford Investment Management Company; Hartford Life and Accident Insurance Company; Hartford Life and Annuity Insurance Company; Hartford Life Insurance Company; Hartford Life Private Placement, LLC; Hartford Lloyd’s Corporation; Hartford Lloyd’s Insurance Company; Hartford Mezzanine Investors I, LLC; Hartford Residual Market, L.C.C.; Hartford Retirement Services, LLC; Hartford Securities Distribution Company, Inc.; Hartford Series Fund, Inc.; Hartford Specialty Insurance Services of Texas, LLC; Hartford Strategic Investments, LLC; Hartford Underwriters Insurance Company; Hartford Technology Services Company, L.L.C.; Hartford of Texas General Agency, Inc.; Hartford Underwriters General Agency, Inc.; HARTRE Company, L.C.C.; HL Investment Advisors, LLC; HLA LLC; Horizon Management Group, LLC; HRA Brokerage Services, Inc.; Lanidex Class B, LLC; M-CAP Insurance Agency, LLC; New England Insurance Company; New England Reinsurance Corporation; Nutmeg Insurance Agency, Inc.; Nutmeg Insurance Company; Pacific Insurance Company, Limited; Planco, LLC: Property and Casualty Insurance Company of Hartford; Revere R, LLC; RVR R, LLC; Sentinel Insurance Company, Ltd.; Sunstone R, LLC; Symphony R, LLC; The Evergreen Group Incorporated; The Hartford Alternative Strategies Fund; The Hartford Mutual Funds, Inc.; The Hartford Mutual Funds II, Inc.; Trumbull Flood Management, L.L.C.; Trumbull Insurance Company; Twin City Fire Insurance Company; White River Life Reinsurance Company.
HPP Revised January 2014
HARTFORDFUNDS
hartfordfunds.com
This information is written in connection with the promotion or marketing of the matter(s) addressed in this material.
This report is submitted for the general information of the shareholders of the Fund. It is not authorized for distribution unless preceded or accompanied by a current prospectus for the Fund.
The information cannot be used or relied upon for the purpose of avoiding IRS penalties. These materials are not intended to provide tax, accounting or legal advice. As with all matters of a tax or legal nature, you should consult your own tax or legal counsel for advice.
Investors should carefully consider the investment objectives, risks, charges, and expenses of Hartford Funds before investing. This and other information can be found in the prospectus and summary prospectus, which can be obtained by calling 888-843-7824 (retail) or 800-279-1541 (institutional). Investors should read them carefully before they invest.
Hartford Funds are underwritten and distributed by Hartford Funds Distributors, LLC.
MFAR-FR14 12/14 113974-3 Printed in U.S.A.
HARTFORDFUNDS
|
THE HARTFORD FLOATING RATE
HIGH INCOME FUND
2014 Annual Report |
A MESSAGE FROM THE PRESIDENT
Dear Fellow Shareholders:
Thank you for investing in Hartford Funds.
Market Review
U.S. equities (as represented by the S&P 500 Index) rose steadily for the fiscal year ended October 31, 2014, with a return of 17.27% for the period. With the exception of short-lived geopolitical scares early in 2014 and concerns about continuing global growth near the end of the period, stocks generally rose on solid fundamentals and encouraging macroeconomic data during the year.
September 2014 marked the six-year anniversary of the start of the financial crisis. Within weeks of that anniversary, both the S&P 500 Index and the Dow Jones Industrial Average set new all-time highs, closing at 2,018 and 17,391, respectively, on October 31. Although the fallout of the crisis continues to influence investor behavior, stocks have recovered and risen dramatically, up 198% from their low in March 2009. Meanwhile, the domestic economy is notching strong growth, and the unemployment rate has reached its lowest level since August 2008.
While the U.S. economy appears to have stabilized and to have reverted to a solid growth path, the outlook for the global economy appears to have gotten cloudier. The U.S. Federal Reserve has ended quantitative easing, while Europe and Japan are pursuing stimulus options to avoid a double-dip recession and deflation, respectively. Diverging central-bank policies will likely continue to play an important role in market movements going forward as investors wait to see the reactions to their efforts and their impacts on global markets.
How have market movements impacted your portfolio throughout the last year? Are your investments still on track to provide the growth or income you need, and are you comfortable with their progress during times of volatility?
Your financial professional can help you navigate today’s markets with confidence, as well as assist you to achieve your investment goals by providing advice on the best options within our fund family to help you work toward overcoming today’s investing challenges. Meet with your financial advisor regularly to examine your portfolio and your investment strategy, and to determine if you’re still on track to meet your goals.
Thank you again for investing with Hartford Funds.
James Davey
President
Hartford Funds
1 The S&P 500 Index is a market capitalization-weighted price index composed of 500 widely held common stocks.
2 The Dow Jones Industrial Average is an unmanaged, price-weighted index of 30 of the largest, most widely held stocks traded on the NYSE
The Hartford Floating Rate High Income Fund
Table of Contents
The views expressed in the Fund’s Manager Discussion under ‘‘Why did the Fund perform this way?’’ and ‘‘What is the outlook?’’ are views of the Fund’s sub-adviser and portfolio management team through the end of the period and are subject to change based on market and other conditions. The Fund’s Manager Discussion is for informational purposes only and does not represent an offer, recommendation or solicitation to buy, hold or sell any security. The specific securities identified and described, if any, do not represent all of the securities purchased or sold and you should not assume that investments in the securities identified and discussed will be profitable.
| The Hartford Floating Rate High Income Fund inception 09/30/2011 |
| (sub-advised by Wellington Management Company, LLP) |
| Investment objective – The Fund seeks to provide high current income, and long-term total return. |
Performance Overview 9/30/11 - 10/31/14

The chart above represents the hypothetical growth of a $10,000 investment in Class A, which includes a sales charge. Growth results in classes other than Class A will vary from what is seen above due to differences in the expenses charged to those share classes.
Average Annual Total Returns (as of 10/31/14)
| 1 Year | Since Inception▲ | |||||||
| Floating Rate High Income A# | 3.23% | 7.39% | ||||||
| Floating Rate High Income A## | 0.14% | 6.33% | ||||||
| Floating Rate High Income C# | 2.47% | 6.58% | ||||||
| Floating Rate High Income C## | 1.48% | 6.58% | ||||||
| Floating Rate High Income I# | 3.49% | 7.68% | ||||||
| Floating Rate High Income R3# | 2.93% | 7.00% | ||||||
| Floating Rate High Income R4# | 3.24% | 7.32% | ||||||
| Floating Rate High Income R5# | 3.45% | 7.61% | ||||||
| Floating Rate High Income Y# | 3.55% | 7.64% | ||||||
| Credit Suisse Leveraged Loan Index | 3.77% | 6.82% | ||||||
| ▲ | Inception: 09/30/2011 |
| # | Without sales charge |
| ## | With sales charge |
PERFORMANCE DATA QUOTED REPRESENTS PAST PERFORMANCE AND DOES NOT GUARANTEE FUTURE RESULTS. The investment return and principal value of the investment will fluctuate so that investors’ shares, when redeemed, may be worth more or less than their original cost. Current performance may be lower or higher than the performance data quoted. To obtain performance data current to the most recent month-end, please visit our website www.hartfordfunds.com.
The initial investment in Class A shares reflects the maximum sales charge of 3.00% and returns for Class C shares reflect a contingent deferred sales charge of up to 1.00% on shares redeemed within twelve months of purchase.
Total returns presented above were calculated using the Fund’s net asset value available to shareholders for sale or redemption of Fund shares on October 31, 2014, which may exclude investment transactions as of this date. All share class returns assume the reinvestment of all distributions at net asset value and the deduction of all fund expenses.
Performance information includes performance under the Fund’s previous sub-adviser, Hartford Investment Management Company. As of April 23, 2012, Wellington Management Company, LLP became the sub-adviser for the Fund. At the end of a transition period of approximately four weeks ending on May 18, 2012, Hartford Investment Management Company no longer served as a sub-adviser to the Fund.
Credit Suisse Leveraged Loan Index is a market-value weighted index designed to represent the investable universe of the U.S. dollar-denominated leveraged loan market.
You cannot invest directly in an index.
The chart and table do not reflect the deductions of taxes that a shareholder would pay on Fund distributions or the redemption of Fund shares.
Performance information may reflect historical or current expense waivers/reimbursements from the investment adviser, without which performance would have been lower. For information on current expense waivers/reimbursements, please see the prospectus.
| 2 |
| The Hartford Floating Rate High Income Fund |
| Manager Discussion |
| October 31, 2014 (Unaudited) |
| Operating Expenses* | ||||||||
| Net | Gross | |||||||
| Floating Rate High Income Class A | 1.07 | % | 1.15 | % | ||||
| Floating Rate High Income Class C | 1.82 | % | 1.90 | % | ||||
| Floating Rate High Income Class I | 0.82 | % | 0.86 | % | ||||
| Floating Rate High Income Class R3 | 1.37 | % | 1.52 | % | ||||
| Floating Rate High Income Class R4 | 1.07 | % | 1.21 | % | ||||
| Floating Rate High Income Class R5 | 0.77 | % | 0.91 | % | ||||
| Floating Rate High Income Class Y | 0.77 | % | 0.82 | % | ||||
| * | As shown in the Fund's current prospectus dated March 1, 2014. Actual expenses may be higher or lower. Please see accompanying Financial Highlights for expense ratios for the year ended October 31, 2014. |
Gross expenses are the Fund's total annual operating expenses shown in the Fund's most recent prospectus. Net expenses are the Fund's total annual operating expenses shown in the Fund's most recent prospectus and reflect contractual expense reimbursements in instances when these reductions reduce the Fund's gross expenses. Contractual reimbursements remain in effect until February 28, 2015, and automatically renew for one-year terms unless terminated.
All investments are subject to risk including the possible loss of principal. For a discussion of the Fund’s risks, please see the Main Risks section of this report. For more detailed information on the risks associated with an investment in the Fund, please see the prospectus.
| Portfolio Manager | |
| Michael J. Bacevich | |
| Vice President and Fixed Income Portfolio Manager |
How did the Fund perform?
The Class A shares of The Hartford Floating Rate High Income Fund returned 3.23%, before sales charge, for the twelve-month period ended October 31, 2014, underperforming the Fund’s benchmark, the Credit Suisse Leveraged Loan Index, which returned 3.77% for the same period. The Fund outperformed the 2.68% average return of the Lipper Loan Participation Funds peer group, a group of funds that invest primarily in interests in collateralized senior corporate loans that have floating or variable rates.
Why did the Fund perform this way?
Fixed income markets gained throughout much of the period as expectations of prolonged easy monetary policy by major central banks and a supportive macroeconomic environment kept rates low and suppressed volatility. Early in the period emerging markets dominated headlines as economic and political developments sparked risk aversion across global markets, pushing bond prices higher and yields lower amid a flight to quality. Toward the end of the period, however, persistent geopolitical risks – tensions between Ukraine and Russia and violence in Iraq – and Chinese economic slowdown concerns raised questions about the global growth rate, keeping a lid on risk appetites overall.
The period was also highlighted by a divergence in central bank policies. The European Central Bank (ECB) cut its benchmark lending and deposit rates and announced a host of stimulus measures in an effort to encourage lending and fend off fears of deflation. China’s central bank joined the ECB in boosting liquidity by injecting funds into the nation’s largest banks in an attempt to combat weakening growth. The Bank of Japan pre-emptively announced incremental monetary easing to counter the risk of missing the country’s inflation and growth targets. In contrast, the Bank of England and U.S. Federal Reserve (Fed) leaned toward tighter policies. The Fed ended its quantitative easing program as U.S. data largely suggested the economy was on a sustainable growth path. Second quarter Gross Domestic Product (GDP) rebounded after the first quarter’s steep contraction. The labor market strengthened as the unemployment rate dropped to a six-year low. Housing regained some lost ground after a weak start to the year, though the pace of home price appreciation started to slow after a strong 2013. Inflation pressures were muted overall, alleviating pressure on the Federal Reserve to raise rates.
The U.S. Treasury curve flattened as markets contemplated bringing interest rates to normal levels; short-term yields rose while longer term rates declined. Most credit risk sectors posted positive absolute returns and outperformed duration-equivalent government bonds as credit spreads tightened. The 3-year discount margin on the Credit Suisse Leveraged Loan Index widened over the twelve-month period.
In a period in which investors became less concerned about the possibility of rising interest rates, bank loan mutual funds saw periods of significant outflows. Through the first ten months of 2014, bank loan returns have lagged behind those of high yield bonds.
The Fund underperformed its benchmark, the Credit Suisse Leveraged Loan Index. An out-of-benchmark allocation to high yield bonds contributed to relative performance given the outperformance of high yield over bank loans over the period. With respect to sector allocations, the Fund benefitted from being underweight Retail Stores and Utilities but lost performance relative to the benchmark due to underweight allocations to Media Cable and Transportation. Additionally, the Fund’s overweight allocation to European bank loans and high yield detracted from benchmark relative returns over the period, as concerns surrounding European economic growth caused spreads to widen.
Security selection was the primary contributor to the Fund’s benchmark-relative underperformance during the period. Issuers that
| 3 |
| The Hartford Floating Rate High Income Fund |
| Manager Discussion – (continued) |
| October 31, 2014 (Unaudited) |
detracted from performance included Momentive Performance Materials, a Chemicals company that manufactures silicone and quartz products. Momentive filed for Chapter 11 bankruptcy in April, 2014 and emerged after a restructuring in October. Other issuers which detracted from relative performance over the period included TXU, an electric utility company, which we did not have exposure to and is a large component of the benchmark. Despite filing for bankruptcy in 2014, TXU had strong performance. Another name that detracted from relative performance over the period was Paragon Offshore in the Energy sector. We believe that the company is well positioned to absorb any potential weakness and should remain cash flow positive even under a bear market scenario. Issuers that contributed to benchmark-relative performance included Nuveen Investments, which performed strongly due to its acquisition by TIAA-CREF during the period. An overweight position to TVN Finance Corporation in the Media Non-Cable also helped relative performance over the period. TVN is a leading broadcaster in Poland. Lastly, underweight positions in two issuers that underperformed also helped benchmark-relative performance over the period – Gymboree Corporation in the retail sector and Education Management, a consumer cyclicals company.
Over the period, the Fund had a small position in high yield credit default swap index (CDX), which had a marginally positive impact on benchmark relative performance. The CDX position is used for liquidity purposes and for tactically adjusting the risk posture of the Fund.
What is the outlook?
Our outlook for bank loans remains positive, albeit with diminished return expectations. While it appears that credit quality has begun to degrade slightly with the entry of some lower-quality first-time issuers, the sector’s overall credit fundamentals seem to remain strong. Despite recent retail mutual fund outflows, we believe issuance of collateralized loan obligations (a major source of demand) continues to be robust. According to JP Morgan, there has been over $110 billion in primary market issuance of Collateralized Loan Obligations (CLOs) in the first ten months of 2014. We believe current bank loan valuations are attractive given our view of a continued benign default environment over the next few years. Additionally, we believe that the long-term potential diversification benefits of bank loans and their floating-rate nature, particularly given low absolute yields across most fixed income sectors, will eventually reassert themselves, enhancing the relative appeal of this asset class.
Our outlook for U.S. high-yield bonds remains positive, based on the steadily improving macroeconomic backdrop, our expectations that default levels will remain low, and positive corporate fundamentals. We believe that valuations are now more attractive, with spreads around their long-term historical averages, and reasonable for this point in the cycle; the trailing 12-month default rate remains below its long-term average. While we see that there has been a recent pickup in shareholder-friendly actions such as mergers and acquisition (M&A) activity and leveraged buyouts at the margin, we do not believe this is likely to affect default rates in the near to medium term.
At the end of the period, we maintained an out-of-benchmark allocation to high yield credit and favored the metals & mining, financial services, and energy sectors relative to the Credit Suisse Leveraged Loan Index.
| Credit Exposure | ||||
| as of October 31, 2014 | ||||
| Credit Rating * | Percentage of Net Assets | |||
| Baa/ BBB | 0.8 | % | ||
| Ba/ BB | 12.2 | |||
| B | 64.6 | |||
| Caa/ CCC or Lower | 16.1 | |||
| Not Rated | 3.1 | |||
| Non-Debt Securities and Other Short-Term Instruments | 4.8 | |||
| Other Assets and Liabilities | (1.6 | ) | ||
| Total | 100.0 | % | ||
| * | Credit exposure is the long-term credit ratings for the Fund's holdings, as of the date noted, as provided by Standard and Poor's (S&P) or Moody's Investors Service (Moody's) and typically range from AAA/Aaa (highest) to C/D (lowest). Presentation of S&P and Moody's credit ratings in this report have been selected for informational purposes for shareholders, as well as the Fund's consideration of industry practice. If Moody's and S&P assign different ratings, the lower rating is used. Fixed income securities that are not rated by either agency are listed as "Not Rated." Ratings do not apply to the Fund itself or to the Fund's shares. Ratings may change. |
| Diversification by Security Type | ||||
| as of October 31, 2014 | ||||
| Category | Percentage of Net Assets | |||
| Equity Securities | ||||
| Common Stocks | 0.4 | % | ||
| Exchange Traded Funds | 1.7 | |||
| Total | 2.1 | % | ||
| Fixed Income Securities | ||||
| Corporate Bonds | 20.9 | % | ||
| Senior Floating Rate Interests | 75.9 | |||
| Total | 96.8 | % | ||
| Short-Term Investments | 2.7 | |||
| Other Assets and Liabilities | (1.6 | ) | ||
| Total | 100.0 | % | ||
| 4 |
| The Hartford Floating Rate High Income Fund |
| Schedule of Investments |
| October 31, 2014 |
| (000’s Omitted) |
| Shares or Principal Amount ╬ | Market Value ╪ | |||||||
| Corporate Bonds - 20.9% | ||||||||
| Accommodation and Food Services - 0.4% | ||||||||
| Sugarhouse HSP Gaming Prop Mezz L.P. | ||||||||
| $ | 2,490 | 6.38%, 06/01/2021 ■‡ | $ | 2,384 | ||||
| Agriculture, Forestry, Fishing and Hunting - 0.3% | ||||||||
| Tembec Industries, Inc. | ||||||||
| 1,420 | 9.00%, 12/15/2019 ■‡ | 1,438 | ||||||
| Arts, Entertainment and Recreation - 1.3% | ||||||||
| Bougeot Bidco plc | ||||||||
| GBP | 2,000 | 7.88%, 07/15/2020 § | 3,200 | |||||
| Chester Downs & Marina LLC | ||||||||
| 2,340 | 9.25%, 02/01/2020 ■ | 2,083 | ||||||
| Lin Television Corp. Media Genral Financial Sub | ||||||||
| 1,000 | 5.88%, 11/15/2022 ■ | 1,007 | ||||||
| Snai S.p.A. | ||||||||
| EUR | 575 | 7.63%, 06/15/2018 § | 712 | |||||
| 7,002 | ||||||||
| Chemical Manufacturing - 0.7% | ||||||||
| Hexion Specialty Chemicals | ||||||||
| 1,300 | 8.88%, 02/01/2018 | 1,285 | ||||||
| Momentive Performance Materials, Inc. | ||||||||
| 2,740 | 3.88%, 10/24/2021 | 2,384 | ||||||
| 3,669 | ||||||||
| Computer and Electronic Product Manufacturing - 0.2% | ||||||||
| Ceridian LLC | ||||||||
| 1,000 | 8.13%, 11/15/2017 ■ | 1,000 | ||||||
| Construction - 0.8% | ||||||||
| Empresas ICA S.A.B de C.V. | ||||||||
| 1,425 | 8.88%, 05/29/2024 ■‡ | 1,446 | ||||||
| Paragon Offshore plc | ||||||||
| 3,430 | 7.25%, 08/15/2024 ■‡ | 2,624 | ||||||
| 4,070 | ||||||||
| Finance and Insurance - 7.1% | ||||||||
| Access Bank plc | ||||||||
| 1,500 | 9.25%, 06/24/2021 ■ | 1,507 | ||||||
| Banco do Brasil S.A. | ||||||||
| 2,995 | 9.00%, 06/18/2024 ■♠ | 2,944 | ||||||
| Banco Santander S.A. | ||||||||
| EUR | 1,400 | 6.25%, 03/12/2049 § | 1,717 | |||||
| Bank of Ireland | ||||||||
| EUR | 650 | 10.00%, 07/30/2016 § | 880 | |||||
| Barclays Bank plc | ||||||||
| 925 | 8.25%, 12/15/2018 ♠β | 955 | ||||||
| BC Mountain LLC | ||||||||
| 1,320 | 7.00%, 02/01/2021 ■ | 1,188 | ||||||
| Cimpor Financial Operations B.V. | ||||||||
| 500 | 5.75%, 07/17/2024 ■ | 481 | ||||||
| Credit Agricole S.A. | ||||||||
| 1,650 | 6.63%, 09/23/2019 ■♠Δ | 1,610 | ||||||
| 1,585 | 7.88%, 01/23/2024 ■♠ | 1,636 | ||||||
| Credit Suisse Group AG | ||||||||
| 1,100 | 6.25%, 12/18/2024 ■♠Δ | 1,070 | ||||||
| 1,800 | 7.50%, 12/11/2023 ■♠ | 1,913 | ||||||
| HSBC Holdings plc | ||||||||
| 940 | 5.63%, 01/17/2020 ♠ | 955 | ||||||
| Marfrig Holding Europe, B.V. | ||||||||
| 3,000 | 6.88%, 06/24/2019 ■‡ | 3,045 | ||||||
| Nationstar Mortgage LLC | ||||||||
| 1,960 | 6.50%, 07/01/2021 | 1,823 | ||||||
| Nationwide Building Society | ||||||||
| GBP | 1,200 | 6.88%, 03/11/2049 § | 1,876 | |||||
| Nuveen Investments, Inc. | ||||||||
| 3,265 | 9.13%, 10/15/2017 ■‡ | 3,488 | ||||||
| Societe Generale | ||||||||
| 1,470 | 6.00%, 01/27/2020 ■‡♠ | 1,386 | ||||||
| 2,725 | 8.25%, 11/29/2018 §‡♠ | 2,879 | ||||||
| TMK OAO Via TMK Capital S.A. | ||||||||
| 2,000 | 6.75%, 04/03/2020 §‡ | 1,802 | ||||||
| UniCredit S.p.A. | ||||||||
| 1,850 | 8.00%, 06/03/2024 §♠ | 1,855 | ||||||
| YPF S.A. | ||||||||
| 3,000 | 8.88%, 12/19/2018 §‡ | 3,135 | ||||||
| 38,145 | ||||||||
| Food Manufacturing - 0.2% | ||||||||
| Galapagos S.A. | ||||||||
| EUR | 1,000 | 4.83%, 06/15/2021 ■Δ | 1,218 | |||||
| Food Services - 0.5% | ||||||||
| Brakes Capital | ||||||||
| EUR | 1,335 | 5.08%, 12/15/2018 ■Δ | 1,614 | |||||
| GBP | 750 | 7.13%, 12/15/2018 § | 1,170 | |||||
| 2,784 | ||||||||
| Information - 3.0% | ||||||||
| Ancestry.com, Inc. | ||||||||
| 3,150 | 9.63%, 10/15/2018 ■ | 3,142 | ||||||
| Equiniti Bondco plc | ||||||||
| GBP | 1,000 | 6.31%, 12/15/2018 ■Δ | 1,596 | |||||
| First Data Corp. | ||||||||
| 973 | 11.75%, 08/15/2021 | 1,141 | ||||||
| 951 | 14.50%, 09/24/2019 ■Þ | 994 | ||||||
| Infor Software Parent LLC | ||||||||
| 1,555 | 7.13%, 05/01/2021 ■ | 1,574 | ||||||
| VimpelCom Holdings B.V. | ||||||||
| 2,000 | 5.20%, 02/13/2019 §‡ | 1,943 | ||||||
| Wind Acquisition Finance S.A. | ||||||||
| EUR | 1,685 | 4.08%, 07/15/2020 ■Δ | 2,074 | |||||
| EUR | 1,625 | 5.34%, 04/30/2019 ■Δ | 2,042 | |||||
| EUR | 1,500 | 7.00%, 04/23/2021 § | 1,857 | |||||
| 16,363 | ||||||||
| Machinery Manufacturing - 0.3% | ||||||||
| Titan International, Inc. | ||||||||
| 2,000 | 6.88%, 10/01/2020 | 1,805 | ||||||
| Nonmetallic Mineral Product Manufacturing - 0.6% | ||||||||
| Ardagh Finance Holdings S.A. | ||||||||
| EUR | 1,460 | 8.38%, 06/15/2019 ■ | 1,738 | |||||
| 1,235 | 8.63%, 06/15/2019 ■ | 1,263 | ||||||
| 3,001 | ||||||||
| Other Services - 0.2% | ||||||||
| Abengoa Finance | ||||||||
| EUR | 905 | 6.00%, 03/31/2021 ■ | 1,103 | |||||
| Petroleum and Coal Products Manufacturing - 1.4% | ||||||||
| American Energy - Permian Basin LLC | ||||||||
| 4,400 | 6.74%, 08/01/2019 ■Δ | 3,894 | ||||||
| Borets Finance Ltd. | ||||||||
| 2,000 | 7.63%, 09/26/2018 §‡ | 1,940 | ||||||
| KCA Deutag | ||||||||
| 935 | 7.25%, 05/15/2021 ■ | 832 | ||||||
The accompanying notes are an integral part of these financial statements.
| 5 |
| The Hartford Floating Rate High Income Fund |
| Schedule of Investments – (continued) |
| October 31, 2014 |
| (000’s Omitted) |
| Shares or Principal Amount ╬ | Market Value ╪ | |||||||
| Corporate Bonds - 20.9% - (continued) | ||||||||
| Petroleum and Coal Products Manufacturing - 1.4% - (continued) | ||||||||
| Kosmos Energy Ltd. | ||||||||
| $ | 230 | 7.88%, 08/01/2021 § | $ | 212 | ||||
| Shelf Drilling Holdings Ltd. | ||||||||
| 695 | 8.63%, 11/01/2018 ■ | 686 | ||||||
| 7,564 | ||||||||
| Retail Trade - 3.1% | ||||||||
| Albertson's Holdings LLC | ||||||||
| 2,000 | 7.75%, 10/15/2022 ■ | 1,970 | ||||||
| Claire's Stores, Inc. | ||||||||
| 3,500 | 9.00%, 03/15/2019 ■ | 3,570 | ||||||
| Galaxy Bidco Ltd. | ||||||||
| GBP | 2,500 | 5.56%, 11/15/2019 ■Δ | 3,903 | |||||
| Matalan Finance plc | ||||||||
| GBP | 1,385 | 6.88%, 06/01/2019 ■‡ | 2,120 | |||||
| GBP | 1,000 | 6.88%, 06/01/2019 | 1,530 | |||||
| Michaels Stores, Inc. | ||||||||
| 612 | 7.50%, 08/01/2018 ■ | 621 | ||||||
| Picard Groupe S.A. | ||||||||
| EUR | 580 | 4.46%, 08/01/2019 ■Δ | 727 | |||||
| Stretford 79 plc | ||||||||
| GBP | 1,665 | 4.81%, 12/29/2049 ■Δ | 2,387 | |||||
| 16,828 | ||||||||
| Utilities - 0.4% | ||||||||
| Genon Energy, Inc. | ||||||||
| 2,000 | 7.88%, 06/15/2017 ‡ | 2,025 | ||||||
| Wholesale Trade - 0.4% | ||||||||
| Dynegy, Inc. | ||||||||
| 1,905 | 6.75%, 11/01/2019 ■ | 1,972 | ||||||
| Total Corporate Bonds | ||||||||
| (Cost $116,394) | $ | 112,371 | ||||||
| Senior Floating Rate Interests ♦ - 75.9% | ||||||||
| Accommodation and Food Services - 0.4% | ||||||||
| CityCenter Holdings LLC | ||||||||
| $ | 1,478 | 4.25%, 10/16/2020 | $ | 1,467 | ||||
| ESH Hospitality, Inc. | ||||||||
| 195 | 5.00%, 06/24/2019 | 196 | ||||||
| Four Seasons Holdings, Inc. | ||||||||
| 640 | 6.25%, 12/28/2020 | 642 | ||||||
| 2,305 | ||||||||
| Administrative, Support, Waste Management and Remediation Services - 4.3% | ||||||||
| Acosta Holdco, Inc. | ||||||||
| 2,855 | 5.00%, 09/26/2021 | 2,856 | ||||||
| Audio Visual Services Group, Inc. | ||||||||
| 1,234 | 4.50%, 01/25/2021 | 1,224 | ||||||
| Brickman Group Holdings, Inc. | ||||||||
| 481 | 4.00%, 12/18/2020 | 473 | ||||||
| 3,587 | 7.50%, 12/17/2021 | 3,523 | ||||||
| Filtration Group, Inc. | ||||||||
| 422 | 4.50%, 11/20/2020 | 420 | ||||||
| 520 | 8.25%, 11/22/2021 | 518 | ||||||
| Ipreo Holdings LLC | ||||||||
| 1,435 | 4.25%, 08/06/2021 | 1,403 | ||||||
| PRA Holdings, Inc. | ||||||||
| 3,211 | 4.50%, 09/23/2020 | 3,166 | ||||||
| ServiceMaster (The) Co. | ||||||||
| 9,901 | 4.25%, 07/01/2021 | 9,804 | ||||||
| 23,387 | ||||||||
| Agriculture, Construction, Mining and Machinery - 1.6% | ||||||||
| International Equipment Solutions LLC | ||||||||
| 1,426 | 6.75%, 08/16/2019 | 1,426 | ||||||
| Minimax | ||||||||
| EUR | 896 | 4.25%, 08/14/2020 | 954 | |||||
| Signode Industrial Group US, Inc. | ||||||||
| 2,870 | 4.00%, 05/01/2021 | 2,814 | ||||||
| EUR | 534 | 4.25%, 05/01/2021 | 666 | |||||
| Veyance Technologies, Inc. | ||||||||
| 2,755 | 5.25%, 09/08/2017 | 2,745 | ||||||
| 8,605 | ||||||||
| Air Transportation - 0.3% | ||||||||
| Landmark Aviation | ||||||||
| 1,830 | 4.75%, 10/25/2019 | 1,816 | ||||||
| 1,816 | ||||||||
| Arts, Entertainment and Recreation - 10.7% | ||||||||
| 24 Hour Fitness Worldwide, Inc. | ||||||||
| 3,491 | 4.75%, 05/28/2021 | 3,483 | ||||||
| Aristocrat Leisure Ltd. | ||||||||
| 3,525 | 4.75%, 10/20/2021 | 3,497 | ||||||
| Caesars Entertainment Operating Co., Inc. | ||||||||
| 678 | 6.99%, 03/01/2017 | 607 | ||||||
| 3,990 | 9.75%, 01/28/2018 | 3,681 | ||||||
| Caesars Entertainment Resort Properties LLC | ||||||||
| 2,985 | 7.00%, 10/11/2020 | 2,843 | ||||||
| Caesars Growth Property Holdings LLC | ||||||||
| 5,551 | 6.25%, 05/08/2021 | 5,232 | ||||||
| Formula One Holdings | ||||||||
| 4,417 | 4.75%, 07/30/2021 | 4,380 | ||||||
| 2,830 | 7.75%, 07/29/2022 | 2,818 | ||||||
| Hoyts Group Holdings LLC | ||||||||
| 2,726 | 4.00%, 05/29/2020 | 2,685 | ||||||
| 1,140 | 8.25%, 11/30/2020 | 1,128 | ||||||
| ION Media Networks, Inc. | ||||||||
| 893 | 5.00%, 12/18/2020 | 891 | ||||||
| Numericable | ||||||||
| 2,735 | 4.50%, 05/21/2020 | 2,739 | ||||||
| Salem Communications Corp. | ||||||||
| 1,896 | 4.50%, 03/13/2020 | 1,865 | ||||||
| Scientific Games International, Inc. | ||||||||
| 5,760 | 6.00%, 10/01/2021 | 5,635 | ||||||
| Station Casinos LLC | ||||||||
| 4,057 | 4.25%, 03/02/2020 | 4,009 | ||||||
| Templar Energy | ||||||||
| 3,240 | 8.50%, 11/25/2020 | 2,919 | ||||||
| Tribune Co. | ||||||||
| 4,565 | 4.00%, 12/27/2020 | 4,524 | ||||||
| Univision Communications, Inc. | ||||||||
| 2,549 | 4.00%, 03/01/2020 | 2,521 | ||||||
| XO Communications LLC | ||||||||
| 1,920 | 4.25%, 03/20/2021 | 1,900 | ||||||
| 57,357 | ||||||||
| Beverage and Tobacco Product Manufacturing - 0.5% | ||||||||
| DE Master Blenders 1753 N.V. | ||||||||
| 2,915 | 3.50%, 07/23/2021 | 2,886 | ||||||
The accompanying notes are an integral part of these financial statements.
| 6 |
| The Hartford Floating Rate High Income Fund |
| Schedule of Investments – (continued) |
| October 31, 2014 |
| (000’s Omitted) |
| Shares or Principal Amount ╬ | Market Value ╪ | |||||||
| Senior Floating Rate Interests ♦ - 75.9% - (continued) | ||||||||
| Chemical Manufacturing - 2.4% | ||||||||
| Arysta LifeScience Corp. | ||||||||
| $ | 593 | 4.50%, 05/29/2020 | $ | 590 | ||||
| CeramTec | ||||||||
| 253 | 4.25%, 08/28/2020 | 252 | ||||||
| EUR | 170 | 4.75%, 08/28/2020 | 214 | |||||
| Cytec Industries, Inc. | ||||||||
| 103 | 4.50%, 10/03/2019 | 102 | ||||||
| Exopack LLC | ||||||||
| 769 | 5.25%, 05/08/2019 | 771 | ||||||
| Faenza Acquisition Gmbh | ||||||||
| 101 | 4.25%, 08/28/2020 | 101 | ||||||
| EUR | 560 | 4.75%, 08/28/2020 | 703 | |||||
| Monarch, Inc. | ||||||||
| 198 | 4.50%, 10/03/2019 | 197 | ||||||
| Pinnacle Operating Corp. | ||||||||
| 818 | 4.75%, 11/15/2018 | 812 | ||||||
| Solenis International L.P. | ||||||||
| 1,435 | 4.25%, 07/31/2021 | 1,414 | ||||||
| EUR | 1,500 | 4.50%, 07/31/2021 | 1,881 | |||||
| Univar, Inc. | ||||||||
| 3,945 | 5.00%, 06/30/2017 | 3,915 | ||||||
| Utex Industries, Inc. | ||||||||
| 1,297 | 5.00%, 05/21/2021 | 1,278 | ||||||
| 750 | 8.25%, 05/20/2022 | 740 | ||||||
| 12,970 | ||||||||
| Computer and Electronic Product Manufacturing - 1.9% | ||||||||
| Ceridian LLC | ||||||||
| 2,073 | 4.50%, 05/09/2017 | 2,055 | ||||||
| Freescale Semiconductor, Inc. | ||||||||
| 2,282 | 4.25%, 02/28/2020 | 2,249 | ||||||
| 2,633 | 5.00%, 01/15/2021 | 2,627 | ||||||
| Micro Focus International | ||||||||
| 3,500 | 5.25%, 10/07/2021 ☼ | 3,372 | ||||||
| 10,303 | ||||||||
| Construction - 1.3% | ||||||||
| Brand Energy & Infrastructure Services, Inc. | ||||||||
| 1,752 | 4.75%, 11/26/2020 | 1,740 | ||||||
| Brock Holdings III, Inc. | ||||||||
| 457 | 6.00%, 03/16/2017 | 449 | ||||||
| 402 | 10.00%, 03/16/2018 | 392 | ||||||
| Pike Corp. | ||||||||
| 2,640 | 5.25%, 10/01/2021 ☼ | 2,620 | ||||||
| 1,875 | 8.25%, 04/03/2021 ☼ | 1,836 | ||||||
| 7,037 | ||||||||
| Fabricated Metal Product Manufacturing - 0.4% | ||||||||
| Ameriforge Group, Inc. | ||||||||
| 2,025 | 5.00%, 12/19/2019 | 2,008 | ||||||
| Finance and Insurance - 7.3% | ||||||||
| Asurion LLC | ||||||||
| 2,344 | 5.00%, 05/24/2019 | 2,344 | ||||||
| 1,430 | 8.50%, 03/03/2021 | 1,452 | ||||||
| Capital Automotive L.P. | ||||||||
| 470 | 6.00%, 04/30/2020 | 475 | ||||||
| Cooper Gay Swett & Crawford Ltd. | ||||||||
| 1,269 | 5.00%, 04/16/2020 | 1,142 | ||||||
| 2,430 | 8.25%, 10/16/2020 | 2,041 | ||||||
| Evertec LLC | ||||||||
| 2,028 | 3.50%, 04/17/2020 | 1,991 | ||||||
| Guggenheim Partners LLC | ||||||||
| 896 | 4.25%, 07/22/2020 | 890 | ||||||
| Hub International Ltd. | ||||||||
| 3,911 | 4.25%, 10/02/2020 | 3,857 | ||||||
| Interactive Data Corp. | ||||||||
| 2,110 | 4.75%, 05/02/2021 | 2,109 | ||||||
| ION Trading Technologies Ltd. | ||||||||
| EUR | 3,192 | 4.50%, 06/10/2021 | 3,971 | |||||
| 2,210 | 7.25%, 06/10/2022 | 2,173 | ||||||
| National Financial Partners Corp. | ||||||||
| 1,433 | 4.50%, 07/01/2020 | 1,420 | ||||||
| Santander Asset Management S.A. | ||||||||
| EUR | 1,985 | 4.50%, 12/17/2020 | 2,486 | |||||
| Sedgwick CMS Holdings, Inc. | ||||||||
| 3,094 | 3.75%, 03/01/2021 | 3,004 | ||||||
| 2,500 | 6.75%, 02/28/2022 | 2,425 | ||||||
| USI Insurance Services LLC | ||||||||
| 1,368 | 4.25%, 12/27/2019 | 1,353 | ||||||
| Walter Investment Management Corp. | ||||||||
| 6,508 | 4.75%, 12/18/2020 | 6,117 | ||||||
| 39,250 | ||||||||
| Food Manufacturing - 2.1% | ||||||||
| Burton's Foods Ltd. | ||||||||
| GBP | 1,500 | 5.55%, 11/27/2020 | 2,340 | |||||
| Hearthside Food Solutions | ||||||||
| 2,005 | 4.50%, 06/02/2021 | 1,991 | ||||||
| Hostess Brands, Inc. | ||||||||
| 2,433 | 6.75%, 04/09/2020 | 2,474 | ||||||
| Milk Specialties Co. | ||||||||
| 485 | 7.50%, 11/09/2018 | 477 | ||||||
| Roundy's Supermarkets, Inc. | ||||||||
| 4,507 | 5.75%, 03/03/2021 | 4,000 | ||||||
| 11,282 | ||||||||
| Furniture and Related Product Manufacturing - 0.4% | ||||||||
| Wilsonart International Holdings LLC | ||||||||
| 2,397 | 4.00%, 10/31/2019 | 2,357 | ||||||
| Health Care and Social Assistance - 6.3% | ||||||||
| American Renal Holdings, Inc. | ||||||||
| 1,052 | 4.50%, 08/20/2019 | 1,032 | ||||||
| 1,430 | 8.50%, 03/20/2020 | 1,401 | ||||||
| Ardent Medical Services, Inc. | ||||||||
| 457 | 6.75%, 07/02/2018 | 457 | ||||||
| DJO Finance LLC | ||||||||
| 801 | 4.25%, 09/15/2017 | 796 | ||||||
| DSI Renal, Inc. | ||||||||
| 773 | 4.50%, 04/23/2021 | 765 | ||||||
| 1,050 | 7.75%, 10/22/2021 | 1,045 | ||||||
| Healogics, Inc. | ||||||||
| 935 | 5.25%, 07/01/2021 | 929 | ||||||
| Ikaria Acquisition, Inc. | ||||||||
| 640 | 5.00%, 02/12/2021 | 640 | ||||||
| 385 | 8.75%, 02/14/2022 | 385 | ||||||
| Immucor, Inc. | ||||||||
| 488 | 5.00%, 08/19/2018 | 487 | ||||||
| inVentiv Health, Inc. | ||||||||
| 5,739 | 7.75%, 05/15/2018 | 5,659 | ||||||
| One Call Medical, Inc. | ||||||||
| 3,495 | 5.00%, 11/27/2020 | 3,478 | ||||||
The accompanying notes are an integral part of these financial statements.
| 7 |
| The Hartford Floating Rate High Income Fund |
| Schedule of Investments – (continued) |
| October 31, 2014 |
| (000’s Omitted) |
| Shares or Principal Amount ╬ | Market Value ╪ | |||||||
| Senior Floating Rate Interests ♦ - 75.9% - (continued) | ||||||||
| Health Care and Social Assistance - 6.3% - (continued) | ||||||||
| Ortho-Clinical Diagnostics, Inc. | ||||||||
| $ | 3,037 | 4.75%, 06/30/2021 | $ | 3,004 | ||||
| Pharmedium Healthcare Corp. | ||||||||
| 388 | 4.25%, 01/28/2021 | 381 | ||||||
| 580 | 7.75%, 01/28/2022 | 579 | ||||||
| STHI Holding Corp. | ||||||||
| 3,290 | 4.50%, 08/06/2021 | 3,269 | ||||||
| Surgery Center Holdings, Inc. | ||||||||
| 995 | 5.25%, 07/24/2020 ☼ | 993 | ||||||
| 3,300 | 8.50%, 07/23/2021 ☼ | 3,236 | ||||||
| Truven Health Analytics, Inc. | ||||||||
| 930 | 4.50%, 06/06/2019 | 911 | ||||||
| US Renal Care, Inc. | ||||||||
| 2,393 | 4.25%, 07/03/2019 | 2,375 | ||||||
| 1,140 | 8.50%, 01/03/2020 | 1,140 | ||||||
| 666 | 10.25%, 01/03/2020 | 668 | ||||||
| 33,630 | ||||||||
| Health Care Providers and Services - 0.3% | ||||||||
| CRC Health Corp. | ||||||||
| 1,692 | 5.25%, 03/29/2021 | 1,696 | ||||||
| Information - 7.6% | ||||||||
| Cabovisao-Televisao Por Cabo S.A. | ||||||||
| 4,025 | 5.50%, 07/02/2019 | 4,045 | ||||||
| First Data Corp. | ||||||||
| 2,410 | 3.65%, 09/24/2018 | 2,386 | ||||||
| 2,323 | 4.15%, 03/24/2021 | 2,307 | ||||||
| Hyland Software, Inc. | ||||||||
| 657 | 4.75%, 02/19/2021 | 654 | ||||||
| Kronos, Inc. | ||||||||
| 3,904 | 4.50%, 10/30/2019 | 3,884 | ||||||
| 2,259 | 9.75%, 04/30/2020 | 2,316 | ||||||
| Level 3 Communications, Inc. | ||||||||
| 1,920 | 4.00%, 08/01/2019 | 1,907 | ||||||
| 4,000 | 5.25%, 06/15/2015 ☼ | 3,990 | ||||||
| Level 3 Financing, Inc. | ||||||||
| 2,270 | 4.50%, 01/31/2022 ☼ | 2,279 | ||||||
| Light Tower Fiber LLC | ||||||||
| 637 | 4.00%, 04/13/2020 | 629 | ||||||
| 1,319 | 8.00%, 04/12/2021 | 1,307 | ||||||
| MISYS plc | ||||||||
| 1,788 | 5.00%, 12/12/2018 | 1,788 | ||||||
| Novell, Inc. | ||||||||
| 1,214 | 7.25%, 11/22/2017 | 1,213 | ||||||
| Peak 10, Inc. | ||||||||
| 703 | 5.00%, 06/17/2021 | 699 | ||||||
| 1,845 | 8.25%, 06/17/2022 | 1,820 | ||||||
| RedPrairie Corp. | ||||||||
| 2,524 | 6.00%, 12/21/2018 | 2,441 | ||||||
| TransFirst Holding, Inc. | ||||||||
| 750 | 8.00%, 06/27/2018 | 749 | ||||||
| Virgin Media Investment Holdings Ltd. | ||||||||
| GBP | 3,200 | 4.25%, 06/30/2023 | 5,078 | |||||
| Zayo Group LLC | ||||||||
| 1,477 | 4.00%, 07/02/2019 | 1,463 | ||||||
| 40,955 | ||||||||
| Media - 0.3% | ||||||||
| Media General, Inc. | ||||||||
| 1,419 | 4.25%, 07/31/2020 | 1,408 | ||||||
| Mining - 2.8% | ||||||||
| American Rock Salt Holdings LLC | ||||||||
| 2,658 | 4.75%, 05/20/2021 | 2,632 | ||||||
| 1,635 | 8.00%, 05/20/2022 | 1,639 | ||||||
| Arch Coal, Inc. | ||||||||
| 8,542 | 6.25%, 05/16/2018 | 7,529 | ||||||
| BWAY Holding Co. | ||||||||
| 3,426 | 5.50%, 08/14/2020 | 3,439 | ||||||
| 15,239 | ||||||||
| Miscellaneous Manufacturing - 0.3% | ||||||||
| Hamilton Sundstrand Corp. | ||||||||
| 1,207 | 4.00%, 12/13/2019 | 1,185 | ||||||
| Sequa Corp. | ||||||||
| 643 | 5.25%, 06/19/2017 | 611 | ||||||
| 1,796 | ||||||||
| Motor Vehicle and Parts Manufacturing - 0.5% | ||||||||
| Navistar, Inc. | ||||||||
| 1,915 | 5.75%, 08/17/2017 | 1,918 | ||||||
| Tower Automotive Holdings USA LLC | ||||||||
| 995 | 4.00%, 04/23/2020 | 982 | ||||||
| 2,900 | ||||||||
| Nonmetallic Mineral Product Manufacturing - 0.2% | ||||||||
| Ardagh Holdings USA, Inc. | ||||||||
| 990 | 4.00%, 12/17/2019 | 979 | ||||||
| Other Services - 1.7% | ||||||||
| Alliance Laundry Systems LLC | ||||||||
| 970 | 4.25%, 12/10/2018 | 959 | ||||||
| Apex Tool Group LLC | ||||||||
| 2,276 | 4.50%, 01/31/2020 | 2,156 | ||||||
| Gardner Denver, Inc. | ||||||||
| 5,245 | 4.25%, 07/30/2020 | 5,167 | ||||||
| Husky International Ltd. | ||||||||
| 900 | 7.25%, 06/30/2022 | 880 | ||||||
| 9,162 | ||||||||
| Petroleum and Coal Products Manufacturing - 6.8% | ||||||||
| American Energy-Marcellus LLC | ||||||||
| 3,560 | 5.25%, 08/04/2020 | 3,462 | ||||||
| 830 | 8.50%, 08/04/2021 | 791 | ||||||
| Callon Petroleum Co. | ||||||||
| 1,800 | 8.50%, 10/08/2021 ☼ | 1,773 | ||||||
| Chief Exploration & Development | ||||||||
| 3,115 | 7.50%, 05/16/2021 | 2,990 | ||||||
| Crosby Worldwide Ltd. | ||||||||
| 3,226 | 4.00%, 11/23/2020 | 3,087 | ||||||
| Drillships Ocean Ventures, Inc. | ||||||||
| 2,700 | 5.50%, 07/25/2021 ☼ | 2,586 | ||||||
| Jefferson Gulf Coast Energy Partners LLC | ||||||||
| 2,000 | 9.00%, 02/27/2018 ☼ | 1,950 | ||||||
| KCA Deutag | ||||||||
| 2,848 | 6.25%, 05/15/2020 | 2,748 | ||||||
| Ocean Rig ASA | ||||||||
| 3,521 | 6.00%, 03/31/2021 ☼ | 3,359 | ||||||
| Pacific Drilling S.A. | ||||||||
| 514 | 4.50%, 06/03/2018 | 491 | ||||||
| Samson Investment Co. | ||||||||
| 4,785 | 5.00%, 09/25/2018 ☼ | 4,405 | ||||||
| Seadrill Ltd. | ||||||||
| 6,135 | 4.00%, 02/21/2021 | 5,789 | ||||||
The accompanying notes are an integral part of these financial statements.
| 8 |
| The Hartford Floating Rate High Income Fund |
| Schedule of Investments – (continued) |
| October 31, 2014 |
| (000’s Omitted) |
| Shares or Principal Amount ╬ | Market Value ╪ | |||||||
| Senior Floating Rate Interests ♦ - 75.9% - (continued) | ||||||||
| Petroleum and Coal Products Manufacturing - 6.8% - (continued) | ||||||||
| Shelf Drilling International Holdings Ltd. | ||||||||
| $ | 3,435 | 10.00%, 10/08/2018 | $ | 3,383 | ||||
| 36,814 | ||||||||
| Pipeline Transportation - 0.6% | ||||||||
| EMG Utica LLC | ||||||||
| 535 | 4.75%, 03/27/2020 | 529 | ||||||
| Philadelphia Energy Solutions LLC | ||||||||
| 2,898 | 6.25%, 04/04/2018 | 2,732 | ||||||
| 3,261 | ||||||||
| Primary Metal Manufacturing - 0.1% | ||||||||
| WireCo WorldGroup, Inc. | ||||||||
| 273 | 6.00%, 02/15/2017 | 273 | ||||||
| Professional, Scientific and Technical Services - 2.9% | ||||||||
| Advantage Sales & Marketing, Inc. | ||||||||
| 3,260 | 4.25%, 07/23/2021 | 3,229 | ||||||
| 1,895 | 7.50%, 07/25/2022 | 1,880 | ||||||
| Affinion Group, Inc., Tranche B Term Loan | ||||||||
| 6,875 | 6.75%, 04/30/2018 | 6,646 | ||||||
| AlixPartners LLP | ||||||||
| 293 | 4.00%, 07/10/2020 | 289 | ||||||
| 141 | 9.00%, 07/10/2021 | 143 | ||||||
| MoneyGram International, Inc. | ||||||||
| 2,423 | 4.25%, 03/27/2020 | 2,342 | ||||||
| Paradigm Ltd. | ||||||||
| 975 | 4.75%, 07/30/2019 | 951 | ||||||
| 15,480 | ||||||||
| Real Estate, Rental and Leasing - 1.5% | ||||||||
| DTZ U.S. Borrower LLC | ||||||||
| 2,815 | 5.00%, 10/23/2021 - 10/28/2021 ☼ | 2,813 | ||||||
| 1,775 | 8.25%, 10/28/2022 ☼ | 1,779 | ||||||
| Fly Leasing Ltd. | ||||||||
| 870 | 4.50%, 08/09/2019 | 869 | ||||||
| Neff Corp. | ||||||||
| 2,520 | 7.25%, 06/09/2021 | 2,526 | ||||||
| Realogy Corp., Extended Credit Linked Deposit | ||||||||
| 38 | 4.41%, 10/10/2016 | 38 | ||||||
| 8,025 | ||||||||
| Retail Trade - 6.1% | ||||||||
| Albertson's LLC | ||||||||
| 3,710 | 4.50%, 08/25/2021 | 3,711 | ||||||
| American Tire Distributors, Inc. | ||||||||
| 1,186 | 5.75%, 06/01/2018 | 1,184 | ||||||
| Amscan Holdings, Inc. | ||||||||
| 1,792 | 4.00%, 07/27/2019 | 1,754 | ||||||
| Cooper-Standard Automotive, Inc. | ||||||||
| 888 | 4.00%, 04/04/2021 | 878 | ||||||
| Hillman (The) Cos., Inc. | ||||||||
| 2,514 | 4.50%, 06/30/2021 | 2,491 | ||||||
| Lands' End, Inc. | ||||||||
| 4,607 | 4.25%, 04/04/2021 | 4,495 | ||||||
| Mauser-Werke GmbH | ||||||||
| 1,180 | 4.50%, 07/31/2021 | 1,161 | ||||||
| 2,570 | 8.25%, 07/31/2022 | 2,518 | ||||||
| Metaldyne Performance Group, Inc. | ||||||||
| 2,710 | 4.50%, 10/20/2021 ☼ | 2,710 | ||||||
| Neiman Marcus (The) Group, Inc. | ||||||||
| 4,226 | 4.25%, 10/25/2020 | 4,168 | ||||||
| Quikrete (The) Companies, Inc. | ||||||||
| 535 | 7.00%, 03/26/2021 | 540 | ||||||
| Rite Aid Corp. | ||||||||
| 725 | 5.75%, 08/21/2020 | 729 | ||||||
| Sports (The) Authority, Inc. | ||||||||
| 2,653 | 7.50%, 11/16/2017 | 2,494 | ||||||
| Supervalu, Inc. | ||||||||
| 2,659 | 4.50%, 03/21/2019 | 2,623 | ||||||
| Weight Watchers International, Inc. | ||||||||
| 1,492 | 4.00%, 04/02/2020 | 1,138 | ||||||
| 32,594 | ||||||||
| Soap, Cleaning Compound and Toilet Manufacturing - 0.3% | ||||||||
| Revlon Consumer Products Corp. | ||||||||
| 1,787 | 4.00%, 10/08/2019 | 1,765 | ||||||
| Truck Transportation - 0.4% | ||||||||
| Nexeo Solutions LLC | ||||||||
| 2,253 | 5.00%, 09/08/2017 - 09/09/2017 | 2,222 | ||||||
| 2,222 | ||||||||
| Utilities - 2.5% | ||||||||
| Exgen Texas Power LLC | ||||||||
| 3,500 | 5.75%, 09/18/2021 | 3,500 | ||||||
| La Frontera Generation LLC | ||||||||
| 681 | 4.50%, 09/30/2020 | 676 | ||||||
| PowerTeam Services LLC | ||||||||
| 444 | 4.25%, 05/06/2020 | 433 | ||||||
| 665 | 8.25%, 11/06/2020 | 645 | ||||||
| Sandy Creek Energy Associates L.P. | ||||||||
| 1,795 | 5.00%, 11/09/2020 | 1,785 | ||||||
| Star West Generation LLC | ||||||||
| 1,244 | 4.25%, 03/13/2020 | 1,231 | ||||||
| Texas Competitive Electric Holdings Co. LLC | ||||||||
| 7,000 | 4.65%, 10/10/2017 Ψ | 5,090 | ||||||
| 13,360 | ||||||||
| Wholesale Trade - 1.1% | ||||||||
| Gates Global LLC | ||||||||
| 5,590 | 4.25%, 07/05/2021 | 5,520 | ||||||
| Harbor Freight Tools | ||||||||
| 358 | 4.75%, 07/26/2019 | 357 | ||||||
| 5,877 | ||||||||
| Total Senior Floating Rate Interests | ||||||||
| (Cost $416,155) | $ | 408,999 | ||||||
| Common Stocks - 0.4% | ||||||||
| Software and Services - 0.4% | ||||||||
| 69 | Momentive Performance Materials, Inc. ⌂●† | $ | 2,352 | |||||
| 2,352 | ||||||||
| Total Common Stocks | ||||||||
| (Cost $2,497) | $ | 2,352 | ||||||
The accompanying notes are an integral part of these financial statements.
| 9 |
| The Hartford Floating Rate High Income Fund |
| Schedule of Investments – (continued) |
| October 31, 2014 |
| (000’s Omitted) |
| Shares or Principal Amount ╬ | Market Value ╪ | |||||||||||
| Exchange Traded Funds - 1.7% | ||||||||||||
| Other Investment Pools and Funds - 1.7% | ||||||||||||
| 32 | iShares iBoxx $ High Yield Corporate Bond ETF | $ | 2,953 | |||||||||
| 117 | PowerShares Senior Loan Portfolio | 2,857 | ||||||||||
| 29 | SPDR Barclays Short Term High Yield Bond ETF | 866 | ||||||||||
| 44 | SPDR Blackstone/GSO Senior Loan ETF | 2,160 | ||||||||||
| 8,836 | ||||||||||||
| Total Exchange Traded Funds | ||||||||||||
| (Cost $8,924) | $ | 8,836 | ||||||||||
| Total Long-Term Investments | ||||||||||||
| (Cost $543,970) | $ | 532,558 | ||||||||||
| Short-Term Investments - 2.7% | ||||||||||||
| Other Investment Pools and Funds - 2.7% | ||||||||||||
| 14,585 | JP Morgan U.S. Government Money Market Fund | $ | 14,585 | |||||||||
| Total Short-Term Investments | ||||||||||||
| (Cost $14,585) | $ | 14,585 | ||||||||||
| Total Investments | ||||||||||||
| (Cost $558,555) ▲ | 101.6 | % | $ | 547,143 | ||||||||
| Other Assets and Liabilities | (1.6 | )% | (8,373 | ) | ||||||||
| Total Net Assets | 100.0 | % | $ | 538,770 | ||||||||
The accompanying notes are an integral part of these financial statements.
| 10 |
| The Hartford Floating Rate High Income Fund |
| Schedule of Investments – (continued) |
| October 31, 2014 |
| (000’s Omitted) |
| Note: | Percentage of investments as shown is the ratio of the total market value to total net assets. |
The Fund may refer to any one or more of the industry classifications used by one or more widely recognized market indices, ratings group indices and/or as defined by Fund management. Industry classifications may not be identical across all security types.
Other than the industry classifications "Other Investment Pools and Funds" and "Exchange Traded Funds," equity industry classifications used in this report are the Global Industry Classification Standard, which was developed by and is the exclusive property and service mark of MSCI, Inc. and Standard & Poor’s.
For Fund compliance purposes, the Fund may not use the same classification system shown in this report as these classifications are used for reporting ease.
| ▲ | At October 31, 2014, the cost of securities for federal income tax purposes was $558,556 and the aggregate gross unrealized appreciation and depreciation based on that cost were: |
| Unrealized Appreciation | $ | 1,740 | ||
| Unrealized Depreciation | (13,153 | ) | ||
| Net Unrealized Depreciation | $ | (11,413 | ) |
| ╬ | All principal amounts are in U.S. dollars unless otherwise indicated. |
| † | These securities are valued in good faith at fair value as determined under policies and procedures established by and under the supervision of the Board of Directors. At October 31, 2014, the aggregate fair value of these securities was $2,352, which represents 0.4% of total net assets. |
| · | Non-income producing. |
| Ψ | The issuer is in bankruptcy. However, the investment held by the Fund is current with respect to interest payments. |
| Δ | Variable rate securities; the rate reported is the coupon rate in effect at October 31, 2014. |
| ♦ | Senior floating rate interests generally pay interest rates which are periodically adjusted by reference to a base short-term, floating lending rate plus a premium. The base lending rates are primarily the LIBOR, and secondarily the prime rate offered by one or more major United States banks (the "Prime Rate") and the certificate of deposit rate or other base lending rates used by commercial lenders. Senior floating rate interests often require prepayments from excess cash flows or permit the borrower to repay at its election. The rate at which the borrower repays cannot be predicted with accuracy. As a result, the actual remaining maturity may be substantially less than the stated maturities shown. Unless otherwise noted, the interest rate disclosed for these securities represents the average coupon as of October 31, 2014. |
| ■ | Securities issued within terms of a private placement memorandum, exempt from registration under Rule 144A under the Securities Act of 1933, as amended, and may be sold only to qualified institutional buyers. Unless otherwise indicated, these holdings are determined to be liquid. At October 31, 2014, the aggregate value of these securities was $73,290, which represents 13.6% of total net assets. |
| § | These securities were sold to the Fund under Regulation S, rules governing offers and sales made outside the United States without registration under the Securities Act of 1933, as amended. The Fund may only be able to resell these securities in the United States if an exemption from registration under the federal and state securities laws is available, or the Fund may only be able to sell these securities outside of the United States (such as on a foreign exchange) to a non-U.S. person. Unless otherwise indicated, these holdings are determined to be liquid. At October 31, 2014, the aggregate value of these securities was $25,178, which represents 4.7% of total net assets. |
| ⌂ | The following securities are considered illiquid. Illiquid securities are often purchased in private placement transactions, are often not registered under the Securities Act of 1933, as amended, and may have contractual restrictions on resale. A security may also be considered illiquid if the security lacks a readily available market or if its valuation has not changed for a certain period of time. |
| Period Acquired | Shares/ Par | Security | Cost Basis | |||||||
| 04/2014 | 69 | Momentive Performance Materials, Inc. | $ | 2,497 | ||||||
At October 31, 2014, the aggregate value of these securities was $2,352, which represents 0.4% of total net assets.
| β | Convertible security. |
| ♠ | Perpetual maturity security. Maturity date shown is the next call date or final legal maturity date, whichever comes first. |
| Þ | This security may pay interest in the form of additional principal in lieu of cash. |
| ☼ | This security, or a portion of this security, was purchased on a when-issued or delayed-delivery basis. The cost of these securities was $30,755 at October 31, 2014. |
| ‡ | This security, or a portion of this security, has been segregated to cover funding requirements on investment transactions settling in the future. |
The accompanying notes are an integral part of these financial statements.
| 11 |
| The Hartford Floating Rate High Income Fund |
| Schedule of Investments – (continued) |
| October 31, 2014 |
| (000’s Omitted) |
Foreign Currency Contracts Outstanding at October 31, 2014
| Unrealized Appreciation/(Depreciation) | ||||||||||||||||||||||
| Currency | Buy / Sell | Delivery Date | Counterparty | Contract Amount | Market Value ╪ | Asset | Liability | |||||||||||||||
| CAD | Buy | 11/28/2014 | RBC | $ | 29 | $ | 29 | $ | – | $ | – | |||||||||||
| EUR | Buy | 11/04/2014 | HSBC | 742 | 742 | – | – | |||||||||||||||
| EUR | Sell | 11/28/2014 | HSBC | 742 | 742 | – | – | |||||||||||||||
| EUR | Sell | 11/28/2014 | JPM | 26,586 | 26,306 | 280 | – | |||||||||||||||
| GBP | Sell | 11/28/2014 | CBK | 24,450 | 24,415 | 35 | – | |||||||||||||||
| GBP | Sell | 11/28/2014 | UBS | 420 | 419 | 1 | – | |||||||||||||||
| GBP | Sell | 11/28/2014 | WEST | 1,267 | 1,262 | 5 | – | |||||||||||||||
| Total | $ | 321 | $ | – | ||||||||||||||||||
| ╪ | See Significant Accounting Policies of accompanying Notes to Financial Statements regarding valuation of securities. |
| GLOSSARY: (abbreviations used in preceding Schedule of Investments) | ||
| Counterparty Abbreviations: | ||
| CBK | Citibank NA | |
| HSBC | HSBC Bank USA | |
| JPM | JP Morgan Chase & Co. | |
| RBC | RBC Dominion Securities, Inc. | |
| UBS | UBS AG | |
| WEST | Westpac International | |
| Currency Abbreviations: | ||
| CAD | Canadian Dollar | |
| EUR | EURO | |
| GBP | British Pound | |
| Other Abbreviations: | ||
| ETF | Exchange Traded Fund | |
| LIBOR | London Interbank Offered Rate | |
| SPDR | Standard & Poor's Depositary Receipt | |
The accompanying notes are an integral part of these financial statements.
| 12 |
| The Hartford Floating Rate High Income Fund |
| Schedule of Investments – (continued) |
| October 31, 2014 |
| (000’s Omitted) |
Investment Valuation Hierarchy Level Summary
October 31, 2014
| Total | Level 1 ♦ | Level 2 ♦ | Level 3 | |||||||||||||
| Assets: | ||||||||||||||||
| Common Stocks ‡ | $ | 2,352 | $ | – | $ | – | $ | 2,352 | ||||||||
| Corporate Bonds | 112,371 | – | 112,371 | – | ||||||||||||
| Exchange Traded Funds | 8,836 | 8,836 | – | – | ||||||||||||
| Senior Floating Rate Interests | 408,999 | – | 408,999 | – | ||||||||||||
| Short-Term Investments | 14,585 | 14,585 | – | – | ||||||||||||
| Total | $ | 547,143 | $ | 23,421 | $ | 521,370 | $ | 2,352 | ||||||||
| Foreign Currency Contracts * | $ | 321 | $ | – | $ | 321 | $ | – | ||||||||
| Total | $ | 321 | $ | – | $ | 321 | $ | – | ||||||||
| Liabilities: | ||||||||||||||||
| Foreign Currency Contracts * | $ | – | $ | – | $ | – | $ | – | ||||||||
| Total | $ | – | $ | – | $ | – | $ | – | ||||||||
| ♦ | For the year ended October 31, 2014, there were no transfers between Level 1 and Level 2. |
| ‡ | The Fund has all or primarily all of the equity securities categorized in a particular level. Refer to the Schedule of Investments for further industry breakout. |
| * | Derivative
instruments (excluding purchased and written options, if applicable) are valued at the
unrealized appreciation/depreciation on the investments. |
| Note: | For purposes of reporting transfers between different hierarchy levels, both transfers in and out of each level, as applicable, are shown as if they occurred at the beginning of the period. |
Following is a reconciliation of Level 3 assets for which significant unobservable inputs were used to determine fair value:
| Balance
as of October 31, 2013 | Realized Gain (Loss) | Change
in Unrealized Appreciation (Depreciation) | Net Amortization | Purchases | Sales | Transfers Into Level 3 | Transfers Out of Level 3 | Balance
as of October 31, 2014 | ||||||||||||||||||||||||||||
| Assets: | ||||||||||||||||||||||||||||||||||||
| Common Stocks | $ | — | $ | — | $ | (145 | )* | $ | — | $ | 2,497 | $ | — | $ | — | $ | — | $ | 2,352 | |||||||||||||||||
| Total | $ | — | $ | — | $ | (145 | ) | $ | — | $ | 2,497 | $ | — | $ | — | $ | — | $ | 2,352 | |||||||||||||||||
| * | Change in unrealized appreciation (depreciation) in the current period relating to assets still held at October 31, 2014 was $(145). |
The accompanying notes are an integral part of these financial statements.
| 13 |
| The Hartford Floating Rate High Income Fund |
| Statement of Assets and Liabilities |
| October 31, 2014 |
| (000’s Omitted) |
| Assets: | ||||
| Investments in securities, at market value (cost $558,555) | $ | 547,143 | ||
| Cash | 1,738 | |||
| Unrealized appreciation on foreign currency contracts | 321 | |||
| Receivables: | ||||
| Investment securities sold | 28,882 | |||
| Fund shares sold | 10,705 | |||
| Dividends and interest | 3,837 | |||
| Other assets | 214 | |||
| Total assets | 592,840 | |||
| Liabilities: | ||||
| Unrealized depreciation on foreign currency contracts | — | |||
| Bank overdraft — foreign cash | 3,791 | |||
| Payables: | ||||
| Investment securities purchased | 39,911 | |||
| Fund shares redeemed | 10,135 | |||
| Investment management fees | 72 | |||
| Dividends | 38 | |||
| Administrative fees | — | |||
| Distribution fees | 32 | |||
| Accrued expenses | 65 | |||
| Other liabilities | 26 | |||
| Total liabilities | 54,070 | |||
| Net assets | $ | 538,770 | ||
| Summary of Net Assets: | ||||
| Capital stock and paid-in-capital | $ | 542,089 | ||
| Undistributed net investment income | 832 | |||
| Accumulated net realized gain | 7,039 | |||
| Unrealized depreciation of investments and the translation of assets and liabilities denominated in foreign currency | (11,190 | ) | ||
| Net assets | $ | 538,770 | ||
| Shares authorized | 450,000 | |||
| Par value | $ | 0.001 | ||
| Class A: Net asset value per share/Maximum offering price per share | $10.54/$10.87 | |||
| Shares outstanding | 18,132 | |||
| Net assets | $ | 191,162 | ||
| Class C: Net asset value per share | $ | 10.54 | ||
| Shares outstanding | 11,235 | |||
| Net assets | $ | 118,465 | ||
| Class I: Net asset value per share | $ | 10.55 | ||
| Shares outstanding | 19,658 | |||
| Net assets | $ | 207,458 | ||
| Class R3: Net asset value per share | $ | 10.52 | ||
| Shares outstanding | 274 | |||
| Net assets | $ | 2,886 | ||
| Class R4: Net asset value per share | $ | 10.52 | ||
| Shares outstanding | 286 | |||
| Net assets | $ | 3,015 | ||
| Class R5: Net asset value per share | $ | 10.52 | ||
| Shares outstanding | 239 | |||
| Net assets | $ | 2,515 | ||
| Class Y: Net asset value per share | $ | 10.52 | ||
| Shares outstanding | 1,261 | |||
| Net assets | $ | 13,269 |
The accompanying notes are an integral part of these financial statements.
| 14 |
| The Hartford Floating Rate High Income Fund |
| Statement of Operations |
| For the Year Ended October 31, 2014 |
| (000’s Omitted) |
| Investment Income: | ||||
| Dividends | $ | 543 | ||
| Interest | 26,748 | |||
| Less: Foreign tax withheld | (38 | ) | ||
| Total investment income | 27,253 | |||
| Expenses: | ||||
| Investment management fees | 3,513 | |||
| Administrative services fees | ||||
| Class R3 | 6 | |||
| Class R4 | 5 | |||
| Class R5 | 3 | |||
| Transfer agent fees | ||||
| Class A | 153 | |||
| Class C | 100 | |||
| Class I | 112 | |||
| Class R3 | — | |||
| Class R4 | — | |||
| Class R5 | — | |||
| Class Y | — | |||
| Distribution fees | ||||
| Class A | 497 | |||
| Class C | 1,102 | |||
| Class R3 | 14 | |||
| Class R4 | 8 | |||
| Custodian fees | 21 | |||
| Accounting services fees | 91 | |||
| Registration and filing fees | 183 | |||
| Board of Directors' fees | 13 | |||
| Audit fees | 14 | |||
| Other expenses | 79 | |||
| Total expenses (before waivers) | 5,914 | |||
| Expense waivers | (266 | ) | ||
| Total waivers | (266 | ) | ||
| Total expenses, net | 5,648 | |||
| Net Investment Income | 21,605 | |||
| Net Realized Gain on Investments and Foreign Currency Transactions: | ||||
| Net realized gain on investments | 4,246 | |||
| Net realized gain on foreign currency contracts | 3,180 | |||
| Net realized gain on other foreign currency transactions | 16 | |||
| Net Realized Gain on Investments and Foreign Currency Transactions | 7,442 | |||
| Net Changes in Unrealized Depreciation of Investments and Foreign Currency Transactions: | ||||
| Net unrealized depreciation of investments | (15,534 | ) | ||
| Net unrealized appreciation of foreign currency contracts | 397 | |||
| Net unrealized depreciation of translation of other assets and liabilities in foreign currencies | (187 | ) | ||
| Net Changes in Unrealized Depreciation of Investments and Foreign Currency Transactions | (15,324 | ) | ||
| Net Loss on Investments and Foreign Currency Transactions | (7,882 | ) | ||
| Net Increase in Net Assets Resulting from Operations | $ | 13,723 |
The accompanying notes are an integral part of these financial statements.
| 15 |
| The Hartford Floating Rate High Income Fund |
| Statement of Changes in Net Assets |
| (000’s Omitted) |
| For the Year Ended October 31, 2014 | For the Year Ended October 31, 2013 | |||||||
| Operations: | ||||||||
| Net investment income | $ | 21,605 | $ | 9,963 | ||||
| Net realized gain on investments and foreign currency transactions | 7,442 | 1,252 | ||||||
| Net unrealized appreciation (depreciation) of investments and foreign currency transactions | (15,324 | ) | 2,355 | |||||
| Net Increase in Net Assets Resulting from Operations | 13,723 | 13,570 | ||||||
| Distributions to Shareholders: | ||||||||
| From net investment income | ||||||||
| Class A | (8,552 | ) | (4,424 | ) | ||||
| Class C | (3,922 | ) | (2,052 | ) | ||||
| Class I | (7,859 | ) | (2,553 | ) | ||||
| Class R3 | (111 | ) | (104 | ) | ||||
| Class R4 | (144 | ) | (115 | ) | ||||
| Class R5 | (124 | ) | (122 | ) | ||||
| Class Y | (567 | ) | (526 | ) | ||||
| Total from net investment income | (21,279 | ) | (9,896 | ) | ||||
| From net realized gain on investments | ||||||||
| Class A | (498 | ) | (470 | ) | ||||
| Class C | (266 | ) | (243 | ) | ||||
| Class I | (394 | ) | (138 | ) | ||||
| Class R3 | (8 | ) | (21 | ) | ||||
| Class R4 | (8 | ) | (21 | ) | ||||
| Class R5 | (9 | ) | (23 | ) | ||||
| Class Y | (31 | ) | (96 | ) | ||||
| Total from net realized gain on investments | (1,214 | ) | (1,012 | ) | ||||
| Total distributions | (22,493 | ) | (10,908 | ) | ||||
| Capital Share Transactions: | ||||||||
| Class A | 30,419 | 116,068 | ||||||
| Class C | 31,050 | 64,441 | ||||||
| Class I | 91,588 | 103,743 | ||||||
| Class R3 | 369 | 285 | ||||||
| Class R4 | 412 | 328 | ||||||
| Class R5 | 124 | 141 | ||||||
| Class Y | 2,575 | 624 | ||||||
| Net increase from capital share transactions | 156,537 | 285,630 | ||||||
| Net Increase in Net Assets | 147,767 | 288,292 | ||||||
| Net Assets: | ||||||||
| Beginning of period | 391,003 | 102,711 | ||||||
| End of period | $ | 538,770 | $ | 391,003 | ||||
| Undistributed (distributions in excess of) net investment income | $ | 832 | $ | 91 | ||||
The accompanying notes are an integral part of these financial statements.
| 16 |
| The Hartford Floating Rate High Income Fund |
| Notes to Financial Statements |
| October 31, 2014 |
| (000’s Omitted) |
Organization:
The Hartford Mutual Funds, Inc. (“Company”) is an open-end management investment company comprised of forty-two portfolios. Financial statements for The Hartford Floating Rate High Income Fund (the "Fund"), a series of the Company, are included in this report.
The Company is organized under the laws of the State of Maryland and is registered with the Securities and Exchange Commission (“SEC”) under the Investment Company Act of 1940, as amended (“1940 Act”). The Fund is a non-diversified open-end management investment company. The Fund is an investment company and applies specialized accounting and reporting under Accounting Standards Codification Topic 946, Financial Services - Investment Companies.
Class A shares are sold with a front-end sales charge of up to 3.00%. Class C shares are sold with a contingent deferred sales charge of up to 1.00% on shares redeemed within twelve months of purchase. Class I shares are sold without sales charges to certain eligible investors primarily through advisory fee-based wrap programs. Class R3, R4 and R5 shares, which are offered to employer-sponsored retirement plans, and Class Y shares, which are sold to certain eligible institutional investors, are sold without a sales charge. All classes of shares have identical voting, redemption, dividend, liquidation and other rights and the same terms and conditions, with the exceptions that each class may have different expenses, which may affect performance.
Significant Accounting Policies:
The following is a summary of significant accounting policies of the Fund in the preparation of its financial statements, which are in accordance with United States generally accepted accounting principles (“U.S. GAAP”). The preparation of financial statements in accordance with U.S. GAAP may require management to make estimates and assumptions that affect the reported amounts of assets and liabilities and disclosure of contingent assets and liabilities at the date of the financial statements and the reported amounts of increases and decreases in net assets from operations during the reporting period. Actual results could differ from those estimates.
Determination of Net Asset Value – The per share net asset value ("NAV") of each class of the Fund's shares is determined as of the close of regular trading (normally 4:00 p.m. Eastern Time) (the “NYSE Close”) on each day that the New York Stock Exchange (the “Exchange”) is open (“Valuation Date”). Information that becomes known to the Fund after the NAV has been calculated on a particular day will not generally be used to retroactively adjust the NAV determined earlier that day.
Investment Valuation and Fair Value Measurements – For purposes of calculating the NAV, portfolio investments and other assets held by the Fund's portfolio for which market quotes are readily available are valued at market value. Market value is generally determined on the basis of last reported sales prices or official close price. If no sales are reported, market value is based on quotes obtained from a quotation reporting system, established market makers, or independent pricing services. If market prices are not readily available or are deemed unreliable, the Fund will use the fair value of the investment as determined in good faith under policies and procedures established by and under the supervision of the Company's Board of Directors. Market quotes are considered not readily available where there is an absence of current or reliable market-based data (e.g., trade information or indicative market quotes), including where events occur after the close of the relevant market, but prior to the NYSE Close, that materially affect the values of the Fund's portfolio investments or assets. In addition, market quotes are considered not readily available when, due to extraordinary circumstances, the exchanges or markets on which the investments trade do not open for trading for the entire day and no other market prices are available. There can be no assurance that the Fund could obtain the fair market value assigned to an investment if the Fund were to sell the investment at approximately the time at which the Fund determines its NAV.
Fixed income investments (other than short-term obligations), non-exchange traded derivatives and centrally cleared swaps held by the Fund are normally valued on the basis of quotes obtained from independent pricing services or brokers and dealers in accordance with procedures established by the Company's Board of Directors. Prices obtained from independent pricing services use information provided by market makers or estimates of market values through accepted market modeling, trading and pricing conventions. Inputs to the models may include, but are not limited to, prepayment speeds, pricing spread, yield, trade information, dealer quotes, market color, cash flow models and the investment’s terms and conditions. Generally, the Fund may use fair valuation in regard to fixed income investments when the Fund holds defaulted or distressed investments or investments in a company in which a reorganization is pending. Senior floating rate interests generally trade in over-the-counter (“OTC”) markets and are priced through an independent pricing service utilizing independent market quotations from loan dealers or financial institutions. A composite bid price is used, which
| 17 |
| The Hartford Floating Rate High Income Fund |
| Notes to Financial Statements – (continued) |
| October 31, 2014 |
| (000’s Omitted) |
is an average of the dealer marks and dealer runs. Short-term investments maturing in 60 days or less are generally valued at amortized cost, if their original term to maturity was 60 days or less, or by amortizing their value on the 61st day prior to maturity, if the original term to maturity exceeded 60 days, which approximates fair value.
Investments valued in currencies other than U.S. dollars are converted to U.S. dollars using exchange rates obtained from independent pricing services for calculation of the NAV. As a result, the NAV of the Fund’s shares may be affected by changes in the value of currencies in relation to the U.S. dollar. The value of investments traded in markets outside the United States or denominated in currencies other than the U.S. dollar may be affected significantly on a day that the NYSE is closed and the market value may change on days when an investor is not able to purchase, redeem or exchange shares of the Fund.
Foreign currency contracts represent agreements to exchange currencies on specific future dates at predetermined rates. Foreign currency contracts are valued using foreign currency exchange rates and forward rates as provided by an independent pricing service on the Valuation Date.
Investments in open-end mutual funds are valued at the respective NAV of each open-end mutual fund on the Valuation Date.
Financial instruments for which prices are not available from an independent pricing service may be valued using market quotations obtained from one or more dealers that make markets in the respective financial instrument in accordance with procedures established by the Company's Board of Directors.
U.S. GAAP defines fair value as the price that the Fund would receive to sell an asset or pay to transfer a liability in an orderly transaction between market participants. The U.S. GAAP fair value measurement standards require disclosure of a fair value hierarchy for each major category of assets and liabilities. Various inputs are used in determining the fair value of the Fund’s investments. These inputs are summarized into three broad hierarchy levels. This hierarchy is based on whether the valuation inputs are observable or unobservable. These levels are:
Level 1 – Quoted prices in active markets for identical investments. Level 1 may include exchange traded instruments, such as domestic equities, some foreign equities, options, futures, mutual funds, exchange traded funds, rights and warrants.
Level 2 – Observable inputs other than Level 1 prices, such as quoted prices for similar investments; quoted prices in markets that are not active; or other inputs that are observable or can be corroborated by observable market data. Level 2 may include debt investments that are traded less frequently than exchange traded instruments and which are valued using independent pricing services; foreign equities, which are principally traded on certain foreign markets and are adjusted daily pursuant to a fair value pricing service in order to reflect an adjustment for the factors occurring after the close of certain foreign markets but before the NYSE Close; senior floating rate interests, which are valued using an aggregate of dealer bids; short-term investments, which are valued at amortized cost; and swaps, which are valued based upon the terms of each swap contract.
Level 3 – Significant unobservable inputs that are supported by limited or no market activity. Level 3 may include financial instruments whose values are determined using indicative market quotes or require significant management judgment or estimation. These unobservable valuation inputs may include estimates for current yields, maturity/duration, prepayment speed, and indicative market quotes for comparable investments along with other assumptions relating to credit quality, collateral value, complexity of the investment structure, general market conditions and liquidity. This category may include investments where trading has been halted or there are certain restrictions on trading. While these investments are priced using unobservable inputs, the valuation of these investments reflects the best available data and management believes the prices are a reasonable representation of exit price.
The Board of Directors of the Company generally reviews and approves the “Procedures for Valuation of Portfolio Securities” at least once a year. These procedures define how investments are to be valued, including the formation and activities of a Valuation Committee. The Valuation Committee is responsible for determining in good faith the fair value of investments when the value cannot be obtained from primary pricing services or alternative sources or if the valuation of an investment as provided by the primary pricing service or alternative source is believed not to reflect the investment’s fair value as of the Valuation Date. Voting members of the Valuation Committee include the Fund's Treasurer or designee and a Vice President of the investment
| 18 |
| The Hartford Floating Rate High Income Fund |
| Notes to Financial Statements – (continued) |
| October 31, 2014 |
| (000’s Omitted) |
manager or designee. An Assistant Vice President of the Fund with legal expertise or designee is also included on the Valuation Committee as a non-voting advisory member. In addition, the Fund’s Chief Compliance Officer shall designate a member of the compliance group to attend Valuation Committee meetings as a non-voting resource, to monitor for and provide guidance with respect to compliance with these procedures. Two members of the Valuation Committee or their designees, representing different departments, shall constitute a quorum for purposes of permitting the Valuation Committee to take action. The Valuation Committee will consider all relevant factors in determining an investment’s fair value, and may seek the advice of the Fund’s sub-adviser, knowledgeable brokers, and legal counsel in making such determination. The Valuation Committee reports to the Audit Committee of the Company's Board of Directors. The Audit Committee receives quarterly written reports which include details of all fair-valued investments, including the reason for the fair valuation, and an indication, when possible, of the accuracy of the valuation by disclosing the next available reliable public price quotation or the disposition price of such investments (the “look-back” test). The Board of Directors then must consider for ratification all of the fair value determinations made during the previous quarter.
Valuation levels are not necessarily indicative of the risk associated with investing in such investments. Individual investments within any of the above mentioned asset classes may be assigned a different hierarchical level than those presented above, as individual circumstances dictate.
For additional information, refer to the Investment Valuation Hierarchy Level Summary and the Level 3 roll-forward reconciliation, if applicable, which follow the Schedule of Investments.
Investment Transactions and Investment Income – Investment transactions are recorded as of the trade date (the date the order to buy or sell is executed) for financial reporting purposes. Investments purchased or sold on a when-issued or delayed-delivery basis may be settled a month or more after the trade date. Realized gains and losses are determined on the basis of identified cost.
Trade date for senior floating rate interests purchased in the primary loan market is considered the date on which the loan allocations are determined. Trade date for senior floating rate interests purchased in the secondary loan market is the date on which the transaction is entered into.
Dividend income from domestic securities is accrued on the ex-dividend date. Interest income, including amortization of premium, accretion of discounts and additional principal received in-kind in lieu of cash, is accrued on a daily basis.
Foreign Currency Transactions – Assets and liabilities denominated in currencies other than U.S. dollars are translated into U.S. dollars at the exchange rates in effect on the valuation date. Purchases and sales of investments, income and expenses are translated into U.S. dollars at the exchange rates on the dates of such transactions.
The Fund does not isolate that portion of portfolio investment valuation resulting from fluctuations in the foreign currency exchange rates from the fluctuations arising from changes in the market prices of investments held. Exchange rate fluctuations are included with the net realized and unrealized gain or loss on investments in the accompanying financial statements.
Net realized foreign exchange gains or losses arise from sales of foreign currencies and the difference between asset and liability amounts initially stated in foreign currencies and the U.S. dollar value of the amounts actually received or paid. Net unrealized foreign exchange gains or losses arise from changes in the value of other assets and liabilities at the end of the reporting period, resulting from changes in the exchange rates.
Fund Share Valuation and Dividend Distributions to Shareholders – Orders for the Fund’s shares are executed in accordance with the investment instructions of the shareholders. The NAV of the Fund’s shares is determined as of the close of business on each business day of the Exchange. The NAV is determined separately for each class of shares of the Fund by dividing the Fund’s net assets attributable to that class by the number of shares of the class outstanding. Each class of shares offered by the Fund has equal rights as to assets and voting privileges (except that shareholders of a class have exclusive voting rights regarding any matter relating solely to that class of shares). Income and non-class specific expenses are allocated daily to each class on the basis of the relative net assets of the class. Realized and unrealized gains and losses are allocated daily based on the relative net assets of each class of shares of the Fund.
| 19 |
| The Hartford Floating Rate High Income Fund |
| Notes to Financial Statements – (continued) |
| October 31, 2014 |
| (000’s Omitted) |
Orders for the purchase of the Fund’s shares received prior to the close of the Exchange on any day the Exchange is open for business are priced at the NAV determined as of the close of the Exchange. Orders received after the close of the Exchange, or on a day on which the Exchange and/or the Fund is not open for business, are priced at the next determined NAV.
Dividends are declared pursuant to a policy adopted by the Company's Board of Directors based upon the investment performance of the Fund. Normally, dividends from net investment income are declared daily and paid monthly. Dividends from realized gains, if any, are paid at least once a year.
Net investment income, dividends and distributions from net realized gains and capital are determined in accordance with federal income tax regulations, which may differ from U.S. GAAP with respect to character and timing (see Federal Income Taxes: Distributions and Components of Distributable Earnings and Reclassification of Capital Accounts).
Securities and Other Investments:
Illiquid and Restricted Investments – The Fund is permitted to invest up to 15% of its net assets in illiquid investments. Illiquid investments are those that may not be sold or disposed of in the ordinary course of business within seven days, at approximately the price used to determine the Fund’s NAV. The Fund may not be able to sell illiquid investments when its sub-adviser considers it desirable to do so or may have to sell such investments at a price that is lower than the price that could be obtained if the investments were more liquid. A sale of illiquid investments may require more time and may result in higher dealer discounts and other selling expenses than does the sale of those that are liquid. Illiquid investments also may be more difficult to value due to the unavailability of reliable market quotations for such investments, and an investment in them may have an adverse impact on the Fund’s NAV. The Fund may also purchase certain restricted investments that can only be resold to certain qualified investors and may be determined to be liquid pursuant to policies and guidelines established by the Company's Board of Directors. The Fund, as shown on the Schedule of Investments, had illiquid or restricted investments as of October 31, 2014.
Investments Purchased on a When-Issued or Delayed-Delivery Basis – Delivery and payment for investments that have been purchased by the Fund on a forward commitment, or when-issued or delayed-delivery basis, take place beyond the customary settlement period. The Fund may dispose of or renegotiate a delayed-delivery transaction after it is entered into, and may sell delayed-delivery investments before they are delivered, which may result in a realized gain or loss. During this period, such investments are subject to market fluctuations, and the Fund identifies investments segregated in its records with a value at least equal to the amount of the commitment. The Fund, as shown on the Schedule of Investments, had when-issued or delayed-delivery investments as of October 31, 2014.
Senior Floating Rate Interests – The Fund may invest in senior floating rate interests. Senior floating rate interests hold the most senior position in the capital structure of a business entity (the “Borrower”), are typically secured by specific collateral and have a claim on the assets and/or stock of the Borrower that is senior to the assets held by subordinated debtholders and stockholders of the Borrower. Senior floating rate interests are typically structured and administered by a financial institution that acts as the agent of the lenders participating in the senior floating rate interest. The Fund may invest in multiple series or tranches of a senior floating rate interest, which may have varying terms and carry different associated risks. The Fund may also enter into unfunded loan commitments, which are contractual obligations for future funding. Unfunded loan commitments may include revolving credit facilities, which may obligate the Fund to supply additional cash to the borrower on demand, representing a potential financial obligation by the Fund in the future. The Fund may receive a commitment fee based on the undrawn portion of the underlying line of credit portion of a senior floating rate interest. In certain circumstances, the Fund may receive various fees upon the restructure of a senior floating rate interest by a borrower. Fees earned/paid are recorded as a component of income or realized gain/loss in the Statement of Operations.
Senior floating rate interests are typically rated below-investment-grade, which suggests the risk of default is higher, and generally pay higher interest rates than investment-grade debt securities. A default could lead to non-payment of income or principal, which would result in a reduction of investment income to the Fund, and there can be no assurance that the liquidation of any collateral would satisfy the Borrower’s obligation in the event of non-payment of scheduled interest or principal payments, or that such collateral could be readily liquidated. The Fund, as shown on the Schedule of Investments, had senior floating rate interests as of October 31, 2014.
| 20 |
| The Hartford Floating Rate High Income Fund |
| Notes to Financial Statements – (continued) |
| October 31, 2014 |
| (000’s Omitted) |
Financial Derivative Instruments:
The following disclosures contain information on how and why the Fund uses derivative instruments, the credit-risk-related contingent features in certain derivative instruments and how derivative instruments affect the Fund’s financial position and results of operations. The location and fair value amounts of these instruments on the Statement of Assets and Liabilities and the realized gains and losses and changes in unrealized gains and losses on the Statement of Operations, each categorized by type of derivative contract, are included in the following Additional Derivative Instrument Information footnote. The derivative instruments outstanding as of year-end are disclosed in the notes to the Schedule of Investments, if applicable. The amounts of realized gains and losses and changes in unrealized gains and losses on derivative instruments during the year are disclosed in the Statement of Operations.
Foreign Currency Contracts – The Fund may enter into foreign currency contracts that obligate the Fund to purchase or sell currencies at specified future dates. Foreign currency contracts are used to hedge the currency exposure associated with some or all of the Fund’s investments and/or as part of an investment strategy. Foreign currency contracts are marked to market daily and the change in value is recorded by the Fund as an unrealized gain or loss. The Fund will record a realized gain or loss when the foreign currency contract is settled.
Foreign currency contracts involve elements of market risk in excess of the amounts reflected in the Statement of Assets and Liabilities. In addition, risks may arise upon entering into these contracts from the potential inability of the counterparties to meet the terms of the contracts and from unanticipated movements in the value of the foreign currencies relative to the U.S. dollar. The Fund, as shown on the Schedule of Investments, had outstanding foreign currency contracts as of October 31, 2014.
Additional Derivative Instrument Information:
Fair Value of Derivative Instruments on the Statement of Assets and Liabilities as of October 31, 2014:
| Risk Exposure Category | ||||||||||||||||||||||||||||
| Interest
Rate Contracts | Foreign Exchange Contracts | Credit Contracts | Equity Contracts | Commodity Contracts | Other Contracts | Total | ||||||||||||||||||||||
| Assets: | ||||||||||||||||||||||||||||
| Unrealized appreciation on foreign currency contracts | $ | — | $ | 321 | $ | — | $ | — | $ | — | $ | — | $ | 321 | ||||||||||||||
| Total | $ | — | $ | 321 | $ | — | $ | — | $ | — | $ | — | $ | 321 | ||||||||||||||
| Liabilities: | ||||||||||||||||||||||||||||
| Unrealized depreciation on foreign currency contracts | $ | — | $ | — | $ | — | $ | — | $ | — | $ | — | $ | — | ||||||||||||||
| Total | $ | — | $ | — | $ | — | $ | — | $ | — | $ | — | $ | — | ||||||||||||||
The volume of derivatives that is presented in the Schedule of Investments is consistent with the derivative activity during the year ended October 31, 2014.
The Effect of Derivative Instruments on the Statement of Operations for the year ended October 31, 2014:
| Risk Exposure Category | ||||||||||||||||||||||||||||
| Interest Rate Contracts | Foreign Exchange Contracts | Credit Contracts | Equity Contracts | Commodity Contracts | Other Contracts | Total | ||||||||||||||||||||||
| Realized Gain on Derivatives Recognized as a Result of Operations: | ||||||||||||||||||||||||||||
| Net realized gain on foreign currency contracts | $ | — | $ | 3,180 | $ | — | $ | — | $ | — | $ | — | $ | 3,180 | ||||||||||||||
| Total | $ | — | $ | 3,180 | $ | — | $ | — | $ | — | $ | — | $ | 3,180 | ||||||||||||||
| Net Change in Unrealized Appreciation (Depreciation) on Derivatives Recognized as a Result of Operations: | ||||||||||||||||||||||||||||
| Net change in unrealized appreciation of foreign currency contracts | $ | — | $ | 397 | $ | — | $ | — | $ | — | $ | — | $ | 397 | ||||||||||||||
| Total | $ | — | $ | 397 | $ | — | $ | — | $ | — | $ | — | $ | 397 | ||||||||||||||
| 21 |
| The Hartford Floating Rate High Income Fund |
| Notes to Financial Statements – (continued) |
| October 31, 2014 |
| (000’s Omitted) |
Balance Sheet Offsetting Information - The following discloses both gross information and net information about instruments and transactions eligible for offset in the financial statements, and instruments and transactions that are subject to a master netting arrangement, as well as amounts related to margin, reflected as financial collateral (including cash collateral), held at clearing brokers, counterparties and the Fund’s custodian. The master netting arrangements allow the clearing brokers to net any collateral held in or on behalf of the Fund, or liabilities or payment obligations of the clearing brokers to the Fund, against any liabilities or payment obligations of the Fund to the clearing brokers. The Fund is required to deposit financial collateral (including cash collateral) at the Futures Commission Merchant's ("FCM") custodian on behalf of clearing brokers and counterparties to continually meet the original and maintenance requirements established by the clearing brokers and counterparties. Such requirements are specific to the respective clearing broker or counterparty. Certain master netting arrangements may not be enforceable in the bankruptcy proceedings of a counterparty.
Offsetting of Financial Assets and Derivative Assets as of October 31, 2014:
| Gross
Amounts* of Assets Presented in Statement of Assets and Liabilities | Financial Instruments with Allowable Netting | Non-cash Collateral Received | Cash
Collateral Received | Net
Amount (not less than $0) | ||||||||||||||||
| Description | ||||||||||||||||||||
| Unrealized appreciation on foreign currency contracts | $ | 321 | $ | — | $ | — | $ | — | $ | 321 | ||||||||||
| Total subject to a master netting or similar arrangement | $ | 321 | $ | — | $ | — | $ | — | $ | 321 | ||||||||||
* Gross amounts are presented here as there are no amounts that are netted within the Statement of Assets and Liabilities.
Offsetting of Financial Liabilities and Derivative Liabilities as of October 31, 2014:
| Gross
Amounts* of Liabilities Presented in Statement of Assets and Liabilities | Financial Instruments with Allowable Netting | Non-cash Collateral Pledged | Cash
Collateral Pledged | Net
Amount (not less than $0) | ||||||||||||||||
| Description | ||||||||||||||||||||
| Unrealized depreciation on foreign currency contracts | $ | — | $ | — | $ | — | $ | — | $ | — | ||||||||||
| Total subject to a master netting or similar arrangement | $ | — | $ | — | $ | — | $ | — | $ | — | ||||||||||
* Gross amounts are presented here as there are no amounts that are netted within the Statement of Assets and Liabilities.
Certain derivatives held by the Fund, as of October 31, 2014, are not subject to a master netting arrangement and are excluded from the table above.
Principal Risks:
Credit risk depends largely on the perceived financial health of bond issuers. In general, the credit rating is inversely related to the credit risk of the issuer. Higher rated bonds generally are deemed to have less credit risk, while lower or unrated bonds are deemed to have higher risk of default. The share price, yield and total return of a fund that holds securities with higher credit risk may be more volatile than those of a fund that holds bonds with lower credit risk. Similar to credit risk, the Fund may be exposed to counterparty risk, or the risk that an institution or other entity with which the Fund has unsettled or open transactions will default.
The Fund’s investments expose the Fund to various risks including, but not limited to, interest rate, prepayment, extension, foreign currency and equity risks. Interest rate risk is the risk that fixed income securities will decline in value because of changes in interest rates. As nominal interest rates rise, the values of certain fixed income securities held by the Fund are likely to decrease. A nominal interest rate can be described as the sum of a real interest rate and an expected inflation rate. Fixed income securities with longer durations tend to be more sensitive to changes in interest rates, usually making them more volatile than securities with shorter durations. Duration is useful primarily as a measure of the sensitivity of a fixed income security’s market price to interest rate (i.e.,
| 22 |
| The Hartford Floating Rate High Income Fund |
| Notes to Financial Statements – (continued) |
| October 31, 2014 |
| (000’s Omitted) |
yield) movements. Senior floating rate interests and securities subject to prepayment and extension risk generally offer less potential for gains when interest rates decline. Rising interest rates may cause prepayments to occur at a slower than expected rate, thereby effectively lengthening the maturity of the security and making the security more sensitive to interest rate changes. Prepayment and extension risk are major risks of mortgage backed securities, senior floating rate interests and certain asset backed securities. For certain asset backed securities, the actual maturity may be less than the stated maturity shown in the Schedule of Investments, if applicable. As a result, the timing of income recognition relating to these securities may vary based upon the actual maturity.
If the Fund invests directly in foreign currencies or in securities that trade in, and receive revenues in, foreign currencies, or in derivatives that provide exposure to foreign currencies, it will be subject to the risk that those currencies will decline in value relative to the base currency (U.S. dollars) of the Fund, or, in the case of hedging positions, that the Fund’s base currency will decline in value relative to the currency being hedged. Currency rates in foreign countries may fluctuate significantly over short periods of time for a number of reasons, including changes in interest rates, intervention (or the failure to intervene) by U.S. or foreign governments, central banks or supranational entities, such as the International Monetary Fund, or by the imposition of currency controls or other political developments in the United States or abroad. As a result, the Fund’s investments in foreign currency denominated securities may reduce the returns of the Fund. The market values of equity securities, such as common stocks and preferred stocks, or equity related investments, such as futures and options, may decline due to general market conditions which are not specifically related to a particular company, such as real or perceived adverse economic conditions, changes in the general outlook for corporate earnings, changes in interest or currency rates or adverse investor sentiment generally. The market value of equity securities may also decline due to factors which affect a particular industry or industries, such as labor shortages or increased production costs and competitive conditions within an industry. Equity securities and equity related investments generally have greater market price volatility than fixed income securities.
Federal Income Taxes:
Federal Income Taxes – For federal income tax purposes, the Fund intends to continue to qualify as a Regulated Investment Company ("RIC") under Subchapter M of the Internal Revenue Code (“IRC”) by distributing substantially all of its taxable net investment income and net realized capital gains to its shareholders and otherwise complying with the requirements of the IRC. The Fund has distributed substantially all of its income and capital gains in prior years, if applicable, and intends to distribute substantially all of its income and capital gains during the calendar year ending December 31, 2014. Accordingly, no provision for federal income or excise taxes has been made in the accompanying financial statements. Distributions from short-term capital gains are treated as ordinary income distributions for federal income tax purposes.
Net Investment Income (Loss), Net Realized Gains (Losses) and Distributions – Net investment income (loss) and net realized gains (losses) may differ for financial statement and tax purposes primarily because of losses deferred due to wash sale adjustments, foreign currency gains and losses, adjustments related to Passive Foreign Investment Companies ("PFICs"), Real Estate Investment Trusts ("REITs"), RICs, certain derivatives and partnerships. The character of distributions made during the year from net investment income or net realized gains may differ from their ultimate characterization for federal income tax purposes. Also, due to the timing of dividend distributions, the fiscal year in which amounts are distributed may differ from the year that the income or realized gains (losses) were recorded by the Fund.
Distributions and Components of Distributable Earnings – The tax character of distributions paid by the Fund for the periods indicated is as follows (as adjusted for dividends payable, if applicable):
| For the Year Ended October 31, 2014 | For the Year Ended October 31, 2013 | |||||||
| Ordinary Income | $ | 22,169 | $ | 10,807 | ||||
| Long-Term Capital Gains ‡ | 328 | 83 | ||||||
| ‡ | The Fund designates these distributions as long-term capital gain dividends pursuant to IRC Sec. 852(b)(3)(C). |
| 23 |
| The Hartford Floating Rate High Income Fund |
| Notes to Financial Statements – (continued) |
| October 31, 2014 |
| (000’s Omitted) |
As of October 31, 2014, the Fund’s components of distributable earnings (deficit) on a tax basis are as follows:
| Amount | ||||
| Undistributed Ordinary Income | $ | 5,116 | ||
| Undistributed Long-Term Capital Gain | 3,133 | |||
| Unrealized Depreciation* | (11,512 | ) | ||
| Total Accumulated Deficit | $ | (3,263 | ) | |
| * | Differences between book-basis and tax-basis unrealized appreciation (depreciation) may be attributable to the losses deferred due to wash sale adjustments, foreign currency gains and losses, adjustments related to PFICs, REITs, RICs, certain derivatives and partnerships. |
Reclassification of Capital Accounts – The Fund may record reclassifications in its capital accounts. These reclassifications have no impact on the total net assets of the Fund. The reclassifications are a result of permanent differences between U.S. GAAP and tax accounting for such items as foreign currency, PFICs, expiration or utilization of capital loss carryforwards or net operating losses. Adjustments are made to reflect the impact these items have on current and future distributions to shareholders. Therefore, the source of the Fund’s distributions may be shown in the accompanying Statement of Changes in Net Assets as from undistributed net investment income, from accumulated net realized gains on investments or from capital depending on the type of book and tax differences that exist. For the year ended October 31, 2014, the Fund recorded reclassifications to increase (decrease) the accounts listed below:
| Amount | ||||
| Undistributed Net Investment Income (Loss) | $ | 415 | ||
| Accumulated Net Realized Gain (Loss) | (415 | ) | ||
Capital Loss Carryforward – On December 22, 2010, the Regulated Investment Company Modernization Act of 2010 (the “Act”) was enacted, which made changes to the capital loss carryforward rules. The changes are effective for taxable years beginning after the date of enactment. Under the Act, funds are permitted to carry forward capital losses for an unlimited period. Additionally, capital loss carryforwards retain their character as either short-term or long-term capital losses rather than being considered all short-term as permitted under prior regulation.
The Fund had no capital loss carryforward for U.S. federal income tax purposes as of October 31, 2014.
Accounting for Uncertainty in Income Taxes – The Fund has adopted financial reporting rules that require the Fund to analyze all open tax years, as defined by the statute of limitations, for all major jurisdictions. Generally, tax authorities can examine all tax returns filed for the last three years. The Fund does not have an examination in progress.
The Fund has reviewed all open tax years and major jurisdictions and concluded that these financial reporting rules had no effect on the Fund’s financial position or results of operations. There is no tax liability resulting from unrecognized tax benefits relating to uncertain income tax positions taken or expected to be taken on the tax return for the fiscal year ended October 31, 2014. The Fund is also not aware of any tax positions for which it is reasonably possible that the total amounts of unrecognized tax benefits will significantly change in the next twelve months.
Expenses:
Investment Management Agreement – Hartford Funds Management Company, LLC ("HFMC") serves as the Fund’s investment manager pursuant to an Investment Management Agreement with the Company. HFMC is an indirect wholly owned subsidiary of The Hartford Financial Services Group, Inc. ("The Hartford"). The investment manager has overall investment supervisory responsibility for the Fund. In addition, the investment manager provides administrative personnel, services, equipment, facilities and office space for proper operation of the Fund. HFMC has contracted with Wellington Management Company, LLP ("Wellington Management") under a sub-advisory agreement for the provision of day-to-day investment management services to the Fund in accordance with the Fund’s
| 24 |
| The Hartford Floating Rate High Income Fund |
| Notes to Financial Statements – (continued) |
| October 31, 2014 |
| (000’s Omitted) |
investment objective and policies. The Fund pays a fee to the investment manager, a portion of which may be used to compensate Wellington Management.
The schedule below reflects the rates of compensation paid to the investment manager for investment management services rendered as of October 31, 2014; the rates are accrued daily and paid monthly:
| Average Daily Net Assets | Annual Fee |
| On first $500 million | 0.7000% |
| On next $2 billion | 0.6500% |
| On next $2.5 billion | 0.6400% |
| On next $5 billion | 0.6300% |
| Over $10 billion | 0.6200% |
Accounting Services Agreement – Pursuant to the Fund Accounting Agreement between HFMC and the Company, on behalf of the Fund, HFMC provides accounting services to the Fund and receives monthly compensation based on the Fund’s average daily net assets at the rates set forth below. The Fund’s accounting services fees are accrued daily and paid monthly.
| Average Daily Net Assets | Annual Fee |
| On first $5 billion | 0.018% |
| On next $5 billion | 0.014% |
| Over $10 billion | 0.010% |
Operating Expenses – Allocable expenses incurred by the Company are allocated to each Fund and allocated to classes within the Fund in proportion to the average daily net assets of the Fund and each class, except where allocation of certain expenses is more fairly made directly to the Fund or to specific classes within a Fund. As of October 31, 2014, HFMC contractually limited the total operating expenses of this Fund, exclusive of taxes, interest expense, brokerage commissions, acquired fund fees and expenses and extraordinary expenses, through February 28, 2015 as follows:
| Class A | Class C | Class I | Class R3 | Class R4 | Class R5 | Class Y |
| 1.05% | 1.80% | 0.80% | 1.35% | 1.05% | 0.75% | 0.75% |
Distribution and Service Plan for Class A, C, R3 and R4 Shares – Hartford Funds Distributors, LLC ("HFD"), an indirect wholly owned subsidiary of The Hartford, is the principal underwriter and distributor of the Fund. HFD is engaged in distribution activities, which include marketing and distribution of shares through broker/dealers, financing distribution costs and maintaining financial books and records. For the year ended October 31, 2014, HFD received front-end load sales charges of $589 and contingent deferred sales charges of $28 from the Fund.
The Fund has adopted a Distribution and Service Plan in accordance with Rule 12b-1 of the 1940 Act to compensate the distributor (HFD) for activities intended to result in the sale and distribution of Class A, C, R3 and R4 shares and for providing services for shareholders. The Rule 12b-1 plan applicable to Class A shares of the Fund provides for payment of a Rule 12b-1 fee of 0.25% of average daily net assets. Some or all of the fee may be used for shareholder servicing expenses with the remainder used for distribution expenses. Under the Class C Plan, the Fund pays the distributor 1.00% of the average daily net assets of Class C shares outstanding, 0.25% of which is intended as a fee for services provided to existing shareholders with the remainder used for distribution expenses. For Class C shares, some or the entire fee may be remitted to broker/dealers for distribution and/or shareholder account services. Class R3 shares have a distribution fee of 0.50% of average daily net assets and Class R4 shares have a distribution fee of 0.25% of average daily net assets. For Class R3 and R4 shares, some or the entire fee may be remitted to broker/dealers for distribution and/or shareholder account services. The Fund’s 12b-1 fees are accrued daily and paid monthly or at such other intervals as the Board of Directors may determine.
| 25 |
| The Hartford Floating Rate High Income Fund |
| Notes to Financial Statements – (continued) |
| October 31, 2014 |
| (000’s Omitted) |
Other Related Party Transactions – Certain officers of the Fund are directors and/or officers of HFMC and/or The Hartford or its subsidiaries. For the year ended October 31, 2014, a portion of the Fund’s Chief Compliance Officer’s compensation was paid by all of the investment companies in the Hartford fund complex. The portion allocated to the Fund, as represented in other expenses on the Statement of Operations, was in the amount of $1. Hartford Administrative Services Company (“HASCO”), an indirect wholly-owned subsidiary of The Hartford, provides transfer agent services to the Fund. HASCO has contractually agreed to reimburse any portion of the transfer agency fees over 0.30% of average daily net assets per fiscal year for each class. Any transfer agency fee reimbursement is determined before considering the contractual operating expense limitation. For providing such services, HASCO is compensated on a per account basis that varies by account type, except with respect to Class Y, for which it is compensated based on average daily net assets. The amount paid to HASCO and any related contractual reimbursement amounts, if applicable, can be found in the Statement of Operations. These fees are accrued daily and paid monthly.
Administrative services fees are paid to HASCO for third-party recordkeeping services that are payable as a percentage of net assets in the amount of up to 0.20%, 0.15% and 0.10% for Classes R3, R4 and R5 shares, respectively. The total administrative services fees are shown on the Statement of Operations. These fees are accrued daily and paid monthly.
Affiliate Holdings:
As of October 31, 2014, affiliates of The Hartford had ownership of shares in the Fund as follows:
| Percentage of Class | Percentage of Fund | |||||||
| Class R3 | 85 | % | — | %* | ||||
| Class R4 | 82 | — | * | |||||
| Class R5 | 100 | † | — | * | ||||
| Class Y | 85 | 2 | ||||||
| * | Percentage rounds to zero. |
| † | Percentage rounds to 100%. |
Investment Transactions:
For the year ended October 31, 2014, the cost of purchases and proceeds from sales of investment securities (excluding short-term investments) were as follows:
| Excluding U.S. Government Obligations | U.S. Government Obligations | Total | ||||||||||
| Cost of Purchases | $ | 657,771 | $ | — | $ | 657,771 | ||||||
| Sales Proceeds | 496,977 | — | 496,977 | |||||||||
| 26 |
| The Hartford Floating Rate High Income Fund |
| Notes to Financial Statements – (continued) |
| October 31, 2014 |
| (000’s Omitted) |
Capital Share Transactions:
The following information is for the year ended October 31, 2014, and the year ended October 31, 2013:
| For the Year Ended October 31, 2014 | For the Year Ended October 31, 2013 | |||||||||||||||||||||||||||||||
| Shares Sold | Shares
Issued for Reinvested Dividends | Shares Redeemed | Net
Increase (Decrease) of Shares | Shares Sold | Shares
Issued for Reinvested Dividends | Shares Redeemed | Net
Increase (Decrease) of Shares | |||||||||||||||||||||||||
| Class A | ||||||||||||||||||||||||||||||||
| Shares | 15,342 | 835 | (13,334 | ) | 2,843 | 14,447 | 449 | (3,985 | ) | 10,911 | ||||||||||||||||||||||
| Amount | $ | 164,415 | $ | 8,950 | $ | (142,946 | ) | $ | 30,419 | $ | 153,788 | $ | 4,767 | $ | (42,487 | ) | $ | 116,068 | ||||||||||||||
| Class C | ||||||||||||||||||||||||||||||||
| Shares | 6,368 | 381 | (3,855 | ) | 2,894 | 6,752 | 211 | (911 | ) | 6,052 | ||||||||||||||||||||||
| Amount | $ | 68,330 | $ | 4,080 | $ | (41,360 | ) | $ | 31,050 | $ | 71,912 | $ | 2,229 | $ | (9,700 | ) | $ | 64,441 | ||||||||||||||
| Class I | ||||||||||||||||||||||||||||||||
| Shares | 24,435 | 734 | (16,672 | ) | 8,497 | 11,673 | 234 | (2,168 | ) | 9,739 | ||||||||||||||||||||||
| Amount | $ | 262,321 | $ | 7,865 | $ | (178,598 | ) | $ | 91,588 | $ | 124,345 | $ | 2,492 | $ | (23,094 | ) | $ | 103,743 | ||||||||||||||
| Class R3 | ||||||||||||||||||||||||||||||||
| Shares | 26 | 10 | (2 | ) | 34 | 20 | 12 | (5 | ) | 27 | ||||||||||||||||||||||
| Amount | $ | 280 | $ | 109 | $ | (20 | ) | $ | 369 | $ | 212 | $ | 124 | $ | (51 | ) | $ | 285 | ||||||||||||||
| Class R4 | ||||||||||||||||||||||||||||||||
| Shares | 125 | 13 | (99 | ) | 39 | 20 | 12 | (2 | ) | 30 | ||||||||||||||||||||||
| Amount | $ | 1,339 | $ | 141 | $ | (1,068 | ) | $ | 412 | $ | 219 | $ | 131 | $ | (22 | ) | $ | 328 | ||||||||||||||
| Class R5 | ||||||||||||||||||||||||||||||||
| Shares | 71 | 12 | (71 | ) | 12 | 14 | 13 | (14 | ) | 13 | ||||||||||||||||||||||
| Amount | $ | 763 | $ | 123 | $ | (762 | ) | $ | 124 | $ | 148 | $ | 144 | $ | (151 | ) | $ | 141 | ||||||||||||||
| Class Y | ||||||||||||||||||||||||||||||||
| Shares | 372 | 56 | (188 | ) | 240 | 1 | 59 | (1 | ) | 59 | ||||||||||||||||||||||
| Amount | $ | 4,002 | $ | 598 | $ | (2,025 | ) | $ | 2,575 | $ | 7 | $ | 622 | $ | (5 | ) | $ | 624 | ||||||||||||||
| Total | ||||||||||||||||||||||||||||||||
| Shares | 46,739 | 2,041 | (34,221 | ) | 14,559 | 32,927 | 990 | (7,086 | ) | 26,831 | ||||||||||||||||||||||
| Amount | $ | 501,450 | $ | 21,866 | $ | (366,779 | ) | $ | 156,537 | $ | 350,631 | $ | 10,509 | $ | (75,510 | ) | $ | 285,630 | ||||||||||||||
Line of Credit:
The Fund is one of several Hartford Funds that participate in a $500 million committed revolving line of credit facility. The facility is to be used for temporary or emergency purposes. Under the arrangement, the funds are required to own securities having a market value in excess of 300% of the total bank borrowings. The interest rate on borrowings varies depending on the nature of the loan. The facility also requires a fee to be paid based on the amount of the commitment. This commitment fee is allocated to all the funds participating in the line of credit based on the average net assets of the funds. During the year ended October 31, 2014, the Fund did not have any borrowings under this facility.
Pending Legal Proceedings:
On February 25, 2011, Jennifer L. Kasilag, Louis Mellinger, Judith M. Menendez, Jacqueline M. Robinson, and Linda A. Russell filed a derivative lawsuit against Hartford Investment Financial Services, LLC (“HIFSCO”) (now known as HFD) on behalf of six Hartford retail mutual funds in the United States District Court for the District of New Jersey, alleging that HIFSCO received excessive advisory and distribution fees in violation of its statutory fiduciary duty under Section 36(b) of the 1940 Act when serving as investment manager and principal underwriter, respectively, to the Hartford retail mutual funds. Although this action was purportedly filed on behalf of certain of the Hartford Funds, none of the Hartford Funds is itself a defendant to the suit. HIFSCO moved to dismiss and, in September 2011, the motion was granted in part and denied in part, with leave to amend the complaint. In November 2011, plaintiffs filed an amended complaint on behalf of certain Hartford retail mutual funds, The Hartford Global Health Fund (now known as The Hartford Healthcare Fund), The Hartford Conservative Allocation Fund, The Hartford Growth Opportunities Fund, The Hartford Inflation Plus Fund, The Hartford Advisers Fund (now known as The Hartford Balanced Fund), and The Hartford Capital Appreciation Fund. Plaintiffs seek to rescind the investment management agreements and distribution plans between HIFSCO and these funds and to recover the total fees charged thereunder or, in the alternative, to recover any improper compensation HIFSCO received, in addition to lost earnings. HIFSCO filed a partial motion to
| 27 |
| The Hartford Floating Rate High Income Fund |
| Notes to Financial Statements – (continued) |
| October 31, 2014 |
| (000’s Omitted) |
dismiss the amended complaint and, in December 2012, the court dismissed without prejudice the claims regarding distribution fees and denied the motion with respect to the advisory fees claims. HIFSCO disputes the allegations and intends to defend vigorously.
In March 2014, the plaintiffs filed a new complaint that added as new plaintiffs The Hartford Floating Rate Fund and The Hartford Small Company Fund and named as a defendant HFMC, which assumed the role as investment manager to the funds as of January 2013. HFMC and HIFSCO dispute the allegations and intend to defend vigorously.
No accrual for litigation relating to this matter has been recorded in the financial statements of the Fund because the Fund is not party to the suit.
Indemnifications:
Under the Company's organizational documents, the Company shall indemnify its officers and directors to the full extent required or permitted under Maryland General Corporation Law and the federal securities laws. In addition, the Company, on behalf of the Fund, may enter into contracts that contain a variety of indemnifications. The Company's maximum exposure under these arrangements is unknown. However, as of the date of these financial statements, the Company has not had prior claims or losses pursuant to these contracts and expects the risk of loss to be remote.
Subsequent Event:
Effective December 1, 2014, pursuant to a sub-transfer agency agreement between HASCO and Boston Financial Data Services, Inc. (“BFDS”), HASCO has delegated certain transfer agent, dividend disbursing agent and shareholder servicing agent functions to BFDS. The costs and expenses of such delegation are borne by HASCO, not by the Fund.
| 28 |
| The Hartford Floating Rate High Income Fund |
| Financial Highlights |
| - Selected Per-Share Data - (A) | - Ratios and Supplemental Data - | |||||||||||||||||||||||||||||||||||||||||||||||||||
| Class | Net
Asset Value at Beginning of Period | Net Investment Income (Loss) | Net Realized and Unrealized Gain (Loss) on Invest- ments | Total
from Investment Operations | Dividends from Net Investment Income | Distribu- tions from Realized Capital Gains | Total Dividends and Distributions | Net Asset Value at End of Period | Total Return(B) | Net Assets at End of Period (000's) | Ratio
of Expenses to Average Net Assets Before Adjust- ments(C) | Ratio
of Expenses to Average Net Assets After Adjust- ments(C) | Ratio
of Net Investment Income (Loss) to Average Net Assets | |||||||||||||||||||||||||||||||||||||||
| For the Year Ended October 31, 2014 | ||||||||||||||||||||||||||||||||||||||||||||||||||||
| A | $ | 10.70 | $ | 0.47 | $ | (0.13 | ) | $ | 0.34 | $ | (0.47 | ) | $ | (0.03 | ) | $ | (0.50 | ) | $ | 10.54 | 3.23 | % | $ | 191,162 | 1.10 | % | 1.05 | % | 4.35 | % | ||||||||||||||||||||||
| C | 10.70 | 0.39 | (0.13 | ) | 0.26 | (0.39 | ) | (0.03 | ) | (0.42 | ) | 10.54 | 2.47 | 118,465 | 1.87 | 1.80 | 3.61 | |||||||||||||||||||||||||||||||||||
| I | 10.71 | 0.50 | (0.14 | ) | 0.36 | (0.49 | ) | (0.03 | ) | (0.52 | ) | 10.55 | 3.49 | 207,458 | 0.84 | 0.80 | 4.62 | |||||||||||||||||||||||||||||||||||
| R3 | 10.68 | 0.43 | (0.13 | ) | 0.30 | (0.43 | ) | (0.03 | ) | (0.46 | ) | 10.52 | 2.93 | 2,886 | 1.48 | 1.35 | 4.06 | |||||||||||||||||||||||||||||||||||
| R4 | 10.68 | 0.47 | (0.13 | ) | 0.34 | (0.47 | ) | (0.03 | ) | (0.50 | ) | 10.52 | 3.24 | 3,015 | 1.18 | 1.05 | 4.35 | |||||||||||||||||||||||||||||||||||
| R5 | 10.68 | 0.50 | (0.13 | ) | 0.37 | (0.50 | ) | (0.03 | ) | (0.53 | ) | 10.52 | 3.45 | 2,515 | 0.88 | 0.75 | 4.65 | |||||||||||||||||||||||||||||||||||
| Y | 10.68 | 0.50 | (0.13 | ) | 0.37 | (0.50 | ) | (0.03 | ) | (0.53 | ) | 10.52 | 3.55 | 13,269 | 0.78 | 0.75 | 4.66 | |||||||||||||||||||||||||||||||||||
| For the Year Ended October 31, 2013 | ||||||||||||||||||||||||||||||||||||||||||||||||||||
| A | $ | 10.60 | $ | 0.48 | $ | 0.22 | $ | 0.70 | $ | (0.50 | ) | $ | (0.10 | ) | $ | (0.60 | ) | $ | 10.70 | 6.78 | % | $ | 163,631 | 1.13 | % | 1.05 | % | 4.53 | % | |||||||||||||||||||||||
| C | 10.60 | 0.40 | 0.22 | 0.62 | (0.42 | ) | (0.10 | ) | (0.52 | ) | 10.70 | 5.98 | 89,287 | 1.88 | 1.80 | 3.78 | ||||||||||||||||||||||||||||||||||||
| I | 10.60 | 0.50 | 0.23 | 0.73 | (0.52 | ) | (0.10 | ) | (0.62 | ) | 10.71 | 7.15 | 119,549 | 0.84 | 0.80 | 4.73 | ||||||||||||||||||||||||||||||||||||
| R3 | 10.58 | 0.46 | 0.21 | 0.67 | (0.47 | ) | (0.10 | ) | (0.57 | ) | 10.68 | 6.47 | 2,560 | 1.50 | 1.35 | 4.32 | ||||||||||||||||||||||||||||||||||||
| R4 | 10.58 | 0.49 | 0.21 | 0.70 | (0.50 | ) | (0.10 | ) | (0.60 | ) | 10.68 | 6.79 | 2,642 | 1.19 | 1.05 | 4.62 | ||||||||||||||||||||||||||||||||||||
| R5 | 10.58 | 0.52 | 0.21 | 0.73 | (0.53 | ) | (0.10 | ) | (0.63 | ) | 10.68 | 7.11 | 2,427 | 0.89 | 0.75 | 4.93 | ||||||||||||||||||||||||||||||||||||
| Y | 10.58 | 0.52 | 0.21 | 0.73 | (0.53 | ) | (0.10 | ) | (0.63 | ) | 10.68 | 7.11 | 10,907 | 0.80 | 0.75 | 4.92 | ||||||||||||||||||||||||||||||||||||
| For the Year Ended October 31, 2012 | ||||||||||||||||||||||||||||||||||||||||||||||||||||
| A | $ | 10.20 | $ | 0.62 | $ | 0.42 | $ | 1.04 | $ | (0.64 | ) | $ | – | $ | (0.64 | ) | $ | 10.60 | 10.54 | % | $ | 46,387 | 1.31 | % | 1.04 | % | 5.93 | % | ||||||||||||||||||||||||
| C | 10.20 | 0.54 | 0.42 | 0.96 | (0.56 | ) | – | (0.56 | ) | 10.60 | 9.70 | 24,263 | 2.05 | 1.78 | 5.18 | |||||||||||||||||||||||||||||||||||||
| I | 10.20 | 0.65 | 0.42 | 1.07 | (0.67 | ) | – | (0.67 | ) | 10.60 | 10.80 | 15,072 | 1.05 | 0.78 | 6.23 | |||||||||||||||||||||||||||||||||||||
| R3 | 10.20 | 0.61 | 0.38 | 0.99 | (0.61 | ) | – | (0.61 | ) | 10.58 | 9.98 | 2,252 | 1.72 | 1.35 | 5.85 | |||||||||||||||||||||||||||||||||||||
| R4 | 10.20 | 0.64 | 0.38 | 1.02 | (0.64 | ) | – | (0.64 | ) | 10.58 | 10.31 | 2,292 | 1.42 | 1.05 | 6.15 | |||||||||||||||||||||||||||||||||||||
| R5 | 10.20 | 0.67 | 0.38 | 1.05 | (0.67 | ) | – | (0.67 | ) | 10.58 | 10.64 | 2,264 | 1.12 | 0.75 | 6.45 | |||||||||||||||||||||||||||||||||||||
| Y | 10.20 | 0.67 | 0.38 | 1.05 | (0.67 | ) | – | (0.67 | ) | 10.58 | 10.64 | 10,181 | 1.02 | 0.75 | 6.45 | |||||||||||||||||||||||||||||||||||||
| From September 30, 2011 (commencement of operations), through October 31, 2011 | ||||||||||||||||||||||||||||||||||||||||||||||||||||
| A(D) | $ | 10.00 | $ | 0.03 | $ | 0.20 | $ | 0.23 | $ | (0.03 | ) | $ | – | $ | (0.03 | ) | $ | 10.20 | 2.25 | %(E) | $ | 6,855 | 1.29 | %(F) | 1.00 | %(F) | 4.72 | %(F) | ||||||||||||||||||||||||
| C(D) | 10.00 | 0.03 | 0.19 | 0.22 | (0.02 | ) | – | (0.02 | ) | 10.20 | 2.19 | (E) | 3,101 | 2.07 | (F) | 1.78 | (F) | 4.21 | (F) | |||||||||||||||||||||||||||||||||
| I(D) | 10.00 | 0.04 | 0.19 | 0.23 | (0.03 | ) | – | (0.03 | ) | 10.20 | 2.28 | (E) | 2,611 | 1.05 | (F) | 0.76 | (F) | 5.10 | (F) | |||||||||||||||||||||||||||||||||
| R3(D) | 10.00 | 0.03 | 0.19 | 0.22 | (0.02 | ) | – | (0.02 | ) | 10.20 | 2.22 | (E) | 2,044 | 1.74 | (F) | 1.35 | (F) | 4.25 | (F) | |||||||||||||||||||||||||||||||||
| R4(D) | 10.00 | 0.03 | 0.20 | 0.23 | (0.03 | ) | – | (0.03 | ) | 10.20 | 2.25 | (E) | 2,044 | 1.44 | (F) | 1.05 | (F) | 4.55 | (F) | |||||||||||||||||||||||||||||||||
| R5(D) | 10.00 | 0.04 | 0.19 | 0.23 | (0.03 | ) | – | (0.03 | ) | 10.20 | 2.28 | (E) | 2,045 | 1.14 | (F) | 0.75 | (F) | 4.85 | (F) | |||||||||||||||||||||||||||||||||
| Y(D) | 10.00 | 0.04 | 0.19 | 0.23 | (0.03 | ) | – | (0.03 | ) | 10.20 | 2.27 | (E) | 9,195 | 1.04 | (F) | 0.75 | (F) | 4.85 | (F) | |||||||||||||||||||||||||||||||||
See Portfolio Turnover information on the next page.
| 29 |
| The Hartford Floating Rate High Income Fund |
| Financial Highlights – (continued) |
| (A) | Information presented relates to a share outstanding throughout the indicated period. Net investment income (loss) per share amounts are calculated based on average shares outstanding unless otherwise noted. |
| (B) | Assumes initial investment at net asset value at the beginning of each period, reinvestment of all distributions, the complete redemption of the investment at net asset value at the end of each period and no sales charge. Total return would be reduced if sales charges were taken into account. |
| (C) | Adjustments include waivers and reimbursements, if applicable. |
| (D) | Commenced operations on September 30, 2011. |
| (E) | Not annualized. |
| (F) | Annualized. |
| Portfolio Turnover Rate for All Share Classes | ||||
| For the Year Ended October 31, 2014 | 100 | % | ||
| For the Year Ended October 31, 2013 | 59 | |||
| For the Year Ended October 31, 2012 | 67 | |||
| From September 30, 2011 (commencement of operations) through October 31, 2011 | – | (A) | ||
| (A) | Not annualized. |
| 30 |
| Report of Independent Registered Public Accounting Firm |
The Board of Directors and Shareholders of The Hartford Mutual Funds, Inc. |
We have audited the accompanying statement of assets and liabilities, including the schedule of investments, of The Hartford Floating Rate High Income Fund (one of the portfolios constituting The Hartford Mutual Funds, Inc. (the Funds)) as of October 31, 2014, and the related statement of operations for the year then ended, the statements of changes in net assets for each of the two years in the period then ended, and the financial highlights for the periods indicated therein. These financial statements and financial highlights are the responsibility of the Funds’ management. Our responsibility is to express an opinion on these financial statements and financial highlights based on our audits.
We conducted our audits in accordance with the standards of the Public Company Accounting Oversight Board (United States). Those standards require that we plan and perform the audit to obtain reasonable assurance about whether the financial statements and financial highlights are free of material misstatement. We were not engaged to perform an audit of the Funds’ internal control over financial reporting. Our audits included consideration of internal control over financial reporting as a basis for designing audit procedures that are appropriate in the circumstances, but not for the purpose of expressing an opinion on the effectiveness of the Funds’ internal control over financial reporting. Accordingly, we express no such opinion. An audit also includes examining, on a test basis, evidence supporting the amounts and disclosures in the financial statements and financial highlights, assessing the accounting principles used and significant estimates made by management, and evaluating the overall financial statement presentation. Our procedures included confirmation of securities owned as of October 31, 2014, by correspondence with the custodian, agent banks and brokers or by other appropriate auditing procedures where replies from agent banks and brokers were not received. We believe that our audits provide a reasonable basis for our opinion.
In our opinion, the financial statements and financial highlights referred to above present fairly, in all material respects, the financial position of The Hartford Floating Rate High Income Fund of The Hartford Mutual Funds, Inc. at October 31, 2014, the results of its operations for the year then ended, the changes in its net assets for each of the two years in the period then ended, and the financial highlights for the periods indicated therein, in conformity with U.S. generally accepted accounting principles.
|
Minneapolis, Minnesota
December 18, 2014
| 31 |
| The Hartford Floating Rate High Income Fund |
| Directors and Officers (Unaudited) |
The Board of Directors of the Company (the "Directors") appoints officers who are responsible for the day-to-day operations of the Fund and who execute policies formulated by the Directors. Each Director serves until his or her death, resignation, or retirement or until the next annual meeting of shareholders is held or until his or her successor is elected and qualifies.
Directors and officers who are employed by or who have a financial interest in The Hartford Financial Services Group, Inc. ("The Hartford") are considered “interested” persons of the Fund pursuant to the 1940 Act. Each officer and two of the Company's Directors, as noted in the chart below, are “interested” persons of the Fund. Each Director serves as a director for The Hartford Mutual Funds, Inc., The Hartford Mutual Funds II, Inc., Hartford Series Fund, Inc., and Hartford HLS Series Fund II, Inc., and as a trustee for The Hartford Alternative Strategies Fund, which, as of October 31, 2014, collectively consist of 66 funds. Correspondence may be sent to Directors and officers c/o Hartford Funds, 5 Radnor Corporate Center, Suite 300, 100 Matsonford Road, Radnor, Pennsylvania 19087, except that correspondence to Mr. Annoni, Mr. Dressen and Ms. Quade may be sent to 500 Bielenberg Drive, Suite 500, Woodbury, Minnesota 55125.
The table below sets forth, for each Director and officer, his or her name, year of birth, current position with the Company and date first elected or appointed to The Hartford Mutual Funds, Inc. ("MF") and The Hartford Mutual Funds II, Inc. ("MF2"), principal occupation, and, for Directors, other directorships held. The Fund’s Statement of Additional Information contains further information on the Directors and is available free of charge by calling 1-888-843-7824 or writing to: Hartford Funds, P.O. Box 55022, Boston, MA 02205-5022.
Information on the aggregate remuneration paid to the directors of the Company can be found in the Statement of Operations herein. The Fund pays to The Hartford a portion of the Chief Compliance Officer’s compensation, but does not pay salaries or compensation to any of its other officers or Directors who are employed by The Hartford.
Non-Interested Directors
Hilary E. Ackermann (1956) Director since September 23, 2014
Ms. Ackermann served as Chief Risk Officer at Goldman Sachs Bank USA from October 2008 to November 2011 and serves as a Director of Dynegy, Inc., an independent power company, from October 2012 to present.
Lynn S. Birdsong (1946) Director since 2003, Chairman of the Investment Committee since 2014
Mr. Birdsong is a private investor. Mr. Birdsong currently serves as a Director of the Sovereign High Yield Investment Company (April 2010 to current). Mr. Birdsong currently serves as an Independent Director of Nomura Partners Funds, Inc. (formerly, The Japan Fund) (April 2003 to current). From 2003 to March 2005, Mr. Birdsong was an Independent Director of the Atlantic Whitehall Funds. From 1979 to 2002, Mr. Birdsong was a Managing Director of Zurich Scudder Investments, an investment management firm. During his employment with Scudder, Mr. Birdsong was an Interested Director of The Japan Fund. From January 1981 through December 2013, Mr. Birdsong was a partner in Birdsong Company, an advertising specialty firm.
Robert M. Gavin, Jr. (1940) Director since 2002 (MF) and 1986 (MF2), Chairman of the Board for each since 2004
Dr. Gavin is an educational consultant. Prior to September 1, 2001, he was President of Cranbrook Education Community and prior to July 1996, he was President of Macalester College, St. Paul, Minnesota.
Duane E. Hill (1945) Director since 2001 (MF) and 2002 (MF2), Chairman of the Nominating Committee since 2003
Mr. Hill is a Partner of TSG Ventures L.P., a private equity investment company. Mr. Hill is a former partner of TSG Capital Group, a private equity investment firm that served as sponsor and lead investor in leveraged buyouts of middle market companies.
Sandra S. Jaffee (1941) Director since 2005
Ms. Jaffee is the founder and Chief Executive Officer of a private company, Homeworks Concierge, LLC, which provides residential property management services in Westchester County, New York (January 2012 to present). Ms. Jaffee served as Chairman (2008 to 2009) and Chief Executive Officer of Fortent (formerly Searchspace Group), a leading provider of compliance/regulatory technology to financial institutions from August 2005 to August 2009. From August 2004 to August 2005, Ms. Jaffee served as an Entrepreneur in Residence with Warburg Pincus, a private equity firm. Prior to joining Warburg Pincus, Ms. Jaffee served as Executive Vice President at Citigroup, from September 1995 to July 2004, where she was President and Chief Executive Officer of Citibank’s Global Securities Services (1995 to 2003). Ms. Jaffee currently serves as a member of the Board of Directors of Broadridge Financial Solutions as well as a Trustee of Muhlenberg College.
| 32 |
| The Hartford Floating Rate High Income Fund |
| Directors and Officers (Unaudited) – (continued) |
William P. Johnston (1944) Director since 2005, Chairman of the Compliance Committee since 2005
In June 2006, Mr. Johnston was appointed as Senior Advisor to The Carlyle Group, a global private equity and other alternative asset investment firm and currently serves as an Operating Executive. In July 2006, Mr. Johnston was elected to the Board of Directors of MultiPlan, Inc. and served as a Director (July 2006 to August 2010). In August 2007, Mr. Johnston was elected to the Board of Directors of LifeCare Holdings, Inc. and served as a Director (August 2007 to June 2013). In February 2008, Mr. Johnston was elected to the Board of Directors of HCR-ManorCare, Inc. In May 2006, Mr. Johnston was elected to the Supervisory Board of Fresenius Medical Care AG & Co. KGaA, after its acquisition of Renal Care Group, Inc. in March 2006. Mr. Johnston joined Renal Care Group in November 2002 as a member of the Board of Directors and served as Chairman of the Board from March 2003 through March 2006. From 2002 through 2013, Mr. Johnston served as a Board member of the Georgia O’Keefe Museum. From September 1987 to December 2002, Mr. Johnston was with Equitable Securities Corporation (and its successors, SunTrust Equitable Securities and SunTrust Robinson Humphrey) serving in various investment banking and managerial positions, including Managing Director and Head of Investment Banking, Chief Executive Officer and Vice Chairman.
Phillip O. Peterson (1944) Director since 2002 (MF) and 2000 (MF2), Chairman of the Audit Committee since 2002
Mr. Peterson is a mutual fund industry consultant. He was a partner of KPMG LLP (an accounting firm) until July 1999. Mr. Peterson joined William Blair Funds in February 2007 as a member of the Board of Trustees. From February 2012 to February 2014, Mr. Peterson served as a Trustee of Symetra Variable Mutual Funds. From January 2004 to April 2005, Mr. Peterson served as Independent President of the Strong Mutual Funds.
Lemma W. Senbet (1946) Director since 2005
Dr. Senbet is the William E. Mayer Chair Professor of Finance and Founding Director, Center for Financial Policy, at the University of Maryland, Robert H. Smith School of Business. He was chair of the Finance Department of the University of Maryland, Robert H. Smith School of Business from 1998 to 2006. Since June 2013, he has been on leave from the University to serve as Executive Director of African Economic Research Consortium which focuses on economic policy research and training. Previously, he was a chaired professor of finance at the University of Wisconsin-Madison. Also, he was a Director of the Fortis Funds from March 2000 to July 2002. Dr. Senbet served as Director of the American Finance Association and President of the Western Finance Association. In 2006, Dr. Senbet was inducted Fellow of Financial Management Association International for his career-long distinguished scholarship and professional service.
Interested Directors and Officers
James E. Davey (1964) Director since 2012, President and Chief Executive Officer since 2010
Mr. Davey serves as Executive Vice President of Hartford Life Insurance Company (“HLIC”) and The Hartford. Additionally, Mr. Davey serves as Chairman of the Board, Manager and Senior Managing Director of Hartford Funds Distributors, LLC (“HFD”). He also currently serves as Director, Chairman of the Board, President and Senior Managing Director of Hartford Administrative Services Company (“HASCO”). Mr. Davey also serves as Manager, Chairman of the Board and Senior Managing Director for Hartford Funds Management Company, LLC (“HFMC”) and Director, Chairman of the Board and Senior Managing Director for Hartford Funds Management Group, Inc. ("HFMG"). Mr. Davey has served in various positions within The Hartford and its subsidiaries in connection with the operation of the Hartford Funds. Mr. Davey joined The Hartford in 2002.
Lowndes A. Smith* (1939) Director since 1996 (MF) and 2002 (MF2)
Mr. Smith served as Vice Chairman of The Hartford from February 1997 to January 2002, as President and Chief Executive Officer of Hartford Life, Inc. from February 1997 to January 2002, and as President and Chief Operating Officer of The Hartford Life Insurance Companies from January 1989 to January 2002. Mr. Smith serves as a Director of White Mountains Insurance Group Ltd. (October 2003 to current); One Beacon Insurance (October 2006 to current); Symetra Financial (August 2007 to current) and is a Managing Director of Whittington Gray Associates (January 2007 to current).
* Mr. Smith resigned as a Director of MF, MF2, Hartford Series Fund, Inc. and Hartford HLS Series Fund II, Inc. and as a Trustee of The Hartford Alternative Strategies Fund effective September 17, 2014.
Other Officers
Mark A. Annoni (1964) Vice President, Controller and Treasurer since 2012
Mr. Annoni currently serves as the Assistant Vice President of HLIC (February 2004 to present) and Senior Vice President of HFMG (December 2013 to present). Mr. Annoni has served in various positions within The Hartford and its subsidiaries in connection with the operation of the Hartford Funds. Mr. Annoni joined The Hartford in 2001.
| 33 |
| The Hartford Floating Rate High Income Fund |
| Directors and Officers (Unaudited) – (continued) |
Michael R. Dressen (1963) AML Compliance Officer since 2011
Mr. Dressen currently serves as Assistant Vice President of HLIC. He also serves as Chief Compliance Officer and AML Compliance Officer of HASCO and as AML Officer of HFD. Mr. Dressen has served in various positions within The Hartford and its subsidiaries in connection with the operation of the Hartford Funds.
Edward P. Macdonald (1967) Vice President, Secretary and Chief Legal Officer since 2005
Mr. Macdonald currently serves as Assistant Secretary, Executive Vice President and Deputy General Counsel of HFD, HASCO, HFMC and HFMG. He also serves as Vice President of HLIC. Mr. Macdonald has served in various positions within The Hartford and its subsidiaries in connection with the operation of the Hartford Funds. Mr. Macdonald joined The Hartford in 2005.
Joseph G. Melcher (1973) Vice President and Chief Compliance Officer since 2013
Mr. Melcher currently serves as Executive Vice President of HFD, HFMG and HASCO. Mr. Melcher also currently serves as Executive Vice President and Chief Compliance Officer of HFMC. Mr. Melcher has served in various positions within The Hartford and its subsidiaries in connection with the operation of the Hartford Funds since joining The Hartford in 2012. Prior to joining The Hartford, Mr. Melcher worked at Touchstone Investments, a member of the Western & Southern Financial Group, where he held the position of Vice President and Chief Compliance Officer from 2010 through 2012 and Assistant Vice President, Compliance from 2005 to 2010.
Vernon J. Meyer (1964) Vice President since 2006
Mr. Meyer currently serves as Senior Vice President of HLIC. He also currently serves as Managing Director and Chief Investment Officer of HFMC and Managing Director of HFMG. Mr. Meyer has served in various positions within The Hartford and its subsidiaries in connection with the operation of the Hartford Funds. Mr. Meyer joined The Hartford in 2004.
Laura S. Quade (1969) Vice President since 2012
Ms. Quade currently serves as Vice President of HASCO, HFD and HFMG. She is the Head of Operations of HASCO and formerly served as Director, Enterprise Operations of HLIC. Ms. Quade has served in various positions within The Hartford and its subsidiaries in connection with the operation of the Hartford Funds. Ms. Quade joined The Hartford in 2001.
Martin A. Swanson** (1962) Vice President since 2010
Mr. Swanson currently serves as Vice President of HLIC. Mr. Swanson also serves as Managing Director, Chief Marketing Officer and Principal of HFD and Managing Director of HFMG. Mr. Swanson has served in various positions within The Hartford and its subsidiaries in connection with the operation of the Hartford Funds.
** Mr. Swanson resigned as an officer effective November 6, 2014.
HOW TO OBTAIN A COPY OF THE FUND’S PROXY VOTING POLICIES AND VOTING RECORDS (UNAUDITED)
A description of the policies and procedures that the Fund uses to determine how to vote proxies relating to portfolio securities and information about how the Fund voted proxies relating to portfolio securities during the most recent twelve-month period ended June 30 are available (1) without charge, upon request, by calling 888-843-7824 and (2) on the SEC’s website at http://www.sec.gov.
QUARTERLY PORTFOLIO HOLDINGS INFORMATION (UNAUDITED)
The Fund files a complete schedule of portfolio holdings with the SEC for the first and third quarters of each fiscal year on Form N-Q. The Fund’s Forms N-Q are available (1) without charge, upon request, by calling 888-843-7824 and (2) on the SEC’s website at http://www.sec.gov. The Form N-Q may be reviewed and copied at the SEC’s Public Reference Room in Washington, DC. Information on the operation of the Public Reference Room may be obtained by calling 1-800-SEC-0330.
| 34 |
| The Hartford Floating Rate High Income Fund |
| Federal Tax Information (Unaudited) |
For the fiscal year ended October 31, 2014, there is no further federal tax information required for this Fund.
| 35 |
| The Hartford Floating Rate High Income Fund |
| Expense Example (Unaudited) |
Your Fund's Expenses
As a shareholder of the Fund, you incur two types of costs: (1) transaction costs, including sales charges (loads) on purchase payments, if any, and contingent deferred sales charges (CDSC), if any, and (2) ongoing costs, including investment management fees, distribution and/or service (12b-1) fees, if any, and other fund expenses. This example is intended to help you understand your ongoing costs (in dollars) of investing in the Fund and to compare these costs with the ongoing costs of investing in other mutual funds. The example is based on an investment of $1,000 invested at the beginning of the period and held for the entire period of April 30, 2014 through October 31, 2014.
Actual Expenses
The first set of columns of the table below provides information about actual account values and actual expenses. You may use the information in this column, together with the amount you invested, to estimate the expenses that you paid over the period. Simply divide your account value by $1,000 (for example, an $8,600 account value divided by $1,000 = 8.6), then multiply the result by the number in the line under the heading entitled “Expenses Paid During Period” to estimate the expenses you paid on your account during this period.
Hypothetical Example for Comparison Purposes
The second set of columns of the table below provides information about hypothetical account values and hypothetical expenses based on the Fund's actual expense ratio and an assumed rate of return of 5% per year before expenses, which is not the Fund's actual return. The hypothetical account values and expenses may not be used to estimate the actual ending account balance or expenses you paid for the period. You may use this information to compare the ongoing costs of investing in the Fund and other funds. To do so, compare this 5% hypothetical example with the 5% hypothetical examples that appear in the shareholder reports of the other funds.
Please note that the expenses shown in the table are meant to highlight your ongoing costs only and do not reflect any transactional costs, such as sales charges (loads) and CDSC. Therefore, the second set of columns of the table is useful in comparing ongoing costs only, and will not help you determine the relative total costs of owning different funds. In addition, if these transactional costs were included, your costs would be higher. Expenses are equal to the Fund's annualized expense ratios multiplied by average account value over the period, multiplied by 184/365 (to reflect the one-half year period).
| Actual return | Hypothetical (5% return before expenses) | |||||||||||||||||||||||||||||||
| Beginning Account Value April 30, 2014 | Ending
Account Value October 31, 2014 | Expenses
paid during the period April 30, 2014 through October 31, 2014 | Beginning Account Value April 30, 2014 | Ending
Account Value October 31, 2014 | Expenses
paid during the period April 30, 2014 through October 31, 2014 | Annualized expense ratio | Days in the current 1/2 year | Days in the full year | ||||||||||||||||||||||||
| Class A | $ | 1,000.00 | $ | 1,003.90 | $ | 5.30 | $ | 1,000.00 | $ | 1,019.91 | $ | 5.35 | 1.05 | % | 184 | 365 | ||||||||||||||||
| Class C | $ | 1,000.00 | $ | 1,000.10 | $ | 9.07 | $ | 1,000.00 | $ | 1,016.13 | $ | 9.15 | 1.80 | 184 | 365 | |||||||||||||||||
| Class I | $ | 1,000.00 | $ | 1,005.10 | $ | 4.04 | $ | 1,000.00 | $ | 1,021.17 | $ | 4.08 | 0.80 | 184 | 365 | |||||||||||||||||
| Class R3 | $ | 1,000.00 | $ | 1,002.40 | $ | 6.81 | $ | 1,000.00 | $ | 1,018.40 | $ | 6.87 | 1.35 | 184 | 365 | |||||||||||||||||
| Class R4 | $ | 1,000.00 | $ | 1,003.90 | $ | 5.30 | $ | 1,000.00 | $ | 1,019.91 | $ | 5.35 | 1.05 | 184 | 365 | |||||||||||||||||
| Class R5 | $ | 1,000.00 | $ | 1,004.40 | $ | 3.79 | $ | 1,000.00 | $ | 1,021.43 | $ | 3.82 | 0.75 | 184 | 365 | |||||||||||||||||
| Class Y | $ | 1,000.00 | $ | 1,005.40 | $ | 3.79 | $ | 1,000.00 | $ | 1,021.43 | $ | 3.82 | 0.75 | 184 | 365 | |||||||||||||||||
| 36 |
| The Hartford Floating Rate High Income Fund |
| Approval of Investment Management and Investment Sub-Advisory Agreements (Unaudited) |
Section 15(c) of the Investment Company Act of 1940, as amended (the “1940 Act”), requires that each mutual fund’s board of directors, including a majority of those directors who are not “interested persons” of the mutual fund, as defined in the 1940 Act (the “Independent Directors”), annually review and consider the continuation of the mutual fund’s investment advisory and sub-advisory agreements. At its meeting held on August 5-6, 2014, the Board of Directors (the “Board”) of The Hartford Mutual Funds, Inc., including each of the Independent Directors, unanimously voted to approve the continuation of the investment management agreement for The Hartford Floating Rate High Income Fund (the “Fund”) with Hartford Funds Management Company, LLC (“HFMC”) and the continuation of the investment sub-advisory agreement between HFMC and the Fund’s sub-adviser, Wellington Management Company, LLP (the “Sub-adviser,” and together with HFMC, the “Advisers”) (collectively, the “Agreements”).
In the months preceding the August 5-6, 2014 meeting, the Board requested, received and reviewed written responses from the Advisers to questions posed to them on behalf of the Independent Directors and supporting materials relating to those questions and responses. The Board considered information furnished to the Board at its meetings throughout the year, as well as information specifically prepared in connection with the annual approval of the Agreements at the Board’s meetings held on June 17-18, 2014 and August 5-6, 2014. Information provided to the Board at its meetings throughout the year included, among other things, reports on Fund performance, legal and compliance matters, sales and marketing activity, shareholder services, and the other services provided to the Fund by the Advisers and their affiliates. The Board also received in-person presentations by Fund officers and representatives of HFMC at the Board’s meetings on June 17-18, 2014 and August 5-6, 2014 concerning the Agreements.
The Independent Directors, advised by independent legal counsel, engaged service providers to assist them with evaluating the Agreements with respect to the Fund. Lipper Inc. (“Lipper”), an independent provider of investment company data, was retained to provide the Board with reports on how the Fund’s contractual management fees, actual management fees, other non-management fees, overall expense ratios and investment performance compared to those of mutual funds with similar investment objectives. The Independent Directors also engaged an independent financial services consultant (the “Consultant”) to assist them in evaluating the Fund’s management fees, sub-advisory fees, other non-management fees, overall expense ratios and investment performance. In addition, the Consultant reviewed the profitability calculations utilized by HFMC in connection with the continuation of the investment management agreement.
In determining whether to continue the Agreements for the Fund, the members of the Board reviewed and evaluated information and factors they believed to be relevant and appropriate in light of the information that the Board deemed necessary and appropriate through the exercise of its reasonable business judgment. While individual members of the Board may have weighed certain factors differently, the Board’s determination to continue the Agreements was based on a comprehensive consideration of all information provided to the Board throughout the year and specifically with respect to the continuation of the Agreements. A more detailed discussion of the factors the Board considered with respect to its approval of the Agreements is provided below.
Nature, Extent and Quality of Services Provided by the Advisers
The Board requested and considered information concerning the nature, extent and quality of the services provided to the Fund by the Advisers. The Board considered, among other things, the terms of the Agreements and the range of services provided by the Advisers. The Board considered the Advisers’ professional personnel who provide services to the Fund, including each Adviser’s ability and experience in attracting and retaining qualified personnel to service the Fund. The Board considered each Adviser’s reputation and overall financial strength, as well as its willingness to consider and implement organizational and operational changes designed to enhance services to the Hartford Funds. In addition, the Board considered the quality of each Adviser’s communications with the Board and responsiveness to Board inquiries and requests made from time to time with respect to the Fund and other Hartford Funds.
The Board also requested and evaluated information concerning each Adviser’s regulatory and compliance environment. In this regard, the Board requested and reviewed information on each Adviser’s compliance policies and procedures, compliance history, and a report from the Fund’s Chief Compliance Officer on each Adviser’s compliance with applicable laws and regulations, including responses to regulatory developments and compliance issues raised by regulators. The Board also noted the Advisers’ support of the Fund’s compliance control structure, particularly the resources devoted by the Advisers in support of the Fund’s obligations pursuant to Rule 38a-1 under the 1940 Act.
With respect to HFMC, the Board noted that, under the Agreements, HFMC is responsible for the management of the Fund, including oversight of fund operations and service providers, and provides administrative and investment advisory services in connection with selecting, monitoring and supervising the Sub-adviser. The Board considered HFMC’s ongoing monitoring of people, process and performance, including its quarterly reviews of each of the Hartford Funds, semi-annual meetings with the leaders of each Fund’s portfolio management team, and oversight of the Hartford Funds’ approximately 66 portfolio managers. The Board recognized that HFMC has demonstrated a record of making changes to the
| 37 |
| The Hartford Floating Rate High Income Fund |
| Approval of Investment Management and Investment Sub-Advisory Agreements (Unaudited) – (continued) |
management and/or strategies of the Hartford Funds when warranted. The Board considered HFMC’s oversight of the Sub-adviser’s investment approach and results, process for monitoring best execution of portfolio trades by the Sub-adviser, and approach to risk management with respect to the Fund and the service providers to the Fund. The Board also considered HFMC’s oversight of compliance with the Fund’s objective and policies as well as with applicable laws and regulations, noting that regulatory and other developments had over time led to an increase in the scope of HFMC’s services in this regard.
In addition, the Board considered HFMC’s ongoing commitment to review and rationalize the Hartford Funds product line-up and the expenses that HFMC had incurred in connection with fund combinations in recent years. The Board considered that HFMC or its affiliates are responsible for providing the Fund’s officers.
With respect to the Sub-adviser, which provides certain day-to-day portfolio management services for the Fund, the Board considered the quality of the Fund’s portfolio manager, the Sub-adviser’s other investment personnel, its investment philosophy and process, investment research capabilities and resources, performance record, trade execution capabilities and experience. The Board considered the experience of the Fund’s portfolio manager, the number of accounts managed by the portfolio manager, and the Sub-adviser’s method for compensating the portfolio manager.
Based on these considerations, the Board concluded that it was satisfied with the nature, extent and quality of the services provided to the Fund by HFMC and the Sub-adviser.
Performance of the Fund and the Advisers
The Board considered the investment performance of the Fund. In this regard, the Board reviewed the performance of the Fund over different time periods presented in the materials and evaluated HFMC’s analysis of the Fund’s performance for these time periods. The Board considered information and materials provided to the Board by the Advisers concerning Fund performance, as well as information from Lipper comparing the investment performance of the Fund to an appropriate benchmark and universe of peer funds. The Board noted that the Fund’s performance was in the 1st quintile of its performance universe for the 1-year period. The Board also noted that the Fund’s performance was above its benchmark for the 1-year period.
The Board considered the detailed investment analytics reports provided by Hartford Funds’ Investment Advisory Group throughout the year. These reports include, among other things, information on the Fund’s gross and net returns, the Fund’s investment performance relative to an appropriate benchmark and peer group, various statistics concerning the Fund’s portfolio, and a narrative summary of various factors affecting Fund performance. The Board considered the Advisers’ cooperation with the Investment Committee, which assists the Board in evaluating the performance of the Fund at periodic meetings throughout the year. The Board also considered the analysis provided by the Consultant relating to the Fund’s performance track record.
In light of all the considerations noted above, the Board concluded that it had continued confidence in HFMC’s and the Sub-adviser’s overall capabilities to manage the Fund.
Costs of the Services and Profitability of the Advisers
The Board reviewed information regarding HFMC’s cost to provide investment management and related services to the Fund and HFMC’s profitability, both overall and for the Fund, on a pre-tax basis without regard to distribution expenses. The Board also requested and reviewed information about the profitability to HFMC and its affiliates from all services provided to the Fund and all aspects of their relationship with the Fund. The Board also requested and received information relating to the operations and profitability of the Sub-adviser.
The Board considered the Consultant’s review of the profitability calculations used by HFMC in connection with the continuation of the investment management agreement, noting the Consultant’s view that Hartford Funds’ process for calculating and reporting Fund profitability is reasonable. In this regard, the Board noted that the Consultant performed a full review of this process in light of the recent restructuring of the Hartford Funds business and reported that the approach to analyzing Fund profitability, including the use of common expense allocation methodologies, is reasonable, sound and well within common industry practice.
Based on these considerations, the Board concluded that the profits anticipated to be realized by the Advisers and their affiliates from their relationships with the Fund would not be excessive.
| 38 |
| The Hartford Floating Rate High Income Fund |
| Approval of Investment Management and Investment Sub-Advisory Agreements (Unaudited) – (continued) |
Comparison of Fees and Services Provided by the Advisers
The Board considered comparative information with respect to the management fees to be paid by the Fund to HFMC and the total expense ratios of the Fund. The Board also considered comparative information with respect to the sub-advisory fees to be paid by HFMC to the Sub-adviser. In this regard, the Board requested and reviewed information from HFMC and the Sub-adviser relating to the management and sub-advisory fees, including the sub-advisory fee schedule for the Fund, and total operating expenses for the Fund. With respect to the sub-advisory fee schedule, the Board considered representations from HFMC and the Sub-adviser that the Sub-adviser’s fees were negotiated at arm’s length on a fund-by-fund basis. The Board also reviewed information from Lipper comparing the Fund’s contractual management fees, actual management fees and overall expense ratios relative to a group of funds selected by Lipper, in consultation with the Consultant, and a broader universe of funds selected by Lipper. The Board considered that the Fund’s contractual management fee, actual management fee and total expenses (less 12b-1 and shareholder service fees) were in the 2nd quintile of its expense group. The Board noted that the Fund has an automatically renewable contractual expense cap on each share class. The expense cap resulted in reimbursement of certain expenses incurred in 2013.
While the Board recognized that comparisons between the Fund and peer funds may be imprecise, given the different service levels and characteristics of mutual funds and the different business models and cost structures of the Advisers, the comparative information provided by Lipper assisted the Board in evaluating the reasonableness of the Fund’s management and sub-advisory fees and total operating expenses. In addition, the Board considered the analysis and recommendations of the Consultant relating to the Fund’s management and sub-advisory fees and total operating expenses.
Based on these considerations, the Board concluded that the Fund’s fees and total operating expenses, in conjunction with the information about quality of services, profitability, economies of scale, and other matters discussed, were reasonable in light of the services provided.
Economies of Scale
The Board requested and considered information regarding the Advisers’ realization of economies of scale with respect to the Fund and whether the fee levels reflect these economies of scale for the benefit of the Fund’s shareholders. The Board reviewed the breakpoints in the management fee schedule for the Fund, which reduce fee rates as Fund assets grow over time. The Board recognized that a fund with assets beyond the highest breakpoint level will continue to benefit from economies of scale because additional assets are charged the lowest breakpoint fee resulting in lower overall effective management fee rates. The Board also considered that expense limitations and fee waivers that reduce the Fund’s expenses at all asset levels can have the same effect as breakpoints in sharing economies of scale with shareholders and provide protection from an increase in expenses if Fund assets decline. The Board recognized that a fee schedule that reaches a lower breakpoint quickly provides shareholders with the benefit of anticipated or potential economies of scale. The Board also considered that HFMC has been active in managing expenses, which has resulted in benefits being realized by shareholders as assets within the Hartford Funds family of funds have grown over time, including through lower transfer agent costs and other operating expenses.
The Board reviewed and evaluated materials from Lipper and the Consultant showing how management fee schedules of peer funds reflect economies of scale for the benefit of shareholders as a peer fund’s assets hypothetically increase over time. Based on information provided by HFMC, Lipper, and the Consultant, the Board recognized that there is no uniform methodology for establishing breakpoints or uniform pattern in asset levels that trigger breakpoints or the amounts of breakpoints triggered.
After considering all of the information available to it, the Board concluded that it was satisfied with the extent to which economies of scale would be shared for the benefit of the Fund’s shareholders based on currently available information and the effective advisory fees and expense ratios for the Fund at its current and reasonably anticipated asset levels. The Board noted, however, that it would continue to monitor future growth in Fund assets and the appropriateness of additional breakpoints.
Other Benefits
The Board considered other benefits to the Advisers and their affiliates from their relationships with the Fund.
The Board noted that HFMC receives fees for fund accounting and related services from the Fund, and the Board considered information on profits to HFMC for such services. The Board also considered that Hartford Administrative Services Company (“HASCO”), the Fund’s transfer agent and an affiliate of HFMC, receives transfer agency compensation from the Fund, and the Board reviewed information on the profitability of
| 39 |
| The Hartford Floating Rate High Income Fund |
| Approval of Investment Management and Investment Sub-Advisory Agreements (Unaudited) – (continued) |
the Fund’s transfer agency function to HASCO. The Board considered information provided by HASCO indicating that the transfer agent fees charged by HASCO to the Fund were fair and reasonable based on publicly available information.
The Board also considered that Hartford Funds Distributors, LLC (“HFD”), an affiliate of HFMC, serves as principal underwriter of the Fund. As principal underwriter, HFD receives 12b-1 fees from the Fund and receives all or a portion of the sales charges on sales or redemptions of certain classes of shares. The Board also noted that certain affiliates of HFD distribute shares of the Fund and receive compensation in that connection.
The Board considered the benefits, if any, to the Sub-adviser from any use of the Fund’s brokerage commissions to obtain soft dollar research, and representations from HFMC and the Sub-adviser that the Sub-adviser would not make any revenue-sharing payments or any other type of distribution payments to HFMC or its affiliates.
The Board considered the benefits to shareholders of being part of the Hartford Funds family of funds, including the right to exchange investments between the same class of funds without a sales charge, the ability to reinvest Fund dividends into other funds in the family, and the ability to combine holdings in the Fund with holdings in other funds to obtain a reduced sales charge. The Board considered HFMC’s efforts to provide investors in the family with a broad range of investment styles and asset classes and its entrepreneurial risk in initiating new funds to expand these opportunities for shareholders.
* * * *
Based upon its review of these various factors, among others, the Board concluded that it is in the best interests of the Fund and its shareholders for the Board to approve the Agreements for an additional year. In reaching this decision, the Board did not assign relative weights to the factors discussed above or deem any one or group of them to be controlling in and of themselves. In connection with their deliberations, the Independent Directors met separately in executive session on several occasions, with independent legal counsel and the Consultant, to review the relevant materials and consider their responsibilities under relevant laws and regulations.
| 40 |
| The Hartford Floating Rate High Income Fund |
| Main Risks (Unaudited) |
The main risks of investing in the Fund are described below.
Market, Selection and Strategy Risk: The Fund’s share price may fluctuate due to market risk and/or security selections that may underperform the market or relevant benchmarks. If the sub-adviser's investment strategy does not perform as expected, the Fund could underperform its peers or lose money. There is no guarantee the Fund will achieve its stated objective.
Fixed Income Risk: The Fund is subject to interest rate risk (the risk that the value of an investment decreases when interest rates rise), credit risk (the risk that the issuing company of a security is unable to pay interest and principal when due), liquidity risk (the risk that an investment may be difficult to sell at an advantageous time or price) and call risk (the risk that an investment may be redeemed early).
Loan Risk: The Fund’s investments in loans may at times become difficult to value and highly illiquid; they are subject to credit risk such as nonpayment of principal or interest, and risks of bankruptcy and insolvency.
Junk Bond Risk: Investments in junk bonds involve greater risk of price volatility, illiquidity, and default than higher-rated debt securities.
Foreign Investment Risk: Investments in foreign securities may be riskier than investments in U.S. securities. Potential risks include the risks of illiquidity, increased price volatility, less government regulation, less extensive and less frequent accounting and other reporting requirements, unfavorable changes in currency exchange rates, and economic and political disruptions.
Non-Diversified Risk: The Fund is non-diversified, so it may be more exposed to the risks associated with individual issuers than a diversified fund.
Derivatives Risk: Investments in derivatives can be volatile. Potential risks include currency risk, leverage risk (the risk that small market movements may result in large changes in the value of an investment), liquidity risk, index risk, pricing risk, and counterparty risk (the risk that the counterparty may be unwilling or unable to honor its obligations).
The Hartford Floating Rate High Income Fund should not be considered an alternative to CDs or money market funds. The Fund is for investors who are looking to complement their traditional fixed income investments.
| 41 |
THIS PRIVACY POLICY IS NOT PART OF THIS REPORT
Privacy Policy and Practices of The Hartford Financial Services Group, Inc. and its Affiliates
(herein called “we, our and us”)
This Privacy Policy applies to our United States Operations
We value your trust. We are committed to the responsible: a) management; b) use; and c) protection; of Personal Information.
This notice describes how we collect, disclose, and protect Personal Information.
We collect Personal Information to: a) service your Transactions with us; and b) support our business functions.
We may obtain Personal Information from: a) You; b) your Transactions with us; and c) third parties such as a consumer-reporting agency.
Based on the type of product or service You apply for or get from us, Personal Information such as: a) your name; b) your address; c) your income; d) your payment; or e) your credit history; may be gathered from sources such as applications, Transactions, and consumer reports.
To serve You and service our business, we may share certain Personal Information. We will share Personal Information, only as allowed by law, with affiliates such as: a) our insurance companies; b) our employee agents; c) our brokerage firms; and d) our administrators.
As allowed by law, we may share Personal Financial Information with our affiliates to: a) market our products; or b) market our services; to You without providing You with an option to prevent these disclosures.
|
We may also share Personal Information, only as allowed by law, with unaffiliated third parties including: a) independent agents; b) brokerage firms; c) insurance companies; d) administrators; and e) service providers; who help us serve You and service our business.
When allowed by law, we may share certain Personal Financial Information with other unaffiliated third parties who assist us by performing services or functions such as: a) taking surveys; b) marketing our products or services; or c) offering financial products or services under a joint agreement between us and one or more financial institutions.
We, and third parties we partner with, may track some of the pages You visit through the use of: a) cookies; b) pixel tagging; or c) other technologies; and currently do not process or comply with any web browser’s “do not track” signal or similar mechanism that indicates a request to disable online tracking of individual users who visit our websites or use our services.
We will not sell or share your Personal Financial Information with anyone for purposes unrelated to our business functions without offering You the opportunity to: a) “opt-out;” or b) “opt-in;” as required by law.
We only disclose Personal Health Information with: a) your proper written authorization; or b) as otherwise allowed or required by law.
Our employees have access to Personal Information in the course of doing their jobs, such as: a) underwriting policies; b) paying claims; c) developing new products; or d) advising customers of our products and services.
|
We use manual and electronic security procedures to maintain: a) the confidentiality; and b) the integrity of; Personal Information that we have. We use these procedures to guard against unauthorized access.
Some techniques we use to protect Personal Information include: a) secured files; b) user authentication; c) encryption; d) firewall technology; and e) the use of detection software.
We are responsible for and must: a) identify information to be protected; b) provide an adequate level of protection for that data; c) grant access to protected data only to those people who must use it in the performance of their job-related duties.
Employees who violate our Privacy Policy will be subject to discipline, which may include ending their employment with us.
At the start of our business relationship, we will give You a copy of our current Privacy Policy.
We will also give You a copy of our current Privacy Policy once a year if You maintain a continuing business relationship with us.
We will continue to follow our Privacy Policy regarding Personal Information even when a business relationship no longer exists between us.
|
As used in this Privacy Notice:
Application means your request for our product or service.
Personal Financial Information means financial information such as: a) credit history; b) income; c) financial benefits; or d) policy or claim information.
Personal Health Information means health information such as: a) your medical records; or b) information about your illness, disability or injury.
Personal Information means information that identifies You personally and is not otherwise available to the public. It includes: a) Personal Financial Information; and b) Personal Health Information.
Transaction means your business dealings with us, such as: a) your Application; b) your request for us to pay a claim; and c) your request for us to take an action on your account.
You means an individual who has given us Personal Information in conjunction with: a) asking about; b) applying for; or c) obtaining; a financial product or service from us if the product or service is used mainly for personal, family, or household purposes. |
This Privacy Policy is being provided on behalf of the following affiliates of The Hartford Financial Services Group, Inc.:
1stAGChoice, Inc.; Access CoverageCorp, Inc.; Access CoverageCorp Technologies, Inc.; American Maturity Life Insurance Company; Archway 60 R, LLC; Business Management Group, Inc.; Champlain Life Reinsurance Company; DMS R, LLC; Eloy R, LLC; Ersatz Corporation; First State Insurance Company; Hartford Accident and Indemnity Company; Hartford Administrative Services Company; Hartford Casualty General Agency, Inc.; Hartford Casualty Insurance Company; Hartford-Comprehensive Employee Benefit Service Company; Hartford Equity Sales Company, Inc.; Hartford Fire General Agency, Inc.; Hartford Fire Insurance Company; Hartford Funds Management Company, LLC; Hartford Funds Management Group, Inc.; Hartford HLS Series Fund II, Inc.; Hartford Insurance Company of Illinois; Hartford Insurance Company of the Midwest; Hartford Insurance Company of the Southeast; Hartford Integrated Technologies, Inc.; Hartford International Life Reassurance Corporation; Hartford Funds Distributors, LLC; Hartford Investment Management Company; Hartford Life and Accident Insurance Company; Hartford Life and Annuity Insurance Company; Hartford Life Insurance Company; Hartford Life Private Placement, LLC; Hartford Lloyd’s Corporation; Hartford Lloyd’s Insurance Company; Hartford Mezzanine Investors I, LLC; Hartford Residual Market, L.C.C.; Hartford Retirement Services, LLC; Hartford Securities Distribution Company, Inc.; Hartford Series Fund, Inc.; Hartford Specialty Insurance Services of Texas, LLC; Hartford Strategic Investments, LLC; Hartford Underwriters Insurance Company; Hartford Technology Services Company, L.L.C.; Hartford of Texas General Agency, Inc.; Hartford Underwriters General Agency, Inc.; HARTRE Company, L.C.C.; HL Investment Advisors, LLC; HLA LLC; Horizon Management Group, LLC; HRA Brokerage Services, Inc.; Lanidex Class B, LLC; M-CAP Insurance Agency, LLC; New England Insurance Company; New England Reinsurance Corporation; Nutmeg Insurance Agency, Inc.; Nutmeg Insurance Company; Pacific Insurance Company, Limited; Planco, LLC: Property and Casualty Insurance Company of Hartford; Revere R, LLC; RVR R, LLC; Sentinel Insurance Company, Ltd.; Sunstone R, LLC; Symphony R, LLC; The Evergreen Group Incorporated; The Hartford Alternative Strategies Fund; The Hartford Mutual Funds, Inc.; The Hartford Mutual Funds II, Inc.; Trumbull Flood Management, L.L.C.; Trumbull Insurance Company; Twin City Fire Insurance Company; White River Life Reinsurance Company.
HPP Revised January 2014
HARTFORDFUNDS
hartfordfunds.com
This information is written in connection with the promotion or marketing of the matter(s) addressed in this material.
This report is submitted for the general information of the shareholders of the Fund. It is not authorized for distribution unless preceded or accompanied by a current prospectus for the Fund.
The information cannot be used or relied upon for the purpose of avoiding IRS penalties. These materials are not intended to provide tax, accounting or legal advice. As with all matters of a tax or legal nature, you should consult your own tax or legal counsel for advice.
Investors should carefully consider the investment objectives, risks, charges, and expenses of Hartford Funds before investing. This and other information can be found in the prospectus and summary prospectus, which can be obtained by calling 888-843-7824 (retail) or 800-279-1541 (institutional). Investors should read them carefully before they invest.
Hartford Funds are underwritten and distributed by Hartford Funds Distributors, LLC.
MFAR-FRHI14 12/14 113975-3 Printed in U.S.A.
HARTFORDFUNDS
|
THE HARTFORD
2014 Annual Report |
A MESSAGE FROM THE PRESIDENT
Dear Fellow Shareholders:
Thank you for investing in Hartford Funds.
Market Review
U.S. equities (as represented by the S&P 500 Index) rose steadily for the fiscal year ended October 31, 2014, with a return of 17.27% for the period. With the exception of short-lived geopolitical scares early in 2014 and concerns about continuing global growth near the end of the period, stocks generally rose on solid fundamentals and encouraging macroeconomic data during the year.
September 2014 marked the six-year anniversary of the start of the financial crisis. Within weeks of that anniversary, both the S&P 500 Index and the Dow Jones Industrial Average set new all-time highs, closing at 2,018 and 17,391, respectively, on October 31. Although the fallout of the crisis continues to influence investor behavior, stocks have recovered and risen dramatically, up 198% from their low in March 2009. Meanwhile, the domestic economy is notching strong growth, and the unemployment rate has reached its lowest level since August 2008.
While the U.S. economy appears to have stabilized and to have reverted to a solid growth path, the outlook for the global economy appears to have gotten cloudier. The U.S. Federal Reserve has ended quantitative easing, while Europe and Japan are pursuing stimulus options to avoid a double-dip recession and deflation, respectively. Diverging central-bank policies will likely continue to play an important role in market movements going forward as investors wait to see the reactions to their efforts and their impacts on global markets.
How have market movements impacted your portfolio throughout the last year? Are your investments still on track to provide the growth or income you need, and are you comfortable with their progress during times of volatility?
Your financial professional can help you navigate today’s markets with confidence, as well as assist you to achieve your investment goals by providing advice on the best options within our fund family to help you work toward overcoming today’s investing challenges. Meet with your financial advisor regularly to examine your portfolio and your investment strategy, and to determine if you’re still on track to meet your goals.
Thank you again for investing with Hartford Funds.
James Davey
President
Hartford Funds
1 The S&P 500 Index is a market capitalization-weighted price index composed of 500 widely held common stocks.
2 The Dow Jones Industrial Average is an unmanaged, price-weighted index of 30 of the largest, most widely held stocks traded on the NYSE
The Hartford Global All-Asset Fund
The views expressed in the Fund’s Manager Discussion under ‘‘Why did the Fund perform this way?’’ and ‘‘What is the outlook?’’ are views of the Fund’s sub-adviser and portfolio management team through the end of the period and are subject to change based on market and other conditions. The Fund’s Manager Discussion is for informational purposes only and does not represent an offer, recommendation or solicitation to buy, hold or sell any security. The specific securities identified and described, if any, do not represent all of the securities purchased or sold and you should not assume that investments in the securities identified and discussed will be profitable.
| The Hartford Global All-Asset Fund inception 05/28/2010 |
| (sub-advised by Wellington Management Company, LLP) |
| Investment objective – The Fund seeks to provide long-term total return. |
Performance Overview 5/28/10 - 10/31/14

The chart above represents the hypothetical growth of a $10,000 investment in Class A, which includes a sales charge. Growth results in classes other than Class A will vary from what is seen above due to differences in the expenses charged to those share classes.
| Average Annual Total Returns (as of 10/31/14) |
| 1 Year | Since Inception▲ | |||||||
| Global All-Asset A# | 4.18 | % | 6.86 | % | ||||
| Global All-Asset A## | -1.55 | % | 5.50 | % | ||||
| Global All-Asset C# | 3.30 | % | 6.05 | % | ||||
| Global All-Asset C## | 2.30 | % | 6.05 | % | ||||
| Global All-Asset I# | 4.43 | % | 7.14 | % | ||||
| Global All-Asset R3# | 3.86 | % | 6.57 | % | ||||
| Global All-Asset R4# | 4.18 | % | 6.90 | % | ||||
| Global All-Asset R5# | 4.49 | % | 7.17 | % | ||||
| Global All-Asset Y# | 4.54 | % | 7.21 | % | ||||
| Barclays Global Aggregate USD Hedged Index | 5.32 | % | 4.16 | % | ||||
| Barclays U.S. Aggregate Bond Index | 4.14 | % | 3.99 | % | ||||
| Global All-Asset Fund Blended Index | 7.20 | % | 9.52 | % | ||||
| MSCI All Country World Index | 8.32 | % | 12.78 | % | ||||
| ▲ | Inception: 05/28/2010 | |
| # | Without sales charge |
| ## | With sales charge |
PERFORMANCE DATA QUOTED REPRESENTS PAST PERFORMANCE AND DOES NOT GUARANTEE FUTURE RESULTS. The investment return and principal value of the investment will fluctuate so that investors’ shares, when redeemed, may be worth more or less than their original cost. Current performance may be lower or higher than the performance data quoted. To obtain performance data current to the most recent month-end, please visit our website www.hartfordfunds.com.
The initial investment in Class A shares reflects the maximum sales charge of 5.50% and returns for Class C shares reflect a contingent deferred sales charge of up to 1.00% on shares redeemed within twelve months of purchase.
Total returns presented above were calculated using the Fund’s net asset value available to shareholders for sale or redemption of Fund shares on October 31, 2014, which may exclude investment transactions as of this date. All share class returns assume the reinvestment of all distributions at net asset value and the deduction of all fund expenses.
Barclays Global Aggregate USD Hedged Index represents the global investment-grade fixed-income markets.
Barclays U.S. Aggregate Bond Index is an unmanaged index and is composed of securities from the Barclays Government/Credit Bond Index, Mortgage-Backed Securities Index, Asset-Backed Securities Index and Commercial Mortgage-Backed Securities Index.
Global All-Asset Fund Blended Index is calculated by Hartford Funds Management Company, LLC (HFMC) and represents the weighted return of 40% Barclays Global Aggregate USD Hedged Index and 60% MSCI All Country World Index.
MSCI All Country World Index is a free float-adjusted market capitalization index that measures equity market performance in the global developed and emerging markets, consisting of 45 developed and emerging market country indices.
The Fund has changed its benchmark from the Barclays U.S. Aggregate Bond Index to the Barclays Global Aggregate Hedged USD Index. HFMC believes that the Barclays Global Aggregate USD Hedged Index better reflects the Fund’s investment strategy.
You cannot invest directly in an index.
The chart and table do not reflect the deductions of taxes that a shareholder would pay on Fund distributions or the redemption of Fund shares.
Performance information may reflect historical or current expense waivers/reimbursements from the investment adviser, without which performance would have been lower. For information on current expense waivers/reimbursements, please see the prospectus.
| 2 |
The Hartford Global All-Asset Fund
Manager Discussion
October 31, 2014 (Unaudited)
| Operating Expenses* | ||||||||
| Net | Gross | |||||||
| Global All-Asset Class A | 1.26 | % | 1.38 | % | ||||
| Global All-Asset Class C | 2.01 | % | 2.12 | % | ||||
| Global All-Asset Class I | 1.01 | % | 1.09 | % | ||||
| Global All-Asset Class R3 | 1.51 | % | 1.71 | % | ||||
| Global All-Asset Class R4 | 1.21 | % | 1.43 | % | ||||
| Global All-Asset Class R5 | 0.96 | % | 1.10 | % | ||||
| Global All-Asset Class Y | 0.91 | % | 1.00 | % | ||||
| * | As shown in the Fund's current prospectus dated March 1, 2014. Actual expenses may be higher or lower. Please see accompanying Consolidated Financial Highlights for expense ratios for the year ended October 31, 2014. |
Gross expenses are the Fund's total annual operating expenses shown in the Fund's most recent prospectus. Net expenses are the Fund's total annual operating expenses shown in the Fund's most recent prospectus and reflect contractual expense reimbursements in instances when these reductions reduce the Fund's gross expenses. Contractual reimbursements remain in effect until February 28, 2015, and automatically renew for one-year terms unless terminated.
All investments are subject to risk including the possible loss of principal. For a discussion of the Fund’s risks, please see the Main Risks section of this report. For more detailed information on the risks associated with an investment in the Fund, please see the prospectus.
| Portfolio Managers | ||
| Scott M. Elliott | Brian M. Garvey | Stephen A. Gorman, CFA |
| Senior Vice President and Asset Allocation Portfolio Manager |
Vice President and Asset Allocation Portfolio Manager |
Vice President and Director of Tactical Asset Allocation |
How did the Fund perform?
The Class A shares of The Hartford Global All-Asset Fund returned 4.18%, before sales charge, for the twelve-month period ended October 31, 2014, underperforming the Fund’s custom benchmark (60% MSCI All Country World Index, 40% Barclays Global Aggregate USD Hedged Index), which returned 7.20% for the same period. The Fund underperformed the 5.48% average return of the Lipper Flexible Portfolio Funds peer group, a group of funds that allocate their investments across various asset classes, including domestic common stocks, bonds, and money market instruments, with a focus on total return. For the same period, the Barclays Global Aggregate USD Hedged Index returned 5.32% and the MSCI All Country World Index returned 8.32%.
Why did the Fund perform this way?
Global equities rose during the period, notwithstanding bouts of significant volatility. Despite ongoing geopolitical tensions in Ukraine and the Middle East, concerns about a Chinese economic growth slowdown, and unsettling economic and political developments in several other emerging market countries, the five-year-old bull market continued in the first half of 2014. Robust merger and acquisition activity, along with continued accommodative monetary policy from central banks around the globe, aided positive investor sentiment in May and June. However, Portuguese banking woes, European economic malaise, and the prospect of an accelerated U.S. Federal Reserve (Fed) interest-rate-hike timeline all contributed to stall the global stock rally near the tail end of the period. In addition, China's property slump and poor gross domestic product (GDP) readings in Japan and the eurozone raised the specter of a slowdown in global economic growth. Nevertheless, there were several positive developments, including monetary easing by the European Central Bank and the People's Bank of China, as well as an encouraging U.S. corporate earnings season. During the period, emerging market equities underperformed their developed market counterparts and U.S. stocks generally outperformed non-U.S. stocks.
Fixed income markets gained throughout much of the period as expectations of prolonged easy monetary policy by major central banks and a supportive macroeconomic environment kept rates low and suppressed volatility. Early in the period emerging markets dominated headlines as economic and political developments sparked risk aversion across global markets, pushing bond prices higher and yields lower amid a flight to quality. Toward the end of the period, however, persistent geopolitical risks – tensions between Ukraine and Russia and violence in Iraq – and Chinese economic slowdown concerns raised questions about the global growth rate, keeping a lid on risk appetites overall.
The Fund uses multiple levers to generate investment performance. It can invest in equities and fixed income, as well as undertake opportunistic investments in additional asset classes, such as currencies and commodity-related securities. Selection within both the equity and fixed income portions of the Fund detracted during the period. As part of the asset allocation decision making process, the Fund uses global thematic ideas based on macroeconomic trends derived from Wellington Management’s research. From a global thematic perspective, four of six underlying themes in the Fund underperformed relative to the Fund’s custom benchmark during the period, led by Meaningful European Reform and Activist Governments reflecting concerns about European growth and deflation risks. Within Meaningful European reform, underperformance, relative to the Fund’s custom benchmark, was driven by equity exposures in the region; European fixed income exposures also detracted modestly. Within Activist Governments, the primary detractors were exposures to inflation-linked bonds, gold and gold equities. Our Absolute Return Fixed Income and Structural Improvement in Emerging Markets Balance Sheets themes outperformed relative to the Fund’s custom benchmark during the
| 3 |
The Hartford Global All-Asset Fund
Manager Discussion – (continued)
October 31, 2014 (Unaudited)
period. Outperformance within the Absolute Return Fixed Income theme was primarily driven by strong results from a portion of the Fund that seeks to generate absolute results in the developed market currency and interest rate markets. Within the sleeve, outperformance relative to the Fund’s custom benchmark was due to short positions in the Japanese Yen and Euro. Exposures to Emerging Market debt, in particular sovereign debt, drove outperformance relative to the Fund’s custom benchmark within Structural Improvement in Emerging Markets Balance Sheets.
Derivatives are used by the Fund primarily to gain exposure to different asset classes, however they did not have a significant impact on performance during the period.
What is the outlook?
We believe the global cycle continues to advance at a moderate pace with a mix of stronger growth in the U.S. and more sluggish activity in Europe and Japan, while China continues to decelerate.
Wage trends and inflation have been quite muted in the U.S., yet below the surface it appears that U.S. firms are having a tougher time finding qualified labor. This is suggestive of growing wage pressures in 2015 along with an improving labor market. At the same time, Japanese and European policy makers are set to deliver more stimulus. We believe financial markets are overly complacent about inflation potential. Finally, we believe markets have overreacted to sluggish growth in Europe, which in our view is consistent with a gradual recovery coupled with structural reform. Under the surface the reform process is ongoing and we expect that it should support improved corporate profitability. We believe valuations are attractive and, unlike the U.S., policy remains accommodative. As a result, we continue to find what we believe to be good investment opportunities in Europe.
At the end of the period, the Fund held allocations to TIPS, gold, and gold mining equities. The Fund also ended the period overweight European equities, where we believe valuations are attractive.
| Credit Exposure | ||||
| as of October 31, 2014 | ||||
| Credit Rating * | Percentage of Net Assets | |||
| Aaa/ AAA | 10.8 | % | ||
| Aa/ AA | 9.0 | |||
| A | 1.2 | |||
| Baa/ BBB | 3.7 | |||
| Ba/ BB | 1.6 | |||
| B | 0.8 | |||
| Caa/ CCC or Lower | 0.6 | |||
| Not Rated | 0.8 | |||
| Non-Debt Securities and Other Short-Term Instruments | 72.8 | |||
| Other Assets and Liabilities | (1.3 | ) | ||
| Total | 100.0 | % | ||
| * | Credit exposure is the long-term credit ratings for the Fund's holdings, as of the date noted, as provided by Standard and Poor's (S&P) or Moody's Investors Service (Moody's) and typically range from AAA/Aaa (highest) to C/D (lowest). Presentation of S&P and Moody's credit ratings in this report have been selected for informational purposes for shareholders, as well as the Fund's consideration of industry practice. If Moody's and S&P assign different ratings, the lower rating is used. Fixed income securities that are not rated by either agency are listed as "Not Rated." Ratings do not apply to the Fund itself or to the Fund's shares. Ratings may change. |
| Diversification by Security Type | ||||
| as of October 31, 2014 | ||||
| Category | Percentage of Net Assets | |||
| Equity Securities | ||||
| Common Stocks | 58.3 | % | ||
| Exchange Traded Funds | 4.0 | |||
| Preferred Stocks | 0.4 | |||
| Warrants | 0.1 | |||
| Total | 62.8 | % | ||
| Fixed Income Securities | ||||
| Asset & Commercial Mortgage Backed Securities | 4.6 | % | ||
| Corporate Bonds | 3.9 | |||
| Foreign Government Obligations | 9.6 | |||
| U.S. Government Agencies | 6.0 | |||
| U.S. Government Securities | 4.4 | |||
| Total | 28.5 | % | ||
| Short-Term Investments | 9.8 | |||
| Purchased Options | 0.2 | |||
| Other Assets and Liabilities | (1.3 | ) | ||
| Total | 100.0 | % | ||
| 4 |
The Hartford Global All-Asset Fund
Consolidated Schedule of Investments
October 31, 2014
(000’s Omitted)
| Shares or Principal Amount ╬ | Market Value ╪ | |||||||
Asset and Commercial Mortgage Backed Securities - 4.6% | ||||||||
| Cayman Islands - 0.3% | ||||||||
| Ares CLO Ltd. | ||||||||
| $ | 255 | 1.62%, 04/20/2023 ■Δ | $ | 247 | ||||
| Carlyle Global Market Strategies | ||||||||
| 250 | 1.75%, 04/17/2025 ■Δ | 250 | ||||||
| CIFC Funding Ltd. | ||||||||
| 275 | 1.38%, 08/14/2024 ■Δ | 274 | ||||||
| Magnetite CLO Ltd. | ||||||||
| 250 | 2.23%, 07/25/2026 ■Δ | 242 | ||||||
| OZLM Funding Ltd. | ||||||||
| 285 | 1.73%, 04/17/2026 ■Δ | 284 | ||||||
| 1,297 | ||||||||
| United Kingdom - 0.0% | ||||||||
| Granite Master Issuer plc | ||||||||
| 224 | 0.30%, 12/20/2054 Δ | 223 | ||||||
| 46 | 0.34%, 12/20/2054 Δ | 45 | ||||||
| Motor plc | ||||||||
| 41 | 1.29%, 02/25/2020 ■ | 41 | ||||||
| 309 | ||||||||
| United States - 4.3% | ||||||||
| Ally Automotive Receivables Trust | ||||||||
| 138 | 1.14%, 06/15/2016 | 139 | ||||||
| 96 | 2.23%, 03/15/2016 | 96 | ||||||
| Ally Master Owner Trust | ||||||||
| 100 | 1.54%, 09/15/2019 | 100 | ||||||
| AmeriCredit Automobile Receivables Trust | ||||||||
| 425 | 2.64%, 10/10/2017 | 431 | ||||||
| 280 | 2.67%, 01/08/2018 | 284 | ||||||
| ARI Fleet Lease Trust | ||||||||
| 283 | 0.45%, 01/15/2021 ■Δ | 283 | ||||||
| Asset Backed Securities Corp Home Equity | ||||||||
| 283 | 0.66%, 08/25/2034 Δ | 268 | ||||||
| Banc of America Commercial Mortgage, Inc. | ||||||||
| 312 | 5.75%, 02/10/2051 Δ | 343 | ||||||
| Banc of America Mortgage Securities | ||||||||
| 88 | 2.69%, 04/25/2034 Δ | 89 | ||||||
| Bear Stearns Adjustable Rate Mortgage Trust | ||||||||
| 34 | 2.26%, 08/25/2035 Δ | 34 | ||||||
| 388 | 2.52%, 07/25/2036 Δ | 320 | ||||||
| Bear Stearns Asset Backed Securities | ||||||||
| 580 | 6.00%, 11/25/2035 | 512 | ||||||
| Bear Stearns Commercial Mortgage Securities, Inc. | ||||||||
| 371 | 5.43%, 03/11/2039 Δ | 386 | ||||||
| 350 | 5.90%, 06/11/2040 Δ | 385 | ||||||
| Cabela's Master Credit Card Trust | ||||||||
| 230 | 0.60%, 07/15/2022 Δ | 229 | ||||||
| 425 | 0.80%, 08/16/2021 ■Δ | 428 | ||||||
| Citigroup/Deutsche Bank Commercial Mortgage Trust | ||||||||
| 285 | 5.40%, 07/15/2044 Δ | 291 | ||||||
| Commercial Mortgage Pass-Through Certificates | ||||||||
| 308 | 5.95%, 06/10/2046 Δ | 325 | ||||||
| Connecticut Avenue Securities Series | ||||||||
| 314 | 1.75%, 01/25/2024 Δ | 314 | ||||||
| 65 | 2.75%, 05/25/2024 Δ | 58 | ||||||
| 350 | 3.15%, 07/25/2024 Δ | 320 | ||||||
| 330 | 5.40%, 10/25/2023 Δ | 366 | ||||||
| Countrywide Alternative Loan Trust | ||||||||
| 555 | 5.25%, 08/25/2035 | 507 | ||||||
| Countrywide Home Loans, Inc. | ||||||||
| 379 | 2.58%, 09/25/2047 Δ | 337 | ||||||
| Credit Acceptance Automotive Loan Trust | ||||||||
| 250 | 1.83%, 04/15/2021 ■ | 251 | ||||||
| 265 | 2.21%, 09/15/2020 ■ | 268 | ||||||
| 300 | 2.26%, 10/15/2021 ■ | 302 | ||||||
| 250 | 2.29%, 04/15/2022 ■ | 251 | ||||||
| CS First Boston Mortgage Securities Corp. | ||||||||
| 500 | 5.12%, 11/15/2037 ■ | 501 | ||||||
| Dryden Senior Loan Fund | ||||||||
| 350 | 1.70%, 07/15/2026 ■Δ | 348 | ||||||
| First Investors Automotive Owner Trust | ||||||||
| 254 | 1.23%, 03/15/2019 ■ | 255 | ||||||
| FREMF Mortgage Trust | ||||||||
| 160 | 3.60%, 11/25/2046 ■Δ | 164 | ||||||
| 105 | 3.95%, 06/25/2047 ■Δ | 109 | ||||||
| 500 | 4.07%, 07/25/2045 ■Δ | 512 | ||||||
| 95 | 4.27%, 02/25/2046 ■Δ | 96 | ||||||
| 215 | 4.38%, 06/25/2047 ■Δ | 221 | ||||||
| GE Capital Commercial Mortgage Corp. | ||||||||
| 500 | 4.95%, 06/10/2048 | 501 | ||||||
| GE Dealer Floorplan Master Note Trust | ||||||||
| 425 | 0.65%, 06/20/2017 Δ | 425 | ||||||
| GE Equipment Transportation LLC | ||||||||
| 100 | 1.31%, 09/24/2020 | 100 | ||||||
| Goldman Sachs Mortgage Securities Corp. II | ||||||||
| 300 | 5.16%, 12/10/2043 ■ | 340 | ||||||
| Granite Master Issuer plc | ||||||||
| 243 | 0.36%, 12/20/2054 Δ | 241 | ||||||
| GSR Mortgage Loan Trust | ||||||||
| 399 | 2.63%, 03/25/2047 Δ | 348 | ||||||
| 216 | 2.66%, 09/25/2035 Δ | 216 | ||||||
| 143 | 4.53%, 01/25/2035 Δ | 140 | ||||||
| JP Morgan Chase Commercial Mortgage Securities Corp. | ||||||||
| 380 | 5.40%, 12/15/2044 Δ | 391 | ||||||
| 375 | 6.06%, 04/15/2045 Δ | 395 | ||||||
| JP Morgan Mortgage Acquisition Corp. | ||||||||
| 273 | 5.33%, 11/25/2036 Δ | 276 | ||||||
| JP Morgan Mortgage Trust | ||||||||
| 223 | 3.00%, 09/25/2044 ■ | 226 | ||||||
| LB-UBS Commercial Mortgage Trust | ||||||||
| 368 | 5.43%, 02/15/2040 | 399 | ||||||
| 375 | 6.32%, 04/15/2041 Δ | 418 | ||||||
| Mastr Asset Backed Securities Trust | ||||||||
| 370 | 0.78%, 03/25/2035 Δ | 359 | ||||||
| Morgan Stanley Capital I | ||||||||
| 16 | 0.78%, 03/25/2035 Δ | 15 | ||||||
| 354 | 5.83%, 10/15/2042 Δ | 368 | ||||||
| MortgageIT Trust | ||||||||
| 343 | 0.45%, 08/25/2035 Δ | 327 | ||||||
| 320 | 0.47%, 02/25/2035 Δ | 312 | ||||||
| Nationstar Agency Advance Funding Trust | ||||||||
| 200 | 1.89%, 02/18/2048 ■ | 196 | ||||||
| New York City Tax Lien | ||||||||
| 75 | 1.03%, 11/10/2027 ■ | 75 | ||||||
| Opteum Mortgage Acceptance Corp. | ||||||||
| 410 | 0.58%, 04/25/2035 Δ | 379 | ||||||
| Option One Mortgage Loan Trust | ||||||||
| 127 | 0.65%, 02/25/2035 Δ | 125 | ||||||
The accompanying notes are an integral part of these financial statements.
| 5 |
The Hartford Global All-Asset Fund
Consolidated Schedule of Investments – (continued)
October 31, 2014
(000’s Omitted)
| Shares or Principal Amount ╬ | Market Value ╪ | |||||||
| Asset and Commercial Mortgage Backed Securities - 4.6% - (continued) | ||||||||
| United States - 4.3% - (continued) | ||||||||
| Oscar US Funding Trust | ||||||||
| $ | 160 | 1.00%, 08/15/2017 ■ | $ | 160 | ||||
| Prestige Automotive Receivables Trust | ||||||||
| 150 | 3.25%, 07/15/2019 ■ | 154 | ||||||
| Residential Asset Mortgage Products, Inc. | ||||||||
| 100 | 0.56%, 11/25/2035 Δ | 98 | ||||||
| Residential Asset Securities Corp. | ||||||||
| 93 | 0.44%, 03/25/2036 Δ | 92 | ||||||
| Residential Funding Mortgage Securities, Inc. | ||||||||
| 390 | 3.22%, 02/25/2036 Δ | 346 | ||||||
| Santander Drive Automotive Receivables Trust | ||||||||
| 100 | 1.82%, 05/15/2019 | 100 | ||||||
| 94 | 1.94%, 12/15/2016 | 95 | ||||||
| 425 | 3.01%, 04/16/2018 | 433 | ||||||
| 420 | 3.78%, 11/15/2017 | 427 | ||||||
| 393 | 3.82%, 08/15/2017 | 398 | ||||||
| Soundview Home Equity Loan Trust | ||||||||
| 91 | 0.57%, 11/25/2035 Δ | 89 | ||||||
| SpringCastle America Funding LLC | ||||||||
| 260 | 2.70%, 05/25/2023 ■ | 260 | ||||||
| Springleaf Funding Trust | ||||||||
| 155 | 2.41%, 12/15/2022 ■ | 155 | ||||||
| Structured Asset Securities Corp. | ||||||||
| 150 | 0.30%, 02/25/2036 Δ | 148 | ||||||
| Thornburg Mortgage Securities Trust | ||||||||
| 307 | 2.24%, 04/25/2045 Δ | 310 | ||||||
| Wachovia Bank Commercial Mortgage Trust | ||||||||
| 170 | 5.41%, 10/15/2044 ■Δ | 168 | ||||||
| 380 | 5.55%, 03/15/2042 ■Δ | 384 | ||||||
| Wells Fargo Home Equity Trust | ||||||||
| 100 | 0.56%, 08/25/2035 Δ | 100 | ||||||
| Westlake Automobile Receivables Trust | ||||||||
| 250 | 2.24%, 04/15/2020 ■ | 250 | ||||||
| World Omni Automotive Receivables Trust | ||||||||
| 340 | 1.06%, 09/16/2019 | 340 | ||||||
| 21,202 | ||||||||
| Total Asset and Commercial Mortgage Backed Securities | ||||||||
| (Cost $22,894) | $ | 22,808 | ||||||
Corporate Bonds - 3.9% | ||||||||
| Austria - 0.1% | ||||||||
| UniCredit Bank Austria AG | ||||||||
| EUR | 200 | 2.50%, 05/27/2019 § | 264 | |||||
| UNIQA Insurance Group AG | ||||||||
| EUR | 200 | 6.88%, 07/31/2043 § | 288 | |||||
| 552 | ||||||||
| Bermuda - 0.0% | ||||||||
| Digicel Ltd. | ||||||||
| 200 | 8.25%, 09/01/2017 § | 205 | ||||||
| Brazil - 0.1% | ||||||||
| Cosan Overseas Ltd. | ||||||||
| 225 | 8.25%, 11/05/2015 §♠ | 233 | ||||||
| Odebrecht Finance Ltd. | ||||||||
| 242 | 7.50%, 09/14/2015 §♠ | 244 | ||||||
| 477 | ||||||||
| British Virgin Islands - 0.1% | ||||||||
| Studio City Finance Ltd. | ||||||||
| 350 | 8.50%, 12/01/2020 § | 380 | ||||||
| Cayman Islands - 0.0% | ||||||||
| Aquarius Invest. plc Swiss Reinsurance Co., Ltd. | ||||||||
| 200 | 6.38%, 09/01/2024 § | 208 | ||||||
| Chile - 0.1% | ||||||||
| Cencosud S.A. | ||||||||
| 250 | 5.50%, 01/20/2021 § | 267 | ||||||
| China - 0.1% | ||||||||
| CNOOC Finance 2012 Ltd. | ||||||||
| 350 | 3.88%, 05/02/2022 § | 358 | ||||||
| Colombia - 0.2% | ||||||||
| Bancolombia S.A. | ||||||||
| 337 | 6.13%, 07/26/2020 | 366 | ||||||
| Empresa de Energia de Bogota | ||||||||
| 300 | 6.13%, 11/10/2021 § | 324 | ||||||
| Pacific Rubiales Energy Corp. | ||||||||
| 395 | 5.63%, 01/19/2025 ■ | 376 | ||||||
| 1,066 | ||||||||
| Denmark - 0.1% | ||||||||
| Danske Bank A/S | ||||||||
| EUR | 200 | 5.75%, 04/06/2020 §♠ | 257 | |||||
| France - 0.3% | ||||||||
| AXA S.A. | ||||||||
| 150 | 6.46%, 12/14/2018 §♠ | 157 | ||||||
| BNP Paribas | ||||||||
| 150 | 3.25%, 03/03/2023 | 150 | ||||||
| BPCE S.A. | ||||||||
| 200 | 5.15%, 07/21/2024 § | 206 | ||||||
| Credit Agricole S.A. | ||||||||
| EUR | 150 | 6.50%, 06/23/2049 § | 191 | |||||
| GBP | 175 | 7.50%, 04/29/2049 § | 275 | |||||
| 200 | 8.13%, 09/19/2033 § | 227 | ||||||
| Societe Generale | ||||||||
| 200 | 6.00%, 01/27/2020 §♠ | 188 | ||||||
| EUR | 250 | 6.75%, 04/07/2049 § | 315 | |||||
| 1,709 | ||||||||
| Germany - 0.1% | ||||||||
| Commerzbank AG | ||||||||
| 350 | 8.13%, 09/19/2023 § | 405 | ||||||
| Hong Kong - 0.1% | ||||||||
| Hongkong (The) Land Finance Co., Ltd. | ||||||||
| 165 | 4.50%, 10/07/2025 | 173 | ||||||
| Hutchison Whampoa International Ltd. | ||||||||
| 232 | 6.00%, 10/28/2015 ■♠ | 240 | ||||||
| Li & Fung Ltd. | ||||||||
| 168 | 5.25%, 05/13/2020 § | 182 | ||||||
| 595 | ||||||||
| India - 0.1% | ||||||||
| ICICI Bank Ltd. | ||||||||
| 275 | 5.75%, 11/16/2020 § | 305 | ||||||
The accompanying notes are an integral part of these financial statements.
| 6 |
The Hartford Global All-Asset Fund
Consolidated Schedule of Investments – (continued)
October 31, 2014
(000’s Omitted)
| Shares or Principal Amount ╬ | Market Value ╪ | |||||||
| Corporate Bonds - 3.9% - (continued) | ||||||||
| India - 0.1% - (continued) | ||||||||
| Reliance Holdings USA, Inc. | ||||||||
| $ | 325 | 5.40%, 02/14/2022 § | $ | 354 | ||||
| 659 | ||||||||
| Ireland - 0.1% | ||||||||
| Allied Irish Banks plc | ||||||||
| EUR | 150 | 2.75%, 04/16/2019 § | 194 | |||||
| Baggot Securities Ltd. | ||||||||
| EUR | 250 | 10.24%, 12/29/2049 § | 332 | |||||
| MTS International Funding Ltd. | ||||||||
| 175 | 8.63%, 06/22/2020 § | 190 | ||||||
| 716 | ||||||||
| Israel - 0.1% | ||||||||
| Teva Pharmaceuticals Finance LLC | ||||||||
| 300 | 6.15%, 02/01/2036 | 366 | ||||||
| Italy - 0.2% | ||||||||
| Banca Popolare di Lodi Investors Trust III | ||||||||
| EUR | 75 | 6.74%, 06/29/2049 | 94 | |||||
| Banca Popolare di Milano Scarl | ||||||||
| EUR | 150 | 4.25%, 01/30/2019 § | 201 | |||||
| Intesa Sanpaolo S.p.A. | ||||||||
| 200 | 5.25%, 01/12/2024 | 218 | ||||||
| EUR | 200 | 9.50%, 10/29/2049 § | 273 | |||||
| UniCredit S.p.A. | ||||||||
| 250 | 8.00%, 06/03/2024 §♠ | 250 | ||||||
| 1,036 | ||||||||
| Japan - 0.1% | ||||||||
| Sumitomo Life Insurance Co. | ||||||||
| 350 | 6.50%, 09/20/2073 § | 391 | ||||||
| Kazakhstan - 0.1% | ||||||||
| HSBK Europe B.V. | ||||||||
| 377 | 7.25%, 05/03/2017 § | 400 | ||||||
| Luxembourg - 0.1% | ||||||||
| Gaz Capital S.A. | ||||||||
| 225 | 9.25%, 04/23/2019 § | 260 | ||||||
| VTB Capital S.A. | ||||||||
| 294 | 6.88%, 05/29/2018 § | 300 | ||||||
| 560 | ||||||||
| Mexico - 0.1% | ||||||||
| Banco Santander S.A. | ||||||||
| 400 | 4.13%, 11/09/2022 § | 405 | ||||||
| Netherlands - 0.2% | ||||||||
| ABN Amro Bank N.V. | ||||||||
| 225 | 6.25%, 04/27/2022 § | 254 | ||||||
| Indosat Palapa Co. B.V. | ||||||||
| 230 | 7.38%, 07/29/2020 § | 244 | ||||||
| ING Bank N.V. | ||||||||
| 275 | 4.13%, 11/21/2023 § | 282 | ||||||
| NN Group N.V. | ||||||||
| EUR | 150 | 4.63%, 04/08/2044 § | 196 | |||||
| 976 | ||||||||
| Peru - 0.1% | ||||||||
| Banco de Credito del Peru/Panama | ||||||||
| 391 | 5.38%, 09/16/2020 § | 426 | ||||||
| Portugal - 0.0% | ||||||||
| Banco Espirito Santo S.A. | ||||||||
| EUR | 100 | 4.00%, 01/21/2019 § | 117 | |||||
| Qatar (State of) - 0.0% | ||||||||
| CBQ Finance Ltd. | ||||||||
| 189 | 7.50%, 11/18/2019 ■ | 227 | ||||||
| Russia - 0.0% | ||||||||
| Gazprombank OJSC Via GPB Eurobond | ||||||||
| 250 | 7.88%, 04/25/2018 §♠Δ | 239 | ||||||
| Singapore - 0.1% | ||||||||
| DBS Bank Ltd. | ||||||||
| 400 | 3.63%, 09/21/2022 § | 412 | ||||||
| South Korea - 0.1% | ||||||||
| Korea Hydro & Nuclear Power Co., Ltd. | ||||||||
| 225 | 4.75%, 07/13/2021 § | 248 | ||||||
| Posco | ||||||||
| 402 | 4.25%, 10/28/2020 ■ | 430 | ||||||
| 678 | ||||||||
| Spain - 0.2% | ||||||||
| Banco Bilbao Vizcaya Argentaria S.A. | ||||||||
| EUR | 400 | 7.00%, 12/29/2049 § | 514 | |||||
| Banco Santander S.A. | ||||||||
| EUR | 300 | 6.25%, 03/12/2049 - 09/11/2049 § | 367 | |||||
| Bankia S.A. | ||||||||
| EUR | 200 | 4.00%, 05/22/2024 §Δ | 246 | |||||
| BBVA International PFD Uniperson | ||||||||
| 75 | 5.92%, 04/18/2017 ♠ | 77 | ||||||
| 1,204 | ||||||||
| Switzerland - 0.2% | ||||||||
| Credit Suisse Group AG | ||||||||
| EUR | 200 | 5.75%, 09/18/2025 § | 279 | |||||
| UBS AG | ||||||||
| 275 | 4.75%, 05/22/2023 § | 278 | ||||||
| 250 | 5.13%, 05/15/2024 § | 250 | ||||||
| 807 | ||||||||
| Thailand - 0.1% | ||||||||
| PTT plc | ||||||||
| 300 | 3.38%, 10/25/2022 ■ | 293 | ||||||
| Turkey - 0.1% | ||||||||
| Yapi ve Kredi Bankasi | ||||||||
| 275 | 4.00%, 01/22/2020 § | 263 | ||||||
| United Arab Emirates - 0.1% | ||||||||
| DP World Ltd. | ||||||||
| 200 | 6.85%, 07/02/2037 ■ | 230 | ||||||
| Taqa Abu Dhabi National Energy Co. | ||||||||
| 138 | 5.88%, 10/27/2016 ■ | 150 | ||||||
| 380 | ||||||||
| United Kingdom - 0.5% | ||||||||
| Abbey National Treasury Services plc | ||||||||
| 150 | 4.00%, 03/13/2024 | 155 | ||||||
| Barclays Bank plc | ||||||||
| EUR | 350 | 8.00%, 12/15/2049 | 455 | |||||
| HSBC Holdings plc | ||||||||
| 525 | 5.63%, 01/17/2020 ♠ | 533 | ||||||
The accompanying notes are an integral part of these financial statements.
| 7 |
The Hartford Global All-Asset Fund
Consolidated Schedule of Investments – (continued)
October 31, 2014
(000’s Omitted)
| Shares or Principal Amount ╬ | Market Value ╪ | |||||||
| Corporate Bonds - 3.9% - (continued) | ||||||||
| United Kingdom - 0.5% - (continued) | ||||||||
| Lloyds Banking Group plc | ||||||||
| $ | 350 | 7.50%, 06/27/2024 ♠ | $ | 364 | ||||
| Nationwide Building Society | ||||||||
| GBP | 200 | 6.88%, 03/11/2049 § | 313 | |||||
| Royal Bank of Scotland Group plc | ||||||||
| 175 | 5.63%, 08/24/2020 | 200 | ||||||
| Standard Bank plc | ||||||||
| 130 | 8.13%, 12/02/2019 § | 149 | ||||||
| Vedanta Resources plc | ||||||||
| 168 | 9.50%, 07/18/2018 § | 191 | ||||||
| 2,360 | ||||||||
| Total Corporate Bonds | ||||||||
| (Cost $19,517) | $ | 19,394 | ||||||
Foreign Government Obligations - 9.6% | ||||||||
| Brazil - 0.7% | ||||||||
| Brazil (Federative Republic of) | ||||||||
| BRL | 7,968 | 6.00%, 08/15/2022 - 08/15/2050 ◄ | $ | 3,254 | ||||
| 3,254 | ||||||||
| Germany - 2.6% | ||||||||
| Germany (Federal Republic of) | ||||||||
| EUR | 9,729 | 0.10%, 04/15/2023 ◄ | 12,800 | |||||
| Greece - 0.4% | ||||||||
| Greece (Republic of) | ||||||||
| EUR | 2,220 | 2.00%, 02/24/2028 - 02/24/2042 § | 1,543 | |||||
| EUR | 55,775 | 16.19%, 10/15/2042 ○ | 606 | |||||
| 2,149 | ||||||||
| Italy - 0.8% | ||||||||
| Italy (Republic of) | ||||||||
| EUR | 1,332 | 2.10%, 09/15/2017 ◄§ | 1,757 | |||||
| EUR | 1,002 | 2.55%, 09/15/2041 ◄§ | 1,327 | |||||
| EUR | 650 | 4.75%, 05/01/2017 | 894 | |||||
| 3,978 | ||||||||
| Japan - 1.4% | ||||||||
| Japan (Government of) | ||||||||
| JPY | 316,917 | 0.10%, 09/10/2024 ☼ | 3,024 | |||||
| JPY | 381,501 | 0.10%, 09/10/2023 ◄ | 3,631 | |||||
| 6,655 | ||||||||
| Mexico - 0.3% | ||||||||
| Mexico (United Mexican States) | ||||||||
| MXN | 10,701 | 4.50%, 11/22/2035 ◄ | 935 | |||||
| 426 | 6.05%, 01/11/2040 | 514 | ||||||
| 1,449 | ||||||||
| New Zealand - 1.7% | ||||||||
| New Zealand (Government of) | ||||||||
| NZD | 3,638 | 2.00%, 09/20/2025 ◄§ | 2,758 | |||||
| NZD | 2,260 | 3.00%, 09/20/2030 ◄§ | 1,863 | |||||
| NZD | 4,467 | 4.50%, 02/15/2016 ◄§ | 3,596 | |||||
| 8,217 | ||||||||
| Norway - 0.2% | ||||||||
| Norway (Kingdom of) | ||||||||
| NOK | 8,010 | 2.00%, 05/24/2023 | 1,194 | |||||
| Portugal - 0.6% | ||||||||
| Portugal (Republic of) | ||||||||
| EUR | 1,525 | 3.85%, 04/15/2021 ■ | 2,078 | |||||
| EUR | 625 | 4.75%, 06/14/2019 ■ | 882 | |||||
| 2,960 | ||||||||
| South Korea - 0.7% | ||||||||
| Korea (Republic of) | ||||||||
| KRW | 4,023,221 | 1.13%, 06/10/2023 ◄ | 3,652 | |||||
| Sweden - 0.2% | ||||||||
| Sweden (Kingdom of) | ||||||||
| SEK | 4,954 | 3.50%, 12/01/2028 ◄ | 1,000 | |||||
| Total Foreign Government Obligations | ||||||||
| (Cost $48,835) | $ | 47,308 | ||||||
U.S. Government Agencies - 6.0% | ||||||||
| United States - 6.0% | ||||||||
| FHLMC | ||||||||
| $ | 1,600 | 4.50%, 11/15/2044 ☼Ð | $ | 1,733 | ||||
| FNMA | ||||||||
| 5 | 2.29%, 10/01/2022 | 5 | ||||||
| 5 | 2.44%, 01/01/2023 | 5 | ||||||
| 300 | 2.50%, 11/15/2029 ☼Ð | 304 | ||||||
| 5 | 2.66%, 09/01/2022 | 5 | ||||||
| 30 | 2.76%, 05/01/2021 | 31 | ||||||
| 5 | 2.78%, 04/01/2022 | 5 | ||||||
| 287 | 2.83%, 06/01/2022 | 292 | ||||||
| 5 | 2.98%, 01/01/2022 | 5 | ||||||
| 2,900 | 3.00%, 11/15/2044 ☼Ð | 2,901 | ||||||
| 5 | 3.20%, 04/01/2022 | 5 | ||||||
| 30 | 3.21%, 05/01/2023 | 31 | ||||||
| 20 | 3.34%, 04/01/2024 | 21 | ||||||
| 344 | 3.37%, 07/01/2025 | 356 | ||||||
| 134 | 3.42%, 04/01/2024 | 141 | ||||||
| 5 | 3.45%, 01/01/2024 | 5 | ||||||
| 5 | 3.47%, 01/01/2024 | 5 | ||||||
| 17,580 | 3.50%, 11/15/2044 - 12/15/2044 ☼Ð | 18,177 | ||||||
| 196 | 3.65%, 08/01/2023 | 209 | ||||||
| 15 | 3.67%, 08/01/2023 | 16 | ||||||
| 5 | 3.70%, 10/01/2023 | 5 | ||||||
| 5 | 3.76%, 03/01/2024 | 5 | ||||||
| 296 | 3.78%, 10/01/2023 | 319 | ||||||
| 198 | 3.81%, 11/01/2023 | 213 | ||||||
| 15 | 3.86%, 11/01/2023 - 12/01/2025 | 16 | ||||||
| 20 | 3.87%, 10/01/2025 | 21 | ||||||
| 30 | 3.89%, 05/01/2030 | 32 | ||||||
| 25 | 3.93%, 10/01/2023 | 27 | ||||||
| 10 | 3.96%, 05/01/2034 | 11 | ||||||
| 5 | 3.97%, 05/01/2029 | 5 | ||||||
| 15 | 4.06%, 10/01/2028 | 16 | ||||||
| 400 | 4.50%, 11/15/2044 ☼Ð | 434 | ||||||
| 281 | 5.14%, 10/01/2024 | 328 | ||||||
| 1,000 | 5.50%, 11/15/2044 ☼Ð | 1,117 | ||||||
| 100 | 6.00%, 11/15/2044 ☼Ð | 113 | ||||||
| 264 | 7.27%, 02/01/2031 | 328 | ||||||
| 25,509 | ||||||||
The accompanying notes are an integral part of these financial statements.
| 8 |
The Hartford Global All-Asset Fund
Consolidated Schedule of Investments – (continued)
October 31, 2014
(000’s Omitted)
| Shares or Principal Amount ╬ | Market Value ╪ | |||||||
| U.S. Government Agencies - 6.0% - (continued) | ||||||||
| GNMA | ||||||||
| $ | 900 | 3.50%, 11/15/2044 ☼Ð | $ | 940 | ||||
| 400 | 4.50%, 11/15/2044 ☼Ð | 436 | ||||||
| 1,000 | 6.00%, 11/15/2044 ☼Ð | 1,128 | ||||||
| 2,504 | ||||||||
| Total U.S. Government Agencies | ||||||||
| (Cost $29,817) | $ | 29,746 | ||||||
U.S. Government Securities - 4.4% | ||||||||
| United States - 4.4% | ||||||||
| U.S. Treasury Bonds | ||||||||
| $ | 625 | 0.63%, 02/15/2043 ◄ | $ | 591 | ||||
| 1,900 | 3.38%, 04/15/2032 ◄╦ | 3,614 | ||||||
| 4,205 | ||||||||
| U.S. Treasury Notes | ||||||||
| 17,075 | 0.13%, 04/15/2019 - 01/15/2023 ◄‡ | 17,407 | ||||||
| Total U.S. Government Securities | ||||||||
| (Cost $21,916) | $ | 21,612 | ||||||
Common Stocks - 58.3% | ||||||||
| Australia - 0.6% | ||||||||
| 104 | Beach Energy Ltd. | $ | 107 | |||||
| 4 | BHP Billiton Ltd. ADR | 251 | ||||||
| 28 | Buru Energy Ltd. ● | 17 | ||||||
| 36 | Dexus Property Group REIT | 38 | ||||||
| 57 | Dick Smith Holdings Ltd. | 110 | ||||||
| 10 | Domino's Pizza Enterprises Ltd. | 238 | ||||||
| 980 | Evolution Mining Ltd. | 518 | ||||||
| 12 | Federation Centres | 30 | ||||||
| 10 | Goodman Group REIT | 49 | ||||||
| 11 | GrainCorp Ltd. | 81 | ||||||
| 399 | Kingsgate Consolidated Ltd. ● | 255 | ||||||
| 24 | Mirvac Group REIT | 38 | ||||||
| 16 | National Storage REIT ● | 19 | ||||||
| 16 | NuFarm Ltd. | 68 | ||||||
| 17 | Oil Search Ltd. | 127 | ||||||
| 35 | Orora Ltd. | 53 | ||||||
| 13 | Scentre Group | 42 | ||||||
| 19 | Seek Ltd. | 275 | ||||||
| 11 | Stockland REIT | 41 | ||||||
| 134 | Treasury Wine Estates Ltd. | 546 | ||||||
| 2 | Westfield Corp. REIT | 13 | ||||||
| 7 | Woolworths Ltd. | 224 | ||||||
| 3,140 | ||||||||
| Austria - 0.3% | ||||||||
| 490 | OceanaGold Corp. ● | 801 | ||||||
| 70 | Wienerberger AG | 841 | ||||||
| 1,642 | ||||||||
| Belgium - 0.2% | ||||||||
| 8 | Ageas | 281 | ||||||
| 4 | Anheuser-Busch InBev N.V. | 401 | ||||||
| 2 | Anheuser-Busch InBev N.V. ADR | 268 | ||||||
| 2 | UCB S.A. | 133 | ||||||
| 2 | Umicore S.A. | 97 | ||||||
| 1,180 | ||||||||
| Brazil - 0.2% | ||||||||
| 35 | Ambev S.A. | 233 | ||||||
| 8 | Banco ABC Brasil S.A. | 46 | ||||||
| 12 | BRF Brasil Foods S.A. ADR | 321 | ||||||
| 6 | BRF S.A. | 153 | ||||||
| 12 | Cosan Ltd. | 126 | ||||||
| 7 | Minerva S.A. ● | 34 | ||||||
| 17 | Petroleo Brasileiro S.A. ADR | 199 | ||||||
| 10 | SLC Agricola S.A. | 68 | ||||||
| 1,180 | ||||||||
| British Virgin Islands - 0.2% | ||||||||
| 97 | Atlas Mara Co-Nvest Ltd. ● | 1,016 | ||||||
| Canada - 1.5% | ||||||||
| 5 | Agrium, Inc. | 448 | ||||||
| 33 | AuRico Gold, Inc. | 107 | ||||||
| 3 | BCE, Inc. | 149 | ||||||
| 19 | Cameco Corp. | 327 | ||||||
| 1 | Canadian Apartment Properties REIT | 14 | ||||||
| 14 | Canadian Imperial Bank of Commerce | 1,306 | ||||||
| 110 | Centerra Gold, Inc. | 430 | ||||||
| 2 | Dream Industrial Real Estate Investment Trust | 14 | ||||||
| 15 | EcoSynthetix, Inc. ● | 20 | ||||||
| 8 | Enbridge, Inc. | 386 | ||||||
| 17 | First National Financial Corp. | 345 | ||||||
| 2 | Goldcorp, Inc. | 45 | ||||||
| 15 | Home Capital Group, Inc. | 700 | ||||||
| 3 | Imax Corp. ● | 90 | ||||||
| 4 | Imperial Oil Ltd. | 199 | ||||||
| 2 | Methanex Corp. ADR | 124 | ||||||
| 28 | National Bank of Canada | 1,296 | ||||||
| 5 | Potash Corp. of Saskatchewan, Inc. | 156 | ||||||
| 6 | Quebecor, Inc. | 166 | ||||||
| 8 | Sunopta, Inc. ● | 113 | ||||||
| 2 | Telus Corp. | 71 | ||||||
| 307 | Timmins Gold Corp. ● | 294 | ||||||
| 22 | Trican Well Service Ltd. | 201 | ||||||
| 34 | Trinidad Drilling | 220 | ||||||
| 5 | Veresen, Inc. | 74 | ||||||
| 7,295 | ||||||||
| Cayman Islands - 0.0% | ||||||||
| 141 | HC International, Inc. ● | 173 | ||||||
| 72 | Hilong Holdings Ltd. | 23 | ||||||
| 196 | ||||||||
| China - 2.6% | ||||||||
| 36 | 21Vianet Group, Inc. ADR ● | 751 | ||||||
| 554 | Air China Ltd. | 359 | ||||||
| 3 | Alibaba Group Holding Ltd. ● | 313 | ||||||
| 4 | Baidu, Inc. ADR ● | 994 | ||||||
| 64 | China Bluechemical Ltd. | 23 | ||||||
| 45 | China Longyuan Power Group Corp. | 48 | ||||||
| 60 | China Petroleum & Chemical Corp. Class H | 52 | ||||||
| 82 | China Unicom Ltd. | 123 | ||||||
| 49 | ChinaCache International Holdings Ltd. ADR ● | 503 | ||||||
| 399 | Dongfeng Motor Group Co., Ltd. | 617 | ||||||
| 85 | E-House China Holdings Ltd. | 851 | ||||||
| 10 | ENN Energy Holdings Ltd. | 67 | ||||||
| 487 | GOME Electrical Appliances Holdings Ltd. | 77 | ||||||
| 582 | Guangdong Investment Ltd. | 765 | ||||||
| 847 | Huabao International Holdings Ltd. | 606 | ||||||
| 836 | Huadian Fuxin Energy Corp., Ltd. | 481 | ||||||
| 770 | Intime Retail Group Co., Ltd. | 671 | ||||||
| — | JD.com, Inc. ● | 8 | ||||||
| 386 | Lenovo Group Ltd. | 569 | ||||||
The accompanying notes are an integral part of these financial statements.
| 9 |
The Hartford Global All-Asset Fund
Consolidated Schedule of Investments – (continued)
October 31, 2014
(000’s Omitted)
| Shares or Principal Amount ╬ | Market Value ╪ | |||||||
| Common Stocks - 58.3% - (continued) | ||||||||
| China - 2.6% - (continued) | ||||||||
| 12 | Mandarin Oriental International Ltd. | $ | 21 | |||||
| 2,226 | Maoye International Holdings | 344 | ||||||
| 8 | NetEase, Inc. ADR | 716 | ||||||
| 40 | New Oriental Education & Technology Group, Inc. ADR ● | 861 | ||||||
| 6 | NQ Mobile, Inc. ADR ● | 43 | ||||||
| 356 | PetroChina Co., Ltd. | 446 | ||||||
| 60 | Phoenix New Media Ltd. ADR ● | 611 | ||||||
| 308 | PICC Property and Casualty Co., Ltd. | 565 | ||||||
| 54 | Ping An Insurance (Group) Co. | 437 | ||||||
| 17 | Sky-Mobi Ltd. ADR ● | 129 | ||||||
| 301 | Sunny Optical Technology Group | 487 | ||||||
| 879 | Zhaojin Mining Industry Co., Ltd. | 464 | ||||||
| 13,002 | ||||||||
| Denmark - 0.2% | ||||||||
| 10 | DSV AS | 290 | ||||||
| 1 | Gronlandsbanken | 92 | ||||||
| 71 | Spar Nord Bank A/S | 716 | ||||||
| 1,098 | ||||||||
| Egypt - 0.2% | ||||||||
| 917 | Centamin plc | 751 | ||||||
| Finland - 0.1% | ||||||||
| 3 | Elisa Oyj | 94 | ||||||
| 2 | Kemira OYJ | 26 | ||||||
| 2 | Kone Oyj Class B | 104 | ||||||
| 2 | Tikkurila Oyj | 38 | ||||||
| 262 | ||||||||
| France - 2.4% | ||||||||
| 32 | Air France ● | 272 | ||||||
| 1 | Arkema S.A. | 34 | ||||||
| 27 | AXA S.A. | 631 | ||||||
| 19 | BNP Paribas | 1,168 | ||||||
| 6 | Carrefour S.A. | 176 | ||||||
| 1 | Cie Generale d'Optique Essilor International S.A. | 106 | ||||||
| 42 | Compagnie De Saint-Gobain | 1,815 | ||||||
| 54 | Credit Agricole S.A. | 796 | ||||||
| — | Dassault Aviation S.A. ● | 35 | ||||||
| 6 | GDF Suez | 145 | ||||||
| — | Gecina S.A. REIT | 15 | ||||||
| 109 | Groupe Eurotunnel S.A. | 1,382 | ||||||
| 3 | Havas S.A. | 27 | ||||||
| 1 | Lafarge S.A. | 100 | ||||||
| 2 | Legrand S.A. | 89 | ||||||
| 1 | LVMH Moet Hennessy Louis Vuitton S.A. | 154 | ||||||
| 2 | Naturex | 135 | ||||||
| — | Norbert Dentressangle S.A. | 40 | ||||||
| 8 | Rexel S.A. | 140 | ||||||
| 2 | Safran S.A. | 132 | ||||||
| 1 | Sanofi-Aventis S.A. | 121 | ||||||
| 12 | Societe Generale Class A | 564 | ||||||
| 69 | Suez Environment S.A. | 1,168 | ||||||
| 2 | Technip S.A. | 140 | ||||||
| — | Unibail Rodamco REIT | 77 | ||||||
| 29 | Vallourec S.A. | 1,063 | ||||||
| 21 | Vinci S.A. | 1,174 | ||||||
| 11,699 | ||||||||
| Germany - 1.6% | ||||||||
| 5 | Bayerische Motoren Werke (BMW) AG | 483 | ||||||
| 6 | Baywa AG | 221 | ||||||
| 3 | Brenntag AG | 143 | ||||||
| 2 | Deutsche Annington Immobile | 48 | ||||||
| 4 | Deutsche Telekom AG | 59 | ||||||
| 63 | Deutsche Wohnen AG | 1,428 | ||||||
| 7 | E.On SE | 114 | ||||||
| 22 | Freenet AG | 587 | ||||||
| 2 | Gagfah S.A. ● | 45 | ||||||
| 1 | HeidelbergCement AG | 69 | ||||||
| 8 | Hornbach Holding AG | 648 | ||||||
| 17 | Leg Immobilien GmbH | 1,152 | ||||||
| 1 | Linde AG | 131 | ||||||
| 17 | Rheinmetall AG | 739 | ||||||
| 21 | Rhoen-Klinikum AG | 635 | ||||||
| 21 | Rhoen-Klinikum AG Rights | 18 | ||||||
| 2 | Salzgitter AG | 49 | ||||||
| 6 | Suedzucker AG | 83 | ||||||
| 21 | ThyssenKrupp AG ● | 517 | ||||||
| 37 | TUI AG | 563 | ||||||
| — | Zalando SE ● | 4 | ||||||
| 7,736 | ||||||||
| Greece - 1.7% | ||||||||
| 1,108 | Alpha Bank A.E. ● | 722 | ||||||
| 234 | Ellaktor S.A. ● | 660 | ||||||
| 2,333 | Eurobank Ergasias S.A. ● | 810 | ||||||
| 81 | Frigoglass S.A. ● | 225 | ||||||
| 133 | Grivalia Properties REIC | 1,442 | ||||||
| 128 | Hellenic Telecommunications Organization S.A. ● | 1,450 | ||||||
| 139 | Opap S.A. | 1,678 | ||||||
| 885 | Piraeus Bank S.A. ● | 1,287 | ||||||
| 10 | Tsakos Energy Navigation Ltd. | 66 | ||||||
| 8,340 | ||||||||
| Hong Kong - 2.1% | ||||||||
| 60 | AAC Technologies Holdings, Inc. | 359 | ||||||
| 83 | AIA Group Ltd. | 464 | ||||||
| 287 | Asian Citrus Holdings Ltd. | 52 | ||||||
| 25 | ASM Pacific Technology Ltd. | 273 | ||||||
| 287 | Baoxin Automotive Group Ltd. | 219 | ||||||
| 5 | Cheung Kong Holdings Ltd. | 97 | ||||||
| 16 | Cheung Kong Infrastructure Holdings Ltd. | 114 | ||||||
| 753 | China Lesso Group Holdings Ltd. | 395 | ||||||
| 10 | China Mengniu Dairy Co. | 43 | ||||||
| 57 | China Merchants Holdings International Co., Ltd. | 180 | ||||||
| 126 | China Modern Dairy Holdings Ltd. ● | 56 | ||||||
| 878 | China Resources Cement | 597 | ||||||
| 184 | China Resources Gas Group LT | 526 | ||||||
| 221 | China Resources Land Ltd. | 526 | ||||||
| 104 | Fosun International | 123 | ||||||
| 202 | Goldpac Group Ltd. | 196 | ||||||
| 9,233 | G-Resources Group Ltd. ● | 226 | ||||||
| 62 | Hong Kong & China Gas Co., Ltd. | 145 | ||||||
| 4 | Lifestyle Properties Development Ltd. ● | 1 | ||||||
| 158 | MGM China Holdings Ltd. | 509 | ||||||
| 474 | Mongolian Mining Corp. ● | 42 | ||||||
| 40 | Nine Dragons Paper Holdings | 31 | ||||||
| 1,202 | Pacific Basin Ship | 578 | ||||||
| 25 | Phoenix Healthcare Group Co., Ltd. | 48 | ||||||
| 156 | Samsonite International S.A. | 518 | ||||||
| 90 | Sands China Ltd. | 563 | ||||||
| 132 | Shanghai Industrial Holdings Ltd. | 407 | ||||||
| 170 | TCL Communication Technology Holdings | 167 | ||||||
The accompanying notes are an integral part of these financial statements.
| 10 |
The Hartford Global All-Asset Fund
Consolidated Schedule of Investments – (continued)
October 31, 2014
(000’s Omitted)
| Shares or Principal Amount ╬ | Market Value ╪ | |||||||
| Common Stocks - 58.3% - (continued) | ||||||||
| Hong Kong - 2.1% - (continued) | ||||||||
| 137 | Tencent Holdings Ltd. ● | $ | 2,199 | |||||
| 1,480 | Tongda Group Holdings Ltd. | 191 | ||||||
| 758 | Xingda International Holdings | 262 | ||||||
| 350 | Xinyi Glass Holdings Co., Ltd. | 207 | ||||||
| 10,314 | ||||||||
| India - 0.5% | ||||||||
| 14 | Bharti Airtel Ltd. | 90 | ||||||
| 2 | Container Corp. of India Ltd. | 45 | ||||||
| 12 | HCL Technologies Ltd. | 323 | ||||||
| 23 | Idea Cellular Ltd. | 62 | ||||||
| 42 | ITC Ltd. | 244 | ||||||
| 304 | NTPC Ltd. | 743 | ||||||
| 15 | Tata Consultancy Services Ltd. | 652 | ||||||
| 3 | Technology Mahindra, Ltd. ● | 136 | ||||||
| 2,295 | ||||||||
| Indonesia - 0.1% | ||||||||
| 1,425 | Bank Tabungan Pensiunan Nasional Tbk ● | 499 | ||||||
| Ireland - 1.4% | ||||||||
| 3,822 | Bank of Ireland ● | 1,511 | ||||||
| 305 | C&C Group plc | 1,359 | ||||||
| 67 | CRH plc | 1,478 | ||||||
| 16 | Greencore Group plc | 65 | ||||||
| 302 | Hibernia REIT plc ● | 416 | ||||||
| 8 | Paddy Power plc | 578 | ||||||
| 12 | Ryanair Holdings plc ADR ● | 675 | ||||||
| 48 | Smurfit Kappa Group plc | 986 | ||||||
| 7,068 | ||||||||
| Israel - 0.9% | ||||||||
| 17 | Azrieli Group | 554 | ||||||
| 64 | Bezeq Israeli Telecommunication Corp., Ltd. | 109 | ||||||
| 32 | Delek Automotive Systems Ltd. | 319 | ||||||
| 164 | Harel Insurance Investements | 828 | ||||||
| 1 | Israel Corp., Ltd. ● | 392 | ||||||
| 498 | Israel Discount Bank ● | 802 | ||||||
| 67 | Mizrahi Tefahot Bank Ltd. ● | 738 | ||||||
| 15 | Teva Pharmaceutical Industries Ltd. ADR | 865 | ||||||
| 4,607 | ||||||||
| Italy - 1.0% | ||||||||
| 42 | Assicurazioni Generali S.p.A. | 853 | ||||||
| 12 | Banca Generali S.p.A. | 325 | ||||||
| 37 | De'Longhi S.p.A. | 719 | ||||||
| 39 | Enel Green Power S.p.A. | 97 | ||||||
| 15 | Eni S.p.A. | 330 | ||||||
| 129 | FinecoBank Banca Fineco S.p.A. ● | 670 | ||||||
| 71 | Finmeccanica S.p.A. ● | 640 | ||||||
| 74 | Pirelli & Co. S.p.A. | 989 | ||||||
| 49 | Salini Impregilo S.p.A ● | 136 | ||||||
| 13 | Snam S.p.A. | 73 | ||||||
| 4,832 | ||||||||
| Japan - 5.4% | ||||||||
| 13 | Aisin Seiki Co., Ltd. | 416 | ||||||
| 21 | Amada Co., Ltd. | 179 | ||||||
| 43 | Anritsu Corp. | 330 | ||||||
| 7 | Asahi Diamond Industrial Co., Ltd. | 86 | ||||||
| 6 | Asahi Kasei Corp. | 52 | ||||||
| 3 | Astellas Pharma, Inc. | 53 | ||||||
| 5 | Cookpad, Inc. | 151 | ||||||
| 4 | CyberAgent, Inc. | 153 | ||||||
| 20 | Daifuku Co., Ltd. | 233 | ||||||
| 5 | Daiichi Sankyo Co., Ltd. | 77 | ||||||
| — | Daito Trust Construction Co., Ltd. | 35 | ||||||
| 17 | Denso Corp. | 761 | ||||||
| 2 | Dentsu, Inc. | 82 | ||||||
| 6 | Digital Garage, Inc. | 82 | ||||||
| 42 | DMG Mori Seiki Co., Ltd. | 498 | ||||||
| 6 | DTS Corp. | 130 | ||||||
| 2 | Eisai Co., Ltd. | 94 | ||||||
| — | Fast Retailing Co., Ltd. | 97 | ||||||
| 8 | Fuji Heavy Industries Ltd. | 276 | ||||||
| 5 | Fuji Media Holdings, Inc. | 72 | ||||||
| — | GLP J-REIT ☼ | 44 | ||||||
| 10 | GMO Payment Gateway, Inc. | 212 | ||||||
| 12 | Hitachi Metals Ltd. | 196 | ||||||
| 12 | Honda Motor Co., Ltd. | 380 | ||||||
| 11 | Infomart Corp. | 191 | ||||||
| 25 | Inpex Corp. | 313 | ||||||
| 5 | Iriso Electronics Co., Ltd. | 336 | ||||||
| 21 | Isuzu Motors Ltd. | 269 | ||||||
| 53 | Japan Display, Inc. ● | 157 | ||||||
| — | Japan Retail Fund Investment REIT | 26 | ||||||
| 2 | JSR Corp. | 44 | ||||||
| 20 | Kakaku.com, Inc. | 275 | ||||||
| 3 | Kansai Electric Power Co., Inc. ● | 32 | ||||||
| 13 | KDDI Corp. | 846 | ||||||
| 54 | Kubota Corp. | 864 | ||||||
| 7 | Kyushu Electric Power Co., Inc. ● | 79 | ||||||
| 89 | Leopalace21 Corp. ● | 559 | ||||||
| 24 | M3, Inc. | 401 | ||||||
| 75 | Makino Milling Machine Co. | 511 | ||||||
| 2 | Mimaki Engineering Co., Ltd. | 39 | ||||||
| 12 | Minebea Co., Ltd. | 163 | ||||||
| 6 | Mitsubishi Chemical Holdings | 29 | ||||||
| 6 | Mitsubishi Electric Corp. | 77 | ||||||
| 17 | Mitsubishi Estate Co., Ltd. | 428 | ||||||
| 67 | Mitsubishi Gas Chemical Co. | 401 | ||||||
| 13 | Mitsubishi Heavy Industries Ltd. | 81 | ||||||
| 203 | Mitsubishi Materials Corp. | 635 | ||||||
| 190 | Mitsubishi UFJ Financial Group, Inc. | 1,108 | ||||||
| 10 | Mitsui Chemicals, Inc. | 29 | ||||||
| 5 | Mitsui Fudosan Co., Ltd. | 177 | ||||||
| 127 | Mitsui O.S.K. Lines Ltd. | 401 | ||||||
| 6 | Murata Manufacturing Co., Ltd. | 725 | ||||||
| 94 | NEC Corp. | 333 | ||||||
| 4 | Nidec Corp. | 296 | ||||||
| 8 | Nippon Ceramic Co., Ltd. | 109 | ||||||
| 3 | Nippon Paint Holdings Co., Ltd. | 62 | ||||||
| 4 | Nippon Shokubai Co., Ltd. | 44 | ||||||
| 17 | Nippon Telegraph & Telephone Corp. | 1,047 | ||||||
| 4 | Nippon Telegraph & Telephone Corp. ADR | 120 | ||||||
| 40 | Nippon Television Network Corp. | 606 | ||||||
| 49 | Nissan Motor Co., Ltd. | 447 | ||||||
| 9 | NSD Co., Ltd. | 137 | ||||||
| 12 | NTT DoCoMo, Inc. | 195 | ||||||
| 4 | Obara Group, Inc. | 127 | ||||||
| 13 | OBIC Co., Ltd. | 450 | ||||||
| 19 | Okuma Corp. | 136 | ||||||
| 2 | Olympus Corp. ● | 57 | ||||||
| 1 | Ono Pharmaceutical Co., Ltd. | 81 | ||||||
| — | ORIX J-REIT, Inc. | 37 | ||||||
The accompanying notes are an integral part of these financial statements.
| 11 |
The Hartford Global All-Asset Fund
Consolidated Schedule of Investments – (continued)
October 31, 2014
(000’s Omitted)
| Shares or Principal Amount ╬ | Market Value ╪ | |||||||
| Common Stocks - 58.3% - (continued) | ||||||||
| Japan - 5.4% - (continued) | ||||||||
| 63 | Rakuten, Inc. | $ | 705 | |||||
| 5 | Recruit Holdings Co., Ltd. ● | 151 | ||||||
| 3 | Roland Corp. | 118 | ||||||
| 14 | Sanken Electric Co., Ltd. | 110 | ||||||
| 5 | Sata Holdings, Corp. | 138 | ||||||
| 5 | Seven & I Holdings Co., Ltd. | 187 | ||||||
| 13 | Shikoku Electric Power Co. ● | 173 | ||||||
| 1 | Shin-Etsu Chemical Co., Ltd. | 76 | ||||||
| 204 | Shinsei Bank Ltd. | 458 | ||||||
| 10 | Shionogi & Co., Ltd. | 267 | ||||||
| 4 | SoftBank Corp. | 306 | ||||||
| 53 | Sony Financial Holdings, Inc. | 853 | ||||||
| 15 | Sumco Corp. | 196 | ||||||
| 4 | Sumisho Computer Systems Corp. | 103 | ||||||
| 1 | Sysmex Corp. | 28 | ||||||
| 54 | T&D Holdings, Inc. | 701 | ||||||
| 5 | TDK Corp. | 304 | ||||||
| 7 | THK Co., Ltd. | 174 | ||||||
| 16 | Tokio Marine Holdings, Inc. | 520 | ||||||
| 12 | Tokyo Gas Co., Ltd. | 71 | ||||||
| 9 | Tokyo Ohka Kogyo Co., Ltd. | 240 | ||||||
| 162 | Toshiba Corp. | 715 | ||||||
| 11 | Toyota Industries Corp. | 539 | ||||||
| 7 | Toyota Motor Corp. | 445 | ||||||
| 20 | TS Technology Co., Ltd. | 494 | ||||||
| 12 | Tsugami Corp. | 62 | ||||||
| 3 | TV Asahi Holdings Corp. | 46 | ||||||
| 26,349 | ||||||||
| Jersey - 0.2% | ||||||||
| 25 | Glencore plc | 129 | ||||||
| 13 | Randgold Resources Ltd. ADR | 748 | ||||||
| 877 | ||||||||
| Kenya - 0.0% | ||||||||
| 292 | Safaricom Ltd. | 40 | ||||||
| Luxembourg - 0.3% | ||||||||
| 45 | Braas Monier Building Group ● | 906 | ||||||
| 5 | SES Global | 164 | ||||||
| 3 | SES Global S.A. | 120 | ||||||
| 1,190 | ||||||||
| Malaysia - 0.6% | ||||||||
| 2,098 | AirAsia Berhad | 1,595 | ||||||
| 384 | AMMB Holdings Berhad | 791 | ||||||
| 279 | MY EG Services BHD | 341 | ||||||
| 2,727 | ||||||||
| Mauritius - 0.1% | ||||||||
| 48 | MCB Group Ltd. | 316 | ||||||
| 9,740 | S.B.M. Holdings Ltd. ● | 323 | ||||||
| 639 | ||||||||
| Mexico - 0.0% | ||||||||
| 6 | Concentradora Fibra Hotelera | 9 | ||||||
| 7 | Corporacion Inmobiliaria Vesta S. de RL de C.V. | 14 | ||||||
| 7 | Hoteles City Express S.A.B. de C.V. ● | 13 | ||||||
| 8 | Mexichem S.A.B. de C.V. | 33 | ||||||
| 9 | Prologis Property Mexico S.A. | 19 | ||||||
| 88 | ||||||||
| Netherlands - 2.0% | ||||||||
| 2 | Airbus Group N.V. | 111 | ||||||
| 16 | Akzo Nobel N.V. | 1,045 | ||||||
| 2 | ASML Holding N.V. | 154 | ||||||
| 21 | Constellium N.V. ● | 426 | ||||||
| 61 | Delta Lloyd N.V. | 1,394 | ||||||
| 9 | Heineken N.V. | 673 | ||||||
| 1 | IMCD Group B.V. ● | 28 | ||||||
| 239 | ING Groep N.V. ● | 3,424 | ||||||
| 60 | Koninklijke (Royal) KPN N.V. | 197 | ||||||
| 6 | NXP Semiconductors N.V. ● | 384 | ||||||
| 18 | Royal Dutch Shell plc | 635 | ||||||
| 46 | Wolters Kluwer N.V. | 1,234 | ||||||
| 9,705 | ||||||||
| Norway - 0.5% | ||||||||
| 27 | DNB ASA | 503 | ||||||
| 27 | DNO International ASA ● | 66 | ||||||
| 7 | Norwegian Property ASA ● | 11 | ||||||
| 67 | SpareBank 1 SR Bank ASA | 581 | ||||||
| 202 | Storebrand ASA ● | 1,034 | ||||||
| 9 | Telenor ASA | 213 | ||||||
| 5 | Yara International ASA | 244 | ||||||
| 2,652 | ||||||||
| Panama - 0.0% | ||||||||
| 5 | Avianca Holdings S.A. ADR | 69 | ||||||
| Papua New Guinea - 0.0% | ||||||||
| 5 | New Britain Palm Oil Ltd. | 55 | ||||||
| Philippines - 0.1% | ||||||||
| 283 | Metropolitan Bank & Trust Co. | 521 | ||||||
| Poland - 0.0% | ||||||||
| 10 | TVN S.A. | 46 | ||||||
| Portugal - 0.0% | ||||||||
| 10 | Galp Energia SGPS S.A. | 142 | ||||||
| Puerto Rico - 0.0% | ||||||||
| 3 | Evertec, Inc. | 73 | ||||||
| Romania - 0.0% | ||||||||
| 2 | Electrica S.A. ■● | 32 | ||||||
| Singapore - 1.2% | ||||||||
| 27 | ARA Asset Management | 36 | ||||||
| 150 | Ascendas REIT | 260 | ||||||
| 41 | Bumitama Agri Ltd. | 35 | ||||||
| 614 | Capitacommercial Trust REIT | 798 | ||||||
| 21 | First Resources Ltd. | 35 | ||||||
| 525 | Keppel REIT | 499 | ||||||
| 185 | Mapletree Commercial Trust REIT | 205 | ||||||
| 31 | Petra Foods Ltd. | 91 | ||||||
| 319 | Singapore Exchange Ltd. | 1,736 | ||||||
| 1 | SunEdison Semiconductor Ltd. ● | 26 | ||||||
| 157 | Suntec REIT | 218 | ||||||
| 96 | United Overseas Bank Ltd. | 1,722 | ||||||
| 116 | Wilmar International Ltd. | 288 | ||||||
| 5,949 | ||||||||
| South Africa - 0.1% | ||||||||
| 73 | Discovery Ltd. | 667 | ||||||
The accompanying notes are an integral part of these financial statements.
| 12 |
The Hartford Global All-Asset Fund
Consolidated Schedule of Investments – (continued)
October 31, 2014
(000’s Omitted)
| Shares or Principal Amount ╬ | Market Value ╪ | |||||||
| Common Stocks - 58.3% - (continued) | ||||||||
| South Korea - 2.2% | ||||||||
| 31 | BS Financial Group, Inc. | $ | 485 | |||||
| 1 | Coway Co., Ltd. | 109 | ||||||
| 31 | DGB Financial Group, Inc. | 447 | ||||||
| 6 | Doosan Corp. | 593 | ||||||
| 13 | Doosan Heavy Industrions and Construction Co. ● | 278 | ||||||
| 20 | Hana Financial Holdings | 676 | ||||||
| 26 | Hynix Semiconductor, Inc. ● | 1,165 | ||||||
| 2 | Hyundai Department Store Co., Ltd. | 312 | ||||||
| 12 | Hyundai Development Co. | 456 | ||||||
| 7 | Hyundai Home Shopping Network Corp. | 942 | ||||||
| 3 | Hyundai Motor Co., Ltd. | 480 | ||||||
| 5 | Kia Motors Corp. | 246 | ||||||
| 7 | Koh Young Technology, Inc. | 227 | ||||||
| 2 | Kona I Co., Ltd. | 78 | ||||||
| 43 | Korea Electric Power Corp. | 1,876 | ||||||
| — | LG Chem Ltd. | 43 | ||||||
| 62 | LG Telecom Ltd. | 636 | ||||||
| 40 | Nice Information Service Co., Ltd. | 175 | ||||||
| 3 | Posco ADR | 181 | ||||||
| 2 | Posco Ltd. | 682 | ||||||
| 8 | Shinhan Financial Group Co., Ltd. | 381 | ||||||
| 2 | SK Telecom Co., Ltd. | 412 | ||||||
| 4 | Suprema, Inc. ● | 120 | ||||||
| 11,000 | ||||||||
| Spain - 0.5% | ||||||||
| 3 | Almirall S.A. ● | 42 | ||||||
| 3 | Endesa S.A. | 50 | ||||||
| 120 | Iberdrola S.A. | 848 | ||||||
| 17 | Tecnicas Reunidas S.A. | 844 | ||||||
| 45 | Telefonica S.A. | 674 | ||||||
| 2,458 | ||||||||
| Sweden - 0.2% | ||||||||
| 1 | Arcam AB ● | 35 | ||||||
| 9 | Avanza Bank Holding AB | 287 | ||||||
| 4 | Billerud | 61 | ||||||
| 19 | Boliden Ab | 316 | ||||||
| 3 | Fastighets AB Balder ● | 38 | ||||||
| 6 | Hennes & Mauritz Ab | 229 | ||||||
| 6 | Lundin Petroleum Ab ● | 78 | ||||||
| 9 | Telia Ab | 61 | ||||||
| 1,105 | ||||||||
| Switzerland - 1.3% | ||||||||
| 13 | ABB Ltd. ADR | 286 | ||||||
| 1 | Actelion Ltd. | 74 | ||||||
| 3 | Allreal Holding AG REIT | 359 | ||||||
| 1 | Compagnie Financiere Richemont S.A. | 55 | ||||||
| 46 | EFG International AG | 475 | ||||||
| 40 | Evolva Holding S.A. ● | 51 | ||||||
| 1 | Flughafen Zuerich AG | 462 | ||||||
| 34 | Gategroup Holding AG | 756 | ||||||
| 2 | Geberit AG | 547 | ||||||
| 17 | Julius Baer Group Ltd. | 728 | ||||||
| 2 | Mobimo Holding AG | 365 | ||||||
| 5 | PSP Swiss Property AG | 458 | ||||||
| — | Roche Holding AG | 130 | ||||||
| 6 | Swiss Prime Site AG | 449 | ||||||
| — | Swisscom AG | 118 | ||||||
| 1 | Syngenta AG | 290 | ||||||
| 32 | UBS AG | 558 | ||||||
| 6,161 | ||||||||
| Taiwan - 2.6% | ||||||||
| 47 | Advantech Co., Ltd. | 327 | ||||||
| 135 | Aerospace Industrial Development Corp. ● | 148 | ||||||
| 19 | AIC, Inc. | 93 | ||||||
| 40 | AirTac International Group | 291 | ||||||
| 159 | Asia Cement Corp. | 205 | ||||||
| 13 | ASPEED Technology, Inc. | 102 | ||||||
| 42 | Catcher Technology Co., Ltd. | 356 | ||||||
| 112 | Cheng Shin Rubber Industries Co., Ltd. | 262 | ||||||
| 34 | China Motor Corp. | 31 | ||||||
| 637 | China Petrochemical Dev Corp. ● | 202 | ||||||
| 9 | China Steel Chemical Corp. | 52 | ||||||
| 325 | China Steel Corp. | 280 | ||||||
| 85 | Chroma Ate, Inc. | 212 | ||||||
| 93 | Delta Electronics, Inc. | 560 | ||||||
| 8 | Ememory Technology, Inc. | 83 | ||||||
| 150 | Evergreen Marine Corp., Ltd. ● | 89 | ||||||
| 155 | Far Eastern New Century Corp. | 163 | ||||||
| 10 | Feng Hsin Iron & Steel Co. | 13 | ||||||
| 11 | Giant Manufacturing | 85 | ||||||
| 8 | Hermes Microvision, Inc. | 378 | ||||||
| 11 | Hiwin Technologies Corp. | 90 | ||||||
| 60 | Holtek Semiconductor, Inc. | 102 | ||||||
| 55 | Hota Industrial Manufacturing Co., Ltd. | 98 | ||||||
| 19 | ISSC Technologies Corp. | 86 | ||||||
| 21 | King Slide Works Co., Ltd. | 276 | ||||||
| 203 | King Yuan Electronics Co., Ltd. | 161 | ||||||
| 79 | Kinik Co. | 159 | ||||||
| 7 | Largan Precision Co., Ltd. | 502 | ||||||
| 33 | LCY Chemical Corp. | 16 | ||||||
| 43 | MediaTek, Inc. | 615 | ||||||
| 25 | Merida Industry Co., Ltd. | 175 | ||||||
| 46 | Nan Kang Rubber Tire Co., Ltd. | 50 | ||||||
| 57 | Oriental Union Chemical Corp. | 43 | ||||||
| 33 | Pchome Online, Inc. | 331 | ||||||
| 109 | Pou Chen | 120 | ||||||
| 80 | Primax Electronics Ltd. ● | 97 | ||||||
| 79 | Promise Technology, Inc. | 93 | ||||||
| 90 | Ruentex Industries Ltd. | 193 | ||||||
| 33 | Silergy Corp. | 230 | ||||||
| 32 | Sporton International, Inc. | 153 | ||||||
| 43 | Standard Foods Corp. | 99 | ||||||
| 32 | Superalloy Industrial Co., Ltd. ● | 94 | ||||||
| 166 | Taiwan Cement | 254 | ||||||
| 72 | Taiwan Fertilizer Co., Ltd. | 127 | ||||||
| 25 | Taiwan Glass Industries Corp. | 19 | ||||||
| 699 | Taiwan Semiconductor Manufacturing Co., Ltd. | 3,030 | ||||||
| 111 | TECO Electric & Machinery Co., Ltd. | 124 | ||||||
| 30 | TSRC Corp. | 33 | ||||||
| 38 | Tung Ho Steel Enterprise Corp. | 30 | ||||||
| 195 | Uni-President Enterprises Corp. | 335 | ||||||
| 175 | Vanguard International Semiconductor Corp. | 263 | ||||||
| 244 | WPG Holdings Co., Ltd. | 297 | ||||||
| 89 | WT Microelectronics Co., Ltd. | 142 | ||||||
| 30 | Yageo Corp. | 46 | ||||||
| 76 | Yulon Motor Co. | 113 | ||||||
| 5 | Yulon Nissan Motor Co., Ltd. | 43 | ||||||
| 12,571 | ||||||||
| Thailand - 0.1% | ||||||||
| 32 | Delta Electronics Thailand PCL ● | 63 | ||||||
| 317 | Precious Shipping Public Co., Ltd. | 207 | ||||||
The accompanying notes are an integral part of these financial statements.
| 13 |
The Hartford Global All-Asset Fund
Consolidated Schedule of Investments – (continued)
October 31, 2014
(000’s Omitted)
| Shares or Principal Amount ╬ | Market Value ╪ | |||||||
| Common Stocks - 58.3% - (continued) | ||||||||
| Thailand - 0.1% - (continued) | ||||||||
| 33 | PTT Chemical Public Co., Ltd. | $ | 63 | |||||
| 27 | Total Access Communication Public Co., Ltd. | 85 | ||||||
| 418 | ||||||||
| Turkey - 0.1% | ||||||||
| 6 | Turkcell Iletisim Hizmetleri AS ● | 91 | ||||||
| 353 | Turkiye Sinai Kalkinma Bankasi A.S. | 309 | ||||||
| 22 | Ulker Biskuvi Sanayi AS ● | 161 | ||||||
| 561 | ||||||||
| United Arab Emirates - 0.0% | ||||||||
| 27 | Emaar Malls Group PJSC ● | 24 | ||||||
| United Kingdom - 2.6% | ||||||||
| 143 | African Barrick Gold Ltd. | 470 | ||||||
| 3 | Al Noor Hospitals Group | 42 | ||||||
| 4 | Arm Holdings plc | 58 | ||||||
| 133 | Ashmore Group plc | 681 | ||||||
| 21 | AstraZeneca plc | 1,546 | ||||||
| 4 | AstraZeneca plc ADR | 294 | ||||||
| 415 | Balfour Beatty plc | 1,025 | ||||||
| 26 | BG Group plc | 430 | ||||||
| 4 | Big Yellow Group REIT | 38 | ||||||
| 21 | BP plc | 150 | ||||||
| 10 | British American Tobacco plc | 539 | ||||||
| 22 | British Sky Broadcasting Group plc | 309 | ||||||
| 1 | Derwent London plc REIT | 39 | ||||||
| 3 | Diageo Capital plc | 82 | ||||||
| 7 | Dixons Carphone plc | 42 | ||||||
| 5 | Hammerson plc REIT | 48 | ||||||
| 25 | Hargreaves Lansdown plc | 391 | ||||||
| 26 | Home Retail Group | 75 | ||||||
| 78 | HSBC Holdings plc | 799 | ||||||
| 8 | Imperial Tobacco Group plc | 361 | ||||||
| 245 | Intu Properties plc | 1,335 | ||||||
| — | Kennedy Wilson Europe Real Estate plc | — | ||||||
| 30 | Marks & Spencer Group plc | 198 | ||||||
| 16 | National Grid plc | 237 | ||||||
| 5 | NMC Health plc | 40 | ||||||
| 41 | OM Asset Management plc ● | 611 | ||||||
| 26 | Ophilr Energy plc ● | 78 | ||||||
| 139 | Petra Diamonds Ltd. ● | 369 | ||||||
| 10 | PureCircle Ltd. ● | 98 | ||||||
| 198 | Qinetiq Group plc | 641 | ||||||
| 3 | Reckitt Benckiser Group plc | 273 | ||||||
| 8 | Reed Elsevier Capital, Inc. | 136 | ||||||
| 3 | Rio Tinto plc | 159 | ||||||
| 3 | Smith & Nephew plc | 58 | ||||||
| 8 | Spire Healthcare Group plc ● | 38 | ||||||
| 34 | Standard Chartered plc | 518 | ||||||
| 11 | Tate & Lyle plc | 110 | ||||||
| 12 | Tullow Oil plc | 91 | ||||||
| 4 | Unite Group plc | 26 | ||||||
| 7 | United Business Media Ltd. | 60 | ||||||
| — | Vodafone Group plc | — | ||||||
| — | Whitbread plc | 25 | ||||||
| 1 | Workspace Group plc ● | 14 | ||||||
| 6 | WPP plc | 126 | ||||||
| 12,660 | ||||||||
| United States - 20.4% | ||||||||
| 2 | Abbott Laboratories Θ | 84 | ||||||
| 1 | Acadia Healthcare Co., Inc. ● | 82 | ||||||
| 1 | Acadia Realty Trust REIT | 21 | ||||||
| 3 | Accenture plc | 251 | ||||||
| 184 | ACCO Brands Corp. ● | 1,516 | ||||||
| 1 | Acorda Therapeutics, Inc. ● | 46 | ||||||
| 2 | Actavis plc ● | 520 | ||||||
| 4 | Activision Blizzard, Inc. | 81 | ||||||
| 1 | Acuity Brands, Inc. | 72 | ||||||
| 14 | Adecoagro S.A. ● | 123 | ||||||
| 35 | Advance Automotive Parts, Inc. ╦ | 5,159 | ||||||
| 6 | AECOM Technology Corp. ● | 183 | ||||||
| 1 | Aetna, Inc. | 113 | ||||||
| 2 | Agilent Technologies, Inc. Θ | 86 | ||||||
| 1 | Agios Pharmaceuticals, Inc. ● | 72 | ||||||
| 3 | Akamai Technologies, Inc. ● | 174 | ||||||
| 362 | Alacer Gold Corp. | 600 | ||||||
| 5 | Alkermes plc ● | 228 | ||||||
| 5 | Alleghany Corp. ●╦ | 2,426 | ||||||
| 19 | Allegheny Technologies, Inc. | 610 | ||||||
| 1 | Allegion plc | 60 | ||||||
| 1 | Alliance Data Systems Corp. ● | 188 | ||||||
| 2 | Alliant Energy Corp. | 99 | ||||||
| 1 | Alnylam Pharmaceuticals, Inc. ● | 73 | ||||||
| 16 | Altria Group, Inc. | 783 | ||||||
| 2 | Amazon.com, Inc. ● | 763 | ||||||
| 1 | American Tower Corp. REIT | 52 | ||||||
| 4 | AMETEK, Inc. | 193 | ||||||
| 1 | Anadarko Petroleum Corp. | 125 | ||||||
| 2 | Andersons (The), Inc. | 103 | ||||||
| 2 | Apache Corp. | 167 | ||||||
| 12 | Apple, Inc. ╦ | 1,344 | ||||||
| 8 | Applied Materials, Inc. | 187 | ||||||
| 10 | Archer-Daniels-Midland Co. | 458 | ||||||
| 19 | Arena Pharmaceuticals, Inc. ● | 83 | ||||||
| 7 | Aruba Networks, Inc. ● | 148 | ||||||
| 1 | athenahealth, Inc. ● | 94 | ||||||
| 2 | Automatic Data Processing, Inc. | 158 | ||||||
| — | AutoZone, Inc. ● | 169 | ||||||
| 1 | AvalonBay Communities, Inc. REIT | 94 | ||||||
| — | AVIV REIT, Inc. | 13 | ||||||
| 7 | Baker Hughes, Inc. | 362 | ||||||
| 2 | Ball Corp. | 110 | ||||||
| — | Becton, Dickinson & Co. | 51 | ||||||
| 41 | Belden, Inc. | 2,946 | ||||||
| 1 | Biogen Idec, Inc. ● | 209 | ||||||
| 36 | Bizlink Holding, Inc. | 126 | ||||||
| 1 | Boeing Co. | 114 | ||||||
| 2 | Boise Cascade Co. ● | 70 | ||||||
| 1 | Boston Properties, Inc. REIT | 69 | ||||||
| 12 | Boston Scientific Corp. ● | 164 | ||||||
| 12 | Bristol-Myers Squibb Co. | 717 | ||||||
| 1 | Brookdale Senior Living, Inc. ● | 21 | ||||||
| 3 | Bunge Ltd. Finance Corp. | 239 | ||||||
| 1 | Cabot Corp. | 34 | ||||||
| 5 | Cabot Oil & Gas Corp. | 152 | ||||||
| 1 | CACI International, Inc. Class A ● | 60 | ||||||
| 2 | Cadence Design Systems, Inc. ● | 39 | ||||||
| 1 | Cardinal Health, Inc. | 90 | ||||||
| 2 | Cardtronics, Inc. ● | 75 | ||||||
| 38 | Carlisle Cos., Inc. | 3,408 | ||||||
| 1 | Caterpillar, Inc. Θ | 88 | ||||||
The accompanying notes are an integral part of these financial statements.
| 14 |
The Hartford Global All-Asset Fund
Consolidated Schedule of Investments – (continued)
October 31, 2014
(000’s Omitted)
| Shares or Principal Amount ╬ | Market Value ╪ | |||||||
| Common Stocks - 58.3% - (continued) | ||||||||
| United States - 20.4% - (continued) | ||||||||
| 1 | CDK Global, Inc. ● | $ | 22 | |||||
| 2 | Celanese Corp. | 91 | ||||||
| 2 | Celgene Corp. ● | 260 | ||||||
| 1 | CF Industries Holdings, Inc. | 343 | ||||||
| 2 | Charter Communications, Inc. ● | 291 | ||||||
| 3 | Chevron Corp. | 419 | ||||||
| 1 | Churchill Downs, Inc. | 152 | ||||||
| 1 | CIGNA Corp. | 101 | ||||||
| 1 | Cimarex Energy Co. | 111 | ||||||
| 19 | Cisco Systems, Inc. | 459 | ||||||
| 17 | Citigroup, Inc. | 932 | ||||||
| 6 | Cobalt International Energy, Inc. ● | 69 | ||||||
| 17 | Coca-Cola Co. | 725 | ||||||
| 7 | Cognizant Technology Solutions Corp. ● | 329 | ||||||
| 6 | Colfax Corp. ● | 324 | ||||||
| 7 | Comcast Corp. Class A | 387 | ||||||
| 4 | Comcast Corp. Special Class A | 203 | ||||||
| 6 | ConocoPhillips Holding Co. | 461 | ||||||
| 3 | Consol Energy, Inc. | 106 | ||||||
| 1 | Corporate Office Properties REIT | 15 | ||||||
| 3 | Costco Wholesale Corp. | 361 | ||||||
| 11 | Coty, Inc. | 182 | ||||||
| 2 | Cousins Properties, Inc. REIT | 29 | ||||||
| — | Covance, Inc. ● | 35 | ||||||
| 7 | Covenant Transport ● | 136 | ||||||
| 2 | Covidien plc | 214 | ||||||
| 2 | Crown Holdings, Inc. ● | 101 | ||||||
| 55 | CST Brands, Inc. ╦ | 2,096 | ||||||
| 1 | Cubist Pharmaceuticals, Inc. ● | 62 | ||||||
| 5 | CVS Health Corp. | 457 | ||||||
| 5 | Danaher Corp. | 380 | ||||||
| 4 | Dean Foods Co. | 64 | ||||||
| 11 | Deltic Timber Corp. | 710 | ||||||
| 43 | Dorian LPG Ltd. ● | 622 | ||||||
| 2 | Douglas Emmett, Inc. REIT | 44 | ||||||
| 2 | Dover Corp. | 120 | ||||||
| 4 | Dow Chemical Co. | 181 | ||||||
| 1 | DreamWorks Animation SKG, Inc. ● | 24 | ||||||
| 3 | DSW, Inc. | 86 | ||||||
| 3 | Duke Energy Corp. | 210 | ||||||
| — | EastGroup Properties, Inc. REIT | 30 | ||||||
| 3 | Eaton Corp. plc | 197 | ||||||
| 3 | eBay, Inc. ● | 177 | ||||||
| 1 | Edison International | 32 | ||||||
| 3 | Education Realty Trust, Inc. REIT | 28 | ||||||
| 7 | Eli Lilly & Co. | 472 | ||||||
| 1 | Energen Corp. | 100 | ||||||
| 1 | Energizer Holdings, Inc. | 144 | ||||||
| 4 | Envision Healthcare Holdings ● | 137 | ||||||
| 1 | EOG Resources, Inc. | 117 | ||||||
| 2 | Equifax, Inc. | 141 | ||||||
| 1 | Equity Lifestyle Properties, Inc. REIT | 45 | ||||||
| 37 | ERA Group, Inc. ● | 873 | ||||||
| — | Essex Property Trust, Inc. REIT | 76 | ||||||
| — | Euronet Worldwide, Inc. ● | 7 | ||||||
| 1 | Extra Space Storage, Inc. REIT | 30 | ||||||
| 7 | Exxon Mobil Corp. | 660 | ||||||
| 1 | F5 Networks, Inc. ● | 180 | ||||||
| 3 | Facebook, Inc. ● | 253 | ||||||
| 5 | Federal Agricultural Mortgage Corp. | 175 | ||||||
| — | Federal Realty Investment Trust REIT | 44 | ||||||
| 3 | FedEx Corp. | 466 | ||||||
| 8 | Financial Engines, Inc. | 337 | ||||||
| 3 | First Solar, Inc. ● | 182 | ||||||
| 60 | Fiserv, Inc. ● | 4,142 | ||||||
| 2 | Five Below, Inc. ● | 98 | ||||||
| 35 | Ford Motor Co. | 486 | ||||||
| 2 | Forest City Enterprises, Inc. REIT ● | 39 | ||||||
| 8 | Freescale Semiconductor Holdings Ltd. ● | 151 | ||||||
| 38 | GATX Corp. ╦ | 2,405 | ||||||
| 1 | General Dynamics Corp. | 164 | ||||||
| 3 | General Growth Properties, Inc. REIT | 89 | ||||||
| 8 | Genpact Ltd. ● | 134 | ||||||
| 4 | Gilead Sciences, Inc. ● | 475 | ||||||
| 1 | Golar Ltd. | 63 | ||||||
| — | Google, Inc. Class A ● | 32 | ||||||
| — | Google, Inc. Class C ● | 260 | ||||||
| 58 | Graphic Packaging Holding Co. ● | 708 | ||||||
| 18 | Great Western Bancorp, Inc. ● | 352 | ||||||
| 2 | Halliburton Co. | 115 | ||||||
| 6 | Harley-Davidson, Inc. | 398 | ||||||
| 4 | HCA Holdings, Inc. ● | 269 | ||||||
| 1 | Health Care REIT, Inc. | 99 | ||||||
| 4 | Heartland Payment Systems, Inc. | 218 | ||||||
| 1 | Heico Corp. Class A | 49 | ||||||
| 6 | Hewlett-Packard Co. | 225 | ||||||
| 140 | Higher One Holdings, Inc. ● | 361 | ||||||
| 17 | Home Inns & Hotels Management, Inc. ● | 514 | ||||||
| 4 | Honeywell International, Inc. | 364 | ||||||
| 1 | Hospira, Inc. ● | 50 | ||||||
| 2 | HSN, Inc. | 125 | ||||||
| 2 | Huron Consulting Group, Inc. ● | 164 | ||||||
| 4 | IDEX Corp. | 270 | ||||||
| 4 | Illinois Tool Works, Inc. | 356 | ||||||
| 2 | IMS Health Holdings, Inc. ● | 56 | ||||||
| 2 | Incyte Corp. ● | 101 | ||||||
| 3 | Ingersoll-Rand plc | 205 | ||||||
| 5 | Ingredion, Inc. | 384 | ||||||
| 21 | Intel Corp. | 712 | ||||||
| 4 | Intelsat S.A. ● | 81 | ||||||
| 7 | International Paper Co. | 377 | ||||||
| 1 | International Rectifier Corp. ● | 41 | ||||||
| 1 | Intuit, Inc. | 129 | ||||||
| 5 | Ironwood Pharmaceuticals, Inc. ● | 69 | ||||||
| 2 | J.B. Hunt Transport Services, Inc. | 185 | ||||||
| 3 | Johnson & Johnson | 282 | ||||||
| 6 | JP Morgan Chase & Co. | 370 | ||||||
| 1 | Kansas City Southern | 127 | ||||||
| 7 | KBR, Inc. | 126 | ||||||
| 1 | Kennedy-Wilson Holdings, Inc. | 30 | ||||||
| — | Kilroy Realty Corp. REIT | 32 | ||||||
| 2 | Kinder Morgan, Inc. | 75 | ||||||
| 1 | Kite Realty Group Trust REIT | 14 | ||||||
| 2 | Kraft Foods Group, Inc. | 115 | ||||||
| 1 | L Brands, Inc. | 100 | ||||||
| 2 | Las Vegas Sands Corp. | 148 | ||||||
| 4 | Liberty Global plc ● | 161 | ||||||
| 79 | Liberty Global plc Class C ● | 3,528 | ||||||
| 1 | Lockheed Martin Corp. | 213 | ||||||
| 4 | Lorillard, Inc. | 223 | ||||||
The accompanying notes are an integral part of these financial statements.
| 15 |
The Hartford Global All-Asset Fund
Consolidated Schedule of Investments – (continued)
October 31, 2014
(000’s Omitted)
| Shares or Principal Amount ╬ | Market Value ╪ | |||||||
| Common Stocks - 58.3% - (continued) | ||||||||
| United States - 20.4% - (continued) | ||||||||
| 4 | Louisiana-Pacific Corp. ● | $ | 55 | |||||
| 10 | Lowe's Cos., Inc. | 571 | ||||||
| 1 | LyondellBasell Industries Class A | 114 | ||||||
| 2 | Marketo, Inc. ● | 52 | ||||||
| 69 | Mattel, Inc. | 2,150 | ||||||
| 6 | Mavenir Systems, Inc. ● | 68 | ||||||
| 72 | Maxim Integrated Products, Inc. | 2,125 | ||||||
| — | McGraw Hill Financial, Inc. | 34 | ||||||
| 1 | McKesson Corp. | 301 | ||||||
| 1 | MeadWestvaco Corp. | 39 | ||||||
| 4 | Medicines Co. ● | 94 | ||||||
| 4 | Medtronic, Inc. | 284 | ||||||
| 8 | Merck & Co., Inc. | 463 | ||||||
| 22 | Microsoft Corp. | 1,034 | ||||||
| 1 | MKS Instruments, Inc. | 42 | ||||||
| 11 | Mondelez International, Inc. | 402 | ||||||
| 7 | Monsanto Co. | 760 | ||||||
| 5 | Monster Beverage Corp. ● | 509 | ||||||
| 5 | Mosaic Co. | 219 | ||||||
| 22 | Motorola Solutions, Inc. | 1,390 | ||||||
| 12 | MRC Global, Inc. ● | 249 | ||||||
| 1 | Mylan, Inc. ● | 56 | ||||||
| 1 | National Oilwell Varco, Inc. | 49 | ||||||
| 1 | Netflix, Inc. ● | 217 | ||||||
| 3 | NextEra Energy, Inc. | 343 | ||||||
| 3 | Nielsen N.V. | 140 | ||||||
| 4 | Nimble Storage, Inc. ● | 99 | ||||||
| 6 | Norfolk Southern Corp. | 713 | ||||||
| 3 | Northeast Utilities | 136 | ||||||
| 3 | Norwegian Cruise Line Holdings Ltd. ● | 110 | ||||||
| 5 | NPS Pharmaceuticals, Inc. ● | 133 | ||||||
| 4 | Nu Skin Enterprises, Inc. Class A | 222 | ||||||
| 4 | OGE Energy Corp. | 152 | ||||||
| 5 | Omnova Solutions, Inc. ● | 33 | ||||||
| 3 | Orbital Sciences Corp. ● | 66 | ||||||
| 2 | Owens-Illinois, Inc. ● | 46 | ||||||
| — | Packaging Corp. of America | 31 | ||||||
| 2 | Pattern Energy Group, Inc. | 46 | ||||||
| 1 | Pebblebrook Hotel Trust REIT | 29 | ||||||
| 5 | Pentair plc | 306 | ||||||
| 1 | PG&E Corp. | 45 | ||||||
| 4 | Philip Morris International, Inc. | 363 | ||||||
| 2 | Physicians Realty Trust | 27 | ||||||
| 1 | Pioneer Natural Resources Co. | 156 | ||||||
| 51 | Post Holdings, Inc. ● | 1,923 | ||||||
| 1 | Power Integrations, Inc. | 70 | ||||||
| 1 | Precision Castparts Corp. | 151 | ||||||
| 4 | Prestige Brands Holdings, Inc. ● | 124 | ||||||
| — | Priceline (The) Group, Inc. ● | 142 | ||||||
| — | Public Storage REIT | 79 | ||||||
| 5 | Qihoo 360 Technology Co., Ltd. ● | 348 | ||||||
| 3 | Quintiles Transnational Holdings ● | 148 | ||||||
| 1 | Ralph Lauren Corp. | 133 | ||||||
| 2 | Raytheon Co. | 181 | ||||||
| 1 | Regeneron Pharmaceuticals, Inc. ● | 567 | ||||||
| 2 | Reliance Steel & Aluminum | 164 | ||||||
| 2 | Retail Properties of America, Inc. | 33 | ||||||
| 1 | RLJ Lodging Trust REIT | 38 | ||||||
| 6 | Rock Tenn Co. Class A | 299 | ||||||
| 1 | Rogers Corp. ● | 67 | ||||||
| 2 | Ross Stores, Inc. | 174 | ||||||
| 3 | Salesforce.com, Inc. ● | 201 | ||||||
| — | Salix Pharmaceuticals Ltd. ● | 56 | ||||||
| 43 | Santander Consumer USA Holdings, Inc. | 791 | ||||||
| 2 | Schlumberger Ltd. | 151 | ||||||
| 210 | Scorpio Tankers, Inc. | 1,832 | ||||||
| 16 | Seacor Holdings, Inc. ● | 1,282 | ||||||
| 1 | Seattle Genetics, Inc. ● | 42 | ||||||
| — | Sherwin-Williams Co. | 94 | ||||||
| 1 | Signet Jewelers Ltd. | 114 | ||||||
| 1 | Simon Property Group, Inc. REIT | 119 | ||||||
| 1 | SL Green Realty Corp. REIT | 69 | ||||||
| 2 | Snyders-Lance, Inc. | 62 | ||||||
| 2 | Southwestern Energy Co. ● | 58 | ||||||
| 13 | Spirit Aerosystems Holdings, Inc. ● | 521 | ||||||
| 2 | St. Jude Medical, Inc. | 157 | ||||||
| 3 | Starbucks Corp. | 209 | ||||||
| — | Starwood Hotels & Resorts, Inc. | 19 | ||||||
| 1 | Stratasys Ltd. ● | 135 | ||||||
| 1 | Stryker Corp. | 126 | ||||||
| 18 | Symantec Corp. | 438 | ||||||
| — | Taubman Centers, Inc. REIT | 27 | ||||||
| 1 | Teledyne Technologies, Inc. ● | 81 | ||||||
| 2 | Tempur Sealy International, Inc. ● | 99 | ||||||
| 1 | Tesla Motors, Inc. ● | 149 | ||||||
| 13 | Textron, Inc. | 549 | ||||||
| 1 | Thermo Fisher Scientific, Inc. | 115 | ||||||
| 3 | TJX Cos., Inc. | 220 | ||||||
| 4 | Tuesday Morning Corp. ● | 89 | ||||||
| 9 | Twenty-First Century Fox, Inc. | 302 | ||||||
| 5 | Tyson Foods, Inc. Class A | 203 | ||||||
| 1 | UDR, Inc. REIT | 34 | ||||||
| 2 | UGI Corp. | 76 | ||||||
| 1 | Ultragenyx Pharmaceutical, Inc. ● | 53 | ||||||
| 8 | United Continental Holdings, Inc. ● | 428 | ||||||
| 3 | United Technologies Corp. | 358 | ||||||
| 1 | UnitedHealth Group, Inc. | 109 | ||||||
| — | Universal Health Services, Inc. Class B | 13 | ||||||
| 5 | UTI Worldwide, Inc. ● | 54 | ||||||
| 2 | VeriFone Systems, Inc. ● | 78 | ||||||
| 3 | Verizon Communications, Inc. | 158 | ||||||
| 2 | Vertex Pharmaceuticals, Inc. ● | 207 | ||||||
| 2 | Visa, Inc. | 509 | ||||||
| 5 | Wabash National Corp. ● | 48 | ||||||
| 1 | Wageworks, Inc. ● | 70 | ||||||
| 2 | Walgreen Co. | 146 | ||||||
| 5 | Walt Disney Co. | 460 | ||||||
| 1 | Wayfair, Inc. ● | 29 | ||||||
| 55 | Wells Fargo & Co. ╦ | 2,912 | ||||||
| 2 | WESCO International, Inc. ● | 164 | ||||||
| 2 | Western Digital Corp. | 165 | ||||||
| 1 | Westlake Chemical Corp. | 41 | ||||||
| 1 | WEX, Inc. ● | 149 | ||||||
| 1 | Weyerhaeuser Co. REIT | 28 | ||||||
| 1 | Whiting Petroleum Corp. ● | 76 | ||||||
| 3 | Wyndham Worldwide Corp. | 209 | ||||||
| 29 | XL Group plc | 972 | ||||||
| — | Xoom Corp. ● | 3 | ||||||
| 1 | Yelp, Inc. ● | 51 | ||||||
| 1 | Zimmer Holdings, Inc. | 80 | ||||||
The accompanying notes are an integral part of these financial statements.
| 16 |
The Hartford Global All-Asset Fund
Consolidated Schedule of Investments – (continued)
October 31, 2014
(000’s Omitted)
| Shares or Principal Amount ╬ | Market Value ╪ | |||||||
| Common Stocks - 58.3% - (continued) | ||||||||
| United States - 20.4% - (continued) | ||||||||
| 10 | Zoetis, Inc. | $ | 366 | |||||
| 2 | Zulily, Inc. ● | 58 | ||||||
| 100,349 | ||||||||
| Total Common Stocks | ||||||||
| (Cost $265,637) | $ | 287,280 | ||||||
Exchange Traded Funds - 4.0% | ||||||||
| United States - 4.0% | ||||||||
| 9 | iShares MSCI EAFE ETF | $ | 576 | |||||
| 25 | Market Vectors Gold Miners ETF | 422 | ||||||
| 638 | PowerShares Senior Loan Portfolio | 15,557 | ||||||
| 3 | S&P 500 Depositary Receipt | 583 | ||||||
| 57 | SPDR Barclays Convertible Securities ETF | 2,819 | ||||||
| 19,957 | ||||||||
| Total Exchange Traded Funds | ||||||||
| (Cost $20,251) | $ | 19,957 | ||||||
Preferred Stocks - 0.4% | ||||||||
| Germany - 0.4% | ||||||||
| 8 | Volkswagen AG N.V. | $ | 1,739 | |||||
| United States - 0.0% | ||||||||
| 5 | Nutanix, Inc. ⌂●† | 57 | ||||||
| 1 | Uber Technologies, Inc. ⌂●† | 63 | ||||||
| 120 | ||||||||
| Total Preferred Stocks | ||||||||
| (Cost $1,984) | $ | 1,859 | ||||||
Warrants - 0.1% | ||||||||
| British Virgin Islands - 0.0% | ||||||||
| 77 | Atlas Mara Co-Nvest Ltd. | $ | 31 | |||||
| China - 0.0% | ||||||||
| 28 | Hangzhou HIK-Vision Digital-A Technology Co., Ltd. ⌂ | 91 | ||||||
| Greece - 0.1% | ||||||||
| 198 | Alpha Bank A.E. | 318 | ||||||
| Total Warrants | ||||||||
| (Cost $493) | $ | 440 | ||||||
| Total Long-Term Investments Excluding Purchased Options | ||||||||
| (Cost $431,344) | $ | 450,404 | ||||||
| Short-Term Investments - 9.8% | ||||||||
| Repurchase Agreements - 9.8% | ||||||||
| Bank of America Merrill Lynch TriParty Repurchase Agreement (maturing on 11/03/2014 in the amount of $137, collateralized by U.S. Treasury Note 1.50%, 2019, value of $140) | ||||||||
| $ | 137 | 0.08%, 10/31/2014 | $ | 137 | ||||
| Bank of America Merrill Lynch TriParty Repurchase Agreement (maturing on 11/03/2014 in the amount of $2,340, collateralized by GNMA 1.63% - 7.00%, 2031 - 2054, value of $2,387) | ||||||||
| 2,340 | 0.09%, 10/31/2014 ╦ | 2,340 | ||||||
| Bank of Montreal TriParty Repurchase Agreement (maturing on 11/03/2014 in the amount of $629, collateralized by U.S. Treasury Bond 2.88% - 5.25%, 2029 - 2043, U.S. Treasury Note 0.38% - 4.50%, 2015 - 2022, value of $641) | ||||||||
| 629 | 0.08%, 10/31/2014 | 629 | ||||||
| Bank of Montreal TriParty Repurchase Agreement (maturing on 11/03/2014 in the amount of $2,132, collateralized by FHLMC 2.00% - 5.50%, 2022 - 2034, FNMA 2.00% - 4.50%, 2024 - 2039, GNMA 3.00%, 2043, U.S. Treasury Note 4.63%, 2017, value of $2,174) | ||||||||
| 2,132 | 0.10%, 10/31/2014 | 2,132 | ||||||
| Barclays Capital TriParty Repurchase Agreement (maturing on 11/03/2014 in the amount of $8,032, collateralized by U.S. Treasury Bond 4.50% - 6.25%, 2023 - 2036, U.S. Treasury Note 1.63% - 2.13%, 2015 - 2019, value of $8,192) | ||||||||
| 8,032 | 0.08%, 10/31/2014 | 8,032 | ||||||
| Citigroup Global Markets, Inc. TriParty Repurchase Agreement (maturing on 11/03/2014 in the amount of $9,232, collateralized by U.S. Treasury Bill 0.02%, 2015, U.S. Treasury Bond 3.88% - 11.25%, 2015 - 2040, U.S. Treasury Note 2.00% - 3.38%, 2019 - 2021, value of $9,416) | ||||||||
| 9,232 | 0.09%, 10/31/2014 | 9,232 | ||||||
| Deutsche Bank Securities TriParty Repurchase Agreement (maturing on 11/03/2014 in the amount of $533, collateralized by U.S. Treasury Note 0.88%, 2017, value of $544) | ||||||||
| 533 | 0.13%, 10/31/2014 | 533 | ||||||
| RBS Securities, Inc. TriParty Repurchase Agreement (maturing on 11/03/2014 in the amount of $784, collateralized by U.S. Treasury Bond 3.63% - 5.00%, 2037 - 2043, U.S. Treasury Note 2.13%, 2020, value of $800) | ||||||||
| 784 | 0.07%, 10/31/2014 | 784 | ||||||
| Societe Generale TriParty Repurchase Agreement (maturing on 11/03/2014 in the amount of $8,264, collateralized by U.S. Treasury Bill 0.02%, 2015, U.S. Treasury Bond 3.75% - 11.25%, 2015 - 2043, U.S. Treasury Note 1.38% - 4.25%, 2015 - 2022, value of $8,429) | ||||||||
| 8,264 | 0.08%, 10/31/2014 | 8,264 | ||||||
The accompanying notes are an integral part of these financial statements.
| 17 |
The Hartford Global All-Asset Fund
Consolidated Schedule of Investments – (continued)
October 31, 2014
(000’s Omitted)
| Shares or Principal Amount ╬ | Market Value ╪ | |||||||||||
| Short-Term Investments - 9.8% - (continued) | ||||||||||||
| Repurchase Agreements - 9.8% - (continued) | ||||||||||||
| TD Securities TriParty Repurchase Agreement (maturing on 11/03/2014 in the amount of $16,014, collateralized by FHLMC 3.00% - 4.00%, 2026 - 2044, FNMA 2.50% - 5.00%, 2025 - 2044, U.S. Treasury Bond 3.50% - 6.50%, 2026 - 2041, U.S. Treasury Note 1.75% - 2.88%, 2018 - 2019, value of $16,335) | ||||||||||||
| $ | 16,014 | 0.10%, 10/31/2014 | $ | 16,014 | ||||||||
| Total Short-Term Investments | ||||||||||||
| (Cost $48,097) | $ | 48,097 | ||||||||||
| Total Investments Excluding Purchased Options | ||||||||||||
| (Cost $479,441) | 101.1 | % | $ | 498,501 | ||||||||
| Total Purchased Options | ||||||||||||
| (Cost $534) | 0.2 | % | 923 | |||||||||
| Total Investments | ||||||||||||
| (Cost $479,975) ▲ | 101.3 | % | $ | 499,424 | ||||||||
| Other Assets and Liabilities | (1.3 | )% | (6,492 | ) | ||||||||
| Total Net Assets | 100.0 | % | $ | 492,932 | ||||||||
The accompanying notes are an integral part of these financial statements.
| 18 |
The Hartford Global All-Asset Fund
Consolidated Schedule of Investments – (continued)
October 31, 2014
(000’s Omitted)
| Note: | Percentage of investments as shown is the ratio of the total market value to total net assets. |
Prices of foreign equities that are principally traded on certain foreign markets may be adjusted daily pursuant to a fair value pricing service approved by the Board of Directors in order to reflect an adjustment for factors occurring after the close of certain foreign markets but before the close of the New York Stock Exchange.
The Consolidated Schedule of Investments includes investments held by The Hartford Cayman Global All-Asset Fund, Ltd. (the "Subsidiary"), a wholly owned subsidiary of the Fund, which primarily invests in commodity-related instruments. The Fund may invest up to 25% of its total assets in the Subsidiary. As of October 31, 2014, the Fund invested 3.3% of its total assets in the Subsidiary.
The Fund may refer to any one or more of the industry classifications used by one or more widely recognized market indices, ratings group indices and/or as defined by Fund management. Industry classifications may not be identical across all security types.
Other than the industry classifications "Other Investment Pools and Funds" and "Exchange Traded Funds," equity industry classifications used in this report are the Global Industry Classification Standard, which was developed by and is the exclusive property and service mark of MSCI, Inc. and Standard & Poor’s.
For Fund compliance purposes, the Fund may not use the same classification system shown in this report as these classifications are used for reporting ease.
| ▲ | At October 31, 2014, the cost of securities for federal income tax purposes was $481,842 and the aggregate gross unrealized appreciation and depreciation based on that cost were: |
| Unrealized Appreciation | $ | 41,243 | ||
| Unrealized Depreciation | (23,661 | ) | ||
| Net Unrealized Appreciation | $ | 17,582 |
| ╬ | All principal amounts are in U.S. dollars unless otherwise indicated. |
| † | These securities were valued in good faith at fair value as determined under policies and procedures established by and under the supervision of the Board of Directors. At October 31, 2014, the aggregate fair value of these securities was $120, which rounds to zero percent of total net assets. This amount excludes securities that are principally traded in certain foreign markets and whose prices are adjusted pursuant to a third party pricing service methodology approved by the Board of Directors. |
| ● | Non-income producing. |
| Δ | Variable rate securities; the rate reported is the coupon rate in effect at October 31, 2014. |
| ○ | The interest rate disclosed for these securities represents the effective yield on the date of the acquisition. |
| ◄ | The principal amount for this security is adjusted for inflation and the interest payments equal a fixed percentage of the inflation-adjusted principal amount. |
| ■ | Securities issued within terms of a private placement memorandum, exempt from registration under Rule 144A under the Securities Act of 1933, as amended, and may be sold only to qualified institutional buyers. Unless otherwise indicated, these holdings are determined to be liquid. At October 31, 2014, the aggregate value of these securities was $12,633, which represents 2.6% of total net assets. |
| § | These securities were sold to the Fund under Regulation S, rules governing offers and sales made outside the United States without registration under the Securities Act of 1933, as amended. The Fund may only be able to resell these securities in the United States if an exemption from registration under the federal and state securities laws is available, or the Fund may only be able to sell these securities outside of the United States (such as on a foreign exchange) to a non-U.S. person. Unless otherwise indicated, these holdings are determined to be liquid. At October 31, 2014, the aggregate value of these securities was $27,141, which represents 5.5% of total net assets. |
| ⌂ | The following securities are considered illiquid. Illiquid securities are often purchased in private placement transactions, are often not registered under the Securities Act of 1933, as amended, and may have contractual restrictions on resale. A security may also be considered illiquid if the security lacks a readily available market or if its valuation has not changed for a certain period of time. |
| Period Acquired | Shares/ Par | Security | Cost Basis | |||||||
| 07/2014 | 28 | Hangzhou HIK-Vision Digital-A Technology Co., Ltd. Warrants | $ | 74 | ||||||
| 08/2014 | 5 | Nutanix, Inc. Preferred | 63 | |||||||
| 06/2014 | 1 | Uber Technologies, Inc. Preferred | 71 | |||||||
At October 31, 2014, the aggregate value of these securities was $211, which rounds to zero percent of total net assets.
| ♠ | Perpetual maturity security. Maturity date shown is the next call date or final legal maturity date, whichever comes first. |
The accompanying notes are an integral part of these financial statements.
| 19 |
The Hartford Global All-Asset Fund
Consolidated Schedule of Investments – (continued)
October 31, 2014
(000’s Omitted)
| Ð | Represents or includes a TBA transaction. |
| ☼ | This security, or a portion of this security, was purchased on a when-issued or delayed-delivery basis. The cost of these securities was $15,612 at October 31, 2014. |
| ‡ | This security, or a portion of this security, has been segregated to cover funding requirements on investment transactions settling in the future. |
| ╦ | This security, or a portion of this security, has been pledged as collateral in connection with OTC swap contracts. |
| Θ | This security, or a portion of this security, has been pledged as collateral in connection with OTC option and/or swaption contracts. |
Cash pledged and received as collateral in connection with derivatives at October 31, 2014:
| Pledged | Received | |||||||
| OTC option and/or OTC swap contracts | $ | 1,440 | $ | 213 | ||||
| Futures contracts | 7,920 | – | ||||||
| Centrally cleared swaps contracts | 201 | – | ||||||
| Total | $ | 9,561 | $ | 213 | ||||
OTC Option Contracts Outstanding at October 31, 2014
| Description | Counter
- party | Risk
Exposure Category | Exercise
Price/ FX Rate/ Rate | Expiration Date | Number
of Contracts * | Market
Value ╪ | Premiums
Received/ Paid by Fund Δ | Unrealized Appreciation (Depreciation) | ||||||||||||||||
| Purchased Option contracts: | ||||||||||||||||||||||||
| Calls | ||||||||||||||||||||||||
| Brent Oil Option ƻ | DEUT | CO | 140.00 USD | 02/09/15 | USD | 1,355,000 | $ | – | $ | 53 | $ | (53 | ) | |||||||||||
| Brent Oil Option ƻ | DEUT | CO | 150.00 USD | 11/10/15 | USD | 1,407,900 | 11 | 40 | (29 | ) | ||||||||||||||
| Brent Oil Option ƻ | JPM | CO | 150.00 USD | 08/11/15 | USD | 1,355,000 | 6 | 42 | (36 | ) | ||||||||||||||
| Palladium Option | GSC | CO | 858.00 USD | 12/29/14 | USD | 1,404 | 15 | 68 | (53 | ) | ||||||||||||||
| Total Calls | 4,119,304 | $ | 32 | $ | 203 | $ | (171 | ) | ||||||||||||||||
| Puts | ||||||||||||||||||||||||
| Deutsche Lufthansa Option | DEUT | EQ | 12.55 EUR | 12/19/14 | EUR | 186,121 | $ | 243 | $ | 102 | $ | 141 | ||||||||||||
| EUR Put/USD Call Option | GSC | FX | 1.30 USD per EUR | 11/17/14 | EUR | 12,041,031 | 567 | 47 | 520 | |||||||||||||||
| International Consolidated Option | BOA | EQ | 364.10 GBP | 12/19/14 | GBP | 239,793 | 34 | 55 | (21 | ) | ||||||||||||||
| Total Puts | 12,466,945 | $ | 844 | $ | 204 | $ | 640 | |||||||||||||||||
| Total purchased option contracts | 16,586,249 | $ | 876 | $ | 407 | $ | 469 | |||||||||||||||||
| Written option contracts: | ||||||||||||||||||||||||
| Calls | ||||||||||||||||||||||||
| GBP Call/USD Put | DEUT | FX | 1.62 USD per GBP | 12/08/14 | GBP | 5,050,000 | $ | 24 | $ | 116 | $ | 92 | ||||||||||||
| Puts | ||||||||||||||||||||||||
| GBP Put/USD Call | DEUT | FX | 1.62 USD per GBP | 12/08/14 | GBP | 5,050,000 | $ | 109 | $ | 123 | $ | 14 | ||||||||||||
| Total written option contracts | 10,100,000 | $ | 133 | $ | 239 | $ | 106 | |||||||||||||||||
| * | The number of contracts does not omit 000's. |
| Δ | For purchased options, premiums are paid by the Fund, for written options, premiums are received. |
| ƻ | This security has limitations. If at time of expiration the price of a barrel of ICE Brent Crude is equal to or greater than the strike price, the counterparty will be required to pay the Fund the equivalent of par on the number of contracts traded. |
The accompanying notes are an integral part of these financial statements.
| 20 |
The Hartford Global All-Asset Fund
Consolidated Schedule of Investments – (continued)
October 31, 2014
(000’s Omitted)
Exchange Traded Option Contracts Outstanding at October 31, 2014
| Description | Risk Exposure Category | Exercise
Price/ FX Rate/ Rate | Expiration
Date | Number
of Contracts * | Market
Value ╪ | Premiums
Paid by Fund | Unrealized
Appreciation (Depreciation) | |||||||||||||||
| Purchased option contracts: | ||||||||||||||||||||||
| Calls | ||||||||||||||||||||||
| Cocoa Future Option | CO | 3,150.00 USD | 08/10/15 | USD | 38 | $ | 44 | $ | 64 | $ | (20 | ) | ||||||||||
| Hertz Global Holdings, Inc. Option | EQ | 33.00 USD | 12/20/14 | USD | 515 | 3 | 63 | (60 | ) | |||||||||||||
| Total Calls | 553 | $ | 47 | $ | 127 | $ | (80 | ) | ||||||||||||||
| Total purchased option contracts | 553 | $ | 47 | $ | 127 | $ | (80 | ) | ||||||||||||||
* The number of contracts does not omit 000's.
OTC Swaption Contracts Outstanding at October 31, 2014
| Description | Counter
- party | Risk Exposure Category | Exercise
Price/ FX Rate/ Rate | Expiration
Date | Number
of Contracts * | Market
Value ╪ | Premiums
Received by Fund | Unrealized
Appreciation (Depreciation) | ||||||||||||||||||
| Written swaption contracts: | ||||||||||||||||||||||||||
| Calls | ||||||||||||||||||||||||||
| Interest Rate Swaption USD | BNP | IR | 3.44 | % | 10/23/24 | USD | 350,000 | $ | 42 | $ | 43 | $ | 1 | |||||||||||||
| Puts | ||||||||||||||||||||||||||
| Interest Rate Swaption USD | BNP | IR | 3.44 | % | 10/23/24 | USD | 350,000 | $ | 42 | $ | 44 | $ | 2 | |||||||||||||
| Total written swaption contracts | 700,000 | $ | 84 | $ | 87 | $ | 3 | |||||||||||||||||||
* The number of contracts does not omit 000's.
Futures Contracts Outstanding at October 31, 2014
| Number of | Expiration | Notional | Market | Unrealized Appreciation/(Depreciation) | Variation Margin | |||||||||||||||||||||||||
| Description | Contracts* | Date | Amount | Value ╪ | Asset | Liability | Asset | Liability | ||||||||||||||||||||||
| Long position contracts: | ||||||||||||||||||||||||||||||
| CAC 40 10 EURO Future | 40 | 11/21/2014 | $ | 2,025 | $ | 2,121 | $ | 96 | $ | – | $ | 45 | $ | – | ||||||||||||||||
| Euro BUXL 30-Year Bond Future | 1 | 12/08/2014 | 175 | 182 | 7 | – | – | – | ||||||||||||||||||||||
| Euro-BOBL Future | 16 | 12/08/2014 | 2,562 | 2,568 | 6 | – | 2 | – | ||||||||||||||||||||||
| Euro-BUND Future | 59 | 12/08/2014 | 11,235 | 11,158 | – | (77 | ) | 2 | – | |||||||||||||||||||||
| Euro-Schatz Future | 5 | 12/08/2014 | 695 | 695 | – | – | – | – | ||||||||||||||||||||||
| Gold 100oz Future | 8 | 12/29/2014 | 1,035 | 937 | – | (98 | ) | – | (22 | ) | ||||||||||||||||||||
| Japan 10-Year Bond Future | 6 | 12/11/2014 | 7,814 | 7,827 | 13 | – | – | – | ||||||||||||||||||||||
| KOSPI 200 Index Future | 125 | 12/11/2014 | 15,413 | 14,632 | – | (781 | ) | 70 | – | |||||||||||||||||||||
| Short Gilt Future | 1 | 12/29/2014 | 165 | 166 | 1 | – | – | – | ||||||||||||||||||||||
| U.S. Treasury 10-Year Note Future | 119 | 12/19/2014 | 15,165 | 15,037 | – | (128 | ) | – | (31 | ) | ||||||||||||||||||||
| U.S. Treasury 2-Year Note Future | 20 | 12/31/2014 | 4,391 | 4,391 | – | – | 4 | – | ||||||||||||||||||||||
| U.S. Treasury 5-Year Note Future | 144 | 12/31/2014 | 17,123 | 17,198 | 75 | – | – | (24 | ) | |||||||||||||||||||||
| U.S. Treasury CME Ultra Long Term Bond Future | 42 | 12/19/2014 | 6,525 | 6,586 | 61 | – | 1 | (25 | ) | |||||||||||||||||||||
| Total | $ | 259 | $ | (1,084 | ) | $ | 124 | $ | (102 | ) | ||||||||||||||||||||
| Short position contracts: | ||||||||||||||||||||||||||||||
| Australian 10-Year Bond Future | 51 | 12/15/2014 | $ | 5,504 | $ | 5,511 | $ | – | $ | (7 | ) | $ | – | $ | (21 | ) | ||||||||||||||
| Australian SPI 200 Index Future | 73 | 12/18/2014 | 8,778 | 8,862 | – | (84 | ) | – | (96 | ) | ||||||||||||||||||||
| Canadian Government 10-Year Bond Future | 46 | 12/18/2014 | 5,533 | 5,593 | – | (60 | ) | – | (1 | ) | ||||||||||||||||||||
| Long Gilt Future | 70 | 12/29/2014 | 12,750 | 12,889 | – | (139 | ) | 26 | – | |||||||||||||||||||||
| S&P 500 (E-Mini) Future | 2 | 12/19/2014 | 196 | 201 | – | (5 | ) | 111 | (222 | ) | ||||||||||||||||||||
| U.S. Treasury Long Bond Future | 1 | 12/19/2014 | 142 | 141 | 1 | – | – | – | ||||||||||||||||||||||
| Total | $ | 1 | $ | (295 | ) | $ | 137 | $ | (340 | ) | ||||||||||||||||||||
| Total futures contracts | $ | 260 | $ | (1,379 | ) | $ | 261 | $ | (442 | ) | ||||||||||||||||||||
* The number of contracts does not omit 000's.
The accompanying notes are an integral part of these financial statements.
| 21 |
The Hartford Global All-Asset Fund
Consolidated Schedule of Investments – (continued)
October 31, 2014
(000’s Omitted)
OTC Credit Default Swap Contracts Outstanding at October 31, 2014
| Counter- | Notional | (Pay)/
Receive Fixed Rate/ Implied | Expiration | Upfront
Premiums | Upfront
Premiums | Market | Unrealized
Appreciation/ (Depreciation) | |||||||||||||||||||||||||
| Reference Entity | party | Amount (a) | Credit Spread (b) | Date | Paid | Received | Value ╪ | Asset | Liability | |||||||||||||||||||||||
| Credit default swaps on indices: | ||||||||||||||||||||||||||||||||
| Sell protection: | ||||||||||||||||||||||||||||||||
| CDX.EM.22 | GSC | USD | 17,425 | 1.00% | 12/20/19 | $ | – | $ | (1,260 | ) | $ | (1,125 | ) | $ | 135 | $ | – | |||||||||||||||
| Credit default swaps on single-name issues: | ||||||||||||||||||||||||||||||||
| Sell protection: | ||||||||||||||||||||||||||||||||
| Italy (Republic of) | JPM | USD | 1,900 | 1.00% / 1.10% | 09/20/19 | $ | – | $ | (15 | ) | $ | (9 | ) | $ | 6 | $ | – | |||||||||||||||
| $ | – | $ | (1,275 | ) | $ | (1,134 | ) | $ | 141 | $ | – | |||||||||||||||||||||
| (a) | The maximum potential amount the Fund could be required to pay as a seller of credit protection or receive as a buyer of credit protection if a credit event occurs as defined under the terms of that particular swap agreement. |
| (b) | Implied credit spreads, utilized in determining the market value of credit default swap agreements on corporate issues, U.S. municipal issues or sovereign government issues as of period end serve as an indicator of the current status of the payment/performance risk and represent the likelihood of risk of default for the credit derivative. The implied credit spread of a particular entity reflects the cost of buying/selling protection and may include upfront payments required to be made to enter into the agreement. Wider credit spreads represent a deterioration of the reference entity's credit soundness and a greater likelihood or risk of default or other credit event occurring as defined under the terms of the agreement. The percentage shown is the implied credit spread on October 31, 2014. For credit default swap agreements on indices, the quoted market prices and resulting values serve as the indicator of the current status of the payment/performance risk. |
Centrally Cleared Credit Default Swap Contracts Outstanding at October 31, 2014
| Clearing | Notional | (Pay)/
Receive Fixed | Expiration | Market | Unrealized Appreciation/ (Depreciation) | Variation Margin | ||||||||||||||||||||||||||||||
| Reference Entity | House (a) | Amount (b) | Rate | Date | Cost Basis | Value ╪ | Asset | Liability | Asset | Liability | ||||||||||||||||||||||||||
| Credit default swaps on indices: | ||||||||||||||||||||||||||||||||||||
| Sell protection: | ||||||||||||||||||||||||||||||||||||
| CDX.NA.HY.23 | CME | USD | 4,350 | 5.00 | % | 12/20/19 | $ | 251 | $ | 304 | $ | 53 | $ | – | $ | 17 | $ | – | ||||||||||||||||||
| (a) | The FCM to the contracts is MSC. |
| (b) | The maximum potential amount the Fund could be required to pay as a seller of credit protection or receive as a buyer of credit protection if a credit event occurs as defined under the terms of that particular swap agreement. |
OTC Total Return Swap Contracts Outstanding at October 31, 2014
| Notional | Payments received | Expiration | Upfront Premiums | Upfront
Premiums | Market | Unrealized
Appreciation/(Depreciation) | ||||||||||||||||||||||||
| Reference Entity | Counterparty | Amount | (paid) by Fund | Date | Paid | Received | Value ╪ | Asset | Liability | |||||||||||||||||||||
| BCLY US Aggregate TOT | BCLY | USD | 13,325 | 1M LIBOR + 0.10% | 02/28/15 | $ | – | $ | – | $ | (146 | ) | $ | – | $ | (146 | ) | |||||||||||||
| Bloomberg Commodity Index | JPM | USD | 12,576 | (0.09)% Fixed | 01/30/15 | – | – | (101 | ) | – | (101 | ) | ||||||||||||||||||
| MSCI Daily TR Gross EM Poland | GSC | USD | 555 | 1M LIBOR + 0.30% | 06/30/15 | – | – | 21 | 21 | – | ||||||||||||||||||||
| MSCI Daily TR Gross EM S Africa | DEUT | USD | 2,444 | 1M LIBOR - 0.20% | 10/30/15 | – | – | – | – | – | ||||||||||||||||||||
| MSCI Daily TR Net EM Chile | DEUT | USD | 1,605 | 1M LIBOR + 0.10% | 02/27/15 | – | – | 11 | 11 | – | ||||||||||||||||||||
| MSCI Daily TR Net EM Chile | GSC | USD | 469 | 1M LIBOR + 0.10% | 02/27/15 | – | – | 3 | 3 | – | ||||||||||||||||||||
| MSCI United Arab Emirates | DEUT | USD | 580 | 1M LIBOR - 0.69% | 10/30/15 | – | – | (7 | ) | – | (7 | ) | ||||||||||||||||||
| MSCI United Arab Emirates | DEUT | USD | 374 | 1M LIBOR - 0.69% | 10/30/15 | – | – | – | – | – | ||||||||||||||||||||
| S&P US Real Estate Select Industry TR | GSC | USD | 8,647 | 1M LIBOR - 0.90% | 01/30/15 | – | – | (289 | ) | – | (289 | ) | ||||||||||||||||||
| S&P US Real Estate Select Industry TR | GSC | USD | 1,123 | 1M LIBOR - 0.90% | 06/30/15 | – | – | (38 | ) | – | (38 | ) | ||||||||||||||||||
| Tel Aviv 25 | GSC | USD | 4,375 | (1M LIBOR + 0.90%) | 05/28/15 | – | – | (231 | ) | – | (231 | ) | ||||||||||||||||||
| Total | $ | – | $ | – | $ | (777 | ) | $ | 35 | $ | (812 | ) | ||||||||||||||||||
The accompanying notes are an integral part of these financial statements.
| 22 |
The Hartford Global All-Asset Fund
Consolidated Schedule of Investments – (continued)
October 31, 2014
(000’s Omitted)
TBA Sale Commitments Outstanding at October 31, 2014
| Description | Principal Amount | Maturity Date | Market Value ╪ | Unrealized Appreciation/ Depreciation | ||||||||||
| FHLMC, 3.50% | $ | 2,500 | 11/15/2044 | $ | 2,580 | $ | (20 | ) | ||||||
| FHLMC, 5.00% | 800 | 11/15/2044 | 884 | (1 | ) | |||||||||
| FNMA, 3.00% | 200 | 11/15/2029 | 207 | – | ||||||||||
| FNMA, 3.50% | 400 | 11/15/2029 | 423 | 1 | ||||||||||
| FNMA, 3.50% | 14,380 | 11/15/2044 | 14,870 | (62 | ) | |||||||||
| GNMA, 3.00% | 200 | 11/15/2044 | 204 | 1 | ||||||||||
| GNMA, 3.50% | 2,600 | 11/15/2044 | 2,720 | 11 | ||||||||||
| GNMA, 4.50% | 800 | 11/15/2044 | 873 | (4 | ) | |||||||||
| GNMA, 5.00% | 300 | 12/15/2044 | 331 | – | ||||||||||
| Total | $ | 23,092 | $ | (74 | ) | |||||||||
At October 31, 2014, the aggregate market value of these securities represents 4.7% of total net assets.
Foreign Currency Contracts Outstanding at October 31, 2014
| Unrealized Appreciation/(Depreciation) | ||||||||||||||||||||||
| Currency | Buy / Sell | Delivery Date | Counterparty | Contract Amount | Market Value ╪ | Asset | Liability | |||||||||||||||
| AUD | Buy | 11/28/2014 | BCLY | $ | 5,604 | $ | 5,616 | $ | 12 | $ | – | |||||||||||
| AUD | Buy | 11/28/2014 | BOA | 4,281 | 4,281 | – | – | |||||||||||||||
| AUD | Buy | 11/28/2014 | CBA | 4,281 | 4,281 | – | – | |||||||||||||||
| AUD | Buy | 12/17/2014 | CBA | 1,965 | 1,960 | – | (5 | ) | ||||||||||||||
| AUD | Buy | 12/17/2014 | NAB | 1,966 | 1,960 | – | (6 | ) | ||||||||||||||
| AUD | Buy | 12/17/2014 | SSG | 1,965 | 1,960 | – | (5 | ) | ||||||||||||||
| AUD | Sell | 11/06/2014 | DEUT | 228 | 228 | – | – | |||||||||||||||
| AUD | Sell | 11/28/2014 | GSC | 5,656 | 5,616 | 40 | – | |||||||||||||||
| AUD | Sell | 12/17/2014 | RBS | 9,195 | 8,909 | 286 | – | |||||||||||||||
| BRL | Buy | 11/04/2014 | SCB | 896 | 882 | – | (14 | ) | ||||||||||||||
| BRL | Buy | 11/04/2014 | UBS | 1,533 | 1,524 | – | (9 | ) | ||||||||||||||
| BRL | Buy | 12/02/2014 | UBS | 881 | 875 | – | (6 | ) | ||||||||||||||
| BRL | Sell | 11/04/2014 | SCB | 1,576 | 1,524 | 52 | – | |||||||||||||||
| BRL | Sell | 11/04/2014 | UBS | 887 | 882 | 5 | – | |||||||||||||||
| BRL | Sell | 12/02/2014 | UBS | 1,521 | 1,511 | 10 | – | |||||||||||||||
| CAD | Buy | 11/03/2014 | BCLY | 68 | 68 | – | – | |||||||||||||||
| CAD | Buy | 12/17/2014 | DEUT | 4,373 | 4,288 | – | (85 | ) | ||||||||||||||
| CAD | Buy | 11/28/2014 | RBC | 11,251 | 11,183 | – | (68 | ) | ||||||||||||||
| CHF | Buy | 12/17/2014 | CSFB | 2,749 | 2,675 | – | (74 | ) | ||||||||||||||
| CHF | Buy | 11/28/2014 | JPM | 6,853 | 6,819 | – | (34 | ) | ||||||||||||||
| CHF | Sell | 12/17/2014 | BCLY | 588 | 576 | 12 | – | |||||||||||||||
| CHF | Sell | 11/04/2014 | BNY | 129 | 129 | – | – | |||||||||||||||
| CHF | Sell | 11/28/2014 | HSBC | 13,993 | 13,879 | 114 | – | |||||||||||||||
| CLP | Buy | 12/17/2014 | BNP | 2,805 | 2,885 | 80 | – | |||||||||||||||
| CLP | Sell | 12/17/2014 | SCB | 2,789 | 2,885 | – | (96 | ) | ||||||||||||||
| CNY | Sell | 12/17/2014 | JPM | 1,627 | 1,629 | – | (2 | ) | ||||||||||||||
| CNY | Sell | 12/17/2014 | UBS | 5,896 | 5,924 | – | (28 | ) | ||||||||||||||
| COP | Buy | 12/17/2014 | SCB | 2,735 | 2,663 | – | (72 | ) | ||||||||||||||
| COP | Sell | 12/17/2014 | BOA | 2,756 | 2,663 | 93 | – | |||||||||||||||
| DKK | Sell | 11/04/2014 | BNY | 76 | 76 | – | – | |||||||||||||||
| EUR | Buy | 12/17/2014 | BCLY | 369 | 366 | – | (3 | ) | ||||||||||||||
| EUR | Buy | 12/17/2014 | DEUT | 1,854 | 1,795 | – | (59 | ) | ||||||||||||||
| EUR | Buy | 11/03/2014 | GSC | 89 | 88 | – | (1 | ) | ||||||||||||||
| EUR | Buy | 12/17/2014 | JPM | 148 | 147 | – | (1 | ) | ||||||||||||||
| EUR | Buy | 11/03/2014 | RBC | 67 | 67 | – | – | |||||||||||||||
| EUR | Buy | 11/28/2014 | UBS | 6,844 | 6,813 | – | (31 | ) | ||||||||||||||
| EUR | Buy | 12/17/2014 | UBS | 1,346 | 1,301 | – | (45 | ) | ||||||||||||||
| EUR | Buy | 11/04/2014 | WEST | 4 | 4 | – | – | |||||||||||||||
| EUR | Sell | 11/28/2014 | BCLY | 682 | 671 | 11 | – | |||||||||||||||
| EUR | Sell | 12/17/2014 | DEUT | 50,819 | 49,228 | 1,591 | – | |||||||||||||||
| EUR | Sell | 11/28/2014 | GSC | 31 | 31 | – | – | |||||||||||||||
The accompanying notes are an integral part of these financial statements.
| 23 |
The Hartford Global All-Asset Fund
Consolidated Schedule of Investments – (continued)
October 31, 2014
(000’s Omitted)
Foreign Currency Contracts Outstanding at October 31, 2014 - (continued)
| Unrealized Appreciation/(Depreciation) | ||||||||||||||||||||||
| Currency | Buy / Sell | Delivery Date | Counterparty | Contract Amount | Market Value ╪ | Asset | Liability | |||||||||||||||
| EUR | Sell | 11/28/2014 | JPM | $ | 18,323 | $ | 18,130 | $ | 193 | $ | – | |||||||||||
| EUR | Sell | 11/03/2014 | RBC | 12 | 12 | – | – | |||||||||||||||
| EUR | Sell | 11/04/2014 | WEST | 1,126 | 1,126 | – | – | |||||||||||||||
| EUR | Sell | 11/05/2014 | WEST | 15 | 15 | – | – | |||||||||||||||
| GBP | Buy | 11/03/2014 | BMO | 53 | 53 | – | – | |||||||||||||||
| GBP | Buy | 11/28/2014 | BOA | 277 | 277 | – | – | |||||||||||||||
| GBP | Buy | 11/28/2014 | CBK | 8,090 | 8,078 | – | (12 | ) | ||||||||||||||
| GBP | Buy | 12/17/2014 | RBS | 11,617 | 11,438 | – | (179 | ) | ||||||||||||||
| GBP | Buy | 11/28/2014 | SSG | 252 | 251 | – | (1 | ) | ||||||||||||||
| GBP | Sell | 11/03/2014 | BMO | 489 | 489 | – | – | |||||||||||||||
| GBP | Sell | 11/03/2014 | BOA | 277 | 277 | – | – | |||||||||||||||
| GBP | Sell | 11/28/2014 | CBK | 1,352 | 1,350 | 2 | – | |||||||||||||||
| GBP | Sell | 12/17/2014 | JPM | 618 | 612 | 6 | – | |||||||||||||||
| GBP | Sell | 11/04/2014 | MSC | 732 | 732 | – | – | |||||||||||||||
| HKD | Buy | 11/03/2014 | UBS | 21 | 21 | – | – | |||||||||||||||
| HKD | Sell | 11/04/2014 | BCLY | 410 | 410 | – | – | |||||||||||||||
| INR | Buy | 12/17/2014 | BCLY | 1,948 | 1,938 | – | (10 | ) | ||||||||||||||
| INR | Buy | 12/17/2014 | CBK | 2,990 | 2,974 | – | (16 | ) | ||||||||||||||
| JPY | Buy | 12/17/2014 | BCLY | 2,920 | 2,800 | – | (120 | ) | ||||||||||||||
| JPY | Buy | 11/06/2014 | CBA | 3,073 | 3,064 | – | (9 | ) | ||||||||||||||
| JPY | Buy | 12/17/2014 | DEUT | 3,354 | 3,228 | – | (126 | ) | ||||||||||||||
| JPY | Buy | 11/04/2014 | SSG | 8 | 8 | – | – | |||||||||||||||
| JPY | Sell | 11/04/2014 | BCLY | 2,919 | 2,798 | 121 | – | |||||||||||||||
| JPY | Sell | 12/17/2014 | CBA | 3,074 | 3,066 | 8 | – | |||||||||||||||
| JPY | Sell | 11/06/2014 | DEUT | 623 | 620 | 3 | – | |||||||||||||||
| JPY | Sell | 12/17/2014 | JPM | 26,237 | 24,906 | 1,331 | – | |||||||||||||||
| JPY | Sell | 11/28/2014 | RBS | 8,346 | 8,024 | 322 | – | |||||||||||||||
| JPY | Sell | 11/04/2014 | SSG | 81 | 78 | 3 | – | |||||||||||||||
| JPY | Sell | 11/05/2014 | UBS | 41 | 39 | 2 | – | |||||||||||||||
| KRW | Buy | 12/17/2014 | UBS | 14,900 | 14,465 | – | (435 | ) | ||||||||||||||
| KRW | Sell | 12/17/2014 | UBS | 16,861 | 16,369 | 492 | – | |||||||||||||||
| MXN | Buy | 12/17/2014 | JPM | 4,557 | 4,479 | – | (78 | ) | ||||||||||||||
| MXN | Sell | 11/04/2014 | BCLY | 3 | 3 | – | – | |||||||||||||||
| MXN | Sell | 12/17/2014 | CBK | 3,399 | 3,370 | 29 | – | |||||||||||||||
| MXN | Sell | 11/05/2014 | SSG | 9 | 9 | – | – | |||||||||||||||
| NOK | Buy | 12/17/2014 | GSC | 1,313 | 1,238 | – | (75 | ) | ||||||||||||||
| NOK | Buy | 12/17/2014 | MSC | 784 | 789 | 5 | – | |||||||||||||||
| NOK | Buy | 11/03/2014 | UBS | 12 | 12 | – | – | |||||||||||||||
| NOK | Sell | 11/04/2014 | BCLY | 140 | 140 | – | – | |||||||||||||||
| NOK | Sell | 12/17/2014 | GSC | 2,111 | 1,991 | 120 | – | |||||||||||||||
| NOK | Sell | 12/17/2014 | JPM | 1,650 | 1,641 | 9 | – | |||||||||||||||
| NOK | Sell | 11/04/2014 | SSG | 1,540 | 1,548 | – | (8 | ) | ||||||||||||||
| NZD | Buy | 12/17/2014 | JPM | 2,623 | 2,624 | 1 | – | |||||||||||||||
| NZD | Sell | 12/17/2014 | CBA | 10,367 | 9,953 | 414 | – | |||||||||||||||
| NZD | Sell | 12/17/2014 | NAB | 1,961 | 1,916 | 45 | – | |||||||||||||||
| NZD | Sell | 12/17/2014 | SSG | 1,959 | 1,916 | 43 | – | |||||||||||||||
| PLN | Sell | 11/04/2014 | BCLY | 5 | 5 | – | – | |||||||||||||||
| PLN | Sell | 12/17/2014 | BOA | 2,052 | 1,983 | 69 | – | |||||||||||||||
| SEK | Buy | 12/17/2014 | BOA | 2,051 | 1,991 | – | (60 | ) | ||||||||||||||
| SEK | Buy | 12/17/2014 | JPM | 1,745 | 1,680 | – | (65 | ) | ||||||||||||||
| SEK | Sell | 11/04/2014 | BCLY | 101 | 101 | – | – | |||||||||||||||
| SEK | Sell | 12/17/2014 | JPM | 1,850 | 1,847 | 3 | – | |||||||||||||||
| SGD | Buy | 12/17/2014 | GSC | 815 | 807 | – | (8 | ) | ||||||||||||||
| SGD | Buy | 12/17/2014 | UBS | 2,263 | 2,227 | – | (36 | ) | ||||||||||||||
| SGD | Sell | 11/05/2014 | BCLY | 110 | 110 | – | – | |||||||||||||||
| TRY | Sell | 11/04/2014 | BCLY | 29 | 29 | – | – | |||||||||||||||
| TWD | Buy | 12/17/2014 | BCLY | 2,111 | 2,103 | – | (8 | ) | ||||||||||||||
| TWD | Buy | 12/17/2014 | JPM | 1,665 | 1,661 | – | (4 | ) | ||||||||||||||
| TWD | Sell | 12/17/2014 | CBK | 10,314 | 10,159 | 155 | – | |||||||||||||||
The accompanying notes are an integral part of these financial statements.
| 24 |
The Hartford Global All-Asset Fund
Consolidated Schedule of Investments – (continued)
October 31, 2014
(000’s Omitted)
Foreign Currency Contracts Outstanding at October 31, 2014 - (continued)
| Unrealized Appreciation/(Depreciation) | ||||||||||||||||||||||
| Currency | Buy / Sell | Delivery Date | Counterparty | Contract Amount | Market Value ╪ | Asset | Liability | |||||||||||||||
| ZAR | Buy | 12/17/2014 | RBS | $ | 2,175 | $ | 2,180 | $ | 5 | $ | – | |||||||||||
| ZAR | Sell | 11/07/2014 | BCLY | 33 | 33 | – | – | |||||||||||||||
| Total | $ | 5,687 | $ | (1,894 | ) | |||||||||||||||||
| ╪ | See Significant Accounting Policies of accompanying Notes to Consolidated Financial Statements regarding valuation of securities. |
The accompanying notes are an integral part of these financial statements.
| 25 |
The Hartford Global All-Asset Fund
Consolidated Schedule of Investments – (continued)
October 31, 2014
(000’s Omitted)
| GLOSSARY: (abbreviations used in preceding Consolidated Schedule of Investments) |
| Counterparty Abbreviations: | |
| BCLY | Barclays |
| BMO | Bank of Montreal |
| BNP | BNP Paribas Securities Services |
| BNY | BNY Mellon |
| BOA | Banc of America Securities LLC |
| CBA | Commonwealth Bank of Australia |
| CBK | Citibank NA |
| CME | Chicago Mercantile Exchange |
| CSFB | Credit Suisse First Boston Corp. |
| DEUT | Deutsche Bank Securities, Inc. |
| FCM | Futures Commission Merchant |
| GSC | Goldman Sachs & Co. |
| HSBC | HSBC Bank USA |
| JPM | JP Morgan Chase & Co. |
| MSC | Morgan Stanley |
| NAB | National Australia Bank Limited |
| RBC | RBC Dominion Securities, Inc. |
| RBS | RBS Greenwich Capital |
| SCB | Standard Chartered Bank |
| SSG | State Street Global Markets LLC |
| UBS | UBS AG |
| WEST | Westpac International |
| Currency Abbreviations: | |
| AUD | Australian Dollar |
| BRL | Brazilian Real |
| CAD | Canadian Dollar |
| CHF | Swiss Franc |
| CLP | Chilean Peso |
| CNY | Chinese Yuan Renminbi |
| COP | Colombian Peso |
| DKK | Danish Krone |
| EUR | EURO |
| GBP | British Pound |
| HKD | Hong Kong Dollar |
| INR | Indian Rupee |
| JPY | Japanese Yen |
| KRW | South Korean Won |
| MXN | Mexican New Peso |
| NOK | Norwegian Krone |
| NZD | New Zealand Dollar |
| PLN | Polish New Zloty |
| SEK | Swedish Krona |
| SGD | Singapore Dollar |
| TRY | Turkish New Lira |
| TWD | Taiwan Dollar |
| USD | U.S. Dollar |
| ZAR | South African Rand |
| Index Abbreviations: | |
| CAC | Cotation Assistee en Continu |
| CDX.EM | Credit Derivatives Emerging Markets |
| CDX.NA.HY | Credit Derivatives North American High Yield |
| EAFE | Europe, Australasia and Far East |
| KOSPI | Korea Composite Stock Price |
| MSCI | Morgan Stanley Capital International |
| S&P | Standard & Poors |
| SPI | Share Price Index |
| Other Abbreviations: | |
| ADR | American Depositary Receipt |
| CLO | Collateralized Loan Obligation |
| CO | Commodity |
| EM | Emerging Markets |
| EQ | Equity |
| ETF | Exchange Traded Fund |
| FHLMC | Federal Home Loan Mortgage Corp. |
| FNMA | Federal National Mortgage Association |
| FX | Foreign Exchange |
| GNMA | Government National Mortgage Association |
| IR | Interest Rate |
| J-REIT | Japanese Real Estate Investment Trust |
| LIBOR | London Interbank Offered Rate |
| OTC | Over-the-Counter |
| REIC | Real Estate Investment Company |
| REIT | Real Estate Investment Trust |
| SPDR | Standard & Poor's Depositary Receipt |
| TBA | To Be Announced |
The accompanying notes are an integral part of these financial statements.
| 26 |
The Hartford Global All-Asset Fund
Consolidated Schedule of Investments – (continued)
October 31, 2014
(000’s Omitted)
Consolidated Investment Valuation Hierarchy Level Summary
October 31, 2014
| Total | Level 1 ♦ | Level 2 ♦ | Level 3 | |||||||||||||
| Assets: | ||||||||||||||||
| Common Stocks | ||||||||||||||||
| Australia | $ | 3,140 | $ | 1,024 | $ | 2,116 | $ | – | ||||||||
| Austria | 1,642 | 801 | 841 | – | ||||||||||||
| Belgium | 1,180 | 268 | 912 | – | ||||||||||||
| Brazil | 1,180 | 1,180 | – | – | ||||||||||||
| British Virgin Islands | 1,016 | 1,016 | – | – | ||||||||||||
| Canada | 7,295 | 7,295 | – | – | ||||||||||||
| Cayman Islands | 196 | 173 | 23 | – | ||||||||||||
| China | 13,002 | 5,801 | 7,201 | – | ||||||||||||
| Denmark | 1,098 | – | 1,098 | – | ||||||||||||
| Egypt | 751 | 751 | – | – | ||||||||||||
| Finland | 262 | – | 262 | – | ||||||||||||
| France | 11,699 | 162 | 11,537 | – | ||||||||||||
| Germany | 7,736 | 22 | 7,714 | – | ||||||||||||
| Greece | 8,340 | 291 | 8,049 | – | ||||||||||||
| Hong Kong | 10,314 | 262 | 10,052 | – | ||||||||||||
| India | 2,295 | 652 | 1,643 | – | ||||||||||||
| Indonesia | 499 | – | 499 | – | ||||||||||||
| Ireland | 7,068 | 2,450 | 4,618 | – | ||||||||||||
| Israel | 4,607 | 865 | 3,742 | – | ||||||||||||
| Italy | 4,832 | – | 4,832 | – | ||||||||||||
| Japan | 26,349 | 271 | 26,078 | – | ||||||||||||
| Jersey | 877 | 748 | 129 | – | ||||||||||||
| Kenya | 40 | 40 | – | – | ||||||||||||
| Luxembourg | 1,190 | 284 | 906 | – | ||||||||||||
| Malaysia | 2,727 | – | 2,727 | – | ||||||||||||
| Mauritius | 639 | 639 | – | – | ||||||||||||
| Mexico | 88 | 88 | – | – | ||||||||||||
| Netherlands | 9,705 | 992 | 8,713 | – | ||||||||||||
| Norway | 2,652 | 11 | 2,641 | – | ||||||||||||
| Panama | 69 | 69 | – | – | ||||||||||||
| Papua New Guinea | 55 | 55 | – | – | ||||||||||||
| Philippines | 521 | – | 521 | – | ||||||||||||
| Poland | 46 | 46 | – | – | ||||||||||||
| Portugal | 142 | – | 142 | – | ||||||||||||
| Puerto Rico | 73 | 73 | – | – | ||||||||||||
| Romania | 32 | – | 32 | – | ||||||||||||
| Singapore | 5,949 | 152 | 5,797 | – | ||||||||||||
| South Africa | 667 | – | 667 | – | ||||||||||||
| South Korea | 11,000 | 181 | 10,819 | – | ||||||||||||
| Spain | 2,458 | – | 2,458 | – | ||||||||||||
| Sweden | 1,105 | – | 1,105 | – | ||||||||||||
| Switzerland | 6,161 | 286 | 5,875 | – | ||||||||||||
| Taiwan | 12,571 | 242 | 12,329 | – | ||||||||||||
| Thailand | 418 | – | 418 | – | ||||||||||||
| Turkey | 561 | 91 | 470 | – | ||||||||||||
| United Arab Emirates | 24 | 24 | – | – | ||||||||||||
| United Kingdom | 12,660 | 1,976 | 10,684 | – | ||||||||||||
| United States | 100,349 | 100,223 | 126 | – | ||||||||||||
| Total | $ | 287,280 | $ | 129,504 | $ | 157,776 | $ | – | ||||||||
| Asset and Commercial Mortgage Backed Securities | 22,808 | – | 19,793 | 3,015 | ||||||||||||
| Corporate Bonds | 19,394 | – | 19,394 | – | ||||||||||||
| Exchange Traded Funds | 19,957 | 19,957 | – | – | ||||||||||||
| Foreign Government Obligations | 47,308 | – | 47,308 | – | ||||||||||||
| Preferred Stocks | 1,859 | – | 1,739 | 120 | ||||||||||||
| U.S. Government Agencies | 29,746 | – | 29,746 | – | ||||||||||||
| U.S. Government Securities | 21,612 | 13,877 | 7,735 | – | ||||||||||||
| Warrants | 440 | 440 | – | – | ||||||||||||
The accompanying notes are an integral part of these financial statements.
| 27 |
The Hartford Global All-Asset Fund
Consolidated Schedule of Investments – (continued)
October 31, 2014
(000’s Omitted)
Consolidated Investment Valuation Hierarchy Level Summary - (continued)
October 31, 2014
| Total | Level 1 ♦ | Level 2 ♦ | Level 3 | |||||||||||||
| Assets: - (continued) | ||||||||||||||||
| Short-Term Investments | 48,097 | – | 48,097 | – | ||||||||||||
| Purchased Options | 923 | 47 | 876 | – | ||||||||||||
| Total | $ | 499,424 | $ | 163,825 | $ | 332,464 | $ | 3,135 | ||||||||
| Foreign Currency Contracts* | $ | 5,687 | $ | – | $ | 5,687 | $ | – | ||||||||
| Futures* | 260 | 260 | – | – | ||||||||||||
| Swaps - Credit Default* | 194 | – | 194 | – | ||||||||||||
| Swaps - Total Return* | 35 | – | 35 | – | ||||||||||||
| Total | $ | 6,176 | $ | 260 | $ | 5,916 | $ | – | ||||||||
| Liabilities: | ||||||||||||||||
| Securities Sold Short | $ | 23,092 | $ | – | $ | 23,092 | $ | – | ||||||||
| Written Options | 217 | – | 217 | – | ||||||||||||
| Total | $ | 23,309 | $ | – | $ | 23,309 | $ | – | ||||||||
| Foreign Currency Contracts* | $ | 1,894 | $ | – | $ | 1,894 | $ | – | ||||||||
| Futures* | 1,379 | 1,379 | – | – | ||||||||||||
| Swaps - Total Return* | 812 | – | 812 | – | ||||||||||||
| Total | $ | 4,085 | $ | 1,379 | $ | 2,706 | $ | – | ||||||||
| ♦ | For the year ended October 31, 2014, investments valued at $15,481 were transferred from Level 1 to Level 2, and investments valued at $7,262 were transferred from Level 2 to Level 1. Investments are transferred between Level 1 and Level 2 for a variety of reasons including, but not limited to: |
| 1) | Foreign equities for which a fair value price is more representative of exit value than the local market close (transfer into Level 2). Foreign equities for which the local market close is more representative of exit value (transfer into Level 1). |
| 2) | U.S. Treasury securities that no longer represent the most recent issue (transfer into Level 2). |
| 3) | Equity investments with no observable trading but a bid or mean price is used (transfer into Level 2). Equity investments using observable quoted prices in an active market (transfer into Level 1). |
| * | Derivative instruments (excluding purchased and written options, if applicable) are valued at the unrealized appreciation/depreciation on the investments. |
Following is a reconciliation of Level 3 assets for which significant unobservable inputs were used to determine fair value:
| Balance
as of October 31, 2013 | Realized
Gain (Loss) | Change
in Unrealized Appreciation (Depreciation) | Net
Amortization | Purchases | Sales | Transfers Into Level 3 * | Transfers
Out of Level 3 * | Balance
as of October 31, 2014 | ||||||||||||||||||||||||||||
| Assets: | ||||||||||||||||||||||||||||||||||||
| Asset & Commercial Mortgage Backed Securities | $ | — | $ | (10 | ) | $ | 4 | † | $ | 7 | $ | 3,441 | $ | (427 | ) | $ | — | $ | — | $ | 3,015 | |||||||||||||||
| Common Stocks | 258 | 98 | 347 | — | — | (813 | ) | 368 | (258 | ) | — | |||||||||||||||||||||||||
| Preferred Stocks | — | — | (14 | )‡ | — | 134 | — | — | — | 120 | ||||||||||||||||||||||||||
| Total | $ | 258 | $ | 88 | $ | 337 | $ | 7 | $ | 3,575 | $ | (1,240 | ) | $ | 368 | $ | (258 | ) | $ | 3,135 | ||||||||||||||||
| * | Investments are transferred into and out of Level 3 for a variety of reasons including, but not limited to: |
1) Investments where trading has been halted (transfer into Level 3) or investments where trading has resumed (transfer out of Level 3).
2) Broker quoted investments (transfer into Level 3) or quoted prices in active markets (transfer out of Level 3).
3) Investments that have certain restrictions on trading (transfer into Level 3) or investments where trading restrictions have expired (transfer out of Level 3).
| † | Change in unrealized appreciation (depreciation) in the current period relating to assets still held at October 31, 2014 was $4. |
| ‡ | Change in unrealized appreciation (depreciation) in the current period relating to assets still held at October 31, 2014 was $(14). |
| Note: | For purposes of reporting transfers between different hierarchy levels, both transfers in and out of each level, as applicable, are shown as if they occurred at the beginning of the period. |
The accompanying notes are an integral part of these financial statements.
| 28 |
The Hartford Global All-Asset Fund
Consolidated Statement of Assets and Liabilities
October 31, 2014
(000’s Omitted)
| Assets: | ||||
| Investments in securities, at market value (cost $479,975) | $ | 499,424 | ||
| Cash | 9,563 | * | ||
| Foreign currency on deposit with custodian (cost $23) | 23 | |||
| Unrealized appreciation on foreign currency contracts | 5,687 | |||
| Unrealized appreciation on OTC swap contracts | 176 | |||
| Receivables: | ||||
| Investment securities sold | 50,911 | |||
| Fund shares sold | 277 | |||
| Dividends and interest | 1,204 | |||
| Variation margin on financial derivative instruments | 278 | |||
| OTC swap premiums paid | — | |||
| Other assets | 99 | |||
| Total assets | 567,642 | |||
| Liabilities: | ||||
| Unrealized depreciation on foreign currency contracts | 1,894 | |||
| Unrealized depreciation on OTC swap contracts | 812 | |||
| TBA sale commitments, at market value (proceeds $23,018) | 23,092 | |||
| Payables: | ||||
| Investment securities purchased | 41,197 | |||
| Fund shares redeemed | 5,340 | |||
| Investment management fees | 91 | |||
| Administrative fees | — | |||
| Distribution fees | 35 | |||
| Collateral received from broker | 213 | |||
| Variation margin on financial derivative instruments | 442 | |||
| Accrued expenses | 101 | |||
| OTC swap premiums received | 1,275 | |||
| Written option contracts (proceeds $326) | 217 | |||
| Other liabilities | 1 | |||
| Total liabilities | 74,710 | |||
| Net assets | $ | 492,932 | ||
| Summary of Net Assets: | ||||
| Capital stock and paid-in-capital | $ | 412,204 | ||
| Undistributed net investment income | 7,538 | |||
| Accumulated net realized gain | 51,860 | |||
| Unrealized appreciation of investments and the translation of assets and liabilities denominated in foreign currency | 21,330 | |||
| Net assets | $ | 492,932 |
* Cash of $9,561 was pledged as collateral for open financial derivative instruments at October 31, 2014.
The accompanying notes are an integral part of these financial statements.
| 29 |
The Hartford Global All-Asset Fund
Consolidated Statement of Assets and Liabilities – (continued)
October 31, 2014
(000’s Omitted)
| Shares authorized | 700,000 | |||
| Par value | $ | 0.001 | ||
| Class A: Net asset value per share/Maximum offering price per share | $12.68/$13.42 | |||
| Shares outstanding | 16,299 | |||
| Net assets | $ | 206,595 | ||
| Class C: Net asset value per share | $ | 12.56 | ||
| Shares outstanding | 10,369 | |||
| Net assets | $ | 130,260 | ||
| Class I: Net asset value per share | $ | 12.72 | ||
| Shares outstanding | 9,241 | |||
| Net assets | $ | 117,499 | ||
| Class R3: Net asset value per share | $ | 12.67 | ||
| Shares outstanding | 264 | |||
| Net assets | $ | 3,340 | ||
| Class R4: Net asset value per share | $ | 12.80 | ||
| Shares outstanding | 106 | |||
| Net assets | $ | 1,363 | ||
| Class R5: Net asset value per share | $ | 12.72 | ||
| Shares outstanding | 215 | |||
| Net assets | $ | 2,730 | ||
| Class Y: Net asset value per share | $ | 12.72 | ||
| Shares outstanding | 2,449 | |||
| Net assets | $ | 31,145 |
The accompanying notes are an integral part of these financial statements.
| 30 |
The Hartford Global All-Asset Fund
Consolidated Statement of Operations
For the Year Ended October 31, 2014
(000’s Omitted)
| Investment Income: | ||||
| Dividends | $ | 8,716 | ||
| Interest | 3,693 | |||
| Less: Foreign tax withheld | (737 | ) | ||
| Total investment income | 11,672 | |||
| Expenses: | ||||
| Investment management fees | 5,183 | |||
| Administrative services fees | ||||
| Class R3 | 7 | |||
| Class R4 | 2 | |||
| Class R5 | 3 | |||
| Transfer agent fees | ||||
| Class A | 315 | |||
| Class C | 161 | |||
| Class I | 96 | |||
| Class R3 | 1 | |||
| Class R4 | — | |||
| Class R5 | — | |||
| Class Y | 1 | |||
| Distribution fees | ||||
| Class A | 612 | |||
| Class C | 1,419 | |||
| Class R3 | 18 | |||
| Class R4 | 4 | |||
| Custodian fees | 68 | |||
| Accounting services fees | 139 | |||
| Registration and filing fees | 109 | |||
| Board of Directors' fees | 15 | |||
| Audit fees | 47 | |||
| Other expenses | 95 | |||
| Total expenses (before waivers and fees paid indirectly) | 8,295 | |||
| Expense waivers | (752 | ) | ||
| Commission recapture | (4 | ) | ||
| Total waivers and fees paid indirectly | (756 | ) | ||
| Total expenses, net | 7,539 | |||
| Net Investment Income | 4,133 | |||
| Net Realized Gain on Investments, Other Financial Instruments and Foreign Currency Transactions: | ||||
| Net realized gain on investments | 52,088 | |||
| Less: Foreign taxes paid on realized capital gains | (19 | ) | ||
| Net realized loss on purchased option contracts | (938 | ) | ||
| Net realized loss on TBA sale transactions | (721 | ) | ||
| Net realized gain on futures contracts | 1,237 | |||
| Net realized gain on written option contracts | 2 | |||
| Net realized loss on swap contracts | (343 | ) | ||
| Net realized gain on foreign currency contracts | 6,396 | |||
| Net realized loss on other foreign currency transactions | (128 | ) | ||
| Net Realized Gain on Investments, Other Financial Instruments and Foreign Currency Transactions | 57,574 | |||
| Net Changes in Unrealized Depreciation of Investments, Other Financial Instruments and Foreign Currency Transactions: | ||||
| Net unrealized depreciation of investments | (39,926 | ) | ||
| Net unrealized appreciation of purchased option contracts | 502 | |||
| Net unrealized depreciation of TBA sale commitments | (74 | ) | ||
| Net unrealized depreciation of futures contracts | (1,739 | ) | ||
| Net unrealized appreciation of written option contracts | 109 | |||
| Net unrealized depreciation of swap contracts | (1,352 | ) | ||
| Net unrealized appreciation of foreign currency contracts | 4,369 | |||
| Net unrealized depreciation of translation of other assets and liabilities in foreign currencies | (241 | ) | ||
| Net Changes in Unrealized Depreciation of Investments, Other Financial Instruments and Foreign Currency Transactions | (38,352 | ) | ||
| Net Gain on Investments, Other Financial Instruments and Foreign Currency Transactions | 19,222 | |||
| Net Increase in Net Assets Resulting from Operations | $ | 23,355 |
The accompanying notes are an integral part of these financial statements.
| 31 |
The Hartford Global All-Asset Fund
Consolidated Statement of Changes in Net Assets
(000’s Omitted)
| For the Year Ended October 31, 2014 | For the Year Ended October 31, 2013 | |||||||
| Operations: | ||||||||
| Net investment income | $ | 4,133 | $ | 4,113 | ||||
| Net realized gain on investments, other financial instruments and foreign currency transactions | 57,574 | 16,343 | ||||||
| Net unrealized appreciation (depreciation) of investments, other financial instruments and foreign currency transactions | (38,352 | ) | 52,531 | |||||
| Net Increase in Net Assets Resulting from Operations | 23,355 | 72,987 | ||||||
| Distributions to Shareholders: | ||||||||
| From net investment income | ||||||||
| Class A | (2,705 | ) | (7,352 | ) | ||||
| Class C | (370 | ) | (2,817 | ) | ||||
| Class I | (1,719 | ) | (4,796 | ) | ||||
| Class R3 | (29 | ) | (75 | ) | ||||
| Class R4 | (22 | ) | (18 | ) | ||||
| Class R5 | (35 | ) | (71 | ) | ||||
| Class Y | (642 | ) | (2,021 | ) | ||||
| Total from net investment income | (5,522 | ) | (17,150 | ) | ||||
| From net realized gain on investments | ||||||||
| Class A | (855 | ) | — | |||||
| Class C | (490 | ) | — | |||||
| Class I | (434 | ) | — | |||||
| Class R3 | (12 | ) | — | |||||
| Class R4 | (6 | ) | — | |||||
| Class R5 | (9 | ) | — | |||||
| Class Y | (160 | ) | — | |||||
| Total from net realized gain on investments | (1,966 | ) | — | |||||
| Total distributions | (7,488 | ) | (17,150 | ) | ||||
| Capital Share Transactions: | ||||||||
| Class A | (64,851 | ) | (53,382 | ) | ||||
| Class C | (24,054 | ) | (33,398 | ) | ||||
| Class I | (20,800 | ) | (58,417 | ) | ||||
| Class R3 | (261 | ) | (766 | ) | ||||
| Class R4 | (586 | ) | 347 | |||||
| Class R5 | 44 | (96 | ) | |||||
| Class Y | (17,968 | ) | (41,097 | ) | ||||
| Net decrease from capital share transactions | (128,476 | ) | (186,809 | ) | ||||
| Net Decrease in Net Assets | (112,609 | ) | (130,972 | ) | ||||
| Net Assets: | ||||||||
| Beginning of period | 605,541 | 736,513 | ||||||
| End of period | $ | 492,932 | $ | 605,541 | ||||
| Undistributed (distributions in excess of) net investment income | $ | 7,538 | $ | 4,471 | ||||
The accompanying notes are an integral part of these financial statements.
| 32 |
The Hartford Global All-Asset Fund
Notes to Consolidated Financial Statements
October 31, 2014
(000’s Omitted)
Organization:
The Hartford Mutual Funds, Inc. (“Company”) is an open-end management investment company comprised of forty-two portfolios. Financial statements for The Hartford Global All-Asset Fund (the "Fund"), a series of the Company, are included in this report.
The Company is organized under the laws of the State of Maryland and is registered with the Securities and Exchange Commission (“SEC”) under the Investment Company Act of 1940, as amended (“1940 Act”). The Fund is a diversified open-end management investment company. The Fund is an investment company and applies specialized accounting and reporting under Accounting Standards Codification Topic 946, Financial Services - Investment Companies.
Class A shares are sold with a front-end sales charge of up to 5.50%. Class C shares are sold with a contingent deferred sales charge of up to 1.00% on shares redeemed within twelve months of purchase. Class I shares are sold without sales charges to certain eligible investors primarily through advisory fee-based wrap programs. Class R3, R4 and R5 shares, which are offered to employer-sponsored retirement plans, and Class Y shares, which are sold to certain eligible institutional investors, are sold without a sales charge. All classes of shares have identical voting, redemption, dividend, liquidation and other rights and the same terms and conditions, with the exceptions that each class may have different expenses, which may affect performance.
Significant Accounting Policies:
The following is a summary of significant accounting policies of the Fund in the preparation of its financial statements, which are in accordance with United States generally accepted accounting principles (“U.S. GAAP”). The preparation of financial statements in accordance with U.S. GAAP may require management to make estimates and assumptions that affect the reported amounts of assets and liabilities and disclosure of contingent assets and liabilities at the date of the financial statements and the reported amounts of increases and decreases in net assets from operations during the reporting period. Actual results could differ from those estimates.
Determination of Net Asset Value – The per share net asset value ("NAV") of each class of the Fund's shares is determined as of the close of regular trading (normally 4:00 p.m. Eastern Time) (the “NYSE Close”) on each day that the New York Stock Exchange (the “Exchange”) is open (“Valuation Date”). Information that becomes known to the Fund after the NAV has been calculated on a particular day will not generally be used to retroactively adjust the NAV determined earlier that day.
Investment Valuation and Fair Value Measurements – For purposes of calculating the NAV, portfolio investments and other assets held by the Fund's portfolio for which market quotes are readily available are valued at market value. Market value is generally determined on the basis of last reported sales prices or official close price. If no sales are reported, market value is based on quotes obtained from a quotation reporting system, established market makers, or independent pricing services. If market prices are not readily available or are deemed unreliable, the Fund will use the fair value of the investment as determined in good faith under policies and procedures established by and under the supervision of the Company's Board of Directors. Market quotes are considered not readily available where there is an absence of current or reliable market-based data (e.g., trade information or indicative market quotes), including where events occur after the close of the relevant market, but prior to the NYSE Close, that materially affect the values of the Fund's portfolio investments or assets. In addition, market quotes are considered not readily available when, due to extraordinary circumstances, the exchanges or markets on which the investments trade do not open for trading for the entire day and no other market prices are available. In addition, prices of foreign equities that are principally traded on certain foreign markets may be adjusted daily pursuant to a fair value pricing service approved by the Board of Directors in order to reflect an adjustment for the factors occurring after the close of certain foreign markets but before the NYSE Close. Investments that are primarily traded on foreign markets may trade on days that are not business days of the Fund. The value of the foreign investments in which the Fund invests may change on days when a shareholder will not be able to purchase or redeem shares of the Fund. Fair value pricing is subjective in nature and the use of fair value pricing by the Fund may cause the NAV of its shares to differ significantly from the NAV that would have been calculated using market prices at the close of the exchange on which a portfolio investment is primarily traded. There can be no assurance that the Fund could obtain the fair market value assigned to an investment if the Fund were to sell the investment at approximately the time at which the Fund determines its NAV.
Fixed income investments (other than short-term obligations), non-exchange traded derivatives and centrally cleared swaps held by the Fund are normally valued on the basis of quotes obtained from independent pricing services or brokers and dealers in accordance
| 33 |
The Hartford Global All-Asset Fund
Notes to Consolidated Financial Statements – (continued)
October 31, 2014
(000’s Omitted)
with procedures established by the Company's Board of Directors. Prices obtained from independent pricing services use information provided by market makers or estimates of market values through accepted market modeling, trading and pricing conventions. Inputs to the models may include, but are not limited to, prepayment speeds, pricing spread, yield, trade information, dealer quotes, market color, cash flow models and the investment’s terms and conditions. Generally, the Fund may use fair valuation in regard to fixed income investments when the Fund holds defaulted or distressed investments or investments in a company in which a reorganization is pending. Short-term investments maturing in 60 days or less are generally valued at amortized cost, if their original term to maturity was 60 days or less, or by amortizing their value on the 61st day prior to maturity, if the original term to maturity exceeded 60 days, which approximates fair value.
Exchange traded options, futures and options on futures are valued at the settlement price or last trade price determined by the relevant exchange as of the NYSE Close. If the last trade price for exchange traded options does not fall between the bid and ask prices, the value will be the mean of the bid and ask prices as of the NYSE Close. If a last trade price is not available, the value will be the mean of the bid and ask prices as of the NYSE Close. If a mean of the bid and ask prices cannot be calculated for the day, the value will be the bid price as of the NYSE Close. In the case of over-the-counter ("OTC") options and such instruments that do not trade on an exchange, values may be supplied by a pricing service using a formula or other objective method that may take into consideration the style, direction, expiration, strike price, notional value and volatility or other special adjustments.
Investments valued in currencies other than U.S. dollars are converted to U.S. dollars using exchange rates obtained from independent pricing services for calculation of the NAV. As a result, the NAV of the Fund’s shares may be affected by changes in the value of currencies in relation to the U.S. dollar. The value of investments traded in markets outside the United States or denominated in currencies other than the U.S. dollar may be affected significantly on a day that the NYSE is closed and the market value may change on days when an investor is not able to purchase, redeem or exchange shares of the Fund.
Foreign currency contracts represent agreements to exchange currencies on specific future dates at predetermined rates. Foreign currency contracts are valued using foreign currency exchange rates and forward rates as provided by an independent pricing service on the Valuation Date.
Financial instruments for which prices are not available from an independent pricing service may be valued using market quotations obtained from one or more dealers that make markets in the respective financial instrument in accordance with procedures established by the Company's Board of Directors.
U.S. GAAP defines fair value as the price that the Fund would receive to sell an asset or pay to transfer a liability in an orderly transaction between market participants. The U.S. GAAP fair value measurement standards require disclosure of a fair value hierarchy for each major category of assets and liabilities. Various inputs are used in determining the fair value of the Fund’s investments. These inputs are summarized into three broad hierarchy levels. This hierarchy is based on whether the valuation inputs are observable or unobservable. These levels are:
Level 1 – Quoted prices in active markets for identical investments. Level 1 may include exchange traded instruments, such as domestic equities, some foreign equities, options, futures, mutual funds, exchange traded funds, rights and warrants.
Level 2 – Observable inputs other than Level 1 prices, such as quoted prices for similar investments; quoted prices in markets that are not active; or other inputs that are observable or can be corroborated by observable market data. Level 2 may include debt investments that are traded less frequently than exchange traded instruments and which are valued using independent pricing services; foreign equities, which are principally traded on certain foreign markets and are adjusted daily pursuant to a fair value pricing service in order to reflect an adjustment for the factors occurring after the close of certain foreign markets but before the NYSE Close; senior floating rate interests, which are valued using an aggregate of dealer bids; short-term investments, which are valued at amortized cost; and swaps, which are valued based upon the terms of each swap contract.
Level 3 – Significant unobservable inputs that are supported by limited or no market activity. Level 3 may include financial instruments whose values are determined using indicative market quotes or require significant management judgment or estimation. These unobservable valuation inputs may include estimates for current yields, maturity/duration, prepayment speed, and indicative market quotes for comparable investments along with other assumptions relating to credit quality, collateral value,
| 34 |
The Hartford Global All-Asset Fund
Notes to Consolidated Financial Statements – (continued)
October 31, 2014
(000’s Omitted)
complexity of the investment structure, general market conditions and liquidity. This category may include investments where trading has been halted or there are certain restrictions on trading. While these investments are priced using unobservable inputs, the valuation of these investments reflects the best available data and management believes the prices are a reasonable representation of exit price.
The Board of Directors of the Company generally reviews and approves the “Procedures for Valuation of Portfolio Securities” at least once a year. These procedures define how investments are to be valued, including the formation and activities of a Valuation Committee. The Valuation Committee is responsible for determining in good faith the fair value of investments when the value cannot be obtained from primary pricing services or alternative sources or if the valuation of an investment as provided by the primary pricing service or alternative source is believed not to reflect the investment’s fair value as of the Valuation Date. Voting members of the Valuation Committee include the Fund's Treasurer or designee and a Vice President of the investment manager or designee. An Assistant Vice President of the Fund with legal expertise or designee is also included on the Valuation Committee as a non-voting advisory member. In addition, the Fund’s Chief Compliance Officer shall designate a member of the compliance group to attend Valuation Committee meetings as a non-voting resource, to monitor for and provide guidance with respect to compliance with these procedures. Two members of the Valuation Committee or their designees, representing different departments, shall constitute a quorum for purposes of permitting the Valuation Committee to take action. The Valuation Committee will consider all relevant factors in determining an investment’s fair value, and may seek the advice of the Fund’s sub-adviser, knowledgeable brokers, and legal counsel in making such determination. The Valuation Committee reports to the Audit Committee of the Company's Board of Directors. The Audit Committee receives quarterly written reports which include details of all fair-valued investments, including the reason for the fair valuation, and an indication, when possible, of the accuracy of the valuation by disclosing the next available reliable public price quotation or the disposition price of such investments (the “look-back” test). The Board of Directors then must consider for ratification all of the fair value determinations made during the previous quarter.
Valuation levels are not necessarily indicative of the risk associated with investing in such investments. Individual investments within any of the above mentioned asset classes may be assigned a different hierarchical level than those presented above, as individual circumstances dictate.
For additional information, refer to the Consolidated Investment Valuation Hierarchy Level Summary and the Level 3 roll-forward reconciliation, if applicable, which follow the Consolidated Schedule of Investments.
Investment Transactions and Investment Income – Investment transactions are recorded as of the trade date (the date the order to buy or sell is executed) for financial reporting purposes. Investments purchased or sold on a when-issued or delayed-delivery basis may be settled a month or more after the trade date. Realized gains and losses are determined on the basis of identified cost.
Dividend income from domestic securities is accrued on the ex-dividend date. In general, dividend income from foreign securities is recorded on the ex-date; however, dividend notifications in certain foreign jurisdictions may not be available in a timely manner and as a result, the Fund will record the dividend as soon as the relevant details (i.e., rate per share, payment date, shareholders of record, etc.) are publicly available. Interest income, including amortization of premium, accretion of discounts and additional principal received in-kind in lieu of cash, is accrued on a daily basis. Paydown gains and losses on mortgage related and other asset backed securities are included in interest income in the Consolidated Statement of Operations, as applicable.
Taxes – The Fund may be subject to taxes imposed on realized gains on securities of certain foreign countries in which the Fund invests. The amount of foreign tax expense is included on the accompanying Consolidated Statement of Operations as a reduction to net realized gain on investments in these securities.
Foreign Currency Transactions – Assets and liabilities denominated in currencies other than U.S. dollars are translated into U.S. dollars at the exchange rates in effect on the valuation date. Purchases and sales of investments, income and expenses are translated into U.S. dollars at the exchange rates on the dates of such transactions.
| 35 |
The Hartford Global All-Asset Fund
Notes to Consolidated Financial Statements – (continued)
October 31, 2014
(000’s Omitted)
The Fund does not isolate that portion of portfolio investment valuation resulting from fluctuations in the foreign currency exchange rates from the fluctuations arising from changes in the market prices of investments held. Exchange rate fluctuations are included with the net realized and unrealized gain or loss on investments in the accompanying financial statements.
Net realized foreign exchange gains or losses arise from sales of foreign currencies and the difference between asset and liability amounts initially stated in foreign currencies and the U.S. dollar value of the amounts actually received or paid. Net unrealized foreign exchange gains or losses arise from changes in the value of other assets and liabilities at the end of the reporting period, resulting from changes in the exchange rates.
Joint Trading Account – The Fund may invest cash balances into a joint trading account that may be invested in one or more repurchase agreements.
Fund Share Valuation and Dividend Distributions to Shareholders – Orders for the Fund’s shares are executed in accordance with the investment instructions of the shareholders. The NAV of the Fund’s shares is determined as of the close of business on each business day of the Exchange. The NAV is determined separately for each class of shares of the Fund by dividing the Fund’s net assets attributable to that class by the number of shares of the class outstanding. Each class of shares offered by the Fund has equal rights as to assets and voting privileges (except that shareholders of a class have exclusive voting rights regarding any matter relating solely to that class of shares). Income and non-class specific expenses are allocated daily to each class on the basis of the relative net assets of the class. Realized and unrealized gains and losses are allocated daily based on the relative net assets of each class of shares of the Fund.
Orders for the purchase of the Fund’s shares received prior to the close of the Exchange on any day the Exchange is open for business are priced at the NAV determined as of the close of the Exchange. Orders received after the close of the Exchange, or on a day on which the Exchange and/or the Fund is not open for business, are priced at the next determined NAV.
Dividends are declared pursuant to a policy adopted by the Company's Board of Directors based upon the investment performance of the Fund. The policy of the Fund is to pay dividends from net investment income and realized gains, if any, at least once a year.
Net investment income, dividends and distributions from net realized gains and capital are determined in accordance with federal income tax regulations, which may differ from U.S. GAAP with respect to character and timing (see Federal Income Taxes: Distributions and Components of Distributable Earnings and Reclassification of Capital Accounts).
Basis for Consolidation – The Fund may invest up to 25% of its total assets in a wholly-owned subsidiary of the Fund. The Subsidiary is organized under the laws of the Cayman Islands and is consolidated in the Fund’s financial statements. All intercompany balances, revenues, and expenses have been eliminated in consolidation. The Subsidiary acts as an investment vehicle in order to enter into certain investments for the Fund, consistent with the investment objectives and policies specified in the Prospectus and Statement of Additional Information.
Securities and Other Investments:
Repurchase Agreements – A repurchase agreement is an agreement by which a counterparty agrees to sell an investment and agrees to repurchase the investment sold from the buyer at a mutually agreed upon time and price. During the period of the repurchase agreement, the counterparty will deposit cash and or securities in a third party custodial account to serve as collateral. At the time the Fund enters into a repurchase agreement, the value of the underlying collateral, including accrued interest, will be equal to or exceed the value of the repurchase agreement. Repurchase agreements expose the Fund to counterparty risk - that is, the risk that the counterparty will not fulfill its obligations. To minimize counterparty risk, the investments that serve to collateralize the repurchase agreement are held by the Fund’s custodian in book entry or physical form in the custodial account of the Fund or in a third party custodial account. Repurchase agreements are valued at cost plus accrued interest, which approximates fair value. Repurchase agreements have master netting arrangements which allow the Fund to offset amounts owed to a counterparty with amounts owed by the counterparty, including any collateral. Upon an event of default under a master repurchase agreement, the non-defaulting party may close out all transactions traded under such agreement and net amounts owed under each transaction to one net amount payable by one party to the other. Absent an event of default, the master repurchase agreement does not result in an offset of
| 36 |
The Hartford Global All-Asset Fund
Notes to Consolidated Financial Statements – (continued)
October 31, 2014
(000’s Omitted)
reported amounts of assets and liabilities in the Consolidated Statement of Assets and Liabilities across transactions between the Fund and the applicable counterparty. The Fund, as shown on the Consolidated Schedule of Investments, had outstanding repurchase agreements and related collateral as of October 31, 2014.
Illiquid and Restricted Investments – The Fund is permitted to invest up to 15% of its net assets in illiquid investments. Illiquid investments are those that may not be sold or disposed of in the ordinary course of business within seven days, at approximately the price used to determine the Fund’s NAV. The Fund may not be able to sell illiquid investments when its sub-adviser considers it desirable to do so or may have to sell such investments at a price that is lower than the price that could be obtained if the investments were more liquid. A sale of illiquid investments may require more time and may result in higher dealer discounts and other selling expenses than does the sale of those that are liquid. Illiquid investments also may be more difficult to value due to the unavailability of reliable market quotations for such investments, and an investment in them may have an adverse impact on the Fund’s NAV. The Fund may also purchase certain restricted investments that can only be resold to certain qualified investors and may be determined to be liquid pursuant to policies and guidelines established by the Company's Board of Directors. The Fund, as shown on the Consolidated Schedule of Investments, had illiquid or restricted investments as of October 31, 2014.
Investments Purchased on a When-Issued or Delayed-Delivery Basis – Delivery and payment for investments that have been purchased by the Fund on a forward commitment, or when-issued or delayed-delivery basis, take place beyond the customary settlement period. The Fund may dispose of or renegotiate a delayed-delivery transaction after it is entered into, and may sell delayed-delivery investments before they are delivered, which may result in a realized gain or loss. During this period, such investments are subject to market fluctuations, and the Fund identifies investments segregated in its records with a value at least equal to the amount of the commitment. The Fund, as shown on the Consolidated Schedule of Investments, had when-issued or delayed-delivery investments as of October 31, 2014.
In connection with the Fund’s ability to purchase investments on a when-issued or forward commitment basis, the Fund may enter into to-be announced (“TBA”) commitments. TBA commitments are forward agreements for the purchase or sale of mortgage backed securities for a fixed price, with payment and delivery on an agreed-upon future settlement date. The specific securities to be delivered are not identified at the trade date; however, delivered securities must meet specified terms, including issuer, rate and mortgage terms. Although the Fund may enter into TBA commitments with the intention of acquiring or delivering securities for its portfolio, the Fund can extend the settlement date, roll the transaction, or dispose of a commitment prior to settlement if deemed appropriate to do so. If the TBA commitment is closed through the acquisition of an offsetting TBA commitment, the Fund realizes a gain or loss. In a TBA roll transaction, the Fund generally purchases or sells the initial TBA commitment prior to the agreed upon settlement date and enters into a new TBA commitment for future delivery or receipt of the mortgage backed securities. TBA commitments involve a risk of loss if the value of the security to be purchased or sold declines or increases, respectively, prior to settlement date.
The Fund may enter into “dollar rolls” in which the Fund sells securities and contracts with the same counterparty to repurchase substantially similar securities (for example, same issuer, coupon and maturity) on a specified future date at an agreed upon price. The Fund gives up the right to receive interest paid on the investments sold. The Fund would benefit to the extent of any differences between the price received for the security and the lower forward price for the future purchase. Dollar rolls involve the risk that the market value of the securities that the Fund is required to purchase may decline below the agreed upon repurchase price of those securities. The Fund records dollar roll transactions as purchases and sales and realizes gains and losses on these transactions. These transactions are excluded from the Fund’s portfolio turnover rate. The Fund, as shown on the Consolidated Schedule of Investments, had open TBA commitments as of October 31, 2014, which may be a part of dollar roll transactions.
Mortgage Related and Other Asset Backed Securities – The Fund may invest in mortgage related and other asset backed securities. These securities include mortgage pass-through securities, collateralized mortgage obligations, commercial mortgage backed securities, stripped mortgage backed securities, asset backed securities, collateralized debt obligations and other securities that directly or indirectly represent a participation in, or are secured by and payable from, mortgage loans on real property. Mortgage related securities are created from pools of residential or commercial mortgage loans, including mortgage loans made by savings and loan institutions, mortgage bankers, commercial banks and other similar financial institutions. Asset backed securities are created from many types of assets, including auto loans, credit card receivables, home equity loans, and student loans. These securities provide a monthly payment that consists of both interest and principal payments. Interest payments may be determined by fixed or
| 37 |
The Hartford Global All-Asset Fund
Notes to Consolidated Financial Statements – (continued)
October 31, 2014
(000’s Omitted)
adjustable rates. The rate of pre-payments on underlying mortgages will affect the price and volatility of a mortgage related security, and may have the effect of shortening or extending the effective duration of the security relative to what was anticipated at the time of purchase. The timely payment of principal and interest of certain mortgage related securities is guaranteed by the full faith and credit of the United States Government. Mortgage related and other asset backed securities created and guaranteed by non-governmental issuers, including government-sponsored corporations, may be supported by various forms of insurance or guarantees, but there can be no assurance that the private insurers or guarantors can meet their obligations under the insurance policies or guarantee arrangements. The Fund, as shown on the Consolidated Schedule of Investments, had outstanding mortgage related and other asset backed securities as of October 31, 2014.
Inflation Indexed Bonds – The Fund may invest in inflation indexed bonds. Inflation indexed bonds are fixed income investments whose principal value is periodically adjusted to the rate of inflation. The interest rate on these bonds is generally fixed at issuance at a rate lower than typical bonds. Over the life of an inflation indexed bond, however, interest will be paid based on a principal value, which is adjusted for inflation. Any increase or decrease in the principal amount of an inflation indexed bond will be included as interest income on the Consolidated Statement of Operations, even though investors do not receive the principal amount until maturity. The Fund, as shown on the Consolidated Schedule of Investments, had inflation indexed bonds as of October 31, 2014.
Financial Derivative Instruments:
The following disclosures contain information on how and why the Fund uses derivative instruments, the credit-risk-related contingent features in certain derivative instruments and how derivative instruments affect the Fund’s financial position and results of operations. The location and fair value amounts of these instruments on the Consolidated Statement of Assets and Liabilities and the realized gains and losses and changes in unrealized gains and losses on the Consolidated Statement of Operations, each categorized by type of derivative contract, are included in the following Additional Derivative Instrument Information footnote. The derivative instruments outstanding as of year-end are disclosed in the notes to the Consolidated Schedule of Investments, if applicable. The amounts of realized gains and losses and changes in unrealized gains and losses on derivative instruments during the year are disclosed in the Consolidated Statement of Operations.
Foreign Currency Contracts – The Fund may enter into foreign currency contracts that obligate the Fund to purchase or sell currencies at specified future dates. Foreign currency contracts are used to hedge the currency exposure associated with some or all of the Fund’s investments and/or as part of an investment strategy. Foreign currency contracts are marked to market daily and the change in value is recorded by the Fund as an unrealized gain or loss. The Fund will record a realized gain or loss when the foreign currency contract is settled.
Foreign currency contracts involve elements of market risk in excess of the amounts reflected in the Consolidated Statement of Assets and Liabilities. In addition, risks may arise upon entering into these contracts from the potential inability of the counterparties to meet the terms of the contracts and from unanticipated movements in the value of the foreign currencies relative to the U.S. dollar. The Fund, as shown on the Consolidated Schedule of Investments, had outstanding foreign currency contracts as of October 31, 2014.
Futures Contracts – The Fund may enter into futures contracts. A futures contract is an agreement between two parties to buy or sell an asset at a set price on a future date. The Fund uses futures contracts to manage or obtain exposure to the investment markets, commodities, or movements in interest rates and currency values. The primary risks associated with the use of futures contracts are the imperfect correlation between the change in market value of the investments held by the Fund and the prices of futures contracts and the possibility of an illiquid market. Upon entering into a futures contract, the Fund is required to deposit with a futures commission merchant (“FCM”) an amount of cash or U.S. Government or Agency Obligations in accordance with the initial margin requirements of the broker or exchange. Futures contracts are marked to market daily at the most recent settlement price reported by an exchange on which, over time, they are traded most extensively, and an appropriate payable or receivable for the change in value (“variation margin”) is recorded by the Fund. Gains or losses are recognized but not considered realized until the contracts expire or are closed. Futures contracts involve, to varying degrees, risk of loss in excess of the variation margin disclosed on the Consolidated Statement of Assets and Liabilities; however, the Fund seeks to reduce this risk through the use of an FCM. The Fund, as shown on the Consolidated Schedule of Investments, had outstanding futures contracts as of October 31, 2014.
| 38 |
The Hartford Global All-Asset Fund
Notes to Consolidated Financial Statements – (continued)
October 31, 2014
(000’s Omitted)
Options Contracts – An option contract is a contract sold by one party to another party that offers the buyer the right, but not the obligation, to buy (call) or sell (put) an investment or other financial asset at an agreed-upon price during a specific period of time or on a specific date. Options contracts are either privately negotiated in the over-the-counter market ("OTC options") or executed in a registered exchange ("exchange traded options"). The Fund may write (sell) covered call and put options on futures, swaps (“swaptions”), securities, commodities or currencies. “Covered” means that so long as the Fund is obligated as the writer of an option, it will own either the underlying investments or currency or an option to purchase the same underlying investments or currency having an expiration date of the covered option and an exercise price equal to or less than the exercise price of the covered option, or will pledge cash or other liquid investments having a value equal to or greater than the fluctuating market value of the option investment or currency. Writing put options increases the Fund’s exposure to the underlying instrument. Writing call options decreases the Fund’s exposure to the underlying instrument. Premiums received from writing options that expire are treated as realized gains. Premiums received from writing options that are exercised or closed are added to the proceeds or offset amounts paid on the underlying futures, swap, investment or currency transaction to determine the realized gain or loss. The Fund as a writer of an option has no control over whether the underlying instrument may be sold (call) or purchased (put) and as a result bears the market risk of an unfavorable change in the price of the instrument underlying the written option. There is the risk the Fund may not be able to enter into a closing transaction because of an illiquid market. The Fund may also purchase put and call options. Purchasing call options increases the Fund’s exposure to the underlying instrument. Purchasing put options decreases the Fund’s exposure to the underlying instrument. The Fund pays a premium, which is included on the Fund’s Consolidated Statement of Assets and Liabilities as an investment and is subsequently marked to market to reflect the current value of the option. Premiums paid for purchasing options that expire are treated as realized losses. Certain options may be purchased with premiums to be determined on a future date. The premiums for these options are based upon implied volatility parameters at specified terms. The risk associated with purchasing put and call options is generally limited to the premium paid. Premiums paid for purchasing options that are exercised or closed are added to the amounts paid or offset against the proceeds on the underlying investment transaction to determine the realized gain or loss. Entering into over-the-counter options also exposes the Fund to counterparty risk. Counterparty risk is the possibility that the counterparty to the agreements may default on its obligation to perform or disagree as to the meaning of the contractual terms in the agreements.
The Fund, as shown on the Consolidated Schedule of Investments, had outstanding purchased and written option contracts as of October 31, 2014. Transactions involving written option contracts during the year ended October 31, 2014, are summarized below:
| Options Contract Activity During the Year Ended October 31, 2014: | ||||||||
| Call Options Written During the Year | Number of Contracts* | Premium Amounts | ||||||
| Beginning of the period | — | $ | — | |||||
| Written | 5,750,026 | 246 | ||||||
| Expired | — | — | ||||||
| Closed | (350,026 | ) | (87 | ) | ||||
| Exercised | — | — | ||||||
| End of period | 5,400,000 | $ | 159 | |||||
| Put Options Written During the Year | Number of Contracts* | Premium Amounts | ||||||
| Beginning of the period | — | $ | — | |||||
| Written | 5,750,026 | 253 | ||||||
| Expired | — | — | ||||||
| Closed | (350,026 | ) | (86 | ) | ||||
| Exercised | — | — | ||||||
| End of period | 5,400,000 | $ | 167 | |||||
* The number of contracts does not omit 000's.
Swap Contracts – The Fund may invest in swap contracts. Swap contracts are agreements to exchange or swap investment cash flows, assets, foreign currencies or market-linked returns at specified, future intervals. Swap contracts are either privately negotiated in the over-the-counter market (“OTC swaps”) or cleared in a central clearing house (“centrally cleared swaps”). The Fund may enter into credit default, total return, cross-currency, interest rate, inflation and other forms of swap contracts to manage its exposure to credit, currency, interest rate, commodity and inflation risk. Swap contracts are also used to gain exposure to certain markets. In connection with these contracts, investments or cash may be identified as collateral or margin in accordance with the terms of the respective swap contracts and/or master netting arrangement to provide assets of value and recourse in the event of default or bankruptcy/insolvency.
| 39 |
The Hartford Global All-Asset Fund
Notes to Consolidated Financial Statements – (continued)
October 31, 2014
(000’s Omitted)
Swaps are valued based on custom valuations furnished by an independent pricing service. Swaps for which prices are not available from an independent pricing service are valued in accordance with procedures established by the Company's Board of Directors. Changes in market value, if any, are reflected as a component of net changes in unrealized appreciation or depreciation on the Consolidated Statement of Operations. Daily changes in valuation of centrally cleared swaps, if any, are recorded as a receivable or payable for the change in value (“variation margin”) on the Consolidated Statement of Assets and Liabilities. Realized gains or losses on centrally cleared swaps are recorded upon the termination of the swap. OTC swap payments received or paid at the beginning of the measurement period are reflected as such on the Consolidated Statement of Assets and Liabilities and represent premiums paid or received upon entering into the swap contract to compensate for differences between the stated terms of the swap contract and prevailing market conditions (credit spreads, currency exchange rates, interest rates and other relevant factors). These upfront premiums are recorded as realized gains or losses on the Consolidated Statement of Operations upon termination or maturity of the swap. A liquidation payment received or made at the termination or maturity of the swap is recorded as a realized gain or loss on the Consolidated Statement of Operations. Net periodic payments received or paid by the Fund are included as part of realized gains or losses on the Consolidated Statement of Operations.
Entering into these contracts involves, to varying degrees, elements of liquidation, counterparty, credit and market risk in excess of the amounts recognized on the Consolidated Statement of Assets and Liabilities. Such risks involve the possibility that there will be no liquid market for these contracts, that the counterparty to the contracts may default on its obligation to perform or disagree as to the meaning of contractual terms in the contracts, and that there may be unfavorable changes in market conditions (credit spreads, currency exchange rates, interest rates and other relevant factors).
The Fund’s maximum risk of loss from counterparty risk for OTC swaps is the net value of the discounted cash flows to be received from the counterparty over the contract’s remaining life, and current market value, to the extent that amount is positive. The risk is mitigated by having a master netting arrangement between the Fund and the counterparty, which allows for the netting of payments made or received (although such amounts are presented on a gross basis within the Consolidated Statement of Assets and Liabilities, as applicable) as well as the posting of collateral to the Fund to cover the Fund’s exposure to the counterparty. In a centrally cleared swap, while the Fund enters into an agreement with a clearing broker to execute contracts with a counterparty, the performance of the swap is guaranteed by the central clearinghouse, which reduces the Fund’s exposure to counterparty risk. The Fund is still exposed to the counterparty risk through the clearing broker and clearinghouse. The clearinghouse attempts to minimize this risk to its participants through the use of mandatory margin requirements, daily cash settlements and other procedures. Likewise, the clearing broker reduces its risk through margin requirements and required segregation of customer balances.
Credit Default Swap Contracts – The credit default swap market allows the Fund to manage its exposure to the market or certain sectors of the market, to reduce its risk exposure to defaults of corporate and sovereign issuers, or to create exposure to corporate or sovereign issuers to which it is not otherwise exposed. Certain credit default swaps involve the exchange of a fixed rate premium for protection against the loss in value of an underlying investment or index in the event of a credit event, such as payment default or bankruptcy.
Under a credit default swap contract, one party acts as guarantor by receiving the fixed periodic payment in exchange for the commitment to purchase the underlying investment at par if the defined credit event occurs. Upon the occurrence of a defined credit event, the difference between the value of the reference obligation and the swap’s notional amount is recorded as realized gain or loss on swap transactions in the Consolidated Statement of Operations. A “buyer” of credit protection agrees to pay a counterparty to assume the credit risk of an issuer upon the occurrence of certain events. The “seller” of the protection receives periodic payments and agrees to assume the credit risk of an issuer upon the occurrence of certain events. Although specified events are contract specific, credit events are generally defined as bankruptcy, failure to pay, restructuring, obligation acceleration, obligation default or repudiation/moratorium. A “seller’s” exposure is limited to the total notional amount of the credit default swap contract. These potential amounts would be partially offset by any recovery values of the respective referenced obligations or upfront payments received upon entering into the contract.
Implied credit spreads, represented in absolute terms, utilized in determining the market value of credit default swap contracts on corporate issues, sovereign government issues or U.S. municipal issues as of year-end are disclosed in the notes to the Consolidated Schedule of Investments, as applicable, and serve as an indicator of the current status of the payment/performance risk and represent the likelihood or risk of default for the credit derivative. The implied credit spread of a particular referenced entity reflects the cost of
| 40 |
The Hartford Global All-Asset Fund
Notes to Consolidated Financial Statements – (continued)
October 31, 2014
(000’s Omitted)
buying/selling protection and there may also be upfront payments required to be made to enter into the contract. Wider credit spreads represent a deterioration of the referenced entity’s credit soundness and a greater likelihood or risk of default or other credit event occurring as defined under the terms of the contract. For credit default swap contracts on credit indices, the quoted market prices and resulting values serve as the indicator of the current status of the payment/performance risk. Increasing market values, in absolute terms when compared to the notional amount of the swap, represent a deterioration of the referenced equity’s credit soundness and a greater likelihood or risk of default or other credit event occurring as defined under the terms of the contract. The Fund, as shown on the ConsolidatedSchedule of Investments, had outstanding credit default swap contracts as of October 31, 2014.
Interest Rate Swap Contracts – The Fund is subject to interest rate risk exposure in the normal course of pursuing its investment objectives. Because the Fund holds fixed rate bonds, the value of these bonds may decrease if interest rates rise. To hedge against this risk and to maintain its ability to generate income at prevailing market rates, the Fund may enter into interest rate swap contracts. In a typical interest rate swap, one party agrees to make regular payments equal to a floating interest rate, based on a specified interest rate or benchmark (e.g. London Interbank Offered Rate (“LIBOR”)), multiplied by a notional amount, in return for payments equal to a fixed rate multiplied by the same amount, for a specific period of time. The net interest received or paid on interest rate swap contracts is recorded as a realized gain or loss. Interest rate swaps are marked to market daily and the change, if any, is recorded as an unrealized gain or loss in the Consolidated Statement of Operations. When the interest rate swap contract is terminated early, the Fund records a realized gain or loss equal to the difference between the current market value and the upfront premium or cost.
If an interest rate swap contract provides for payments in different currencies, the parties might agree to exchange the notional amount as well. Interest rate swaps may also depend on other prices or rates, such as the value of an index. The risks of interest rate swaps include changes in market conditions which will affect the value of the contract or the cash flows and the possible inability of the counterparty to fulfill its obligations under the contract. The Fund’s maximum risk of loss from counterparty credit risk is the discounted net value of the cash flows to be received from the counterparty over the contract’s remaining life, to the extent that amount is positive. The Fund had no outstanding interest rate swap contracts as of October 31, 2014.
Total Return Swap Contracts – The Fund may invest in total return swap contracts. An investment in a total return swap allows the Fund to gain or mitigate exposure to underlying referenced securities, indices or commodities. Total return swap contracts involve commitments where cash flows are exchanged based on the price of underlying securities, indices or commodities and based on a fixed or variable rate. One party would receive payments based on the price appreciation or depreciation of a commodity index, a portion of the index, or a single commodity in exchange for paying to or receiving from the counterparty seller an agreed-upon rate, which can be fixed or variable. A variable rate may be correlated to a base rate, such as the LIBOR, and is adjusted each reset period, which are defined at the beginning of the contract. Therefore, if interest rates increase over the term of the swap contract, the party paying the rate may be required to pay a higher rate at each swap reset date.
Total return swap contracts on indices involve commitments to pay interest in exchange for a market-linked return. One party pays out the total return of a specific reference asset, which may be an equity, index, or bond, and in return receives a regular stream of payments. To the extent the total return of the security or index underlying the transaction exceeds or falls short of the offsetting interest rate obligation, the Fund will receive a payment from or make a payment to the counterparty. The Fund, as shown on the Consolidated Schedule of Investments, had outstanding total return swap contracts as of October 31, 2014.
| 41 |
The Hartford Global All-Asset Fund
Notes to Consolidated Financial Statements – (continued)
October 31, 2014
(000’s Omitted)
Additional Derivative Instrument Information:
Fair Value of Derivative Instruments on the Consolidated Statement of Assets and Liabilities as of October 31, 2014:
| Risk Exposure Category | ||||||||||||||||||||||||||||
| Interest
Rate Contracts | Foreign
Exchange Contracts | Credit
Contracts | Equity
Contracts | Commodity
Contracts | Other
Contracts | Total | ||||||||||||||||||||||
| Assets: | ||||||||||||||||||||||||||||
| Investments in securities, at value (purchased option contracts), market value | $ | — | $ | 567 | $ | — | $ | 280 | $ | 76 | $ | — | $ | 923 | ||||||||||||||
| Unrealized appreciation on foreign currency contracts | — | 5,687 | — | — | — | — | 5,687 | |||||||||||||||||||||
| Unrealized appreciation on OTC swap contracts | — | — | 141 | 35 | — | — | 176 | |||||||||||||||||||||
| Variation margin receivable * | 35 | — | 17 | 226 | — | — | 278 | |||||||||||||||||||||
| Total | $ | 35 | $ | 6,254 | $ | 158 | $ | 541 | $ | 76 | $ | — | $ | 7,064 | ||||||||||||||
| Liabilities: | ||||||||||||||||||||||||||||
| Unrealized depreciation on foreign currency contracts | $ | — | $ | 1,894 | $ | — | $ | — | $ | — | $ | — | $ | 1,894 | ||||||||||||||
| Unrealized depreciation on OTC swap contracts | — | — | — | 812 | — | — | 812 | |||||||||||||||||||||
| Variation margin payable * | 102 | — | — | 318 | 22 | — | 442 | |||||||||||||||||||||
| Written option contracts, market value | 84 | 133 | — | — | — | — | 217 | |||||||||||||||||||||
| Total | $ | 186 | $ | 2,027 | $ | — | $ | 1,130 | $ | 22 | $ | — | $ | 3,365 | ||||||||||||||
* Only current day's variation margin is reported within the Consolidated Statement of Assets and Liabilities. The variation margin is included in the open futures net cumulative depreciation of $(1,119) and open centrally cleared swaps net cumulative appreciation of $53 as reported in the Consolidated Schedule of Investments.
The volume of derivatives that is presented in the Consolidated Schedule of Investments is consistent with the derivative activity during the year ended October 31, 2014.
The Effect of Derivative Instruments on the Consolidated Statement of Operations for the year ended October 31, 2014:
| Risk Exposure Category | ||||||||||||||||||||||||||||
| Interest
Rate Contracts | Foreign
Exchange Contracts | Credit
Contracts | Equity
Contracts | Commodity
Contracts | Other
Contracts | Total | ||||||||||||||||||||||
| Realized Gain (Loss) on Derivatives Recognized as a Result of Operations: | ||||||||||||||||||||||||||||
| Net realized gain (loss) on purchased option contracts | $ | 56 | $ | 149 | $ | — | $ | (942 | ) | $ | (201 | ) | $ | — | $ | (938 | ) | |||||||||||
| Net realized gain (loss) on futures contracts | 3,906 | — | — | (2,384 | ) | (285 | ) | — | 1,237 | |||||||||||||||||||
| Net realized gain on written option contracts | 2 | — | — | — | — | — | 2 | |||||||||||||||||||||
| Net realized gain (loss) on swap contracts | (1,944 | ) | — | 2,094 | (320 | ) | (173 | ) | — | (343 | ) | |||||||||||||||||
| Net realized gain on foreign currency contracts | — | 6,396 | — | — | — | — | 6,396 | |||||||||||||||||||||
| Total | $ | 2,020 | $ | 6,545 | $ | 2,094 | $ | (3,646 | ) | $ | (659 | ) | $ | — | $ | 6,354 | ||||||||||||
| Net Change in Unrealized Appreciation (Depreciation) on Derivatives Recognized as a Result of Operations: | ||||||||||||||||||||||||||||
| Net change in unrealized appreciation (depreciation) of purchased option contracts | $ | — | $ | 520 | $ | — | $ | 36 | $ | (54 | ) | $ | — | $ | 502 | |||||||||||||
| Net change in unrealized appreciation (depreciation) of futures contracts | (1,714 | ) | — | — | 81 | (106 | ) | — | (1,739 | ) | ||||||||||||||||||
| Net change in unrealized appreciation of written option contracts | 3 | 106 | — | — | — | — | 109 | |||||||||||||||||||||
| Net change in unrealized appreciation (depreciation) of swap contracts | 379 | — | (1,311 | ) | (420 | ) | — | — | (1,352 | ) | ||||||||||||||||||
| Net change in unrealized appreciation of foreign currency contracts | — | 4,369 | — | — | — | — | 4,369 | |||||||||||||||||||||
| Total | $ | (1,332 | ) | $ | 4,995 | $ | (1,311 | ) | $ | (303 | ) | $ | (160 | ) | $ | — | $ | 1,889 | ||||||||||
| 42 |
The Hartford Global All-Asset Fund
Notes to Consolidated Financial Statements – (continued)
October 31, 2014
(000’s Omitted)
Balance Sheet Offsetting Information - The following discloses both gross information and net information about instruments and transactions eligible for offset in the financial statements, and instruments and transactions that are subject to a master netting arrangement, as well as amounts related to margin, reflected as financial collateral (including cash collateral), held at clearing brokers, counterparties and the Fund’s custodian. The master netting arrangements allow the clearing brokers to net any collateral held in or on behalf of the Fund, or liabilities or payment obligations of the clearing brokers to the Fund, against any liabilities or payment obligations of the Fund to the clearing brokers. The Fund is required to deposit financial collateral (including cash collateral) at the FCM's custodian on behalf of clearing brokers and counterparties to continually meet the original and maintenance requirements established by the clearing brokers and counterparties. Such requirements are specific to the respective clearing broker or counterparty. Certain master netting arrangements may not be enforceable in the bankruptcy proceedings of a counterparty.
Offsetting of Financial Assets and Derivative Assets as of October 31, 2014:
| Gross
Amounts* of Assets Presented in Consolidated Statement of Assets and Liabilities | Financial
Instruments with Allowable Netting | Non-cash
Collateral Received | Cash
Collateral Received | Net
Amount (not less than $0) | ||||||||||||||||
| Description | ||||||||||||||||||||
| OTC purchased option and OTC swap contracts at market value | $ | 911 | $ | (752 | ) | $ | — | $ | (125 | )† | $ | 34 | ||||||||
| Futures contracts - variation margin receivable | 261 | (261 | ) | — | — | — | ||||||||||||||
| Swap contracts - variation margin receivable | 17 | — | — | — | □ | 17 | ||||||||||||||
| Unrealized appreciation on foreign currency contracts | 5,558 | (1,415 | ) | — | — | 4,143 | ||||||||||||||
| Total subject to a master netting or similar arrangement | $ | 6,747 | $ | (2,428 | ) | $ | — | $ | (125 | ) | $ | 4,194 | ||||||||
* Gross amounts are presented here as there are no amounts that are netted within the Consolidated Statement of Assets and Liabilities.
† An additional $88 of cash collateral was received by the Fund related to derivative assets.
□ The Fund has pledged $201 as collateral for open centrally cleared swap contracts held at October 31, 2014.
Offsetting of Financial Liabilities and Derivative Liabilities as of October 31, 2014:
| Gross
Amounts* of Liabilities Presented in Consolidated Statement of Assets and Liabilities | Financial Instruments with Allowable Netting | Non-cash Collateral Pledged | Cash
Collateral Pledged | Net
Amount (not less than $0) | ||||||||||||||||
| Description | ||||||||||||||||||||
| OTC written option and OTC swap contracts at market value | $ | 2,163 | $ | (752 | ) | $ | — | $ | (1,142 | )† | $ | 269 | ||||||||
| Futures contracts - variation margin payable | 442 | (261 | ) | — | (7,920 | ) | — | |||||||||||||
| Unrealized depreciation on foreign currency contracts | 1,876 | (1,415 | ) | — | — | 461 | ||||||||||||||
| Total subject to a master netting or similar arrangement | $ | 4,481 | $ | (2,428 | ) | $ | — | $ | (9,062 | ) | $ | 730 | ||||||||
* Gross amounts are presented here as there are no amounts that are netted within the Consolidated Statement of Assets and Liabilities.
† An additional $298 of cash collateral was pledged to counterparties related to derivative liabilities.
Certain derivatives held by the Fund, as of October 31, 2014, are not subject to a master netting arrangement and are excluded from the table above.
Principal Risks:
Credit risk depends largely on the perceived financial health of bond issuers. In general, the credit rating is inversely related to the credit risk of the issuer. Higher rated bonds generally are deemed to have less credit risk, while lower or unrated bonds are deemed to have higher risk of default. The share price, yield and total return of a fund that holds securities with higher credit risk may be more volatile than those of a fund that holds bonds with lower credit risk. Similar to credit risk, the Fund may be exposed to counterparty risk, or the risk that an institution or other entity with which the Fund has unsettled or open transactions will default.
| 43 |
The Hartford Global All-Asset Fund
Notes to Consolidated Financial Statements – (continued)
October 31, 2014
(000’s Omitted)
The Fund’s investments expose the Fund to various risks including, but not limited to, interest rate, prepayment, extension, foreign currency and equity risks. Interest rate risk is the risk that fixed income securities will decline in value because of changes in interest rates. As nominal interest rates rise, the values of certain fixed income securities held by the Fund are likely to decrease. A nominal interest rate can be described as the sum of a real interest rate and an expected inflation rate. Fixed income securities with longer durations tend to be more sensitive to changes in interest rates, usually making them more volatile than securities with shorter durations. Duration is useful primarily as a measure of the sensitivity of a fixed income security’s market price to interest rate (i.e., yield) movements. Rising interest rates may cause prepayments to occur at a slower than expected rate, thereby effectively lengthening the maturity of the security and making the security more sensitive to interest rate changes. Prepayment and extension risk are major risks of mortgage backed securities and certain asset backed securities. For certain asset backed securities, the actual maturity may be less than the stated maturity shown in the Consolidated Schedule of Investments, if applicable. As a result, the timing of income recognition relating to these securities may vary based upon the actual maturity.
If the Fund invests directly in foreign currencies or in securities that trade in, and receive revenues in, foreign currencies, or in derivatives that provide exposure to foreign currencies, it will be subject to the risk that those currencies will decline in value relative to the base currency (U.S. dollars) of the Fund, or, in the case of hedging positions, that the Fund’s base currency will decline in value relative to the currency being hedged. Currency rates in foreign countries may fluctuate significantly over short periods of time for a number of reasons, including changes in interest rates, intervention (or the failure to intervene) by U.S. or foreign governments, central banks or supranational entities, such as the International Monetary Fund, or by the imposition of currency controls or other political developments in the United States or abroad. As a result, the Fund’s investments in foreign currency denominated securities may reduce the returns of the Fund. The market values of equity securities, such as common stocks and preferred stocks, or equity related investments, such as futures and options, may decline due to general market conditions which are not specifically related to a particular company, such as real or perceived adverse economic conditions, changes in the general outlook for corporate earnings, changes in interest or currency rates or adverse investor sentiment generally. The market value of equity securities may also decline due to factors which affect a particular industry or industries, such as labor shortages or increased production costs and competitive conditions within an industry. Equity securities and equity related investments generally have greater market price volatility than fixed income securities.
Federal Income Taxes:
Federal Income Taxes – For federal income tax purposes, the Fund intends to continue to qualify as a Regulated Investment Company ("RIC") under Subchapter M of the Internal Revenue Code (“IRC”) by distributing substantially all of its taxable net investment income and net realized capital gains to its shareholders and otherwise complying with the requirements of the IRC. The Fund has distributed substantially all of its income and capital gains in prior years, if applicable, and intends to distribute substantially all of its income and capital gains during the calendar year ending December 31, 2014. Accordingly, no provision for federal income or excise taxes has been made in the accompanying financial statements. Distributions from short-term capital gains are treated as ordinary income distributions for federal income tax purposes.
Net Investment Income (Loss), Net Realized Gains (Losses) and Distributions – Net investment income (loss) and net realized gains (losses) may differ for financial statement and tax purposes primarily because of losses deferred due to wash sale adjustments, foreign currency gains and losses, adjustments related to Passive Foreign Investment Companies ("PFICs"), Real Estate Investment Trusts ("REITs"), RICs, certain derivatives and partnerships. The character of distributions made during the year from net investment income or net realized gains may differ from their ultimate characterization for federal income tax purposes. Also, due to the timing of dividend distributions, the fiscal year in which amounts are distributed may differ from the year that the income or realized gains (losses) were recorded by the Fund.
| 44 |
The Hartford Global All-Asset Fund
Notes to Consolidated Financial Statements – (continued)
October 31, 2014
(000’s Omitted)
Distributions and Components of Distributable Earnings – The tax character of distributions paid by the Fund for the periods indicated is as follows (as adjusted for dividends payable, if applicable):
| For the Year Ended October 31, 2014 | For the Year Ended October 31, 2013 | |||||||
| Ordinary Income | $ | 5,510 | $ | 17,150 | ||||
| Long-Term Capital Gains ‡ | 1,978 | — | ||||||
‡ The Fund designates these distributions as long-term capital gain dividends pursuant to IRC Sec. 852(b)(3)(C).
As of October 31, 2014, the Fund’s components of distributable earnings (deficit) on a tax basis are as follows:
| Amount | ||||
| Undistributed Ordinary Income | $ | 19,628 | ||
| Undistributed Long-Term Capital Gain | 44,855 | |||
| Unrealized Appreciation* | 15,632 | |||
| Total Accumulated Earnings | $ | 80,115 | ||
| * | Differences between book-basis and tax-basis unrealized appreciation (depreciation) may be attributable to the losses deferred due to wash sale adjustments, foreign currency gains and losses, adjustments related to PFICs, REITs, RICs, certain derivatives and partnerships. |
Reclassification of Capital Accounts – The Fund may record reclassifications in its capital accounts. These reclassifications have no impact on the total net assets of the Fund. The reclassifications are a result of permanent differences between U.S. GAAP and tax accounting for such items as foreign currency, PFICs, expiration or utilization of capital loss carryforwards or net operating losses. Adjustments are made to reflect the impact these items have on current and future distributions to shareholders. Therefore, the source of the Fund’s distributions may be shown in the accompanying Consolidated Statement of Changes in Net Assets as from undistributed net investment income, from accumulated net realized gains on investments or from capital depending on the type of book and tax differences that exist. For the year ended October 31, 2014, the Fund recorded reclassifications to increase (decrease) the accounts listed below:
| Amount | ||||
| Undistributed Net Investment Income (Loss) | $ | 4,456 | ||
| Accumulated Net Realized Gain (Loss) | (3,188 | ) | ||
| Capital Stock and Paid-in-Capital | (1,268 | ) | ||
Capital Loss Carryforward – On December 22, 2010, the Regulated Investment Company Modernization Act of 2010 (the “Act”) was enacted, which made changes to the capital loss carryforward rules. The changes are effective for taxable years beginning after the date of enactment. Under the Act, funds are permitted to carry forward capital losses for an unlimited period. Additionally, capital loss carryforwards retain their character as either short-term or long-term capital losses rather than being considered all short-term as permitted under prior regulation.
The Fund had no capital loss carryforward for U.S. federal income tax purposes as of October 31, 2014.
Accounting for Uncertainty in Income Taxes – The Fund has adopted financial reporting rules that require the Fund to analyze all open tax years, as defined by the statute of limitations, for all major jurisdictions. Generally, tax authorities can examine all tax returns filed for the last three years. The Fund does not have an examination in progress.
The Fund has reviewed all open tax years and major jurisdictions and concluded that these financial reporting rules had no effect on the Fund’s financial position or results of operations. There is no tax liability resulting from unrecognized tax benefits relating to uncertain income tax positions taken or expected to be taken on the tax return for the fiscal year ended October 31, 2014. The Fund is also not aware of any tax positions for which it is reasonably possible that the total amounts of unrecognized tax benefits will significantly change in the next twelve months.
| 45 |
The Hartford Global All-Asset Fund
Notes to Consolidated Financial Statements – (continued)
October 31, 2014
(000’s Omitted)
Expenses:
Investment Management Agreement – Hartford Funds Management Company, LLC ("HFMC") serves as the Fund’s investment manager pursuant to an Investment Management Agreement with the Company. HFMC is an indirect wholly owned subsidiary of The Hartford Financial Services Group, Inc. ("The Hartford"). The investment manager has overall investment supervisory responsibility for the Fund. In addition, the investment manager provides administrative personnel, services, equipment, facilities and office space for proper operation of the Fund. HFMC has contracted with Wellington Management Company, LLP ("Wellington Management") under a sub-advisory agreement for the provision of day-to-day investment management services to the Fund in accordance with the Fund’s investment objective and policies. The Fund pays a fee to the investment manager, a portion of which may be used to compensate Wellington Management.
The schedule below reflects the rates of compensation paid to the investment manager for investment management services rendered as of October 31, 2014; the rates are accrued daily and paid monthly:
| Average Daily Net Assets | Annual Fee | |||
| On first $250 million | 0.950% | |||
| On next $250 million | 0.900% | |||
| On next $500 million | 0.800% | |||
| On next $1.5 billion | 0.730% | |||
| On next $2.5 billion | 0.700% | |||
| On next $5 billion | 0.660% | |||
| Over $10 billion | 0.655% | |||
The investment manager has contractually agreed to waive the management fee in an amount equal to the management fee paid to it by the Fund’s wholly owned Cayman Islands subsidiary fund. This waiver will remain in effect for a long as the Fund remains invested in that subsidiary fund.
Accounting Services Agreement – Pursuant to the Fund Accounting Agreement between HFMC and the Company, on behalf of the Fund, HFMC provides accounting services to the Fund and receives monthly compensation based on the Fund’s average daily net assets at the rates set forth below. The Fund’s accounting services fees are accrued daily and paid monthly.
| Average Daily Net Assets | Annual Fee | |||
| On first $5 billion | 0.025% | |||
| On next $5 billion | 0.020% | |||
| Over $10 billion | 0.015% | |||
Operating Expenses – Allocable expenses incurred by the Company are allocated to each Fund and allocated to classes within the Fund in proportion to the average daily net assets of the Fund and each class, except where allocation of certain expenses is more fairly made directly to the Fund or to specific classes within a Fund. As of October 31, 2014, HFMC contractually limited the total operating expenses of this Fund, exclusive of taxes, interest expense, brokerage commissions, acquired fund fees and expenses and extraordinary expenses, through February 28, 2015 as follows:
| Class A | Class C | Class I | Class R3 | Class R4 | Class R5 | Class Y | ||||||||||||||||||||
| 1.25% | 2.00% | 1.00% | 1.50% | 1.20% | 0.95% | 0.90% | ||||||||||||||||||||
Fees Paid Indirectly – The Fund has entered into agreements with State Street Global Markets, LLC and Russell Implementation Services, Inc. to partially recapture non-discounted trade commissions. Such rebates are used to pay a portion of the Fund's expenses. For the year ended October 31, 2014, this amount, if any, is included in the Consolidated Statement of Operations.
| 46 |
The Hartford Global All-Asset Fund
Notes to Consolidated Financial Statements – (continued)
October 31, 2014
(000’s Omitted)
The ratio of expenses to average net assets in the accompanying financial highlights excludes the reduction in expenses related to fees paid indirectly. The annualized expense ratio after waivers for the period listed below reflecting the reduction for fees paid indirectly is as follows:
| Year Ended October 31, 2014 | ||||
| Class A | 1.25 | % | ||
| Class C | 2.00 | |||
| Class I | 0.98 | |||
| Class R3 | 1.50 | |||
| Class R4 | 1.20 | |||
| Class R5 | 0.95 | |||
| Class Y | 0.90 | |||
Distribution and Service Plan for Class A, C, R3 and R4 Shares – Hartford Funds Distributors, LLC ("HFD"), an indirect wholly owned subsidiary of The Hartford, is the principal underwriter and distributor of the Fund. HFD is engaged in distribution activities, which include marketing and distribution of shares through broker/dealers, financing distribution costs and maintaining financial books and records. For the year ended October 31, 2014, HFD received front-end load sales charges of $383 and contingent deferred sales charges of $9 from the Fund.
The Fund has adopted a Distribution and Service Plan in accordance with Rule 12b-1 of the 1940 Act to compensate the distributor (HFD) for activities intended to result in the sale and distribution of Class A, C, R3 and R4 shares and for providing services for shareholders. The Rule 12b-1 plan applicable to Class A shares of the Fund provides for payment of a Rule 12b-1 fee of 0.25% of average daily net assets. Some or all of the fee may be used for shareholder servicing expenses with the remainder used for distribution expenses. Under the Class C Plan, the Fund pays the distributor 1.00% of the average daily net assets of Class C shares outstanding, 0.25% of which is intended as a fee for services provided to existing shareholders with the remainder used for distribution expenses. For Class C shares, some or the entire fee may be remitted to broker/dealers for distribution and/or shareholder account services. Class R3 shares have a distribution fee of 0.50% of average daily net assets and Class R4 shares have a distribution fee of 0.25% of average daily net assets. For Class R3 and R4 shares, some or the entire fee may be remitted to broker/dealers for distribution and/or shareholder account services. The Fund’s 12b-1 fees are accrued daily and paid monthly or at such other intervals as the Board of Directors may determine.
Other Related Party Transactions – Certain officers of the Fund are directors and/or officers of HFMC and/or The Hartford or its subsidiaries. For the year ended October 31, 2014, a portion of the Fund’s Chief Compliance Officer’s compensation was paid by all of the investment companies in the Hartford fund complex. The portion allocated to the Fund, as represented in other expenses on the Consolidated Statement of Operations, was in the amount of $1. Hartford Administrative Services Company (“HASCO”), an indirect wholly-owned subsidiary of The Hartford, provides transfer agent services to the Fund. HASCO has contractually agreed to reimburse any portion of the transfer agency fees over 0.30% of average daily net assets per fiscal year for each class. Any transfer agency fee reimbursement is determined before considering the contractual operating expense limitation. For providing such services, HASCO is compensated on a per account basis that varies by account type, except with respect to Class Y, for which it is compensated based on average daily net assets. The amount paid to HASCO and any related contractual reimbursement amounts, if applicable, can be found in the Consolidated Statement of Operations. These fees are accrued daily and paid monthly.
Administrative services fees are paid to HASCO for third-party recordkeeping services that are payable as a percentage of net assets in the amount of up to 0.20%, 0.15% and 0.10% for Classes R3, R4 and R5 shares, respectively. The total administrative services fees are shown on the Consolidated Statement of Operations. These fees are accrued daily and paid monthly.
| 47 |
The Hartford Global All-Asset Fund
Notes to Consolidated Financial Statements – (continued)
October 31, 2014
(000’s Omitted)
Affiliate Holdings:
As of October 31, 2014, affiliates of The Hartford had ownership of shares in the Fund as follows:
| Percentage of Class | Percentage of Fund | |||||||
| Class R5 | 100 | %* | 1 | % | ||||
| * | Percentage rounds to 100%. |
Investment Transactions:
For the year ended October 31, 2014, the cost of purchases and proceeds from sales of investment securities (excluding short-term investments) were as follows:
| Excluding U.S. Government Obligations | U.S. Government Obligations | Total | ||||||||||
| Cost of Purchases | $ | 863,908 | $ | 28,816 | $ | 892,724 | ||||||
| Sales Proceeds | 973,622 | 22,874 | 996,496 | |||||||||
Capital Share Transactions:
The following information is for the year ended October 31, 2014, and the year ended October 31, 2013:
| For the Year Ended October 31, 2014 | For the Year Ended October 31, 2013 | |||||||||||||||||||||||||||||||
| Shares Sold | Shares
Issued for Reinvested Dividends | Shares
Redeemed | Net
Increase (Decrease) of Shares | Shares Sold | Shares
Issued for Reinvested Dividends | Shares
Redeemed | Net
Increase (Decrease) of Shares | |||||||||||||||||||||||||
| Class A | ||||||||||||||||||||||||||||||||
| Shares | 1,317 | 277 | (6,724 | ) | (5,130 | ) | 2,631 | 616 | (7,820 | ) | (4,573 | ) | ||||||||||||||||||||
| Amount | $ | 16,632 | $ | 3,428 | $ | (84,911 | ) | $ | (64,851 | ) | $ | 30,515 | $ | 6,983 | $ | (90,880 | ) | $ | (53,382 | ) | ||||||||||||
| Class C | ||||||||||||||||||||||||||||||||
| Shares | 781 | 56 | (2,753 | ) | (1,916 | ) | 1,529 | 194 | (4,612 | ) | (2,889 | ) | ||||||||||||||||||||
| Amount | $ | 9,767 | $ | 684 | $ | (34,505 | ) | $ | (24,054 | ) | $ | 17,615 | $ | 2,190 | $ | (53,203 | ) | $ | (33,398 | ) | ||||||||||||
| Class I | ||||||||||||||||||||||||||||||||
| Shares | 2,275 | 128 | (4,058 | ) | (1,655 | ) | 3,584 | 293 | (8,907 | ) | (5,030 | ) | ||||||||||||||||||||
| Amount | $ | 29,063 | $ | 1,594 | $ | (51,457 | ) | $ | (20,800 | ) | $ | 41,632 | $ | 3,330 | $ | (103,379 | ) | $ | (58,417 | ) | ||||||||||||
| Class R3 | ||||||||||||||||||||||||||||||||
| Shares | 57 | 3 | (80 | ) | (20 | ) | 44 | 6 | (117 | ) | (67 | ) | ||||||||||||||||||||
| Amount | $ | 713 | $ | 40 | $ | (1,014 | ) | $ | (261 | ) | $ | 505 | $ | 70 | $ | (1,341 | ) | $ | (766 | ) | ||||||||||||
| Class R4 | ||||||||||||||||||||||||||||||||
| Shares | 21 | 1 | (69 | ) | (47 | ) | 169 | 1 | (138 | ) | 32 | |||||||||||||||||||||
| Amount | $ | 278 | $ | 10 | $ | (874 | ) | $ | (586 | ) | $ | 1,968 | $ | 12 | $ | (1,633 | ) | $ | 347 | |||||||||||||
| Class R5 | ||||||||||||||||||||||||||||||||
| Shares | — | 4 | — | 4 | 2 | 6 | (16 | ) | (8 | ) | ||||||||||||||||||||||
| Amount | $ | 4 | $ | 44 | $ | (4 | ) | $ | 44 | $ | 19 | $ | 71 | $ | (186 | ) | $ | (96 | ) | |||||||||||||
| Class Y | ||||||||||||||||||||||||||||||||
| Shares | 148 | 33 | (1,612 | ) | (1,431 | ) | 291 | 128 | (4,017 | ) | (3,598 | ) | ||||||||||||||||||||
| Amount | $ | 1,850 | $ | 405 | $ | (20,223 | ) | $ | (17,968 | ) | $ | 3,429 | $ | 1,447 | $ | (45,973 | ) | $ | (41,097 | ) | ||||||||||||
| Total | ||||||||||||||||||||||||||||||||
| Shares | 4,599 | 502 | (15,296 | ) | (10,195 | ) | 8,250 | 1,244 | (25,627 | ) | (16,133 | ) | ||||||||||||||||||||
| Amount | $ | 58,307 | $ | 6,205 | $ | (192,988 | ) | $ | (128,476 | ) | $ | 95,683 | $ | 14,103 | $ | (296,595 | ) | $ | (186,809 | ) | ||||||||||||
| 48 |
The Hartford Global All-Asset Fund
Notes to Consolidated Financial Statements – (continued)
October 31, 2014
(000’s Omitted)
Line of Credit:
The Fund is one of several Hartford Funds that participate in a $500 million committed revolving line of credit facility. The facility is to be used for temporary or emergency purposes. Under the arrangement, the funds are required to own securities having a market value in excess of 300% of the total bank borrowings. The interest rate on borrowings varies depending on the nature of the loan. The facility also requires a fee to be paid based on the amount of the commitment. This commitment fee is allocated to all the funds participating in the line of credit based on the average net assets of the funds. During the year ended October 31, 2014, the Fund did not have any borrowings under this facility.
Pending Legal Proceedings:
On February 25, 2011, Jennifer L. Kasilag, Louis Mellinger, Judith M. Menendez, Jacqueline M. Robinson, and Linda A. Russell filed a derivative lawsuit against Hartford Investment Financial Services, LLC (“HIFSCO”) (now known as HFD) on behalf of six Hartford retail mutual funds in the United States District Court for the District of New Jersey, alleging that HIFSCO received excessive advisory and distribution fees in violation of its statutory fiduciary duty under Section 36(b) of the 1940 Act when serving as investment manager and principal underwriter, respectively, to the Hartford retail mutual funds. Although this action was purportedly filed on behalf of certain of the Hartford Funds, none of the Hartford Funds is itself a defendant to the suit. HIFSCO moved to dismiss and, in September 2011, the motion was granted in part and denied in part, with leave to amend the complaint. In November 2011, plaintiffs filed an amended complaint on behalf of certain Hartford retail mutual funds, The Hartford Global Health Fund (now known as The Hartford Healthcare Fund), The Hartford Conservative Allocation Fund, The Hartford Growth Opportunities Fund, The Hartford Inflation Plus Fund, The Hartford Advisers Fund (now known as The Hartford Balanced Fund), and The Hartford Capital Appreciation Fund. Plaintiffs seek to rescind the investment management agreements and distribution plans between HIFSCO and these funds and to recover the total fees charged thereunder or, in the alternative, to recover any improper compensation HIFSCO received, in addition to lost earnings. HIFSCO filed a partial motion to dismiss the amended complaint and, in December 2012, the court dismissed without prejudice the claims regarding distribution fees and denied the motion with respect to the advisory fees claims. HIFSCO disputes the allegations and intends to defend vigorously.
In March 2014, the plaintiffs filed a new complaint that added as new plaintiffs The Hartford Floating Rate Fund and The Hartford Small Company Fund and named as a defendant HFMC, which assumed the role as investment manager to the funds as of January 2013. HFMC and HIFSCO dispute the allegations and intend to defend vigorously.
No accrual for litigation relating to this matter has been recorded in the financial statements of the Fund because the Fund is not party to the suit.
Indemnifications:
Under the Company's organizational documents, the Company shall indemnify its officers and directors to the full extent required or permitted under Maryland General Corporation Law and the federal securities laws. In addition, the Company, on behalf of the Fund, may enter into contracts that contain a variety of indemnifications. The Company's maximum exposure under these arrangements is unknown. However, as of the date of these financial statements, the Company has not had prior claims or losses pursuant to these contracts and expects the risk of loss to be remote.
Subsequent Event:
Effective December 1, 2014, pursuant to a sub-transfer agency agreement between HASCO and Boston Financial Data Services, Inc. (“BFDS”), HASCO has delegated certain transfer agent, dividend disbursing agent and shareholder servicing agent functions to BFDS. The costs and expenses of such delegation are borne by HASCO, not by the Fund.
| 49 |
The Hartford Global All-Asset Fund
Consolidated Financial Highlights
| - Selected Per-Share Data - (A) | - Ratios and Supplemental Data - | |||||||||||||||||||||||||||||||||||||||||||||||||||
| Class | Net
Asset Value at Beginning of Period | Net
Investment Income (Loss) | Net
Realized and Unrealized Gain (Loss) on Invest- ments | Total
from Investment Operations | Dividends from Net Investment Income | Distribu- tions from Realized Capital Gains | Total Dividends and Distributions | Net
Asset Value at End of Period | Total Return(B) | Net Assets at End of Period (000's) | Ratio
of Expenses to Average Net Assets Before Adjust- ments(C) | Ratio
of Expenses to Average Net Assets After Adjust- ments(C) | Ratio
of Net Investment Income (Loss) to Average Net Assets | |||||||||||||||||||||||||||||||||||||||
| For the Year Ended October 31, 2014 | ||||||||||||||||||||||||||||||||||||||||||||||||||||
| A | $ | 12.34 | $ | 0.11 | $ | 0.40 | $ | 0.51 | $ | (0.13 | ) | $ | (0.04 | ) | $ | (0.17 | ) | $ | 12.68 | 4.18 | % | $ | 206,595 | 1.40 | % | 1.25 | % | 0.85 | % | |||||||||||||||||||||||
| C | 12.23 | 0.01 | 0.39 | 0.40 | (0.03 | ) | (0.04 | ) | (0.07 | ) | 12.56 | 3.30 | 130,260 | 2.13 | 2.00 | 0.10 | ||||||||||||||||||||||||||||||||||||
| I | 12.38 | 0.14 | 0.40 | 0.54 | (0.16 | ) | (0.04 | ) | (0.20 | ) | 12.72 | 4.43 | 117,499 | 1.10 | 0.98 | 1.11 | ||||||||||||||||||||||||||||||||||||
| R3 | 12.34 | 0.08 | 0.39 | 0.47 | (0.10 | ) | (0.04 | ) | (0.14 | ) | 12.67 | 3.86 | 3,340 | 1.73 | 1.50 | 0.61 | ||||||||||||||||||||||||||||||||||||
| R4 | 12.47 | 0.11 | 0.41 | 0.52 | (0.15 | ) | (0.04 | ) | (0.19 | ) | 12.80 | 4.18 | 1,363 | 1.44 | 1.20 | 0.90 | ||||||||||||||||||||||||||||||||||||
| R5 | 12.38 | 0.14 | 0.41 | 0.55 | (0.17 | ) | (0.04 | ) | (0.21 | ) | 12.72 | 4.49 | 2,730 | 1.12 | 0.95 | 1.14 | ||||||||||||||||||||||||||||||||||||
| Y | 12.38 | 0.15 | 0.41 | 0.56 | (0.18 | ) | (0.04 | ) | (0.22 | ) | 12.72 | 4.54 | 31,145 | 1.02 | 0.90 | 1.18 | ||||||||||||||||||||||||||||||||||||
| For the Year Ended October 31, 2013 | ||||||||||||||||||||||||||||||||||||||||||||||||||||
| A | $ | 11.30 | $ | 0.08 | $ | 1.25 | $ | 1.33 | $ | (0.29 | ) | $ | – | $ | (0.29 | ) | $ | 12.34 | 12.02 | % | $ | 264,437 | 1.37 | % | 1.22 | % | 0.72 | % | ||||||||||||||||||||||||
| C | 11.18 | – | 1.24 | 1.24 | (0.19 | ) | – | (0.19 | ) | 12.23 | 11.26 | 150,191 | 2.11 | 1.97 | (0.03 | ) | ||||||||||||||||||||||||||||||||||||
| I | 11.33 | 0.12 | 1.25 | 1.37 | (0.32 | ) | – | (0.32 | ) | 12.38 | 12.37 | 134,853 | 1.08 | 0.96 | 0.99 | |||||||||||||||||||||||||||||||||||||
| R3 | 11.29 | 0.05 | 1.26 | 1.31 | (0.26 | ) | – | (0.26 | ) | 12.34 | 11.78 | 3,504 | 1.70 | 1.47 | 0.45 | |||||||||||||||||||||||||||||||||||||
| R4 | 11.39 | 0.07 | 1.29 | 1.36 | (0.28 | ) | – | (0.28 | ) | 12.47 | 12.16 | 1,906 | 1.42 | 1.18 | 0.57 | |||||||||||||||||||||||||||||||||||||
| R5 | 11.34 | 0.12 | 1.25 | 1.37 | (0.33 | ) | – | (0.33 | ) | 12.38 | 12.30 | 2,615 | 1.09 | 0.93 | 0.99 | |||||||||||||||||||||||||||||||||||||
| Y | 11.34 | 0.12 | 1.25 | 1.37 | (0.33 | ) | – | (0.33 | ) | 12.38 | 12.36 | 48,035 | 0.99 | 0.88 | 1.04 | |||||||||||||||||||||||||||||||||||||
| For the Year Ended October 31, 2012 | ||||||||||||||||||||||||||||||||||||||||||||||||||||
| A | $ | 10.63 | $ | 0.06 | $ | 0.67 | $ | 0.73 | $ | (0.06 | ) | $ | – | $ | (0.06 | ) | $ | 11.30 | 6.97 | % | $ | 293,773 | 1.38 | % | 1.09 | % | 0.58 | % | ||||||||||||||||||||||||
| C | 10.53 | (0.02 | ) | 0.67 | 0.65 | – | – | – | 11.18 | 6.17 | 169,673 | 2.12 | 1.84 | (0.16 | ) | |||||||||||||||||||||||||||||||||||||
| I | 10.66 | 0.09 | 0.68 | 0.77 | (0.10 | ) | – | (0.10 | ) | 11.33 | 7.28 | 180,463 | 1.09 | 0.83 | 0.84 | |||||||||||||||||||||||||||||||||||||
| R3 | 10.61 | 0.04 | 0.67 | 0.71 | (0.03 | ) | – | (0.03 | ) | 11.29 | 6.75 | 3,961 | 1.74 | 1.36 | 0.33 | |||||||||||||||||||||||||||||||||||||
| R4 | 10.64 | 0.07 | 0.68 | 0.75 | – | – | – | 11.39 | 7.05 | 1,378 | 1.45 | 1.06 | 0.62 | |||||||||||||||||||||||||||||||||||||||
| R5 | 10.67 | 0.09 | 0.68 | 0.77 | (0.10 | ) | – | (0.10 | ) | 11.34 | 7.31 | 2,485 | 1.11 | 0.83 | 0.85 | |||||||||||||||||||||||||||||||||||||
| Y | 10.67 | 0.10 | 0.68 | 0.78 | (0.11 | ) | – | (0.11 | ) | 11.34 | 7.38 | 84,780 | 1.01 | 0.77 | 0.91 | |||||||||||||||||||||||||||||||||||||
| For the Year Ended October 31, 2011 | ||||||||||||||||||||||||||||||||||||||||||||||||||||
| A | $ | 11.04 | $ | 0.03 | $ | (0.32 | ) | $ | (0.29 | ) | $ | (0.03 | ) | $ | (0.09 | ) | $ | (0.12 | ) | $ | 10.63 | (2.67 | )% | $ | 373,186 | 1.45 | % | 1.02 | % | 0.31 | % | |||||||||||||||||||||
| C | 11.00 | (0.05 | ) | (0.32 | ) | (0.37 | ) | (0.01 | ) | (0.09 | ) | (0.10 | ) | 10.53 | (3.36 | ) | 216,578 | 2.19 | 1.75 | (0.43 | ) | |||||||||||||||||||||||||||||||
| I | 11.05 | 0.06 | (0.32 | ) | (0.26 | ) | (0.04 | ) | (0.09 | ) | (0.13 | ) | 10.66 | (2.44 | ) | 263,596 | 1.17 | 0.73 | 0.57 | |||||||||||||||||||||||||||||||||
| R3 | 11.02 | 0.01 | (0.33 | ) | (0.32 | ) | – | (0.09 | ) | (0.09 | ) | 10.61 | (2.93 | ) | 3,140 | 1.79 | 1.30 | 0.09 | ||||||||||||||||||||||||||||||||||
| R4 | 11.04 | 0.06 | (0.36 | ) | (0.30 | ) | (0.01 | ) | (0.09 | ) | (0.10 | ) | 10.64 | (2.71 | ) | 1,205 | 1.49 | 1.00 | 0.50 | |||||||||||||||||||||||||||||||||
| R5 | 11.05 | 0.08 | (0.34 | ) | (0.26 | ) | (0.03 | ) | (0.09 | ) | (0.12 | ) | 10.67 | (2.36 | ) | 2,335 | 1.19 | 0.70 | 0.74 | |||||||||||||||||||||||||||||||||
| Y | 11.05 | 0.08 | (0.33 | ) | (0.25 | ) | (0.04 | ) | (0.09 | ) | (0.13 | ) | 10.67 | (2.34 | ) | 12,219 | 1.08 | 0.65 | 0.76 | |||||||||||||||||||||||||||||||||
See Portfolio Turnover information on the next page.
| 50 |
The Hartford Global All-Asset Fund
Consolidated Financial Highlights – (continued)
| - Selected Per-Share Data - (A) | - Ratios and Supplemental Data - | |||||||||||||||||||||||||||||||||||||||||||||||||||
| Class | Net
Asset Value at Beginning of Period | Net
Investment Income (Loss) | Net
Realized and Unrealized Gain (Loss) on Invest- ments | Total
from Investment Operations | Dividends from Net Investment Income | Distribu- tions from Realized Capital Gains | Total Dividends and Distributions | Net
Asset Value at End of Period | Total Return(B) | Net Assets at End of Period (000's) | Ratio
of Expenses to Average Net Assets Before Adjust- ments(C) | Ratio
of Expenses to Average Net Assets After Adjust- ments(C) | Ratio
of Net Investment Income (Loss) to Average Net Assets | |||||||||||||||||||||||||||||||||||||||
| From May 28, 2010 (commencement of operations), through October 31, 2010 | ||||||||||||||||||||||||||||||||||||||||||||||||||||
| A(D) | $ | 10.00 | $ | (0.01 | ) | $ | 1.05 | $ | 1.04 | $ | – | $ | – | $ | – | $ | 11.04 | 10.40 | %(E) | $ | 92,704 | 1.51 | %(F) | 0.95 | %(F) | (0.16 | )%(F) | |||||||||||||||||||||||||
| C(D) | 10.00 | (0.04 | ) | 1.04 | 1.00 | – | – | – | 11.00 | 10.00 | (E) | 46,828 | 2.26 | (F) | 1.70 | (F) | (0.92 | )(F) | ||||||||||||||||||||||||||||||||||
| I(D) | 10.00 | – | 1.05 | 1.05 | – | – | – | 11.05 | 10.50 | (E) | 66,511 | 1.24 | (F) | 0.68 | (F) | (0.01 | )(F) | |||||||||||||||||||||||||||||||||||
| R3(D) | 10.00 | (0.01 | ) | 1.03 | 1.02 | – | – | – | 11.02 | 10.20 | (E) | 2,216 | 1.91 | (F) | 1.31 | (F) | (0.18 | )(F) | ||||||||||||||||||||||||||||||||||
| R4(D) | 10.00 | 0.01 | 1.03 | 1.04 | – | – | – | 11.04 | 10.40 | (E) | 2,208 | 1.61 | (F) | 1.01 | (F) | 0.12 | (F) | |||||||||||||||||||||||||||||||||||
| R5(D) | 10.00 | 0.02 | 1.03 | 1.05 | – | – | – | 11.05 | 10.50 | (E) | 2,210 | 1.31 | (F) | 0.71 | (F) | 0.42 | (F) | |||||||||||||||||||||||||||||||||||
| Y(D) | 10.00 | 0.01 | 1.04 | 1.05 | – | – | – | 11.05 | 10.50 | (E) | 9,948 | 1.22 | (F) | 0.66 | (F) | 0.47 | (F) | |||||||||||||||||||||||||||||||||||
| (A) | Information presented relates to a share outstanding throughout the indicated period. Net investment income (loss) per share amounts are calculated based on average shares outstanding unless otherwise noted. |
| (B) | Assumes initial investment at net asset value at the beginning of each period, reinvestment of all distributions, the complete redemption of the investment at net asset value at the end of each period and no sales charge. Total return would be reduced if sales charges were taken into account. |
| (C) | Adjustments include waivers and reimbursements, if applicable. Ratios do not include fees paid indirectly (see Expenses in the accompanying Notes to Consolidated Financial Statements). |
| (D) | Commenced operations on May 28, 2010. |
| (E) | Not annualized. |
| (F) | Annualized. |
| Portfolio Turnover Rate for All Share Classes | ||||
| For the Year Ended October 31, 2014 | 75 | % | ||
| For the Year Ended October 31, 2013 | 47 | |||
| For the Year Ended October 31, 2012 | 94 | |||
| For the Year Ended October 31, 2011 | 206 | |||
| From May 28, 2010 (commencement of operations) through October 31, 2010 | 37 | (A) | ||
(A) Not annualized.
| 51 |
Report of Independent Registered Public Accounting Firm
The Board of Directors and Shareholders of
The Hartford Mutual Funds, Inc.
We have audited the accompanying consolidated statement of assets and liabilities, including the consolidated schedule of investments, of The Hartford Global All-Asset Fund (one of the portfolios constituting The Hartford Mutual Funds, Inc. (the Funds)) as of October 31, 2014, and the related consolidated statement of operations for the year then ended, the consolidated statements of changes in net assets for each of the two years in the period then ended, and the consolidated financial highlights for the periods indicated therein. These financial statements and financial highlights are the responsibility of the Funds’ management. Our responsibility is to express an opinion on these financial statements and financial highlights based on our audits.
We conducted our audits in accordance with the standards of the Public Company Accounting Oversight Board (United States). Those standards require that we plan and perform the audit to obtain reasonable assurance about whether the financial statements and financial highlights are free of material misstatement. We were not engaged to perform an audit of the Funds’ internal control over financial reporting. Our audits included consideration of internal control over financial reporting as a basis for designing audit procedures that are appropriate in the circumstances, but not for the purpose of expressing an opinion on the effectiveness of the Funds’ internal control over financial reporting. Accordingly, we express no such opinion. An audit also includes examining, on a test basis, evidence supporting the amounts and disclosures in the financial statements and financial highlights, assessing the accounting principles used and significant estimates made by management, and evaluating the overall financial statement presentation. Our procedures included confirmation of securities owned as of October 31, 2014, by correspondence with the custodian and brokers or by other appropriate auditing procedures where replies from brokers were not received. We believe that our audits provide a reasonable basis for our opinion.
In our opinion, the consolidated financial statements and consolidated financial highlights referred to above present fairly, in all material respects, the consolidated financial position of The Hartford Global All-Asset Fund of The Hartford Mutual Funds, Inc. at October 31, 2014, the results of its consolidated operations for the year then ended, the consolidated changes in its net assets for each of the two years in the period then ended, and the consolidated financial highlights for the periods indicated therein, in conformity with U.S. generally accepted accounting principles.
| |
| Minneapolis, Minnesota December 18, 2014 |
| 52 |
The Hartford Global All-Asset Fund
Directors and Officers (Unaudited)
The Board of Directors of the Company (the "Directors") appoints officers who are responsible for the day-to-day operations of the Fund and who execute policies formulated by the Directors. Each Director serves until his or her death, resignation, or retirement or until the next annual meeting of shareholders is held or until his or her successor is elected and qualifies.
Directors and officers who are employed by or who have a financial interest in The Hartford Financial Services Group, Inc. ("The Hartford") are considered “interested” persons of the Fund pursuant to the 1940 Act. Each officer and two of the Company's Directors, as noted in the chart below, are “interested” persons of the Fund. Each Director serves as a director for The Hartford Mutual Funds, Inc., The Hartford Mutual Funds II, Inc., Hartford Series Fund, Inc., and Hartford HLS Series Fund II, Inc., and as a trustee for The Hartford Alternative Strategies Fund, which, as of October 31, 2014, collectively consist of 66 funds. Correspondence may be sent to Directors and officers c/o Hartford Funds, 5 Radnor Corporate Center, Suite 300, 100 Matsonford Road, Radnor, Pennsylvania 19087, except that correspondence to Mr. Annoni, Mr. Dressen and Ms. Quade may be sent to 500 Bielenberg Drive, Suite 500, Woodbury, Minnesota 55125.
The table below sets forth, for each Director and officer, his or her name, year of birth, current position with the Company and date first elected or appointed to The Hartford Mutual Funds, Inc. ("MF") and The Hartford Mutual Funds II, Inc. ("MF2"), principal occupation, and, for Directors, other directorships held. The Fund’s Statement of Additional Information contains further information on the Directors and is available free of charge by calling 1-888-843-7824 or writing to: Hartford Funds, P.O. Box 55022, Boston, MA 02205-5022.
Information on the aggregate remuneration paid to the directors of the Company can be found in the Consolidated Statement of Operations herein. The Fund pays to The Hartford a portion of the Chief Compliance Officer’s compensation, but does not pay salaries or compensation to any of its other officers or Directors who are employed by The Hartford.
Non-Interested Directors
Hilary E. Ackermann (1956) Director since September 23, 2014
Ms. Ackermann served as Chief Risk Officer at Goldman Sachs Bank USA from October 2008 to November 2011 and serves as a Director of Dynegy, Inc., an independent power company, from October 2012 to present.
Lynn S. Birdsong (1946) Director since 2003, Chairman of the Investment Committee since 2014
Mr. Birdsong is a private investor. Mr. Birdsong currently serves as a Director of the Sovereign High Yield Investment Company (April 2010 to current). Mr. Birdsong currently serves as an Independent Director of Nomura Partners Funds, Inc. (formerly, The Japan Fund) (April 2003 to current). From 2003 to March 2005, Mr. Birdsong was an Independent Director of the Atlantic Whitehall Funds. From 1979 to 2002, Mr. Birdsong was a Managing Director of Zurich Scudder Investments, an investment management firm. During his employment with Scudder, Mr. Birdsong was an Interested Director of The Japan Fund. From January 1981 through December 2013, Mr. Birdsong was a partner in Birdsong Company, an advertising specialty firm.
Robert M. Gavin, Jr. (1940) Director since 2002 (MF) and 1986 (MF2), Chairman of the Board for each since 2004
Dr. Gavin is an educational consultant. Prior to September 1, 2001, he was President of Cranbrook Education Community and prior to July 1996, he was President of Macalester College, St. Paul, Minnesota.
Duane E. Hill (1945) Director since 2001 (MF) and 2002 (MF2), Chairman of the Nominating Committee since 2003
Mr. Hill is a Partner of TSG Ventures L.P., a private equity investment company. Mr. Hill is a former partner of TSG Capital Group, a private equity investment firm that served as sponsor and lead investor in leveraged buyouts of middle market companies.
Sandra S. Jaffee (1941) Director since 2005
Ms. Jaffee is the founder and Chief Executive Officer of a private company, Homeworks Concierge, LLC, which provides residential property management services in Westchester County, New York (January 2012 to present). Ms. Jaffee served as Chairman (2008 to 2009) and Chief Executive Officer of Fortent (formerly Searchspace Group), a leading provider of compliance/regulatory technology to financial institutions from August 2005 to August 2009. From August 2004 to August 2005, Ms. Jaffee served as an Entrepreneur in Residence with Warburg Pincus, a private equity firm. Prior to joining Warburg Pincus, Ms. Jaffee served as Executive Vice President at Citigroup, from September 1995 to July 2004, where she was President and Chief Executive Officer of Citibank’s Global Securities Services (1995 to 2003). Ms. Jaffee currently serves as a member of the Board of Directors of Broadridge Financial Solutions as well as a Trustee of Muhlenberg College.
| 53 |
The Hartford Global All-Asset Fund
Directors and Officers (Unaudited) – (continued)
William P. Johnston (1944) Director since 2005, Chairman of the Compliance Committee since 2005
In June 2006, Mr. Johnston was appointed as Senior Advisor to The Carlyle Group, a global private equity and other alternative asset investment firm and currently serves as an Operating Executive. In July 2006, Mr. Johnston was elected to the Board of Directors of MultiPlan, Inc. and served as a Director (July 2006 to August 2010). In August 2007, Mr. Johnston was elected to the Board of Directors of LifeCare Holdings, Inc. and served as a Director (August 2007 to June 2013). In February 2008, Mr. Johnston was elected to the Board of Directors of HCR-ManorCare, Inc. In May 2006, Mr. Johnston was elected to the Supervisory Board of Fresenius Medical Care AG & Co. KGaA, after its acquisition of Renal Care Group, Inc. in March 2006. Mr. Johnston joined Renal Care Group in November 2002 as a member of the Board of Directors and served as Chairman of the Board from March 2003 through March 2006. From 2002 through 2013, Mr. Johnston served as a Board member of the Georgia O’Keefe Museum. From September 1987 to December 2002, Mr. Johnston was with Equitable Securities Corporation (and its successors, SunTrust Equitable Securities and SunTrust Robinson Humphrey) serving in various investment banking and managerial positions, including Managing Director and Head of Investment Banking, Chief Executive Officer and Vice Chairman.
Phillip O. Peterson (1944) Director since 2002 (MF) and 2000 (MF2), Chairman of the Audit Committee since 2002
Mr. Peterson is a mutual fund industry consultant. He was a partner of KPMG LLP (an accounting firm) until July 1999. Mr. Peterson joined William Blair Funds in February 2007 as a member of the Board of Trustees. From February 2012 to February 2014, Mr. Peterson served as a Trustee of Symetra Variable Mutual Funds. From January 2004 to April 2005, Mr. Peterson served as Independent President of the Strong Mutual Funds.
Lemma W. Senbet (1946) Director since 2005
Dr. Senbet is the William E. Mayer Chair Professor of Finance and Founding Director, Center for Financial Policy, at the University of Maryland, Robert H. Smith School of Business. He was chair of the Finance Department of the University of Maryland, Robert H. Smith School of Business from 1998 to 2006. Since June 2013, he has been on leave from the University to serve as Executive Director of African Economic Research Consortium which focuses on economic policy research and training. Previously, he was a chaired professor of finance at the University of Wisconsin-Madison. Also, he was a Director of the Fortis Funds from March 2000 to July 2002. Dr. Senbet served as Director of the American Finance Association and President of the Western Finance Association. In 2006, Dr. Senbet was inducted Fellow of Financial Management Association International for his career-long distinguished scholarship and professional service.
Interested Directors and Officers
James E. Davey (1964) Director since 2012, President and Chief Executive Officer since 2010
Mr. Davey serves as Executive Vice President of Hartford Life Insurance Company (“HLIC”) and The Hartford. Additionally, Mr. Davey serves as Chairman of the Board, Manager and Senior Managing Director of Hartford Funds Distributors, LLC (“HFD”). He also currently serves as Director, Chairman of the Board, President and Senior Managing Director of Hartford Administrative Services Company (“HASCO”). Mr. Davey also serves as Manager, Chairman of the Board and Senior Managing Director for Hartford Funds Management Company, LLC (“HFMC”) and Director, Chairman of the Board and Senior Managing Director for Hartford Funds Management Group, Inc. ("HFMG"). Mr. Davey has served in various positions within The Hartford and its subsidiaries in connection with the operation of the Hartford Funds. Mr. Davey joined The Hartford in 2002.
Lowndes A. Smith* (1939) Director since 1996 (MF) and 2002 (MF2)
Mr. Smith served as Vice Chairman of The Hartford from February 1997 to January 2002, as President and Chief Executive Officer of Hartford Life, Inc. from February 1997 to January 2002, and as President and Chief Operating Officer of The Hartford Life Insurance Companies from January 1989 to January 2002. Mr. Smith serves as a Director of White Mountains Insurance Group Ltd. (October 2003 to current); One Beacon Insurance (October 2006 to current); Symetra Financial (August 2007 to current) and is a Managing Director of Whittington Gray Associates (January 2007 to current).
* Mr. Smith resigned as a Director of MF, MF2, Hartford Series Fund, Inc. and Hartford HLS Series Fund II, Inc. and as a Trustee of The Hartford Alternative Strategies Fund effective September 17, 2014.
Other Officers
Mark A. Annoni (1964) Vice President, Controller and Treasurer since 2012
Mr. Annoni currently serves as the Assistant Vice President of HLIC (February 2004 to present) and Senior Vice President of HFMG (December 2013 to present). Mr. Annoni has served in various positions within The Hartford and its subsidiaries in connection with the operation of the Hartford Funds. Mr. Annoni joined The Hartford in 2001.
| 54 |
The Hartford Global All-Asset Fund
Directors and Officers (Unaudited) – (continued)
Michael R. Dressen (1963) AML Compliance Officer since 2011
Mr. Dressen currently serves as Assistant Vice President of HLIC. He also serves as Chief Compliance Officer and AML Compliance Officer of HASCO and as AML Officer of HFD. Mr. Dressen has served in various positions within The Hartford and its subsidiaries in connection with the operation of the Hartford Funds.
Edward P. Macdonald (1967) Vice President, Secretary and Chief Legal Officer since 2005
Mr. Macdonald currently serves as Assistant Secretary, Executive Vice President and Deputy General Counsel of HFD, HASCO, HFMC and HFMG. He also serves as Vice President of HLIC. Mr. Macdonald has served in various positions within The Hartford and its subsidiaries in connection with the operation of the Hartford Funds. Mr. Macdonald joined The Hartford in 2005.
Joseph G. Melcher (1973) Vice President and Chief Compliance Officer since 2013
Mr. Melcher currently serves as Executive Vice President of HFD, HFMG and HASCO. Mr. Melcher also currently serves as Executive Vice President and Chief Compliance Officer of HFMC. Mr. Melcher has served in various positions within The Hartford and its subsidiaries in connection with the operation of the Hartford Funds since joining The Hartford in 2012. Prior to joining The Hartford, Mr. Melcher worked at Touchstone Investments, a member of the Western & Southern Financial Group, where he held the position of Vice President and Chief Compliance Officer from 2010 through 2012 and Assistant Vice President, Compliance from 2005 to 2010.
Vernon J. Meyer (1964) Vice President since 2006
Mr. Meyer currently serves as Senior Vice President of HLIC. He also currently serves as Managing Director and Chief Investment Officer of HFMC and Managing Director of HFMG. Mr. Meyer has served in various positions within The Hartford and its subsidiaries in connection with the operation of the Hartford Funds. Mr. Meyer joined The Hartford in 2004.
Laura S. Quade (1969) Vice President since 2012
Ms. Quade currently serves as Vice President of HASCO, HFD and HFMG. She is the Head of Operations of HASCO and formerly served as Director, Enterprise Operations of HLIC. Ms. Quade has served in various positions within The Hartford and its subsidiaries in connection with the operation of the Hartford Funds. Ms. Quade joined The Hartford in 2001.
Martin A. Swanson** (1962) Vice President since 2010
Mr. Swanson currently serves as Vice President of HLIC. Mr. Swanson also serves as Managing Director, Chief Marketing Officer and Principal of HFD and Managing Director of HFMG. Mr. Swanson has served in various positions within The Hartford and its subsidiaries in connection with the operation of the Hartford Funds.
** Mr. Swanson resigned as an officer effective November 6, 2014.
HOW TO OBTAIN A COPY OF THE FUND’S PROXY VOTING POLICIES AND VOTING RECORDS (UNAUDITED)
A description of the policies and procedures that the Fund uses to determine how to vote proxies relating to portfolio securities and information about how the Fund voted proxies relating to portfolio securities during the most recent twelve-month period ended June 30 are available (1) without charge, upon request, by calling 888-843-7824 and (2) on the SEC’s website at http://www.sec.gov.
QUARTERLY PORTFOLIO HOLDINGS INFORMATION (UNAUDITED)
The Fund files a complete schedule of portfolio holdings with the SEC for the first and third quarters of each fiscal year on Form N-Q. The Fund’s Forms N-Q are available (1) without charge, upon request, by calling 888-843-7824 and (2) on the SEC’s website at http://www.sec.gov. The Form N-Q may be reviewed and copied at the SEC’s Public Reference Room in Washington, DC. Information on the operation of the Public Reference Room may be obtained by calling 1-800-SEC-0330.
| 55 |
The Hartford Global All-Asset Fund
Federal Tax Information (Unaudited)
For the fiscal year ended October 31, 2014, there is no further federal tax information required for this Fund.
| 56 |
The Hartford Global All-Asset Fund
Expense Example (Unaudited)
Your Fund's Expenses
As a shareholder of the Fund, you incur two types of costs: (1) transaction costs, including sales charges (loads) on purchase payments, if any, and contingent deferred sales charges (CDSC), if any, and (2) ongoing costs, including investment management fees, distribution and/or service (12b-1) fees, if any, and other fund expenses. This example is intended to help you understand your ongoing costs (in dollars) of investing in the Fund and to compare these costs with the ongoing costs of investing in other mutual funds. The example is based on an investment of $1,000 invested at the beginning of the period and held for the entire period of April 30, 2014 through October 31, 2014.
Actual Expenses
The first set of columns of the table below provides information about actual account values and actual expenses. You may use the information in this column, together with the amount you invested, to estimate the expenses that you paid over the period. Simply divide your account value by $1,000 (for example, an $8,600 account value divided by $1,000 = 8.6), then multiply the result by the number in the line under the heading entitled “Expenses Paid During Period” to estimate the expenses you paid on your account during this period.
Hypothetical Example for Comparison Purposes
The second set of columns of the table below provides information about hypothetical account values and hypothetical expenses based on the Fund's actual expense ratio and an assumed rate of return of 5% per year before expenses, which is not the Fund's actual return. The hypothetical account values and expenses may not be used to estimate the actual ending account balance or expenses you paid for the period. You may use this information to compare the ongoing costs of investing in the Fund and other funds. To do so, compare this 5% hypothetical example with the 5% hypothetical examples that appear in the shareholder reports of the other funds.
Please note that the expenses shown in the table are meant to highlight your ongoing costs only and do not reflect any transactional costs, such as sales charges (loads) and CDSC. Therefore, the second set of columns of the table is useful in comparing ongoing costs only, and will not help you determine the relative total costs of owning different funds. In addition, if these transactional costs were included, your costs would be higher. Expenses are equal to the Fund's annualized expense ratios multiplied by average account value over the period, multiplied by 184/365 (to reflect the one-half year period).
| Actual return | Hypothetical (5% return before expenses) | |||||||||||||||||||||||||||||||
| Beginning
Account Value April 30, 2014 | Ending
Account Value October 31, 2014 | Expenses
paid during the period April 30, 2014 through October 31, 2014 | Beginning
Account Value April 30, 2014 | Ending
Account Value October 31, 2014 | Expenses
paid during the period April 30, 2014 through October 31, 2014 | Annualized
expense ratio | Days
in the current 1/2 year | Days
in the full year | ||||||||||||||||||||||||
| Class A | $ | 1,000.00 | $ | 1,000.80 | $ | 6.30 | $ | 1,000.00 | $ | 1,018.90 | $ | 6.36 | 1.25 | % | 184 | 365 | ||||||||||||||||
| Class C | $ | 1,000.00 | $ | 996.00 | $ | 10.06 | $ | 1,000.00 | $ | 1,015.12 | $ | 10.16 | 2.00 | 184 | 365 | |||||||||||||||||
| Class I | $ | 1,000.00 | $ | 1,002.40 | $ | 4.85 | $ | 1,000.00 | $ | 1,020.37 | $ | 4.89 | 0.96 | 184 | 365 | |||||||||||||||||
| Class R3 | $ | 1,000.00 | $ | 999.20 | $ | 7.56 | $ | 1,000.00 | $ | 1,017.64 | $ | 7.63 | 1.50 | 184 | 365 | |||||||||||||||||
| Class R4 | $ | 1,000.00 | $ | 1,000.80 | $ | 6.05 | $ | 1,000.00 | $ | 1,019.16 | $ | 6.11 | 1.20 | 184 | 365 | |||||||||||||||||
| Class R5 | $ | 1,000.00 | $ | 1,001.60 | $ | 4.79 | $ | 1,000.00 | $ | 1,020.42 | $ | 4.84 | 0.95 | 184 | 365 | |||||||||||||||||
| Class Y | $ | 1,000.00 | $ | 1,002.40 | $ | 4.54 | $ | 1,000.00 | $ | 1,020.67 | $ | 4.58 | 0.90 | 184 | 365 | |||||||||||||||||
| 57 |
The Hartford Global All-Asset Fund
Approval of Investment Management and Investment Sub-Advisory Agreements (Unaudited)
Section 15(c) of the Investment Company Act of 1940, as amended (the “1940 Act”), requires that each mutual fund’s board of directors, including a majority of those directors who are not “interested persons” of the mutual fund, as defined in the 1940 Act (the “Independent Directors”), annually review and consider the continuation of the mutual fund’s investment advisory and sub-advisory agreements. At its meeting held on August 5-6, 2014, the Board of Directors (the “Board”) of The Hartford Mutual Funds, Inc., including each of the Independent Directors, unanimously voted to approve the continuation of the investment management agreement for The Hartford Global All-Asset Fund (the “Fund”) with Hartford Funds Management Company, LLC (“HFMC”) and the continuation of the investment sub-advisory agreement between HFMC and the Fund’s sub-adviser, Wellington Management Company, LLP (the “Sub-adviser,” and together with HFMC, the “Advisers”) (collectively, the “Agreements”).
In the months preceding the August 5-6, 2014 meeting, the Board requested, received and reviewed written responses from the Advisers to questions posed to them on behalf of the Independent Directors and supporting materials relating to those questions and responses. The Board considered information furnished to the Board at its meetings throughout the year, as well as information specifically prepared in connection with the annual approval of the Agreements at the Board’s meetings held on June 17-18, 2014 and August 5-6, 2014. Information provided to the Board at its meetings throughout the year included, among other things, reports on Fund performance, legal and compliance matters, sales and marketing activity, shareholder services, and the other services provided to the Fund by the Advisers and their affiliates. The Board also received in-person presentations by Fund officers and representatives of HFMC at the Board’s meetings on June 17-18, 2014 and August 5-6, 2014 concerning the Agreements.
The Independent Directors, advised by independent legal counsel, engaged service providers to assist them with evaluating the Agreements with respect to the Fund. Lipper Inc. (“Lipper”), an independent provider of investment company data, was retained to provide the Board with reports on how the Fund’s contractual management fees, actual management fees, other non-management fees, overall expense ratios and investment performance compared to those of mutual funds with similar investment objectives. The Independent Directors also engaged an independent financial services consultant (the “Consultant”) to assist them in evaluating the Fund’s management fees, sub-advisory fees, other non-management fees, overall expense ratios and investment performance. In addition, the Consultant reviewed the profitability calculations utilized by HFMC in connection with the continuation of the investment management agreement.
In determining whether to continue the Agreements for the Fund, the members of the Board reviewed and evaluated information and factors they believed to be relevant and appropriate in light of the information that the Board deemed necessary and appropriate through the exercise of its reasonable business judgment. While individual members of the Board may have weighed certain factors differently, the Board’s determination to continue the Agreements was based on a comprehensive consideration of all information provided to the Board throughout the year and specifically with respect to the continuation of the Agreements. A more detailed discussion of the factors the Board considered with respect to its approval of the Agreements is provided below.
Nature, Extent and Quality of Services Provided by the Advisers
The Board requested and considered information concerning the nature, extent and quality of the services provided to the Fund by the Advisers. The Board considered, among other things, the terms of the Agreements and the range of services provided by the Advisers. The Board considered the Advisers’ professional personnel who provide services to the Fund, including each Adviser’s ability and experience in attracting and retaining qualified personnel to service the Fund. The Board considered each Adviser’s reputation and overall financial strength, as well as its willingness to consider and implement organizational and operational changes designed to enhance services to the Hartford Funds. In addition, the Board considered the quality of each Adviser’s communications with the Board and responsiveness to Board inquiries and requests made from time to time with respect to the Fund and other Hartford Funds.
The Board also requested and evaluated information concerning each Adviser’s regulatory and compliance environment. In this regard, the Board requested and reviewed information on each Adviser’s compliance policies and procedures, compliance history, and a report from the Fund’s Chief Compliance Officer on each Adviser’s compliance with applicable laws and regulations, including responses to regulatory developments and compliance issues raised by regulators. The Board also noted the Advisers’ support of the Fund’s compliance control structure, particularly the resources devoted by the Advisers in support of the Fund’s obligations pursuant to Rule 38a-1 under the 1940 Act.
With respect to HFMC, the Board noted that, under the Agreements, HFMC is responsible for the management of the Fund, including oversight of fund operations and service providers, and provides administrative and investment advisory services in connection with selecting, monitoring and supervising the Sub-adviser. The Board considered HFMC’s ongoing monitoring of people, process and performance, including its quarterly reviews of each of the Hartford Funds, semi-annual meetings with the leaders of each Fund’s portfolio management team, and oversight of the Hartford Funds’ approximately 66 portfolio managers. The Board recognized that HFMC has demonstrated a record of making changes to the
| 58 |
The Hartford Global All-Asset Fund
Approval of Investment Management and Investment Sub-Advisory Agreements (Unaudited) – (continued)
management and/or strategies of the Hartford Funds when warranted. The Board considered HFMC’s oversight of the Sub-adviser’s investment approach and results, process for monitoring best execution of portfolio trades by the Sub-adviser, and approach to risk management with respect to the Fund and the service providers to the Fund. The Board also considered HFMC’s oversight of compliance with the Fund’s objective and policies as well as with applicable laws and regulations, noting that regulatory and other developments had over time led to an increase in the scope of HFMC’s services in this regard.
In addition, the Board considered HFMC’s ongoing commitment to review and rationalize the Hartford Funds product line-up and the expenses that HFMC had incurred in connection with fund combinations in recent years. The Board considered that HFMC or its affiliates are responsible for providing the Fund’s officers.
With respect to the Sub-adviser, which provides certain day-to-day portfolio management services for the Fund, the Board considered the quality of the Fund’s portfolio managers, the Sub-adviser’s other investment personnel, its investment philosophy and process, investment research capabilities and resources, its use of the Fund’s investment flexibility, performance record, trade execution capabilities and experience. The Board considered the experience of the Fund’s portfolio managers, the number of accounts managed by the portfolio managers, and the Sub-adviser’s method for compensating the portfolio managers.
Based on these considerations, the Board concluded that it was satisfied with the nature, extent and quality of the services provided to the Fund by HFMC and the Sub-adviser.
Performance of the Fund and the Advisers
The Board considered the investment performance of the Fund. In this regard, the Board reviewed the performance of the Fund over different time periods presented in the materials and evaluated HFMC’s analysis of the Fund’s performance for these time periods. The Board considered information and materials provided to the Board by the Advisers concerning Fund performance, as well as information from Lipper comparing the investment performance of the Fund to an appropriate benchmark and universe of peer funds. The Board noted that the Fund’s performance was in the 2nd quintile of its performance universe for the 1-year period and the 4th quintile for the 3-year period. The Board also noted that the Fund’s performance was above its blended custom benchmark for the 1-year period and below its blended custom benchmark for the 3-year period. The Board considered that, in response to questions raised concerning the Fund’s performance, HFMC stated that it has confidence in the Fund’s portfolio management team and investment strategy.
The Board considered the detailed investment analytics reports provided by Hartford Funds’ Investment Advisory Group throughout the year. These reports include, among other things, information on the Fund’s gross and net returns, the Fund’s investment performance relative to an appropriate benchmark and peer group, various statistics concerning the Fund’s portfolio, and a narrative summary of various factors affecting Fund performance. The Board considered the Advisers’ cooperation with the Investment Committee, which assists the Board in evaluating the performance of the Fund at periodic meetings throughout the year. The Board also considered the analysis provided by the Consultant relating to the Fund’s performance track record.
In light of all the considerations noted above, the Board concluded that it had continued confidence in HFMC’s and the Sub-adviser’s overall capabilities to manage the Fund.
Costs of the Services and Profitability of the Advisers
The Board reviewed information regarding HFMC’s cost to provide investment management and related services to the Fund and HFMC’s profitability, both overall and for the Fund, on a pre-tax basis without regard to distribution expenses. The Board also requested and reviewed information about the profitability to HFMC and its affiliates from all services provided to the Fund and all aspects of their relationship with the Fund. The Board also requested and received information relating to the operations and profitability of the Sub-adviser.
The Board considered the Consultant’s review of the profitability calculations used by HFMC in connection with the continuation of the investment management agreement, noting the Consultant’s view that Hartford Funds’ process for calculating and reporting Fund profitability is reasonable. In this regard, the Board noted that the Consultant performed a full review of this process in light of the recent restructuring of the Hartford Funds business and reported that the approach to analyzing Fund profitability, including the use of common expense allocation methodologies, is reasonable, sound and well within common industry practice.
| 59 |
The Hartford Global All-Asset Fund
Approval of Investment Management and Investment Sub-Advisory Agreements (Unaudited) – (continued)
Based on these considerations, the Board concluded that the profits anticipated to be realized by the Advisers and their affiliates from their relationships with the Fund would not be excessive.
Comparison of Fees and Services Provided by the Advisers
The Board considered comparative information with respect to the management fees to be paid by the Fund to HFMC and the total expense ratios of the Fund. The Board also considered comparative information with respect to the sub-advisory fees to be paid by HFMC to the Sub-adviser. In this regard, the Board requested and reviewed information from HFMC and the Sub-adviser relating to the management and sub-advisory fees, including the sub-advisory fee schedule for the Fund, and total operating expenses for the Fund. With respect to the sub-advisory fee schedule, the Board considered representations from HFMC and the Sub-adviser that the Sub-adviser’s fees were negotiated at arm’s length on a fund-by-fund basis. The Board also reviewed information from Lipper comparing the Fund’s contractual management fees, actual management fees and overall expense ratios relative to a group of funds selected by Lipper, in consultation with the Consultant, and a broader universe of funds selected by Lipper. The Board considered that the Fund’s contractual management fee and actual management fee were in the 5th quintile of its expense group, while its total expenses (less 12b-1 and shareholder service fees) were in the 3rd quintile. The Board noted that the Fund has an automatically renewable contractual expense cap on each share class. The expense cap resulted in reimbursement of certain expenses incurred in 2013.
While the Board recognized that comparisons between the Fund and peer funds may be imprecise, given the different service levels and characteristics of mutual funds and the different business models and cost structures of the Advisers, the comparative information provided by Lipper assisted the Board in evaluating the reasonableness of the Fund’s management and sub-advisory fees and total operating expenses. In addition, the Board considered the analysis and recommendations of the Consultant relating to the Fund’s management and sub-advisory fees and total operating expenses.
Based on these considerations, the Board concluded that the Fund’s fees and total operating expenses, in conjunction with the information about quality of services, profitability, economies of scale, and other matters discussed, were reasonable in light of the services provided.
Economies of Scale
The Board requested and considered information regarding the Advisers’ realization of economies of scale with respect to the Fund and whether the fee levels reflect these economies of scale for the benefit of the Fund’s shareholders. The Board reviewed the breakpoints in the management fee schedule for the Fund, which reduce fee rates as Fund assets grow over time. The Board recognized that a fund with assets beyond the highest breakpoint level will continue to benefit from economies of scale because additional assets are charged the lowest breakpoint fee resulting in lower overall effective management fee rates. The Board also considered that expense limitations and fee waivers that reduce the Fund’s expenses at all asset levels can have the same effect as breakpoints in sharing economies of scale with shareholders and provide protection from an increase in expenses if Fund assets decline. The Board recognized that a fee schedule that reaches a lower breakpoint quickly provides shareholders with the benefit of anticipated or potential economies of scale. The Board also considered that HFMC has been active in managing expenses, which has resulted in benefits being realized by shareholders as assets within the Hartford Funds family of funds have grown over time, including through lower transfer agent costs and other operating expenses.
The Board reviewed and evaluated materials from Lipper and the Consultant showing how management fee schedules of peer funds reflect economies of scale for the benefit of shareholders as a peer fund’s assets hypothetically increase over time. Based on information provided by HFMC, Lipper, and the Consultant, the Board recognized that there is no uniform methodology for establishing breakpoints or uniform pattern in asset levels that trigger breakpoints or the amounts of breakpoints triggered.
After considering all of the information available to it, the Board concluded that it was satisfied with the extent to which economies of scale would be shared for the benefit of the Fund’s shareholders based on currently available information and the effective advisory fees and expense ratios for the Fund at its current and reasonably anticipated asset levels. The Board noted, however, that it would continue to monitor future growth in Fund assets and the appropriateness of additional breakpoints.
Other Benefits
The Board considered other benefits to the Advisers and their affiliates from their relationships with the Fund.
| 60 |
The Hartford Global All-Asset Fund
Approval of Investment Management and Investment Sub-Advisory Agreements (Unaudited) – (continued)
The Board noted that HFMC receives fees for fund accounting and related services from the Fund, and the Board considered information on profits to HFMC for such services. The Board also considered that Hartford Administrative Services Company (“HASCO”), the Fund’s transfer agent and an affiliate of HFMC, receives transfer agency compensation from the Fund, and the Board reviewed information on the profitability of the Fund’s transfer agency function to HASCO. The Board considered information provided by HASCO indicating that the transfer agent fees charged by HASCO to the Fund were fair and reasonable based on publicly available information.
The Board also considered that Hartford Funds Distributors, LLC (“HFD”), an affiliate of HFMC, serves as principal underwriter of the Fund. As principal underwriter, HFD receives 12b-1 fees from the Fund and receives all or a portion of the sales charges on sales or redemptions of certain classes of shares. The Board also noted that certain affiliates of HFD distribute shares of the Fund and receive compensation in that connection.
The Board considered benefits to the Sub-adviser from its use of the Fund’s brokerage commissions to obtain soft dollar research, and representations from HFMC and the Sub-adviser that the Sub-adviser would not make any revenue-sharing payments or any other type of distribution payments to HFMC or its affiliates.
The Board considered the benefits to shareholders of being part of the Hartford Funds family of funds, including the right to exchange investments between the same class of funds without a sales charge, the ability to reinvest Fund dividends into other funds in the family, and the ability to combine holdings in the Fund with holdings in other funds to obtain a reduced sales charge. The Board considered HFMC’s efforts to provide investors in the family with a broad range of investment styles and asset classes and its entrepreneurial risk in initiating new funds to expand these opportunities for shareholders.
* * * *
Based upon its review of these various factors, among others, the Board concluded that it is in the best interests of the Fund and its shareholders for the Board to approve the Agreements for an additional year. In reaching this decision, the Board did not assign relative weights to the factors discussed above or deem any one or group of them to be controlling in and of themselves. In connection with their deliberations, the Independent Directors met separately in executive session on several occasions, with independent legal counsel and the Consultant, to review the relevant materials and consider their responsibilities under relevant laws and regulations.
| 61 |
The Hartford Global All-Asset Fund
Main Risks (Unaudited)
The main risks of investing in the Fund are described below.
Market, Selection and Strategy Risk: The Fund’s share price may fluctuate due to market risk and/or security selections that may underperform the market or relevant benchmarks. If the sub-adviser's investment strategy does not perform as expected, the Fund could underperform its peers or lose money. There is no guarantee the Fund will achieve its stated objective.
Asset Allocation Strategy Risk: The portfolio managers' asset allocation strategy may not always work as intended, and asset allocation does not guarantee better performance or reduce the risk of investment loss.
Foreign Investment and Emerging Markets Risk: Investments in foreign securities may be riskier than investments in U.S. securities. Potential risks include the risks of illiquidity, increased price volatility, less government regulation, less extensive and less frequent accounting and other reporting requirements, unfavorable changes in currency exchange rates, and economic and political disruptions. These risks are generally greater for investments in emerging markets.
Derivatives Risk: Investments in derivatives can be volatile. Potential risks include currency risk, leverage risk (the risk that small market movements may result in large changes in the value of an investment), liquidity risk, index risk, pricing risk, and counterparty risk (the risk that the counterparty may be unwilling or unable to honor its obligations).
Junk Bond Risk: Investments in junk bonds involve greater risk of price volatility, illiquidity, and default than higher-rated debt securities.
Fixed Income Risk: The Fund is subject to interest rate risk (the risk that the value of an investment decreases when interest rates rise), credit risk (the risk that the issuing company of a security is unable to pay interest and principal when due) and call risk (the risk that an investment may be redeemed early).
Cayman Subsidiary Risk: Investing in a Cayman Islands subsidiary exposes the Fund to the risks associated with the subsidiary and its investments.
Commodities Risk: Investments in commodities may be more volatile than investments in traditional securities.
Active Trading Risk: Actively trading investments may result in higher costs and higher taxable income.
| 62 |
THIS PRIVACY POLICY IS NOT PART OF THIS REPORT
Privacy Policy and Practices of The Hartford Financial Services Group, Inc. and its Affiliates
(herein called “we, our and us”)
This Privacy Policy applies to our United States Operations
|
We value your trust. We are committed to the responsible: a) management; b) use; and c) protection; of Personal Information.
This notice describes how we collect, disclose, and protect Personal Information.
We collect Personal Information to: a) service your Transactions with us; and b) support our business functions.
We may obtain Personal Information from: a) You; b) your Transactions with us; and c) third parties such as a consumer-reporting agency.
Based on the type of product or service You apply for or get from us, Personal Information such as: a) your name; b) your address; c) your income; d) your payment; or e) your credit history; may be gathered from sources such as applications, Transactions, and consumer reports.
To serve You and service our business, we may share certain Personal Information. We will share Personal Information, only as allowed by law, with affiliates such as: a) our insurance companies; b) our employee agents; c) our brokerage firms; and d) our administrators.
As allowed by law, we may share Personal Financial Information with our affiliates to: a) market our products; or b) market our services; to You without providing You with an option to prevent these disclosures.
|
We may also share Personal Information, only as allowed by law, with unaffiliated third parties including: a) independent agents; b) brokerage firms; c) insurance companies; d) administrators; and e) service providers; who help us serve You and service our business.
When allowed by law, we may share certain Personal Financial Information with other unaffiliated third parties who assist us by performing services or functions such as: a) taking surveys; b) marketing our products or services; or c) offering financial products or services under a joint agreement between us and one or more financial institutions.
We, and third parties we partner with, may track some of the pages You visit through the use of: a) cookies; b) pixel tagging; or c) other technologies; and currently do not process or comply with any web browser’s “do not track” signal or similar mechanism that indicates a request to disable online tracking of individual users who visit our websites or use our services.
We will not sell or share your Personal Financial Information with anyone for purposes unrelated to our business functions without offering You the opportunity to: a) “opt-out;” or b) “opt-in;” as required by law.
We only disclose Personal Health Information with: a) your proper written authorization; or b) as otherwise allowed or required by law.
Our employees have access to Personal Information in the course of doing their jobs, such as: a) underwriting policies; b) paying claims; c) developing new products; or d) advising customers of our products and services. |
|
We use manual and electronic security procedures to maintain: a) the confidentiality; and b) the integrity of; Personal Information that we have. We use these procedures to guard against unauthorized access.
Some techniques we use to protect Personal Information include: a) secured files; b) user authentication; c) encryption; d) firewall technology; and e) the use of detection software.
We are responsible for and must: a) identify information to be protected; b) provide an adequate level of protection for that data; c) grant access to protected data only to those people who must use it in the performance of their job-related duties.
Employees who violate our Privacy Policy will be subject to discipline, which may include ending their employment with us.
At the start of our business relationship, we will give You a copy of our current Privacy Policy.
We will also give You a copy of our current Privacy Policy once a year if You maintain a continuing business relationship with us.
We will continue to follow our Privacy Policy regarding Personal Information even when a business relationship no longer exists between us.
|
As used in this Privacy Notice:
Application means your request for our product or service.
Personal Financial Information means financial information such as: a) credit history; b) income; c) financial benefits; or d) policy or claim information.
Personal Health Information means health information such as: a) your medical records; or b) information about your illness, disability or injury.
Personal Information means information that identifies You personally and is not otherwise available to the public. It includes: a) Personal Financial Information; and b) Personal Health Information.
Transaction means your business dealings with us, such as: a) your Application; b) your request for us to pay a claim; and c) your request for us to take an action on your account.
You means an individual who has given us Personal Information in conjunction with: a) asking about; b) applying for; or c) obtaining; a financial product or service from us if the product or service is used mainly for personal, family, or household purposes. |
This Privacy Policy is being provided on behalf of the following affiliates of The Hartford Financial Services Group, Inc.:
1stAGChoice, Inc.; Access CoverageCorp, Inc.; Access CoverageCorp Technologies, Inc.; American Maturity Life Insurance Company; Archway 60 R, LLC; Business Management Group, Inc.; Champlain Life Reinsurance Company; DMS R, LLC; Eloy R, LLC; Ersatz Corporation; First State Insurance Company; Hartford Accident and Indemnity Company; Hartford Administrative Services Company; Hartford Casualty General Agency, Inc.; Hartford Casualty Insurance Company; Hartford-Comprehensive Employee Benefit Service Company; Hartford Equity Sales Company, Inc.; Hartford Fire General Agency, Inc.; Hartford Fire Insurance Company; Hartford Funds Management Company, LLC; Hartford Funds Management Group, Inc.; Hartford HLS Series Fund II, Inc.; Hartford Insurance Company of Illinois; Hartford Insurance Company of the Midwest; Hartford Insurance Company of the Southeast; Hartford Integrated Technologies, Inc.; Hartford International Life Reassurance Corporation; Hartford Funds Distributors, LLC; Hartford Investment Management Company; Hartford Life and Accident Insurance Company; Hartford Life and Annuity Insurance Company; Hartford Life Insurance Company; Hartford Life Private Placement, LLC; Hartford Lloyd’s Corporation; Hartford Lloyd’s Insurance Company; Hartford Mezzanine Investors I, LLC; Hartford Residual Market, L.C.C.; Hartford Retirement Services, LLC; Hartford Securities Distribution Company, Inc.; Hartford Series Fund, Inc.; Hartford Specialty Insurance Services of Texas, LLC; Hartford Strategic Investments, LLC; Hartford Underwriters Insurance Company; Hartford Technology Services Company, L.L.C.; Hartford of Texas General Agency, Inc.; Hartford Underwriters General Agency, Inc.; HARTRE Company, L.C.C.; HL Investment Advisors, LLC; HLA LLC; Horizon Management Group, LLC; HRA Brokerage Services, Inc.; Lanidex Class B, LLC; M-CAP Insurance Agency, LLC; New England Insurance Company; New England Reinsurance Corporation; Nutmeg Insurance Agency, Inc.; Nutmeg Insurance Company; Pacific Insurance Company, Limited; Planco, LLC: Property and Casualty Insurance Company of Hartford; Revere R, LLC; RVR R, LLC; Sentinel Insurance Company, Ltd.; Sunstone R, LLC; Symphony R, LLC; The Evergreen Group Incorporated; The Hartford Alternative Strategies Fund; The Hartford Mutual Funds, Inc.; The Hartford Mutual Funds II, Inc.; Trumbull Flood Management, L.L.C.; Trumbull Insurance Company; Twin City Fire Insurance Company; White River Life Reinsurance Company.
HPP Revised January 2014
HARTFORDFUNDS
hartfordfunds.com
This information is written in connection with the promotion or marketing of the matter(s) addressed in this material.
This report is submitted for the general information of the shareholders of the Fund. It is not authorized for distribution unless preceded or accompanied by a current prospectus for the Fund.
The information cannot be used or relied upon for the purpose of avoiding IRS penalties. These materials are not intended to provide tax, accounting or legal advice. As with all matters of a tax or legal nature, you should consult your own tax or legal counsel for advice.
Investors should carefully consider the investment objectives, risks, charges, and expenses of Hartford Funds before investing. This and other information can be found in the prospectus and summary prospectus, which can be obtained by calling 888-843-7824 (retail) or 800-279-1541 (institutional). Investors should read them carefully before they invest.
Hartford Funds are underwritten and distributed by Hartford Funds Distributors, LLC.
MFAR-GAA14 12/14 113976-3 Printed in U.S.A.
HARTFORDFUNDS
|
THE HARTFORD
2014 Annual Report |
A MESSAGE FROM THE PRESIDENT
Dear Fellow Shareholders:
Thank you for investing in Hartford Funds.
Market Review
U.S. equities (as represented by the S&P 500 Index) rose steadily for the fiscal year ended October 31, 2014, with a return of 17.27% for the period. With the exception of short-lived geopolitical scares early in 2014 and concerns about continuing global growth near the end of the period, stocks generally rose on solid fundamentals and encouraging macroeconomic data during the year.
September 2014 marked the six-year anniversary of the start of the financial crisis. Within weeks of that anniversary, both the S&P 500 Index and the Dow Jones Industrial Average set new all-time highs, closing at 2,018 and 17,391, respectively, on October 31. Although the fallout of the crisis continues to influence investor behavior, stocks have recovered and risen dramatically, up 198% from their low in March 2009. Meanwhile, the domestic economy is notching strong growth, and the unemployment rate has reached its lowest level since August 2008.
While the U.S. economy appears to have stabilized and to have reverted to a solid growth path, the outlook for the global economy appears to have gotten cloudier. The U.S. Federal Reserve has ended quantitative easing, while Europe and Japan are pursuing stimulus options to avoid a double-dip recession and deflation, respectively. Diverging central-bank policies will likely continue to play an important role in market movements going forward as investors wait to see the reactions to their efforts and their impacts on global markets.
How have market movements impacted your portfolio throughout the last year? Are your investments still on track to provide the growth or income you need, and are you comfortable with their progress during times of volatility?
Your financial professional can help you navigate today’s markets with confidence, as well as assist you to achieve your investment goals by providing advice on the best options within our fund family to help you work toward overcoming today’s investing challenges. Meet with your financial advisor regularly to examine your portfolio and your investment strategy, and to determine if you’re still on track to meet your goals.
Thank you again for investing with Hartford Funds.
James Davey
President
Hartford Funds
1 The S&P 500 Index is a market capitalization-weighted price index composed of 500 widely held common stocks.
2 The Dow Jones Industrial Average is an unmanaged, price-weighted index of 30 of the largest, most widely held stocks traded on the NYSE
The Hartford Global Alpha Fund
Table of Contents
The views expressed in the Fund’s Manager Discussion under ‘‘Why did the Fund perform this way?’’ and ‘‘What is the outlook?’’ are views of the Fund’s sub-adviser and portfolio management team through the end of the period and are subject to change based on market and other conditions. The Fund’s Manager Discussion is for informational purposes only and does not represent an offer, recommendation or solicitation to buy, hold or sell any security. The specific securities identified and described, if any, do not represent all of the securities purchased or sold and you should not assume that investments in the securities identified and discussed will be profitable.
The Hartford Global Alpha Fund inception 12/14/2012
(sub-advised by Wellington Management Company, LLP)
| Investment objective – The Fund seeks to provide a positive total return that exceeds the return on 3-Month U.S. Treasury bills over the long-term (generally at least three years) regardless of market conditions. |
Performance Overview 12/14/12 - 10/31/14

The chart above represents the hypothetical growth of a $10,000 investment in Class A, which includes a sales charge. Growth results in classes other than Class A will vary from what is seen above due to differences in the expenses charged to those share classes.
| Average Annual Total Returns (as of 10/31/14) |
| 1 Year | Since Inception▲ | |||||||
| Global Alpha A# | -0.63 | % | -2.75 | % | ||||
| Global Alpha A## | -6.09 | % | -5.63 | % | ||||
| Global Alpha C# | -1.27 | % | -3.46 | % | ||||
| Global Alpha C## | -2.25 | % | -3.46 | % | ||||
| Global Alpha I# | -0.31 | % | -2.47 | % | ||||
| Global Alpha R3# | -0.95 | % | -3.13 | % | ||||
| Global Alpha R4# | -0.73 | % | -2.86 | % | ||||
| Global Alpha R5# | -0.42 | % | -2.58 | % | ||||
| Global Alpha Y# | -0.31 | % | -2.47 | % | ||||
| Bank of America Merrill Lynch 3-Month U.S. Treasury Bill Index | 0.05 | % | 0.06 | % | ||||
| ▲ | Inception: 12/14/2012 |
| # | Without sales charge |
| ## | With sales charge |
PERFORMANCE DATA QUOTED REPRESENTS PAST PERFORMANCE AND DOES NOT GUARANTEE FUTURE RESULTS. The investment return and principal value of the investment will fluctuate so that investors’ shares, when redeemed, may be worth more or less than their original cost. Current performance may be lower or higher than the performance data quoted. To obtain performance data current to the most recent month-end, please visit our website www.hartfordfunds.com.
The initial investment in Class A shares reflects the maximum sales charge of 5.50% and returns for Class C shares reflect a contingent deferred sales charge of up to 1.00% on shares redeemed within twelve months of purchase.
Total returns presented above were calculated using the Fund’s net asset value available to shareholders for sale or redemption of Fund shares on October 31, 2014, which may exclude investment transactions as of this date. All share class returns assume the reinvestment of all distributions at net asset value and the deduction of all fund expenses.
Bank of America Merrill Lynch 3-Month U.S. Treasury Bill Index is an unmanaged index that tracks the performance of U.S. dollar denominated U.S. Treasury bills publicly issued in the U.S. domestic markets with maturities of 90 days or less that assumes reinvestment of all income.
You cannot invest directly in an index.
The chart and table do not reflect the deductions of taxes that a shareholder would pay on Fund distributions or the redemption of Fund shares.
Performance information may reflect historical or current expense waivers/reimbursements from the investment adviser, without which performance would have been lower. For information on current expense waivers/reimbursements, please see the prospectus.
| 2 |
| The Hartford Global Alpha Fund |
| Manager Discussion |
| October 31, 2014 (Unaudited) |
| Operating Expenses* | ||||||||
| Net | Gross | |||||||
| Global Alpha Class A | 1.55 | % | 1.88 | % | ||||
| Global Alpha Class C | 2.30 | % | 2.62 | % | ||||
| Global Alpha Class I | 1.30 | % | 1.64 | % | ||||
| Global Alpha Class R3 | 1.85 | % | 2.32 | % | ||||
| Global Alpha Class R4 | 1.55 | % | 2.02 | % | ||||
| Global Alpha Class R5 | 1.25 | % | 1.72 | % | ||||
| Global Alpha Class Y | 1.20 | % | 1.61 | % | ||||
| * | As shown in the Fund's current prospectus dated March 1, 2014. Actual expenses may be higher or lower. Please see accompanying Financial Highlights for expense ratios for the year ended October 31, 2014. |
Gross expenses are the Fund's total annual operating expenses shown in the Fund's most recent prospectus. Net expenses are the Fund's total annual operating expenses shown in the Fund's most recent prospectus and reflect contractual expense reimbursements in instances when these reductions reduce the Fund's gross expenses. Contractual reimbursements remain in effect until February 28, 2015, and automatically renew for one-year terms unless terminated.
All investments are subject to risk including the possible loss of principal. For a discussion of the Fund’s risks, please see the Main Risks section of this report. For more detailed information on the risks associated with an investment in the Fund, please see the prospectus.
| Portfolio Managers | ||||
| Robert L. Evans | Mark H. Sullivan, CFA, CMT | John Soukas | ||
|
Director and Fixed Income Portfolio Manager |
Senior Vice President and Fixed Income Portfolio Manager |
Senior Vice President and Fixed Income Portfolio Manager |
How did the Fund perform?
The Class A shares of The Hartford Global Alpha Fund returned -0.63%, before sales charge, for the twelve-month period ended October 31, 2014, underperforming the Fund’s benchmark, the Bank of America Merrill Lynch 3-Month U.S. Treasury Bill Index, which returned 0.05% for the same period. The Fund also underperformed the 3.05% average return of the Lipper Absolute Return Funds peer group, a group of funds which aim for positive returns in all market conditions. The funds in the Lipper Absolute Return Funds peer group are not benchmarked against a traditional long only market index but rather have the aim of outperforming a cash or risk-free benchmark.
Why did the Fund perform this way?
Fixed income markets gained throughout much of the period as expectations of prolonged easy monetary policy by major central banks and a supportive macroeconomic environment kept rates low and suppressed volatility. Early in the period emerging markets dominated headlines as economic and political developments sparked risk aversion across global markets, pushing bond prices higher and yields lower amid a flight to quality. Toward the end of the period, however, persistent geopolitical risks – tensions between Ukraine and Russia and violence in Iraq – and Chinese economic slowdown concerns raised questions about the global growth rate, keeping a lid on risk appetites overall.
The period was also highlighted by a divergence in central bank policies. The European Central Bank (ECB) cut its benchmark lending and deposit rates and announced a host of stimulus measures in an effort to encourage lending and fend off fears of deflation. China’s central bank joined the ECB in boosting liquidity by injecting funds into the nation’s largest banks in an attempt to combat weakening growth. The Bank of Japan pre-emptively announced incremental monetary easing to counter the risk of missing the country’s inflation and growth targets. In contrast, the Bank of England (BOE) and U.S. Federal Reserve (Fed) leaned toward tighter policies. The Fed ended its quantitative easing program as U.S. data largely suggested the economy was on a sustainable growth path. Second quarter GDP rebounded after the first quarter’s steep contraction. The labor market strengthened as the unemployment rate dropped to a six-year low. Housing regained some lost ground after a weak start to the year, though the pace of home price appreciation started to slow after a strong 2013. Inflation pressures were muted overall, alleviating pressure on the Fed to raise rates.
The U.S. Treasury curve flattened as markets contemplated bringing interest rates to normal levels; short-term yields rose while longer term rates declined. Most credit risk sectors posted positive absolute returns and outperformed duration-equivalent government bonds as credit spreads tightened.
The Fund’s macro and credit strategies contributed positively to results over the period while quantitative strategies detracted. Within macro strategies, our duration strategies were primary contributors while currency strategies detracted from relative returns over the period. Our underweight duration positions in front-end and intermediate U.K. interest rates, particularly in 4Q 2013, were positive contributors as strong domestic data and BOE policy tightening expectations both led to a rise in U.K. yields. In addition, our tactical long positions in Australia held throughout this period were beneficial. We held these positions based on our outlook for the impacts of a slowing Chinese economy on commodity export- driven economies like Australia. As China’s consumption of raw materials slows, it should continue to have negative effects on Australia’s growth outlook, influence more accommodative monetary policy and impact yields. Within the Fund’s currency strategies, our tactical positions favoring an underweight to European currencies, including the Euro (EUR) detracted from relative performance as economic data stabilized in the Eurozone and the ECB provided
| 3 |
| The Hartford Global Alpha Fund |
| Manager Discussion – (continued) |
| October 31, 2014 (Unaudited) |
guidance that implied rates would remain low, but refrained from actually easing monetary policy until very recently. Within our quantitative strategies, modest long U.S. 10-year vs. U.K. 10-year and Germany 10-year positions, which were held at elevated risk levels at various points during this time period, detracted from relative performance as both sovereign spreads widened at the margin. Helping offset the majority of this benchmark-relative underperformance during the period were our relative yield curve strategies within the U.S. and Germany. Early in 2014, our models favored a flatter U.S. yield curve relative to a steeper Germany curve and the U.S. curve continued to experience flattening relative to Germany. Within credit, our positioning in corporate bonds, non-agency Mortgage Backed Securities (MBS), and Commercial Mortgage Backed Securities (CMBS) aided performance as spreads generally tightened during the period, driven by investors’ continued search for yield and positive market technicals. This was partially offset by our tactical positioning in MBS, which detracted from relative returns over the period.
Our quantitatively-oriented country positioning is primarily implemented through the use of exchange-traded government bond futures. Our currency and duration positioning is primarily implemented through the use of currency forward contracts and through the use of exchange-traded government bond futures. Our credit positioning is primarily implemented through the use of cash bonds and credit default swaps.
What is the outlook?
In our view the global cycle in advanced economies continues to moderate, coupled with a weaker emerging market growth outlook. We tactically traded duration (3.24 years as of October 31, 2014) during the period. We ended the period with active duration overweights in South Korea and Australia, while our primary underweight duration positions were in Germany, the United Kingdom, and Japan. We continued to favor the U.S. dollar as our primary overweight with underweights in the New Zealand dollar, South Korean won and Euro Currency. Our exposure to investment grade, high yield, and securitized credit sectors remains opportunistic in nature, but we retain our positive outlook for global credit and continue to expect corporate bonds to outperform government bonds.
| Credit Exposure | ||||
| as of October 31, 2014 | ||||
| Credit Rating * | Percentage of Net Assets | |||
| Aaa/ AAA | 14.7 | % | ||
| Aa/ AA | 53.3 | |||
| A | 0.2 | |||
| Baa/ BBB | 4.9 | |||
| Ba/ BB | 5.4 | |||
| B | 0.8 | |||
| Caa/ CCC or Lower | 0.6 | |||
| Not Rated | 0.2 | |||
| Non-Debt Securities and Other Short-Term Instruments | 16.5 | |||
| Other Assets and Liabilities | 3.4 | |||
| Total | 100.0 | % | ||
| * | Credit exposure is the long-term credit ratings for the Fund's holdings, as of the date noted, as provided by Standard and Poor's (S&P) or Moody's Investors Service (Moody's) and typically range from AAA/Aaa (highest) to C/D (lowest). Presentation of S&P and Moody's credit ratings in this report have been selected for informational purposes for shareholders, as well as the Fund's consideration of industry practice. If Moody's and S&P assign different ratings, the lower rating is used. Fixed income securities that are not rated by either agency are listed as "Not Rated." Ratings do not apply to the Fund itself or to the Fund's shares. Ratings may change. |
Diversification by Security Type
as of October 31, 2014
| Category | Percentage of Net Assets | |||
| Fixed Income Securities | ||||
| Asset & Commercial Mortgage Backed Securities | 4.4 | % | ||
| Corporate Bonds | 9.1 | |||
| Foreign Government Obligations | 5.5 | |||
| U.S. Government Securities | 61.1 | |||
| Total | 80.1 | % | ||
| Short-Term Investments | 16.3 | |||
| Purchased Options | 0.2 | |||
| Other Assets and Liabilities | 3.4 | |||
| Total | 100.0 | % | ||
| 4 |
| The Hartford Global Alpha Fund |
| Schedule of Investments |
| October 31, 2014 |
| (000’s Omitted) |
| Shares or Principal Amount ╬ | Market Value ╪ | |||||||
| Asset and Commercial Mortgage Backed Securities - 4.4% | ||||||||
| Finance and Insurance - 4.4% | ||||||||
| CHL Mortgage Pass-Through Trust | ||||||||
| $ | 22 | 6.25%, 09/25/2036 | $ | 20 | ||||
| Countrywide Alternative Loan Trust | ||||||||
| 17 | 0.47%, 11/25/2035 Δ | 14 | ||||||
| 27 | 6.50%, 09/25/2036 | 24 | ||||||
| Dryden Senior Loan Fund | ||||||||
| 250 | 1.70%, 07/15/2026 ■Δ | 249 | ||||||
| GMAC Mortgage Corp. Loan Trust | ||||||||
| 31 | 2.93%, 09/19/2035 Δ | 29 | ||||||
| JP Morgan Chase Commercial Mortgage Securities Corp. | ||||||||
| 100 | 2.75%, 10/15/2045 ■ | 75 | ||||||
| 115 | 4.57%, 12/15/2047 ■Δ | 98 | ||||||
| Magnetite CLO Ltd. | ||||||||
| 250 | 1.70%, 07/25/2026 ■Δ | 248 | ||||||
| OZLM Funding Ltd. | ||||||||
| 250 | 1.73%, 04/17/2026 ■Δ | 249 | ||||||
| Residential Accredit Loans, Inc. | ||||||||
| 96 | 0.36%, 04/25/2046 Δ | 49 | ||||||
| UBS-Barclays Commercial Mortgage Trust | ||||||||
| 50 | 4.23%, 03/10/2046 ■Δ | 42 | ||||||
| WaMu Mortgage Pass Through Certificates | ||||||||
| 16 | 1.83%, 01/25/2037 Δ | 14 | ||||||
| 1,111 | ||||||||
| Total Asset and Commercial Mortgage Backed Securities | ||||||||
| (Cost $1,087) | $ | 1,111 | ||||||
| Corporate Bonds - 9.1% | ||||||||
| Administrative, Support, Waste Management and Remediation Services - 0.1% | ||||||||
| Clean Harbors, Inc. | ||||||||
| $ | 25 | 5.13%, 06/01/2021 | $ | 25 | ||||
| Finance and Insurance - 5.6% | ||||||||
| Ally Financial, Inc. | ||||||||
| 40 | 5.13%, 09/30/2024 | 42 | ||||||
| American International Group, Inc. | ||||||||
| GBP | 50 | 5.75%, 03/15/2067 | 83 | |||||
| Bank of America Corp. | ||||||||
| EUR | 50 | 0.78%, 05/23/2017 Δ | 62 | |||||
| Banque PSA Finance S.A. | ||||||||
| EUR | 100 | 4.00%, 06/24/2015 § | 128 | |||||
| Barclays Bank plc | ||||||||
| 210 | 4.38%, 09/11/2024 | 204 | ||||||
| CNH Capital LLC | ||||||||
| 75 | 3.63%, 04/15/2018 | 75 | ||||||
| CNH Industrial Finance Europe S.A. | ||||||||
| EUR | 100 | 2.75%, 03/18/2019 § | 126 | |||||
| Conti-Gummi Finance B.V. | ||||||||
| EUR | 100 | 2.50%, 03/20/2017 § | 131 | |||||
| Ford Motor Credit Co. LLC | ||||||||
| 125 | 5.63%, 09/15/2015 | 130 | ||||||
| HSBC Holdings plc | ||||||||
| EUR | 50 | 0.38%, 09/30/2020 Δ | 62 | |||||
| Navient Corp. | ||||||||
| 165 | 5.50%, 01/15/2019 | 171 | ||||||
| 20 | 6.25%, 01/25/2016 | 21 | ||||||
| Royal Bank of Scotland Group plc | ||||||||
| 115 | 6.00%, 12/19/2023 | 124 | ||||||
| 50 | 9.50%, 03/16/2022 § | 57 | ||||||
| 1,416 | ||||||||
| Health Care and Social Assistance - 0.8% | ||||||||
| AbbVie, Inc. | ||||||||
| 25 | 1.75%, 11/06/2017 | 25 | ||||||
| DaVita, Inc. | ||||||||
| 45 | 5.75%, 08/15/2022 | 48 | ||||||
| Fresenius Medical Care U.S. Finance II, Inc. | ||||||||
| 70 | 5.63%, 07/31/2019 ■ | 75 | ||||||
| Zoetis, Inc. | ||||||||
| 45 | 1.88%, 02/01/2018 | 45 | ||||||
| 193 | ||||||||
| Information - 1.4% | ||||||||
| Deutsche Telekom International Finance B.V. | ||||||||
| 175 | 5.75%, 03/23/2016 | 186 | ||||||
| Sprint Corp. | ||||||||
| 15 | 7.25%, 09/15/2021 ■ | 16 | ||||||
| Verizon Communications, Inc. | ||||||||
| 27 | 5.01%, 08/21/2054 ■ | 27 | ||||||
| 103 | 6.55%, 09/15/2043 | 130 | ||||||
| 359 | ||||||||
| Other Services - 0.1% | ||||||||
| Service Corp. International | ||||||||
| 15 | 5.38%, 01/15/2022 | 15 | ||||||
| Petroleum and Coal Products Manufacturing - 0.6% | ||||||||
| Petrobras Global Finance Co. | ||||||||
| 155 | 3.25%, 03/17/2017 | 156 | ||||||
| Utilities - 0.3% | ||||||||
| American Electric Power Co., Inc. | ||||||||
| 25 | 1.65%, 12/15/2017 | 25 | ||||||
| 50 | 2.95%, 12/15/2022 | 49 | ||||||
| 74 | ||||||||
| Wholesale Trade - 0.2% | ||||||||
| Spectrum Brands, Inc. | ||||||||
| 60 | 6.38%, 11/15/2020 | 64 | ||||||
| Total Corporate Bonds | ||||||||
| (Cost $2,315) | $ | 2,302 | ||||||
| Foreign Government Obligations - 5.5% | ||||||||
| Cyprus - 0.1% | ||||||||
| Cyprus (Republic of) | ||||||||
| EUR | 16 | 4.75%, 06/25/2019 § | $ | 19 | ||||
| Denmark - 3.8% | ||||||||
| Denmark (Kingdom of) | ||||||||
| DKK | 5,690 | 2.00%, 11/15/2014 | 959 | |||||
| Ireland - 0.5% | ||||||||
| Ireland (Republic of) | ||||||||
| EUR | 85 | 3.40%, 03/18/2024 § | 122 | |||||
The accompanying notes are an integral part of these financial statements.
| 5 |
| The Hartford Global Alpha Fund |
| Schedule of Investments – (continued) |
| October 31, 2014 |
| (000’s Omitted) |
| Shares or Principal Amount ╬ | Market Value ╪ | |||||||
| Foreign Government Obligations - 5.5% - (continued) | ||||||||
| Portugal - 0.6% | ||||||||
| Portugal (Republic of) | ||||||||
| EUR | 120 | 3.88%, 02/15/2030 ■ | $ | 149 | ||||
| South Africa - 0.5% | ||||||||
| South Africa (Republic of) | ||||||||
| ZAR | 655 | 8.00%, 01/31/2030 | 58 | |||||
| ZAR | 630 | 10.50%, 12/21/2026 | 68 | |||||
| 126 | ||||||||
| Total Foreign Government Obligations | ||||||||
| (Cost $1,471) | $ | 1,375 | ||||||
| U.S. Government Securities - 61.1% | ||||||||
| Other Direct Federal Obligations - 2.0% | ||||||||
| FHLB - 2.0% | ||||||||
| $ | 500 | 0.25%, 01/16/2015 | $ | 500 | ||||
| U.S. Treasury Securities - 59.1% | ||||||||
| U.S. Treasury Notes - 59.1% | ||||||||
| 1,550 | 0.13%, 12/31/2014 Є | 1,550 | ||||||
| 5,005 | 0.25%, 11/30/2014 - 02/28/2015 ╦ΘЄ | 5,008 | ||||||
| 2,440 | 0.38%, 11/15/2014 - 03/15/2015 | 2,441 | ||||||
| 1,605 | 2.25%, 01/31/2015 | 1,613 | ||||||
| 2,000 | 2.63%, 12/31/2014 | 2,008 | ||||||
| 2,300 | 4.25%, 11/15/2014 | 2,304 | ||||||
| 14,924 | ||||||||
| Total U.S. Government Securities | ||||||||
| (Cost $15,425) | $ | 15,424 | ||||||
| Total Long-Term Investments Excluding Purchased Options | ||||||||
| (Cost $20,298) | $ | 20,212 | ||||||
| Short-Term Investments - 16.3% | ||||||||
| Other Direct Federal Obligations - 4.9% | ||||||||
| FHLB | ||||||||
| $ | 250 | 0.06%, 11/5/2014 ○ | $ | 250 | ||||
| 1,000 | 0.06%, 3/30/2015 | 999 | ||||||
| 1,249 | ||||||||
| Commercial Paper - 4.0% | ||||||||
| Computer and Electronic Product Manufacturing - 1.0% | ||||||||
| Apple, Inc. | ||||||||
| $ | 250 | 0.06%, 11/21/2014 ○ | $ | 250 | ||||
| Finance and Insurance - 1.0% | ||||||||
| Nissan Motor Acceptance Corp. | ||||||||
| 250 | 0.27%, 11/17/2014 ○ | 250 | ||||||
| Information - 2.0% | ||||||||
| AT&T, Inc. | ||||||||
| 250 | 0.24%, 11/14/2014 ■○ | 250 | ||||||
| Deutsche Telekom AG | ||||||||
| 250 | 0.30%, 12/1/2014 ○ | 250 | ||||||
| 500 | ||||||||
| 1,000 | ||||||||
| Repurchase Agreements - 7.4% | ||||||||
Bank
of America Merrill Lynch TriParty | ||||||||
| 5 | 0.08%, 10/31/2014 | 5 | ||||||
| Bank of America Merrill Lynch TriParty Repurchase Agreement (maturing on 11/03/2014 in the amount of $91, collateralized by GNMA 1.63% - 7.00%, 2031 - 2054, value of $93) | ||||||||
| 91 | 0.09%, 10/31/2014 | 91 | ||||||
| Bank of Montreal TriParty Repurchase Agreement (maturing on 11/03/2014 in the amount of $25, collateralized by U.S. Treasury Bond 2.88% - 5.25%, 2029 - 2043, U.S. Treasury Note 0.38% - 4.50%, 2015 - 2022, value of $25) | ||||||||
| 25 | 0.08%, 10/31/2014 | 25 | ||||||
| Bank of Montreal TriParty Repurchase Agreement (maturing on 11/03/2014 in the amount of $83, collateralized by FHLMC 2.00% - 5.50%, 2022 - 2034, FNMA 2.00% - 4.50%, 2024 - 2039, GNMA 3.00%, 2043, U.S. Treasury Note 4.63%, 2017, value of $85) | ||||||||
| 83 | 0.10%, 10/31/2014 | 83 | ||||||
| Barclays Capital TriParty Repurchase Agreement (maturing on 11/03/2014 in the amount of $313, collateralized by U.S. Treasury Bond 4.50% - 6.25%, 2023 - 2036, U.S. Treasury Note 1.63% - 2.13%, 2015 - 2019, value of $320) | ||||||||
| 313 | 0.08%, 10/31/2014 | 313 | ||||||
| Citigroup Global Markets, Inc. TriParty Repurchase Agreement (maturing on 11/03/2014 in the amount of $360, collateralized by U.S. Treasury Bill 0.02%, 2015, U.S. Treasury Bond 3.88% - 11.25%, 2015 - 2040, U.S. Treasury Note 2.00% - 3.38%, 2019 - 2021, value of $367) | ||||||||
| 360 | 0.09%, 10/31/2014 | 360 | ||||||
| Deutsche Bank Securities TriParty Repurchase Agreement (maturing on 11/03/2014 in the amount of $21, collateralized by U.S. Treasury Note 0.88%, 2017, value of $21) | ||||||||
| 21 | 0.13%, 10/31/2014 | 21 | ||||||
| RBS Securities, Inc. TriParty Repurchase Agreement (maturing on 11/03/2014 in the amount of $31, collateralized by U.S. Treasury Bond 3.63% - 5.00%, 2037 - 2043, U.S. Treasury Note 2.13%, 2020, value of $31) | ||||||||
| 31 | 0.07%, 10/31/2014 | 31 | ||||||
The accompanying notes are an integral part of these financial statements.
| 6 |
| The Hartford Global Alpha Fund |
| Schedule of Investments – (continued) |
| October 31, 2014 |
| (000’s Omitted) |
| Shares or Principal Amount ╬ | Market Value ╪ | |||||||||||
| Short-Term Investments - 16.3% - (continued) | ||||||||||||
| Repurchase Agreements- 7.4% - (continued) | ||||||||||||
| Societe Generale TriParty Repurchase Agreement (maturing on 11/03/2014 in the amount of $322, collateralized by U.S. Treasury Bill 0.02%, 2015, U.S. Treasury Bond 3.75% - 11.25%, 2015 - 2043, U.S. Treasury Note 1.38% - 4.25%, 2015 - 2022, value of $329) |
||||||||||||
| $ | 322 | 0.08%, 10/31/2014 | $ | 322 | ||||||||
| TD Securities TriParty Repurchase Agreement (maturing on 11/03/2014 in the amount of $625, collateralized by FHLMC 3.00% - 4.00%, 2026 - 2044, FNMA 2.50% - 5.00%, 2025 - 2044, U.S. Treasury Bond 3.50% - 6.50%, 2026 - 2041, U.S. Treasury Note 1.75% - 2.88%, 2018 - 2019, value of $637) |
||||||||||||
| 625 | 0.10%, 10/31/2014 | 625 | ||||||||||
| 1,876 | ||||||||||||
| Total Short-Term Investments | ||||||||||||
| (Cost $4,126) | $ | 4,125 | ||||||||||
| Total Investments Excluding Purchased Options | ||||||||||||
| (Cost $24,424) | 96.4 | % | $ | 24,337 | ||||||||
| Total Purchased Options | ||||||||||||
| (Cost $56) | 0.2 | % | 55 | |||||||||
| Total Investments | ||||||||||||
| (Cost $24,480) ▲ | 96.6 | % | $ | 24,392 | ||||||||
| Other Assets and Liabilities | 3.4 | % | 845 | |||||||||
| Total Net Assets | 100.0 | % | $ | 25,237 | ||||||||
The accompanying notes are an integral part of these financial statements.
| 7 |
| The Hartford Global Alpha Fund |
| Schedule of Investments – (continued) |
| October 31, 2014 |
| (000’s Omitted) |
| Note: | Percentage of investments as shown is the ratio of the total market value to total net assets. |
The Fund may refer to any one or more of the industry classifications used by one or more widely recognized market indices, ratings group indices and/or as defined by Fund management. Industry classifications may not be identical across all security types.
For Fund compliance purposes, the Fund may not use the same classification system shown in this report as these classifications are used for reporting ease.
| ▲ | At October 31, 2014, the cost of securities for federal income tax purposes was $24,482 and the aggregate gross unrealized appreciation and depreciation based on that cost were: |
| Unrealized Appreciation | $ | 81 | ||
| Unrealized Depreciation | (171 | ) | ||
| Net Unrealized Depreciation | $ | (90 | ) |
| ╬ | All principal amounts are in U.S. dollars unless otherwise indicated. | |
| Δ | Variable rate securities; the rate reported is the coupon rate in effect at October 31, 2014. | |
| ○ | The interest rate disclosed for these securities represents the effective yield on the date of the acquisition. | |
| ■ | Securities issued within terms of a private placement memorandum, exempt from registration under Rule 144A under the Securities Act of 1933, as amended, and may be sold only to qualified institutional buyers. Unless otherwise indicated, these holdings are determined to be liquid. At October 31, 2014, the aggregate value of these securities was $1,478, which represents 5.9% of total net assets. | |
| § | These securities were sold to the Fund under Regulation S, rules governing offers and sales made outside the United States without registration under the Securities Act of 1933, as amended. The Fund may only be able to resell these securities in the United States if an exemption from registration under the federal and state securities laws is available, or the Fund may only be able to sell these securities outside of the United States (such as on a foreign exchange) to a non-U.S. person. Unless otherwise indicated, these holdings are determined to be liquid. At October 31, 2014, the aggregate value of these securities was $583, which represents 2.3% of total net assets. | |
| ╦ | This security, or a portion of this security, has been pledged as collateral in connection with OTC swap contracts. | |
| Є | This security, or a portion of this security, has been pledged as collateral in connection with centrally cleared swap contracts. | |
| Θ | This security, or a portion of this security, has been pledged as collateral in connection with OTC option and/or swaption contracts. |
Cash pledged and received as collateral in connection with derivatives at October 31, 2014:
| Pledged | Received | |||||||
| Futures contracts | $ | 458 | $ | – | ||||
| Total | $ | 458 | $ | – | ||||
OTC Option Contracts Outstanding at October 31, 2014
| Description | Counter -
party | Risk Exposure Category | Exercise Price/ FX Rate/
Rate | Expiration
Date | Number of
Contracts * | Market
Value ╪ | Premiums Paid by Fund | Unrealized
Appreciation (Depreciation) | ||||||||||||||||||
| Purchased Option contracts: | ||||||||||||||||||||||||||
| Calls | ||||||||||||||||||||||||||
| CMS Spread Option CMS10/CMS5 | BOA | IR | 0.76 USD | 11/03/14 | USD | 4,390,000 | $ | – | $ | 3 | $ | (3 | ) | |||||||||||||
| EUR Call/USD Put | GSC | FX | 1.29 USD per EUR | 04/15/15 | EUR | 255,000 | 2 | 6 | (4 | ) | ||||||||||||||||
| USD Call/CAD Put æ | JPM | FX | 1.11 CAD per USD | 01/22/15 | USD | 11,000 | 8 | 2 | 6 | |||||||||||||||||
| USD Call/CHF Put И | CBK | FX | 1.10 USD per CHF | 07/02/15 | USD | 36,000 | 4 | 5 | (1 | ) | ||||||||||||||||
| USD Call/CHF Put Ҹ | CBK | FX | 1.10 USD per CHF | 07/02/15 | USD | 18,000 | 2 | 2 | – | |||||||||||||||||
| USD Call/CNH Put | SCB | FX | 6.50 CNH per USD | 04/16/15 | USD | 717,000 | 1 | 5 | (4 | ) | ||||||||||||||||
| USD Call/CNY Put | JPM | FX | 6.30 CNY per USD | 06/15/15 | USD | 580,000 | 2 | 3 | (1 | ) | ||||||||||||||||
| Total Calls | 6,007,000 | $ | 19 | $ | 26 | $ | (7 | ) | ||||||||||||||||||
| Puts | ||||||||||||||||||||||||||
| AUD Put/NZD Call | UBS | FX | 1.08 NZD per AUD | 04/01/15 | AUD | 393,000 | $ | 1 | $ | 2 | $ | (1 | ) | |||||||||||||
| AUD Put/NZD Call ₡ | JPM | FX | 1.08 NZD per AUD | 04/01/15 | AUD | 14,000 | 2 | 3 | (1 | ) | ||||||||||||||||
| EUR Put/USD Call | JPM | FX | 1.26 USD per EUR | 03/05/15 | EUR | 401,000 | 11 | 4 | 7 | |||||||||||||||||
The accompanying notes are an integral part of these financial statements.
| 8 |
|
The Hartford Global Alpha Fund |
| Schedule of Investments – (continued) |
| October 31, 2014 |
| (000’s Omitted) |
OTC Option Contracts Outstanding at October 31, 2014 - (continued)
| Description | Counter -
party | Risk Exposure Category | Exercise Price/ FX Rate/
Rate | Expiration
Date | Number of
Contracts * | Market
Value ╪ | Premiums
Paid by Fund | Unrealized
Appreciation (Depreciation) | ||||||||||||||||||
| Purchased Option contracts: - (continued) | ||||||||||||||||||||||||||
| Puts - (continued) | ||||||||||||||||||||||||||
| EUR Put/USD Call | GSC | FX | 1.25 USD per EUR | 11/04/14 | EUR | 19,001 | $ | 10 | $ | 4 | $ | 6 | ||||||||||||||
| GBP Put/USD Call | GSC | FX | 1.60 USD per GBP | 03/19/15 | GBP | 159,000 | 4 | 2 | 2 | |||||||||||||||||
| GBP Put/USD Call ₪ | JPM | FX | 1.50 USD per GBP | 07/01/15 | GBP | 26,000 | 5 | 6 | (1 | ) | ||||||||||||||||
| SGD Put/JPY Call | GSC | FX | 83.00 JPY per SGD | 01/08/15 | SGD | 457,000 | – | 2 | (2 | ) | ||||||||||||||||
| USD Put/CHF Call | JPM | FX | 0.93 CHF per USD | 04/15/15 | USD | 304,000 | 3 | 6 | (3 | ) | ||||||||||||||||
| Total Puts | 1,773,001 | $ | 36 | $ | 29 | $ | 7 | |||||||||||||||||||
| Total purchased option contracts | 7,780,001 | $ | 55 | $ | 55 | $ | – | |||||||||||||||||||
| * | The number of contracts does not omit 000's. | |
| æ | This security has limitations. If the CAD per USD exchange rate is greater than or equal to 1.11 at expiration date, the Fund will receive the equivalent of par on the number of contracts traded. |
| И | This security has limitations. If the USD per CHF exchange rate is greater than or equal to 1.10 at expiration date, the Fund will receive the equivalent of par on the number of contracts traded. |
| ₡ | This security has limitations. If the NZD per AUD exchange rate is greater than or equal to 1.08 at expiration date, the Fund will receive the equivalent of par on the number of contracts traded. |
| ₪ | This security has limitations. If the USD per GBP exchange rate is greater than or equal to 1.50 at expiration date, the Fund will receive the equivalent of par on the number of contracts traded. |
OTC Swaption Contracts Outstanding at October 31, 2014
| Description | Counter -
party | Risk Exposure Category | Exercise Price/ FX Rate/
Rate | Expiration
Date | Number of
Contracts * | Market
Value ╪ | Premiums
Received/ Paid by Fund Δ | Unrealized
Appreciation (Depreciation) | ||||||||||||||||||||
| Purchased swaption contracts: | ||||||||||||||||||||||||||||
| Puts | ||||||||||||||||||||||||||||
| Credit Default Swaption CDX.NA.IG.23 | CSI | CR | 0.75 | % | 11/19/14 | USD | 1,200,000 | $ | – | $ | 1 | $ | (1 | ) | ||||||||||||||
| Written swaption contracts: | ||||||||||||||||||||||||||||
| Calls | ||||||||||||||||||||||||||||
| Credit Default Swaption CDX.NA.IG.23 | CSI | CR | 0.65 | % | 11/19/14 | USD | 1,200,000 | $ | 2 | $ | 1 | $ | (1 | ) | ||||||||||||||
| * | The number of contracts does not omit 000's. |
| Δ | For purchased swaptions, premiums are paid by the Fund, for written swaptions, premiums are received. |
Futures Contracts Outstanding at October 31, 2014
| Number of | Expiration | Notional | Market | Unrealized
Appreciation/(Depreciation) | Variation Margin | |||||||||||||||||||||||||
| Description | Contracts* | Date | Amount | Value ╪ | Asset | Liability | Asset | Liability | ||||||||||||||||||||||
| Long position contracts: | ||||||||||||||||||||||||||||||
| Australian 10-Year Bond Future | 6 | 12/15/2014 | $ | 647 | $ | 648 | $ | 1 | $ | – | $ | 2 | $ | – | ||||||||||||||||
| Australian 3-Year Bond Future | 39 | 12/15/2014 | 3,766 | 3,769 | 3 | – | 4 | – | ||||||||||||||||||||||
| U.S. Treasury 10-Year Note Future | 139 | 12/19/2014 | 17,744 | 17,564 | – | (180 | ) | – | (37 | ) | ||||||||||||||||||||
| U.S. Treasury 5-Year Note Future | 19 | 12/31/2014 | 2,279 | 2,269 | – | (10 | ) | – | (3 | ) | ||||||||||||||||||||
| U.S. Treasury Long Bond Future | 1 | 12/19/2014 | 141 | 141 | – | – | 1 | – | ||||||||||||||||||||||
| Total | $ | 4 | $ | (190 | ) | $ | 7 | $ | (40 | ) | ||||||||||||||||||||
The accompanying notes are an integral part of these financial statements.
| 9 |
| The Hartford Global Alpha Fund |
| Schedule of Investments – (continued) |
| October 31, 2014 |
| (000’s Omitted) |
Futures Contracts Outstanding at October 31, 2014 - (continued)
| Number of | Expiration | Notional | Market | Unrealized
Appreciation/(Depreciation) | Variation Margin | |||||||||||||||||||||||||
| Description | Contracts* | Date | Amount | Value ╪ | Asset | Liability | Asset | Liability | ||||||||||||||||||||||
| Short position contracts: | ||||||||||||||||||||||||||||||
| Euro BUXL 30-Year Bond Future | 3 | 12/08/2014 | $ | 543 | $ | 546 | $ | – | $ | (3 | ) | $ | 2 | $ | – | |||||||||||||||
| Euro-BTP Future | 2 | 12/08/2014 | 323 | 327 | – | (4 | ) | – | (10 | ) | ||||||||||||||||||||
| Euro-BUND Future | 19 | 12/08/2014 | 3,590 | 3,593 | – | (3 | ) | – | (1 | ) | ||||||||||||||||||||
| Japan 10-Year Mini Bond Future | 22 | 12/10/2014 | 2,852 | 2,872 | – | (20 | ) | – | (2 | ) | ||||||||||||||||||||
| Long Gilt Future | 46 | 12/29/2014 | 8,541 | 8,470 | 71 | – | 16 | – | ||||||||||||||||||||||
| U.S. Treasury 2-Year Note Future | 2 | 12/31/2014 | 438 | 439 | – | (1 | ) | – | – | |||||||||||||||||||||
| U.S. Treasury Long Bond Future | 1 | 12/19/2014 | 142 | 141 | 1 | – | – | – | ||||||||||||||||||||||
| Total | $ | 72 | $ | (31 | ) | $ | 18 | $ | (13 | ) | ||||||||||||||||||||
| Total futures contracts | $ | 76 | $ | (221 | ) | $ | 25 | $ | (53 | ) | ||||||||||||||||||||
| * | The number of contracts does not omit 000's. |
OTC Credit Default Swap Contracts Outstanding at October 31, 2014
| Counter- | Notional | (Pay)/ Receive Fixed Rate/ Implied | Expiration | Upfront
Premiums | Upfront
Premiums | Market | Unrealized Appreciation/
(Depreciation) | |||||||||||||||||||||||
| Reference Entity | party | Amount (a) | Credit Spread (b) | Date | Paid | Received | Value ╪ | Asset | Liability | |||||||||||||||||||||
| Credit default swaps on indices: | ||||||||||||||||||||||||||||||
| Buy protection: | ||||||||||||||||||||||||||||||
| ABX.HE.AA.06-1 | JPM | USD 19 | (0.32 | )% | 07/25/45 | $ | 5 | $ | – | $ | 4 | $ | – | $ | (1 | ) | ||||||||||||||
| ABX.HE.AAA.06-1 | JPM | USD 30 | (0.18 | )% | 07/25/45 | 1 | – | 1 | – | – | ||||||||||||||||||||
| ABX.HE.AAA.06-2 | BOA | USD 181 | (0.11 | )% | 05/25/46 | 38 | – | 36 | – | (2 | ) | |||||||||||||||||||
| ABX.HE.AAA.07-1 | GSC | USD 25 | (0.09 | )% | 08/25/37 | 7 | – | 7 | – | – | ||||||||||||||||||||
| ABX.HE.AAA.07-1 | MSC | USD 59 | (0.09 | )% | 08/25/37 | 14 | – | 15 | 1 | – | ||||||||||||||||||||
| ABX.HE.PENAAA.06-2 | JPM | USD 157 | (0.11 | )% | 05/25/46 | 22 | – | 22 | – | – | ||||||||||||||||||||
| CMBX.NA.A.7 | JPM | USD 65 | (2.00 | )% | 01/17/47 | – | (1 | ) | – | 1 | – | |||||||||||||||||||
| CMBX.NA.AA.2 | CSI | USD 38 | (0.15 | )% | 03/15/49 | 11 | – | 12 | 1 | – | ||||||||||||||||||||
| CMBX.NA.AA.2 | DEUT | USD 124 | (0.15 | )% | 03/15/49 | 44 | – | 40 | – | (4 | ) | |||||||||||||||||||
| CMBX.NA.AA.2 | MSC | USD 158 | (0.15 | )% | 03/15/49 | 58 | – | 51 | – | (7 | ) | |||||||||||||||||||
| CMBX.NA.AA.7 | CSI | USD 180 | (1.50 | )% | 01/17/47 | – | – | – | – | – | ||||||||||||||||||||
| CMBX.NA.AA.7 | CSI | USD 60 | (1.50 | )% | 01/17/47 | – | (1 | ) | – | 1 | – | |||||||||||||||||||
| CMBX.NA.AA.7 | MSC | USD 65 | (1.50 | )% | 01/17/47 | – | – | – | – | – | ||||||||||||||||||||
| CMBX.NA.AJ.1 | CSI | USD 90 | (0.84 | )% | 10/12/52 | 5 | – | 2 | – | (3 | ) | |||||||||||||||||||
| CMBX.NA.AJ.2 | CSI | USD 84 | (1.09 | )% | 03/15/49 | 13 | – | 7 | – | (6 | ) | |||||||||||||||||||
| CMBX.NA.AJ.2 | DEUT | USD 104 | (1.09 | )% | 03/15/49 | 10 | – | 9 | – | (1 | ) | |||||||||||||||||||
| CMBX.NA.AJ.4 | CBK | USD 50 | (0.96 | )% | 02/17/51 | 10 | – | 10 | – | – | ||||||||||||||||||||
| CMBX.NA.AJ.4 | CSI | USD 70 | (0.96 | )% | 02/17/51 | 14 | – | 14 | – | – | ||||||||||||||||||||
| CMBX.NA.AJ.4 | CSI | USD 115 | (0.96 | )% | 02/17/51 | 28 | – | 22 | – | (6 | ) | |||||||||||||||||||
| CMBX.NA.AJ.4 | DEUT | USD 70 | (0.96 | )% | 02/17/51 | 14 | – | 14 | – | – | ||||||||||||||||||||
| CMBX.NA.AJ.4 | GSC | USD 50 | (0.96 | )% | 02/17/51 | 9 | – | 10 | 1 | – | ||||||||||||||||||||
| CMBX.NA.AJ.4 | JPM | USD 10 | (0.96 | )% | 02/17/51 | 2 | – | 2 | – | – | ||||||||||||||||||||
| CMBX.NA.AJ.4 | MSC | USD 60 | (0.96 | )% | 02/17/51 | 12 | – | 12 | – | – | ||||||||||||||||||||
| CMBX.NA.AM.2 | CSI | USD 365 | (0.50 | )% | 03/15/49 | 24 | – | 5 | – | (19 | ) | |||||||||||||||||||
| CMBX.NA.AM.4 | GSC | USD 55 | (0.50 | )% | 02/17/51 | 4 | – | 2 | – | (2 | ) | |||||||||||||||||||
| CMBX.NA.AS.6 | CSI | USD 135 | (1.00 | )% | 05/11/63 | 2 | – | 1 | – | (1 | ) | |||||||||||||||||||
| CMBX.NA.AS.7 | CBK | USD 60 | (1.00 | )% | 01/17/47 | 1 | – | 1 | – | – | ||||||||||||||||||||
| CMBX.NA.AS.7 | CSI | USD 85 | (1.00 | )% | 01/17/47 | 2 | – | 1 | – | (1 | ) | |||||||||||||||||||
| ITRAXX.SUB.FIN.21 | DEUT | EUR 140 | (1.00 | )% | 06/20/19 | – | (2 | ) | (3 | ) | – | (1 | ) | |||||||||||||||||
| Total | $ | 350 | $ | (4 | ) | $ | 297 | $ | 5 | $ | (54 | ) | ||||||||||||||||||
| Sell protection: | ||||||||||||||||||||||||||||||
| CMBX.NA.A.2 | BOA | USD 36 | 0.25 | % | 03/15/49 | $ | – | $ | (22 | ) | $ | (24 | ) | $ | – | $ | (2 | ) | ||||||||||||
| CMBX.NA.AAA.6 | CSI | USD 820 | 0.50 | % | 05/11/63 | – | (24 | ) | (16 | ) | 8 | – | ||||||||||||||||||
| CMBX.NA.AAA.6 | DEUT | USD 260 | 0.50 | % | 05/11/63 | – | (6 | ) | (5 | ) | 1 | – | ||||||||||||||||||
| CMBX.NA.AAA.6 | JPM | USD 50 | 0.50 | % | 05/11/63 | – | (2 | ) | (1 | ) | 1 | – | ||||||||||||||||||
The accompanying notes are an integral part of these financial statements.
| 10 |
| The Hartford Global Alpha Fund |
| Schedule of Investments – (continued) |
| October 31, 2014 |
| (000’s Omitted) |
OTC Credit Default Swap Contracts Outstanding at October 31, 2014 - (continued)
| Counter- | Notional | (Pay)/ Receive Fixed
Rate/ Implied | Expiration | Upfront
Premiums | Upfront
Premiums | Market | Unrealized Appreciation/
(Depreciation) | |||||||||||||||||||||||
| Reference Entity | party | Amount (a) | Credit Spread (b) | Date | Paid | Received | Value ╪ | Asset | Liability | |||||||||||||||||||||
| Credit default swaps on indices: - (continued) | ||||||||||||||||||||||||||||||
| Sell protection: - (continued) | ||||||||||||||||||||||||||||||
| CMBX.NA.BB.6 | CSI | USD 380 | 5.00% | 05/11/63 | $ | – | $ | (16 | ) | $ | – | $ | 16 | $ | – | |||||||||||||||
| CMBX.NA.BB.6 | CSI | USD 147 | 5.00% | 05/11/63 | 2 | – | – | – | (2 | ) | ||||||||||||||||||||
| CMBX.NA.BB.6 | CSI | USD 15 | 5.00% | 05/11/63 | – | – | – | – | – | |||||||||||||||||||||
| CMBX.NA.BB.7 | BOA | USD 55 | 5.00% | 01/17/47 | – | (2 | ) | (2 | ) | – | – | |||||||||||||||||||
| CMBX.NA.BB.7 | CBK | USD 10 | 5.00% | 01/17/47 | – | – | – | – | – | |||||||||||||||||||||
| CMBX.NA.BB.7 | CSI | USD 150 | 5.00% | 01/17/47 | – | (6 | ) | (3 | ) | 3 | – | |||||||||||||||||||
| CMBX.NA.BB.7 | DEUT | USD 50 | 5.00% | 01/17/47 | – | (1 | ) | (1 | ) | – | – | |||||||||||||||||||
| CMBX.NA.BB.7 | GSC | USD 85 | 5.00% | 01/17/47 | – | (5 | ) | (2 | ) | 3 | – | |||||||||||||||||||
| CMBX.NA.BBB-.7 | CSI | USD 35 | 3.00% | 01/17/47 | – | (2 | ) | (1 | ) | 1 | – | |||||||||||||||||||
| CMBX.NA.BBB-.7 | UBS | USD 45 | 3.00% | 01/17/47 | – | (3 | ) | (1 | ) | 2 | – | |||||||||||||||||||
| PrimeX.ARM.2 | MSC | USD 5 | 4.58% | 12/25/37 | – | – | – | – | – | |||||||||||||||||||||
| PrimeX.ARM.2 | MSC | USD 118 | 4.58% | 12/25/37 | 3 | – | 4 | 1 | – | |||||||||||||||||||||
| PrimeX.FRM.1 | MSC | USD 15 | 4.42% | 07/25/36 | 2 | – | 2 | – | – | |||||||||||||||||||||
| Total | $ | 7 | $ | (89 | ) | $ | (50 | ) | $ | 36 | $ | (4 | ) | |||||||||||||||||
| Total traded indices | $ | 357 | $ | (93 | ) | $ | 247 | $ | 41 | $ | (58 | ) | ||||||||||||||||||
| Credit default swaps on single-name issues: | ||||||||||||||||||||||||||||||
| Buy protection: | ||||||||||||||||||||||||||||||
| Ally Financial, Inc. | MSC | USD 30 | (5.00)% / (1.55)% | 12/20/19 | $ | – | $ | (5 | ) | $ | (5 | ) | $ | – | $ | – | ||||||||||||||
| First Data Corp. | MSC | USD 100 | (5.00)% / (1.65)% | 09/20/17 | – | (8 | ) | (9 | ) | – | (1 | ) | ||||||||||||||||||
| Freescale Semiconductors, Inc. | JPM | USD 75 | (5.00)% / (1.65)% | 12/20/17 | – | (8 | ) | (8 | ) | – | – | |||||||||||||||||||
| Freescale Semiconductors, Inc. | JPM | USD 25 | (5.00)% / (1.65)% | 12/20/17 | – | (2 | ) | (3 | ) | – | (1 | ) | ||||||||||||||||||
| Ryland Group, Inc. | DEUT | USD 75 | (5.00)% / (1.26)% | 09/20/17 | – | (7 | ) | (8 | ) | – | (1 | ) | ||||||||||||||||||
| Ryland Group, Inc. | DEUT | USD 50 | (5.00)% / (1.34)% | 12/20/17 | – | (6 | ) | (6 | ) | – | – | |||||||||||||||||||
| Telefonica S.A. | CSI | EUR 60 | (1.00)% / (0.85)% | 06/20/19 | 1 | – | – | – | (1 | ) | ||||||||||||||||||||
| Tenet Healthcare Corp. | MSC | USD 50 | (5.00)% / (1.39)% | 12/20/17 | – | (4 | ) | (5 | ) | – | (1 | ) | ||||||||||||||||||
| Total | $ | 1 | $ | (40 | ) | $ | (44 | ) | $ | – | $ | (5 | ) | |||||||||||||||||
| Sell protection: | ||||||||||||||||||||||||||||||
| First Data Corp. | JPM | USD 100 | 5.00% / 3.45% | 12/20/19 | $ | 6 | $ | – | $ | 7 | $ | 1 | $ | – | ||||||||||||||||
| Freescale Semiconductors, Inc. | GSC | USD 40 | 5.00% / 3.25% | 12/20/19 | 4 | – | 4 | – | – | |||||||||||||||||||||
| Freescale Semiconductors, Inc. | JPM | USD 25 | 5.00% / 3.25% | 12/20/19 | 1 | – | 2 | 1 | – | |||||||||||||||||||||
| Freescale Semiconductors, Inc. | JPM | USD 85 | 5.00% / 3.25% | 12/20/19 | 7 | – | 7 | – | – | |||||||||||||||||||||
| Gannett Co., Inc. | GSC | USD 50 | 5.00% / 2.18% | 12/20/19 | 6 | – | 6 | – | – | |||||||||||||||||||||
| Koninklijke KPN, N.V. | CSI | EUR 60 | 1.00% / 0.87% | 06/20/19 | – | (1 | ) | – | 1 | – | ||||||||||||||||||||
| Liberty Interactive LLC | GSC | USD 50 | 5.00% / 2.40% | 12/20/19 | 5 | – | 6 | 1 | – | |||||||||||||||||||||
| Rite Aid Corp. | GSC | USD 15 | 5.00% / 3.41% | 12/20/19 | 1 | – | 1 | – | – | |||||||||||||||||||||
| Ryland Group, Inc. | DEUT | USD 75 | 5.00% / 2.52% | 09/20/19 | 6 | – | 8 | 2 | – | |||||||||||||||||||||
| Ryland Group, Inc. | DEUT | USD 50 | 5.00% / 2.64% | 12/20/19 | 5 | – | 6 | 1 | – | |||||||||||||||||||||
| Tenet Healthcare Corp. | MSC | USD 50 | 5.00% / 2.72% | 12/20/19 | 3 | – | 5 | 2 | – | |||||||||||||||||||||
| Total | $ | 44 | $ | (1 | ) | $ | 52 | $ | 9 | $ | – | |||||||||||||||||||
| Total single-name issues | $ | 45 | $ | (41 | ) | $ | 8 | $ | 9 | $ | (5 | ) | ||||||||||||||||||
| $ | 402 | $ | (134 | ) | $ | 255 | $ | 50 | $ | (63 | ) | |||||||||||||||||||
| (a) | The maximum potential amount the Fund could be required to pay as a seller of credit protection or receive as a buyer of credit protection if a credit event occurs as defined under the terms of that particular swap agreement. |
| (b) | Implied credit spreads, utilized in determining the market value of credit default swap agreements on corporate issues, U.S. municipal issues or sovereign government issues as of period end serve as an indicator of the current status of the payment/performance risk and represent the likelihood of risk of default for the credit derivative. The implied credit spread of a particular entity reflects the cost of buying/selling protection and may include upfront payments required to be made to enter into the agreement. Wider credit spreads represent a deterioration of the reference entity's credit soundness and a greater likelihood or risk of default or other credit event occurring as defined under the terms of the agreement. The percentage shown is the implied credit spread on October 31, 2014. For credit default swap agreements on indices, the quoted market prices and resulting values serve as the indicator of the current status of the payment/performance risk. |
The accompanying notes are an integral part of these financial statements.
| 11 |
| The Hartford Global Alpha Fund |
| Schedule of Investments – (continued) |
| October 31, 2014 |
| (000’s Omitted) |
Centrally Cleared Credit Default Swap Contracts Outstanding at October 31, 2014
| Clearing | Notional | (Pay)/
Receive Fixed | Expiration | Market | Unrealized Appreciation/ (Depreciation) | Variation Margin | ||||||||||||||||||||||||||||
| Reference Entity | House (a) | Amount (b) | Rate | Date | Cost Basis | Value ╪ | Asset | Liability | Asset | Liability | ||||||||||||||||||||||||
| Credit default swaps on indices: | ||||||||||||||||||||||||||||||||||
| Buy protection: | ||||||||||||||||||||||||||||||||||
| CDX.NA.HY.22 | CME | USD 15 | (5.00 | )% | 06/20/19 | $ | (1 | ) | $ | (1 | ) | $ | – | $ | – | $ | – | $ | – | |||||||||||||||
| (a) | The FCM to the contracts is GSC. |
| (b) | The maximum potential amount the Fund could be required to pay as a seller of credit protection or receive as a buyer of credit protection if a credit event occurs as defined under the terms of that particular swap agreement. |
OTC Interest Rate Swap Contracts Outstanding at October 31, 2014
| Payments made | Payments received | Notional | Expiration | Upfront Premiums | Upfront Premiums | Market | Unrealized Appreciation/(Depreciation) | |||||||||||||||||||||||||
| Counterparty | by Fund | by Fund | Amount | Date | Paid | Received | Value ╪ | Asset | Liability | |||||||||||||||||||||||
| CBK | 6M WIBOR PLN | 1.66% Fixed | PLN | 865 | 12/17/16 | $ | – | $ | – | $ | – | $ | – | $ | – | |||||||||||||||||
| DEUT | KRW CD KSDA | 2.36% Fixed | KRW | 280,240 | 12/17/19 | – | – | 2 | 2 | – | ||||||||||||||||||||||
| DEUT | KRW CD KSDA | 2.41% Fixed | KRW | 585,235 | 12/17/19 | – | – | 5 | 5 | – | ||||||||||||||||||||||
| DEUT | KRW CD KSDA | 2.51% Fixed | KRW | 202,900 | 12/17/19 | – | – | 3 | 3 | – | ||||||||||||||||||||||
| DEUT | KRW CD KSDA | 2.76% Fixed | KRW | 99,620 | 12/17/24 | – | – | 2 | 2 | – | ||||||||||||||||||||||
| DEUT | KRW CD KSDA | 2.85% Fixed | KRW | 262,995 | 12/17/24 | – | – | 8 | 8 | – | ||||||||||||||||||||||
| JPM | 6M WIBOR PLN | 1.67% Fixed | PLN | 850 | 12/17/16 | – | – | – | – | – | ||||||||||||||||||||||
| JPM | KRW CD KSDA | 2.21% Fixed | KRW | 210,185 | 12/17/19 | – | – | – | – | – | ||||||||||||||||||||||
| JPM | KRW CD KSDA | 2.39% Fixed | KRW | 467,075 | 12/17/19 | – | – | 3 | 3 | – | ||||||||||||||||||||||
| JPM | KRW CD KSDA | 2.51% Fixed | KRW | 200,650 | 12/17/19 | – | – | 3 | 3 | – | ||||||||||||||||||||||
| JPM | KRW CD KSDA | 2.60% Fixed | KRW | 744,685 | 12/17/19 | – | – | 13 | 13 | – | ||||||||||||||||||||||
| Total | $ | – | $ | – | $ | 39 | $ | 39 | $ | – | ||||||||||||||||||||||
Centrally Cleared Interest Rate Swap Contracts Outstanding at October 31, 2014
| Clearing | Payments made | Payments received | Notional | Expiration | Upfront Premiums Paid | Market | Unrealized Appreciation/ (Depreciation) | Variation Margin | ||||||||||||||||||||||||||||
| House (a) | by Fund | by Fund | Amount | Date | (Received) | Value ╪ | Asset | Liability | Asset | Liability | ||||||||||||||||||||||||||
| LCH | 6M EURIBOR | 2.00% Fixed | EUR | 500 | 12/18/24 | $ | 3 | $ | 7 | $ | 4 | $ | – | $ | – | $ | – | |||||||||||||||||||
| LCH | 6M GBP LIBOR | 2.13% Fixed | GBP | 815 | 12/21/18 | – | (1 | ) | – | (1 | ) | – | (1 | ) | ||||||||||||||||||||||
| LCH | 6M GBP LIBOR | 2.34% Fixed | GBP | 1,385 | 12/18/20 | – | (7 | ) | – | (7 | ) | – | – | |||||||||||||||||||||||
| LCH | 6M GBP LIBOR | 2.45% Fixed | GBP | 11,535 | 12/21/18 | 75 | 96 | 21 | – | – | (13 | ) | ||||||||||||||||||||||||
| LCH | 6M GBP LIBOR | 2.53% Fixed | GBP | 1,380 | 12/18/20 | – | (4 | ) | – | (4 | ) | – | (1 | ) | ||||||||||||||||||||||
| Total | $ | 78 | $ | 91 | $ | 25 | $ | (12 | ) | $ | – | $ | (15 | ) | ||||||||||||||||||||||
| (a) | The FCM to the contracts is GSC. |
| Foreign Currency Contracts Outstanding at October 31, 2014 |
| Unrealized Appreciation/(Depreciation) | ||||||||||||||||||||||
| Currency | Buy / Sell | Delivery Date | Counterparty | Contract Amount | Market Value ╪ | Asset | Liability | |||||||||||||||
| AUD | Buy | 11/28/2014 | BOA | $ | 206 | $ | 204 | $ | – | $ | (2 | ) | ||||||||||
| AUD | Buy | 11/28/2014 | GSC | 22 | 22 | – | – | |||||||||||||||
| AUD | Buy | 11/28/2014 | JPM | 152 | 152 | – | – | |||||||||||||||
| AUD | Buy | 11/28/2014 | JPM | 179 | 178 | – | (1 | ) | ||||||||||||||
| AUD | Buy | 11/28/2014 | NAB | 22 | 22 | – | – | |||||||||||||||
| AUD | Sell | 11/28/2014 | CBA | 101 | 101 | – | – | |||||||||||||||
| AUD | Sell | 11/28/2014 | NAB | 1,164 | 1,170 | – | (6 | ) | ||||||||||||||
| AUD | Sell | 11/28/2014 | UBS | 22 | 22 | – | – | |||||||||||||||
| BRL | Buy | 11/04/2014 | GSC | 22 | 22 | – | – | |||||||||||||||
The accompanying notes are an integral part of these financial statements.
| 12 |
| The Hartford Global Alpha Fund |
| Schedule of Investments – (continued) |
| October 31, 2014 |
| (000’s Omitted) |
| Foreign Currency Contracts Outstanding at October 31, 2014 - (continued) |
| Unrealized Appreciation/(Depreciation) | ||||||||||||||||||||||
| Currency | Buy / Sell | Delivery Date | Counterparty | Contract Amount | Market Value ╪ | Asset | Liability | |||||||||||||||
| BRL | Buy | 11/04/2014 | UBS | $ | 14 | $ | 14 | $ | – | $ | – | |||||||||||
| BRL | Buy | 11/04/2014 | UBS | 106 | 105 | – | (1 | ) | ||||||||||||||
| BRL | Buy | 12/02/2014 | UBS | 23 | 22 | – | (1 | ) | ||||||||||||||
| BRL | Sell | 11/04/2014 | SCB | 82 | 81 | 1 | – | |||||||||||||||
| BRL | Sell | 11/04/2014 | UBS | 62 | 60 | 2 | – | |||||||||||||||
| BRL | Sell | 12/02/2014 | UBS | 114 | 112 | 2 | – | |||||||||||||||
| CAD | Buy | 11/28/2014 | BMO | 27 | 27 | – | – | |||||||||||||||
| CAD | Buy | 11/28/2014 | BOA | 27 | 27 | – | – | |||||||||||||||
| CAD | Buy | 11/28/2014 | RBC | 106 | 105 | – | (1 | ) | ||||||||||||||
| CAD | Sell | 11/28/2014 | BOA | 27 | 27 | – | – | |||||||||||||||
| CHF | Buy | 11/28/2014 | HSBC | 76 | 75 | – | (1 | ) | ||||||||||||||
| CHF | Sell | 11/28/2014 | HSBC | 229 | 227 | 2 | – | |||||||||||||||
| CLP | Buy | 11/28/2014 | UBS | 35 | 36 | 1 | – | |||||||||||||||
| CLP | Sell | 11/28/2014 | BNP | 25 | 25 | – | – | |||||||||||||||
| CNH | Buy | 11/28/2014 | JPM | 23 | 23 | – | – | |||||||||||||||
| CNH | Sell | 11/28/2014 | HSBC | 222 | 222 | – | – | |||||||||||||||
| COP | Sell | 11/28/2014 | UBS | 31 | 31 | – | – | |||||||||||||||
| DKK | Sell | 11/17/2014 | BOA | 1,063 | 977 | 86 | – | |||||||||||||||
| EUR | Buy | 11/28/2014 | BCLY | 185 | 182 | – | (3 | ) | ||||||||||||||
| EUR | Buy | 11/28/2014 | CBA | 300 | 296 | – | (4 | ) | ||||||||||||||
| EUR | Buy | 11/28/2014 | DEUT | 145 | 143 | – | (2 | ) | ||||||||||||||
| EUR | Buy | 11/28/2014 | HSBC | 76 | 75 | – | (1 | ) | ||||||||||||||
| EUR | Buy | 11/28/2014 | JPM | 31 | 31 | – | – | |||||||||||||||
| EUR | Buy | 11/28/2014 | JPM | 72 | 71 | – | (1 | ) | ||||||||||||||
| EUR | Buy | 11/28/2014 | UBS | 154 | 153 | – | (1 | ) | ||||||||||||||
| EUR | Buy | 11/28/2014 | WEST | 109 | 108 | – | (1 | ) | ||||||||||||||
| EUR | Sell | 11/28/2014 | GSC | 44 | 44 | – | – | |||||||||||||||
| EUR | Sell | 11/28/2014 | JPM | 1,875 | 1,856 | 19 | – | |||||||||||||||
| GBP | Buy | 11/28/2014 | BOA | 102 | 101 | – | (1 | ) | ||||||||||||||
| GBP | Buy | 11/28/2014 | CBK | 29 | 29 | – | – | |||||||||||||||
| GBP | Buy | 11/28/2014 | SSG | 302 | 299 | – | (3 | ) | ||||||||||||||
| GBP | Sell | 11/28/2014 | BOA | 101 | 101 | – | – | |||||||||||||||
| GBP | Sell | 11/28/2014 | CBK | 953 | 952 | 1 | – | |||||||||||||||
| GBP | Sell | 11/28/2014 | HSBC | 150 | 150 | – | – | |||||||||||||||
| GBP | Sell | 11/28/2014 | UBS | 16 | 16 | – | – | |||||||||||||||
| HUF | Buy | 11/28/2014 | BCLY | 17 | 17 | – | – | |||||||||||||||
| HUF | Sell | 11/28/2014 | JPM | 17 | 17 | – | – | |||||||||||||||
| ILS | Buy | 11/28/2014 | GSC | 25 | 25 | – | – | |||||||||||||||
| ILS | Sell | 11/28/2014 | JPM | 33 | 33 | – | – | |||||||||||||||
| INR | Sell | 11/28/2014 | JPM | 34 | 34 | – | – | |||||||||||||||
| JPY | Buy | 11/28/2014 | BCLY | 21 | 20 | – | (1 | ) | ||||||||||||||
| JPY | Buy | 11/28/2014 | JPM | 44 | 44 | – | – | |||||||||||||||
| JPY | Buy | 11/28/2014 | RBS | 1,386 | 1,333 | – | (53 | ) | ||||||||||||||
| JPY | Sell | 11/28/2014 | BCLY | 21 | 20 | 1 | – | |||||||||||||||
| JPY | Sell | 11/28/2014 | JPM | 295 | 295 | – | – | |||||||||||||||
| JPY | Sell | 11/28/2014 | RBS | 30 | 29 | 1 | – | |||||||||||||||
| KRW | Sell | 11/28/2014 | BCLY | 100 | 99 | 1 | – | |||||||||||||||
| KRW | Sell | 11/28/2014 | BNP | 32 | 32 | – | – | |||||||||||||||
| KRW | Sell | 11/28/2014 | HSBC | 1,436 | 1,421 | 15 | – | |||||||||||||||
| MXN | Buy | 11/28/2014 | MSC | 33 | 33 | – | – | |||||||||||||||
| MXN | Buy | 11/28/2014 | MSC | 25 | 25 | – | – | |||||||||||||||
| MXN | Sell | 11/28/2014 | BCLY | 25 | 25 | – | – | |||||||||||||||
| MXN | Sell | 11/28/2014 | MSC | 304 | 306 | – | (2 | ) | ||||||||||||||
| MXN | Sell | 11/28/2014 | UBS | 25 | 25 | – | – | |||||||||||||||
| MYR | Sell | 11/28/2014 | HSBC | 61 | 61 | – | – | |||||||||||||||
| NOK | Buy | 11/28/2014 | GSC | 19 | 19 | – | – | |||||||||||||||
| NOK | Buy | 11/28/2014 | JPM | 101 | 101 | – | – | |||||||||||||||
| NOK | Sell | 11/28/2014 | CBK | 108 | 105 | 3 | – | |||||||||||||||
| NOK | Sell | 11/28/2014 | JPM | 19 | 19 | – | – | |||||||||||||||
The accompanying notes are an integral part of these financial statements.
| 13 |
|
The Hartford Global Alpha Fund |
| Schedule of Investments – (continued) |
| October 31, 2014 |
| (000’s Omitted) |
| Foreign Currency Contracts Outstanding at October 31, 2014 - (continued) |
| Unrealized Appreciation/(Depreciation) | ||||||||||||||||||||||
| Currency | Buy / Sell | Delivery Date | Counterparty | Contract Amount | Market Value ╪ | Asset | Liability | |||||||||||||||
| NOK | Sell | 11/28/2014 | JPM | $ | 46 | $ | 46 | $ | – | $ | – | |||||||||||
| NOK | Sell | 11/28/2014 | MSC | 2 | 2 | – | – | |||||||||||||||
| NZD | Buy | 11/28/2014 | BCLY | 20 | 19 | – | (1 | ) | ||||||||||||||
| NZD | Buy | 11/28/2014 | JPM | 218 | 218 | – | – | |||||||||||||||
| NZD | Sell | 11/28/2014 | BOA | 99 | 99 | – | – | |||||||||||||||
| NZD | Sell | 11/28/2014 | JPM | 302 | 300 | 2 | – | |||||||||||||||
| NZD | Sell | 11/28/2014 | MSC | 100 | 99 | 1 | – | |||||||||||||||
| NZD | Sell | 11/28/2014 | NAB | 39 | 39 | – | – | |||||||||||||||
| NZD | Sell | 11/28/2014 | WEST | 1,462 | 1,448 | 14 | – | |||||||||||||||
| PEN | Sell | 11/28/2014 | UBS | 56 | 56 | – | – | |||||||||||||||
| PLN | Buy | 11/28/2014 | JPM | 202 | 200 | – | (2 | ) | ||||||||||||||
| PLN | Buy | 11/28/2014 | UBS | 25 | 25 | – | – | |||||||||||||||
| PLN | Sell | 11/28/2014 | BCLY | 25 | 25 | – | – | |||||||||||||||
| PLN | Sell | 11/28/2014 | HSBC | 258 | 256 | 2 | – | |||||||||||||||
| RUB | Sell | 11/28/2014 | HSBC | 82 | 79 | 3 | – | |||||||||||||||
| RUB | Sell | 11/28/2014 | JPM | 21 | 20 | 1 | – | |||||||||||||||
| SEK | Buy | 11/28/2014 | CSFB | 435 | 427 | – | (8 | ) | ||||||||||||||
| SEK | Sell | 11/28/2014 | BCLY | 26 | 26 | – | – | |||||||||||||||
| SEK | Sell | 11/28/2014 | BOA | 116 | 115 | 1 | – | |||||||||||||||
| SEK | Sell | 11/28/2014 | JPM | 15 | 15 | – | – | |||||||||||||||
| SEK | Sell | 11/28/2014 | SSG | 303 | 300 | 3 | – | |||||||||||||||
| SGD | Buy | 11/28/2014 | HSBC | 8 | 8 | – | – | |||||||||||||||
| SGD | Sell | 11/28/2014 | HSBC | 307 | 304 | 3 | – | |||||||||||||||
| TRY | Buy | 11/28/2014 | BCLY | 33 | 33 | – | – | |||||||||||||||
| TRY | Buy | 11/28/2014 | BOA | 207 | 206 | – | (1 | ) | ||||||||||||||
| TRY | Buy | 11/28/2014 | CBK | 40 | 40 | – | – | |||||||||||||||
| TRY | Buy | 11/28/2014 | GSC | 22 | 22 | – | – | |||||||||||||||
| TRY | Buy | 11/28/2014 | UBS | 13 | 13 | – | – | |||||||||||||||
| TRY | Sell | 11/28/2014 | CBK | 205 | 206 | – | (1 | ) | ||||||||||||||
| TWD | Sell | 11/28/2014 | HSBC | 58 | 58 | – | – | |||||||||||||||
| ZAR | Buy | 11/28/2014 | CBK | 10 | 10 | – | – | |||||||||||||||
| ZAR | Sell | 11/28/2014 | BCLY | 15 | 15 | – | – | |||||||||||||||
| ZAR | Sell | 11/28/2014 | DEUT | 131 | 129 | 2 | – | |||||||||||||||
| Total | $ | 167 | $ | (99 | ) | |||||||||||||||||
| ╪ | See Significant Accounting Policies of accompanying Notes to Financial Statements regarding valuation of securities. |
The accompanying notes are an integral part of these financial statements.
| 14 |
| The Hartford Global Alpha Fund |
| Schedule of Investments – (continued) |
| October 31, 2014 |
| (000’s Omitted) |
| GLOSSARY: (abbreviations used in preceding Schedule of Investments) | |
| Counterparty Abbreviations: | |
| BCLY | Barclays |
| BMO | Bank of Montreal |
| BNP | BNP Paribas Securities Services |
| BOA | Banc of America Securities LLC |
| CBA | Commonwealth Bank of Australia |
| CBK | Citibank NA |
| CME | Chicago Mercantile Exchange |
| CSFB | Credit Suisse First Boston Corp. |
| CSI | Credit Suisse International |
| DEUT | Deutsche Bank Securities, Inc. |
| FCM | Futures Commission Merchant |
| GSC | Goldman Sachs & Co. |
| HSBC | HSBC Bank USA |
| JPM | JP Morgan Chase & Co. |
| LCH | LCH Clearnet |
| MSC | Morgan Stanley |
| NAB | National Australia Bank Limited |
| RBC | RBC Dominion Securities, Inc. |
| RBS | RBS Greenwich Capital |
| SCB | Standard Chartered Bank |
| SSG | State Street Global Markets LLC |
| UBS | UBS AG |
| WEST | Westpac International |
| Currency Abbreviations: | |
| AUD | Australian Dollar |
| BRL | Brazilian Real |
| CAD | Canadian Dollar |
| CHF | Swiss Franc |
| CLP | Chilean Peso |
| CNH | Chinese Yuan Renminbi - Hong Kong |
| CNY | Chinese Yuan Renminbi |
| COP | Colombian Peso |
| DKK | Danish Krone |
| EUR | EURO |
| GBP | British Pound |
| HUF | Hungarian Forint |
| ILS | Israeli New Shekel |
| INR | Indian Rupee |
| JPY | Japanese Yen |
| KRW | South Korean Won |
| MXN | Mexican New Peso |
| MYR | Malaysian Ringgit |
| NOK | Norwegian Krone |
| NZD | New Zealand Dollar |
| PEN | Peruvian New Sol |
| PLN | Polish New Zloty |
| RUB | Russian New Ruble |
| SEK | Swedish Krona |
| SGD | Singapore Dollar |
| TRY | Turkish New Lira |
| TWD | Taiwan Dollar |
| USD | U.S. Dollar |
| ZAR | South African Rand |
| Index Abbreviations: | |
| ABX.HE | Markit Asset Backed Security Home Equity |
| ABX.HE.PEN | Markit Asset Backed Security Home Equity Penultimate |
| CDX.NA.HY | Credit Derivatives North American High Yield |
| CDX.NA.IG | Credit Derivatives North American Investment Grade |
| CMBX.NA | Markit Commercial Mortgage Backed North American |
| ITRAXX.SUB.FIN | Markit iTraxx - Europe Sub Financials |
| PrimeX.ARM | Markit PrimeX Adjustable Rate Mortgage Backed Security |
| PrimeX.FRM | Markit PrimeX Fixed Rate Mortgage Backed Security |
| Other Abbreviations: | |
| CD | Certificate of Deposit |
| CLO | Collateralized Loan Obligation |
| CMS | Constant Maturity Swap |
| CR | Credit |
| EURIBOR | Euro Interbank Offered Rate |
| FHLB | Federal Home Loan Bank |
| FHLMC | Federal Home Loan Mortgage Corp. |
| FNMA | Federal National Mortgage Association |
| FX | Foreign Exchange |
| GNMA | Government National Mortgage Association |
| IR | Interest Rate |
| KSDA | Korea Securities Dealers Association |
| LIBOR | London Interbank Offered Rate |
| OTC | Over-the-Counter |
| WIBOR | Warsaw Interbank Offered Rate |
The accompanying notes are an integral part of these financial statements.
| 15 |
|
The Hartford Global Alpha Fund |
| Schedule of Investments – (continued) |
| October 31, 2014 |
| (000’s Omitted) |
| Investment Valuation Hierarchy Level Summary |
| October 31, 2014 |
| Total | Level 1 ♦ | Level 2 ♦ | Level 3 | |||||||||||||
| Assets: | ||||||||||||||||
| Asset and Commercial Mortgage Backed Securities | $ | 1,111 | $ | – | $ | 1,024 | $ | 87 | ||||||||
| Corporate Bonds | 2,302 | – | 2,302 | – | ||||||||||||
| Foreign Government Obligations | 1,375 | – | 1,375 | – | ||||||||||||
| U.S. Government Securities | 15,424 | – | 15,424 | – | ||||||||||||
| Short-Term Investments | 4,125 | – | 4,125 | – | ||||||||||||
| Purchased Options | 55 | – | 55 | – | ||||||||||||
| Total | $ | 24,392 | $ | – | $ | 24,305 | $ | 87 | ||||||||
| Foreign Currency Contracts * | $ | 167 | $ | – | $ | 167 | $ | – | ||||||||
| Futures * | 76 | 76 | – | – | ||||||||||||
| Swaps - Credit Default * | 50 | – | 50 | – | ||||||||||||
| Swaps - Interest Rate * | 64 | – | 64 | – | ||||||||||||
| Total | $ | 357 | $ | 76 | $ | 281 | $ | – | ||||||||
| Liabilities: | ||||||||||||||||
| Written Options | 2 | – | 2 | – | ||||||||||||
| Total | $ | 2 | $ | – | $ | 2 | $ | – | ||||||||
| Foreign Currency Contracts * | $ | 99 | $ | – | $ | 99 | $ | – | ||||||||
| Futures * | 221 | 221 | – | – | ||||||||||||
| Swaps - Credit Default * | 63 | – | 63 | – | ||||||||||||
| Swaps - Interest Rate * | 12 | – | 12 | – | ||||||||||||
| Total | $ | 395 | $ | 221 | $ | 174 | $ | – | ||||||||
| ♦ | For the year ended October 31, 2014, investments valued at $673 were transferred from Level 1 to Level 2, and there were no transfers from Level 2 to Level 1. Investments are transferred between Level 1 and Level 2 for a variety of reasons including, but not limited to: |
| 1) | Foreign equities for which a fair value price is more representative of exit value than the local market close (transfer into Level 2). Foreign equities for which the local market close is more representative of exit value (transfer into Level 1). |
| 2) | U.S. Treasury securities that no longer represent the most recent issue (transfer into Level 2). |
| 3) | Equity investments with no observable trading but a bid or mean price is used (transfer into Level 2). Equity investments using observable quoted prices in an active market (transfer into Level 1). |
| * | Derivative instruments (excluding purchased and written options, if applicable) are valued at the unrealized appreciation/depreciation on the investments. |
| Following is a reconciliation of Level 3 assets for which significant unobservable inputs were used to determine fair value: |
| Balance
as of October 31, 2013 | Realized Gain (Loss) | Change
in Unrealized Appreciation (Depreciation) | Net Amortization | Purchases | Sales | Transfers Into Level 3 * | Transfers Out of Level 3 * | Balance
as of October 31, 2014 | ||||||||||||||||||||||||||||
| Assets: | ||||||||||||||||||||||||||||||||||||
| Asset & Commercial Mortgage Backed Securities | $ | 196 | $ | 25 | $ | (15 | )† | $ | 4 | $ | 85 | $ | (109 | ) | $ | — | $ | (99 | ) | $ | 87 | |||||||||||||||
| Total | $ | 196 | $ | 25 | $ | (15 | ) | $ | 4 | $ | 85 | $ | (109 | ) | $ | — | $ | (99 | ) | $ | 87 | |||||||||||||||
| * | Investments are transferred into and out of Level 3 for a variety of reasons including, but not limited to: |
| 1) | Investments where trading has been halted (transfer into Level 3) or investments where trading has resumed (transfer out of Level 3). |
| 2) | Broker quoted investments (transfer into Level 3) or quoted prices in active markets (transfer out of Level 3). |
| 3) | Investments that have certain restrictions on trading (transfer into Level 3) or investments where trading restrictions have expired (transfer out of Level 3). |
| † | Change in unrealized appreciation (depreciation) in the current period relating to assets still held at October 31, 2014 was $5. |
| Note: | For purposes of reporting transfers between different hierarchy levels, both transfers in and out of each level, as applicable, are shown as if they occurred at the beginning of the period. |
The accompanying notes are an integral part of these financial statements.
| 16 |
| The Hartford Global Alpha Fund |
| Statement of Assets and Liabilities |
| October 31, 2014 |
| (000’s Omitted) |
| Assets: | ||||
| Investments in securities, at market value (cost $24,480) | $ | 24,392 | ||
| Cash | 468 | * | ||
| Foreign currency on deposit with custodian (cost $6) | 6 | |||
| Unrealized appreciation on foreign currency contracts | 167 | |||
| Unrealized appreciation on OTC swap contracts | 89 | |||
| Receivables: | ||||
| Investment securities sold | 11 | |||
| Fund shares sold | 5 | |||
| Interest | 134 | |||
| Variation margin on financial derivative instruments | 25 | |||
| OTC swap premiums paid | 402 | |||
| Other assets | 10 | |||
| Total assets | 25,709 | |||
| Liabilities: | ||||
| Unrealized depreciation on foreign currency contracts | 99 | |||
| Unrealized depreciation on OTC swap contracts | 63 | |||
| Payables: | ||||
| Investment securities purchased | — | |||
| Fund shares redeemed | 87 | |||
| Investment management fees | 2 | |||
| Administrative fees | — | |||
| Distribution fees | 1 | |||
| Variation margin on financial derivative instruments | 68 | |||
| Accrued expenses | 15 | |||
| OTC swap premiums received | 134 | |||
| Written option contracts (proceeds $1) | 2 | |||
| Other liabilities | 1 | |||
| Total liabilities | 472 | |||
| Net assets | $ | 25,237 | ||
| Summary of Net Assets: | ||||
| Capital stock and paid-in-capital | $ | 26,013 | ||
| Net investment loss | (29 | ) | ||
| Accumulated net realized loss | (620 | ) | ||
| Unrealized depreciation of investments and the translation of assets and liabilities denominated in foreign currency | (127 | ) | ||
| Net assets | $ | 25,237 |
| * | Cash of $458 was pledged as collateral for open financial derivative instruments at October 31, 2014. |
The accompanying notes are an integral part of these financial statements.
| 17 |
|
The Hartford Global Alpha Fund |
| Statement of Assets and Liabilities – (continued) |
| October 31, 2014 |
| (000’s Omitted) |
| Shares authorized | 450,000 | |||
| Par value | $ | 0.001 | ||
| Class A: Net asset value per share/Maximum offering price per share | $9.49/$10.04 | |||
| Shares outstanding | 500 | |||
| Net assets | $ | 4,747 | ||
| Class C: Net asset value per share | $ | 9.36 | ||
| Shares outstanding | 207 | |||
| Net assets | $ | 1,941 | ||
| Class I: Net asset value per share | $ | 9.54 | ||
| Shares outstanding | 258 | |||
| Net assets | $ | 2,460 | ||
| Class R3: Net asset value per share | $ | 9.42 | ||
| Shares outstanding | 200 | |||
| Net assets | $ | 1,883 | ||
| Class R4: Net asset value per share | $ | 9.47 | ||
| Shares outstanding | 200 | |||
| Net assets | $ | 1,894 | ||
| Class R5: Net asset value per share | $ | 9.52 | ||
| Shares outstanding | 200 | |||
| Net assets | $ | 1,905 | ||
| Class Y: Net asset value per share | $ | 9.54 | ||
| Shares outstanding | 1,091 | |||
| Net assets | $ | 10,407 |
The accompanying notes are an integral part of these financial statements.
| 18 |
|
|
| Statement of Operations |
| For the Year Ended October 31, 2014 |
| (000’s Omitted) |
| Investment Income: | ||||
| Interest | $ | 274 | ||
| Less: Foreign tax withheld | (12 | ) | ||
| Total investment income | 262 | |||
| Expenses: | ||||
| Investment management fees | 194 | |||
| Administrative services fees | ||||
| Class R3 | 4 | |||
| Class R4 | 3 | |||
| Class R5 | 2 | |||
| Transfer agent fees | ||||
| Class A | 1 | |||
| Class C | — | |||
| Class I | — | |||
| Class R5 | — | |||
| Class Y | — | |||
| Distribution fees | ||||
| Class A | 15 | |||
| Class C | 20 | |||
| Class R3 | 10 | |||
| Class R4 | 5 | |||
| Custodian fees | 12 | |||
| Accounting services fees | 7 | |||
| Registration and filing fees | 97 | |||
| Board of Directors' fees | 1 | |||
| Audit fees | 11 | |||
| Other expenses | 12 | |||
| Total expenses (before fees paid indirectly) | 394 | |||
| Custodian fee offset | — | |||
| Total fees paid indirectly | — | |||
| Total expenses, net | 394 | |||
| Net Investment Loss | (132 | ) | ||
| Net Realized Loss on Investments, Other Financial Instruments and Foreign Currency Transactions: | ||||
| Net realized gain on investments | 333 | |||
| Net realized loss on purchased option contracts | (95 | ) | ||
| Net realized loss on TBA sale transactions | (40 | ) | ||
| Net realized loss on futures contracts | (405 | ) | ||
| Net realized gain on written option contracts | 25 | |||
| Net realized loss on swap contracts | (127 | ) | ||
| Net realized gain on foreign currency contracts | 248 | |||
| Net realized gain on other foreign currency transactions | 51 | |||
| Net Realized Loss on Investments, Other Financial Instruments and Foreign Currency Transactions | (10 | ) | ||
| Net Changes in Unrealized Appreciation of Investments, Other Financial Instruments and Foreign Currency Transactions: | ||||
| Net unrealized depreciation of investments | (220 | ) | ||
| Net unrealized appreciation of purchased option contracts | 26 | |||
| Net unrealized appreciation of futures contracts | 91 | |||
| Net unrealized depreciation of written option contracts | (9 | ) | ||
| Net unrealized appreciation of swap contracts | 174 | |||
| Net unrealized depreciation of foreign currency contracts | (34 | ) | ||
| Net unrealized depreciation of translation of other assets and liabilities in foreign currencies | (25 | ) | ||
| Net Changes in Unrealized Appreciation of Investments, Other Financial Instruments and Foreign Currency Transactions | 3 | |||
| Net Loss on Investments, Other Financial Instruments and Foreign Currency Transactions | (7 | ) | ||
| Net Decrease in Net Assets Resulting from Operations | $ | (139 | ) |
The accompanying notes are an integral part of these financial statements.
| 19 |
|
|
| Statement of Changes in Net Assets |
| (000’s Omitted) |
| For the Year Ended October 31, 2014 | For the Period December 14, 2012* through October 31, 2013 | |||||||
| Operations: | ||||||||
| Net investment loss | $ | (132 | ) | $ | (211 | ) | ||
| Net realized loss on investments, other financial instruments and foreign currency transactions | (10 | ) | (985 | ) | ||||
| Net unrealized appreciation (depreciation) of investments, other financial instruments and foreign currency transactions | 3 | (130 | ) | |||||
| Net Decrease in Net Assets Resulting from Operations | (139 | ) | (1,326 | ) | ||||
| Capital Share Transactions: | ||||||||
| Class A | (2,609 | ) | 7,692 | |||||
| Class C | (7 | ) | 2,081 | |||||
| Class I | 413 | 2,156 | ||||||
| Class R3 | — | 2,000 | ||||||
| Class R4 | — | 2,000 | ||||||
| Class R5 | — | 2,000 | ||||||
| Class Y | (4,022 | ) | 14,998 | |||||
| Net increase (decrease) from capital share transactions | (6,225 | ) | 32,927 | |||||
| Net Increase (Decrease) in Net Assets | (6,364 | ) | 31,601 | |||||
| Net Assets: | ||||||||
| Beginning of period | 31,601 | — | ||||||
| End of period | $ | 25,237 | $ | 31,601 | ||||
| Undistributed (distributions in excess of) net investment income | $ | (29 | ) | $ | (678 | ) | ||
* Commencement of operations.
The accompanying notes are an integral part of these financial statements.
| 20 |
| The Hartford Global Alpha Fund |
| Notes to Financial Statements |
| October 31, 2014 |
| (000’s Omitted) |
Organization:
The Hartford Mutual Funds, Inc. (“Company”) is an open-end management investment company comprised of forty-two portfolios. Financial statements for The Hartford Global Alpha Fund (the "Fund"), a series of the Company, are included in this report.
The Company is organized under the laws of the State of Maryland and is registered with the Securities and Exchange Commission (“SEC”) under the Investment Company Act of 1940, as amended (“1940 Act”). The Fund is a diversified open-end management investment company. The Fund is an investment company and applies specialized accounting and reporting under Accounting Standards Codification Topic 946, Financial Services - Investment Companies.
Class A shares are sold with a front-end sales charge of up to 5.50%. Class C shares are sold with a contingent deferred sales charge of up to 1.00% on shares redeemed within twelve months of purchase. Class I shares are sold without sales charges to certain eligible investors primarily through advisory fee-based wrap programs. Class R3, R4 and R5 shares, which are offered to employer-sponsored retirement plans, and Class Y shares, which are sold to certain eligible institutional investors, are sold without a sales charge. All classes of shares have identical voting, redemption, dividend, liquidation and other rights and the same terms and conditions, with the exceptions that each class may have different expenses, which may affect performance.
Significant Accounting Policies:
The following is a summary of significant accounting policies of the Fund in the preparation of its financial statements, which are in accordance with United States generally accepted accounting principles (“U.S. GAAP”). The preparation of financial statements in accordance with U.S. GAAP may require management to make estimates and assumptions that affect the reported amounts of assets and liabilities and disclosure of contingent assets and liabilities at the date of the financial statements and the reported amounts of increases and decreases in net assets from operations during the reporting period. Actual results could differ from those estimates.
Determination of Net Asset Value – The per share net asset value ("NAV") of each class of the Fund's shares is determined as of the close of regular trading (normally 4:00 p.m. Eastern Time) (the “NYSE Close”) on each day that the New York Stock Exchange (the “Exchange”) is open (“Valuation Date”). Information that becomes known to the Fund after the NAV has been calculated on a particular day will not generally be used to retroactively adjust the NAV determined earlier that day.
Investment Valuation and Fair Value Measurements – For purposes of calculating the NAV, portfolio investments and other assets held by the Fund's portfolio for which market quotes are readily available are valued at market value. Market value is generally determined on the basis of last reported sales prices or official close price. If no sales are reported, market value is based on quotes obtained from a quotation reporting system, established market makers, or independent pricing services. If market prices are not readily available or are deemed unreliable, the Fund will use the fair value of the investment as determined in good faith under policies and procedures established by and under the supervision of the Company's Board of Directors. Market quotes are considered not readily available where there is an absence of current or reliable market-based data (e.g., trade information or indicative market quotes), including where events occur after the close of the relevant market, but prior to the NYSE Close, that materially affect the values of the Fund's portfolio investments or assets. In addition, market quotes are considered not readily available when, due to extraordinary circumstances, the exchanges or markets on which the investments trade do not open for trading for the entire day and no other market prices are available. There can be no assurance that the Fund could obtain the fair market value assigned to an investment if the Fund were to sell the investment at approximately the time at which the Fund determines its NAV.
Fixed income investments (other than short-term obligations), non-exchange traded derivatives and centrally cleared swaps held by the Fund are normally valued on the basis of quotes obtained from independent pricing services or brokers and dealers in accordance with procedures established by the Company's Board of Directors. Prices obtained from independent pricing services use information provided by market makers or estimates of market values through accepted market modeling, trading and pricing conventions. Inputs to the models may include, but are not limited to, prepayment speeds, pricing spread, yield, trade information, dealer quotes, market color, cash flow models and the investment’s terms and conditions. Generally, the Fund may use fair valuation in regard to fixed income investments when the Fund holds defaulted or distressed investments or investments in a company in which a reorganization is pending. Short-term investments maturing in 60 days or less are generally valued at amortized cost, if their original term to maturity
| 21 |
| The Hartford Global Alpha Fund |
| Notes to Financial Statements – (continued) |
| October 31, 2014 |
| (000’s Omitted) |
was 60 days or less, or by amortizing their value on the 61st day prior to maturity, if the original term to maturity exceeded 60 days, which approximates fair value.
Exchange traded options, futures and options on futures are valued at the settlement price or last trade price determined by the relevant exchange as of the NYSE Close. If the last trade price for exchange traded options does not fall between the bid and ask prices, the value will be the mean of the bid and ask prices as of the NYSE Close. If a last trade price is not available, the value will be the mean of the bid and ask prices as of the NYSE Close. If a mean of the bid and ask prices cannot be calculated for the day, the value will be the bid price as of the NYSE Close. In the case of over-the-counter ("OTC") options and such instruments that do not trade on an exchange, values may be supplied by a pricing service using a formula or other objective method that may take into consideration the style, direction, expiration, strike price, notional value and volatility or other special adjustments.
Investments valued in currencies other than U.S. dollars are converted to U.S. dollars using exchange rates obtained from independent pricing services for calculation of the NAV. As a result, the NAV of the Fund’s shares may be affected by changes in the value of currencies in relation to the U.S. dollar. The value of investments traded in markets outside the United States or denominated in currencies other than the U.S. dollar may be affected significantly on a day that the NYSE is closed and the market value may change on days when an investor is not able to purchase, redeem or exchange shares of the Fund.
Foreign currency contracts represent agreements to exchange currencies on specific future dates at predetermined rates. Foreign currency contracts are valued using foreign currency exchange rates and forward rates as provided by an independent pricing service on the Valuation Date.
Financial instruments for which prices are not available from an independent pricing service may be valued using market quotations obtained from one or more dealers that make markets in the respective financial instrument in accordance with procedures established by the Company's Board of Directors.
U.S. GAAP defines fair value as the price that the Fund would receive to sell an asset or pay to transfer a liability in an orderly transaction between market participants. The U.S. GAAP fair value measurement standards require disclosure of a fair value hierarchy for each major category of assets and liabilities. Various inputs are used in determining the fair value of the Fund’s investments. These inputs are summarized into three broad hierarchy levels. This hierarchy is based on whether the valuation inputs are observable or unobservable. These levels are:
Level 1 – Quoted prices in active markets for identical investments. Level 1 may include exchange traded instruments, such as domestic equities, some foreign equities, options, futures, mutual funds, exchange traded funds, rights and warrants.
Level 2 – Observable inputs other than Level 1 prices, such as quoted prices for similar investments; quoted prices in markets that are not active; or other inputs that are observable or can be corroborated by observable market data. Level 2 may include debt investments that are traded less frequently than exchange traded instruments and which are valued using independent pricing services; foreign equities, which are principally traded on certain foreign markets and are adjusted daily pursuant to a fair value pricing service in order to reflect an adjustment for the factors occurring after the close of certain foreign markets but before the NYSE Close; senior floating rate interests, which are valued using an aggregate of dealer bids; short-term investments, which are valued at amortized cost; and swaps, which are valued based upon the terms of each swap contract.
Level 3 – Significant unobservable inputs that are supported by limited or no market activity. Level 3 may include financial instruments whose values are determined using indicative market quotes or require significant management judgment or estimation. These unobservable valuation inputs may include estimates for current yields, maturity/duration, prepayment speed, and indicative market quotes for comparable investments along with other assumptions relating to credit quality, collateral value, complexity of the investment structure, general market conditions and liquidity. This category may include investments where trading has been halted or there are certain restrictions on trading. While these investments are priced using unobservable inputs, the valuation of these investments reflects the best available data and management believes the prices are a reasonable representation of exit price.
The Board of Directors of the Company generally reviews and approves the “Procedures for Valuation of Portfolio Securities” at
| 22 |
| The Hartford Global Alpha Fund |
| Notes to Financial Statements – (continued) |
| October 31, 2014 |
| (000’s Omitted) |
least once a year. These procedures define how investments are to be valued, including the formation and activities of a Valuation Committee. The Valuation Committee is responsible for determining in good faith the fair value of investments when the value cannot be obtained from primary pricing services or alternative sources or if the valuation of an investment as provided by the primary pricing service or alternative source is believed not to reflect the investment’s fair value as of the Valuation Date. Voting members of the Valuation Committee include the Fund's Treasurer or designee and a Vice President of the investment manager or designee. An Assistant Vice President of the Fund with legal expertise or designee is also included on the Valuation Committee as a non-voting advisory member. In addition, the Fund’s Chief Compliance Officer shall designate a member of the compliance group to attend Valuation Committee meetings as a non-voting resource, to monitor for and provide guidance with respect to compliance with these procedures. Two members of the Valuation Committee or their designees, representing different departments, shall constitute a quorum for purposes of permitting the Valuation Committee to take action. The Valuation Committee will consider all relevant factors in determining an investment’s fair value, and may seek the advice of the Fund’s sub-adviser, knowledgeable brokers, and legal counsel in making such determination. The Valuation Committee reports to the Audit Committee of the Company's Board of Directors. The Audit Committee receives quarterly written reports which include details of all fair-valued investments, including the reason for the fair valuation, and an indication, when possible, of the accuracy of the valuation by disclosing the next available reliable public price quotation or the disposition price of such investments (the “look-back” test). The Board of Directors then must consider for ratification all of the fair value determinations made during the previous quarter.
Valuation levels are not necessarily indicative of the risk associated with investing in such investments. Individual investments within any of the above mentioned asset classes may be assigned a different hierarchical level than those presented above, as individual circumstances dictate.
For additional information, refer to the Investment Valuation Hierarchy Level Summary and the Level 3 roll-forward reconciliation, if applicable, which follow the Schedule of Investments.
Investment Transactions and Investment Income – Investment transactions are recorded as of the trade date (the date the order to buy or sell is executed) for financial reporting purposes. Investments purchased or sold on a when-issued or delayed-delivery basis may be settled a month or more after the trade date. Realized gains and losses are determined on the basis of identified cost.
Interest income, including amortization of premium, accretion of discounts and additional principal received in-kind in lieu of cash, is accrued on a daily basis. Paydown gains and losses on mortgage related and other asset backed securities are included in interest income in the Statement of Operations.
Foreign Currency Transactions – Assets and liabilities denominated in currencies other than U.S. dollars are translated into U.S. dollars at the exchange rates in effect on the valuation date. Purchases and sales of investments, income and expenses are translated into U.S. dollars at the exchange rates on the dates of such transactions.
The Fund does not isolate that portion of portfolio investment valuation resulting from fluctuations in the foreign currency exchange rates from the fluctuations arising from changes in the market prices of investments held. Exchange rate fluctuations are included with the net realized and unrealized gain or loss on investments in the accompanying financial statements.
Net realized foreign exchange gains or losses arise from sales of foreign currencies and the difference between asset and liability amounts initially stated in foreign currencies and the U.S. dollar value of the amounts actually received or paid. Net unrealized foreign exchange gains or losses arise from changes in the value of other assets and liabilities at the end of the reporting period, resulting from changes in the exchange rates.
Joint Trading Account – The Fund may invest cash balances into a joint trading account that may be invested in one or more repurchase agreements.
Fund Share Valuation and Dividend Distributions to Shareholders – Orders for the Fund’s shares are executed in accordance with the investment instructions of the shareholders. The NAV of the Fund’s shares is determined as of the close of business on each business day of the Exchange. The NAV is determined separately for each class of shares of the Fund by dividing the Fund’s net
| 23 |
| The Hartford Global Alpha Fund |
| Notes to Financial Statements – (continued) |
| October 31, 2014 |
| (000’s Omitted) |
assets attributable to that class by the number of shares of the class outstanding. Each class of shares offered by the Fund has equal rights as to assets and voting privileges (except that shareholders of a class have exclusive voting rights regarding any matter relating solely to that class of shares). Income and non-class specific expenses are allocated daily to each class on the basis of the relative net assets of the class. Realized and unrealized gains and losses are allocated daily based on the relative net assets of each class of shares of the Fund.
Orders for the purchase of the Fund’s shares received prior to the close of the Exchange on any day the Exchange is open for business are priced at the NAV determined as of the close of the Exchange. Orders received after the close of the Exchange, or on a day on which the Exchange and/or the Fund is not open for business, are priced at the next determined NAV.
Dividends are declared pursuant to a policy adopted by the Company's Board of Directors based upon the investment performance of the Fund. The policy of the Fund is to pay dividends from net investment income and realized gains, if any, at least once a year.
Net investment income, dividends and distributions from net realized gains and capital are determined in accordance with federal income tax regulations, which may differ from U.S. GAAP with respect to character and timing (see Federal Income Taxes: Distributions and Components of Distributable Earnings and Reclassification of Capital Accounts).
Securities and Other Investments:
Repurchase Agreements – A repurchase agreement is an agreement by which a counterparty agrees to sell an investment and agrees to repurchase the investment sold from the buyer at a mutually agreed upon time and price. During the period of the repurchase agreement, the counterparty will deposit cash and or securities in a third party custodial account to serve as collateral. At the time the Fund enters into a repurchase agreement, the value of the underlying collateral, including accrued interest, will be equal to or exceed the value of the repurchase agreement. Repurchase agreements expose the Fund to counterparty risk - that is, the risk that the counterparty will not fulfill its obligations. To minimize counterparty risk, the investments that serve to collateralize the repurchase agreement are held by the Fund’s custodian in book entry or physical form in the custodial account of the Fund or in a third party custodial account. Repurchase agreements are valued at cost plus accrued interest, which approximates fair value. Repurchase agreements have master netting arrangements which allow the Fund to offset amounts owed to a counterparty with amounts owed by the counterparty, including any collateral. Upon an event of default under a master repurchase agreement, the non-defaulting party may close out all transactions traded under such agreement and net amounts owed under each transaction to one net amount payable by one party to the other. Absent an event of default, the master repurchase agreement does not result in an offset of reported amounts of assets and liabilities in the Statement of Assets and Liabilities across transactions between the Fund and the applicable counterparty. The Fund, as shown on the Schedule of Investments, had outstanding repurchase agreements and related collateral as of October 31, 2014.
Illiquid and Restricted Investments – The Fund is permitted to invest up to 15% of its net assets in illiquid investments. Illiquid investments are those that may not be sold or disposed of in the ordinary course of business within seven days, at approximately the price used to determine the Fund’s NAV. The Fund may not be able to sell illiquid investments when its sub-adviser considers it desirable to do so or may have to sell such investments at a price that is lower than the price that could be obtained if the investments were more liquid. A sale of illiquid investments may require more time and may result in higher dealer discounts and other selling expenses than does the sale of those that are liquid. Illiquid investments also may be more difficult to value due to the unavailability of reliable market quotations for such investments, and an investment in them may have an adverse impact on the Fund’s NAV. The Fund may also purchase certain restricted investments that can only be resold to certain qualified investors and may be determined to be liquid pursuant to policies and guidelines established by the Company's Board of Directors. The Fund, as shown on the Schedule of Investments, had illiquid or restricted investments as of October 31, 2014.
Investments Purchased on a When-Issued or Delayed-Delivery Basis – Delivery and payment for investments that have been purchased by the Fund on a forward commitment, or when-issued or delayed-delivery basis, take place beyond the customary settlement period. The Fund may dispose of or renegotiate a delayed-delivery transaction after it is entered into, and may sell delayed-delivery investments before they are delivered, which may result in a realized gain or loss. During this period, such investments are subject to market fluctuations, and the Fund identifies investments segregated in its records with a value at least equal to the amount of the commitment. The Fund had no when-issued or delayed-delivery investments as of October 31, 2014.
| 24 |
| The Hartford Global Alpha Fund |
| Notes to Financial Statements – (continued) |
| October 31, 2014 |
| (000’s Omitted) |
In connection with the Fund’s ability to purchase investments on a when-issued or forward commitment basis, the Fund may enter into to-be announced (“TBA”) commitments. TBA commitments are forward agreements for the purchase or sale of mortgage backed securities for a fixed price, with payment and delivery on an agreed-upon future settlement date. The specific securities to be delivered are not identified at the trade date; however, delivered securities must meet specified terms, including issuer, rate and mortgage terms. Although the Fund may enter into TBA commitments with the intention of acquiring or delivering securities for its portfolio, the Fund can extend the settlement date, roll the transaction, or dispose of a commitment prior to settlement if deemed appropriate to do so. If the TBA commitment is closed through the acquisition of an offsetting TBA commitment, the Fund realizes a gain or loss. In a TBA roll transaction, the Fund generally purchases or sells the initial TBA commitment prior to the agreed upon settlement date and enters into a new TBA commitment for future delivery or receipt of the mortgage backed securities. TBA commitments involve a risk of loss if the value of the security to be purchased or sold declines or increases, respectively, prior to settlement date.
The Fund may enter into “dollar rolls” in which the Fund sells securities and contracts with the same counterparty to repurchase substantially similar securities (for example, same issuer, coupon and maturity) on a specified future date at an agreed upon price. The Fund gives up the right to receive interest paid on the investments sold. The Fund would benefit to the extent of any differences between the price received for the security and the lower forward price for the future purchase. Dollar rolls involve the risk that the market value of the securities that the Fund is required to purchase may decline below the agreed upon repurchase price of those securities. The Fund records dollar roll transactions as purchases and sales and realizes gains and losses on these transactions. These transactions are excluded from the Fund’s portfolio turnover rate. The Fund had no open TBA commitments or dollar rolls as of October 31, 2014.
Mortgage Related and Other Asset Backed Securities – The Fund may invest in mortgage related and other asset backed securities. These securities include mortgage pass-through securities, collateralized mortgage obligations, commercial mortgage backed securities, stripped mortgage backed securities, asset backed securities, collateralized debt obligations and other securities that directly or indirectly represent a participation in, or are secured by and payable from, mortgage loans on real property. Mortgage related securities are created from pools of residential or commercial mortgage loans, including mortgage loans made by savings and loan institutions, mortgage bankers, commercial banks and other similar financial institutions. Asset backed securities are created from many types of assets, including auto loans, credit card receivables, home equity loans, and student loans. These securities provide a monthly payment that consists of both interest and principal payments. Interest payments may be determined by fixed or adjustable rates. The rate of pre-payments on underlying mortgages will affect the price and volatility of a mortgage related security, and may have the effect of shortening or extending the effective duration of the security relative to what was anticipated at the time of purchase. The timely payment of principal and interest of certain mortgage related securities is guaranteed by the full faith and credit of the United States Government. Mortgage related and other asset backed securities created and guaranteed by non-governmental issuers, including government-sponsored corporations, may be supported by various forms of insurance or guarantees, but there can be no assurance that the private insurers or guarantors can meet their obligations under the insurance policies or guarantee arrangements. The Fund, as shown on the Schedule of Investments, had outstanding mortgage related and other asset backed securities as of October 31, 2014.
Inflation Indexed Bonds – The Fund may invest in inflation indexed bonds. Inflation indexed bonds are fixed income investments whose principal value is periodically adjusted to the rate of inflation. The interest rate on these bonds is generally fixed at issuance at a rate lower than typical bonds. Over the life of an inflation indexed bond, however, interest will be paid based on a principal value, which is adjusted for inflation. Any increase or decrease in the principal amount of an inflation indexed bond will be included as interest income on the Statement of Operations, even though investors do not receive the principal amount until maturity. The Fund had no inflation indexed bonds as of October 31, 2014.
Financial Derivative Instruments:
The following disclosures contain information on how and why the Fund uses derivative instruments, the credit-risk-related contingent features in certain derivative instruments and how derivative instruments affect the Fund’s financial position and results of operations. The location and fair value amounts of these instruments on the Statement of Assets and Liabilities and the realized gains and losses and changes in unrealized gains and losses on the Statement of Operations, each categorized by type of derivative contract, are included in the following Additional Derivative Instrument Information footnote. The derivative instruments outstanding as of year-end are disclosed in
| 25 |
| The Hartford Global Alpha Fund |
| Notes to Financial Statements – (continued) |
| October 31, 2014 |
| (000’s Omitted) |
the notes to the Schedule of Investments, if applicable. The amounts of realized gains and losses and changes in unrealized gains and losses on derivative instruments during the year are disclosed in the Statement of Operations.
Foreign Currency Contracts – The Fund may enter into foreign currency contracts that obligate the Fund to purchase or sell currencies at specified future dates. Foreign currency contracts are used to hedge the currency exposure associated with some or all of the Fund’s investments and/or as part of an investment strategy. Foreign currency contracts are marked to market daily and the change in value is recorded by the Fund as an unrealized gain or loss. The Fund will record a realized gain or loss when the foreign currency contract is settled.
Foreign currency contracts involve elements of market risk in excess of the amounts reflected in the Statement of Assets and Liabilities. In addition, risks may arise upon entering into these contracts from the potential inability of the counterparties to meet the terms of the contracts and from unanticipated movements in the value of the foreign currencies relative to the U.S. dollar. The Fund, as shown on the Schedule of Investments, had outstanding foreign currency contracts as of October 31, 2014.
Futures Contracts – The Fund may enter into futures contracts. A futures contract is an agreement between two parties to buy or sell an asset at a set price on a future date. The Fund uses futures contracts to manage or obtain exposure to the investment markets, commodities, or movements in interest rates and currency values. The primary risks associated with the use of futures contracts are the imperfect correlation between the change in market value of the investments held by the Fund and the prices of futures contracts and the possibility of an illiquid market. Upon entering into a futures contract, the Fund is required to deposit with a futures commission merchant (“FCM”) an amount of cash or U.S. Government or Agency Obligations in accordance with the initial margin requirements of the broker or exchange. Futures contracts are marked to market daily at the most recent settlement price reported by an exchange on which, over time, they are traded most extensively, and an appropriate payable or receivable for the change in value (“variation margin”) is recorded by the Fund. Gains or losses are recognized but not considered realized until the contracts expire or are closed. Futures contracts involve, to varying degrees, risk of loss in excess of the variation margin disclosed on the Statement of Assets and Liabilities; however, the Fund seeks to reduce this risk through the use of an FCM. The Fund, as shown on the Schedule of Investments, had outstanding futures contracts as of October 31, 2014.
Options Contracts – An option contract is a contract sold by one party to another party that offers the buyer the right, but not the obligation, to buy (call) or sell (put) an investment or other financial asset at an agreed-upon price during a specific period of time or on a specific date. Options contracts are either privately negotiated in the over-the-counter market ("OTC options") or executed in a registered exchange ("exchange traded options"). The Fund may write (sell) covered call and put options on futures, swaps (“swaptions”), securities, commodities or currencies. “Covered” means that so long as the Fund is obligated as the writer of an option, it will own either the underlying investments or currency or an option to purchase the same underlying investments or currency having an expiration date of the covered option and an exercise price equal to or less than the exercise price of the covered option, or will pledge cash or other liquid investments having a value equal to or greater than the fluctuating market value of the option investment or currency. Writing put options increases the Fund’s exposure to the underlying instrument. Writing call options decreases the Fund’s exposure to the underlying instrument. Premiums received from writing options that expire are treated as realized gains. Premiums received from writing options that are exercised or closed are added to the proceeds or offset amounts paid on the underlying futures, swap, investment or currency transaction to determine the realized gain or loss. The Fund as a writer of an option has no control over whether the underlying instrument may be sold (call) or purchased (put) and as a result bears the market risk of an unfavorable change in the price of the instrument underlying the written option. There is the risk the Fund may not be able to enter into a closing transaction because of an illiquid market. The Fund may also purchase put and call options. Purchasing call options increases the Fund’s exposure to the underlying instrument. Purchasing put options decreases the Fund’s exposure to the underlying instrument. The Fund pays a premium, which is included on the Fund’s Statement of Assets and Liabilities as an investment and is subsequently marked to market to reflect the current value of the option. Premiums paid for purchasing options that expire are treated as realized losses. Certain options may be purchased with premiums to be determined on a future date. The premiums for these options are based upon implied volatility parameters at specified terms. The risk associated with purchasing put and call options is generally limited to the premium paid. Premiums paid for purchasing options that are exercised or closed are added to the amounts paid or offset against the proceeds on the underlying investment transaction to determine the realized gain or loss. Entering into over-the-counter options also exposes the Fund to counterparty risk. Counterparty risk is the possibility that the counterparty to the agreements may default on its obligation to perform or disagree as to the meaning of the contractual terms in the agreements.
| 26 |
| The Hartford Global Alpha Fund |
| Notes to Financial Statements – (continued) |
| October 31, 2014 |
| (000’s Omitted) |
The Fund, as shown on the Schedule of Investments, had outstanding purchased and written option contracts as of October 31, 2014. Transactions involving written option contracts during the year ended October 31, 2014, are summarized below:
| Options Contract Activity During the Year Ended October 31, 2014: | ||||||||
| Call Options Written During the Year | Number of Contracts* | Premium Amounts | ||||||
| Beginning of the period | 549,000 | $ | 12 | |||||
| Written | 2,125,013 | 4 | ||||||
| Expired | (549,000 | ) | (12 | ) | ||||
| Closed | (925,013 | ) | (3 | ) | ||||
| Exercised | — | — | ||||||
| End of period | 1,200,000 | $ | 1 | |||||
| Put Options Written During the Year | Number of Contracts* | Premium Amounts | ||||||
| Beginning of the period | 74 | $ | 5 | |||||
| Written | 565,000 | 6 | ||||||
| Expired | (565,074 | ) | (11 | ) | ||||
| Closed | — | — | ||||||
| Exercised | — | — | ||||||
| End of period | — | $ | — | |||||
* The number of contracts does not omit 000's.
Swap Contracts – The Fund may invest in swap contracts. Swap contracts are agreements to exchange or swap investment cash flows, assets, foreign currencies or market-linked returns at specified, future intervals. Swap contracts are either privately negotiated in the over-the-counter market (“OTC swaps”) or cleared in a central clearing house (“centrally cleared swaps”). The Fund may enter into credit default, total return, cross-currency, interest rate, inflation and other forms of swap contracts to manage its exposure to credit, currency, interest rate, commodity and inflation risk. Swap contracts are also used to gain exposure to certain markets. In connection with these contracts, investments or cash may be identified as collateral or margin in accordance with the terms of the respective swap contracts and/or master netting arrangement to provide assets of value and recourse in the event of default or bankruptcy/insolvency.
Swaps are valued based on custom valuations furnished by an independent pricing service. Swaps for which prices are not available from an independent pricing service are valued in accordance with procedures established by the Company's Board of Directors. Changes in market value, if any, are reflected as a component of net changes in unrealized appreciation or depreciation on the Statement of Operations. Daily changes in valuation of centrally cleared swaps, if any, are recorded as a receivable or payable for the change in value (“variation margin”) on the Statement of Assets and Liabilities. Realized gains or losses on centrally cleared swaps are recorded upon the termination of the swap. OTC swap payments received or paid at the beginning of the measurement period are reflected as such on the Statement of Assets and Liabilities and represent premiums paid or received upon entering into the swap contract to compensate for differences between the stated terms of the swap contract and prevailing market conditions (credit spreads, currency exchange rates, interest rates and other relevant factors). These upfront premiums are recorded as realized gains or losses on the Statement of Operations upon termination or maturity of the swap. A liquidation payment received or made at the termination or maturity of the swap is recorded as a realized gain or loss on the Statement of Operations. Net periodic payments received or paid by the Fund are included as part of realized gains or losses on the Statement of Operations.
Entering into these contracts involves, to varying degrees, elements of liquidation, counterparty, credit and market risk in excess of the amounts recognized on the Statement of Assets and Liabilities. Such risks involve the possibility that there will be no liquid market for these contracts, that the counterparty to the contracts may default on its obligation to perform or disagree as to the meaning of contractual terms in the contracts, and that there may be unfavorable changes in market conditions (credit spreads, currency exchange rates, interest rates and other relevant factors).
The Fund’s maximum risk of loss from counterparty risk for OTC swaps is the net value of the discounted cash flows to be received from the counterparty over the contract’s remaining life, and current market value, to the extent that amount is positive. The risk is mitigated by having a master netting arrangement between the Fund and the counterparty, which allows for the netting of payments made or received (although such amounts are presented on a gross basis within the Statement of Assets and Liabilities, as applicable) as well as the posting of collateral to the Fund to cover the Fund’s exposure to the counterparty. In a centrally cleared
| 27 |
| The Hartford Global Alpha Fund |
| Notes to Financial Statements – (continued) |
| October 31, 2014 |
| (000’s Omitted) |
swap, while the Fund enters into an agreement with a clearing broker to execute contracts with a counterparty, the performance of the swap is guaranteed by the central clearinghouse, which reduces the Fund’s exposure to counterparty risk. The Fund is still exposed to the counterparty risk through the clearing broker and clearinghouse. The clearinghouse attempts to minimize this risk to its participants through the use of mandatory margin requirements, daily cash settlements and other procedures. Likewise, the clearing broker reduces its risk through margin requirements and required segregation of customer balances.
Credit Default Swap Contracts – The credit default swap market allows the Fund to manage its exposure to the market or certain sectors of the market, to reduce its risk exposure to defaults of corporate and sovereign issuers, or to create exposure to corporate or sovereign issuers to which it is not otherwise exposed. Certain credit default swaps involve the exchange of a fixed rate premium for protection against the loss in value of an underlying investment or index in the event of a credit event, such as payment default or bankruptcy.
Under a credit default swap contract, one party acts as guarantor by receiving the fixed periodic payment in exchange for the commitment to purchase the underlying investment at par if the defined credit event occurs. Upon the occurrence of a defined credit event, the difference between the value of the reference obligation and the swap’s notional amount is recorded as realized gain or loss on swap transactions in the Statement of Operations. A “buyer” of credit protection agrees to pay a counterparty to assume the credit risk of an issuer upon the occurrence of certain events. The “seller” of the protection receives periodic payments and agrees to assume the credit risk of an issuer upon the occurrence of certain events. Although specified events are contract specific, credit events are generally defined as bankruptcy, failure to pay, restructuring, obligation acceleration, obligation default or repudiation/moratorium. A “seller’s” exposure is limited to the total notional amount of the credit default swap contract. These potential amounts would be partially offset by any recovery values of the respective referenced obligations or upfront payments received upon entering into the contract.
Implied credit spreads, represented in absolute terms, utilized in determining the market value of credit default swap contracts on corporate issues, sovereign government issues or U.S. municipal issues as of year-end are disclosed in the notes to the Schedule of Investments, as applicable, and serve as an indicator of the current status of the payment/performance risk and represent the likelihood or risk of default for the credit derivative. The implied credit spread of a particular referenced entity reflects the cost of buying/selling protection and there may also be upfront payments required to be made to enter into the contract. Wider credit spreads represent a deterioration of the referenced entity’s credit soundness and a greater likelihood or risk of default or other credit event occurring as defined under the terms of the contract. For credit default swap contracts on credit indices, the quoted market prices and resulting values serve as the indicator of the current status of the payment/performance risk. Increasing market values, in absolute terms when compared to the notional amount of the swap, represent a deterioration of the referenced equity’s credit soundness and a greater likelihood or risk of default or other credit event occurring as defined under the terms of the contract. The Fund, as shown on the Schedule of Investments, had outstanding credit default swap contracts as of October 31, 2014.
Interest Rate Swap Contracts – The Fund is subject to interest rate risk exposure in the normal course of pursuing its investment objectives. Because the Fund holds fixed rate bonds, the value of these bonds may decrease if interest rates rise. To hedge against this risk and to maintain its ability to generate income at prevailing market rates, the Fund may enter into interest rate swap contracts. In a typical interest rate swap, one party agrees to make regular payments equal to a floating interest rate, based on a specified interest rate or benchmark (e.g. London Interbank Offered Rate (“LIBOR”)), multiplied by a notional amount, in return for payments equal to a fixed rate multiplied by the same amount, for a specific period of time. The net interest received or paid on interest rate swap contracts is recorded as a realized gain or loss. Interest rate swaps are marked to market daily and the change, if any, is recorded as an unrealized gain or loss in the Statement of Operations. When the interest rate swap contract is terminated early, the Fund records a realized gain or loss equal to the difference between the current market value and the upfront premium or cost.
If an interest rate swap contract provides for payments in different currencies, the parties might agree to exchange the notional amount as well. Interest rate swaps may also depend on other prices or rates, such as the value of an index. The risks of interest rate swaps include changes in market conditions which will affect the value of the contract or the cash flows and the possible inability of the counterparty to fulfill its obligations under the contract. The Fund’s maximum risk of loss from counterparty credit risk is the discounted net value of the cash flows to be received from the counterparty over the contract’s remaining life, to the extent that amount is positive. The Fund, as shown on the Schedule of Investments, had outstanding interest rate swap contracts as of October 31, 2014.
| 28 |
| The Hartford Global Alpha Fund |
| Notes to Financial Statements – (continued) |
| October 31, 2014 |
| (000’s Omitted) |
Additional Derivative Instrument Information:
| Fair Value of Derivative Instruments on the Statement of Assets and Liabilities as of October 31, 2014: |
| Risk Exposure Category | ||||||||||||||||||||||||||||
| Interest
Rate Contracts | Foreign Exchange Contracts | Credit Contracts | Equity Contracts | Commodity Contracts | Other Contracts | Total | ||||||||||||||||||||||
| Assets: | ||||||||||||||||||||||||||||
| Investments in securities, at value (purchased option contracts), market value | $ | — | $ | 55 | $ | — | $ | — | $ | — | $ | — | $ | 55 | ||||||||||||||
| Unrealized appreciation on foreign currency contracts | — | 167 | — | — | — | — | 167 | |||||||||||||||||||||
| Unrealized appreciation on OTC swap contracts | 39 | — | 50 | — | — | — | 89 | |||||||||||||||||||||
| Variation margin receivable * | 25 | — | — | — | — | — | 25 | |||||||||||||||||||||
| Total | $ | 64 | $ | 222 | $ | 50 | $ | — | $ | — | $ | — | $ | 336 | ||||||||||||||
| Liabilities: | ||||||||||||||||||||||||||||
| Unrealized depreciation on foreign currency contracts | $ | — | $ | 99 | $ | — | $ | — | $ | — | $ | — | $ | 99 | ||||||||||||||
| Unrealized depreciation on OTC swap contracts | — | — | 63 | — | — | — | 63 | |||||||||||||||||||||
| Variation margin payable * | 68 | — | — | — | — | — | 68 | |||||||||||||||||||||
| Written option contracts, market value | — | — | 2 | — | — | — | 2 | |||||||||||||||||||||
| Total | $ | 68 | $ | 99 | $ | 65 | $ | — | $ | — | $ | — | $ | 232 | ||||||||||||||
| * Only current day's variation margin is reported within the Statement of Assets and Liabilities. The variation margin is included in the open futures net cumulative depreciation of $(145) and open centrally cleared swaps net cumulative appreciation of $13 as reported in the Schedule of Investments. |
| The volume of derivatives that is presented in the Schedule of Investments is consistent with the derivative activity during the year ended October 31, 2014. |
| The Effect of Derivative Instruments on the Statement of Operations for the year ended October 31, 2014: |
| Risk Exposure Category | ||||||||||||||||||||||||||||
| Interest
Rate Contracts | Foreign Exchange Contracts | Credit Contracts | Equity Contracts | Commodity Contracts | Other Contracts | Total | ||||||||||||||||||||||
| Realized Gain (Loss) on Derivatives Recognized as a Result of Operations: | ||||||||||||||||||||||||||||
| Net realized gain (loss) on purchased option contracts | $ | (25 | ) | $ | (71 | ) | $ | 1 | $ | — | $ | — | $ | — | $ | (95 | ) | |||||||||||
| Net realized loss on futures contracts | (405 | ) | — | — | — | — | — | (405 | ) | |||||||||||||||||||
| Net realized gain on written option contracts | 12 | 12 | 1 | — | — | — | 25 | |||||||||||||||||||||
| Net realized loss on swap contracts | (82 | ) | — | (45 | ) | — | — | — | (127 | ) | ||||||||||||||||||
| Net realized gain on foreign currency contracts | — | 248 | — | — | — | — | 248 | |||||||||||||||||||||
| Total | $ | (500 | ) | $ | 189 | $ | (43 | ) | $ | — | $ | — | $ | — | $ | (354 | ) | |||||||||||
| Net Change in Unrealized Appreciation (Depreciation) on Derivatives Recognized as a Result of Operations: | ||||||||||||||||||||||||||||
| Net change in unrealized appreciation (depreciation) of purchased option contracts | $ | — | $ | 27 | $ | (1 | ) | $ | — | $ | — | $ | — | $ | 26 | |||||||||||||
| Net change in unrealized appreciation of futures contracts | 91 | — | — | — | — | — | 91 | |||||||||||||||||||||
| Net change in unrealized appreciation (depreciation) of written option contracts | 2 | (10 | ) | (1 | ) | — | — | — | (9 | ) | ||||||||||||||||||
| Net change in unrealized appreciation of swap contracts | 118 | — | 56 | — | — | — | 174 | |||||||||||||||||||||
| Net change in unrealized depreciation of foreign currency contracts | — | (34 | ) | — | — | — | — | (34 | ) | |||||||||||||||||||
| Total | $ | 211 | $ | (17 | ) | $ | 54 | $ | — | $ | — | $ | — | $ | 248 | |||||||||||||
| 29 |
| The Hartford Global Alpha Fund |
| Notes to Financial Statements – (continued) |
| October 31, 2014 |
| (000’s Omitted) |
Balance Sheet Offsetting Information - The following discloses both gross information and net information about instruments and transactions eligible for offset in the financial statements, and instruments and transactions that are subject to a master netting arrangement, as well as amounts related to margin, reflected as financial collateral (including cash collateral), held at clearing brokers, counterparties and the Fund’s custodian. The master netting arrangements allow the clearing brokers to net any collateral held in or on behalf of the Fund, or liabilities or payment obligations of the clearing brokers to the Fund, against any liabilities or payment obligations of the Fund to the clearing brokers. The Fund is required to deposit financial collateral (including cash collateral) at the FCM's custodian on behalf of clearing brokers and counterparties to continually meet the original and maintenance requirements established by the clearing brokers and counterparties. Such requirements are specific to the respective clearing broker or counterparty. Certain master netting arrangements may not be enforceable in the bankruptcy proceedings of a counterparty.
| Offsetting of Financial Assets and Derivative Assets as of October 31, 2014: |
| Gross
Amounts* of Assets Presented in Statement of Assets and Liabilities | Financial Instruments with Allowable Netting | Non-cash Collateral Received | Cash
Collateral Received | Net
Amount (not less than $0) | ||||||||||||||||
| Description | ||||||||||||||||||||
| OTC purchased option and OTC swap contracts at market value | $ | 452 | $ | (105 | ) | $ | — | $ | — | $ | 347 | |||||||||
| Futures contracts - variation margin receivable | 25 | (25 | ) | — | — | — | ||||||||||||||
| Unrealized appreciation on foreign currency contracts | 167 | (24 | ) | — | — | 143 | ||||||||||||||
| Total subject to a master netting or similar arrangement | $ | 644 | $ | (154 | ) | $ | — | $ | — | $ | 490 | |||||||||
* Gross amounts are presented here as there are no amounts that are netted within the Statement of Assets and Liabilities.
| Offsetting of Financial Liabilities and Derivative Liabilities as of October 31, 2014: | ||||||||||||||||||||
| Gross
Amounts* of Liabilities Presented in Statement of Assets and Liabilities | Financial Instruments with Allowable Netting | Non-cash Collateral Pledged | Cash
Collateral Pledged | Net
Amount (not less than $0) | ||||||||||||||||
| Description | ||||||||||||||||||||
| OTC written option and OTC swap contracts at market value | $ | 105 | $ | (105 | ) | $ | — | $ | — | $ | — | |||||||||
| Futures contracts - variation margin payable | 53 | (25 | ) | — | (458 | ) | — | |||||||||||||
| Swaps contracts - variation margin payable | 15 | — | (263 | ) | — | — | ||||||||||||||
| Unrealized depreciation on foreign currency contracts | 99 | (24 | ) | — | — | 75 | ||||||||||||||
| Total subject to a master netting or similar arrangement | $ | 272 | $ | (154 | ) | $ | (263 | ) | $ | (458 | ) | $ | 75 | |||||||
* Gross amounts are presented here as there are no amounts that are netted within the Statement of Assets and Liabilities.
Principal Risks:
Credit risk depends largely on the perceived financial health of bond issuers. In general, the credit rating is inversely related to the credit risk of the issuer. Higher rated bonds generally are deemed to have less credit risk, while lower or unrated bonds are deemed to have higher risk of default. The share price, yield and total return of a fund that holds securities with higher credit risk may be more volatile than those of a fund that holds bonds with lower credit risk. Similar to credit risk, the Fund may be exposed to counterparty risk, or the risk that an institution or other entity with which the Fund has unsettled or open transactions will default.
The Fund’s investments expose the Fund to various risks including, but not limited to, interest rate, prepayment, extension and foreign currency risks. Interest rate risk is the risk that fixed income securities will decline in value because of changes in interest rates. As nominal interest rates rise, the values of certain fixed income securities held by the Fund are likely to decrease. A nominal interest rate can be described as the sum of a real interest rate and an expected inflation rate. Fixed income securities with longer durations tend to be more sensitive to changes in interest rates, usually making them more volatile than securities with shorter durations. Duration is useful primarily as a measure of the sensitivity of a fixed income security’s market price to interest rate (i.e., yield)
| 30 |
| The Hartford Global Alpha Fund |
| Notes to Financial Statements – (continued) |
| October 31, 2014 |
| (000’s Omitted) |
movements. Rising interest rates may cause prepayments to occur at a slower than expected rate, thereby effectively lengthening the maturity of the security and making the security more sensitive to interest rate changes. Prepayment and extension risk are major risks of mortgage backed securities and certain asset backed securities. For certain asset backed securities, the actual maturity may be less than the stated maturity shown in the Schedule of Investments, if applicable. As a result, the timing of income recognition relating to these securities may vary based upon the actual maturity.
If the Fund invests directly in foreign currencies or in securities that trade in, and receive revenues in, foreign currencies, or in derivatives that provide exposure to foreign currencies, it will be subject to the risk that those currencies will decline in value relative to the base currency (U.S. dollars) of the Fund, or, in the case of hedging positions, that the Fund’s base currency will decline in value relative to the currency being hedged. Currency rates in foreign countries may fluctuate significantly over short periods of time for a number of reasons, including changes in interest rates, intervention (or the failure to intervene) by U.S. or foreign governments, central banks or supranational entities, such as the International Monetary Fund, or by the imposition of currency controls or other political developments in the United States or abroad. As a result, the Fund’s investments in foreign currency denominated securities may reduce the returns of the Fund. The market values of equity securities, such as common stocks and preferred stocks, or equity related investments, such as futures and options, may decline due to general market conditions which are not specifically related to a particular company, such as real or perceived adverse economic conditions, changes in the general outlook for corporate earnings, changes in interest or currency rates or adverse investor sentiment generally. The market value of equity securities may also decline due to factors which affect a particular industry or industries, such as labor shortages or increased production costs and competitive conditions within an industry. Equity securities and equity related investments generally have greater market price volatility than fixed income securities.
Federal Income Taxes:
Federal Income Taxes – For federal income tax purposes, the Fund intends to continue to qualify as a Regulated Investment Company ("RIC") under Subchapter M of the Internal Revenue Code (“IRC”) by distributing substantially all of its taxable net investment income and net realized capital gains to its shareholders and otherwise complying with the requirements of the IRC. The Fund has distributed substantially all of its income and capital gains in prior years, if applicable, and intends to distribute substantially all of its income and capital gains during the calendar year ending December 31, 2014. Accordingly, no provision for federal income or excise taxes has been made in the accompanying financial statements. Distributions from short-term capital gains are treated as ordinary income distributions for federal income tax purposes.
Net Investment Income (Loss), Net Realized Gains (Losses) and Distributions – Net investment income (loss) and net realized gains (losses) may differ for financial statement and tax purposes primarily because of losses deferred due to wash sale adjustments, foreign currency gains and losses, adjustments related to Passive Foreign Investment Companies ("PFICs"), Real Estate Investment Trusts ("REITs"), RICs, certain derivatives and partnerships. The character of distributions made during the year from net investment income or net realized gains may differ from their ultimate characterization for federal income tax purposes. Also, due to the timing of dividend distributions, the fiscal year in which amounts are distributed may differ from the year that the income or realized gains (losses) were recorded by the Fund.
Components of Distributable Earnings – The Fund’s components of distributable earnings (deficit) on a tax basis at October 31, 2014, are as follows:
| Amount | ||||
| Accumulated Capital and Other Losses* | $ | (795 | ) | |
| Unrealized Appreciation† | 19 | |||
| Total Accumulated Deficit | $ | (776 | ) | |
| * | The Fund has capital loss carryforwards that are identified in the Capital Loss Carryforward note that follows. |
| † | Differences between book-basis and tax-basis unrealized appreciation (depreciation) may be attributable to the losses deferred due to wash sale adjustments, foreign currency gains and losses, adjustments related to PFICs, REITs, RICs, certain derivatives and partnerships. |
| 31 |
| The Hartford Global Alpha Fund |
| Notes to Financial Statements – (continued) |
| October 31, 2014 |
| (000’s Omitted) |
Reclassification of Capital Accounts – The Fund may record reclassifications in its capital accounts. These reclassifications have no impact on the total net assets of the Fund. The reclassifications are a result of permanent differences between U.S. GAAP and tax accounting for such items as foreign currency, PFICs, expiration or utilization of capital loss carryforwards or net operating losses. Adjustments are made to reflect the impact these items have on current and future distributions to shareholders. Therefore, the source of the Fund’s distributions may be shown in the accompanying Statement of Changes in Net Assets as from undistributed net investment income, from accumulated net realized gains on investments or from capital depending on the type of book and tax differences that exist. For the year ended October 31, 2014, the Fund recorded reclassifications to increase (decrease) the accounts listed below:
| Amount | ||||
| Undistributed Net Investment Income (Loss) | $ | 781 | ||
| Accumulated Net Realized Gain (Loss) | (101 | ) | ||
| Capital Stock and Paid-in-Capital | (680 | ) | ||
Capital Loss Carryforward – On December 22, 2010, the Regulated Investment Company Modernization Act of 2010 (the “Act”) was enacted, which made changes to the capital loss carryforward rules. The changes are effective for taxable years beginning after the date of enactment. Under the Act, funds are permitted to carry forward capital losses for an unlimited period. Additionally, capital loss carryforwards retain their character as either short-term or long-term capital losses rather than being considered all short-term as permitted under prior regulation.
At October 31, 2014 (tax year end), the Fund had capital loss carryforwards for U.S. federal income tax purposes as follows:
| Amount | ||||
| Short-Term Capital Loss Carryforward | $ | 33 | ||
| Long-Term Capital Loss Carryforward | 698 | |||
| Total | $ | 731 | ||
During the year ended October 31, 2014, the Fund utilized $178 of prior year short term capital loss carryforwards.
| As of October 31, 2014, the Fund elected to defer the following Late-Year Ordinary Losses: | ||||
| Amount | ||||
| Ordinary Income | $ | 64 | ||
Accounting for Uncertainty in Income Taxes – The Fund has adopted financial reporting rules that require the Fund to analyze all open tax years, as defined by the statute of limitations, for all major jurisdictions. Generally, tax authorities can examine all tax returns filed for the last three years. The Fund does not have an examination in progress.
The Fund has reviewed all open tax years and major jurisdictions and concluded that these financial reporting rules had no effect on the Fund’s financial position or results of operations. There is no tax liability resulting from unrecognized tax benefits relating to uncertain income tax positions taken or expected to be taken on the tax return for the fiscal year ended October 31, 2014. The Fund is also not aware of any tax positions for which it is reasonably possible that the total amounts of unrecognized tax benefits will significantly change in the next twelve months.
Expenses:
Investment Management Agreement – Hartford Funds Management Company, LLC ("HFMC") serves as the Fund’s investment manager pursuant to an Investment Management Agreement with the Company. HFMC is an indirect wholly owned subsidiary of The Hartford Financial Services Group, Inc. ("The Hartford"). The investment manager has overall investment supervisory responsibility for the Fund. In addition, the investment manager provides administrative personnel, services, equipment, facilities and office space for proper operation of the Fund. HFMC has contracted with Wellington Management Company, LLP ("Wellington Management") under a sub-advisory agreement for the provision of day-to-day investment management services to the Fund in accordance with the Fund’s
| 32 |
| The Hartford Global Alpha Fund |
| Notes to Financial Statements – (continued) |
| October 31, 2014 |
| (000’s Omitted) |
investment objective and policies. The Fund pays a fee to the investment manager, a portion of which may be used to compensate Wellington Management.
The schedule below reflects the rates of compensation paid to the investment manager for investment management services rendered as of October 31, 2014; the rates are accrued daily and paid monthly:
| Average Daily Net Assets | Annual Fee |
| On first $500 million | 1.100% |
| On next $500 million | 1.090% |
| On next $1.5 billion | 1.080% |
| On next $2.5 billion | 1.070% |
| Over $5 billion |
1.060% |
The Fund’s management fee rate is adjusted based on the Fund’s performance relative to the cumulative investment record of its benchmark index (the Bank of America Merrill Lynch 3-Month U.S. Treasury Bill Index) over the Performance Measurement Period. The accrual of this adjustment began in December 2013 and the first payment was made in January 2014. Prior to December 2013, only the base fee rate shown in the table applied.
The Performance Measurement Period is the previous 36 months; however until the Fund has been in operation for 36 months, the Performance Measurement Period equals the time that has elapsed since the Fund’s inception. The management fee rate paid to HFMC by the Fund consists of two components: (1) a base fee calculated by applying the contractual fixed rate of the management fee to the Fund’s average daily net assets during the previous month (“Base Fee Rate”), and (2) a performance fee adjustment (“Performance Adjustment”), calculated by applying a variable rate of up to 0.50% of the Fund’s average daily net assets during the applicable Performance Measurement Period. The Performance Adjustment may either increase the management fee owed to HFMC if the Fund outperforms the benchmark index, or may partially offset the management fee owed to HFMC if the Fund underperforms the benchmark index.
The investment performance of the Fund’s Class A Shares (excluding the frond-end sales load) for the Performance Measurement Period is used to calculate the Performance Adjustment. The Performance Adjustment is equivalent to 25% of the amount by which the Fund outperforms or underperforms the cumulative investment record of its benchmark index plus 1.15%. No Performance Adjustment is applied if the Fund’s investment performance is equal to the cumulative investment record of the Fund’s benchmark index plus 1.15% during the applicable Performance Measurement Period. The Performance Adjustment is calculated monthly in arrears, accrued throughout the month, and paid monthly. For the period December 15, 2013 through October 31, 2014, the Base Fee Rate represented an effective rate (excluding the impact of any expense waivers in effect, if applicable) of 1.10% of the Fund’s average daily net assets before a decrease of $128 (a ratio of 0.44% of the Fund’s average daily net assets) based on the Performance Adjustment. The Performance Adjustment amount is included as a component of the Investment management fees on the Statement of Operations. For more information on management fees, including the Performance Adjustment, please refer to the Fund’s prospectus.
Accounting Services Agreement – Pursuant to the Fund Accounting Agreement between HFMC and the Company, on behalf of the Fund, HFMC provides accounting services to the Fund and receives monthly compensation based on the Fund’s average daily net assets at the rates set forth below. The Fund’s accounting services fees are accrued daily and paid monthly.
| Average Daily Net Assets | Annual Fee |
| On first $5 billion | 0.025% |
| On next $5 billion | 0.020% |
| Over $10 billion | 0.015% |
Operating Expenses – Allocable expenses incurred by the Company are allocated to each Fund and allocated to classes within the Fund in proportion to the average daily net assets of the Fund and each class, except where allocation of certain expenses is more fairly made directly to the Fund or to specific classes within a Fund. As of October 31, 2014, HFMC contractually limited the total
| 33 |
| The Hartford Global Alpha Fund |
| Notes to Financial Statements – (continued) |
| October 31, 2014 |
| (000’s Omitted) |
operating expenses of this Fund, exclusive of taxes, interest expense, brokerage commissions, acquired fund fees and expenses and extraordinary expenses, through February 28, 2015 as follows:
| Class A | Class C | Class I | Class R3 | Class R4 | Class R5 | Class Y |
| 1.55% | 2.30% | 1.30% | 1.85% | 1.55% | 1.25% | 1.20% |
Fees Paid Indirectly – The Fund's custodian bank has agreed to reduce its fees when the Fund maintains cash on deposit in a non-interest-bearing custody account. For the year ended October 31, 2014, this amount, if any, is included in the Statement of Operations.
The ratio of expenses to average net assets in the accompanying financial highlights excludes the reduction in expenses related to fees paid indirectly. The annualized expense ratio after waivers for the period listed below reflecting the reduction for fees paid indirectly is as follows:
| Year Ended October 31, 2014 | ||||
| Class A | 1.44 | % | ||
| Class C | 2.14 | |||
| Class I | 1.13 | |||
| Class R3 | 1.83 | |||
| Class R4 | 1.53 | |||
| Class R5 | 1.23 | |||
| Class Y | 1.15 | |||
Distribution and Service Plan for Class A, C, R3 and R4 Shares – Hartford Funds Distributors, LLC ("HFD"), an indirect wholly owned subsidiary of The Hartford, is the principal underwriter and distributor of the Fund. HFD is engaged in distribution activities, which include marketing and distribution of shares through broker/dealers, financing distribution costs and maintaining financial books and records. For the year ended October 31, 2014, HFD received front-end load sales charges of $1 and contingent deferred sales charges of zero from the Fund.
The Fund has adopted a Distribution and Service Plan in accordance with Rule 12b-1 of the 1940 Act to compensate the distributor (HFD) for activities intended to result in the sale and distribution of Class A, C, R3 and R4 shares and for providing services for shareholders. The Rule 12b-1 plan applicable to Class A shares of the Fund provides for payment of a Rule 12b-1 fee of 0.25% of average daily net assets. Some or all of the fee may be used for shareholder servicing expenses with the remainder used for distribution expenses. Under the Class C Plan, the Fund pays the distributor 1.00% of the average daily net assets of Class C shares outstanding, 0.25% of which is intended as a fee for services provided to existing shareholders with the remainder used for distribution expenses. For Class C shares, some or the entire fee may be remitted to broker/dealers for distribution and/or shareholder account services. Class R3 shares have a distribution fee of 0.50% of average daily net assets and Class R4 shares have a distribution fee of 0.25% of average daily net assets. For Class R3 and R4 shares, some or the entire fee may be remitted to broker/dealers for distribution and/or shareholder account services. The Fund’s 12b-1 fees are accrued daily and paid monthly or at such other intervals as the Board of Directors may determine.
Other Related Party Transactions – Certain officers of the Fund are directors and/or officers of HFMC and/or The Hartford or its subsidiaries. For the year ended October 31, 2014, a portion of the Fund’s Chief Compliance Officer’s compensation was paid by all of the investment companies in the Hartford fund complex. The portion allocated to the Fund, as represented in other expenses on the Statement of Operations, rounds to zero. Hartford Administrative Services Company (“HASCO”), an indirect wholly-owned subsidiary of The Hartford, provides transfer agent services to the Fund. HASCO has contractually agreed to reimburse any portion of the transfer agency fees over 0.30% of average daily net assets per fiscal year for each class. Any transfer agency fee reimbursement is determined before considering the contractual operating expense limitation. For providing such services, HASCO is compensated on a per account basis that varies by account type, except with respect to Class Y, for which it is compensated based on average daily net assets. The amount paid to HASCO and any related contractual reimbursement amounts, if applicable, can be found in the Statement of Operations. These fees are accrued daily and paid monthly.
| 34 |
| The Hartford Global Alpha Fund |
| Notes to Financial Statements – (continued) |
| October 31, 2014 |
| (000’s Omitted) |
Administrative services fees are paid to HASCO for third-party recordkeeping services that are payable as a percentage of net assets in the amount of up to 0.20%, 0.15% and 0.10% for Classes R3, R4 and R5 shares, respectively. The total administrative services fees are shown on the Statement of Operations. These fees are accrued daily and paid monthly.
Affiliate Holdings:
As of October 31, 2014, affiliates of The Hartford had ownership of shares in the Fund as follows:
| Percentage of Class | Percentage of Fund | |||||||
| Class A | 89 | % | 17 | % | ||||
| Class C | 96 | 8 | ||||||
| Class I | 78 | 8 | ||||||
| Class R3 | 100 | 8 | ||||||
| Class R4 | 100 | 8 | ||||||
| Class R5 | 100 | 8 | ||||||
| Class Y | 82 | 34 | ||||||
Investment Transactions:
For the year ended October 31, 2014, the cost of purchases and proceeds from sales of investment securities (excluding short-term investments) were as follows:
| Excluding U.S. Government Obligations | U.S. Government Obligations | Total | ||||||||||
| Cost of Purchases | $ | 85,036 | $ | 35,281 | $ | 120,317 | ||||||
| Sales Proceeds | 90,201 | 40,443 | 130,644 | |||||||||
| 35 |
| The Hartford Global Alpha Fund |
| Notes to Financial Statements – (continued) |
| October 31, 2014 |
| (000’s Omitted) |
Capital Share Transactions:
The following information is for the year ended October 31, 2014, and the period December 14, 2012 (commencement of operations) through October 31, 2013:
| For the Year Ended October 31, 2014 | For the Period Ended October 31, 2013 | |||||||||||||||||||||||||||||||
| Shares Sold | Shares
Issued for Reinvested Dividends | Shares Redeemed | Net
Increase (Decrease) of Shares | Shares Sold | Shares
Issued for Reinvested Dividends | Shares Redeemed | Net
Increase (Decrease) of Shares | |||||||||||||||||||||||||
| Class A | ||||||||||||||||||||||||||||||||
| Shares | 29 | — | (301 | ) | (272 | ) | 784 | — | (12 | ) | 772 | |||||||||||||||||||||
| Amount | $ | 280 | $ | — | $ | (2,889 | ) | $ | (2,609 | ) | $ | 7,805 | $ | — | $ | (113 | ) | $ | 7,692 | |||||||||||||
| Class C | ||||||||||||||||||||||||||||||||
| Shares | 6 | — | (7 | ) | (1 | ) | 208 | — | — | 208 | ||||||||||||||||||||||
| Amount | $ | 60 | $ | — | $ | (67 | ) | $ | (7 | ) | $ | 2,081 | $ | — | $ | — | $ | 2,081 | ||||||||||||||
| Class I | ||||||||||||||||||||||||||||||||
| Shares | 55 | — | (12 | ) | 43 | 305 | — | (90 | ) | 215 | ||||||||||||||||||||||
| Amount | $ | 525 | $ | — | $ | (112 | ) | $ | 413 | $ | 3,045 | $ | — | $ | (889 | ) | $ | 2,156 | ||||||||||||||
| Class R3 | ||||||||||||||||||||||||||||||||
| Shares | — | — | — | — | 200 | — | — | 200 | ||||||||||||||||||||||||
| Amount | $ | — | $ | — | $ | — | $ | — | $ | 2,000 | $ | — | $ | — | $ | 2,000 | ||||||||||||||||
| Class R4 | ||||||||||||||||||||||||||||||||
| Shares | — | — | — | — | 200 | — | — | 200 | ||||||||||||||||||||||||
| Amount | $ | — | $ | — | $ | — | $ | — | $ | 2,000 | $ | — | $ | — | $ | 2,000 | ||||||||||||||||
| Class R5 | ||||||||||||||||||||||||||||||||
| Shares | — | — | — | — | 200 | — | — | 200 | ||||||||||||||||||||||||
| Amount | $ | 2 | $ | — | $ | (2 | ) | $ | — | $ | 2,000 | $ | — | $ | — | $ | 2,000 | |||||||||||||||
| Class Y | ||||||||||||||||||||||||||||||||
| Shares | 338 | — | (760 | ) | (422 | ) | 1,517 | — | (4 | ) | 1,513 | |||||||||||||||||||||
| Amount | $ | 3,255 | $ | — | $ | (7,277 | ) | $ | (4,022 | ) | $ | 15,034 | $ | — | $ | (36 | ) | $ | 14,998 | |||||||||||||
| Total | ||||||||||||||||||||||||||||||||
| Shares | 428 | — | (1,080 | ) | (652 | ) | 3,414 | — | (106 | ) | 3,308 | |||||||||||||||||||||
| Amount | $ | 4,122 | $ | — | $ | (10,347 | ) | $ | (6,225 | ) | $ | 33,965 | $ | — | $ | (1,038 | ) | $ | 32,927 | |||||||||||||
Line of Credit:
The Fund is one of several Hartford Funds that participate in a $500 million committed revolving line of credit facility. The facility is to be used for temporary or emergency purposes. Under the arrangement, the funds are required to own securities having a market value in excess of 300% of the total bank borrowings. The interest rate on borrowings varies depending on the nature of the loan. The facility also requires a fee to be paid based on the amount of the commitment. This commitment fee is allocated to all the funds participating in the line of credit based on the average net assets of the funds. During the year ended October 31, 2014, the Fund did not have any borrowings under this facility.
Pending Legal Proceedings:
On February 25, 2011, Jennifer L. Kasilag, Louis Mellinger, Judith M. Menendez, Jacqueline M. Robinson, and Linda A. Russell filed a derivative lawsuit against Hartford Investment Financial Services, LLC (“HIFSCO”) (now known as HFD) on behalf of six Hartford retail mutual funds in the United States District Court for the District of New Jersey, alleging that HIFSCO received excessive advisory and distribution fees in violation of its statutory fiduciary duty under Section 36(b) of the 1940 Act when serving as investment manager and principal underwriter, respectively, to the Hartford retail mutual funds. Although this action was purportedly filed on behalf of certain of the Hartford Funds, none of the Hartford Funds is itself a defendant to the suit. HIFSCO moved to dismiss and, in September 2011, the motion was granted in part and denied in part, with leave to amend the complaint. In November 2011, plaintiffs filed an amended complaint on behalf of certain Hartford retail mutual funds, The Hartford Global Health Fund (now known as The Hartford Healthcare Fund), The Hartford Conservative Allocation Fund, The Hartford Growth Opportunities Fund, The Hartford Inflation Plus Fund, The Hartford Advisers Fund (now known as The Hartford Balanced Fund), and The Hartford Capital Appreciation Fund. Plaintiffs seek to rescind the investment management agreements and distribution plans between HIFSCO and these funds and to recover the total fees charged thereunder or, in the alternative, to recover any improper compensation HIFSCO received, in addition to lost earnings. HIFSCO filed a partial motion to
| 36 |
| The Hartford Global Alpha Fund |
| Notes to Financial Statements – (continued) |
| October 31, 2014 |
| (000’s Omitted) |
dismiss the amended complaint and, in December 2012, the court dismissed without prejudice the claims regarding distribution fees and denied the motion with respect to the advisory fees claims. HIFSCO disputes the allegations and intends to defend vigorously.
In March 2014, the plaintiffs filed a new complaint that added as new plaintiffs The Hartford Floating Rate Fund and The Hartford Small Company Fund and named as a defendant HFMC, which assumed the role as investment manager to the funds as of January 2013. HFMC and HIFSCO dispute the allegations and intend to defend vigorously.
No accrual for litigation relating to this matter has been recorded in the financial statements of the Fund because the Fund is not party to the suit.
Indemnifications:
Under the Company's organizational documents, the Company shall indemnify its officers and directors to the full extent required or permitted under Maryland General Corporation Law and the federal securities laws. In addition, the Company, on behalf of the Fund, may enter into contracts that contain a variety of indemnifications. The Company's maximum exposure under these arrangements is unknown. However, as of the date of these financial statements, the Company has not had prior claims or losses pursuant to these contracts and expects the risk of loss to be remote.
Subsequent Event:
Effective December 1, 2014, pursuant to a sub-transfer agency agreement between HASCO and Boston Financial Data Services, Inc. (“BFDS”), HASCO has delegated certain transfer agent, dividend disbursing agent and shareholder servicing agent functions to BFDS. The costs and expenses of such delegation are borne by HASCO, not by the Fund.
| 37 |
| The Hartford Global Alpha Fund |
| Financial Highlights |
| - Selected Per-Share Data - (A) | - Ratios and Supplemental Data - | |||||||||||||||||||||||||||||||||||||||||||||||||||||
| Class | Net
Asset Value at Beginning of Period | Net Investment Income (Loss) | Net Realized and Unrealized Gain (Loss) on Invest- ments | Total
from Investment Operations | Dividends from Net Investment Income | Distribu- tions from Realized Capital Gains | Total Dividends and Distributions | Net Asset Value at End of Period | Total Return(B) | Net Assets at End of Period (000's) | Ratio
of Expenses to Average Net Assets Before Adjust- ments(C) | Ratio
of Expenses to Average Net Assets After Adjust- ments(C) | Ratio
of Net Investment Income (Loss) to Average Net Assets | |||||||||||||||||||||||||||||||||||||||||
| For the Year Ended October 31, 2014 | ||||||||||||||||||||||||||||||||||||||||||||||||||||||
| A | $ | 9.55 | $ | (0.05 | ) | $ | (0.01 | ) | $ | (0.06 | ) | $ | – | $ | – | $ | – | $ | 9.49 | (0.63 | )% | $ | 4,747 | 1.44 | % | 1.44 | % | (0.53 | )% | |||||||||||||||||||||||||
| C | 9.48 | (0.12 | ) | – | (0.12 | ) | – | – | – | 9.36 | (1.27 | ) | 1,941 | 2.14 | 2.14 | (1.25 | ) | |||||||||||||||||||||||||||||||||||||
| I | 9.57 | (0.02 | ) | (0.01 | ) | (0.03 | ) | – | – | – | 9.54 | (0.31 | ) | 2,460 | 1.13 | 1.13 | (0.25 | ) | ||||||||||||||||||||||||||||||||||||
| R3 | 9.51 | (0.09 | ) | – | (0.09 | ) | – | – | – | 9.42 | (0.95 | ) | 1,883 | 1.83 | 1.83 | (0.94 | ) | |||||||||||||||||||||||||||||||||||||
| R4 | 9.54 | (0.06 | ) | (0.01 | ) | (0.07 | ) | – | – | – | 9.47 | (0.73 | ) | 1,894 | 1.53 | 1.53 | (0.64 | ) | ||||||||||||||||||||||||||||||||||||
| R5 | 9.56 | (0.03 | ) | (0.01 | ) | (0.04 | ) | – | – | – | 9.52 | (0.42 | ) | 1,905 | 1.23 | 1.23 | (0.34 | ) | ||||||||||||||||||||||||||||||||||||
| Y | 9.57 | (0.02 | ) | (0.01 | ) | (0.03 | ) | – | – | – | 9.54 | (0.31 | ) | 10,407 | 1.15 | 1.15 | (0.25 | ) | ||||||||||||||||||||||||||||||||||||
| From December 14, 2012 (commencement of operations), through October 31, 2013 | ||||||||||||||||||||||||||||||||||||||||||||||||||||||
| A(D) | $ | 10.00 | $ | (0.08 | ) | $ | (0.37 | ) | $ | (0.45 | ) | $ | – | $ | – | $ | – | $ | 9.55 | (4.50 | )%(E) | $ | 7,371 | 1.88 | %(F) | 1.47 | %(F) | (0.90 | ) %(F) | |||||||||||||||||||||||||
| C(D) | 10.00 | (0.14 | ) | (0.38 | ) | (0.52 | ) | – | – | – | 9.48 | (5.20 | )(E) | 1,975 | 2.62 | (F) | 2.21 | (F) | (1.65 | )(F) | ||||||||||||||||||||||||||||||||||
| I(D) | 10.00 | (0.06 | ) | (0.37 | ) | (0.43 | ) | – | – | – | 9.57 | (4.30 | )(E) | 2,055 | 1.64 | (F) | 1.23 | (F) | (0.69 | )(F) | ||||||||||||||||||||||||||||||||||
| R3(D) | 10.00 | (0.11 | ) | (0.38 | ) | (0.49 | ) | – | – | – | 9.51 | (4.90 | )(E) | 1,903 | 2.32 | (F) | 1.85 | (F) | (1.30 | )(F) | ||||||||||||||||||||||||||||||||||
| R4(D) | 10.00 | (0.09 | ) | (0.37 | ) | (0.46 | ) | – | – | – | 9.54 | (4.60 | )(E) | 1,908 | 2.02 | (F) | 1.55 | (F) | (1.00 | )(F) | ||||||||||||||||||||||||||||||||||
| R5(D) | 10.00 | (0.06 | ) | (0.38 | ) | (0.44 | ) | – | – | – | 9.56 | (4.40 | )(E) | 1,913 | 1.72 | (F) | 1.25 | (F) | (0.70 | )(F) | ||||||||||||||||||||||||||||||||||
| Y(D) | 10.00 | (0.05 | ) | (0.38 | ) | (0.43 | ) | – | – | – | 9.57 | (4.30 | )(E) | 14,476 | 1.61 | (F) | 1.20 | (F) | (0.62 | )(F) | ||||||||||||||||||||||||||||||||||
| (A) | Information presented relates to a share outstanding throughout the indicated period. Net investment income (loss) per share amounts are calculated based on average shares outstanding unless otherwise noted. |
| (B) | Assumes initial investment at net asset value at the beginning of each period, reinvestment of all distributions, the complete redemption of the investment at net asset value at the end of each period and no sales charge. Total return would be reduced if sales charges were taken into account. |
| (C) | Adjustments include waivers and reimbursements, if applicable. Ratios do not include fees paid indirectly (see Expenses in the accompanying Notes to Financial Statements). |
| (D) | Commenced operations on December 14, 2012. |
| (E) | Not annualized. |
| (F) | Annualized. |
| Portfolio Turnover Rate for All Share Classes | ||||
| For the Year Ended October 31, 2014 | 386 | % | ||
| From December 14, 2012 (commencement of operations) through October 31, 2013 | 384 | (A) | ||
| (A) | Not annualized. |
| 38 |
| Report of Independent Registered Public Accounting Firm |
| The Board of Directors and Shareholders of |
| The Hartford Mutual Funds, Inc. |
We have audited the accompanying statement of assets and liabilities, including the schedule of investments, of The Hartford Global Alpha Fund (one of the portfolios constituting The Hartford Mutual Funds, Inc. (the Funds)) as of October 31, 2014, and the related statement of operations for the year then ended, and the statements of changes in net assets and the financial highlights for the periods indicated therein. These financial statements and financial highlights are the responsibility of the Funds’ management. Our responsibility is to express an opinion on these financial statements and financial highlights based on our audits.
We conducted our audits in accordance with the standards of the Public Company Accounting Oversight Board (United States). Those standards require that we plan and perform the audit to obtain reasonable assurance about whether the financial statements and financial highlights are free of material misstatement. We were not engaged to perform an audit of the Funds’ internal control over financial reporting. Our audits included consideration of internal control over financial reporting as a basis for designing audit procedures that are appropriate in the circumstances, but not for the purpose of expressing an opinion on the effectiveness of the Funds’ internal control over financial reporting. Accordingly, we express no such opinion. An audit also includes examining, on a test basis, evidence supporting the amounts and disclosures in the financial statements and financial highlights, assessing the accounting principles used and significant estimates made by management, and evaluating the overall financial statement presentation. Our procedures included confirmation of securities owned as of October 31, 2014, by correspondence with the custodian and brokers or by other appropriate auditing procedures where replies from brokers were not received. We believe that our audits provide a reasonable basis for our opinion.
In our opinion, the financial statements and financial highlights referred to above present fairly, in all material respects, the financial position of The Hartford Global Alpha Fund of The Hartford Mutual Funds, Inc. at October 31, 2014, the results of its operations for the year then ended and the changes in its net assets and the financial highlights for the periods indicated therein, in conformity with U.S. generally accepted accounting principles.
| |
Minneapolis, Minnesota
December 18, 2014
| 39 |
| The Hartford Global Alpha Fund |
| Directors and Officers (Unaudited) |
The Board of Directors of the Company (the "Directors") appoints officers who are responsible for the day-to-day operations of the Fund and who execute policies formulated by the Directors. Each Director serves until his or her death, resignation, or retirement or until the next annual meeting of shareholders is held or until his or her successor is elected and qualifies.
Directors and officers who are employed by or who have a financial interest in The Hartford Financial Services Group, Inc. ("The Hartford") are considered “interested” persons of the Fund pursuant to the 1940 Act. Each officer and two of the Company's Directors, as noted in the chart below, are “interested” persons of the Fund. Each Director serves as a director for The Hartford Mutual Funds, Inc., The Hartford Mutual Funds II, Inc., Hartford Series Fund, Inc., and Hartford HLS Series Fund II, Inc., and as a trustee for The Hartford Alternative Strategies Fund, which, as of October 31, 2014, collectively consist of 66 funds. Correspondence may be sent to Directors and officers c/o Hartford Funds, 5 Radnor Corporate Center, Suite 300, 100 Matsonford Road, Radnor, Pennsylvania 19087, except that correspondence to Mr. Annoni, Mr. Dressen and Ms. Quade may be sent to 500 Bielenberg Drive, Suite 500, Woodbury, Minnesota 55125.
The table below sets forth, for each Director and officer, his or her name, year of birth, current position with the Company and date first elected or appointed to The Hartford Mutual Funds, Inc. ("MF") and The Hartford Mutual Funds II, Inc. ("MF2"), principal occupation, and, for Directors, other directorships held. The Fund’s Statement of Additional Information contains further information on the Directors and is available free of charge by calling 1-888-843-7824 or writing to: Hartford Funds, P.O. Box 55022, Boston, MA 02205-5022.
Information on the aggregate remuneration paid to the directors of the Company can be found in the Statement of Operations herein. The Fund pays to The Hartford a portion of the Chief Compliance Officer’s compensation, but does not pay salaries or compensation to any of its other officers or Directors who are employed by The Hartford.
Non-Interested Directors
Hilary E. Ackermann (1956) Director since September 23, 2014
Ms. Ackermann served as Chief Risk Officer at Goldman Sachs Bank USA from October 2008 to November 2011 and serves as a Director of Dynegy, Inc., an independent power company, from October 2012 to present.
Lynn S. Birdsong (1946) Director since 2003, Chairman of the Investment Committee since 2014
Mr. Birdsong is a private investor. Mr. Birdsong currently serves as a Director of the Sovereign High Yield Investment Company (April 2010 to current). Mr. Birdsong currently serves as an Independent Director of Nomura Partners Funds, Inc. (formerly, The Japan Fund) (April 2003 to current). From 2003 to March 2005, Mr. Birdsong was an Independent Director of the Atlantic Whitehall Funds. From 1979 to 2002, Mr. Birdsong was a Managing Director of Zurich Scudder Investments, an investment management firm. During his employment with Scudder, Mr. Birdsong was an Interested Director of The Japan Fund. From January 1981 through December 2013, Mr. Birdsong was a partner in Birdsong Company, an advertising specialty firm.
Robert M. Gavin, Jr. (1940) Director since 2002 (MF) and 1986 (MF2), Chairman of the Board for each since 2004
Dr. Gavin is an educational consultant. Prior to September 1, 2001, he was President of Cranbrook Education Community and prior to July 1996, he was President of Macalester College, St. Paul, Minnesota.
Duane E. Hill (1945) Director since 2001 (MF) and 2002 (MF2), Chairman of the Nominating Committee since 2003
Mr. Hill is a Partner of TSG Ventures L.P., a private equity investment company. Mr. Hill is a former partner of TSG Capital Group, a private equity investment firm that served as sponsor and lead investor in leveraged buyouts of middle market companies.
Sandra S. Jaffee (1941) Director since 2005
Ms. Jaffee is the founder and Chief Executive Officer of a private company, Homeworks Concierge, LLC, which provides residential property management services in Westchester County, New York (January 2012 to present). Ms. Jaffee served as Chairman (2008 to 2009) and Chief Executive Officer of Fortent (formerly Searchspace Group), a leading provider of compliance/regulatory technology to financial institutions from August 2005 to August 2009. From August 2004 to August 2005, Ms. Jaffee served as an Entrepreneur in Residence with Warburg Pincus, a private equity firm. Prior to joining Warburg Pincus, Ms. Jaffee served as Executive Vice President at Citigroup, from September 1995 to July 2004, where she was President and Chief Executive Officer of Citibank’s Global Securities Services (1995 to 2003). Ms. Jaffee currently serves as a member of the Board of Directors of Broadridge Financial Solutions as well as a Trustee of Muhlenberg College.
| 40 |
| The Hartford Global Alpha Fund |
| Directors and Officers (Unaudited) – (continued) |
William P. Johnston (1944) Director since 2005, Chairman of the Compliance Committee since 2005
In June 2006, Mr. Johnston was appointed as Senior Advisor to The Carlyle Group, a global private equity and other alternative asset investment firm and currently serves as an Operating Executive. In July 2006, Mr. Johnston was elected to the Board of Directors of MultiPlan, Inc. and served as a Director (July 2006 to August 2010). In August 2007, Mr. Johnston was elected to the Board of Directors of LifeCare Holdings, Inc. and served as a Director (August 2007 to June 2013). In February 2008, Mr. Johnston was elected to the Board of Directors of HCR-ManorCare, Inc. In May 2006, Mr. Johnston was elected to the Supervisory Board of Fresenius Medical Care AG & Co. KGaA, after its acquisition of Renal Care Group, Inc. in March 2006. Mr. Johnston joined Renal Care Group in November 2002 as a member of the Board of Directors and served as Chairman of the Board from March 2003 through March 2006. From 2002 through 2013, Mr. Johnston served as a Board member of the Georgia O’Keefe Museum. From September 1987 to December 2002, Mr. Johnston was with Equitable Securities Corporation (and its successors, SunTrust Equitable Securities and SunTrust Robinson Humphrey) serving in various investment banking and managerial positions, including Managing Director and Head of Investment Banking, Chief Executive Officer and Vice Chairman.
Phillip O. Peterson (1944) Director since 2002 (MF) and 2000 (MF2), Chairman of the Audit Committee since 2002
Mr. Peterson is a mutual fund industry consultant. He was a partner of KPMG LLP (an accounting firm) until July 1999. Mr. Peterson joined William Blair Funds in February 2007 as a member of the Board of Trustees. From February 2012 to February 2014, Mr. Peterson served as a Trustee of Symetra Variable Mutual Funds. From January 2004 to April 2005, Mr. Peterson served as Independent President of the Strong Mutual Funds.
Lemma W. Senbet (1946) Director since 2005
Dr. Senbet is the William E. Mayer Chair Professor of Finance and Founding Director, Center for Financial Policy, at the University of Maryland, Robert H. Smith School of Business. He was chair of the Finance Department of the University of Maryland, Robert H. Smith School of Business from 1998 to 2006. Since June 2013, he has been on leave from the University to serve as Executive Director of African Economic Research Consortium which focuses on economic policy research and training. Previously, he was a chaired professor of finance at the University of Wisconsin-Madison. Also, he was a Director of the Fortis Funds from March 2000 to July 2002. Dr. Senbet served as Director of the American Finance Association and President of the Western Finance Association. In 2006, Dr. Senbet was inducted Fellow of Financial Management Association International for his career-long distinguished scholarship and professional service.
Interested Directors and Officers
James E. Davey (1964) Director since 2012, President and Chief Executive Officer since 2010
Mr. Davey serves as Executive Vice President of Hartford Life Insurance Company (“HLIC”) and The Hartford. Additionally, Mr. Davey serves as Chairman of the Board, Manager and Senior Managing Director of Hartford Funds Distributors, LLC (“HFD”). He also currently serves as Director, Chairman of the Board, President and Senior Managing Director of Hartford Administrative Services Company (“HASCO”). Mr. Davey also serves as Manager, Chairman of the Board and Senior Managing Director for Hartford Funds Management Company, LLC (“HFMC”) and Director, Chairman of the Board and Senior Managing Director for Hartford Funds Management Group, Inc. ("HFMG"). Mr. Davey has served in various positions within The Hartford and its subsidiaries in connection with the operation of the Hartford Funds. Mr. Davey joined The Hartford in 2002.
Lowndes A. Smith* (1939) Director since 1996 (MF) and 2002 (MF2)
Mr. Smith served as Vice Chairman of The Hartford from February 1997 to January 2002, as President and Chief Executive Officer of Hartford Life, Inc. from February 1997 to January 2002, and as President and Chief Operating Officer of The Hartford Life Insurance Companies from January 1989 to January 2002. Mr. Smith serves as a Director of White Mountains Insurance Group Ltd. (October 2003 to current); One Beacon Insurance (October 2006 to current); Symetra Financial (August 2007 to current) and is a Managing Director of Whittington Gray Associates (January 2007 to current).
* Mr. Smith resigned as a Director of MF, MF2, Hartford Series Fund, Inc. and Hartford HLS Series Fund II, Inc. and as a Trustee of The Hartford Alternative Strategies Fund effective September 17, 2014.
Other Officers
Mark A. Annoni (1964) Vice President, Controller and Treasurer since 2012
Mr. Annoni currently serves as the Assistant Vice President of HLIC (February 2004 to present) and Senior Vice President of HFMG (December 2013 to present). Mr. Annoni has served in various positions within The Hartford and its subsidiaries in connection with the operation of the Hartford Funds. Mr. Annoni joined The Hartford in 2001.
| 41 |
| The Hartford Global Alpha Fund |
| Directors and Officers (Unaudited) – (continued) |
Michael R. Dressen (1963) AML Compliance Officer since 2011
Mr. Dressen currently serves as Assistant Vice President of HLIC. He also serves as Chief Compliance Officer and AML Compliance Officer of HASCO and as AML Officer of HFD. Mr. Dressen has served in various positions within The Hartford and its subsidiaries in connection with the operation of the Hartford Funds.
Edward P. Macdonald (1967) Vice President, Secretary and Chief Legal Officer since 2005
Mr. Macdonald currently serves as Assistant Secretary, Executive Vice President and Deputy General Counsel of HFD, HASCO, HFMC and HFMG. He also serves as Vice President of HLIC. Mr. Macdonald has served in various positions within The Hartford and its subsidiaries in connection with the operation of the Hartford Funds. Mr. Macdonald joined The Hartford in 2005.
Joseph G. Melcher (1973) Vice President and Chief Compliance Officer since 2013
Mr. Melcher currently serves as Executive Vice President of HFD, HFMG and HASCO. Mr. Melcher also currently serves as Executive Vice President and Chief Compliance Officer of HFMC. Mr. Melcher has served in various positions within The Hartford and its subsidiaries in connection with the operation of the Hartford Funds since joining The Hartford in 2012. Prior to joining The Hartford, Mr. Melcher worked at Touchstone Investments, a member of the Western & Southern Financial Group, where he held the position of Vice President and Chief Compliance Officer from 2010 through 2012 and Assistant Vice President, Compliance from 2005 to 2010.
Vernon J. Meyer (1964) Vice President since 2006
Mr. Meyer currently serves as Senior Vice President of HLIC. He also currently serves as Managing Director and Chief Investment Officer of HFMC and Managing Director of HFMG. Mr. Meyer has served in various positions within The Hartford and its subsidiaries in connection with the operation of the Hartford Funds. Mr. Meyer joined The Hartford in 2004.
Laura S. Quade (1969) Vice President since 2012
Ms. Quade currently serves as Vice President of HASCO, HFD and HFMG. She is the Head of Operations of HASCO and formerly served as Director, Enterprise Operations of HLIC. Ms. Quade has served in various positions within The Hartford and its subsidiaries in connection with the operation of the Hartford Funds. Ms. Quade joined The Hartford in 2001.
Martin A. Swanson** (1962) Vice President since 2010
Mr. Swanson currently serves as Vice President of HLIC. Mr. Swanson also serves as Managing Director, Chief Marketing Officer and Principal of HFD and Managing Director of HFMG. Mr. Swanson has served in various positions within The Hartford and its subsidiaries in connection with the operation of the Hartford Funds.
** Mr. Swanson resigned as an officer effective November 6, 2014.
HOW TO OBTAIN A COPY OF THE FUND’S PROXY VOTING POLICIES AND VOTING RECORDS (UNAUDITED)
A description of the policies and procedures that the Fund uses to determine how to vote proxies relating to portfolio securities and information about how the Fund voted proxies relating to portfolio securities during the most recent twelve-month period ended June 30 are available (1) without charge, upon request, by calling 888-843-7824 and (2) on the SEC’s website at http://www.sec.gov.
QUARTERLY PORTFOLIO HOLDINGS INFORMATION (UNAUDITED)
The Fund files a complete schedule of portfolio holdings with the SEC for the first and third quarters of each fiscal year on Form N-Q. The Fund’s Forms N-Q are available (1) without charge, upon request, by calling 888-843-7824 and (2) on the SEC’s website at http://www.sec.gov. The Form N-Q may be reviewed and copied at the SEC’s Public Reference Room in Washington, DC. Information on the operation of the Public Reference Room may be obtained by calling 1-800-SEC-0330.
| 42 |
| The Hartford Global Alpha Fund |
| Federal Tax Information (Unaudited) |
For the fiscal year ended October 31, 2014, there is no further federal tax information required for this Fund.
| 43 |
| The Hartford Global Alpha Fund |
| Expense Example (Unaudited) |
Your Fund's Expenses
As a shareholder of the Fund, you incur two types of costs: (1) transaction costs, including sales charges (loads) on purchase payments, if any, and contingent deferred sales charges (CDSC), if any, and (2) ongoing costs, including investment management fees, distribution and/or service (12b-1) fees, if any, and other fund expenses. This example is intended to help you understand your ongoing costs (in dollars) of investing in the Fund and to compare these costs with the ongoing costs of investing in other mutual funds. The example is based on an investment of $1,000 invested at the beginning of the period and held for the entire period of April 30, 2014 through October 31, 2014.
Actual Expenses
The first set of columns of the table below provides information about actual account values and actual expenses. You may use the information in this column, together with the amount you invested, to estimate the expenses that you paid over the period. Simply divide your account value by $1,000 (for example, an $8,600 account value divided by $1,000 = 8.6), then multiply the result by the number in the line under the heading entitled “Expenses Paid During Period” to estimate the expenses you paid on your account during this period.
Hypothetical Example for Comparison Purposes
The second set of columns of the table below provides information about hypothetical account values and hypothetical expenses based on the Fund's actual expense ratio and an assumed rate of return of 5% per year before expenses, which is not the Fund's actual return. The hypothetical account values and expenses may not be used to estimate the actual ending account balance or expenses you paid for the period. You may use this information to compare the ongoing costs of investing in the Fund and other funds. To do so, compare this 5% hypothetical example with the 5% hypothetical examples that appear in the shareholder reports of the other funds.
Please note that the expenses shown in the table are meant to highlight your ongoing costs only and do not reflect any transactional costs, such as sales charges (loads) and CDSC. Therefore, the second set of columns of the table is useful in comparing ongoing costs only, and will not help you determine the relative total costs of owning different funds. In addition, if these transactional costs were included, your costs would be higher. Expenses are equal to the Fund's annualized expense ratios multiplied by average account value over the period, multiplied by 184/365 (to reflect the one-half year period).
| Actual return | Hypothetical (5% return before expenses) | |||||||||||||||||||||||||||||||||||
| Beginning Account Value April 30, 2014 | Ending
Account Value October 31, 2014 | Expenses
paid during the period April 30, 2014 through October 31, 2014 | Beginning Account Value April 30, 2014 | Ending
Account Value October 31, 2014 | Expenses
paid during the period April 30, 2014 through October 31, 2014 | Annualized expense ratio | Days in the current 1/2 year | Days in the full year | ||||||||||||||||||||||||||||
| Class A | $ | 1,000.00 | $ | 994.80 | $ | 6.56 | $ | 1,000.00 | $ | 1,018.63 | $ | 6.64 | 1.31 | % | 184 | 365 | ||||||||||||||||||||
| Class C | $ | 1,000.00 | $ | 990.50 | $ | 10.24 | $ | 1,000.00 | $ | 1,014.92 | $ | 10.36 | 2.04 | 184 | 365 | |||||||||||||||||||||
| Class I | $ | 1,000.00 | $ | 995.80 | $ | 5.22 | $ | 1,000.00 | $ | 1,019.97 | $ | 5.29 | 1.04 | 184 | 365 | |||||||||||||||||||||
| Class R3 | $ | 1,000.00 | $ | 991.60 | $ | 8.68 | $ | 1,000.00 | $ | 1,016.48 | $ | 8.79 | 1.73 | 184 | 365 | |||||||||||||||||||||
| Class R4 | $ | 1,000.00 | $ | 993.70 | $ | 7.19 | $ | 1,000.00 | $ | 1,018.00 | $ | 7.27 | 1.43 | 184 | 365 | |||||||||||||||||||||
| Class R5 | $ | 1,000.00 | $ | 994.80 | $ | 5.68 | $ | 1,000.00 | $ | 1,019.51 | $ | 5.75 | 1.13 | 184 | 365 | |||||||||||||||||||||
| Class Y | $ | 1,000.00 | $ | 995.80 | $ | 5.25 | $ | 1,000.00 | $ | 1,019.95 | $ | 5.31 | 1.04 | 184 | 365 | |||||||||||||||||||||
| 44 |
| The Hartford Globabl Alpha Fund |
| Approval of Investment Management and Investment Sub-Advisory Agreements (Unaudited) |
Section 15(c) of the Investment Company Act of 1940, as amended (the “1940 Act”), requires that each mutual fund’s board of directors, including a majority of those directors who are not “interested persons” of the mutual fund, as defined in the 1940 Act (the “Independent Directors”), annually review and consider the continuation of the mutual fund’s investment advisory and sub-advisory agreements. At its meeting held on August 5-6, 2014, the Board of Directors (the “Board”) of The Hartford Mutual Funds, Inc., including each of the Independent Directors, unanimously voted to approve the continuation of the investment management agreement for The Hartford Global Alpha Fund (the “Fund”) with Hartford Funds Management Company, LLC (“HFMC”) and the continuation of the investment sub-advisory agreement between HFMC and the Fund’s sub-adviser, Wellington Management Company, LLP (the “Sub-adviser,” and together with HFMC, the “Advisers”) (collectively, the “Agreements”).
In the months preceding the August 5-6, 2014 meeting, the Board requested, received and reviewed written responses from the Advisers to questions posed to them on behalf of the Independent Directors and supporting materials relating to those questions and responses. The Board considered information furnished to the Board at its meetings throughout the year, as well as information specifically prepared in connection with the annual approval of the Agreements at the Board’s meetings held on June 17-18, 2014 and August 5-6, 2014. Information provided to the Board at its meetings throughout the year included, among other things, reports on Fund performance, legal and compliance matters, sales and marketing activity, shareholder services, and the other services provided to the Fund by the Advisers and their affiliates. The Board also received in-person presentations by Fund officers and representatives of HFMC at the Board’s meetings on June 17-18, 2014 and August 5-6, 2014 concerning the Agreements.
The Independent Directors, advised by independent legal counsel, engaged service providers to assist them with evaluating the Agreements with respect to the Fund. Lipper Inc. (“Lipper”), an independent provider of investment company data, was retained to provide the Board with reports on how the Fund’s contractual management fees, actual management fees, other non-management fees, overall expense ratios and investment performance compared to those of mutual funds with similar investment objectives. The Independent Directors also engaged an independent financial services consultant (the “Consultant”) to assist them in evaluating the Fund’s management fees, sub-advisory fees, other non-management fees, overall expense ratios and investment performance. In addition, the Consultant reviewed the profitability calculations utilized by HFMC in connection with the continuation of the investment management agreement.
In determining whether to continue the Agreements for the Fund, the members of the Board reviewed and evaluated information and factors they believed to be relevant and appropriate in light of the information that the Board deemed necessary and appropriate through the exercise of its reasonable business judgment. While individual members of the Board may have weighed certain factors differently, the Board’s determination to continue the Agreements was based on a comprehensive consideration of all information provided to the Board throughout the year and specifically with respect to the continuation of the Agreements. A more detailed discussion of the factors the Board considered with respect to its approval of the Agreements is provided below.
Nature, Extent and Quality of Services Provided by the Advisers
The Board requested and considered information concerning the nature, extent and quality of the services provided to the Fund by the Advisers. The Board considered, among other things, the terms of the Agreements and the range of services provided by the Advisers. The Board considered the Advisers’ professional personnel who provide services to the Fund, including each Adviser’s ability and experience in attracting and retaining qualified personnel to service the Fund. The Board considered each Adviser’s reputation and overall financial strength, as well as its willingness to consider and implement organizational and operational changes designed to enhance services to the Hartford Funds. In addition, the Board considered the quality of each Adviser’s communications with the Board and responsiveness to Board inquiries and requests made from time to time with respect to the Fund and other Hartford Funds.
The Board also requested and evaluated information concerning each Adviser’s regulatory and compliance environment. In this regard, the Board requested and reviewed information on each Adviser’s compliance policies and procedures, compliance history, and a report from the Fund’s Chief Compliance Officer on each Adviser’s compliance with applicable laws and regulations, including responses to regulatory developments and compliance issues raised by regulators. The Board also noted the Advisers’ support of the Fund’s compliance control structure, particularly the resources devoted by the Advisers in support of the Fund’s obligations pursuant to Rule 38a-1 under the 1940 Act.
With respect to HFMC, the Board noted that, under the Agreements, HFMC is responsible for the management of the Fund, including oversight of fund operations and service providers, and provides administrative and investment advisory services in connection with selecting, monitoring and supervising the Sub-adviser. The Board considered HFMC’s ongoing monitoring of people, process and performance, including its quarterly reviews of each of the Hartford Funds, semi-annual meetings with the leaders of each Fund’s portfolio management team, and oversight of the Hartford Funds’ approximately 66 portfolio managers. The Board recognized that HFMC has demonstrated a record of making changes to the
| 45 |
| The Hartford Globabl Alpha Fund |
| Approval of Investment Management and Investment Sub-Advisory Agreements (Unaudited) – (continued) |
management and/or strategies of the Hartford Funds when warranted. The Board considered HFMC’s oversight of the Sub-adviser’s investment approach and results, process for monitoring best execution of portfolio trades by the Sub-adviser, and approach to risk management with respect to the Fund and the service providers to the Fund. The Board also considered HFMC’s oversight of compliance with the Fund’s objective and policies as well as with applicable laws and regulations, noting that regulatory and other developments had over time led to an increase in the scope of HFMC’s services in this regard.
In addition, the Board considered HFMC’s ongoing commitment to review and rationalize the Hartford Funds product line-up and the expenses that HFMC had incurred in connection with fund combinations in recent years. The Board considered that HFMC or its affiliates are responsible for providing the Fund’s officers.
With respect to the Sub-adviser, which provides certain day-to-day portfolio management services for the Fund, the Board considered the quality of the Fund’s portfolio managers, the Sub-adviser’s other investment personnel, its investment philosophy and process, investment research capabilities and resources, performance record, trade execution capabilities and experience. The Board considered the experience of the Fund’s portfolio managers, the number of accounts managed by the portfolio managers, and the Sub-adviser’s method for compensating the portfolio managers.
Based on these considerations, the Board concluded that it was satisfied with the nature, extent and quality of the services provided to the Fund by HFMC and the Sub-adviser.
Performance of the Fund and the Advisers
The Board considered the investment performance of the Fund. In this regard, the Board reviewed the performance of the Fund over different time periods presented in the materials and evaluated HFMC’s analysis of the Fund’s performance for these time periods. The Board considered information and materials provided to the Board by the Advisers concerning Fund performance, as well as information from Lipper comparing the investment performance of the Fund to an appropriate benchmark and universe of peer funds. The Board noted that the Fund’s performance was in the 4th quintile of its performance universe for the 1-year period. The Board also noted that the Fund’s performance was below its benchmark for the 1-year period.
The Board considered the detailed investment analytics reports provided by Hartford Funds’ Investment Advisory Group throughout the year. These reports include, among other things, information on the Fund’s gross and net returns, the Fund’s investment performance relative to an appropriate benchmark and peer group, various statistics concerning the Fund’s portfolio, and a narrative summary of various factors affecting Fund performance. The Board considered the Advisers’ cooperation with the Investment Committee, which assists the Board in evaluating the performance of the Fund at periodic meetings throughout the year. The Board also considered the analysis provided by the Consultant relating to the Fund’s performance track record.
In light of all the considerations noted above, the Board concluded that it had continued confidence in HFMC’s and the Sub-adviser’s overall capabilities to manage the Fund.
Costs of the Services and Profitability of the Advisers
The Board reviewed information regarding HFMC’s cost to provide investment management and related services to the Fund and HFMC’s profitability, both overall and for the Fund, on a pre-tax basis without regard to distribution expenses. The Board also requested and reviewed information about the profitability to HFMC and its affiliates from all services provided to the Fund and all aspects of their relationship with the Fund. The Board also requested and received information relating to the operations and profitability of the Sub-adviser.
The Board considered the Consultant’s review of the profitability calculations used by HFMC in connection with the continuation of the investment management agreement, noting the Consultant’s view that Hartford Funds’ process for calculating and reporting Fund profitability is reasonable. In this regard, the Board noted that the Consultant performed a full review of this process in light of the recent restructuring of the Hartford Funds business and reported that the approach to analyzing Fund profitability, including the use of common expense allocation methodologies, is reasonable, sound and well within common industry practice.
Based on these considerations, the Board concluded that the profits anticipated to be realized by the Advisers and their affiliates from their relationships with the Fund would not be excessive.
| 46 |
| The Hartford Globabl Alpha Fund |
| Approval of Investment Management and Investment Sub-Advisory Agreements (Unaudited) – (continued) |
Comparison of Fees and Services Provided by the Advisers
The Board considered comparative information with respect to the management fees to be paid by the Fund to HFMC and the total expense ratios of the Fund. The Board also considered comparative information with respect to the sub-advisory fees to be paid by HFMC to the Sub-adviser. In this regard, the Board requested and reviewed information from HFMC and the Sub-adviser relating to the management and sub-advisory fees, including the sub-advisory fee schedule for the Fund, and total operating expenses for the Fund. With respect to the sub-advisory fee schedule, the Board considered representations from HFMC and the Sub-adviser that the Sub-adviser’s fees were negotiated at arm’s length on a fund-by-fund basis. The Board also reviewed information from Lipper comparing the Fund’s contractual management fees, actual management fees and overall expense ratios relative to a group of funds selected by Lipper, in consultation with the Consultant, and a broader universe of funds selected by Lipper. The Board considered that the Fund’s contractual management fee and its total expenses (less 12b-1 and shareholder service fees) were in the 2nd quintile of its expense group, while its actual management fee was in the 1st quintile. The Board noted that the Fund has an automatically renewable contractual expense cap on each share class. The expense cap resulted in reimbursement of certain expenses incurred in 2013.
While the Board recognized that comparisons between the Fund and peer funds may be imprecise, given the different service levels and characteristics of mutual funds and the different business models and cost structures of the Advisers, the comparative information provided by Lipper assisted the Board in evaluating the reasonableness of the Fund’s management and sub-advisory fees and total operating expenses. In addition, the Board considered the analysis and recommendations of the Consultant relating to the Fund’s management and sub-advisory fees and total operating expenses.
Based on these considerations, the Board concluded that the Fund’s fees and total operating expenses, in conjunction with the information about quality of services, profitability, economies of scale, and other matters discussed, were reasonable in light of the services provided.
Economies of Scale
The Board requested and considered information regarding the Advisers’ realization of economies of scale with respect to the Fund and whether the fee levels reflect these economies of scale for the benefit of the Fund’s shareholders. The Board reviewed the breakpoints in the management fee schedule for the Fund, which reduce fee rates as Fund assets grow over time. The Board recognized that a fund with assets beyond the highest breakpoint level will continue to benefit from economies of scale because additional assets are charged the lowest breakpoint fee resulting in lower overall effective management fee rates. The Board also considered that expense limitations and fee waivers that reduce the Fund’s expenses at all asset levels can have the same effect as breakpoints in sharing economies of scale with shareholders and provide protection from an increase in expenses if Fund assets decline. The Board recognized that a fee schedule that reaches a lower breakpoint quickly provides shareholders with the benefit of anticipated or potential economies of scale although the Board noted that the Fund’s current low asset levels have kept the Fund from fully realizing this benefit. The Board also considered that HFMC has been active in managing expenses, which has resulted in benefits being realized by shareholders as assets within the Hartford Funds family of funds have grown over time, including through lower transfer agent costs and other operating expenses.
The Board reviewed and evaluated materials from Lipper and the Consultant showing how management fee schedules of peer funds reflect economies of scale for the benefit of shareholders as a peer fund’s assets hypothetically increase over time. Based on information provided by HFMC, Lipper, and the Consultant, the Board recognized that there is no uniform methodology for establishing breakpoints or uniform pattern in asset levels that trigger breakpoints or the amounts of breakpoints triggered.
After considering all of the information available to it, the Board concluded that it was satisfied with the extent to which economies of scale would be shared for the benefit of the Fund’s shareholders based on currently available information and the effective advisory fees and expense ratios for the Fund at its current and reasonably anticipated asset levels. The Board noted, however, that it would continue to monitor future growth in Fund assets and the appropriateness of additional breakpoints.
Other Benefits
The Board considered other benefits to the Advisers and their affiliates from their relationships with the Fund.
The Board noted that HFMC receives fees for fund accounting and related services from the Fund, and the Board considered information on profits to HFMC for such services. The Board also considered that Hartford Administrative Services Company (“HASCO”), the Fund’s transfer agent and an affiliate of HFMC, receives transfer agency compensation from the Fund, and the Board reviewed information on the profitability of
| 47 |
| The Hartford Globabl Alpha Fund |
| Approval of Investment Management and Investment Sub-Advisory Agreements (Unaudited) – (continued) |
the Fund’s transfer agency function to HASCO. The Board considered information provided by HASCO indicating that the transfer agent fees charged by HASCO to the Fund were fair and reasonable based on publicly available information.
The Board also considered that Hartford Funds Distributors, LLC (“HFD”), an affiliate of HFMC, serves as principal underwriter of the Fund. As principal underwriter, HFD receives 12b-1 fees from the Fund and receives all or a portion of the sales charges on sales or redemptions of certain classes of shares. The Board also noted that certain affiliates of HFD distribute shares of the Fund and receive compensation in that connection.
The Board considered the benefits, if any, to the Sub-adviser from any use of the Fund’s brokerage commissions to obtain soft dollar research, and representations from HFMC and the Sub-adviser that the Sub-adviser would not make any revenue-sharing payments or any other type of distribution payments to HFMC or its affiliates.
The Board considered the benefits to shareholders of being part of the Hartford Funds family of funds, including the right to exchange investments between the same class of funds without a sales charge, the ability to reinvest Fund dividends into other funds in the family, and the ability to combine holdings in the Fund with holdings in other funds to obtain a reduced sales charge. The Board considered HFMC’s efforts to provide investors in the family with a broad range of investment styles and asset classes and its entrepreneurial risk in initiating new funds to expand these opportunities for shareholders.
* * * *
Based upon its review of these various factors, among others, the Board concluded that it is in the best interests of the Fund and its shareholders for the Board to approve the Agreements for an additional year. In reaching this decision, the Board did not assign relative weights to the factors discussed above or deem any one or group of them to be controlling in and of themselves. In connection with their deliberations, the Independent Directors met separately in executive session on several occasions, with independent legal counsel and the Consultant, to review the relevant materials and consider their responsibilities under relevant laws and regulations.
| 48 |
| The Hartford Global Alpha Fund |
| Main Risks (Unaudited) |
The main risks of investing in the Fund are described below.
Market, Selection and Strategy Risk: The Fund’s share price may fluctuate due to market risk and/or security selections that may underperform the market or relevant benchmarks. If the sub-adviser's investment strategy does not perform as expected, the Fund could underperform its peers or lose money. There is no guarantee the Fund will achieve its stated objective.
Asset Allocation Strategy Risk: The portfolio managers' asset allocation strategy may not always work as intended, and asset allocation does not guarantee better performance or reduce the risk of investment loss.
Fixed Income Risk: The Fund is subject to interest rate risk (the risk that the value of an investment decreases when interest rates rise), credit risk (the risk that the issuing company of a security is unable to pay interest and principal when due) and call risk (the risk that an investment may be redeemed early). These risks also apply to the Fund’s investments in U.S. government securities, which may not be guaranteed by the U.S. government.
Derivatives Risk: Investments in derivatives can be volatile. Potential risks include currency risk, leverage risk (the risk that small market movements may result in large changes in the value of an investment), liquidity risk, index risk, pricing risk, and counterparty risk (the risk that the counterparty may be unwilling or unable to honor its obligations).
Foreign Investment, Emerging Markets and Sovereign Debt Risk: Investments in foreign securities may be riskier than investments in U.S. securities. Potential risks include the risks of illiquidity, increased price volatility, less government regulation, less extensive and less frequent accounting and other reporting requirements, unfavorable changes in currency exchange rates, and economic and political disruptions. These risks are generally greater for investments in emerging markets. Sovereign debt investments are subject to credit risk and the risk of default.
Junk Bond Risk: Investments in junk bonds involve greater risk of price volatility, illiquidity, and default than higher-rated debt securities.
Quantitative Analysis Risk: The Fund uses quantitative analysis in its securities selection; securities selected by this method may perform differently from the broader stock market.
Active Trading Risk: Actively trading investments may result in higher costs and higher taxable income.
Performance Fee Risk: The use of a Treasury bill index to calculate the Fund’s performance fee could result in the Fund paying higher management fees than if the Fund limited its investments to U.S. Treasury bills and other short-term instruments.
| 49 |
THIS PRIVACY POLICY IS NOT PART OF THIS REPORT
Privacy Policy and Practices of The Hartford Financial Services Group, Inc. and its Affiliates
(herein called “we, our and us”)
This Privacy Policy applies to our United States Operations
|
We value your trust. We are committed to the responsible: a) management; b) use; and c) protection; of Personal Information.
This notice describes how we collect, disclose, and protect Personal Information.
We collect Personal Information to: a) service your Transactions with us; and b) support our business functions.
We may obtain Personal Information from: a) You; b) your Transactions with us; and c) third parties such as a consumer-reporting agency.
Based on the type of product or service You apply for or get from us, Personal Information such as: a) your name; b) your address; c) your income; d) your payment; or e) your credit history; may be gathered from sources such as applications, Transactions, and consumer reports.
To serve You and service our business, we may share certain Personal Information. We will share Personal Information, only as allowed by law, with affiliates such as: a) our insurance companies; b) our employee agents; c) our brokerage firms; and d) our administrators.
As allowed by law, we may share Personal Financial Information with our affiliates to: a) market our products; or b) market our services; to You without providing You with an option to prevent these disclosures.
|
We may also share Personal Information, only as allowed by law, with unaffiliated third parties including: a) independent agents; b) brokerage firms; c) insurance companies; d) administrators; and e) service providers; who help us serve You and service our business.
When allowed by law, we may share certain Personal Financial Information with other unaffiliated third parties who assist us by performing services or functions such as: a) taking surveys; b) marketing our products or services; or c) offering financial products or services under a joint agreement between us and one or more financial institutions.
We, and third parties we partner with, may track some of the pages You visit through the use of: a) cookies; b) pixel tagging; or c) other technologies; and currently do not process or comply with any web browser’s “do not track” signal or similar mechanism that indicates a request to disable online tracking of individual users who visit our websites or use our services.
We will not sell or share your Personal Financial Information with anyone for purposes unrelated to our business functions without offering You the opportunity to: a) “opt-out;” or b) “opt-in;” as required by law.
We only disclose Personal Health Information with: a) your proper written authorization; or b) as otherwise allowed or required by law.
Our employees have access to Personal Information in the course of doing their jobs, such as: a) underwriting policies; b) paying claims; c) developing new products; or d) advising customers of our products and services. |
|
We use manual and electronic security procedures to maintain: a) the confidentiality; and b) the integrity of; Personal Information that we have. We use these procedures to guard against unauthorized access.
Some techniques we use to protect Personal Information include: a) secured files; b) user authentication; c) encryption; d) firewall technology; and e) the use of detection software.
We are responsible for and must: a) identify information to be protected; b) provide an adequate level of protection for that data; c) grant access to protected data only to those people who must use it in the performance of their job-related duties.
Employees who violate our Privacy Policy will be subject to discipline, which may include ending their employment with us.
At the start of our business relationship, we will give You a copy of our current Privacy Policy.
We will also give You a copy of our current Privacy Policy once a year if You maintain a continuing business relationship with us.
We will continue to follow our Privacy Policy regarding Personal Information even when a business relationship no longer exists between us.
|
As used in this Privacy Notice:
Application means your request for our product or service.
Personal Financial Information means financial information such as: a) credit history; b) income; c) financial benefits; or d) policy or claim information.
Personal Health Information means health information such as: a) your medical records; or b) information about your illness, disability or injury.
Personal Information means information that identifies You personally and is not otherwise available to the public. It includes: a) Personal Financial Information; and b) Personal Health Information.
Transaction means your business dealings with us, such as: a) your Application; b) your request for us to pay a claim; and c) your request for us to take an action on your account.
You means an individual who has given us Personal Information in conjunction with: a) asking about; b) applying for; or c) obtaining; a financial product or service from us if the product or service is used mainly for personal, family, or household purposes. |
This Privacy Policy is being provided on behalf of the following affiliates of The Hartford Financial Services Group, Inc.:
1stAGChoice, Inc.; Access CoverageCorp, Inc.; Access CoverageCorp Technologies, Inc.; American Maturity Life Insurance Company; Archway 60 R, LLC; Business Management Group, Inc.; Champlain Life Reinsurance Company; DMS R, LLC; Eloy R, LLC; Ersatz Corporation; First State Insurance Company; Hartford Accident and Indemnity Company; Hartford Administrative Services Company; Hartford Casualty General Agency, Inc.; Hartford Casualty Insurance Company; Hartford-Comprehensive Employee Benefit Service Company; Hartford Equity Sales Company, Inc.; Hartford Fire General Agency, Inc.; Hartford Fire Insurance Company; Hartford Funds Management Company, LLC; Hartford Funds Management Group, Inc.; Hartford HLS Series Fund II, Inc.; Hartford Insurance Company of Illinois; Hartford Insurance Company of the Midwest; Hartford Insurance Company of the Southeast; Hartford Integrated Technologies, Inc.; Hartford International Life Reassurance Corporation; Hartford Funds Distributors, LLC; Hartford Investment Management Company; Hartford Life and Accident Insurance Company; Hartford Life and Annuity Insurance Company; Hartford Life Insurance Company; Hartford Life Private Placement, LLC; Hartford Lloyd’s Corporation; Hartford Lloyd’s Insurance Company; Hartford Mezzanine Investors I, LLC; Hartford Residual Market, L.C.C.; Hartford Retirement Services, LLC; Hartford Securities Distribution Company, Inc.; Hartford Series Fund, Inc.; Hartford Specialty Insurance Services of Texas, LLC; Hartford Strategic Investments, LLC; Hartford Underwriters Insurance Company; Hartford Technology Services Company, L.L.C.; Hartford of Texas General Agency, Inc.; Hartford Underwriters General Agency, Inc.; HARTRE Company, L.C.C.; HL Investment Advisors, LLC; HLA LLC; Horizon Management Group, LLC; HRA Brokerage Services, Inc.; Lanidex Class B, LLC; M-CAP Insurance Agency, LLC; New England Insurance Company; New England Reinsurance Corporation; Nutmeg Insurance Agency, Inc.; Nutmeg Insurance Company; Pacific Insurance Company, Limited; Planco, LLC: Property and Casualty Insurance Company of Hartford; Revere R, LLC; RVR R, LLC; Sentinel Insurance Company, Ltd.; Sunstone R, LLC; Symphony R, LLC; The Evergreen Group Incorporated; The Hartford Alternative Strategies Fund; The Hartford Mutual Funds, Inc.; The Hartford Mutual Funds II, Inc.; Trumbull Flood Management, L.L.C.; Trumbull Insurance Company; Twin City Fire Insurance Company; White River Life Reinsurance Company.
HPP Revised January 2014
HARTFORDFUNDS
hartfordfunds.com
This information is written in connection with the promotion or marketing of the matter(s) addressed in this material.
This report is submitted for the general information of the shareholders of the Fund. It is not authorized for distribution unless preceded or accompanied by a current prospectus for the Fund.
The information cannot be used or relied upon for the purpose of avoiding IRS penalties. These materials are not intended to provide tax, accounting or legal advice. As with all matters of a tax or legal nature, you should consult your own tax or legal counsel for advice.
Investors should carefully consider the investment objectives, risks, charges, and expenses of Hartford Funds before investing. This and other information can be found in the prospectus and summary prospectus, which can be obtained by calling 888-843-7824 (retail) or 800-279-1541 (institutional). Investors should read them carefully before they invest.
Hartford Funds are underwritten and distributed by Hartford Funds Distributors, LLC.
MFAR-GLA14 12/14 113978-3 Printed in U.S.A.
HARTFORDFUNDS
|
HARTFORD
GLOBAL
2014 Annual Report
* Prior to March 1, 2014, Hartford Global Capital Appreciation Fund was known as The Hartford Capital Appreciation II Fund.
|
A MESSAGE FROM THE PRESIDENT
Dear Fellow Shareholders:
Thank you for investing in Hartford Funds.
Market Review
U.S. equities (as represented by the S&P 500 Index) rose steadily for the fiscal year ended October 31, 2014, with a return of 17.27% for the period. With the exception of short-lived geopolitical scares early in 2014 and concerns about continuing global growth near the end of the period, stocks generally rose on solid fundamentals and encouraging macroeconomic data during the year.
September 2014 marked the six-year anniversary of the start of the financial crisis. Within weeks of that anniversary, both the S&P 500 Index and the Dow Jones Industrial Average set new all-time highs, closing at 2,018 and 17,391, respectively, on October 31. Although the fallout of the crisis continues to influence investor behavior, stocks have recovered and risen dramatically, up 198% from their low in March 2009. Meanwhile, the domestic economy is notching strong growth, and the unemployment rate has reached its lowest level since August 2008.
While the U.S. economy appears to have stabilized and to have reverted to a solid growth path, the outlook for the global economy appears to have gotten cloudier. The U.S. Federal Reserve has ended quantitative easing, while Europe and Japan are pursuing stimulus options to avoid a double-dip recession and deflation, respectively. Diverging central-bank policies will likely continue to play an important role in market movements going forward as investors wait to see the reactions to their efforts and their impacts on global markets.
How have market movements impacted your portfolio throughout the last year? Are your investments still on track to provide the growth or income you need, and are you comfortable with their progress during times of volatility?
Your financial professional can help you navigate today’s markets with confidence, as well as assist you to achieve your investment goals by providing advice on the best options within our fund family to help you work toward overcoming today’s investing challenges. Meet with your financial advisor regularly to examine your portfolio and your investment strategy, and to determine if you’re still on track to meet your goals.
Thank you again for investing with Hartford Funds.
James Davey
President
Hartford Funds
1 The S&P 500 Index is a market capitalization-weighted price index composed of 500 widely held common stocks.
2 The Dow Jones Industrial Average is an unmanaged, price-weighted index of 30 of the largest, most widely held stocks traded on the NYSE
Hartford Global Capital Appreciation Fund
The views expressed in the Fund’s Manager Discussion under ‘‘Why did the Fund perform this way?’’ and ‘‘What is the outlook?’’ are views of the Fund’s sub-adviser and portfolio management team through the end of the period and are subject to change based on market and other conditions. The Fund’s Manager Discussion is for informational purposes only and does not represent an offer, recommendation or solicitation to buy, hold or sell any security. The specific securities identified and described, if any, do not represent all of the securities purchased or sold and you should not assume that investments in the securities identified and discussed will be profitable.
| Hartford Global Capital Appreciation Fund inception 04/29/2005 |
| (sub-advised by Wellington Management Company, LLP) |
| Investment objective – The Fund seeks growth of capital. |
Performance Overview 4/29/05 - 10/31/14

The chart above represents the hypothetical growth of a $10,000 investment in Class A, which includes a sales charge. Growth results in classes other than Class A will vary from what is seen above due to differences in the expenses charged to those share classes.
Average Annual Total Returns (as of 10/31/14)
| 1 Year | 5 Years | Since Inception▲ | ||||||||||
| Global Capital Appreciation A# | 9.39 | % | 14.04 | % | 9.25 | % | ||||||
| Global Capital Appreciation A## | 3.37 | % | 12.76 | % | 8.60 | % | ||||||
| Global Capital Appreciation B# | 8.59 | % | 13.14 | % | 8.53 | %* | ||||||
| Global Capital Appreciation B## | 3.59 | % | 12.89 | % | 8.53 | %* | ||||||
| Global Capital Appreciation C# | 8.65 | % | 13.21 | % | 8.47 | % | ||||||
| Global Capital Appreciation C## | 7.65 | % | 13.21 | % | 8.47 | % | ||||||
| Global Capital Appreciation I# | 9.72 | % | 14.38 | % | 9.55 | % | ||||||
| Global Capital Appreciation R3# | 9.27 | % | 13.82 | % | 9.10 | % | ||||||
| Global Capital Appreciation R4# | 9.61 | % | 14.19 | % | 9.40 | % | ||||||
| Global Capital Appreciation R5# | 9.73 | % | 14.39 | % | 9.60 | % | ||||||
| Global Capital Appreciation Y# | 9.83 | % | 14.50 | % | 9.71 | % | ||||||
| MSCI All Country World Index | 8.32 | % | 11.15 | % | 7.37 | % | ||||||
| Russell 3000 Index | 16.07 | % | 17.01 | % | 8.60 | % | ||||||
| ▲ | Inception: 04/29/2005 |
| # | Without sales charge |
| ## | With sales charge |
| * | Class B shares convert to Class A shares after 8 years. The return shown reflects the conversion to Class A shares, which had different operating expenses, for the period after conversion. |
PERFORMANCE DATA QUOTED REPRESENTS PAST PERFORMANCE AND DOES NOT GUARANTEE FUTURE RESULTS. The investment return and principal value of the investment will fluctuate so that investors’ shares, when redeemed, may be worth more or less than their original cost. Current performance may be lower or higher than the performance data quoted. To obtain performance data current to the most recent month-end, please visit our website www.hartfordfunds.com.
The initial investment in Class A shares reflects the maximum sales charge of 5.50% and returns for Class B shares reflect a contingent deferred sales charge of up to 5.00% and declining to zero, depending on the period of time the shares are held. Returns for Class C shares reflect a contingent deferred sales charge of up to 1.00% on shares redeemed within twelve months of purchase.
Total returns presented above were calculated using the Fund’s net asset value available to shareholders for sale or redemption of Fund shares on October 31, 2014, which may exclude investment transactions as of this date. All share class returns assume the reinvestment of all distributions at net asset value and the deduction of all fund expenses.
Effective 9/30/09, Class B shares of the Fund were closed to new investments.
Class I shares commenced operations on 8/31/06. Performance prior to that date is that of the Fund's Class A shares (excluding sales charges), which had different operating expenses. Class R3, R4 and R5 shares commenced operations on 12/22/06. Performance prior to that date is that of the Fund's Class Y shares, which had different operating expenses.
The Fund has changed its benchmark from the Russell 3000 Index to the MSCI All Country World Index. Hartford Funds Management Company, LLC believes that the MSCI All Country World Index better reflects the Fund’s revised investment strategy.
MSCI All Country World Index is a free float-adjusted market capitalization index that measures equity market performance in the global developed and emerging markets, consisting of 45 developed and emerging market country indices.
Russell 3000 Index is an unmanaged index that measures the performance of the 3,000 largest U.S. companies based on total market capitalization.
You cannot invest directly in an index.
The chart and table do not reflect the deductions of taxes that a shareholder would pay on Fund distributions or the redemption of Fund shares.
Performance information may reflect historical or current expense waivers/reimbursements from the investment adviser, without which performance would have been lower. For information on current expense waivers/reimbursements, please see the prospectus.
| 2 |
| Hartford Global Capital Appreciation Fund |
| Manager Discussion |
| October 31, 2014 (Unaudited) |
| Operating Expenses* | ||||||||
| Net | Gross | |||||||
| Global Capital Appreciation Class A | 1.25 | % | 1.30 | % | ||||
| Global Capital Appreciation Class B | 2.00 | % | 2.14 | % | ||||
| Global Capital Appreciation Class C | 2.00 | % | 2.01 | % | ||||
| Global Capital Appreciation Class I | 0.98 | % | 0.98 | % | ||||
| Global Capital Appreciation Class R3 | 1.35 | % | 1.58 | % | ||||
| Global Capital Appreciation Class R4 | 1.05 | % | 1.27 | % | ||||
| Global Capital Appreciation Class R5 | 0.95 | % | 0.99 | % | ||||
| Global Capital Appreciation Class Y | 0.87 | % | 0.87 | % | ||||
| * | As shown in the Fund's current prospectus dated March 1, 2014. Actual expenses may be higher or lower. Please see accompanying Financial Highlights for expense ratios for the year ended October 31, 2014. |
Gross expenses are the Fund's total annual operating expenses shown in the Fund's most recent prospectus. Net expenses are the Fund's total annual operating expenses shown in the Fund's most recent prospectus and reflect contractual expense reimbursements in instances when these reductions reduce the Fund's gross expenses. Contractual reimbursements remain in effect until February 28, 2015, and automatically renew for one-year terms unless terminated.
All investments are subject to risk including the possible loss of principal. For a discussion of the Fund’s risks, please see the Main Risks section of this report. For more detailed information on the risks associated with an investment in the Fund, please see the prospectus.
| Portfolio Managers | ||
| Kent M. Stahl, CFA | David W. Palmer, CFA | Nicolas M. Choumenkovitch |
| Senior Vice President and Director, Investments and Risk Management |
Senior Vice President and Equity Portfolio Manager |
Senior Vice President and Equity Portfolio Manager |
| Gregg R. Thomas, CFA | Frank D. Catrickes, CFA | Saul J. Pannell, CFA |
| Senior Vice President and Director, Risk Management |
Senior Vice President and Equity Portfolio Manager |
Senior Vice President and Equity Portfolio Manager |
| Michael T. Carmen, CFA | ||
| Senior Vice President and Equity Portfolio Manager |
How did the Fund perform?
The Class A shares of the Hartford Global Capital Appreciation Fund returned 9.39%, before sales charge, for the twelve-month period ended October 31, 2014, outperforming the Fund’s benchmark, the MSCI All Country World Index, which returned 8.32% for the same period. The Fund outperformed the 6.64% average return of the Lipper Global Multi-Cap Core Funds peer group, a group of funds with investment strategies similar to those of the Fund.
Why did the Fund perform this way?
Global equities rose during the period, notwithstanding bouts of significant volatility. Despite ongoing geopolitical tensions in Ukraine and the Middle East, concerns about a Chinese economic growth slowdown, and unsettling economic and political developments in several other emerging market countries, the five-year-old bull market continued in the first half of 2014. Robust merger and acquisition activity, along with continued accommodative monetary policy from central banks around the globe, aided positive investor sentiment in May and June. However, Portuguese banking woes, European economic malaise, and the prospect of an accelerated U.S. Federal Reserve (Fed) interest-rate-hike timeline all contributed to stall the global stock rally near the tail end of the period. In addition, China's property slump and poor gross domestic product (GDP) readings in Japan and the eurozone raised the specter of a slowdown in global economic growth. Nevertheless, there were several positive developments, including monetary easing by the European Central Bank and the People's Bank of China, as well as an encouraging U.S. corporate earnings season. Despite these positives, many market participants found ample reason to reassess their risk appetites (i.e., reduce risks), given the strong performance in recent years. During the period, emerging market equities underperformed their developed market counterparts and U.S. stocks generally outperformed non-U.S. stocks.
All ten sectors in the benchmark posted positive returns during the period. Strong performing sectors included Healthcare (+25%), Information Technology (+22%), and Utilities (+15%), while the Telecommunication Services (0%), Energy (+1%) and Materials (+2%) sectors lagged on a relative basis.
Lackluster security selection was the primary driver of the Fund’s relative underperformance during the period. Weak stock selection within the Industrials, Financials, Consumer Discretionary, and Energy sectors more than offset stronger selection in the Information Technology and Healthcare sectors. Sector allocation, a result of the bottom-up stock selection process, contributed to relative returns driven by overweight allocations the Information Technology and Healthcare sectors.
The top contributors to relative performance included SunEdison (Information Technology), Micron Technology (Information Technology), and NXP Semiconductors (Information Technology). Shares of SunEdison, a solar installation company, continued to rise during the period on further appreciation among investors of the
| 3 |
| Hartford Global Capital Appreciation Fund |
| Manager Discussion – (continued) |
| October 31, 2014 (Unaudited) |
value of the planned investment in the Yieldco entity, a publicly traded investment vehicle. We believe the solar market is at an inflection point at which costs have come down and growth is returning. The installation market remains fragmented, and we believe this is an opportunity for SunEdison to gain market share. Shares of Micron Technology, a U.S.-based semiconductor manufacturer, rose on improving expectations for demand for the company's products, solid execution, and reported better-than-expected results in the second quarter of 2014. The share price of Netherlands-based semiconductor company NXP Semiconductors moved higher as it continued to maintain its status as a well positioned semiconductor manufacturer. Overall, NXP continued to benefit from a powerful combination of product cycles, structural cost savings, margin expansion, and a competitive advantage in sizable markets such as identification and smart mobile businesses. Top contributors to absolute performance during the period also included Merck (health care).
The top detractors from relative performance during the period included Cobalt International Energy (Energy), Apple (Information Technology), and Rexel (Industrials). Shares of Cobalt International Energy, a U.S.-based oil-focused exploration and production company, declined due to disappointing well test results at multiple wells, uncertainty surrounding the impact of the SEC’s investigation into its Angola operations, and negative investor sentiment for the subsector. Shares of Apple, U.S.-based maker of an interconnected ecosystem of computing and mobile devices, rose after the company posted better-than-expected quarterly earnings and gave solid guidance for the fourth quarter; we owned a position in this stock but were underweight relative to the benchmark which detracted from benchmark-relative results. Rexel is a France-based global distributor of low voltage electrical products. The stock underperformed as margins disappointed and early 2014 earnings came in below consensus due to isolated issues, such as weather conditions in Canada, and a higher weighting in the sales of lower margin products. Japan Display (Information Technology) was also a top detractor from performance on an absolute basis.
Derivatives are not used in a significant manner in this Fund and did not have a material impact on performance during the period.
What is the outlook?
We believe the global cycle continues to advance at a moderate pace with a mix of stronger growth in the U.S. and more sluggish activity in Europe, Japan, and China. After three years of fiscal consolidation it appears that the U.S. expansion will no longer require support of the Fed and we believe policy tightening is on the horizon. Europe is adding layer after layer of central bank accommodation while Japan contemplates extending its quantitative easing program. In the meantime, China continues to use targeted easing measures to maintain growth. We believe that the combined effects of these policy actions will be the primary market driver in coming months. At the end of the period, Information Technology was our top overweight while Financials remained our largest underweight relative to the MSCI All Country World Index.
| 4 |
| Hartford Global Capital Appreciation Fund |
| Manager Discussion – (continued) |
| October 31, 2014 (Unaudited) |
Diversification by Country
as of October 31, 2014
| Percentage of | ||||
| Country | Net Assets | |||
| Argentina | 0.2 | % | ||
| Australia | 0.3 | |||
| Austria | 0.3 | |||
| Belgium | 1.0 | |||
| Brazil | 0.7 | |||
| Canada | 3.1 | |||
| Cayman Islands | 0.1 | |||
| Chile | 0.1 | |||
| China | 6.0 | |||
| Colombia | 0.2 | |||
| Denmark | 0.2 | |||
| Finland | 0.3 | |||
| France | 2.7 | |||
| Germany | 1.3 | |||
| Greece | 0.9 | |||
| Hong Kong | 1.7 | |||
| India | 0.7 | |||
| Indonesia | 0.1 | |||
| Ireland | 0.8 | |||
| Italy | 1.4 | |||
| Japan | 7.9 | |||
| Jersey | 0.1 | |||
| Luxembourg | 0.3 | |||
| Malaysia | 0.2 | |||
| Mexico | 0.4 | |||
| Netherlands | 2.6 | |||
| New Zealand | 0.0 | |||
| Norway | 0.6 | |||
| Philippines | 0.1 | |||
| Poland | 0.1 | |||
| Russia | 0.1 | |||
| Singapore | 0.1 | |||
| South Africa | 0.3 | |||
| South Korea | 0.8 | |||
| Spain | 0.4 | |||
| Sweden | 1.1 | |||
| Switzerland | 2.7 | |||
| Taiwan | 0.5 | |||
| Thailand | 0.4 | |||
| United Kingdom | 6.3 | |||
| United States | 50.4 | |||
| Short-Term Investments | 2.3 | |||
| Other Assets and Liabilities | 0.2 | |||
| Total | 100.0 | % | ||
Diversification by Sector
as of October 31, 2014
| Sector | Percentage of Net Assets |
|||
| Equity Securities | ||||
| Consumer Discretionary | 11.9 | % | ||
| Consumer Staples | 7.1 | |||
| Energy | 6.5 | |||
| Financials | 14.7 | |||
| Health Care | 13.9 | |||
| Industrials | 12.8 | |||
| Information Technology | 19.3 | |||
| Materials | 5.4 | |||
| Services | 2.7 | |||
| Utilities | 3.2 | |||
| Total | 97.5 | % | ||
| Short-Term Investments | 2.3 | |||
| Other Assets and Liabilities | 0.2 | |||
| Total | 100.0 | % | ||
A sector may be comprised of several industries. For Fund compliance purposes, the Fund may not use the same classification system and these sector classifications are used for reporting ease.
| 5 |
| Hartford Global Capital Appreciation Fund |
| Schedule of Investments |
| October 31, 2014 |
| (000’s Omitted) |
| Shares or Principal Amount | Market Value ╪ | |||||||
| Common Stocks - 96.5% | ||||||||
| Automobiles and Components - 0.8% | ||||||||
| 36 | Bajaj Automotive Ltd. | $ | 1,541 | |||||
| 690 | Chongqing Changan Automobile Co., Ltd. ● | 1,525 | ||||||
| 21 | Delphi Automotive plc | 1,476 | ||||||
| 18 | Denso Corp. | 816 | ||||||
| 441 | Dongfeng Motor Group Co., Ltd. | 683 | ||||||
| 145 | Fiat Chrysler Automobiles N.V. ● | 1,623 | ||||||
| 6 | Hyundai Motor Co., Ltd. | 992 | ||||||
| 28 | Isuzu Motors Ltd. | 364 | ||||||
| 69 | Musashi Seimitsu Industry Co., Ltd. | 1,358 | ||||||
| 12 | Toyota Industries Corp. | 586 | ||||||
| 485 | Xingda International Holdings | 168 | ||||||
| 11,132 | ||||||||
| Banks - 4.2% | ||||||||
| 2,398 | Alpha Bank A.E. ● | 1,563 | ||||||
| 189 | Banca Popolare dell-Emilia Romagna Scrl ● | 1,440 | ||||||
| 212 | Banco Bilbao Vizcaya Argentaria S.A. | 2,370 | ||||||
| 325 | Bangkok Bank Public Co. NVDR | 1,976 | ||||||
| 9,229 | Bank of Ireland ● | 3,633 | ||||||
| 64 | Bank of Nova Scotia | 3,933 | ||||||
| 183 | Barclays Bank plc ADR | 703 | ||||||
| 1,806 | Eurobank Ergasias S.A. ● | 627 | ||||||
| 352 | Grupo Financiero Banorte S.A.B. de C.V. | 2,255 | ||||||
| 37 | HDFC Bank Ltd. ADR | 1,931 | ||||||
| 391 | HSBC Holdings plc | 3,988 | ||||||
| 104 | ICICI Bank Ltd. | 2,750 | ||||||
| 2,568 | Industrial & Commercial Bank of China Ltd. | 1,705 | ||||||
| 1,658 | Mitsubishi UFJ Financial Group, Inc. | 9,664 | ||||||
| 1,758 | Piraeus Bank S.A. ● | 2,557 | ||||||
| 71 | PNC Financial Services Group, Inc. | 6,147 | ||||||
| 1,182 | Shinsei Bank Ltd. | 2,656 | ||||||
| 283 | Standard Chartered plc | 4,256 | ||||||
| 34 | Svenska Handelsbanken AB Class A | 1,617 | ||||||
| 83 | Wells Fargo & Co. | 4,383 | ||||||
| 60,154 | ||||||||
| Capital Goods - 8.8% | ||||||||
| 36 | Acuity Brands, Inc. | 4,968 | ||||||
| 158 | AECOM Technology Corp. ● | 5,147 | ||||||
| 905 | Alfa S.A.B. de C.V. | 2,889 | ||||||
| 100 | Arcam AB ● | 2,335 | ||||||
| 47 | Assa Abloy Ab | 2,471 | ||||||
| 176 | Atlas Copco Ab | 5,111 | ||||||
| 546 | Balfour Beatty plc | 1,348 | ||||||
| 15 | Belden, Inc. | 1,070 | ||||||
| 190 | Bombardier, Inc. Class B | 625 | ||||||
| 14 | Braas Monier Building Group ● | 284 | ||||||
| 1,857 | Capstone Turbine Corp. ● | 1,857 | ||||||
| 557 | China Lesso Group Holdings Ltd. | 292 | ||||||
| 1,944 | China Machinery Engineering Corp. | 1,104 | ||||||
| 64 | Compagnie De Saint-Gobain | 2,744 | ||||||
| 55 | Danaher Corp. | 4,386 | ||||||
| 76 | Denyo Co., Ltd. | 1,008 | ||||||
| 127 | DigitalGlobe, Inc. ● | 3,630 | ||||||
| 11 | Doosan Corp. | 1,134 | ||||||
| 11 | Eaton Corp. plc | 780 | ||||||
| 117 | Ellaktor S.A. ● | 331 | ||||||
| 11 | Esterline Technologies Corp. ● | 1,231 | ||||||
| 34 | Generac Holdings, Inc. ● | 1,533 | ||||||
| 67 | General Electric Co. | 1,719 | ||||||
| 118 | HD Supply Holdings, Inc. ● | 3,405 | ||||||
| 27 | KBR, Inc. | 523 | ||||||
| 100 | Kone Oyj Class B | 4,304 | ||||||
| 30 | Lockheed Martin Corp. | 5,739 | ||||||
| 127 | Masco Corp. | 2,807 | ||||||
| 33 | Mitsubishi Corp. | 649 | ||||||
| 7 | Moog, Inc. Class A ● | 542 | ||||||
| 57 | Nidec Corp. | 3,784 | ||||||
| 263 | Okuma Corp. | 1,888 | ||||||
| 118 | Orbital Sciences Corp. ● | 3,106 | ||||||
| 59 | Owens Corning, Inc. | 1,906 | ||||||
| 413 | Qinetiq Group plc | 1,338 | ||||||
| 65 | Raytheon Co. | 6,742 | ||||||
| 333 | Rexel S.A. | 5,596 | ||||||
| 17 | Rheinmetall AG | 745 | ||||||
| 24 | Safran S.A. | 1,545 | ||||||
| 105 | Schneider Electric S.A. | 8,300 | ||||||
| 225 | Shanghai Industrial Holdings Ltd. | 694 | ||||||
| 13 | Siemens AG | 1,511 | ||||||
| 18 | Sulzer AG | 2,102 | ||||||
| 22 | Teledyne Technologies, Inc. ● | 2,296 | ||||||
| 247 | Toshiba Corp. | 1,091 | ||||||
| 10 | TransDigm Group, Inc. | 1,878 | ||||||
| 52 | United Technologies Corp. | 5,578 | ||||||
| 152 | Vallourec S.A. | 5,555 | ||||||
| 50 | Wienerberger AG | 608 | ||||||
| 179 | Zumtobel Group AG | 3,151 | ||||||
| 125,380 | ||||||||
| Commercial and Professional Services - 1.3% | ||||||||
| 39 | ACCO Brands Corp. ● | 318 | ||||||
| 19 | Clean Harbors, Inc. ● | 923 | ||||||
| 111 | Edenred | 3,067 | ||||||
| 175 | Enernoc, Inc. ● | 2,591 | ||||||
| 31 | Equifax, Inc. | 2,362 | ||||||
| 32 | IHS, Inc. ● | 4,173 | ||||||
| 117 | Knoll, Inc. | 2,332 | ||||||
| 37 | Nielsen N.V. | 1,579 | ||||||
| 32 | Robert Half International, Inc. | 1,779 | ||||||
| 19,124 | ||||||||
| Consumer Durables and Apparel - 1.8% | ||||||||
| 39 | Brunello Cucinelli S.p.A. | 782 | ||||||
| 151 | Crocs, Inc. ● | 1,764 | ||||||
| 47 | D.R. Horton, Inc. | 1,069 | ||||||
| 80 | Electrolux AB Series B | 2,271 | ||||||
| 47 | Kate Spade & Co. ● | 1,280 | ||||||
| 37 | Lululemon Athletica, Inc. ● | 1,546 | ||||||
| 47 | Luxottica Group S.p.A. | 2,391 | ||||||
| 40 | Persimmon plc | 940 | ||||||
| 275 | Pulte Group, Inc. | 5,286 | ||||||
| 1,272 | Samsonite International S.A. | 4,227 | ||||||
| 416 | Truly International Holdings | 211 | ||||||
| 25 | Whirlpool Corp. | 4,263 | ||||||
| 26,030 | ||||||||
| Consumer Services - 1.9% | ||||||||
| 36 | Boyd Gaming Corp. ● | 419 | ||||||
| 251 | Compass Group plc ● | 4,044 | ||||||
| 100 | Hilton Worldwide Holdings, Inc. ● | 2,513 | ||||||
| 54 | Home Inns & Hotels Management, Inc. ● | 1,632 | ||||||
| 388 | Kroton Educacional S.A. | 2,768 | ||||||
| 844 | Mandarin Oriental International Ltd. | 1,486 | ||||||
| 53 | McDonald's Corp. | 4,955 | ||||||
The accompanying notes are an integral part of these financial statements.
| 6 |
| Hartford Global Capital Appreciation Fund |
| Schedule of Investments – (continued) |
| October 31, 2014 |
| (000’s Omitted) |
| Shares or Principal Amount | Market Value ╪ | |||||||
| Common Stocks - 96.5% - (continued) | ||||||||
| Consumer Services - 1.9% - (continued) | ||||||||
| 79 | New Oriental Education & Technology Group, Inc. ADR ● | $ | 1,717 | |||||
| 60 | Norwegian Cruise Line Holdings Ltd. ● | 2,328 | ||||||
| 198 | Opap S.A. | 2,402 | ||||||
| 9 | Outerwall, Inc. ● | 538 | ||||||
| 216 | Sands China Ltd. | 1,347 | ||||||
| 17 | Wyndham Worldwide Corp. | 1,307 | ||||||
| 27,456 | ||||||||
| Diversified Financials - 4.2% | ||||||||
| 283 | Anima Holding S.p.A. ● | 1,327 | ||||||
| 115 | Ares Capital Corp. | 1,831 | ||||||
| 121 | Banca Generali S.p.A. | 3,206 | ||||||
| 21 | BlackRock, Inc. | 7,305 | ||||||
| 319 | BM & F Bovespa S.A. | 1,403 | ||||||
| 38 | Bolsas Y Mercados Espanoles | 1,463 | ||||||
| 31 | Citigroup, Inc. | 1,673 | ||||||
| 135 | EFG International AG | 1,402 | ||||||
| 30 | Element Financial Corp. ● | 349 | ||||||
| 612 | Henderson Group plc | 2,061 | ||||||
| 53 | Hong Kong Exchanges & Clearing Ltd. | 1,181 | ||||||
| 166 | Ichiyoshi Securities Co., Ltd. | 1,963 | ||||||
| 277 | ING Groep N.V. ● | 3,964 | ||||||
| 28 | Japan Exchange Group, Inc. | 701 | ||||||
| 108 | JP Morgan Chase & Co. | 6,542 | ||||||
| 183 | Julius Baer Group Ltd. | 8,033 | ||||||
| 118 | Legg Mason, Inc. | 6,115 | ||||||
| 178 | Mitsubishi UFJ Lease & Finance Co., Ltd. | 939 | ||||||
| 64 | Nomad Holdings Ltd. ●† | 738 | ||||||
| 82 | Platform Specialty Products Corp. PIPE ⌂●† | 1,983 | ||||||
| 111 | Platform Specialty Products Corp. ● | 2,873 | ||||||
| 59 | Solar Cayman Ltd. ⌂■●† | 4 | ||||||
| 151 | UBS AG | 2,629 | ||||||
| 68 | Wisdomtree Investment, Inc. ● | 997 | ||||||
| 60,682 | ||||||||
| Energy - 6.5% | ||||||||
| 7 | Anadarko Petroleum Corp. | 685 | ||||||
| 215 | BG Group plc | 3,576 | ||||||
| 88 | Cabot Oil & Gas Corp. | 2,733 | ||||||
| 140 | Cameco Corp. | 2,439 | ||||||
| 13 | Canadian Natural Resources Ltd. | 437 | ||||||
| 31 | Canadian Natural Resources Ltd. ADR | 1,078 | ||||||
| 86 | Chevron Corp. | 10,321 | ||||||
| 5,700 | China Suntien Green Energy | 1,514 | ||||||
| 428 | Cobalt International Energy, Inc. ● | 5,006 | ||||||
| 83 | Enbridge, Inc. | 3,943 | ||||||
| 25 | Energen Corp. | 1,672 | ||||||
| 40 | Halliburton Co. | 2,181 | ||||||
| 4,267 | Hilong Holdings Ltd. | 1,387 | ||||||
| 40 | HollyFrontier Corp. | 1,817 | ||||||
| 12 | Hornbeck Offshore Services, Inc. ● | 380 | ||||||
| 181 | Imperial Oil Ltd. | 8,687 | ||||||
| 627 | Karoon Gas Australia Ltd. ● | 1,637 | ||||||
| 71 | McDermott International, Inc. ● | 274 | ||||||
| 41 | National Oilwell Varco, Inc. | 3,006 | ||||||
| 152 | OAO Gazprom Class S ADR | 1,007 | ||||||
| 152 | Pacific Rubiales Energy Corp. | 2,294 | ||||||
| 2,000 | PetroChina Co., Ltd. | 2,504 | ||||||
| 344 | Petroleo Brasileiro S.A. ADR | 4,164 | ||||||
| 109 | Petroleum Geo-Services ASA | 543 | ||||||
| 27 | Phillips 66 | 2,110 | ||||||
| 45 | Pioneer Natural Resources Co. | 8,599 | ||||||
| 22 | QEP Resources, Inc. | 552 | ||||||
| 35 | Range Resources Corp. | 2,392 | ||||||
| 65 | Royal Dutch Shell plc Class B | 2,401 | ||||||
| 89 | Southwestern Energy Co. ● | 2,909 | ||||||
| 33 | Total S.A. | 1,967 | ||||||
| 471 | Trican Well Service Ltd. | 4,217 | ||||||
| 370 | Tsakos Energy Navigation Ltd. | 2,505 | ||||||
| 66 | YPF Sociedad Anonima ADR | 2,328 | ||||||
| 93,265 | ||||||||
| Food and Staples Retailing - 1.0% | ||||||||
| 26 | Alimentation Couche-Tard, Inc. | 882 | ||||||
| 8 | CVS Health Corp. | 721 | ||||||
| 6 | E-Mart Co., Ltd. | 1,179 | ||||||
| 71 | Seven & I Holdings Co., Ltd. | 2,766 | ||||||
| 18 | Walgreen Co. | 1,143 | ||||||
| 101 | Wal-Mart Stores, Inc. | 7,676 | ||||||
| 14,367 | ||||||||
| Food, Beverage and Tobacco - 5.4% | ||||||||
| 73 | Ambev S.A. | 490 | ||||||
| 105 | Anheuser-Busch InBev N.V. | 11,651 | ||||||
| 119 | British American Tobacco plc | 6,762 | ||||||
| 799 | C&C Group plc | 3,561 | ||||||
| 220 | Coca-Cola Co. | 9,223 | ||||||
| 174 | Diageo Capital plc | 5,141 | ||||||
| 209 | Greencore Group plc | 877 | ||||||
| 102 | Imperial Tobacco Group plc | 4,412 | ||||||
| 15 | Japan Tobacco, Inc. | 515 | ||||||
| 23 | Kraft Foods Group, Inc. | 1,279 | ||||||
| 3,308 | LT Group, Inc. | 1,049 | ||||||
| 286 | Mondelez International, Inc. | 10,088 | ||||||
| 58 | Monster Beverage Corp. ● | 5,834 | ||||||
| 68 | Nestle S.A. | 4,993 | ||||||
| 36 | Post Holdings, Inc. ● | 1,331 | ||||||
| 745 | Treasury Wine Estates Ltd. | 3,043 | ||||||
| 31 | Unilever N.V. | 1,201 | ||||||
| 114 | Unilever N.V. NY Shares ADR | 4,417 | ||||||
| 531 | Vina Concha Y Tora S.A. | 1,022 | ||||||
| 76,889 | ||||||||
| Health Care Equipment and Services - 1.8% | ||||||||
| 28 | Aetna, Inc. | 2,277 | ||||||
| 11 | Becton, Dickinson & Co. | 1,450 | ||||||
| 59 | Cardinal Health, Inc. | 4,642 | ||||||
| 1,551 | CareView Communications, Inc. ●† | 475 | ||||||
| 73 | Envision Healthcare Holdings ● | 2,552 | ||||||
| 19 | HCA Holdings, Inc. ● | 1,326 | ||||||
| 63 | Medtronic, Inc. | 4,321 | ||||||
| 131 | Nikkiso Co., Ltd. | 1,354 | ||||||
| 17 | Olympus Corp. ● | 625 | ||||||
| 63 | UnitedHealth Group, Inc. | 6,000 | ||||||
| 9 | Universal Health Services, Inc. Class B | 966 | ||||||
| 25,988 | ||||||||
| Household and Personal Products - 0.7% | ||||||||
| 78 | Coty, Inc. | 1,294 | ||||||
| 87 | Procter & Gamble Co. | 7,561 | ||||||
| 45 | Svenska Cellulosa AB Class B | 1,006 | ||||||
| 9,861 | ||||||||
| Insurance - 4.2% | ||||||||
| 38 | ACE Ltd. | 4,157 | ||||||
| 37 | Ageas | 1,236 | ||||||
The accompanying notes are an integral part of these financial statements.
| 7 |
| Hartford Global Capital Appreciation Fund |
| Schedule of Investments – (continued) |
| October 31, 2014 |
| (000’s Omitted) |
| Shares or Principal Amount | Market Value ╪ | |||||||
| Common Stocks - 96.5% - (continued) | ||||||||
| Insurance - 4.2% - (continued) | ||||||||
| 1,092 | AIA Group Ltd. | $ | 6,095 | |||||
| 270 | American International Group, Inc. | 14,474 | ||||||
| 379 | Assicurazioni Generali S.p.A. | 7,768 | ||||||
| 130 | Delta Lloyd N.V. | 2,969 | ||||||
| 489 | Direct Line Insurance Group plc | 2,161 | ||||||
| 34 | Marsh & McLennan Cos., Inc. | 1,832 | ||||||
| 110 | MetLife, Inc. | 5,961 | ||||||
| 93 | Ping An Insurance (Group) Co. | 760 | ||||||
| 46 | Principal Financial Group, Inc. | 2,388 | ||||||
| 356 | T&D Holdings, Inc. | 4,584 | ||||||
| 19 | Zurich Financial Services AG | 5,669 | ||||||
| 60,054 | ||||||||
| Materials - 5.4% | ||||||||
| 32 | Air Liquide | 3,834 | ||||||
| 29 | Akzo Nobel N.V. | 1,935 | ||||||
| 1,818 | AMVIG Holdings Ltd. | 851 | ||||||
| 29 | Barrick Gold Corp. | 348 | ||||||
| 43 | BASF SE | 3,837 | ||||||
| 22 | Berry Plastics Group, Inc. ● | 573 | ||||||
| 51 | BHP Billiton plc | 1,317 | ||||||
| 6 | Cabot Corp. | 297 | ||||||
| 37 | Celanese Corp. | 2,170 | ||||||
| 1,122 | China Resources Cement | 763 | ||||||
| 76 | Constellium N.V. ● | 1,549 | ||||||
| 87 | CRH plc | 1,942 | ||||||
| 29 | Crown Holdings, Inc. ● | 1,400 | ||||||
| 59 | E.I. DuPont de Nemours & Co. | 4,101 | ||||||
| 9 | Ecolab, Inc. | 993 | ||||||
| 88 | Eldorado Gold Corp. | 479 | ||||||
| – | Givaudan | 755 | ||||||
| 324 | Glencore plc | 1,664 | ||||||
| 4,101 | Greatview Aseptic Packaging Co., Ltd. | 2,686 | ||||||
| 165 | Harmony Gold Mining Co., Ltd. ● | 266 | ||||||
| 101 | Headwaters, Inc. ● | 1,288 | ||||||
| 921 | Huabao International Holdings Ltd. | 659 | ||||||
| 121 | International Paper Co. | 6,132 | ||||||
| 846 | Ivanhoe Mines Ltd. ● | 638 | ||||||
| 185 | JSR Corp. | 3,332 | ||||||
| 124 | Kinross Gold Corp. ● | 266 | ||||||
| 28 | Martin Marietta Materials, Inc. | 3,311 | ||||||
| 44 | Methanex Corp. ADR | 2,616 | ||||||
| 150 | Norbord, Inc. | 2,927 | ||||||
| 31 | Packaging Corp. of America | 2,214 | ||||||
| 42 | Praxair, Inc. | 5,251 | ||||||
| 978 | PTT Chemical Public Co., Ltd. | 1,856 | ||||||
| 50 | Reliance Steel & Aluminum | 3,392 | ||||||
| 33 | Rio Tinto plc | 1,554 | ||||||
| 63 | Rio Tinto plc ADR | 3,021 | ||||||
| 47 | Smurfit Kappa Group plc | 966 | ||||||
| 45 | Vulcan Materials Co. | 2,755 | ||||||
| 26 | Wacker Chemie AG | 3,094 | ||||||
| 77,032 | ||||||||
| Media - 1.6% | ||||||||
| 77 | Avex, Inc. | 1,147 | ||||||
| 11 | Comcast Corp. Class A | 598 | ||||||
| 216 | DHX Media Ltd. ● | 1,916 | ||||||
| 16 | DISH Network Corp. ● | 1,025 | ||||||
| 8 | DreamWorks Animation SKG, Inc. ● | 177 | ||||||
| 1,277 | Major Cineplex Group Public Co., Ltd. | 933 | ||||||
| 17 | McGraw Hill Financial, Inc. | 1,503 | ||||||
| 29 | Naspers Ltd. | 3,577 | ||||||
| 36 | Pandora Media, Inc. ● | 685 | ||||||
| 83 | Quebecor, Inc. | 2,118 | ||||||
| 114 | SES Global S.A. | 3,953 | ||||||
| 2,573 | Solocal Group ● | 1,581 | ||||||
| 2 | Tribune Media Co. Class A ● | 133 | ||||||
| 217 | TVN S.A. | 970 | ||||||
| 60 | Wolters Kluwer N.V. | 1,594 | ||||||
| 74 | WPP plc | 1,442 | ||||||
| 23,352 | ||||||||
| Pharmaceuticals, Biotechnology and Life Sciences - 12.1% | ||||||||
| 47 | Actavis plc ● | 11,303 | ||||||
| 8 | Agios Pharmaceuticals, Inc. ● | 640 | ||||||
| 22 | Alkermes plc ● | 1,127 | ||||||
| 87 | Almirall S.A. ● | 1,426 | ||||||
| 21 | Alnylam Pharmaceuticals, Inc. ● | 1,910 | ||||||
| 252 | Arena Pharmaceuticals, Inc. ● | 1,100 | ||||||
| 297 | AstraZeneca plc | 21,696 | ||||||
| 124 | AstraZeneca plc ADR | 9,068 | ||||||
| 571 | Bristol-Myers Squibb Co. | 33,215 | ||||||
| 15 | Celgene Corp. ● | 1,566 | ||||||
| 490 | China Shineway Pharmaceutical Group Ltd. | 884 | ||||||
| 61 | Daiichi Sankyo Co., Ltd. | 912 | ||||||
| 71 | Eisai Co., Ltd. | 2,781 | ||||||
| 29 | Eli Lilly & Co. | 1,914 | ||||||
| 36 | Gilead Sciences, Inc. ● | 4,022 | ||||||
| 8 | Illumina, Inc. ● | 1,545 | ||||||
| 19 | Incyte Corp. ● | 1,287 | ||||||
| 48 | Innate Pharma S.A. ● | 439 | ||||||
| 60 | Johnson & Johnson | 6,481 | ||||||
| 338 | Merck & Co., Inc. | 19,590 | ||||||
| 98 | Ono Pharmaceutical Co., Ltd. | 9,861 | ||||||
| 76 | Portola Pharmaceuticals, Inc. ● | 2,168 | ||||||
| 15 | PTC Therapeutics, Inc. ● | 622 | ||||||
| 2 | Receptos, Inc. ● | 249 | ||||||
| 14 | Regeneron Pharmaceuticals, Inc. ● | 5,624 | ||||||
| 38 | Roche Holding AG | 11,177 | ||||||
| 12 | Salix Pharmaceuticals Ltd. ● | 1,746 | ||||||
| 20 | Sanofi ADR | 929 | ||||||
| 31 | Shionogi & Co., Ltd. | 798 | ||||||
| 55 | Takeda Pharmaceutical Co., Ltd. | 2,402 | ||||||
| 53 | Tesaro, Inc. ● | 1,487 | ||||||
| 923 | TherapeuticsMD, Inc. ● | 4,096 | ||||||
| 25 | UCB S.A. | 1,984 | ||||||
| 35 | Vertex Pharmaceuticals, Inc. ● | 3,920 | ||||||
| 82 | Zoetis, Inc. | 3,038 | ||||||
| 173,007 | ||||||||
| Real Estate - 2.1% | ||||||||
| 16 | AvalonBay Communities, Inc. REIT | 2,484 | ||||||
| 27,667 | Bekasi Fajar Industrial Estate Tbk PT | 1,340 | ||||||
| 115 | Castellum AB | 1,764 | ||||||
| 63 | CBRE Group, Inc. ● | 2,001 | ||||||
| 312 | China Resources Land Ltd. | 742 | ||||||
| 175 | City Developments Ltd. | 1,288 | ||||||
| 53 | Deutsche Annington Immobile | 1,546 | ||||||
| 66 | Deutsche Wohnen AG | 1,498 | ||||||
| 105 | E-House China Holdings Ltd. | 1,050 | ||||||
| 118 | Grivalia Properties REIC | 1,278 | ||||||
| 514 | Hibernia REIT ●☼ | 707 | ||||||
| 17 | Icade REIT | 1,322 | ||||||
The accompanying notes are an integral part of these financial statements.
| 8 |
| Hartford Global Capital Appreciation Fund |
| Schedule of Investments – (continued) |
| October 31, 2014 |
| (000’s Omitted) |
| Shares or Principal Amount | Market Value ╪ | |||||||
| Common Stocks - 96.5% - (continued) | ||||||||
| Real Estate - 2.1% - (continued) | ||||||||
| 453 | Leopalace21 Corp. ● | $ | 2,839 | |||||
| 170 | Mitsui Fudosan Co., Ltd. | 5,466 | ||||||
| 53 | Realogy Holdings Corp. ● | 2,193 | ||||||
| 151 | Two Harbors Investment Corp. REIT | 1,531 | ||||||
| 27 | Weyerhaeuser Co. REIT | 908 | ||||||
| 29,957 | ||||||||
| Retailing - 5.4% | ||||||||
| 54 | Advance Automotive Parts, Inc. ‡ | 7,953 | ||||||
| 727 | Allstar Co. ⌂●† | 617 | ||||||
| 18 | Amazon.com, Inc. ● | 5,511 | ||||||
| 43 | American Eagle Outfitters, Inc. | 551 | ||||||
| 32 | ASOS plc ● | 1,373 | ||||||
| 2 | AutoZone, Inc. ● | 1,308 | ||||||
| 1,908 | Baoxin Automotive Group Ltd. | 1,456 | ||||||
| 144 | Coupons.com, Inc. ● | 2,002 | ||||||
| 33 | GNC Holdings, Inc. | 1,384 | ||||||
| 794 | Groupon, Inc. ● | 5,806 | ||||||
| 6 | Honest (The) Co. ⌂●† | 145 | ||||||
| 18 | HSN, Inc. | 1,214 | ||||||
| 9 | Hyundai Home Shopping Network Corp. | 1,182 | ||||||
| 7,629 | Intime Retail Group Co., Ltd. | 6,644 | ||||||
| 17 | L Brands, Inc. | 1,237 | ||||||
| 131 | Lowe's Cos., Inc. | 7,486 | ||||||
| 553 | Luk Fook Holdings International Ltd. | 1,649 | ||||||
| 3,134 | Maoye International Holdings | 485 | ||||||
| 184 | Marks & Spencer Group plc | 1,200 | ||||||
| 9 | Netflix, Inc. ● | 3,632 | ||||||
| 1 | Priceline (The) Group, Inc. ● | 925 | ||||||
| 242 | Rakuten, Inc. | 2,729 | ||||||
| 57 | Rent-A-Center, Inc. | 1,771 | ||||||
| 33 | Restoration Hardware Holdings, Inc. ● | 2,622 | ||||||
| 13 | Signet Jewelers Ltd. | 1,530 | ||||||
| 149 | TJX Cos., Inc. | 9,427 | ||||||
| 39 | Tory Burch LLC ⌂●† | 2,585 | ||||||
| 68 | Tuesday Morning Corp. ● | 1,395 | ||||||
| 1,085 | Zhongsheng Group Holdings Ltd. | 1,118 | ||||||
| 76,937 | ||||||||
| Semiconductors and Semiconductor Equipment - 6.6% | ||||||||
| 443 | Applied Materials, Inc. | 9,795 | ||||||
| 23,739 | GCL-Poly Energy Holdings Ltd. ● | 8,000 | ||||||
| 121 | Hynix Semiconductor, Inc. ● | 5,391 | ||||||
| 245 | Intel Corp. | 8,339 | ||||||
| 253 | Maxim Integrated Products, Inc. | 7,431 | ||||||
| 335 | Micron Technology, Inc. ● | 11,079 | ||||||
| 173 | NXP Semiconductors N.V. ● | 11,865 | ||||||
| 114 | RF Micro Devices, Inc. ● | 1,481 | ||||||
| 2 | Samsung Electronics Co., Ltd. | 1,778 | ||||||
| 1,041 | Sumco Corp. ☼ | 14,003 | ||||||
| 216 | SunEdison, Inc. ● | 4,215 | ||||||
| 174 | SunPower Corp. ● | 5,540 | ||||||
| 679 | Taiwan Semiconductor Manufacturing Co., Ltd. | 2,943 | ||||||
| 102 | Taiwan Semiconductor Manufacturing Co., Ltd. ADR | 2,253 | ||||||
| 94,113 | ||||||||
| Software and Services - 8.2% | ||||||||
| 71 | 21Vianet Group, Inc. ADR ● | 1,488 | ||||||
| 23 | Accenture plc | 1,894 | ||||||
| 624 | Activision Blizzard, Inc. | 12,447 | ||||||
| 21 | Adobe Systems, Inc. ● | 1,471 | ||||||
| 58 | Akamai Technologies, Inc. ● | 3,520 | ||||||
| 115 | Alibaba Group Holding Ltd. ● | 11,343 | ||||||
| 82 | Angie's List, Inc. ● | 572 | ||||||
| 80 | AOL, Inc. ● | 3,470 | ||||||
| 42 | Automatic Data Processing, Inc. | 3,456 | ||||||
| 38 | Baidu, Inc. ADR ● | 9,041 | ||||||
| 176 | Cadence Design Systems, Inc. ● | 3,152 | ||||||
| 32 | ChinaCache International Holdings Ltd. ADR ● | 332 | ||||||
| 110 | Cia Brasileira de Meios de Pagamentos | 1,811 | ||||||
| 86 | Comverse, Inc. ● | 1,866 | ||||||
| 473 | Corindus Vascular Robotics, Inc. PIPE ⌂●† | 1,729 | ||||||
| 8 | CoStar Group, Inc. ● | 1,237 | ||||||
| 38 | Ellie Mae, Inc. ● | 1,475 | ||||||
| 69 | Facebook, Inc. ● | 5,202 | ||||||
| 14 | Google, Inc. Class C ● | 7,759 | ||||||
| 19 | IAC/InterActiveCorp. | 1,310 | ||||||
| 11 | IBM Corp. | 1,732 | ||||||
| 132 | Kakaku.com, Inc. | 1,800 | ||||||
| 48 | Markit Ltd. ● | 1,230 | ||||||
| 322 | Microsoft Corp. | 15,111 | ||||||
| 562 | Monster Worldwide, Inc. ● | 2,168 | ||||||
| 11 | NetEase, Inc. ADR | 1,060 | ||||||
| 527 | Optimal Payments plc ● | 3,739 | ||||||
| 116 | Oracle Corp. | 4,542 | ||||||
| 17 | Rovi Corp. ● | 351 | ||||||
| 39 | Salesforce.com, Inc. ● | 2,506 | ||||||
| 14 | Tableau Software, Inc. ● | 1,172 | ||||||
| 54 | Tangoe, Inc. ● | 791 | ||||||
| 73 | Teradata Corp. ● | 3,091 | ||||||
| 47 | UbiSoft Entertainment S.A. ● | 853 | ||||||
| 30 | Verint Systems, Inc. ● | 1,698 | ||||||
| 3 | Xero Ltd. ● | 33 | ||||||
| 12 | Yelp, Inc. ● | 733 | ||||||
| 117,185 | ||||||||
| Technology Hardware and Equipment - 4.0% | ||||||||
| 227 | Apple, Inc. | 24,494 | ||||||
| 182 | Aruba Networks, Inc. ● | 3,925 | ||||||
| 281 | Cisco Systems, Inc. | 6,869 | ||||||
| 84 | EMC Corp. | 2,401 | ||||||
| 198 | Hitachi Ltd. | 1,556 | ||||||
| 175 | Japan Display, Inc. ● | 520 | ||||||
| 44 | Juniper Networks, Inc. | 919 | ||||||
| 14 | Loral Space & Communications, Inc. ● | 1,043 | ||||||
| 719 | NEC Corp. | 2,543 | ||||||
| 903 | ParkerVision, Inc. ● | 1,182 | ||||||
| 14 | Qualcomm, Inc. | 1,115 | ||||||
| 14 | Stratasys Ltd. ● | 1,721 | ||||||
| 67 | TE Connectivity Ltd. | 4,092 | ||||||
| 26 | Western Digital Corp. | 2,524 | ||||||
| 1,761 | WPG Holdings Co., Ltd. | 2,145 | ||||||
| 57,049 | ||||||||
| Telecommunication Services - 2.7% | ||||||||
| 244 | Gogo, Inc. ● | 4,056 | ||||||
| 91 | Hellenic Telecommunications Organization S.A. ● | 1,028 | ||||||
| 1,095 | Koninklijke (Royal) KPN N.V. | 3,606 | ||||||
| 23 | Level 3 Communications, Inc. ● | 1,093 | ||||||
| 96 | Nippon Telegraph & Telephone Corp. | 5,973 | ||||||
| 296 | NTT DoCoMo, Inc. | 4,987 | ||||||
| 2 | SK Telecom Co., Ltd. | 505 | ||||||
| 70 | SoftBank Corp. | 5,067 | ||||||
| 393 | Telecom Italia S.p.A. ● | 445 | ||||||
The accompanying notes are an integral part of these financial statements.
| 9 |
| Hartford Global Capital Appreciation Fund |
| Schedule of Investments – (continued) |
| October 31, 2014 |
| (000’s Omitted) |
| Shares or Principal Amount | Market Value ╪ | |||||||
| Common Stocks - 96.5% - (continued) | ||||||||
| Telecommunication Services - 2.7% - (continued) | ||||||||
| 343 | Telenor ASA | $ | 7,721 | |||||
| 471 | Total Access Communication Public Co., Ltd. | 1,498 | ||||||
| 37 | Verizon Communications, Inc. | 1,839 | ||||||
| 242 | Vodafone Group plc | 805 | ||||||
| 18 | Zayo Group Holdings, Inc. ● | 414 | ||||||
| 39,037 | ||||||||
| Transportation - 2.6% | ||||||||
| 4,648 | AirAsia Berhad | 3,533 | ||||||
| 70 | Canadian National Railway Co. | 4,924 | ||||||
| 41 | Deutsche Lufthansa AG | 613 | ||||||
| 44 | Deutsche Post AG | 1,377 | ||||||
| 103 | DSV AS | 3,080 | ||||||
| 109 | Groupe Eurotunnel S.A. | 1,374 | ||||||
| 108 | Hitachi Transport System Ltd. | 1,424 | ||||||
| 253 | International Consolidated Airlines Group S.A. ● | 1,660 | ||||||
| 2,498 | Jiangsu Express Co., Ltd. | 2,790 | ||||||
| 7 | Kansas City Southern | 828 | ||||||
| 16 | Kuehne & Nagel International AG | 2,084 | ||||||
| 319 | Mitsui O.S.K. Lines Ltd. | 1,009 | ||||||
| 288 | Nippon Yusen | 747 | ||||||
| 25 | Norfolk Southern Corp. | 2,763 | ||||||
| 1,284 | Pacific Basin Ship | 618 | ||||||
| 15 | United Continental Holdings, Inc. ● | 810 | ||||||
| 62 | United Parcel Service, Inc. Class B | 6,460 | ||||||
| 116 | UTI Worldwide, Inc. ● | 1,272 | ||||||
| 37,366 | ||||||||
| Utilities - 3.2% | ||||||||
| 428 | Cheung Kong Infrastructure Holdings Ltd. | 3,125 | ||||||
| 10,902 | China Longyuan Power Group Corp. | 11,626 | ||||||
| 192 | China Resources Gas Group LT | 549 | ||||||
| 29 | Edison International | 1,815 | ||||||
| 1,137 | ENN Energy Holdings Ltd. | 7,378 | ||||||
| 3,357 | Guangdong Investment Ltd. | 4,415 | ||||||
| 282 | Hokkaido Electric Power Co. ● | 2,369 | ||||||
| 896 | Huadian Fuxin Energy Corp., Ltd. | 516 | ||||||
| 130 | Kyushu Electric Power Co., Inc. ● | 1,406 | ||||||
| 115 | National Grid plc | 1,707 | ||||||
| 1,478 | NTPC Ltd. | 3,610 | ||||||
| 529 | Snam S.p.A. | 2,860 | ||||||
| 19 | Southern Co. | 885 | ||||||
| 1,319 | Towngas China Co., Ltd. | 1,385 | ||||||
| 65 | Xcel Energy, Inc. | 2,176 | ||||||
| 45,822 | ||||||||
| Total Common Stocks | ||||||||
| ( Cost $1,357,704) | $ | 1,381,239 | ||||||
| Preferred Stocks - 1.0% | ||||||||
| Capital Goods - 0.1% | ||||||||
| 132 | Lithium Technology Corp. ⌂●† | $ | 735 | |||||
| Consumer Durables and Apparel - 0.1% | ||||||||
| 15 | Cloudera, Inc. ⌂●† | 366 | ||||||
| 47 | One Kings Lane, Inc. ⌂●† | 711 | ||||||
| 1,077 | ||||||||
| Media - 0.3% | ||||||||
| 115 | ProSieben Sat.1 Media AG | 4,653 | ||||||
| Retailing - 0.0% | ||||||||
| 14 | Honest (The) Co. Series C ⌂●†β | 339 | ||||||
| Software and Services - 0.4% | ||||||||
| 143 | Apigee Corp. ⌂●† | 470 | ||||||
| 11 | Dropbox, Inc. ⌂●† | 214 | ||||||
| 243 | Essence Holding Group ⌂●† | 346 | ||||||
| 18 | LendingClub Corp. ⌂●† | 165 | ||||||
| 39 | Lookout, Inc. ⌂●† | 398 | ||||||
| 11 | New Relic, Inc. ⌂●† | 280 | ||||||
| 46 | Nutanix, Inc. ⌂●† | 559 | ||||||
| 42 | Uber Technologies, Inc. ⌂●† | 2,352 | ||||||
| 29 | Veracode, Inc. ⌂●† | 479 | ||||||
| 5,263 | ||||||||
| Technology Hardware and Equipment - 0.1% | ||||||||
| 61 | DataLogix Holdings ⌂●† | 567 | ||||||
| 60 | Pure Storage, Inc. ⌂●† | 846 | ||||||
| 1,413 | ||||||||
| Telecommunication Services - 0.0% | ||||||||
| 19 | DocuSign, Inc. ⌂●† | 328 | ||||||
| 328 | ||||||||
| Total Preferred Stocks | ||||||||
| (Cost $14,768) | $ | 13,808 | ||||||
| Warrants - 0.0% | ||||||||
| Banks - 0.0% | ||||||||
| 155 | Alpha Bank A.E. | $ | 249 | |||||
| Diversified Financials - 0.0% | ||||||||
| 64 | Nomad Holdings Ltd. † | 34 | ||||||
| Total Warrants | ||||||||
| (Cost $326) | $ | 283 | ||||||
| Total Long-Term Investments | ||||||||
| (Cost $1,372,798) | $ | 1,395,330 | ||||||
| Short-Term Investments - 2.3% | ||||||||
| Repurchase Agreements - 2.3% | ||||||||
| Bank of America Merrill Lynch TriParty Repurchase Agreement (maturing on 11/03/2014 in the amount of $96, collateralized by U.S. Treasury Note 1.50%, 2019, value of $98) | ||||||||
| $ | 96 | 0.08%, 10/31/2014 | $ | 96 | ||||
| Bank of America Merrill Lynch TriParty Repurchase Agreement (maturing on 11/03/2014 in the amount of $1,631, collateralized by GNMA 1.63% - 7.00%, 2031 - 2054, value of $1,664) | ||||||||
| 1,631 | 0.09%, 10/31/2014 | 1,631 | ||||||
| Bank of Montreal TriParty Repurchase Agreement (maturing on 11/03/2014 in the amount of $438, collateralized by U.S. Treasury Bond 2.88% - 5.25%, 2029 - 2043, U.S. Treasury Note 0.38% - 4.50%, 2015 - 2022, value of $447) | ||||||||
| 438 | 0.08%, 10/31/2014 | 438 | ||||||
The accompanying notes are an integral part of these financial statements.
| 10 |
| Hartford Global Capital Appreciation Fund |
| Schedule of Investments – (continued) |
| October 31, 2014 |
| (000’s Omitted) |
| Shares or Principal Amount | Market Value ╪ | |||||||||||
| Short-Term Investments - 2.3% - (continued) | ||||||||||||
| Repurchase Agreements - 2.3% - (continued) | ||||||||||||
| Bank of Montreal TriParty Repurchase Agreement (maturing on 11/03/2014 in the amount of $1,486, collateralized by FHLMC 2.00% - 5.50%, 2022 - 2034, FNMA 2.00% - 4.50%, 2024 - 2039, GNMA 3.00%, 2043, U.S. Treasury Note 4.63%, 2017, value of $1,515) | ||||||||||||
| $ | 1,486 | 0.10%, 10/31/2014 | $ | 1,486 | ||||||||
| Barclays Capital TriParty Repurchase Agreement (maturing on 11/03/2014 in the amount of $5,598, collateralized by U.S. Treasury Bond 4.50% - 6.25%, 2023 - 2036, U.S. Treasury Note 1.63% - 2.13%, 2015 - 2019, value of $5,710) | ||||||||||||
| 5,598 | 0.08%, 10/31/2014 | 5,598 | ||||||||||
| Citigroup Global Markets, Inc. TriParty Repurchase Agreement (maturing on 11/03/2014 in the amount of $6,434, collateralized by U.S. Treasury Bill 0.02%, 2015, U.S. Treasury Bond 3.88% - 11.25%, 2015 - 2040, U.S. Treasury Note 2.00% - 3.38%, 2019 - 2021, value of $6,563) | ||||||||||||
| 6,434 | 0.09%, 10/31/2014 | 6,434 | ||||||||||
| Deutsche Bank Securities TriParty Repurchase Agreement (maturing on 11/03/2014 in the amount of $371, collateralized by U.S. Treasury Note 0.88%, 2017, value of $379) | ||||||||||||
| 371 | 0.13%, 10/31/2014 | 371 | ||||||||||
| RBS Securities, Inc. TriParty Repurchase Agreement (maturing on 11/03/2014 in the amount of $547, collateralized by U.S. Treasury Bond 3.63% - 5.00%, 2037 - 2043, U.S. Treasury Note 2.13%, 2020, value of $558) | ||||||||||||
| 547 | 0.07%, 10/31/2014 | 547 | ||||||||||
| Societe Generale TriParty Repurchase Agreement (maturing on 11/03/2014 in the amount of $5,760, collateralized by U.S. Treasury Bill 0.02%, 2015, U.S. Treasury Bond 3.75% - 11.25%, 2015 - 2043, U.S. Treasury Note 1.38% - 4.25%, 2015 - 2022, value of $5,875) | ||||||||||||
| 5,760 | 0.08%, 10/31/2014 | 5,760 | ||||||||||
| TD Securities TriParty Repurchase Agreement (maturing on 11/03/2014 in the amount of $11,161, collateralized by FHLMC 3.00% - 4.00%, 2026 - 2044, FNMA 2.50% - 5.00%, 2025 - 2044, U.S. Treasury Bond 3.50% - 6.50%, 2026 - 2041, U.S. Treasury Note 1.75% - 2.88%, 2018 - 2019, value of $11,385) | ||||||||||||
| 11,161 | 0.10%, 10/31/2014 | 11,161 | ||||||||||
| 33,522 | ||||||||||||
| Total Short-Term Investments | ||||||||||||
| (Cost $33,522) | $ | 33,522 | ||||||||||
| Total Investments | ||||||||||||
| (Cost $1,406,320) ▲ | 99.8 | % | $ | 1,428,852 | ||||||||
| Other Assets and Liabilities | 0.2 | % | 3,434 | |||||||||
| Total Net Assets | 100.0 | % | $ | 1,432,286 | ||||||||
The accompanying notes are an integral part of these financial statements.
| 11 |
| Hartford Global Capital Appreciation Fund |
| Schedule of Investments – (continued) |
| October 31, 2014 |
| (000’s Omitted) |
| Note: | Percentage of investments as shown is the ratio of the total market value to total net assets. |
Prices of foreign equities that are principally traded on certain foreign markets may be adjusted daily pursuant to a fair value pricing service approved by the Board of Directors in order to reflect an adjustment for factors occurring after the close of certain foreign markets but before the close of the New York Stock Exchange.
The Fund may refer to any one or more of the industry classifications used by one or more widely recognized market indices, ratings group indices and/or as defined by Fund management. Industry classifications may not be identical across all security types.
Equity industry classifications used in this report are the Global Industry Classification Standard, which was developed by and is the exclusive property and service mark of MSCI, Inc. and Standard & Poor’s.
For Fund compliance purposes, the Fund may not use the same classification system shown in this report as these classifications are used for reporting ease.
| ▲ | At October 31, 2014, the cost of securities for federal income tax purposes was $1,415,383 and the aggregate gross unrealized appreciation and depreciation based on that cost were: |
| Unrealized Appreciation | $ | 98,797 | ||
| Unrealized Depreciation | (85,328 | ) | ||
| Net Unrealized Appreciation | $ | 13,469 |
| † | These securities were valued in good faith at fair value as determined under policies and procedures established by and under the supervision of the Board of Directors. At October 31, 2014, the aggregate fair value of these securities was $17,465, which represents 1.2% of total net assets. This amount excludes securities that are principally traded in certain foreign markets and whose prices are adjusted pursuant to a third party pricing service methodology approved by the Board of Directors. |
| ● | Non-income producing. |
| ☼ | This security, or a portion of this security, was purchased on a when-issued or delayed-delivery basis. The cost of these securities was $1,740 at October 31, 2014. |
| ‡ | This security, or a portion of this security, has been segregated to cover funding requirements on investment transactions settling in the future. |
| ■ | Securities issued within terms of a private placement memorandum, exempt from registration under Rule 144A under the Securities Act of 1933, as amended, and may be sold only to qualified institutional buyers. Unless otherwise indicated, these holdings are determined to be liquid. At October 31, 2014, the aggregate value of these securities was $4, which rounds to zero percent of total net assets. |
The accompanying notes are an integral part of these financial statements.
| 12 |
| Hartford Global Capital Appreciation Fund |
| Schedule of Investments – (continued) |
| October 31, 2014 |
| (000’s Omitted) |
| ⌂ | The following securities are considered illiquid. Illiquid securities are often purchased in private placement transactions, are often not registered under the Securities Act of 1933, as amended, and may have contractual restrictions on resale. A security may also be considered illiquid if the security lacks a readily available market or if its valuation has not changed for a certain period of time. |
| Period Acquired | Shares/ Par | Security | Cost Basis | |||||||
| 08/2011 | 727 | Allstar Co. | $ | 316 | ||||||
| 04/2014 | 143 | Apigee Corp. Preferred | 416 | |||||||
| 02/2014 | 15 | Cloudera, Inc. Preferred | 218 | |||||||
| 09/2014 | 473 | Corindus Vascular Robotics, Inc. | 1,181 | |||||||
| 05/2014 | 61 | DataLogix Holdings Preferred | 630 | |||||||
| 02/2014 | 19 | DocuSign, Inc. Preferred | 255 | |||||||
| 01/2014 | 11 | Dropbox, Inc. Preferred | 204 | |||||||
| 05/2014 | 243 | Essence Holding Group Preferred | 385 | |||||||
| 08/2014 | 6 | Honest (The) Co. | 161 | |||||||
| 08/2014 | 14 | Honest (The) Co. Series C Preferred | 377 | |||||||
| 04/2014 | 18 | LendingClub Corp. Preferred | 184 | |||||||
| 08/2014 | 132 | Lithium Technology Corp. Preferred | 644 | |||||||
| 07/2014 | 39 | Lookout, Inc. Preferred | 442 | |||||||
| 04/2014 | 11 | New Relic, Inc. Preferred | 311 | |||||||
| 08/2014 | 46 | Nutanix, Inc. Preferred | 621 | |||||||
| 01/2014 | 47 | One Kings Lane, Inc. Preferred | 721 | |||||||
| 10/2014 | 82 | Platform Specialty Products Corp. PIPE | 2,108 | |||||||
| 04/2014 | 60 | Pure Storage, Inc. Preferred | 940 | |||||||
| 03/2007 | 59 | Solar Cayman Ltd. - 144A | 17 | |||||||
| 11/2013 | 39 | Tory Burch LLC | 3,091 | |||||||
| 06/2014 | 42 | Uber Technologies, Inc. Preferred | 2,613 | |||||||
| 08/2014 | 29 | Veracode, Inc. Preferred | 532 | |||||||
At October 31, 2014, the aggregate value of these securities was $16,218, which represents 1.1% of total net assets.
| β | Convertible security. |
The accompanying notes are an integral part of these financial statements.
| 13 |
| Hartford Global Capital Appreciation Fund |
| Schedule of Investments – (continued) |
| October 31, 2014 |
| (000’s Omitted) |
Foreign Currency Contracts Outstanding at October 31, 2014
| Unrealized Appreciation/(Depreciation) | ||||||||||||||||||||||
| Currency | Buy / Sell | Delivery Date | Counterparty | Contract Amount | Market Value ╪ | Asset | Liability | |||||||||||||||
| BRL | Sell | 11/03/2014 | JPM | $ | 145 | $ | 142 | $ | 3 | $ | – | |||||||||||
| CAD | Buy | 11/04/2014 | BCLY | 134 | 133 | – | (1 | ) | ||||||||||||||
| EUR | Buy | 11/04/2014 | HSBC | 530 | 524 | – | (6 | ) | ||||||||||||||
| EUR | Buy | 11/03/2014 | RBC | 440 | 437 | – | (3 | ) | ||||||||||||||
| EUR | Buy | 11/04/2014 | WEST | 669 | 669 | – | – | |||||||||||||||
| EUR | Sell | 12/03/2014 | BCLY | 660 | 662 | – | (2 | ) | ||||||||||||||
| EUR | Sell | 12/03/2014 | BOA | 6,514 | 6,318 | 196 | – | |||||||||||||||
| EUR | Sell | 12/17/2014 | JPM | 9,336 | 9,356 | – | (20 | ) | ||||||||||||||
| GBP | Sell | 11/03/2014 | BMO | 419 | 419 | – | – | |||||||||||||||
| GBP | Sell | 11/04/2014 | MSC | 1,681 | 1,681 | – | – | |||||||||||||||
| HKD | Buy | 11/04/2014 | BCLY | 89 | 89 | – | – | |||||||||||||||
| HKD | Buy | 11/03/2014 | UBS | 3,076 | 3,076 | – | – | |||||||||||||||
| HKD | Sell | 11/04/2014 | BCLY | 799 | 799 | – | – | |||||||||||||||
| HKD | Sell | 11/03/2014 | UBS | 101 | 101 | – | – | |||||||||||||||
| JPY | Buy | 12/03/2014 | BCLY | 2,966 | 2,967 | 1 | – | |||||||||||||||
| JPY | Buy | 12/03/2014 | BCLY | 547 | 494 | – | (53 | ) | ||||||||||||||
| JPY | Buy | 12/03/2014 | BOA | 2,134 | 1,940 | – | (194 | ) | ||||||||||||||
| JPY | Buy | 12/03/2014 | CBK | 1,838 | 1,671 | – | (167 | ) | ||||||||||||||
| JPY | Buy | 12/17/2014 | CBK | 2,322 | 2,213 | – | (109 | ) | ||||||||||||||
| JPY | Buy | 11/06/2014 | DEUT | 348 | 346 | – | (2 | ) | ||||||||||||||
| JPY | Buy | 12/03/2014 | DEUT | 678 | 618 | – | (60 | ) | ||||||||||||||
| JPY | Buy | 12/03/2014 | SCB | 1,159 | 1,048 | – | (111 | ) | ||||||||||||||
| JPY | Buy | 11/04/2014 | SSG | 298 | 287 | – | (11 | ) | ||||||||||||||
| JPY | Buy | 11/05/2014 | UBS | 465 | 452 | – | (13 | ) | ||||||||||||||
| JPY | Sell | 12/03/2014 | BCLY | 11,564 | 10,477 | 1,087 | – | |||||||||||||||
| JPY | Sell | 12/03/2014 | BOA | 2,237 | 2,028 | 209 | – | |||||||||||||||
| JPY | Sell | 12/03/2014 | CBK | 2,236 | 2,028 | 208 | – | |||||||||||||||
| JPY | Sell | 12/17/2014 | CBK | 1,898 | 1,897 | 1 | – | |||||||||||||||
| JPY | Sell | 11/06/2014 | DEUT | 1,328 | 1,320 | 8 | – | |||||||||||||||
| JPY | Sell | 12/03/2014 | DEUT | 420 | 390 | 30 | – | |||||||||||||||
| JPY | Sell | 12/17/2014 | JPM | 23,382 | 22,196 | 1,186 | – | |||||||||||||||
| JPY | Sell | 12/17/2014 | RBC | 1,455 | 1,399 | 56 | – | |||||||||||||||
| JPY | Sell | 11/04/2014 | SSG | 797 | 767 | 30 | – | |||||||||||||||
| JPY | Sell | 11/05/2014 | UBS | 1,290 | 1,252 | 38 | – | |||||||||||||||
| JPY | Sell | 12/03/2014 | UBS | 2,695 | 2,506 | 189 | – | |||||||||||||||
| Total | $ | 3,242 | $ | (752 | ) | |||||||||||||||||
| ╪ | See Significant Accounting Policies of accompanying Notes to Financial Statements regarding valuation of securities. |
| GLOSSARY: (abbreviations used in preceding Schedule of Investments) | |
| Counterparty Abbreviations: | |
| BCLY | Barclays |
| BMO | Bank of Montreal |
| BOA | Banc of America Securities LLC |
| CBK | Citibank NA |
| DEUT | Deutsche Bank Securities, Inc. |
| HSBC | HSBC Bank USA |
| JPM | JP Morgan Chase & Co. |
| MSC | Morgan Stanley |
| RBC | RBC Dominion Securities, Inc. |
| SCB | Standard Chartered Bank |
| SSG | State Street Global Markets LLC |
| UBS | UBS AG |
| WEST | Westpac International |
| Currency Abbreviations: | |
| BRL | Brazilian Real |
| CAD | Canadian Dollar |
| EUR | EURO |
| GBP | British Pound |
| HKD | Hong Kong Dollar |
| JPY | Japanese Yen |
| Other Abbreviations: | |
| ADR | American Depositary Receipt |
| FHLMC | Federal Home Loan Mortgage Corp. |
| FNMA | Federal National Mortgage Association |
| GNMA | Government National Mortgage Association |
| NVDR | Non-Voting Depositary Receipt |
| PIPE | Private Investment in Public Equity |
| REIC | Real Estate Investment Company |
| REIT | Real Estate Investment Trust |
The accompanying notes are an integral part of these financial statements.
| 14 |
| Hartford Global Capital Appreciation Fund |
| Schedule of Investments – (continued) |
| October 31, 2014 |
| (000’s Omitted) |
Investment Valuation Hierarchy Level Summary
October 31, 2014
| Total | Level 1 ♦ | Level 2 ♦ | Level 3 | |||||||||||||
| Assets: | ||||||||||||||||
| Common Stocks | ||||||||||||||||
| Automobiles and Components | $ | 11,132 | $ | 1,476 | $ | 9,656 | $ | – | ||||||||
| Banks | 60,154 | 18,649 | 41,505 | – | ||||||||||||
| Capital Goods | 125,380 | 67,508 | 57,872 | – | ||||||||||||
| Commercial and Professional Services | 19,124 | 16,057 | 3,067 | – | ||||||||||||
| Consumer Durables and Apparel | 26,030 | 15,208 | 10,822 | – | ||||||||||||
| Consumer Services | 27,456 | 19,663 | 7,793 | – | ||||||||||||
| Diversified Financials | 60,682 | 29,826 | 28,869 | 1,987 | ||||||||||||
| Energy | 93,265 | 77,736 | 15,529 | – | ||||||||||||
| Food and Staples Retailing | 14,367 | 10,422 | 3,945 | – | ||||||||||||
| Food, Beverage and Tobacco | 76,889 | 37,245 | 39,644 | – | ||||||||||||
| Health Care Equipment and Services | 25,988 | 24,009 | 1,979 | – | ||||||||||||
| Household and Personal Products | 9,861 | 8,855 | 1,006 | – | ||||||||||||
| Insurance | 60,054 | 28,812 | 31,242 | – | ||||||||||||
| Materials | 77,032 | 49,258 | 27,774 | – | ||||||||||||
| Media | 23,352 | 13,078 | 10,274 | – | ||||||||||||
| Pharmaceuticals, Biotechnology and Life Sciences | 173,007 | 118,647 | 54,360 | – | ||||||||||||
| Real Estate | 29,957 | 11,489 | 18,468 | – | ||||||||||||
| Retailing | 76,937 | 57,210 | 16,380 | 3,347 | ||||||||||||
| Semiconductors and Semiconductor Equipment | 94,113 | 61,998 | 32,115 | – | ||||||||||||
| Software and Services | 117,185 | 109,031 | 6,425 | 1,729 | ||||||||||||
| Technology Hardware and Equipment | 57,049 | 50,285 | 6,764 | – | ||||||||||||
| Telecommunication Services | 39,037 | 7,402 | 31,635 | – | ||||||||||||
| Transportation | 37,366 | 17,057 | 20,309 | – | ||||||||||||
| Utilities | 45,822 | 4,876 | 40,946 | – | ||||||||||||
| Total | 1,381,239 | 855,797 | 518,379 | 7,063 | ||||||||||||
| Preferred Stocks | 13,808 | – | 4,653 | 9,155 | ||||||||||||
| Warrants | 283 | 283 | – | – | ||||||||||||
| Short-Term Investments | 33,522 | – | 33,522 | – | ||||||||||||
| Total | $ | 1,428,852 | $ | 856,080 | $ | 556,554 | $ | 16,218 | ||||||||
| Foreign Currency Contracts* | $ | 3,242 | $ | – | $ | 3,242 | $ | – | ||||||||
| Total | $ | 3,242 | $ | – | $ | 3,242 | $ | – | ||||||||
| Liabilities: | ||||||||||||||||
| Foreign Currency Contracts* | $ | 752 | $ | – | $ | 752 | $ | – | ||||||||
| Total | $ | 752 | $ | – | $ | 752 | $ | – | ||||||||
| ♦ | For the year ended October 31, 2014, investments valued at $2,124 were transferred from Level 1 to Level 2, and investments valued at $2,247 were transferred from Level 2 to Level 1. Investments are transferred between Level 1 and Level 2 for a variety of reasons including, but not limited to: |
| 1) | Foreign equities for which a fair value price is more representative of exit value than the local market close (transfer into Level 2). Foreign equities for which the local market close is more representative of exit value (transfer into Level 1). | |
| 2) | U.S. Treasury securities that no longer represent the most recent issue (transfer into Level 2). | |
| 3) | Equity investments with no observable trading but a bid or mean price is used (transfer into Level 2). Equity investments using observable quoted prices in an active market (transfer into Level 1). |
| * | Derivative instruments (excluding purchased and written options, if applicable) are valued at the unrealized appreciation/depreciation on the investments. |
The accompanying notes are an integral part of these financial statements.
| 15 |
| Hartford Global Capital Appreciation Fund |
| Schedule of Investments – (continued) |
| October 31, 2014 |
| (000’s Omitted) |
Following is a reconciliation of Level 3 assets for which significant unobservable inputs were used to determine fair value:
| Balance
as of October 31, 2013 | Realized Gain (Loss) | Change
in Unrealized Appreciation (Depreciation) | Net Amortization | Purchases | Sales | Transfers Into Level 3 * | Transfers Out of Level 3 * | Balance
as of October 31, 2014 | ||||||||||||||||||||||||||||
| Assets: | ||||||||||||||||||||||||||||||||||||
| Common Stocks | $ | 2,565 | $ | 84 | $ | (776 | )† | $ | — | $ | 6,542 | $ | (230 | ) | $ | — | $ | (1,122 | ) | $ | 7,063 | |||||||||||||||
| Preferred Stocks | — | — | (338 | )‡ | — | 9,493 | — | — | — | 9,155 | ||||||||||||||||||||||||||
| Warrants | 4 | — | — | — | — | — | — | (4 | ) | — | ||||||||||||||||||||||||||
| Total | $ | 2,569 | $ | 84 | $ | (1,114 | ) | $ | — | $ | 16,035 | $ | (230 | ) | $ | — | $ | (1,126 | ) | $ | 16,218 | |||||||||||||||
| * | Investments are transferred into and out of Level 3 for a variety of reasons including, but not limited to: |
| 1) | Investments where trading has been halted (transfer into Level 3) or investments where trading has resumed (transfer out of Level 3). |
| 2) | Broker quoted investments (transfer into Level 3) or quoted prices in active markets (transfer out of Level 3). |
| 3) | Investments that have certain restrictions on trading (transfer into Level 3) or investments where trading restrictions have expired (transfer out of Level 3). |
| † | Change in unrealized appreciation (depreciation) in the current period relating to assets still held at October 31, 2014 was $(707). |
| ‡ | Change in unrealized appreciation (depreciation) in the current period relating to assets still held at October 31, 2014 was $(338). |
| Note: | For purposes of reporting transfers between different hierarchy levels, both transfers in and out of each level, as applicable, are shown as if they occurred at the beginning of the period. |
The accompanying notes are an integral part of these financial statements.
| 16 |
| Hartford Global Capital Appreciation Fund |
| Statement of Assets and Liabilities |
| October 31, 2014 |
| (000’s Omitted) |
| Assets: | ||||
| Investments in securities, at market value (cost $1,406,320) | $ | 1,428,852 | ||
| Foreign currency on deposit with custodian (cost $42) | 42 | |||
| Unrealized appreciation on foreign currency contracts | 3,242 | |||
| Receivables: | ||||
| Investment securities sold | 17,719 | |||
| Fund shares sold | 720 | |||
| Dividends and interest | 1,918 | |||
| Other assets | 90 | |||
| Total assets | 1,452,583 | |||
| Liabilities: | ||||
| Unrealized depreciation on foreign currency contracts | 752 | |||
| Bank overdraft | 7 | |||
| Payables: | ||||
| Investment securities purchased | 17,995 | |||
| Fund shares redeemed | 973 | |||
| Investment management fees | 207 | |||
| Administrative fees | 1 | |||
| Distribution fees | 99 | |||
| Accrued expenses | 263 | |||
| Total liabilities | 20,297 | |||
| Net assets | $ | 1,432,286 | ||
| Summary of Net Assets: | ||||
| Capital stock and paid-in-capital | $ | 1,189,265 | ||
| Undistributed net investment income | 4,852 | |||
| Accumulated net realized gain | 213,232 | |||
| Unrealized appreciation of investments and the translation of assets and liabilities denominated in foreign currency | 24,937 | |||
| Net assets | $ | 1,432,286 | ||
| Shares authorized | 1,000,000 | |||
| Par value | $ | 0.001 | ||
| Class A: Net asset value per share/Maximum offering price per share | $20.10/$21.27 | |||
| Shares outstanding | 36,469 | |||
| Net assets | $ | 732,928 | ||
| Class B: Net asset value per share | $ | 18.65 | ||
| Shares outstanding | 2,484 | |||
| Net assets | $ | 46,336 | ||
| Class C: Net asset value per share | $ | 18.78 | ||
| Shares outstanding | 15,054 | |||
| Net assets | $ | 282,703 | ||
| Class I: Net asset value per share | $ | 20.59 | ||
| Shares outstanding | 5,713 | |||
| Net assets | $ | 117,640 | ||
| Class R3: Net asset value per share | $ | 19.85 | ||
| Shares outstanding | 1,599 | |||
| Net assets | $ | 31,735 | ||
| Class R4: Net asset value per share | $ | 20.35 | ||
| Shares outstanding | 494 | |||
| Net assets | $ | 10,055 | ||
| Class R5: Net asset value per share | $ | 20.68 | ||
| Shares outstanding | 75 | |||
| Net assets | $ | 1,549 | ||
| Class Y: Net asset value per share | $ | 20.86 | ||
| Shares outstanding | 10,034 | |||
| Net assets | $ | 209,340 |
The accompanying notes are an integral part of these financial statements.
| 17 |
| Hartford Global Capital Appreciation Fund |
| Statement of Operations |
| For the Year Ended October 31, 2014 |
| (000’s Omitted) |
| Investment Income: | ||||
| Dividends | $ | 24,617 | ||
| Interest | 14 | |||
| Less: Foreign tax withheld | (1,551 | ) | ||
| Total investment income | 23,080 | |||
| Expenses: | ||||
| Investment management fees | 9,810 | |||
| Administrative services fees | ||||
| Class R3 | 64 | |||
| Class R4 | 16 | |||
| Class R5 | 2 | |||
| Transfer agent fees | ||||
| Class A | 1,146 | |||
| Class B | 138 | |||
| Class C | 357 | |||
| Class I | 108 | |||
| Class R3 | 5 | |||
| Class R4 | 1 | |||
| Class R5 | — | |||
| Class Y | 1 | |||
| Distribution fees | ||||
| Class A | 1,628 | |||
| Class B | 536 | |||
| Class C | 2,797 | |||
| Class R3 | 161 | |||
| Class R4 | 27 | |||
| Custodian fees | 54 | |||
| Accounting services fees | 172 | |||
| Registration and filing fees | 177 | |||
| Board of Directors' fees | 30 | |||
| Audit fees | 38 | |||
| Other expenses | 205 | |||
| Total expenses (before waivers and fees paid indirectly) | 17,473 | |||
| Expense waivers | (131 | ) | ||
| Management fee waivers | (334 | ) | ||
| Commission recapture | (41 | ) | ||
| Custodian fee offset | — | |||
| Total waivers and fees paid indirectly | (506 | ) | ||
| Total expenses, net | 16,967 | |||
| Net Investment Income | 6,113 | |||
| Net Realized Gain on Investments and Foreign Currency Transactions: | ||||
| Net realized gain on investments | 247,745 | |||
| Less: Foreign taxes paid on realized capital gains | (274 | ) | ||
| Net realized gain on foreign currency contracts | 912 | |||
| Net realized gain on other foreign currency transactions | 870 | |||
| Net Realized Gain on Investments and Foreign Currency Transactions | 249,253 | |||
| Net Changes in Unrealized Depreciation of Investments and Foreign Currency Transactions: | ||||
| Net unrealized depreciation of investments | (164,720 | ) | ||
| Net unrealized appreciation of foreign currency contracts | 1,763 | |||
| Net unrealized depreciation of translation of other assets and liabilities in foreign currencies | (75 | ) | ||
| Net Changes in Unrealized Depreciation of Investments and Foreign Currency Transactions | (163,032 | ) | ||
| Net Gain on Investments and Foreign Currency Transactions | 86,221 | |||
| Net Increase in Net Assets Resulting from Operations | $ | 92,334 |
The accompanying notes are an integral part of these financial statements.
| 18 |
| Hartford Global Capital Appreciation Fund |
| Statement of Changes in Net Assets |
| (000’s Omitted) |
| For the Year Ended October 31, 2014 | For the Year Ended October 31, 2013 | |||||||
| Operations: | ||||||||
| Net investment income | $ | 6,113 | $ | 1,847 | ||||
| Net realized gain on investments and foreign currency transactions | 249,253 | 153,672 | ||||||
| Net unrealized appreciation (depreciation) of investments and foreign currency transactions | (163,032 | ) | 114,726 | |||||
| Net Increase in Net Assets Resulting from Operations | 92,334 | 270,245 | ||||||
| Distributions to Shareholders: | ||||||||
| From net investment income | ||||||||
| Class A | — | (1,568 | ) | |||||
| Class I | — | (534 | ) | |||||
| Class R3 | — | (83 | ) | |||||
| Class R4 | — | (55 | ) | |||||
| Class R5 | — | (7 | ) | |||||
| Class Y | (140 | ) | (72 | ) | ||||
| Total from net investment income | (140 | ) | (2,319 | ) | ||||
| From net realized gain on investments | ||||||||
| Class A | (13,469 | ) | — | |||||
| Class B | (1,573 | ) | — | |||||
| Class C | (7,293 | ) | — | |||||
| Class I | (3,052 | ) | — | |||||
| Class R3 | (832 | ) | — | |||||
| Class R4 | (288 | ) | — | |||||
| Class R5 | (31 | ) | — | |||||
| Class Y | (370 | ) | — | |||||
| Total from net realized gain on investments | (26,908 | ) | — | |||||
| Total distributions | (27,048 | ) | (2,319 | ) | ||||
| Capital Share Transactions: | ||||||||
| Class A | 190,141 | * | (43,660 | ) | ||||
| Class B | (11,138 | )* | (11,546 | ) | ||||
| Class C | 11,675 | * | (34,499 | ) | ||||
| Class I | (7,320 | ) | 36 | |||||
| Class R3 | (997 | )* | (1,885 | ) | ||||
| Class R4 | (1,321 | )* | (2,999 | ) | ||||
| Class R5 | 213 | * | (377 | ) | ||||
| Class Y | 193,898 | * | (2,631 | ) | ||||
| Net increase (decrease) from capital share transactions | 375,151 | (97,561 | ) | |||||
| Net Increase in Net Assets | 440,437 | 170,365 | ||||||
| Net Assets: | ||||||||
| Beginning of period | 991,849 | 821,484 | ||||||
| End of period | $ | 1,432,286 | $ | 991,849 | ||||
| Undistributed (distributions in excess of) net investment income | $ | 4,852 | $ | (129 | ) | |||
* Includes merger activity (see Fund Merger in accompanying Notes to Financial Statements).
The accompanying notes are an integral part of these financial statements.
| 19 |
| Hartford Global Capital Appreciation Fund |
| Notes to Financial Statements |
| October 31, 2014 |
| (000’s Omitted) |
Organization:
The Hartford Mutual Funds, Inc. (“Company”) is an open-end management investment company comprised of forty-two portfolios. Financial statements for Hartford Global Capital Appreciation Fund (the "Fund"), a series of the Company, are included in this report. Prior to March 1, 2014, the Fund was known as The Hartford Capital Appreciation II Fund.
The Company is organized under the laws of the State of Maryland and is registered with the Securities and Exchange Commission (“SEC”) under the Investment Company Act of 1940, as amended (“1940 Act”). The Fund is a diversified open-end management investment company. The Fund is an investment company and applies specialized accounting and reporting under Accounting Standards Codification Topic 946, Financial Services - Investment Companies.
Class A shares are sold with a front-end sales charge of up to 5.50%. Class B shares were sold with a contingent deferred sales charge which is assessed on the lesser of the per share net asset value (“NAV”) of the shares at the time of redemption or the original purchase price, and declines from up to 5.00% to zero depending on the period of time the shares are held (see note below regarding the closing of Class B shares). Class C shares are sold with a contingent deferred sales charge of up to 1.00% on shares redeemed within twelve months of purchase. Class I shares are sold without sales charges to certain eligible investors primarily through advisory fee-based wrap programs. Class R3, R4 and R5 shares, which are offered to employer-sponsored retirement plans, and Class Y shares, which are sold to certain eligible institutional investors, are sold without a sales charge. All classes of shares have identical voting, redemption, dividend, liquidation and other rights and the same terms and conditions, with the exceptions that each class may have different expenses, which may affect performance, and that Class B shares automatically convert to Class A shares after 8 years.
No new or additional investments are allowed in Class B shares of the Fund (including investments through any systematic investment plan). Existing shareholders of Class B shares may continue to hold their Class B shares, exchange their Class B shares for Class B shares of another Hartford Fund (as permitted by existing exchange privileges), or redeem their Class B shares as described in the Fund’s prospectus. Reinstatement privileges with respect to Class B shares are set forth in the Fund's prospectus. For investors electing to reinvest capital gains and dividends, any such capital gains or dividends on Class B shares will continue to be reinvested in Class B shares of the Fund. All Class B share attributes, including the 12b-1 fee, contingent deferred sales charge schedule, and conversion to Class A shares, remain unchanged.
Significant Accounting Policies:
The following is a summary of significant accounting policies of the Fund in the preparation of its financial statements, which are in accordance with United States generally accepted accounting principles (“U.S. GAAP”). The preparation of financial statements in accordance with U.S. GAAP may require management to make estimates and assumptions that affect the reported amounts of assets and liabilities and disclosure of contingent assets and liabilities at the date of the financial statements and the reported amounts of increases and decreases in net assets from operations during the reporting period. Actual results could differ from those estimates.
Determination of Net Asset Value – The NAV of each class of the Fund's shares is determined as of the close of regular trading (normally 4:00 p.m. Eastern Time) (the “NYSE Close”) on each day that the New York Stock Exchange (the “Exchange”) is open (“Valuation Date”). Information that becomes known to the Fund after the NAV has been calculated on a particular day will not generally be used to retroactively adjust the NAV determined earlier that day.
Investment Valuation and Fair Value Measurements – For purposes of calculating the NAV, portfolio investments and other assets held by the Fund's portfolio for which market quotes are readily available are valued at market value. Market value is generally determined on the basis of last reported sales prices or official close price. If no sales are reported, market value is based on quotes obtained from a quotation reporting system, established market makers, or independent pricing services. If market prices are not readily available or are deemed unreliable, the Fund will use the fair value of the investment as determined in good faith under policies and procedures established by and under the supervision of the Company's Board of Directors. Market quotes are considered not readily available where there is an absence of current or reliable market-based data (e.g., trade information or indicative market quotes), including where events occur after the close of the relevant market, but prior to the NYSE Close, that materially affect the values of the Fund's portfolio investments or assets. In addition, market quotes are considered not readily available when, due to extraordinary circumstances, the exchanges or markets on which the investments trade do not open for trading for the entire day and
| 20 |
| Hartford Global Capital Appreciation Fund |
| Notes to Financial Statements – (continued) |
| October 31, 2014 |
| (000’s Omitted) |
no other market prices are available. In addition, prices of foreign equities that are principally traded on certain foreign markets may be adjusted daily pursuant to a fair value pricing service approved by the Board of Directors in order to reflect an adjustment for the factors occurring after the close of certain foreign markets but before the NYSE Close. Investments that are primarily traded on foreign markets may trade on days that are not business days of the Fund. The value of the foreign investments in which the Fund invests may change on days when a shareholder will not be able to purchase or redeem shares of the Fund. Fair value pricing is subjective in nature and the use of fair value pricing by the Fund may cause the NAV of its shares to differ significantly from the NAV that would have been calculated using market prices at the close of the exchange on which a portfolio investment is primarily traded. There can be no assurance that the Fund could obtain the fair market value assigned to an investment if the Fund were to sell the investment at approximately the time at which the Fund determines its NAV.
Investments valued in currencies other than U.S. dollars are converted to U.S. dollars using exchange rates obtained from independent pricing services for calculation of the NAV. As a result, the NAV of the Fund’s shares may be affected by changes in the value of currencies in relation to the U.S. dollar. The value of investments traded in markets outside the United States or denominated in currencies other than the U.S. dollar may be affected significantly on a day that the NYSE is closed and the market value may change on days when an investor is not able to purchase, redeem or exchange shares of the Fund.
Foreign currency contracts represent agreements to exchange currencies on specific future dates at predetermined rates. Foreign currency contracts are valued using foreign currency exchange rates and forward rates as provided by an independent pricing service on the Valuation Date.
Financial instruments for which prices are not available from an independent pricing service may be valued using market quotations obtained from one or more dealers that make markets in the respective financial instrument in accordance with procedures established by the Company's Board of Directors.
U.S. GAAP defines fair value as the price that the Fund would receive to sell an asset or pay to transfer a liability in an orderly transaction between market participants. The U.S. GAAP fair value measurement standards require disclosure of a fair value hierarchy for each major category of assets and liabilities. Various inputs are used in determining the fair value of the Fund’s investments. These inputs are summarized into three broad hierarchy levels. This hierarchy is based on whether the valuation inputs are observable or unobservable. These levels are:
Level 1 – Quoted prices in active markets for identical investments. Level 1 may include exchange traded instruments, such as domestic equities, some foreign equities, options, futures, mutual funds, exchange traded funds, rights and warrants.
Level 2 – Observable inputs other than Level 1 prices, such as quoted prices for similar investments; quoted prices in markets that are not active; or other inputs that are observable or can be corroborated by observable market data. Level 2 may include debt investments that are traded less frequently than exchange traded instruments and which are valued using independent pricing services; foreign equities, which are principally traded on certain foreign markets and are adjusted daily pursuant to a fair value pricing service in order to reflect an adjustment for the factors occurring after the close of certain foreign markets but before the NYSE Close; senior floating rate interests, which are valued using an aggregate of dealer bids; short-term investments, which are valued at amortized cost; and swaps, which are valued based upon the terms of each swap contract.
Level 3 – Significant unobservable inputs that are supported by limited or no market activity. Level 3 may include financial instruments whose values are determined using indicative market quotes or require significant management judgment or estimation. These unobservable valuation inputs may include estimates for current yields, maturity/duration, prepayment speed, and indicative market quotes for comparable investments along with other assumptions relating to credit quality, collateral value, complexity of the investment structure, general market conditions and liquidity. This category may include investments where trading has been halted or there are certain restrictions on trading. While these investments are priced using unobservable inputs, the valuation of these investments reflects the best available data and management believes the prices are a reasonable representation of exit price.
The Board of Directors of the Company generally reviews and approves the “Procedures for Valuation of Portfolio Securities” at least once a year. These procedures define how investments are to be valued, including the formation and activities of a
| 21 |
| Hartford Global Capital Appreciation Fund |
| Notes to Financial Statements – (continued) |
| October 31, 2014 |
| (000’s Omitted) |
Valuation Committee. The Valuation Committee is responsible for determining in good faith the fair value of investments when the value cannot be obtained from primary pricing services or alternative sources or if the valuation of an investment as provided by the primary pricing service or alternative source is believed not to reflect the investment’s fair value as of the Valuation Date. Voting members of the Valuation Committee include the Fund's Treasurer or designee and a Vice President of the investment manager or designee. An Assistant Vice President of the Fund with legal expertise or designee is also included on the Valuation Committee as a non-voting advisory member. In addition, the Fund’s Chief Compliance Officer shall designate a member of the compliance group to attend Valuation Committee meetings as a non-voting resource, to monitor for and provide guidance with respect to compliance with these procedures. Two members of the Valuation Committee or their designees, representing different departments, shall constitute a quorum for purposes of permitting the Valuation Committee to take action. The Valuation Committee will consider all relevant factors in determining an investment’s fair value, and may seek the advice of the Fund’s sub-adviser, knowledgeable brokers, and legal counsel in making such determination. The Valuation Committee reports to the Audit Committee of the Company's Board of Directors. The Audit Committee receives quarterly written reports which include details of all fair-valued investments, including the reason for the fair valuation, and an indication, when possible, of the accuracy of the valuation by disclosing the next available reliable public price quotation or the disposition price of such investments (the “look-back” test). The Board of Directors then must consider for ratification all of the fair value determinations made during the previous quarter.
Valuation levels are not necessarily indicative of the risk associated with investing in such investments. Individual investments within any of the above mentioned asset classes may be assigned a different hierarchical level than those presented above, as individual circumstances dictate.
For additional information, refer to the Investment Valuation Hierarchy Level Summary and the Level 3 roll-forward reconciliation, if applicable, which follow the Schedule of Investments.
Investment Transactions and Investment Income – Investment transactions are recorded as of the trade date (the date the order to buy or sell is executed) for financial reporting purposes. Investments purchased or sold on a when-issued or delayed-delivery basis may be settled a month or more after the trade date. Realized gains and losses are determined on the basis of identified cost.
Dividend income from domestic securities is accrued on the ex-dividend date. In general, dividend income from foreign securities is recorded on the ex-date; however, dividend notifications in certain foreign jurisdictions may not be available in a timely manner and as a result, the Fund will record the dividend as soon as the relevant details (i.e., rate per share, payment date, shareholders of record, etc.) are publicly available. Interest income, including amortization of premium, accretion of discounts and additional principal received in-kind in lieu of cash, is accrued on a daily basis.
Taxes – The Fund may be subject to taxes imposed on realized gains on securities of certain foreign countries in which the Fund invests. The amount of foreign tax expense is included on the accompanying Statement of Operations as a reduction to net realized gain on investments in these securities.
Foreign Currency Transactions – Assets and liabilities denominated in currencies other than U.S. dollars are translated into U.S. dollars at the exchange rates in effect on the valuation date. Purchases and sales of investments, income and expenses are translated into U.S. dollars at the exchange rates on the dates of such transactions.
The Fund does not isolate that portion of portfolio investment valuation resulting from fluctuations in the foreign currency exchange rates from the fluctuations arising from changes in the market prices of investments held. Exchange rate fluctuations are included with the net realized and unrealized gain or loss on investments in the accompanying financial statements.
Net realized foreign exchange gains or losses arise from sales of foreign currencies and the difference between asset and liability amounts initially stated in foreign currencies and the U.S. dollar value of the amounts actually received or paid. Net unrealized foreign exchange gains or losses arise from changes in the value of other assets and liabilities at the end of the reporting period, resulting from changes in the exchange rates.
| 22 |
| Hartford Global Capital Appreciation Fund |
| Notes to Financial Statements – (continued) |
| October 31, 2014 |
| (000’s Omitted) |
Joint Trading Account – The Fund may invest cash balances into a joint trading account that may be invested in one or more repurchase agreements.
Fund Share Valuation and Dividend Distributions to Shareholders – Orders for the Fund’s shares are executed in accordance with the investment instructions of the shareholders. The NAV of the Fund’s shares is determined as of the close of business on each business day of the Exchange. The NAV is determined separately for each class of shares of the Fund by dividing the Fund’s net assets attributable to that class by the number of shares of the class outstanding. Each class of shares offered by the Fund has equal rights as to assets and voting privileges (except that shareholders of a class have exclusive voting rights regarding any matter relating solely to that class of shares). Income and non-class specific expenses are allocated daily to each class on the basis of the relative net assets of the class. Realized and unrealized gains and losses are allocated daily based on the relative net assets of each class of shares of the Fund.
Orders for the purchase of the Fund’s shares received prior to the close of the Exchange on any day the Exchange is open for business are priced at the NAV determined as of the close of the Exchange. Orders received after the close of the Exchange, or on a day on which the Exchange and/or the Fund is not open for business, are priced at the next determined NAV.
Dividends are declared pursuant to a policy adopted by the Company's Board of Directors based upon the investment performance of the Fund. The policy of the Fund is to pay dividends from net investment income and realized gains, if any, at least once a year.
Net investment income, dividends and distributions from net realized gains and capital are determined in accordance with federal income tax regulations, which may differ from U.S. GAAP with respect to character and timing (see Federal Income Taxes: Distributions and Components of Distributable Earnings and Reclassification of Capital Accounts).
Securities and Other Investments:
Repurchase Agreements – A repurchase agreement is an agreement by which a counterparty agrees to sell an investment and agrees to repurchase the investment sold from the buyer at a mutually agreed upon time and price. During the period of the repurchase agreement, the counterparty will deposit cash and or securities in a third party custodial account to serve as collateral. At the time the Fund enters into a repurchase agreement, the value of the underlying collateral, including accrued interest, will be equal to or exceed the value of the repurchase agreement. Repurchase agreements expose the Fund to counterparty risk - that is, the risk that the counterparty will not fulfill its obligations. To minimize counterparty risk, the investments that serve to collateralize the repurchase agreement are held by the Fund’s custodian in book entry or physical form in the custodial account of the Fund or in a third party custodial account. Repurchase agreements are valued at cost plus accrued interest, which approximates fair value. Repurchase agreements have master netting arrangements which allow the Fund to offset amounts owed to a counterparty with amounts owed by the counterparty, including any collateral. Upon an event of default under a master repurchase agreement, the non-defaulting party may close out all transactions traded under such agreement and net amounts owed under each transaction to one net amount payable by one party to the other. Absent an event of default, the master repurchase agreement does not result in an offset of reported amounts of assets and liabilities in the Statement of Assets and Liabilities across transactions between the Fund and the applicable counterparty. The Fund, as shown on the Schedule of Investments, had outstanding repurchase agreements and related collateral as of October 31, 2014.
Illiquid and Restricted Investments – The Fund is permitted to invest up to 15% of its net assets in illiquid investments. Illiquid investments are those that may not be sold or disposed of in the ordinary course of business within seven days, at approximately the price used to determine the Fund’s NAV. The Fund may not be able to sell illiquid investments when its sub-adviser considers it desirable to do so or may have to sell such investments at a price that is lower than the price that could be obtained if the investments were more liquid. A sale of illiquid investments may require more time and may result in higher dealer discounts and other selling expenses than does the sale of those that are liquid. Illiquid investments also may be more difficult to value due to the unavailability of reliable market quotations for such investments, and an investment in them may have an adverse impact on the Fund’s NAV. The Fund may also purchase certain restricted investments that can only be resold to certain qualified investors and may be determined to be liquid pursuant to policies and guidelines established by the Company's Board of Directors. The Fund, as shown on the Schedule of Investments, had illiquid or restricted investments as of October 31, 2014.
| 23 |
| Hartford Global Capital Appreciation Fund |
| Notes to Financial Statements – (continued) |
| October 31, 2014 |
| (000’s Omitted) |
Investments Purchased on a When-Issued or Delayed-Delivery Basis – Delivery and payment for investments that have been purchased by the Fund on a forward commitment, or when-issued or delayed-delivery basis, take place beyond the customary settlement period. The Fund may dispose of or renegotiate a delayed-delivery transaction after it is entered into, and may sell delayed-delivery investments before they are delivered, which may result in a realized gain or loss. During this period, such investments are subject to market fluctuations, and the Fund identifies investments segregated in its records with a value at least equal to the amount of the commitment. The Fund, as shown on the Schedule of Investments, had when-issued or delayed-delivery investments as of October 31, 2014.
Financial Derivative Instruments:
The following disclosures contain information on how and why the Fund uses derivative instruments, the credit-risk-related contingent features in certain derivative instruments and how derivative instruments affect the Fund’s financial position and results of operations. The location and fair value amounts of these instruments on the Statement of Assets and Liabilities and the realized gains and losses and changes in unrealized gains and losses on the Statement of Operations, each categorized by type of derivative contract, are included in the following Additional Derivative Instrument Information footnote. The derivative instruments outstanding as of year-end are disclosed in the notes to the Schedule of Investments, if applicable. The amounts of realized gains and losses and changes in unrealized gains and losses on derivative instruments during the year are disclosed in the Statement of Operations.
Foreign Currency Contracts – The Fund may enter into foreign currency contracts that obligate the Fund to purchase or sell currencies at specified future dates. Foreign currency contracts are used to hedge the currency exposure associated with some or all of the Fund’s investments and/or as part of an investment strategy. Foreign currency contracts are marked to market daily and the change in value is recorded by the Fund as an unrealized gain or loss. The Fund will record a realized gain or loss when the foreign currency contract is settled.
Foreign currency contracts involve elements of market risk in excess of the amounts reflected in the Statement of Assets and Liabilities. In addition, risks may arise upon entering into these contracts from the potential inability of the counterparties to meet the terms of the contracts and from unanticipated movements in the value of the foreign currencies relative to the U.S. dollar. The Fund, as shown on the Schedule of Investments, had outstanding foreign currency contracts as of October 31, 2014.
Additional Derivative Instrument Information:
Fair Value of Derivative Instruments on the Statement of Assets and Liabilities as of October 31, 2014:
| Risk Exposure Category | ||||||||||||||||||||||||||||
| Interest
Rate Contracts | Foreign Exchange Contracts | Credit Contracts | Equity Contracts | Commodity Contracts | Other Contracts | Total | ||||||||||||||||||||||
| Assets: | ||||||||||||||||||||||||||||
| Unrealized appreciation on foreign currency contracts | $ | — | $ | 3,242 | $ | — | $ | — | $ | — | $ | — | $ | 3,242 | ||||||||||||||
| Total | $ | — | $ | 3,242 | $ | — | $ | — | $ | — | $ | — | $ | 3,242 | ||||||||||||||
| Liabilities: | ||||||||||||||||||||||||||||
| Unrealized depreciation on foreign currency contracts | $ | — | $ | 752 | $ | — | $ | — | $ | — | $ | — | $ | 752 | ||||||||||||||
| Total | $ | — | $ | 752 | $ | — | $ | — | $ | — | $ | — | $ | 752 | ||||||||||||||
The volume of derivatives that is presented in the Schedule of Investments is consistent with the derivative activity during the year ended October 31, 2014.
| 24 |
| Hartford Global Capital Appreciation Fund |
| Notes to Financial Statements – (continued) |
| October 31, 2014 |
| (000’s Omitted) |
The Effect of Derivative Instruments on the Statement of Operations for the year ended October 31, 2014:
| Risk Exposure Category | ||||||||||||||||||||||||||||
| Interest
Rate Contracts | Foreign Exchange Contracts | Credit Contracts | Equity Contracts | Commodity Contracts | Other Contracts | Total | ||||||||||||||||||||||
| Realized Gain on Derivatives Recognized as a Result of Operations: | ||||||||||||||||||||||||||||
| Net realized gain on foreign currency contracts | $ | — | $ | 912 | $ | — | $ | — | $ | — | $ | — | $ | 912 | ||||||||||||||
| Total | $ | — | $ | 912 | $ | — | $ | — | $ | — | $ | — | $ | 912 | ||||||||||||||
| Net Change in Unrealized Appreciation (Depreciation) on Derivatives Recognized as a Result of Operations: | ||||||||||||||||||||||||||||
| Net change in unrealized appreciation of foreign currency contracts | $ | — | $ | 1,763 | $ | — | $ | — | $ | — | $ | — | $ | 1,763 | ||||||||||||||
| Total | $ | — | $ | 1,763 | $ | — | $ | — | $ | — | $ | — | $ | 1,763 | ||||||||||||||
Balance Sheet Offsetting Information - The following discloses both gross information and net information about instruments and transactions eligible for offset in the financial statements, and instruments and transactions that are subject to a master netting arrangement, as well as amounts related to margin, reflected as financial collateral (including cash collateral), held at clearing brokers, counterparties and the Fund’s custodian. The master netting arrangements allow the clearing brokers to net any collateral held in or on behalf of the Fund, or liabilities or payment obligations of the clearing brokers to the Fund, against any liabilities or payment obligations of the Fund to the clearing brokers. The Fund is required to deposit financial collateral (including cash collateral) at the Futures Commission Merchant's ("FCM") custodian on behalf of clearing brokers and counterparties to continually meet the original and maintenance requirements established by the clearing brokers and counterparties. Such requirements are specific to the respective clearing broker or counterparty. Certain master netting arrangements may not be enforceable in the bankruptcy proceedings of a counterparty.
Offsetting of Financial Assets and Derivative Assets as of October 31, 2014:
| Gross Amounts* of Assets Presented in Statement of Assets and Liabilities | Financial Instruments with Allowable Netting | Non-cash Collateral Received | Cash Collateral Received | Net Amount (not less than $0) | ||||||||||||||||
| Description | ||||||||||||||||||||
| Unrealized appreciation on foreign currency contracts | $ | 3,163 | $ | (508 | ) | $ | — | $ | — | $ | 2,655 | |||||||||
| Total subject to a master netting or similar arrangement | $ | 3,163 | $ | (508 | ) | $ | — | $ | — | $ | 2,655 | |||||||||
* Gross amounts are presented here as there are no amounts that are netted within the Statement of Assets and Liabilities.
Offsetting of Financial Liabilities and Derivative Liabilities as of October 31, 2014:
| Gross Amounts* of Liabilities Presented in Statement of Assets and Liabilities | Financial Instruments with Allowable Netting | Non-cash Collateral Pledged | Cash Collateral Pledged | Net Amount (not less than $0) | ||||||||||||||||
| Description | ||||||||||||||||||||
| Unrealized depreciation on foreign currency contracts | $ | 716 | $ | (508 | ) | $ | — | $ | — | $ | 208 | |||||||||
| Total subject to a master netting or similar arrangement | $ | 716 | $ | (508 | ) | $ | — | $ | — | $ | 208 | |||||||||
* Gross amounts are presented here as there are no amounts that are netted within the Statement of Assets and Liabilities.
Certain derivatives held by the Fund, as of October 31, 2014, are not subject to a master netting arrangement and are excluded from the table above.
| 25 |
| Hartford Global Capital Appreciation Fund |
| Notes to Financial Statements – (continued) |
| October 31, 2014 |
| (000’s Omitted) |
Principal Risks:
Credit risk depends largely on the perceived financial health of bond issuers. In general, the credit rating is inversely related to the credit risk of the issuer. Higher rated bonds generally are deemed to have less credit risk, while lower or unrated bonds are deemed to have higher risk of default. The share price, yield and total return of a fund that holds securities with higher credit risk may be more volatile than those of a fund that holds bonds with lower credit risk. Similar to credit risk, the Fund may be exposed to counterparty risk, or the risk that an institution or other entity with which the Fund has unsettled or open transactions will default.
If the Fund invests directly in foreign currencies or in securities that trade in, and receive revenues in, foreign currencies, or in derivatives that provide exposure to foreign currencies, it will be subject to the risk that those currencies will decline in value relative to the base currency (U.S. dollars) of the Fund, or, in the case of hedging positions, that the Fund’s base currency will decline in value relative to the currency being hedged. Currency rates in foreign countries may fluctuate significantly over short periods of time for a number of reasons, including changes in interest rates, intervention (or the failure to intervene) by U.S. or foreign governments, central banks or supranational entities, such as the International Monetary Fund, or by the imposition of currency controls or other political developments in the United States or abroad. As a result, the Fund’s investments in foreign currency denominated securities may reduce the returns of the Fund. The market values of equity securities, such as common stocks and preferred stocks, or equity related investments, such as futures and options, may decline due to general market conditions which are not specifically related to a particular company, such as real or perceived adverse economic conditions, changes in the general outlook for corporate earnings, changes in interest or currency rates or adverse investor sentiment generally. The market value of equity securities may also decline due to factors which affect a particular industry or industries, such as labor shortages or increased production costs and competitive conditions within an industry. Equity securities and equity related investments generally have greater market price volatility than fixed income securities.
Federal Income Taxes:
Federal Income Taxes – For federal income tax purposes, the Fund intends to continue to qualify as a Regulated Investment Company ("RIC") under Subchapter M of the Internal Revenue Code (“IRC”) by distributing substantially all of its taxable net investment income and net realized capital gains to its shareholders and otherwise complying with the requirements of the IRC. The Fund has distributed substantially all of its income and capital gains in prior years, if applicable, and intends to distribute substantially all of its income and capital gains during the calendar year ending December 31, 2014. Accordingly, no provision for federal income or excise taxes has been made in the accompanying financial statements. Distributions from short-term capital gains are treated as ordinary income distributions for federal income tax purposes.
Net Investment Income (Loss), Net Realized Gains (Losses) and Distributions – Net investment income (loss) and net realized gains (losses) may differ for financial statement and tax purposes primarily because of losses deferred due to wash sale adjustments, foreign currency gains and losses, adjustments related to Passive Foreign Investment Companies ("PFICs"), Real Estate Investment Trusts ("REITs"), RICs, certain derivatives and partnerships. The character of distributions made during the year from net investment income or net realized gains may differ from their ultimate characterization for federal income tax purposes. Also, due to the timing of dividend distributions, the fiscal year in which amounts are distributed may differ from the year that the income or realized gains (losses) were recorded by the Fund.
| 26 |
| Hartford Global Capital Appreciation Fund |
| Notes to Financial Statements – (continued) |
| October 31, 2014 |
| (000’s Omitted) |
Distributions and Components of Distributable Earnings – The tax character of distributions paid by the Fund for the periods indicated is as follows (as adjusted for dividends payable, if applicable):
| For the Year Ended October 31, 2014 | For the Year Ended October 31, 2013 | |||||||
| Ordinary Income | $ | 140 | $ | 2,097 | ||||
| Long-Term Capital Gains ‡ | 26,908 | 222 | ||||||
‡ The Fund designates these distributions as long-term capital gain dividends pursuant to IRC Sec. 852(b)(3)(C).
As of October 31, 2014, the Fund’s components of distributable earnings (deficit) on a tax basis are as follows:
| Amount | ||||
| Undistributed Ordinary Income | $ | 83,107 | ||
| Undistributed Long-Term Capital Gain | 146,488 | |||
| Unrealized Appreciation* | 13,426 | |||
| Total Accumulated Earnings | $ | 243,021 | ||
| * | Differences between book-basis and tax-basis unrealized appreciation (depreciation) may be attributable to the losses deferred due to wash sale adjustments, foreign currency gains and losses, adjustments related to PFICs, REITs, RICs, certain derivatives and partnerships. |
Reclassification of Capital Accounts – The Fund may record reclassifications in its capital accounts. These reclassifications have no impact on the total net assets of the Fund. The reclassifications are a result of permanent differences between U.S. GAAP and tax accounting for such items as foreign currency, PFICs, expiration or utilization of capital loss carryforwards or net operating losses. Adjustments are made to reflect the impact these items have on current and future distributions to shareholders. Therefore, the source of the Fund’s distributions may be shown in the accompanying Statement of Changes in Net Assets as from undistributed net investment income, from accumulated net realized gains on investments or from capital depending on the type of book and tax differences that exist. For the year ended October 31, 2014, the Fund recorded reclassifications to increase (decrease) the accounts listed below:
| Amount | ||||
| Undistributed Net Investment Income (Loss) | $ | (992 | ) | |
| Accumulated Net Realized Gain (Loss) | 992 | |||
Capital Loss Carryforward – On December 22, 2010, the Regulated Investment Company Modernization Act of 2010 (the “Act”) was enacted, which made changes to the capital loss carryforward rules. The changes are effective for taxable years beginning after the date of enactment. Under the Act, funds are permitted to carry forward capital losses for an unlimited period. Additionally, capital loss carryforwards retain their character as either short-term or long-term capital losses rather than being considered all short-term as permitted under prior regulation.
The Fund had no capital loss carryforward for U.S. federal income tax purposes as of October 31, 2014.
During the year ended October 31, 2014, the Fund utilized $27,381 of prior year capital loss carryforwards.
Accounting for Uncertainty in Income Taxes – The Fund has adopted financial reporting rules that require the Fund to analyze all open tax years, as defined by the statute of limitations, for all major jurisdictions. Generally, tax authorities can examine all tax returns filed for the last three years. The Fund does not have an examination in progress.
The Fund has reviewed all open tax years and major jurisdictions and concluded that these financial reporting rules had no effect on the Fund’s financial position or results of operations. There is no tax liability resulting from unrecognized tax benefits relating to uncertain income tax positions taken or expected to be taken on the tax return for the fiscal year ended October 31, 2014. The Fund
| 27 |
| Hartford Global Capital Appreciation Fund |
| Notes to Financial Statements – (continued) |
| October 31, 2014 |
| (000’s Omitted) |
is also not aware of any tax positions for which it is reasonably possible that the total amounts of unrecognized tax benefits will significantly change in the next twelve months.
Expenses:
Investment Management Agreement – Hartford Funds Management Company, LLC ("HFMC") serves as the Fund’s investment manager pursuant to an Investment Management Agreement with the Company. HFMC is an indirect wholly owned subsidiary of The Hartford Financial Services Group, Inc. ("The Hartford"). The investment manager has overall investment supervisory responsibility for the Fund. In addition, the investment manager provides administrative personnel, services, equipment, facilities and office space for proper operation of the Fund. HFMC has contracted with Wellington Management Company, LLP ("Wellington Management") under a sub-advisory agreement for the provision of day-to-day investment management services to the Fund in accordance with the Fund’s investment objective and policies. The Fund pays a fee to the investment manager, a portion of which may be used to compensate Wellington Management.
The schedule below reflects the rates of compensation paid to the investment manager for investment management services rendered during the period February 28, 2014 through October 31, 2014; the rates are accrued daily and paid monthly:
| Average Daily Net Assets | Annual Fee |
| On first $500 million | 0.8500% |
| On next $500 million | 0.7500% |
| On next $4 billion | 0.7000% |
| On next $5 billion | 0.6800% |
| Over $10 billion | 0.6750% |
The schedule below reflects the rates of compensation paid to the investment manager for investment management services rendered during the period November 1, 2013 through February 27, 2014.
| Average Daily Net Assets | Annual Fee |
| On first $250 million | 0.9500% |
| On next $250 million | 0.9000% |
| On next $500 million | 0.8000% |
| On next $1.5 billion | 0.7500% |
| On next $2.5 billion | 0.7000% |
| On next $5 billion | 0.6800% |
| Over $10 billion | 0.6750% |
HFMC voluntarily agreed to waive investment management fees of 0.10% of average daily net assets until February 27, 2014. These amounts are deducted from expenses and are reported as expense waivers on the accompanying Statement of Operations, as applicable.
Accounting Services Agreement – Pursuant to the Fund Accounting Agreement between HFMC and the Company, on behalf of the Fund, HFMC provides accounting services to the Fund and receives monthly compensation based on the Fund’s average daily net assets at the rates set forth below. The Fund’s accounting services fees are accrued daily and paid monthly.
| Average Daily Net Assets | Annual Fee |
| On first $5 billion | 0.014% |
| On next $5 billion | 0.012% |
| Over $10 billion | 0.010% |
| 28 |
| Hartford Global Capital Appreciation Fund |
| Notes to Financial Statements – (continued) |
| October 31, 2014 |
| (000’s Omitted) |
Operating Expenses – Allocable expenses incurred by the Company are allocated to each Fund and allocated to classes within the Fund in proportion to the average daily net assets of the Fund and each class, except where allocation of certain expenses is more fairly made directly to the Fund or to specific classes within a Fund. As of October 31, 2014, HFMC contractually limited the total operating expenses of this Fund, exclusive of taxes, interest expense, brokerage commissions, acquired fund fees and expenses and extraordinary expenses, through February 28, 2015 as follows:
| Class A | Class B | Class C | Class I | Class R3 | Class R4 | Class R5 | Class Y |
| 1.25% | 2.00% | 2.00% | 1.00% | 1.35% | 1.05% | 0.95% | 0.90% |
Fees Paid Indirectly – The Fund has entered into agreements with State Street Global Markets, LLC and Russell Implementation Services, Inc. to partially recapture non-discounted trade commissions. Such rebates are used to pay a portion of the Fund’s expenses. In addition, the Fund's custodian bank has agreed to reduce its fees when the Fund maintains cash on deposit in a non-interest-bearing custody account. For the year ended October 31, 2014, these amounts, if any, are included in the Statement of Operations.
The ratio of expenses to average net assets in the accompanying financial highlights excludes the reduction in expenses related to fees paid indirectly. The annualized expense ratio after waivers for the period listed below reflecting the reduction for fees paid indirectly is as follows:
| Year Ended October 31, 2014 | ||||
| Class A | 1.25 | % | ||
| Class B | 1.99 | |||
| Class C | 1.95 | |||
| Class I | 0.92 | |||
| Class R3 | 1.35 | |||
| Class R4 | 1.05 | |||
| Class R5 | 0.94 | |||
| Class Y | 0.83 | |||
Distribution and Service Plan for Class A, B, C, R3 and R4 Shares – Hartford Funds Distributors, LLC ("HFD"), an indirect wholly owned subsidiary of The Hartford, is the principal underwriter and distributor of the Fund. HFD is engaged in distribution activities, which include marketing and distribution of shares through broker/dealers, financing distribution costs and maintaining financial books and records. For the year ended October 31, 2014, HFD received front-end load sales charges of $1,535 and contingent deferred sales charges of $16 from the Fund.
The Fund has adopted a Distribution and Service Plan in accordance with Rule 12b-1 of the 1940 Act to compensate the distributor (HFD) for activities intended to result in the sale and distribution of Class A, B, C, R3 and R4 shares and for providing services for shareholders. The Rule 12b-1 plan applicable to Class A shares of the Fund provides for payment of a Rule 12b-1 fee of 0.25% of average daily net assets. Some or all of the fee may be used for shareholder servicing expenses with the remainder used for distribution expenses. Under the Class B Plan, the Fund pays the distributor 1.00% of the average daily net assets of Class B shares that are outstanding for 8 years or less, 0.25% of which is a fee for services provided to existing shareholders with the remainder used for distribution expenses. Some or the entire Rule 12b-1 fee for Class B shares may be remitted to broker/dealers for distribution and/or shareholder account services. After eight years, Class B shares convert to Class A shares. Upon conversion to Class A shares, the Class A plan described above will apply to those shares. Under the Class C Plan, the Fund pays the distributor 1.00% of the average daily net assets of Class C shares outstanding, 0.25% of which is intended as a fee for services provided to existing shareholders with the remainder used for distribution expenses. For Class C shares, some or the entire fee may be remitted to broker/dealers for distribution and/or shareholder account services. Class R3 shares have a distribution fee of 0.50% of average daily net assets and Class R4 shares have a distribution fee of 0.25% of average daily net assets. For Class R3 and R4 shares, some or the entire fee may be remitted to broker/dealers for distribution and/or shareholder account services. The Fund’s 12b-1 fees are accrued daily and paid monthly or at such other intervals as the Board of Directors may determine.
| 29 |
| Hartford Global Capital Appreciation Fund |
| Notes to Financial Statements – (continued) |
| October 31, 2014 |
| (000’s Omitted) |
Other Related Party Transactions – Certain officers of the Fund are directors and/or officers of HFMC and/or The Hartford or its subsidiaries. For the year ended October 31, 2014, a portion of the Fund’s Chief Compliance Officer’s compensation was paid by all of the investment companies in the Hartford fund complex. The portion allocated to the Fund, as represented in other expenses on the Statement of Operations, was in the amount of $2. Hartford Administrative Services Company (“HASCO”), an indirect wholly-owned subsidiary of The Hartford, provides transfer agent services to the Fund. HASCO has contractually agreed to reimburse any portion of the transfer agency fees over 0.30% of average daily net assets per fiscal year for each class. Any transfer agency fee reimbursement is determined before considering the contractual operating expense limitation. For providing such services, HASCO is compensated on a per account basis that varies by account type, except with respect to Class Y, for which it is compensated based on average daily net assets. The amount paid to HASCO and any related contractual reimbursement amounts, if applicable, can be found in the Statement of Operations. These fees are accrued daily and paid monthly.
Administrative services fees are paid to HASCO for third-party recordkeeping services that are payable as a percentage of net assets in the amount of up to 0.20%, 0.15% and 0.10% for Classes R3, R4 and R5 shares, respectively. The total administrative services fees are shown on the Statement of Operations. These fees are accrued daily and paid monthly.
Affiliate Holdings:
As of October 31, 2014, affiliates of The Hartford had ownership of shares in the Fund as follows:
| Percentage
of Class | Percentage
of Fund | |||||||
| Class R4 | 2 | % | — | %* | ||||
| Class R5 | 11 | — | * | |||||
| Class Y | — | * | — | * | ||||
As of October 31, 2014, the Fund's shares were owned in aggregate by affiliated fund of funds. Therefore, the Fund may experience relatively large purchases or redemptions of its shares from these affiliated fund of funds. Affiliated fund of funds owned shares in the Fund as follows:
| Percentage of Fund | ||||
| Class Y | 14 | % | ||
* Percentage rounds to zero.
Investment Transactions:
For the year ended October 31, 2014, the cost of purchases and proceeds from sales of investment securities (excluding short-term investments) were as follows:
| Excluding U.S. Government Obligations | U.S. Government Obligations | Total | ||||||||||
| Cost of Purchases | $ | 2,151,924 | $ | — | $ | 2,151,924 | ||||||
| Sales Proceeds | 1,865,314 | — | 1,865,314 | |||||||||
| 30 |
| Hartford Global Capital Appreciation Fund |
| Notes to Financial Statements – (continued) |
| October 31, 2014 |
| (000’s Omitted) |
Capital Share Transactions:
The following information is for the year ended October 31, 2014, and the year ended October 31, 2013:
| For the Year Ended October 31, 2014 | For the Year Ended October 31, 2013 | |||||||||||||||||||||||||||||||
| Shares Sold* | Shares
Issued for Reinvested Dividends | Shares Redeemed | Net
Increase (Decrease) of Shares | Shares Sold | Shares
Issued for Reinvested Dividends | Shares Redeemed | Net
Increase (Decrease) of Shares | |||||||||||||||||||||||||
| Class A | ||||||||||||||||||||||||||||||||
| Shares | 13,787 | 705 | (4,726 | ) | 9,766 | 3,578 | 103 | (6,538 | ) | (2,857 | ) | |||||||||||||||||||||
| Amount | $ | 270,672 | $ | 13,203 | $ | (93,734 | ) | $ | 190,141 | $ | 59,643 | $ | 1,521 | $ | (104,824 | ) | $ | (43,660 | ) | |||||||||||||
| Class B | ||||||||||||||||||||||||||||||||
| Shares | 273 | 83 | (1,083 | ) | (727 | ) | 56 | — | (799 | ) | (743 | ) | ||||||||||||||||||||
| Amount | $ | 7,382 | $ | 1,462 | $ | (19,982 | ) | $ | (11,138 | ) | $ | 849 | $ | — | $ | (12,395 | ) | $ | (11,546 | ) | ||||||||||||
| Class C | ||||||||||||||||||||||||||||||||
| Shares | 2,187 | 379 | (2,051 | ) | 515 | 1,119 | — | (3,452 | ) | (2,333 | ) | |||||||||||||||||||||
| Amount | $ | 43,044 | $ | 6,667 | $ | (38,036 | ) | $ | 11,675 | $ | 17,564 | $ | — | $ | (52,063 | ) | $ | (34,499 | ) | |||||||||||||
| Class I | ||||||||||||||||||||||||||||||||
| Shares | 1,995 | 144 | (2,519 | ) | (380 | ) | 2,529 | 31 | (2,600 | ) | (40 | ) | ||||||||||||||||||||
| Amount | $ | 40,296 | $ | 2,760 | $ | (50,376 | ) | $ | (7,320 | ) | $ | 42,394 | $ | 461 | $ | (42,819 | ) | $ | 36 | |||||||||||||
| Class R3 | ||||||||||||||||||||||||||||||||
| Shares | 250 | 44 | (341 | ) | (47 | ) | 398 | 6 | (515 | ) | (111 | ) | ||||||||||||||||||||
| Amount | $ | 4,844 | $ | 820 | $ | (6,661 | ) | $ | (997 | ) | $ | 6,315 | $ | 82 | $ | (8,282 | ) | $ | (1,885 | ) | ||||||||||||
| Class R4 | ||||||||||||||||||||||||||||||||
| Shares | 128 | 14 | (204 | ) | (62 | ) | 136 | 3 | (319 | ) | (180 | ) | ||||||||||||||||||||
| Amount | $ | 2,525 | $ | 273 | $ | (4,119 | ) | $ | (1,321 | ) | $ | 2,296 | $ | 50 | $ | (5,345 | ) | $ | (2,999 | ) | ||||||||||||
| Class R5 | ||||||||||||||||||||||||||||||||
| Shares | 20 | 2 | (11 | ) | 11 | 14 | 1 | (40 | ) | (25 | ) | |||||||||||||||||||||
| Amount | $ | 403 | $ | 31 | $ | (221 | ) | $ | 213 | $ | 251 | $ | 7 | $ | (635 | ) | $ | (377 | ) | |||||||||||||
| Class Y | ||||||||||||||||||||||||||||||||
| Shares | 10,301 | 25 | (956 | ) | 9,370 | 35 | 5 | (222 | ) | (182 | ) | |||||||||||||||||||||
| Amount | $ | 213,279 | $ | 509 | $ | (19,890 | ) | $ | 193,898 | $ | 608 | $ | 72 | $ | (3,311 | ) | $ | (2,631 | ) | |||||||||||||
| Total | ||||||||||||||||||||||||||||||||
| Shares | 28,941 | 1,396 | (11,891 | ) | 18,446 | 7,865 | 149 | (14,485 | ) | (6,471 | ) | |||||||||||||||||||||
| Amount | $ | 582,445 | $ | 25,725 | $ | (233,019 | ) | $ | 375,151 | $ | 129,920 | $ | 2,193 | $ | (229,674 | ) | $ | (97,561 | ) | |||||||||||||
* Includes shares issued from merger, except for Class I. Please see the table immediately following for details. For further information please see Fund Merger section that follows.
| Shares Issued from Merger | ||||||||
| For the Year Ended October 31, 2014 | ||||||||
| Shares | Amount | |||||||
| Class A | 10,037 | $ | 197,410 | |||||
| Class B | 244 | 4,471 | ||||||
| Class C | 1,198 | 22,100 | ||||||
| Class R3 | 8 | 149 | ||||||
| Class R4 | 13 | 250 | ||||||
| Class R5 | 9 | 175 | ||||||
| Class Y | 10 | 199 | ||||||
| 11,519 | $ | 224,754 | ||||||
The following reflects the conversion of Class B shares into Class A shares (reflected as Class A shares sold) for the year ended October 31, 2014, and the year ended October 31, 2013:
| Shares | Dollars | |||||||
| For the Year Ended October 31, 2014 | 179 | $ | 3,556 | |||||
| For the Year Ended October 31, 2013 | 62 | $ | 1,087 |
| 31 |
| Hartford Global Capital Appreciation Fund |
| Notes to Financial Statements – (continued) |
| October 31, 2014 |
| (000’s Omitted) |
Line of Credit:
The Fund is one of several Hartford Funds that participate in a $500 million committed revolving line of credit facility. The facility is to be used for temporary or emergency purposes. Under the arrangement, the funds are required to own securities having a market value in excess of 300% of the total bank borrowings. The interest rate on borrowings varies depending on the nature of the loan. The facility also requires a fee to be paid based on the amount of the commitment. This commitment fee is allocated to all the funds participating in the line of credit based on the average net assets of the funds. During the year ended October 31, 2014, the Fund did not have any borrowings under this facility.
Fund Merger:
Reorganization of The Hartford Global Growth Fund into the Fund – At a meeting held on December 13, 2013, the Board of Directors of The Hartford Mutual Funds, Inc. approved an Agreement and Plan of Reorganization providing for the acquisition of all the assets and liabilities of The Hartford Global Growth Fund (“Target Fund”) by the Fund (“Acquiring Fund”).
Under the terms of the Agreement and Plan of Reorganization, the assets and liabilities of the Target Fund were acquired by the Fund on April 7, 2014. The Fund acquired the assets and liabilites of the Target Fund in exchange for shares in the Fund, which were distributed pro rata by the Target Fund to shareholders, in complete liquidation of the Target Fund.
The Fund acquired capital loss carryforwards of $27,381 from the Target Fund and none of these acquired losses were limited.
This merger was accomplished by tax free exchange, as detailed below:
| Net assets of Target Fund on April 4, 2014* | Net assets of Acquiring Fund immediately before merger | Net assets of Acquiring Fund immediately after merger | Target Fund shares exchanged | Acquiring Fund shares issued to the Target Fund's shareholders | ||||||||||||||||
| Class A | $ | 197,410 | $ | 536,838 | $ | 734,248 | 9,178 | 10,037 | ||||||||||||
| Class B | 4,471 | 52,533 | 57,004 | 234 | 244 | |||||||||||||||
| Class C | 22,100 | 268,421 | 290,521 | 1,159 | 1,198 | |||||||||||||||
| Class I ‡ | N/A | 114,781 | 114,781 | N/A | N/A | |||||||||||||||
| Class R3 | 149 | 32,497 | 32,646 | 7 | 8 | |||||||||||||||
| Class R4 | 250 | 11,153 | 11,403 | 11 | 13 | |||||||||||||||
| Class R5 | 175 | 1,325 | 1,500 | 8 | 9 | |||||||||||||||
| Class Y | 199 | 3,346 | 3,545 | 9 | 10 | |||||||||||||||
| Total | $ | 224,754 | $ | 1,020,894 | $ | 1,245,648 | 10,606 | 11,519 | ||||||||||||
* Final day of operations immediately prior to the merger.
‡ The Target Fund did not have Class I shares.
The Target Fund had the following unrealized appreciation, accumulated net realized losses and capital stock as of April 4, 2014:
| Fund | Undistributed Income | Unrealized Appreciation (Depreciation) | Accumulated Net Realized Gains (Losses) | Capital Stock | Total | |||||||||||||||
| Target Fund | $ | — | $ | 57,741 | $ | (27,906 | ) | $ | 194,919 | $ | 224,754 | |||||||||
| 32 |
| Hartford Global Capital Appreciation Fund |
| Notes to Financial Statements – (continued) |
| October 31, 2014 |
| (000’s Omitted) |
Assuming the acquisition had been completed on November 1, 2013, the beginning of the annual reporting period of the Funds, the Fund’s pro forma results of operations for the year ended October 31, 2014, are as follows:
| Fund | Net Investment Income | Net Gain on Investments | Net Increase in Net Assets Resulting From Operations | |||||||||
| Acquiring Fund | $ | 5,787 | $ | 98,193 | $ | 103,980 | ||||||
Because the combined investment portfolios have been managed as a single integrated portfolio since the merger was completed, it is not practical to separate the amounts of revenue and earnings of the Target Fund that have been included in the Fund’s Statement of Operations since the merger date.
Pending Legal Proceedings:
On February 25, 2011, Jennifer L. Kasilag, Louis Mellinger, Judith M. Menendez, Jacqueline M. Robinson, and Linda A. Russell filed a derivative lawsuit against Hartford Investment Financial Services, LLC (“HIFSCO”) (now known as HFD) on behalf of six Hartford retail mutual funds in the United States District Court for the District of New Jersey, alleging that HIFSCO received excessive advisory and distribution fees in violation of its statutory fiduciary duty under Section 36(b) of the 1940 Act when serving as investment manager and principal underwriter, respectively, to the Hartford retail mutual funds. Although this action was purportedly filed on behalf of certain of the Hartford Funds, none of the Hartford Funds is itself a defendant to the suit. HIFSCO moved to dismiss and, in September 2011, the motion was granted in part and denied in part, with leave to amend the complaint. In November 2011, plaintiffs filed an amended complaint on behalf of certain Hartford retail mutual funds, The Hartford Global Health Fund (now known as The Hartford Healthcare Fund), The Hartford Conservative Allocation Fund, The Hartford Growth Opportunities Fund, The Hartford Inflation Plus Fund, The Hartford Advisers Fund (now known as The Hartford Balanced Fund), and The Hartford Capital Appreciation Fund. Plaintiffs seek to rescind the investment management agreements and distribution plans between HIFSCO and these funds and to recover the total fees charged thereunder or, in the alternative, to recover any improper compensation HIFSCO received, in addition to lost earnings. HIFSCO filed a partial motion to dismiss the amended complaint and, in December 2012, the court dismissed without prejudice the claims regarding distribution fees and denied the motion with respect to the advisory fees claims. HIFSCO disputes the allegations and intends to defend vigorously.
In March 2014, the plaintiffs filed a new complaint that added as new plaintiffs The Hartford Floating Rate Fund and The Hartford Small Company Fund and named as a defendant HFMC, which assumed the role as investment manager to the funds as of January 2013. HFMC and HIFSCO dispute the allegations and intend to defend vigorously.
No accrual for litigation relating to this matter has been recorded in the financial statements of the Fund because the Fund is not party to the suit.
Indemnifications:
Under the Company's organizational documents, the Company shall indemnify its officers and directors to the full extent required or permitted under Maryland General Corporation Law and the federal securities laws. In addition, the Company, on behalf of the Fund, may enter into contracts that contain a variety of indemnifications. The Company's maximum exposure under these arrangements is unknown. However, as of the date of these financial statements, the Company has not had prior claims or losses pursuant to these contracts and expects the risk of loss to be remote.
Subsequent Event:
Effective December 1, 2014, pursuant to a sub-transfer agency agreement between HASCO and Boston Financial Data Services, Inc. (“BFDS”), HASCO has delegated certain transfer agent, dividend disbursing agent and shareholder servicing agent functions to BFDS. The costs and expenses of such delegation are borne by HASCO, not by the Fund.
| 33 |
| Hartford Global Capital Appreciation Fund |
| Financial Highlights |
| - Selected Per-Share Data - (A) | - Ratios and Supplemental Data - | |||||||||||||||||||||||||||||||||||||||||||||||||||
| Class | Net
Asset Value at Beginning of Period | Net Investment Income (Loss) | Net Realized and Unrealized Gain (Loss) on Invest- ments | Total
from Investment Operations | Dividends from Net Investment Income | Distribu- tions from Realized Capital Gains | Total Dividends and Distributions | Net
Asset Value at End of Period | Total Return(B) | Net
Assets at End of Period (000's) | Ratio
of Expenses to Average Net Assets Before Adjust- ments(C) | Ratio
of Expenses to Average Net Assets After Adjust- ments(C) | Ratio
of Net Investment Income (Loss) to Average Net Assets | |||||||||||||||||||||||||||||||||||||||
| For the Year Ended October 31, 2014 | ||||||||||||||||||||||||||||||||||||||||||||||||||||
| A | $ | 18.87 | $ | 0.13 | $ | 1.60 | $ | 1.73 | $ | – | $ | (0.50 | ) | $ | (0.50 | ) | $ | 20.10 | 9.39 | % | $ | 732,928 | 1.28 | % | 1.25 | % | 0.67 | % | ||||||||||||||||||||||||
| B | 17.67 | (0.02 | ) | 1.50 | 1.48 | – | (0.50 | ) | (0.50 | ) | 18.65 | 8.59 | 46,336 | 2.11 | 2.00 | (0.08 | ) | |||||||||||||||||||||||||||||||||||
| C | 17.78 | (0.01 | ) | 1.51 | 1.50 | – | (0.50 | ) | (0.50 | ) | 18.78 | 8.65 | 282,703 | 1.98 | 1.95 | (0.03 | ) | |||||||||||||||||||||||||||||||||||
| I | 19.26 | 0.20 | 1.63 | 1.83 | – | (0.50 | ) | (0.50 | ) | 20.59 | 9.72 | 117,640 | 0.95 | 0.92 | 0.98 | |||||||||||||||||||||||||||||||||||||
| R3 | 18.66 | 0.11 | 1.58 | 1.69 | – | (0.50 | ) | (0.50 | ) | 19.85 | 9.27 | 31,735 | 1.57 | 1.35 | 0.57 | |||||||||||||||||||||||||||||||||||||
| R4 | 19.06 | 0.18 | 1.61 | 1.79 | – | (0.50 | ) | (0.50 | ) | 20.35 | 9.61 | 10,055 | 1.26 | 1.05 | 0.88 | |||||||||||||||||||||||||||||||||||||
| R5 | 19.34 | 0.20 | 1.64 | 1.84 | – | (0.50 | ) | (0.50 | ) | 20.68 | 9.73 | 1,549 | 0.97 | 0.94 | 0.98 | |||||||||||||||||||||||||||||||||||||
| Y | 19.50 | 0.12 | 1.76 | 1.88 | (0.02 | ) | (0.50 | ) | (0.52 | ) | 20.86 | 9.83 | 209,340 | 0.86 | 0.83 | 0.58 | ||||||||||||||||||||||||||||||||||||
| For the Year Ended October 31, 2013 | ||||||||||||||||||||||||||||||||||||||||||||||||||||
| A | $ | 13.93 | $ | 0.07 | $ | 4.93 | $ | 5.00 | $ | (0.06 | ) | $ | – | $ | (0.06 | ) | $ | 18.87 | 35.97 | % | $ | 503,765 | 1.36 | % | 1.25 | % | 0.42 | % | ||||||||||||||||||||||||
| B | 13.10 | (0.05 | ) | 4.62 | 4.57 | – | – | – | 17.67 | 34.89 | 56,743 | 2.20 | 2.00 | (0.32 | ) | |||||||||||||||||||||||||||||||||||||
| C | 13.18 | (0.05 | ) | 4.65 | 4.60 | – | – | – | 17.78 | 34.90 | 258,520 | 2.07 | 2.00 | (0.33 | ) | |||||||||||||||||||||||||||||||||||||
| I | 14.22 | 0.11 | 5.02 | 5.13 | (0.09 | ) | – | (0.09 | ) | 19.26 | 36.29 | 117,325 | 1.04 | 1.00 | 0.66 | |||||||||||||||||||||||||||||||||||||
| R3 | 13.79 | 0.05 | 4.87 | 4.92 | (0.05 | ) | – | (0.05 | ) | 18.66 | 35.75 | 30,704 | 1.64 | 1.35 | 0.31 | |||||||||||||||||||||||||||||||||||||
| R4 | 14.07 | 0.11 | 4.96 | 5.07 | (0.08 | ) | – | (0.08 | ) | 19.06 | 36.18 | 10,603 | 1.33 | 1.05 | 0.63 | |||||||||||||||||||||||||||||||||||||
| R5 | 14.28 | 0.12 | 5.04 | 5.16 | (0.10 | ) | – | (0.10 | ) | 19.34 | 36.36 | 1,242 | 1.05 | 0.95 | 0.74 | |||||||||||||||||||||||||||||||||||||
| Y | 14.40 | 0.13 | 5.08 | 5.21 | (0.11 | ) | – | (0.11 | ) | 19.50 | 36.40 | 12,947 | 0.93 | 0.90 | 0.76 | |||||||||||||||||||||||||||||||||||||
| For the Year Ended October 31, 2012 (D) | ||||||||||||||||||||||||||||||||||||||||||||||||||||
| A | $ | 12.80 | $ | 0.03 | $ | 1.10 | $ | 1.13 | $ | – | $ | – | $ | – | $ | 13.93 | 8.83 | % | $ | 411,923 | 1.41 | % | 1.32 | % | 0.23 | % | ||||||||||||||||||||||||||
| B | 12.14 | (0.08 | ) | 1.04 | 0.96 | – | – | – | 13.10 | 7.91 | 51,815 | 2.26 | 2.10 | (0.55 | ) | |||||||||||||||||||||||||||||||||||||
| C | 12.21 | (0.07 | ) | 1.04 | 0.97 | – | – | – | 13.18 | 7.94 | 222,460 | 2.12 | 2.06 | (0.51 | ) | |||||||||||||||||||||||||||||||||||||
| I | 13.04 | 0.08 | 1.10 | 1.18 | – | – | – | 14.22 | 9.05 | 87,227 | 1.10 | 1.05 | 0.49 | |||||||||||||||||||||||||||||||||||||||
| R3 | 12.69 | 0.01 | 1.09 | 1.10 | – | – | – | 13.79 | 8.67 | 24,232 | 1.69 | 1.45 | 0.11 | |||||||||||||||||||||||||||||||||||||||
| R4 | 12.91 | 0.06 | 1.10 | 1.16 | – | – | – | 14.07 | 8.99 | 10,362 | 1.37 | 1.18 | 0.37 | |||||||||||||||||||||||||||||||||||||||
| R5 | 13.09 | 0.08 | 1.11 | 1.19 | – | – | – | 14.28 | 9.09 | 1,276 | 1.09 | 1.00 | 0.57 | |||||||||||||||||||||||||||||||||||||||
| Y | 13.18 | 0.19 | 1.03 | 1.22 | – | – | – | 14.40 | 9.26 | 12,189 | 0.97 | 0.95 | 0.63 | |||||||||||||||||||||||||||||||||||||||
| For the Year Ended October 31, 2011 (D) | ||||||||||||||||||||||||||||||||||||||||||||||||||||
| A | $ | 12.94 | $ | (0.03 | ) | $ | (0.11 | ) | $ | (0.14 | ) | $ | – | $ | – | $ | – | $ | 12.80 | (1.08 | )% | $ | 467,407 | 1.41 | % | 1.41 | % | (0.19 | )% | |||||||||||||||||||||||
| B | 12.37 | (0.14 | ) | (0.09 | ) | (0.23 | ) | – | – | – | 12.14 | (1.86 | ) | 61,934 | 2.25 | 2.25 | (1.03 | ) | ||||||||||||||||||||||||||||||||||
| C | 12.42 | (0.12 | ) | (0.09 | ) | (0.21 | ) | – | – | – | 12.21 | (1.69 | ) | 266,634 | 2.13 | 2.13 | (0.91 | ) | ||||||||||||||||||||||||||||||||||
| I | 13.13 | 0.02 | (0.11 | ) | (0.09 | ) | – | – | – | 13.04 | (0.69 | ) | 112,597 | 1.11 | 1.11 | 0.12 | ||||||||||||||||||||||||||||||||||||
| R3 | 12.86 | (0.06 | ) | (0.11 | ) | (0.17 | ) | – | – | – | 12.69 | (1.32 | ) | 20,237 | 1.72 | 1.70 | (0.48 | ) | ||||||||||||||||||||||||||||||||||
| R4 | 13.04 | (0.02 | ) | (0.11 | ) | (0.13 | ) | – | – | – | 12.91 | (1.00 | ) | 12,333 | 1.40 | 1.40 | (0.17 | ) | ||||||||||||||||||||||||||||||||||
| R5 | 13.18 | 0.02 | (0.11 | ) | (0.09 | ) | – | – | – | 13.09 | (0.68 | ) | 1,255 | 1.11 | 1.10 | 0.13 | ||||||||||||||||||||||||||||||||||||
| Y | 13.25 | 0.03 | (0.10 | ) | (0.07 | ) | – | – | – | 13.18 | (0.53 | ) | 33,723 | 0.99 | 0.99 | 0.23 | ||||||||||||||||||||||||||||||||||||
See Portfolio Turnover information on the next page.
| 34 |
| Hartford Global Capital Appreciation Fund |
| Financial Highlights – (continued) |
| - Selected Per-Share Data - (A) | - Ratios and Supplemental Data - | |||||||||||||||||||||||||||||||||||||||||||||||||||
| Class | Net
Asset Value at Beginning of Period | Net Investment Income (Loss) | Net Realized and Unrealized Gain (Loss) on Invest- ments | Total
from Investment Operations | Dividends from Net Investment Income | Distribu- tions from Realized Capital Gains | Total Dividends and Distributions | Net
Asset Value at End of Period | Total Return(B) | Net
Assets at End of Period (000's) | Ratio
of Expenses to Average Net Assets Before Adjust- ments(C) | Ratio
of Expenses to Average Net Assets After Adjust- ments(C) | Ratio
of Net Investment Income (Loss) to Average Net Assets | |||||||||||||||||||||||||||||||||||||||
| For the Year Ended October 31, 2010 (D) | ||||||||||||||||||||||||||||||||||||||||||||||||||||
| A | $ | 10.74 | $ | (0.03 | ) | $ | 2.23 | $ | 2.20 | $ | – | $ | – | $ | – | $ | 12.94 | 20.48 | % | $ | 516,406 | 1.44 | % | 1.44 | % | (0.20 | )% | |||||||||||||||||||||||||
| B | 10.35 | (0.14 | ) | 2.16 | 2.02 | – | – | – | 12.37 | 19.52 | 73,313 | 2.28 | 2.28 | (1.04 | ) | |||||||||||||||||||||||||||||||||||||
| C | 10.39 | (0.12 | ) | 2.15 | 2.03 | – | – | – | 12.42 | 19.54 | 310,899 | 2.15 | 2.15 | (0.91 | ) | |||||||||||||||||||||||||||||||||||||
| I | 10.86 | 0.02 | 2.25 | 2.27 | – | – | – | 13.13 | 20.90 | 107,796 | 1.11 | 1.11 | 0.13 | |||||||||||||||||||||||||||||||||||||||
| R3 | 10.71 | (0.05 | ) | 2.20 | 2.15 | – | – | – | 12.86 | 20.07 | 13,520 | 1.74 | 1.73 | (0.50 | ) | |||||||||||||||||||||||||||||||||||||
| R4 | 10.82 | (0.02 | ) | 2.24 | 2.22 | – | – | – | 13.04 | 20.52 | 8,486 | 1.40 | 1.40 | (0.18 | ) | |||||||||||||||||||||||||||||||||||||
| R5 | 10.91 | 0.02 | 2.25 | 2.27 | – | – | – | 13.18 | 20.81 | 777 | 1.12 | 1.11 | 0.12 | |||||||||||||||||||||||||||||||||||||||
| Y | 10.96 | 0.04 | 2.25 | 2.29 | – | – | – | 13.25 | 20.89 | 46,353 | 1.00 | 1.00 | 0.25 | |||||||||||||||||||||||||||||||||||||||
| (A) | Information presented relates to a share outstanding throughout the indicated period. Net investment income (loss) per share amounts are calculated based on average shares outstanding unless otherwise noted. |
| (B) | Assumes initial investment at net asset value at the beginning of each period, reinvestment of all distributions, the complete redemption of the investment at net asset value at the end of each period and no sales charge. Total return would be reduced if sales charges were taken into account. |
| (C) | Adjustments include waivers and reimbursements, if applicable. Ratios do not include fees paid indirectly (see Expenses in the accompanying Notes to Financial Statements). |
| (D) | Net investment income (loss) per share amounts have been calculated using the SEC method. |
| Portfolio
Turnover Rate for All Share Classes | ||||
| For the Year Ended October 31, 2014 | 144 | %(A) | ||
| For the Year Ended October 31, 2013 | 128 | |||
| For the Year Ended October 31, 2012 | 135 | |||
| For the Year Ended October 31, 2011 | 140 | |||
| For the Year Ended October 31, 2010 | 155 | |||
| (A) | During the year ended October 31, 2014, the Fund incurred $165.7 million in sales of securities held associated with the transition of assets from The Hartford Global Growth Fund, which merged into the Fund on April 7, 2014. These sales are excluded from the portfolio turnover rate calculation. |
| 35 |
| Report of Independent Registered Public Accounting Firm |
|
The Board of Directors and Shareholders of The Hartford Mutual Funds, Inc. |
We have audited the accompanying statement of assets and liabilities, including the schedule of investments, of Hartford Global Capital Appreciation Fund (formerly The Hartford Capital Appreciation II Fund) (one of the portfolios constituting The Hartford Mutual Funds, Inc. (the Funds)) as of October 31, 2014, and the related statement of operations for the year then ended, the statements of changes in net assets for each of the two years in the period then ended, and the financial highlights for each of the five years in the period then ended. These financial statements and financial highlights are the responsibility of the Funds’ management. Our responsibility is to express an opinion on these financial statements and financial highlights based on our audits.
We conducted our audits in accordance with the standards of the Public Company Accounting Oversight Board (United States). Those standards require that we plan and perform the audit to obtain reasonable assurance about whether the financial statements and financial highlights are free of material misstatement. We were not engaged to perform an audit of the Funds’ internal control over financial reporting. Our audits included consideration of internal control over financial reporting as a basis for designing audit procedures that are appropriate in the circumstances, but not for the purpose of expressing an opinion on the effectiveness of the Funds’ internal control over financial reporting. Accordingly, we express no such opinion. An audit also includes examining, on a test basis, evidence supporting the amounts and disclosures in the financial statements and financial highlights, assessing the accounting principles used and significant estimates made by management, and evaluating the overall financial statement presentation. Our procedures included confirmation of securities owned as of October 31, 2014, by correspondence with the custodian and brokers or by other appropriate auditing procedures where replies from brokers were not received. We believe that our audits provide a reasonable basis for our opinion.
In our opinion, the financial statements and financial highlights referred to above present fairly, in all material respects, the financial position of Hartford Global Capital Appreciation Fund (formerly The Hartford Capital Appreciation II Fund) of The Hartford Mutual Funds, Inc. at October 31, 2014, the results of its operations for the year then ended, the changes in its net assets for each of the two years in the period then ended, and the financial highlights for each of the five years in the period then ended, in conformity with U.S. generally accepted accounting principles.
| |
| Minneapolis, Minnesota | |
| December 18, 2014 |
| 36 |
| Hartford Global Capital Appreciation Fund |
| Directors and Officers (Unaudited) |
The Board of Directors of the Company (the "Directors") appoints officers who are responsible for the day-to-day operations of the Fund and who execute policies formulated by the Directors. Each Director serves until his or her death, resignation, or retirement or until the next annual meeting of shareholders is held or until his or her successor is elected and qualifies.
Directors and officers who are employed by or who have a financial interest in The Hartford Financial Services Group, Inc. ("The Hartford") are considered “interested” persons of the Fund pursuant to the 1940 Act. Each officer and two of the Company's Directors, as noted in the chart below, are “interested” persons of the Fund. Each Director serves as a director for The Hartford Mutual Funds, Inc., The Hartford Mutual Funds II, Inc., Hartford Series Fund, Inc., and Hartford HLS Series Fund II, Inc., and as a trustee for The Hartford Alternative Strategies Fund, which, as of October 31, 2014, collectively consist of 66 funds. Correspondence may be sent to Directors and officers c/o Hartford Funds, 5 Radnor Corporate Center, Suite 300, 100 Matsonford Road, Radnor, Pennsylvania 19087, except that correspondence to Mr. Annoni, Mr. Dressen and Ms. Quade may be sent to 500 Bielenberg Drive, Suite 500, Woodbury, Minnesota 55125.
The table below sets forth, for each Director and officer, his or her name, year of birth, current position with the Company and date first elected or appointed to The Hartford Mutual Funds, Inc. ("MF") and The Hartford Mutual Funds II, Inc. ("MF2"), principal occupation, and, for Directors, other directorships held. The Fund’s Statement of Additional Information contains further information on the Directors and is available free of charge by calling 1-888-843-7824 or writing to: Hartford Funds, P.O. Box 55022, Boston, MA 02205-5022.
Information on the aggregate remuneration paid to the directors of the Company can be found in the Statement of Operations herein. The Fund pays to The Hartford a portion of the Chief Compliance Officer’s compensation, but does not pay salaries or compensation to any of its other officers or Directors who are employed by The Hartford.
Non-Interested Directors
Hilary E. Ackermann (1956) Director since September 23, 2014
Ms. Ackermann served as Chief Risk Officer at Goldman Sachs Bank USA from October 2008 to November 2011 and serves as a Director of Dynegy, Inc., an independent power company, from October 2012 to present.
Lynn S. Birdsong (1946) Director since 2003, Chairman of the Investment Committee since 2014
Mr. Birdsong is a private investor. Mr. Birdsong currently serves as a Director of the Sovereign High Yield Investment Company (April 2010 to current). Mr. Birdsong currently serves as an Independent Director of Nomura Partners Funds, Inc. (formerly, The Japan Fund) (April 2003 to current). From 2003 to March 2005, Mr. Birdsong was an Independent Director of the Atlantic Whitehall Funds. From 1979 to 2002, Mr. Birdsong was a Managing Director of Zurich Scudder Investments, an investment management firm. During his employment with Scudder, Mr. Birdsong was an Interested Director of The Japan Fund. From January 1981 through December 2013, Mr. Birdsong was a partner in Birdsong Company, an advertising specialty firm.
Robert M. Gavin, Jr. (1940) Director since 2002 (MF) and 1986 (MF2), Chairman of the Board for each since 2004
Dr. Gavin is an educational consultant. Prior to September 1, 2001, he was President of Cranbrook Education Community and prior to July 1996, he was President of Macalester College, St. Paul, Minnesota.
Duane E. Hill (1945) Director since 2001 (MF) and 2002 (MF2), Chairman of the Nominating Committee since 2003
Mr. Hill is a Partner of TSG Ventures L.P., a private equity investment company. Mr. Hill is a former partner of TSG Capital Group, a private equity investment firm that served as sponsor and lead investor in leveraged buyouts of middle market companies.
Sandra S. Jaffee (1941) Director since 2005
Ms. Jaffee is the founder and Chief Executive Officer of a private company, Homeworks Concierge, LLC, which provides residential property management services in Westchester County, New York (January 2012 to present). Ms. Jaffee served as Chairman (2008 to 2009) and Chief Executive Officer of Fortent (formerly Searchspace Group), a leading provider of compliance/regulatory technology to financial institutions from August 2005 to August 2009. From August 2004 to August 2005, Ms. Jaffee served as an Entrepreneur in Residence with Warburg Pincus, a private equity firm. Prior to joining Warburg Pincus, Ms. Jaffee served as Executive Vice President at Citigroup, from September 1995 to July 2004, where she was President and Chief Executive Officer of Citibank’s Global Securities Services (1995 to 2003). Ms. Jaffee currently serves as a member of the Board of Directors of Broadridge Financial Solutions as well as a Trustee of Muhlenberg College.
| 37 |
| Hartford Global Capital Appreciation Fund |
| Directors and Officers (Unaudited) – (continued) |
William P. Johnston (1944) Director since 2005, Chairman of the Compliance Committee since 2005
In June 2006, Mr. Johnston was appointed as Senior Advisor to The Carlyle Group, a global private equity and other alternative asset investment firm and currently serves as an Operating Executive. In July 2006, Mr. Johnston was elected to the Board of Directors of MultiPlan, Inc. and served as a Director (July 2006 to August 2010). In August 2007, Mr. Johnston was elected to the Board of Directors of LifeCare Holdings, Inc. and served as a Director (August 2007 to June 2013). In February 2008, Mr. Johnston was elected to the Board of Directors of HCR-ManorCare, Inc. In May 2006, Mr. Johnston was elected to the Supervisory Board of Fresenius Medical Care AG & Co. KGaA, after its acquisition of Renal Care Group, Inc. in March 2006. Mr. Johnston joined Renal Care Group in November 2002 as a member of the Board of Directors and served as Chairman of the Board from March 2003 through March 2006. From 2002 through 2013, Mr. Johnston served as a Board member of the Georgia O’Keefe Museum. From September 1987 to December 2002, Mr. Johnston was with Equitable Securities Corporation (and its successors, SunTrust Equitable Securities and SunTrust Robinson Humphrey) serving in various investment banking and managerial positions, including Managing Director and Head of Investment Banking, Chief Executive Officer and Vice Chairman.
Phillip O. Peterson (1944) Director since 2002 (MF) and 2000 (MF2), Chairman of the Audit Committee since 2002
Mr. Peterson is a mutual fund industry consultant. He was a partner of KPMG LLP (an accounting firm) until July 1999. Mr. Peterson joined William Blair Funds in February 2007 as a member of the Board of Trustees. From February 2012 to February 2014, Mr. Peterson served as a Trustee of Symetra Variable Mutual Funds. From January 2004 to April 2005, Mr. Peterson served as Independent President of the Strong Mutual Funds.
Lemma W. Senbet (1946) Director since 2005
Dr. Senbet is the William E. Mayer Chair Professor of Finance and Founding Director, Center for Financial Policy, at the University of Maryland, Robert H. Smith School of Business. He was chair of the Finance Department of the University of Maryland, Robert H. Smith School of Business from 1998 to 2006. Since June 2013, he has been on leave from the University to serve as Executive Director of African Economic Research Consortium which focuses on economic policy research and training. Previously, he was a chaired professor of finance at the University of Wisconsin-Madison. Also, he was a Director of the Fortis Funds from March 2000 to July 2002. Dr. Senbet served as Director of the American Finance Association and President of the Western Finance Association. In 2006, Dr. Senbet was inducted Fellow of Financial Management Association International for his career-long distinguished scholarship and professional service.
Interested Directors and Officers
James E. Davey (1964) Director since 2012, President and Chief Executive Officer since 2010
Mr. Davey serves as Executive Vice President of Hartford Life Insurance Company (“HLIC”) and The Hartford. Additionally, Mr. Davey serves as Chairman of the Board, Manager and Senior Managing Director of Hartford Funds Distributors, LLC (“HFD”). He also currently serves as Director, Chairman of the Board, President and Senior Managing Director of Hartford Administrative Services Company (“HASCO”). Mr. Davey also serves as Manager, Chairman of the Board and Senior Managing Director for Hartford Funds Management Company, LLC (“HFMC”) and Director, Chairman of the Board and Senior Managing Director for Hartford Funds Management Group, Inc. ("HFMG"). Mr. Davey has served in various positions within The Hartford and its subsidiaries in connection with the operation of the Hartford Funds. Mr. Davey joined The Hartford in 2002.
Lowndes A. Smith* (1939) Director since 1996 (MF) and 2002 (MF2)
Mr. Smith served as Vice Chairman of The Hartford from February 1997 to January 2002, as President and Chief Executive Officer of Hartford Life, Inc. from February 1997 to January 2002, and as President and Chief Operating Officer of The Hartford Life Insurance Companies from January 1989 to January 2002. Mr. Smith serves as a Director of White Mountains Insurance Group Ltd. (October 2003 to current); One Beacon Insurance (October 2006 to current); Symetra Financial (August 2007 to current) and is a Managing Director of Whittington Gray Associates (January 2007 to current).
* Mr. Smith resigned as a Director of MF, MF2, Hartford Series Fund, Inc. and Hartford HLS Series Fund II, Inc. and as a Trustee of The Hartford Alternative Strategies Fund effective September 17, 2014.
Other Officers
Mark A. Annoni (1964) Vice President, Controller and Treasurer since 2012
Mr. Annoni currently serves as the Assistant Vice President of HLIC (February 2004 to present) and Senior Vice President of HFMG (December 2013 to present). Mr. Annoni has served in various positions within The Hartford and its subsidiaries in connection with the operation of the Hartford Funds. Mr. Annoni joined The Hartford in 2001.
| 38 |
| Hartford Global Capital Appreciation Fund |
| Directors and Officers (Unaudited) – (continued) |
Michael R. Dressen (1963) AML Compliance Officer since 2011
Mr. Dressen currently serves as Assistant Vice President of HLIC. He also serves as Chief Compliance Officer and AML Compliance Officer of HASCO and as AML Officer of HFD. Mr. Dressen has served in various positions within The Hartford and its subsidiaries in connection with the operation of the Hartford Funds.
Edward P. Macdonald (1967) Vice President, Secretary and Chief Legal Officer since 2005
Mr. Macdonald currently serves as Assistant Secretary, Executive Vice President and Deputy General Counsel of HFD, HASCO, HFMC and HFMG. He also serves as Vice President of HLIC. Mr. Macdonald has served in various positions within The Hartford and its subsidiaries in connection with the operation of the Hartford Funds. Mr. Macdonald joined The Hartford in 2005.
Joseph G. Melcher (1973) Vice President and Chief Compliance Officer since 2013
Mr. Melcher currently serves as Executive Vice President of HFD, HFMG and HASCO. Mr. Melcher also currently serves as Executive Vice President and Chief Compliance Officer of HFMC. Mr. Melcher has served in various positions within The Hartford and its subsidiaries in connection with the operation of the Hartford Funds since joining The Hartford in 2012. Prior to joining The Hartford, Mr. Melcher worked at Touchstone Investments, a member of the Western & Southern Financial Group, where he held the position of Vice President and Chief Compliance Officer from 2010 through 2012 and Assistant Vice President, Compliance from 2005 to 2010.
Vernon J. Meyer (1964) Vice President since 2006
Mr. Meyer currently serves as Senior Vice President of HLIC. He also currently serves as Managing Director and Chief Investment Officer of HFMC and Managing Director of HFMG. Mr. Meyer has served in various positions within The Hartford and its subsidiaries in connection with the operation of the Hartford Funds. Mr. Meyer joined The Hartford in 2004.
Laura S. Quade (1969) Vice President since 2012
Ms. Quade currently serves as Vice President of HASCO, HFD and HFMG. She is the Head of Operations of HASCO and formerly served as Director, Enterprise Operations of HLIC. Ms. Quade has served in various positions within The Hartford and its subsidiaries in connection with the operation of the Hartford Funds. Ms. Quade joined The Hartford in 2001.
Martin A. Swanson** (1962) Vice President since 2010
Mr. Swanson currently serves as Vice President of HLIC. Mr. Swanson also serves as Managing Director, Chief Marketing Officer and Principal of HFD and Managing Director of HFMG. Mr. Swanson has served in various positions within The Hartford and its subsidiaries in connection with the operation of the Hartford Funds.
** Mr. Swanson resigned as an officer effective November 6, 2014.
HOW TO OBTAIN A COPY OF THE FUND’S PROXY VOTING POLICIES AND VOTING RECORDS (UNAUDITED)
A description of the policies and procedures that the Fund uses to determine how to vote proxies relating to portfolio securities and information about how the Fund voted proxies relating to portfolio securities during the most recent twelve-month period ended June 30 are available (1) without charge, upon request, by calling 888-843-7824 and (2) on the SEC’s website at http://www.sec.gov.
QUARTERLY PORTFOLIO HOLDINGS INFORMATION (UNAUDITED)
The Fund files a complete schedule of portfolio holdings with the SEC for the first and third quarters of each fiscal year on Form N-Q. The Fund’s Forms N-Q are available (1) without charge, upon request, by calling 888-843-7824 and (2) on the SEC’s website at http://www.sec.gov. The Form N-Q may be reviewed and copied at the SEC’s Public Reference Room in Washington, DC. Information on the operation of the Public Reference Room may be obtained by calling 1-800-SEC-0330.
| 39 |
| Hartford Global Capital Appreciation Fund |
| Federal Tax Information (Unaudited) |
For the fiscal year ended October 31, 2014, there is no further federal tax information required for this Fund.
| 40 |
| Hartford Global Capital Appreciation Fund |
| Expense Example (Unaudited) |
Your Fund's Expenses
As a shareholder of the Fund, you incur two types of costs: (1) transaction costs, including sales charges (loads) on purchase payments, if any, and contingent deferred sales charges (CDSC), if any, and (2) ongoing costs, including investment management fees, distribution and/or service (12b-1) fees, if any, and other fund expenses. This example is intended to help you understand your ongoing costs (in dollars) of investing in the Fund and to compare these costs with the ongoing costs of investing in other mutual funds. The example is based on an investment of $1,000 invested at the beginning of the period and held for the entire period of April 30, 2014 through October 31, 2014.
Actual Expenses
The first set of columns of the table below provides information about actual account values and actual expenses. You may use the information in this column, together with the amount you invested, to estimate the expenses that you paid over the period. Simply divide your account value by $1,000 (for example, an $8,600 account value divided by $1,000 = 8.6), then multiply the result by the number in the line under the heading entitled “Expenses Paid During Period” to estimate the expenses you paid on your account during this period.
Hypothetical Example for Comparison Purposes
The second set of columns of the table below provides information about hypothetical account values and hypothetical expenses based on the Fund's actual expense ratio and an assumed rate of return of 5% per year before expenses, which is not the Fund's actual return. The hypothetical account values and expenses may not be used to estimate the actual ending account balance or expenses you paid for the period. You may use this information to compare the ongoing costs of investing in the Fund and other funds. To do so, compare this 5% hypothetical example with the 5% hypothetical examples that appear in the shareholder reports of the other funds.
Please note that the expenses shown in the table are meant to highlight your ongoing costs only and do not reflect any transactional costs, such as sales charges (loads) and CDSC. Therefore, the second set of columns of the table is useful in comparing ongoing costs only, and will not help you determine the relative total costs of owning different funds. In addition, if these transactional costs were included, your costs would be higher. Expenses are equal to the Fund's annualized expense ratios multiplied by average account value over the period, multiplied by 184/365 (to reflect the one-half year period).
| Actual return | Hypothetical (5% return before expenses) | |||||||||||||||||||||||||||||||||||
| Beginning Account Value April 30, 2014 | Ending
Account Value October 31, 2014 | Expenses
paid during the period April 30, 2014 through October 31, 2014 | Beginning Account Value April 30, 2014 | Ending
Account Value October 31, 2014 | Expenses
paid during the period April 30, 2014 through October 31, 2014 | Annualized expense ratio | Days in the current 1/2 year | Days in the full year | ||||||||||||||||||||||||||||
| Class A | $ | 1,000.00 | $ | 1,020.50 | $ | 6.37 | $ | 1,000.00 | $ | 1,018.90 | $ | 6.36 | 1.25 | % | 184 | 365 | ||||||||||||||||||||
| Class B | $ | 1,000.00 | $ | 1,016.60 | $ | 10.17 | $ | 1,000.00 | $ | 1,015.12 | $ | 10.16 | 2.00 | 184 | 365 | |||||||||||||||||||||
| Class C | $ | 1,000.00 | $ | 1,017.00 | $ | 9.97 | $ | 1,000.00 | $ | 1,015.32 | $ | 9.96 | 1.96 | 184 | 365 | |||||||||||||||||||||
| Class I | $ | 1,000.00 | $ | 1,022.10 | $ | 4.68 | $ | 1,000.00 | $ | 1,020.57 | $ | 4.68 | 0.92 | 184 | 365 | |||||||||||||||||||||
| Class R3 | $ | 1,000.00 | $ | 1,020.30 | $ | 6.87 | $ | 1,000.00 | $ | 1,018.40 | $ | 6.87 | 1.35 | 184 | 365 | |||||||||||||||||||||
| Class R4 | $ | 1,000.00 | $ | 1,021.80 | $ | 5.35 | $ | 1,000.00 | $ | 1,019.91 | $ | 5.35 | 1.05 | 184 | 365 | |||||||||||||||||||||
| Class R5 | $ | 1,000.00 | $ | 1,022.00 | $ | 4.80 | $ | 1,000.00 | $ | 1,020.45 | $ | 4.80 | 0.94 | 184 | 365 | |||||||||||||||||||||
| Class Y | $ | 1,000.00 | $ | 1,022.90 | $ | 4.23 | $ | 1,000.00 | $ | 1,021.03 | $ | 4.22 | 0.83 | 184 | 365 | |||||||||||||||||||||
| 41 |
| Hartford Global Capital Appreciation Fund |
| Approval of Investment Management and Investment Sub-Advisory Agreements (Unaudited) |
Section 15(c) of the Investment Company Act of 1940, as amended (the “1940 Act”), requires that each mutual fund’s board of directors, including a majority of those directors who are not “interested persons” of the mutual fund, as defined in the 1940 Act (the “Independent Directors”), annually review and consider the continuation of the mutual fund’s investment advisory and sub-advisory agreements. At its meeting held on August 5-6, 2014, the Board of Directors (the “Board”) of The Hartford Mutual Funds, Inc., including each of the Independent Directors, unanimously voted to approve the continuation of the investment management agreement for Hartford Global Capital Appreciation Fund (formerly The Hartford Capital Appreciation II Fund) (the “Fund”) with Hartford Funds Management Company, LLC (“HFMC”) and the continuation of the investment sub-advisory agreement between HFMC and the Fund’s sub-adviser, Wellington Management Company, LLP (the “Sub-adviser,” and together with HFMC, the “Advisers”) (collectively, the “Agreements”).
In the months preceding the August 5-6, 2014 meeting, the Board requested, received and reviewed written responses from the Advisers to questions posed to them on behalf of the Independent Directors and supporting materials relating to those questions and responses. The Board considered information furnished to the Board at its meetings throughout the year, as well as information specifically prepared in connection with the annual approval of the Agreements at the Board’s meetings held on June 17-18, 2014 and August 5-6, 2014. Information provided to the Board at its meetings throughout the year included, among other things, reports on Fund performance, legal and compliance matters, sales and marketing activity, shareholder services, and the other services provided to the Fund by the Advisers and their affiliates. The Board also received in-person presentations by Fund officers and representatives of HFMC at the Board’s meetings on June 17-18, 2014 and August 5-6, 2014 concerning the Agreements.
The Independent Directors, advised by independent legal counsel, engaged service providers to assist them with evaluating the Agreements with respect to the Fund. Lipper Inc. (“Lipper”), an independent provider of investment company data, was retained to provide the Board with reports on how the Fund’s contractual management fees, actual management fees, other non-management fees, overall expense ratios and investment performance compared to those of mutual funds with similar investment objectives. The Independent Directors also engaged an independent financial services consultant (the “Consultant”) to assist them in evaluating the Fund’s management fees, sub-advisory fees, other non-management fees, overall expense ratios and investment performance. In addition, the Consultant reviewed the profitability calculations utilized by HFMC in connection with the continuation of the investment management agreement.
In determining whether to continue the Agreements for the Fund, the members of the Board reviewed and evaluated information and factors they believed to be relevant and appropriate in light of the information that the Board deemed necessary and appropriate through the exercise of its reasonable business judgment. While individual members of the Board may have weighed certain factors differently, the Board’s determination to continue the Agreements was based on a comprehensive consideration of all information provided to the Board throughout the year and specifically with respect to the continuation of the Agreements. A more detailed discussion of the factors the Board considered with respect to its approval of the Agreements is provided below.
Nature, Extent and Quality of Services Provided by the Advisers
The Board requested and considered information concerning the nature, extent and quality of the services provided to the Fund by the Advisers. The Board considered, among other things, the terms of the Agreements and the range of services provided by the Advisers. The Board considered the Advisers’ professional personnel who provide services to the Fund, including each Adviser’s ability and experience in attracting and retaining qualified personnel to service the Fund. The Board considered each Adviser’s reputation and overall financial strength, as well as its willingness to consider and implement organizational and operational changes designed to enhance services to the Hartford Funds. In addition, the Board considered the quality of each Adviser’s communications with the Board and responsiveness to Board inquiries and requests made from time to time with respect to the Fund and other Hartford Funds.
The Board also requested and evaluated information concerning each Adviser’s regulatory and compliance environment. In this regard, the Board requested and reviewed information on each Adviser’s compliance policies and procedures, compliance history, and a report from the Fund’s Chief Compliance Officer on each Adviser’s compliance with applicable laws and regulations, including responses to regulatory developments and compliance issues raised by regulators. The Board also noted the Advisers’ support of the Fund’s compliance control structure, particularly the resources devoted by the Advisers in support of the Fund’s obligations pursuant to Rule 38a-1 under the 1940 Act.
With respect to HFMC, the Board noted that, under the Agreements, HFMC is responsible for the management of the Fund, including oversight of fund operations and service providers, and provides administrative and investment advisory services in connection with selecting, monitoring and supervising the Sub-adviser. The Board considered HFMC’s ongoing monitoring of people, process and performance, including its quarterly reviews of each of the Hartford Funds, semi-annual meetings with the leaders of each Fund’s portfolio management team, and oversight of the Hartford Funds’ approximately 66 portfolio managers. The Board recognized that HFMC has demonstrated a record of making changes to the
| 42 |
| Hartford Global Capital Appreciation Fund |
| Approval of Investment Management and Investment Sub-Advisory Agreements (Unaudited) – (continued) |
management and/or strategies of the Hartford Funds when warranted. The Board considered HFMC’s oversight of the Sub-adviser’s investment approach and results, process for monitoring best execution of portfolio trades by the Sub-adviser, and approach to risk management with respect to the Fund and the service providers to the Fund. The Board also considered HFMC’s oversight of compliance with the Fund’s objective and policies as well as with applicable laws and regulations, noting that regulatory and other developments had over time led to an increase in the scope of HFMC’s services in this regard.
In addition, the Board considered HFMC’s ongoing commitment to review and rationalize the Hartford Funds product line-up and the expenses that HFMC had incurred in connection with fund combinations in recent years. The Board considered that HFMC or its affiliates are responsible for providing the Fund’s officers.
With respect to the Sub-adviser, which provides certain day-to-day portfolio management services for the Fund, the Board considered the quality of the Fund’s portfolio managers, the Sub-adviser’s other investment personnel, its investment philosophy and process, investment research capabilities and resources, performance record, trade execution capabilities and experience. The Board considered the experience of the Fund’s portfolio managers, the number of accounts managed by the portfolio managers, and the Sub-adviser’s method for compensating the portfolio managers.
Based on these considerations, the Board concluded that it was satisfied with the nature, extent and quality of the services provided to the Fund by HFMC and the Sub-adviser.
Performance of the Fund and the Advisers
The Board considered the investment performance of the Fund. In this regard, the Board reviewed the performance of the Fund over different time periods presented in the materials and evaluated HFMC’s analysis of the Fund’s performance for these time periods. The Board considered information and materials provided to the Board by the Advisers concerning Fund performance, as well as information from Lipper comparing the investment performance of the Fund to an appropriate benchmark and universe of peer funds. The Board noted that the Fund’s performance was in the 1st quintile of its performance universe for the 1-, 3- and 5-year periods. The Board also noted that the Fund’s performance was above its benchmark for the 1-, 3- and 5-year periods. The Board further noted that certain changes had recently been made to the Fund’s principal investment strategy.
The Board considered the detailed investment analytics reports provided by Hartford Funds’ Investment Advisory Group throughout the year. These reports include, among other things, information on the Fund’s gross and net returns, the Fund’s investment performance relative to an appropriate benchmark and peer group, various statistics concerning the Fund’s portfolio, and a narrative summary of various factors affecting Fund performance. The Board considered the Advisers’ cooperation with the Investment Committee, which assists the Board in evaluating the performance of the Fund at periodic meetings throughout the year. The Board also considered the analysis provided by the Consultant relating to the Fund’s performance track record.
In light of all the considerations noted above, the Board concluded that it had continued confidence in HFMC’s and the Sub-adviser’s overall capabilities to manage the Fund.
Costs of the Services and Profitability of the Advisers
The Board reviewed information regarding HFMC’s cost to provide investment management and related services to the Fund and HFMC’s profitability, both overall and for the Fund, on a pre-tax basis without regard to distribution expenses. The Board also requested and reviewed information about the profitability to HFMC and its affiliates from all services provided to the Fund and all aspects of their relationship with the Fund. The Board also requested and received information relating to the operations and profitability of the Sub-adviser.
The Board considered the Consultant’s review of the profitability calculations used by HFMC in connection with the continuation of the investment management agreement, noting the Consultant’s view that Hartford Funds’ process for calculating and reporting Fund profitability is reasonable. In this regard, the Board noted that the Consultant performed a full review of this process in light of the recent restructuring of the Hartford Funds business and reported that the approach to analyzing Fund profitability, including the use of common expense allocation methodologies, is reasonable, sound and well within common industry practice.
Based on these considerations, the Board concluded that the profits anticipated to be realized by the Advisers and their affiliates from their relationships with the Fund would not be excessive.
| 43 |
| Hartford Global Capital Appreciation Fund |
| Approval of Investment Management and Investment Sub-Advisory Agreements (Unaudited) – (continued) |
Comparison of Fees and Services Provided by the Advisers
The Board considered comparative information with respect to the management fees to be paid by the Fund to HFMC and the total expense ratios of the Fund. The Board also considered comparative information with respect to the sub-advisory fees to be paid by HFMC to the Sub-adviser. In this regard, the Board requested and reviewed information from HFMC and the Sub-adviser relating to the management and sub-advisory fees, including the sub-advisory fee schedule for the Fund, and total operating expenses for the Fund. With respect to the sub-advisory fee schedule, the Board considered representations from HFMC and the Sub-adviser that the Sub-adviser’s fees were negotiated at arm’s length on a fund-by-fund basis. The Board also reviewed information from Lipper comparing the Fund’s contractual management fees, actual management fees and overall expense ratios relative to a group of funds selected by Lipper, in consultation with the Consultant, and a broader universe of funds selected by Lipper. The Board considered that the Fund’s contractual management fee was in the 4th quintile of its expense group, while its actual management fee was in the 3rd quintile and its total expenses (less 12b-1 and shareholder service fees) were in the 2nd quintile. The Board noted that the Fund has an automatically renewable contractual expense cap on each share class. The expense cap resulted in reimbursement of certain expenses incurred in 2013.
While the Board recognized that comparisons between the Fund and peer funds may be imprecise, given the different service levels and characteristics of mutual funds and the different business models and cost structures of the Advisers, the comparative information provided by Lipper assisted the Board in evaluating the reasonableness of the Fund’s management and sub-advisory fees and total operating expenses. In addition, the Board considered the analysis and recommendations of the Consultant relating to the Fund’s management and sub-advisory fees and total operating expenses.
Based on these considerations, the Board concluded that the Fund’s fees and total operating expenses, in conjunction with the information about quality of services, profitability, economies of scale, and other matters discussed, were reasonable in light of the services provided.
Economies of Scale
The Board requested and considered information regarding the Advisers’ realization of economies of scale with respect to the Fund and whether the fee levels reflect these economies of scale for the benefit of the Fund’s shareholders. The Board reviewed the breakpoints in the management fee schedule for the Fund, which reduce fee rates as Fund assets grow over time. The Board recognized that a fund with assets beyond the highest breakpoint level will continue to benefit from economies of scale because additional assets are charged the lowest breakpoint fee resulting in lower overall effective management fee rates. The Board also considered that expense limitations and fee waivers that reduce the Fund’s expenses at all asset levels can have the same effect as breakpoints in sharing economies of scale with shareholders and provide protection from an increase in expenses if Fund assets decline. The Board recognized that a fee schedule that reaches a lower breakpoint quickly provides shareholders with the benefit of anticipated or potential economies of scale. The Board also considered that HFMC has been active in managing expenses, which has resulted in benefits being realized by shareholders as assets within the Hartford Funds family of funds have grown over time, including through lower transfer agent costs and other operating expenses.
The Board reviewed and evaluated materials from Lipper and the Consultant showing how management fee schedules of peer funds reflect economies of scale for the benefit of shareholders as a peer fund’s assets hypothetically increase over time. Based on information provided by HFMC, Lipper, and the Consultant, the Board recognized that there is no uniform methodology for establishing breakpoints or uniform pattern in asset levels that trigger breakpoints or the amounts of breakpoints triggered.
After considering all of the information available to it, the Board concluded that it was satisfied with the extent to which economies of scale would be shared for the benefit of the Fund’s shareholders based on currently available information and the effective advisory fees and expense ratios for the Fund at its current and reasonably anticipated asset levels. The Board noted, however, that it would continue to monitor future growth in Fund assets and the appropriateness of additional breakpoints.
Other Benefits
The Board considered other benefits to the Advisers and their affiliates from their relationships with the Fund.
The Board noted that HFMC receives fees for fund accounting and related services from the Fund, and the Board considered information on profits to HFMC for such services. The Board also considered that Hartford Administrative Services Company (“HASCO”), the Fund’s transfer agent and an affiliate of HFMC, receives transfer agency compensation from the Fund, and the Board reviewed information on the profitability of
| 44 |
| Hartford Global Capital Appreciation Fund |
| Approval of Investment Management and Investment Sub-Advisory Agreements (Unaudited) – (continued) |
the Fund’s transfer agency function to HASCO. The Board considered information provided by HASCO indicating that the transfer agent fees charged by HASCO to the Fund were fair and reasonable based on publicly available information.
The Board also considered that Hartford Funds Distributors, LLC (“HFD”), an affiliate of HFMC, serves as principal underwriter of the Fund. As principal underwriter, HFD receives 12b-1 fees from the Fund and receives all or a portion of the sales charges on sales or redemptions of certain classes of shares. The Board also noted that certain affiliates of HFD distribute shares of the Fund and receive compensation in that connection.
The Board considered benefits to the Sub-adviser from its use of the Fund’s brokerage commissions to obtain soft dollar research, and representations from HFMC and the Sub-adviser that the Sub-adviser would not make any revenue-sharing payments or any other type of distribution payments to HFMC or its affiliates.
The Board considered the benefits to shareholders of being part of the Hartford Funds family of funds, including the right to exchange investments between the same class of funds without a sales charge, the ability to reinvest Fund dividends into other funds in the family, and the ability to combine holdings in the Fund with holdings in other funds to obtain a reduced sales charge. The Board considered HFMC’s efforts to provide investors in the family with a broad range of investment styles and asset classes and its entrepreneurial risk in initiating new funds to expand these opportunities for shareholders.
* * * *
Based upon its review of these various factors, among others, the Board concluded that it is in the best interests of the Fund and its shareholders for the Board to approve the Agreements for an additional year. In reaching this decision, the Board did not assign relative weights to the factors discussed above or deem any one or group of them to be controlling in and of themselves. In connection with their deliberations, the Independent Directors met separately in executive session on several occasions, with independent legal counsel and the Consultant, to review the relevant materials and consider their responsibilities under relevant laws and regulations.
| 45 |
| Hartford Global Capital Appreciation Fund |
| Main Risks (Unaudited) |
The main risks of investing in the Fund are described below.
Market, Selection and Strategy Risk: The Fund’s share price may fluctuate due to market risk and/or security selections that may underperform the market or relevant benchmarks. If the sub-adviser's investment strategy does not perform as expected, the Fund could underperform its peers or lose money. There is no guarantee the Fund will achieve its stated objective.
Small/Mid-Cap Stock Risk: Small- and mid-cap stocks are generally more volatile and risky and may be less liquid than large-cap stocks because they may have limited operating histories, narrow product lines, and focus on niche markets.
Foreign Investment and Emerging Markets Risk: Investments in foreign securities may be riskier than investments in U.S. securities. Potential risks include the risks of illiquidity, increased price volatility, less government regulation, less extensive and less frequent accounting and other reporting requirements, unfavorable changes in currency exchange rates, and economic and political disruptions. These risks are generally greater for investments in emerging markets.
Asset Allocation Strategy Risk: The portfolio managers' asset allocation strategy may not always work as intended, and asset allocation does not guarantee better performance or reduce the risk of investment loss. The investment styles employed by the portfolio managers may not be complimentary, which could adversely affect the performance of the Fund.
Active Trading Risk: Actively trading investments may result in higher costs and higher taxable income.
| 46 |
THIS PRIVACY POLICY IS NOT PART OF THIS REPORT
Privacy Policy and Practices of The Hartford Financial Services Group, Inc. and its Affiliates
(herein called “we, our and us”)
This Privacy Policy applies to our United States Operations
|
We value your trust. We are committed to the responsible: a) management; b) use; and c) protection; of Personal Information.
This notice describes how we collect, disclose, and protect Personal Information.
We collect Personal Information to: a) service your Transactions with us; and b) support our business functions.
We may obtain Personal Information from: a) You; b) your Transactions with us; and c) third parties such as a consumer-reporting agency.
Based on the type of product or service You apply for or get from us, Personal Information such as: a) your name; b) your address; c) your income; d) your payment; or e) your credit history; may be gathered from sources such as applications, Transactions, and consumer reports.
To serve You and service our business, we may share certain Personal Information. We will share Personal Information, only as allowed by law, with affiliates such as: a) our insurance companies; b) our employee agents; c) our brokerage firms; and d) our administrators.
As allowed by law, we may share Personal Financial Information with our affiliates to: a) market our products; or b) market our services; to You without providing You with an option to prevent these disclosures. |
We may also share Personal Information, only as allowed by law, with unaffiliated third parties including: a) independent agents; b) brokerage firms; c) insurance companies; d) administrators; and e) service providers; who help us serve You and service our business.
When allowed by law, we may share certain Personal Financial Information with other unaffiliated third parties who assist us by performing services or functions such as: a) taking surveys; b) marketing our products or services; or c) offering financial products or services under a joint agreement between us and one or more financial institutions.
We, and third parties we partner with, may track some of the pages You visit through the use of: a) cookies; b) pixel tagging; or c) other technologies; and currently do not process or comply with any web browser’s “do not track” signal or similar mechanism that indicates a request to disable online tracking of individual users who visit our websites or use our services.
We will not sell or share your Personal Financial Information with anyone for purposes unrelated to our business functions without offering You the opportunity to: a) “opt-out;” or b) “opt-in;” as required by law.
We only disclose Personal Health Information with: a) your proper written authorization; or b) as otherwise allowed or required by law.
Our employees have access to Personal Information in the course of doing their jobs, such as: a) underwriting policies; b) paying claims; c) developing new products; or d) advising customers of our products and services. |
|
We use manual and electronic security procedures to maintain: a) the confidentiality; and b) the integrity of; Personal Information that we have. We use these procedures to guard against unauthorized access.
Some techniques we use to protect Personal Information include: a) secured files; b) user authentication; c) encryption; d) firewall technology; and e) the use of detection software.
We are responsible for and must: a) identify information to be protected; b) provide an adequate level of protection for that data; c) grant access to protected data only to those people who must use it in the performance of their job-related duties.
Employees who violate our Privacy Policy will be subject to discipline, which may include ending their employment with us.
At the start of our business relationship, we will give You a copy of our current Privacy Policy.
We will also give You a copy of our current Privacy Policy once a year if You maintain a continuing business relationship with us.
We will continue to follow our Privacy Policy regarding Personal Information even when a business relationship no longer exists between us.
|
As used in this Privacy Notice:
Application means your request for our product or service.
Personal Financial Information means financial information such as: a) credit history; b) income; c) financial benefits; or d) policy or claim information.
Personal Health Information means health information such as: a) your medical records; or b) information about your illness, disability or injury.
Personal Information means information that identifies You personally and is not otherwise available to the public. It includes: a) Personal Financial Information; and b) Personal Health Information.
Transaction means your business dealings with us, such as: a) your Application; b) your request for us to pay a claim; and c) your request for us to take an action on your account.
You means an individual who has given us Personal Information in conjunction with: a) asking about; b) applying for; or c) obtaining; a financial product or service from us if the product or service is used mainly for personal, family, or household purposes. |
This Privacy Policy is being provided on behalf of the following affiliates of The Hartford Financial Services Group, Inc.:
1stAGChoice, Inc.; Access CoverageCorp, Inc.; Access CoverageCorp Technologies, Inc.; American Maturity Life Insurance Company; Archway 60 R, LLC; Business Management Group, Inc.; Champlain Life Reinsurance Company; DMS R, LLC; Eloy R, LLC; Ersatz Corporation; First State Insurance Company; Hartford Accident and Indemnity Company; Hartford Administrative Services Company; Hartford Casualty General Agency, Inc.; Hartford Casualty Insurance Company; Hartford-Comprehensive Employee Benefit Service Company; Hartford Equity Sales Company, Inc.; Hartford Fire General Agency, Inc.; Hartford Fire Insurance Company; Hartford Funds Management Company, LLC; Hartford Funds Management Group, Inc.; Hartford HLS Series Fund II, Inc.; Hartford Insurance Company of Illinois; Hartford Insurance Company of the Midwest; Hartford Insurance Company of the Southeast; Hartford Integrated Technologies, Inc.; Hartford International Life Reassurance Corporation; Hartford Funds Distributors, LLC; Hartford Investment Management Company; Hartford Life and Accident Insurance Company; Hartford Life and Annuity Insurance Company; Hartford Life Insurance Company; Hartford Life Private Placement, LLC; Hartford Lloyd’s Corporation; Hartford Lloyd’s Insurance Company; Hartford Mezzanine Investors I, LLC; Hartford Residual Market, L.C.C.; Hartford Retirement Services, LLC; Hartford Securities Distribution Company, Inc.; Hartford Series Fund, Inc.; Hartford Specialty Insurance Services of Texas, LLC; Hartford Strategic Investments, LLC; Hartford Underwriters Insurance Company; Hartford Technology Services Company, L.L.C.; Hartford of Texas General Agency, Inc.; Hartford Underwriters General Agency, Inc.; HARTRE Company, L.C.C.; HL Investment Advisors, LLC; HLA LLC; Horizon Management Group, LLC; HRA Brokerage Services, Inc.; Lanidex Class B, LLC; M-CAP Insurance Agency, LLC; New England Insurance Company; New England Reinsurance Corporation; Nutmeg Insurance Agency, Inc.; Nutmeg Insurance Company; Pacific Insurance Company, Limited; Planco, LLC: Property and Casualty Insurance Company of Hartford; Revere R, LLC; RVR R, LLC; Sentinel Insurance Company, Ltd.; Sunstone R, LLC; Symphony R, LLC; The Evergreen Group Incorporated; The Hartford Alternative Strategies Fund; The Hartford Mutual Funds, Inc.; The Hartford Mutual Funds II, Inc.; Trumbull Flood Management, L.L.C.; Trumbull Insurance Company; Twin City Fire Insurance Company; White River Life Reinsurance Company.
HPP Revised January 2014
HARTFORDFUNDS
hartfordfunds.com
This information is written in connection with the promotion or marketing of the matter(s) addressed in this material.
This report is submitted for the general information of the shareholders of the Fund. It is not authorized for distribution unless preceded or accompanied by a current prospectus for the Fund.
The information cannot be used or relied upon for the purpose of avoiding IRS penalties. These materials are not intended to provide tax, accounting or legal advice. As with all matters of a tax or legal nature, you should consult your own tax or legal counsel for advice.
Investors should carefully consider the investment objectives, risks, charges, and expenses of Hartford Funds before investing. This and other information can be found in the prospectus and summary prospectus, which can be obtained by calling 888-843-7824 (retail) or 800-279-1541 (institutional). Investors should read them carefully before they invest.
Hartford Funds are underwritten and distributed by Hartford Funds Distributors, LLC.
MFAR-GCA14 12/14 113965-5 Printed in U.S.A.
HARTFORDFUNDS
|
HARTFORD
2014 Annual Report
* Prior to May 30, 2014, Hartford Global Equity Income Fund was known as The Hartford Global Research Fund. |
A MESSAGE FROM THE PRESIDENT
Dear Fellow Shareholders:
Thank you for investing in Hartford Funds.
Market Review
U.S. equities (as represented by the S&P 500 Index) rose steadily for the fiscal year ended October 31, 2014, with a return of 17.27% for the period. With the exception of short-lived geopolitical scares early in 2014 and concerns about continuing global growth near the end of the period, stocks generally rose on solid fundamentals and encouraging macroeconomic data during the year.
September 2014 marked the six-year anniversary of the start of the financial crisis. Within weeks of that anniversary, both the S&P 500 Index and the Dow Jones Industrial Average set new all-time highs, closing at 2,018 and 17,391, respectively, on October 31. Although the fallout of the crisis continues to influence investor behavior, stocks have recovered and risen dramatically, up 198% from their low in March 2009. Meanwhile, the domestic economy is notching strong growth, and the unemployment rate has reached its lowest level since August 2008.
While the U.S. economy appears to have stabilized and to have reverted to a solid growth path, the outlook for the global economy appears to have gotten cloudier. The U.S. Federal Reserve has ended quantitative easing, while Europe and Japan are pursuing stimulus options to avoid a double-dip recession and deflation, respectively. Diverging central-bank policies will likely continue to play an important role in market movements going forward as investors wait to see the reactions to their efforts and their impacts on global markets.
How have market movements impacted your portfolio throughout the last year? Are your investments still on track to provide the growth or income you need, and are you comfortable with their progress during times of volatility?
Your financial professional can help you navigate today’s markets with confidence, as well as assist you to achieve your investment goals by providing advice on the best options within our fund family to help you work toward overcoming today’s investing challenges. Meet with your financial advisor regularly to examine your portfolio and your investment strategy, and to determine if you’re still on track to meet your goals.
Thank you again for investing with Hartford Funds.
James Davey
President
Hartford Funds
1 The S&P 500 Index is a market capitalization-weighted price index composed of 500 widely held common stocks.
2 The Dow Jones Industrial Average is an unmanaged, price-weighted index of 30 of the largest, most widely held stocks traded on the NYSE
Hartford Global Equity Income Fund
Table of Contents
The views expressed in the Fund’s Manager Discussion under ‘‘Why did the Fund perform this way?’’ and ‘‘What is the outlook?’’ are views of the Fund’s sub-adviser and portfolio management team through the end of the period and are subject to change based on market and other conditions. The Fund’s Manager Discussion is for informational purposes only and does not represent an offer, recommendation or solicitation to buy, hold or sell any security. The specific securities identified and described, if any, do not represent all of the securities purchased or sold and you should not assume that investments in the securities identified and discussed will be profitable.
Hartford Global Equity Income Fund inception 02/29/2008
| (sub-advised by Wellington Management Company, LLP) |
| Investment objective – The Fund seeks a high level of current income consistent with growth of capital. |
Performance Overview 2/29/08 - 10/31/14
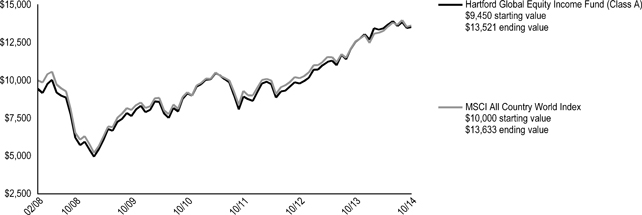
The chart above represents the hypothetical growth of a $10,000 investment in Class A, which includes a sales charge. Growth results in classes other than Class A will vary from what is seen above due to differences in the expenses charged to those share classes.
Average Annual Total Returns (as of 10/31/14)
| 1 Year | 5 Years | Since Inception▲ | |
| Global Equity Income A# | 7.66% | 12.05% | 5.52 % |
| Global Equity Income A## | 1.74% | 10.79% | 4.63 % |
| Global Equity Income B# | 6.90% | 11.22% | 4.74 % |
| Global Equity Income B## | 2.01% | 10.96% | 4.74 % |
| Global Equity Income C# | 6.91% | 11.24% | 4.75 % |
| Global Equity Income C## | 5.93% | 11.24% | 4.75 % |
| Global Equity Income I# | 7.89% | 12.39% | 5.82 % |
| Global Equity Income R3# | 7.41% | 11.82% | 5.27 % |
| Global Equity Income R4# | 7.80% | 12.15% | 5.57 % |
| Global Equity Income R5# | 8.12% | 12.49% | 5.88 % |
| Global Equity Income Y# | 8.22% | 12.58% | 5.94 % |
| MSCI All Country World Index | 8.32% | 11.15% | 4.75 % |
| ▲ | Inception: 02/29/2008 | |
| # | Without sales charge | |
| ## | With sales charge |
PERFORMANCE DATA QUOTED REPRESENTS PAST PERFORMANCE AND DOES NOT GUARANTEE FUTURE RESULTS. The investment return and principal value of the investment will fluctuate so that investors’ shares, when redeemed, may be worth more or less than their original cost. Current performance may be lower or higher than the performance data quoted. To obtain performance data current to the most recent month-end, please visit our website www.hartfordfunds.com.
The initial investment in Class A shares reflects the maximum sales charge of 5.50% and returns for Class B shares reflect a contingent deferred sales charge of up to 5.00% and declining to zero, depending on the period of time the shares are held. Returns for Class C shares reflect a contingent deferred sales charge of up to 1.00% on shares redeemed within twelve months of purchase.
Total returns presented above were calculated using the Fund’s net asset value available to shareholders for sale or redemption of Fund shares on October 31, 2014, which may exclude investment transactions as of this date. All share class returns assume the reinvestment of all distributions at net asset value and the deduction of all fund expenses.
Effective 9/30/09, Class B shares of the Fund were closed to new investments.
MSCI All Country World Index is a free float-adjusted market capitalization index that measures equity market performance in the global developed and emerging markets, consisting of 45 developed and emerging market country indices.
You cannot invest directly in an index.
The chart and table do not reflect the deductions of taxes that a shareholder would pay on Fund distributions or the redemption of Fund shares.
Performance information may reflect historical or current expense waivers/reimbursements from the investment adviser, without which performance would have been lower. For information on current expense waivers/reimbursements, please see the prospectus.
Effective May 30, 2014, the Fund changed its name to Hartford Global Equity Income Fund and, on June 1, 2014, also changed its investment goal, strategy and portfolio managers. In connection with these changes, Hartford Funds Management Company, LLC reduced its investment management fee rate.
| 2 |
| Hartford Global Equity Income Fund |
| Manager Discussion |
| October 31, 2014 (Unaudited) |
| Operating Expenses* | ||
| Net | Gross | |
| Global Equity Income Class A | 1.25% | 1.58% |
| Global Equity Income Class B | 2.00% | 2.51% |
| Global Equity Income Class C | 2.00% | 2.28% |
| Global Equity Income Class I | 1.00% | 1.23% |
| Global Equity Income Class R3 | 1.45% | 1.70% |
| Global Equity Income Class R4 | 1.15% | 1.39% |
| Global Equity Income Class R5 | 0.85% | 1.08% |
| Global Equity Income Class Y | 0.80% | 0.99% |
| * | As shown in the Fund's current prospectus dated March 1, 2014. Actual expenses may be higher or lower. Please see accompanying Financial Highlights for expense ratios for the year ended October 31, 2014. |
Gross expenses are the Fund's total annual operating expenses shown in the Fund's most recent prospectus. Net expenses are the Fund's total annual operating expenses shown in the Fund's most recent prospectus and reflect contractual expense reimbursements in instances when these reductions reduce the Fund's gross expenses. Contractual reimbursements remain in effect until February 29, 2016, and automatically renew for one-year terms unless terminated.
All investments are subject to risk including the possible loss of principal. For a discussion of the Fund’s risks, please see the Main Risks section of this report. For more detailed information on the risks associated with an investment in the Fund, please see the prospectus.
| Portfolio Managers | ||
| Ian R. Link, CFA | John R. Ryan, CFA | W. Michael Reckmeyer, III, CFA |
| Director and Equity Portfolio Manager | Director and Equity Portfolio Manager | Senior Vice President and Equity Portfolio Manager |
How did the Fund perform?
The Class A shares of the Hartford Global Equity Income Fund* returned 7.66%, before sales charge, for the twelve-month period ended October 31, 2014, underperforming the Fund’s benchmark, the MSCI All Country World Index, which returned 8.32% for the same period. The Fund outperformed the 6.08% average return of the Lipper Global Equity Income peer group, a group of funds with investment strategies similar to those of the Fund.
Why did the Fund perform this way?
Global equities rose during the period, notwithstanding bouts of significant volatility. Despite ongoing geopolitical tensions in Ukraine and the Middle East, concerns about a Chinese economic growth slowdown, and unsettling economic and political developments in several other emerging market countries, the five-year-old bull market continued in the first half of 2014. Robust merger and acquisition activity, along with continued accommodative monetary policy from central banks around the globe, aided positive investor sentiment in May and June. However, Portuguese banking woes, European economic malaise, and the prospect of an accelerated U.S. Federal Reserve interest-rate-hike timeline all contributed to stall the global stock rally near the tail end of the period. In addition, China's property slump and poor gross domestic product (GDP) readings in Japan and the eurozone raised the specter of a slowdown in global economic growth. Nevertheless, there were several positive developments, including monetary easing by the European Central Bank and the People's Bank of China, as well as an encouraging U.S. corporate earnings season. During the period, emerging market equities underperformed their developed market counterparts and U.S. stocks generally outperformed non-U.S. stocks.
Eight of the ten sectors in the MSCI All Country World Index rose during the period. Healthcare (+24%), Information Technology (+21%), and Utilities (+14%) rose the most while returns in Materials (-3%), Energy (-1%), and Consumer Discretionary (+4%) lagged most on a relative basis.
Security selection was weakest within Financials, Healthcare, and Industrials and strongest within Materials and Information Technology. Sector allocation, a result of bottom-up stock selection, modestly contributed to benchmark-relative performance over the period driven by an underweight to Energy and an overweight to Healthcare. A modest cash position detracted from relative returns in an upward trending environment, as did an overweight to materials relative to the benchmark.
The largest detractors from relative and absolute returns were Schneider Electric (Industrials), Maxim Integrated Products (Information Technology), and Henderson Group (Financials). Schneider Electric, a France-based company specializing in electricity distribution, automation, and energy management, underperformed over the last few months due to disappointing earnings and low organic growth, as well as investor concern over an economic slowdown in China. Shares of Maxim Integrated Products, a U.S.-based supplier of quality analog and mixed signal semiconductors, fell as the company provided earnings guidance for 2015 below expectations due to weaker Samsung sales, as Samsung is a leading customer of Maxim. Shares of Henderson Group, a U.K.-based investment management company, declined as inflows of assets were lower than expected while European equity markets fell in value.
*Effective May 30, 2014 The Hartford Global Research Fund changed its name to Hartford Global Equity Income Fund. Effective June 1, 2014, the Fund changed its portfolio managers and strategy.
| 3 |
| Hartford Global Equity Income Fund |
| Manager Discussion – (continued) |
| October 31, 2014 (Unaudited) |
Top contributors to relative performance during the period included Intel (Information Technology), FireEye (Information Technology), and International Paper (Materials). Intel, a U.S.-based manufacturer of semiconductor chips, performed well over the period given stronger than expected demand for PCs. FireEye is based in the U.S. and is a machine-based security platform that provides real-time threat protection to enterprises and governments worldwide against the next generation of cyber-attacks. The company’s stock rose significantly over the period due to better than expected financial results in the first quarter of 2014. We eliminated the position on strength (i.e. while the price was still rising but expected to reverse) in the first half of the period. Shares of International Paper, a leading U.S. containerboard manufacturer and the largest softwood pulp producer globally, was a solid performer over the period despite significant weather and foreign exchange headwinds during the first quarter of 2014. The stock has delivered above-consensus earnings results over the past couple of quarters driven by strong earnings from the industrial packaging business. Microsoft (Information Technology) was also a top contributor to absolute performance.
Derivatives are not used in a significant manner in this Fund and did not have a material impact on performance during the period.
What is the outlook?
We believe the global cycle continues to advance at a moderate pace with a mix of stronger growth in the U.S. and more sluggish activity in Europe, Japan, and China. We believe the U.S. economy is on track for a self-sustaining expansion and should, due to a steadily improving labor market, experience rising wage inflation and a moderate increase in policy rates next year. The eurozone and Japan are easing aggressively to help boost inflation and growth, and China is using targeted measures to help maintain growth as it simultaneously seeks to stem excess production in the system that could weigh on the economy. We believe this environment should contribute to a stronger U.S. dollar.
The Fund ended the period most overweight the Financials, Telecommunication Services, and Materials sectors and most underweight the Consumer Discretionary, Industrials, and Energy sectors, relative to the MSCI All Country World Index.
Diversification by Sector
as of October 31, 2014
| Sector | Percentage of Net Assets | |||
| Equity Securities | ||||
| Consumer Discretionary | 1.8 | % | ||
| Consumer Staples | 7.7 | |||
| Energy | 6.8 | |||
| Financials | 26.4 | |||
| Health Care | 13.8 | |||
| Industrials | 7.9 | |||
| Information Technology | 13.4 | |||
| Materials | 8.9 | |||
| Services | 7.6 | |||
| Utilities | 3.9 | |||
| Total | 98.2 | % | ||
| Short-Term Investments | 1.1 | |||
| Other Assets and Liabilities | 0.7 | |||
| Total | 100.0 | % | ||
A sector may be comprised of several industries. For Fund compliance purposes, the Fund may not use the same classification system and these sector classifications are used for reporting ease.
| 4 |
| Hartford Global Equity Income Fund |
| Schedule of Investments |
| October 31, 2014 |
| (000’s Omitted) |
| Shares or Principal Amount | Market Value ╪ | |||||||
| Common Stocks - 97.3% | ||||||||
| China - 3.2% | ||||||||
| 4,288 | Jiangsu Express Co., Ltd. | $ | 4,790 | |||||
| 3,404 | PetroChina Co., Ltd. | 4,261 | ||||||
| 9,051 | ||||||||
| France - 4.5% | ||||||||
| 29 | Icade REIT | 2,271 | ||||||
| 90 | Schneider Electric S.A. | 7,125 | ||||||
| 57 | Total S.A. | 3,380 | ||||||
| 12,776 | ||||||||
| Germany - 4.6% | ||||||||
| 186 | Deutsche Annington Immobile | 5,392 | ||||||
| 75 | Deutsche Post AG | 2,366 | ||||||
| 114 | Deutsche Wohnen AG | 2,577 | ||||||
| 23 | Siemens AG | 2,597 | ||||||
| 12,932 | ||||||||
| Italy - 1.5% | ||||||||
| 204 | Assicurazioni Generali S.p.A. | 4,186 | ||||||
| Japan - 7.5% | ||||||||
| 38 | Daiichi Sankyo Co., Ltd. | 572 | ||||||
| 74 | Eisai Co., Ltd. | 2,886 | ||||||
| 57 | Mitsubishi Corp. | 1,116 | ||||||
| 762 | Mitsubishi UFJ Financial Group, Inc. | 4,441 | ||||||
| 125 | Nippon Telegraph & Telephone Corp. | 7,752 | ||||||
| 272 | NTT DoCoMo, Inc. | 4,588 | ||||||
| 21,355 | ||||||||
| Netherlands - 4.9% | ||||||||
| 42 | Akzo Nobel N.V. | 2,793 | ||||||
| 189 | Delta Lloyd N.V. | 4,311 | ||||||
| 130 | Royal Dutch Shell plc Class B | 4,803 | ||||||
| 50 | Unilever N.V. | 1,952 | ||||||
| 13,859 | ||||||||
| Norway - 1.9% | ||||||||
| 237 | Telenor ASA | 5,330 | ||||||
| Spain - 1.5% | ||||||||
| 363 | Banco Bilbao Vizcaya Argentaria S.A. | 4,065 | ||||||
| 3 | Bolsas Y Mercados Espanoles | 121 | ||||||
| 4,186 | ||||||||
| Sweden - 2.0% | ||||||||
| 198 | Castellum AB | 3,031 | ||||||
| 58 | Svenska Handelsbanken AB Class A | 2,780 | ||||||
| 5,811 | ||||||||
| Switzerland - 6.8% | ||||||||
| 33 | Roche Holding AG | 9,770 | ||||||
| 32 | Zurich Financial Services AG | 9,657 | ||||||
| 19,427 | ||||||||
| Taiwan - 1.4% | ||||||||
| 902 | Taiwan Semiconductor Manufacturing Co., Ltd. | 3,910 | ||||||
| Thailand - 1.1% | ||||||||
| 1,681 | PTT Chemical Public Co., Ltd. | 3,190 | ||||||
| United Kingdom - 13.6% | ||||||||
| 74 | AstraZeneca plc | 5,418 | ||||||
| 17 | AstraZeneca plc ADR | 1,239 | ||||||
| 316 | Barclays Bank plc ADR | 1,217 | ||||||
| 87 | BHP Billiton plc | 2,236 | ||||||
| 205 | British American Tobacco plc | 11,621 | ||||||
| 1,052 | Henderson Group plc | 3,542 | ||||||
| 672 | HSBC Holdings plc | 6,853 | ||||||
| 198 | National Grid plc | 2,935 | ||||||
| 285 | Vodafone Group plc | 949 | ||||||
| 128 | WPP plc | 2,496 | ||||||
| 38,506 | ||||||||
| United States - 42.8% | ||||||||
| 22 | Apple, Inc. | 2,357 | ||||||
| 8 | BlackRock, Inc. | 2,558 | ||||||
| 64 | Bristol-Myers Squibb Co. | 3,734 | ||||||
| 36 | Chevron Corp. | 4,282 | ||||||
| 115 | Cisco Systems, Inc. | 2,802 | ||||||
| 7 | Dropbox, Inc. ⌂●† | 97 | ||||||
| 93 | E.I. DuPont de Nemours & Co. | 6,459 | ||||||
| 21 | Eaton Corp. plc | 1,402 | ||||||
| 50 | Edison International | 3,098 | ||||||
| 114 | General Electric Co. | 2,951 | ||||||
| 342 | Intel Corp. | 11,619 | ||||||
| 208 | International Paper Co. | 10,553 | ||||||
| 31 | Johnson & Johnson | 3,321 | ||||||
| 83 | JP Morgan Chase & Co. | 5,038 | ||||||
| 39 | Kraft Foods Group, Inc. | 2,197 | ||||||
| 69 | Marathon Oil Corp. | 2,432 | ||||||
| 58 | Marsh & McLennan Cos., Inc. | 3,132 | ||||||
| 276 | Maxim Integrated Products, Inc. | 8,094 | ||||||
| 211 | Merck & Co., Inc. | 12,246 | ||||||
| 50 | MetLife, Inc. | 2,696 | ||||||
| 194 | Microsoft Corp. | 9,103 | ||||||
| 81 | PNC Financial Services Group, Inc. | 6,972 | ||||||
| 67 | Procter & Gamble Co. | 5,882 | ||||||
| 33 | Southern Co. | 1,525 | ||||||
| 62 | Verizon Communications, Inc. | 3,133 | ||||||
| 112 | Xcel Energy, Inc. | 3,735 | ||||||
| 121,418 | ||||||||
| Total Common Stocks | ||||||||
| (Cost $279,009) | $ | 275,937 | ||||||
| Preferred Stocks - 0.9% | ||||||||
| Germany - 0.9% | ||||||||
| 62 | ProSieben Sat.1 Media AG | $ | 2,514 | |||||
| United States - 0.0% | ||||||||
| 2 | Pure Storage, Inc. ⌂●† | 35 | ||||||
| Total Preferred Stocks | ||||||||
| (Cost $2,902) | $ | 2,549 | ||||||
| Total Long-Term Investments | ||||||||
| (Cost $281,911) | $ | 278,486 | ||||||
| Short-Term Investments - 1.1% | ||||||||
| Repurchase Agreements - 1.1% | ||||||||
| Bank of America Merrill Lynch TriParty Repurchase Agreement (maturing on 11/03/2014 in the amount of $9, collateralized by U.S. Treasury Note 1.50%, 2019, value of $9) | ||||||||
| $ | 9 | 0.08%, 10/31/2014 | $ | 9 | ||||
The accompanying notes are an integral part of these financial statements.
| 5 |
| Hartford Global Equity Income Fund |
| Schedule of Investments – (continued) |
| October 31, 2014 |
| (000’s Omitted) |
| Shares or Principal Amount | Market Value ╪ | |||||||
| Short-Term Investments - 1.1% - (continued) | ||||||||
| Repurchase Agreements - 1.1% - (continued) | ||||||||
| Bank of America Merrill Lynch TriParty Repurchase Agreement (maturing on 11/03/2014 in the amount of $157, collateralized by GNMA 1.63% - 7.00%, 2031 - 2054, value of $160) | ||||||||
| $ | 157 | 0.09%, 10/31/2014 | $ | 157 | ||||
| Bank of Montreal TriParty Repurchase Agreement (maturing on 11/03/2014 in the amount of $42, collateralized by U.S. Treasury Bond 2.88% - 5.25%, 2029 - 2043, U.S. Treasury Note 0.38% - 4.50%, 2015 - 2022, value of $43) | ||||||||
| 42 | 0.08%, 10/31/2014 | 42 | ||||||
| Bank of Montreal TriParty Repurchase Agreement (maturing on 11/03/2014 in the amount of $143, collateralized by FHLMC 2.00% - 5.50%, 2022 - 2034, FNMA 2.00% - 4.50%, 2024 - 2039, GNMA 3.00%, 2043, U.S. Treasury Note 4.63%, 2017, value of $146) | ||||||||
| 143 | 0.10%, 10/31/2014 | 143 | ||||||
| Barclays Capital TriParty Repurchase Agreement (maturing on 11/03/2014 in the amount of $538, collateralized by U.S. Treasury Bond 4.50% - 6.25%, 2023 - 2036, U.S. Treasury Note 1.63% - 2.13%, 2015 - 2019, value of $549) | ||||||||
| 538 | 0.08%, 10/31/2014 | 538 | ||||||
| Citigroup Global Markets, Inc. TriParty Repurchase Agreement (maturing on 11/03/2014 in the amount of $619, collateralized by U.S. Treasury Bill 0.02%, 2015, U.S. Treasury Bond 3.88% - 11.25%, 2015 - 2040, U.S. Treasury Note 2.00% - 3.38%, 2019 - 2021, value of $631) | ||||||||
| 619 | 0.09%, 10/31/2014 | 619 | ||||||
| Deutsche Bank Securities TriParty Repurchase Agreement (maturing on 11/03/2014 in the amount of $36, collateralized by U.S. Treasury Note 0.88%, 2017, value of $36) | ||||||||
| 36 | 0.13%, 10/31/2014 | 36 | ||||||
| RBS Securities, Inc. TriParty Repurchase Agreement (maturing on 11/03/2014 in the amount of $53, collateralized by U.S. Treasury Bond 3.63% - 5.00%, 2037 - 2043, U.S. Treasury Note 2.13%, 2020, value of $54) | ||||||||
| 53 | 0.07%, 10/31/2014 | 53 | ||||||
| Societe Generale TriParty Repurchase Agreement (maturing on 11/03/2014 in the amount of $554, collateralized by U.S. Treasury Bill 0.02%, 2015, U.S. Treasury Bond 3.75% - 11.25%, 2015 - 2043, U.S. Treasury Note 1.38% - 4.25%, 2015 - 2022, value of $565) | ||||||||
| 554 | 0.08%, 10/31/2014 | 554 | ||||||
| TD Securities TriParty Repurchase Agreement (maturing on 11/03/2014 in the amount of $1,073, collateralized by FHLMC 3.00% - 4.00%, 2026 - 2044, FNMA 2.50% - 5.00%, 2025 - 2044, U.S. Treasury Bond 3.50% - 6.50%, 2026 - 2041, U.S. Treasury Note 1.75% - 2.88%, 2018 - 2019, value of $1,095) | ||||||||||||
| 1,073 | 0.10%, 10/31/2014 | 1,073 | ||||||||||
| 3,224 | ||||||||||||
| Total Short-Term Investments | ||||||||||||
| (Cost $3,224) | $ | 3,224 | ||||||||||
| Total Investments | ||||||||||||
| (Cost $285,135) ▲ | 99.3 | % | $ | 281,710 | ||||||||
| Other Assets and Liabilities | 0.7 | % | 2,051 | |||||||||
| Total Net Assets | 100.0 | % | $ | 283,761 |
The accompanying notes are an integral part of these financial statements.
| 6 |
| Hartford Global Equity Income Fund |
| Schedule of Investments – (continued) |
| October 31, 2014 |
| (000’s Omitted) |
| Note: | Percentage of investments as shown is the ratio of the total market value to total net assets. |
Prices of foreign equities that are principally traded on certain foreign markets may be adjusted daily pursuant to a fair value
pricing service approved by the Board of Directors in order to reflect an adjustment for factors occurring after the close of certain
foreign markets but before the close of the New York Stock Exchange.
Equity industry classifications used in this report
are the Global Industry Classification Standard, which was developed by and is the exclusive property and service mark of MSCI,
Inc. and Standard & Poor’s.
For Fund compliance purposes, the Fund may not use the same classification system shown in this report as these classifications
are used for reporting ease.
| ▲ | At October 31, 2014, the cost of securities for federal income tax purposes was $285,153 and the aggregate gross unrealized appreciation and depreciation based on that cost were: |
| Unrealized Appreciation | $ | 8,850 | ||
| Unrealized Depreciation | (12,293 | ) | ||
| Net Unrealized Depreciation | $ | (3,443 | ) |
| † | These securities were valued in good faith at fair value as determined under policies and procedures established by and under the supervision of the Board of Directors. At October 31, 2014, the aggregate fair value of these securities was $132, which rounds to zero percent of total net assets. This amount excludes securities that are principally traded in certain foreign markets and whose prices are adjusted pursuant to a third party pricing service methodology approved by the Board of Directors. |
| ● | Non-income producing. |
| ⌂ | The following securities are considered illiquid. Illiquid securities are often purchased in private placement transactions, are often not registered under the Securities Act of 1933, as amended, and may have contractual restrictions on resale. A security may also be considered illiquid if the security lacks a readily available market or if its valuation has not changed for a certain period of time. |
| Period Acquired | Shares/ Par | Security | Cost Basis | |||||||||
| 05/2012 | 7 | Dropbox, Inc. | $ | 64 | ||||||||
| 04/2014 | 2 | Pure Storage, Inc. Preferred | 39 | |||||||||
At October 31, 2014, the aggregate value of these securities was $132, which rounds to zero percent of total net assets.
Foreign Currency Contracts Outstanding at October 31, 2014
| Unrealized Appreciation/(Depreciation) | ||||||||||||||||||||||
| Currency | Buy / Sell | Delivery Date | Counterparty | Contract Amount | Market Value ╪ | Asset | Liability | |||||||||||||||
| JPY | Sell | 11/06/2014 | DEUT | $ | 943 | $ | 937 | $ | 6 | $ | – | |||||||||||
| JPY | Sell | 11/05/2014 | UBS | 668 | 649 | 19 | – | |||||||||||||||
| Total | $ | 25 | $ | – | ||||||||||||||||||
| ╪ | See Significant Accounting Policies of accompanying Notes to Financial Statements regarding valuation of securities. |
| GLOSSARY: (abbreviations used in preceding Schedule of Investments) | |
| Counterparty Abbreviations: | |
| DEUT | Deutsche Bank Securities, Inc. |
| UBS | UBS AG |
| Currency Abbreviations: | |
| JPY | Japanese Yen |
| Other Abbreviations: | |
| ADR | American Depositary Receipt |
| FHLMC | Federal Home Loan Mortgage Corp. |
| FNMA | Federal National Mortgage Association |
| GNMA | Government National Mortgage Association |
| REIT | Real Estate Investment Trust |
The accompanying notes are an integral part of these financial statements.
| 7 |
| Hartford Global Equity Income Fund |
| Schedule of Investments – (continued) |
| October 31, 2014 |
| (000’s Omitted) |
| Investment Valuation Hierarchy Level Summary |
| October 31, 2014 |
| Total | Level 1 ♦ | Level 2 ♦ | Level 3 | |||||||||||||
| Assets: | ||||||||||||||||
| Common Stocks | ||||||||||||||||
| China | $ | 9,051 | $ | – | $ | 9,051 | $ | – | ||||||||
| France | 12,776 | 2,271 | 10,505 | – | ||||||||||||
| Germany | 12,932 | – | 12,932 | – | ||||||||||||
| Italy | 4,186 | – | 4,186 | – | ||||||||||||
| Japan | 21,355 | – | 21,355 | – | ||||||||||||
| Netherlands | 13,859 | – | 13,859 | – | ||||||||||||
| Norway | 5,330 | – | 5,330 | – | ||||||||||||
| Spain | 4,186 | – | 4,186 | – | ||||||||||||
| Sweden | 5,811 | – | 5,811 | – | ||||||||||||
| Switzerland | 19,427 | – | 19,427 | – | ||||||||||||
| Taiwan | 3,910 | – | 3,910 | – | ||||||||||||
| Thailand | 3,190 | – | 3,190 | – | ||||||||||||
| United Kingdom | 38,506 | 1,239 | 37,267 | – | ||||||||||||
| United States | 121,418 | 121,321 | – | 97 | ||||||||||||
| Total | $ | 275,937 | $ | 124,831 | $ | 151,009 | $ | 97 | ||||||||
| Preferred Stocks | 2,549 | – | 2,514 | 35 | ||||||||||||
| Short-Term Investments | 3,224 | – | 3,224 | – | ||||||||||||
| Total | $ | 281,710 | $ | 124,831 | $ | 156,747 | $ | 132 | ||||||||
| Foreign Currency Contracts* | $ | 25 | $ | – | $ | 25 | $ | – | ||||||||
| Total | $ | 25 | $ | – | $ | 25 | $ | – | ||||||||
| ♦ | For the year ended October 31, 2014, investments valued at $489 were transferred from Level 1 to Level 2, and investments valued at $599 were transferred from Level 2 to Level 1. Investments are transferred between Level 1 and Level 2 for a variety of reasons including, but not limited to: |
| 1) | Foreign equities for which a fair value price is more representative of exit value than the local market close (transfer into Level 2). Foreign equities for which the local market close is more representative of exit value (transfer into Level 1). |
| 2) | U.S. Treasury securities that no longer represent the most recent issue (transfer into Level 2). |
| 3) | Equity investments with no observable trading but a bid or mean price is used (transfer into Level 2). Equity investments using observable quoted prices in an active market (transfer into Level 1). |
| * | Derivative instruments (excluding purchased and written options, if applicable) are valued at the unrealized appreciation/depreciation on the investments. |
Following is a reconciliation of Level 3 assets for which significant unobservable inputs were used to determine fair value:
| Balance
as of October 31, 2013 | Realized Gain (Loss) | Change
in Unrealized Appreciation (Depreciation) | Net Amortization | Purchases | Sales | Transfers Into Level 3 * | Transfers Out of Level 3 * | Balance as of
October | ||||||||||||||||||||||||||||
| Assets: | ||||||||||||||||||||||||||||||||||||
| Common Stocks | $ | 340 | $ | — | $ | 17 | † | $ | — | $ | — | $ | — | $ | — | $ | (260 | ) | $ | 97 | ||||||||||||||||
| Preferred Stocks | — | — | (4 | )‡ | — | 39 | — | — | — | 35 | ||||||||||||||||||||||||||
| Total | $ | 340 | $ | — | $ | 13 | $ | — | $ | 39 | $ | — | $ | — | $ | (260 | ) | $ | 132 | |||||||||||||||||
| * | Investments are transferred into and out of Level 3 for a variety of reasons including, but not limited to: |
| 1) | Investments where trading has been halted (transfer into Level 3) or investments where trading has resumed (transfer out of Level 3). |
| 2) | Broker quoted investments (transfer into Level 3) or quoted prices in active markets (transfer out of Level 3). |
| 3) | Investments that have certain restrictions on trading (transfer into Level 3) or investments where trading restrictions have expired (transfer out of Level 3). |
| † | Change in unrealized appreciation (depreciation) in the current period relating to assets still held at October 31, 2014 was $17. |
| ‡ | Change in unrealized appreciation (depreciation) in the current period relating to assets still held at October 31, 2014 was $(4). |
| Note: | For purposes of reporting transfers between different hierarchy levels, both transfers in and out of each level, as applicable, are shown as if they occurred at the beginning of the period. |
The accompanying notes are an integral part of these financial statements.
| 8 |
| Hartford Global Equity Income Fund |
| Statement of Assets and Liabilities |
| October 31, 2014 |
| (000’s Omitted) |
| Assets: | ||||
| Investments in securities, at market value (cost $285,135) | $ | 281,710 | ||
| Cash | 1 | |||
| Foreign currency on deposit with custodian (cost $5) | 5 | |||
| Unrealized appreciation on foreign currency contracts | 25 | |||
| Receivables: | ||||
| Investment securities sold | 1,586 | |||
| Fund shares sold | 335 | |||
| Dividends and interest | 588 | |||
| Other assets | 59 | |||
| Total assets | 284,309 | |||
| Liabilities: | ||||
| Payables: | ||||
| Fund shares redeemed | 450 | |||
| Investment management fees | 40 | |||
| Administrative fees | — | |||
| Distribution fees | 6 | |||
| Accrued expenses | 52 | |||
| Total liabilities | 548 | |||
| Net assets | $ | 283,761 | ||
| Summary of Net Assets: | ||||
| Capital stock and paid-in-capital | $ | 281,635 | ||
| Undistributed net investment income | 497 | |||
| Accumulated net realized gain | 5,057 | |||
| Unrealized depreciation of investments and the translation of assets and liabilities denominated in foreign currency | (3,428 | ) | ||
| Net assets | $ | 283,761 | ||
| Shares authorized | 900,000 | |||
| Par value | $ | 0.001 | ||
| Class A: Net asset value per share/Maximum offering price per share | $11.72/$12.40 | |||
| Shares outstanding | 6,471 | |||
| Net assets | $ | 75,862 | ||
| Class B: Net asset value per share | $ | 11.49 | ||
| Shares outstanding | 192 | |||
| Net assets | $ | 2,208 | ||
| Class C: Net asset value per share | $ | 11.47 | ||
| Shares outstanding | 903 | |||
| Net assets | $ | 10,356 | ||
| Class I: Net asset value per share | $ | 11.74 | ||
| Shares outstanding | 117 | |||
| Net assets | $ | 1,377 | ||
| Class R3: Net asset value per share | $ | 11.69 | ||
| Shares outstanding | 40 | |||
| Net assets | $ | 465 | ||
| Class R4: Net asset value per share | $ | 11.73 | ||
| Shares outstanding | 43 | |||
| Net assets | $ | 508 | ||
| Class R5: Net asset value per share | $ | 11.75 | ||
| Shares outstanding | 56 | |||
| Net assets | $ | 659 | ||
| Class Y: Net asset value per share | $ | 11.74 | ||
| Shares outstanding | 16,387 | |||
| Net assets | $ | 192,326 |
The accompanying notes are an integral part of these financial statements.
| 9 |
| Hartford Global Equity Income Fund |
| Statement of Operations |
| For the Year Ended October 31, 2014 |
| (000’s Omitted) |
| Investment Income: | ||||
| Dividends | $ | 4,099 | ||
| Interest | 3 | |||
| Less: Foreign tax withheld | (286 | ) | ||
| Total investment income | 3,816 | |||
| Expenses: | ||||
| Investment management fees | 1,264 | |||
| Administrative services fees | ||||
| Class R3 | 1 | |||
| Class R4 | 1 | |||
| Class R5 | — | |||
| Transfer agent fees | ||||
| Class A | 188 | |||
| Class B | 12 | |||
| Class C | 27 | |||
| Class I | 1 | |||
| Class R3 | — | |||
| Class R4 | — | |||
| Class R5 | — | |||
| Class Y | — | |||
| Distribution fees | ||||
| Class A | 166 | |||
| Class B | 26 | |||
| Class C | 103 | |||
| Class R3 | 2 | |||
| Class R4 | 1 | |||
| Custodian fees | 23 | |||
| Accounting services fees | 29 | |||
| Registration and filing fees | 129 | |||
| Board of Directors' fees | 3 | |||
| Audit fees | 38 | |||
| Other expenses | 39 | |||
| Total expenses (before waivers and fees paid indirectly) | 2,053 | |||
| Expense waivers | (222 | ) | ||
| Transfer agent fee waivers | (4 | ) | ||
| Commission recapture | (1 | ) | ||
| Custodian fee offset | — | |||
| Total waivers and fees paid indirectly | (227 | ) | ||
| Total expenses, net | 1,826 | |||
| Net Investment Income | 1,990 | |||
| Net Realized Gain on Investments and Foreign Currency Transactions: | ||||
| Net realized gain on investments | 15,920 | |||
| Net realized gain on foreign currency contracts | 140 | |||
| Net realized loss on other foreign currency transactions | (56 | ) | ||
| Net Realized Gain on Investments and Foreign Currency Transactions | 16,004 | |||
| Net Changes in Unrealized Depreciation of Investments and Foreign Currency Transactions: | ||||
| Net unrealized depreciation of investments | (15,541 | ) | ||
| Net unrealized appreciation of foreign currency contracts | 24 | |||
| Net unrealized depreciation of translation of other assets and liabilities in foreign currencies | (29 | ) | ||
| Net Changes in Unrealized Depreciation of Investments and Foreign Currency Transactions | (15,546 | ) | ||
| Net Gain on Investments and Foreign Currency Transactions | 458 | |||
| Net Increase in Net Assets Resulting from Operations | $ | 2,448 |
The accompanying notes are an integral part of these financial statements.
| 10 |
| Hartford Global Equity Income Fund |
| Statement of Changes in Net Assets |
| (000’s Omitted) |
| For the Year Ended October 31, 2014 | For the Year Ended October 31, 2013 | |||||||
| Operations: | ||||||||
| Net investment income | $ | 1,990 | $ | 460 | ||||
| Net realized gain on investments and foreign currency transactions | 16,004 | 11,708 | ||||||
| Net unrealized appreciation (depreciation) of investments and foreign currency transactions | (15,546 | ) | 7,702 | |||||
| Net Increase in Net Assets Resulting from Operations | 2,448 | 19,870 | ||||||
| Distributions to Shareholders: | ||||||||
| From net investment income | ||||||||
| Class A | (459 | ) | (887 | ) | ||||
| Class B | — | (31 | ) | |||||
| Class C | — | (103 | ) | |||||
| Class I | (13 | ) | (17 | ) | ||||
| Class R3 | (2 | ) | (7 | ) | ||||
| Class R4 | (4 | ) | (7 | ) | ||||
| Class R5 | (7 | ) | (7 | ) | ||||
| Class Y | (1,312 | ) | (538 | ) | ||||
| Total from net investment income | (1,797 | ) | (1,597 | ) | ||||
| From net realized gain on investments | ||||||||
| Class A | (5,062 | ) | — | |||||
| Class B | (255 | ) | — | |||||
| Class C | (846 | ) | — | |||||
| Class I | (53 | ) | — | |||||
| Class R3 | (43 | ) | — | |||||
| Class R4 | (36 | ) | — | |||||
| Class R5 | (35 | ) | — | |||||
| Class Y | (334 | ) | — | |||||
| Total from net realized gain on investments | (6,664 | ) | — | |||||
| Total distributions | (8,461 | ) | (1,597 | ) | ||||
| Capital Share Transactions: | ||||||||
| Class A | 17,463 | 793 | ||||||
| Class B | (791 | ) | (1,247 | ) | ||||
| Class C | 497 | (1,124 | ) | |||||
| Class I | 339 | 136 | ||||||
| Class R3 | (36 | ) | 44 | |||||
| Class R4 | 78 | 14 | ||||||
| Class R5 | 249 | 8 | ||||||
| Class Y | 193,120 | (21,713 | ) | |||||
| Net increase (decrease) from capital share transactions | 210,919 | (23,089 | ) | |||||
| Net Increase (Decrease) in Net Assets | 204,906 | (4,816 | ) | |||||
| Net Assets: | ||||||||
| Beginning of period | 78,855 | 83,671 | ||||||
| End of period | $ | 283,761 | $ | 78,855 | ||||
| Undistributed (distributions in excess of) net investment income | $ | 497 | $ | 190 | ||||
The accompanying notes are an integral part of these financial statements.
| 11 |
| Hartford Global Equity Income Fund |
| Notes to Financial Statements |
| October 31, 2014 |
| (000’s Omitted) |
Organization:
The Hartford Mutual Funds, Inc. (“Company”) is an open-end management investment company comprised of forty-two portfolios. Financial statements for Hartford Global Equity Income Fund (the "Fund"), a series of the Company, are included in this report. Prior to May 30, 2014, the Fund was known as The Hartford Global Research Fund.
The Company is organized under the laws of the State of Maryland and is registered with the Securities and Exchange Commission (“SEC”) under the Investment Company Act of 1940, as amended (“1940 Act”). The Fund is a diversified open-end management investment company. The Fund is an investment company and applies specialized accounting and reporting under Accounting Standards Codification Topic 946, Financial Services - Investment Companies.
Class A shares are sold with a front-end sales charge of up to 5.50%. Class B shares were sold with a contingent deferred sales charge which is assessed on the lesser of the per share net asset value (“NAV”) of the shares at the time of redemption or the original purchase price, and declines from up to 5.00% to zero depending on the period of time the shares are held (see note below regarding the closing of Class B shares). Class C shares are sold with a contingent deferred sales charge of up to 1.00% on shares redeemed within twelve months of purchase. Class I shares are sold without sales charges to certain eligible investors primarily through advisory fee-based wrap programs. Class R3, R4 and R5 shares, which are offered to employer-sponsored retirement plans, and Class Y shares, which are sold to certain eligible institutional investors, are sold without a sales charge. All classes of shares have identical voting, redemption, dividend, liquidation and other rights and the same terms and conditions, with the exceptions that each class may have different expenses, which may affect performance, and that Class B shares automatically convert to Class A shares after 8 years.
No new or additional investments are allowed in Class B shares of the Fund (including investments through any systematic investment plan). Existing shareholders of Class B shares may continue to hold their Class B shares, exchange their Class B shares for Class B shares of another Hartford Fund (as permitted by existing exchange privileges), or redeem their Class B shares as described in the Fund’s prospectus. Reinstatement privileges with respect to Class B shares are set forth in the Fund's prospectus. For investors electing to reinvest capital gains and dividends, any such capital gains or dividends on Class B shares will continue to be reinvested in Class B shares of the Fund. All Class B share attributes, including the 12b-1 fee, contingent deferred sales charge schedule, and conversion to Class A shares, remain unchanged.
Significant Accounting Policies:
The following is a summary of significant accounting policies of the Fund in the preparation of its financial statements, which are in accordance with United States generally accepted accounting principles (“U.S. GAAP”). The preparation of financial statements in accordance with U.S. GAAP may require management to make estimates and assumptions that affect the reported amounts of assets and liabilities and disclosure of contingent assets and liabilities at the date of the financial statements and the reported amounts of increases and decreases in net assets from operations during the reporting period. Actual results could differ from those estimates.
Determination of Net Asset Value – The NAV of each class of the Fund's shares is determined as of the close of regular trading (normally 4:00 p.m. Eastern Time) (the “NYSE Close”) on each day that the New York Stock Exchange (the “Exchange”) is open (“Valuation Date”). Information that becomes known to the Fund after the NAV has been calculated on a particular day will not generally be used to retroactively adjust the NAV determined earlier that day.
Investment Valuation and Fair Value Measurements – For purposes of calculating the NAV, portfolio investments and other assets held by the Fund's portfolio for which market quotes are readily available are valued at market value. Market value is generally determined on the basis of last reported sales prices or official close price. If no sales are reported, market value is based on quotes obtained from a quotation reporting system, established market makers, or independent pricing services. If market prices are not readily available or are deemed unreliable, the Fund will use the fair value of the investment as determined in good faith under policies and procedures established by and under the supervision of the Company's Board of Directors. Market quotes are considered not readily available where there is an absence of current or reliable market-based data (e.g., trade information or indicative market quotes), including where events occur after the close of the relevant market, but prior to the NYSE Close, that materially affect the values of the Fund's portfolio investments or assets. In addition, market quotes are considered not readily available when, due to extraordinary circumstances, the exchanges or markets on which the investments trade do not open for trading for the entire day and
| 12 |
| Hartford Global Equity Income Fund |
| Notes to Financial Statements – (continued) |
| October 31, 2014 |
| (000’s Omitted) |
no other market prices are available. In addition, prices of foreign equities that are principally traded on certain foreign markets may be adjusted daily pursuant to a fair value pricing service approved by the Board of Directors in order to reflect an adjustment for the factors occurring after the close of certain foreign markets but before the NYSE Close. Investments that are primarily traded on foreign markets may trade on days that are not business days of the Fund. The value of the foreign investments in which the Fund invests may change on days when a shareholder will not be able to purchase or redeem shares of the Fund. Fair value pricing is subjective in nature and the use of fair value pricing by the Fund may cause the NAV of its shares to differ significantly from the NAV that would have been calculated using market prices at the close of the exchange on which a portfolio investment is primarily traded. There can be no assurance that the Fund could obtain the fair market value assigned to an investment if the Fund were to sell the investment at approximately the time at which the Fund determines its NAV.
Investments valued in currencies other than U.S. dollars are converted to U.S. dollars using exchange rates obtained from independent pricing services for calculation of the NAV. As a result, the NAV of the Fund’s shares may be affected by changes in the value of currencies in relation to the U.S. dollar. The value of investments traded in markets outside the United States or denominated in currencies other than the U.S. dollar may be affected significantly on a day that the NYSE is closed and the market value may change on days when an investor is not able to purchase, redeem or exchange shares of the Fund.
Foreign currency contracts represent agreements to exchange currencies on specific future dates at predetermined rates. Foreign currency contracts are valued using foreign currency exchange rates and forward rates as provided by an independent pricing service on the Valuation Date.
Financial instruments for which prices are not available from an independent pricing service may be valued using market quotations obtained from one or more dealers that make markets in the respective financial instrument in accordance with procedures established by the Company's Board of Directors.
U.S. GAAP defines fair value as the price that the Fund would receive to sell an asset or pay to transfer a liability in an orderly transaction between market participants. The U.S. GAAP fair value measurement standards require disclosure of a fair value hierarchy for each major category of assets and liabilities. Various inputs are used in determining the fair value of the Fund’s investments. These inputs are summarized into three broad hierarchy levels. This hierarchy is based on whether the valuation inputs are observable or unobservable. These levels are:
Level 1 – Quoted prices in active markets for identical investments. Level 1 may include exchange traded instruments, such as domestic equities, some foreign equities, options, futures, mutual funds, exchange traded funds, rights and warrants.
Level 2 – Observable inputs other than Level 1 prices, such as quoted prices for similar investments; quoted prices in markets that are not active; or other inputs that are observable or can be corroborated by observable market data. Level 2 may include debt investments that are traded less frequently than exchange traded instruments and which are valued using independent pricing services; foreign equities, which are principally traded on certain foreign markets and are adjusted daily pursuant to a fair value pricing service in order to reflect an adjustment for the factors occurring after the close of certain foreign markets but before the NYSE Close; senior floating rate interests, which are valued using an aggregate of dealer bids; short-term investments, which are valued at amortized cost; and swaps, which are valued based upon the terms of each swap contract.
Level 3 – Significant unobservable inputs that are supported by limited or no market activity. Level 3 may include financial instruments whose values are determined using indicative market quotes or require significant management judgment or estimation. These unobservable valuation inputs may include estimates for current yields, maturity/duration, prepayment speed, and indicative market quotes for comparable investments along with other assumptions relating to credit quality, collateral value, complexity of the investment structure, general market conditions and liquidity. This category may include investments where trading has been halted or there are certain restrictions on trading. While these investments are priced using unobservable inputs, the valuation of these investments reflects the best available data and management believes the prices are a reasonable representation of exit price.
The Board of Directors of the Company generally reviews and approves the “Procedures for Valuation of Portfolio Securities” at least once a year. These procedures define how investments are to be valued, including the formation and activities of a
| 13 |
| Hartford Global Equity Income Fund |
| Notes to Financial Statements – (continued) |
| October 31, 2014 |
| (000’s Omitted) |
Valuation Committee. The Valuation Committee is responsible for determining in good faith the fair value of investments when the value cannot be obtained from primary pricing services or alternative sources or if the valuation of an investment as provided by the primary pricing service or alternative source is believed not to reflect the investment’s fair value as of the Valuation Date. Voting members of the Valuation Committee include the Fund's Treasurer or designee and a Vice President of the investment manager or designee. An Assistant Vice President of the Fund with legal expertise or designee is also included on the Valuation Committee as a non-voting advisory member. In addition, the Fund’s Chief Compliance Officer shall designate a member of the compliance group to attend Valuation Committee meetings as a non-voting resource, to monitor for and provide guidance with respect to compliance with these procedures. Two members of the Valuation Committee or their designees, representing different departments, shall constitute a quorum for purposes of permitting the Valuation Committee to take action. The Valuation Committee will consider all relevant factors in determining an investment’s fair value, and may seek the advice of the Fund’s sub-adviser, knowledgeable brokers, and legal counsel in making such determination. The Valuation Committee reports to the Audit Committee of the Company's Board of Directors. The Audit Committee receives quarterly written reports which include details of all fair-valued investments, including the reason for the fair valuation, and an indication, when possible, of the accuracy of the valuation by disclosing the next available reliable public price quotation or the disposition price of such investments (the “look-back” test). The Board of Directors then must consider for ratification all of the fair value determinations made during the previous quarter.
Valuation levels are not necessarily indicative of the risk associated with investing in such investments. Individual investments within any of the above mentioned asset classes may be assigned a different hierarchical level than those presented above, as individual circumstances dictate.
For additional information, refer to the Investment Valuation Hierarchy Level Summary and the Level 3 roll-forward reconciliation, if applicable, which follow the Schedule of Investments.
Investment Transactions and Investment Income – Investment transactions are recorded as of the trade date (the date the order to buy or sell is executed) for financial reporting purposes. Investments purchased or sold on a when-issued or delayed-delivery basis may be settled a month or more after the trade date. Realized gains and losses are determined on the basis of identified cost.
Dividend income from domestic securities is accrued on the ex-dividend date. In general, dividend income from foreign securities is recorded on the ex-date; however, dividend notifications in certain foreign jurisdictions may not be available in a timely manner and as a result, the Fund will record the dividend as soon as the relevant details (i.e., rate per share, payment date, shareholders of record, etc.) are publicly available. Interest income, including amortization of premium, accretion of discounts and additional principal received in-kind in lieu of cash, is accrued on a daily basis.
Foreign Currency Transactions – Assets and liabilities denominated in currencies other than U.S. dollars are translated into U.S. dollars at the exchange rates in effect on the valuation date. Purchases and sales of investments, income and expenses are translated into U.S. dollars at the exchange rates on the dates of such transactions.
The Fund does not isolate that portion of portfolio investment valuation resulting from fluctuations in the foreign currency exchange rates from the fluctuations arising from changes in the market prices of investments held. Exchange rate fluctuations are included with the net realized and unrealized gain or loss on investments in the accompanying financial statements.
Net realized foreign exchange gains or losses arise from sales of foreign currencies and the difference between asset and liability amounts initially stated in foreign currencies and the U.S. dollar value of the amounts actually received or paid. Net unrealized foreign exchange gains or losses arise from changes in the value of other assets and liabilities at the end of the reporting period, resulting from changes in the exchange rates.
Joint Trading Account – The Fund may invest cash balances into a joint trading account that may be invested in one or more repurchase agreements.
Fund Share Valuation and Dividend Distributions to Shareholders – Orders for the Fund’s shares are executed in accordance with the investment instructions of the shareholders. The NAV of the Fund’s shares is determined as of the close of business on each
| 14 |
| Hartford Global Equity Income Fund |
| Notes to Financial Statements – (continued) |
| October 31, 2014 |
| (000’s Omitted) |
business day of the Exchange. The NAV is determined separately for each class of shares of the Fund by dividing the Fund’s net assets attributable to that class by the number of shares of the class outstanding. Each class of shares offered by the Fund has equal rights as to assets and voting privileges (except that shareholders of a class have exclusive voting rights regarding any matter relating solely to that class of shares). Income and non-class specific expenses are allocated daily to each class on the basis of the relative net assets of the class. Realized and unrealized gains and losses are allocated daily based on the relative net assets of each class of shares of the Fund.
Orders for the purchase of the Fund’s shares received prior to the close of the Exchange on any day the Exchange is open for business are priced at the NAV determined as of the close of the Exchange. Orders received after the close of the Exchange, or on a day on which the Exchange and/or the Fund is not open for business, are priced at the next determined NAV.
Dividends are declared pursuant to a policy adopted by the Company's Board of Directors based upon the investment performance of the Fund. The policy of the Fund is to pay dividends from net investment income and realized gains, if any, at least once a year.
Net investment income, dividends and distributions from net realized gains and capital are determined in accordance with federal income tax regulations, which may differ from U.S. GAAP with respect to character and timing (see Federal Income Taxes: Distributions and Components of Distributable Earnings and Reclassification of Capital Accounts).
Securities and Other Investments:
Repurchase Agreements – A repurchase agreement is an agreement by which a counterparty agrees to sell an investment and agrees to repurchase the investment sold from the buyer at a mutually agreed upon time and price. During the period of the repurchase agreement, the counterparty will deposit cash and or securities in a third party custodial account to serve as collateral. At the time the Fund enters into a repurchase agreement, the value of the underlying collateral, including accrued interest, will be equal to or exceed the value of the repurchase agreement. Repurchase agreements expose the Fund to counterparty risk - that is, the risk that the counterparty will not fulfill its obligations. To minimize counterparty risk, the investments that serve to collateralize the repurchase agreement are held by the Fund’s custodian in book entry or physical form in the custodial account of the Fund or in a third party custodial account. Repurchase agreements are valued at cost plus accrued interest, which approximates fair value. Repurchase agreements have master netting arrangements which allow the Fund to offset amounts owed to a counterparty with amounts owed by the counterparty, including any collateral. Upon an event of default under a master repurchase agreement, the non-defaulting party may close out all transactions traded under such agreement and net amounts owed under each transaction to one net amount payable by one party to the other. Absent an event of default, the master repurchase agreement does not result in an offset of reported amounts of assets and liabilities in the Statement of Assets and Liabilities across transactions between the Fund and the applicable counterparty. The Fund, as shown on the Schedule of Investments, had outstanding repurchase agreements and related collateral as of October 31, 2014.
Illiquid and Restricted Investments – The Fund is permitted to invest up to 15% of its net assets in illiquid investments. Illiquid investments are those that may not be sold or disposed of in the ordinary course of business within seven days, at approximately the price used to determine the Fund’s NAV. The Fund may not be able to sell illiquid investments when its sub-adviser considers it desirable to do so or may have to sell such investments at a price that is lower than the price that could be obtained if the investments were more liquid. A sale of illiquid investments may require more time and may result in higher dealer discounts and other selling expenses than does the sale of those that are liquid. Illiquid investments also may be more difficult to value due to the unavailability of reliable market quotations for such investments, and an investment in them may have an adverse impact on the Fund’s NAV. The Fund may also purchase certain restricted investments that can only be resold to certain qualified investors and may be determined to be liquid pursuant to policies and guidelines established by the Company's Board of Directors. The Fund, as shown on the Schedule of Investments, had illiquid or restricted investments as of October 31, 2014.
Investments Purchased on a When-Issued or Delayed-Delivery Basis – Delivery and payment for investments that have been purchased by the Fund on a forward commitment, or when-issued or delayed-delivery basis, take place beyond the customary settlement period. The Fund may dispose of or renegotiate a delayed-delivery transaction after it is entered into, and may sell delayed-delivery investments before they are delivered, which may result in a realized gain or loss. During this period, such
| 15 |
| Hartford Global Equity Income Fund |
| Notes to Financial Statements – (continued) |
| October 31, 2014 |
| (000’s Omitted) |
investments are subject to market fluctuations, and the Fund identifies investments segregated in its records with a value at least equal to the amount of the commitment. The Fund had no when-issued or delayed-delivery investments as of October 31, 2014.
Financial Derivative Instruments:
The following disclosures contain information on how and why the Fund uses derivative instruments, the credit-risk-related contingent features in certain derivative instruments and how derivative instruments affect the Fund’s financial position and results of operations. The location and fair value amounts of these instruments on the Statement of Assets and Liabilities and the realized gains and losses and changes in unrealized gains and losses on the Statement of Operations, each categorized by type of derivative contract, are included in the following Additional Derivative Instrument Information footnote. The derivative instruments outstanding as of year-end are disclosed in the notes to the Schedule of Investments, if applicable. The amounts of realized gains and losses and changes in unrealized gains and losses on derivative instruments during the year are disclosed in the Statement of Operations.
Foreign Currency Contracts – The Fund may enter into foreign currency contracts that obligate the Fund to purchase or sell currencies at specified future dates. Foreign currency contracts are used to hedge the currency exposure associated with some or all of the Fund’s investments and/or as part of an investment strategy. Foreign currency contracts are marked to market daily and the change in value is recorded by the Fund as an unrealized gain or loss. The Fund will record a realized gain or loss when the foreign currency contract is settled.
Foreign currency contracts involve elements of market risk in excess of the amounts reflected in the Statement of Assets and Liabilities. In addition, risks may arise upon entering into these contracts from the potential inability of the counterparties to meet the terms of the contracts and from unanticipated movements in the value of the foreign currencies relative to the U.S. dollar. The Fund, as shown on the Schedule of Investments, had outstanding foreign currency contracts as of October 31, 2014.
Additional Derivative Instrument Information:
Fair Value of Derivative Instruments on the Statement of Assets and Liabilities as of October 31, 2014:
| Risk Exposure Category | ||||||||||||||||||||||||||||
| Interest
Rate Contracts | Foreign Exchange Contracts | Credit Contracts | Equity Contracts | Commodity Contracts | Other Contracts | Total | ||||||||||||||||||||||
| Assets: | ||||||||||||||||||||||||||||
| Unrealized appreciation on foreign currency contracts | $ | — | $ | 25 | $ | — | $ | — | $ | — | $ | — | $ | 25 | ||||||||||||||
| Total | $ | — | $ | 25 | $ | — | $ | — | $ | — | $ | — | $ | 25 | ||||||||||||||
The volume of derivatives that is presented in the Schedule of Investments is consistent with the derivative activity during the year ended October 31, 2014.
The Effect of Derivative Instruments on the Statement of Operations for the year ended October 31, 2014:
| Risk Exposure Category | ||||||||||||||||||||||||||||
| Interest
Rate Contracts | Foreign Exchange Contracts | Credit Contracts | Equity Contracts | Commodity Contracts | Other Contracts | Total | ||||||||||||||||||||||
| Realized Gain on Derivatives Recognized as a Result of Operations: | ||||||||||||||||||||||||||||
| Net realized gain on foreign currency contracts | $ | — | $ | 140 | $ | — | $ | — | $ | — | $ | — | $ | 140 | ||||||||||||||
| Total | $ | — | $ | 140 | $ | — | $ | — | $ | — | $ | — | $ | 140 | ||||||||||||||
Net Change in Unrealized Appreciation (Depreciation) on Derivatives Recognized as a Result of Operations:
| Net change in unrealized appreciation of foreign currency contracts | $ | — | $ | 24 | $ | — | $ | — | $ | — | $ | — | $ | 24 | ||||||||||||||
| Total | $ | — | $ | 24 | $ | — | $ | — | $ | — | $ | — | $ | 24 |
The derivatives held by the Fund as of October 31, 2014 are not subject to a master netting arrangement; therefore, no balance sheet offsetting disclosure is presented.
| 16 |
| Hartford Global Equity Income Fund |
| Notes to Financial Statements – (continued) |
| October 31, 2014 |
| (000’s Omitted) |
Principal Risks:
The Fund may be exposed to counterparty risk, or the risk that an institution or other entity with which the Fund has unsettled or open transactions will default.
If the Fund invests directly in foreign currencies or in securities that trade in, and receive revenues in, foreign currencies, or in derivatives that provide exposure to foreign currencies, it will be subject to the risk that those currencies will decline in value relative to the base currency (U.S. dollars) of the Fund, or, in the case of hedging positions, that the Fund’s base currency will decline in value relative to the currency being hedged. Currency rates in foreign countries may fluctuate significantly over short periods of time for a number of reasons, including changes in interest rates, intervention (or the failure to intervene) by U.S. or foreign governments, central banks or supranational entities, such as the International Monetary Fund, or by the imposition of currency controls or other political developments in the United States or abroad. As a result, the Fund’s investments in foreign currency denominated securities may reduce the returns of the Fund. The market values of equity securities, such as common stocks and preferred stocks, or equity related investments, such as futures and options, may decline due to general market conditions which are not specifically related to a particular company, such as real or perceived adverse economic conditions, changes in the general outlook for corporate earnings, changes in interest or currency rates or adverse investor sentiment generally. The market value of equity securities may also decline due to factors which affect a particular industry or industries, such as labor shortages or increased production costs and competitive conditions within an industry. Equity securities and equity related investments generally have greater market price volatility than fixed income securities.
Federal Income Taxes:
Federal Income Taxes – For federal income tax purposes, the Fund intends to continue to qualify as a Regulated Investment Company ("RIC") under Subchapter M of the Internal Revenue Code (“IRC”) by distributing substantially all of its taxable net investment income and net realized capital gains to its shareholders and otherwise complying with the requirements of the IRC. The Fund has distributed substantially all of its income and capital gains in prior years, if applicable, and intends to distribute substantially all of its income and capital gains during the calendar year ending December 31, 2014. Accordingly, no provision for federal income or excise taxes has been made in the accompanying financial statements. Distributions from short-term capital gains are treated as ordinary income distributions for federal income tax purposes.
Net Investment Income (Loss), Net Realized Gains (Losses) and Distributions – Net investment income (loss) and net realized gains (losses) may differ for financial statement and tax purposes primarily because of losses deferred due to wash sale adjustments, foreign currency gains and losses, adjustments related to Passive Foreign Investment Companies ("PFICs"), Real Estate Investment Trusts ("REITs"), RICs, certain derivatives and partnerships. The character of distributions made during the year from net investment income or net realized gains may differ from their ultimate characterization for federal income tax purposes. Also, due to the timing of dividend distributions, the fiscal year in which amounts are distributed may differ from the year that the income or realized gains (losses) were recorded by the Fund.
Distributions and Components of Distributable Earnings – The tax character of distributions paid by the Fund for the periods indicated is as follows (as adjusted for dividends payable, if applicable):
For the Year Ended October 31, 2014 | For the Year Ended October 31, 2013 | |||||||
| Ordinary Income | $ | 3,215 | $ | 1,597 | ||||
| Long-Term Capital Gains ‡ | 5,246 | — | ||||||
| ‡ | The Fund designates these distributions as long-term capital gain dividends pursuant to IRC Sec. 852(b)(3)(C). |
| 17 |
| Hartford Global Equity Income Fund |
| Notes to Financial Statements – (continued) |
| October 31, 2014 |
| (000’s Omitted) |
As of October 31, 2014, the Fund’s components of distributable earnings (deficit) on a tax basis are as follows:
| Amount | ||||
| Undistributed Ordinary Income | $ | 3,988 | ||
| Undistributed Long-Term Capital Gain | 8,833 | |||
| Accumulated Capital and Other Losses* | (7,249 | ) | ||
| Unrealized Depreciation† | (3,446 | ) | ||
| Total Accumulated Earnings | $ | 2,126 | ||
| * | The Fund has capital loss carryforwards that are identified in the Capital Loss Carryforward note that follows. |
| † | Differences between book-basis and tax-basis unrealized appreciation (depreciation) may be attributable to the losses deferred due to wash sale adjustments, foreign currency gains and losses, adjustments related to PFICs, REITs, RICs, certain derivatives and partnerships. |
Reclassification of Capital Accounts – The Fund may record reclassifications in its capital accounts. These reclassifications have no impact on the total net assets of the Fund. The reclassifications are a result of permanent differences between U.S. GAAP and tax accounting for such items as foreign currency, PFICs, expiration or utilization of capital loss carryforwards or net operating losses. Adjustments are made to reflect the impact these items have on current and future distributions to shareholders. Therefore, the source of the Fund’s distributions may be shown in the accompanying Statement of Changes in Net Assets as from undistributed net investment income, from accumulated net realized gains on investments or from capital depending on the type of book and tax differences that exist. For the year ended October 31, 2014, the Fund recorded reclassifications to increase (decrease) the accounts listed below:
| Amount | ||||
| Undistributed Net Investment Income (Loss) | $ | 114 | ||
| Accumulated Net Realized Gain (Loss) | (114 | ) | ||
Capital Loss Carryforward – On December 22, 2010, the Regulated Investment Company Modernization Act of 2010 (the “Act”) was enacted, which made changes to the capital loss carryforward rules. The changes are effective for taxable years beginning after the date of enactment. Under the Act, funds are permitted to carry forward capital losses for an unlimited period. However, any losses incurred during those future taxable years will be required to be utilized prior to the losses incurred in pre-enactment taxable years, which carry an expiration date. As a result of this ordering rule, pre-enactment capital loss carryforwards may be more likely to expire unused. Additionally, post-enactment capital loss carryforwards retain their character as either short-term or long-term capital losses rather than being considered all short-term as permitted under prior regulation.
At October 31, 2014 (tax year end), the Fund had capital loss carryforwards for U.S. federal income tax purposes as follows:
| Year of Expiration | Amount | |||
| 2015 | $ | 887 | ||
| 2016 | 3,459 | |||
| 2017 | 169 | |||
| 2018 | 2,734 | |||
| Total | $ | 7,249 | ||
During the year ended October 31, 2014, the Fund utilized $2,628 of prior year capital loss carryforwards.
Accounting for Uncertainty in Income Taxes – The Fund has adopted financial reporting rules that require the Fund to analyze all open tax years, as defined by the statute of limitations, for all major jurisdictions. Generally, tax authorities can examine all tax returns filed for the last three years. The Fund does not have an examination in progress.
The Fund has reviewed all open tax years and major jurisdictions and concluded that these financial reporting rules had no effect on the Fund’s financial position or results of operations. There is no tax liability resulting from unrecognized tax benefits relating to
| 18 |
| Hartford Global Equity Income Fund |
| Notes to Financial Statements – (continued) |
| October 31, 2014 |
| (000’s Omitted) |
uncertain income tax positions taken or expected to be taken on the tax return for the fiscal year ended October 31, 2014. The Fund is also not aware of any tax positions for which it is reasonably possible that the total amounts of unrecognized tax benefits will significantly change in the next twelve months.
Expenses:
Investment Management Agreement – Hartford Funds Management Company, LLC ("HFMC") serves as the Fund’s investment manager pursuant to an Investment Management Agreement with the Company. HFMC is an indirect wholly owned subsidiary of The Hartford Financial Services Group, Inc. ("The Hartford"). The investment manager has overall investment supervisory responsibility for the Fund. In addition, the investment manager provides administrative personnel, services, equipment, facilities and office space for proper operation of the Fund. HFMC has contracted with Wellington Management Company, LLP ("Wellington Management") under a sub-advisory agreement for the provision of day-to-day investment management services to the Fund in accordance with the Fund’s investment objective and policies. The Fund pays a fee to the investment manager, a portion of which may be used to compensate Wellington Management.
The schedule below reflects the rates of compensation paid to the investment manager for investment management services rendered for the period May 30, 2014 through October 31, 2014; the rates are accrued daily and paid monthly:
| Average Daily Net Assets | Annual Fee | |||
| On first $500 million | 0.7500% | |||
| On next $500 million | 0.7000% | |||
| On next $4 billion | 0.6900% | |||
| On next $5 billion | 0.6850% | |||
| Over $10 billion | 0.6700% | |||
The schedule below reflects the rates of compensation paid to the investment manager for investment management services rendered during the period November 1, 2013 through May 29, 2014.
| Average Daily Net Assets | Annual Fee | |||
| On first $500 million | 0.9000% | |||
| On next $500 million | 0.8750% | |||
| On next $4 billion | 0.8500% | |||
| On next $5 billion | 0.8475% | |||
| Over $10 billion | 0.8450% | |||
Accounting Services Agreement – Pursuant to the Fund Accounting Agreement between HFMC and the Company, on behalf of the Fund, HFMC provides accounting services to the Fund and receives monthly compensation based on the Fund’s average daily net assets at the rates set forth below. The Fund’s accounting services fees are accrued daily and paid monthly.
| Average Daily Net Assets | Annual Fee | |||
| On first $5 billion | 0.018% | |||
| On next $5 billion | 0.014% | |||
| Over $10 billion | 0.010% | |||
| 19 |
| Hartford Global Equity Income Fund |
| Notes to Financial Statements – (continued) |
| October 31, 2014 |
| (000’s Omitted) |
Operating Expenses – Allocable expenses incurred by the Company are allocated to each Fund and allocated to classes within the Fund in proportion to the average daily net assets of the Fund and each class, except where allocation of certain expenses is more fairly made directly to the Fund or to specific classes within a Fund. From May 30, 2014 through October 31, 2014, HFMC contractually limited the total operating expenses of this Fund, exclusive of taxes, interest expense, brokerage commissions, acquired fund fees and expenses and extraordinary expenses, through February 29, 2016 as follows:
| Class A | Class B | Class C | Class I | Class R3 | Class R4 | Class R5 | Class Y | |||||||||||||||||||||||
| 1.25% | 2.00% | 2.00% | 1.00% | 1.45% | 1.15% | 0.85% | 0.80% | |||||||||||||||||||||||
From November 1, 2013 through May 29, 2014, the investment manager contractually limited the total operating expenses of this Fund, exclusive of taxes, interest expense, brokerage commissions, acquired fund fees and expenses and extraordinary expenses as follows:
| Class A | Class B | Class C | Class I | Class R3 | Class R4 | Class R5 | Class Y | |||||||||||||||||||||||
| 1.45% | 2.20% | 2.20% | 1.20% | 1.65% | 1.35% | 1.05% | 1.00% | |||||||||||||||||||||||
Fees Paid Indirectly – The Fund has entered into agreements with State Street Global Markets, LLC and Russell Implementation Services, Inc. to partially recapture non-discounted trade commissions. Such rebates are used to pay a portion of the Fund’s expenses. In addition, the Fund's custodian bank has agreed to reduce its fees when the Fund maintains cash on deposit in a non-interest-bearing custody account. For the year ended October 31, 2014, these amounts, if any, are included in the Statement of Operations.
The ratio of expenses to average net assets in the accompanying financial highlights excludes the reduction in expenses related to fees paid indirectly. The annualized expense ratio after waivers for the period listed below reflecting the reduction for fees paid indirectly is as follows:
| Year Ended October 31, 2014 | ||||
| Class A | 1.36 | % | ||
| Class B | 2.12 | |||
| Class C | 2.11 | |||
| Class I | 1.10 | |||
| Class R3 | 1.57 | |||
| Class R4 | 1.26 | |||
| Class R5 | 0.95 | |||
| Class Y | 0.80 | |||
Distribution and Service Plan for Class A, B, C, R3 and R4 Shares – Hartford Funds Distributors, LLC ("HFD"), an indirect wholly owned subsidiary of The Hartford, is the principal underwriter and distributor of the Fund. HFD is engaged in distribution activities, which include marketing and distribution of shares through broker/dealers, financing distribution costs and maintaining financial books and records. For the year ended October 31, 2014, HFD received front-end load sales charges of $501 and contingent deferred sales charges of $1 from the Fund.
The Fund has adopted a Distribution and Service Plan in accordance with Rule 12b-1 of the 1940 Act to compensate the distributor (HFD) for activities intended to result in the sale and distribution of Class A, B, C, R3 and R4 shares and for providing services for shareholders. The Rule 12b-1 plan applicable to Class A shares of the Fund provides for payment of a Rule 12b-1 fee of 0.25% of average daily net assets. Some or all of the fee may be used for shareholder servicing expenses with the remainder used for distribution expenses. Under the Class B Plan, the Fund pays the distributor 1.00% of the average daily net assets of Class B shares that are outstanding for 8 years or less, 0.25% of which is a fee for services provided to existing shareholders with the remainder used for distribution expenses. Some or the entire Rule 12b-1 fee for Class B shares may be remitted to broker/dealers for distribution and/or shareholder account services. After eight years, Class B shares convert to Class A shares. Upon conversion to Class A
| 20 |
| Hartford Global Equity Income Fund |
| Notes to Financial Statements – (continued) |
| October 31, 2014 |
| (000’s Omitted) |
shares, the Class A plan described above will apply to those shares. Under the Class C Plan, the Fund pays the distributor 1.00% of the average daily net assets of Class C shares outstanding, 0.25% of which is intended as a fee for services provided to existing shareholders with the remainder used for distribution expenses. For Class C shares, some or the entire fee may be remitted to broker/dealers for distribution and/or shareholder account services. Class R3 shares have a distribution fee of 0.50% of average daily net assets and Class R4 shares have a distribution fee of 0.25% of average daily net assets. For Class R3 and R4 shares, some or the entire fee may be remitted to broker/dealers for distribution and/or shareholder account services. The Fund’s 12b-1 fees are accrued daily and paid monthly or at such other intervals as the Board of Directors may determine.
Other Related Party Transactions – Certain officers of the Fund are directors and/or officers of HFMC and/or The Hartford or its subsidiaries. For the year ended October 31, 2014, a portion of the Fund’s Chief Compliance Officer’s compensation was paid by all of the investment companies in the Hartford fund complex. The portion allocated to the Fund, as represented in other expenses on the Statement of Operations, rounds to zero. Hartford Administrative Services Company (“HASCO”), an indirect wholly-owned subsidiary of The Hartford, provides transfer agent services to the Fund. HASCO has contractually agreed to reimburse any portion of the transfer agency fees over 0.30% of average daily net assets per fiscal year for each class. Any transfer agency fee reimbursement is determined before considering the contractual operating expense limitation. For providing such services, HASCO is compensated on a per account basis that varies by account type, except with respect to Class Y, for which it is compensated based on average daily net assets. The amount paid to HASCO and any related contractual reimbursement amounts, if applicable, can be found in the Statement of Operations. These fees are accrued daily and paid monthly.
Administrative services fees are paid to HASCO for third-party recordkeeping services that are payable as a percentage of net assets in the amount of up to 0.20%, 0.15% and 0.10% for Classes R3, R4 and R5 shares, respectively. The total administrative services fees are shown on the Statement of Operations. These fees are accrued daily and paid monthly.
Affiliate Holdings:
As of October 31, 2014, affiliates of The Hartford had ownership of shares in the Fund as follows:
| Percentage of Class | Percentage of Fund | |||||||
| Class R3 | 68 | % | — | %* | ||||
| Class R4 | 85 | — | * | |||||
| Class R5 | 67 | — | * | |||||
As of October 31, 2014, the Fund's shares were owned in aggregate by affiliated fund of funds. Therefore, the Fund may experience relatively large purchases or redemptions of its shares from these affiliated fund of funds. Affiliated fund of funds owned shares in the Fund as follows:
| Percentage of Fund | ||||
| Class Y | 66% | |||
| * | Percentage rounds to zero. |
| 21 |
| Hartford Global Equity Income Fund |
| Notes to Financial Statements – (continued) |
| October 31, 2014 |
| (000’s Omitted) |
Investment Transactions:
For the year ended October 31, 2014, the cost of purchases and proceeds from sales of investment securities (excluding short-term investments) were as follows:
| Excluding U.S. Government Obligations | U.S. Government Obligations | Total | ||||||||||
| Cost of Purchases | $ | 341,212 | $ | — | $ | 341,212 | ||||||
| Sales Proceeds | 140,689 | — | 140,689 | |||||||||
Capital Share Transactions:
The following information is for the year ended October 31, 2014, and the year ended October 31, 2013:
| For the Year Ended October 31, 2014 | For the Year Ended October 31, 2013 | |||||||||||||||||||||||||||||||
| Shares Sold | Shares
Issued for Reinvested Dividends | Shares Redeemed | Net
Increase (Decrease) of Shares | Shares Sold | Shares
Issued for Reinvested Dividends | Shares Redeemed | Net
Increase (Decrease) of Shares | |||||||||||||||||||||||||
| Class A | ||||||||||||||||||||||||||||||||
| Shares | 1,956 | 486 | (934 | ) | 1,508 | 836 | 88 | (859 | ) | 65 | ||||||||||||||||||||||
| Amount | $ | 23,005 | $ | 5,333 | $ | (10,875 | ) | $ | 17,463 | $ | 8,896 | $ | 859 | $ | (8,962 | ) | $ | 793 | ||||||||||||||
| Class B | ||||||||||||||||||||||||||||||||
| Shares | 11 | 21 | (100 | ) | (68 | ) | 6 | 3 | (129 | ) | (120 | ) | ||||||||||||||||||||
| Amount | $ | 119 | $ | 230 | $ | (1,140 | ) | $ | (791 | ) | $ | 66 | $ | 28 | $ | (1,341 | ) | $ | (1,247 | ) | ||||||||||||
| Class C | ||||||||||||||||||||||||||||||||
| Shares | 145 | 73 | (171 | ) | 47 | 49 | 10 | (168 | ) | (109 | ) | |||||||||||||||||||||
| Amount | $ | 1,672 | $ | 776 | $ | (1,951 | ) | $ | 497 | $ | 519 | $ | 95 | $ | (1,738 | ) | $ | (1,124 | ) | |||||||||||||
| Class I | ||||||||||||||||||||||||||||||||
| Shares | 98 | 4 | (73 | ) | 29 | 69 | 1 | (56 | ) | 14 | ||||||||||||||||||||||
| Amount | $ | 1,159 | $ | 48 | $ | (868 | ) | $ | 339 | $ | 722 | $ | 14 | $ | (600 | ) | $ | 136 | ||||||||||||||
| Class R3 | ||||||||||||||||||||||||||||||||
| Shares | 2 | 4 | (9 | ) | (3 | ) | 6 | 1 | (3 | ) | 4 | |||||||||||||||||||||
| Amount | $ | 20 | $ | 45 | $ | (101 | ) | $ | (36 | ) | $ | 64 | $ | 7 | $ | (27 | ) | $ | 44 | |||||||||||||
| Class R4 | ||||||||||||||||||||||||||||||||
| Shares | 6 | 4 | (3 | ) | 7 | — | 1 | — | 1 | |||||||||||||||||||||||
| Amount | $ | 66 | $ | 40 | $ | (28 | ) | $ | 78 | $ | 7 | $ | 7 | $ | — | $ | 14 | |||||||||||||||
| Class R5 | ||||||||||||||||||||||||||||||||
| Shares | 20 | 4 | (3 | ) | 21 | — | 1 | — | 1 | |||||||||||||||||||||||
| Amount | $ | 235 | $ | 41 | $ | (27 | ) | $ | 249 | $ | 1 | $ | 7 | $ | — | $ | 8 | |||||||||||||||
| Class Y | ||||||||||||||||||||||||||||||||
| Shares | 16,614 | 142 | (700 | ) | 16,056 | 257 | 55 | (2,378 | ) | (2,066 | ) | |||||||||||||||||||||
| Amount | $ | 199,934 | $ | 1,646 | $ | (8,460 | ) | $ | 193,120 | $ | 2,619 | $ | 538 | $ | (24,870 | ) | $ | (21,713 | ) | |||||||||||||
| Total | ||||||||||||||||||||||||||||||||
| Shares | 18,852 | 738 | (1,993 | ) | 17,597 | 1,223 | 160 | (3,593 | ) | (2,210 | ) | |||||||||||||||||||||
| Amount | $ | 226,210 | $ | 8,159 | $ | (23,450 | ) | $ | 210,919 | $ | 12,894 | $ | 1,555 | $ | (37,538 | ) | $ | (23,089 | ) | |||||||||||||
The following reflects the conversion of Class B shares into Class A shares (reflected as Class A shares sold) for the year ended October 31, 2014, and the year ended October 31, 2013:
| Shares | Dollars | |||||||
| For the Year Ended October 31, 2014 | 28 | $ | 325 | |||||
| For the Year Ended October 31, 2013 | 38 | $ | 408 | |||||
Line of Credit:
The Fund is one of several Hartford Funds that participate in a $500 million committed revolving line of credit facility. The facility is to be used for temporary or emergency purposes. Under the arrangement, the funds are required to own securities having a market value in
| 22 |
| Hartford Global Equity Income Fund |
| Notes to Financial Statements – (continued) |
| October 31, 2014 |
| (000’s Omitted) |
excess of 300% of the total bank borrowings. The interest rate on borrowings varies depending on the nature of the loan. The facility also requires a fee to be paid based on the amount of the commitment. This commitment fee is allocated to all the funds participating in the line of credit based on the average net assets of the funds. During the year ended October 31, 2014, the Fund did not have any borrowings under this facility.
Pending Legal Proceedings:
On February 25, 2011, Jennifer L. Kasilag, Louis Mellinger, Judith M. Menendez, Jacqueline M. Robinson, and Linda A. Russell filed a derivative lawsuit against Hartford Investment Financial Services, LLC (“HIFSCO”) (now known as HFD) on behalf of six Hartford retail mutual funds in the United States District Court for the District of New Jersey, alleging that HIFSCO received excessive advisory and distribution fees in violation of its statutory fiduciary duty under Section 36(b) of the 1940 Act when serving as investment manager and principal underwriter, respectively, to the Hartford retail mutual funds. Although this action was purportedly filed on behalf of certain of the Hartford Funds, none of the Hartford Funds is itself a defendant to the suit. HIFSCO moved to dismiss and, in September 2011, the motion was granted in part and denied in part, with leave to amend the complaint. In November 2011, plaintiffs filed an amended complaint on behalf of certain Hartford retail mutual funds, The Hartford Global Health Fund (now known as The Hartford Healthcare Fund), The Hartford Conservative Allocation Fund, The Hartford Growth Opportunities Fund, The Hartford Inflation Plus Fund, The Hartford Advisers Fund (now known as The Hartford Balanced Fund), and The Hartford Capital Appreciation Fund. Plaintiffs seek to rescind the investment management agreements and distribution plans between HIFSCO and these funds and to recover the total fees charged thereunder or, in the alternative, to recover any improper compensation HIFSCO received, in addition to lost earnings. HIFSCO filed a partial motion to dismiss the amended complaint and, in December 2012, the court dismissed without prejudice the claims regarding distribution fees and denied the motion with respect to the advisory fees claims. HIFSCO disputes the allegations and intends to defend vigorously.
In March 2014, the plaintiffs filed a new complaint that added as new plaintiffs The Hartford Floating Rate Fund and The Hartford Small Company Fund and named as a defendant HFMC, which assumed the role as investment manager to the funds as of January 2013. HFMC and HIFSCO dispute the allegations and intend to defend vigorously.
No accrual for litigation relating to this matter has been recorded in the financial statements of the Fund because the Fund is not party to the suit.
Indemnifications:
Under the Company's organizational documents, the Company shall indemnify its officers and directors to the full extent required or permitted under Maryland General Corporation Law and the federal securities laws. In addition, the Company, on behalf of the Fund, may enter into contracts that contain a variety of indemnifications. The Company's maximum exposure under these arrangements is unknown. However, as of the date of these financial statements, the Company has not had prior claims or losses pursuant to these contracts and expects the risk of loss to be remote.
Subsequent Event:
Effective December 1, 2014, pursuant to a sub-transfer agency agreement between HASCO and Boston Financial Data Services, Inc. (“BFDS”), HASCO has delegated certain transfer agent, dividend disbursing agent and shareholder servicing agent functions to BFDS. The costs and expenses of such delegation are borne by HASCO, not by the Fund.
| 23 |
| Hartford Global Equity Income Fund |
| Financial Highlights |
| - Selected Per-Share Data - (A) | - Ratios and Supplemental Data - | |||||||||||||||||||||||||||||||||||||||||||||||||||
| Class | Net
Asset Value at Beginning of Period | Net Investment Income (Loss) | Net Realized and Unrealized Gain (Loss) on Invest- ments | Total
from Investment Operations | Dividends from Net Investment Income | Distribu- tions from Realized Capital Gains | Total Dividends and Distributions | Net Asset Value at End of Period | Total Return(B) | Net Assets at End of Period (000's) | Ratio
of Expenses to Average Net Assets Before Adjust- ments(C) | Ratio
of Expenses to Average Net Assets After Adjust- ments(C) | Ratio
of Net Investment Income (Loss) to Average Net Assets | |||||||||||||||||||||||||||||||||||||||
| For the Year Ended October 31, 2014 | ||||||||||||||||||||||||||||||||||||||||||||||||||||
| A | $ | 11.96 | $ | 0.13 | $ | 0.71 | $ | 0.84 | $ | (0.08 | ) | $ | (1.00 | ) | $ | (1.08 | ) | $ | 11.72 | 7.66 | % | $ | 75,862 | 1.57 | % | 1.36 | % | 1.08 | % | |||||||||||||||||||||||
| B | 11.75 | 0.03 | 0.71 | 0.74 | – | (1.00 | ) | (1.00 | ) | 11.49 | 6.90 | 2,208 | 2.52 | 2.12 | 0.26 | |||||||||||||||||||||||||||||||||||||
| C | 11.73 | 0.04 | 0.70 | 0.74 | – | (1.00 | ) | (1.00 | ) | 11.47 | 6.91 | 10,356 | 2.31 | 2.11 | 0.32 | |||||||||||||||||||||||||||||||||||||
| I | 12.00 | 0.16 | 0.70 | 0.86 | (0.12 | ) | (1.00 | ) | (1.12 | ) | 11.74 | 7.89 | 1,377 | 1.17 | 1.10 | 1.35 | ||||||||||||||||||||||||||||||||||||
| R3 | 11.92 | 0.10 | 0.70 | 0.80 | (0.03 | ) | (1.00 | ) | (1.03 | ) | 11.69 | 7.41 | 465 | 1.77 | 1.57 | 0.81 | ||||||||||||||||||||||||||||||||||||
| R4 | 11.97 | 0.14 | 0.71 | 0.85 | (0.09 | ) | (1.00 | ) | (1.09 | ) | 11.73 | 7.80 | 508 | 1.45 | 1.26 | 1.19 | ||||||||||||||||||||||||||||||||||||
| R5 | 12.01 | 0.18 | 0.71 | 0.89 | (0.15 | ) | (1.00 | ) | (1.15 | ) | 11.75 | 8.12 | 659 | 1.13 | 0.95 | 1.53 | ||||||||||||||||||||||||||||||||||||
| Y | 12.00 | 0.18 | 0.72 | 0.90 | (0.16 | ) | (1.00 | ) | (1.16 | ) | 11.74 | 8.22 | 192,326 | 0.87 | 0.80 | 1.54 | ||||||||||||||||||||||||||||||||||||
| For the Year Ended October 31, 2013 | ||||||||||||||||||||||||||||||||||||||||||||||||||||
| A | $ | 9.50 | $ | 0.07 | $ | 2.57 | $ | 2.64 | $ | (0.18 | ) | $ | – | $ | (0.18 | ) | $ | 11.96 | 28.25 | % | $ | 59,361 | 1.73 | % | 1.45 | % | 0.65 | % | ||||||||||||||||||||||||
| B | 9.32 | (0.01 | ) | 2.53 | 2.52 | (0.09 | ) | – | (0.09 | ) | 11.75 | 27.22 | 3,057 | 2.66 | 2.20 | (0.07 | ) | |||||||||||||||||||||||||||||||||||
| C | 9.32 | (0.01 | ) | 2.53 | 2.52 | (0.11 | ) | – | (0.11 | ) | 11.73 | 27.27 | 10,041 | 2.43 | 2.20 | (0.09 | ) | |||||||||||||||||||||||||||||||||||
| I | 9.54 | 0.09 | 2.58 | 2.67 | (0.21 | ) | – | (0.21 | ) | 12.00 | 28.50 | 1,052 | 1.38 | 1.20 | 0.88 | |||||||||||||||||||||||||||||||||||||
| R3 | 9.47 | 0.05 | 2.57 | 2.62 | (0.17 | ) | – | (0.17 | ) | 11.92 | 28.03 | 517 | 1.85 | 1.65 | 0.43 | |||||||||||||||||||||||||||||||||||||
| R4 | 9.52 | 0.08 | 2.56 | 2.64 | (0.19 | ) | – | (0.19 | ) | 11.97 | 28.24 | 436 | 1.54 | 1.35 | 0.75 | |||||||||||||||||||||||||||||||||||||
| R5 | 9.54 | 0.11 | 2.58 | 2.69 | (0.22 | ) | – | (0.22 | ) | 12.01 | 28.75 | 416 | 1.23 | 1.05 | 1.05 | |||||||||||||||||||||||||||||||||||||
| Y | 9.53 | 0.10 | 2.60 | 2.70 | (0.23 | ) | – | (0.23 | ) | 12.00 | 28.84 | 3,975 | 1.14 | 1.00 | 1.02 | |||||||||||||||||||||||||||||||||||||
| For the Year Ended October 31, 2012 | ||||||||||||||||||||||||||||||||||||||||||||||||||||
| A | $ | 9.30 | $ | 0.07 | $ | 0.71 | $ | 0.78 | $ | (0.02 | ) | $ | (0.56 | ) | $ | (0.58 | ) | $ | 9.50 | 9.52 | % | $ | 46,551 | 1.78 | % | 1.45 | % | 0.82 | % | |||||||||||||||||||||||
| B | 9.17 | – | 0.71 | 0.71 | – | (0.56 | ) | (0.56 | ) | 9.32 | 8.78 | 3,542 | 2.69 | 2.20 | 0.05 | |||||||||||||||||||||||||||||||||||||
| C | 9.17 | 0.01 | 0.70 | 0.71 | – | (0.56 | ) | (0.56 | ) | 9.32 | 8.78 | 8,994 | 2.47 | 2.20 | 0.06 | |||||||||||||||||||||||||||||||||||||
| I | 9.33 | 0.09 | 0.73 | 0.82 | (0.05 | ) | (0.56 | ) | (0.61 | ) | 9.54 | 9.91 | 708 | 1.35 | 1.20 | 1.03 | ||||||||||||||||||||||||||||||||||||
| R3 | 9.26 | 0.06 | 0.71 | 0.77 | – | (0.56 | ) | (0.56 | ) | 9.47 | 9.38 | 371 | 1.86 | 1.65 | 0.63 | |||||||||||||||||||||||||||||||||||||
| R4 | 9.31 | 0.08 | 0.72 | 0.80 | (0.03 | ) | (0.56 | ) | (0.59 | ) | 9.52 | 9.72 | 334 | 1.55 | 1.35 | 0.91 | ||||||||||||||||||||||||||||||||||||
| R5 | 9.33 | 0.11 | 0.72 | 0.83 | (0.06 | ) | (0.56 | ) | (0.62 | ) | 9.54 | 10.04 | 322 | 1.24 | 1.05 | 1.21 | ||||||||||||||||||||||||||||||||||||
| Y | 9.32 | 0.13 | 0.70 | 0.83 | (0.06 | ) | (0.56 | ) | (0.62 | ) | 9.53 | 10.12 | 22,849 | 1.10 | 1.00 | 1.48 | ||||||||||||||||||||||||||||||||||||
| For the Year Ended October 31, 2011 | ||||||||||||||||||||||||||||||||||||||||||||||||||||
| A | $ | 9.56 | $ | 0.06 | $ | (0.27 | ) | $ | (0.21 | ) | $ | (0.05 | ) | $ | – | $ | (0.05 | ) | $ | 9.30 | (2.22 | )% | $ | 44,414 | 1.74 | % | 1.45 | % | 0.58 | % | ||||||||||||||||||||||
| B | 9.45 | (0.02 | ) | (0.26 | ) | (0.28 | ) | – | – | – | 9.17 | (2.96 | ) | 5,101 | 2.59 | 2.20 | (0.17 | ) | ||||||||||||||||||||||||||||||||||
| C | 9.45 | (0.02 | ) | (0.26 | ) | (0.28 | ) | – | – | – | 9.17 | (2.96 | ) | 10,009 | 2.41 | 2.20 | (0.17 | ) | ||||||||||||||||||||||||||||||||||
| I | 9.60 | 0.10 | (0.28 | ) | (0.18 | ) | (0.09 | ) | – | (0.09 | ) | 9.33 | (1.93 | ) | 526 | 1.21 | 1.10 | 1.05 | ||||||||||||||||||||||||||||||||||
| R3 | 9.53 | 0.04 | (0.27 | ) | (0.23 | ) | (0.04 | ) | – | (0.04 | ) | 9.26 | (2.42 | ) | 294 | 1.81 | 1.65 | 0.38 | ||||||||||||||||||||||||||||||||||
| R4 | 9.57 | 0.07 | (0.27 | ) | (0.20 | ) | (0.06 | ) | – | (0.06 | ) | 9.31 | (2.09 | ) | 299 | 1.51 | 1.35 | 0.68 | ||||||||||||||||||||||||||||||||||
| R5 | 9.59 | 0.10 | (0.27 | ) | (0.17 | ) | (0.09 | ) | – | (0.09 | ) | 9.33 | (1.81 | ) | 292 | 1.20 | 1.05 | 0.98 | ||||||||||||||||||||||||||||||||||
| Y | 9.58 | 0.10 | (0.26 | ) | (0.16 | ) | (0.10 | ) | – | (0.10 | ) | 9.32 | (1.77 | ) | 67,387 | 1.10 | 1.00 | 1.00 | ||||||||||||||||||||||||||||||||||
See Portfolio Turnover information on the next page.
| 24 |
| Hartford Global Equity Income Fund |
Financial Highlights – (continued) |
| - Selected Per-Share Data - (A) | - Ratios and Supplemental Data - | |||||||||||||||||||||||||||||||||||||||||||||||||||
| Class | Net
Asset Value at Beginning of Period | Net Investment Income (Loss) | Net Realized and Unrealized Gain (Loss) on Invest- ments | Total
from Investment Operations | Dividends from Net Investment Income | Distribu- tions from Realized Capital Gains | Total Dividends and Distributions | Net Asset Value at End of Period | Total Return(B) | Net Assets at End of Period (000's) | Ratio
of Expenses to Average Net Assets Before Adjust- ments(C) | Ratio
of Expenses to Average Net Assets After Adjust- ments(C) | Ratio
of Net Investment Income (Loss) to Average Net Assets | |||||||||||||||||||||||||||||||||||||||
| For the Year Ended October 31, 2010 | ||||||||||||||||||||||||||||||||||||||||||||||||||||
| A | $ | 8.01 | $ | 0.04 | $ | 1.52 | $ | 1.56 | $ | (0.01 | ) | $ | – | $ | (0.01 | ) | $ | 9.56 | 19.48 | % | $ | 47,429 | 1.85 | % | 1.48 | % | 0.48 | % | ||||||||||||||||||||||||
| B | 7.97 | (0.03 | ) | 1.51 | 1.48 | – | – | – | 9.45 | 18.57 | 7,209 | 2.72 | 2.24 | (0.30 | ) | |||||||||||||||||||||||||||||||||||||
| C | 7.97 | (0.03 | ) | 1.51 | 1.48 | – | – | – | 9.45 | 18.57 | 12,910 | 2.52 | 2.23 | (0.30 | ) | |||||||||||||||||||||||||||||||||||||
| I | 8.02 | 0.07 | 1.53 | 1.60 | (0.02 | ) | – | (0.02 | ) | 9.60 | 20.00 | 517 | 1.26 | 1.12 | 0.87 | |||||||||||||||||||||||||||||||||||||
| R3 | 8.00 | 0.02 | 1.51 | 1.53 | – | – | – | 9.53 | 19.13 | 313 | 1.90 | 1.72 | 0.22 | |||||||||||||||||||||||||||||||||||||||
| R4 | 8.01 | 0.04 | 1.52 | 1.56 | – | – | – | 9.57 | 19.48 | 299 | 1.60 | 1.45 | 0.49 | |||||||||||||||||||||||||||||||||||||||
| R5 | 8.02 | 0.07 | 1.51 | 1.58 | (0.01 | ) | – | (0.01 | ) | 9.59 | 19.77 | 297 | 1.29 | 1.14 | 0.81 | |||||||||||||||||||||||||||||||||||||
| Y | 8.01 | 0.07 | 1.52 | 1.59 | (0.02 | ) | – | (0.02 | ) | 9.58 | 19.92 | 47,067 | 1.21 | 1.07 | 0.91 | |||||||||||||||||||||||||||||||||||||
| (A) | Information presented relates to a share outstanding throughout the indicated period. Net investment income (loss) per share amounts are calculated based on average shares outstanding unless otherwise noted. |
| (B) | Assumes initial investment at net asset value at the beginning of each period, reinvestment of all distributions, the complete redemption of the investment at net asset value at the end of each period and no sales charge. Total return would be reduced if sales charges were taken into account. |
| (C) | Adjustments include waivers and reimbursements, if applicable. Ratios do not include fees paid indirectly (see Expenses in the accompanying Notes to Financial Statements). |
| Portfolio Turnover Rate for All Share Classes | ||||
| For the Year Ended October 31, 2014 | 90 | % | ||
| For the Year Ended October 31, 2013 | 100 | |||
| For the Year Ended October 31, 2012 | 107 | |||
| For the Year Ended October 31, 2011 | 102 | |||
| For the Year Ended October 31, 2010 | 100 | |||
| 25 |
| Report of Independent Registered Public Accounting Firm |
| The Board of Directors and Shareholders of |
| The Hartford Mutual Funds, Inc. |
We have audited the accompanying statement of assets and liabilities, including the schedule of investments, of Hartford Global Equity Income Fund (formerly The Hartford Global Research Fund) (one of the portfolios constituting The Hartford Mutual Funds, Inc. (the Funds)) as of October 31, 2014, and the related statement of operations for the year then ended, the statements of changes in net assets for each of the two years in the period then ended, and the financial highlights for each of the five years in the period then ended. These financial statements and financial highlights are the responsibility of the Funds’ management. Our responsibility is to express an opinion on these financial statements and financial highlights based on our audits.
We conducted our audits in accordance with the standards of the Public Company Accounting Oversight Board (United States). Those standards require that we plan and perform the audit to obtain reasonable assurance about whether the financial statements and financial highlights are free of material misstatement. We were not engaged to perform an audit of the Funds’ internal control over financial reporting. Our audits included consideration of internal control over financial reporting as a basis for designing audit procedures that are appropriate in the circumstances, but not for the purpose of expressing an opinion on the effectiveness of the Funds’ internal control over financial reporting. Accordingly, we express no such opinion. An audit also includes examining, on a test basis, evidence supporting the amounts and disclosures in the financial statements and financial highlights, assessing the accounting principles used and significant estimates made by management, and evaluating the overall financial statement presentation. Our procedures included confirmation of securities owned as of October 31, 2014, by correspondence with the custodian. We believe that our audits provide a reasonable basis for our opinion.
In our opinion, the financial statements and financial highlights referred to above present fairly, in all material respects, the financial position of Hartford Global Equity Income Fund (formerly The Hartford Global Research Fund) of The Hartford Mutual Funds, Inc. at October 31, 2014, the results of its operations for the year then ended, the changes in its net assets for each of the two years in the period then ended, and the financial highlights for each of the five years in the period then ended, in conformity with U.S. generally accepted accounting principles.
| |
| Minneapolis, Minnesota | |
| December 18, 2014 |
| 26 |
| Hartford Global Equity Income Fund |
| Directors and Officers (Unaudited) |
The Board of Directors of the Company (the "Directors") appoints officers who are responsible for the day-to-day operations of the Fund and who execute policies formulated by the Directors. Each Director serves until his or her death, resignation, or retirement or until the next annual meeting of shareholders is held or until his or her successor is elected and qualifies.
Directors and officers who are employed by or who have a financial interest in The Hartford Financial Services Group, Inc. ("The Hartford") are considered “interested” persons of the Fund pursuant to the 1940 Act. Each officer and two of the Company's Directors, as noted in the chart below, are “interested” persons of the Fund. Each Director serves as a director for The Hartford Mutual Funds, Inc., The Hartford Mutual Funds II, Inc., Hartford Series Fund, Inc., and Hartford HLS Series Fund II, Inc., and as a trustee for The Hartford Alternative Strategies Fund, which, as of October 31, 2014, collectively consist of 66 funds. Correspondence may be sent to Directors and officers c/o Hartford Funds, 5 Radnor Corporate Center, Suite 300, 100 Matsonford Road, Radnor, Pennsylvania 19087, except that correspondence to Mr. Annoni, Mr. Dressen and Ms. Quade may be sent to 500 Bielenberg Drive, Suite 500, Woodbury, Minnesota 55125.
The table below sets forth, for each Director and officer, his or her name, year of birth, current position with the Company and date first elected or appointed to The Hartford Mutual Funds, Inc. ("MF") and The Hartford Mutual Funds II, Inc. ("MF2"), principal occupation, and, for Directors, other directorships held. The Fund’s Statement of Additional Information contains further information on the Directors and is available free of charge by calling 1-888-843-7824 or writing to: Hartford Funds, P.O. Box 55022, Boston, MA 02205-5022.
Information on the aggregate remuneration paid to the directors of the Company can be found in the Statement of Operations herein. The Fund pays to The Hartford a portion of the Chief Compliance Officer’s compensation, but does not pay salaries or compensation to any of its other officers or Directors who are employed by The Hartford.
Non-Interested Directors
Hilary E. Ackermann (1956) Director since September 23, 2014
Ms. Ackermann served as Chief Risk Officer at Goldman Sachs Bank USA from October 2008 to November 2011 and serves as a Director of Dynegy, Inc., an independent power company, from October 2012 to present.
Lynn S. Birdsong (1946) Director since 2003, Chairman of the Investment Committee since 2014
Mr. Birdsong is a private investor. Mr. Birdsong currently serves as a Director of the Sovereign High Yield Investment Company (April 2010 to current). Mr. Birdsong currently serves as an Independent Director of Nomura Partners Funds, Inc. (formerly, The Japan Fund) (April 2003 to current). From 2003 to March 2005, Mr. Birdsong was an Independent Director of the Atlantic Whitehall Funds. From 1979 to 2002, Mr. Birdsong was a Managing Director of Zurich Scudder Investments, an investment management firm. During his employment with Scudder, Mr. Birdsong was an Interested Director of The Japan Fund. From January 1981 through December 2013, Mr. Birdsong was a partner in Birdsong Company, an advertising specialty firm.
Robert M. Gavin, Jr. (1940) Director since 2002 (MF) and 1986 (MF2), Chairman of the Board for each since 2004
Dr. Gavin is an educational consultant. Prior to September 1, 2001, he was President of Cranbrook Education Community and prior to July 1996, he was President of Macalester College, St. Paul, Minnesota.
Duane E. Hill (1945) Director since 2001 (MF) and 2002 (MF2), Chairman of the Nominating Committee since 2003
Mr. Hill is a Partner of TSG Ventures L.P., a private equity investment company. Mr. Hill is a former partner of TSG Capital Group, a private equity investment firm that served as sponsor and lead investor in leveraged buyouts of middle market companies.
Sandra S. Jaffee (1941) Director since 2005
Ms. Jaffee is the founder and Chief Executive Officer of a private company, Homeworks Concierge, LLC, which provides residential property management services in Westchester County, New York (January 2012 to present). Ms. Jaffee served as Chairman (2008 to 2009) and Chief Executive Officer of Fortent (formerly Searchspace Group), a leading provider of compliance/regulatory technology to financial institutions from August 2005 to August 2009. From August 2004 to August 2005, Ms. Jaffee served as an Entrepreneur in Residence with Warburg Pincus, a private equity firm. Prior to joining Warburg Pincus, Ms. Jaffee served as Executive Vice President at Citigroup, from September 1995 to July 2004, where she was President and Chief Executive Officer of Citibank’s Global Securities Services (1995 to 2003). Ms. Jaffee currently serves as a member of the Board of Directors of Broadridge Financial Solutions as well as a Trustee of Muhlenberg College.
| 27 |
| Hartford Global Equity Income Fund |
| Directors and Officers (Unaudited) – (continued) |
William P. Johnston (1944) Director since 2005, Chairman of the Compliance Committee since 2005
In June 2006, Mr. Johnston was appointed as Senior Advisor to The Carlyle Group, a global private equity and other alternative asset investment firm and currently serves as an Operating Executive. In July 2006, Mr. Johnston was elected to the Board of Directors of MultiPlan, Inc. and served as a Director (July 2006 to August 2010). In August 2007, Mr. Johnston was elected to the Board of Directors of LifeCare Holdings, Inc. and served as a Director (August 2007 to June 2013). In February 2008, Mr. Johnston was elected to the Board of Directors of HCR-ManorCare, Inc. In May 2006, Mr. Johnston was elected to the Supervisory Board of Fresenius Medical Care AG & Co. KGaA, after its acquisition of Renal Care Group, Inc. in March 2006. Mr. Johnston joined Renal Care Group in November 2002 as a member of the Board of Directors and served as Chairman of the Board from March 2003 through March 2006. From 2002 through 2013, Mr. Johnston served as a Board member of the Georgia O’Keefe Museum. From September 1987 to December 2002, Mr. Johnston was with Equitable Securities Corporation (and its successors, SunTrust Equitable Securities and SunTrust Robinson Humphrey) serving in various investment banking and managerial positions, including Managing Director and Head of Investment Banking, Chief Executive Officer and Vice Chairman.
Phillip O. Peterson (1944) Director since 2002 (MF) and 2000 (MF2), Chairman of the Audit Committee since 2002
Mr. Peterson is a mutual fund industry consultant. He was a partner of KPMG LLP (an accounting firm) until July 1999. Mr. Peterson joined William Blair Funds in February 2007 as a member of the Board of Trustees. From February 2012 to February 2014, Mr. Peterson served as a Trustee of Symetra Variable Mutual Funds. From January 2004 to April 2005, Mr. Peterson served as Independent President of the Strong Mutual Funds.
Lemma W. Senbet (1946) Director since 2005
Dr. Senbet is the William E. Mayer Chair Professor of Finance and Founding Director, Center for Financial Policy, at the University of Maryland, Robert H. Smith School of Business. He was chair of the Finance Department of the University of Maryland, Robert H. Smith School of Business from 1998 to 2006. Since June 2013, he has been on leave from the University to serve as Executive Director of African Economic Research Consortium which focuses on economic policy research and training. Previously, he was a chaired professor of finance at the University of Wisconsin-Madison. Also, he was a Director of the Fortis Funds from March 2000 to July 2002. Dr. Senbet served as Director of the American Finance Association and President of the Western Finance Association. In 2006, Dr. Senbet was inducted Fellow of Financial Management Association International for his career-long distinguished scholarship and professional service.
Interested Directors and Officers
James E. Davey (1964) Director since 2012, President and Chief Executive Officer since 2010
Mr. Davey serves as Executive Vice President of Hartford Life Insurance Company (“HLIC”) and The Hartford. Additionally, Mr. Davey serves as Chairman of the Board, Manager and Senior Managing Director of Hartford Funds Distributors, LLC (“HFD”). He also currently serves as Director, Chairman of the Board, President and Senior Managing Director of Hartford Administrative Services Company (“HASCO”). Mr. Davey also serves as Manager, Chairman of the Board and Senior Managing Director for Hartford Funds Management Company, LLC (“HFMC”) and Director, Chairman of the Board and Senior Managing Director for Hartford Funds Management Group, Inc. ("HFMG"). Mr. Davey has served in various positions within The Hartford and its subsidiaries in connection with the operation of the Hartford Funds. Mr. Davey joined The Hartford in 2002.
Lowndes A. Smith* (1939) Director since 1996 (MF) and 2002 (MF2)
Mr. Smith served as Vice Chairman of The Hartford from February 1997 to January 2002, as President and Chief Executive Officer of Hartford Life, Inc. from February 1997 to January 2002, and as President and Chief Operating Officer of The Hartford Life Insurance Companies from January 1989 to January 2002. Mr. Smith serves as a Director of White Mountains Insurance Group Ltd. (October 2003 to current); One Beacon Insurance (October 2006 to current); Symetra Financial (August 2007 to current) and is a Managing Director of Whittington Gray Associates (January 2007 to current).
* Mr. Smith resigned as a Director of MF, MF2, Hartford Series Fund, Inc. and Hartford HLS Series Fund II, Inc. and as a Trustee of The Hartford Alternative Strategies Fund effective September 17, 2014.
Other Officers
Mark A. Annoni (1964) Vice President, Controller and Treasurer since 2012
Mr. Annoni currently serves as the Assistant Vice President of HLIC (February 2004 to present) and Senior Vice President of HFMG (December 2013 to present). Mr. Annoni has served in various positions within The Hartford and its subsidiaries in connection with the operation of the Hartford Funds. Mr. Annoni joined The Hartford in 2001.
| 28 |
| Hartford Global Equity Income Fund |
| Directors and Officers (Unaudited) – (continued) |
Michael R. Dressen (1963) AML Compliance Officer since 2011
Mr. Dressen currently serves as Assistant Vice President of HLIC. He also serves as Chief Compliance Officer and AML Compliance Officer of HASCO and as AML Officer of HFD. Mr. Dressen has served in various positions within The Hartford and its subsidiaries in connection with the operation of the Hartford Funds.
Edward P. Macdonald (1967) Vice President, Secretary and Chief Legal Officer since 2005
Mr. Macdonald currently serves as Assistant Secretary, Executive Vice President and Deputy General Counsel of HFD, HASCO, HFMC and HFMG. He also serves as Vice President of HLIC. Mr. Macdonald has served in various positions within The Hartford and its subsidiaries in connection with the operation of the Hartford Funds. Mr. Macdonald joined The Hartford in 2005.
Joseph G. Melcher (1973) Vice President and Chief Compliance Officer since 2013
Mr. Melcher currently serves as Executive Vice President of HFD, HFMG and HASCO. Mr. Melcher also currently serves as Executive Vice President and Chief Compliance Officer of HFMC. Mr. Melcher has served in various positions within The Hartford and its subsidiaries in connection with the operation of the Hartford Funds since joining The Hartford in 2012. Prior to joining The Hartford, Mr. Melcher worked at Touchstone Investments, a member of the Western & Southern Financial Group, where he held the position of Vice President and Chief Compliance Officer from 2010 through 2012 and Assistant Vice President, Compliance from 2005 to 2010.
Vernon J. Meyer (1964) Vice President since 2006
Mr. Meyer currently serves as Senior Vice President of HLIC. He also currently serves as Managing Director and Chief Investment Officer of HFMC and Managing Director of HFMG. Mr. Meyer has served in various positions within The Hartford and its subsidiaries in connection with the operation of the Hartford Funds. Mr. Meyer joined The Hartford in 2004.
Laura S. Quade (1969) Vice President since 2012
Ms. Quade currently serves as Vice President of HASCO, HFD and HFMG. She is the Head of Operations of HASCO and formerly served as Director, Enterprise Operations of HLIC. Ms. Quade has served in various positions within The Hartford and its subsidiaries in connection with the operation of the Hartford Funds. Ms. Quade joined The Hartford in 2001.
Martin A. Swanson** (1962) Vice President since 2010
Mr. Swanson currently serves as Vice President of HLIC. Mr. Swanson also serves as Managing Director, Chief Marketing Officer and Principal of HFD and Managing Director of HFMG. Mr. Swanson has served in various positions within The Hartford and its subsidiaries in connection with the operation of the Hartford Funds.
** Mr. Swanson resigned as an officer effective November 6, 2014.
HOW TO OBTAIN A COPY OF THE FUND’S PROXY VOTING POLICIES AND VOTING RECORDS (UNAUDITED)
A description of the policies and procedures that the Fund uses to determine how to vote proxies relating to portfolio securities and information about how the Fund voted proxies relating to portfolio securities during the most recent twelve-month period ended June 30 are available (1) without charge, upon request, by calling 888-843-7824 and (2) on the SEC’s website at http://www.sec.gov.
QUARTERLY PORTFOLIO HOLDINGS INFORMATION (UNAUDITED)
The Fund files a complete schedule of portfolio holdings with the SEC for the first and third quarters of each fiscal year on Form N-Q. The Fund’s Forms N-Q are available (1) without charge, upon request, by calling 888-843-7824 and (2) on the SEC’s website at http://www.sec.gov. The Form N-Q may be reviewed and copied at the SEC’s Public Reference Room in Washington, DC. Information on the operation of the Public Reference Room may be obtained by calling 1-800-SEC-0330.
| 29 |
| Hartford Global Equity Income Fund |
| Federal Tax Information (Unaudited) |
For the fiscal year ended October 31, 2014, there is no further federal tax information required for this Fund.
| 30 |
| Hartford Global Equity Income Fund |
| Expense Example (Unaudited) |
Your Fund's Expenses
As a shareholder of the Fund, you incur two types of costs: (1) transaction costs, including sales charges (loads) on purchase payments, if any, and contingent deferred sales charges (CDSC), if any, and (2) ongoing costs, including investment management fees, distribution and/or service (12b-1) fees, if any, and other fund expenses. This example is intended to help you understand your ongoing costs (in dollars) of investing in the Fund and to compare these costs with the ongoing costs of investing in other mutual funds. The example is based on an investment of $1,000 invested at the beginning of the period and held for the entire period of April 30, 2014 through October 31, 2014.
Actual Expenses
The first set of columns of the table below provides information about actual account values and actual expenses. You may use the information in this column, together with the amount you invested, to estimate the expenses that you paid over the period. Simply divide your account value by $1,000 (for example, an $8,600 account value divided by $1,000 = 8.6), then multiply the result by the number in the line under the heading entitled “Expenses Paid During Period” to estimate the expenses you paid on your account during this period.
Hypothetical Example for Comparison Purposes
The second set of columns of the table below provides information about hypothetical account values and hypothetical expenses based on the Fund's actual expense ratio and an assumed rate of return of 5% per year before expenses, which is not the Fund's actual return. The hypothetical account values and expenses may not be used to estimate the actual ending account balance or expenses you paid for the period. You may use this information to compare the ongoing costs of investing in the Fund and other funds. To do so, compare this 5% hypothetical example with the 5% hypothetical examples that appear in the shareholder reports of the other funds.
Please note that the expenses shown in the table are meant to highlight your ongoing costs only and do not reflect any transactional costs, such as sales charges (loads) and CDSC. Therefore, the second set of columns of the table is useful in comparing ongoing costs only, and will not help you determine the relative total costs of owning different funds. In addition, if these transactional costs were included, your costs would be higher. Expenses are equal to the Fund's annualized expense ratios multiplied by average account value over the period, multiplied by 184/365 (to reflect the one-half year period).
| Actual return | Hypothetical (5% return before expenses) | |||||||||||||||||||||||||||||||||||
| Beginning Account Value April 30, 2014 | Ending
Account Value October 31, 2014 | Expenses
paid during the period April 30, 2014 through October 31, 2014 | Beginning Account Value April 30, 2014 | Ending
Account Value October 31, 2014 | Expenses
paid during the period April 30, 2014 through October 31, 2014 | Annualized expense ratio | Days in the current 1/2 year | Days in the full year | ||||||||||||||||||||||||||||
| Class A | $ | 1,000.00 | $ | 1,006.00 | $ | 6.47 | $ | 1,000.00 | $ | 1,018.75 | $ | 6.51 | 1.28 | % | 184 | 365 | ||||||||||||||||||||
| Class B | $ | 1,000.00 | $ | 1,002.60 | $ | 10.26 | $ | 1,000.00 | $ | 1,014.96 | $ | 10.33 | 2.03 | 184 | 365 | |||||||||||||||||||||
| Class C | $ | 1,000.00 | $ | 1,002.60 | $ | 10.25 | $ | 1,000.00 | $ | 1,014.97 | $ | 10.31 | 2.03 | 184 | 365 | |||||||||||||||||||||
| Class I | $ | 1,000.00 | $ | 1,008.00 | $ | 5.06 | $ | 1,000.00 | $ | 1,020.16 | $ | 5.09 | 1.00 | 184 | 365 | |||||||||||||||||||||
| Class R3 | $ | 1,000.00 | $ | 1,005.10 | $ | 7.48 | $ | 1,000.00 | $ | 1,017.74 | $ | 7.53 | 1.48 | 184 | 365 | |||||||||||||||||||||
| Class R4 | $ | 1,000.00 | $ | 1,006.60 | $ | 5.97 | $ | 1,000.00 | $ | 1,019.25 | $ | 6.01 | 1.18 | 184 | 365 | |||||||||||||||||||||
| Class R5 | $ | 1,000.00 | $ | 1,008.00 | $ | 4.43 | $ | 1,000.00 | $ | 1,020.79 | $ | 4.46 | 0.88 | 184 | 365 | |||||||||||||||||||||
| Class Y | $ | 1,000.00 | $ | 1,009.30 | $ | 4.05 | $ | 1,000.00 | $ | 1,021.17 | $ | 4.08 | 0.80 | 184 | 365 | |||||||||||||||||||||
| 31 |
| Hartford Global Equity Income Fund |
| Approval of Investment Management and Investment Sub-Advisory Agreements (Unaudited) |
Section 15(c) of the Investment Company Act of 1940, as amended (the “1940 Act”), requires that each mutual fund’s board of directors, including a majority of those directors who are not “interested persons” of the mutual fund, as defined in the 1940 Act (the “Independent Directors”), annually review and consider the continuation of the mutual fund’s investment advisory and sub-advisory agreements. At its meeting held on August 5-6, 2014, the Board of Directors (the “Board”) of The Hartford Mutual Funds, Inc., including each of the Independent Directors, unanimously voted to approve the continuation of the investment management agreement for Hartford Global Equity Income Fund (formerly The Hartford Global Research Fund) (the “Fund”) with Hartford Funds Management Company, LLC (“HFMC”) and the continuation of the investment sub-advisory agreement between HFMC and the Fund’s sub-adviser, Wellington Management Company, LLP (the “Sub-adviser,” and together with HFMC, the “Advisers”) (collectively, the “Agreements”).
In the months preceding the August 5-6, 2014 meeting, the Board requested, received and reviewed written responses from the Advisers to questions posed to them on behalf of the Independent Directors and supporting materials relating to those questions and responses. The Board considered information furnished to the Board at its meetings throughout the year, as well as information specifically prepared in connection with the annual approval of the Agreements at the Board’s meetings held on June 17-18, 2014 and August 5-6, 2014. Information provided to the Board at its meetings throughout the year included, among other things, reports on Fund performance, legal and compliance matters, sales and marketing activity, shareholder services, and the other services provided to the Fund by the Advisers and their affiliates. The Board also received in-person presentations by Fund officers and representatives of HFMC at the Board’s meetings on June 17-18, 2014 and August 5-6, 2014 concerning the Agreements.
The Independent Directors, advised by independent legal counsel, engaged service providers to assist them with evaluating the Agreements with respect to the Fund. Lipper Inc. (“Lipper”), an independent provider of investment company data, was retained to provide the Board with reports on how the Fund’s contractual management fees, actual management fees, other non-management fees, overall expense ratios and investment performance compared to those of mutual funds with similar investment objectives. The Independent Directors also engaged an independent financial services consultant (the “Consultant”) to assist them in evaluating the Fund’s management fees, sub-advisory fees, other non-management fees, overall expense ratios and investment performance. In addition, the Consultant reviewed the profitability calculations utilized by HFMC in connection with the continuation of the investment management agreement.
In determining whether to continue the Agreements for the Fund, the members of the Board reviewed and evaluated information and factors they believed to be relevant and appropriate in light of the information that the Board deemed necessary and appropriate through the exercise of its reasonable business judgment. While individual members of the Board may have weighed certain factors differently, the Board’s determination to continue the Agreements was based on a comprehensive consideration of all information provided to the Board throughout the year and specifically with respect to the continuation of the Agreements. A more detailed discussion of the factors the Board considered with respect to its approval of the Agreements is provided below.
Nature, Extent and Quality of Services Provided by the Advisers
The Board requested and considered information concerning the nature, extent and quality of the services provided to the Fund by the Advisers. The Board considered, among other things, the terms of the Agreements and the range of services provided by the Advisers. The Board considered the Advisers’ professional personnel who provide services to the Fund, including each Adviser’s ability and experience in attracting and retaining qualified personnel to service the Fund. The Board considered each Adviser’s reputation and overall financial strength, as well as its willingness to consider and implement organizational and operational changes designed to enhance services to the Hartford Funds. In addition, the Board considered the quality of each Adviser’s communications with the Board and responsiveness to Board inquiries and requests made from time to time with respect to the Fund and other Hartford Funds.
The Board also requested and evaluated information concerning each Adviser’s regulatory and compliance environment. In this regard, the Board requested and reviewed information on each Adviser’s compliance policies and procedures, compliance history, and a report from the Fund’s Chief Compliance Officer on each Adviser’s compliance with applicable laws and regulations, including responses to regulatory developments and compliance issues raised by regulators. The Board also noted the Advisers’ support of the Fund’s compliance control structure, particularly the resources devoted by the Advisers in support of the Fund’s obligations pursuant to Rule 38a-1 under the 1940 Act.
With respect to HFMC, the Board noted that, under the Agreements, HFMC is responsible for the management of the Fund, including oversight of fund operations and service providers, and provides administrative and investment advisory services in connection with selecting, monitoring and supervising the Sub-adviser. The Board considered HFMC’s ongoing monitoring of people, process and performance, including its quarterly reviews of each of the Hartford Funds, semi-annual meetings with the leaders of each Fund’s portfolio management team, and oversight of the Hartford Funds’ approximately 66 portfolio managers. The Board recognized that HFMC has demonstrated a record of making changes to the
| 32 |
| Hartford Global Equity Income Fund |
| Approval of Investment Management and Investment Sub-Advisory Agreements (Unaudited) – (continued) |
management and/or strategies of the Hartford Funds when warranted. The Board considered HFMC’s oversight of the Sub-adviser’s investment approach and results, process for monitoring best execution of portfolio trades by the Sub-adviser, and approach to risk management with respect to the Fund and the service providers to the Fund. The Board also considered HFMC’s oversight of compliance with the Fund’s objective and policies as well as with applicable laws and regulations, noting that regulatory and other developments had over time led to an increase in the scope of HFMC’s services in this regard.
In addition, the Board considered HFMC’s ongoing commitment to review and rationalize the Hartford Funds product line-up and the expenses that HFMC had incurred in connection with fund combinations in recent years. The Board considered that HFMC or its affiliates are responsible for providing the Fund’s officers.
With respect to the Sub-adviser, which provides certain day-to-day portfolio management services for the Fund, the Board considered the quality of the Fund’s portfolio managers, the Sub-adviser’s other investment personnel, its investment philosophy and process, investment research capabilities and resources, performance record, trade execution capabilities and experience. The Board considered the experience of the Fund’s portfolio managers, the number of accounts managed by the portfolio managers, and the Sub-adviser’s method for compensating the portfolio managers.
Based on these considerations, the Board concluded that it was satisfied with the nature, extent and quality of the services provided to the Fund by HFMC and the Sub-adviser.
Performance of the Fund and the Advisers
The Board considered the investment performance of the Fund. In this regard, the Board reviewed the performance of the Fund over different time periods presented in the materials and evaluated HFMC’s analysis of the Fund’s performance for these time periods. The Board considered information and materials provided to the Board by the Advisers concerning Fund performance, as well as information from Lipper comparing the investment performance of the Fund to an appropriate benchmark and universe of peer funds. The Board noted that the Fund’s performance was in the 1st quintile of its performance universe for the 1- and 5-year periods and the 3rd quintile for the 3-year period. The Board also noted that the Fund’s performance was above its benchmark for the 1-, 3- and 5-year periods. The Board further noted recent changes to the Fund’s portfolio management team and principal investment strategy.
The Board considered the detailed investment analytics reports provided by Hartford Funds’ Investment Advisory Group throughout the year. These reports include, among other things, information on the Fund’s gross and net returns, the Fund’s investment performance relative to an appropriate benchmark and peer group, various statistics concerning the Fund’s portfolio, and a narrative summary of various factors affecting Fund performance. The Board considered the Advisers’ cooperation with the Investment Committee, which assists the Board in evaluating the performance of the Fund at periodic meetings throughout the year. The Board also considered the analysis provided by the Consultant relating to the Fund’s performance track record.
In light of all the considerations noted above, the Board concluded that it had continued confidence in HFMC’s and the Sub-adviser’s overall capabilities to manage the Fund.
Costs of the Services and Profitability of the Advisers
The Board reviewed information regarding HFMC’s cost to provide investment management and related services to the Fund and HFMC’s profitability, both overall and for the Fund, on a pre-tax basis without regard to distribution expenses. The Board also requested and reviewed information about the profitability to HFMC and its affiliates from all services provided to the Fund and all aspects of their relationship with the Fund. The Board also requested and received information relating to the operations and profitability of the Sub-adviser.
The Board considered the Consultant’s review of the profitability calculations used by HFMC in connection with the continuation of the investment management agreement, noting the Consultant’s view that Hartford Funds’ process for calculating and reporting Fund profitability is reasonable. In this regard, the Board noted that the Consultant performed a full review of this process in light of the recent restructuring of the Hartford Funds business and reported that the approach to analyzing Fund profitability, including the use of common expense allocation methodologies, is reasonable, sound and well within common industry practice.
Based on these considerations, the Board concluded that the profits anticipated to be realized by the Advisers and their affiliates from their relationships with the Fund would not be excessive.
| 33 |
| Hartford Global Equity Income Fund |
| Approval of Investment Management and Investment Sub-Advisory Agreements (Unaudited) – (continued) |
Comparison of Fees and Services Provided by the Advisers
The Board considered comparative information with respect to the management fees to be paid by the Fund to HFMC and the total expense ratios of the Fund. The Board also considered comparative information with respect to the sub-advisory fees to be paid by HFMC to the Sub-adviser. In this regard, the Board requested and reviewed information from HFMC and the Sub-adviser relating to the management and sub-advisory fees, including the sub-advisory fee schedule for the Fund, and total operating expenses for the Fund. With respect to the sub-advisory fee schedule, the Board considered representations from HFMC and the Sub-adviser that the Sub-adviser’s fees were negotiated at arm’s length on a fund-by-fund basis. The Board also reviewed information from Lipper comparing the Fund’s contractual management fees, actual management fees and overall expense ratios relative to a group of funds selected by Lipper, in consultation with the Consultant, and a broader universe of funds selected by Lipper. The Board considered that the Fund’s contractual management fee was in the 3rd quintile of its expense group, while its actual management fee was in the 2nd quintile and its total expenses (less 12b-1 and shareholder service fees) were in the 1st quintile. The Board noted that the Fund has an automatically renewable contractual expense cap on each share class. The expense cap resulted in reimbursement of certain expenses incurred in 2013.
While the Board recognized that comparisons between the Fund and peer funds may be imprecise, given the different service levels and characteristics of mutual funds and the different business models and cost structures of the Advisers, the comparative information provided by Lipper assisted the Board in evaluating the reasonableness of the Fund’s management and sub-advisory fees and total operating expenses. In addition, the Board considered the analysis and recommendations of the Consultant relating to the Fund’s management and sub-advisory fees and total operating expenses.
Based on these considerations, the Board concluded that the Fund’s fees and total operating expenses, in conjunction with the information about quality of services, profitability, economies of scale, and other matters discussed, were reasonable in light of the services provided.
Economies of Scale
The Board requested and considered information regarding the Advisers’ realization of economies of scale with respect to the Fund and whether the fee levels reflect these economies of scale for the benefit of the Fund’s shareholders. The Board reviewed the breakpoints in the management fee schedule for the Fund, which reduce fee rates as Fund assets grow over time. The Board recognized that a fund with assets beyond the highest breakpoint level will continue to benefit from economies of scale because additional assets are charged the lowest breakpoint fee resulting in lower overall effective management fee rates. The Board also considered that expense limitations and fee waivers that reduce the Fund’s expenses at all asset levels can have the same effect as breakpoints in sharing economies of scale with shareholders and provide protection from an increase in expenses if Fund assets decline. The Board recognized that a fee schedule that reaches a lower breakpoint quickly provides shareholders with the benefit of anticipated or potential economies of scale, although the Board noted that the Fund’s current low asset levels have kept the Fund from fully realizing this benefit. The Board also considered that HFMC has been active in managing expenses, which has resulted in benefits being realized by shareholders as assets within the Hartford Funds family of funds have grown over time, including through lower transfer agent costs and other operating expenses.
The Board reviewed and evaluated materials from Lipper and the Consultant showing how management fee schedules of peer funds reflect economies of scale for the benefit of shareholders as a peer fund’s assets hypothetically increase over time. Based on information provided by HFMC, Lipper, and the Consultant, the Board recognized that there is no uniform methodology for establishing breakpoints or uniform pattern in asset levels that trigger breakpoints or the amounts of breakpoints triggered.
After considering all of the information available to it, the Board concluded that it was satisfied with the extent to which economies of scale would be shared for the benefit of the Fund’s shareholders based on currently available information and the effective advisory fees and expense ratios for the Fund at its current and reasonably anticipated asset levels. The Board noted, however, that it would continue to monitor future growth in Fund assets and the appropriateness of additional breakpoints.
Other Benefits
The Board considered other benefits to the Advisers and their affiliates from their relationships with the Fund.
The Board noted that HFMC receives fees for fund accounting and related services from the Fund, and the Board considered information on profits to HFMC for such services. The Board also considered that Hartford Administrative Services Company (“HASCO”), the Fund’s transfer agent and an affiliate of HFMC, receives transfer agency compensation from the Fund, and the Board reviewed information on the profitability of
| 34 |
| Hartford Global Equity Income Fund |
| Approval of Investment Management and Investment Sub-Advisory Agreements (Unaudited) – (continued) |
the Fund’s transfer agency function to HASCO. The Board considered information provided by HASCO indicating that the transfer agent fees charged by HASCO to the Fund were fair and reasonable based on publicly available information.
The Board also considered that Hartford Funds Distributors, LLC (“HFD”), an affiliate of HFMC, serves as principal underwriter of the Fund. As principal underwriter, HFD receives 12b-1 fees from the Fund and receives all or a portion of the sales charges on sales or redemptions of certain classes of shares. The Board also noted that certain affiliates of HFD distribute shares of the Fund and receive compensation in that connection.
The Board considered benefits to the Sub-adviser from its use of the Fund’s brokerage commissions to obtain soft dollar research, and representations from HFMC and the Sub-adviser that the Sub-adviser would not make any revenue-sharing payments or any other type of distribution payments to HFMC or its affiliates.
The Board considered the benefits to shareholders of being part of the Hartford Funds family of funds, including the right to exchange investments between the same class of funds without a sales charge, the ability to reinvest Fund dividends into other funds in the family, and the ability to combine holdings in the Fund with holdings in other funds to obtain a reduced sales charge. The Board considered HFMC’s efforts to provide investors in the family with a broad range of investment styles and asset classes and its entrepreneurial risk in initiating new funds to expand these opportunities for shareholders.
* * * *
Based upon its review of these various factors, among others, the Board concluded that it is in the best interests of the Fund and its shareholders for the Board to approve the Agreements for an additional year. In reaching this decision, the Board did not assign relative weights to the factors discussed above or deem any one or group of them to be controlling in and of themselves. In connection with their deliberations, the Independent Directors met separately in executive session on several occasions, with independent legal counsel and the Consultant, to review the relevant materials and consider their responsibilities under relevant laws and regulations.
| 35 |
| Hartford Global Equity Income Fund |
| Main Risks (Unaudited) |
The main risks of investing in the Fund are described below.
Market, Selection and Strategy Risk: The Fund’s share price may fluctuate due to market risk and/or security selections that may underperform the market or relevant benchmarks. If the sub-adviser's investment strategy does not perform as expected, the Fund could underperform its peers or lose money. There is no guarantee the Fund will achieve its stated objective.
Foreign Investment and Emerging Markets Risk: Investments in foreign securities may be riskier than investments in U.S. securities. Potential risks include the risks of illiquidity, increased price volatility, less government regulation, less extensive and less frequent accounting and other reporting requirements, unfavorable changes in currency exchange rates, and economic and political disruptions. These risks are generally greater for investments in emerging markets.
Dividend Paying Security Investment Risk: Dividends are not guaranteed and are subject to change. Dividend paying securities as a group can fall out of favor with the market, causing the Fund to underperform.
Value Investing Risk: Value investments are considered to be undervalued, but they may never attain their potential value. Value-style investing falls in and out of favor, which may result in periods of underperformance.
Active Trading Risk: Actively trading investments may result in higher costs and higher taxable income.
| 36 |
THIS PRIVACY POLICY IS NOT PART OF THIS REPORT
Privacy Policy and Practices of The Hartford Financial Services Group, Inc. and its Affiliates
(herein called “we, our and us”)
This Privacy Policy applies to our United States Operations
|
We value your trust. We are committed to the responsible: a) management; b) use; and c) protection; of Personal Information.
This notice describes how we collect, disclose, and protect Personal Information.
We collect Personal Information to: a) service your Transactions with us; and b) support our business functions.
We may obtain Personal Information from: a) You; b) your Transactions with us; and c) third parties such as a consumer-reporting agency.
Based on the type of product or service You apply for or get from us, Personal Information such as: a) your name; b) your address; c) your income; d) your payment; or e) your credit history; may be gathered from sources such as applications, Transactions, and consumer reports.
To serve You and service our business, we may share certain Personal Information. We will share Personal Information, only as allowed by law, with affiliates such as: a) our insurance companies; b) our employee agents; c) our brokerage firms; and d) our administrators.
As allowed by law, we may share Personal Financial Information with our affiliates to: a) market our products; or b) market our services; to You without providing You with an option to prevent these disclosures.
|
We may also share Personal Information, only as allowed by law, with unaffiliated third parties including: a) independent agents; b) brokerage firms; c) insurance companies; d) administrators; and e) service providers; who help us serve You and service our business.
When allowed by law, we may share certain Personal Financial Information with other unaffiliated third parties who assist us by performing services or functions such as: a) taking surveys; b) marketing our products or services; or c) offering financial products or services under a joint agreement between us and one or more financial institutions.
We, and third parties we partner with, may track some of the pages You visit through the use of: a) cookies; b) pixel tagging; or c) other technologies; and currently do not process or comply with any web browser’s “do not track” signal or similar mechanism that indicates a request to disable online tracking of individual users who visit our websites or use our services.
We will not sell or share your Personal Financial Information with anyone for purposes unrelated to our business functions without offering You the opportunity to: a) “opt-out;” or b) “opt-in;” as required by law.
We only disclose Personal Health Information with: a) your proper written authorization; or b) as otherwise allowed or required by law.
Our employees have access to Personal Information in the course of doing their jobs, such as: a) underwriting policies; b) paying claims; c) developing new products; or d) advising customers of our products and services. |
|
We use manual and electronic security procedures to maintain: a) the confidentiality; and b) the integrity of; Personal Information that we have. We use these procedures to guard against unauthorized access.
Some techniques we use to protect Personal Information include: a) secured files; b) user authentication; c) encryption; d) firewall technology; and e) the use of detection software.
We are responsible for and must: a) identify information to be protected; b) provide an adequate level of protection for that data; c) grant access to protected data only to those people who must use it in the performance of their job-related duties.
Employees who violate our Privacy Policy will be subject to discipline, which may include ending their employment with us.
At the start of our business relationship, we will give You a copy of our current Privacy Policy.
We will also give You a copy of our current Privacy Policy once a year if You maintain a continuing business relationship with us.
We will continue to follow our Privacy Policy regarding Personal Information even when a business relationship no longer exists between us.
|
As used in this Privacy Notice:
Application means your request for our product or service.
Personal Financial Information means financial information such as: a) credit history; b) income; c) financial benefits; or d) policy or claim information.
Personal Health Information means health information such as: a) your medical records; or b) information about your illness, disability or injury.
Personal Information means information that identifies You personally and is not otherwise available to the public. It includes: a) Personal Financial Information; and b) Personal Health Information.
Transaction means your business dealings with us, such as: a) your Application; b) your request for us to pay a claim; and c) your request for us to take an action on your account.
You means an individual who has given us Personal Information in conjunction with: a) asking about; b) applying for; or c) obtaining; a financial product or service from us if the product or service is used mainly for personal, family, or household purposes. |
This Privacy Policy is being provided on behalf of the following affiliates of The Hartford Financial Services Group, Inc.:
1stAGChoice, Inc.; Access CoverageCorp, Inc.; Access CoverageCorp Technologies, Inc.; American Maturity Life Insurance Company; Archway 60 R, LLC; Business Management Group, Inc.; Champlain Life Reinsurance Company; DMS R, LLC; Eloy R, LLC; Ersatz Corporation; First State Insurance Company; Hartford Accident and Indemnity Company; Hartford Administrative Services Company; Hartford Casualty General Agency, Inc.; Hartford Casualty Insurance Company; Hartford-Comprehensive Employee Benefit Service Company; Hartford Equity Sales Company, Inc.; Hartford Fire General Agency, Inc.; Hartford Fire Insurance Company; Hartford Funds Management Company, LLC; Hartford Funds Management Group, Inc.; Hartford HLS Series Fund II, Inc.; Hartford Insurance Company of Illinois; Hartford Insurance Company of the Midwest; Hartford Insurance Company of the Southeast; Hartford Integrated Technologies, Inc.; Hartford International Life Reassurance Corporation; Hartford Funds Distributors, LLC; Hartford Investment Management Company; Hartford Life and Accident Insurance Company; Hartford Life and Annuity Insurance Company; Hartford Life Insurance Company; Hartford Life Private Placement, LLC; Hartford Lloyd’s Corporation; Hartford Lloyd’s Insurance Company; Hartford Mezzanine Investors I, LLC; Hartford Residual Market, L.C.C.; Hartford Retirement Services, LLC; Hartford Securities Distribution Company, Inc.; Hartford Series Fund, Inc.; Hartford Specialty Insurance Services of Texas, LLC; Hartford Strategic Investments, LLC; Hartford Underwriters Insurance Company; Hartford Technology Services Company, L.L.C.; Hartford of Texas General Agency, Inc.; Hartford Underwriters General Agency, Inc.; HARTRE Company, L.C.C.; HL Investment Advisors, LLC; HLA LLC; Horizon Management Group, LLC; HRA Brokerage Services, Inc.; Lanidex Class B, LLC; M-CAP Insurance Agency, LLC; New England Insurance Company; New England Reinsurance Corporation; Nutmeg Insurance Agency, Inc.; Nutmeg Insurance Company; Pacific Insurance Company, Limited; Planco, LLC: Property and Casualty Insurance Company of Hartford; Revere R, LLC; RVR R, LLC; Sentinel Insurance Company, Ltd.; Sunstone R, LLC; Symphony R, LLC; The Evergreen Group Incorporated; The Hartford Alternative Strategies Fund; The Hartford Mutual Funds, Inc.; The Hartford Mutual Funds II, Inc.; Trumbull Flood Management, L.L.C.; Trumbull Insurance Company; Twin City Fire Insurance Company; White River Life Reinsurance Company.
HPP Revised January 2014
HARTFORDFUNDS
hartfordfunds.com
This information is written in connection with the promotion or marketing of the matter(s) addressed in this material.
This report is submitted for the general information of the shareholders of the Fund. It is not authorized for distribution unless preceded or accompanied by a current prospectus for the Fund.
The information cannot be used or relied upon for the purpose of avoiding IRS penalties. These materials are not intended to provide tax, accounting or legal advice. As with all matters of a tax or legal nature, you should consult your own tax or legal counsel for advice.
Investors should carefully consider the investment objectives, risks, charges, and expenses of Hartford Funds before investing. This and other information can be found in the prospectus and summary prospectus, which can be obtained by calling 888-843-7824 (retail) or 800-279-1541 (institutional). Investors should read them carefully before they invest.
Hartford Funds are underwritten and distributed by Hartford Funds Distributors, LLC.
MFAR-GEI14 12/14 113980-3 Printed in U.S.A.
HARTFORDFUNDS
|
THE HARTFORD
2014 Annual Report
|
A MESSAGE FROM THE PRESIDENT
Dear Fellow Shareholders:
Thank you for investing in Hartford Funds.
Market Review
U.S. equities (as represented by the S&P 500 Index) rose steadily for the fiscal year ended October 31, 2014, with a return of 17.27% for the period. With the exception of short-lived geopolitical scares early in 2014 and concerns about continuing global growth near the end of the period, stocks generally rose on solid fundamentals and encouraging macroeconomic data during the year.
September 2014 marked the six-year anniversary of the start of the financial crisis. Within weeks of that anniversary, both the S&P 500 Index and the Dow Jones Industrial Average set new all-time highs, closing at 2,018 and 17,391, respectively, on October 31. Although the fallout of the crisis continues to influence investor behavior, stocks have recovered and risen dramatically, up 198% from their low in March 2009. Meanwhile, the domestic economy is notching strong growth, and the unemployment rate has reached its lowest level since August 2008.
While the U.S. economy appears to have stabilized and to have reverted to a solid growth path, the outlook for the global economy appears to have gotten cloudier. The U.S. Federal Reserve has ended quantitative easing, while Europe and Japan are pursuing stimulus options to avoid a double-dip recession and deflation, respectively. Diverging central-bank policies will likely continue to play an important role in market movements going forward as investors wait to see the reactions to their efforts and their impacts on global markets.
How have market movements impacted your portfolio throughout the last year? Are your investments still on track to provide the growth or income you need, and are you comfortable with their progress during times of volatility?
Your financial professional can help you navigate today’s markets with confidence, as well as assist you to achieve your investment goals by providing advice on the best options within our fund family to help you work toward overcoming today’s investing challenges. Meet with your financial advisor regularly to examine your portfolio and your investment strategy, and to determine if you’re still on track to meet your goals.
Thank you again for investing with Hartford Funds.
James Davey
President
Hartford Funds
1 The S&P 500 Index is a market capitalization-weighted price index composed of 500 widely held common stocks.
2 The Dow Jones Industrial Average is an unmanaged, price-weighted index of 30 of the largest, most widely held stocks traded on the NYSE
The Hartford Global Real Asset Fund
Table of Contents
The views expressed in the Fund’s Manager Discussion under ‘‘Why did the Fund perform this way?’’ and ‘‘What is the outlook?’’ are views of the Fund’s sub-adviser and portfolio management team through the end of the period and are subject to change based on market and other conditions. The Fund’s Manager Discussion is for informational purposes only and does not represent an offer, recommendation or solicitation to buy, hold or sell any security. The specific securities identified and described, if any, do not represent all of the securities purchased or sold and you should not assume that investments in the securities identified and discussed will be profitable.
| The Hartford Global Real Asset Fund inception 05/28/2010 |
| (sub-advised by Wellington Management Company, LLP) |
| Investment objective – The Fund seeks to provide long-term total returns that outpace inflation over a macroeconomic cycle. |
Performance Overview 5/28/10 - 10/31/14
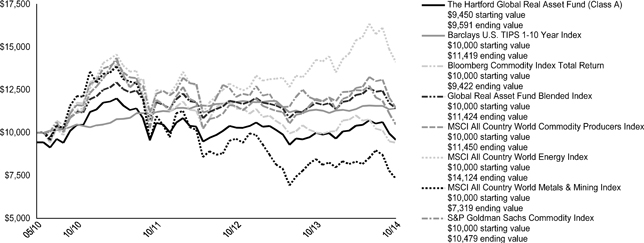
The chart above represents the hypothetical growth of a $10,000 investment in Class A, which includes a sales charge. Growth results in classes other than Class A will vary from what is seen above due to differences in the expenses charged to those share classes.
Average Annual Total Returns (as of 10/31/14)
| 1 Year |
Since Inception▲ | |
| Global Real Asset A# | -4.03% | 0.33% |
| Global Real Asset A## | -9.31% | -0.94% |
| Global Real Asset C# | -4.72% | -0.40% |
| Global Real Asset C## | -5.67% | -0.40% |
| Global Real Asset I# | -3.76% | 0.60% |
| Global Real Asset R3# | -4.20% | 0.11% |
| Global Real Asset R4# | -3.91% | 0.39% |
| Global Real Asset R5# | -3.72% | 0.64% |
| Global Real Asset Y# | -3.58% | 0.70% |
| Barclays U.S. TIPS 1-10 Year Index | 0.60% | 3.04% |
| Bloomberg Commodity Index Total Return | -5.94% | -1.34% |
| Global Real Asset Fund Blended Index | -2.63% | 3.01% |
| MSCI All Country World Commodity Producers Index | -4.45% | 3.10% |
| MSCI All Country World Energy Index | -0.90% | 8.11% |
| MSCI All Country World Metals & Mining Index | -13.52% | -6.81% |
| S&P Goldman Sachs Commodity Index | -12.01% | 1.06% |
| ▲ | Inception: 05/28/2010 |
| # | Without sales charge |
| ## | With sales charge |
PERFORMANCE DATA QUOTED REPRESENTS PAST PERFORMANCE AND DOES NOT GUARANTEE FUTURE RESULTS. The investment return and principal value of the investment will fluctuate so that investors’ shares, when redeemed, may be worth more or less than their original cost. Current performance may be lower or higher than the performance data quoted. To obtain performance data current to the most recent month-end, please visit our website www.hartfordfunds.com.
The initial investment in Class A shares reflects the maximum sales charge of 5.50% and returns for Class C shares reflect a contingent deferred sales charge of up to 1.00% on shares redeemed within twelve months of purchase.
Total returns presented above were calculated using the Fund’s net asset value available to shareholders for sale or redemption of Fund shares on October 31, 2014, which may exclude investment transactions as of this date. All share class returns assume the reinvestment of all distributions at net asset value and the deduction of all fund expenses.
Barclays U.S. TIPS 1-10 Year Index represents securities that protect against adverse inflation and provide a minimum level of real return. To be included in this index, bonds must have cash flows linked to an inflation index, be sovereign issues denominated in U.S. currency, and have maturities of 1 to 10 years.
Bloomberg Commodity Index Total Return (formerly Dow Jones UBS Commodities Index) is composed of commodities traded on U.S. exchanges, with the exception of aluminum, nickel and zinc, which trade on the London Metal Exchange (LME).
Global Real Asset Fund Blended Index is calculated by Hartford Funds Management Company, LLC (HFMC) and represents the weighted return of 55% MSCI All Country World Commodity Producers Index, 35% Barclays U.S. TIPS 1-10 Year Index and 10% Bloomberg Commodity Index Total Return.
MSCI All Country World Commodity Producers Index is a free float-adjusted market capitalization index that is designed to reflect the performance of listed commodity producers across three industry (or sub-industry) categories as defined by the Global Industry Classification Standard (GICS®): energy, metals and agriculture.
MSCI All Country World Energy Index is a free float-adjusted market capitalization-weighted index that is designed to measure the equity market performance of developed and emerging markets in the energy sector.
MSCI All Country World Metals & Mining Index is a free float-adjusted market capitalization-weighted index that is designed to measure the equity market performance of developed and emerging markets in the metals and mining industry.
S&P Goldman Sachs Commodity Index is a measure of general commodity price movements and inflation in the world economy.
The Fund has changed its equity benchmark from the MSCI All Country World Energy Index and MSCI All Country World Metals & Mining Index to the MSCI All Country World Commodity Producers Index. HFMC believes that the MSCI All Country World Commodity Producers Index better reflects the equity component of the Fund’s investment strategy. The Fund has changed its commodity benchmark from the S&P Goldman Sachs Commodity Index to the Dow Jones UBS Commodities Index. HFMC believes that the Dow Jones UBS Commodities Index better reflects the commodity component of the Fund’s investment strategy.
You cannot invest directly in an index.
The chart and table do not reflect the deductions of taxes that a shareholder would pay on Fund distributions or the redemption of Fund shares.
Performance information may reflect historical or current expense waivers/reimbursements from the investment adviser, without which performance would have been lower. For information on current expense waivers/reimbursements, please see the prospectus.
| 2 |
| The Hartford Global Real Asset Fund |
| Manager Discussion |
| October 31, 2014 (Unaudited) |
Operating Expenses*
| Net | Gross | |
| Global Real Asset Class A | 1.37% | 1.54% |
| Global Real Asset Class C | 2.12% | 2.26% |
| Global Real Asset Class I | 1.12% | 1.21% |
| Global Real Asset Class R3 | 1.62% | 1.88% |
| Global Real Asset Class R4 | 1.32% | 1.52% |
| Global Real Asset Class R5 | 1.07% | 1.22% |
| Global Real Asset Class Y | 1.02% | 1.11% |
| * | As shown in the Fund's current prospectus dated March 1, 2014. Actual expenses may be higher or lower. Please see accompanying Consolidated Financial Highlights for expense ratios for the year ended October 31, 2014. |
Gross expenses are the Fund's total annual operating expenses shown in the Fund's most recent prospectus. Net expenses are the Fund's total annual operating expenses shown in the Fund's most recent prospectus and reflect contractual expense waivers/reimbursements in instances when these reductions reduce the Fund's gross expenses. Certain contractual waivers/reimbursements remain in effect until October 31, 2015. Other contractual waivers/reimbursements remain in effect until February 28, 2015, and automatically renew for one-year terms unless terminated.
All investments are subject to risk including the possible loss of principal. For a discussion of the Fund’s risks, please see the Main Risks section of this report. For more detailed information on the risks associated with an investment in the Fund, please see the prospectus.
| Portfolio Managers | |||
| Scott M. Elliott | Brian M. Garvey | Jay Bhutani | Lindsay T. Politi |
| Senior Vice President and Asset Allocation Portfolio Manager |
Vice President and Asset Allocation Portfolio Manager |
Director and Natural Resources Portfolio Manager |
Vice President and Fixed Income Portfolio Manager |
How did the Fund perform?
The Class A shares of The Hartford Global Real Asset Fund returned -4.03%, before sales charge, for the twelve-month period ended October 31, 2014, underperforming the Fund’s custom benchmark* (55% MSCI All Country World Commodity Producers Index, 35% Barclays U.S. TIPS 1–10 Year Index, and 10% Bloomberg Commodity Index Total Return, formerly known as the Dow Jones UBS Commodities Index), which returned -2.63% for the same period. The Fund underperformed the 5.48% average return of the Lipper Flexible Portfolio Funds peer group, a group of funds that allocate their investments across various asset classes, including domestic common stocks, bonds, and money market instruments, with a focus on total return. For the period, the MSCI All Country World Commodity Producers Index returned -4.45%, the Barclays U.S. TIPS 1–10 Year Index returned 0.60%, and the Bloomberg Commodity Index Total Return returned -5.94%
Why did the Fund perform this way?
Global equities rose during the period, notwithstanding bouts of significant volatility. Despite ongoing geopolitical tensions in Ukraine and the Middle East, concerns about a Chinese economic growth slowdown, and unsettling economic and political developments in several other emerging market countries, the five-year-old bull market continued in the first half of 2014. Robust merger and acquisition activity, along with continued accommodative monetary policy from central banks around the globe, aided positive investor sentiment in May and June. However, Portuguese banking woes, European economic malaise, and the prospect of an accelerated U.S. Federal Reserve (Fed) interest-rate-hike timeline all contributed to stall the global stock rally near the tail end of the period. In addition, China's property slump and poor gross domestic product (GDP) readings in Japan and the eurozone raised the specter of a slowdown in global economic growth. Nevertheless, there were several positive developments, including monetary easing by the European Central Bank and the People's Bank of China, as well as an encouraging U.S. corporate earnings season. During the period, emerging market equities underperformed their developed market counterparts and U.S. stocks generally outperformed non-U.S. stocks. Natural resource equities struggled during the period, as energy stocks were challenged in a weakened crude oil price environment towards the latter part of the period, coupled with a continued slowdown in commodities driven in part by slower growth in China. As a result, weak results from both energy companies and metals and mining related companies weighed on returns for global natural resource equities broadly.
Commodities returned -5.94% during the period as represented by Bloomberg Commodity Index Total Return. Industrial metals were the only one of the four commodity sectors to post positive returns. Agriculture and livestock, precious metals commodities, particularly silver and gold, and energy commodities, particularly heating and crude oil, posted negative returns during the period.
Treasury Inflation Protected Securities (TIPS) returns were positive for the twelve months ended October 31, 2014, though TIPS returned less than nominal Treasuries of similar durations. The TIPS curve flattened during the period; consequently, longer dated maturities outperformed shorter maturities. Breakeven inflation rates, which can be regarded as a proxy for the market’s inflation expectations, rose during the early part of the period before falling sharply in the 3rd quarter of 2014 as a strengthening U.S. dollar and falling energy prices weighed on inflation.
The Fund has four primary levers to generate investment performance: inflation-related equity investments, inflation-related fixed income investments, commodity investments, and asset allocation among stocks, bonds, commodities, and cash. In aggregate, security selection was a headwind for the Fund’s performance during this period. Security selection was weakest in the energy and global gas opportunities sub-portfolios; this was
| 3 |
| The Hartford Global Real Asset Fund |
| Manager Discussion – (continued) |
| October 31, 2014 (Unaudited) |
partially offset by stronger selection within metals & mining and commodities. The team’s allocation decisions added value during this period. Our out-of-custom benchmark allocation to inflation-sensitive infrastructure equities, along with underweights to energy and metals & mining equities were additive. An underweight allocation to the portfolio’s safety asset (TIPS) and out-of-custom benchmark allocations to precious metals equities and inflation opportunities proved to be drags on the portfolio.
The commodities sub-portfolio outperformed its custom benchmark due to strong selection within agriculture and livestock as well as precious metals and an underweight to energy. Our marginal cash position within the portfolio also helped. This positive performance was partially offset by weak selection within energy and industrial metals.
Commodities exposure is gained through derivatives, primarily total return swaps and futures. As described above, these derivatives contributed positively to performance relative to the custom benchmark.
What is the outlook?
Our outlook remains constructive as we view this recent market drawdown as a temporary setback towards the manager’s assumption of continued but measured economic healing led by the U.S. along with a continuation of accommodative monetary policy globally. Valuations once again look to us to be quite compelling as a result of the selloff. Using a price-to-marginal cost framework, we believe commodity valuations have reached the most attractive level since June 2009. We will look to opportunistically add to favored asset classes within the Fund.
We ended the period underweight TIPS and overweight commodities and inflation sensitive equities.
* Until February 28, 2014, the custom benchmark consisted of 33% MSCI All Country World Energy Index, 16.5% MSCI All Country World Metals and Mining Index, 5.5% MSCI All Country World Agriculture/Chemicals and Forest, Paper, and Products Index, 35% Barclays U.S. TIPS 1–10 Year Index, and 10% S&P Goldman Sachs Commodity Index (2.5% Precious metals, 2.5% Industry metals, 2.5% Energy, 2.5% Agriculture and Livestock).
| 4 |
| The Hartford Global Real Asset Fund |
| Manager Discussion – (continued) |
| October 31, 2014 (Unaudited) |
| Credit Exposure | ||||
| as of October 31, 2014 | ||||
| Credit Rating * | Percentage of Net Assets | |||
| Aa/ AA | 16.3 | % | ||
| A | 1.2 | |||
| Baa/ BBB | 2.0 | |||
| Not Rated | 1.7 | |||
| Non-Debt Securities and Other Short-Term Instruments | 79.1 | |||
| Other Assets and Liabilities | (0.3 | ) | ||
| Total | 100.0 | % | ||
| * | Credit exposure is the long-term credit ratings for the Fund's holdings, as of the date noted, as provided by Standard and Poor's (S&P) or Moody's Investors Service (Moody's) and typically range from AAA/Aaa (highest) to C/D (lowest). Presentation of S&P and Moody's credit ratings in this report have been selected for informational purposes for shareholders, as well as the Fund's consideration of industry practice. If Moody's and S&P assign different ratings, the lower rating is used. Fixed income securities that are not rated by either agency are listed as "Not Rated." Ratings do not apply to the Fund itself or to the Fund's shares. Ratings may change. |
Diversification by Sector
as of October 31, 2014
| Sector | Percentage of Net Assets | |||
| Equity Securities | ||||
| Consumer Discretionary | 0.4 | % | ||
| Consumer Staples | 2.0 | |||
| Energy | 32.1 | |||
| Financials | 1.8 | |||
| Health Care | 0.1 | |||
| Industrials | 2.5 | |||
| Information Technology | 0.5 | |||
| Materials | 16.2 | |||
| Services | 0.5 | |||
| Utilities | 4.8 | |||
| Total | 60.9 | % | ||
| Foreign Government Obligations | 5.0 | % | ||
| Purchased Options | 0.0 | |||
| U.S. Government Securities | 16.2 | |||
| Short-Term Investments | 18.2 | |||
| Other Assets and Liabilities | (0.3 | ) | ||
| Total | 100.0 | % | ||
A sector may be comprised of several industries. For Fund compliance purposes, the Fund may not use the same classification system and these sector classifications are used for reporting ease.
Diversification by Country
as of October 31, 2014
| Percentage of | ||||
| Country | Net Assets | |||
| Australia | 3.2 | % | ||
| Austria | 0.1 | |||
| Belgium | 0.6 | |||
| Brazil | 3.1 | |||
| Canada | 6.6 | |||
| Cayman Islands | 0.1 | |||
| Chile | 0.0 | |||
| China | 1.8 | |||
| Colombia | 0.0 | |||
| Egypt | 0.0 | |||
| France | 1.8 | |||
| Germany | 0.3 | |||
| Hong Kong | 1.4 | |||
| India | 0.2 | |||
| Indonesia | 0.0 | |||
| Ireland | 0.0 | |||
| Israel | 1.0 | |||
| Italy | 1.6 | |||
| Japan | 2.7 | |||
| Jersey | 0.8 | |||
| Luxembourg | 0.3 | |||
| Mauritius | 0.0 | |||
| Mexico | 1.4 | |||
| Netherlands | 2.7 | |||
| Norway | 0.8 | |||
| Papua New Guinea | 0.0 | |||
| Peru | 0.1 | |||
| Philippines | 0.0 | |||
| Poland | 0.1 | |||
| Portugal | 0.5 | |||
| Russia | 0.9 | |||
| Singapore | 0.2 | |||
| South Africa | 1.0 | |||
| South Korea | 0.8 | |||
| Spain | 0.2 | |||
| Sweden | 0.4 | |||
| Switzerland | 0.7 | |||
| Taiwan | 0.2 | |||
| Thailand | 0.4 | |||
| Turkey | 0.8 | |||
| United Kingdom | 6.9 | |||
| Zambia | 0.0 | |||
| United States | 38.4 | |||
| Short-Term Investments | 18.2 | |||
| Purchased Options | 0.0 | |||
| Other Assets and Liabilities | (0.3 | ) | ||
| Total | 100.0 | % | ||
| 5 |
| The Hartford Global Real Asset Fund |
| Consolidated Schedule of Investments |
| October 31, 2014 |
| (000’s Omitted) |
| Shares or Principal Amount ╬ | Market Value ╪ | |||||||
| Common Stocks - 60.6% | ||||||||
| Automobiles and Components - 0.1% | ||||||||
| 15 | Toyoda Gosei Co., Ltd. | $ | 282 | |||||
| Banks - 0.5% | ||||||||
| 10 | Banca Popolare dell-Emilia Romagna Scrl ● | 78 | ||||||
| 95 | Banco Espirito Santo S.A. ⌂●† | 2 | ||||||
| 13 | Dah Sing Financial Group | 82 | ||||||
| 34 | HSBC Holdings plc | 350 | ||||||
| 8 | KB Financial Group, Inc. | 322 | ||||||
| 59 | Mitsubishi UFJ Financial Group, Inc. | 343 | ||||||
| 18 | Standard Chartered plc | 265 | ||||||
| 8 | Sumitomo Mitsui Financial Group, Inc. | 335 | ||||||
| 33 | UniCredit S.p.A. | 238 | ||||||
| 2,015 | ||||||||
| Capital Goods - 1.9% | ||||||||
| 90 | Beijing Enterprises Holdings Ltd. | 738 | ||||||
| 15 | Caterpillar, Inc. | 1,534 | ||||||
| 2 | CNH Industrial N.V. | 16 | ||||||
| 7 | Compagnie De Saint-Gobain | 320 | ||||||
| 67 | Cosco Corp. Singapore Ltd. | 31 | ||||||
| — | Cummins, Inc. | 20 | ||||||
| 2 | Deere & Co. | 173 | ||||||
| 10 | Hino Motors Ltd. | 145 | ||||||
| — | Hitachi Construction Machine Co., Ltd. | 7 | ||||||
| 45 | Japan Steel Works Ltd. | 161 | ||||||
| 3 | John Bean Technologies Corp. | 79 | ||||||
| 102 | KBR, Inc. | 1,944 | ||||||
| 1 | Komatsu Ltd. | 28 | ||||||
| 34 | Kubota Corp. | 543 | ||||||
| 1 | Man AG | 91 | ||||||
| 2 | PACCAR, Inc. | 137 | ||||||
| 27 | Sembcorp Marine Ltd. | 77 | ||||||
| 38 | Vallourec S.A. | 1,380 | ||||||
| 14 | Vinci S.A. | 776 | ||||||
| 17 | Yangzigiang Shipbuilding Holdings Ltd. | 15 | ||||||
| 8,215 | ||||||||
| Commercial and Professional Services - 0.1% | ||||||||
| 5 | Ceres Global AG Corp. ● | 27 | ||||||
| 5 | Ceres Global AG Corp. Rights | 2 | ||||||
| 5 | En-Japan, Inc. | 86 | ||||||
| 51 | Hays plc | 100 | ||||||
| 8 | USG People N.V. | 78 | ||||||
| 293 | ||||||||
| Diversified Financials - 0.3% | ||||||||
| 8 | Groupe Bruxelles Lambert S.A. | 702 | ||||||
| 4 | Julius Baer Group Ltd. | 172 | ||||||
| 6 | Pico Holdings, Inc. ● | 139 | ||||||
| 15 | UBS AG | 264 | ||||||
| 23 | Uranium Participation Corp. ● | 101 | ||||||
| 1,378 | ||||||||
| Energy - 32.1% | ||||||||
| 34 | Anadarko Petroleum Corp. | 3,139 | ||||||
| 19 | Antero Resources Corp. ● | 993 | ||||||
| 32 | Apache Corp. | 2,478 | ||||||
| 19 | Baker Hughes, Inc. | 1,003 | ||||||
| 1 | Baytex Energy Corp. | 19 | ||||||
| 1,690 | Beach Energy Ltd. | 1,748 | ||||||
| 367 | BG Group plc | 6,113 | ||||||
| 509 | BP plc | 3,661 | ||||||
| 6 | BP plc ADR | 281 | ||||||
| 531 | Buru Energy Ltd. ● | 320 | ||||||
| 104 | Cabot Oil & Gas Corp. | 3,220 | ||||||
| 2 | Cameco Corp. | 36 | ||||||
| 66 | Canacol Energy Ltd. ● | 227 | ||||||
| 3 | Canadian Natural Resources Ltd. ADR | 103 | ||||||
| 2 | Cenovus Energy, Inc. | 50 | ||||||
| 3 | Chesapeake Energy Corp. | 65 | ||||||
| 58 | Chevron Corp. | 6,920 | ||||||
| 930 | China Petroleum & Chemical Corp. Class H | 807 | ||||||
| 3,886 | China Suntien Green Energy | 1,032 | ||||||
| 15 | Cimarex Energy Co. | 1,747 | ||||||
| 90 | Cobalt International Energy, Inc. ● | 1,055 | ||||||
| — | Concho Resources, Inc. ● | 37 | ||||||
| 81 | ConocoPhillips Holding Co. | 5,854 | ||||||
| 43 | Consol Energy, Inc. | 1,565 | ||||||
| 2 | Denbury Resources, Inc. | 21 | ||||||
| 1 | Devon Energy Corp. | 72 | ||||||
| — | Diamond Offshore Drilling, Inc. | 17 | ||||||
| 19 | Diamondback Energy, Inc. ● | 1,309 | ||||||
| 554 | DNO International ASA ● | 1,341 | ||||||
| 47 | Eclipse Resources Corp. ● | 620 | ||||||
| 24 | Enbridge Energy Management | 857 | ||||||
| 143 | Enbridge, Inc. | 6,781 | ||||||
| 19 | EnCana Corp. | 361 | ||||||
| 32 | Energen Corp. | 2,151 | ||||||
| 40 | Energy Resources of Australia Ltd. ● | 46 | ||||||
| 200 | Eni S.p.A. | 4,265 | ||||||
| 3 | Eni S.p.A. ADR | 132 | ||||||
| 1 | Ensco plc | 32 | ||||||
| 44 | EOG Resources, Inc. | 4,219 | ||||||
| 6 | EQT Corp. | 600 | ||||||
| 148 | Exxon Mobil Corp. | 14,272 | ||||||
| 144 | Galp Energia SGPS S.A. | 2,086 | ||||||
| 17 | Golar Ltd. | 974 | ||||||
| 21 | Halliburton Co. | 1,156 | ||||||
| 449 | Harum Energy Tbk PT | 59 | ||||||
| 1 | Hess Corp. | 67 | ||||||
| 1,220 | Hilong Holdings Ltd. | 396 | ||||||
| 1 | HollyFrontier Corp. | 28 | ||||||
| 2 | Husky Energy, Inc. | 45 | ||||||
| 61 | Imperial Oil Ltd. | 2,900 | ||||||
| 55 | Indo Tambangraya Megah PT | 96 | ||||||
| 31 | Inpex Corp. | 395 | ||||||
| 10 | Interoil Corp. ● | 575 | ||||||
| 8 | Japan Petroleum Exploration Co., Ltd. | 275 | ||||||
| 7 | Keyera Corp. | 542 | ||||||
| 29 | Kinder Morgan, Inc. | 1,130 | ||||||
| 428 | Kunlun Energy Co., Ltd. | 568 | ||||||
| 35 | Laredo Petroleum, Inc. ● | 655 | ||||||
| 20 | Legacy Oil + Gas, Inc. ● | 81 | ||||||
| 4 | Lukoil ADR | 211 | ||||||
| 85 | Lundin Petroleum Ab ● | 1,205 | ||||||
| 481 | Madalena Energy, Inc. ● | 134 | ||||||
| 3 | Marathon Oil Corp. | 92 | ||||||
| 1 | Marathon Petroleum Corp. | 81 | ||||||
| 1 | Murphy Oil Corp. | 51 | ||||||
| — | Murphy USA, Inc. ● | 21 | ||||||
| 2 | Nabors Industries Ltd. | 35 | ||||||
| 1 | National Oilwell Varco, Inc. | 65 | ||||||
| 1 | Noble Corp. plc | 17 | ||||||
| 1 | Noble Energy, Inc. | 63 | ||||||
The accompanying notes are an integral part of these financial statements.
| 6 |
| The Hartford Global Real Asset Fund |
| Consolidated Schedule of Investments – (continued) |
| October 31, 2014 |
| (000’s Omitted) |
| Shares or Principal Amount ╬ | Market Value ╪ | |||||||
| Common Stocks - 60.6% - (continued) | ||||||||
| Energy - 32.1% - (continued) | ||||||||
| — | NOW, Inc. ● | $ | 6 | |||||
| 311 | OAO Gazprom Class S ADR | 2,064 | ||||||
| 182 | OAO Rosneft Oil Co. GDR § | 1,015 | ||||||
| 2 | Occidental Petroleum Corp. | 201 | ||||||
| 239 | Oil Search Ltd. | 1,835 | ||||||
| 609 | Ophilr Energy plc ● | 1,810 | ||||||
| 1 | Pacific Rubiales Energy Corp. | 16 | ||||||
| 10 | Painted Pony Petroleum Ltd. ● | 99 | ||||||
| — | Paragon Offshore plc ● | 1 | ||||||
| 40 | Paramount Resources Ltd. ● | 1,681 | ||||||
| 2 | Pembina Pipeline Corp. | 79 | ||||||
| 1,450 | PetroChina Co., Ltd. | 1,815 | ||||||
| 324 | Petroleo Brasileiro S.A. ADR | 3,890 | ||||||
| 1 | Phillips 66 | 113 | ||||||
| 12 | Pioneer Natural Resources Co. | 2,197 | ||||||
| 16 | Prairiesky Royalty Ltd. | 506 | ||||||
| 1 | QEP Resources, Inc. | 26 | ||||||
| 16 | Range Resources Corp. | 1,077 | ||||||
| 12 | Rice Energy, Inc. ● | 327 | ||||||
| 312 | Royal Dutch Shell plc | 11,163 | ||||||
| 9 | Royal Dutch Shell plc ADR | 650 | ||||||
| 3 | Schlumberger Ltd. | 341 | ||||||
| 2 | Seadrill Ltd. | 44 | ||||||
| 11 | Seven Generations Energy Ltd. ●☼ | 228 | ||||||
| — | Seventy Seven Energy, Inc. ● | 3 | ||||||
| 55 | Southwestern Energy Co. ● | 1,794 | ||||||
| 2 | Spectra Energy Corp. | 65 | ||||||
| 4 | Statoilhydro ASA ADR | 89 | ||||||
| 41 | Storm Resources Ltd. ● | 183 | ||||||
| 5 | Suncor Energy, Inc. | 169 | ||||||
| 34 | Talisman Energy, Inc. | 220 | ||||||
| 9 | Targa Resources Corp. | 1,219 | ||||||
| 30 | Technip S.A. | 2,154 | ||||||
| 1 | Tenaris S.A. ADR | 50 | ||||||
| 21 | Total S.A. | 1,230 | ||||||
| 5 | Total S.A. ADR | 323 | ||||||
| 20 | Transcanada Corp. | 984 | ||||||
| 1 | Transocean, Inc. | 31 | ||||||
| 97 | Trican Well Service Ltd. | 868 | ||||||
| 22 | Trilogy Energy Corp. | 345 | ||||||
| 175 | Tullow Oil plc | 1,365 | ||||||
| 1 | Valero Energy Corp. | 68 | ||||||
| 1 | Vermilion Energy, Inc. | 66 | ||||||
| 2 | Weatherford International plc ● | 40 | ||||||
| 20 | Whiting Petroleum Corp. ● | 1,204 | ||||||
| 137,226 | ||||||||
| Food and Staples Retailing - 0.0% | ||||||||
| 3 | Andersons (The), Inc. | 166 | ||||||
| Food, Beverage and Tobacco - 2.0% | ||||||||
| 19 | Adecoagro S.A. ● | 172 | ||||||
| 5 | Anheuser-Busch InBev N.V. ADR | 532 | ||||||
| 48 | Archer-Daniels-Midland Co. | 2,240 | ||||||
| 17 | BRF Brasil Foods S.A. ADR | 433 | ||||||
| 6 | BRF S.A. | 151 | ||||||
| 9 | Bunge Ltd. Finance Corp. | 836 | ||||||
| 214 | Charoen Pokphand Foods Ltd. | 205 | ||||||
| 82 | China Agri-Industries Holdings | 31 | ||||||
| 176 | China Foods Ltd. ● | 66 | ||||||
| 217 | China Modern Dairy Holdings Ltd. ● | 96 | ||||||
| 20 | Cosan Ltd. | 215 | ||||||
| 10 | Dean Foods Co. | 149 | ||||||
| 377 | Golden Agri Resources Ltd. | 153 | ||||||
| 8 | GrainCorp Ltd. | 62 | ||||||
| 5 | Ingredion, Inc. | 393 | ||||||
| 2 | Kraft Foods Group, Inc. | 137 | ||||||
| 5 | Limoneira Co. | 140 | ||||||
| 7 | McLeod Russel India Ltd. | 31 | ||||||
| 2 | MHP S.A. § | 21 | ||||||
| 36 | Minerva S.A. ● | 186 | ||||||
| 1 | Monster Beverage Corp. ● | 60 | ||||||
| 8 | New Britain Palm Oil Ltd. | 82 | ||||||
| 13 | PureCircle Ltd. ● | 120 | ||||||
| 2 | S&W Seed Co. ● | 6 | ||||||
| 12 | SLC Agricola S.A. | 80 | ||||||
| 8 | Suedzucker AG | 116 | ||||||
| 16 | Tate & Lyle plc | 155 | ||||||
| 58 | Treasury Wine Estates Ltd. | 238 | ||||||
| 10 | Tyson Foods, Inc. Class A | 405 | ||||||
| 331 | Wilmar International Ltd. | 825 | ||||||
| 60 | Zambeef Products plc ● | 16 | ||||||
| 8,352 | ||||||||
| Insurance - 0.4% | ||||||||
| 19 | Dai-ichi Life Insurance Co., Ltd. | 283 | ||||||
| 9 | Delta Lloyd N.V. | 209 | ||||||
| 18 | Hanwha Life Insurance Co., Ltd. ● | 141 | ||||||
| 17 | QBE Insurance Group Ltd. | 174 | ||||||
| 526 | Shin Kong Financial Holding Co., Ltd. | 160 | ||||||
| 28 | Storebrand ASA ● | 145 | ||||||
| 28 | T&D Holdings, Inc. | 362 | ||||||
| 8 | Tongyang Life Insurance | 90 | ||||||
| 1,564 | ||||||||
| Materials - 16.2% | ||||||||
| 9 | African Barrick Gold Ltd. | 29 | ||||||
| 6 | African Rainbow Minerals Ltd. ☼ | 79 | ||||||
| 14 | Agnico Eagle Mines Ltd. | 323 | ||||||
| 12 | Agrium, Inc. | 1,179 | ||||||
| 16 | Aichi Steel Corp. | 58 | ||||||
| 15 | Alacer Gold Corp. | 25 | ||||||
| 8 | Alamos Gold, Inc. | 62 | ||||||
| 76 | Alcoa, Inc. | 1,275 | ||||||
| 5 | Alexco Resource ● | 3 | ||||||
| 2 | Allegheny Technologies, Inc. | 72 | ||||||
| 5 | Allied Nevada Gold Corp. ● | 8 | ||||||
| 145 | Alumina Ltd. ●☼ | 209 | ||||||
| 115 | Aluminum Corp. of China Ltd. ● | 51 | ||||||
| 12 | Anglo American Platinum Ltd. ● | 372 | ||||||
| 106 | Anglo American plc | 2,235 | ||||||
| 24 | AngloGold Ltd. ADR | 196 | ||||||
| 22 | Antofagasta plc | 244 | ||||||
| 222 | Aquarius Platinum Ltd. ● | 59 | ||||||
| 53 | ArcelorMittal | 691 | ||||||
| 31 | ArcelorMittal ADR | 408 | ||||||
| 5 | ArcelorMittal South Africa Ltd. ●☼ | 15 | ||||||
| 9 | Argonaut Gold, Inc. ● | 18 | ||||||
| 1 | Asahi Holdings, Inc. | 22 | ||||||
| 7 | Asanko Gold, Inc. ● | 11 | ||||||
| 2 | Assore Ltd. ☼ | 41 | ||||||
| 15 | AuRico Gold, Inc. | 47 | ||||||
| 18 | Avocet Mining plc ● | 1 | ||||||
The accompanying notes are an integral part of these financial statements.
| 7 |
| The Hartford Global Real Asset Fund |
| Consolidated Schedule of Investments – (continued) |
| October 31, 2014 |
| (000’s Omitted) |
| Shares or Principal Amount ╬ | Market Value ╪ | |||||||
| Common Stocks - 60.6% - (continued) | ||||||||
| Materials - 16.2% - (continued) | ||||||||
| 50 | B2Gold Corp. ● | $ | 83 | |||||
| 19 | Banro Corp. ● | 3 | ||||||
| 94 | Barrick Gold Corp. | 1,121 | ||||||
| 47 | Beadell Resources Ltd. ● | 10 | ||||||
| 14 | Belo Sun Mining Corp. ● | 2 | ||||||
| 178 | BHP Billiton Ltd. ☼ | 5,325 | ||||||
| 17 | BHP Billiton Ltd. ADR | 1,036 | ||||||
| 114 | BHP Billiton plc | 2,936 | ||||||
| 16 | BHP Billiton plc ADR | 833 | ||||||
| 15 | Boliden Ab | 245 | ||||||
| 13 | Bradespar S.A. | 88 | ||||||
| 17 | Buzzi Unicem S.p.A. | 228 | ||||||
| 4 | Capital S.A. | 39 | ||||||
| 70 | Centamin plc | 57 | ||||||
| 36 | Centerra Gold, Inc. | 141 | ||||||
| 4 | CF Industries Holdings, Inc. | 1,083 | ||||||
| 9 | China Gold International Resources Corp. ● | 17 | ||||||
| 210 | China Precious Metal Resources Holdings Co., Ltd. ● | 22 | ||||||
| 655 | China Steel Corp. | 565 | ||||||
| 3 | Cliff's Natural Resources, Inc. | 38 | ||||||
| 4 | CNK International Co., Ltd. ⌂●† | 5 | ||||||
| 6 | Coeur Mining, Inc. ● | 22 | ||||||
| — | Colossus Minerals, Inc. ●† | — | ||||||
| 42 | Companhia Sider·rgica Nacional | 140 | ||||||
| 12 | Compania De Minas Buenaventur ADR | 113 | ||||||
| 5 | Continental Gold Ltd. ● | 8 | ||||||
| 9 | CRH plc | 195 | ||||||
| 16 | Daido Steel Co., Ltd. ☼ | 62 | ||||||
| 8 | Detour Gold Corp. ● | 46 | ||||||
| 6 | Dominion Diamond Corp. ● | 79 | ||||||
| 41 | DRDGOLD Ltd. ● | 11 | ||||||
| 7 | Dundee Precious Metals, Inc. ● | 20 | ||||||
| 5 | EcoSynthetix, Inc. ● | 7 | ||||||
| 94 | Eldorado Gold Corp. | 512 | ||||||
| 7 | Endeavor Silver Corp. ● | 23 | ||||||
| 32 | Endeavour Mining Corp. ● | 14 | ||||||
| 86 | Eregli Demir ve Celik Fabrikalari T.A.S. | 179 | ||||||
| 9 | Feng Hsin Iron & Steel Co. | 12 | ||||||
| 8 | First Majestic Silver Corp. ● | 40 | ||||||
| 39 | First Quantum Minerals Ltd. | 592 | ||||||
| 82 | Fortescue Metals Group Ltd. ☼ | 254 | ||||||
| 8 | Fortuna Silver Mines, Inc. ● | 27 | ||||||
| 57 | Fosun International | 67 | ||||||
| 10 | Franco-Nevada Corp. | 470 | ||||||
| 71 | Freeport-McMoRan, Inc. | 2,017 | ||||||
| 12 | Fresnillo plc | 138 | ||||||
| 9 | Fujimi, Inc. | 118 | ||||||
| 17 | Gabriel Resources Ltd. ● | 10 | ||||||
| 9 | Gem Diamonds Ltd. ● | 22 | ||||||
| 51 | Gerdau S.A. | 228 | ||||||
| 559 | Glencore plc | 2,870 | ||||||
| 50 | Gold Fields Ltd. | 162 | ||||||
| 2 | Gold Resource Corp. | 8 | ||||||
| 54 | Goldcorp, Inc. | 1,019 | ||||||
| 18 | Golden Star Resources Ltd. ● | 5 | ||||||
| 4,659 | G-Resources Group Ltd. ● | 114 | ||||||
| 225 | Grupo Mexico S.A.B. de C.V. | 775 | ||||||
| 26 | Gryphon Minerals Ltd. ● | 2 | ||||||
| 7 | Guyana Goldfields, Inc. ● | 15 | ||||||
| 27 | Harmony Gold Mining Co., Ltd. ● | 44 | ||||||
| 22 | Hecla Mining Co. | 48 | ||||||
| 15 | Highland Gold Mining Ltd. | 9 | ||||||
| 56 | Hindalco Industries Ltd. | 149 | ||||||
| 17 | Hitachi Chemical Co., Ltd. | 307 | ||||||
| 10 | Hitachi Metals Ltd. ☼ | 177 | ||||||
| 12 | Hochschild Mining plc ● | 19 | ||||||
| 2 | Holcim Ltd. | 175 | ||||||
| 6 | Holmen AB Class B | 184 | ||||||
| 1 | Hyundai Hysco | 33 | ||||||
| 4 | Hyundai Steel Co. | 251 | ||||||
| 25 | IAMGOLD Corp. ● | 47 | ||||||
| 26 | Iluka Resources Ltd. ☼ | 166 | ||||||
| 73 | Impala Platinum Holdings Ltd. ● | 535 | ||||||
| 10 | Industrias CH S.A. ● | 52 | ||||||
| 9 | Industrias Penoles S.A.B. de C.V. | 214 | ||||||
| 3 | International Paper Co. | 157 | ||||||
| 23 | Israel Chemicals Ltd. | 157 | ||||||
| — | Israel Corp., Ltd. ● | 113 | ||||||
| 3 | Jastrzebska Spolka Weglowa S.A. ● | 22 | ||||||
| 28 | JFE Holdings, Inc. ☼ | 559 | ||||||
| 80 | Jiangxi Copper Co., Ltd. | 142 | ||||||
| 21 | Jindal Steel & Power Ltd. | 55 | ||||||
| 18 | JSR Corp. | 326 | ||||||
| 3 | JSW Steel Ltd. | 71 | ||||||
| 6 | K&S AG | 175 | ||||||
| 8 | KGHM Polska Miedz S.A. | 310 | ||||||
| 11 | Kingsgate Consolidated Ltd. ● | 7 | ||||||
| 20 | Kingsrose Mining Ltd. ● | 6 | ||||||
| 188 | Kinross Gold Corp. ● | 405 | ||||||
| 147 | Kobe Steel Ltd. ☼ | 233 | ||||||
| — | Korea Zinc Co., Ltd. | 180 | ||||||
| 3 | Koza Altin Isletmeleri A.S. | 22 | ||||||
| 5 | Kumba Iron Ore Ltd. ☼ | 119 | ||||||
| 3 | Lafarge S.A. | 176 | ||||||
| 827 | Lepanto Consolidated Mining Co. ● | 6 | ||||||
| 39 | LionGold Corp. Ltd. ● | 1 | ||||||
| 95 | Lonmin plc ● | 268 | ||||||
| 3 | MAG Silver Corp. ● | 17 | ||||||
| 7 | Maruichi Steel Tube Ltd. ☼ | 173 | ||||||
| 11 | McEwen Mining, Inc. ● | 14 | ||||||
| 6 | MeadWestvaco Corp. | 258 | ||||||
| 11 | Medusa Mining Ltd. ● | 6 | ||||||
| 16 | Metalurgica Gerdau S.A. | 87 | ||||||
| 7 | Midas Gold Corp. ● | 3 | ||||||
| 36 | Minera Frisco S.A.B. de C.V. ● | 64 | ||||||
| 62 | Mitsubishi Materials Corp. ☼ | 193 | ||||||
| 100 | Mitsui Chemicals, Inc. | 290 | ||||||
| 16 | MMC Norilsk Nickel OJSC ADR | 296 | ||||||
| 7,140 | Mongolian Mining Corp. ● | 635 | ||||||
| 25 | Monsanto Co. | 2,892 | ||||||
| 18 | Mosaic Co. | 785 | ||||||
| 5 | Neturen Co., Ltd. | 36 | ||||||
| 12 | Nevsun Resources Ltd. | 42 | ||||||
| 32 | New Gold, Inc. ● | 118 | ||||||
| 52 | Newcrest Mining Ltd. ● | 423 | ||||||
| 42 | Newmont Mining Corp. | 788 | ||||||
| 10 | NGEx Resources, Inc. ● | 12 | ||||||
| 418 | Nippon Steel & Sumitomo Metal Corp. ☼ | 1,103 | ||||||
| 5 | Nitto Denko Corp. | 276 | ||||||
The accompanying notes are an integral part of these financial statements.
| 8 |
| The Hartford Global Real Asset Fund |
| Consolidated Schedule of Investments – (continued) |
| October 31, 2014 |
| (000’s Omitted) |
| Shares or Principal Amount ╬ | Market Value ╪ | |||||||
| Common Stocks - 60.6% - (continued) | ||||||||
| Materials - 16.2% - (continued) | ||||||||
| 54 | Norsk Hydro ASA | $ | 303 | |||||
| 14 | North American Palladium Ltd. ● | 2 | ||||||
| 20 | Northern Platinum Ltd. ● | 63 | ||||||
| 21 | Northern Star Resources Ltd. | 21 | ||||||
| 15 | NovaGold Resources, Inc. ● | 36 | ||||||
| 3 | Novolipetsk Steel § | 41 | ||||||
| 22 | Nucor Corp. | 1,175 | ||||||
| 20 | OceanaGold Corp. ● | 33 | ||||||
| 19 | Oji Holdings Corp. | 67 | ||||||
| 3 | Osisko Gold Royalties Ltd. ● | 37 | ||||||
| 5 | OZ Minerals Ltd. ☼ | 16 | ||||||
| 86 | Pan African Resources plc | 16 | ||||||
| 11 | Pan American Silver Corp. | 100 | ||||||
| 10 | Paramount Gold & Silver Corp. ● | 6 | ||||||
| 31 | Perseus Mining Ltd. ● | 8 | ||||||
| 25 | Petra Diamonds Ltd. ● | 65 | ||||||
| 12 | Petropavlovsk plc ● | 4 | ||||||
| 4 | Posco Ltd. | 1,097 | ||||||
| 42 | Potash Corp. of Saskatchewan, Inc. | 1,420 | ||||||
| 9 | Premier Gold Mines Ltd. ● | 14 | ||||||
| 5 | Pretium Resources, Inc. ● | 22 | ||||||
| 5 | Primero Mining Corp. ● | 18 | ||||||
| 513 | PTT Chemical Public Co., Ltd. | 974 | ||||||
| 6 | Randgold Resources Ltd. | 348 | ||||||
| 21 | Regis Resources Ltd. ● | 25 | ||||||
| 225 | Resolute Mining Ltd. ● | 63 | ||||||
| 25 | Rio Tinto Ltd. ☼ | 1,315 | ||||||
| 70 | Rio Tinto plc | 3,312 | ||||||
| 21 | Rio Tinto plc ADR | 993 | ||||||
| 7 | Royal Bafokeng Platinum Ltd. ● | 37 | ||||||
| 4 | Royal Gold, Inc. | 234 | ||||||
| 17 | Rubicon Minerals Corp. ● | 14 | ||||||
| 7 | Salzgitter AG | 222 | ||||||
| 24 | San Gold Corp. ● | 1 | ||||||
| 4 | Sandstorm Gold Ltd. ● | 10 | ||||||
| 2 | Seabridge Gold, Inc. ● | 14 | ||||||
| 18 | Semafo, Inc. ● | 44 | ||||||
| 55 | Sesa Sterlite Ltd. | 231 | ||||||
| 8 | Severstal GDR § | 86 | ||||||
| 150 | Shougang Fushan Resources Group Ltd. | 34 | ||||||
| 49 | Sibanye Gold Ltd. | 92 | ||||||
| 22 | Silver Lake Resources Ltd. ● | 5 | ||||||
| 6 | Silver Standard Resources, Inc. ● | 24 | ||||||
| 24 | Silver Wheaton Corp. | 419 | ||||||
| 11 | Silvercorp Metals, Inc. | 13 | ||||||
| 3 | Sims Metal Management Ltd. ☼ | 34 | ||||||
| 8 | Southern Copper Corp. | 244 | ||||||
| 3 | SSAB AB ● | 24 | ||||||
| 32 | St. Barbara Ltd. ● | 3 | ||||||
| 7 | Stillwater Mining Co. ● | 92 | ||||||
| 51 | Sumitomo Bakelite Co., Ltd. | 201 | ||||||
| 29 | Sumitomo Metal Mining Co., Ltd. ☼ | 407 | ||||||
| 6 | Syngenta AG | 1,769 | ||||||
| 6 | Tahoe Resources, Inc. ● | 101 | ||||||
| 6 | Tanzanian Royalty Exploration Corp. ● | 7 | ||||||
| 18 | Tata Steel Ltd. | 146 | ||||||
| 37 | Teck Cominco Ltd. Class B | 585 | ||||||
| 21 | ThyssenKrupp AG ● | 505 | ||||||
| 7 | Timmins Gold Corp. ● | 7 | ||||||
| 26 | Tokyo Steel Manufacturing Co., Ltd. | 141 | ||||||
| 40 | Torex Gold Resources, Inc. ● | 43 | ||||||
| 26 | Turquoise Hill Resources Ltd. ● | 87 | ||||||
| 32 | Umicore S.A. | 1,245 | ||||||
| 4 | United States Steel Corp. | 169 | ||||||
| 21 | Usinas Siderurgicas De Minas Gerais S.A. ● | 49 | ||||||
| 210 | Vale S.A. | 1,928 | ||||||
| 6 | Vedanta Resources plc | 80 | ||||||
| — | Veritiv Corp. ● | 3 | ||||||
| 6 | Voestalpine AG | 250 | ||||||
| 58 | Yamana Gold, Inc. | 233 | ||||||
| 8 | Yamato Kogyo Co. ☼ | 271 | ||||||
| 16 | Yara International ASA | 732 | ||||||
| 14 | Yodogawa Steel Works Ltd. | 55 | ||||||
| 56 | Zhaojin Mining Industry Co., Ltd. | 30 | ||||||
| 394 | Zijin Mining Group Co., Ltd. | 101 | ||||||
| 69,053 | ||||||||
| Media - 0.2% | ||||||||
| 17 | Comcast Corp. Class A | 952 | ||||||
| Pharmaceuticals, Biotechnology and Life Sciences - 0.1% | ||||||||
| 3 | Evogene Ltd. ● | 33 | ||||||
| 9 | Genus plc | 177 | ||||||
| 1 | Ouro Fino Saude Animal Participacoes S.A. ● | 12 | ||||||
| 9 | Zoetis, Inc. | 338 | ||||||
| 560 | ||||||||
| Real Estate - 0.3% | ||||||||
| 22 | Equity Lifestyle Properties, Inc. REIT | 1,090 | ||||||
| Retailing - 0.1% | ||||||||
| 7 | Adastria Holdings Co., Ltd. | 156 | ||||||
| — | CST Brands, Inc. | 10 | ||||||
| 1 | Shimamura Co., Ltd. | 123 | ||||||
| 9 | XEBIO Co., Ltd. | 133 | ||||||
| 422 | ||||||||
| Semiconductors and Semiconductor Equipment - 0.4% | ||||||||
| 20 | First Solar, Inc. ● | 1,160 | ||||||
| 59 | SCREEN Holdings Co., Ltd. | 322 | ||||||
| 34 | Shinko Electric Industries Co., Ltd. | 198 | ||||||
| 10 | Tokyo Seimitsu Co., Ltd. | 169 | ||||||
| 1,849 | ||||||||
| Software and Services - 0.1% | ||||||||
| 51 | Fujitsu Ltd. | 310 | ||||||
| 4 | Itochu Techno-Solutions Corp. | 155 | ||||||
| 465 | ||||||||
| Telecommunication Services - 0.5% | ||||||||
| 10 | Korea Telecom Corp. | 305 | ||||||
| 56 | NTT DoCoMo, Inc. | 940 | ||||||
| 42 | Telenor ASA | 935 | ||||||
| 2,180 | ||||||||
| Transportation - 0.5% | ||||||||
| 16 | Canadian National Railway Co. | 1,116 | ||||||
| 1 | Flughafen Zuerich AG | 608 | ||||||
| 4 | Hamburger Hafen und Logistik | 97 | ||||||
| 50 | PostNL ● | 214 | ||||||
| 142 | Qantas Airways Ltd. ● | 212 | ||||||
| 2,247 | ||||||||
| Utilities - 4.8% | ||||||||
| 149 | Cheung Kong Infrastructure Holdings Ltd. | 1,088 | ||||||
| 875 | China Longyuan Power Group Corp. | 933 | ||||||
The accompanying notes are an integral part of these financial statements.
| 9 |
| The Hartford Global Real Asset Fund |
| Consolidated Schedule of Investments – (continued) |
| October 31, 2014 |
| (000’s Omitted) |
| Shares or Principal Amount ╬ | Market Value ╪ | |||||||
| Common Stocks - 60.6% - (continued) | ||||||||
| Utilities - 4.8% - (continued) | ||||||||
| 119 | China Resources Gas Group LT | $ | 340 | |||||
| 26 | Cia de Saneamento Basico do Estado de Sao Paulo | 203 | ||||||
| 359 | Enel Green Power S.p.A. | 882 | ||||||
| 192 | ENN Energy Holdings Ltd. | 1,249 | ||||||
| 14 | GDF Suez | 349 | ||||||
| 954 | Guangdong Investment Ltd. | 1,255 | ||||||
| 201 | Hong Kong & China Gas Co., Ltd. | 469 | ||||||
| 16 | Korea Electric Power Corp. | 687 | ||||||
| 95 | National Grid plc | 1,403 | ||||||
| 12 | NextEra Energy, Inc. | 1,214 | ||||||
| 58 | NTPC Ltd. | 143 | ||||||
| 138 | Osaka Gas Co., Ltd. | 551 | ||||||
| 18 | PG&E Corp. | 928 | ||||||
| 90 | Power Assets Holdings Ltd. | 864 | ||||||
| 11 | Red Electrica Corporacion S.A. | 930 | ||||||
| 30 | Severn Trent plc | 950 | ||||||
| 159 | Snam S.p.A. | 858 | ||||||
| 36 | SSE plc | 915 | ||||||
| 61 | Suez Environment S.A. | 1,035 | ||||||
| 681 | Towngas China Co., Ltd. | 715 | ||||||
| 40 | UGI Corp. | 1,506 | ||||||
| 17 | Wisconsin Energy Corp. | 834 | ||||||
| 20,301 | ||||||||
| Total Common Stocks | ||||||||
| (Cost $281,324) | $ | 258,610 | ||||||
| Preferred Stocks - 0.0% | ||||||||
| Utilities - 0.0% | ||||||||
| 17 | Cia Paranaense de Energie | $ | 233 | |||||
| Total Preferred Stocks | ||||||||
| (Cost $264) | $ | 233 | ||||||
| Warrants - 0.0% | ||||||||
| Materials - 0.0% | ||||||||
| 14 | Shandong Denghai ⌂ | $ | 74 | |||||
| Total Warrants | ||||||||
| (Cost $41) | $ | 74 | ||||||
| Exchange Traded Funds - 0.3% | ||||||||
| Other Investment Pools and Funds - 0.3% | ||||||||
| 77 | Market Vectors Gold Miners ETF | $ | 1,319 | |||||
| 1 | Platinum Trust ETF ● | 96 | ||||||
| Total Exchange Traded Funds | ||||||||
| (Cost $1,700) | $ | 1,415 | ||||||
| Foreign Government Obligations - 5.0% | ||||||||
| Brazil - 1.3% | ||||||||
| Brazil (Federative Republic of) | ||||||||
| BRL | 13,450 | 6.00%, 08/15/2016 - 08/15/2030 ◄ | 5,492 | |||||
| $ | 5,492 | |||||||
| Israel - 0.9% | ||||||||
| Israel (State of) | ||||||||
| ILS | 4,746 | 1.00%, 05/30/2017 ◄ | 1,292 | |||||
| ILS | 8,278 | 2.75%, 09/30/2022 - 08/30/2041 ◄ | 2,734 | |||||
| 4,026 | ||||||||
| Mexico - 1.2% | ||||||||
| Mexico (United Mexican States) | ||||||||
| MXN | 18,809 | 2.00%, 06/09/2022 ◄ | 1,373 | |||||
| MXN | 29,181 | 4.00%, 11/15/2040 ◄ | 2,375 | |||||
| MXN | 14,815 | 5.00%, 06/16/2016 ◄ | 1,189 | |||||
| 4,937 | ||||||||
| South Africa - 0.6% | ||||||||
| South Africa (Republic of) | ||||||||
| ZAR | 9,552 | 2.75%, 01/31/2022 ◄ | 937 | |||||
| ZAR | 12,486 | 3.45%, 12/07/2033 ◄ | 1,439 | |||||
| 2,376 | ||||||||
| South Korea - 0.1% | ||||||||
| Korea (Republic of) | ||||||||
| KRW | 575,980 | 1.13%, 06/10/2023 ◄ | 523 | |||||
| Thailand - 0.2% | ||||||||
| Thailand (Kingdom of) | ||||||||
| THB | 22,793 | 1.20%, 07/14/2021 ◄§ | 673 | |||||
| Turkey - 0.7% | ||||||||
| Turkey (Republic of) | ||||||||
| TRY | 6,622 | 2.80%, 11/08/2023 ◄ | 3,216 | |||||
| Total Foreign Government Obligations | ||||||||
| (Cost $21,480) | $ | 21,243 | ||||||
| U.S. Government Securities - 16.2% | ||||||||
| U.S. Treasury Securities - 16.2% | ||||||||
| U.S. Treasury Bonds - 0.2% | ||||||||
| $ | 450 | 2.38%, 01/15/2027 ◄ | $ | 639 | ||||
| U.S. Treasury Notes - 16.0% | ||||||||
| 37,957 | 0.13%, 04/15/2016 - 07/15/2024 ◄‡ | 39,365 | ||||||
| 3,300 | 0.38%, 07/15/2023 ◄ | 3,374 | ||||||
| 8,419 | 0.63%, 07/15/2021 - 01/15/2024 ◄╦Ø | 8,926 | ||||||
| 2,034 | 1.13%, 01/15/2021 ◄ | 2,336 | ||||||
| 1,529 | 1.25%, 07/15/2020 ◄ | 1,780 | ||||||
| 3,823 | 1.38%, 01/15/2020 ◄ | 4,492 | ||||||
| 305 | 1.63%, 01/15/2018 ◄ | 369 | ||||||
| 3,500 | 1.88%, 07/15/2019 ◄ | 4,270 | ||||||
| 455 | 2.13%, 01/15/2019 ◄ | 552 | ||||||
| 2,375 | 2.38%, 01/15/2017 ◄ | 2,992 | ||||||
| 68,456 | ||||||||
| 69,095 | ||||||||
| Total U.S. Government Securities | ||||||||
| (Cost $69,669) | $ | 69,095 | ||||||
| Total Long-Term Investments Excluding Purchased Options | ||||||||
| (Cost $374,478) | $ | 350,670 | ||||||
The accompanying notes are an integral part of these financial statements.
| 10 |
| The Hartford Global Real Asset Fund |
| Consolidated Schedule of Investments – (continued) |
| October 31, 2014 |
| (000’s Omitted) |
| Shares or Principal Amount ╬ | Market Value ╪ | |||||||
| Short-Term Investments - 18.2% | ||||||||
| Repurchase Agreements - 18.2% | ||||||||
| Bank of America Merrill Lynch TriParty Repurchase Agreement (maturing on 11/03/2014 in the amount of $222, collateralized by U.S. Treasury Note 1.50%, 2019, value of $226) | ||||||||
| $ | 222 | 0.08%, 10/31/2014 | $ | 222 | ||||
| Bank of America Merrill Lynch TriParty Repurchase Agreement (maturing on 11/03/2014 in the amount of $3,775, collateralized by GNMA 1.63% - 7.00%, 2031 - 2054, value of $3,851) | ||||||||
| 3,775 | 0.09%, 10/31/2014 | 3,775 | ||||||
| Bank of Montreal TriParty Repurchase Agreement (maturing on 11/03/2014 in the amount of $1,014, collateralized by U.S. Treasury Bond 2.88% - 5.25%, 2029 - 2043, U.S. Treasury Note 0.38% - 4.50%, 2015 - 2022, value of $1,035) | ||||||||
| 1,014 | 0.08%, 10/31/2014 | 1,014 | ||||||
| Bank of Montreal TriParty Repurchase Agreement (maturing on 11/03/2014 in the amount of $3,438, collateralized by FHLMC 2.00% - 5.50%, 2022 - 2034, FNMA 2.00% - 4.50%, 2024 - 2039, GNMA 3.00%, 2043, U.S. Treasury Note 4.63%, 2017, value of $3,507) | ||||||||
| 3,438 | 0.10%, 10/31/2014 | 3,438 | ||||||
| Barclays Capital TriParty Repurchase Agreement (maturing on 11/03/2014 in the amount of $12,956, collateralized by U.S. Treasury Bond 4.50% - 6.25%, 2023 - 2036, U.S. Treasury Note 1.63% - 2.13%, 2015 - 2019, value of $13,215) | ||||||||
| 12,956 | 0.08%, 10/31/2014 | 12,956 | ||||||
| Citigroup Global Markets, Inc. TriParty Repurchase Agreement (maturing on 11/03/2014 in the amount of $14,892, collateralized by U.S. Treasury Bill 0.02%, 2015, U.S. Treasury Bond 3.88% - 11.25%, 2015 - 2040, U.S. Treasury Note 2.00% - 3.38%, 2019 - 2021, value of $15,189) | ||||||||
| 14,892 | 0.09%, 10/31/2014 | 14,892 | ||||||
| Deutsche Bank Securities TriParty Repurchase Agreement (maturing on 11/03/2014 in the amount of $860, collateralized by U.S. Treasury Note 0.88%, 2017, value of $877) | ||||||||
| 860 | 0.13%, 10/31/2014 | 860 | ||||||
| RBS Securities, Inc. TriParty Repurchase Agreement (maturing on 11/03/2014 in the amount of $1,265, collateralized by U.S. Treasury Bond 3.63% - 5.00%, 2037 - 2043, U.S. Treasury Note 2.13%, 2020, value of $1,291) | ||||||||
| 1,265 | 0.07%, 10/31/2014 | 1,265 | ||||||
| Societe Generale TriParty Repurchase Agreement (maturing on 11/03/2014 in the amount of $13,331, collateralized by U.S. Treasury Bill 0.02%, 2015, U.S. Treasury Bond 3.75% - 11.25%, 2015 - 2043, U.S. Treasury Note 1.38% - 4.25%, 2015 - 2022, value of $13,597) | ||||||||
| 13,331 | 0.08%, 10/31/2014 | 13,331 | ||||||
| TD Securities TriParty Repurchase Agreement (maturing on 11/03/2014 in the amount of $25,833, collateralized by FHLMC 3.00% - 4.00%, 2026 - 2044, FNMA 2.50% - 5.00%, 2025 - 2044, U.S. Treasury Bond 3.50% - 6.50%, 2026 - 2041, U.S. Treasury Note 1.75% - 2.88%, 2018 - 2019, value of $26,349) | ||||||||||||
| 25,832 | 0.10%, 10/31/2014 | 25,832 | ||||||||||
| 77,585 | ||||||||||||
| Total Short-Term Investments | ||||||||||||
| (Cost $77,585) | $ | 77,585 | ||||||||||
| Total Investments Excluding Purchased Options | ||||||||||||
| (Cost $452,063) | 100.3 | % | $ | 428,255 | ||||||||
| Total Purchased Options | ||||||||||||
| (Cost $74) | — | % | 57 | |||||||||
| Total Investments | ||||||||||||
| (Cost $452,137) ▲ | 100.3 | % | $ | 428,312 | ||||||||
| Other Assets and Liabilities | (0.3 | )% | (1,384 | ) | ||||||||
| Total Net Assets | 100.0 | % | $ | 426,928 |
The accompanying notes are an integral part of these financial statements.
| 11 |
| The Hartford Global Real Asset Fund |
| Consolidated Schedule of Investments – (continued) |
| October 31, 2014 |
| (000’s Omitted) |
| Note: | Percentage of investments as shown is the ratio of the total market value to total net assets. |
Prices of foreign equities that are principally traded on certain foreign markets may be adjusted daily pursuant to a fair value
pricing service approved by the Board of Directors in order to reflect an adjustment for factors occurring after the close of certain
foreign markets but before the close of the New York Stock Exchange.
The Consolidated Schedule of Investments includes investments held by The Hartford Cayman Global Real Asset Fund, Ltd. (the "Subsidiary"),
a wholly-owned subsidiary of the Fund, which primarily invests in commodity-related instruments. The Fund may invest up to 25%
of its total assets in the Subsidiary. As of October 31, 2014, the Fund invested 21.0% of its total assets in the Subsidiary.
The Fund may refer to any one or more of the industry
classifications used by one or more widely recognized market indices, ratings group indices and/or as defined by Fund management.
Industry classifications may not be identical across all security types.
Other than the industry classifications "Other Investment Pools and Funds" and "Exchange Traded Funds," equity
industry classifications used in this report are the Global Industry Classification Standard, which was developed by and is the
exclusive property and service mark of MSCI, Inc. and Standard & Poor’s.
For Fund compliance purposes, the Fund may not use the same classification system shown in this report as these classifications
are used for reporting ease.
| ▲ | At October 31, 2014, the cost of securities for federal income tax purposes was $465,125 and the aggregate gross unrealized appreciation and depreciation based on that cost were: |
| Unrealized Appreciation | $ | 8,185 | ||
| Unrealized Depreciation | (44,998 | ) | ||
| Net Unrealized Depreciation | $ | (36,813 | ) |
| † | These securities were valued in good faith at fair value as determined under policies and procedures established by and under the supervision of the Board of Directors. At October 31, 2014, the aggregate fair value of these securities was $7, which rounds to zero percent of total net assets. This amount excludes securities that are principally traded in certain foreign markets and whose prices are adjusted pursuant to a third party pricing service methodology approved by the Board of Directors. |
| ● | Non-income producing. |
| ◄ | The principal amount for this security is adjusted for inflation and the interest payments equal a fixed percentage of the inflation-adjusted principal amount. |
| ╬ | All principal amounts are in U.S. dollars unless otherwise indicated. |
| § | These securities were sold to the Fund under Regulation S, rules governing offers and sales made outside the United States without registration under the Securities Act of 1933, as amended. The Fund may only be able to resell these securities in the United States if an exemption from registration under the federal and state securities laws is available, or the Fund may only be able to sell these securities outside of the United States (such as on a foreign exchange) to a non-U.S. person. Unless otherwise indicated, these holdings are determined to be liquid. At October 31, 2014, the aggregate value of these securities was $1,836, which represents 0.4% of total net assets. |
| ⌂ | The following securities are considered illiquid. Illiquid securities are often purchased in private placement transactions, are often not registered under the Securities Act of 1933, as amended, and may have contractual restrictions on resale. A security may also be considered illiquid if the security lacks a readily available market or if its valuation has not changed for a certain period of time. |
| Period Acquired | Shares/ Par | Security | Cost Basis | |||||||
| 05/2014 - 06/2014 | 95 | Banco Espirito Santo S.A. | $ | 105 | ||||||
| 01/2013 - 05/2013 | 4 | CNK International Co., Ltd. | 20 | |||||||
| 09/2012 | 14 | Shandong Denghai Warrants | 41 | |||||||
At October 31, 2014, the aggregate value of these securities was $81, which rounds to zero percent of total net assets.
| ☼ | This security, or a portion of this security, was purchased on a when-issued or delayed-delivery basis. The cost of these securities was $622 at October 31, 2014. |
| ‡ | This security, or a portion of this security, has been segregated to cover funding requirements on investment transactions settling in the future. |
| ╦ | This security, or a portion of this security, has been pledged as collateral in connection with OTC swap contracts. |
| Ø | This security, or a portion of this security, has been pledged as collateral in connection with exchange traded option and/or swaption contracts. |
The accompanying notes are an integral part of these financial statements.
| 12 |
| The Hartford Global Real Asset Fund |
| Consolidated Schedule of Investments – (continued) |
| October 31, 2014 |
| (000’s Omitted) |
Cash pledged and received as collateral in connection with derivatives at October 31, 2014:
| Pledged | Received | |||||||
| Futures contracts | $ | 5,688 | $ | – | ||||
| Total | $ | 5,688 | $ | – | ||||
Exchange Traded Option Contracts Outstanding at October 31, 2014
| Description | Risk Exposure Category | Exercise
Price/ FX Rate/ Rate | Expiration Date | Number
of Contracts * | Market Value ╪ | Premiums Received/Paid by Fund Δ | Unrealized Appreciation (Depreciation) | |||||||||||||||||||
| Purchased option contracts: | ||||||||||||||||||||||||||
| Calls | ||||||||||||||||||||||||||
| Brent Crude Oil Option | CO | 120.00 USD | 11/11/14 | USD | 9 | $ | – | $ | 9 | $ | (9 | ) | ||||||||||||||
| Natural Gas Future Option | CO | 4.50 USD | 01/28/15 | USD | 28 | 48 | 48 | – | ||||||||||||||||||
| Platinum Future Option | CO | 1,350.00 USD | 12/18/14 | USD | 8 | 1 | 8 | (7 | ) | |||||||||||||||||
| Total Calls | 45 | $ | 49 | $ | 65 | $ | (16 | ) | ||||||||||||||||||
| Puts | ||||||||||||||||||||||||||
| Soybean Meal Future Option | CO | 350.00 USD | 11/24/14 | USD | 20 | $ | 8 | $ | 9 | $ | (1 | ) | ||||||||||||||
| Total purchased option contracts | 65 | $ | 57 | $ | 74 | $ | (17 | ) | ||||||||||||||||||
| Written option contracts: | ||||||||||||||||||||||||||
| Calls | ||||||||||||||||||||||||||
| Natural Gas Future Option | CO | 5.00 USD | 01/28/15 | USD | 28 | $ | 29 | $ | 26 | $ | (3 | ) | ||||||||||||||
| Puts | ||||||||||||||||||||||||||
| Gold Option | CO | 1,100.00 USD | 05/26/15 | USD | 4 | $ | 13 | $ | 13 | $ | – | |||||||||||||||
| Total written option contracts | 32 | $ | 42 | $ | 39 | $ | (3 | ) | ||||||||||||||||||
* The number of contracts does not omit 000's.
Δ For purchased options, premiums are paid by the Fund, for written options, premiums are received.
Futures Contracts Outstanding at October 31, 2014
| Number of | Expiration | Notional | Market | Unrealized Appreciation/(Depreciation) | Variation Margin | |||||||||||||||||||||||||
| Description | Contracts* | Date | Amount | Value ╪ | Asset | Liability | Asset | Liability | ||||||||||||||||||||||
| Long position contracts: | ||||||||||||||||||||||||||||||
| Brent Crude Oil Future | 36 | 11/13/2014 | $ | 3,413 | $ | 3,091 | $ | – | $ | (322 | ) | $ | – | $ | (14 | ) | ||||||||||||||
| Brent Oil Future | 6 | 11/13/2015 | 557 | 540 | – | (17 | ) | – | (1 | ) | ||||||||||||||||||||
| Corn Future | 46 | 03/13/2015 | 859 | 895 | 36 | – | 5 | – | ||||||||||||||||||||||
| Electrolytic Copper Future | 6 | 03/16/2015 | 984 | 1,002 | 18 | – | 46 | (28 | ) | |||||||||||||||||||||
| Gas Oil Futures | 32 | 12/11/2014 | 2,738 | 2,372 | – | (366 | ) | – | (18 | ) | ||||||||||||||||||||
| Gold 100oz Future | 18 | 12/29/2014 | 2,344 | 2,109 | – | (235 | ) | – | (49 | ) | ||||||||||||||||||||
| Gold 100oz Future | 40 | 02/25/2015 | 4,997 | 4,690 | – | (307 | ) | – | (108 | ) | ||||||||||||||||||||
| Henry Hub Natural Gas Future | 10 | 12/28/2016 | 109 | 106 | – | (3 | ) | – | – | |||||||||||||||||||||
| Henry Hub Natural Gas Future | 10 | 01/27/2017 | 110 | 106 | – | (4 | ) | – | – | |||||||||||||||||||||
| Henry Hub Natural Gas Future | 10 | 02/24/2017 | 109 | 104 | – | (5 | ) | – | – | |||||||||||||||||||||
| Henry Hub Natural Gas Future | 11 | 03/29/2017 | 120 | 108 | – | (12 | ) | 1 | – | |||||||||||||||||||||
| Henry Hub Natural Gas Future | 11 | 04/26/2017 | 120 | 108 | – | (12 | ) | – | – | |||||||||||||||||||||
| Henry Hub Natural Gas Future | 11 | 05/26/2017 | 120 | 109 | – | (11 | ) | – | – | |||||||||||||||||||||
| Henry Hub Natural Gas Future | 11 | 06/28/2017 | 121 | 110 | – | (11 | ) | – | – | |||||||||||||||||||||
| Henry Hub Natural Gas Future | 11 | 07/27/2017 | 120 | 110 | – | (10 | ) | – | – | |||||||||||||||||||||
| Henry Hub Natural Gas Future | 11 | 08/29/2017 | 120 | 110 | – | (10 | ) | – | – | |||||||||||||||||||||
| Henry Hub Natural Gas Future | 11 | 09/27/2017 | 121 | 111 | – | (10 | ) | – | – | |||||||||||||||||||||
| Henry Hub Natural Gas Future | 11 | 10/27/2017 | 121 | 113 | – | (8 | ) | – | – | |||||||||||||||||||||
| Henry Hub Natural Gas Future | 10 | 11/28/2017 | 110 | 107 | – | (3 | ) | – | – | |||||||||||||||||||||
| Henry Hub Natural Gas Future | 4 | 12/27/2017 | 46 | 44 | – | (2 | ) | – | – | |||||||||||||||||||||
The accompanying notes are an integral part of these financial statements.
| 13 |
| The Hartford Global Real Asset Fund |
| Consolidated Schedule of Investments – (continued) |
| October 31, 2014 |
| (000’s Omitted) |
Futures Contracts Outstanding at October 31, 2014 - (continued)
| Number of | Expiration | Notional | Market | Unrealized Appreciation/(Depreciation) | Variation Margin | |||||||||||||||||||||||||
| Description | Contracts* | Date | Amount | Value ╪ | Asset | Asset | Liability | |||||||||||||||||||||||
| Long position contracts: - (continued) | ||||||||||||||||||||||||||||||
| Henry Hub Natural Gas Future | 4 | 01/29/2018 | $ | 46 | $ | 44 | $ | – | $ | (2 | ) | $ | – | $ | – | |||||||||||||||
| Henry Hub Natural Gas Future | 4 | 02/26/2018 | 45 | 43 | – | (2 | ) | – | – | |||||||||||||||||||||
| Henry Hub Natural Gas Future | 5 | 03/27/2018 | 56 | 50 | – | (6 | ) | – | – | |||||||||||||||||||||
| Henry Hub Natural Gas Future | 5 | 04/26/2018 | 57 | 51 | – | (6 | ) | – | – | |||||||||||||||||||||
| Henry Hub Natural Gas Future | 4 | 05/29/2018 | 46 | 41 | – | (5 | ) | – | – | |||||||||||||||||||||
| Henry Hub Natural Gas Future | 4 | 06/27/2018 | 45 | 41 | – | (4 | ) | – | – | |||||||||||||||||||||
| Henry Hub Natural Gas Future | 4 | 07/27/2018 | 45 | 41 | – | (4 | ) | – | – | |||||||||||||||||||||
| Henry Hub Natural Gas Future | 4 | 08/29/2018 | 45 | 41 | – | (4 | ) | – | – | |||||||||||||||||||||
| Henry Hub Natural Gas Future | 4 | 09/26/2018 | 45 | 41 | – | (4 | ) | – | – | |||||||||||||||||||||
| Henry Hub Natural Gas Future | 4 | 10/29/2018 | 45 | 42 | – | (3 | ) | – | – | |||||||||||||||||||||
| Henry Hub Natural Gas Future | 4 | 11/28/2018 | 46 | 44 | – | (2 | ) | – | – | |||||||||||||||||||||
| Live Cattle Future | 9 | 12/31/2014 | 569 | 598 | 29 | – | – | (5 | ) | |||||||||||||||||||||
| Natural Gas Future | 97 | 12/29/2014 | 4,343 | 3,840 | – | (503 | ) | 52 | – | |||||||||||||||||||||
| Natural Gas Future | 112 | 01/28/2015 | 4,562 | 4,424 | – | (138 | ) | 56 | – | |||||||||||||||||||||
| Natural Gas Future | 10 | 02/25/2015 | 458 | 388 | – | (70 | ) | 5 | – | |||||||||||||||||||||
| Natural Gas Future | 52 | 05/27/2015 | 2,140 | 1,914 | – | (226 | ) | 13 | – | |||||||||||||||||||||
| Natural Gas Future | 13 | 12/29/2015 | 524 | 535 | 11 | – | 2 | – | ||||||||||||||||||||||
| Nickel Future | 18 | 12/15/2014 | 1,016 | 902 | – | (114 | ) | 131 | (245 | ) | ||||||||||||||||||||
| Palladuim Future | 44 | 12/29/2014 | 3,871 | 3,484 | – | (387 | ) | 49 | – | |||||||||||||||||||||
| Platinum Future | 71 | 01/28/2015 | 4,808 | 4,385 | – | (423 | ) | – | (38 | ) | ||||||||||||||||||||
| Primary Aluminum Future | 33 | 12/14/2015 | 1,660 | 1,697 | 37 | – | 80 | (44 | ) | |||||||||||||||||||||
| Primary Nickel Future | 35 | 12/15/2014 | 3,959 | 3,309 | – | (650 | ) | 897 | (1547 | ) | ||||||||||||||||||||
| Soybean Future | 32 | 03/13/2015 | 1,563 | 1,685 | 122 | – | 28 | – | ||||||||||||||||||||||
| Soybean Oil Future | 30 | 01/14/2015 | 583 | 630 | 47 | – | 9 | – | ||||||||||||||||||||||
| Sugar No. 11 Future | 110 | 02/27/2015 | 2,030 | 1,976 | – | (54 | ) | – | (32 | ) | ||||||||||||||||||||
| WTI Crude Future | 58 | 11/20/2014 | 5,436 | 4,671 | – | (765 | ) | – | (34 | ) | ||||||||||||||||||||
| WTI Crude Future | 13 | 02/20/2015 | 1,164 | 1,044 | – | (120 | ) | – | (4 | ) | ||||||||||||||||||||
| WTI Crude Future | 6 | 11/20/2015 | 553 | 482 | – | (71 | ) | – | (1 | ) | ||||||||||||||||||||
| Zinc Future | 42 | 12/15/2014 | 2,471 | 2,427 | – | (44 | ) | 467 | (510 | ) | ||||||||||||||||||||
| Total | $ | 300 | $ | (4,955 | ) | $ | 1,841 | $ | (2,678 | ) | ||||||||||||||||||||
| Short position contracts: | ||||||||||||||||||||||||||||||
| Cocoa Future | 18 | 12/15/2014 | $ | 567 | $ | 522 | $ | 45 | $ | – | $ | 8 | $ | – | ||||||||||||||||
| Feeder Cattle Future | 4 | 11/20/2014 | 450 | 468 | – | (18 | ) | – | – | |||||||||||||||||||||
| Gasoline Future | 6 | 02/27/2015 | 547 | 550 | – | (3 | ) | 3 | – | |||||||||||||||||||||
| Soybean Future | 13 | 01/14/2015 | 678 | 682 | – | (4 | ) | – | (13 | ) | ||||||||||||||||||||
| Soybean Meal Future | 18 | 12/12/2014 | 713 | 700 | 13 | – | – | (16 | ) | |||||||||||||||||||||
| U.S. Treasury 10-Year Note Future | 8 | 12/19/2014 | 1,011 | 1,011 | – | – | 1 | – | ||||||||||||||||||||||
| U.S. Treasury 5-Year Note Future | 13 | 12/31/2014 | 1,553 | 1,552 | 1 | – | 1 | – | ||||||||||||||||||||||
| Wheat Future | 19 | 07/14/2015 | 574 | 532 | 42 | – | 4 | – | ||||||||||||||||||||||
| Total | $ | 101 | $ | (25 | ) | $ | 17 | $ | (29 | ) | ||||||||||||||||||||
| Total futures contracts | $ | 401 | $ | (4,980 | ) | $ | 1,858 | $ | (2,707 | ) | ||||||||||||||||||||
* The number of contracts does not omit 000's.
OTC Interest Rate Swap Contracts Outstanding at October 31, 2014
| Payments made | Payments received | Notional | Expiration | Upfront Premiums | Upfront Premiums | Market | Unrealized Appreciation/(Depreciation) | |||||||||||||||||||||||||
| Counterparty | by Fund | by Fund | Amount | Date | Paid | Received | Value ╪ | Asset | Liability | |||||||||||||||||||||||
| BOA | CLICP Camara | 2.09% Fixed | CLP | 184,550 | 09/28/17 | $ | – | $ | – | $ | 38 | $ | 38 | $ | – | |||||||||||||||||
| DEUT | CLICP Camara | 0.72% Fixed | CLP | 68,750 | 10/30/17 | – | – | – | – | – | ||||||||||||||||||||||
| Total | $ | – | $ | – | $ | 38 | $ | 38 | $ | – | ||||||||||||||||||||||
The accompanying notes are an integral part of these financial statements.
| 14 |
| The Hartford Global Real Asset Fund |
| Consolidated Schedule of Investments – (continued) |
| October 31, 2014 |
| (000’s Omitted) |
OTC Total Return Swap Contracts Outstanding at October 31, 2014
| Notional | Payments received | Expiration | Upfront Premiums | Upfront
Premiums | Market | Unrealized Appreciation/(Depreciation) | ||||||||||||||||||||||||
| Reference Entity | Counterparty | Amount | (paid) by Fund | Date | Paid | Received | Value ╪ | Asset | Liability | |||||||||||||||||||||
| Bloomberg Commodity Index | JPM | USD | 4,449 | (0.09)% Fixed | 04/30/15 | $ | – | $ | – | $ | – | $ | – | $ | – | |||||||||||||||
| Platinum Spot | GSC | USD | 389 | Platinum Spot | 10/30/15 | – | – | (9 | ) | – | (9 | ) | ||||||||||||||||||
| S&P GSCI Industrial Metals | GSC | USD | 401 | (0.10)% Fixed | 05/20/15 | – | – | 6 | 6 | – | ||||||||||||||||||||
| Total | $ | – | $ | – | $ | (3 | ) | $ | 6 | $ | (9 | ) | ||||||||||||||||||
Foreign Currency Contracts Outstanding at October 31, 2014
| Unrealized Appreciation/(Depreciation) | ||||||||||||||||||||||
| Currency | Buy / Sell | Delivery Date | Counterparty | Contract Amount | Market Value ╪ | Asset | Liability | |||||||||||||||
| AUD | Buy | 11/06/2014 | DEUT | $ | 303 | $ | 303 | $ | – | $ | – | |||||||||||
| AUD | Sell | 11/06/2014 | DEUT | 506 | 505 | 1 | – | |||||||||||||||
| BRL | Buy | 11/03/2014 | JPM | 2,233 | 2,167 | – | (66 | ) | ||||||||||||||
| CAD | Buy | 11/04/2014 | BCLY | 21 | 21 | – | – | |||||||||||||||
| CAD | Buy | 11/05/2014 | BCLY | 145 | 144 | – | (1 | ) | ||||||||||||||
| CAD | Buy | 11/05/2014 | RBC | 50 | 50 | – | – | |||||||||||||||
| CAD | Sell | 11/03/2014 | BCLY | 21 | 21 | – | – | |||||||||||||||
| CLP | Buy | 12/17/2014 | BNP | 343 | 353 | 10 | – | |||||||||||||||
| CLP | Buy | 12/17/2014 | BOA | 86 | 86 | – | – | |||||||||||||||
| EUR | Buy | 11/03/2014 | RBC | 580 | 576 | – | (4 | ) | ||||||||||||||
| EUR | Buy | 11/04/2014 | WEST | 81 | 81 | – | – | |||||||||||||||
| GBP | Buy | 11/03/2014 | BMO | 1,613 | 1,613 | – | – | |||||||||||||||
| GBP | Buy | 11/04/2014 | MSC | 448 | 448 | – | – | |||||||||||||||
| GBP | Sell | 11/03/2014 | BMO | 11 | 11 | – | – | |||||||||||||||
| GBP | Sell | 11/04/2014 | MSC | 352 | 352 | – | – | |||||||||||||||
| HKD | Buy | 11/04/2014 | BCLY | 12 | 12 | – | – | |||||||||||||||
| HKD | Buy | 11/03/2014 | UBS | 169 | 169 | – | – | |||||||||||||||
| JPY | Buy | 11/06/2014 | DEUT | 116 | 115 | – | (1 | ) | ||||||||||||||
| JPY | Sell | 11/06/2014 | DEUT | 12 | 12 | – | – | |||||||||||||||
| JPY | Sell | 11/05/2014 | UBS | 40 | 39 | 1 | – | |||||||||||||||
| MXN | Buy | 11/05/2014 | SSG | 37 | 37 | – | – | |||||||||||||||
| MXN | Buy | 11/03/2014 | TDS | 1,935 | 1,928 | – | (7 | ) | ||||||||||||||
| NOK | Buy | 11/04/2014 | BCLY | 12 | 12 | – | – | |||||||||||||||
| PLN | Buy | 11/04/2014 | BCLY | 14 | 14 | – | – | |||||||||||||||
| SEK | Buy | 11/04/2014 | BCLY | 11 | 11 | – | – | |||||||||||||||
| TRY | Buy | 11/04/2014 | BCLY | 8 | 8 | – | – | |||||||||||||||
| TRY | Buy | 11/04/2014 | RBS | 1,211 | 1,206 | – | (5 | ) | ||||||||||||||
| ZAR | Buy | 11/03/2014 | BCLY | 928 | 914 | – | (14 | ) | ||||||||||||||
| ZAR | Buy | 11/07/2014 | BCLY | 10 | 10 | – | – | |||||||||||||||
| Total | $ | 12 | $ | (98 | ) | |||||||||||||||||
| ╪ | See Significant Accounting Policies of accompanying Notes to Consolidated Financial Statements regarding valuation of securities. |
The accompanying notes are an integral part of these financial statements.
| 15 |
| The Hartford Global Real Asset Fund |
| Consolidated Schedule of Investments – (continued) |
| October 31, 2014 |
| (000’s Omitted) |
| GLOSSARY: (abbreviations used in preceding Consolidated Schedule of Investments) | |
| Counterparty Abbreviations: | |
| BCLY | Barclays |
| BMO | Bank of Montreal |
| BNP | BNP Paribas Securities Services |
| BOA | Banc of America Securities LLC |
| DEUT | Deutsche Bank Securities, Inc. |
| GSC | Goldman Sachs & Co. |
| JPM | JP Morgan Chase & Co. |
| MSC | Morgan Stanley |
| RBC | RBC Dominion Securities, Inc. |
| RBS | RBS Greenwich Capital |
| SSG | State Street Global Markets LLC |
| TDS | TD Securities, Inc. |
| UBS | UBS AG |
| WEST | Westpac International |
| Currency Abbreviations: | |
| AUD | Australian Dollar |
| BRL | Brazilian Real |
| CAD | Canadian Dollar |
| CLP | Chilean Peso |
| EUR | EURO |
| GBP | British Pound |
| HKD | Hong Kong Dollar |
| ILS | Israeli New Shekel |
| JPY | Japanese Yen |
| KRW | South Korean Won |
| MXN | Mexican New Peso |
| NOK | Norwegian Krone |
| PLN | Polish New Zloty |
| SEK | Swedish Krona |
| THB | Thai Baht |
| TRY | Turkish New Lira |
| USD | U.S. Dollar |
| ZAR | South African Rand |
| Index Abbreviations: | |
| GSCI | Goldman Sachs Commodity Index |
| S&P | Standard & Poors |
| Other Abbreviations: | |
| ADR | American Depositary Receipt |
| CLICP | Sinacofi Chile Interbank Offered Rate |
| CO | Commodity |
| ETF | Exchange Traded Fund |
| FHLMC | Federal Home Loan Mortgage Corp. |
| FNMA | Federal National Mortgage Association |
| FX | Foreign Exchange |
| GDR | Global Depositary Receipt |
| GNMA | Government National Mortgage Association |
| OTC | Over-the-Counter |
| REIT | Real Estate Investment Trust |
The accompanying notes are an integral part of these financial statements.
| 16 |
| The Hartford Global Real Asset Fund |
| Consolidated Schedule of Investments – (continued) |
| October 31, 2014 |
| (000’s Omitted) |
Consolidated Investment Valuation Hierarchy Level Summary
October 31, 2014
| Total | Level 1 ♦ | Level 2 ♦ | Level 3 | |||||||||||||
| Assets: | ||||||||||||||||
| Common Stocks | ||||||||||||||||
| Automobiles and Components | $ | 282 | $ | – | $ | 282 | $ | – | ||||||||
| Banks | 2,015 | – | 2,013 | 2 | ||||||||||||
| Capital Goods | 8,215 | 3,887 | 4,328 | – | ||||||||||||
| Commercial and Professional Services | 293 | 29 | 264 | – | ||||||||||||
| Diversified Financials | 1,378 | 240 | 1,138 | – | ||||||||||||
| Energy | 137,226 | 91,487 | 45,739 | – | ||||||||||||
| Food and Staples Retailing | 166 | 166 | – | – | ||||||||||||
| Food, Beverage and Tobacco | 8,352 | 6,374 | 1,978 | – | ||||||||||||
| Insurance | 1,564 | – | 1,564 | – | ||||||||||||
| Materials | 69,053 | 30,363 | 38,685 | 5 | ||||||||||||
| Media | 952 | 952 | – | – | ||||||||||||
| Pharmaceuticals, Biotechnology and Life Sciences | 560 | 383 | 177 | – | ||||||||||||
| Real Estate | 1,090 | 1,090 | – | – | ||||||||||||
| Retailing | 422 | 10 | 412 | – | ||||||||||||
| Semiconductors and Semiconductor Equipment | 1,849 | 1,160 | 689 | – | ||||||||||||
| Software and Services | 465 | – | 465 | – | ||||||||||||
| Telecommunication Services | 2,180 | – | 2,180 | – | ||||||||||||
| Transportation | 2,247 | 1,116 | 1,131 | – | ||||||||||||
| Utilities | 20,301 | 4,685 | 15,616 | – | ||||||||||||
| Total | 258,610 | 141,942 | 116,661 | 7 | ||||||||||||
| Exchange Traded Funds | 1,415 | 1,415 | – | – | ||||||||||||
| Foreign Government Obligations | 21,243 | – | 21,243 | – | ||||||||||||
| Preferred Stocks | 233 | 233 | – | – | ||||||||||||
| U.S. Government Securities | 69,095 | 5,148 | 63,947 | – | ||||||||||||
| Warrants | 74 | 74 | – | – | ||||||||||||
| Short-Term Investments | 77,585 | – | 77,585 | – | ||||||||||||
| Purchased Options | 57 | 57 | – | – | ||||||||||||
| Total | $ | 428,312 | $ | 148,869 | $ | 279,436 | $ | 7 | ||||||||
| Foreign Currency Contracts* | $ | 12 | $ | – | $ | 12 | $ | – | ||||||||
| Futures* | 401 | 401 | – | – | ||||||||||||
| Swaps - Interest Rate* | 38 | – | 38 | – | ||||||||||||
| Swaps - Total Return* | 6 | – | 6 | – | ||||||||||||
| Total | $ | 457 | $ | 401 | $ | 56 | $ | – | ||||||||
| Liabilities: | ||||||||||||||||
| Written Options | 42 | 42 | – | – | ||||||||||||
| Total | $ | 42 | $ | 42 | $ | – | $ | – | ||||||||
| Foreign Currency Contracts* | $ | 98 | $ | – | $ | 98 | $ | – | ||||||||
| Futures* | 4,980 | 4,980 | – | – | ||||||||||||
| Swaps - Interest Rate* | – | – | – | – | ||||||||||||
| Swaps - Total Return* | 9 | – | 9 | – | ||||||||||||
| Total | $ | 5,087 | $ | 4,980 | $ | 107 | $ | – | ||||||||
| ♦ | For the year ended October 31, 2014, investments valued at $8,946 were transferred from Level 1 to Level 2, and investments valued at $2,751 were transferred from Level 2 to Level 1. Investments are transferred between Level 1 and Level 2 for a variety of reasons including, but not limited to: |
| 1) | Foreign equities for which a fair value price is more representative of exit value than the local market close (transfer into Level 2). Foreign equities for which the local market close is more representative of exit value (transfer into Level 1). |
| 2) | U.S. Treasury securities that no longer represent the most recent issue (transfer into Level 2). |
| 3) | Equity investments with no observable trading but a bid or mean price is used (transfer into Level 2). Equity investments using observable quoted prices in an active market (transfer into Level 1). |
| * | Derivative instruments (excluding purchased and written options, if applicable) are valued at the unrealized appreciation/depreciation on the investments. |
The accompanying notes are an integral part of these financial statements.
| 17 |
| The Hartford Global Real Asset Fund |
| Consolidated Schedule of Investments – (continued) |
| October 31, 2014 |
| (000’s Omitted) |
Following is a reconciliation of Level 3 assets for which significant unobservable inputs were used to determine fair value:
| Balance
as of October 31, 2013 | Realized Gain (Loss) | Change
in Unrealized Appreciation (Depreciation) | Net Amortization | Purchases | Sales | Transfers Into Level 3 * | Transfers Out of Level 3 * | Balance
as of October 31, 2014 | ||||||||||||||||||||||||||||
| Assets: | ||||||||||||||||||||||||||||||||||||
| Common Stocks | $ | 26 | $ | 2 | $ | (119 | )† | $ | — | $ | 185 | $ | (89 | ) | $ | 29 | $ | (27 | ) | $ | 7 | |||||||||||||||
| Total | $ | 26 | $ | 2 | $ | (119 | ) | $ | — | $ | 185 | $ | (89 | ) | $ | 29 | $ | (27 | ) | $ | 7 | |||||||||||||||
| * | Investments are transferred into and out of Level 3 for a variety of reasons including, but not limited to: |
| 1) | Investments where trading has been halted (transfer into Level 3) or investments where trading has resumed (transfer out of Level 3). |
| 2) | Broker quoted investments (transfer into Level 3) or quoted prices in active markets (transfer out of Level 3). |
| 3) | Investments that have certain restrictions on trading (transfer into Level 3) or investments where trading restrictions have expired (transfer out of Level 3). |
| † | Change in unrealized appreciation (depreciation) in the current period relating to assets still held at October 31, 2014 was $(160). |
| Note: | For purposes of reporting transfers between different hierarchy levels, both transfers in and out of each level, as applicable, are shown as if they occurred at the beginning of the period. |
The accompanying notes are an integral part of these financial statements.
| 18 |
| The Hartford Global Real Asset Fund |
| Consolidated Statement of Assets and Liabilities |
| October 31, 2014 |
| (000’s Omitted) |
| Assets: | ||||
| Investments in securities, at market value (cost $374,552) | $ | 350,727 | ||
| Investments in repurchase agreements, at market value (cost $77,585) | 77,585 | |||
| Cash | 5,688 | * | ||
| Foreign currency on deposit with custodian (cost $58) | 56 | |||
| Unrealized appreciation on foreign currency contracts | 12 | |||
| Unrealized appreciation on OTC swap contracts | 44 | |||
| Receivables: | ||||
| Investment securities sold | 12,150 | |||
| Fund shares sold | 174 | |||
| Dividends and interest | 630 | |||
| Variation margin on financial derivative instruments | 1,858 | |||
| Other assets | 481 | |||
| Total assets | 449,405 | |||
| Liabilities: | ||||
| Unrealized depreciation on foreign currency contracts | 98 | |||
| Unrealized depreciation on OTC swap contracts | 9 | |||
| Bank overdraft | 967 | |||
| Payables: | ||||
| Investment securities purchased | 17,721 | |||
| Fund shares redeemed | 95 | |||
| Investment management fees | 92 | |||
| Administrative fees | — | |||
| Distribution fees | 6 | |||
| Variation margin on financial derivative instruments | 2,707 | |||
| Accrued expenses | 49 | |||
| Written option contracts (proceeds $39) | 42 | |||
| Other liabilities | 691 | |||
| Total liabilities | 22,477 | |||
| Net assets | $ | 426,928 | ||
| Summary of Net Assets: | ||||
| Capital stock and paid-in-capital | $ | 493,594 | ||
| Undistributed net investment income | 975 | |||
| Accumulated net realized loss | (39,213 | ) | ||
| Unrealized depreciation of investments and the translation of assets and liabilities denominated in foreign currency | (28,428 | ) | ||
| Net assets | $ | 426,928 |
* Cash of $5,688 was pledged as collateral for open financial derivative instruments at October 31, 2014.
The accompanying notes are an integral part of these financial statements.
| 19 |
| The Hartford Global Real Asset Fund |
| Consolidated Statement of Assets and Liabilities – (continued) |
| October 31, 2014 |
| (000’s Omitted) |
| Shares authorized | 650,000 | |||
| Par value | $ | 0.001 | ||
| Class A: Net asset value per share/Maximum offering price per share | $9.85/$10.42 | |||
| Shares outstanding | 4,524 | |||
| Net assets | $ | 44,562 | ||
| Class C: Net asset value per share | $ | 9.70 | ||
| Shares outstanding | 1,793 | |||
| Net assets | $ | 17,382 | ||
| Class I: Net asset value per share | $ | 9.87 | ||
| Shares outstanding | 4,779 | |||
| Net assets | $ | 47,168 | ||
| Class R3: Net asset value per share | $ | 9.89 | ||
| Shares outstanding | 28 | |||
| Net assets | $ | 277 | ||
| Class R4: Net asset value per share | $ | 9.88 | ||
| Shares outstanding | 373 | |||
| Net assets | $ | 3,686 | ||
| Class R5: Net asset value per share | $ | 9.89 | ||
| Shares outstanding | 52 | |||
| Net assets | $ | 516 | ||
| Class Y: Net asset value per share | $ | 9.89 | ||
| Shares outstanding | 31,698 | |||
| Net assets | $ | 313,337 |
The accompanying notes are an integral part of these financial statements.
| 20 |
| The Hartford Global Real Asset Fund |
| Consolidated Statement of Operations |
| For the Year Ended October 31, 2014 |
| (000’s Omitted) |
| Investment Income: | ||||
| Dividends | $ | 7,632 | ||
| Interest | 3,250 | |||
| Less: Foreign tax withheld | (530 | ) | ||
| Total investment income | 10,352 | |||
| Expenses: | ||||
| Investment management fees | 5,181 | |||
| Administrative services fees | ||||
| Class R3 | 1 | |||
| Class R4 | 5 | |||
| Class R5 | 1 | |||
| Transfer agent fees | ||||
| Class A | 100 | |||
| Class C | 37 | |||
| Class I | 38 | |||
| Class R3 | — | |||
| Class R4 | — | |||
| Class R5 | — | |||
| Class Y | 6 | |||
| Distribution fees | ||||
| Class A | 140 | |||
| Class C | 226 | |||
| Class R3 | 1 | |||
| Class R4 | 9 | |||
| Custodian fees | 45 | |||
| Accounting services fees | 122 | |||
| Registration and filing fees | 135 | |||
| Board of Directors' fees | 15 | |||
| Audit fees | 38 | |||
| Other expenses | 71 | |||
| Total expenses (before waivers and fees paid indirectly) | 6,171 | |||
| Expense waivers | (735 | ) | ||
| Commission recapture | (7 | ) | ||
| Custodian fee offset | — | |||
| Total waivers and fees paid indirectly | (742 | ) | ||
| Total expenses, net | 5,429 | |||
| Net Investment Income | 4,923 | |||
| Net Realized Gain on Investments, Other Financial Instruments and Foreign Currency Transactions: | ||||
| Net realized gain on investments | 19,187 | |||
| Less: Foreign taxes paid on realized capital gains | (2 | ) | ||
| Net realized loss on futures contracts | (1,681 | ) | ||
| Net realized gain on swap contracts | 53 | |||
| Net realized loss on foreign currency contracts | (684 | ) | ||
| Net realized gain on other foreign currency transactions | 88 | |||
| Net Realized Gain on Investments, Other Financial Instruments and Foreign Currency Transactions | 16,961 | |||
| Net Changes in Unrealized Depreciation of Investments, Other Financial Instruments and Foreign Currency Transactions: | ||||
| Net unrealized depreciation of investments | (32,202 | ) | ||
| Net unrealized depreciation of purchased option contracts | (17 | ) | ||
| Net unrealized depreciation of futures contracts | (4,594 | ) | ||
| Net unrealized depreciation of written option contracts | (3 | ) | ||
| Net unrealized appreciation of swap contracts | 284 | |||
| Net unrealized depreciation of foreign currency contracts | (233 | ) | ||
| Net unrealized appreciation of translation of other assets and liabilities in foreign currencies | 51 | |||
| Net Changes in Unrealized Depreciation of Investments, Other Financial Instruments and Foreign Currency Transactions | (36,714 | ) | ||
| Net Loss on Investments, Other Financial Instruments and Foreign Currency Transactions | (19,753 | ) | ||
| Net Decrease in Net Assets Resulting from Operations | $ | (14,830 | ) |
The accompanying notes are an integral part of these financial statements.
| 21 |
| The Hartford Global Real Asset Fund |
| Consolidated Statement of Changes in Net Assets |
| (000’s Omitted) |
| For the Year Ended October 31, 2014 | For the Year Ended October 31, 2013 | |||||||
| Operations: | ||||||||
| Net investment income | $ | 4,923 | $ | 3,359 | ||||
| Net realized gain (loss) on investments, other financial instruments and foreign currency transactions | 16,961 | (25,576 | ) | |||||
| Net unrealized appreciation (depreciation) of investments, other financial instruments and foreign currency transactions | (36,714 | ) | 3,492 | |||||
| Net Decrease in Net Assets Resulting from Operations | (14,830 | ) | (18,725 | ) | ||||
| Distributions to Shareholders: | ||||||||
| From net investment income | ||||||||
| Class A | (215 | ) | (648 | ) | ||||
| Class I | (443 | ) | (650 | ) | ||||
| Class R3 | (1 | ) | — | |||||
| Class R4 | (19 | ) | (7 | ) | ||||
| Class R5 | (3 | ) | (3 | ) | ||||
| Class Y | (2,904 | ) | (2,499 | ) | ||||
| Total distributions | (3,585 | ) | (3,807 | ) | ||||
| Capital Share Transactions: | ||||||||
| Class A | (23,132 | ) | (41,401 | ) | ||||
| Class C | (10,368 | ) | (22,660 | ) | ||||
| Class I | (16,630 | ) | (6,700 | ) | ||||
| Class R3 | (4 | ) | (1,657 | ) | ||||
| Class R4 | 524 | 304 | ||||||
| Class R5 | 90 | (1,577 | ) | |||||
| Class Y | (48,655 | ) | 133,110 | |||||
| Net increase (decrease) from capital share transactions | (98,175 | ) | 59,419 | |||||
| Net Increase (Decrease) in Net Assets | (116,590 | ) | 36,887 | |||||
| Net Assets: | ||||||||
| Beginning of period | 543,518 | 506,631 | ||||||
| End of period | $ | 426,928 | $ | 543,518 | ||||
| Undistributed (distributions in excess of) net investment income | $ | 975 | $ | 1,775 | ||||
The accompanying notes are an integral part of these financial statements.
| 22 |
| The Hartford Global Real Asset Fund |
| Notes to Consolidated Financial Statements |
| October 31, 2014 |
| (000’s Omitted) |
Organization:
The Hartford Mutual Funds, Inc. (“Company”) is an open-end management investment company comprised of forty-two portfolios. Financial statements for The Hartford Global Real Asset Fund (the "Fund"), a series of the Company, are included in this report.
The Company is organized under the laws of the State of Maryland and is registered with the Securities and Exchange Commission (“SEC”) under the Investment Company Act of 1940, as amended (“1940 Act”). The Fund is a diversified open-end management investment company. The Fund is an investment company and applies specialized accounting and reporting under Accounting Standards Codification Topic 946, Financial Services - Investment Companies.
Class A shares are sold with a front-end sales charge of up to 5.50%. Class C shares are sold with a contingent deferred sales charge of up to 1.00% on shares redeemed within twelve months of purchase. Class I shares are sold without sales charges to certain eligible investors primarily through advisory fee-based wrap programs. Class R3, R4 and R5 shares, which are offered to employer-sponsored retirement plans, and Class Y shares, which are sold to certain eligible institutional investors, are sold without a sales charge. All classes of shares have identical voting, redemption, dividend, liquidation and other rights and the same terms and conditions, with the exceptions that each class may have different expenses, which may affect performance.
Significant Accounting Policies:
The following is a summary of significant accounting policies of the Fund in the preparation of its financial statements, which are in accordance with United States generally accepted accounting principles (“U.S. GAAP”). The preparation of financial statements in accordance with U.S. GAAP may require management to make estimates and assumptions that affect the reported amounts of assets and liabilities and disclosure of contingent assets and liabilities at the date of the financial statements and the reported amounts of increases and decreases in net assets from operations during the reporting period. Actual results could differ from those estimates.
Determination of Net Asset Value – The per share net asset value ("NAV") of each class of the Fund's shares is determined as of the close of regular trading (normally 4:00 p.m. Eastern Time) (the “NYSE Close”) on each day that the New York Stock Exchange (the “Exchange”) is open (“Valuation Date”). Information that becomes known to the Fund after the NAV has been calculated on a particular day will not generally be used to retroactively adjust the NAV determined earlier that day.
Investment Valuation and Fair Value Measurements – For purposes of calculating the NAV, portfolio investments and other assets held by the Fund's portfolio for which market quotes are readily available are valued at market value. Market value is generally determined on the basis of last reported sales prices or official close price. If no sales are reported, market value is based on quotes obtained from a quotation reporting system, established market makers, or independent pricing services. If market prices are not readily available or are deemed unreliable, the Fund will use the fair value of the investment as determined in good faith under policies and procedures established by and under the supervision of the Company's Board of Directors. Market quotes are considered not readily available where there is an absence of current or reliable market-based data (e.g., trade information or indicative market quotes), including where events occur after the close of the relevant market, but prior to the NYSE Close, that materially affect the values of the Fund's portfolio investments or assets. In addition, market quotes are considered not readily available when, due to extraordinary circumstances, the exchanges or markets on which the investments trade do not open for trading for the entire day and no other market prices are available. In addition, prices of foreign equities that are principally traded on certain foreign markets may be adjusted daily pursuant to a fair value pricing service approved by the Board of Directors in order to reflect an adjustment for the factors occurring after the close of certain foreign markets but before the NYSE Close. Investments that are primarily traded on foreign markets may trade on days that are not business days of the Fund. The value of the foreign investments in which the Fund invests may change on days when a shareholder will not be able to purchase or redeem shares of the Fund. Fair value pricing is subjective in nature and the use of fair value pricing by the Fund may cause the NAV of its shares to differ significantly from the NAV that would have been calculated using market prices at the close of the exchange on which a portfolio investment is primarily traded. There can be no assurance that the Fund could obtain the fair market value assigned to an investment if the Fund were to sell the investment at approximately the time at which the Fund determines its NAV.
Fixed income investments (other than short-term obligations), non-exchange traded derivatives and centrally cleared swaps held by the Fund are normally valued on the basis of quotes obtained from independent pricing services or brokers and dealers in accordance
| 23 |
| The Hartford Global Real Asset Fund |
| Notes to Consolidated Financial Statements – (continued) |
| October 31, 2014 |
| (000’s Omitted) |
with procedures established by the Company's Board of Directors. Prices obtained from independent pricing services use information provided by market makers or estimates of market values through accepted market modeling, trading and pricing conventions. Inputs to the models may include, but are not limited to, prepayment speeds, pricing spread, yield, trade information, dealer quotes, market color, cash flow models and the investment’s terms and conditions. Generally, the Fund may use fair valuation in regard to fixed income investments when the Fund holds defaulted or distressed investments or investments in a company in which a reorganization is pending. Short-term investments maturing in 60 days or less are generally valued at amortized cost, if their original term to maturity was 60 days or less, or by amortizing their value on the 61st day prior to maturity, if the original term to maturity exceeded 60 days, which approximates fair value.
Exchange traded options, futures and options on futures are valued at the settlement price or last trade price determined by the relevant exchange as of the NYSE Close. If the last trade price for exchange traded options does not fall between the bid and ask prices, the value will be the mean of the bid and ask prices as of the NYSE Close. If a last trade price is not available, the value will be the mean of the bid and ask prices as of the NYSE Close. If a mean of the bid and ask prices cannot be calculated for the day, the value will be the bid price as of the NYSE Close. In the case of over-the-counter ("OTC") options and such instruments that do not trade on an exchange, values may be supplied by a pricing service using a formula or other objective method that may take into consideration the style, direction, expiration, strike price, notional value and volatility or other special adjustments.
Investments valued in currencies other than U.S. dollars are converted to U.S. dollars using exchange rates obtained from independent pricing services for calculation of the NAV. As a result, the NAV of the Fund’s shares may be affected by changes in the value of currencies in relation to the U.S. dollar. The value of investments traded in markets outside the United States or denominated in currencies other than the U.S. dollar may be affected significantly on a day that the NYSE is closed and the market value may change on days when an investor is not able to purchase, redeem or exchange shares of the Fund.
Foreign currency contracts represent agreements to exchange currencies on specific future dates at predetermined rates. Foreign currency contracts are valued using foreign currency exchange rates and forward rates as provided by an independent pricing service on the Valuation Date.
Financial instruments for which prices are not available from an independent pricing service may be valued using market quotations obtained from one or more dealers that make markets in the respective financial instrument in accordance with procedures established by the Company's Board of Directors.
U.S. GAAP defines fair value as the price that the Fund would receive to sell an asset or pay to transfer a liability in an orderly transaction between market participants. The U.S. GAAP fair value measurement standards require disclosure of a fair value hierarchy for each major category of assets and liabilities. Various inputs are used in determining the fair value of the Fund’s investments. These inputs are summarized into three broad hierarchy levels. This hierarchy is based on whether the valuation inputs are observable or unobservable. These levels are:
Level 1 – Quoted prices in active markets for identical investments. Level 1 may include exchange traded instruments, such as domestic equities, some foreign equities, options, futures, mutual funds, exchange traded funds, rights and warrants.
Level 2 – Observable inputs other than Level 1 prices, such as quoted prices for similar investments; quoted prices in markets that are not active; or other inputs that are observable or can be corroborated by observable market data. Level 2 may include debt investments that are traded less frequently than exchange traded instruments and which are valued using independent pricing services; foreign equities, which are principally traded on certain foreign markets and are adjusted daily pursuant to a fair value pricing service in order to reflect an adjustment for the factors occurring after the close of certain foreign markets but before the NYSE Close; senior floating rate interests, which are valued using an aggregate of dealer bids; short-term investments, which are valued at amortized cost; and swaps, which are valued based upon the terms of each swap contract.
Level 3 – Significant unobservable inputs that are supported by limited or no market activity. Level 3 may include financial instruments whose values are determined using indicative market quotes or require significant management judgment or estimation. These unobservable valuation inputs may include estimates for current yields, maturity/duration, prepayment speed, and indicative market quotes for comparable investments along with other assumptions relating to credit quality, collateral value,
| 24 |
| The Hartford Global Real Asset Fund |
| Notes to Consolidated Financial Statements – (continued) |
| October 31, 2014 |
| (000’s Omitted) |
complexity of the investment structure, general market conditions and liquidity. This category may include investments where trading has been halted or there are certain restrictions on trading. While these investments are priced using unobservable inputs, the valuation of these investments reflects the best available data and management believes the prices are a reasonable representation of exit price.
The Board of Directors of the Company generally reviews and approves the “Procedures for Valuation of Portfolio Securities” at least once a year. These procedures define how investments are to be valued, including the formation and activities of a Valuation Committee. The Valuation Committee is responsible for determining in good faith the fair value of investments when the value cannot be obtained from primary pricing services or alternative sources or if the valuation of an investment as provided by the primary pricing service or alternative source is believed not to reflect the investment’s fair value as of the Valuation Date. Voting members of the Valuation Committee include the Fund's Treasurer or designee and a Vice President of the investment manager or designee. An Assistant Vice President of the Fund with legal expertise or designee is also included on the Valuation Committee as a non-voting advisory member. In addition, the Fund’s Chief Compliance Officer shall designate a member of the compliance group to attend Valuation Committee meetings as a non-voting resource, to monitor for and provide guidance with respect to compliance with these procedures. Two members of the Valuation Committee or their designees, representing different departments, shall constitute a quorum for purposes of permitting the Valuation Committee to take action. The Valuation Committee will consider all relevant factors in determining an investment’s fair value, and may seek the advice of the Fund’s sub-adviser, knowledgeable brokers, and legal counsel in making such determination. The Valuation Committee reports to the Audit Committee of the Company's Board of Directors. The Audit Committee receives quarterly written reports which include details of all fair-valued investments, including the reason for the fair valuation, and an indication, when possible, of the accuracy of the valuation by disclosing the next available reliable public price quotation or the disposition price of such investments (the “look-back” test). The Board of Directors then must consider for ratification all of the fair value determinations made during the previous quarter.
Valuation levels are not necessarily indicative of the risk associated with investing in such investments. Individual investments within any of the above mentioned asset classes may be assigned a different hierarchical level than those presented above, as individual circumstances dictate.
For additional information, refer to the Consolidated Investment Valuation Hierarchy Level Summary and the Level 3 roll-forward reconciliation, if applicable, which follow the Consolidated Schedule of Investments.
Investment Transactions and Investment Income – Investment transactions are recorded as of the trade date (the date the order to buy or sell is executed) for financial reporting purposes. Investments purchased or sold on a when-issued or delayed-delivery basis may be settled a month or more after the trade date. Realized gains and losses are determined on the basis of identified cost.
Dividend income from domestic securities is accrued on the ex-dividend date. In general, dividend income from foreign securities is recorded on the ex-date; however, dividend notifications in certain foreign jurisdictions may not be available in a timely manner and as a result, the Fund will record the dividend as soon as the relevant details (i.e., rate per share, payment date, shareholders of record, etc.) are publicly available. Interest income, including amortization of premium, accretion of discounts and additional principal received in-kind in lieu of cash, is accrued on a daily basis.
Taxes – The Fund may be subject to taxes imposed on realized gains on securities of certain foreign countries in which the Fund invests. The amount of foreign tax expense is included on the accompanying Consolidated Statement of Operations as a reduction to net realized gain on investments in these securities.
Foreign Currency Transactions – Assets and liabilities denominated in currencies other than U.S. dollars are translated into U.S. dollars at the exchange rates in effect on the valuation date. Purchases and sales of investments, income and expenses are translated into U.S. dollars at the exchange rates on the dates of such transactions.
The Fund does not isolate that portion of portfolio investment valuation resulting from fluctuations in the foreign currency exchange rates from the fluctuations arising from changes in the market prices of investments held. Exchange rate fluctuations are included with the net realized and unrealized gain or loss on investments in the accompanying financial statements.
| 25 |
| The Hartford Global Real Asset Fund |
| Notes to Consolidated Financial Statements – (continued) |
| October 31, 2014 |
| (000’s Omitted) |
Net realized foreign exchange gains or losses arise from sales of foreign currencies and the difference between asset and liability amounts initially stated in foreign currencies and the U.S. dollar value of the amounts actually received or paid. Net unrealized foreign exchange gains or losses arise from changes in the value of other assets and liabilities at the end of the reporting period, resulting from changes in the exchange rates.
Joint Trading Account – The Fund may invest cash balances into a joint trading account that may be invested in one or more repurchase agreements.
Fund Share Valuation and Dividend Distributions to Shareholders – Orders for the Fund’s shares are executed in accordance with the investment instructions of the shareholders. The NAV of the Fund’s shares is determined as of the close of business on each business day of the Exchange. The NAV is determined separately for each class of shares of the Fund by dividing the Fund’s net assets attributable to that class by the number of shares of the class outstanding. Each class of shares offered by the Fund has equal rights as to assets and voting privileges (except that shareholders of a class have exclusive voting rights regarding any matter relating solely to that class of shares). Income and non-class specific expenses are allocated daily to each class on the basis of the relative net assets of the class. Realized and unrealized gains and losses are allocated daily based on the relative net assets of each class of shares of the Fund.
Orders for the purchase of the Fund’s shares received prior to the close of the Exchange on any day the Exchange is open for business are priced at the NAV determined as of the close of the Exchange. Orders received after the close of the Exchange, or on a day on which the Exchange and/or the Fund is not open for business, are priced at the next determined NAV.
Dividends are declared pursuant to a policy adopted by the Company's Board of Directors based upon the investment performance of the Fund. The policy of the Fund is to pay dividends from net investment income and realized gains, if any, at least once a year.
Net investment income, dividends and distributions from net realized gains and capital are determined in accordance with federal income tax regulations, which may differ from U.S. GAAP with respect to character and timing (see Federal Income Taxes: Distributions and Components of Distributable Earnings and Reclassification of Capital Accounts).
Basis for Consolidation – The Fund may invest up to 25% of its total assets in a wholly-owned subsidiary of the Fund. The Subsidiary is organized under the laws of the Cayman Islands and is consolidated in the Fund’s financial statements. All intercompany balances, revenues, and expenses have been eliminated in consolidation. The Subsidiary acts as an investment vehicle in order to enter into certain investments (primarily commodities) for the Fund, consistent with the investment objectives and policies specified in the Prospectus and Statement of Additional Information.
Securities and Other Investments:
Repurchase Agreements – A repurchase agreement is an agreement by which a counterparty agrees to sell an investment and agrees to repurchase the investment sold from the buyer at a mutually agreed upon time and price. During the period of the repurchase agreement, the counterparty will deposit cash and or securities in a third party custodial account to serve as collateral. At the time the Fund enters into a repurchase agreement, the value of the underlying collateral, including accrued interest, will be equal to or exceed the value of the repurchase agreement. Repurchase agreements expose the Fund to counterparty risk - that is, the risk that the counterparty will not fulfill its obligations. To minimize counterparty risk, the investments that serve to collateralize the repurchase agreement are held by the Fund’s custodian in book entry or physical form in the custodial account of the Fund or in a third party custodial account. Repurchase agreements are valued at cost plus accrued interest, which approximates fair value. Repurchase agreements have master netting arrangements which allow the Fund to offset amounts owed to a counterparty with amounts owed by the counterparty, including any collateral. Upon an event of default under a master repurchase agreement, the non-defaulting party may close out all transactions traded under such agreement and net amounts owed under each transaction to one net amount payable by one party to the other. Absent an event of default, the master repurchase agreement does not result in an offset of reported amounts of assets and liabilities in the Consolidated Statement of Assets and Liabilities across transactions between the Fund and the applicable counterparty. The Fund, as shown on the Consolidated Schedule of Investments, had outstanding repurchase agreements and related collateral as of October 31, 2014.
| 26 |
| The Hartford Global Real Asset Fund |
| Notes to Consolidated Financial Statements – (continued) |
| October 31, 2014 |
| (000’s Omitted) |
Illiquid and Restricted Investments – The Fund is permitted to invest up to 15% of its net assets in illiquid investments. Illiquid investments are those that may not be sold or disposed of in the ordinary course of business within seven days, at approximately the price used to determine the Fund’s NAV. The Fund may not be able to sell illiquid investments when its sub-adviser considers it desirable to do so or may have to sell such investments at a price that is lower than the price that could be obtained if the investments were more liquid. A sale of illiquid investments may require more time and may result in higher dealer discounts and other selling expenses than does the sale of those that are liquid. Illiquid investments also may be more difficult to value due to the unavailability of reliable market quotations for such investments, and an investment in them may have an adverse impact on the Fund’s NAV. The Fund may also purchase certain restricted investments that can only be resold to certain qualified investors and may be determined to be liquid pursuant to policies and guidelines established by the Company's Board of Directors. The Fund, as shown on the Consolidated Schedule of Investments, had illiquid or restricted investments as of October 31, 2014.
Investments Purchased on a When-Issued or Delayed-Delivery Basis – Delivery and payment for investments that have been purchased by the Fund on a forward commitment, or when-issued or delayed-delivery basis, take place beyond the customary settlement period. The Fund may dispose of or renegotiate a delayed-delivery transaction after it is entered into, and may sell delayed-delivery investments before they are delivered, which may result in a realized gain or loss. During this period, such investments are subject to market fluctuations, and the Fund identifies investments segregated in its records with a value at least equal to the amount of the commitment. The Fund, as shown on the Consolidated Schedule of Investments, had when-issued or delayed-delivery investments as of October 31, 2014.
Inflation Indexed Bonds – The Fund may invest in inflation indexed bonds. Inflation indexed bonds are fixed income investments whose principal value is periodically adjusted to the rate of inflation. The interest rate on these bonds is generally fixed at issuance at a rate lower than typical bonds. Over the life of an inflation indexed bond, however, interest will be paid based on a principal value, which is adjusted for inflation. Any increase or decrease in the principal amount of an inflation indexed bond will be included as interest income on the Consolidated Statement of Operations, even though investors do not receive the principal amount until maturity. The Fund, as shown on the Consolidated Schedule of Investments, had inflation indexed bonds as of October 31, 2014.
Financial Derivative Instruments:
The following disclosures contain information on how and why the Fund uses derivative instruments, the credit-risk-related contingent features in certain derivative instruments and how derivative instruments affect the Fund’s financial position and results of operations. The location and fair value amounts of these instruments on the Consolidated Statement of Assets and Liabilities and the realized gains and losses and changes in unrealized gains and losses on the Consolidated Statement of Operations, each categorized by type of derivative contract, are included in the following Additional Derivative Instrument Information footnote. The derivative instruments outstanding as of year-end are disclosed in the notes to the Consolidated Schedule of Investments, if applicable. The amounts of realized gains and losses and changes in unrealized gains and losses on derivative instruments during the year are disclosed in the Consolidated Statement of Operations.
Foreign Currency Contracts – The Fund may enter into foreign currency contracts that obligate the Fund to purchase or sell currencies at specified future dates. Foreign currency contracts are used to hedge the currency exposure associated with some or all of the Fund’s investments and/or as part of an investment strategy. Foreign currency contracts are marked to market daily and the change in value is recorded by the Fund as an unrealized gain or loss. The Fund will record a realized gain or loss when the foreign currency contract is settled.
Foreign currency contracts involve elements of market risk in excess of the amounts reflected in the Consolidated Statement of Assets and Liabilities. In addition, risks may arise upon entering into these contracts from the potential inability of the counterparties to meet the terms of the contracts and from unanticipated movements in the value of the foreign currencies relative to the U.S. dollar. The Fund, as shown on the Consolidated Schedule of Investments, had outstanding foreign currency contracts as of October 31, 2014.
| 27 |
| The Hartford Global Real Asset Fund |
| Notes to Consolidated Financial Statements – (continued) |
| October 31, 2014 |
| (000’s Omitted) |
Futures Contracts – The Fund may enter into futures contracts. A futures contract is an agreement between two parties to buy or sell an asset at a set price on a future date. The Fund uses futures contracts to manage or obtain exposure to the investment markets, commodities, or movements in interest rates and currency values. The primary risks associated with the use of futures contracts are the imperfect correlation between the change in market value of the investments held by the Fund and the prices of futures contracts and the possibility of an illiquid market. Upon entering into a futures contract, the Fund is required to deposit with a futures commission merchant (“FCM”) an amount of cash or U.S. Government or Agency Obligations in accordance with the initial margin requirements of the broker or exchange. Futures contracts are marked to market daily at the most recent settlement price reported by an exchange on which, over time, they are traded most extensively, and an appropriate payable or receivable for the change in value (“variation margin”) is recorded by the Fund. Gains or losses are recognized but not considered realized until the contracts expire or are closed. Futures contracts involve, to varying degrees, risk of loss in excess of the variation margin disclosed on the Consolidated Statement of Assets and Liabilities; however, the Fund seeks to reduce this risk through the use of an FCM. The Fund, as shown on the Consolidated Schedule of Investments, had outstanding futures contracts as of October 31, 2014.
Options Contracts – An option contract is a contract sold by one party to another party that offers the buyer the right, but not the obligation, to buy (call) or sell (put) an investment or other financial asset at an agreed-upon price during a specific period of time or on a specific date. Options contracts are either privately negotiated in the over-the-counter market ("OTC options") or executed in a registered exchange ("exchange traded options"). The Fund may write (sell) covered call and put options on futures, swaps (“swaptions”), securities, commodities or currencies. “Covered” means that so long as the Fund is obligated as the writer of an option, it will own either the underlying investments or currency or an option to purchase the same underlying investments or currency having an expiration date of the covered option and an exercise price equal to or less than the exercise price of the covered option, or will pledge cash or other liquid investments having a value equal to or greater than the fluctuating market value of the option investment or currency. Writing put options increases the Fund’s exposure to the underlying instrument. Writing call options decreases the Fund’s exposure to the underlying instrument. Premiums received from writing options that expire are treated as realized gains. Premiums received from writing options that are exercised or closed are added to the proceeds or offset amounts paid on the underlying futures, swap, investment or currency transaction to determine the realized gain or loss. The Fund as a writer of an option has no control over whether the underlying instrument may be sold (call) or purchased (put) and as a result bears the market risk of an unfavorable change in the price of the instrument underlying the written option. There is the risk the Fund may not be able to enter into a closing transaction because of an illiquid market. The Fund may also purchase put and call options. Purchasing call options increases the Fund’s exposure to the underlying instrument. Purchasing put options decreases the Fund’s exposure to the underlying instrument. The Fund pays a premium, which is included on the Fund’s Consolidated Statement of Assets and Liabilities as an investment and is subsequently marked to market to reflect the current value of the option. Premiums paid for purchasing options that expire are treated as realized losses. Certain options may be purchased with premiums to be determined on a future date. The premiums for these options are based upon implied volatility parameters at specified terms. The risk associated with purchasing put and call options is generally limited to the premium paid. Premiums paid for purchasing options that are exercised or closed are added to the amounts paid or offset against the proceeds on the underlying investment transaction to determine the realized gain or loss. Entering into over-the-counter options also exposes the Fund to counterparty risk. Counterparty risk is the possibility that the counterparty to the agreements may default on its obligation to perform or disagree as to the meaning of the contractual terms in the agreements.
The Fund, as shown on the Consolidated Schedule of Investments, had outstanding purchased and written option contracts as of October 31, 2014. Transactions involving written option contracts during the year ended October 31, 2014, are summarized below:
| 28 |
| The Hartford Global Real Asset Fund |
| Notes to Consolidated Financial Statements – (continued) |
| October 31, 2014 |
| (000’s Omitted) |
Options Contract Activity During the Year Ended October 31, 2014:
| Call Options Written During the Year | Number of Contracts* | Premium Amounts | ||||||
| Beginning of the period | — | $ | — | |||||
| Written | 28 | 26 | ||||||
| Expired | — | — | ||||||
| Closed | — | — | ||||||
| Exercised | — | — | ||||||
| End of period | 28 | $ | 26 | |||||
| Put Options Written During the Year | Number of Contracts* | Premium Amounts | ||||||
| Beginning of the period | — | $ | — | |||||
| Written | 4 | 13 | ||||||
| Expired | — | — | ||||||
| Closed | — | — | ||||||
| Exercised | — | — | ||||||
| End of period | 4 | $ | 13 | |||||
| * | The number of contracts does not omit 000's. |
Swap Contracts – The Fund may invest in swap contracts. Swap contracts are agreements to exchange or swap investment cash flows, assets, foreign currencies or market-linked returns at specified, future intervals. Swap contracts are either privately negotiated in the over-the-counter market (“OTC swaps”) or cleared in a central clearing house (“centrally cleared swaps”). The Fund may enter into credit default, total return, cross-currency, interest rate, inflation and other forms of swap contracts to manage its exposure to credit, currency, interest rate, commodity and inflation risk. Swap contracts are also used to gain exposure to certain markets. In connection with these contracts, investments or cash may be identified as collateral or margin in accordance with the terms of the respective swap contracts and/or master netting arrangement to provide assets of value and recourse in the event of default or bankruptcy/insolvency.
Swaps are valued based on custom valuations furnished by an independent pricing service. Swaps for which prices are not available from an independent pricing service are valued in accordance with procedures established by the Company's Board of Directors. Changes in market value, if any, are reflected as a component of net changes in unrealized appreciation or depreciation on the Consolidated Statement of Operations. Daily changes in valuation of centrally cleared swaps, if any, are recorded as a receivable or payable for the change in value (“variation margin”) on the Consolidated Statement of Assets and Liabilities. Realized gains or losses on centrally cleared swaps are recorded upon the termination of the swap. OTC swap payments received or paid at the beginning of the measurement period are reflected as such on the Consolidated Statement of Assets and Liabilities and represent premiums paid or received upon entering into the swap contract to compensate for differences between the stated terms of the swap contract and prevailing market conditions (credit spreads, currency exchange rates, interest rates and other relevant factors). These upfront premiums are recorded as realized gains or losses on the Consolidated Statement of Operations upon termination or maturity of the swap. A liquidation payment received or made at the termination or maturity of the swap is recorded as a realized gain or loss on the Consolidated Statement of Operations. Net periodic payments received or paid by the Fund are included as part of realized gains or losses on the Consolidated Statement of Operations.
Entering into these contracts involves, to varying degrees, elements of liquidation, counterparty, credit and market risk in excess of the amounts recognized on the Consolidated Statement of Assets and Liabilities. Such risks involve the possibility that there will be no liquid market for these contracts, that the counterparty to the contracts may default on its obligation to perform or disagree as to the meaning of contractual terms in the contracts, and that there may be unfavorable changes in market conditions (credit spreads, currency exchange rates, interest rates and other relevant factors).
The Fund’s maximum risk of loss from counterparty risk for OTC swaps is the net value of the discounted cash flows to be received from the counterparty over the contract’s remaining life, and current market value, to the extent that amount is positive. The risk is mitigated by having a master netting arrangement between the Fund and the counterparty, which allows for the netting of payments made or received (although such amounts are presented on a gross basis within the Consolidated Statement of Assets and Liabilities, as applicable) as well as the posting of collateral to the Fund to cover the Fund’s exposure to the counterparty. In a centrally cleared swap, while the Fund enters into an agreement with a clearing broker to execute contracts with a counterparty, the performance of the swap is guaranteed by the central clearinghouse, which reduces the Fund’s exposure to counterparty risk. The Fund is still exposed to
| 29 |
| The Hartford Global Real Asset Fund |
| Notes to Consolidated Financial Statements – (continued) |
| October 31, 2014 |
| (000’s Omitted) |
the counterparty risk through the clearing broker and clearinghouse. The clearinghouse attempts to minimize this risk to its participants through the use of mandatory margin requirements, daily cash settlements and other procedures. Likewise, the clearing broker reduces its risk through margin requirements and required segregation of customer balances.
Interest Rate Swap Contracts – The Fund is subject to interest rate risk exposure in the normal course of pursuing its investment objectives. Because the Fund holds fixed rate bonds, the value of these bonds may decrease if interest rates rise. To hedge against this risk and to maintain its ability to generate income at prevailing market rates, the Fund may enter into interest rate swap contracts. In a typical interest rate swap, one party agrees to make regular payments equal to a floating interest rate, based on a specified interest rate or benchmark (e.g. London Interbank Offered Rate (“LIBOR”)), multiplied by a notional amount, in return for payments equal to a fixed rate multiplied by the same amount, for a specific period of time. The net interest received or paid on interest rate swap contracts is recorded as a realized gain or loss. Interest rate swaps are marked to market daily and the change, if any, is recorded as an unrealized gain or loss in the Consolidated Statement of Operations. When the interest rate swap contract is terminated early, the Fund records a realized gain or loss equal to the difference between the current market value and the upfront premium or cost.
If an interest rate swap contract provides for payments in different currencies, the parties might agree to exchange the notional amount as well. Interest rate swaps may also depend on other prices or rates, such as the value of an index. The risks of interest rate swaps include changes in market conditions which will affect the value of the contract or the cash flows and the possible inability of the counterparty to fulfill its obligations under the contract. The Fund’s maximum risk of loss from counterparty credit risk is the discounted net value of the cash flows to be received from the counterparty over the contract’s remaining life, to the extent that amount is positive. The Fund, as shown on the Consolidated Schedule of Investments, had outstanding interest rate swap contracts as of October 31, 2014.
Total Return Swap Contracts – The Fund may invest in total return swap contracts. An investment in a total return swap allows the Fund to gain or mitigate exposure to underlying referenced securities, indices or commodities. Total return swap contracts involve commitments where cash flows are exchanged based on the price of underlying securities, indices or commodities and based on a fixed or variable rate. One party would receive payments based on the price appreciation or depreciation of a commodity index, a portion of the index, or a single commodity in exchange for paying to or receiving from the counterparty seller an agreed-upon rate, which can be fixed or variable. A variable rate may be correlated to a base rate, such as the LIBOR, and is adjusted each reset period, which are defined at the beginning of the contract. Therefore, if interest rates increase over the term of the swap contract, the party paying the rate may be required to pay a higher rate at each swap reset date.
Total return swap contracts on indices involve commitments to pay interest in exchange for a market-linked return. One party pays out the total return of a specific reference asset, which may be an equity, index, or bond, and in return receives a regular stream of payments. To the extent the total return of the security or index underlying the transaction exceeds or falls short of the offsetting interest rate obligation, the Fund will receive a payment from or make a payment to the counterparty. The Fund, as shown on the Consolidated Schedule of Investments, had outstanding total return swap contracts as of October 31, 2014.
The prices of commodity-linked derivative securities may move in different directions from investments in traditional equity and debt securities when the value of those traditional securities is declining due to adverse economic conditions. As an example, during periods of rising inflation, debt securities have historically tended to decline in value due to the general increase in prevailing interest rates. Conversely, during those same periods of rising inflation, prices of certain commodities, such as oil and metals, have historically tended to increase. There cannot be any guarantee that these investments will perform in that manner in the future, and at certain times the price movements of commodity-linked instruments have followed those of debt and equity securities. Commodities have historically tended to increase and decrease in value during different parts of the business cycle than financial assets. Nevertheless, at various times, commodities prices may move in tandem with prices of financial assets and thus may not provide overall portfolio diversification benefits. Exposure to commodity-linked derivatives is generally achieved through total return swaps, futures or options.
| 30 |
| The Hartford Global Real Asset Fund |
| Notes to Consolidated Financial Statements – (continued) |
| October 31, 2014 |
| (000’s Omitted) |
Additional Derivative Instrument Information:
Fair Value of Derivative Instruments on the Consolidated Statement of Assets and Liabilities as of October 31, 2014:
| Risk Exposure Category | ||||||||||||||||||||||||||||
| Interest
Rate Contracts | Foreign Exchange Contracts | Credit Contracts | Equity Contracts | Commodity Contracts | Other Contracts | Total | ||||||||||||||||||||||
| Assets: | ||||||||||||||||||||||||||||
| Investments in securities, at value (purchased option contracts), market value | $ | — | $ | — | $ | — | $ | — | $ | 57 | $ | — | $ | 57 | ||||||||||||||
| Unrealized appreciation on foreign currency contracts | — | 12 | — | — | — | — | 12 | |||||||||||||||||||||
| Unrealized appreciation on OTC swap contracts | 38 | — | — | — | 6 | — | 44 | |||||||||||||||||||||
| Variation margin receivable * | 2 | — | — | — | 1,856 | — | 1,858 | |||||||||||||||||||||
| Total | $ | 40 | $ | 12 | $ | — | $ | — | $ | 1,919 | $ | — | $ | 1,971 | ||||||||||||||
| Liabilities: | ||||||||||||||||||||||||||||
| Unrealized depreciation on foreign currency contracts | $ | — | $ | 98 | $ | — | $ | — | $ | — | $ | — | $ | 98 | ||||||||||||||
| Unrealized depreciation on OTC swap contracts | — | — | — | 9 | — | — | 9 | |||||||||||||||||||||
| Variation margin payable * | — | — | — | — | 2,707 | — | 2,707 | |||||||||||||||||||||
| Written option contracts, market value | — | — | — | — | 42 | — | 42 | |||||||||||||||||||||
| Total | $ | — | $ | 98 | $ | — | $ | 9 | $ | 2,749 | $ | — | $ | 2,856 | ||||||||||||||
| * | Only current day's variation margin is reported within the Consolidated Statement of Assets and Liabilities. The variation margin is included in the open futures net cumulative depreciation of $(4,579) as reported in the Consolidated Schedule of Investments. |
The ratio of futures market value to net assets at October 31, 2014 was 12.37%, compared to the twelve-month average ratio of 7.25% during the year ended October 31, 2014. The ratio of foreign currency contracts market value to net assets at October 31, 2014 was 2.62%, compared to the twelve-month average ratio of 9.69% during the year ended October 31, 2014. The volume of other derivatives that are presented in the Consolidated Schedule of Investments is consistent with the derivative activity during the year ended October 31, 2014.
The Effect of Derivative Instruments on the Consolidated Statement of Operations for the year ended October 31, 2014:
| Risk Exposure Category | ||||||||||||||||||||||||||||
| Interest
Rate Contracts | Foreign Exchange Contracts | Credit
Contracts | Equity Contracts | Commodity Contracts | Other Contracts | Total | ||||||||||||||||||||||
| Realized Gain (Loss) on Derivatives Recognized as a Result of Operations: | ||||||||||||||||||||||||||||
| Net realized loss on futures contracts | $ | (65 | ) | $ | — | $ | — | $ | — | $ | (1,616 | ) | $ | — | $ | (1,681 | ) | |||||||||||
| Net realized gain (loss) on swap contracts | 33 | — | — | (456 | ) | 476 | — | 53 | ||||||||||||||||||||
| Net realized loss on foreign currency contracts | — | (684 | ) | — | — | — | — | (684 | ) | |||||||||||||||||||
| Total | $ | (32 | ) | $ | (684 | ) | $ | — | $ | (456 | ) | $ | (1,140 | ) | $ | — | $ | (2,312 | ) | |||||||||
| Net Change in Unrealized Appreciation (Depreciation) on Derivatives Recognized as a Result of Operations: | ||||||||||||||||||||||||||||
| Net change in unrealized depreciation of purchased option contracts | $ | — | $ | — | $ | — | $ | — | $ | (17 | ) | $ | — | $ | (17 | ) | ||||||||||||
| Net change in unrealized appreciation (depreciation) of futures contracts | 1 | — | — | — | (4,595 | ) | — | (4,594 | ) | |||||||||||||||||||
| Net change in unrealized depreciation of written option contracts | — | — | — | — | (3 | ) | — | (3 | ) | |||||||||||||||||||
| Net change in unrealized appreciation (depreciation) of swap contracts | 67 | — | — | (9 | ) | 226 | — | 284 | ||||||||||||||||||||
| Net change in unrealized depreciation of foreign currency contracts | — | (233 | ) | — | — | — | — | (233 | ) | |||||||||||||||||||
| Total | $ | 68 | $ | (233 | ) | $ | — | $ | (9 | ) | $ | (4,389 | ) | $ | — | $ | (4,563 | ) | ||||||||||
Balance Sheet Offsetting Information - The following discloses both gross information and net information about instruments and transactions eligible for offset in the financial statements, and instruments and transactions that are subject to a master netting arrangement, as well as amounts related to margin, reflected as financial collateral (including cash collateral), held at clearing brokers,
| 31 |
| The Hartford Global Real Asset Fund |
| Notes to Consolidated Financial Statements – (continued) |
| October 31, 2014 |
| (000’s Omitted) |
counterparties and the Fund’s custodian. The master netting arrangements allow the clearing brokers to net any collateral held in or on behalf of the Fund, or liabilities or payment obligations of the clearing brokers to the Fund, against any liabilities or payment obligations of the Fund to the clearing brokers. The Fund is required to deposit financial collateral (including cash collateral) at the FCM's custodian on behalf of clearing brokers and counterparties to continually meet the original and maintenance requirements established by the clearing brokers and counterparties. Such requirements are specific to the respective clearing broker or counterparty. Certain master netting arrangements may not be enforceable in the bankruptcy proceedings of a counterparty.
Offsetting of Financial Assets and Derivative Assets as of October 31, 2014:
| Gross
Amounts* of Assets Presented in Consolidated Statement of Assets and Liabilities | Financial Instruments with Allowable Netting | Non-cash Collateral Received | Cash
Collateral Received | Net
Amount (not less than $0) | ||||||||||||||||
| Description | ||||||||||||||||||||
| OTC purchased option and OTC swap contracts at market value | $ | 44 | $ | (6 | ) | $ | — | $ | — | $ | 38 | |||||||||
| Futures contracts - variation margin receivable | 1,858 | (1,858 | ) | — | — | — | ||||||||||||||
| Unrealized appreciation on foreign currency contracts | 10 | — | — | — | 10 | |||||||||||||||
| Total subject to a master netting or similar arrangement | $ | 1,912 | $ | (1,864 | ) | $ | — | $ | — | $ | 48 | |||||||||
| * | Gross amounts are presented here as there are no amounts that are netted within the Consolidated Statement of Assets and Liabilities. |
Offsetting of Financial Liabilities and Derivative Liabilities as of October 31, 2014:
| Gross
Amounts* of Liabilities Presented in Consolidated Statement of Assets and Liabilities | Financial Instruments with Allowable Netting | Non-cash Collateral Pledged | Cash
Collateral Pledged | Net
Amount (not less than $0) | ||||||||||||||||
| Description | ||||||||||||||||||||
| OTC written option and OTC swap contracts at market value | $ | 9 | $ | (6 | ) | $ | — | $ | — | $ | 3 | |||||||||
| Futures contracts - variation margin payable | 2,707 | (1,858 | ) | — | (5,688 | ) | — | |||||||||||||
| Unrealized depreciation on foreign currency contracts | — | — | — | — | — | |||||||||||||||
| Total subject to a master netting or similar arrangement | $ | 2,716 | $ | (1,864 | ) | $ | — | $ | (5,688 | ) | $ | 3 | ||||||||
| * | Gross amounts are presented here as there are no amounts that are netted within the Consolidated Statement of Assets and Liabilities. |
Certain derivatives held by the Fund, as of October 31, 2014, are not subject to a master netting arrangement and are excluded from the table above.
Principal Risks:
Credit risk depends largely on the perceived financial health of bond issuers. In general, the credit rating is inversely related to the credit risk of the issuer. Higher rated bonds generally are deemed to have less credit risk, while lower or unrated bonds are deemed to have higher risk of default. The share price, yield and total return of a fund that holds securities with higher credit risk may be more volatile than those of a fund that holds bonds with lower credit risk. Similar to credit risk, the Fund may be exposed to counterparty risk, or the risk that an institution or other entity with which the Fund has unsettled or open transactions will default.
The Fund’s investments expose the Fund to various risks including, but not limited to, interest rate, prepayment, extension, foreign currency and equity risks. Interest rate risk is the risk that fixed income securities will decline in value because of changes in interest rates. As nominal interest rates rise, the values of certain fixed income securities held by the Fund are likely to decrease. A nominal interest rate can be described as the sum of a real interest rate and an expected inflation rate. Fixed income securities with longer durations tend to be more sensitive to changes in interest rates, usually making them more volatile than securities with shorter
| 32 |
| The Hartford Global Real Asset Fund |
| Notes to Consolidated Financial Statements – (continued) |
| October 31, 2014 |
| (000’s Omitted) |
durations. Duration is useful primarily as a measure of the sensitivity of a fixed income security’s market price to interest rate (i.e., yield) movements. Rising interest rates may cause prepayments to occur at a slower than expected rate, thereby effectively lengthening the maturity of the security and making the security more sensitive to interest rate changes. Prepayment and extension risk are major risks of mortgage backed securities and certain asset backed securities. For certain asset backed securities, the actual maturity may be less than the stated maturity shown in the Consolidated Schedule of Investments, if applicable. As a result, the timing of income recognition relating to these securities may vary based upon the actual maturity.
If the Fund invests directly in foreign currencies or in securities that trade in, and receive revenues in, foreign currencies, or in derivatives that provide exposure to foreign currencies, it will be subject to the risk that those currencies will decline in value relative to the base currency (U.S. dollars) of the Fund, or, in the case of hedging positions, that the Fund’s base currency will decline in value relative to the currency being hedged. Currency rates in foreign countries may fluctuate significantly over short periods of time for a number of reasons, including changes in interest rates, intervention (or the failure to intervene) by U.S. or foreign governments, central banks or supranational entities, such as the International Monetary Fund, or by the imposition of currency controls or other political developments in the United States or abroad. As a result, the Fund’s investments in foreign currency denominated securities may reduce the returns of the Fund. The market values of equity securities, such as common stocks and preferred stocks, or equity related investments, such as futures and options, may decline due to general market conditions which are not specifically related to a particular company, such as real or perceived adverse economic conditions, changes in the general outlook for corporate earnings, changes in interest or currency rates or adverse investor sentiment generally. The market value of equity securities may also decline due to factors which affect a particular industry or industries, such as labor shortages or increased production costs and competitive conditions within an industry. Equity securities and equity related investments generally have greater market price volatility than fixed income securities.
Federal Income Taxes:
Federal Income Taxes – For federal income tax purposes, the Fund intends to continue to qualify as a Regulated Investment Company ("RIC") under Subchapter M of the Internal Revenue Code (“IRC”) by distributing substantially all of its taxable net investment income and net realized capital gains to its shareholders and otherwise complying with the requirements of the IRC. The Fund has distributed substantially all of its income and capital gains in prior years, if applicable, and intends to distribute substantially all of its income and capital gains during the calendar year ending December 31, 2014. Accordingly, no provision for federal income or excise taxes has been made in the accompanying financial statements. Distributions from short-term capital gains are treated as ordinary income distributions for federal income tax purposes.
Net Investment Income (Loss), Net Realized Gains (Losses) and Distributions – Net investment income (loss) and net realized gains (losses) may differ for financial statement and tax purposes primarily because of losses deferred due to wash sale adjustments, foreign currency gains and losses, adjustments related to Passive Foreign Investment Companies ("PFICs"), Real Estate Investment Trusts ("REITs"), RICs, certain derivatives and partnerships. The character of distributions made during the year from net investment income or net realized gains may differ from their ultimate characterization for federal income tax purposes. Also, due to the timing of dividend distributions, the fiscal year in which amounts are distributed may differ from the year that the income or realized gains (losses) were recorded by the Fund.
Distributions and Components of Distributable Earnings – The tax character of distributions paid by the Fund for the periods indicated is as follows (as adjusted for dividends payable, if applicable):
| For the Year Ended October 31, 2014 | For the Year Ended October 31, 2013 | |||||||
| Ordinary Income | $ | 3,585 | $ | 3,807 | ||||
| 33 |
| The Hartford Global Real Asset Fund |
| Notes to Consolidated Financial Statements – (continued) |
| October 31, 2014 |
| (000’s Omitted) |
As of October 31, 2014, the Fund’s components of distributable earnings (deficit) on a tax basis are as follows:
| Amount | ||||
| Undistributed Ordinary Income | $ | 1,242 | ||
| Accumulated Capital and Other Losses* | (26,382 | ) | ||
| Unrealized Depreciation† | (41,526 | ) | ||
| Total Accumulated Deficit | $ | (66,666 | ) | |
| * | The Fund has capital loss carryforwards that are identified in the Capital Loss Carryforward note that follows. |
| † | Differences between book-basis and tax-basis unrealized appreciation (depreciation) may be attributable to the losses deferred due to wash sale adjustments, foreign currency gains and losses, adjustments related to PFICs, REITs, RICs, certain derivatives and partnerships. |
Reclassification of Capital Accounts – The Fund may record reclassifications in its capital accounts. These reclassifications have no impact on the total net assets of the Fund. The reclassifications are a result of permanent differences between U.S. GAAP and tax accounting for such items as foreign currency, PFICs, expiration or utilization of capital loss carryforwards or net operating losses. Adjustments are made to reflect the impact these items have on current and future distributions to shareholders. Therefore, the source of the Fund’s distributions may be shown in the accompanying Consolidated Statement of Changes in Net Assets as from undistributed net investment income, from accumulated net realized gains on investments or from capital depending on the type of book and tax differences that exist. For the year ended October 31, 2014, the Fund recorded reclassifications to increase (decrease) the accounts listed below:
| Amount | ||||
| Undistributed Net Investment Income (Loss) | $ | (2,138 | ) | |
| Accumulated Net Realized Gain (Loss) | 4,036 | |||
| Capital Stock and Paid-in-Capital | (1,898 | ) | ||
Capital Loss Carryforward – On December 22, 2010, the Regulated Investment Company Modernization Act of 2010 (the “Act”) was enacted, which made changes to the capital loss carryforward rules. The changes are effective for taxable years beginning after the date of enactment. Under the Act, funds are permitted to carry forward capital losses for an unlimited period. However, any losses incurred during those future taxable years will be required to be utilized prior to the losses incurred in pre-enactment taxable years, which carry an expiration date. As a result of this ordering rule, pre-enactment capital loss carryforwards may be more likely to expire unused. Additionally, post-enactment capital loss carryforwards retain their character as either short-term or long-term capital losses rather than being considered all short-term as permitted under prior regulation.
At October 31, 2014 (tax year end), the Fund had capital loss carryforwards for U.S. federal income tax purposes as follows:
| Amount | ||||
| Long-Term Capital Loss Carryforward | $ | 19,700 | ||
| Total | $ | 19,700 | ||
During the year ended October 31, 2014, the Fund utilized $3,645 of prior year short term capital loss carryforwards and $11,709 of prior year long term capital loss carryforwards.
Capital loss carryforwards with expiration:
| Year of Expiration | Amount | |||
| 2019 | $ | 6,682 | ||
| Total | $ | 6,682 | ||
| 34 |
| The Hartford Global Real Asset Fund |
| Notes to Consolidated Financial Statements – (continued) |
| October 31, 2014 |
| (000’s Omitted) |
Accounting for Uncertainty in Income Taxes – The Fund has adopted financial reporting rules that require the Fund to analyze all open tax years, as defined by the statute of limitations, for all major jurisdictions. Generally, tax authorities can examine all tax returns filed for the last three years. The Fund does not have an examination in progress.
The Fund has reviewed all open tax years and major jurisdictions and concluded that these financial reporting rules had no effect on the Fund’s financial position or results of operations. There is no tax liability resulting from unrecognized tax benefits relating to uncertain income tax positions taken or expected to be taken on the tax return for the fiscal year ended October 31, 2014. The Fund is also not aware of any tax positions for which it is reasonably possible that the total amounts of unrecognized tax benefits will significantly change in the next twelve months.
Expenses:
Investment Management Agreement – Hartford Funds Management Company, LLC ("HFMC") serves as the Fund’s investment manager pursuant to an Investment Management Agreement with the Company. HFMC is an indirect wholly owned subsidiary of The Hartford Financial Services Group, Inc. ("The Hartford"). The investment manager has overall investment supervisory responsibility for the Fund. In addition, the investment manager provides administrative personnel, services, equipment, facilities and office space for proper operation of the Fund. HFMC has contracted with Wellington Management Company, LLP ("Wellington Management") under a sub-advisory agreement for the provision of day-to-day investment management services to the Fund in accordance with the Fund’s investment objective and policies. The Fund pays a fee to the investment manager, a portion of which may be used to compensate Wellington Management.
The schedule below reflects the rates of compensation paid to the investment manager for investment management services rendered as of October 31, 2014; the rates are accrued daily and paid monthly:
| Average Daily Net Assets | Annual Fee | |||
| On first $250 million | 0.950% | |||
| On next $250 million | 0.930% | |||
| On next $500 million | 0.850% | |||
| On next $1.5 billion | 0.780% | |||
| On next $2.5 billion | 0.750% | |||
| Over $5 billion | 0.710% | |||
Effective November 1, 2014, the investment manager contractually agreed to waive investment management fees of 0.15% of average daily net assets until October 31, 2015.
Accounting Services Agreement – Pursuant to the Fund Accounting Agreement between HFMC and the Company, on behalf of the Fund, HFMC provides accounting services to the Fund and receives monthly compensation based on the Fund’s average daily net assets at the rates set forth below. The Fund’s accounting services fees are accrued daily and paid monthly.
| Average Daily Net Assets | Annual Fee | |||
| On first $5 billion | 0.025% | |||
| On next $5 billion | 0.020% | |||
| Over $10 billion | 0.015% | |||
| 35 |
| The Hartford Global Real Asset Fund |
| Notes to Consolidated Financial Statements – (continued) |
| October 31, 2014 |
| (000’s Omitted) |
Operating Expenses – Allocable expenses incurred by the Company are allocated to each Fund and allocated to classes within the Fund in proportion to the average daily net assets of the Fund and each class, except where allocation of certain expenses is more fairly made directly to the Fund or to specific classes within a Fund. As of October 31, 2014, HFMC contractually limited the total operating expenses of this Fund, exclusive of taxes, interest expense, brokerage commissions, acquired fund fees and expenses and extraordinary expenses, through February 28, 2015 as follows:
| Class A | Class C | Class I | Class R3 | Class R4 | Class R5 | Class Y | ||||||||||||||||||||
| 1.35% | 2.10% | 1.10% | 1.60% | 1.30% | 1.05% | 1.00%% | ||||||||||||||||||||
Effective November 1, 2014, the investment manager voluntarily agreed to limit the total operating expenses of the Fund, exclusive of taxes, interest expense, brokerage commissions, acquired fund fees and expenses and extraordinary expenses through October 31, 2015, as follows:
| Class A | Class C | Class I | Class R3 | Class R4 | Class R5 | Class Y | ||||||||||||||||||||
| 1.20% | 1.95% | 0.95% | 1.45% | 1.15% | 0.90% | 0.85% | ||||||||||||||||||||
Fees Paid Indirectly – The Fund has entered into agreements with State Street Global Markets, LLC and Russell Implementation Services, Inc. to partially recapture non-discounted trade commissions. Such rebates are used to pay a portion of the Fund’s expenses. In addition, the Fund's custodian bank has agreed to reduce its fees when the Fund maintains cash on deposit in a non-interest-bearing custody account. For the year ended October 31, 2014, these amounts, if any, are included in the Consolidated Statement of Operations.
The ratio of expenses to average net assets in the accompanying financial highlights excludes the reduction in expenses related to fees paid indirectly. The annualized expense ratio after waivers for the period listed below reflecting the reduction for fees paid indirectly is as follows:
|
Year
Ended |
|||
| Class A | 1.35 | % | |
| Class C | 2.10 | ||
| Class I | 1.06 | ||
| Class R3 | 1.60 | ||
| Class R4 | 1.30 | ||
| Class R5 | 1.05 | ||
| Class Y | 1.00 |
Distribution and Service Plan for Class A, C, R3 and R4 Shares – Hartford Funds Distributors, LLC ("HFD"), an indirect wholly owned subsidiary of The Hartford, is the principal underwriter and distributor of the Fund. HFD is engaged in distribution activities, which include marketing and distribution of shares through broker/dealers, financing distribution costs and maintaining financial books and records. For the year ended October 31, 2014, HFD received front-end load sales charges of $71 and contingent deferred sales charges of an amount which rounds to zero from the Fund.
The Fund has adopted a Distribution and Service Plan in accordance with Rule 12b-1 of the 1940 Act to compensate the distributor (HFD) for activities intended to result in the sale and distribution of Class A, C, R3 and R4 shares and for providing services for shareholders. The Rule 12b-1 plan applicable to Class A shares of the Fund provides for payment of a Rule 12b-1 fee of 0.25% of average daily net assets. Some or all of the fee may be used for shareholder servicing expenses with the remainder used for distribution expenses. Under the Class C Plan, the Fund pays the distributor 1.00% of the average daily net assets of Class C shares outstanding, 0.25% of which is intended as a fee for services provided to existing shareholders with the remainder used for distribution expenses. For Class C shares, some or the entire fee may be remitted to broker/dealers for distribution and/or shareholder account services. Class R3 shares have a distribution fee of 0.50% of average daily net assets and Class R4 shares have a distribution fee of 0.25% of average daily net assets. For Class R3 and R4 shares, some or the entire fee may be remitted to
| 36 |
| The Hartford Global Real Asset Fund |
| Notes to Consolidated Financial Statements – (continued) |
| October 31, 2014 |
| (000’s Omitted) |
broker/dealers for distribution and/or shareholder account services. The Fund’s 12b-1 fees are accrued daily and paid monthly or at such other intervals as the Board of Directors may determine.
Other Related Party Transactions – Certain officers of the Fund are directors and/or officers of HFMC and/or The Hartford or its subsidiaries. For the year ended October 31, 2014, a portion of the Fund’s Chief Compliance Officer’s compensation was paid by all of the investment companies in the Hartford fund complex. The portion allocated to the Fund, as represented in other expenses on the Consolidated Statement of Operations, was in the amount of $1. Hartford Administrative Services Company (“HASCO”), an indirect wholly-owned subsidiary of The Hartford, provides transfer agent services to the Fund. HASCO has contractually agreed to reimburse any portion of the transfer agency fees over 0.30% of average daily net assets per fiscal year for each class. Any transfer agency fee reimbursement is determined before considering the contractual operating expense limitation. For providing such services, HASCO is compensated on a per account basis that varies by account type, except with respect to Class Y, for which it is compensated based on average daily net assets. The amount paid to HASCO and any related contractual reimbursement amounts, if applicable, can be found in the Consolidated Statement of Operations. These fees are accrued daily and paid monthly.
Administrative services fees are paid to HASCO for third-party recordkeeping services that are payable as a percentage of net assets in the amount of up to 0.20%, 0.15% and 0.10% for Classes R3, R4 and R5 shares, respectively. The total administrative services fees are shown on the Consolidated Statement of Operations. These fees are accrued daily and paid monthly.
Affiliate Holdings:
As of October 31, 2014, the Fund's shares were owned in aggregate by affiliated fund of funds. Therefore, the Fund may experience relatively large purchases or redemptions of its shares from these affiliated fund of funds. Affiliated fund of funds owned shares in the Fund as follows:
| Percentage of Fund | ||||
| Class Y | 18 | % | ||
Investment Transactions:
For the year ended October 31, 2014, the cost of purchases and proceeds from sales of investment securities (excluding short-term investments) were as follows:
| Excluding U.S. Government Obligations | U.S. Government Obligations | Total | ||||||||||
| Cost of Purchases | $ | 449,817 | $ | 237,968 | $ | 687,785 | ||||||
| Sales Proceeds | 541,350 | 258,359 | 799,709 | |||||||||
| 37 |
| The Hartford Global Real Asset Fund |
| Notes to Consolidated Financial Statements – (continued) |
| October 31, 2014 |
| (000’s Omitted) |
Capital Share Transactions:
The following information is for the year ended October 31, 2014, and the year ended October 31, 2013:
| For the Year Ended October 31, 2014 | For the Year Ended October 31, 2013 | |||||||||||||||||||||||||||||||
| Shares Sold | Shares
Issued for Reinvested Dividends | Shares Redeemed | Net
Increase (Decrease) of Shares | Shares Sold | Shares
Issued for Reinvested Dividends | Shares Redeemed | Net
Increase (Decrease) of Shares | |||||||||||||||||||||||||
| Class A | ||||||||||||||||||||||||||||||||
| Shares | 388 | 20 | (2,638 | ) | (2,230 | ) | 1,013 | 54 | (5,047 | ) | (3,980 | ) | ||||||||||||||||||||
| Amount | $ | 4,079 | $ | 205 | $ | (27,416 | ) | $ | (23,132 | ) | $ | 10,492 | $ | 585 | $ | (52,478 | ) | $ | (41,401 | ) | ||||||||||||
| Class C | ||||||||||||||||||||||||||||||||
| Shares | 68 | — | (1,080 | ) | (1,012 | ) | 154 | — | (2,351 | ) | (2,197 | ) | ||||||||||||||||||||
| Amount | $ | 698 | $ | — | $ | (11,066 | ) | $ | (10,368 | ) | $ | 1,589 | $ | — | $ | (24,249 | ) | $ | (22,660 | ) | ||||||||||||
| Class I | ||||||||||||||||||||||||||||||||
| Shares | 812 | 33 | (2,463 | ) | (1,618 | ) | 3,176 | 42 | (3,834 | ) | (616 | ) | ||||||||||||||||||||
| Amount | $ | 8,699 | $ | 341 | $ | (25,670 | ) | $ | (16,630 | ) | $ | 32,652 | $ | 451 | $ | (39,803 | ) | $ | (6,700 | ) | ||||||||||||
| Class R3 | ||||||||||||||||||||||||||||||||
| Shares | 3 | — | (3 | ) | — | 8 | — | (164 | ) | (156 | ) | |||||||||||||||||||||
| Amount | $ | 32 | $ | 1 | $ | (37 | ) | $ | (4 | ) | $ | 83 | $ | — | $ | (1,740 | ) | $ | (1,657 | ) | ||||||||||||
| Class R4 | ||||||||||||||||||||||||||||||||
| Shares | 117 | 2 | (68 | ) | 51 | 260 | — | (231 | ) | 29 | ||||||||||||||||||||||
| Amount | $ | 1,213 | $ | 18 | $ | (707 | ) | $ | 524 | $ | 2,733 | $ | 6 | $ | (2,435 | ) | $ | 304 | ||||||||||||||
| Class R5 | ||||||||||||||||||||||||||||||||
| Shares | 16 | — | (8 | ) | 8 | 58 | — | (206 | ) | (148 | ) | |||||||||||||||||||||
| Amount | $ | 173 | $ | 3 | $ | (86 | ) | $ | 90 | $ | 624 | $ | 3 | $ | (2,204 | ) | $ | (1,577 | ) | |||||||||||||
| Class Y | ||||||||||||||||||||||||||||||||
| Shares | 6,408 | 273 | (11,260 | ) | (4,579 | ) | 23,673 | 218 | (11,540 | ) | 12,351 | |||||||||||||||||||||
| Amount | $ | 66,858 | $ | 2,783 | $ | (118,296 | ) | $ | (48,655 | ) | $ | 249,311 | $ | 2,333 | $ | (118,534 | ) | $ | 133,110 | |||||||||||||
| Total | ||||||||||||||||||||||||||||||||
| Shares | 7,812 | 328 | (17,520 | ) | (9,380 | ) | 28,342 | 314 | (23,373 | ) | 5,283 | |||||||||||||||||||||
| Amount | $ | 81,752 | $ | 3,351 | $ | (183,278 | ) | $ | (98,175 | ) | $ | 297,484 | $ | 3,378 | $ | (241,443 | ) | $ | 59,419 | |||||||||||||
Line of Credit:
The Fund is one of several Hartford Funds that participate in a $500 million committed revolving line of credit facility. The facility is to be used for temporary or emergency purposes. Under the arrangement, the funds are required to own securities having a market value in excess of 300% of the total bank borrowings. The interest rate on borrowings varies depending on the nature of the loan. The facility also requires a fee to be paid based on the amount of the commitment. This commitment fee is allocated to all the funds participating in the line of credit based on the average net assets of the funds. During the year ended October 31, 2014, the Fund did not have any borrowings under this facility.
Pending Legal Proceedings:
On February 25, 2011, Jennifer L. Kasilag, Louis Mellinger, Judith M. Menendez, Jacqueline M. Robinson, and Linda A. Russell filed a derivative lawsuit against Hartford Investment Financial Services, LLC (“HIFSCO”) (now known as HFD) on behalf of six Hartford retail mutual funds in the United States District Court for the District of New Jersey, alleging that HIFSCO received excessive advisory and distribution fees in violation of its statutory fiduciary duty under Section 36(b) of the 1940 Act when serving as investment manager and principal underwriter, respectively, to the Hartford retail mutual funds. Although this action was purportedly filed on behalf of certain of the Hartford Funds, none of the Hartford Funds is itself a defendant to the suit. HIFSCO moved to dismiss and, in September 2011, the motion was granted in part and denied in part, with leave to amend the complaint. In November 2011, plaintiffs filed an amended complaint on behalf of certain Hartford retail mutual funds, The Hartford Global Health Fund (now known as The Hartford Healthcare Fund), The Hartford Conservative Allocation Fund, The Hartford Growth Opportunities Fund, The Hartford Inflation Plus Fund, The Hartford Advisers Fund (now known as The Hartford Balanced Fund), and The Hartford Capital Appreciation Fund. Plaintiffs seek to rescind the investment management agreements and distribution plans between HIFSCO and these funds and to recover the total fees charged thereunder or, in the alternative, to recover any improper compensation HIFSCO received, in addition to lost earnings. HIFSCO filed a partial motion to
| 38 |
| The Hartford Global Real Asset Fund |
| Notes to Consolidated Financial Statements – (continued) |
| October 31, 2014 |
| (000’s Omitted) |
dismiss the amended complaint and, in December 2012, the court dismissed without prejudice the claims regarding distribution fees and denied the motion with respect to the advisory fees claims. HIFSCO disputes the allegations and intends to defend vigorously.
In March 2014, the plaintiffs filed a new complaint that added as new plaintiffs The Hartford Floating Rate Fund and The Hartford Small Company Fund and named as a defendant HFMC, which assumed the role as investment manager to the funds as of January 2013. HFMC and HIFSCO dispute the allegations and intend to defend vigorously.
No accrual for litigation relating to this matter has been recorded in the financial statements of the Fund because the Fund is not party to the suit.
Indemnifications:
Under the Company's organizational documents, the Company shall indemnify its officers and directors to the full extent required or permitted under Maryland General Corporation Law and the federal securities laws. In addition, the Company, on behalf of the Fund, may enter into contracts that contain a variety of indemnifications. The Company's maximum exposure under these arrangements is unknown. However, as of the date of these financial statements, the Company has not had prior claims or losses pursuant to these contracts and expects the risk of loss to be remote.
Subsequent Event:
Effective December 1, 2014, pursuant to a sub-transfer agency agreement between HASCO and Boston Financial Data Services, Inc. (“BFDS”), HASCO has delegated certain transfer agent, dividend disbursing agent and shareholder servicing agent functions to BFDS. The costs and expenses of such delegation are borne by HASCO, not by the Fund.
| 39 |
| The Hartford Global Real Asset Fund |
| Consolidated Financial Highlights |
| - Selected Per-Share Data - (A) | - Ratios and Supplemental Data - | |||||||||||||||||||||||||||||||||||||||||||||||||||
| Class | Net
Asset Value at Beginning of Period | Net Investment Income (Loss) | Net Realized and Unrealized Gain (Loss) on Invest- ments | Total
from Investment Operations | Dividends from Net Investment Income | Distribu- tions from Realized Capital Gains | Total Dividends and Distributions | Net
Asset Value at End of Period | Total Return(B) | Net Assets at End of Period (000's) | Ratio
of Expenses to Average Net Assets Before Adjust- ments(C) | Ratio
of Expenses to Average Net Assets After Adjust- ments(C) | Ratio
of Net Investment Income (Loss) to Average Net Assets | |||||||||||||||||||||||||||||||||||||||
| For the Year Ended October 31, 2014 | ||||||||||||||||||||||||||||||||||||||||||||||||||||
| A | $ | 10.30 | $ | 0.08 | $ | (0.49 | ) | $ | (0.41 | ) | $ | (0.04 | ) | $ | – | $ | (0.04 | ) | $ | 9.85 | (4.03 | )% | $ | 44,562 | 1.58 | % | 1.35 | % | 0.76 | % | ||||||||||||||||||||||
| C | 10.18 | – | (0.48 | ) | (0.48 | ) | – | – | – | 9.70 | (4.72 | ) | 17,382 | 2.31 | 2.10 | 0.01 | ||||||||||||||||||||||||||||||||||||
| I | 10.33 | 0.11 | (0.50 | ) | (0.39 | ) | (0.07 | ) | – | (0.07 | ) | 9.87 | (3.76 | ) | 47,168 | 1.21 | 1.06 | 1.03 | ||||||||||||||||||||||||||||||||||
| R3 | 10.35 | 0.05 | (0.48 | ) | (0.43 | ) | (0.03 | ) | – | (0.03 | ) | 9.89 | (4.20 | ) | 277 | 1.93 | 1.60 | 0.49 | ||||||||||||||||||||||||||||||||||
| R4 | 10.34 | 0.08 | (0.48 | ) | (0.40 | ) | (0.06 | ) | – | (0.06 | ) | 9.88 | (3.91 | ) | 3,686 | 1.55 | 1.30 | 0.79 | ||||||||||||||||||||||||||||||||||
| R5 | 10.35 | 0.11 | (0.49 | ) | (0.38 | ) | (0.08 | ) | – | (0.08 | ) | 9.89 | (3.72 | ) | 516 | 1.26 | 1.05 | 1.05 | ||||||||||||||||||||||||||||||||||
| Y | 10.34 | 0.12 | (0.49 | ) | (0.37 | ) | (0.08 | ) | – | (0.08 | ) | 9.89 | (3.58 | ) | 313,337 | 1.15 | 1.00 | 1.11 | ||||||||||||||||||||||||||||||||||
| For the Year Ended October 31, 2013 | ||||||||||||||||||||||||||||||||||||||||||||||||||||
| A | $ | 10.68 | $ | (0.04 | ) | $ | (0.27 | ) | $ | (0.31 | ) | $ | (0.07 | ) | $ | – | $ | (0.07 | ) | $ | 10.30 | (2.98 | )% | $ | 69,554 | 1.52 | % | 1.30 | % | (0.35 | )% | |||||||||||||||||||||
| C | 10.58 | (0.11 | ) | (0.29 | ) | (0.40 | ) | – | – | – | 10.18 | (3.78 | ) | 28,546 | 2.24 | 2.05 | (1.08 | ) | ||||||||||||||||||||||||||||||||||
| I | 10.72 | – | (0.29 | ) | (0.29 | ) | (0.10 | ) | – | (0.10 | ) | 10.33 | (2.78 | ) | 66,061 | 1.19 | 1.05 | (0.04 | ) | |||||||||||||||||||||||||||||||||
| R3 | 10.69 | 0.17 | (0.51 | ) | (0.34 | ) | – | – | – | 10.35 | (3.18 | ) | 295 | 1.86 | 1.53 | 1.66 | ||||||||||||||||||||||||||||||||||||
| R4 | 10.71 | 0.17 | (0.49 | ) | (0.32 | ) | (0.05 | ) | – | (0.05 | ) | 10.34 | (3.00 | ) | 3,331 | 1.50 | 1.27 | 1.65 | ||||||||||||||||||||||||||||||||||
| R5 | 10.73 | 0.21 | (0.50 | ) | (0.29 | ) | (0.09 | ) | – | (0.09 | ) | 10.35 | (2.76 | ) | 451 | 1.20 | 1.01 | 1.98 | ||||||||||||||||||||||||||||||||||
| Y | 10.73 | 0.12 | (0.41 | ) | (0.29 | ) | (0.10 | ) | – | (0.10 | ) | 10.34 | (2.74 | ) | 375,280 | 1.09 | 0.98 | 1.14 | ||||||||||||||||||||||||||||||||||
| For the Year Ended October 31, 2012 | ||||||||||||||||||||||||||||||||||||||||||||||||||||
| A | $ | 11.05 | $ | 0.03 | $ | (0.31 | ) | $ | (0.28 | ) | $ | (0.09 | ) | $ | – | $ | (0.09 | ) | $ | 10.68 | (2.50 | )% | $ | 114,692 | 1.52 | % | 1.17 | % | 0.28 | % | ||||||||||||||||||||||
| C | 10.96 | (0.05 | ) | (0.30 | ) | (0.35 | ) | (0.03 | ) | – | (0.03 | ) | 10.58 | (3.20 | ) | 52,906 | 2.23 | 1.91 | (0.46 | ) | ||||||||||||||||||||||||||||||||
| I | 11.09 | 0.06 | (0.31 | ) | (0.25 | ) | (0.12 | ) | – | (0.12 | ) | 10.72 | (2.26 | ) | 75,179 | 1.22 | 0.91 | 0.53 | ||||||||||||||||||||||||||||||||||
| R3 | 11.04 | – | (0.30 | ) | (0.30 | ) | (0.05 | ) | – | (0.05 | ) | 10.69 | (2.75 | ) | 1,964 | 1.84 | 1.43 | 0.01 | ||||||||||||||||||||||||||||||||||
| R4 | 11.07 | 0.03 | (0.30 | ) | (0.27 | ) | (0.09 | ) | – | (0.09 | ) | 10.71 | (2.44 | ) | 3,135 | 1.56 | 1.15 | 0.30 | ||||||||||||||||||||||||||||||||||
| R5 | 11.10 | 0.06 | (0.31 | ) | (0.25 | ) | (0.12 | ) | – | (0.12 | ) | 10.73 | (2.19 | ) | 2,062 | 1.23 | 0.90 | 0.54 | ||||||||||||||||||||||||||||||||||
| Y | 11.10 | 0.04 | (0.28 | ) | (0.24 | ) | (0.13 | ) | – | (0.13 | ) | 10.73 | (2.14 | ) | 256,693 | 1.19 | 0.90 | 0.38 | ||||||||||||||||||||||||||||||||||
| For the Year Ended October 31, 2011 | ||||||||||||||||||||||||||||||||||||||||||||||||||||
| A | $ | 11.06 | $ | 0.09 | $ | 0.03 | $ | 0.12 | $ | (0.06 | ) | $ | (0.07 | ) | $ | (0.13 | ) | $ | 11.05 | 1.08 | % | $ | 155,876 | 1.55 | % | 1.04 | % | 0.82 | % | |||||||||||||||||||||||
| C | 11.02 | 0.01 | 0.05 | 0.06 | (0.05 | ) | (0.07 | ) | (0.12 | ) | 10.96 | 0.46 | 81,736 | 2.27 | 1.76 | 0.13 | ||||||||||||||||||||||||||||||||||||
| I | 11.07 | 0.14 | 0.02 | 0.16 | (0.07 | ) | (0.07 | ) | (0.14 | ) | 11.09 | 1.41 | 135,558 | 1.25 | 0.74 | 1.22 | ||||||||||||||||||||||||||||||||||||
| R3 | 11.04 | 0.06 | 0.04 | 0.10 | (0.03 | ) | (0.07 | ) | (0.10 | ) | 11.04 | 0.90 | 2,001 | 1.87 | 1.30 | 0.52 | ||||||||||||||||||||||||||||||||||||
| R4 | 11.06 | 0.09 | 0.04 | 0.13 | (0.05 | ) | (0.07 | ) | (0.12 | ) | 11.07 | 1.15 | 1,846 | 1.57 | 1.00 | 0.81 | ||||||||||||||||||||||||||||||||||||
| R5 | 11.07 | 0.13 | 0.04 | 0.17 | (0.07 | ) | (0.07 | ) | (0.14 | ) | 11.10 | 1.49 | 1,871 | 1.26 | 0.70 | 1.10 | ||||||||||||||||||||||||||||||||||||
| Y | 11.07 | 0.12 | 0.05 | 0.17 | (0.07 | ) | (0.07 | ) | (0.14 | ) | 11.10 | 1.52 | 70,019 | 1.16 | 0.65 | 1.06 | ||||||||||||||||||||||||||||||||||||
See Portfolio Turnover information on the next page.
| 40 |
| The Hartford Global Real Asset Fund |
| Consolidated Financial Highlights – (continued) |
| - Selected Per-Share Data - (A) | - Ratios and Supplemental Data - | |||||||||||||||||||||||||||||||||||||||||||||||||||
| Class | Net
Asset Value at Beginning of Period | Net Investment Income (Loss) | Net Realized and Unrealized Gain (Loss) on Invest- ments | Total
from Investment Operations | Dividends from Net Investment Income | Distribu- tions from Realized Capital Gains | Total Dividends and Distributions | Net
Asset Value at End of Period | Total Return(B) | Net Assets at End of Period (000's) | Ratio
of Expenses to Average Net Assets Before Adjust- ments(C) | Ratio
of Expenses to Average Net Assets After Adjust- ments(C) | Ratio
of Net Investment Income (Loss) to Average Net Assets | |||||||||||||||||||||||||||||||||||||||
| From May 28, 2010 (commencement of operations), through October 31, 2010 | ||||||||||||||||||||||||||||||||||||||||||||||||||||
| A(D) | $ | 10.00 | $ | 0.01 | $ | 1.05 | $ | 1.06 | $ | – | $ | – | $ | – | $ | 11.06 | 10.60 | %(E) | $ | 26,248 | 1.62 | %(F) | 0.96 | %(F) | 0.13 | %(F) | ||||||||||||||||||||||||||
| C(D) | 10.00 | (0.03 | ) | 1.05 | 1.02 | – | – | – | 11.02 | 10.20 | (E) | 8,650 | 2.38 | (F) | 1.72 | (F) | ( 0.61 | )(F) | ||||||||||||||||||||||||||||||||||
| I(D) | 10.00 | 0.01 | 1.06 | 1.07 | – | – | – | 11.07 | 10.70 | (E) | 10,821 | 1.45 | (F) | 0.79 | (F) | 0.33 | (F) | |||||||||||||||||||||||||||||||||||
| R3(D) | 10.00 | (0.01 | ) | 1.05 | 1.04 | – | – | – | 11.04 | 10.40 | (E) | 2,208 | 2.01 | (F) | 1.31 | (F) | ( 0.21 | )(F) | ||||||||||||||||||||||||||||||||||
| R4(D) | 10.00 | – | 1.06 | 1.06 | – | – | – | 11.06 | 10.60 | (E) | 2,211 | 1.71 | (F) | 1.01 | (F) | 0.09 | (F) | |||||||||||||||||||||||||||||||||||
| R5(D) | 10.00 | 0.02 | 1.05 | 1.07 | – | – | – | 11.07 | 10.70 | (E) | 2,214 | 1.41 | (F) | 0.71 | (F) | 0.39 | (F) | |||||||||||||||||||||||||||||||||||
| Y(D) | 10.00 | 0.03 | 1.04 | 1.07 | – | – | – | 11.07 | 10.70 | (E) | 11,643 | 1.32 | (F) | 0.66 | (F) | 0.43 | (F) | |||||||||||||||||||||||||||||||||||
| (A) | Information presented relates to a share outstanding throughout the indicated period. Net investment income (loss) per share amounts are calculated based on average shares outstanding unless otherwise noted. |
| (B) | Assumes initial investment at net asset value at the beginning of each period, reinvestment of all distributions, the complete redemption of the investment at net asset value at the end of each period and no sales charge. Total return would be reduced if sales charges were taken into account. |
| (C) | Adjustments include waivers and reimbursements, if applicable. Ratios do not include fees paid indirectly (see Expenses in the accompanying Notes to Consolidated Financial Statements). |
| (D) | Commenced operations on May 28, 2010. |
| (E) | Not annualized. |
| (F) | Annualized. |
| Portfolio Turnover Rate for All Share Classes | ||||
| For the Year Ended October 31, 2014 | 162 | % | ||
| For the Year Ended October 31, 2013 | 147 | |||
| For the Year Ended October 31, 2012 | 167 | |||
| For the Year Ended October 31, 2011 | 145 | |||
| From May 28, 2010 (commencement of operations) through October 31, 2010 | 20 | (A) | ||
| (A) | Not annualized. |
| 41 |
| Report of Independent Registered Public Accounting Firm |
| The Board of Directors and Shareholders of |
| The Hartford Mutual Funds, Inc. |
We have audited the accompanying consolidated statement of assets and liabilities, including the consolidated schedule of investments, of The Hartford Global Real Asset Fund (one of the portfolios constituting The Hartford Mutual Funds, Inc. (the Funds)) as of October 31, 2014, and the related consolidated statement of operations for the year then ended, the consolidated statements of changes in net assets for each of the two years in the period then ended, and the consolidated financial highlights for the periods indicated therein. These financial statements and financial highlights are the responsibility of the Funds’ management. Our responsibility is to express an opinion on these financial statements and financial highlights based on our audits.
We conducted our audits in accordance with the standards of the Public Company Accounting Oversight Board (United States). Those standards require that we plan and perform the audit to obtain reasonable assurance about whether the financial statements and financial highlights are free of material misstatement. We were not engaged to perform an audit of the Funds’ internal control over financial reporting. Our audits included consideration of internal control over financial reporting as a basis for designing audit procedures that are appropriate in the circumstances, but not for the purpose of expressing an opinion on the effectiveness of the Funds’ internal control over financial reporting. Accordingly, we express no such opinion. An audit also includes examining, on a test basis, evidence supporting the amounts and disclosures in the financial statements and financial highlights, assessing the accounting principles used and significant estimates made by management, and evaluating the overall financial statement presentation. Our procedures included confirmation of securities owned as of October 31, 2014, by correspondence with the custodian and brokers or by other appropriate auditing procedures where replies from brokers were not received. We believe that our audits provide a reasonable basis for our opinion.
In our opinion, the consolidated financial statements and consolidated financial highlights referred to above present fairly, in all material respects, the consolidated financial position of The Hartford Global Real Asset Fund of The Hartford Mutual Funds, Inc. at October 31, 2014, the results of its consolidated operations for the year then ended, the consolidated changes in its net assets for each of the two years in the period then ended, and the consolidated financial highlights for the periods indicated therein, in conformity with U.S. generally accepted accounting principles.
| |
| Minneapolis, Minnesota | |
| December 18, 2014 |
| 42 |
| The Hartford Global Real Asset Fund |
| Directors and Officers (Unaudited) |
The Board of Directors of the Company (the "Directors") appoints officers who are responsible for the day-to-day operations of the Fund and who execute policies formulated by the Directors. Each Director serves until his or her death, resignation, or retirement or until the next annual meeting of shareholders is held or until his or her successor is elected and qualifies.
Directors and officers who are employed by or who have a financial interest in The Hartford Financial Services Group, Inc. ("The Hartford") are considered “interested” persons of the Fund pursuant to the 1940 Act. Each officer and two of the Company's Directors, as noted in the chart below, are “interested” persons of the Fund. Each Director serves as a director for The Hartford Mutual Funds, Inc., The Hartford Mutual Funds II, Inc., Hartford Series Fund, Inc., and Hartford HLS Series Fund II, Inc., and as a trustee for The Hartford Alternative Strategies Fund, which, as of October 31, 2014, collectively consist of 66 funds. Correspondence may be sent to Directors and officers c/o Hartford Funds, 5 Radnor Corporate Center, Suite 300, 100 Matsonford Road, Radnor, Pennsylvania 19087, except that correspondence to Mr. Annoni, Mr. Dressen and Ms. Quade may be sent to 500 Bielenberg Drive, Suite 500, Woodbury, Minnesota 55125.
The table below sets forth, for each Director and officer, his or her name, year of birth, current position with the Company and date first elected or appointed to The Hartford Mutual Funds, Inc. ("MF") and The Hartford Mutual Funds II, Inc. ("MF2"), principal occupation, and, for Directors, other directorships held. The Fund’s Statement of Additional Information contains further information on the Directors and is available free of charge by calling 1-888-843-7824 or writing to: Hartford Funds, P.O. Box 55022, Boston, MA 02205-5022.
Information on the aggregate remuneration paid to the directors of the Company can be found in the Consolidated Statement of Operations herein. The Fund pays to The Hartford a portion of the Chief Compliance Officer’s compensation, but does not pay salaries or compensation to any of its other officers or Directors who are employed by The Hartford.
Non-Interested Directors
Hilary E. Ackermann (1956) Director since September 23, 2014
Ms. Ackermann served as Chief Risk Officer at Goldman Sachs Bank USA from October 2008 to November 2011 and serves as a Director of Dynegy, Inc., an independent power company, from October 2012 to present.
Lynn S. Birdsong (1946) Director since 2003, Chairman of the Investment Committee since 2014
Mr. Birdsong is a private investor. Mr. Birdsong currently serves as a Director of the Sovereign High Yield Investment Company (April 2010 to current). Mr. Birdsong currently serves as an Independent Director of Nomura Partners Funds, Inc. (formerly, The Japan Fund) (April 2003 to current). From 2003 to March 2005, Mr. Birdsong was an Independent Director of the Atlantic Whitehall Funds. From 1979 to 2002, Mr. Birdsong was a Managing Director of Zurich Scudder Investments, an investment management firm. During his employment with Scudder, Mr. Birdsong was an Interested Director of The Japan Fund. From January 1981 through December 2013, Mr. Birdsong was a partner in Birdsong Company, an advertising specialty firm.
Robert M. Gavin, Jr. (1940) Director since 2002 (MF) and 1986 (MF2), Chairman of the Board for each since 2004
Dr. Gavin is an educational consultant. Prior to September 1, 2001, he was President of Cranbrook Education Community and prior to July 1996, he was President of Macalester College, St. Paul, Minnesota.
Duane E. Hill (1945) Director since 2001 (MF) and 2002 (MF2), Chairman of the Nominating Committee since 2003
Mr. Hill is a Partner of TSG Ventures L.P., a private equity investment company. Mr. Hill is a former partner of TSG Capital Group, a private equity investment firm that served as sponsor and lead investor in leveraged buyouts of middle market companies.
Sandra S. Jaffee (1941) Director since 2005
Ms. Jaffee is the founder and Chief Executive Officer of a private company, Homeworks Concierge, LLC, which provides residential property management services in Westchester County, New York (January 2012 to present). Ms. Jaffee served as Chairman (2008 to 2009) and Chief Executive Officer of Fortent (formerly Searchspace Group), a leading provider of compliance/regulatory technology to financial institutions from August 2005 to August 2009. From August 2004 to August 2005, Ms. Jaffee served as an Entrepreneur in Residence with Warburg Pincus, a private equity firm. Prior to joining Warburg Pincus, Ms. Jaffee served as Executive Vice President at Citigroup, from September 1995 to July 2004, where she was President and Chief Executive Officer of Citibank’s Global Securities Services (1995 to 2003). Ms. Jaffee currently serves as a member of the Board of Directors of Broadridge Financial Solutions as well as a Trustee of Muhlenberg College.
| 43 |
| The Hartford Global Real Asset Fund |
| Directors and Officers (Unaudited) – (continued) |
William P. Johnston (1944) Director since 2005, Chairman of the Compliance Committee since 2005
In June 2006, Mr. Johnston was appointed as Senior Advisor to The Carlyle Group, a global private equity and other alternative asset investment firm and currently serves as an Operating Executive. In July 2006, Mr. Johnston was elected to the Board of Directors of MultiPlan, Inc. and served as a Director (July 2006 to August 2010). In August 2007, Mr. Johnston was elected to the Board of Directors of LifeCare Holdings, Inc. and served as a Director (August 2007 to June 2013). In February 2008, Mr. Johnston was elected to the Board of Directors of HCR-ManorCare, Inc. In May 2006, Mr. Johnston was elected to the Supervisory Board of Fresenius Medical Care AG & Co. KGaA, after its acquisition of Renal Care Group, Inc. in March 2006. Mr. Johnston joined Renal Care Group in November 2002 as a member of the Board of Directors and served as Chairman of the Board from March 2003 through March 2006. From 2002 through 2013, Mr. Johnston served as a Board member of the Georgia O’Keefe Museum. From September 1987 to December 2002, Mr. Johnston was with Equitable Securities Corporation (and its successors, SunTrust Equitable Securities and SunTrust Robinson Humphrey) serving in various investment banking and managerial positions, including Managing Director and Head of Investment Banking, Chief Executive Officer and Vice Chairman.
Phillip O. Peterson (1944) Director since 2002 (MF) and 2000 (MF2), Chairman of the Audit Committee since 2002
Mr. Peterson is a mutual fund industry consultant. He was a partner of KPMG LLP (an accounting firm) until July 1999. Mr. Peterson joined William Blair Funds in February 2007 as a member of the Board of Trustees. From February 2012 to February 2014, Mr. Peterson served as a Trustee of Symetra Variable Mutual Funds. From January 2004 to April 2005, Mr. Peterson served as Independent President of the Strong Mutual Funds.
Lemma W. Senbet (1946) Director since 2005
Dr. Senbet is the William E. Mayer Chair Professor of Finance and Founding Director, Center for Financial Policy, at the University of Maryland, Robert H. Smith School of Business. He was chair of the Finance Department of the University of Maryland, Robert H. Smith School of Business from 1998 to 2006. Since June 2013, he has been on leave from the University to serve as Executive Director of African Economic Research Consortium which focuses on economic policy research and training. Previously, he was a chaired professor of finance at the University of Wisconsin-Madison. Also, he was a Director of the Fortis Funds from March 2000 to July 2002. Dr. Senbet served as Director of the American Finance Association and President of the Western Finance Association. In 2006, Dr. Senbet was inducted Fellow of Financial Management Association International for his career-long distinguished scholarship and professional service.
Interested Directors and Officers
James E. Davey (1964) Director since 2012, President and Chief Executive Officer since 2010
Mr. Davey serves as Executive Vice President of Hartford Life Insurance Company (“HLIC”) and The Hartford. Additionally, Mr. Davey serves as Chairman of the Board, Manager and Senior Managing Director of Hartford Funds Distributors, LLC (“HFD”). He also currently serves as Director, Chairman of the Board, President and Senior Managing Director of Hartford Administrative Services Company (“HASCO”). Mr. Davey also serves as Manager, Chairman of the Board and Senior Managing Director for Hartford Funds Management Company, LLC (“HFMC”) and Director, Chairman of the Board and Senior Managing Director for Hartford Funds Management Group, Inc. ("HFMG"). Mr. Davey has served in various positions within The Hartford and its subsidiaries in connection with the operation of the Hartford Funds. Mr. Davey joined The Hartford in 2002.
Lowndes A. Smith* (1939) Director since 1996 (MF) and 2002 (MF2)
Mr. Smith served as Vice Chairman of The Hartford from February 1997 to January 2002, as President and Chief Executive Officer of Hartford Life, Inc. from February 1997 to January 2002, and as President and Chief Operating Officer of The Hartford Life Insurance Companies from January 1989 to January 2002. Mr. Smith serves as a Director of White Mountains Insurance Group Ltd. (October 2003 to current); One Beacon Insurance (October 2006 to current); Symetra Financial (August 2007 to current) and is a Managing Director of Whittington Gray Associates (January 2007 to current).
* Mr. Smith resigned as a Director of MF, MF2, Hartford Series Fund, Inc. and Hartford HLS Series Fund II, Inc. and as a Trustee of The Hartford Alternative Strategies Fund effective September 17, 2014.
Other Officers
Mark A. Annoni (1964) Vice President, Controller and Treasurer since 2012
Mr. Annoni currently serves as the Assistant Vice President of HLIC (February 2004 to present) and Senior Vice President of HFMG (December 2013 to present). Mr. Annoni has served in various positions within The Hartford and its subsidiaries in connection with the operation of the Hartford Funds. Mr. Annoni joined The Hartford in 2001.
| 44 |
| The Hartford Global Real Asset Fund |
| Directors and Officers (Unaudited) – (continued) |
Michael R. Dressen (1963) AML Compliance Officer since 2011
Mr. Dressen currently serves as Assistant Vice President of HLIC. He also serves as Chief Compliance Officer and AML Compliance Officer of HASCO and as AML Officer of HFD. Mr. Dressen has served in various positions within The Hartford and its subsidiaries in connection with the operation of the Hartford Funds.
Edward P. Macdonald (1967) Vice President, Secretary and Chief Legal Officer since 2005
Mr. Macdonald currently serves as Assistant Secretary, Executive Vice President and Deputy General Counsel of HFD, HASCO, HFMC and HFMG. He also serves as Vice President of HLIC. Mr. Macdonald has served in various positions within The Hartford and its subsidiaries in connection with the operation of the Hartford Funds. Mr. Macdonald joined The Hartford in 2005.
Joseph G. Melcher (1973) Vice President and Chief Compliance Officer since 2013
Mr. Melcher currently serves as Executive Vice President of HFD, HFMG and HASCO. Mr. Melcher also currently serves as Executive Vice President and Chief Compliance Officer of HFMC. Mr. Melcher has served in various positions within The Hartford and its subsidiaries in connection with the operation of the Hartford Funds since joining The Hartford in 2012. Prior to joining The Hartford, Mr. Melcher worked at Touchstone Investments, a member of the Western & Southern Financial Group, where he held the position of Vice President and Chief Compliance Officer from 2010 through 2012 and Assistant Vice President, Compliance from 2005 to 2010.
Vernon J. Meyer (1964) Vice President since 2006
Mr. Meyer currently serves as Senior Vice President of HLIC. He also currently serves as Managing Director and Chief Investment Officer of HFMC and Managing Director of HFMG. Mr. Meyer has served in various positions within The Hartford and its subsidiaries in connection with the operation of the Hartford Funds. Mr. Meyer joined The Hartford in 2004.
Laura S. Quade (1969) Vice President since 2012
Ms. Quade currently serves as Vice President of HASCO, HFD and HFMG. She is the Head of Operations of HASCO and formerly served as Director, Enterprise Operations of HLIC. Ms. Quade has served in various positions within The Hartford and its subsidiaries in connection with the operation of the Hartford Funds. Ms. Quade joined The Hartford in 2001.
Martin A. Swanson** (1962) Vice President since 2010
Mr. Swanson currently serves as Vice President of HLIC. Mr. Swanson also serves as Managing Director, Chief Marketing Officer and Principal of HFD and Managing Director of HFMG. Mr. Swanson has served in various positions within The Hartford and its subsidiaries in connection with the operation of the Hartford Funds.
** Mr. Swanson resigned as an officer effective November 6, 2014.
HOW TO OBTAIN A COPY OF THE FUND’S PROXY VOTING POLICIES AND VOTING RECORDS (UNAUDITED)
A description of the policies and procedures that the Fund uses to determine how to vote proxies relating to portfolio securities and information about how the Fund voted proxies relating to portfolio securities during the most recent twelve-month period ended June 30 are available (1) without charge, upon request, by calling 888-843-7824 and (2) on the SEC’s website at http://www.sec.gov.
QUARTERLY PORTFOLIO HOLDINGS INFORMATION (UNAUDITED)
The Fund files a complete schedule of portfolio holdings with the SEC for the first and third quarters of each fiscal year on Form N-Q. The Fund’s Forms N-Q are available (1) without charge, upon request, by calling 888-843-7824 and (2) on the SEC’s website at http://www.sec.gov. The Form N-Q may be reviewed and copied at the SEC’s Public Reference Room in Washington, DC. Information on the operation of the Public Reference Room may be obtained by calling 1-800-SEC-0330.
| 45 |
| The Hartford Global Real Asset Fund |
| Federal Tax Information (Unaudited) |
For the fiscal year ended October 31, 2014, there is no further federal tax information required for this Fund.
| 46 |
| The Hartford Global Real Asset Fund |
| Expense Example (Unaudited) |
Your Fund's Expenses
As a shareholder of the Fund, you incur two types of costs: (1) transaction costs, including sales charges (loads) on purchase payments, if any, and contingent deferred sales charges (CDSC), if any, and (2) ongoing costs, including investment management fees, distribution and/or service (12b-1) fees, if any, and other fund expenses. This example is intended to help you understand your ongoing costs (in dollars) of investing in the Fund and to compare these costs with the ongoing costs of investing in other mutual funds. The example is based on an investment of $1,000 invested at the beginning of the period and held for the entire period of April 30, 2014 through October 31, 2014.
Actual Expenses
The first set of columns of the table below provides information about actual account values and actual expenses. You may use the information in this column, together with the amount you invested, to estimate the expenses that you paid over the period. Simply divide your account value by $1,000 (for example, an $8,600 account value divided by $1,000 = 8.6), then multiply the result by the number in the line under the heading entitled “Expenses Paid During Period” to estimate the expenses you paid on your account during this period.
Hypothetical Example for Comparison Purposes
The second set of columns of the table below provides information about hypothetical account values and hypothetical expenses based on the Fund's actual expense ratio and an assumed rate of return of 5% per year before expenses, which is not the Fund's actual return. The hypothetical account values and expenses may not be used to estimate the actual ending account balance or expenses you paid for the period. You may use this information to compare the ongoing costs of investing in the Fund and other funds. To do so, compare this 5% hypothetical example with the 5% hypothetical examples that appear in the shareholder reports of the other funds.
Please note that the expenses shown in the table are meant to highlight your ongoing costs only and do not reflect any transactional costs, such as sales charges (loads) and CDSC. Therefore, the second set of columns of the table is useful in comparing ongoing costs only, and will not help you determine the relative total costs of owning different funds. In addition, if these transactional costs were included, your costs would be higher. Expenses are equal to the Fund's annualized expense ratios multiplied by average account value over the period, multiplied by 184/365 (to reflect the one-half year period).
| Actual return | Hypothetical (5% return before expenses) | |||||||||||||||||||||||||||||||||||
| Beginning Account Value April 30, 2014 | Ending
Account Value October 31, 2014 | Expenses
paid during the period April 30, 2014 through October 31, 2014 | Beginning Account Value April 30, 2014 | Ending
Account Value October 31, 2014 | Expenses
paid during the period April 30, 2014 through October 31, 2014 | Annualized
expense ratio | Days in the current 1/2 year | Days in the full year | ||||||||||||||||||||||||||||
| Class A | $ | 1,000.00 | $ | 920.60 | $ | 6.54 | $ | 1,000.00 | $ | 1,018.40 | $ | 6.87 | 1.35 | % | 184 | 365 | ||||||||||||||||||||
| Class C | $ | 1,000.00 | $ | 917.70 | $ | 10.15 | $ | 1,000.00 | $ | 1,014.62 | $ | 10.66 | 2.10 | 184 | 365 | |||||||||||||||||||||
| Class I | $ | 1,000.00 | $ | 922.40 | $ | 5.15 | $ | 1,000.00 | $ | 1,019.84 | $ | 5.42 | 1.06 | 184 | 365 | |||||||||||||||||||||
| Class R3 | $ | 1,000.00 | $ | 920.00 | $ | 7.75 | $ | 1,000.00 | $ | 1,017.13 | $ | 8.15 | 1.60 | 184 | 365 | |||||||||||||||||||||
| Class R4 | $ | 1,000.00 | $ | 921.60 | $ | 6.32 | $ | 1,000.00 | $ | 1,018.63 | $ | 6.63 | 1.30 | 184 | 365 | |||||||||||||||||||||
| Class R5 | $ | 1,000.00 | $ | 922.60 | $ | 5.09 | $ | 1,000.00 | $ | 1,019.91 | $ | 5.35 | 1.05 | 184 | 365 | |||||||||||||||||||||
| Class Y | $ | 1,000.00 | $ | 922.60 | $ | 4.83 | $ | 1,000.00 | $ | 1,020.18 | $ | 5.08 | 1.00 | 184 | 365 | |||||||||||||||||||||
| 47 |
| The Hartford Global Real Asset Fund |
| Approval of Investment Management and Investment Sub-Advisory Agreements (Unaudited) |
Section 15(c) of the Investment Company Act of 1940, as amended (the “1940 Act”), requires that each mutual fund’s board of directors, including a majority of those directors who are not “interested persons” of the mutual fund, as defined in the 1940 Act (the “Independent Directors”), annually review and consider the continuation of the mutual fund’s investment advisory and sub-advisory agreements. At its meeting held on August 5-6, 2014, the Board of Directors (the “Board”) of The Hartford Mutual Funds, Inc., including each of the Independent Directors, unanimously voted to approve the continuation of the investment management agreement for The Hartford Global Real Asset Fund (the “Fund”) with Hartford Funds Management Company, LLC (“HFMC”) and the continuation of the investment sub-advisory agreement between HFMC and the Fund’s sub-adviser, Wellington Management Company, LLP (the “Sub-adviser,” and together with HFMC, the “Advisers”) (collectively, the “Agreements”).
In the months preceding the August 5-6, 2014 meeting, the Board requested, received and reviewed written responses from the Advisers to questions posed to them on behalf of the Independent Directors and supporting materials relating to those questions and responses. The Board considered information furnished to the Board at its meetings throughout the year, as well as information specifically prepared in connection with the annual approval of the Agreements at the Board’s meetings held on June 17-18, 2014 and August 5-6, 2014. Information provided to the Board at its meetings throughout the year included, among other things, reports on Fund performance, legal and compliance matters, sales and marketing activity, shareholder services, and the other services provided to the Fund by the Advisers and their affiliates. The Board also received in-person presentations by Fund officers and representatives of HFMC at the Board’s meetings on June 17-18, 2014 and August 5-6, 2014 concerning the Agreements.
The Independent Directors, advised by independent legal counsel, engaged service providers to assist them with evaluating the Agreements with respect to the Fund. Lipper Inc. (“Lipper”), an independent provider of investment company data, was retained to provide the Board with reports on how the Fund’s contractual management fees, actual management fees, other non-management fees, overall expense ratios and investment performance compared to those of mutual funds with similar investment objectives. The Independent Directors also engaged an independent financial services consultant (the “Consultant”) to assist them in evaluating the Fund’s management fees, sub-advisory fees, other non-management fees, overall expense ratios and investment performance. In addition, the Consultant reviewed the profitability calculations utilized by HFMC in connection with the continuation of the investment management agreement.
In determining whether to continue the Agreements for the Fund, the members of the Board reviewed and evaluated information and factors they believed to be relevant and appropriate in light of the information that the Board deemed necessary and appropriate through the exercise of its reasonable business judgment. While individual members of the Board may have weighed certain factors differently, the Board’s determination to continue the Agreements was based on a comprehensive consideration of all information provided to the Board throughout the year and specifically with respect to the continuation of the Agreements. A more detailed discussion of the factors the Board considered with respect to its approval of the Agreements is provided below.
Nature, Extent and Quality of Services Provided by the Advisers
The Board requested and considered information concerning the nature, extent and quality of the services provided to the Fund by the Advisers. The Board considered, among other things, the terms of the Agreements and the range of services provided by the Advisers. The Board considered the Advisers’ professional personnel who provide services to the Fund, including each Adviser’s ability and experience in attracting and retaining qualified personnel to service the Fund. The Board considered each Adviser’s reputation and overall financial strength, as well as its willingness to consider and implement organizational and operational changes designed to enhance services to the Hartford Funds. In addition, the Board considered the quality of each Adviser’s communications with the Board and responsiveness to Board inquiries and requests made from time to time with respect to the Fund and other Hartford Funds.
The Board also requested and evaluated information concerning each Adviser’s regulatory and compliance environment. In this regard, the Board requested and reviewed information on each Adviser’s compliance policies and procedures, compliance history, and a report from the Fund’s Chief Compliance Officer on each Adviser’s compliance with applicable laws and regulations, including responses to regulatory developments and compliance issues raised by regulators. The Board also noted the Advisers’ support of the Fund’s compliance control structure, particularly the resources devoted by the Advisers in support of the Fund’s obligations pursuant to Rule 38a-1 under the 1940 Act.
With respect to HFMC, the Board noted that, under the Agreements, HFMC is responsible for the management of the Fund, including oversight of fund operations and service providers, and provides administrative and investment advisory services in connection with selecting, monitoring and supervising the Sub-adviser. The Board considered HFMC’s ongoing monitoring of people, process and performance, including its quarterly reviews of each of the Hartford Funds, semi-annual meetings with the leaders of each Fund’s portfolio management team, and oversight of the Hartford Funds’ approximately 66 portfolio managers. The Board recognized that HFMC has demonstrated a record of making changes to the
| 48 |
| The Hartford Global Real Asset Fund |
| Approval of Investment Management and Investment Sub-Advisory Agreements (Unaudited) – (continued) |
management and/or strategies of the Hartford Funds when warranted. The Board considered HFMC’s oversight of the Sub-adviser’s investment approach and results, process for monitoring best execution of portfolio trades by the Sub-adviser, and approach to risk management with respect to the Fund and the service providers to the Fund. The Board also considered HFMC’s oversight of compliance with the Fund’s objective and policies as well as with applicable laws and regulations, noting that regulatory and other developments had over time led to an increase in the scope of HFMC’s services in this regard.
In addition, the Board considered HFMC’s ongoing commitment to review and rationalize the Hartford Funds product line-up and the expenses that HFMC had incurred in connection with fund combinations in recent years. The Board considered that HFMC or its affiliates are responsible for providing the Fund’s officers.
With respect to the Sub-adviser, which provides certain day-to-day portfolio management services for the Fund, the Board considered the quality of the Fund’s portfolio managers, the Sub-adviser’s other investment personnel, its investment philosophy and process, investment research capabilities and resources, performance record, trade execution capabilities and experience. The Board considered the experience of the Fund’s portfolio managers, the number of accounts managed by the portfolio managers, and the Sub-adviser’s method for compensating the portfolio managers.
Based on these considerations, the Board concluded that it was satisfied with the nature, extent and quality of the services provided to the Fund by HFMC and the Sub-adviser.
Performance of the Fund and the Advisers
The Board considered the investment performance of the Fund. In this regard, the Board reviewed the performance of the Fund over different time periods presented in the materials and evaluated HFMC’s analysis of the Fund’s performance for these time periods. The Board considered information and materials provided to the Board by the Advisers concerning Fund performance, as well as information from Lipper comparing the investment performance of the Fund to an appropriate benchmark and universe of peer funds. The Board noted that the Fund’s performance was in the 5th quintile of its performance universe for the 1- and 3-year periods. The Board also noted that the Fund’s performance was below its blended custom benchmark for the 1- and 3-year periods. The Board considered that, in response to questions raised concerning the Fund’s performance, HFMC stated that it has confidence in the Fund’s portfolio management team and investment strategy. The Board noted that certain changes had recently been made to the Fund’s principal investment strategy.
The Board considered the detailed investment analytics reports provided by Hartford Funds’ Investment Advisory Group throughout the year. These reports include, among other things, information on the Fund’s gross and net returns, the Fund’s investment performance relative to an appropriate benchmark and peer group, various statistics concerning the Fund’s portfolio, and a narrative summary of various factors affecting Fund performance. The Board considered the Advisers’ cooperation with the Investment Committee, which assists the Board in evaluating the performance of the Fund at periodic meetings throughout the year. The Board also considered the analysis provided by the Consultant relating to the Fund’s performance track record.
In light of all the considerations noted above, the Board concluded that it had continued confidence in HFMC’s and the Sub-adviser’s overall capabilities to manage the Fund.
Costs of the Services and Profitability of the Advisers
The Board reviewed information regarding HFMC’s cost to provide investment management and related services to the Fund and HFMC’s profitability, both overall and for the Fund, on a pre-tax basis without regard to distribution expenses. The Board also requested and reviewed information about the profitability to HFMC and its affiliates from all services provided to the Fund and all aspects of their relationship with the Fund. The Board also requested and received information relating to the operations and profitability of the Sub-adviser.
The Board considered the Consultant’s review of the profitability calculations used by HFMC in connection with the continuation of the investment management agreement, noting the Consultant’s view that Hartford Funds’ process for calculating and reporting Fund profitability is reasonable. In this regard, the Board noted that the Consultant performed a full review of this process in light of the recent restructuring of the Hartford Funds business and reported that the approach to analyzing Fund profitability, including the use of common expense allocation methodologies, is reasonable, sound and well within common industry practice.
| 49 |
| The Hartford Global Real Asset Fund |
| Approval of Investment Management and Investment Sub-Advisory Agreements (Unaudited) – (continued) |
Based on these considerations, the Board concluded that the profits anticipated to be realized by the Advisers and their affiliates from their relationships with the Fund would not be excessive.
Comparison of Fees and Services Provided by the Advisers
The Board considered comparative information with respect to the management fees to be paid by the Fund to HFMC and the total expense ratios of the Fund. The Board also considered comparative information with respect to the sub-advisory fees to be paid by HFMC to the Sub-adviser. In this regard, the Board requested and reviewed information from HFMC and the Sub-adviser relating to the management and sub-advisory fees, including the sub-advisory fee schedule for the Fund, and total operating expenses for the Fund. With respect to the sub-advisory fee schedule, the Board considered representations from HFMC and the Sub-adviser that the Sub-adviser’s fees were negotiated at arm’s length on a fund-by-fund basis. The Board also reviewed information from Lipper comparing the Fund’s contractual management fees, actual management fees and overall expense ratios relative to a group of funds selected by Lipper, in consultation with the Consultant, and a broader universe of funds selected by Lipper. The Board considered that the Fund’s contractual management fee, actual management fee and total expenses (less 12b-1 and shareholder service fees) were in the 5th quintile of its expense group. The Board noted that the Fund has an automatically renewable contractual expense cap on each share class. The expense cap resulted in reimbursement of certain expenses incurred in 2013. The Board also noted that in response to a request from the Board, HFMC had agreed to waive 0.15% of its contractual management fee for the Fund from November 1, 2014 to October 31, 2015.
While the Board recognized that comparisons between the Fund and peer funds may be imprecise, given the different service levels and characteristics of mutual funds and the different business models and cost structures of the Advisers, the comparative information provided by Lipper assisted the Board in evaluating the reasonableness of the Fund’s management and sub-advisory fees and total operating expenses. In addition, the Board considered the analysis and recommendations of the Consultant relating to the Fund’s management and sub-advisory fees and total operating expenses.
Based on these considerations, the Board concluded that the Fund’s fees and total operating expenses, in conjunction with the information about quality of services, profitability, economies of scale, and other matters discussed, were reasonable in light of the services provided.
Economies of Scale
The Board requested and considered information regarding the Advisers’ realization of economies of scale with respect to the Fund and whether the fee levels reflect these economies of scale for the benefit of the Fund’s shareholders. The Board reviewed the breakpoints in the management fee schedule for the Fund, which reduce fee rates as Fund assets grow over time. The Board recognized that a fund with assets beyond the highest breakpoint level will continue to benefit from economies of scale because additional assets are charged the lowest breakpoint fee resulting in lower overall effective management fee rates. The Board also considered that expense limitations and fee waivers that reduce the Fund’s expenses at all asset levels can have the same effect as breakpoints in sharing economies of scale with shareholders and provide protection from an increase in expenses if Fund assets decline. The Board recognized that a fee schedule that reaches a lower breakpoint quickly provides shareholders with the benefit of anticipated or potential economies of scale. The Board also considered that HFMC has been active in managing expenses, which has resulted in benefits being realized by shareholders as assets within the Hartford Funds family of funds have grown over time, including through lower transfer agent costs and other operating expenses.
The Board reviewed and evaluated materials from Lipper and the Consultant showing how management fee schedules of peer funds reflect economies of scale for the benefit of shareholders as a peer fund’s assets hypothetically increase over time. Based on information provided by HFMC, Lipper, and the Consultant, the Board recognized that there is no uniform methodology for establishing breakpoints or uniform pattern in asset levels that trigger breakpoints or the amounts of breakpoints triggered.
After considering all of the information available to it, the Board concluded that it was satisfied with the extent to which economies of scale would be shared for the benefit of the Fund’s shareholders based on currently available information and the effective advisory fees and expense ratios for the Fund at its current and reasonably anticipated asset levels. The Board noted, however, that it would continue to monitor future growth in Fund assets and the appropriateness of additional breakpoints.
Other Benefits
The Board considered other benefits to the Advisers and their affiliates from their relationships with the Fund.
| 50 |
| The Hartford Global Real Asset Fund |
| Approval of Investment Management and Investment Sub-Advisory Agreements (Unaudited) – (continued) |
The Board noted that HFMC receives fees for fund accounting and related services from the Fund, and the Board considered information on profits to HFMC for such services. The Board also considered that Hartford Administrative Services Company (“HASCO”), the Fund’s transfer agent and an affiliate of HFMC, receives transfer agency compensation from the Fund, and the Board reviewed information on the profitability of the Fund’s transfer agency function to HASCO. The Board considered information provided by HASCO indicating that the transfer agent fees charged by HASCO to the Fund were fair and reasonable based on publicly available information.
The Board also considered that Hartford Funds Distributors, LLC (“HFD”), an affiliate of HFMC, serves as principal underwriter of the Fund. As principal underwriter, HFD receives 12b-1 fees from the Fund and receives all or a portion of the sales charges on sales or redemptions of certain classes of shares. The Board also noted that certain affiliates of HFD distribute shares of the Fund and receive compensation in that connection.
The Board considered benefits to the Sub-adviser from its use of the Fund’s brokerage commissions to obtain soft dollar research, and representations from HFMC and the Sub-adviser that the Sub-adviser would not make any revenue-sharing payments or any other type of distribution payments to HFMC or its affiliates.
The Board considered the benefits to shareholders of being part of the Hartford Funds family of funds, including the right to exchange investments between the same class of funds without a sales charge, the ability to reinvest Fund dividends into other funds in the family, and the ability to combine holdings in the Fund with holdings in other funds to obtain a reduced sales charge. The Board considered HFMC’s efforts to provide investors in the family with a broad range of investment styles and asset classes and its entrepreneurial risk in initiating new funds to expand these opportunities for shareholders.
* * * *
Based upon its review of these various factors, among others, the Board concluded that it is in the best interests of the Fund and its shareholders for the Board to approve the Agreements for an additional year. In reaching this decision, the Board did not assign relative weights to the factors discussed above or deem any one or group of them to be controlling in and of themselves. In connection with their deliberations, the Independent Directors met separately in executive session on several occasions, with independent legal counsel and the Consultant, to review the relevant materials and consider their responsibilities under relevant laws and regulations.
| 51 |
| The Hartford Global Real Asset Fund |
| Main Risks (Unaudited) |
The main risks of investing in the Fund are described below.
Market, Selection and Strategy Risk: The Fund’s share price may fluctuate due to market risk and/or security selections that may underperform the market or relevant benchmarks. If the sub-adviser's investment strategy does not perform as expected, the Fund could underperform its peers or lose money. There is no guarantee the Fund will achieve its stated objective.
Foreign Investment and Emerging Markets Risk: Investments in foreign securities may be riskier than investments in U.S. securities. Potential risks include the risks of illiquidity, increased price volatility, less government regulation, less extensive and less frequent accounting and other reporting requirements, unfavorable changes in currency exchange rates, and economic and political disruptions. These risks are generally greater for investments in emerging markets.
Natural Resources Risk: Investments in the natural resources sector include liquidity risk and risk of loss if there are adverse developments in the sector.
Inflation Protected Securities Risk: The market for inflation protected securities may be less developed or liquid, and more volatile, than other securities markets.
Derivatives Risk: Investments in derivatives can be volatile. Potential risks include currency risk, leverage risk (the risk that small market movements may result in large changes in the value of an investment), liquidity risk, index risk, pricing risk, and counterparty risk (the risk that the counterparty may be unwilling or unable to honor its obligations).
Junk Bond Risk: Investments in junk bonds involve greater risk of price volatility, illiquidity, and default than higher-rated debt securities.
Fixed Income Risk: The Fund is subject to interest rate risk (the risk that the value of an investment decreases when interest rates rise), credit risk (the risk that the issuing company of a security is unable to pay interest and principal when due) and call risk (the risk that an investment may be redeemed early).
Asset Allocation Strategy Risk: The portfolio managers' asset allocation strategy may not always work as intended, and asset allocation does not guarantee better performance or reduce the risk of investment loss.
Cayman Subsidiary Risk: Investing in a Cayman Islands subsidiary exposes the Fund to the risks associated with the subsidiary and its investments.
Commodities Risk: Investments in commodities may be more volatile than investments in traditional securities.
Active Trading Risk: Actively trading investments may result in higher costs and higher taxable income.
| 52 |
THIS PRIVACY POLICY IS NOT PART OF THIS REPORT
Privacy Policy and Practices of The Hartford Financial Services Group, Inc. and its Affiliates
(herein called “we, our and us”)
This Privacy Policy applies to our United States Operations
|
We value your trust. We are committed to the responsible: a) management; b) use; and c) protection; of Personal Information.
This notice describes how we collect, disclose, and protect Personal Information.
We collect Personal Information to: a) service your Transactions with us; and b) support our business functions.
We may obtain Personal Information from: a) You; b) your Transactions with us; and c) third parties such as a consumer-reporting agency.
Based on the type of product or service You apply for or get from us, Personal Information such as: a) your name; b) your address; c) your income; d) your payment; or e) your credit history; may be gathered from sources such as applications, Transactions, and consumer reports.
To serve You and service our business, we may share certain Personal Information. We will share Personal Information, only as allowed by law, with affiliates such as: a) our insurance companies; b) our employee agents; c) our brokerage firms; and d) our administrators.
As allowed by law, we may share Personal Financial Information with our affiliates to: a) market our products; or b) market our services; to You without providing You with an option to prevent these disclosures.
|
We may also share Personal Information, only as allowed by law, with unaffiliated third parties including: a) independent agents; b) brokerage firms; c) insurance companies; d) administrators; and e) service providers; who help us serve You and service our business.
When allowed by law, we may share certain Personal Financial Information with other unaffiliated third parties who assist us by performing services or functions such as: a) taking surveys; b) marketing our products or services; or c) offering financial products or services under a joint agreement between us and one or more financial institutions.
We, and third parties we partner with, may track some of the pages You visit through the use of: a) cookies; b) pixel tagging; or c) other technologies; and currently do not process or comply with any web browser’s “do not track” signal or similar mechanism that indicates a request to disable online tracking of individual users who visit our websites or use our services.
We will not sell or share your Personal Financial Information with anyone for purposes unrelated to our business functions without offering You the opportunity to: a) “opt-out;” or b) “opt-in;” as required by law.
We only disclose Personal Health Information with: a) your proper written authorization; or b) as otherwise allowed or required by law.
Our employees have access to Personal Information in the course of doing their jobs, such as: a) underwriting policies; b) paying claims; c) developing new products; or d) advising customers of our products and services. |
|
We use manual and electronic security procedures to maintain: a) the confidentiality; and b) the integrity of; Personal Information that we have. We use these procedures to guard against unauthorized access.
Some techniques we use to protect Personal Information include: a) secured files; b) user authentication; c) encryption; d) firewall technology; and e) the use of detection software.
We are responsible for and must: a) identify information to be protected; b) provide an adequate level of protection for that data; c) grant access to protected data only to those people who must use it in the performance of their job-related duties.
Employees who violate our Privacy Policy will be subject to discipline, which may include ending their employment with us.
At the start of our business relationship, we will give You a copy of our current Privacy Policy.
We will also give You a copy of our current Privacy Policy once a year if You maintain a continuing business relationship with us.
We will continue to follow our Privacy Policy regarding Personal Information even when a business relationship no longer exists between us.
|
As used in this Privacy Notice:
Application means your request for our product or service.
Personal Financial Information means financial information such as: a) credit history; b) income; c) financial benefits; or d) policy or claim information.
Personal Health Information means health information such as: a) your medical records; or b) information about your illness, disability or injury.
Personal Information means information that identifies You personally and is not otherwise available to the public. It includes: a) Personal Financial Information; and b) Personal Health Information.
Transaction means your business dealings with us, such as: a) your Application; b) your request for us to pay a claim; and c) your request for us to take an action on your account.
You means an individual who has given us Personal Information in conjunction with: a) asking about; b) applying for; or c) obtaining; a financial product or service from us if the product or service is used mainly for personal, family, or household purposes. |
This Privacy Policy is being provided on behalf of the following affiliates of The Hartford Financial Services Group, Inc.:
1stAGChoice, Inc.; Access CoverageCorp, Inc.; Access CoverageCorp Technologies, Inc.; American Maturity Life Insurance Company; Archway 60 R, LLC; Business Management Group, Inc.; Champlain Life Reinsurance Company; DMS R, LLC; Eloy R, LLC; Ersatz Corporation; First State Insurance Company; Hartford Accident and Indemnity Company; Hartford Administrative Services Company; Hartford Casualty General Agency, Inc.; Hartford Casualty Insurance Company; Hartford-Comprehensive Employee Benefit Service Company; Hartford Equity Sales Company, Inc.; Hartford Fire General Agency, Inc.; Hartford Fire Insurance Company; Hartford Funds Management Company, LLC; Hartford Funds Management Group, Inc.; Hartford HLS Series Fund II, Inc.; Hartford Insurance Company of Illinois; Hartford Insurance Company of the Midwest; Hartford Insurance Company of the Southeast; Hartford Integrated Technologies, Inc.; Hartford International Life Reassurance Corporation; Hartford Funds Distributors, LLC; Hartford Investment Management Company; Hartford Life and Accident Insurance Company; Hartford Life and Annuity Insurance Company; Hartford Life Insurance Company; Hartford Life Private Placement, LLC; Hartford Lloyd’s Corporation; Hartford Lloyd’s Insurance Company; Hartford Mezzanine Investors I, LLC; Hartford Residual Market, L.C.C.; Hartford Retirement Services, LLC; Hartford Securities Distribution Company, Inc.; Hartford Series Fund, Inc.; Hartford Specialty Insurance Services of Texas, LLC; Hartford Strategic Investments, LLC; Hartford Underwriters Insurance Company; Hartford Technology Services Company, L.L.C.; Hartford of Texas General Agency, Inc.; Hartford Underwriters General Agency, Inc.; HARTRE Company, L.C.C.; HL Investment Advisors, LLC; HLA LLC; Horizon Management Group, LLC; HRA Brokerage Services, Inc.; Lanidex Class B, LLC; M-CAP Insurance Agency, LLC; New England Insurance Company; New England Reinsurance Corporation; Nutmeg Insurance Agency, Inc.; Nutmeg Insurance Company; Pacific Insurance Company, Limited; Planco, LLC: Property and Casualty Insurance Company of Hartford; Revere R, LLC; RVR R, LLC; Sentinel Insurance Company, Ltd.; Sunstone R, LLC; Symphony R, LLC; The Evergreen Group Incorporated; The Hartford Alternative Strategies Fund; The Hartford Mutual Funds, Inc.; The Hartford Mutual Funds II, Inc.; Trumbull Flood Management, L.L.C.; Trumbull Insurance Company; Twin City Fire Insurance Company; White River Life Reinsurance Company.
HPP Revised January 2014
HARTFORDFUNDS
hartfordfunds.com
This information is written in connection with the promotion or marketing of the matter(s) addressed in this material.
This report is submitted for the general information of the shareholders of the Fund. It is not authorized for distribution unless preceded or accompanied by a current prospectus for the Fund.
The information cannot be used or relied upon for the purpose of avoiding IRS penalties. These materials are not intended to provide tax, accounting or legal advice. As with all matters of a tax or legal nature, you should consult your own tax or legal counsel for advice.
Investors should carefully consider the investment objectives, risks, charges, and expenses of Hartford Funds before investing. This and other information can be found in the prospectus and summary prospectus, which can be obtained by calling 888-843-7824 (retail) or 800-279-1541 (institutional). Investors should read them carefully before they invest.
Hartford Funds are underwritten and distributed by Hartford Funds Distributors, LLC.
MFAR-GRA14 12/14 113977-3 Printed in U.S.A.
HARTFORDFUNDS
|
THE HARTFORD
GROWTH ALLOCATION FUND
2014 Annual Report |
A MESSAGE FROM THE PRESIDENT
Dear Fellow Shareholders:
Thank you for investing in Hartford Funds.
Market Review
U.S. equities (as represented by the S&P 500 Index) rose steadily for the fiscal year ended October 31, 2014, with a return of 17.27% for the period. With the exception of short-lived geopolitical scares early in 2014 and concerns about continuing global growth near the end of the period, stocks generally rose on solid fundamentals and encouraging macroeconomic data during the year.
September 2014 marked the six-year anniversary of the start of the financial crisis. Within weeks of that anniversary, both the S&P 500 Index and the Dow Jones Industrial Average set new all-time highs, closing at 2,018 and 17,391, respectively, on October 31. Although the fallout of the crisis continues to influence investor behavior, stocks have recovered and risen dramatically, up 198% from their low in March 2009. Meanwhile, the domestic economy is notching strong growth, and the unemployment rate has reached its lowest level since August 2008.
While the U.S. economy appears to have stabilized and to have reverted to a solid growth path, the outlook for the global economy appears to have gotten cloudier. The U.S. Federal Reserve has ended quantitative easing, while Europe and Japan are pursuing stimulus options to avoid a double-dip recession and deflation, respectively. Diverging central-bank policies will likely continue to play an important role in market movements going forward as investors wait to see the reactions to their efforts and their impacts on global markets.
How have market movements impacted your portfolio throughout the last year? Are your investments still on track to provide the growth or income you need, and are you comfortable with their progress during times of volatility?
Your financial professional can help you navigate today’s markets with confidence, as well as assist you to achieve your investment goals by providing advice on the best options within our fund family to help you work toward overcoming today’s investing challenges. Meet with your financial advisor regularly to examine your portfolio and your investment strategy, and to determine if you’re still on track to meet your goals.
Thank you again for investing with Hartford Funds.
James Davey
President
Hartford Funds
1 The S&P 500 Index is a market capitalization-weighted price index composed of 500 widely held common stocks.
2 The Dow Jones Industrial Average is an unmanaged, price-weighted index of 30 of the largest, most widely held stocks traded on the NYSE
The Hartford Growth Allocation Fund
The views expressed in the Fund’s Manager Discussion under ‘‘Why did the Fund perform this way?’’ and ‘‘What is the outlook?’’ are views of the Fund’s investment manager through the end of the period and are subject to change based on market and other conditions. The Fund’s Manager Discussion is for informational purposes only and does not represent an offer, recommendation or solicitation to buy, hold or sell any security. The specific securities identified and described, if any, do not represent all of the securities purchased or sold and you should not assume that investments in the securities identified and discussed will be profitable.
| The Hartford Growth Allocation Fund inception 05/28/2004 |
| (advised by Hartford Funds Management Company, LLC (“HFMC”)) |
|
Investment objective – The Fund seeks long-term capital appreciation. |
Performance Overview 10/31/04 - 10/31/14

The chart above represents the hypothetical growth of a $10,000 investment in Class A, which includes a sales charge. Growth results in classes other than class A will vary from what is seen above due to differences in the expenses charged to those share classes.
Average Annual Total Returns (as of 10/31/14)
| 1 Year | 5 Years | 10 Years | ||||||||||
| Growth Allocation A# | 6.40 | % | 10.72 | % | 6.48 | % | ||||||
| Growth Allocation A## | 0.55 | % | 9.48 | % | 5.88 | % | ||||||
| Growth Allocation B# | 5.52 | % | 9.85 | % | 5.85 | %* | ||||||
| Growth Allocation B## | 0.52 | % | 9.57 | % | 5.85 | %* | ||||||
| Growth Allocation C# | 5.60 | % | 9.93 | % | 5.72 | % | ||||||
| Growth Allocation C## | 4.60 | % | 9.93 | % | 5.72 | % | ||||||
| Growth Allocation I# | 6.74 | % | 11.10 | % | 6.78 | % | ||||||
| Growth Allocation R3# | 6.09 | % | 10.41 | % | 6.22 | % | ||||||
| Growth Allocation R4# | 6.39 | % | 10.77 | % | 6.50 | % | ||||||
| Growth Allocation R5# | 6.75 | % | 11.10 | % | 6.75 | % | ||||||
| Barclays U.S. Aggregate Bond Index | 4.14 | % | 4.22 | % | 4.64 | % | ||||||
| Growth Allocation Fund Blended Index | 7.53 | % | 9.93 | % | 7.29 | % | ||||||
| MSCI All Country World Index | 8.32 | % | 11.15 | % | 7.65 | % | ||||||
| # | Without sales charge |
| ## | With sales charge |
| * | Class B shares convert to Class A shares after 8 years. The return shown reflects the conversion to Class A shares, which had different operating expenses, for the period after conversion. |
PERFORMANCE DATA QUOTED REPRESENTS PAST PERFORMANCE AND DOES NOT GUARANTEE FUTURE RESULTS. The investment return and principal value of the investment will fluctuate so that investors’ shares, when redeemed, may be worth more or less than their original cost. Current performance may be lower or higher than the performance data quoted. To obtain performance data current to the most recent month-end, please visit our website www.hartfordfunds.com.
The initial investment in Class A shares reflects the maximum sales charge of 5.50% and returns for Class B shares reflect a contingent deferred sales charge of up to 5.00% and declining to zero, depending on the period of time the shares are held. Returns for Class C shares reflect a contingent deferred sales charge of up to 1.00% on shares redeemed within twelve months of purchase.
Total returns presented above were calculated using the Fund’s net asset value available to shareholders for sale or redemption of Fund shares on October 31, 2014, which may exclude investment transactions as of this date. All share class returns assume the reinvestment of all distributions at net asset value and the deduction of all fund expenses.
Effective 9/30/09, Class B shares of the Fund were closed to new investments.
Class I shares commenced operations on 8/31/06. Performance prior to that date is that of the Fund’s Class A shares (excluding sales charges), which had different operating expenses. Class R3, R4 and R5 shares commenced operations on 12/22/06. Performance prior to that date is that of the Fund’s Class A shares (excluding sales charges), which had different operating expenses.
Performance information includes performance under the Fund’s previous sub-advisers, Hartford Investment Management Company, using a modified investment strategy, and Wellington Management Company, LLP ("Wellington Management"). As of June 4, 2012, Hartford Investment Management Company no longer served as the sub-adviser to the Fund.
Effective May 31, 2014, Wellington Management no longer serves as the sub-adviser to the Fund. In connection with these changes, HFMC has assumed the day-to-day management of the Fund.
Performance information may reflect historical or current expense waivers/reimbursements from the investment adviser, without which performance would have been lower. For information on current expense waivers/reimbursements, please see the prospectus.
Barclays U.S. Aggregate Bond Index is an unmanaged index and is composed of securities from the Barclays Government/Credit Bond Index, Mortgage-Backed Securities Index, Asset-Backed Securities Index and Commercial Mortgage-Backed Securities Index.
Growth Allocation Fund Blended Index is calculated by Hartford Funds Management Company, LLC and represents the weighted return of 20% Barclays U.S. Aggregate Bond Index and 80% MSCI All Country World Index.
MSCI All Country World Index is a free float-adjusted market capitalization index that measures equity market performance in the global developed and emerging markets, consisting of 45 developed and emerging market country indices.
You cannot invest directly in an index.
The chart and table do not reflect the deductions of taxes that a shareholder would pay on Fund distributions or the redemption of Fund shares.
| 2 |
| The Hartford Growth Allocation Fund |
| Manager Discussion |
| October 31, 2014 (Unaudited) |
| Operating Expenses* | ||||||||
| Net | Gross | |||||||
| Growth Allocation Class A | 1.36 | % | 1.36 | % | ||||
| Growth Allocation Class B | 2.19 | % | 2.19 | % | ||||
| Growth Allocation Class C | 2.09 | % | 2.09 | % | ||||
| Growth Allocation Class I | 1.04 | % | 1.04 | % | ||||
| Growth Allocation Class R3 | 1.65 | % | 1.65 | % | ||||
| Growth Allocation Class R4 | 1.35 | % | 1.35 | % | ||||
| Growth Allocation Class R5 | 1.05 | % | 1.05 | % | ||||
| * | As shown in the Fund's current prospectus dated March 1, 2014. Actual expenses may be higher or lower. Expenses shown include expenses of the Underlying Funds. Please see accompanying Financial Highlights for expense ratios for the year ended October 31, 2014. |
Gross expenses are the Fund's total annual operating expenses shown in the Fund's most recent prospectus. Net expenses are the Fund's total annual operating expenses shown in the Fund's most recent prospectus and reflect contractual expense reimbursements in instances when these reductions reduce the Fund's gross expenses. Contractual reimbursements remain in effect until February 28, 2015, and automatically renew for one-year terms unless terminated.
All investments are subject to risk including the possible loss of principal. For a discussion of the Fund’s risks, please see the Main Risks section of this report. For more detailed information on the risks associated with an investment in the Fund, please see the prospectus.
| Portfolio Manager |
| Vernon J. Meyer, CFA |
| Managing Director and Chief Investment Officer of Hartford Funds Management Company, LLC (“HFMC”) and Chairman of HFMC Investment Oversight Committee |
How did the Fund perform?
The Class A shares of The Hartford Growth Allocation Fund returned 6.40%, before sales charge, for the twelve-month period ended October 31, 2014 underperforming the Fund’s blended benchmark, 80% MSCI All Country World Index/20% Barclays U.S. Aggregate Bond Index, which returned 7.53% for the same period. In comparison, the Barclays U.S. Aggregate Bond Index and the MSCI All Country World Index returned 4.14% and 8.32%, respectively, for the same period. The Fund also underperformed the 8.98% average return for the Lipper Mixed-Asset Target Growth Funds category, a group of funds with equity weights of 60%-80%.
Why did the Fund perform this way?
Global equities rose during the period, notwithstanding bouts of significant volatility. Despite ongoing geopolitical tensions in Ukraine and the Middle East, concerns about a Chinese growth slowdown, and unsettling economic and political developments in several other emerging market countries, the five-year-old bull market marched on in the first half of 2014. Robust merger and acquisition activity, along with continued accommodative monetary policy from central banks around the globe, aided positive investor sentiment in May and June. However, Portuguese banking woes, European economic malaise, and the prospect of an accelerated U.S. Federal Reserve (Fed) interest-rate-hike timeline all contributed to stall the global stock rally near the tail end of the period. In addition, China's property slump and poor gross domestic product (GDP) readings in Japan and the eurozone raised the specter of a slowdown in global economic growth. Nevertheless, there were several positive developments, including monetary easing by the European Central Bank (ECB) and the People's Bank of China, as well as an encouraging U.S. corporate earnings season. During the period, emerging market equities underperformed their developed market counterparts and U.S. stocks generally outperformed non-U.S. stocks.
Fixed income markets gained throughout much of the period as expectations of prolonged easy monetary policy by major central banks and a supportive macroeconomic environment kept rates low and suppressed volatility. Early in the period, emerging markets dominated headlines as economic and political developments sparked risk aversion across global markets, pushing bond prices higher and yields lower amid a flight to quality. Toward the end of the period, however, persistent geopolitical risks – tensions between Ukraine and Russia and violence in Iraq – and Chinese economic slowdown concerns raised questions about the global growth rate, keeping a lid on risk appetites overall.
The period was also highlighted by a divergence in central bank policies. The ECB cut its benchmark lending and deposit rates and announced a host of stimulus measures in an effort to encourage lending and fend off fears of deflation. China’s central bank joined the ECB in boosting liquidity by injecting funds into the nation’s largest banks in an attempt to combat weakening growth. The Bank of Japan pre-emptively announced incremental monetary easing to counter the risk of missing the country’s inflation and growth targets. In contrast, the Bank of England and Fed leaned toward tighter policies. The Fed ended its quantitative easing program as U.S. data largely suggested the economy was on a sustainable growth path. In the U.S., second quarter GDP rebounded after the first quarter’s steep contraction. The labor market strengthened as the unemployment rate dropped to a six-year low. Housing regained some lost ground after a weak start to the year, though the pace of home price appreciation started to slow after a strong 2013. Inflation pressures were muted overall, alleviating pressure on the Fed to raise rates.
The U.S. Treasury curve flattened as markets contemplated bringing interest rates to normal levels; short-term yields rose while longer term rates declined. Most credit risk sectors posted positive absolute
| 3 |
| The Hartford Growth Allocation Fund |
| Manager Discussion – (continued) |
|
October 31, 2014 (Unaudited) |
returns and outperformed duration-equivalent government bonds as credit spreads tightened.
During the period, the list of available Underlying Funds was revised to include the following Funds: Hartford Global Capital Appreciation Fund, Hartford Global Equity Income Fund, Hartford Multi-Asset Income Fund, The Hartford Emerging Markets Research Fund, The Hartford World Bond Fund, The Hartford MidCap Fund, The Hartford MidCap Value Fund, The Hartford Small Company Fund, and Hartford Real Total Return Fund.
During the period from November 1, 2013 to May 31, 2014 (period when the Fund was sub-advised by Wellington Management Company, LLC (“Wellington Management”)), allocations to The Hartford Dividend and Growth Fund and The Hartford MidCap Value Fund contributed the most to relative performance. Allocations to The Hartford Emerging Markets Research and The Hartford International Opportunities Fund detracted from relative performance versus the Fund’s blended benchmark.
During the period from May 31, 2014 to October 31, 2014 (period when the Fund was managed directly by HFMC), allocations to The Hartford Small Company Fund and The Hartford MidCap Fund contributed the most to performance. Allocations to Hartford Real Total Return Fund and Hartford Global Equity Income Fund detracted the most from both relative and absolute performance. Derivatives are not utilized at the aggregate fund level but are utilized at the underlying fund level.
Effective May 31, 2014, Wellington Management no longer serves as the sub-adviser to the Fund. As a result of this change, Vernon J. Meyer replaced Richard P. Meagher and Wendy M. Cromwell as the portfolio manager of the Fund. The investment objective did not change, and the Fund continues to seek long-term capital appreciation.
What is the outlook?
The Fund ended the period with an overweight to international equities, smaller cap equities, and non-U.S. bonds, relative to its blended benchmark. We will continue to manage the Fund within the bands of the 80% equity, 20% fixed income strategic targets.
| Composition by Investments | ||||
| as of October 31, 2014 | ||||
| Fund Name | Percentage of | |||
| Hartford Global Capital Appreciation Fund | 22.2 | % | ||
| Hartford Global Equity Income Fund | 20.2 | |||
| Hartford Multi-Asset Income Fund | 11.8 | |||
| Hartford Real Total Return Fund | 4.9 | |||
| The Hartford Emerging Markets Research Fund | 9.8 | |||
| The Hartford MidCap Fund | 7.1 | |||
| The Hartford MidCap Value Fund | 7.1 | |||
| The Hartford Small Company Fund | 7.1 | |||
| The Hartford World Bond Fund | 9.8 | |||
| Other Assets and Liabilities | 0.0 | |||
| Total | 100.0 | % | ||
| 4 |
| The Hartford Growth Allocation Fund |
| Schedule of Investments |
| October 31, 2014 |
| (000’s Omitted) |
| Shares or Principal Amount | Market Value ╪ | |||||||||||
| Affiliated Investment Companies - 100.0% | ||||||||||||
| Alternative Strategy Funds - 4.9% | ||||||||||||
| 4,515 | Hartford Real Total Return Fund● | $ | 45,781 | |||||||||
| Total Alternative Strategy Funds | ||||||||||||
| (Cost $46,843) | $ | 45,781 | ||||||||||
| Domestic Equity Funds - 21.3% | ||||||||||||
| 2,127 | The Hartford MidCap Fund | $ | 66,162 | |||||||||
| 3,691 | The Hartford MidCap Value Fund | 65,625 | ||||||||||
| 2,350 | The Hartford Small Company Fund | 66,443 | ||||||||||
| 198,230 | ||||||||||||
| Total Domestic Equity Funds | ||||||||||||
| (Cost $177,178) | $ | 198,230 | ||||||||||
| International/Global Equity Funds - 52.2% | ||||||||||||
| 9,887 | Hartford Global Capital Appreciation Fund | $ | 206,252 | |||||||||
| 15,963 | Hartford Global Equity Income Fund | 187,410 | ||||||||||
| 10,004 | The Hartford Emerging Markets Research Fund | 90,832 | ||||||||||
| 484,494 | ||||||||||||
| Total International/Global Equity Funds | ||||||||||||
| (Cost $483,919) | $ | 484,494 | ||||||||||
| Mixed-Asset Funds - 11.8% | ||||||||||||
| 10,988 | Hartford Multi-Asset Income Fund | $ | 109,330 | |||||||||
| Total Mixed-Asset Funds | ||||||||||||
| (Cost $111,740) | $ | 109,330 | ||||||||||
| Taxable Fixed Income Funds - 9.8% | ||||||||||||
| 8,433 | The Hartford World Bond Fund | $ | 90,828 | |||||||||
| Total Taxable Fixed Income Funds | ||||||||||||
| (Cost $90,930) | $ | 90,828 | ||||||||||
| Total Investments in Affiliated Investment Companies | ||||||||||||
| (Cost $910,610) | $ | 928,663 | ||||||||||
| Total Long-Term Investments | ||||||||||||
| (Cost $910,610) | $ | 928,663 | ||||||||||
| Total Investments | ||||||||||||
| (Cost $910,610) ▲ | 100.0 | % | $ | 928,663 | ||||||||
| Other Assets and Liabilities | — | % | (331 | ) | ||||||||
| Total Net Assets | 100.0 | % | $ | 928,332 | ||||||||
The accompanying notes are an integral part of these financial statements.
| 5 |
| The Hartford Growth Allocation Fund |
| Schedule of Investments – (continued) |
|
October 31, 2014 |
| (000’s Omitted) |
Note: Percentage of investments as shown is the ratio of the total market value to total net assets.
For Fund compliance purposes, the Fund may not use the same classification system shown in this report as these classifications are used for reporting ease.
| ▲ | At October 31, 2014, the cost of securities for federal income tax purposes was $912,341 and the aggregate gross unrealized appreciation and depreciation based on that cost were: |
| Unrealized Appreciation | $ | 28,729 | ||
| Unrealized Depreciation | (12,407 | ) | ||
| Net Unrealized Appreciation | $ | 16,322 |
| ● | Non-income producing. |
| ╪ | See Significant Accounting Policies of accompanying Notes to Financial Statements regarding valuation of securities. |
The accompanying notes are an integral part of these financial statements.
| 6 |
| The Hartford Growth Allocation Fund |
| Schedule of Investments – (continued) |
| October 31, 2014 |
| (000’s Omitted) |
|
Investment Valuation Hierarchy Level Summary |
| October 31, 2014 |
| Total | Level 1 ♦ | Level 2 ♦ | Level 3 | |||||||||||||
| Assets: | ||||||||||||||||
| Affiliated Investment Companies | $ | 928,663 | $ | 928,663 | $ | – | $ | – | ||||||||
| Total | $ | 928,663 | $ | 928,663 | $ | – | $ | – | ||||||||
| ♦ | For the year ended October 31, 2014, there were no transfers between Level 1 and Level 2. |
| Note: | For purposes of reporting transfers between different hierarchy levels, both transfers in and out of each level, as applicable, are shown as if they occurred at the beginning of the period. |
The accompanying notes are an integral part of these financial statements.
| 7 |
| The Hartford Growth Allocation Fund |
| Statement of Assets and Liabilities |
| October 31, 2014 |
|
(000’s Omitted) |
| Assets: | ||||
| Investments in affiliated investment companies, at market value (cost $910,610) | $ | 928,663 | ||
| Receivables: | ||||
| Investment securities sold | 348 | |||
| Fund shares sold | 465 | |||
| Other assets | 46 | |||
| Total assets | 929,522 | |||
| Liabilities: | ||||
| Payables: | ||||
| Investment securities purchased | 153 | |||
| Fund shares redeemed | 770 | |||
| Investment management fees | 22 | |||
| Administrative fees | 1 | |||
| Distribution fees | 80 | |||
| Accrued expenses | 164 | |||
| Total liabilities | 1,190 | |||
| Net assets | $ | 928,332 | ||
| Summary of Net Assets: | ||||
| Capital stock and paid-in-capital | $ | 722,570 | ||
| Undistributed net investment income | 4,285 | |||
| Accumulated net realized gain | 183,424 | |||
| Unrealized appreciation of investments | 18,053 | |||
| Net assets | $ | 928,332 | ||
| Shares authorized | 400,000 | |||
| Par value | $ | 0.001 | ||
| Class A: Net asset value per share/Maximum offering price per share | $15.10/$15.98 | |||
| Shares outstanding | 41,653 | |||
| Net assets | $ | 628,969 | ||
| Class B: Net asset value per share | $ | 14.91 | ||
| Shares outstanding | 2,722 | |||
| Net assets | $ | 40,575 | ||
| Class C: Net asset value per share | $ | 14.90 | ||
| Shares outstanding | 14,053 | |||
| Net assets | $ | 209,438 | ||
| Class I: Net asset value per share | $ | 15.06 | ||
| Shares outstanding | 435 | |||
| Net assets | $ | 6,553 | ||
| Class R3: Net asset value per share | $ | 14.83 | ||
| Shares outstanding | 1,322 | |||
| Net assets | $ | 19,608 | ||
| Class R4: Net asset value per share | $ | 15.04 | ||
| Shares outstanding | 1,111 | |||
| Net assets | $ | 16,704 | ||
| Class R5: Net asset value per share | $ | 15.13 | ||
| Shares outstanding | 429 | |||
| Net assets | $ | 6,485 |
The accompanying notes are an integral part of these financial statements.
| 8 |
| The Hartford Growth Allocation Fund |
| Statement of Operations |
|
For the Year Ended October 31, 2014 |
|
(000’s Omitted) |
| Investment Income: | ||||
| Dividends from affiliated investment companies | $ | 11,645 | ||
| Total investment income | 11,645 | |||
| Expenses: | ||||
| Investment management fees | 1,195 | |||
| Administrative services fees | ||||
| Class R3 | 41 | |||
| Class R4 | 27 | |||
| Class R5 | 7 | |||
| Transfer agent fees | ||||
| Class A | 910 | |||
| Class B | 130 | |||
| Class C | 279 | |||
| Class I | 4 | |||
| Class R3 | 1 | |||
| Class R4 | — | |||
| Class R5 | — | |||
| Distribution fees | ||||
| Class A | 1,570 | |||
| Class B | 523 | |||
| Class C | 2,146 | |||
| Class R3 | 102 | |||
| Class R4 | 45 | |||
| Custodian fees | 3 | |||
| Accounting services fees | 114 | |||
| Registration and filing fees | 119 | |||
| Board of Directors' fees | 25 | |||
| Audit fees | 17 | |||
| Other expenses | 143 | |||
| Total expenses (before waivers) | 7,401 | |||
| Management fee waivers | (60 | ) | ||
| Total waivers | (60 | ) | ||
| Total expenses, net | 7,341 | |||
| Net Investment Income | 4,304 | |||
| Net Realized Gain on Investments: | ||||
| Capital gain distributions received from affiliated investment companies | 30,584 | |||
| Net realized gain on investments in affiliated investment companies | 181,223 | |||
| Net realized gain on investments | 3,208 | |||
| Net Realized Gain on Investments | 215,015 | |||
| Net Changes in Unrealized Depreciation of Investments: | ||||
| Net unrealized depreciation of investments in affiliated investment companies | (160,647 | ) | ||
| Net unrealized depreciation of investments | (2,890 | ) | ||
| Net Changes in Unrealized Depreciation of Investments | (163,537 | ) | ||
| Net Gain on Investments | 51,478 | |||
| Net Increase in Net Assets Resulting from Operations | $ | 55,782 |
The accompanying notes are an integral part of these financial statements.
| 9 |
| The Hartford Growth Allocation Fund |
| Statement of Changes in Net Assets |
| (000’s Omitted) |
| For the Year Ended October 31, 2014 | For the Year Ended October 31, 2013 | |||||||
| Operations: | ||||||||
| Net investment income | $ | 4,304 | $ | 6,716 | ||||
| Net realized gain on investments | 215,015 | 38,797 | ||||||
| Net unrealized appreciation (depreciation) of investments | (163,537 | ) | 113,821 | |||||
| Net Increase in Net Assets Resulting from Operations | 55,782 | 159,334 | ||||||
| Distributions to Shareholders: | ||||||||
| From net investment income | ||||||||
| Class A | (3,439 | ) | (13,888 | ) | ||||
| Class B | — | (1,527 | ) | |||||
| Class C | — | (3,957 | ) | |||||
| Class I | (42 | ) | (101 | ) | ||||
| Class R3 | (60 | ) | (442 | ) | ||||
| Class R4 | (106 | ) | (372 | ) | ||||
| Class R5 | (55 | ) | (214 | ) | ||||
| Total distributions | (3,702 | ) | (20,501 | ) | ||||
| Capital Share Transactions: | ||||||||
| Class A | (15,830 | ) | 1,554 | |||||
| Class B | (27,107 | ) | (36,922 | ) | ||||
| Class C | (14,931 | ) | (15,858 | ) | ||||
| Class I | 1,634 | 735 | ||||||
| Class R3 | (917 | ) | (913 | ) | ||||
| Class R4 | (1,312 | ) | (2,471 | ) | ||||
| Class R5 | (462 | ) | (2,427 | ) | ||||
| Net decrease from capital share transactions | (58,925 | ) | (56,302 | ) | ||||
| Net Increase (Decrease) in Net Assets | (6,845 | ) | 82,531 | |||||
| Net Assets: | ||||||||
| Beginning of period | 935,177 | 852,646 | ||||||
| End of period | $ | 928,332 | $ | 935,177 | ||||
| Undistributed (distributions in excess of) net investment income | $ | 4,285 | $ | — | ||||
The accompanying notes are an integral part of these financial statements.
| 10 |
| The Hartford Growth Allocation Fund |
| Notes to Financial Statements |
| October 31, 2014 |
|
(000’s Omitted) |
Organization:
The Hartford Mutual Funds, Inc. (“Company”) is an open-end management investment company comprised of forty-two portfolios. Financial statements for The Hartford Growth Allocation Fund (the "Fund"), a series of the Company, are included in this report.
The Company is organized under the laws of the State of Maryland and is registered with the Securities and Exchange Commission (“SEC”) under the Investment Company Act of 1940, as amended (“1940 Act”). The Fund is a diversified open-end management investment company. The Fund is an investment company and applies specialized accounting and reporting under Accounting Standards Codification Topic 946, Financial Services - Investment Companies.
Class A shares are sold with a front-end sales charge of up to 5.50%. Class B shares were sold with a contingent deferred sales charge which is assessed on the lesser of the per share net asset value (“NAV”) of the shares at the time of redemption or the original purchase price, and declines from up to 5.00% to zero depending on the period of time the shares are held (see note below regarding the closing of Class B shares). Class C shares are sold with a contingent deferred sales charge of up to 1.00% on shares redeemed within twelve months of purchase. Class I shares are sold without sales charges to certain eligible investors primarily through advisory fee-based wrap programs. Class R3, R4 and R5 shares, which are offered to employer-sponsored retirement plans, are sold without a sales charge. All classes of shares have identical voting, redemption, dividend, liquidation and other rights and the same terms and conditions, with the exceptions that each class may have different expenses, which may affect performance, and that Class B shares automatically convert to Class A shares after 8 years.
The Fund, as a “Fund of Funds,” invests the majority of its assets in Class Y shares of other Hartford Funds ("Affiliated Investment Companies") and may also invest in one or more unaffiliated money market funds (together with the Affiliated Investment Companies, the "Underlying Funds"), certain exchange traded funds (“ETFs”) and/or exchange traded notes (“ETNs”). The Fund seeks its investment goal through implementation of a strategic asset allocation recommendation provided by Hartford Funds Management Company, LLC (“HFMC”), the adviser to the Fund.
No new or additional investments are allowed in Class B shares of the Fund (including investments through any systematic investment plan). Existing shareholders of Class B shares may continue to hold their Class B shares, exchange their Class B shares for Class B shares of another Hartford Fund (as permitted by existing exchange privileges), or redeem their Class B shares as described in the Fund’s prospectus. Reinstatement privileges with respect to Class B shares are set forth in the Fund's prospectus. For investors electing to reinvest capital gains and dividends, any such capital gains or dividends on Class B shares will continue to be reinvested in Class B shares of the Fund. All Class B share attributes, including the 12b-1 fee, contingent deferred sales charge schedule, and conversion to Class A shares, remain unchanged.
Significant Accounting Policies:
The significant accounting policies of the Affiliated Investment Companies are outlined in the shareholder reports for such funds, available (1) without charge, upon request, by calling 888-843-7824, (2) on our website www.hartfordfunds.com and (3) on the SEC’s website at www.sec.gov. The reports may be reviewed and copied at the Commission’s Public Reference Room in Washington, DC. Information on the operation of the Public Reference Room may be obtained by calling 1-800-SEC-0330. The significant accounting policies of the Affiliated Investment Companies are not covered by this report.
The following is a summary of significant accounting policies of the Fund in the preparation of its financial statements, which are in accordance with United States generally accepted accounting principles (“U.S. GAAP”). The preparation of financial statements in accordance with U.S. GAAP may require management to make estimates and assumptions that affect the reported amounts of assets and liabilities and disclosure of contingent assets and liabilities at the date of the financial statements and the reported amounts of increases and decreases in net assets from operations during the reporting period. Actual results could differ from those estimates.
Determination of Net Asset Value – The NAV of each class of the Fund's shares is determined as of the close of regular trading (normally 4:00 p.m. Eastern Time) (the “NYSE Close”) on each day that the New York Stock Exchange (the “Exchange”) is open (“Valuation Date”). Information that becomes known to the Fund after the NAV has been calculated on a particular day will not generally be used to retroactively adjust the NAV determined earlier that day.
| 11 |
| The Hartford Growth Allocation Fund |
| Notes to Financial Statements – (continued) |
| October 31, 2014 |
| (000’s Omitted) |
Investment Valuation and Fair Value Measurements – Investments in open-end mutual funds are valued at the respective NAV of each Underlying Fund as determined as of the NYSE Close on the Valuation Date. The Fund generally uses market prices in valuing the remaining portfolio investments. If market prices are not readily available or are deemed unreliable, the Fund will use the fair value of the investment as determined in good faith under policies and procedures established by and under the supervision of the Company’s Board of Directors.
U.S. GAAP defines fair value as the price that the Fund would receive to sell an asset or pay to transfer a liability in an orderly transaction between market participants. The U.S. GAAP fair value measurement standards require disclosure of a fair value hierarchy for each major category of assets and liabilities. Various inputs are used in determining the fair value of the Fund’s investments. These inputs are summarized into three broad hierarchy levels. This hierarchy is based on whether the valuation inputs are observable or unobservable. These levels are:
Level 1 – Quoted prices in active markets for identical investments. Level 1 may include exchange traded instruments, such as domestic equities, some foreign equities, options, futures, mutual funds, exchange traded funds, rights and warrants.
Level 2 – Observable inputs other than Level 1 prices, such as quoted prices for similar investments; quoted prices in markets that are not active; or other inputs that are observable or can be corroborated by observable market data. Level 2 may include debt investments that are traded less frequently than exchange traded instruments and which are valued using independent pricing services; foreign equities, which are principally traded on certain foreign markets and are adjusted daily pursuant to a fair value pricing service in order to reflect an adjustment for the factors occurring after the close of certain foreign markets but before the NYSE Close; senior floating rate interests, which are valued using an aggregate of dealer bids; short-term investments, which are valued at amortized cost; and swaps, which are valued based upon the terms of each swap contract.
Level 3 – Significant unobservable inputs that are supported by limited or no market activity. Level 3 may include financial instruments whose values are determined using indicative market quotes or require significant management judgment or estimation. These unobservable valuation inputs may include estimates for current yields, maturity/duration, prepayment speed, and indicative market quotes for comparable investments along with other assumptions relating to credit quality, collateral value, complexity of the investment structure, general market conditions and liquidity. This category may include investments where trading has been halted or there are certain restrictions on trading. While these investments are priced using unobservable inputs, the valuation of these investments reflects the best available data and management believes the prices are a reasonable representation of exit price.
Valuation levels are not necessarily indicative of the risk associated with investing in such investments. Individual investments within any of the above mentioned asset classes may be assigned a different hierarchical level than those presented above, as individual circumstances dictate.
For additional information, refer to the Investment Valuation Hierarchy Level Summary which follows the Schedule of Investments.
Investment Transactions and Investment Income – Investment transactions are recorded as of the trade date (the date the order to buy or sell is executed) for financial reporting purposes. Realized gains and losses are determined on the basis of identified cost.
Dividend income is accrued on the ex-dividend date. Income and capital gain distributions from the Underlying Funds are accrued on the ex-dividend date.
Fund Share Valuation and Dividend Distributions to Shareholders – Orders for the Fund’s shares are executed in accordance with the investment instructions of the shareholders. The NAV of the Fund’s shares is determined as of the close of business on each business day of the Exchange. The NAV is determined separately for each class of shares of the Fund by dividing the Fund’s net assets attributable to that class by the number of shares of the class outstanding. Each class of shares offered by the Fund has equal rights as to assets and voting privileges (except that shareholders of a class have exclusive voting rights regarding any matter relating solely to that class of shares). Income and non-class specific expenses are allocated daily to each class on the basis of the relative net assets of the class. Realized and unrealized gains and losses are allocated daily based on the relative net assets of each class of shares of the Fund.
| 12 |
| The Hartford Growth Allocation Fund |
| Notes to Financial Statements – (continued) |
| October 31, 2014 |
| (000’s Omitted) |
Orders for the purchase of the Fund’s shares received prior to the close of the Exchange on any day the Exchange is open for business are priced at the NAV determined as of the close of the Exchange. Orders received after the close of the Exchange, or on a day on which the Exchange and/or the Fund is not open for business, are priced at the next determined NAV.
Dividends are declared pursuant to a policy adopted by the Company's Board of Directors based upon the investment performance of the Fund. The policy of the Fund is to pay dividends from net investment income and realized gains, if any, at least once a year. Long-term capital gain distributions are distributed by the Underlying Funds at least annually, when required. Unless shareholders specify otherwise, all dividends and distributions will be automatically reinvested in additional full or fractional shares of the Fund.
Net investment income, dividends and distributions from net realized gains and capital are determined in accordance with federal income tax regulations, which may differ from U.S. GAAP with respect to character and timing (see Federal Income Taxes: Distributions and Components of Distributable Earnings and Reclassification of Capital Accounts).
Principal Risks:
The Fund is exposed to the risks of the Underlying Funds and/or ETFs/ETNs in direct proportion to the amount of assets the Fund allocates to each Underlying Fund and/or ETF/ETN. The market values of the Underlying Funds and/or ETFs/ETNs may decline due to general market conditions which are not specifically related to a particular company in which the Underlying Fund and/or ETF/ETN invested, such as real or perceived adverse economic conditions, changes in the general outlook for corporate earnings, changes in interest or currency rates or adverse investor sentiment generally. The market value of equity securities in which the Underlying Funds and/or ETFs/ETNs invest may also decline due to factors which affect a particular industry or industries, such as labor shortages or increased production costs and competitive conditions within an industry.
Federal Income Taxes:
Federal Income Taxes – For federal income tax purposes, the Fund intends to continue to qualify as a Regulated Investment Company ("RIC") under Subchapter M of the Internal Revenue Code (“IRC”) by distributing substantially all of its taxable net investment income and net realized capital gains to its shareholders and otherwise complying with the requirements of the IRC. The Fund has distributed substantially all of its income and capital gains in prior years, if applicable, and intends to distribute substantially all of its income and capital gains during the calendar year ending December 31, 2014. Accordingly, no provision for federal income or excise taxes has been made in the accompanying financial statements. Distributions from short-term capital gains are treated as ordinary income distributions for federal income tax purposes.
Net Investment Income (Loss), Net Realized Gains (Losses) and Distributions – Net investment income (loss) and net realized gains (losses) may differ for financial statement and tax purposes primarily because of losses deferred due to wash sale adjustments and short-term capital gain adjustments. The character of distributions made during the year from net investment income or net realized gains may differ from their ultimate characterization for federal income tax purposes. Also, due to the timing of dividend distributions, the fiscal year in which amounts are distributed may differ from the year that the income or realized gains (losses) were recorded by the Fund.
Distributions and Components of Distributable Earnings – The tax character of distributions paid by the Fund for the periods indicated is as follows (as adjusted for dividends payable, if applicable):
| For the Year Ended October 31, 2014 | For the Year Ended October 31, 2013 | |||||||
| Ordinary Income | $ | 3,702 | $ | 15,254 | ||||
| Long-Term Capital Gains ‡ | — | 5,247 | ||||||
| ‡ | The Fund designates these distributions as long-term capital gain dividends pursuant to IRC Sec. 852(b)(3)(C). |
| 13 |
| The Hartford Growth Allocation Fund |
| Notes to Financial Statements – (continued) |
| October 31, 2014 |
| (000’s Omitted) |
As of October 31, 2014, the Fund’s components of distributable earnings (deficit) on a tax basis are as follows:
| Amount | ||||
| Undistributed Ordinary Income | $ | 4,285 | ||
| Undistributed Long-Term Capital Gain | 198,823 | |||
| Accumulated Capital and Other Losses* | (13,668 | ) | ||
| Unrealized Appreciation† | 16,322 | |||
| Total Accumulated Earnings | $ | 205,762 | ||
| * | The Fund has capital loss carryforwards that are identified in the Capital Loss Carryforward note that follows. | |
| † | Differences between book-basis and tax-basis unrealized appreciation (depreciation) may be attributable to the losses deferred due to wash sale adjustments, foreign currency gains and losses, adjustments related to PFICs, REITs, RICs, certain derivatives and partnerships. |
Reclassification of Capital Accounts – The Fund may record reclassifications in its capital accounts. These reclassifications have no impact on the total net assets of the Fund. The reclassifications are a result of permanent differences between U.S. GAAP and tax accounting for such items as expiration or utilization of capital loss carryforwards or net operating losses. Adjustments are made to reflect the impact these items have on current and future distributions to shareholders. Therefore, the source of the Fund’s distributions may be shown in the accompanying Statement of Changes in Net Assets as from undistributed net investment income, from accumulated net realized gains on investments or from capital depending on the type of book and tax differences that exist. For the year ended October 31, 2014, the Fund recorded reclassifications to increase (decrease) the accounts listed below:
| Amount | ||||
| Undistributed Net Investment Income (Loss) | $ | 3,683 | ||
| Accumulated Net Realized Gain (Loss) | (3,683 | ) | ||
Capital Loss Carryforward – On December 22, 2010, the Regulated Investment Company Modernization Act of 2010 (the “Act”) was enacted, which made changes to the capital loss carryforward rules. The changes are effective for taxable years beginning after the date of enactment. Under the Act, funds are permitted to carry forward capital losses for an unlimited period. However, any losses incurred during those future taxable years will be required to be utilized prior to the losses incurred in pre-enactment taxable years, which carry an expiration date. As a result of this ordering rule, pre-enactment capital loss carryforwards may be more likely to expire unused. Additionally, post-enactment capital loss carryforwards retain their character as either short-term or long-term capital losses rather than being considered all short-term as permitted under prior regulation.
At October 31, 2014 (tax year end), the Fund had capital loss carryforwards for U.S. federal income tax purposes as follows:
| Year of Expiration | Amount | |||
| 2016 | $ | 3,090 | ||
| 2017 | 10,578 | |||
| Total | $ | 13,668 | ||
As a result of mergers in the Fund, certain provisions in the IRC may limit the future utilization of capital losses. During the year ended October 31, 2014, the Fund utilized $6,891 of prior year capital loss carryforwards.
Accounting for Uncertainty in Income Taxes – The Fund has adopted financial reporting rules that require the Fund to analyze all open tax years, as defined by the statute of limitations, for all major jurisdictions. Generally, tax authorities can examine all tax returns filed for the last three years. The Fund does not have an examination in progress.
The Fund has reviewed all open tax years and major jurisdictions and concluded that these financial reporting rules had no effect on the Fund’s financial position or results of operations. There is no tax liability resulting from unrecognized tax benefits relating to uncertain income tax positions taken or expected to be taken on the tax return for the fiscal year ended October 31, 2014. The Fund
| 14 |
| The Hartford Growth Allocation Fund |
| Notes to Financial Statements – (continued) |
| October 31, 2014 |
| (000’s Omitted) |
is also not aware of any tax positions for which it is reasonably possible that the total amounts of unrecognized tax benefits will significantly change in the next twelve months.
Expenses:
Investment Management Agreement – HFMC serves as the Fund’s investment manager pursuant to an Investment Management Agreement with the Company. HFMC is an indirect wholly owned subsidiary of The Hartford Financial Services Group, Inc. ("The Hartford"). The investment manager has overall investment supervisory responsibility for the Fund. In addition, the investment manager provides administrative personnel, services, equipment, facilities and office space for proper operation of the Fund. Prior to May 31, 2014, HFMC contracted with Wellington Management Company, LLP ("Wellington Management") under a sub-advisory agreement for the provision of day-to-day investment management services to the Fund in accordance with the Fund’s investment objective and policies. Effective May 31, 2014, HFMC assumed the day-to-day management of the Fund. The Fund pays a fee to the investment manager, a portion of which may have been used to compensate Wellington Management, prior to May 31, 2014.
The schedule below reflects the rates of compensation paid to the investment manager for investment management services rendered as of October 31, 2014; the rates are accrued daily and paid monthly:
| Average Daily Net Assets | Annual Fee |
| On first $500 million | 0.15% |
| On next $500 million | 0.10% |
| On next $1.5 billion | 0.09% |
| On next $2.5 billion | 0.08% |
| On next $2.5 billion | 0.07% |
| On next $2.5 billion | 0.06% |
| Over $10 billion | 0.05% |
Effective May 31, 2014, HFMC voluntarily agreed to waive investment management fees of 0.015% of average daily net assets until such time as it is revoked by HFMC, in its sole discretion. These amounts are deducted from expenses and are reported as expense waivers on the accompanying Statement of Operations, as applicable.
Accounting Services Agreement – Pursuant to the Fund Accounting Agreement between HFMC and the Company, on behalf of the Fund, HFMC provides accounting services to the Fund and receives monthly compensation based on the Fund’s average daily net assets at the rates set forth below. The Fund’s accounting services fees are accrued daily and paid monthly.
| Average Daily Net Assets | Annual Fee |
| On first $5 billion | 0.012% |
| Over $5 billion | 0.010% |
Operating Expenses – Allocable expenses incurred by the Company are allocated to each Fund and allocated to classes within the Fund in proportion to the average daily net assets of the Fund and each class, except where allocation of certain expenses is more fairly made directly to the Fund or to specific classes within a Fund. As of October 31, 2014, HFMC contractually limited the total operating expenses of this Fund, exclusive of taxes, interest expense, brokerage commissions and extraordinary expenses, through February 28, 2015 as follows:
| Class A | Class B | Class C | Class I | Class R3 | Class R4 | Class R5 |
| 1.50% | 2.25% | 2.25% | 1.25% | 1.70% | 1.40% | 1.10% |
Contractual limitations for total operating expenses include expenses incurred as the result of investing in other investment companies including the Underlying Funds. Amounts incurred which exceed the above limits are deducted from expenses and are reported as expense waivers on the accompanying Statement of Operations, as applicable.
| 15 |
| The Hartford Growth Allocation Fund |
| Notes to Financial Statements – (continued) |
| October 31, 2014 |
| (000’s Omitted) |
Distribution and Service Plan for Class A, B, C, R3 and R4 Shares – Hartford Funds Distributors, LLC ("HFD"), an indirect wholly owned subsidiary of The Hartford, is the principal underwriter and distributor of the Fund. HFD is engaged in distribution activities, which include marketing and distribution of shares through broker/dealers, financing distribution costs and maintaining financial books and records. For the year ended October 31, 2014, HFD received front-end load sales charges of $1,614 and contingent deferred sales charges of $31 from the Fund.
The Fund has adopted a Distribution and Service Plan in accordance with Rule 12b-1 of the 1940 Act to compensate the distributor (HFD) for activities intended to result in the sale and distribution of Class A, B, C, R3 and R4 shares and for providing services for shareholders. The Rule 12b-1 plan applicable to Class A shares of the Fund provides for payment of a Rule 12b-1 fee of 0.25% of average daily net assets. Some or all of the fee may be used for shareholder servicing expenses with the remainder used for distribution expenses. Under the Class B Plan, the Fund pays the distributor 1.00% of the average daily net assets of Class B shares that are outstanding for 8 years or less, 0.25% of which is a fee for services provided to existing shareholders with the remainder used for distribution expenses. Some or the entire Rule 12b-1 fee for Class B shares may be remitted to broker/dealers for distribution and/or shareholder account services. After eight years, Class B shares convert to Class A shares. Upon conversion to Class A shares, the Class A plan described above will apply to those shares. Under the Class C Plan, the Fund pays the distributor 1.00% of the average daily net assets of Class C shares outstanding, 0.25% of which is intended as a fee for services provided to existing shareholders with the remainder used for distribution expenses. For Class C shares, some or the entire fee may be remitted to broker/dealers for distribution and/or shareholder account services. Class R3 shares have a distribution fee of 0.50% of average daily net assets and Class R4 shares have a distribution fee of 0.25% of average daily net assets. For Class R3 and R4 shares, some or the entire fee may be remitted to broker/dealers for distribution and/or shareholder account services. The Fund’s 12b-1 fees are accrued daily and paid monthly or at such other intervals as the Board of Directors may determine.
Other Related Party Transactions – Certain officers of the Fund are directors and/or officers of HFMC and/or The Hartford or its subsidiaries. For the year ended October 31, 2014, a portion of the Fund’s Chief Compliance Officer’s compensation was paid by all of the investment companies in the Hartford fund complex. The portion allocated to the Fund, as represented in other expenses on the Statement of Operations, was in the amount of $2. Hartford Administrative Services Company (“HASCO”), an indirect wholly-owned subsidiary of The Hartford, provides transfer agent services to the Fund. HASCO has contractually agreed to reimburse any portion of the transfer agency fees over 0.30% of average daily net assets per fiscal year for each class. Any transfer agency fee reimbursement is determined before considering the contractual operating expense limitation. For providing such services, HASCO is compensated on a per account basis that varies by account type. The amount paid to HASCO and any related contractual reimbursement amounts, if applicable, can be found in the Statement of Operations. These fees are accrued daily and paid monthly.
Administrative services fees are paid to HASCO for third-party recordkeeping services that are payable as a percentage of net assets in the amount of up to 0.20%, 0.15% and 0.10% for Classes R3, R4 and R5 shares, respectively. The total administrative services fees are shown on the Statement of Operations. These fees are accrued daily and paid monthly.
Investment Transactions:
For the year ended October 31, 2014, the cost of purchases and proceeds from sales of investment securities (excluding short-term investments) were as follows:
| Excluding U.S. Government Obligations | U.S. Government Obligations | Total | ||||||||||
| Cost of Purchases | $ | 972,708 | $ | — | $ | 972,708 | ||||||
| Sales Proceeds | 1,000,470 | — | 1,000,470 | |||||||||
| 16 |
| The Hartford Growth Allocation Fund |
| Notes to Financial Statements – (continued) |
| October 31, 2014 |
| (000’s Omitted) |
Capital Share Transactions:
The following information is for the year ended October 31, 2014, and the year ended October 31, 2013:
| For the Year Ended October 31, 2014 | For the Year Ended October 31, 2013 | |||||||||||||||||||||||||||||||
| Shares Sold | Shares
Issued for Reinvested Dividends | Shares Redeemed | Net
Increase (Decrease) of Shares | Shares Sold | Shares
Issued for Reinvested Dividends | Shares Redeemed | Net
Increase (Decrease) of Shares | |||||||||||||||||||||||||
| Class A | ||||||||||||||||||||||||||||||||
| Shares | 5,245 | 231 | (6,563 | ) | (1,087 | ) | 6,980 | 1,117 | (7,971 | ) | 126 | |||||||||||||||||||||
| Amount | $ | 78,000 | $ | 3,397 | $ | (97,227 | ) | $ | (15,830 | ) | $ | 91,350 | $ | 13,701 | $ | (103,497 | ) | $ | 1,554 | |||||||||||||
| Class B | ||||||||||||||||||||||||||||||||
| Shares | 23 | — | (1,871 | ) | (1,848 | ) | 121 | 121 | (3,084 | ) | (2,842 | ) | ||||||||||||||||||||
| Amount | $ | 348 | $ | — | $ | (27,455 | ) | $ | (27,107 | ) | $ | 1,568 | $ | 1,478 | $ | (39,968 | ) | $ | (36,922 | ) | ||||||||||||
| Class C | ||||||||||||||||||||||||||||||||
| Shares | 1,274 | — | (2,291 | ) | (1,017 | ) | 1,464 | 304 | (2,982 | ) | (1,214 | ) | ||||||||||||||||||||
| Amount | $ | 18,757 | $ | — | $ | (33,688 | ) | $ | (14,931 | ) | $ | 18,948 | $ | 3,706 | $ | (38,512 | ) | $ | (15,858 | ) | ||||||||||||
| Class I | ||||||||||||||||||||||||||||||||
| Shares | 190 | 2 | (84 | ) | 108 | 140 | 8 | (89 | ) | 59 | ||||||||||||||||||||||
| Amount | $ | 2,826 | $ | 36 | $ | (1,228 | ) | $ | 1,634 | $ | 1,820 | $ | 88 | $ | (1,173 | ) | $ | 735 | ||||||||||||||
| Class R3 | ||||||||||||||||||||||||||||||||
| Shares | 266 | 4 | (335 | ) | (65 | ) | 310 | 36 | (417 | ) | (71 | ) | ||||||||||||||||||||
| Amount | $ | 3,880 | $ | 60 | $ | (4,857 | ) | $ | (917 | ) | $ | 3,991 | $ | 442 | $ | (5,346 | ) | $ | (913 | ) | ||||||||||||
| Class R4 | ||||||||||||||||||||||||||||||||
| Shares | 543 | 7 | (650 | ) | (100 | ) | 357 | 30 | (600 | ) | (213 | ) | ||||||||||||||||||||
| Amount | $ | 8,108 | $ | 104 | $ | (9,524 | ) | $ | (1,312 | ) | $ | 4,714 | $ | 366 | $ | (7,551 | ) | $ | (2,471 | ) | ||||||||||||
| Class R5 | ||||||||||||||||||||||||||||||||
| Shares | 54 | 4 | (89 | ) | (31 | ) | 99 | 17 | (307 | ) | (191 | ) | ||||||||||||||||||||
| Amount | $ | 805 | $ | 55 | $ | (1,322 | ) | $ | (462 | ) | $ | 1,288 | $ | 214 | $ | (3,929 | ) | $ | (2,427 | ) | ||||||||||||
| Total | ||||||||||||||||||||||||||||||||
| Shares | 7,595 | 248 | (11,883 | ) | (4,040 | ) | 9,471 | 1,633 | (15,450 | ) | (4,346 | ) | ||||||||||||||||||||
| Amount | $ | 112,724 | $ | 3,652 | $ | (175,301 | ) | $ | (58,925 | ) | $ | 123,679 | $ | 19,995 | $ | (199,976 | ) | $ | (56,302 | ) | ||||||||||||
The following reflects the conversion of Class B shares into Class A shares (reflected as Class A shares sold) for the year ended October 31, 2014, and the year ended October 31, 2013:
| Shares | Dollars | |||||||
| For the Year Ended October 31, 2014 | 531 | $ | 7,869 | |||||
| For the Year Ended October 31, 2013 | 646 | $ | 8,466 | |||||
Line of Credit:
The Fund is one of several Hartford Funds that participate in a $500 million committed revolving line of credit facility. The facility is to be used for temporary or emergency purposes. Under the arrangement, the funds are required to own securities having a market value in excess of 300% of the total bank borrowings. The interest rate on borrowings varies depending on the nature of the loan. The facility also requires a fee to be paid based on the amount of the commitment. This commitment fee is allocated to all the funds participating in the line of credit based on the average net assets of the funds. During the year ended October 31, 2014, the Fund did not have any borrowings under this facility.
Pending Legal Proceedings:
On February 25, 2011, Jennifer L. Kasilag, Louis Mellinger, Judith M. Menendez, Jacqueline M. Robinson, and Linda A. Russell filed a derivative lawsuit against Hartford Investment Financial Services, LLC (“HIFSCO”) (now known as HFD) on behalf of six Hartford retail mutual funds in the United States District Court for the District of New Jersey, alleging that HIFSCO received excessive advisory and distribution fees in violation of its statutory fiduciary duty under Section 36(b) of the 1940 Act when serving as investment manager and principal underwriter, respectively, to the Hartford retail mutual funds. Although this action was purportedly filed on behalf of certain of the Hartford Funds, none of the Hartford Funds is itself a defendant to the suit. HIFSCO moved to dismiss and, in September 2011, the motion was granted in part and denied in part, with leave to amend the complaint. In November 2011, plaintiffs filed an amended complaint on
| 17 |
| The Hartford Growth Allocation Fund |
| Notes to Financial Statements – (continued) |
| October 31, 2014 |
| (000’s Omitted) |
behalf of certain Hartford retail mutual funds, The Hartford Global Health Fund (now known as The Hartford Healthcare Fund), The Hartford Conservative Allocation Fund, The Hartford Growth Opportunities Fund, The Hartford Inflation Plus Fund, The Hartford Advisers Fund (now known as The Hartford Balanced Fund), and The Hartford Capital Appreciation Fund. Plaintiffs seek to rescind the investment management agreements and distribution plans between HIFSCO and these funds and to recover the total fees charged thereunder or, in the alternative, to recover any improper compensation HIFSCO received, in addition to lost earnings. HIFSCO filed a partial motion to dismiss the amended complaint and, in December 2012, the court dismissed without prejudice the claims regarding distribution fees and denied the motion with respect to the advisory fees claims. HIFSCO disputes the allegations and intends to defend vigorously.
In March 2014, the plaintiffs filed a new complaint that added as new plaintiffs The Hartford Floating Rate Fund and The Hartford Small Company Fund and named as a defendant HFMC, which assumed the role as investment manager to the funds as of January 2013. HFMC and HIFSCO dispute the allegations and intend to defend vigorously.
No accrual for litigation relating to this matter has been recorded in the financial statements of the Fund because the Fund is not party to the suit.
Indemnifications:
Under the Company's organizational documents, the Company shall indemnify its officers and directors to the full extent required or permitted under Maryland General Corporation Law and the federal securities laws. In addition, the Company, on behalf of the Fund, may enter into contracts that contain a variety of indemnifications. The Company's maximum exposure under these arrangements is unknown. However, as of the date of these financial statements, the Company has not had prior claims or losses pursuant to these contracts and expects the risk of loss to be remote.
Subsequent Event:
Effective December 1, 2014, pursuant to a sub-transfer agency agreement between HASCO and Boston Financial Data Services, Inc. (“BFDS”), HASCO has delegated certain transfer agent, dividend disbursing agent and shareholder servicing agent functions to BFDS. The costs and expenses of such delegation are borne by HASCO, not by the Fund.
| 18 |
| The Hartford Growth Allocation Fund |
|
Financial Highlights |
| - Selected Per-Share Data - (A) | - Ratios and Supplemental Data - | |||||||||||||||||||||||||||||||||||||||||||||||||||
| Class | Net
Asset Value at Beginning of Period | Net Investment Income (Loss) | Net Realized and Unrealized Gain (Loss) on Invest- ments | Total
from Investment Operations | Dividends from Net Investment Income | Distribu- tions from Realized Capital Gains | Total Dividends and Distributions | Net Asset Value at End of Period | Total Return(B) | Net Assets at End of Period (000's) | Ratio
of Expenses to Average Net Assets Before Adjust- ments(C),(D) | Ratio
of Expenses to Average Net Assets After Adjust- ments(C),(D) | Ratio
of Net Investment Income (Loss) to Average Net Assets(D) | |||||||||||||||||||||||||||||||||||||||
| For the Year Ended October 31, 2014 | ||||||||||||||||||||||||||||||||||||||||||||||||||||
| A | $ | 14.27 | $ | 0.10 | $ | 0.81 | $ | 0.91 | $ | (0.08 | ) | $ | – | $ | (0.08 | ) | $ | 15.10 | 6.40 | % | $ | 628,969 | 0.57 | % | 0.56 | % | 0.66 | % | ||||||||||||||||||||||||
| B | 14.13 | (0.01 | ) | 0.79 | 0.78 | – | – | – | 14.91 | 5.52 | 40,575 | 1.42 | 1.42 | (0.07 | ) | |||||||||||||||||||||||||||||||||||||
| C | 14.11 | (0.01 | ) | 0.80 | 0.79 | – | – | – | 14.90 | 5.60 | 209,438 | 1.30 | 1.29 | (0.06 | ) | |||||||||||||||||||||||||||||||||||||
| I | 14.23 | 0.14 | 0.82 | 0.96 | (0.13 | ) | – | (0.13 | ) | 15.06 | 6.74 | 6,553 | 0.25 | 0.24 | 0.92 | |||||||||||||||||||||||||||||||||||||
| R3 | 14.02 | 0.05 | 0.80 | 0.85 | (0.04 | ) | – | (0.04 | ) | 14.83 | 6.09 | 19,608 | 0.87 | 0.87 | 0.36 | |||||||||||||||||||||||||||||||||||||
| R4 | 14.22 | 0.10 | 0.81 | 0.91 | (0.09 | ) | – | (0.09 | ) | 15.04 | 6.39 | 16,704 | 0.57 | 0.57 | 0.67 | |||||||||||||||||||||||||||||||||||||
| R5 | 14.29 | 0.14 | 0.82 | 0.96 | (0.12 | ) | – | (0.12 | ) | 15.13 | 6.75 | 6,485 | 0.27 | 0.27 | 0.96 | |||||||||||||||||||||||||||||||||||||
| For the Year Ended October 31, 2013 | ||||||||||||||||||||||||||||||||||||||||||||||||||||
| A | $ | 12.21 | $ | 0.13 | $ | 2.26 | $ | 2.39 | $ | (0.33 | ) | $ | – | $ | (0.33 | ) | $ | 14.27 | 20.02 | % | $ | 610,007 | 0.59 | % | 0.59 | % | 0.97 | % | ||||||||||||||||||||||||
| B | 12.09 | 0.04 | 2.22 | 2.26 | (0.22 | ) | – | (0.22 | ) | 14.13 | 19.00 | 64,592 | 1.42 | 1.42 | 0.35 | |||||||||||||||||||||||||||||||||||||
| C | 12.08 | 0.04 | 2.24 | 2.28 | (0.25 | ) | – | (0.25 | ) | 14.11 | 19.17 | 212,687 | 1.32 | 1.32 | 0.28 | |||||||||||||||||||||||||||||||||||||
| I | 12.17 | 0.15 | 2.28 | 2.43 | (0.37 | ) | – | (0.37 | ) | 14.23 | 20.46 | 4,648 | 0.27 | 0.27 | 1.18 | |||||||||||||||||||||||||||||||||||||
| R3 | 12.01 | 0.09 | 2.23 | 2.32 | (0.31 | ) | – | (0.31 | ) | 14.02 | 19.71 | 19,453 | 0.88 | 0.88 | 0.71 | |||||||||||||||||||||||||||||||||||||
| R4 | 12.15 | 0.14 | 2.25 | 2.39 | (0.32 | ) | – | (0.32 | ) | 14.22 | 20.11 | 17,221 | 0.58 | 0.58 | 1.07 | |||||||||||||||||||||||||||||||||||||
| R5 | 12.22 | 0.19 | 2.25 | 2.44 | (0.37 | ) | – | (0.37 | ) | 14.29 | 20.44 | 6,569 | 0.28 | 0.28 | 1.48 | |||||||||||||||||||||||||||||||||||||
| For the Year Ended October 31, 2012 | ||||||||||||||||||||||||||||||||||||||||||||||||||||
| A | $ | 11.24 | $ | 0.07 | $ | 1.01 | $ | 1.08 | $ | (0.11 | ) | $ | – | $ | (0.11 | ) | $ | 12.21 | 9.75 | % | $ | 520,278 | 0.61 | % | 0.61 | % | 0.58 | % | ||||||||||||||||||||||||
| B | 11.11 | (0.02 | ) | 1.01 | 0.99 | (0.01 | ) | – | (0.01 | ) | 12.09 | 8.93 | 89,586 | 1.41 | 1.41 | (0.20 | ) | |||||||||||||||||||||||||||||||||||
| C | 11.11 | (0.02 | ) | 1.01 | 0.99 | (0.02 | ) | – | (0.02 | ) | 12.08 | 8.97 | 196,748 | 1.34 | 1.34 | (0.15 | ) | |||||||||||||||||||||||||||||||||||
| I | 11.21 | 0.11 | 1.00 | 1.11 | (0.15 | ) | – | (0.15 | ) | 12.17 | 10.08 | 3,268 | 0.29 | 0.29 | 0.91 | |||||||||||||||||||||||||||||||||||||
| R3 | 11.07 | 0.02 | 1.01 | 1.03 | (0.09 | ) | – | (0.09 | ) | 12.01 | 9.43 | 17,513 | 0.89 | 0.89 | 0.21 | |||||||||||||||||||||||||||||||||||||
| R4 | 11.18 | 0.07 | 1.02 | 1.09 | (0.12 | ) | – | (0.12 | ) | 12.15 | 9.83 | 17,299 | 0.59 | 0.59 | 0.60 | |||||||||||||||||||||||||||||||||||||
| R5 | 11.25 | 0.10 | 1.02 | 1.12 | (0.15 | ) | – | (0.15 | ) | 12.22 | 10.11 | 7,954 | 0.29 | 0.29 | 0.82 | |||||||||||||||||||||||||||||||||||||
| For the Year Ended October 31, 2011 (E) | ||||||||||||||||||||||||||||||||||||||||||||||||||||
| A | $ | 11.01 | $ | 0.06 | $ | 0.24 | $ | 0.30 | $ | (0.07 | ) | $ | – | $ | (0.07 | ) | $ | 11.24 | 2.72 | % | $ | 394,691 | 0.59 | % | 0.59 | % | 0.54 | % | ||||||||||||||||||||||||
| B | 10.90 | (0.03 | ) | 0.24 | 0.21 | – | – | – | 11.11 | 1.93 | 79,711 | 1.38 | 1.38 | (0.25 | ) | |||||||||||||||||||||||||||||||||||||
| C | 10.89 | (0.02 | ) | 0.24 | 0.22 | – | – | – | 11.11 | 2.02 | 156,463 | 1.33 | 1.33 | (0.19 | ) | |||||||||||||||||||||||||||||||||||||
| I | 10.97 | 0.10 | 0.25 | 0.35 | (0.11 | ) | – | (0.11 | ) | 11.21 | 3.15 | 2,455 | 0.26 | 0.26 | 0.86 | |||||||||||||||||||||||||||||||||||||
| R3 | 10.87 | 0.04 | 0.23 | 0.27 | (0.07 | ) | – | (0.07 | ) | 11.07 | 2.48 | 9,689 | 0.89 | 0.89 | 0.24 | |||||||||||||||||||||||||||||||||||||
| R4 | 10.95 | 0.07 | 0.23 | 0.30 | (0.07 | ) | – | (0.07 | ) | 11.18 | 2.74 | 14,605 | 0.59 | 0.59 | 0.55 | |||||||||||||||||||||||||||||||||||||
| R5 | 11.02 | 0.10 | 0.23 | 0.33 | (0.10 | ) | – | (0.10 | ) | 11.25 | 3.02 | 4,457 | 0.29 | 0.29 | 0.86 | |||||||||||||||||||||||||||||||||||||
See Portfolio Turnover information on the next page.
| 19 |
| The Hartford Growth Allocation Fund |
|
Financial Highlights – (continued) |
| - Selected Per-Share Data - (A) | - Ratios and Supplemental Data - | |||||||||||||||||||||||||||||||||||||||||||||||||||
| Class | Net
Asset Value at Beginning of Period | Net Investment Income (Loss) | Net Realized and Unrealized Gain (Loss) on Invest- ments | Total
from Investment Operations | Dividends from Net Investment Income | Distribu- tions from Realized Capital Gains | Total Dividends and Distributions | Net Asset Value at End of Period | Total Return(B) | Net Assets at End of Period (000's) | Ratio
of Expenses to Average Net Assets Before Adjust- ments(C),(D) | Ratio
of Expenses to Average Net Assets After Adjust- ments(C),(D) | Ratio
of Net Investment Income (Loss) to Average Net Assets(D) | |||||||||||||||||||||||||||||||||||||||
| For the Year Ended October 31, 2010 | ||||||||||||||||||||||||||||||||||||||||||||||||||||
| A | $ | 9.58 | $ | 0.07 | $ | 1.42 | $ | 1.49 | $ | (0.06 | ) | $ | – | $ | (0.06 | ) | $ | 11.01 | 15.60 | % | $ | 405,386 | 0.61 | % | 0.61 | % | 0.67 | % | ||||||||||||||||||||||||
| B | 9.50 | (0.01 | ) | 1.41 | 1.40 | – | – | – | 10.90 | 14.74 | 93,002 | 1.41 | 1.41 | (0.13 | ) | |||||||||||||||||||||||||||||||||||||
| C | 9.49 | (0.01 | ) | 1.41 | 1.40 | – | – | – | 10.89 | 14.75 | 167,745 | 1.34 | 1.34 | (0.07 | ) | |||||||||||||||||||||||||||||||||||||
| I | 9.55 | 0.10 | 1.42 | 1.52 | (0.10 | ) | – | (0.10 | ) | 10.97 | 15.96 | 3,005 | 0.27 | 0.27 | 1.02 | |||||||||||||||||||||||||||||||||||||
| R3 | 9.50 | 0.03 | 1.41 | 1.44 | (0.07 | ) | – | (0.07 | ) | 10.87 | 15.21 | 6,314 | 0.90 | 0.90 | 0.35 | |||||||||||||||||||||||||||||||||||||
| R4 | 9.53 | 0.07 | 1.42 | 1.49 | (0.07 | ) | – | (0.07 | ) | 10.95 | 15.67 | 13,734 | 0.59 | 0.59 | 0.66 | |||||||||||||||||||||||||||||||||||||
| R5 | 9.58 | 0.10 | 1.43 | 1.53 | (0.09 | ) | – | (0.09 | ) | 11.02 | 16.06 | 4,838 | 0.29 | 0.29 | 0.98 | |||||||||||||||||||||||||||||||||||||
| (A) | Information presented relates to a share outstanding throughout the indicated period. Net investment income (loss) per share amounts are calculated based on average shares outstanding unless otherwise noted. |
| (B) | Assumes initial investment at net asset value at the beginning of each period, reinvestment of all distributions, the complete redemption of the investment at net asset value at the end of each period and no sales charge. Total return would be reduced if sales charges were taken into account. |
| (C) | Adjustments include waivers and reimbursements, if applicable. |
| (D) | Ratios do not include expenses of the Underlying Funds and/or ETFs/ETNs, if applicable. |
| (E) | Net investment income (loss) per share amounts have been calculated using the SEC method. |
| Portfolio Turnover Rate for All Share Classes | ||||
| For the Year Ended October 31, 2014 | 103 | % | ||
| For the Year Ended October 31, 2013 | 20 | |||
| For the Year Ended October 31, 2012 | 95 | (A) | ||
| For the Year Ended October 31, 2011 | 36 | |||
| For the Year Ended October 31, 2010 | 23 | |||
| (A) | During the year ended October 31, 2012, the Fund incurred $36.1 million in sales of securities held associated with the transition of assets from The Hartford Equity Growth Allocation Fund, which merged into the Fund on May 25, 2012. These sales are excluded from the portfolio turnover calculation. |
| 20 |
| Report of Independent Registered Public Accounting Firm |
| The Board of Directors and Shareholders of |
| The Hartford Mutual Funds, Inc. |
We have audited the accompanying statement of assets and liabilities, including the schedule of investments, of The Hartford Growth Allocation Fund (one of the portfolios constituting The Hartford Mutual Funds, Inc. (the Funds)) as of October 31, 2014, and the related statement of operations for the year then ended, the statements of changes in net assets for each of the two years in the period then ended, and the financial highlights for each of the five years in the period then ended. These financial statements and financial highlights are the responsibility of the Funds’ management. Our responsibility is to express an opinion on these financial statements and financial highlights based on our audits.
We conducted our audits in accordance with the standards of the Public Company Accounting Oversight Board (United States). Those standards require that we plan and perform the audit to obtain reasonable assurance about whether the financial statements and financial highlights are free of material misstatement. We were not engaged to perform an audit of the Funds’ internal control over financial reporting. Our audits included consideration of internal control over financial reporting as a basis for designing audit procedures that are appropriate in the circumstances, but not for the purpose of expressing an opinion on the effectiveness of the Funds’ internal control over financial reporting. Accordingly, we express no such opinion. An audit also includes examining, on a test basis, evidence supporting the amounts and disclosures in the financial statements and financial highlights, assessing the accounting principles used and significant estimates made by management, and evaluating the overall financial statement presentation. Our procedures included confirmation of securities owned as of October 31, 2014, by correspondence with the custodian and brokers or by other appropriate auditing procedures where replies from brokers were not received. We believe that our audits provide a reasonable basis for our opinion.
In our opinion, the financial statements and financial highlights referred to above present fairly, in all material respects, the financial position of The Hartford Growth Allocation Fund of The Hartford Mutual Funds, Inc. at October 31, 2014, the results of its operations for the year then ended, the changes in its net assets for each of the two years in the period then ended, and the financial highlights for each of the five years in the period then ended, in conformity with U.S. generally accepted accounting principles.
|
Minneapolis, Minnesota
December 18, 2014
| 21 |
| The Hartford Growth Allocation Fund |
|
Directors and Officers (Unaudited) |
The Board of Directors of the Company (the "Directors") appoints officers who are responsible for the day-to-day operations of the Fund and who execute policies formulated by the Directors. Each Director serves until his or her death, resignation, or retirement or until the next annual meeting of shareholders is held or until his or her successor is elected and qualifies.
Directors and officers who are employed by or who have a financial interest in The Hartford Financial Services Group, Inc. ("The Hartford") are considered “interested” persons of the Fund pursuant to the 1940 Act. Each officer and two of the Company's Directors, as noted in the chart below, are “interested” persons of the Fund. Each Director serves as a director for The Hartford Mutual Funds, Inc., The Hartford Mutual Funds II, Inc., Hartford Series Fund, Inc., and Hartford HLS Series Fund II, Inc., and as a trustee for The Hartford Alternative Strategies Fund, which, as of October 31, 2014, collectively consist of 66 funds. Correspondence may be sent to Directors and officers c/o Hartford Funds, 5 Radnor Corporate Center, Suite 300, 100 Matsonford Road, Radnor, Pennsylvania 19087, except that correspondence to Mr. Annoni, Mr. Dressen and Ms. Quade may be sent to 500 Bielenberg Drive, Suite 500, Woodbury, Minnesota 55125.
The table below sets forth, for each Director and officer, his or her name, year of birth, current position with the Company and date first elected or appointed to The Hartford Mutual Funds, Inc. ("MF") and The Hartford Mutual Funds II, Inc. ("MF2"), principal occupation, and, for Directors, other directorships held. The Fund’s Statement of Additional Information contains further information on the Directors and is available free of charge by calling 1-888-843-7824 or writing to: Hartford Funds, P.O. Box 55022, Boston, MA 02205-5022.
Information on the aggregate remuneration paid to the directors of the Company can be found in the Statement of Operations herein. The Fund pays to The Hartford a portion of the Chief Compliance Officer’s compensation, but does not pay salaries or compensation to any of its other officers or Directors who are employed by The Hartford.
Non-Interested Directors
Hilary E. Ackermann (1956) Director since September 23, 2014
Ms. Ackermann served as Chief Risk Officer at Goldman Sachs Bank USA from October 2008 to November 2011 and serves as a Director of Dynegy, Inc., an independent power company, from October 2012 to present.
Lynn S. Birdsong (1946) Director since 2003, Chairman of the Investment Committee since 2014
Mr. Birdsong is a private investor. Mr. Birdsong currently serves as a Director of the Sovereign High Yield Investment Company (April 2010 to current). Mr. Birdsong currently serves as an Independent Director of Nomura Partners Funds, Inc. (formerly, The Japan Fund) (April 2003 to current). From 2003 to March 2005, Mr. Birdsong was an Independent Director of the Atlantic Whitehall Funds. From 1979 to 2002, Mr. Birdsong was a Managing Director of Zurich Scudder Investments, an investment management firm. During his employment with Scudder, Mr. Birdsong was an Interested Director of The Japan Fund. From January 1981 through December 2013, Mr. Birdsong was a partner in Birdsong Company, an advertising specialty firm.
Robert M. Gavin, Jr. (1940) Director since 2002 (MF) and 1986 (MF2), Chairman of the Board for each since 2004
Dr. Gavin is an educational consultant. Prior to September 1, 2001, he was President of Cranbrook Education Community and prior to July 1996, he was President of Macalester College, St. Paul, Minnesota.
Duane E. Hill (1945) Director since 2001 (MF) and 2002 (MF2), Chairman of the Nominating Committee since 2003
Mr. Hill is a Partner of TSG Ventures L.P., a private equity investment company. Mr. Hill is a former partner of TSG Capital Group, a private equity investment firm that served as sponsor and lead investor in leveraged buyouts of middle market companies.
Sandra S. Jaffee (1941) Director since 2005
Ms. Jaffee is the founder and Chief Executive Officer of a private company, Homeworks Concierge, LLC, which provides residential property management services in Westchester County, New York (January 2012 to present). Ms. Jaffee served as Chairman (2008 to 2009) and Chief Executive Officer of Fortent (formerly Searchspace Group), a leading provider of compliance/regulatory technology to financial institutions from August 2005 to August 2009. From August 2004 to August 2005, Ms. Jaffee served as an Entrepreneur in Residence with Warburg Pincus, a private equity firm. Prior to joining Warburg Pincus, Ms. Jaffee served as Executive Vice President at Citigroup, from September 1995 to July 2004, where she was President and Chief Executive Officer of Citibank’s Global Securities Services (1995 to 2003). Ms. Jaffee currently serves as a member of the Board of Directors of Broadridge Financial Solutions as well as a Trustee of Muhlenberg College.
| 22 |
| The Hartford Growth Allocation Fund |
|
Directors and Officers (Unaudited) – (continued) |
William P. Johnston (1944) Director since 2005, Chairman of the Compliance Committee since 2005
In June 2006, Mr. Johnston was appointed as Senior Advisor to The Carlyle Group, a global private equity and other alternative asset investment firm and currently serves as an Operating Executive. In July 2006, Mr. Johnston was elected to the Board of Directors of MultiPlan, Inc. and served as a Director (July 2006 to August 2010). In August 2007, Mr. Johnston was elected to the Board of Directors of LifeCare Holdings, Inc. and served as a Director (August 2007 to June 2013). In February 2008, Mr. Johnston was elected to the Board of Directors of HCR-ManorCare, Inc. In May 2006, Mr. Johnston was elected to the Supervisory Board of Fresenius Medical Care AG & Co. KGaA, after its acquisition of Renal Care Group, Inc. in March 2006. Mr. Johnston joined Renal Care Group in November 2002 as a member of the Board of Directors and served as Chairman of the Board from March 2003 through March 2006. From 2002 through 2013, Mr. Johnston served as a Board member of the Georgia O’Keefe Museum. From September 1987 to December 2002, Mr. Johnston was with Equitable Securities Corporation (and its successors, SunTrust Equitable Securities and SunTrust Robinson Humphrey) serving in various investment banking and managerial positions, including Managing Director and Head of Investment Banking, Chief Executive Officer and Vice Chairman.
Phillip O. Peterson (1944) Director since 2002 (MF) and 2000 (MF2), Chairman of the Audit Committee since 2002
Mr. Peterson is a mutual fund industry consultant. He was a partner of KPMG LLP (an accounting firm) until July 1999. Mr. Peterson joined William Blair Funds in February 2007 as a member of the Board of Trustees. From February 2012 to February 2014, Mr. Peterson served as a Trustee of Symetra Variable Mutual Funds. From January 2004 to April 2005, Mr. Peterson served as Independent President of the Strong Mutual Funds.
Lemma W. Senbet (1946) Director since 2005
Dr. Senbet is the William E. Mayer Chair Professor of Finance and Founding Director, Center for Financial Policy, at the University of Maryland, Robert H. Smith School of Business. He was chair of the Finance Department of the University of Maryland, Robert H. Smith School of Business from 1998 to 2006. Since June 2013, he has been on leave from the University to serve as Executive Director of African Economic Research Consortium which focuses on economic policy research and training. Previously, he was a chaired professor of finance at the University of Wisconsin-Madison. Also, he was a Director of the Fortis Funds from March 2000 to July 2002. Dr. Senbet served as Director of the American Finance Association and President of the Western Finance Association. In 2006, Dr. Senbet was inducted Fellow of Financial Management Association International for his career-long distinguished scholarship and professional service.
Interested Directors and Officers
James E. Davey (1964) Director since 2012, President and Chief Executive Officer since 2010
Mr. Davey serves as Executive Vice President of Hartford Life Insurance Company (“HLIC”) and The Hartford. Additionally, Mr. Davey serves as Chairman of the Board, Manager and Senior Managing Director of Hartford Funds Distributors, LLC (“HFD”). He also currently serves as Director, Chairman of the Board, President and Senior Managing Director of Hartford Administrative Services Company (“HASCO”). Mr. Davey also serves as Manager, Chairman of the Board and Senior Managing Director for Hartford Funds Management Company, LLC (“HFMC”) and Director, Chairman of the Board and Senior Managing Director for Hartford Funds Management Group, Inc. ("HFMG"). Mr. Davey has served in various positions within The Hartford and its subsidiaries in connection with the operation of the Hartford Funds. Mr. Davey joined The Hartford in 2002.
Lowndes A. Smith* (1939) Director since 1996 (MF) and 2002 (MF2)
Mr. Smith served as Vice Chairman of The Hartford from February 1997 to January 2002, as President and Chief Executive Officer of Hartford Life, Inc. from February 1997 to January 2002, and as President and Chief Operating Officer of The Hartford Life Insurance Companies from January 1989 to January 2002. Mr. Smith serves as a Director of White Mountains Insurance Group Ltd. (October 2003 to current); One Beacon Insurance (October 2006 to current); Symetra Financial (August 2007 to current) and is a Managing Director of Whittington Gray Associates (January 2007 to current).
* Mr. Smith resigned as a Director of MF, MF2, Hartford Series Fund, Inc. and Hartford HLS Series Fund II, Inc. and as a Trustee of The Hartford Alternative Strategies Fund effective September 17, 2014.
Other Officers
Mark A. Annoni (1964) Vice President, Controller and Treasurer since 2012
Mr. Annoni currently serves as the Assistant Vice President of HLIC (February 2004 to present) and Senior Vice President of HFMG (December 2013 to present). Mr. Annoni has served in various positions within The Hartford and its subsidiaries in connection with the operation of the Hartford Funds. Mr. Annoni joined The Hartford in 2001.
| 23 |
| The Hartford Growth Allocation Fund |
|
Directors and Officers (Unaudited) – (continued) |
Michael R. Dressen (1963) AML Compliance Officer since 2011
Mr. Dressen currently serves as Assistant Vice President of HLIC. He also serves as Chief Compliance Officer and AML Compliance Officer of HASCO and as AML Officer of HFD. Mr. Dressen has served in various positions within The Hartford and its subsidiaries in connection with the operation of the Hartford Funds.
Edward P. Macdonald (1967) Vice President, Secretary and Chief Legal Officer since 2005
Mr. Macdonald currently serves as Assistant Secretary, Executive Vice President and Deputy General Counsel of HFD, HASCO, HFMC and HFMG. He also serves as Vice President of HLIC. Mr. Macdonald has served in various positions within The Hartford and its subsidiaries in connection with the operation of the Hartford Funds. Mr. Macdonald joined The Hartford in 2005.
Joseph G. Melcher (1973) Vice President and Chief Compliance Officer since 2013
Mr. Melcher currently serves as Executive Vice President of HFD, HFMG and HASCO. Mr. Melcher also currently serves as Executive Vice President and Chief Compliance Officer of HFMC. Mr. Melcher has served in various positions within The Hartford and its subsidiaries in connection with the operation of the Hartford Funds since joining The Hartford in 2012. Prior to joining The Hartford, Mr. Melcher worked at Touchstone Investments, a member of the Western & Southern Financial Group, where he held the position of Vice President and Chief Compliance Officer from 2010 through 2012 and Assistant Vice President, Compliance from 2005 to 2010.
Vernon J. Meyer (1964) Vice President since 2006
Mr. Meyer currently serves as Senior Vice President of HLIC. He also currently serves as Managing Director and Chief Investment Officer of HFMC and Managing Director of HFMG. Mr. Meyer has served in various positions within The Hartford and its subsidiaries in connection with the operation of the Hartford Funds. Mr. Meyer joined The Hartford in 2004.
Laura S. Quade (1969) Vice President since 2012
Ms. Quade currently serves as Vice President of HASCO, HFD and HFMG. She is the Head of Operations of HASCO and formerly served as Director, Enterprise Operations of HLIC. Ms. Quade has served in various positions within The Hartford and its subsidiaries in connection with the operation of the Hartford Funds. Ms. Quade joined The Hartford in 2001.
Martin A. Swanson** (1962) Vice President since 2010
Mr. Swanson currently serves as Vice President of HLIC. Mr. Swanson also serves as Managing Director, Chief Marketing Officer and Principal of HFD and Managing Director of HFMG. Mr. Swanson has served in various positions within The Hartford and its subsidiaries in connection with the operation of the Hartford Funds.
** Mr. Swanson resigned as an officer effective November 6, 2014.
HOW TO OBTAIN A COPY OF THE FUND’S PROXY VOTING POLICIES AND VOTING RECORDS (UNAUDITED)
A description of the policies and procedures that the Fund uses to determine how to vote proxies relating to portfolio securities and information about how the Fund voted proxies relating to portfolio securities during the most recent twelve-month period ended June 30 are available (1) without charge, upon request, by calling 888-843-7824 and (2) on the SEC’s website at http://www.sec.gov.
QUARTERLY PORTFOLIO HOLDINGS INFORMATION (UNAUDITED)
The Fund files a complete schedule of portfolio holdings with the SEC for the first and third quarters of each fiscal year on Form N-Q. The Fund’s Forms N-Q are available (1) without charge, upon request, by calling 888-843-7824 and (2) on the SEC’s website at http://www.sec.gov. The Form N-Q may be reviewed and copied at the SEC’s Public Reference Room in Washington, DC. Information on the operation of the Public Reference Room may be obtained by calling 1-800-SEC-0330.
| 24 |
| The Hartford Growth Allocation Fund |
|
Federal Tax Information (Unaudited) |
For the fiscal year ended October 31, 2014, there is no further federal tax information required for this Fund.
| 25 |
| The Hartford Growth Allocation Fund |
|
Expense Example (Unaudited) |
Your Fund's Expenses
As a shareholder of the Fund, you incur two types of costs: (1) transaction costs, including sales charges (loads) on purchase payments, if any, and contingent deferred sales charges (CDSC), if any, and (2) ongoing costs, including investment management fees, distribution and/or service (12b-1) fees, if any, and other fund expenses. This example is intended to help you understand your ongoing costs (in dollars) of investing in the Fund and to compare these costs with the ongoing costs of investing in other mutual funds. The example is based on an investment of $1,000 invested at the beginning of the period and held for the entire period of April 30, 2014 through October 31, 2014.
Actual Expenses
The first set of columns of the table below provides information about actual account values and actual expenses. You may use the information in this column, together with the amount you invested, to estimate the expenses that you paid over the period. Simply divide your account value by $1,000 (for example, an $8,600 account value divided by $1,000 = 8.6), then multiply the result by the number in the line under the heading entitled “Expenses Paid During Period” to estimate the expenses you paid on your account during this period.
Hypothetical Example for Comparison Purposes
The second set of columns of the table below provides information about hypothetical account values and hypothetical expenses based on the Fund's actual expense ratio and an assumed rate of return of 5% per year before expenses, which is not the Fund's actual return. The hypothetical account values and expenses may not be used to estimate the actual ending account balance or expenses you paid for the period. You may use this information to compare the ongoing costs of investing in the Fund and other funds. To do so, compare this 5% hypothetical example with the 5% hypothetical examples that appear in the shareholder reports of the other funds.
Please note that the expenses shown in the table are meant to highlight your ongoing costs only and do not reflect any transactional costs, such as sales charges (loads) and CDSC. Therefore, the second set of columns of the table is useful in comparing ongoing costs only, and will not help you determine the relative total costs of owning different funds. In addition, if these transactional costs were included, your costs would be higher. Expenses are equal to the Fund's annualized expense ratios multiplied by average account value over the period, multiplied by 184/365 (to reflect the one-half year period).
| Actual return | Hypothetical (5% return before expenses) | |||||||||||||||||||||||||||||||||||
| Beginning Account Value April 30, 2014 | Ending
Account Value October 31, 2014 | Expenses
paid during the period April 30, 2014 through October 31, 2014 | Beginning Account Value April 30, 2014 | Ending
Account Value October 31, 2014 | Expenses
paid during the period April 30, 2014 through October 31, 2014 | Annualized expense ratio(A) | Days in the current 1/2 year | Days in the full year | ||||||||||||||||||||||||||||
| Class A | $ | 1,000.00 | $ | 1,016.80 | $ | 2.85 | $ | 1,000.00 | $ | 1,022.38 | $ | 2.85 | 0.56 | % | 184 | 365 | ||||||||||||||||||||
| Class B | $ | 1,000.00 | $ | 1,012.20 | $ | 7.15 | $ | 1,000.00 | $ | 1,018.10 | $ | 7.17 | 1.41 | 184 | 365 | |||||||||||||||||||||
| Class C | $ | 1,000.00 | $ | 1,012.90 | $ | 6.53 | $ | 1,000.00 | $ | 1,018.71 | $ | 6.55 | 1.29 | 184 | 365 | |||||||||||||||||||||
| Class I | $ | 1,000.00 | $ | 1,018.30 | $ | 1.20 | $ | 1,000.00 | $ | 1,024.01 | $ | 1.21 | 0.24 | 184 | 365 | |||||||||||||||||||||
| Class R3 | $ | 1,000.00 | $ | 1,015.10 | $ | 4.42 | $ | 1,000.00 | $ | 1,020.82 | $ | 4.43 | 0.87 | 184 | 365 | |||||||||||||||||||||
| Class R4 | $ | 1,000.00 | $ | 1,016.90 | $ | 2.86 | $ | 1,000.00 | $ | 1,022.37 | $ | 2.86 | 0.56 | 184 | 365 | |||||||||||||||||||||
| Class R5 | $ | 1,000.00 | $ | 1,018.20 | $ | 1.33 | $ | 1,000.00 | $ | 1,023.89 | $ | 1.33 | 0.26 | 184 | 365 | |||||||||||||||||||||
| (A) | Ratios do not include expenses of the Underlying Funds and/or ETFs/ETNs, if applicable. |
| 26 |
| The Hartford Growth Allocation Fund |
|
Shareholder Meeting Results (Unaudited) |
The Fund solicited proxies from shareholders seeking approval on the following matters to be voted upon at a special meeting of shareholders of the Fund held on April 4, 2014 (“Shareholder Meeting”): (1) ratification and approval of the sub-advisory agreement between HFMC, the investment manager of the Fund, and Wellington Management, pursuant to which Wellington Management served as sub-adviser to the Fund and managed the Fund's assets; (2) approval of the retention of fees paid and the payment of fees payable by Hartford Investment Financial Services, LLC, the Fund’s former investment manager, and HFMC (as applicable) to Wellington Management for its sub-advisory services to the Fund; and (3) authorization of HFMC to select and contract with sub-advisers that are not affiliated with HFMC or the Fund (other than by reason of serving as a sub-adviser to one or more Hartford-sponsored mutual funds) and to materially amend investment sub-advisory agreements without obtaining shareholder approval.
The aforementioned matters were not voted upon at the Shareholder Meeting due to the failure to obtain the votes necessary to achieve a quorum, and did not receive the requisite votes for approval at subsequent adjourned meetings on May 9, 2014 and May 10, 2014.
| 27 |
| The Hartford Growth Allocation Fund |
|
Approval of Investment Management Agreement (Unaudited) |
Section 15(c) of the Investment Company Act of 1940, as amended (the “1940 Act”), requires that each mutual fund’s board of directors, including a majority of those directors who are not “interested persons” of the mutual fund, as defined in the 1940 Act (the “Independent Directors”), annually review and consider the continuation of the mutual fund’s investment advisory agreement. At its meeting held on August 5-6, 2014, the Board of Directors (the “Board”) of The Hartford Mutual Funds, Inc., including each of the Independent Directors, unanimously voted to approve the continuation of the investment management agreement for The Hartford Growth Allocation Fund (the “Fund”) with Hartford Funds Management Company, LLC (the “Adviser”) (the “Agreement”).
In the months preceding the August 5-6, 2014 meeting, the Board requested, received and reviewed written responses from the Adviser to questions posed to it on behalf of the Independent Directors and supporting materials relating to those questions and responses. The Board considered information furnished to the Board at its meetings throughout the year, as well as information specifically prepared in connection with the annual approval of the Agreement at the Board’s meetings held on June 17-18, 2014 and August 5-6, 2014. Information provided to the Board at its meetings throughout the year included, among other things, reports on Fund performance, legal and compliance matters, sales and marketing activity, shareholder services, and the other services provided to the Fund by the Adviser and its affiliates. The Board also received in-person presentations by Fund officers and representatives of the Adviser at the Board’s meetings on June 17-18, 2014 and August 5-6, 2014 concerning the Agreement. In addition, the Board held a special meeting on May 30, 2014 to consider the Adviser’s proposal to terminate Wellington Management Company, LLP (“Wellington Management”) as sub-adviser and begin managing the Fund directly effective May 31, 2014.
The Independent Directors, advised by independent legal counsel, engaged service providers to assist them with evaluating the Agreement with respect to the Fund. Lipper Inc. (“Lipper”), an independent provider of investment company data, was retained to provide the Board with reports on how the Fund’s non-management fees, overall expense ratios and investment performance compared to those of mutual funds with similar investment objectives. The Independent Directors also engaged an independent financial services consultant (the “Consultant”) to assist them in evaluating the Fund’s non-management fees, overall expense ratios and investment performance. In addition, the Consultant reviewed the profitability calculations utilized by the Adviser in connection with the continuation of the Agreement.
In determining whether to continue the Agreement for the Fund, the members of the Board reviewed and evaluated information and factors they believed to be relevant and appropriate in light of the information that the Board deemed necessary and appropriate through the exercise of its reasonable business judgment. While individual members of the Board may have weighed certain factors differently, the Board’s determination to continue the Agreement was based on a comprehensive consideration of all information provided to the Board throughout the year and specifically with respect to the continuation of the Agreement. A more detailed discussion of the factors the Board considered with respect to its approval of the Agreement is provided below.
Nature, Extent and Quality of Services Provided by the Adviser
The Board requested and considered information concerning the nature, extent and quality of the services provided to the Fund by the Adviser. The Board considered, among other things, the terms of the Agreement and the range of services provided by the Adviser. The Board considered the Adviser’s professional personnel who provide services to the Fund, including the Adviser’s ability and experience in attracting and retaining qualified personnel to service the Fund. In particular, the Board considered the information presented at the May 30, 2014 special meeting regarding the Fund’s portfolio manager, the Adviser’s other investment personnel, its investment philosophy and process, investment research capabilities and resources, performance record, trade execution capabilities and experience. The Board considered that while the Adviser utilizes a different portfolio construction process than Wellington Management, the Fund’s strategic allocation, principal investment strategy, investment objective, performance benchmark and peer group remained the same as when the Fund was managed by Wellington Management. The Board considered the Adviser’s reputation and overall financial strength, as well as its willingness to consider and implement organizational and operational changes designed to enhance services to the Hartford Funds. In addition, the Board considered the quality of the Adviser’s communications with the Board and responsiveness to Board inquiries and requests made from time to time with respect to the Fund and other Hartford Funds.
The Board also requested and evaluated information concerning the Adviser’s regulatory and compliance environment. In this regard, the Board requested and reviewed information on the Adviser’s compliance policies and procedures, compliance history, and a report from the Fund’s Chief Compliance Officer on the Adviser’s compliance with applicable laws and regulations, including responses to regulatory developments and compliance issues raised by regulators. The Board also noted the Adviser’s support of the Fund’s compliance control structure, particularly the resources devoted by the Adviser in support of the Fund’s obligations pursuant to Rule 38a-1 under the 1940 Act.
| 28 |
| The Hartford Growth Allocation Fund |
|
Approval of Investment Management Agreement (Unaudited) – (continued) |
The Board noted that under the Agreement, the Adviser is responsible for the management of the Fund, including oversight of fund operations and service providers, and provides administrative and investment advisory services. The Board considered the Adviser’s ongoing monitoring of people, process and performance, including its quarterly reviews of each of the Hartford Funds, semi-annual meetings with the leaders of each Fund’s portfolio management team, and oversight of the Hartford Funds’ approximately 66 portfolio managers. The Board recognized that the Adviser has demonstrated a record of making changes to the management and/or strategies of the Hartford Funds when warranted. The Board considered the Adviser’s approach to risk management with respect to the Fund and the service providers to the Fund. The Board also considered the Adviser’s oversight of compliance with the Fund’s objective and policies as well as with applicable laws and regulations, noting that regulatory and other developments had over time led to an increase in the scope of the Adviser’s services in this regard.
In addition, the Board considered the Adviser’s ongoing commitment to review and rationalize the Hartford Funds product line-up and the expenses that the Adviser had incurred in connection with fund combinations in recent years. The Board considered that the Adviser or its affiliates are responsible for providing the Fund’s officers.
Based on these considerations, the Board concluded that it was satisfied with the nature, extent and quality of the services provided to the Fund by the Adviser.
Performance of the Fund and the Adviser
The Board considered the investment performance of the Fund. In this regard, the Board reviewed the performance of the Fund over different time periods presented in the materials and evaluated the Adviser’s analysis of the Fund’s performance for these time periods. The Board considered information and materials provided to the Board by the Adviser concerning Fund performance, as well as information from Lipper comparing the investment performance of the Fund to an appropriate benchmark and universe of peer funds. The Board noted that the Fund’s performance was in the 2nd quintile of its performance universe for the 1- and 5-year periods and the 4th quintile for the 3-year period. The Board also noted that the Fund’s performance was above its blended custom benchmark for the 1- and 5-year periods and in line with its blended custom benchmark for the 3-year period. The Board further noted recent changes to the Fund’s portfolio management team in connection with the termination of Wellington Management as sub-adviser effective May 31, 2014.
The Board considered the detailed investment analytics reports provided by Hartford Funds’ Investment Advisory Group throughout the year. These reports include, among other things, information on the Fund’s gross and net returns, the Fund’s investment performance relative to an appropriate benchmark and peer group, various statistics concerning the Fund’s portfolio, and a narrative summary of various factors affecting Fund performance. The Board considered the Adviser’s cooperation with the Investment Committee, which assists the Board in evaluating the performance of the Fund at periodic meetings throughout the year. The Board also considered the analysis provided by the Consultant relating to the Fund’s performance track record.
In light of all the considerations noted above, the Board concluded that it had continued confidence in the Adviser’s overall capabilities to manage the Fund.
Costs of the Services and Profitability of the Adviser
The Board reviewed information regarding the Adviser’s cost to provide investment management and related services to the Fund and the Adviser’s profitability, both overall and for the Fund, on a pre-tax basis without regard to distribution expenses. The Board also requested and reviewed information about the profitability to the Adviser and its affiliates from all services provided to the Fund and all aspects of their relationship with the Fund.
The Board considered the Consultant’s review of the profitability calculations used by the Adviser in connection with the continuation of the investment management agreement, noting the Consultant’s view that Hartford Funds’ process for calculating and reporting Fund profitability is reasonable. In this regard, the Board noted that the Consultant performed a full review of this process in light of the recent restructuring of the Hartford Funds business and reported that the approach to analyzing Fund profitability, including the use of common expense allocation methodologies, is reasonable, sound and well within common industry practice.
Based on these considerations, the Board concluded that the profits anticipated to be realized by the Adviser and its affiliates from their relationships with the Fund would not be excessive.
| 29 |
| The Hartford Growth Allocation Fund |
|
Approval of Investment Management Agreement (Unaudited) – (continued) |
Comparison of Fees and Services Provided by the Adviser
The Board considered comparative information with respect to the management fees to be paid by the Fund to the Adviser and the total expense ratios of the Fund. The Board also reviewed information from Lipper comparing the Fund’s overall expense ratios relative to a group of funds selected by Lipper, in consultation with the Consultant, and a broader universe of funds selected by Lipper. The Board considered that the Fund’s total expenses (less 12b-1 and shareholder service fees) were in the 4th quintile of its expense group. The Board noted that the Fund has an automatically renewable contractual expense cap on each share class. The expense cap resulted in reimbursement of certain expenses incurred in 2013. The Board also noted that in connection with the termination of Wellington Management and the assumption by the Adviser of responsibility for direct management of the Fund, the Adviser had voluntarily waived 0.015% of its contractual management fee for the Fund commencing on May 31, 2014.
While the Board recognized that comparisons between the Fund and peer funds may be imprecise, given the different service levels and characteristics of mutual funds and the different business models and cost structures of the Adviser, the comparative information provided by Lipper assisted the Board in evaluating the reasonableness of the Fund’s management fees and total operating expenses. In addition, the Board considered the analysis and recommendations of the Consultant relating to the Fund’s management fees and total operating expenses.
Based on these considerations, the Board concluded that the Fund’s fees and total operating expenses, in conjunction with the information about quality of services, profitability, economies of scale, and other matters discussed, were reasonable in light of the services provided.
Economies of Scale
The Board requested and considered information regarding the Adviser’s realization of economies of scale with respect to the Fund and whether the fee levels reflect these economies of scale for the benefit of the Fund’s shareholders. The Board reviewed the breakpoints in the management fee schedule for the Fund, which reduce fee rates as Fund assets grow over time. The Board recognized that a fund with assets beyond the highest breakpoint level will continue to benefit from economies of scale because additional assets are charged the lowest breakpoint fee resulting in lower overall effective management fee rates. The Board also considered that expense limitations and fee waivers that reduce the Fund’s expenses at all asset levels can have the same effect as breakpoints in sharing economies of scale with shareholders and provide protection from an increase in expenses if Fund assets decline. The Board recognized that a fee schedule that reaches a lower breakpoint quickly provides shareholders with the benefit of anticipated or potential economies of scale. The Board also considered that the Adviser has been active in managing expenses, which has resulted in benefits being realized by shareholders as assets within the Hartford Funds family of funds have grown over time, including through lower transfer agent costs and other operating expenses.
After considering all of the information available to it, the Board concluded that it was satisfied with the extent to which economies of scale would be shared for the benefit of the Fund’s shareholders based on currently available information and the effective advisory fees and expense ratios for the Fund at its current and reasonably anticipated asset levels. The Board noted, however, that it would continue to monitor future growth in Fund assets and the appropriateness of additional breakpoints.
Other Benefits
The Board considered other benefits to the Adviser and its affiliates from their relationships with the Fund.
The Board noted that the Adviser receives fees for fund accounting and related services from the Fund, and the Board considered information on profits to the Adviser for such services. The Board also considered that Hartford Administrative Services Company (“HASCO”), the Fund’s transfer agent and an affiliate of the Adviser, receives transfer agency compensation from the Fund, and the Board reviewed information on the profitability of the Fund’s transfer agency function to HASCO. The Board considered information provided by HASCO indicating that the transfer agent fees charged by HASCO to the Fund were fair and reasonable based on publicly available information.
The Board also considered that Hartford Funds Distributors, LLC (“HFD”), an affiliate of the Adviser, serves as principal underwriter of the Fund. As principal underwriter, HFD receives 12b-1 fees from the Fund and receives all or a portion of the sales charges on sales or redemptions of certain classes of shares. The Board also noted that certain affiliates of HFD distribute shares of the Fund and receive compensation in that connection.
The Board considered the benefits, if any, to the Adviser from any use of the Fund’s brokerage commissions to obtain soft dollar research.
| 30 |
| The Hartford Growth Allocation Fund |
|
Approval of Investment Management Agreement (Unaudited) – (continued) |
The Board considered the benefits to shareholders of being part of the Hartford Funds family of funds, including the right to exchange investments between the same class of funds without a sales charge, the ability to reinvest Fund dividends into other funds in the family, and the ability to combine holdings in the Fund with holdings in other funds to obtain a reduced sales charge. The Board considered the Adviser’s efforts to provide investors in the family with a broad range of investment styles and asset classes and its entrepreneurial risk in initiating new funds to expand these opportunities for shareholders.
* * * *
Based upon its review of these various factors, among others, the Board concluded that it is in the best interests of the Fund and its shareholders for the Board to approve the Agreement for an additional year. In reaching this decision, the Board did not assign relative weights to the factors discussed above or deem any one or group of them to be controlling in and of themselves. In connection with their deliberations, the Independent Directors met separately in executive session on several occasions, with independent legal counsel and the Consultant, to review the relevant materials and consider their responsibilities under relevant laws and regulations.
| 31 |
| The Hartford Growth Allocation Fund |
| Main Risks (Unaudited) |
The main risks of investing in the Fund are described below.
Market, Selection and Strategy Risk: The Fund’s share price may fluctuate due to market risk and/or security selections that may underperform the market or relevant benchmarks. If the investment manager's investment strategy does not perform as expected, the Fund could underperform its peers or lose money. There is no guarantee the Fund will achieve its stated objective.
Asset Allocation Strategy Risk: The portfolio manager's asset allocation strategy may not always work as intended, and asset allocation does not guarantee better performance or reduce the risk of investment loss.
Fund of Funds Risk:The Fund invests in a number of Underlying Funds, and is subject to the risks of the Underlying Funds in direct proportion to the amount of assets it invests in each Underlying Fund. The Underlying Funds may invest in the following: foreign securities including emerging markets, fixed income securities (which carry credit and interest rate risk) including junk bonds, small- and mid-cap stocks, mortgage- and asset-backed securities, and derivatives.
| 32 |
THIS PRIVACY POLICY IS NOT PART OF THIS REPORT
Privacy Policy and Practices of The Hartford Financial Services Group, Inc. and its Affiliates
(herein called “we, our and us”)
This Privacy Policy applies to our United States Operations
|
We value your trust. We are committed to the responsible: a) management; b) use; and c) protection; of Personal Information.
This notice describes how we collect, disclose, and protect Personal Information.
We collect Personal Information to: a) service your Transactions with us; and b) support our business functions.
We may obtain Personal Information from: a) You; b) your Transactions with us; and c) third parties such as a consumer-reporting agency.
Based on the type of product or service You apply for or get from us, Personal Information such as: a) your name; b) your address; c) your income; d) your payment; or e) your credit history; may be gathered from sources such as applications, Transactions, and consumer reports.
To serve You and service our business, we may share certain Personal Information. We will share Personal Information, only as allowed by law, with affiliates such as: a) our insurance companies; b) our employee agents; c) our brokerage firms; and d) our administrators.
As allowed by law, we may share Personal Financial Information with our affiliates to: a) market our products; or b) market our services; to You without providing You with an option to prevent these disclosures.
|
We may also share Personal Information, only as allowed by law, with unaffiliated third parties including: a) independent agents; b) brokerage firms; c) insurance companies; d) administrators; and e) service providers; who help us serve You and service our business.
When allowed by law, we may share certain Personal Financial Information with other unaffiliated third parties who assist us by performing services or functions such as: a) taking surveys; b) marketing our products or services; or c) offering financial products or services under a joint agreement between us and one or more financial institutions.
We, and third parties we partner with, may track some of the pages You visit through the use of: a) cookies; b) pixel tagging; or c) other technologies; and currently do not process or comply with any web browser’s “do not track” signal or similar mechanism that indicates a request to disable online tracking of individual users who visit our websites or use our services.
We will not sell or share your Personal Financial Information with anyone for purposes unrelated to our business functions without offering You the opportunity to: a) “opt-out;” or b) “opt-in;” as required by law.
We only disclose Personal Health Information with: a) your proper written authorization; or b) as otherwise allowed or required by law.
Our employees have access to Personal Information in the course of doing their jobs, such as: a) underwriting policies; b) paying claims; c) developing new products; or d) advising customers of our products and services. |
|
We use manual and electronic security procedures to maintain: a) the confidentiality; and b) the integrity of; Personal Information that we have. We use these procedures to guard against unauthorized access.
Some techniques we use to protect Personal Information include: a) secured files; b) user authentication; c) encryption; d) firewall technology; and e) the use of detection software.
We are responsible for and must: a) identify information to be protected; b) provide an adequate level of protection for that data; c) grant access to protected data only to those people who must use it in the performance of their job-related duties.
Employees who violate our Privacy Policy will be subject to discipline, which may include ending their employment with us.
At the start of our business relationship, we will give You a copy of our current Privacy Policy.
We will also give You a copy of our current Privacy Policy once a year if You maintain a continuing business relationship with us.
We will continue to follow our Privacy Policy regarding Personal Information even when a business relationship no longer exists between us.
|
As used in this Privacy Notice:
Application means your request for our product or service.
Personal Financial Information means financial information such as: a) credit history; b) income; c) financial benefits; or d) policy or claim information.
Personal Health Information means health information such as: a) your medical records; or b) information about your illness, disability or injury.
Personal Information means information that identifies You personally and is not otherwise available to the public. It includes: a) Personal Financial Information; and b) Personal Health Information.
Transaction means your business dealings with us, such as: a) your Application; b) your request for us to pay a claim; and c) your request for us to take an action on your account.
You means an individual who has given us Personal Information in conjunction with: a) asking about; b) applying for; or c) obtaining; a financial product or service from us if the product or service is used mainly for personal, family, or household purposes.
|
This Privacy Policy is being provided on behalf of the following affiliates of The Hartford Financial Services Group, Inc.:
1stAGChoice, Inc.; Access CoverageCorp, Inc.; Access CoverageCorp Technologies, Inc.; American Maturity Life Insurance Company; Archway 60 R, LLC; Business Management Group, Inc.; Champlain Life Reinsurance Company; DMS R, LLC; Eloy R, LLC; Ersatz Corporation; First State Insurance Company; Hartford Accident and Indemnity Company; Hartford Administrative Services Company; Hartford Casualty General Agency, Inc.; Hartford Casualty Insurance Company; Hartford-Comprehensive Employee Benefit Service Company; Hartford Equity Sales Company, Inc.; Hartford Fire General Agency, Inc.; Hartford Fire Insurance Company; Hartford Funds Management Company, LLC; Hartford Funds Management Group, Inc.; Hartford HLS Series Fund II, Inc.; Hartford Insurance Company of Illinois; Hartford Insurance Company of the Midwest; Hartford Insurance Company of the Southeast; Hartford Integrated Technologies, Inc.; Hartford International Life Reassurance Corporation; Hartford Funds Distributors, LLC; Hartford Investment Management Company; Hartford Life and Accident Insurance Company; Hartford Life and Annuity Insurance Company; Hartford Life Insurance Company; Hartford Life Private Placement, LLC; Hartford Lloyd’s Corporation; Hartford Lloyd’s Insurance Company; Hartford Mezzanine Investors I, LLC; Hartford Residual Market, L.C.C.; Hartford Retirement Services, LLC; Hartford Securities Distribution Company, Inc.; Hartford Series Fund, Inc.; Hartford Specialty Insurance Services of Texas, LLC; Hartford Strategic Investments, LLC; Hartford Underwriters Insurance Company; Hartford Technology Services Company, L.L.C.; Hartford of Texas General Agency, Inc.; Hartford Underwriters General Agency, Inc.; HARTRE Company, L.C.C.; HL Investment Advisors, LLC; HLA LLC; Horizon Management Group, LLC; HRA Brokerage Services, Inc.; Lanidex Class B, LLC; M-CAP Insurance Agency, LLC; New England Insurance Company; New England Reinsurance Corporation; Nutmeg Insurance Agency, Inc.; Nutmeg Insurance Company; Pacific Insurance Company, Limited; Planco, LLC: Property and Casualty Insurance Company of Hartford; Revere R, LLC; RVR R, LLC; Sentinel Insurance Company, Ltd.; Sunstone R, LLC; Symphony R, LLC; The Evergreen Group Incorporated; The Hartford Alternative Strategies Fund; The Hartford Mutual Funds, Inc.; The Hartford Mutual Funds II, Inc.; Trumbull Flood Management, L.L.C.; Trumbull Insurance Company; Twin City Fire Insurance Company; White River Life Reinsurance Company.
HPP Revised January 2014
HARTFORDFUNDS
hartfordfunds.com
This information is written in connection with the promotion or marketing of the matter(s) addressed in this material.
This report is submitted for the general information of the shareholders of the Fund. It is not authorized for distribution unless preceded or accompanied by a current prospectus for the Fund.
The information cannot be used or relied upon for the purpose of avoiding IRS penalties. These materials are not intended to provide tax, accounting or legal advice. As with all matters of a tax or legal nature, you should consult your own tax or legal counsel for advice.
Investors should carefully consider the investment objectives, risks, charges, and expenses of Hartford Funds before investing. This and other information can be found in the prospectus and summary prospectus, which can be obtained by calling 888-843-7824 (retail) or 800-279-1541 (institutional). Investors should read them carefully before they invest.
Hartford Funds are underwritten and distributed by Hartford Funds Distributors, LLC.
MFAR-GA14 12/14 113981-3 Printed in U.S.A.
HARTFORDFUNDS
|
THE HARTFORD
2014 Annual Report |
A MESSAGE FROM THE PRESIDENT
Dear Fellow Shareholders:
Thank you for investing in Hartford Funds.
Market Review
U.S. equities (as represented by the S&P 500 Index) rose steadily for the fiscal year ended October 31, 2014, with a return of 17.27% for the period. With the exception of short-lived geopolitical scares early in 2014 and concerns about continuing global growth near the end of the period, stocks generally rose on solid fundamentals and encouraging macroeconomic data during the year.
September 2014 marked the six-year anniversary of the start of the financial crisis. Within weeks of that anniversary, both the S&P 500 Index and the Dow Jones Industrial Average set new all-time highs, closing at 2,018 and 17,391, respectively, on October 31. Although the fallout of the crisis continues to influence investor behavior, stocks have recovered and risen dramatically, up 198% from their low in March 2009. Meanwhile, the domestic economy is notching strong growth, and the unemployment rate has reached its lowest level since August 2008.
While the U.S. economy appears to have stabilized and to have reverted to a solid growth path, the outlook for the global economy appears to have gotten cloudier. The U.S. Federal Reserve has ended quantitative easing, while Europe and Japan are pursuing stimulus options to avoid a double-dip recession and deflation, respectively. Diverging central-bank policies will likely continue to play an important role in market movements going forward as investors wait to see the reactions to their efforts and their impacts on global markets.
How have market movements impacted your portfolio throughout the last year? Are your investments still on track to provide the growth or income you need, and are you comfortable with their progress during times of volatility?
Your financial professional can help you navigate today’s markets with confidence, as well as assist you to achieve your investment goals by providing advice on the best options within our fund family to help you work toward overcoming today’s investing challenges. Meet with your financial advisor regularly to examine your portfolio and your investment strategy, and to determine if you’re still on track to meet your goals.
Thank you again for investing with Hartford Funds.
James Davey
President
Hartford Funds
1 The S&P 500 Index is a market capitalization-weighted price index composed of 500 widely held common stocks.
2 The Dow Jones Industrial Average is an unmanaged, price-weighted index of 30 of the largest, most widely held stocks traded on the NYSE
The Hartford Healthcare Fund
The views expressed in the Fund’s Manager Discussion under ‘‘Why did the Fund perform this way?’’ and ‘‘What is the outlook?’’ are views of the Fund’s sub-adviser and portfolio management team through the end of the period and are subject to change based on market and other conditions. The Fund’s Manager Discussion is for informational purposes only and does not represent an offer, recommendation or solicitation to buy, hold or sell any security. The specific securities identified and described, if any, do not represent all of the securities purchased or sold and you should not assume that investments in the securities identified and discussed will be profitable.
The Hartford Healthcare Fund inception 05/01/2000
(sub-advised by Wellington Management Company, LLP)
| Investment objective – The Fund seeks long-term capital appreciation. |
Performance Overview 10/31/04 - 10/31/14
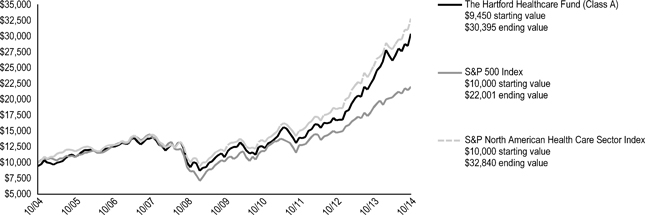
The chart above represents the hypothetical growth of a $10,000 investment in Class A, which includes a sales charge. Growth results in classes other than Class A will vary from what is seen above due to differences in the expenses charged to those share classes.
Average Annual Total Returns (as of 10/31/14)
| 1 Year | 5 Years | 10 Years | ||||||
| Healthcare A# | 30.48 | % | 22.87 | % | 12.39 | % | ||
| Healthcare A## | 23.30 | % | 21.49 | % | 11.76 | % | ||
| Healthcare B# | 29.34 | % | 21.85 | % | 11.71 | %* | ||
| Healthcare B## | 24.34 | % | 21.67 | % | 11.71 | %* | ||
| Healthcare C# | 29.52 | % | 22.01 | % | 11.58 | % | ||
| Healthcare C## | 28.52 | % | 22.01 | % | 11.58 | % | ||
| Healthcare I# | 30.84 | % | 23.25 | % | 12.69 | % | ||
| Healthcare R3# | 30.08 | % | 22.60 | % | 12.28 | % | ||
| Healthcare R4# | 30.45 | % | 22.97 | % | 12.58 | % | ||
| Healthcare R5# | 30.82 | % | 23.35 | % | 12.85 | % | ||
| Healthcare Y# | 31.00 | % | 23.45 | % | 12.92 | % | ||
| S&P 500 Index | 17.27 | % | 16.69 | % | 8.20 | % | ||
| S&P North American Health Care Sector Index | 30.02 | % | 22.79 | % | 12.63 | % | ||
| # | Without sales charge |
| ## | With sales charge |
| * | Class B shares convert to Class A shares after 8 years. The return shown reflects the conversion to Class A shares, which had different operating expenses, for the period after conversion. |
PERFORMANCE DATA QUOTED REPRESENTS PAST PERFORMANCE AND DOES NOT GUARANTEE FUTURE RESULTS. The investment return and principal value of the investment will fluctuate so that investors’ shares, when redeemed, may be worth more or less than their original cost. Current performance may be lower or higher than the performance data quoted. To obtain performance data current to the most recent month-end, please visit our website www.hartfordfunds.com.
The initial investment in Class A shares reflects the maximum sales charge of 5.50% and returns for Class B shares reflect a contingent deferred sales charge of up to 5.00% and declining to zero, depending on the period of time the shares are held. Returns for Class C shares reflect a contingent deferred sales charge of up to 1.00% on shares redeemed within twelve months of purchase.
Total returns presented above were calculated using the Fund’s net asset value available to shareholders for sale or redemption of Fund shares on October 31, 2014, which may exclude investment transactions as of this date. All share class returns assume the reinvestment of all distributions at net asset value and the deduction of all fund expenses.
Effective 9/30/09, Class B shares of the Fund were closed to new investments.
Class I shares commenced operations on 8/31/06. Performance prior to that date is that of the Fund's Class A shares (excluding sales charges), which had different operating expenses. Class R3, R4 and R5 shares commenced operations on 12/22/06. Performance prior to that date is that of the Fund's Class Y shares, which had different operating expenses.
S&P 500 Index is a market capitalization-weighted price index composed of 500 widely held common stocks.
S&P North American Health Care Sector Index is a modified capitalization-weighted index based on United States headquartered health care companies. Stocks in the index are weighted such that each stock is no more than 7.5% of the market capitalization as of the most recent reconstitution date. The companies included in the index must be common stocks and be traded on the NYSE MKT LLC, Nasdaq or the New York Stock Exchange and meet certain established market capitalization levels.
You cannot invest directly in an index.
The chart and table do not reflect the deductions of taxes that a shareholder would pay on Fund distributions or the redemption of Fund shares.
Performance information may reflect historical or current expense waivers/reimbursements from the investment adviser, without which performance would have been lower. For information on current expense waivers/reimbursements, please see the prospectus.
| 2 |
| The Hartford Healthcare Fund |
| Manager Discussion |
| October 31, 2014 (Unaudited) |
Operating Expenses*
| Net | Gross | ||||
| Healthcare Class A | 1.40 | % | 1.40 | % | |
| Healthcare Class B | 2.26 | % | 2.29 | % | |
| Healthcare Class C | 2.11 | % | 2.11 | % | |
| Healthcare Class I | 1.08 | % | 1.08 | % | |
| Healthcare Class R3 | 1.65 | % | 1.66 | % | |
| Healthcare Class R4 | 1.35 | % | 1.36 | % | |
| Healthcare Class R5 | 1.05 | % | 1.08 | % | |
| Healthcare Class Y | 0.96 | % | 0.96 | % | |
| * | As shown in the Fund's current prospectus dated March 1, 2014. Actual expenses may be higher or lower. Please see accompanying Financial Highlights for expense ratios for the year ended October 31, 2014. |
Gross expenses are the Fund's total annual operating expenses shown in the Fund's most recent prospectus. Net expenses are the Fund's total annual operating expenses shown in the Fund's most recent prospectus and reflect contractual expense reimbursements in instances when these reductions reduce the Fund's gross expenses. Contractual reimbursements remain in effect until February 28, 2015, and automatically renew for one-year terms unless terminated.
All investments are subject to risk including the possible loss of principal. For a discussion of the Fund’s risks, please see the Main Risks section of this report. For more detailed information on the risks associated with an investment in the Fund, please see the prospectus.
| Portfolio Managers | |||
| Jean M. Hynes, CFA | Ann C. Gallo | Kirk J. Mayer, CFA | Robert L. Deresiewicz |
| Senior Vice President and Global Industry Analyst | Senior Vice President and Global Industry Analyst | Senior Vice President and Global Industry Analyst | Senior Vice President and Global Industry Analyst |
How did the Fund perform?
The Class A shares of The Hartford Healthcare Fund returned 30.48%, before sales charge, for the twelve-month period ended October 31, 2014, performing roughly in line with the Fund’s benchmark, the S&P North American Health Care Sector Index, which returned 30.02% for the same period. The Fund outperformed the S&P 500 Index, which returned 17.27% for the same period. The Fund outperformed the 29.69% average return of the Lipper Global Health and Biotechnology peer group, a group of funds with investment strategies similar to those of the Fund.
Why did the Fund perform this way?
Health care stocks (+30%) outperformed both the broader U.S. market (+17%) and the global equity market (+9%) during the period, as measured by the S&P North American Health Care Sector, S&P 500, and the MSCI World Indices respectively. Within the S&P North American Health Care Index, all five sub-sectors posted positive absolute returns. Biopharma returns outperformed across the market-cap spectrum; small-cap, mid-cap, and large-cap biopharma returned approximately 47%, 46%, and 31%, respectively, while medical technology (+23%) and health services (+29%) lagged the broader health care index.
The Fund outperformed the S&P North American Health Care Sector Index due to a combination of positive sector allocation and positive stock selection. Overweight allocations to small- and mid-cap biopharma names as well as an underweight to medical technology contributed to relative performance. However, a modest cash position in an upward trending market environment detracted from relative results during the period. Security selection also contributed to relative returns due to strong selection in large-cap biopharma names and medical technology during the period.
Holdings of Forest Labs (pharma, biotech, & life sciences) and Anacor Pharmaceuticals (pharma, biotech, & life sciences) and having no exposure to Pfizer (pharma, biotech, & life sciences) contributed most to results relative to the S&P North American Health Care Sector Index. Shares of Forest Labs, a U.S.-based pharmaceutical company, soared in early 2014 on news the company was being acquired by Actavis for U.S. $25 billion. Shares of Anacor Pharmaceuticals, a U.S.-based biopharmaceutical company focused on discovering, developing and commercializing small-molecule therapeutics, outperformed on news that its topical toe nail antifungal was approved by the FDA. Pfizer, a large U.S. pharmaceutical company, saw its stock fall after the company's plans to acquire AstraZeneca were rejected after six months of negotiations. Top contributors to absolute performance during the period also included Gilead Sciences (specialty pharmaceuticals) and Covidien (health care equipment & services).
Allergan (pharma, biotech, & life sciences), TESARO (pharma, biotech, & life sciences), and Medicines Company (pharma, biotech, & life sciences) were the top detractors from performance relative to the S&P North American Health Care Sector Index. Shares of Allergan, a specialty pharmaceutical company, rose during the period as the company is being pursued as an acquisition candidate by Valeant Pharmaceuticals. Not owning the strong performing S&P North American Health Care Sector Index -constituent weighed on relative returns. Shares of TESARO, a U.S.-based biopharmaceutical company, pulled back in late March along with many other companies across the biopharma sub-sector, but the stock has been slower to recover from the drawdown. Medicines Company, a pharmaceutical firm focused on the acute-care (hospital-based) drug market, has been a weak performer due to potential generic competition for their lead drug Angiomax. Top detractors from absolute performance during the period also included MediWound (pharma, biotech, & life).
| 3 |
| The Hartford Healthcare Fund |
| Manager Discussion – (continued) |
October 31, 2014 (Unaudited) |
Derivatives are not used in a significant manner in this Fund and did not have a material impact on performance during the period.
What is the outlook?
We expect consolidation within the industry to continue, particularly among generic manufacturers, health care service companies, and biotechs. However, recent steps by the Treasury to limit inversion-based transactions will likely discourage companies from doing deals that do not have a strong, strategic rationale but rather are mainly driven by the tax considerations. Importantly, the companies held within the Fund that are domiciled in low tax jurisdictions are held for their strong fundamentals and have the qualities to succeed as stand-alone companies, separate from their potential appeal as acquisition targets.
We continue to emphasize holdings in the biopharmaceutical companies most advanced in the immuno-oncology field, as well as other biopharmaceuticals with underappreciated future cash flows. Moreover, we are optimistic about the long-term outlook for the health care services sector and maintain the belief that the evolving structure of health care markets both within and outside the U.S. will lead to the emergence of clear winners and losers. We believe our philosophy of using a long term time horizon to evaluate secular themes and trends as they play out globally will enable us to identify the pockets of opportunity within the health care sector able to generate sustainable, growth.
Diversification by Sector
as of October 31, 2014
| Sector | Percentage of Net Assets | |||
| Equity Securities | ||||
| Consumer Staples | 3.0 | % | ||
| Health Care | 92.5 | |||
| Industrials | 0.9 | |||
| Information Technology | 0.3 | |||
| Total | 96.7 | % | ||
| Short-Term Investments | 1.3 | |||
| Other Assets and Liabilities | 2.0 | |||
| Total | 100.0 | % | ||
A sector may be comprised of several industries. For Fund compliance purposes, the Fund may not use the same classification system and these sector classifications are used for reporting ease.
| 4 |
| The Hartford Healthcare Fund |
| Schedule of Investments |
| October 31, 2014 (000’s Omitted) |
| Shares or Principal Amount | Market Value ╪ | |||||||
| Common Stocks - 96.7% | ||||||||
| Biotechnology - 25.7% | ||||||||
| 91 | Acorda Therapeutics, Inc. ● | $ | 3,152 | |||||
| 413 | Alkermes plc ● | 20,855 | ||||||
| 120 | Alnylam Pharmaceuticals, Inc. ● | 11,138 | ||||||
| 388 | Anacor Pharmaceuticals, Inc. ● | 11,415 | ||||||
| 1,555 | Arena Pharmaceuticals, Inc. ● | 6,780 | ||||||
| 599 | BioCryst Pharmaceuticals, Inc. ● | 7,026 | ||||||
| 23 | Biogen Idec, Inc. ● | 7,257 | ||||||
| 186 | Cepheid, Inc. ● | 9,841 | ||||||
| 69 | Cubist Pharmaceuticals, Inc. ● | 4,990 | ||||||
| 79 | Foundation Medicine, Inc. ● | 2,037 | ||||||
| 526 | Gilead Sciences, Inc. ● | 58,929 | ||||||
| 345 | Glycomimetics, Inc. ● | 2,458 | ||||||
| 192 | Incyte Corp. ● | 12,851 | ||||||
| 125 | Innate Pharma S.A. ● | 1,152 | ||||||
| 307 | Ironwood Pharmaceuticals, Inc. ● | 4,310 | ||||||
| 9 | Kite Pharma, Inc. ● | 337 | ||||||
| 403 | NPS Pharmaceuticals, Inc. ● | 11,051 | ||||||
| 34 | Otonomy, Inc. ● | 899 | ||||||
| 157 | Portola Pharmaceuticals, Inc. ● | 4,472 | ||||||
| 84 | PTC Therapeutics, Inc. ● | 3,417 | ||||||
| 72 | Regeneron Pharmaceuticals, Inc. ● | 28,514 | ||||||
| 440 | Regulus Therapeutics, Inc. ● | 8,775 | ||||||
| 633 | Rigel Pharmaceuticals, Inc. ● | 1,252 | ||||||
| 106 | Seattle Genetics, Inc. ● | 3,878 | ||||||
| 261 | Tesaro, Inc. ● | 7,260 | ||||||
| 260 | Tetraphase Pharmaceuticals, Inc. ● | 6,211 | ||||||
| 193 | Trevana, Inc. ● | 1,119 | ||||||
| 4 | Ultragenyx Pharmaceutical, Inc. ● | 193 | ||||||
| 140 | Vertex Pharmaceuticals, Inc. ● | 15,771 | ||||||
| 257,340 | ||||||||
| Drug Retail - 3.0% | ||||||||
| 202 | CVS Health Corp. | 17,322 | ||||||
| 103 | Diplomat Pharmacy, Inc. ● | 2,208 | ||||||
| 164 | Walgreen Co. | 10,556 | ||||||
| 30,086 | ||||||||
| Health Care Distributors - 5.1% | ||||||||
| 229 | Cardinal Health, Inc. | 17,971 | ||||||
| 165 | McKesson Corp. | 33,581 | ||||||
| 51,552 | ||||||||
| Health Care Equipment - 17.5% | ||||||||
| 357 | Abbott Laboratories | 15,561 | ||||||
| 238 | AtriCure, Inc. ● | 4,154 | ||||||
| 38 | Becton, Dickinson & Co. | 4,830 | ||||||
| 1,337 | Boston Scientific Corp. ● | 17,755 | ||||||
| 316 | Covidien plc | 29,168 | ||||||
| 265 | Globus Medical, Inc. ● | 5,871 | ||||||
| 73 | Heartware International, Inc. ● | 5,601 | ||||||
| 561 | K2M Group Holdings, Inc. ● | 9,033 | ||||||
| 438 | Medtronic, Inc. | 29,850 | ||||||
| 140 | Ocular Therapeutix, Inc. ● | 2,140 | ||||||
| 261 | St. Jude Medical, Inc. | 16,734 | ||||||
| 159 | Stryker Corp. | 13,902 | ||||||
| 144 | T2 Biosystems, Inc. ● | 2,324 | ||||||
| 168 | Tornier N.V. ● | 4,704 | ||||||
| 316 | TriVascular Techonologies, Inc. ● | 4,182 | ||||||
| 90 | Zimmer Holdings, Inc. | 10,040 | ||||||
| 175,849 | ||||||||
| Health Care Facilities - 5.1% | ||||||||
| 114 | Acadia Healthcare Co., Inc. ● | 7,059 | ||||||
| 330 | HCA Holdings, Inc. ● | 23,128 | ||||||
| 528 | NMC Health plc | 4,181 | ||||||
| 2,363 | Phoenix Healthcare Group Co., Ltd. | 4,645 | ||||||
| 767 | Spire Healthcare Group plc ● | 3,436 | ||||||
| 88 | Universal Health Services, Inc. Class B | 9,098 | ||||||
| 51,547 | ||||||||
| Health Care Services - 1.7% | ||||||||
| 244 | Al Noor Hospitals Group | 3,976 | ||||||
| 368 | Envision Healthcare Holdings ● | 12,857 | ||||||
| 17 | iKang Healthcare Group, Inc. ● | 318 | ||||||
| 17,151 | ||||||||
| Health Care Supplies - 0.7% | ||||||||
| 96 | Dentsply International, Inc. | 4,851 | ||||||
| 163 | Endologix, Inc. ● | 1,855 | ||||||
| 6,706 | ||||||||
| Health Care Technology - 2.1% | ||||||||
| 650 | Allscripts Healthcare Solutions, Inc. ● | 8,915 | ||||||
| 56 | athenahealth, Inc. ● | 6,858 | ||||||
| 221 | IMS Health Holdings, Inc. ● | 5,360 | ||||||
| 21,133 | ||||||||
| Internet Software and Services - 0.3% | ||||||||
| 209 | Everyday Health, Inc. ● | 2,853 | ||||||
| Life Sciences Tools and Services - 2.4% | ||||||||
| 136 | Agilent Technologies, Inc. | 7,514 | ||||||
| 41 | Covance, Inc. ● | 3,287 | ||||||
| 33 | MorphoSys AG ● | 3,156 | ||||||
| 83 | Thermo Fisher Scientific, Inc. | 9,781 | ||||||
| 23,738 | ||||||||
| Managed Health Care - 5.7% | ||||||||
| 312 | Aetna, Inc. | 25,717 | ||||||
| 195 | CIGNA Corp. | 19,439 | ||||||
| 188 | Qualicorp S.A. ● | 1,909 | ||||||
| 110 | UnitedHealth Group, Inc. | 10,477 | ||||||
| 57,542 | ||||||||
| Pharmaceuticals - 26.5% | ||||||||
| 186 | Actavis plc ● | 45,149 | ||||||
| 392 | Aerie Pharmaceuticals, Inc. ● | 9,883 | ||||||
| 99 | Almirall S.A. ● | 1,626 | ||||||
| 238 | AstraZeneca plc ADR | 17,388 | ||||||
| 1,018 | Bristol-Myers Squibb Co. | 59,218 | ||||||
| 288 | Daiichi Sankyo Co., Ltd. | 4,326 | ||||||
| 53 | Dr. Reddy's Laboratories Ltd. ADR | 2,782 | ||||||
| 135 | Eisai Co., Ltd. | 5,295 | ||||||
| 252 | Eli Lilly & Co. | 16,718 | ||||||
| 96 | Hospira, Inc. ● | 5,177 | ||||||
| 61 | Johnson & Johnson | 6,586 | ||||||
| 264 | Medicines Co. ● | 6,672 | ||||||
| 232 | MediWound Ltd. ● | 1,371 | ||||||
| 273 | Merck & Co., Inc. | 15,828 | ||||||
| 135 | Mylan, Inc. ● | 7,248 | ||||||
| 39 | Ono Pharmaceutical Co., Ltd. | 3,917 | ||||||
| 17 | Salix Pharmaceuticals Ltd. ● | 2,480 | ||||||
| 107 | Sanofi-Aventis S.A. | 9,713 | ||||||
| 521 | Shionogi & Co., Ltd. | 13,620 | ||||||
| 247 | Teva Pharmaceutical Industries Ltd. ADR | 13,969 | ||||||
| 117 | UCB S.A. | 9,422 | ||||||
| 370 | Xenoport, Inc. ● | 2,512 | ||||||
| 128 | Zoetis, Inc. | 4,761 | ||||||
| 265,661 | ||||||||
The accompanying notes are an integral part of these financial statements.
| 5 |
| The Hartford Healthcare Fund |
| Schedule of Investments – (continued) |
| October 31, 2014 (000’s Omitted) |
| Shares or Principal Amount | Market Value ╪ | |||||||||||
| Common Stocks - 96.7% - (continued) | ||||||||||||
| Research and Consulting Services - 0.9% | ||||||||||||
| 158 | Quintiles Transnational Holdings ● | $ | 9,221 | |||||||||
| Total Common Stocks | ||||||||||||
| (Cost $642,276) | $ | 970,379 | ||||||||||
| Total Long-Term Investments | ||||||||||||
| (Cost $642,276) | $ | 970,379 | ||||||||||
| Short-Term Investments - 1.3% | ||||||||||||
| Repurchase Agreements - 1.3% | ||||||||||||
| Bank of America Merrill Lynch TriParty Repurchase Agreement (maturing on 11/03/2014 in the amount of $37, collateralized by U.S. Treasury Note 1.50%, 2019, value of $37) | ||||||||||||
| $ | 37 | 0.08%, 10/31/2014 | $ | 37 | ||||||||
| Bank of America Merrill Lynch TriParty Repurchase Agreement (maturing on 11/03/2014 in the amount of $624, collateralized by GNMA 1.63% - 7.00%, 2031 - 2054, value of $636) | ||||||||||||
| 624 | 0.09%, 10/31/2014 | 624 | ||||||||||
| Bank of Montreal TriParty Repurchase Agreement (maturing on 11/03/2014 in the amount of $168, collateralized by U.S. Treasury Bond 2.88% - 5.25%, 2029 - 2043, U.S. Treasury Note 0.38% - 4.50%, 2015 - 2022, value of $171) | ||||||||||||
| 167 | 0.08%, 10/31/2014 | 167 | ||||||||||
| Bank of Montreal TriParty Repurchase Agreement (maturing on 11/03/2014 in the amount of $568, collateralized by FHLMC 2.00% - 5.50%, 2022 - 2034, FNMA 2.00% - 4.50%, 2024 - 2039, GNMA 3.00%, 2043, U.S. Treasury Note 4.63%, 2017, value of $579) | ||||||||||||
| 568 | 0.10%, 10/31/2014 | 568 | ||||||||||
| Barclays Capital TriParty Repurchase Agreement (maturing on 11/03/2014 in the amount of $2,140, collateralized by U.S. Treasury Bond 4.50% - 6.25%, 2023 - 2036, U.S. Treasury Note 1.63% - 2.13%, 2015 - 2019, value of $2,183) | ||||||||||||
| 2,140 | 0.08%, 10/31/2014 | 2,140 | ||||||||||
| Citigroup Global Markets, Inc. TriParty Repurchase Agreement (maturing on 11/03/2014 in the amount of $2,460, collateralized by U.S. Treasury Bill 0.02%, 2015, U.S. Treasury Bond 3.88% - 11.25%, 2015 - 2040, U.S. Treasury Note 2.00% - 3.38%, 2019 - 2021, value of $2,509) | ||||||||||||
| 2,459 | 0.09%, 10/31/2014 | 2,459 | ||||||||||
| Deutsche Bank Securities TriParty Repurchase Agreement (maturing on 11/03/2014 in the amount of $142, collateralized by U.S. Treasury Note 0.88%, 2017, value of $145) | ||||||||||||
| 142 | 0.13%, 10/31/2014 | 142 | ||||||||||
| RBS Securities, Inc. TriParty Repurchase Agreement (maturing on 11/03/2014 in the amount of $209, collateralized by U.S. Treasury Bond 3.63% - 5.00%, 2037 - 2043, U.S. Treasury Note 2.13%, 2020, value of $213) | ||||||||||||
| 209 | 0.07%, 10/31/2014 | 209 | ||||||||||
| Societe Generale TriParty Repurchase Agreement (maturing on 11/03/2014 in the amount of $2,202, collateralized by U.S. Treasury Bill 0.02%, 2015, U.S. Treasury Bond 3.75% - 11.25%, 2015 - 2043, U.S. Treasury Note 1.38% - 4.25%, 2015 - 2022, value of $2,246) | ||||||||||||
| 2,202 | 0.08%, 10/31/2014 | 2,202 | ||||||||||
| TD Securities TriParty Repurchase Agreement (maturing on 11/03/2014 in the amount of $4,267, collateralized by FHLMC 3.00% - 4.00%, 2026 - 2044, FNMA 2.50% - 5.00%, 2025 - 2044, U.S. Treasury Bond 3.50% - 6.50%, 2026 - 2041, U.S. Treasury Note 1.75% - 2.88%, 2018 - 2019, value of $4,352) | ||||||||||||
| 4,266 | 0.10%, 10/31/2014 | 4,266 | ||||||||||
| 12,814 | ||||||||||||
| Total Short-Term Investments | ||||||||||||
| (Cost $12,814) | $ | 12,814 | ||||||||||
| Total Investments | ||||||||||||
| (Cost $655,090) ▲ | 98.0 | % | $ | 983,193 | ||||||||
| Other Assets and Liabilities | 2.0 | % | 19,567 | |||||||||
| Total Net Assets | 100.0 | % | $ | 1,002,760 | ||||||||
The accompanying notes are an integral part of these financial statements.
| 6 |
| The Hartford Healthcare Fund |
| Schedule of Investments – (continued) |
October 31, 2014 (000’s Omitted) |
Note: Percentage of investments as shown is the ratio of the total market value to total net assets.
Prices of foreign equities that are principally traded on certain foreign markets may be adjusted daily pursuant to a fair value pricing service approved by the Board of Directors in order to reflect an adjustment for factors occurring after the close of certain foreign markets but before the close of the New York Stock Exchange.
Equity industry classifications used in this report are the Global Industry Classification Standard, which was developed by and is the exclusive property and service mark of MSCI, Inc. and Standard & Poor’s.
For Fund compliance purposes, the Fund may not use the same classification system shown in this report as these classifications are used for reporting ease.
| ▲ | At October 31, 2014, the cost of securities for federal income tax purposes was $659,485 and the aggregate gross unrealized appreciation and depreciation based on that cost were: |
| Unrealized Appreciation | $ | 338,897 | ||
| Unrealized Depreciation | (15,189 | ) | ||
| Net Unrealized Appreciation | $ | 323,708 |
| ● | Non-income producing. |
Foreign Currency Contracts Outstanding at October 31, 2014
Unrealized Appreciation/(Depreciation) | ||||||||||||||||||||||
Currency | Buy / Sell | Delivery Date | Counterparty | Contract Amount | Market Value ╪ | Asset | Liability | |||||||||||||||
| JPY | Sell | 11/06/2014 | DEUT | $ | 362 | $ | 360 | $ | 2 | $ | – | |||||||||||
| JPY | Sell | 12/17/2014 | JPM | 13,013 | 12,353 | 660 | – | |||||||||||||||
| JPY | Sell | 11/04/2014 | SSG | 188 | 181 | 7 | – | |||||||||||||||
| JPY | Sell | 11/05/2014 | UBS | 967 | 939 | 28 | – | |||||||||||||||
| Total | $ | 697 | $ | – | ||||||||||||||||||
| ╪ | See Significant Accounting Policies of accompanying Notes to Financial Statements regarding valuation of securities. |
| GLOSSARY: (abbreviations used in preceding Schedule of Investments) | ||
| Counterparty Abbreviations: | ||
| DEUT | Deutsche Bank Securities, Inc. | |
| JPM | JP Morgan Chase & Co. | |
| SSG | State Street Global Markets LLC | |
| UBS | UBS AG | |
| Currency Abbreviations: | ||
| JPY | Japanese Yen | |
| Other Abbreviations: | ||
| ADR | American Depositary Receipt | |
| FHLMC | Federal Home Loan Mortgage Corp. | |
| FNMA | Federal National Mortgage Association | |
| GNMA | Government National Mortgage Association | |
The accompanying notes are an integral part of these financial statements.
| 7 |
| The Hartford Healthcare Fund |
| Schedule of Investments – (continued) |
| October 31, 2014 (000’s Omitted) |
Investment Valuation Hierarchy Level Summary
October 31, 2014
| Total | Level 1 ♦ | Level 2 ♦ | Level 3 | |||||||||||||
| Assets: | ||||||||||||||||
| Common Stocks ‡ | $ | 970,379 | $ | 913,507 | $ | 56,872 | $ | – | ||||||||
| Short-Term Investments | 12,814 | – | 12,814 | – | ||||||||||||
| Total | $ | 983,193 | $ | 913,507 | $ | 69,686 | $ | – | ||||||||
| Foreign Currency Contracts * | $ | 697 | $ | – | $ | 697 | $ | – | ||||||||
| Total | $ | 697 | $ | – | $ | 697 | $ | – | ||||||||
| ♦ | For the year ended October 31, 2014, there were no transfers between Level 1 and Level 2. |
| ‡ | The Fund has all or primarily all of the equity securities categorized in a particular level. Refer to the Schedule of Investments for further industry breakout. |
| * | Derivative instruments (excluding purchased and written options, if applicable) are valued at the unrealized appreciation/depreciation on the investments. |
| Note: | For purposes of reporting transfers between different hierarchy levels, both transfers in and out of each level, as applicable, are shown as if they occurred at the beginning of the period. |
The accompanying notes are an integral part of these financial statements.
| 8 |
| The Hartford Healthcare Fund |
Statement of Assets and Liabilities October 31, 2014 (000’s Omitted) |
| Assets: | ||||
| Investments in securities, at market value (cost $655,090) | $ | 983,193 | ||
| Cash | — | |||
| Foreign currency on deposit with custodian (cost $—) | — | |||
| Unrealized appreciation on foreign currency contracts | 697 | |||
| Receivables: | ||||
| Investment securities sold | 16,126 | |||
| Fund shares sold | 3,876 | |||
| Dividends and interest | 991 | |||
| Other assets | 70 | |||
| Total assets | 1,004,953 | |||
| Liabilities: | ||||
| Payables: | ||||
| Investment securities purchased | 1,058 | |||
| Fund shares redeemed | 753 | |||
| Investment management fees | 163 | |||
| Administrative fees | 2 | |||
| Distribution fees | 68 | |||
| Accrued expenses | 149 | |||
| Total liabilities | 2,193 | |||
| Net assets | $ | 1,002,760 | ||
| Summary of Net Assets: | ||||
| Capital stock and paid-in-capital | $ | 611,532 | ||
| Distributions in excess of net investment income | (4,576 | ) | ||
| Accumulated net realized gain | 67,045 | |||
| Unrealized appreciation of investments and the translation of assets and liabilities denominated in foreign currency | 328,759 | |||
| Net assets | $ | 1,002,760 | ||
| Shares authorized | 500,000 | |||
| Par value | $ | 0.001 | ||
| Class A: Net asset value per share/Maximum offering price per share | $36.60/$38.73 | |||
| Shares outstanding | 16,368 | |||
| Net assets | $ | 599,010 | ||
| Class B: Net asset value per share | $ | 32.18 | ||
| Shares outstanding | 351 | |||
| Net assets | $ | 11,303 | ||
| Class C: Net asset value per share | $ | 32.42 | ||
| Shares outstanding | 5,446 | |||
| Net assets | $ | 176,581 | ||
| Class I: Net asset value per share | $ | 37.63 | ||
| Shares outstanding | 3,653 | |||
| Net assets | $ | 137,450 | ||
| Class R3: Net asset value per share | $ | 37.58 | ||
| Shares outstanding | 1,077 | |||
| Net assets | $ | 40,482 | ||
| Class R4: Net asset value per share | $ | 38.64 | ||
| Shares outstanding | 764 | |||
| Net assets | $ | 29,530 | ||
| Class R5: Net asset value per share | $ | 39.60 | ||
| Shares outstanding | 59 | |||
| Net assets | $ | 2,323 | ||
| Class Y: Net asset value per share | $ | 39.85 | ||
| Shares outstanding | 153 | |||
| Net assets | $ | 6,081 |
The accompanying notes are an integral part of these financial statements.
| 9 |
| The Hartford Healthcare Fund |
| Statement of Operations |
| For the Year Ended October 31, 2014 |
| (000’s Omitted) |
| Investment Income: | ||||
| Dividends | $ | 7,848 | ||
| Interest | 16 | |||
| Less: Foreign tax withheld | (167 | ) | ||
| Total investment income | 7,697 | |||
| Expenses: | ||||
| Investment management fees | 7,318 | |||
| Administrative services fees | ||||
| Class R3 | 65 | |||
| Class R4 | 34 | |||
| Class R5 | 2 | |||
| Transfer agent fees | ||||
| Class A | 725 | |||
| Class B | 36 | |||
| Class C | 177 | |||
| Class I | 121 | |||
| Class R3 | 2 | |||
| Class R4 | — | |||
| Class R5 | — | |||
| Class Y | — | |||
| Distribution fees | ||||
| Class A | 1,252 | |||
| Class B | 137 | |||
| Class C | 1,461 | |||
| Class R3 | 162 | |||
| Class R4 | 58 | |||
| Custodian fees | 12 | |||
| Accounting services fees | 116 | |||
| Registration and filing fees | 144 | |||
| Board of Directors' fees | 22 | |||
| Audit fees | 17 | |||
| Other expenses | 141 | |||
| Total expenses (before waivers and fees paid indirectly) | 12,002 | |||
| Expense waivers | — | |||
| Commission recapture | (12 | ) | ||
| Custodian fee offset | — | |||
| Total waivers and fees paid indirectly | (12 | ) | ||
| Total expenses, net | 11,990 | |||
| Net Investment Loss | (4,293 | ) | ||
| Net Realized Gain on Investments and Foreign Currency Transactions: | ||||
| Net realized gain on investments | 83,054 | |||
| Net realized gain on foreign currency contracts | 963 | |||
| Net realized gain on other foreign currency transactions | 102 | |||
| Net Realized Gain on Investments and Foreign Currency Transactions | 84,119 | |||
| Net Changes in Unrealized Appreciation of Investments and Foreign Currency Transactions: | ||||
| Net unrealized appreciation of investments | 136,202 | |||
| Net unrealized appreciation of foreign currency contracts | 622 | |||
| Net unrealized depreciation of translation of other assets and liabilities in foreign currencies | (48 | ) | ||
| Net Changes in Unrealized Appreciation of Investments and Foreign Currency Transactions | 136,776 | |||
| Net Gain on Investments and Foreign Currency Transactions | 220,895 | |||
| Net Increase in Net Assets Resulting from Operations | $ | 216,602 |
The accompanying notes are an integral part of these financial statements.
| 10 |
| The Hartford Healthcare Fund |
| Statement of Changes in Net Assets |
| (000’s Omitted) |
| For the Year Ended October 31, 2014 | For the Year Ended October 31, 2013 | |||||||
| Operations: | ||||||||
| Net investment loss | $ | (4,293 | ) | $ | (1,920 | ) | ||
| Net realized gain on investments and foreign currency transactions | 84,119 | 41,957 | ||||||
| Net unrealized appreciation of investments and foreign currency transactions | 136,776 | 134,236 | ||||||
| Net Increase in Net Assets Resulting from Operations | 216,602 | 174,273 | ||||||
| Capital Share Transactions: | ||||||||
| Class A | 52,262 | 28,527 | ||||||
| Class B | (6,916 | ) | (3,981 | ) | ||||
| Class C | 22,913 | 13,332 | ||||||
| Class I | 30,037 | 22,756 | ||||||
| Class R3 | 7,219 | 6,671 | ||||||
| Class R4 | 5,638 | 1,020 | ||||||
| Class R5 | 614 | (1,729 | ) | |||||
| Class Y | 671 | (457 | ) | |||||
| Net increase from capital share transactions | 112,438 | 66,139 | ||||||
| Net Increase in Net Assets | 329,040 | 240,412 | ||||||
| Net Assets: | ||||||||
| Beginning of period | 673,720 | 433,308 | ||||||
| End of period | $ | 1,002,760 | $ | 673,720 | ||||
| Undistributed (distributions in excess of) net investment income | $ | (4,576 | ) | $ | (2,241 | ) | ||
The accompanying notes are an integral part of these financial statements.
| 11 |
| The Hartford Healthcare Fund |
| Notes to Financial Statements |
| October 31, 2014 |
| (000’s Omitted) |
Organization:
The Hartford Mutual Funds, Inc. (“Company”) is an open-end management investment company comprised of forty-two portfolios. Financial statements for The Hartford Healthcare Fund (the "Fund"), a series of the Company, are included in this report.
The Company is organized under the laws of the State of Maryland and is registered with the Securities and Exchange Commission (“SEC”) under the Investment Company Act of 1940, as amended (“1940 Act”). The Fund is a diversified open-end management investment company. The Fund is an investment company and applies specialized accounting and reporting under Accounting Standards Codification Topic 946, Financial Services - Investment Companies.
Class A shares are sold with a front-end sales charge of up to 5.50%. Class B shares were sold with a contingent deferred sales charge which is assessed on the lesser of the per share net asset value (“NAV”) of the shares at the time of redemption or the original purchase price, and declines from up to 5.00% to zero depending on the period of time the shares are held (see note below regarding the closing of Class B shares). Class C shares are sold with a contingent deferred sales charge of up to 1.00% on shares redeemed within twelve months of purchase. Class I shares are sold without sales charges to certain eligible investors primarily through advisory fee-based wrap programs. Class R3, R4 and R5 shares, which are offered to employer-sponsored retirement plans, and Class Y shares, which are sold to certain eligible institutional investors, are sold without a sales charge. All classes of shares have identical voting, redemption, dividend, liquidation and other rights and the same terms and conditions, with the exceptions that each class may have different expenses, which may affect performance, and that Class B shares automatically convert to Class A shares after 8 years.
No new or additional investments are allowed in Class B shares of the Fund (including investments through any systematic investment plan). Existing shareholders of Class B shares may continue to hold their Class B shares, exchange their Class B shares for Class B shares of another Hartford Fund (as permitted by existing exchange privileges), or redeem their Class B shares as described in the Fund’s prospectus. Reinstatement privileges with respect to Class B shares are set forth in the Fund's prospectus. For investors electing to reinvest capital gains and dividends, any such capital gains or dividends on Class B shares will continue to be reinvested in Class B shares of the Fund. All Class B share attributes, including the 12b-1 fee, contingent deferred sales charge schedule, and conversion to Class A shares, remain unchanged.
Significant Accounting Policies:
The following is a summary of significant accounting policies of the Fund in the preparation of its financial statements, which are in accordance with United States generally accepted accounting principles (“U.S. GAAP”). The preparation of financial statements in accordance with U.S. GAAP may require management to make estimates and assumptions that affect the reported amounts of assets and liabilities and disclosure of contingent assets and liabilities at the date of the financial statements and the reported amounts of increases and decreases in net assets from operations during the reporting period. Actual results could differ from those estimates.
Determination of Net Asset Value – The NAV of each class of the Fund's shares is determined as of the close of regular trading (normally 4:00 p.m. Eastern Time) (the “NYSE Close”) on each day that the New York Stock Exchange (the “Exchange”) is open (“Valuation Date”). Information that becomes known to the Fund after the NAV has been calculated on a particular day will not generally be used to retroactively adjust the NAV determined earlier that day.
Investment Valuation and Fair Value Measurements – For purposes of calculating the NAV, portfolio investments and other assets held by the Fund's portfolio for which market quotes are readily available are valued at market value. Market value is generally determined on the basis of last reported sales prices or official close price. If no sales are reported, market value is based on quotes obtained from a quotation reporting system, established market makers, or independent pricing services. If market prices are not readily available or are deemed unreliable, the Fund will use the fair value of the investment as determined in good faith under policies and procedures established by and under the supervision of the Company's Board of Directors. Market quotes are considered not readily available where there is an absence of current or reliable market-based data (e.g., trade information or indicative market quotes), including where events occur after the close of the relevant market, but prior to the NYSE Close, that materially affect the values of the Fund's portfolio investments or assets. In addition, market quotes are considered not readily available when, due to extraordinary circumstances, the exchanges or markets on which the investments trade do not open for trading for the entire day and no other market prices are available. In addition, prices of foreign equities that are principally traded on certain foreign markets may
| 12 |
| The Hartford Healthcare Fund |
| Notes to Financial Statements – (continued) |
| October 31, 2014 (000’s Omitted) |
be adjusted daily pursuant to a fair value pricing service approved by the Board of Directors in order to reflect an adjustment for the factors occurring after the close of certain foreign markets but before the NYSE Close. Investments that are primarily traded on foreign markets may trade on days that are not business days of the Fund. The value of the foreign investments in which the Fund invests may change on days when a shareholder will not be able to purchase or redeem shares of the Fund. Fair value pricing is subjective in nature and the use of fair value pricing by the Fund may cause the NAV of its shares to differ significantly from the NAV that would have been calculated using market prices at the close of the exchange on which a portfolio investment is primarily traded. There can be no assurance that the Fund could obtain the fair market value assigned to an investment if the Fund were to sell the investment at approximately the time at which the Fund determines its NAV.
Investments valued in currencies other than U.S. dollars are converted to U.S. dollars using exchange rates obtained from independent pricing services for calculation of the NAV. As a result, the NAV of the Fund’s shares may be affected by changes in the value of currencies in relation to the U.S. dollar. The value of investments traded in markets outside the United States or denominated in currencies other than the U.S. dollar may be affected significantly on a day that the NYSE is closed and the market value may change on days when an investor is not able to purchase, redeem or exchange shares of the Fund.
Foreign currency contracts represent agreements to exchange currencies on specific future dates at predetermined rates. Foreign currency contracts are valued using foreign currency exchange rates and forward rates as provided by an independent pricing service on the Valuation Date.
Financial instruments for which prices are not available from an independent pricing service may be valued using market quotations obtained from one or more dealers that make markets in the respective financial instrument in accordance with procedures established by the Company's Board of Directors.
U.S. GAAP defines fair value as the price that the Fund would receive to sell an asset or pay to transfer a liability in an orderly transaction between market participants. The U.S. GAAP fair value measurement standards require disclosure of a fair value hierarchy for each major category of assets and liabilities. Various inputs are used in determining the fair value of the Fund’s investments. These inputs are summarized into three broad hierarchy levels. This hierarchy is based on whether the valuation inputs are observable or unobservable. These levels are:
Level 1 – Quoted prices in active markets for identical investments. Level 1 may include exchange traded instruments, such as domestic equities, some foreign equities, options, futures, mutual funds, exchange traded funds, rights and warrants.
Level 2 – Observable inputs other than Level 1 prices, such as quoted prices for similar investments; quoted prices in markets that are not active; or other inputs that are observable or can be corroborated by observable market data. Level 2 may include debt investments that are traded less frequently than exchange traded instruments and which are valued using independent pricing services; foreign equities, which are principally traded on certain foreign markets and are adjusted daily pursuant to a fair value pricing service in order to reflect an adjustment for the factors occurring after the close of certain foreign markets but before the NYSE Close; senior floating rate interests, which are valued using an aggregate of dealer bids; short-term investments, which are valued at amortized cost; and swaps, which are valued based upon the terms of each swap contract.
Level 3 – Significant unobservable inputs that are supported by limited or no market activity. Level 3 may include financial instruments whose values are determined using indicative market quotes or require significant management judgment or estimation. These unobservable valuation inputs may include estimates for current yields, maturity/duration, prepayment speed, and indicative market quotes for comparable investments along with other assumptions relating to credit quality, collateral value, complexity of the investment structure, general market conditions and liquidity. This category may include investments where trading has been halted or there are certain restrictions on trading. While these investments are priced using unobservable inputs, the valuation of these investments reflects the best available data and management believes the prices are a reasonable representation of exit price.
The Board of Directors of the Company generally reviews and approves the “Procedures for Valuation of Portfolio Securities” at least once a year. These procedures define how investments are to be valued, including the formation and activities of a Valuation Committee. The Valuation Committee is responsible for determining in good faith the fair value of investments when
| 13 |
| The Hartford Healthcare Fund |
| Notes to Financial Statements – (continued) |
October 31, 2014 (000’s Omitted) |
the value cannot be obtained from primary pricing services or alternative sources or if the valuation of an investment as provided by the primary pricing service or alternative source is believed not to reflect the investment’s fair value as of the Valuation Date. Voting members of the Valuation Committee include the Fund's Treasurer or designee and a Vice President of the investment manager or designee. An Assistant Vice President of the Fund with legal expertise or designee is also included on the Valuation Committee as a non-voting advisory member. In addition, the Fund’s Chief Compliance Officer shall designate a member of the compliance group to attend Valuation Committee meetings as a non-voting resource, to monitor for and provide guidance with respect to compliance with these procedures. Two members of the Valuation Committee or their designees, representing different departments, shall constitute a quorum for purposes of permitting the Valuation Committee to take action. The Valuation Committee will consider all relevant factors in determining an investment’s fair value, and may seek the advice of the Fund’s sub-adviser, knowledgeable brokers, and legal counsel in making such determination. The Valuation Committee reports to the Audit Committee of the Company's Board of Directors. The Audit Committee receives quarterly written reports which include details of all fair-valued investments, including the reason for the fair valuation, and an indication, when possible, of the accuracy of the valuation by disclosing the next available reliable public price quotation or the disposition price of such investments (the “look-back” test). The Board of Directors then must consider for ratification all of the fair value determinations made during the previous quarter.
Valuation levels are not necessarily indicative of the risk associated with investing in such investments. Individual investments within any of the above mentioned asset classes may be assigned a different hierarchical level than those presented above, as individual circumstances dictate.
For additional information, refer to the Investment Valuation Hierarchy Level Summary which follows the Schedule of Investments.
Investment Transactions and Investment Income – Investment transactions are recorded as of the trade date (the date the order to buy or sell is executed) for financial reporting purposes. Investments purchased or sold on a when-issued or delayed-delivery basis may be settled a month or more after the trade date. Realized gains and losses are determined on the basis of identified cost.
Dividend income from domestic securities is accrued on the ex-dividend date. In general, dividend income from foreign securities is recorded on the ex-date; however, dividend notifications in certain foreign jurisdictions may not be available in a timely manner and as a result, the Fund will record the dividend as soon as the relevant details (i.e., rate per share, payment date, shareholders of record, etc.) are publicly available. Interest income, including amortization of premium, accretion of discounts and additional principal received in-kind in lieu of cash, is accrued on a daily basis.
Foreign Currency Transactions – Assets and liabilities denominated in currencies other than U.S. dollars are translated into U.S. dollars at the exchange rates in effect on the valuation date. Purchases and sales of investments, income and expenses are translated into U.S. dollars at the exchange rates on the dates of such transactions.
The Fund does not isolate that portion of portfolio investment valuation resulting from fluctuations in the foreign currency exchange rates from the fluctuations arising from changes in the market prices of investments held. Exchange rate fluctuations are included with the net realized and unrealized gain or loss on investments in the accompanying financial statements.
Net realized foreign exchange gains or losses arise from sales of foreign currencies and the difference between asset and liability amounts initially stated in foreign currencies and the U.S. dollar value of the amounts actually received or paid. Net unrealized foreign exchange gains or losses arise from changes in the value of other assets and liabilities at the end of the reporting period, resulting from changes in the exchange rates.
Joint Trading Account – The Fund may invest cash balances into a joint trading account that may be invested in one or more repurchase agreements.
Fund Share Valuation and Dividend Distributions to Shareholders – Orders for the Fund’s shares are executed in accordance with the investment instructions of the shareholders. The NAV of the Fund’s shares is determined as of the close of business on each business day of the Exchange. The NAV is determined separately for each class of shares of the Fund by dividing the Fund’s net assets attributable to that class by the number of shares of the class outstanding. Each class of shares offered by the Fund has equal
| 14 |
| The Hartford Healthcare Fund |
| Notes to Financial Statements – (continued) |
| October 31, 2014 (000’s Omitted) |
rights as to assets and voting privileges (except that shareholders of a class have exclusive voting rights regarding any matter relating solely to that class of shares). Income and non-class specific expenses are allocated daily to each class on the basis of the relative net assets of the class. Realized and unrealized gains and losses are allocated daily based on the relative net assets of each class of shares of the Fund.
Orders for the purchase of the Fund’s shares received prior to the close of the Exchange on any day the Exchange is open for business are priced at the NAV determined as of the close of the Exchange. Orders received after the close of the Exchange, or on a day on which the Exchange and/or the Fund is not open for business, are priced at the next determined NAV.
Dividends are declared pursuant to a policy adopted by the Company's Board of Directors based upon the investment performance of the Fund. The policy of the Fund is to pay dividends from net investment income and realized gains, if any, at least once a year.
Net investment income, dividends and distributions from net realized gains and capital are determined in accordance with federal income tax regulations, which may differ from U.S. GAAP with respect to character and timing (see Federal Income Taxes: Distributions and Components of Distributable Earnings and Reclassification of Capital Accounts).
Securities and Other Investments:
Repurchase Agreements – A repurchase agreement is an agreement by which a counterparty agrees to sell an investment and agrees to repurchase the investment sold from the buyer at a mutually agreed upon time and price. During the period of the repurchase agreement, the counterparty will deposit cash and or securities in a third party custodial account to serve as collateral. At the time the Fund enters into a repurchase agreement, the value of the underlying collateral, including accrued interest, will be equal to or exceed the value of the repurchase agreement. Repurchase agreements expose the Fund to counterparty risk - that is, the risk that the counterparty will not fulfill its obligations. To minimize counterparty risk, the investments that serve to collateralize the repurchase agreement are held by the Fund’s custodian in book entry or physical form in the custodial account of the Fund or in a third party custodial account. Repurchase agreements are valued at cost plus accrued interest, which approximates fair value. Repurchase agreements have master netting arrangements which allow the Fund to offset amounts owed to a counterparty with amounts owed by the counterparty, including any collateral. Upon an event of default under a master repurchase agreement, the non-defaulting party may close out all transactions traded under such agreement and net amounts owed under each transaction to one net amount payable by one party to the other. Absent an event of default, the master repurchase agreement does not result in an offset of reported amounts of assets and liabilities in the Statement of Assets and Liabilities across transactions between the Fund and the applicable counterparty. The Fund, as shown on the Schedule of Investments, had outstanding repurchase agreements and related collateral as of October 31, 2014.
Investments Purchased on a When-Issued or Delayed-Delivery Basis – Delivery and payment for investments that have been purchased by the Fund on a forward commitment, or when-issued or delayed-delivery basis, take place beyond the customary settlement period. The Fund may dispose of or renegotiate a delayed-delivery transaction after it is entered into, and may sell delayed-delivery investments before they are delivered, which may result in a realized gain or loss. During this period, such investments are subject to market fluctuations, and the Fund identifies investments segregated in its records with a value at least equal to the amount of the commitment. The Fund had no when-issued or delayed-delivery investments as of October 31, 2014.
Financial Derivative Instruments:
The following disclosures contain information on how and why the Fund uses derivative instruments, the credit-risk-related contingent features in certain derivative instruments and how derivative instruments affect the Fund’s financial position and results of operations. The location and fair value amounts of these instruments on the Statement of Assets and Liabilities and the realized gains and losses and changes in unrealized gains and losses on the Statement of Operations, each categorized by type of derivative contract, are included in the following Additional Derivative Instrument Information footnote. The derivative instruments outstanding as of year-end are disclosed in the notes to the Schedule of Investments, if applicable. The amounts of realized gains and losses and changes in unrealized gains and losses on derivative instruments during the year are disclosed in the Statement of Operations.
| 15 |
| The Hartford Healthcare Fund |
| Notes to Financial Statements – (continued) |
| October 31, 2014 |
| (000’s Omitted) |
Foreign Currency Contracts – The Fund may enter into foreign currency contracts that obligate the Fund to purchase or sell currencies at specified future dates. Foreign currency contracts are used to hedge the currency exposure associated with some or all of the Fund’s investments and/or as part of an investment strategy. Foreign currency contracts are marked to market daily and the change in value is recorded by the Fund as an unrealized gain or loss. The Fund will record a realized gain or loss when the foreign currency contract is settled.
Foreign currency contracts involve elements of market risk in excess of the amounts reflected in the Statement of Assets and Liabilities. In addition, risks may arise upon entering into these contracts from the potential inability of the counterparties to meet the terms of the contracts and from unanticipated movements in the value of the foreign currencies relative to the U.S. dollar. The Fund, as shown on the Schedule of Investments, had outstanding foreign currency contracts as of October 31, 2014.
Additional Derivative Instrument Information:
Fair Value of Derivative Instruments on the Statement of Assets and Liabilities as of October 31, 2014:
| Risk Exposure Category | ||||||||||||||||||||||||||||
Interest
Rate | Foreign | Credit | Equity | Commodity | Other | Total | ||||||||||||||||||||||
| Assets: | ||||||||||||||||||||||||||||
| Unrealized appreciation on foreign currency contracts | $ | — | $ | 697 | $ | — | $ | — | $ | — | $ | — | $ | 697 | ||||||||||||||
| Total | $ | — | $ | 697 | $ | — | $ | — | $ | — | $ | — | $ | 697 | ||||||||||||||
The volume of derivatives that is presented in the Schedule of Investments is consistent with the derivative activity during the year ended October 31, 2014.
The Effect of Derivative Instruments on the Statement of Operations for the year ended October 31, 2014:
| Risk Exposure Category | ||||||||||||||||||||||||||||
Interest
Rate | Foreign | Credit | Equity | Commodity | Other | Total | ||||||||||||||||||||||
| Realized Gain on Derivatives Recognized as a Result of Operations: | ||||||||||||||||||||||||||||
| Net realized gain on foreign currency contracts | $ | — | $ | 963 | $ | — | $ | — | $ | — | $ | — | $ | 963 | ||||||||||||||
| Total | $ | — | $ | 963 | $ | — | $ | — | $ | — | $ | — | $ | 963 | ||||||||||||||
| Net Change in Unrealized Appreciation (Depreciation) on Derivatives Recognized as a Result of Operations: | ||||||||||||||||||||||||||||
| Net change in unrealized appreciation of foreign currency contracts | $ | — | $ | 622 | $ | — | $ | — | $ | — | $ | — | $ | 622 | ||||||||||||||
| Total | $ | — | $ | 622 | $ | — | $ | — | $ | — | $ | — | $ | 622 | ||||||||||||||
Balance Sheet Offsetting Information - The following discloses both gross information and net information about instruments and transactions eligible for offset in the financial statements, and instruments and transactions that are subject to a master netting arrangement, as well as amounts related to margin, reflected as financial collateral (including cash collateral), held at clearing brokers, counterparties and the Fund’s custodian. The master netting arrangements allow the clearing brokers to net any collateral held in or on behalf of the Fund, or liabilities or payment obligations of the clearing brokers to the Fund, against any liabilities or payment obligations of the Fund to the clearing brokers. The Fund is required to deposit financial collateral (including cash collateral) at the Futures Commission Merchant's ("FCM") custodian on behalf of clearing brokers and counterparties to continually meet the original and maintenance requirements established by the clearing brokers and counterparties. Such requirements are specific to the respective clearing broker or counterparty. Certain master netting arrangements may not be enforceable in the bankruptcy proceedings of a counterparty.
| 16 |
| The Hartford Healthcare Fund |
| Notes to Financial Statements – (continued) |
October 31, 2014 (000’s Omitted) |
Offsetting of Financial Assets and Derivative Assets as of October 31, 2014:
| Gross
Amounts* of Assets Presented in Statement of Assets and Liabilities | Financial Instruments with Allowable Netting | Non-cash Collateral Received | Cash
Collateral Received | Net
Amount (not less than $0) | ||||||||||||||||
| Description | ||||||||||||||||||||
| Unrealized appreciation on foreign currency contracts | $ | 660 | $ | — | $ | — | $ | — | $ | 660 | ||||||||||
| Total subject to a master netting or similar arrangement | $ | 660 | $ | — | $ | — | $ | — | $ | 660 | ||||||||||
* Gross amounts are presented here as there are no amounts that are netted within the Statement of Assets and Liabilities.
Certain derivatives held by the Fund, as of October 31, 2014, are not subject to a master netting arrangement and are excluded from the table above.
Principal Risks:
The Fund may be exposed to counterparty risk, or the risk that an institution or other entity with which the Fund has unsettled or open transactions will default.
If the Fund invests directly in foreign currencies or in securities that trade in, and receive revenues in, foreign currencies, or in derivatives that provide exposure to foreign currencies, it will be subject to the risk that those currencies will decline in value relative to the base currency (U.S. dollars) of the Fund, or, in the case of hedging positions, that the Fund’s base currency will decline in value relative to the currency being hedged. Currency rates in foreign countries may fluctuate significantly over short periods of time for a number of reasons, including changes in interest rates, intervention (or the failure to intervene) by U.S. or foreign governments, central banks or supranational entities, such as the International Monetary Fund, or by the imposition of currency controls or other political developments in the United States or abroad. As a result, the Fund’s investments in foreign currency denominated securities may reduce the returns of the Fund. The market values of equity securities, such as common stocks and preferred stocks, or equity related investments, such as futures and options, may decline due to general market conditions which are not specifically related to a particular company, such as real or perceived adverse economic conditions, changes in the general outlook for corporate earnings, changes in interest or currency rates or adverse investor sentiment generally. The market value of equity securities may also decline due to factors which affect a particular industry or industries, such as labor shortages or increased production costs and competitive conditions within an industry. Equity securities and equity related investments generally have greater market price volatility than fixed income securities.
Federal Income Taxes:
Federal Income Taxes – For federal income tax purposes, the Fund intends to continue to qualify as a Regulated Investment Company ("RIC") under Subchapter M of the Internal Revenue Code (“IRC”) by distributing substantially all of its taxable net investment income and net realized capital gains to its shareholders and otherwise complying with the requirements of the IRC. The Fund has distributed substantially all of its income and capital gains in prior years, if applicable, and intends to distribute substantially all of its income and capital gains during the calendar year ending December 31, 2014. Accordingly, no provision for federal income or excise taxes has been made in the accompanying financial statements. Distributions from short-term capital gains are treated as ordinary income distributions for federal income tax purposes.
Net Investment Income (Loss), Net Realized Gains (Losses) and Distributions – Net investment income (loss) and net realized gains (losses) may differ for financial statement and tax purposes primarily because of losses deferred due to wash sale adjustments, foreign currency gains and losses, adjustments related to Passive Foreign Investment Companies ("PFICs"), Real Estate Investment Trusts ("REITs"), RICs, certain derivatives and partnerships. The character of distributions made during the year from net investment income or net realized gains may differ from their ultimate characterization for federal income tax purposes. Also, due to the timing of dividend distributions, the fiscal year in which amounts are distributed may differ from the year that the income or realized gains (losses) were recorded by the Fund.
| 17 |
| The Hartford Healthcare Fund |
| Notes to Financial Statements – (continued) |
October 31, 2014 (000’s Omitted) |
Components of Distributable Earnings – The Fund’s components of distributable earnings (deficit) on a tax basis at October 31, 2014, are as follows:
| Amount | ||||
| Undistributed Long-Term Capital Gain | $ | 71,460 | ||
| Accumulated Capital and Other Losses | (3,936 | ) | ||
| Unrealized Appreciation* | 323,704 | |||
| Total Accumulated Earnings | $ | 391,228 | ||
| * | Differences between book-basis and tax-basis unrealized appreciation (depreciation) may be attributable to the losses deferred due to wash sale adjustments, foreign currency gains and losses, adjustments related to PFICs, REITs, RICs, certain derivatives and partnerships. |
Reclassification of Capital Accounts – The Fund may record reclassifications in its capital accounts. These reclassifications have no impact on the total net assets of the Fund. The reclassifications are a result of permanent differences between U.S. GAAP and tax accounting for such items as foreign currency, PFICs, expiration or utilization of capital loss carryforwards or net operating losses. Adjustments are made to reflect the impact these items have on current and future distributions to shareholders. Therefore, the source of the Fund’s distributions may be shown in the accompanying Statement of Changes in Net Assets as from undistributed net investment income, from accumulated net realized gains on investments or from capital depending on the type of book and tax differences that exist. For the year ended October 31, 2014, the Fund recorded reclassifications to increase (decrease) the accounts listed below:
| Amount | ||||
| Undistributed Net Investment Income (Loss) | $ | 1,958 | ||
| Accumulated Net Realized Gain (Loss) | 160 | |||
| Capital Stock and Paid-in-Capital | (2,118 | ) | ||
Capital Loss Carryforward – On December 22, 2010, the Regulated Investment Company Modernization Act of 2010 (the “Act”) was enacted, which made changes to the capital loss carryforward rules. The changes are effective for taxable years beginning after the date of enactment. Under the Act, funds are permitted to carry forward capital losses for an unlimited period. Additionally, capital loss carryforwards retain their character as either short-term or long-term capital losses rather than being considered all short-term as permitted under prior regulation.
The Fund had no capital loss carryforward for U.S. federal income tax purposes as of October 31, 2014.
During the year ended October 31, 2014, the Fund utilized $12,172 of prior year capital loss carryforwards.
Accounting for Uncertainty in Income Taxes – The Fund has adopted financial reporting rules that require the Fund to analyze all open tax years, as defined by the statute of limitations, for all major jurisdictions. Generally, tax authorities can examine all tax returns filed for the last three years. The Fund does not have an examination in progress.
The Fund has reviewed all open tax years and major jurisdictions and concluded that these financial reporting rules had no effect on the Fund’s financial position or results of operations. There is no tax liability resulting from unrecognized tax benefits relating to uncertain income tax positions taken or expected to be taken on the tax return for the fiscal year ended October 31, 2014. The Fund is also not aware of any tax positions for which it is reasonably possible that the total amounts of unrecognized tax benefits will significantly change in the next twelve months.
Expenses:
Investment Management Agreement – Hartford Funds Management Company, LLC ("HFMC") serves as the Fund’s investment manager pursuant to an Investment Management Agreement with the Company. HFMC is an indirect wholly owned subsidiary of The
| 18 |
| The Hartford Healthcare Fund |
| Notes to Financial Statements – (continued) |
| October 31, 2014 |
| (000’s Omitted) |
Hartford Financial Services Group, Inc. ("The Hartford"). The investment manager has overall investment supervisory responsibility for the Fund. In addition, the investment manager provides administrative personnel, services, equipment, facilities and office space for proper operation of the Fund. HFMC has contracted with Wellington Management Company, LLP ("Wellington Management") under a sub-advisory agreement for the provision of day-to-day investment management services to the Fund in accordance with the Fund’s investment objective and policies. The Fund pays a fee to the investment manager, a portion of which may be used to compensate Wellington Management.
The schedule below reflects the rates of compensation paid to the investment manager for investment management services rendered as of October 31, 2014; the rates are accrued daily and paid monthly:
| Average Daily Net Assets | Annual Fee |
| On first $500 million | 0.9000% |
| On next $500 million | 0.8500% |
| On next $4 billion | 0.8000% |
| On next $5 billion | 0.7975% |
| Over $10 billion | 0.7950% |
Accounting Services Agreement – Pursuant to the Fund Accounting Agreement between HFMC and the Company, on behalf of the Fund, HFMC provides accounting services to the Fund and receives monthly compensation based on the Fund’s average daily net assets at the rates set forth below. The Fund’s accounting services fees are accrued daily and paid monthly.
| Average Daily Net Assets | Annual Fee |
| On first $5 billion | 0.014% |
| On next $5 billion | 0.012% |
| Over $10 billion | 0.010% |
Operating Expenses – Allocable expenses incurred by the Company are allocated to each Fund and allocated to classes within the Fund in proportion to the average daily net assets of the Fund and each class, except where allocation of certain expenses is more fairly made directly to the Fund or to specific classes within a Fund. As of October 31, 2014, HFMC contractually limited the total operating expenses of this Fund, exclusive of taxes, interest expense, brokerage commissions, acquired fund fees and expenses and extraordinary expenses, through February 28, 2015 as follows:
| Class A | Class B | Class C | Class I | Class R3 | Class R4 | Class R5 | Class Y |
| 1.60% | 2.35% | 2.35% | 1.35% | 1.65% | 1.35% | 1.05% | 1.00% |
Fees Paid Indirectly – The Fund has entered into agreements with State Street Global Markets, LLC and Russell Implementation Services, Inc. to partially recapture non-discounted trade commissions. Such rebates are used to pay a portion of the Fund’s expenses. In addition, the Fund's custodian bank has agreed to reduce its fees when the Fund maintains cash on deposit in a non-interest-bearing custody account. For the year ended October 31, 2014, these amounts, if any, are included in the Statement of Operations.
| 19 |
| The Hartford Healthcare Fund |
| Notes to Financial Statements – (continued) |
| October 31, 2014 (000’s Omitted) |
The ratio of expenses to average net assets in the accompanying financial highlights excludes the reduction in expenses related to fees paid indirectly. The annualized expense ratio after waivers for the period listed below reflecting the reduction for fees paid indirectly is as follows:
| Year Ended October 31, 2014 | ||||
| Class A | 1.33 | % | ||
| Class B | 2.20 | |||
| Class C | 2.05 | |||
| Class I | 1.04 | |||
| Class R3 | 1.64 | |||
| Class R4 | 1.34 | |||
| Class R5 | 1.05 | |||
| Class Y | 0.93 | |||
Distribution and Service Plan for Class A, B, C, R3 and R4 Shares – Hartford Funds Distributors, LLC ("HFD"), an indirect wholly owned subsidiary of The Hartford, is the principal underwriter and distributor of the Fund. HFD is engaged in distribution activities, which include marketing and distribution of shares through broker/dealers, financing distribution costs and maintaining financial books and records. For the year ended October 31, 2014, HFD received front-end load sales charges of $2,495 and contingent deferred sales charges of $18 from the Fund.
The Fund has adopted a Distribution and Service Plan in accordance with Rule 12b-1 of the 1940 Act to compensate the distributor (HFD) for activities intended to result in the sale and distribution of Class A, B, C, R3 and R4 shares and for providing services for shareholders. The Rule 12b-1 plan applicable to Class A shares of the Fund provides for payment of a Rule 12b-1 fee of 0.25% of average daily net assets. Some or all of the fee may be used for shareholder servicing expenses with the remainder used for distribution expenses. Under the Class B Plan, the Fund pays the distributor 1.00% of the average daily net assets of Class B shares that are outstanding for 8 years or less, 0.25% of which is a fee for services provided to existing shareholders with the remainder used for distribution expenses. Some or the entire Rule 12b-1 fee for Class B shares may be remitted to broker/dealers for distribution and/or shareholder account services. After eight years, Class B shares convert to Class A shares. Upon conversion to Class A shares, the Class A plan described above will apply to those shares. Under the Class C Plan, the Fund pays the distributor 1.00% of the average daily net assets of Class C shares outstanding, 0.25% of which is intended as a fee for services provided to existing shareholders with the remainder used for distribution expenses. For Class C shares, some or the entire fee may be remitted to broker/dealers for distribution and/or shareholder account services. Class R3 shares have a distribution fee of 0.50% of average daily net assets and Class R4 shares have a distribution fee of 0.25% of average daily net assets. For Class R3 and R4 shares, some or the entire fee may be remitted to broker/dealers for distribution and/or shareholder account services. The Fund’s 12b-1 fees are accrued daily and paid monthly or at such other intervals as the Board of Directors may determine.
Other Related Party Transactions – Certain officers of the Fund are directors and/or officers of HFMC and/or The Hartford or its subsidiaries. For the year ended October 31, 2014, a portion of the Fund’s Chief Compliance Officer’s compensation was paid by all of the investment companies in the Hartford fund complex. The portion allocated to the Fund, as represented in other expenses on the Statement of Operations, was in the amount of $1. Hartford Administrative Services Company (“HASCO”), an indirect wholly-owned subsidiary of The Hartford, provides transfer agent services to the Fund. HASCO has contractually agreed to reimburse any portion of the transfer agency fees over 0.30% of average daily net assets per fiscal year for each class. Any transfer agency fee reimbursement is determined before considering the contractual operating expense limitation. For providing such services, HASCO is compensated on a per account basis that varies by account type, except with respect to Class Y, for which it is compensated based on average daily net assets. The amount paid to HASCO and any related contractual reimbursement amounts, if applicable, can be found in the Statement of Operations. These fees are accrued daily and paid monthly.
Administrative services fees are paid to HASCO for third-party recordkeeping services that are payable as a percentage of net assets in the amount of up to 0.20%, 0.15% and 0.10% for Classes R3, R4 and R5 shares, respectively. The total administrative services fees are shown on the Statement of Operations. These fees are accrued daily and paid monthly.
| 20 |
| The Hartford Healthcare Fund |
| Notes to Financial Statements – (continued) |
| October 31, 2014 |
| (000’s Omitted) |
Investment Transactions:
For the year ended October 31, 2014, the cost of purchases and proceeds from sales of investment securities (excluding short-term investments) were as follows:
| Excluding U.S. Government Obligations | U.S. Government Obligations | Total | ||||||||||
| Cost of Purchases | $ | 330,884 | $ | — | $ | 330,884 | ||||||
| Sales Proceeds | 228,290 | — | 228,290 | |||||||||
Capital Share Transactions:
The following information is for the year ended October 31, 2014, and the year ended October 31, 2013:
For the Year Ended October 31, 2014 | For the Year Ended October 31, 2013 | |||||||||||||||||||||||||||||||
Shares Sold | Shares
Issued | Shares | Net
Increase (Decrease) of Shares | Shares Sold | Shares
Issued | Shares | Net Increase (Decrease)
of | |||||||||||||||||||||||||
| Class A | ||||||||||||||||||||||||||||||||
| Shares | 4,289 | — | (2,729 | ) | 1,560 | 3,668 | — | (2,623 | ) | 1,045 | ||||||||||||||||||||||
| Amount | $ | 139,654 | $ | — | $ | (87,392 | ) | $ | 52,262 | $ | 90,251 | $ | — | $ | (61,724 | ) | $ | 28,527 | ||||||||||||||
| Class B | ||||||||||||||||||||||||||||||||
| Shares | 13 | — | (253 | ) | (240 | ) | 27 | — | (215 | ) | (188 | ) | ||||||||||||||||||||
| Amount | $ | 398 | $ | — | $ | (7,314 | ) | $ | (6,916 | ) | $ | 562 | $ | — | $ | (4,543 | ) | $ | (3,981 | ) | ||||||||||||
| Class C | ||||||||||||||||||||||||||||||||
| Shares | 1,432 | — | (646 | ) | 786 | 1,164 | — | (584 | ) | 580 | ||||||||||||||||||||||
| Amount | $ | 41,553 | $ | — | $ | (18,640 | ) | $ | 22,913 | $ | 25,634 | $ | — | $ | (12,302 | ) | $ | 13,332 | ||||||||||||||
| Class I | ||||||||||||||||||||||||||||||||
| Shares | 1,780 | — | (874 | ) | 906 | 1,338 | — | (450 | ) | 888 | ||||||||||||||||||||||
| Amount | $ | 59,336 | $ | — | $ | (29,299 | ) | $ | 30,037 | $ | 33,867 | $ | — | $ | (11,111 | ) | $ | 22,756 | ||||||||||||||
| Class R3 | ||||||||||||||||||||||||||||||||
| Shares | 534 | — | (319 | ) | 215 | 492 | — | (233 | ) | 259 | ||||||||||||||||||||||
| Amount | $ | 17,904 | $ | — | $ | (10,685 | ) | $ | 7,219 | $ | 12,434 | $ | — | $ | (5,763 | ) | $ | 6,671 | ||||||||||||||
| Class R4 | ||||||||||||||||||||||||||||||||
| Shares | 350 | — | (188 | ) | 162 | 292 | — | (273 | ) | 19 | ||||||||||||||||||||||
| Amount | $ | 11,951 | $ | — | $ | (6,313 | ) | $ | 5,638 | $ | 7,558 | $ | — | $ | (6,538 | ) | $ | 1,020 | ||||||||||||||
| Class R5 | ||||||||||||||||||||||||||||||||
| Shares | 56 | — | (39 | ) | 17 | 39 | — | (112 | ) | (73 | ) | |||||||||||||||||||||
| Amount | $ | 1,951 | $ | — | $ | (1,337 | ) | $ | 614 | $ | 1,002 | $ | — | $ | (2,731 | ) | $ | (1,729 | ) | |||||||||||||
| Class Y | ||||||||||||||||||||||||||||||||
| Shares | 95 | — | (75 | ) | 20 | 24 | — | (41 | ) | (17 | ) | |||||||||||||||||||||
| Amount | $ | 3,295 | $ | — | $ | (2,624 | ) | $ | 671 | $ | 613 | $ | — | $ | (1,070 | ) | $ | (457 | ) | |||||||||||||
| Total | ||||||||||||||||||||||||||||||||
| Shares | 8,549 | — | (5,123 | ) | 3,426 | 7,044 | — | (4,531 | ) | 2,513 | ||||||||||||||||||||||
| Amount | $ | 276,042 | $ | — | $ | (163,604 | ) | $ | 112,438 | $ | 171,921 | $ | — | $ | (105,782 | ) | $ | 66,139 | ||||||||||||||
The following reflects the conversion of Class B shares into Class A shares (reflected as Class A shares sold) for the year ended October 31, 2014, and the year ended October 31, 2013:
| Shares | Dollars | |||||||
| For the Year Ended October 31, 2014 | 43 | $ | 1,399 | |||||
| For the Year Ended October 31, 2013 | 42 | $ | 987 | |||||
Line of Credit:
The Fund is one of several Hartford Funds that participate in a $500 million committed revolving line of credit facility. The facility is to be used for temporary or emergency purposes. Under the arrangement, the funds are required to own securities having a market value in
| 21 |
| The Hartford Healthcare Fund |
| Notes to Financial Statements – (continued) |
| October 31, 2014 |
| (000’s Omitted) |
excess of 300% of the total bank borrowings. The interest rate on borrowings varies depending on the nature of the loan. The facility also requires a fee to be paid based on the amount of the commitment. This commitment fee is allocated to all the funds participating in the line of credit based on the average net assets of the funds. During the year ended October 31, 2014, the Fund did not have any borrowings under this facility.
Pending Legal Proceedings:
On February 25, 2011, Jennifer L. Kasilag, Louis Mellinger, Judith M. Menendez, Jacqueline M. Robinson, and Linda A. Russell filed a derivative lawsuit against Hartford Investment Financial Services, LLC (“HIFSCO”) (now known as HFD) on behalf of six Hartford retail mutual funds in the United States District Court for the District of New Jersey, alleging that HIFSCO received excessive advisory and distribution fees in violation of its statutory fiduciary duty under Section 36(b) of the 1940 Act when serving as investment manager and principal underwriter, respectively, to the Hartford retail mutual funds. Although this action was purportedly filed on behalf of certain of the Hartford Funds, none of the Hartford Funds is itself a defendant to the suit. HIFSCO moved to dismiss and, in September 2011, the motion was granted in part and denied in part, with leave to amend the complaint. In November 2011, plaintiffs filed an amended complaint on behalf of certain Hartford retail mutual funds, The Hartford Global Health Fund (now known as The Hartford Healthcare Fund), The Hartford Conservative Allocation Fund, The Hartford Growth Opportunities Fund, The Hartford Inflation Plus Fund, The Hartford Advisers Fund (now known as The Hartford Balanced Fund), and The Hartford Capital Appreciation Fund. Plaintiffs seek to rescind the investment management agreements and distribution plans between HIFSCO and these funds and to recover the total fees charged thereunder or, in the alternative, to recover any improper compensation HIFSCO received, in addition to lost earnings. HIFSCO filed a partial motion to dismiss the amended complaint and, in December 2012, the court dismissed without prejudice the claims regarding distribution fees and denied the motion with respect to the advisory fees claims. HIFSCO disputes the allegations and intends to defend vigorously.
In March 2014, the plaintiffs filed a new complaint that added as new plaintiffs The Hartford Floating Rate Fund and The Hartford Small Company Fund and named as a defendant HFMC, which assumed the role as investment manager to the funds as of January 2013. HFMC and HIFSCO dispute the allegations and intend to defend vigorously.
No accrual for litigation relating to this matter has been recorded in the financial statements of the Fund because the Fund is not party to the suit.
Indemnifications:
Under the Company's organizational documents, the Company shall indemnify its officers and directors to the full extent required or permitted under Maryland General Corporation Law and the federal securities laws. In addition, the Company, on behalf of the Fund, may enter into contracts that contain a variety of indemnifications. The Company's maximum exposure under these arrangements is unknown. However, as of the date of these financial statements, the Company has not had prior claims or losses pursuant to these contracts and expects the risk of loss to be remote.
Subsequent Event:
Effective December 1, 2014, pursuant to a sub-transfer agency agreement between HASCO and Boston Financial Data Services, Inc. (“BFDS”), HASCO has delegated certain transfer agent, dividend disbursing agent and shareholder servicing agent functions to BFDS. The costs and expenses of such delegation are borne by HASCO, not by the Fund.
| 22 |
| The Hartford Healthcare Fund |
Financial Highlights |
- Selected Per-Share Data - (A) | - Ratios and Supplemental Data - | |||||||||||||||||||||||||||||||||||||||||||||||||||
Class | Net Asset | Net | Net | Total from | Dividends | Distribu- | Total | Net Asset | Total | Net Assets | Ratio of | Ratio of | Ratio of | |||||||||||||||||||||||||||||||||||||||
| For the Year Ended October 31, 2014 | ||||||||||||||||||||||||||||||||||||||||||||||||||||
| A | $ | 28.05 | $ | (0.13 | ) | $ | 8.68 | $ | 8.55 | $ | – | $ | – | $ | – | $ | 36.60 | 30.48 | % | $ | 599,010 | 1.33 | % | 1.33 | % | (0.40 | )% | |||||||||||||||||||||||||
| B | 24.88 | (0.36 | ) | 7.66 | 7.30 | – | – | – | 32.18 | 29.34 | 11,303 | 2.20 | 2.20 | (1.27 | ) | |||||||||||||||||||||||||||||||||||||
| C | 25.03 | (0.32 | ) | 7.71 | 7.39 | – | – | – | 32.42 | 29.52 | 176,581 | 2.06 | 2.06 | (1.13 | ) | |||||||||||||||||||||||||||||||||||||
| I | 28.76 | (0.04 | ) | 8.91 | 8.87 | – | – | – | 37.63 | 30.84 | 137,450 | 1.05 | 1.05 | (0.12 | ) | |||||||||||||||||||||||||||||||||||||
| R3 | 28.89 | (0.24 | ) | 8.93 | 8.69 | – | – | – | 37.58 | 30.08 | 40,482 | 1.64 | 1.64 | (0.71 | ) | |||||||||||||||||||||||||||||||||||||
| R4 | 29.62 | (0.14 | ) | 9.16 | 9.02 | – | – | – | 38.64 | 30.45 | 29,530 | 1.34 | 1.34 | (0.41 | ) | |||||||||||||||||||||||||||||||||||||
| R5 | 30.27 | (0.04 | ) | 9.37 | 9.33 | – | – | – | 39.60 | 30.82 | 2,323 | 1.05 | 1.05 | (0.12 | ) | |||||||||||||||||||||||||||||||||||||
| Y | 30.42 | – | 9.43 | 9.43 | – | – | – | 39.85 | 31.00 | 6,081 | 0.94 | 0.94 | – | |||||||||||||||||||||||||||||||||||||||
| For the Year Ended October 31, 2013 | ||||||||||||||||||||||||||||||||||||||||||||||||||||
| A | $ | 20.11 | $ | (0.06 | ) | $ | 8.00 | $ | 7.94 | $ | – | $ | – | $ | – | $ | 28.05 | 39.48 | % | $ | 415,323 | 1.40 | % | 1.40 | % | (0.24 | )% | |||||||||||||||||||||||||
| B | 17.99 | (0.23 | ) | 7.12 | 6.89 | – | – | – | 24.88 | 38.30 | 14,697 | 2.29 | 2.26 | (1.08 | ) | |||||||||||||||||||||||||||||||||||||
| C | 18.07 | (0.21 | ) | 7.17 | 6.96 | – | – | – | 25.03 | 38.52 | 116,641 | 2.11 | 2.11 | (0.95 | ) | |||||||||||||||||||||||||||||||||||||
| I | 20.55 | 0.01 | 8.20 | 8.21 | – | – | – | 28.76 | 39.95 | 79,005 | 1.08 | 1.08 | 0.06 | |||||||||||||||||||||||||||||||||||||||
| R3 | 20.77 | (0.13 | ) | 8.25 | 8.12 | – | – | – | 28.89 | 39.09 | 24,914 | 1.66 | 1.65 | (0.51 | ) | |||||||||||||||||||||||||||||||||||||
| R4 | 21.22 | (0.05 | ) | 8.45 | 8.40 | – | – | – | 29.62 | 39.59 | 17,817 | 1.36 | 1.35 | (0.20 | ) | |||||||||||||||||||||||||||||||||||||
| R5 | 21.62 | 0.05 | 8.60 | 8.65 | – | – | – | 30.27 | 40.01 | 1,267 | 1.08 | 1.05 | 0.19 | |||||||||||||||||||||||||||||||||||||||
| Y | 21.71 | 0.05 | 8.66 | 8.71 | – | – | – | 30.42 | 40.12 | 4,056 | 0.96 | 0.96 | 0.20 | |||||||||||||||||||||||||||||||||||||||
| For the Year Ended October 31, 2012 (D) | ||||||||||||||||||||||||||||||||||||||||||||||||||||
| A | $ | 16.80 | $ | – | $ | 3.31 | $ | 3.31 | $ | – | $ | – | $ | – | $ | 20.11 | 19.70 | % | $ | 276,741 | 1.47 | % | 1.47 | % | – | % | ||||||||||||||||||||||||||
| B | 15.15 | (0.17 | ) | 3.01 | 2.84 | – | – | – | 17.99 | 18.75 | 14,015 | 2.38 | 2.28 | (0.84 | ) | |||||||||||||||||||||||||||||||||||||
| C | 15.20 | (0.12 | ) | 2.99 | 2.87 | – | – | – | 18.07 | 18.88 | 73,728 | 2.17 | 2.17 | (0.71 | ) | |||||||||||||||||||||||||||||||||||||
| I | 17.10 | 0.07 | 3.38 | 3.45 | – | – | – | 20.55 | 20.18 | 38,199 | 1.11 | 1.11 | 0.35 | |||||||||||||||||||||||||||||||||||||||
| R3 | 17.38 | (0.02 | ) | 3.41 | 3.39 | – | – | – | 20.77 | 19.51 | 12,521 | 1.69 | 1.65 | (0.15 | ) | |||||||||||||||||||||||||||||||||||||
| R4 | 17.70 | 0.02 | 3.50 | 3.52 | – | – | – | 21.22 | 19.89 | 12,363 | 1.38 | 1.35 | 0.11 | |||||||||||||||||||||||||||||||||||||||
| R5 | 17.98 | 0.08 | 3.56 | 3.64 | – | – | – | 21.62 | 20.24 | 2,489 | 1.09 | 1.05 | 0.43 | |||||||||||||||||||||||||||||||||||||||
| Y | 18.05 | 0.10 | 3.56 | 3.66 | – | – | – | 21.71 | 20.28 | 3,252 | 0.98 | 0.98 | 0.48 | |||||||||||||||||||||||||||||||||||||||
| For the Year Ended October 31, 2011 | ||||||||||||||||||||||||||||||||||||||||||||||||||||
| A | $ | 15.21 | $ | (0.04 | ) | $ | 1.63 | $ | 1.59 | $ | – | $ | – | $ | – | $ | 16.80 | 10.45 | % | $ | 224,294 | 1.49 | % | 1.49 | % | (0.24 | )% | |||||||||||||||||||||||||
| B | 13.83 | (0.16 | ) | 1.48 | 1.32 | – | – | – | 15.15 | 9.54 | 17,208 | 2.38 | 2.28 | (1.04 | ) | |||||||||||||||||||||||||||||||||||||
| C | 13.86 | (0.14 | ) | 1.48 | 1.34 | – | – | – | 15.20 | 9.67 | 65,692 | 2.18 | 2.18 | (0.93 | ) | |||||||||||||||||||||||||||||||||||||
| I | 15.44 | 0.02 | 1.64 | 1.66 | – | – | – | 17.10 | 10.75 | 32,213 | 1.18 | 1.18 | 0.09 | |||||||||||||||||||||||||||||||||||||||
| R3 | 15.76 | (0.07 | ) | 1.69 | 1.62 | – | – | – | 17.38 | 10.28 | 5,905 | 1.71 | 1.65 | (0.39 | ) | |||||||||||||||||||||||||||||||||||||
| R4 | 16.01 | (0.02 | ) | 1.71 | 1.69 | – | – | – | 17.70 | 10.56 | 9,241 | 1.39 | 1.35 | (0.09 | ) | |||||||||||||||||||||||||||||||||||||
| R5 | 16.21 | 0.04 | 1.73 | 1.77 | – | – | – | 17.98 | 10.92 | 1,403 | 1.09 | 1.05 | 0.21 | |||||||||||||||||||||||||||||||||||||||
| Y | 16.26 | 0.05 | 1.74 | 1.79 | – | – | – | 18.05 | 11.01 | 2,555 | 0.99 | 0.99 | 0.27 | |||||||||||||||||||||||||||||||||||||||
See Portfolio Turnover information on the next page.
| 23 |
| The Hartford Healthcare Fund |
| Financial Highlights – (continued) |
- Selected Per-Share Data - (A) | - Ratios and Supplemental Data - | |||||||||||||||||||||||||||||||||||||||||||||||||||
Class | Net Asset | Net | Net | Total from | Dividends | Distribu- | Total | Net Asset | Total | Net Assets | Ratio of | Ratio of | Ratio of | |||||||||||||||||||||||||||||||||||||||
| For the Year Ended October 31, 2010 (D) | ||||||||||||||||||||||||||||||||||||||||||||||||||||
| A | $ | 13.07 | $ | – | $ | 2.14 | $ | 2.14 | $ | – | $ | – | $ | – | $ | 15.21 | 16.37 | % | $ | 236,781 | 1.49 | % | 1.49 | % | (0.03 | )% | ||||||||||||||||||||||||||
| B | 11.98 | (0.14 | ) | 1.99 | 1.85 | – | – | – | 13.83 | 15.44 | 23,023 | 2.39 | 2.28 | (0.84 | ) | |||||||||||||||||||||||||||||||||||||
| C | 11.99 | (0.11 | ) | 1.98 | 1.87 | – | – | – | 13.86 | 15.60 | 71,124 | 2.18 | 2.18 | (0.72 | ) | |||||||||||||||||||||||||||||||||||||
| I | 13.23 | 0.04 | 2.17 | 2.21 | – | – | – | 15.44 | 16.70 | 14,176 | 1.22 | 1.22 | 0.24 | |||||||||||||||||||||||||||||||||||||||
| R3 | 13.57 | (0.02 | ) | 2.21 | 2.19 | – | – | – | 15.76 | 16.14 | 3,549 | 1.70 | 1.70 | (0.17 | ) | |||||||||||||||||||||||||||||||||||||
| R4 | 13.74 | 0.02 | 2.25 | 2.27 | – | – | – | 16.01 | 16.52 | 7,939 | 1.37 | 1.37 | 0.11 | |||||||||||||||||||||||||||||||||||||||
| R5 | 13.87 | 0.06 | 2.28 | 2.34 | – | – | – | 16.21 | 16.87 | 1,895 | 1.08 | 1.08 | 0.38 | |||||||||||||||||||||||||||||||||||||||
| Y | 13.90 | 0.08 | 2.28 | 2.36 | – | – | – | 16.26 | 16.98 | 2,294 | 0.97 | 0.97 | 0.50 | |||||||||||||||||||||||||||||||||||||||
| (A) | Information presented relates to a share outstanding throughout the indicated period. Net investment income (loss) per share amounts are calculated based on average shares outstanding unless otherwise noted. |
| (B) | Assumes initial investment at net asset value at the beginning of each period, reinvestment of all distributions, the complete redemption of the investment at net asset value at the end of each period and no sales charge. Total return would be reduced if sales charges were taken into account. |
| (C) | Adjustments include waivers and reimbursements, if applicable. Ratios do not include fees paid indirectly (see Expenses in the accompanying Notes to Financial Statements). |
| (D) | Net investment income (loss) per share amounts have been calculated using the SEC method. |
| Portfolio Turnover Rate for All Share Classes | ||||
| For the Year Ended October 31, 2014 | 28 | % | ||
| For the Year Ended October 31, 2013 | 32 | |||
| For the Year Ended October 31, 2012 | 46 | |||
| For the Year Ended October 31, 2011 | 44 | |||
| For the Year Ended October 31, 2010 | 36 | |||
| 24 |
| Report of Independent Registered Public Accounting Firm |
| The Board of Directors and Shareholders of |
| The Hartford Mutual Funds, Inc. |
We have audited the accompanying statement of assets and liabilities, including the schedule of investments, of The Hartford Healthcare Fund (one of the portfolios constituting The Hartford Mutual Funds, Inc. (the Funds)) as of October 31, 2014, and the related statement of operations for the year then ended, the statements of changes in net assets for each of the two years in the period then ended, and the financial highlights for each of the five years in the period then ended. These financial statements and financial highlights are the responsibility of the Funds’ management. Our responsibility is to express an opinion on these financial statements and financial highlights based on our audits.
We conducted our audits in accordance with the standards of the Public Company Accounting Oversight Board (United States). Those standards require that we plan and perform the audit to obtain reasonable assurance about whether the financial statements and financial highlights are free of material misstatement. We were not engaged to perform an audit of the Funds’ internal control over financial reporting. Our audits included consideration of internal control over financial reporting as a basis for designing audit procedures that are appropriate in the circumstances, but not for the purpose of expressing an opinion on the effectiveness of the Funds’ internal control over financial reporting. Accordingly, we express no such opinion. An audit also includes examining, on a test basis, evidence supporting the amounts and disclosures in the financial statements and financial highlights, assessing the accounting principles used and significant estimates made by management, and evaluating the overall financial statement presentation. Our procedures included confirmation of securities owned as of October 31, 2014, by correspondence with the custodian and brokers or by other appropriate auditing procedures where replies from brokers were not received. We believe that our audits provide a reasonable basis for our opinion.
In our opinion, the financial statements and financial highlights referred to above present fairly, in all material respects, the financial position of The Hartford Healthcare Fund of The Hartford Mutual Funds, Inc. at October 31, 2014, the results of its operations for the year then ended, the changes in its net assets for each of the two years in the period then ended, and the financial highlights for each of the five years in the period then ended, in conformity with U.S. generally accepted accounting principles.
|
Minneapolis, Minnesota
December 18, 2014
| 25 |
| The Hartford Healthcare Fund |
| Directors and Officers (Unaudited) |
The Board of Directors of the Company (the "Directors") appoints officers who are responsible for the day-to-day operations of the Fund and who execute policies formulated by the Directors. Each Director serves until his or her death, resignation, or retirement or until the next annual meeting of shareholders is held or until his or her successor is elected and qualifies.
Directors and officers who are employed by or who have a financial interest in The Hartford Financial Services Group, Inc. ("The Hartford") are considered “interested” persons of the Fund pursuant to the 1940 Act. Each officer and two of the Company's Directors, as noted in the chart below, are “interested” persons of the Fund. Each Director serves as a director for The Hartford Mutual Funds, Inc., The Hartford Mutual Funds II, Inc., Hartford Series Fund, Inc., and Hartford HLS Series Fund II, Inc., and as a trustee for The Hartford Alternative Strategies Fund, which, as of October 31, 2014, collectively consist of 66 funds. Correspondence may be sent to Directors and officers c/o Hartford Funds, 5 Radnor Corporate Center, Suite 300, 100 Matsonford Road, Radnor, Pennsylvania 19087, except that correspondence to Mr. Annoni, Mr. Dressen and Ms. Quade may be sent to 500 Bielenberg Drive, Suite 500, Woodbury, Minnesota 55125.
The table below sets forth, for each Director and officer, his or her name, year of birth, current position with the Company and date first elected or appointed to The Hartford Mutual Funds, Inc. ("MF") and The Hartford Mutual Funds II, Inc. ("MF2"), principal occupation, and, for Directors, other directorships held. The Fund’s Statement of Additional Information contains further information on the Directors and is available free of charge by calling 1-888-843-7824 or writing to: Hartford Funds, P.O. Box 55022, Boston, MA 02205-5022.
Information on the aggregate remuneration paid to the directors of the Company can be found in the Statement of Operations herein. The Fund pays to The Hartford a portion of the Chief Compliance Officer’s compensation, but does not pay salaries or compensation to any of its other officers or Directors who are employed by The Hartford.
Non-Interested Directors
Hilary E. Ackermann (1956) Director since September 23, 2014
Ms. Ackermann served as Chief Risk Officer at Goldman Sachs Bank USA from October 2008 to November 2011 and serves as a Director of Dynegy, Inc., an independent power company, from October 2012 to present.
Lynn S. Birdsong (1946) Director since 2003, Chairman of the Investment Committee since 2014
Mr. Birdsong is a private investor. Mr. Birdsong currently serves as a Director of the Sovereign High Yield Investment Company (April 2010 to current). Mr. Birdsong currently serves as an Independent Director of Nomura Partners Funds, Inc. (formerly, The Japan Fund) (April 2003 to current). From 2003 to March 2005, Mr. Birdsong was an Independent Director of the Atlantic Whitehall Funds. From 1979 to 2002, Mr. Birdsong was a Managing Director of Zurich Scudder Investments, an investment management firm. During his employment with Scudder, Mr. Birdsong was an Interested Director of The Japan Fund. From January 1981 through December 2013, Mr. Birdsong was a partner in Birdsong Company, an advertising specialty firm.
Robert M. Gavin, Jr. (1940) Director since 2002 (MF) and 1986 (MF2), Chairman of the Board for each since 2004
Dr. Gavin is an educational consultant. Prior to September 1, 2001, he was President of Cranbrook Education Community and prior to July 1996, he was President of Macalester College, St. Paul, Minnesota.
Duane E. Hill (1945) Director since 2001 (MF) and 2002 (MF2), Chairman of the Nominating Committee since 2003
Mr. Hill is a Partner of TSG Ventures L.P., a private equity investment company. Mr. Hill is a former partner of TSG Capital Group, a private equity investment firm that served as sponsor and lead investor in leveraged buyouts of middle market companies.
Sandra S. Jaffee (1941) Director since 2005
Ms. Jaffee is the founder and Chief Executive Officer of a private company, Homeworks Concierge, LLC, which provides residential property management services in Westchester County, New York (January 2012 to present). Ms. Jaffee served as Chairman (2008 to 2009) and Chief Executive Officer of Fortent (formerly Searchspace Group), a leading provider of compliance/regulatory technology to financial institutions from August 2005 to August 2009. From August 2004 to August 2005, Ms. Jaffee served as an Entrepreneur in Residence with Warburg Pincus, a private equity firm. Prior to joining Warburg Pincus, Ms. Jaffee served as Executive Vice President at Citigroup, from September 1995 to July 2004, where she was President and Chief Executive Officer of Citibank’s Global Securities Services (1995 to 2003). Ms. Jaffee currently serves as a member of the Board of Directors of Broadridge Financial Solutions as well as a Trustee of Muhlenberg College.
| 26 |
| The Hartford Healthcare Fund |
| Directors and Officers (Unaudited) – (continued) |
William P. Johnston (1944) Director since 2005, Chairman of the Compliance Committee since 2005
In June 2006, Mr. Johnston was appointed as Senior Advisor to The Carlyle Group, a global private equity and other alternative asset investment firm and currently serves as an Operating Executive. In July 2006, Mr. Johnston was elected to the Board of Directors of MultiPlan, Inc. and served as a Director (July 2006 to August 2010). In August 2007, Mr. Johnston was elected to the Board of Directors of LifeCare Holdings, Inc. and served as a Director (August 2007 to June 2013). In February 2008, Mr. Johnston was elected to the Board of Directors of HCR-ManorCare, Inc. In May 2006, Mr. Johnston was elected to the Supervisory Board of Fresenius Medical Care AG & Co. KGaA, after its acquisition of Renal Care Group, Inc. in March 2006. Mr. Johnston joined Renal Care Group in November 2002 as a member of the Board of Directors and served as Chairman of the Board from March 2003 through March 2006. From 2002 through 2013, Mr. Johnston served as a Board member of the Georgia O’Keefe Museum. From September 1987 to December 2002, Mr. Johnston was with Equitable Securities Corporation (and its successors, SunTrust Equitable Securities and SunTrust Robinson Humphrey) serving in various investment banking and managerial positions, including Managing Director and Head of Investment Banking, Chief Executive Officer and Vice Chairman.
Phillip O. Peterson (1944) Director since 2002 (MF) and 2000 (MF2), Chairman of the Audit Committee since 2002
Mr. Peterson is a mutual fund industry consultant. He was a partner of KPMG LLP (an accounting firm) until July 1999. Mr. Peterson joined William Blair Funds in February 2007 as a member of the Board of Trustees. From February 2012 to February 2014, Mr. Peterson served as a Trustee of Symetra Variable Mutual Funds. From January 2004 to April 2005, Mr. Peterson served as Independent President of the Strong Mutual Funds.
Lemma W. Senbet (1946) Director since 2005
Dr. Senbet is the William E. Mayer Chair Professor of Finance and Founding Director, Center for Financial Policy, at the University of Maryland, Robert H. Smith School of Business. He was chair of the Finance Department of the University of Maryland, Robert H. Smith School of Business from 1998 to 2006. Since June 2013, he has been on leave from the University to serve as Executive Director of African Economic Research Consortium which focuses on economic policy research and training. Previously, he was a chaired professor of finance at the University of Wisconsin-Madison. Also, he was a Director of the Fortis Funds from March 2000 to July 2002. Dr. Senbet served as Director of the American Finance Association and President of the Western Finance Association. In 2006, Dr. Senbet was inducted Fellow of Financial Management Association International for his career-long distinguished scholarship and professional service.
Interested Directors and Officers
James E. Davey (1964) Director since 2012, President and Chief Executive Officer since 2010
Mr. Davey serves as Executive Vice President of Hartford Life Insurance Company (“HLIC”) and The Hartford. Additionally, Mr. Davey serves as Chairman of the Board, Manager and Senior Managing Director of Hartford Funds Distributors, LLC (“HFD”). He also currently serves as Director, Chairman of the Board, President and Senior Managing Director of Hartford Administrative Services Company (“HASCO”). Mr. Davey also serves as Manager, Chairman of the Board and Senior Managing Director for Hartford Funds Management Company, LLC (“HFMC”) and Director, Chairman of the Board and Senior Managing Director for Hartford Funds Management Group, Inc. ("HFMG"). Mr. Davey has served in various positions within The Hartford and its subsidiaries in connection with the operation of the Hartford Funds. Mr. Davey joined The Hartford in 2002.
Lowndes A. Smith* (1939) Director since 1996 (MF) and 2002 (MF2)
Mr. Smith served as Vice Chairman of The Hartford from February 1997 to January 2002, as President and Chief Executive Officer of Hartford Life, Inc. from February 1997 to January 2002, and as President and Chief Operating Officer of The Hartford Life Insurance Companies from January 1989 to January 2002. Mr. Smith serves as a Director of White Mountains Insurance Group Ltd. (October 2003 to current); One Beacon Insurance (October 2006 to current); Symetra Financial (August 2007 to current) and is a Managing Director of Whittington Gray Associates (January 2007 to current).
* Mr. Smith resigned as a Director of MF, MF2, Hartford Series Fund, Inc. and Hartford HLS Series Fund II, Inc. and as a Trustee of The Hartford Alternative Strategies Fund effective September 17, 2014.
Other Officers
Mark A. Annoni (1964) Vice President, Controller and Treasurer since 2012
Mr. Annoni currently serves as the Assistant Vice President of HLIC (February 2004 to present) and Senior Vice President of HFMG (December 2013 to present). Mr. Annoni has served in various positions within The Hartford and its subsidiaries in connection with the operation of the Hartford Funds. Mr. Annoni joined The Hartford in 2001.
| 27 |
| The Hartford Healthcare Fund |
| Directors and Officers (Unaudited) – (continued) |
Michael R. Dressen (1963) AML Compliance Officer since 2011
Mr. Dressen currently serves as Assistant Vice President of HLIC. He also serves as Chief Compliance Officer and AML Compliance Officer of HASCO and as AML Officer of HFD. Mr. Dressen has served in various positions within The Hartford and its subsidiaries in connection with the operation of the Hartford Funds.
Edward P. Macdonald (1967) Vice President, Secretary and Chief Legal Officer since 2005
Mr. Macdonald currently serves as Assistant Secretary, Executive Vice President and Deputy General Counsel of HFD, HASCO, HFMC and HFMG. He also serves as Vice President of HLIC. Mr. Macdonald has served in various positions within The Hartford and its subsidiaries in connection with the operation of the Hartford Funds. Mr. Macdonald joined The Hartford in 2005.
Joseph G. Melcher (1973) Vice President and Chief Compliance Officer since 2013
Mr. Melcher currently serves as Executive Vice President of HFD, HFMG and HASCO. Mr. Melcher also currently serves as Executive Vice President and Chief Compliance Officer of HFMC. Mr. Melcher has served in various positions within The Hartford and its subsidiaries in connection with the operation of the Hartford Funds since joining The Hartford in 2012. Prior to joining The Hartford, Mr. Melcher worked at Touchstone Investments, a member of the Western & Southern Financial Group, where he held the position of Vice President and Chief Compliance Officer from 2010 through 2012 and Assistant Vice President, Compliance from 2005 to 2010.
Vernon J. Meyer (1964) Vice President since 2006
Mr. Meyer currently serves as Senior Vice President of HLIC. He also currently serves as Managing Director and Chief Investment Officer of HFMC and Managing Director of HFMG. Mr. Meyer has served in various positions within The Hartford and its subsidiaries in connection with the operation of the Hartford Funds. Mr. Meyer joined The Hartford in 2004.
Laura S. Quade (1969) Vice President since 2012
Ms. Quade currently serves as Vice President of HASCO, HFD and HFMG. She is the Head of Operations of HASCO and formerly served as Director, Enterprise Operations of HLIC. Ms. Quade has served in various positions within The Hartford and its subsidiaries in connection with the operation of the Hartford Funds. Ms. Quade joined The Hartford in 2001.
Martin A. Swanson** (1962) Vice President since 2010
Mr. Swanson currently serves as Vice President of HLIC. Mr. Swanson also serves as Managing Director, Chief Marketing Officer and Principal of HFD and Managing Director of HFMG. Mr. Swanson has served in various positions within The Hartford and its subsidiaries in connection with the operation of the Hartford Funds.
** Mr. Swanson resigned as an officer effective November 6, 2014.
HOW TO OBTAIN A COPY OF THE FUND’S PROXY VOTING POLICIES AND VOTING RECORDS (UNAUDITED)
A description of the policies and procedures that the Fund uses to determine how to vote proxies relating to portfolio securities and information about how the Fund voted proxies relating to portfolio securities during the most recent twelve-month period ended June 30 are available (1) without charge, upon request, by calling 888-843-7824 and (2) on the SEC’s website at http://www.sec.gov.
QUARTERLY PORTFOLIO HOLDINGS INFORMATION (UNAUDITED)
The Fund files a complete schedule of portfolio holdings with the SEC for the first and third quarters of each fiscal year on Form N-Q. The Fund’s Forms N-Q are available (1) without charge, upon request, by calling 888-843-7824 and (2) on the SEC’s website at http://www.sec.gov. The Form N-Q may be reviewed and copied at the SEC’s Public Reference Room in Washington, DC. Information on the operation of the Public Reference Room may be obtained by calling 1-800-SEC-0330.
| 28 |
| The Hartford Healthcare Fund |
| Federal Tax Information (Unaudited) |
For the fiscal year ended October 31, 2014, there is no further federal tax information required for this Fund.
| 29 |
| The Hartford Healthcare Fund |
| Expense Example (Unaudited) |
Your Fund's Expenses
As a shareholder of the Fund, you incur two types of costs: (1) transaction costs, including sales charges (loads) on purchase payments, if any, and contingent deferred sales charges (CDSC), if any, and (2) ongoing costs, including investment management fees, distribution and/or service (12b-1) fees, if any, and other fund expenses. This example is intended to help you understand your ongoing costs (in dollars) of investing in the Fund and to compare these costs with the ongoing costs of investing in other mutual funds. The example is based on an investment of $1,000 invested at the beginning of the period and held for the entire period of April 30, 2014 through October 31, 2014.
Actual Expenses
The first set of columns of the table below provides information about actual account values and actual expenses. You may use the information in this column, together with the amount you invested, to estimate the expenses that you paid over the period. Simply divide your account value by $1,000 (for example, an $8,600 account value divided by $1,000 = 8.6), then multiply the result by the number in the line under the heading entitled “Expenses Paid During Period” to estimate the expenses you paid on your account during this period.
Hypothetical Example for Comparison Purposes
The second set of columns of the table below provides information about hypothetical account values and hypothetical expenses based on the Fund's actual expense ratio and an assumed rate of return of 5% per year before expenses, which is not the Fund's actual return. The hypothetical account values and expenses may not be used to estimate the actual ending account balance or expenses you paid for the period. You may use this information to compare the ongoing costs of investing in the Fund and other funds. To do so, compare this 5% hypothetical example with the 5% hypothetical examples that appear in the shareholder reports of the other funds.
Please note that the expenses shown in the table are meant to highlight your ongoing costs only and do not reflect any transactional costs, such as sales charges (loads) and CDSC. Therefore, the second set of columns of the table is useful in comparing ongoing costs only, and will not help you determine the relative total costs of owning different funds. In addition, if these transactional costs were included, your costs would be higher. Expenses are equal to the Fund's annualized expense ratios multiplied by average account value over the period, multiplied by 184/365 (to reflect the one-half year period).
| Actual return | Hypothetical (5% return before expenses) | |||||||||||||||||||||||||||||||||||
Beginning | Ending
Account | Expenses paid during the period April 30, 2014 through October 31, 2014 | Beginning | Ending
Account | Expenses
paid | Annualized | Days | Days | ||||||||||||||||||||||||||||
| Class A | $ | 1,000.00 | $ | 1,163.40 | $ | 7.26 | $ | 1,000.00 | $ | 1,018.49 | $ | 6.77 | 1.33 | % | 184 | 365 | ||||||||||||||||||||
| Class B | $ | 1,000.00 | $ | 1,158.40 | $ | 11.88 | $ | 1,000.00 | $ | 1,014.19 | $ | 11.09 | 2.18 | 184 | 365 | |||||||||||||||||||||
| Class C | $ | 1,000.00 | $ | 1,159.10 | $ | 11.22 | $ | 1,000.00 | $ | 1,014.81 | $ | 10.47 | 2.06 | 184 | 365 | |||||||||||||||||||||
| Class I | $ | 1,000.00 | $ | 1,165.00 | $ | 5.76 | $ | 1,000.00 | $ | 1,019.89 | $ | 5.37 | 1.06 | 184 | 365 | |||||||||||||||||||||
| Class R3 | $ | 1,000.00 | $ | 1,161.30 | $ | 8.95 | $ | 1,000.00 | $ | 1,016.92 | $ | 8.35 | 1.64 | 184 | 365 | |||||||||||||||||||||
| Class R4 | $ | 1,000.00 | $ | 1,163.20 | $ | 7.31 | $ | 1,000.00 | $ | 1,018.45 | $ | 6.82 | 1.34 | 184 | 365 | |||||||||||||||||||||
| Class R5 | $ | 1,000.00 | $ | 1,165.00 | $ | 5.73 | $ | 1,000.00 | $ | 1,019.91 | $ | 5.35 | 1.05 | 184 | 365 | |||||||||||||||||||||
| Class Y | $ | 1,000.00 | $ | 1,165.50 | $ | 5.13 | $ | 1,000.00 | $ | 1,020.47 | $ | 4.79 | 0.94 | 184 | 365 | |||||||||||||||||||||
| 30 |
| The Hartford Healthcare Fund |
| Approval of Investment Management and Investment Sub-Advisory Agreements (Unaudited) |
Section 15(c) of the Investment Company Act of 1940, as amended (the “1940 Act”), requires that each mutual fund’s board of directors, including a majority of those directors who are not “interested persons” of the mutual fund, as defined in the 1940 Act (the “Independent Directors”), annually review and consider the continuation of the mutual fund’s investment advisory and sub-advisory agreements. At its meeting held on August 5-6, 2014, the Board of Directors (the “Board”) of The Hartford Mutual Funds, Inc., including each of the Independent Directors, unanimously voted to approve the continuation of the investment management agreement for The Hartford Healthcare Fund (the “Fund”) with Hartford Funds Management Company, LLC (“HFMC”) and the continuation of the investment sub-advisory agreement between HFMC and the Fund’s sub-adviser, Wellington Management Company, LLP (the “Sub-adviser,” and together with HFMC, the “Advisers”) (collectively, the “Agreements”).
In the months preceding the August 5-6, 2014 meeting, the Board requested, received and reviewed written responses from the Advisers to questions posed to them on behalf of the Independent Directors and supporting materials relating to those questions and responses. The Board considered information furnished to the Board at its meetings throughout the year, as well as information specifically prepared in connection with the annual approval of the Agreements at the Board’s meetings held on June 17-18, 2014 and August 5-6, 2014. Information provided to the Board at its meetings throughout the year included, among other things, reports on Fund performance, legal and compliance matters, sales and marketing activity, shareholder services, and the other services provided to the Fund by the Advisers and their affiliates. The Board also received in-person presentations by Fund officers and representatives of HFMC at the Board’s meetings on June 17-18, 2014 and August 5-6, 2014 concerning the Agreements.
The Independent Directors, advised by independent legal counsel, engaged service providers to assist them with evaluating the Agreements with respect to the Fund. Lipper Inc. (“Lipper”), an independent provider of investment company data, was retained to provide the Board with reports on how the Fund’s contractual management fees, actual management fees, other non-management fees, overall expense ratios and investment performance compared to those of mutual funds with similar investment objectives. The Independent Directors also engaged an independent financial services consultant (the “Consultant”) to assist them in evaluating the Fund’s management fees, sub-advisory fees, other non-management fees, overall expense ratios and investment performance. In addition, the Consultant reviewed the profitability calculations utilized by HFMC in connection with the continuation of the investment management agreement.
In determining whether to continue the Agreements for the Fund, the members of the Board reviewed and evaluated information and factors they believed to be relevant and appropriate in light of the information that the Board deemed necessary and appropriate through the exercise of its reasonable business judgment. While individual members of the Board may have weighed certain factors differently, the Board’s determination to continue the Agreements was based on a comprehensive consideration of all information provided to the Board throughout the year and specifically with respect to the continuation of the Agreements. A more detailed discussion of the factors the Board considered with respect to its approval of the Agreements is provided below.
Nature, Extent and Quality of Services Provided by the Advisers
The Board requested and considered information concerning the nature, extent and quality of the services provided to the Fund by the Advisers. The Board considered, among other things, the terms of the Agreements and the range of services provided by the Advisers. The Board considered the Advisers’ professional personnel who provide services to the Fund, including each Adviser’s ability and experience in attracting and retaining qualified personnel to service the Fund. The Board considered each Adviser’s reputation and overall financial strength, as well as its willingness to consider and implement organizational and operational changes designed to enhance services to the Hartford Funds. In addition, the Board considered the quality of each Adviser’s communications with the Board and responsiveness to Board inquiries and requests made from time to time with respect to the Fund and other Hartford Funds.
The Board also requested and evaluated information concerning each Adviser’s regulatory and compliance environment. In this regard, the Board requested and reviewed information on each Adviser’s compliance policies and procedures, compliance history, and a report from the Fund’s Chief Compliance Officer on each Adviser’s compliance with applicable laws and regulations, including responses to regulatory developments and compliance issues raised by regulators. The Board also noted the Advisers’ support of the Fund’s compliance control structure, particularly the resources devoted by the Advisers in support of the Fund’s obligations pursuant to Rule 38a-1 under the 1940 Act.
With respect to HFMC, the Board noted that, under the Agreements, HFMC is responsible for the management of the Fund, including oversight of fund operations and service providers, and provides administrative and investment advisory services in connection with selecting, monitoring and supervising the Sub-adviser. The Board considered HFMC’s ongoing monitoring of people, process and performance, including its quarterly reviews of each of the Hartford Funds, semi-annual meetings with the leaders of each Fund’s portfolio management team, and oversight of the Hartford Funds’ approximately 66 portfolio managers. The Board recognized that HFMC has demonstrated a record of making changes to the
| 31 |
| The Hartford Healthcare Fund |
| Approval of Investment Management and Investment Sub-Advisory Agreements (Unaudited) – (continued) |
management and/or strategies of the Hartford Funds when warranted. The Board considered HFMC’s oversight of the Sub-adviser’s investment approach and results, process for monitoring best execution of portfolio trades by the Sub-adviser, and approach to risk management with respect to the Fund and the service providers to the Fund. The Board also considered HFMC’s oversight of compliance with the Fund’s objective and policies as well as with applicable laws and regulations, noting that regulatory and other developments had over time led to an increase in the scope of HFMC’s services in this regard.
In addition, the Board considered HFMC’s ongoing commitment to review and rationalize the Hartford Funds product line-up and the expenses that HFMC had incurred in connection with fund combinations in recent years. The Board considered that HFMC or its affiliates are responsible for providing the Fund’s officers.
With respect to the Sub-adviser, which provides certain day-to-day portfolio management services for the Fund, the Board considered the quality of the Fund’s portfolio managers, the Sub-adviser’s other investment personnel, its investment philosophy and process, investment research capabilities and resources, performance record, trade execution capabilities and experience. The Board considered the experience of the Fund’s portfolio managers, the number of accounts managed by the portfolio managers, and the Sub-adviser’s method for compensating the portfolio managers.
Based on these considerations, the Board concluded that it was satisfied with the nature, extent and quality of the services provided to the Fund by HFMC and the Sub-adviser.
Performance of the Fund and the Advisers
The Board considered the investment performance of the Fund. In this regard, the Board reviewed the performance of the Fund over different time periods presented in the materials and evaluated HFMC’s analysis of the Fund’s performance for these time periods. The Board considered information and materials provided to the Board by the Advisers concerning Fund performance, as well as information from Lipper comparing the investment performance of the Fund to an appropriate benchmark and universe of peer funds. The Board noted that the Fund’s performance was in the 1st quintile of its performance universe for the 1- and 3-year periods and the 2nd quintile for the 5-year period. The Board also noted that the Fund’s performance was above its benchmark for the 1-, 3- and 5-year periods.
The Board considered the detailed investment analytics reports provided by Hartford Funds’ Investment Advisory Group throughout the year. These reports include, among other things, information on the Fund’s gross and net returns, the Fund’s investment performance relative to an appropriate benchmark and peer group, various statistics concerning the Fund’s portfolio, and a narrative summary of various factors affecting Fund performance. The Board considered the Advisers’ cooperation with the Investment Committee, which assists the Board in evaluating the performance of the Fund at periodic meetings throughout the year. The Board also considered the analysis provided by the Consultant relating to the Fund’s performance track record.
In light of all the considerations noted above, the Board concluded that it had continued confidence in HFMC’s and the Sub-adviser’s overall capabilities to manage the Fund.
Costs of the Services and Profitability of the Advisers
The Board reviewed information regarding HFMC’s cost to provide investment management and related services to the Fund and HFMC’s profitability, both overall and for the Fund, on a pre-tax basis without regard to distribution expenses. The Board also requested and reviewed information about the profitability to HFMC and its affiliates from all services provided to the Fund and all aspects of their relationship with the Fund. The Board also requested and received information relating to the operations and profitability of the Sub-adviser.
The Board considered the Consultant’s review of the profitability calculations used by HFMC in connection with the continuation of the investment management agreement, noting the Consultant’s view that Hartford Funds’ process for calculating and reporting Fund profitability is reasonable. In this regard, the Board noted that the Consultant performed a full review of this process in light of the recent restructuring of the Hartford Funds business and reported that the approach to analyzing Fund profitability, including the use of common expense allocation methodologies, is reasonable, sound and well within common industry practice.
Based on these considerations, the Board concluded that the profits anticipated to be realized by the Advisers and their affiliates from their relationships with the Fund would not be excessive.
| 32 |
| The Hartford Healthcare Fund |
| Approval of Investment Management and Investment Sub-Advisory Agreements (Unaudited) – (continued) |
Comparison of Fees and Services Provided by the Advisers
The Board considered comparative information with respect to the management fees to be paid by the Fund to HFMC and the total expense ratios of the Fund. The Board also considered comparative information with respect to the sub-advisory fees to be paid by HFMC to the Sub-adviser. In this regard, the Board requested and reviewed information from HFMC and the Sub-adviser relating to the management and sub-advisory fees, including the sub-advisory fee schedule for the Fund, and total operating expenses for the Fund. With respect to the sub-advisory fee schedule, the Board considered representations from HFMC and the Sub-adviser that the Sub-adviser’s fees were negotiated at arm’s length on a fund-by-fund basis. The Board also reviewed information from Lipper comparing the Fund’s contractual management fees, actual management fees and overall expense ratios relative to a group of funds selected by Lipper, in consultation with the Consultant, and a broader universe of funds selected by Lipper. The Board considered that the Fund’s contractual management fee was in the 3rd quintile of its expense group, while its actual management fee and total expenses (less 12b-1 and shareholder service fees) were in the 4th quintile. The Board noted that the Fund has an automatically renewable contractual expense cap on each share class. The expense cap resulted in reimbursement of certain expenses incurred in 2013.
While the Board recognized that comparisons between the Fund and peer funds may be imprecise, given the different service levels and characteristics of mutual funds and the different business models and cost structures of the Advisers, the comparative information provided by Lipper assisted the Board in evaluating the reasonableness of the Fund’s management and sub-advisory fees and total operating expenses. In addition, the Board considered the analysis and recommendations of the Consultant relating to the Fund’s management and sub-advisory fees and total operating expenses.
Based on these considerations, the Board concluded that the Fund’s fees and total operating expenses, in conjunction with the information about quality of services, profitability, economies of scale, and other matters discussed, were reasonable in light of the services provided.
Economies of Scale
The Board requested and considered information regarding the Advisers’ realization of economies of scale with respect to the Fund and whether the fee levels reflect these economies of scale for the benefit of the Fund’s shareholders. The Board reviewed the breakpoints in the management fee schedule for the Fund, which reduce fee rates as Fund assets grow over time. The Board recognized that a fund with assets beyond the highest breakpoint level will continue to benefit from economies of scale because additional assets are charged the lowest breakpoint fee resulting in lower overall effective management fee rates. The Board also considered that expense limitations and fee waivers that reduce the Fund’s expenses at all asset levels can have the same effect as breakpoints in sharing economies of scale with shareholders and provide protection from an increase in expenses if Fund assets decline. The Board recognized that a fee schedule that reaches a lower breakpoint quickly provides shareholders with the benefit of anticipated or potential economies of scale. The Board also considered that HFMC has been active in managing expenses, which has resulted in benefits being realized by shareholders as assets within the Hartford Funds family of funds have grown over time, including through lower transfer agent costs and other operating expenses.
The Board reviewed and evaluated materials from Lipper and the Consultant showing how management fee schedules of peer funds reflect economies of scale for the benefit of shareholders as a peer fund’s assets hypothetically increase over time. Based on information provided by HFMC, Lipper, and the Consultant, the Board recognized that there is no uniform methodology for establishing breakpoints or uniform pattern in asset levels that trigger breakpoints or the amounts of breakpoints triggered.
After considering all of the information available to it, the Board concluded that it was satisfied with the extent to which economies of scale would be shared for the benefit of the Fund’s shareholders based on currently available information and the effective advisory fees and expense ratios for the Fund at its current and reasonably anticipated asset levels. The Board noted, however, that it would continue to monitor future growth in Fund assets and the appropriateness of additional breakpoints.
Other Benefits
The Board considered other benefits to the Advisers and their affiliates from their relationships with the Fund.
The Board noted that HFMC receives fees for fund accounting and related services from the Fund, and the Board considered information on profits to HFMC for such services. The Board also considered that Hartford Administrative Services Company (“HASCO”), the Fund’s transfer agent and an affiliate of HFMC, receives transfer agency compensation from the Fund, and the Board reviewed information on the profitability of
| 33 |
| The Hartford Healthcare Fund |
| Approval of Investment Management and Investment Sub-Advisory Agreements (Unaudited) – (continued) |
the Fund’s transfer agency function to HASCO. The Board considered information provided by HASCO indicating that the transfer agent fees charged by HASCO to the Fund were fair and reasonable based on publicly available information.
The Board also considered that Hartford Funds Distributors, LLC (“HFD”), an affiliate of HFMC, serves as principal underwriter of the Fund. As principal underwriter, HFD receives 12b-1 fees from the Fund and receives all or a portion of the sales charges on sales or redemptions of certain classes of shares. The Board also noted that certain affiliates of HFD distribute shares of the Fund and receive compensation in that connection.
The Board considered benefits to the Sub-adviser from its use of the Fund’s brokerage commissions to obtain soft dollar research, and representations from HFMC and the Sub-adviser that the Sub-adviser would not make any revenue-sharing payments or any other type of distribution payments to HFMC or its affiliates.
The Board considered the benefits to shareholders of being part of the Hartford Funds family of funds, including the right to exchange investments between the same class of funds without a sales charge, the ability to reinvest Fund dividends into other funds in the family, and the ability to combine holdings in the Fund with holdings in other funds to obtain a reduced sales charge. The Board considered HFMC’s efforts to provide investors in the family with a broad range of investment styles and asset classes and its entrepreneurial risk in initiating new funds to expand these opportunities for shareholders.
* * * *
Based upon its review of these various factors, among others, the Board concluded that it is in the best interests of the Fund and its shareholders for the Board to approve the Agreements for an additional year. In reaching this decision, the Board did not assign relative weights to the factors discussed above or deem any one or group of them to be controlling in and of themselves. In connection with their deliberations, the Independent Directors met separately in executive session on several occasions, with independent legal counsel and the Consultant, to review the relevant materials and consider their responsibilities under relevant laws and regulations.
| 34 |
| The Hartford Healthcare Fund |
| Main Risks (Unaudited) |
The main risks of investing in the Fund are described below.
Market, Selection and Strategy Risk: The Fund’s share price may fluctuate due to market risk and/or security selections that may underperform the market or relevant benchmarks. If the sub-adviser's investment strategy does not perform as expected, the Fund could underperform its peers or lose money. There is no guarantee the Fund will achieve its stated objective.
Health Sector Risk: Risks of focusing investments on the health care sector include regulatory and legal developments, patent considerations, intense competitive pressures, rapid technological changes and potential product obsolescence, and liquidity risk.
Foreign Investment and Emerging Markets Risk: Investments in foreign securities may be riskier than investments in U.S. securities. Potential risks include the risks of illiquidity, increased price volatility, less government regulation, less extensive and less frequent accounting and other reporting requirements, unfavorable changes in currency exchange rates, and economic and political disruptions. These risks are generally greater for investments in emerging markets.
Small/Mid-Cap Stock Risk: Small- and mid-cap stocks are generally more volatile and risky and may be less liquid than large-cap stocks because they may have limited operating histories, narrow product lines, and focus on niche markets.
| 35 |
THIS PRIVACY POLICY IS NOT PART OF THIS REPORT
Privacy Policy and Practices of The Hartford Financial Services Group, Inc. and its Affiliates
(herein called “we, our and us”)
This Privacy Policy applies to our United States Operations
We value your trust. We are committed to the responsible: a) management; b) use; and c) protection; of Personal Information.
This notice describes how we collect, disclose, and protect Personal Information.
We collect Personal Information to: a) service your Transactions with us; and b) support our business functions.
We may obtain Personal Information from: a) You; b) your Transactions with us; and c) third parties such as a consumer-reporting agency.
Based on the type of product or service You apply for or get from us, Personal Information such as: a) your name; b) your address; c) your income; d) your payment; or e) your credit history; may be gathered from sources such as applications, Transactions, and consumer reports.
To serve You and service our business, we may share certain Personal Information. We will share Personal Information, only as allowed by law, with affiliates such as: a) our insurance companies; b) our employee agents; c) our brokerage firms; and d) our administrators.
As allowed by law, we may share Personal Financial Information with our affiliates to: a) market our products; or b) market our services; to You without providing You with an option to prevent these disclosures. |
We may also share Personal Information, only as allowed by law, with unaffiliated third parties including: a) independent agents; b) brokerage firms; c) insurance companies; d) administrators; and e) service providers; who help us serve You and service our business.
When allowed by law, we may share certain Personal Financial Information with other unaffiliated third parties who assist us by performing services or functions such as: a) taking surveys; b) marketing our products or services; or c) offering financial products or services under a joint agreement between us and one or more financial institutions.
We, and third parties we partner with, may track some of the pages You visit through the use of: a) cookies; b) pixel tagging; or c) other technologies; and currently do not process or comply with any web browser’s “do not track” signal or similar mechanism that indicates a request to disable online tracking of individual users who visit our websites or use our services.
We will not sell or share your Personal Financial Information with anyone for purposes unrelated to our business functions without offering You the opportunity to: a) “opt-out;” or b) “opt-in;” as required by law.
We only disclose Personal Health Information with: a) your proper written authorization; or b) as otherwise allowed or required by law.
Our employees have access to Personal Information in the course of doing their jobs, such as: a) underwriting policies; b) paying claims; c) developing new products; or d) advising customers of our products and services. |
We use manual and electronic security procedures to maintain: a) the confidentiality; and b) the integrity of; Personal Information that we have. We use these procedures to guard against unauthorized access.
Some techniques we use to protect Personal Information include: a) secured files; b) user authentication; c) encryption; d) firewall technology; and e) the use of detection software.
We are responsible for and must: a) identify information to be protected; b) provide an adequate level of protection for that data; c) grant access to protected data only to those people who must use it in the performance of their job-related duties.
Employees who violate our Privacy Policy will be subject to discipline, which may include ending their employment with us.
At the start of our business relationship, we will give You a copy of our current Privacy Policy.
We will also give You a copy of our current Privacy Policy once a year if You maintain a continuing business relationship with us.
We will continue to follow our Privacy Policy regarding Personal Information even when a business relationship no longer exists between us.
|
As used in this Privacy Notice:
Application means your request for our product or service.
Personal Financial Information means financial information such as: a) credit history; b) income; c) financial benefits; or d) policy or claim information.
Personal Health Information means health information such as: a) your medical records; or b) information about your illness, disability or injury.
Personal Information means information that identifies You personally and is not otherwise available to the public. It includes: a) Personal Financial Information; and b) Personal Health Information.
Transaction means your business dealings with us, such as: a) your Application; b) your request for us to pay a claim; and c) your request for us to take an action on your account.
You means an individual who has given us Personal Information in conjunction with: a) asking about; b) applying for; or c) obtaining; a financial product or service from us if the product or service is used mainly for personal, family, or household purposes. |
This Privacy Policy is being provided on behalf of the following affiliates of The Hartford Financial Services Group, Inc.:
1stAGChoice, Inc.; Access CoverageCorp, Inc.; Access CoverageCorp Technologies, Inc.; American Maturity Life Insurance Company; Archway 60 R, LLC; Business Management Group, Inc.; Champlain Life Reinsurance Company; DMS R, LLC; Eloy R, LLC; Ersatz Corporation; First State Insurance Company; Hartford Accident and Indemnity Company; Hartford Administrative Services Company; Hartford Casualty General Agency, Inc.; Hartford Casualty Insurance Company; Hartford-Comprehensive Employee Benefit Service Company; Hartford Equity Sales Company, Inc.; Hartford Fire General Agency, Inc.; Hartford Fire Insurance Company; Hartford Funds Management Company, LLC; Hartford Funds Management Group, Inc.; Hartford HLS Series Fund II, Inc.; Hartford Insurance Company of Illinois; Hartford Insurance Company of the Midwest; Hartford Insurance Company of the Southeast; Hartford Integrated Technologies, Inc.; Hartford International Life Reassurance Corporation; Hartford Funds Distributors, LLC; Hartford Investment Management Company; Hartford Life and Accident Insurance Company; Hartford Life and Annuity Insurance Company; Hartford Life Insurance Company; Hartford Life Private Placement, LLC; Hartford Lloyd’s Corporation; Hartford Lloyd’s Insurance Company; Hartford Mezzanine Investors I, LLC; Hartford Residual Market, L.C.C.; Hartford Retirement Services, LLC; Hartford Securities Distribution Company, Inc.; Hartford Series Fund, Inc.; Hartford Specialty Insurance Services of Texas, LLC; Hartford Strategic Investments, LLC; Hartford Underwriters Insurance Company; Hartford Technology Services Company, L.L.C.; Hartford of Texas General Agency, Inc.; Hartford Underwriters General Agency, Inc.; HARTRE Company, L.C.C.; HL Investment Advisors, LLC; HLA LLC; Horizon Management Group, LLC; HRA Brokerage Services, Inc.; Lanidex Class B, LLC; M-CAP Insurance Agency, LLC; New England Insurance Company; New England Reinsurance Corporation; Nutmeg Insurance Agency, Inc.; Nutmeg Insurance Company; Pacific Insurance Company, Limited; Planco, LLC: Property and Casualty Insurance Company of Hartford; Revere R, LLC; RVR R, LLC; Sentinel Insurance Company, Ltd.; Sunstone R, LLC; Symphony R, LLC; The Evergreen Group Incorporated; The Hartford Alternative Strategies Fund; The Hartford Mutual Funds, Inc.; The Hartford Mutual Funds II, Inc.; Trumbull Flood Management, L.L.C.; Trumbull Insurance Company; Twin City Fire Insurance Company; White River Life Reinsurance Company.
HPP Revised January 2014
HARTFORDFUNDS
hartfordfunds.com
This information is written in connection with the promotion or marketing of the matter(s) addressed in this material.
This report is submitted for the general information of the shareholders of the Fund. It is not authorized for distribution unless preceded or accompanied by a current prospectus for the Fund.
The information cannot be used or relied upon for the purpose of avoiding IRS penalties. These materials are not intended to provide tax, accounting or legal advice. As with all matters of a tax or legal nature, you should consult your own tax or legal counsel for advice.
Investors should carefully consider the investment objectives, risks, charges, and expenses of Hartford Funds before investing. This and other information can be found in the prospectus and summary prospectus, which can be obtained by calling 888-843-7824 (retail) or 800-279-1541 (institutional). Investors should read them carefully before they invest.
Hartford Funds are underwritten and distributed by Hartford Funds Distributors, LLC.
MFAR-HC14 12/14 113984-3 Printed in U.S.A.
HARTFORDFUNDS
|
THE HARTFORD HIGH YIELD FUND
2014 Annual Report |
A MESSAGE FROM THE PRESIDENT
Dear Fellow Shareholders:
Thank you for investing in Hartford Funds.
Market Review
U.S. equities (as represented by the S&P 500 Index) rose steadily for the fiscal year ended October 31, 2014, with a return of 17.27% for the period. With the exception of short-lived geopolitical scares early in 2014 and concerns about continuing global growth near the end of the period, stocks generally rose on solid fundamentals and encouraging macroeconomic data during the year.
September 2014 marked the six-year anniversary of the start of the financial crisis. Within weeks of that anniversary, both the S&P 500 Index and the Dow Jones Industrial Average set new all-time highs, closing at 2,018 and 17,391, respectively, on October 31. Although the fallout of the crisis continues to influence investor behavior, stocks have recovered and risen dramatically, up 198% from their low in March 2009. Meanwhile, the domestic economy is notching strong growth, and the unemployment rate has reached its lowest level since August 2008.
While the U.S. economy appears to have stabilized and to have reverted to a solid growth path, the outlook for the global economy appears to have gotten cloudier. The U.S. Federal Reserve has ended quantitative easing, while Europe and Japan are pursuing stimulus options to avoid a double-dip recession and deflation, respectively. Diverging central-bank policies will likely continue to play an important role in market movements going forward as investors wait to see the reactions to their efforts and their impacts on global markets.
How have market movements impacted your portfolio throughout the last year? Are your investments still on track to provide the growth or income you need, and are you comfortable with their progress during times of volatility?
Your financial professional can help you navigate today’s markets with confidence, as well as assist you to achieve your investment goals by providing advice on the best options within our fund family to help you work toward overcoming today’s investing challenges. Meet with your financial advisor regularly to examine your portfolio and your investment strategy, and to determine if you’re still on track to meet your goals.
Thank you again for investing with Hartford Funds.
James Davey
President
Hartford Funds
1 The S&P 500 Index is a market capitalization-weighted price index composed of 500 widely held common stocks.
2 The Dow Jones Industrial Average is an unmanaged, price-weighted index of 30 of the largest, most widely held stocks traded on the NYSE
Table of Contents
The views expressed in the Fund’s Manager Discussion under ‘‘Why did the Fund perform this way?’’ and ‘‘What is the outlook?’’ are views of the Fund’s sub-adviser and portfolio management team through the end of the period and are subject to change based on market and other conditions. The Fund’s Manager Discussion is for informational purposes only and does not represent an offer, recommendation or solicitation to buy, hold or sell any security. The specific securities identified and described, if any, do not represent all of the securities purchased or sold and you should not assume that investments in the securities identified and discussed will be profitable.
| The Hartford High Yield Fund inception 09/30/1998 | |
| (sub-advised by Wellington Management Company, LLP) | |
| Investment objective – The Fund seeks to provide high current income, and long-term total return. |
Performance Overview 10/31/04 - 10/31/14

The chart above represents the hypothetical growth of a $10,000 investment in Class A, which includes a sales charge. Growth results in classes other than Class A will vary from what is seen above due to differences in the expenses charged to those share classes.
| Average Annual Total Returns (as of 10/31/14) |
| 1 Year | 5 Years | 10 Years | ||||||||||
| High Yield A# | 5.35 | % | 9.43 | % | 6.64 | % | ||||||
| High Yield A## | 0.61 | % | 8.43 | % | 6.15 | % | ||||||
| High Yield B# | 4.60 | % | 8.61 | % | 6.01 | %* | ||||||
| High Yield B## | -0.40 | % | 8.32 | % | 6.01 | %* | ||||||
| High Yield C# | 4.60 | % | 8.64 | % | 5.87 | % | ||||||
| High Yield C## | 3.60 | % | 8.64 | % | 5.87 | % | ||||||
| High Yield I# | 5.60 | % | 9.78 | % | 6.91 | % | ||||||
| High Yield R3# | 5.18 | % | 9.12 | % | 6.51 | % | ||||||
| High Yield R4# | 5.35 | % | 9.44 | % | 6.76 | % | ||||||
| High Yield R5# | 5.81 | % | 9.76 | % | 6.98 | % | ||||||
| High Yield Y# | 5.73 | % | 9.81 | % | 7.05 | % | ||||||
| Barclays U.S. Corporate High Yield Bond Index | 5.82 | % | 10.44 | % | 8.26 | % | ||||||
| # | Without sales charge |
| ## | With sales charge |
| * | Class B shares convert to Class A shares after 8 years. The return shown reflects the conversion to Class A shares, which had different operating expenses, for the period after conversion. |
PERFORMANCE DATA QUOTED REPRESENTS PAST PERFORMANCE AND DOES NOT GUARANTEE FUTURE RESULTS. The investment return and principal value of the investment will fluctuate so that investors’ shares, when redeemed, may be worth more or less than their original cost. Current performance may be lower or higher than the performance data quoted. To obtain performance data current to the most recent month-end, please visit our website www.hartfordfunds.com.
The initial investment in Class A shares reflects the maximum sales charge of 4.50% and returns for Class B shares reflect a contingent deferred sales charge of up to 5.00% and declining to zero, depending on the period of time the shares are held. Returns for Class C shares reflect a contingent deferred sales charge of up to 1.00% on shares redeemed within twelve months of purchase.
Total returns presented above were calculated using the Fund’s net asset value available to shareholders for sale or redemption of Fund shares on October 31, 2014, which may exclude investment transactions as of this date. All share class returns assume the reinvestment of all distributions at net asset value and the deduction of all fund expenses.
Effective 9/30/09, Class B shares of the Fund were closed to new investments.
Class I shares commenced operations on 5/31/07. Performance prior to that date is that of the Fund's Class A shares (excluding sales charges), which had different operating expenses. Class R3, R4 and R5 shares commenced operations on 12/22/06. Performance prior to that date is that of the Fund's Class Y shares, which had different operating expenses.
Performance information includes performance under the Fund’s previous sub-adviser, Hartford Investment Management Company. As of March 5, 2012, Hartford Investment Management Company no longer served as the sub-adviser to the Fund.
Barclays U.S. Corporate High Yield Bond Index is an unmanaged broad-based market-value-weighted index that tracks the total return performance of non-investment grade, fixed-rate, publicly placed, dollar denominated and nonconvertible debt registered with the Securities and Exchange Commission.
You cannot invest directly in an index.
The chart and table do not reflect the deductions of taxes that a shareholder would pay on Fund distributions or the redemption of Fund shares.
Performance information may reflect historical or current expense waivers/reimbursements from the investment adviser, without which performance would have been lower. For information on current expense waivers/reimbursements, please see the prospectus.
| 2 |
| The Hartford High Yield Fund |
| Manager Discussion |
| October 31, 2014 (Unaudited) |
Operating Expenses*
| Net | Gross | |||||||
| High Yield Class A | 1.05 | % | 1.15 | % | ||||
| High Yield Class B | 1.80 | % | 1.99 | % | ||||
| High Yield Class C | 1.80 | % | 1.81 | % | ||||
| High Yield Class I | 0.80 | % | 0.81 | % | ||||
| High Yield Class R3 | 1.35 | % | 1.47 | % | ||||
| High Yield Class R4 | 1.05 | % | 1.14 | % | ||||
| High Yield Class R5 | 0.75 | % | 0.84 | % | ||||
| High Yield Class Y | 0.70 | % | 0.72 | % | ||||
| * | As shown in the Fund's current prospectus dated March 1, 2014. Actual expenses may be higher or lower. Please see accompanying Financial Highlights for expense ratios for the year ended October 31, 2014. |
Gross expenses are the Fund's total annual operating expenses shown in the Fund's most recent prospectus. Net expenses are the Fund's total annual operating expenses shown in the Fund's most recent prospectus and reflect contractual expense reimbursements in instances when these reductions reduce the Fund's gross expenses. Contractual reimbursements remain in effect until February 28, 2015, and automatically renew for one-year terms unless terminated.
All investments are subject to risk including the possible loss of principal. For a discussion of the Fund’s risks, please see the Main Risks section of this report. For more detailed information on the risks associated with an investment in the Fund, please see the prospectus.
| Portfolio Manager |
| Christopher A. Jones, CFA |
| Senior Vice President and Fixed Income Portfolio Manager |
How did the Fund perform?
The Class A shares of The Hartford High Yield Fund returned 5.35%, before sales charge, for the twelve-month period ended October 31, 2014, underperforming the Fund’s benchmark, the Barclays U.S. Corporate High Yield Bond Index, which returned 5.82% for the same period. The Fund outperformed the 4.45% average return of the Lipper High Current Yield Funds peer group, a group of funds with investment strategies similar to those of the Fund.
Why did the Fund perform this way?
Fixed income markets gained throughout much of the period as expectations of prolonged easy monetary policy by major central banks and a supportive macroeconomic environment kept rates low and suppressed volatility. Early in the period emerging markets dominated headlines as economic and political developments sparked risk aversion across global markets, pushing bond prices higher and yields lower amid a flight to quality. Toward the end of the period, however, persistent geopolitical risks – tensions between Ukraine and Russia and violence in Iraq – and Chinese economic slowdown concerns raised questions about the global growth rate, keeping a lid on risk appetites overall.
The period was also highlighted by a divergence in central bank policies. The European Central Bank (ECB) cut its benchmark lending and deposit rates and announced a host of stimulus measures in an effort to encourage lending and fend off fears of deflation. China’s central bank joined the ECB in boosting liquidity by injecting funds into the nation’s largest banks in an attempt to combat weakening growth. The Bank of Japan pre-emptively announced incremental monetary easing to counter the risk of missing the country’s inflation and growth targets. In contrast, the Bank of England and U.S. Federal Reserve (Fed) leaned toward tighter policies. The Fed ended its quantitative easing program as U.S. data largely suggested the economy was on a sustainable growth path. Second quarter Gross Domestic Product (GDP) rebounded after the first quarter’s steep contraction. The labor market strengthened as the unemployment rate dropped to a six-year low. Housing regained some lost ground after a weak start to the year, though the pace of home price appreciation started to slow after a strong 2013. Inflation pressures were muted overall, alleviating pressure on the Fed to raise rates.
The U.S. Treasury curve flattened as markets contemplated bringing interest rates to normal levels; short-term yields rose while longer term rates declined. Most credit risk sectors posted positive absolute returns and outperformed duration-equivalent government bonds as credit spreads tightened.
The Barclays U.S. Corporate High Yield Bond Index returned 5.82% for the twelve-months ended October 31, 2014 and outperformed duration equivalent Treasuries by 3.84%. The Option-Adjusted Spread (OAS) of the Barclays U.S. Corporate High Yield Bond Index was 4.15% on October 31, 2014, in line from a year ago (4.16%).
An important detractor from the Fund’s performance over the period included being underweight to BB-rated securities, the highest quality sector in High Yield. These bonds outperformed the lower quality sectors on a duration-adjusted basis during the period. An out-of-benchmark allocation to Bank Loans slightly detracted from performance. Bank Loans are floating rate securities and thus did not benefit from falling rates.
In terms of sector allocations, the Fund benefitted from being underweight two sectors that significantly underperformed versus other Barclays U.S. Corporate High Yield Bond Index sectors – Gaming and Energy. The fundamentals of both sectors appear to have deteriorated - the former due to increased competition as more state legislatures pass laws allowing gambling. Many of the issuers in the Energy sector are Exploration and Production companies.
| 3 |
| The Hartford High Yield Fund |
| Manager Discussion – (continued) |
| October 31, 2014 (Unaudited) |
These companies tend to have poor free cash flow metrics, which have been exacerbated by weak Natural Gas and oil prices. On the other hand being underweight in the Utility sector detracted slightly from benchmark-relative returns.
Security selection was positive in the period. Importantly, we have started to see more divergence in the performance of companies over the period allowing for more opportunities to add value from security selection. In the Gaming sector, not having exposure to Caesars Entertainment, a highly leveraged company in a troubled sector contributed to performance. Security selection in the Financial Services sector contributed to performance including an overweight position in Nuveen Investments which was acquired by TIAA-CREF, during the period. Security selection in Healthcare was also a positive contributor. The Fund benefitted from overweight positions in HCA and Community Health Systems. We continue to favor select large hospital companies as we feel that they will benefit from Healthcare reforms. Some of the issuers that detracted from performance during the period were overweight positions in Nii Holdings in the wireless sector with operations in South America and Paragon Offshore, an Energy company. We have exited the position in Nii Holdings believing that we are no longer being compensated for the operational risks this company is facing. We believe that Paragon Offshore is well positioned to absorb any potential weakness and should remain cash flow positive even under a bear market scenario. Offsetting any fundamental weakness is a strong current backlog and decent asset coverage. Not owning Telecom Italia, a large issuer which migrated down to high yield in recent years from investment grade, also hurt performance. We have been cautious in taking on exposure to peripheral European issuers.
Over the period, the Fund had a small position in high yield credit default swap index (CDX), which had a marginal impact on benchmark relative performance. The Fund’s CDX position is used for liquidity purposes and for tactically adjusting the risk posture of the Fund.
What is the outlook?
Our outlook for U.S. high-yield bonds remains positive, based on the steadily improving macroeconomic backdrop, our expectations that default levels will remain low, and positive corporate fundamentals. In our view, valuations are now more attractive, with spreads around their long-term historical averages, and reasonable for this point in the cycle; the trailing 12-month par-weighted default rate remains below its long-term average. While we see that there has been a recent pickup in shareholder-friendly actions such as M&A activity and leveraged buyouts at the margin, we do not believe this is likely to affect default rates in the near to medium term. As noted above, we expect that idiosyncratic risk will become increasingly important with greater dispersion of returns between companies. In this environment we would expect to see increased stress on more highly leveraged companies with poor fundamentals.
Credit Exposure
as of October 31, 2014
| Credit Rating * | Percentage
of Net Assets | |||
| Baa/ BBB | 1.0 | % | ||
| Ba/ BB | 26.1 | |||
| B | 40.3 | |||
| Caa/ CCC or Lower | 21.6 | |||
| Not Rated | 1.8 | |||
| Non-Debt Securities and Other Short-Term Instruments | 7.6 | |||
| Other Assets and Liabilities | 1.6 | |||
| Total | 100.0 | % | ||
| * | Credit exposure is the long-term credit ratings for the Fund's holdings, as of the date noted, as provided by Standard and Poor's (S&P) or Moody's Investors Service (Moody's) and typically range from AAA/Aaa (highest) to C/D (lowest). Presentation of S&P and Moody's credit ratings in this report have been selected for informational purposes for shareholders, as well as the Fund's consideration of industry practice. If Moody's and S&P assign different ratings, the lower rating is used. Fixed income securities that are not rated by either agency are listed as "Not Rated." Ratings do not apply to the Fund itself or to the Fund's shares. Ratings may change. |
| Diversification by Security Type |
| as of October 31, 2014 |
| Category | Percentage
of Net Assets | |||
| Equity Securities | ||||
| Common Stocks | 0.1 | % | ||
| Preferred Stocks | 1.3 | |||
| Total | 1.4 | % | ||
| Fixed Income Securities | ||||
| Asset & Commercial Mortgage Backed Securities | 0.0 | % | ||
| Corporate Bonds | 87.7 | |||
| Senior Floating Rate Interests | 3.1 | |||
| Total | 90.8 | % | ||
| Short-Term Investments | 6.2 | |||
| Other Assets and Liabilities | 1.6 | |||
| Total | 100.0 | % | ||
| 4 |
| The Hartford High Yield Fund |
| Schedule of Investments |
| October 31, 2014 |
| (000’s Omitted) |
| Shares or Principal Amount ╬ | Market Value ╪ | |||||||
| Asset and Commercial Mortgage Backed Securities - 0.0% | ||||||||
| Finance and Insurance - 0.0% | ||||||||
| Soundview NIM Trust | ||||||||
| $ | 920 | 0.00%, 12/25/2036 ■● | $ | – | ||||
| Total Asset and Commercial Mortgage Backed Securities | ||||||||
| (Cost $916) | $ | – | ||||||
| Corporate Bonds - 87.7% | ||||||||
| Administrative, Support, Waste Management and Remediation Services - 1.3% | ||||||||
| Casella Waste Systems, Inc. | ||||||||
| $ | 1,560 | 7.75%, 02/15/2019 | $ | 1,591 | ||||
| ServiceMaster (The) Co. | ||||||||
| 3,522 | 7.00%, 08/15/2020 | 3,725 | ||||||
| 5,316 | ||||||||
| Arts, Entertainment and Recreation - 4.4% | ||||||||
| CCO Holdings LLC | ||||||||
| 105 | 5.13%, 02/15/2023 | 105 | ||||||
| 495 | 5.75%, 09/01/2023 | 507 | ||||||
| 2,920 | 7.38%, 06/01/2020 | 3,130 | ||||||
| Cequel Communications Holdings I LLC | ||||||||
| 2,425 | 5.13%, 12/15/2021 ■ | 2,367 | ||||||
| Emdeon, Inc. | ||||||||
| 1,625 | 11.00%, 12/31/2019 | 1,802 | ||||||
| Gannett Co., Inc. | ||||||||
| 1,615 | 4.88%, 09/15/2021 ■ | 1,627 | ||||||
| 3,105 | 5.13%, 10/15/2019 | 3,229 | ||||||
| 270 | 5.50%, 09/15/2024 ■ | 279 | ||||||
| 800 | 6.38%, 10/15/2023 | 860 | ||||||
| Gray Television, Inc. | ||||||||
| 2,545 | 7.50%, 10/01/2020 | 2,663 | ||||||
| NBC Universal Enterprise | ||||||||
| 1,980 | 5.25%, 12/19/2049 ■‡ | 2,062 | ||||||
| 18,631 | ||||||||
| Chemical Manufacturing - 2.1% | ||||||||
| Hexion U.S. Finance Corp. | ||||||||
| 2,030 | 6.63%, 04/15/2020 | 2,030 | ||||||
| Ineos Group Holdings plc | ||||||||
| 2,710 | 5.88%, 02/15/2019 ■ | 2,706 | ||||||
| 4,205 | 6.13%, 08/15/2018 ■ | 4,242 | ||||||
| 8,978 | ||||||||
| Computer and Electronic Product Manufacturing - 3.3% | ||||||||
| Alcatel-Lucent USA, Inc. | ||||||||
| 2,010 | 6.75%, 11/15/2020 ■ | 2,071 | ||||||
| CDW LLC / CDW Finance Corp. | ||||||||
| 3,330 | 6.00%, 08/15/2022 | 3,513 | ||||||
| Freescale Semiconductor, Inc. | ||||||||
| 4,520 | 6.00%, 01/15/2022 ■ | 4,633 | ||||||
| Lucent Technologies, Inc. | ||||||||
| 3,070 | 6.45%, 03/15/2029 | 2,955 | ||||||
| 660 | 6.50%, 01/15/2028 | 635 | ||||||
| 13,807 | ||||||||
| Construction - 4.6% | ||||||||
| K Hovnanian Enterprises, Inc. | ||||||||
| 570 | 7.00%, 01/15/2019 ■ | 556 | ||||||
| 245 | 8.00%, 11/01/2019 ■ | 245 | ||||||
| 2,426 | 9.13%, 11/15/2020 ■ | 2,632 | ||||||
| KB Home | ||||||||
| 1,030 | 7.00%, 12/15/2021 | 1,102 | ||||||
| 1,895 | 7.50%, 09/15/2022 | 2,042 | ||||||
| 1,510 | 8.00%, 03/15/2020 | 1,684 | ||||||
| Lennar Corp. | ||||||||
| 3,100 | 4.75%, 12/15/2017 - 11/15/2022 | 3,114 | ||||||
| M/I Homes, Inc. | ||||||||
| 543 | 3.00%, 03/01/2018 β | 550 | ||||||
| MPH Acquisition Holdings LLC | ||||||||
| 1,390 | 6.63%, 04/01/2022 ■ | 1,454 | ||||||
| Paragon Offshore plc | ||||||||
| 3,345 | 6.75%, 07/15/2022 ■ | 2,550 | ||||||
| Ply Gem Industries, Inc. | ||||||||
| 3,665 | 6.50%, 02/01/2022 | 3,605 | ||||||
| 19,534 | ||||||||
| Electrical Equipment and Appliance Manufacturing - 0.2% | ||||||||
| Sensata Technologies B.V. | ||||||||
| 685 | 5.63%, 11/01/2024 ■ | 723 | ||||||
| Fabricated Metal Product Manufacturing - 0.6% | ||||||||
| Entegris, Inc. | ||||||||
| 2,380 | 6.00%, 04/01/2022 ■ | 2,422 | ||||||
| Finance and Insurance - 9.7% | ||||||||
| AerCap Ireland Capital Ltd. | ||||||||
| 1,670 | 4.50%, 05/15/2021 ■ | 1,687 | ||||||
| Banco Bilbao Vizcaya Argentaria S.A. | ||||||||
| EUR | 2,600 | 7.00%, 12/29/2049 § | 3,342 | |||||
| 800 | 9.00%, 05/09/2018 §♠ | 865 | ||||||
| Barclays Bank plc | ||||||||
| 525 | 6.63%, 09/15/2019 ♠ | 502 | ||||||
| 3,105 | 8.25%, 12/15/2018 ♠β | 3,206 | ||||||
| CIT Group, Inc. | ||||||||
| 2,554 | 5.50%, 02/15/2019 ■ | 2,725 | ||||||
| Credit Agricole S.A. | ||||||||
| 945 | 7.88%, 01/23/2024 ■♠ | 975 | ||||||
| Credit Suisse Group AG | ||||||||
| 1,320 | 7.50%, 12/11/2023 ■♠ | 1,403 | ||||||
| HBOS Capital Funding L.P. | ||||||||
| 1,250 | 6.85%, 12/23/2014 §♠ | 1,254 | ||||||
| Nationstar Mortgage LLC | ||||||||
| 2,270 | 6.50%, 08/01/2018 | 2,225 | ||||||
| 1,461 | 7.88%, 10/01/2020 | 1,439 | ||||||
| Nuveen Investments, Inc. | ||||||||
| 1,845 | 9.13%, 10/15/2017 ■ | 1,971 | ||||||
| Provident Funding Associates L.P. | ||||||||
| 4,280 | 6.75%, 06/15/2021 ■ | 4,269 | ||||||
| Royal Bank of Scotland Group plc | ||||||||
| 2,700 | 6.99%, 10/05/2017 ■♠ | 3,064 | ||||||
| 1,800 | 7.64%, 09/27/2017 ♠Δ | 1,904 | ||||||
| Societe Generale | ||||||||
| 1,075 | 6.00%, 01/27/2020 ■♠ | 1,013 | ||||||
| 1,535 | 7.88%, 12/18/2023 ■♠ | 1,535 | ||||||
| 2,525 | 8.25%, 11/29/2018 §♠ | 2,668 | ||||||
| SoftBank Corp. | ||||||||
| 2,940 | 4.50%, 04/15/2020 ■ | 2,977 | ||||||
| TMX Finance LLC | ||||||||
| 2,285 | 8.50%, 09/15/2018 ■ | 2,228 | ||||||
| 41,252 | ||||||||
The accompanying notes are an integral part of these financial statements.
| 5 |
| The Hartford High Yield Fund |
| Schedule of Investments – (continued) |
| October 31, 2014 |
| (000’s Omitted) |
| Shares or Principal Amount ╬ | Market Value ╪ | |||||||
| Corporate Bonds - 87.7% - (continued) | ||||||||
| Food Services - 1.0% | ||||||||
| ARAMARK Corp. | ||||||||
| $ | 2,875 | 5.75%, 03/15/2020 | $ | 3,004 | ||||
| CEC Entertainment, Inc. | ||||||||
| 1,415 | 8.00%, 02/15/2022 ■ | 1,359 | ||||||
| 4,363 | ||||||||
| Health Care and Social Assistance - 9.7% | ||||||||
| Alere, Inc. | ||||||||
| 2,645 | 6.50%, 06/15/2020 | 2,724 | ||||||
| AmSurg Corp. | ||||||||
| 1,255 | 5.63%, 07/15/2022 ■ | 1,300 | ||||||
| Biomet, Inc. | ||||||||
| 1,205 | 6.50%, 08/01/2020 | 1,289 | ||||||
| Community Health Systems, Inc. | ||||||||
| 615 | 5.13%, 08/15/2018 | 640 | ||||||
| 4,880 | 6.88%, 02/01/2022 | 5,258 | ||||||
| 1,985 | 7.13%, 07/15/2020 | 2,149 | ||||||
| Cubist Pharmaceuticals | ||||||||
| 626 | 1.88%, 09/01/2020 β | 731 | ||||||
| Envision Healthcare Corp. | ||||||||
| 970 | 5.13%, 07/01/2022 ■ | 982 | ||||||
| Grifols Worldwide Operations Ltd. | ||||||||
| 1,015 | 5.25%, 04/01/2022 ■ | 1,040 | ||||||
| HCA Holdings, Inc. | ||||||||
| 2,645 | 6.25%, 02/15/2021 | 2,847 | ||||||
| 4,626 | 7.50%, 11/15/2095 | 4,441 | ||||||
| InVentiv Health, Inc. | ||||||||
| 1,070 | 9.00%, 01/15/2018 ■ | 1,110 | ||||||
| Pinnacle Merger Sub, Inc. | ||||||||
| 2,820 | 9.50%, 10/01/2023 ■ | 3,074 | ||||||
| Salix Pharmaceuticals Ltd. | ||||||||
| 5,826 | 6.00%, 01/15/2021 ■ | 6,307 | ||||||
| Savient Pharmaceuticals, Inc. | ||||||||
| 2,815 | 0.00%, 02/01/2018 Ω | 3 | ||||||
| Tenet Healthcare Corp. | ||||||||
| 2,565 | 4.75%, 06/01/2020 | 2,623 | ||||||
| 1,640 | 5.00%, 03/01/2019 ■ | 1,642 | ||||||
| 1,585 | 8.13%, 04/01/2022 | 1,817 | ||||||
| Wellcare Health Plans, Inc. | ||||||||
| 1,160 | 5.75%, 11/15/2020 | 1,195 | ||||||
| 41,172 | ||||||||
| Information - 22.1% | ||||||||
| Activision Blizzard, Inc. | ||||||||
| 5,422 | 5.63%, 09/15/2021 ■ | 5,768 | ||||||
| 1,025 | 6.13%, 09/15/2023 ■ | 1,110 | ||||||
| Altice Financing S.A. | ||||||||
| 235 | 6.50%, 01/15/2022 ■ | 241 | ||||||
| 2,100 | 7.88%, 12/15/2019 ■‡ | 2,239 | ||||||
| 250 | 8.13%, 01/15/2024 ■ | 263 | ||||||
| 925 | 9.88%, 12/15/2020 ■ | 1,031 | ||||||
| Audatex North America, Inc. | ||||||||
| 3,841 | 6.00%, 06/15/2021 ■ | 4,062 | ||||||
| DISH DBS Corp. | ||||||||
| 1,250 | 5.00%, 03/15/2023 | 1,245 | ||||||
| 3,270 | 6.75%, 06/01/2021 | 3,630 | ||||||
| 2,812 | 7.88%, 09/01/2019 | 3,265 | ||||||
| First Data Corp. | ||||||||
| 990 | 6.75%, 11/01/2020 ■ | 1,059 | ||||||
| 1,960 | 7.38%, 06/15/2019 ■ | 2,078 | ||||||
| 4,350 | 8.25%, 01/15/2021 ■ | 4,720 | ||||||
| 512 | 14.50%, 09/24/2019 ■Þ | 535 | ||||||
| Harron Communications L.P. | ||||||||
| 950 | 9.13%, 04/01/2020 ■ | 1,035 | ||||||
| Infor Software Parent LLC | ||||||||
| 3,315 | 7.13%, 05/01/2021 ■ | 3,356 | ||||||
| Infor US, Inc. | ||||||||
| 880 | 9.38%, 04/01/2019 | 957 | ||||||
| Intelsat Jackson Holdings S.A. | ||||||||
| 190 | 6.63%, 12/15/2022 | 200 | ||||||
| 1,140 | 7.50%, 04/01/2021 | 1,234 | ||||||
| Intelsat Luxembourg S.A. | ||||||||
| 1,940 | 6.75%, 06/01/2018 | 2,008 | ||||||
| 4,435 | 7.75%, 06/01/2021 | 4,635 | ||||||
| Level 3 Escrow, Inc. | ||||||||
| 2,380 | 5.38%, 08/15/2022 ■ | 2,422 | ||||||
| 1,166 | 8.13%, 07/01/2019 | 1,248 | ||||||
| Level 3 Financing, Inc. | ||||||||
| 890 | 6.13%, 01/15/2021 | 933 | ||||||
| 2,319 | 7.00%, 06/01/2020 | 2,476 | ||||||
| MetroPCS Wireless, Inc. | ||||||||
| 3,125 | 6.63%, 11/15/2020 | 3,293 | ||||||
| Paetec Holding Corp. | ||||||||
| 961 | 9.88%, 12/01/2018 | 1,014 | ||||||
| Softbrands, Inc. | ||||||||
| 1,480 | 11.50%, 07/15/2018 | 1,635 | ||||||
| Sprint Communications, Inc. | ||||||||
| 3,470 | 7.00%, 03/01/2020 ■ | 3,871 | ||||||
| 1,533 | 9.00%, 11/15/2018 ■ | 1,803 | ||||||
| Sprint Corp. | ||||||||
| 4,070 | 7.25%, 09/15/2021 ■ | 4,304 | ||||||
| 3,890 | 7.88%, 09/15/2023 ■ | 4,211 | ||||||
| Syniverse Holdings, Inc. | ||||||||
| 3,945 | 9.13%, 01/15/2019 | 4,142 | ||||||
| T-Mobile USA, Inc. | ||||||||
| 225 | 6.13%, 01/15/2022 | 233 | ||||||
| 795 | 6.46%, 04/28/2019 | 829 | ||||||
| 330 | 6.50%, 01/15/2024 | 346 | ||||||
| 2,440 | 6.63%, 04/28/2021 | 2,571 | ||||||
| 2,155 | 6.73%, 04/28/2022 | 2,279 | ||||||
| Unitymedia Hessen GmbH & Co. | ||||||||
| 3,045 | 5.50%, 01/15/2023 ■ | 3,174 | ||||||
| Verint Systems, Inc. | ||||||||
| 1,034 | 1.50%, 06/01/2021 β | 1,154 | ||||||
| Videotron Ltd. | ||||||||
| 170 | 9.13%, 04/15/2018 | 176 | ||||||
| Wind Acquisition Finance S.A. | ||||||||
| EUR | 3,080 | 4.00%, 07/15/2020 ■ | 3,802 | |||||
| 770 | 6.50%, 04/30/2020 ■ | 801 | ||||||
| Windstream Corp. | ||||||||
| 2,050 | 7.50%, 04/01/2023 | 2,152 | ||||||
| 93,540 | ||||||||
| Machinery Manufacturing - 0.8% | ||||||||
| Case New Holland Industrial, Inc. | ||||||||
| 3,104 | 7.88%, 12/01/2017 | 3,484 | ||||||
| Mining - 3.4% | ||||||||
| AK Steel Corp. | ||||||||
| 3,980 | 7.63%, 05/15/2020 - 10/01/2021 | 3,999 | ||||||
| 1,460 | 8.38%, 04/01/2022 | 1,489 | ||||||
| FMG Resources Aug 2006 | ||||||||
| 6,400 | 6.88%, 04/01/2022 ■ | 6,608 | ||||||
The accompanying notes are an integral part of these financial statements.
| 6 |
| The Hartford High Yield Fund |
| Schedule of Investments – (continued) |
| October 31, 2014 |
| (000’s Omitted) |
| Shares or Principal Amount ╬ | Market Value ╪ | |||||||
| Corporate Bonds - 87.7% - (continued) | ||||||||
| Mining - 3.4% - (continued) | ||||||||
| Steel Dynamics, Inc. | ||||||||
| $ | 1,000 | 5.13%, 10/01/2021 ■ | $ | 1,035 | ||||
| 1,095 | 5.50%, 10/01/2024 ■ | 1,158 | ||||||
| 14,289 | ||||||||
| Miscellaneous Manufacturing - 0.5% | ||||||||
| DigitalGlobe, Inc. | ||||||||
| 2,190 | 5.25%, 02/01/2021 ■ | 2,130 | ||||||
| Motor Vehicle and Parts Manufacturing - 2.0% | ||||||||
| Chrysler Group LLC | ||||||||
| 690 | 8.00%, 06/15/2019 | 739 | ||||||
| 3,745 | 8.25%, 06/15/2021 | 4,185 | ||||||
| General Motors Co. | ||||||||
| 2,315 | 4.88%, 10/02/2023 | 2,480 | ||||||
| 820 | 6.25%, 10/02/2043 | 976 | ||||||
| 8,380 | ||||||||
| Nonmetallic Mineral Product Manufacturing - 1.9% | ||||||||
| Ardagh Finance Holdings S.A. | ||||||||
| 1,200 | 8.63%, 06/15/2019 ■ | 1,227 | ||||||
| Ardagh Packaging Finance plc | ||||||||
| 685 | 6.00%, 06/30/2021 ■ | 676 | ||||||
| 1,767 | 9.13%, 10/15/2020 ■ | 1,904 | ||||||
| Cemex Finance LLC | ||||||||
| 2,240 | 6.00%, 04/01/2024 ■ | 2,284 | ||||||
| Cemex S.A.B. de C.V. | ||||||||
| 1,995 | 5.70%, 01/11/2025 ■ | 1,954 | ||||||
| 8,045 | ||||||||
| Other Services - 1.5% | ||||||||
| Abengoa Finance | ||||||||
| EUR | 1,150 | 6.00%, 03/31/2021 § | 1,401 | |||||
| EUR | 745 | 6.00%, 03/31/2021 ■ | 908 | |||||
| 2,125 | 7.75%, 02/01/2020 ■ | 2,221 | ||||||
| Abengoa Greenfield S.A. | ||||||||
| 1,685 | 6.50%, 10/01/2019 ■ | 1,689 | ||||||
| 6,219 | ||||||||
| Petroleum and Coal Products Manufacturing - 5.3% | ||||||||
| Antero Resources Corp. | ||||||||
| 470 | 5.38%, 11/01/2021 | 477 | ||||||
| Antero Resources Finance Corp. | ||||||||
| 2,510 | 6.00%, 12/01/2020 | 2,610 | ||||||
| Bonanza Creek Energy, Inc. | ||||||||
| 2,395 | 6.75%, 04/15/2021 | 2,401 | ||||||
| Cobalt International Energy, Inc. | ||||||||
| 1,645 | 2.63%, 12/01/2019 β | 1,222 | ||||||
| Concho Resources, Inc. | ||||||||
| 925 | 5.50%, 10/01/2022 | 976 | ||||||
| Diamondback Energy, Inc. | ||||||||
| 2,215 | 7.63%, 10/01/2021 | 2,353 | ||||||
| Everest Acquisition LLC | ||||||||
| 1,800 | 9.38%, 05/01/2020 | 1,967 | ||||||
| Harvest Operations Corp. | ||||||||
| 1,010 | 6.88%, 10/01/2017 | 1,030 | ||||||
| Range Resources Corp. | ||||||||
| 455 | 5.00%, 08/15/2022 | 477 | ||||||
| Rosetta Resources, Inc. | ||||||||
| 1,590 | 5.63%, 05/01/2021 | 1,542 | ||||||
| 1,120 | 5.88%, 06/01/2022 | 1,075 | ||||||
| Tullow Oil plc | ||||||||
| 2,270 | 6.00%, 11/01/2020 ■ | 2,123 | ||||||
| 2,030 | 6.25%, 04/15/2022 ■ | 1,888 | ||||||
| WPX Energy, Inc. | ||||||||
| 1,380 | 5.25%, 09/15/2024 ☼ | 1,346 | ||||||
| 920 | 6.00%, 01/15/2022 | 964 | ||||||
| 22,451 | ||||||||
| Pipeline Transportation - 0.7% | ||||||||
| El Paso Corp. | ||||||||
| 595 | 7.00%, 06/15/2017 | 662 | ||||||
| Energy Transfer Equity L.P. | ||||||||
| 1,757 | 7.50%, 10/15/2020 | 2,021 | ||||||
| Kinder Morgan Finance Co. | ||||||||
| 240 | 6.00%, 01/15/2018 ■ | 263 | ||||||
| 2,946 | ||||||||
| Plastics and Rubber Products Manufacturing - 0.7% | ||||||||
| Associated Materials LLC | ||||||||
| 930 | 9.13%, 11/01/2017 | 909 | ||||||
| Nortek, Inc. | ||||||||
| 1,825 | 8.50%, 04/15/2021 | 1,962 | ||||||
| 2,871 | ||||||||
| Primary Metal Manufacturing - 1.1% | ||||||||
| ArcelorMittal | ||||||||
| 210 | 7.25%, 03/01/2041 | 217 | ||||||
| 1,175 | 7.50%, 10/15/2039 | 1,254 | ||||||
| Constellium N.V. | ||||||||
| 475 | 5.75%, 05/15/2024 ■ | 470 | ||||||
| United States Steel Corp. | ||||||||
| 2,526 | 7.38%, 04/01/2020 | 2,829 | ||||||
| 4,770 | ||||||||
| Printing and Related Support Activities - 1.1% | ||||||||
| Quad Graphics, Inc. | ||||||||
| 3,265 | 7.00%, 05/01/2022 ■ | 3,135 | ||||||
| Quebecor Media, Inc. | ||||||||
| 1,540 | 5.75%, 01/15/2023 | 1,586 | ||||||
| 4,721 | ||||||||
| Professional, Scientific and Technical Services - 1.5% | ||||||||
| Getty Images, Inc. | ||||||||
| 3,115 | 7.00%, 10/15/2020 ■ | 2,398 | ||||||
| SunGard Data Systems, Inc. | ||||||||
| 3,190 | 6.63%, 11/01/2019 | 3,302 | ||||||
| 783 | 7.38%, 11/15/2018 | 816 | ||||||
| 6,516 | ||||||||
| Real Estate, Rental and Leasing - 1.9% | ||||||||
| International Lease Finance Corp. | ||||||||
| 7,415 | 5.88%, 04/01/2019 - 08/15/2022 | 8,011 | ||||||
| 8,011 | ||||||||
| Retail Trade - 4.1% | ||||||||
| 99 Cents Only Stores | ||||||||
| 2,010 | 11.00%, 12/15/2019 | 2,176 | ||||||
| Albertson's Holdings LLC | ||||||||
| 2,000 | 7.75%, 10/15/2022 ■ | 1,970 | ||||||
| Building Materials Corp. | ||||||||
| 4,050 | 5.38%, 11/15/2024 ■☼ | 4,060 | ||||||
| GRD Holding III Corp. | ||||||||
| 2,210 | 10.75%, 06/01/2019 ■ | 2,439 | ||||||
| Michaels Stores, Inc. | ||||||||
| 2,240 | 5.88%, 12/15/2020 ■ | 2,268 | ||||||
| Party City Holdings, Inc. | ||||||||
| 1,755 | 8.88%, 08/01/2020 | 1,904 | ||||||
The accompanying notes are an integral part of these financial statements.
| 7 |
| The Hartford High Yield Fund |
| Schedule of Investments – (continued) |
| October 31, 2014 |
| (000’s Omitted) |
| Shares or Principal Amount ╬ | Market Value ╪ | |||||||
| Corporate Bonds - 87.7% - (continued) | ||||||||
| Retail Trade - 4.1% - (continued) | ||||||||
| PC Nextco Holdings LLC/PC Nextco Finance, Inc. | ||||||||
| $ | 2,585 | 8.75%, 08/15/2019 | $ | 2,624 | ||||
| 17,441 | ||||||||
| Soap, Cleaning Compound and Toilet Manufacturing - 0.5% | ||||||||
| Sun Products Corp. | ||||||||
| 2,760 | 7.75%, 03/15/2021 ■ | 2,042 | ||||||
| Utilities - 1.4% | ||||||||
| Dolphin Subsidiary II, Inc. | ||||||||
| 3,575 | 7.25%, 10/15/2021 | 3,798 | ||||||
| GenOn Americas Generation LLC | ||||||||
| 1,100 | 9.13%, 05/01/2031 | 1,029 | ||||||
| Texas Competitive Electric Holdings Co. LLC | ||||||||
| 1,460 | 11.50%, 10/01/2020 ■Ϫ | 1,172 | ||||||
| 5,999 | ||||||||
| Wholesale Trade - 0.3% | ||||||||
| Dynegy, Inc. | ||||||||
| 755 | 5.88%, 06/01/2023 | 740 | ||||||
| 485 | 7.38%, 11/01/2022 ■ | 513 | ||||||
| 235 | 7.63%, 11/01/2024 ■ | 249 | ||||||
| 1,502 | ||||||||
| Total Corporate Bonds | ||||||||
| (Cost $367,521) | $ | 371,555 | ||||||
| Senior Floating Rate Interests ♦ - 3.1% | ||||||||
| Finance and Insurance - 0.2% | ||||||||
| Asurion LLC | ||||||||
| $ | 830 | 8.50%, 03/03/2021 | $ | 842 | ||||
| Mining - 0.5% | ||||||||
| Arch Coal, Inc. | ||||||||
| 2,418 | 6.25%, 05/16/2018 | 2,131 | ||||||
| Other Services - 0.6% | ||||||||
| Gardner Denver, Inc. | ||||||||
| 2,589 | 4.25%, 07/30/2020 | 2,551 | ||||||
| Retail Trade - 0.9% | ||||||||
| Lands' End, Inc. | ||||||||
| 2,152 | 4.25%, 04/04/2021 | 2,100 | ||||||
| Neiman Marcus (The) Group, Inc. | ||||||||
| 1,981 | 4.25%, 10/25/2020 | 1,953 | ||||||
| 4,053 | ||||||||
| Utilities - 0.9% | ||||||||
| Texas Competitive Electric Holdings Co. LLC | ||||||||
| 5,000 | 4.65%, 10/10/2017 Ψ | 3,636 | ||||||
| Total Senior Floating Rate Interests | ||||||||
| (Cost $13,407) | $ | 13,213 | ||||||
| Common Stocks - 0.1% | ||||||||
| Energy - 0.1% | ||||||||
| 104,555 | KCA Deutag ⌂●† | $ | 511 | |||||
| Total Common Stocks | ||||||||
| (Cost $1,417) | $ | 511 | ||||||
| Preferred Stocks - 1.3% | ||||||||
| Diversified Financials - 0.9% | ||||||||
| – | Citigroup Capital XIII | $ | 3 | |||||
| 139 | GMAC Capital Trust I β | 3,705 | ||||||
| 3,708 | ||||||||
| Telecommunication Services - 0.4% | ||||||||
| 29 | Intelsat S.A., 5.75% β | 1,479 | ||||||
| Total Preferred Stocks | ||||||||
| (Cost $4,780) | $ | 5,187 | ||||||
| Total Long-Term Investments | ||||||||
| (Cost $388,041) | $ | 390,466 | ||||||
| Short-Term Investments - 6.2% | ||||||||
| Repurchase Agreements - 6.2% | ||||||||
| Bank
of America Merrill Lynch TriParty Repurchase Agreement (maturing on 11/03/2014 in the amount of $75, collateralized by U.S. Treasury Note 1.50%, 2019, value of $76) | ||||||||
| $ | 75 | 0.08%, 10/31/2014 | $ | 75 | ||||
| Bank
of America Merrill Lynch TriParty Repurchase Agreement (maturing on 11/03/2014 in the amount of $1,274, collateralized by GNMA 1.63% - 7.00%, 2031 - 2054, value of $1,300) | ||||||||
| 1,274 | 0.09%, 10/31/2014 | 1,274 | ||||||
| Bank
of Montreal TriParty Repurchase Agreement (maturing on 11/03/2014 in the amount of $342, collateralized by U.S. Treasury Bond 2.88% - 5.25%, 2029 - 2043, U.S. Treasury Note 0.38% - 4.50%, 2015 - 2022, value of $349) | ||||||||
| 342 | 0.08%, 10/31/2014 | 342 | ||||||
| Bank
of Montreal TriParty Repurchase Agreement (maturing on 11/03/2014 in the amount of $1,160, collateralized by FHLMC 2.00% - 5.50%, 2022 - 2034, FNMA 2.00% - 4.50%, 2024 - 2039, GNMA 3.00%, 2043, U.S. Treasury Note 4.63%, 2017, value of $1,184) | ||||||||
| 1,160 | 0.10%, 10/31/2014 | 1,160 | ||||||
| Barclays
Capital TriParty Repurchase Agreement (maturing on 11/03/2014 in the amount of $4,373, collateralized by U.S. Treasury Bond 4.50% - 6.25%, 2023 - 2036, U.S. Treasury Note 1.63% - 2.13%, 2015 - 2019, value of $4,460) | ||||||||
| 4,373 | 0.08%, 10/31/2014 | 4,373 | ||||||
| Citigroup
Global Markets, Inc. TriParty Repurchase Agreement (maturing on 11/03/2014 in the amount of $5,026, collateralized by U.S. Treasury Bill 0.02%, 2015, U.S. Treasury Bond 3.88% - 11.25%, 2015 - 2040, U.S. Treasury Note 2.00% - 3.38%, 2019 - 2021, value of $5,126) | ||||||||
| 5,026 | 0.09%, 10/31/2014 | 5,026 | ||||||
The accompanying notes are an integral part of these financial statements.
| 8 |
| The Hartford High Yield Fund |
| Schedule of Investments – (continued) |
| October 31, 2014 |
| (000’s Omitted) |
| Shares or Principal Amount ╬ | Market Value ╪ | |||||||
| Short-Term Investments - 6.2% - (continued) | ||||||||
| Repurchase Agreements - 6.2% - (continued) | ||||||||
| Deutsche
Bank Securities TriParty Repurchase Agreement (maturing on 11/03/2014 in the amount of $290, collateralized by U.S. Treasury Note 0.88%, 2017, value of $296) | ||||||||
| $ | 290 | 0.13%, 10/31/2014 | $ | 290 | ||||
| RBS
Securities, Inc. TriParty Repurchase Agreement (maturing on 11/03/2014 in the amount of $427, collateralized by U.S. Treasury Bond 3.63% - 5.00%, 2037 - 2043, U.S. Treasury Note 2.13%, 2020, value of $436) | ||||||||
| 427 | 0.07%, 10/31/2014 | 427 | ||||||
| Societe
Generale TriParty Repurchase Agreement (maturing on 11/03/2014 in the amount of $4,499, collateralized by U.S. Treasury Bill 0.02%, 2015, U.S. Treasury Bond 3.75% - 11.25%, 2015 - 2043, U.S. Treasury Note 1.38% - 4.25%, 2015 - 2022, value of $4,589) | ||||||||
| 4,499 | 0.08%, 10/31/2014 | 4,499 | ||||||
| TD
Securities TriParty Repurchase Agreement (maturing on 11/03/2014 in the amount of $8,718, collateralized by FHLMC 3.00% - 4.00%, 2026 - 2044, FNMA 2.50% - 5.00%, 2025 - 2044, U.S. Treasury Bond 3.50% - 6.50%, 2026 - 2041, U.S. Treasury Note 1.75% - 2.88%, 2018 - 2019, value of $8,893) | ||||||||
| 8,718 | 0.10%, 10/31/2014 | 8,718 | ||||||
| 26,184 | ||||||||
| Total Short-Term Investments | ||||||||
| (Cost $26,184) | $ | 26,184 | ||||||
| Total Investments | ||||||||||||
| (Cost $414,225) ▲ | 98.4 | % | $ | 416,650 | ||||||||
| Other Assets and Liabilities | 1.6 | % | 6,924 | |||||||||
| Total Net Assets | 100.0 | % | $ | 423,574 |
The accompanying notes are an integral part of these financial statements.
| 9 |
| The Hartford High Yield Fund |
| Schedule of Investments – (continued) |
| October 31, 2014 |
| (000’s Omitted) |
| Note: | Percentage of investments as shown is the ratio of the total market value to total net assets. |
The Fund may refer to any one or more of the industry classifications used by one or more widely recognized market indices, ratings group indices and/or as defined by Fund management. Industry classifications may not be identical across all security types.
Equity industry classifications used in this report are the Global Industry Classification Standard, which was developed by and is the exclusive property and service mark of MSCI, Inc. and Standard & Poor’s.
For Fund compliance purposes, the Fund may not use the same classification system shown in this report as these classifications are used for reporting ease.
| ▲ | At October 31, 2014, the cost of securities for federal income tax purposes was $414,433 and the aggregate gross unrealized appreciation and depreciation based on that cost were: |
| Unrealized Appreciation | $ | 10,905 | ||
| Unrealized Depreciation | (8,688 | ) | ||
| Net Unrealized Appreciation | $ | 2,217 |
| ╬ | All principal amounts are in U.S. dollars unless otherwise indicated. |
| † | These securities are valued in good faith at fair value as determined under policies and procedures established by and under the supervision of the Board of Directors. At October 31, 2014, the aggregate fair value of these securities was $511, which represents 0.1% of total net assets. |
| ● | Non-income producing. For long-term debt securities, items identified are in default as to payment of interest and/or principal. |
| Ψ | The issuer is in bankruptcy. However, the investment held by the Fund is current with respect to interest payments. |
| Ϫ | The issuer is in bankruptcy. The investment held by the Fund has made partial interest payments. |
| Ω | Debt security in default due to bankruptcy. |
| Δ | Variable rate securities; the rate reported is the coupon rate in effect at October 31, 2014. |
| ♦ | Senior floating rate interests generally pay interest rates which are periodically adjusted by reference to a base short-term, floating lending rate plus a premium. The base lending rates are primarily the LIBOR, and secondarily the prime rate offered by one or more major United States banks (the "Prime Rate") and the certificate of deposit rate or other base lending rates used by commercial lenders. Senior floating rate interests often require prepayments from excess cash flows or permit the borrower to repay at its election. The rate at which the borrower repays cannot be predicted with accuracy. As a result, the actual remaining maturity may be substantially less than the stated maturities shown. Unless otherwise noted, the interest rate disclosed for these securities represents the average coupon as of October 31, 2014. |
| ■ | Securities issued within terms of a private placement memorandum, exempt from registration under Rule 144A under the Securities Act of 1933, as amended, and may be sold only to qualified institutional buyers. Unless otherwise indicated, these holdings are determined to be liquid. At October 31, 2014, the aggregate value of these securities was $171,899, which represents 40.6% of total net assets. |
| § | These securities were sold to the Fund under Regulation S, rules governing offers and sales made outside the United States without registration under the Securities Act of 1933, as amended. The Fund may only be able to resell these securities in the United States if an exemption from registration under the federal and state securities laws is available, or the Fund may only be able to sell these securities outside of the United States (such as on a foreign exchange) to a non-U.S. person. Unless otherwise indicated, these holdings are determined to be liquid. At October 31, 2014, the aggregate value of these securities was $9,530, which represents 2.2% of total net assets. |
| ⌂ | The following securities are considered illiquid. Illiquid securities are often purchased in private placement transactions, are often not registered under the Securities Act of 1933, as amended, and may have contractual restrictions on resale. A security may also be considered illiquid if the security lacks a readily available market or if its valuation has not changed for a certain period of time. |
| Period Acquired | Shares/ Par | Security | Cost Basis | |||||||
| 03/2011 | 104,555 | KCA Deutag | $ | 1,417 | ||||||
At October 31, 2014, the aggregate value of these securities was $511, which represents 0.1% of total net assets.
| β | Convertible security. |
| ♠ | Perpetual maturity security. Maturity date shown is the next call date or final legal maturity date, whichever comes first. |
| Þ | This security may pay interest in the form of additional principal in lieu of cash. |
The accompanying notes are an integral part of these financial statements.
| 10 |
| The Hartford High Yield Fund |
| Schedule of Investments – (continued) |
| October 31, 2014 |
| (000’s Omitted) |
| ☼ | This security, or a portion of this security, was purchased on a when-issued or delayed-delivery basis. The cost of these securities was $4,084 at October 31, 2014. |
| ‡ | This security, or a portion of this security, has been segregated to cover funding requirements on investment transactions settling in the future. |
Cash pledged and received as collateral in connection with derivatives at October 31, 2014:
| Pledged | Received | |||||||
| Centrally cleared swaps contracts | $ | 567 | $ | – | ||||
| Total | $ | 567 | $ | – | ||||
Centrally Cleared Credit Default Swap Contracts Outstanding at October 31, 2014
| Clearing | Notional | (Pay)/ Receive Fixed | Expiration | Market | Unrealized Appreciation/ (Depreciation) | Variation Margin | ||||||||||||||||||||||||||||||
| Reference Entity | House (a) | Amount (b) | Rate | Date | Cost Basis | Value ╪ | Asset | Liability | Asset | Liability | ||||||||||||||||||||||||||
| Credit default swaps on indices: | ||||||||||||||||||||||||||||||||||||
| Sell protection: | ||||||||||||||||||||||||||||||||||||
| CDX.NA.HY.22 | CME | USD | 8,425 | 5.00 | % | 06/20/19 | $ | 652 | $ | 631 | $ | – | $ | (21 | ) | $ | 28 | $ | – | |||||||||||||||||
| CDX.NA.HY.23 | CME | USD | 4,000 | 5.00 | % | 12/20/19 | 285 | 280 | – | (5 | ) | – | (5 | ) | ||||||||||||||||||||||
| Total | $ | 937 | $ | 911 | $ | – | $ | (26 | ) | $ | 28 | $ | (5 | ) | ||||||||||||||||||||||
| (a) | The FCM to the contracts is GSC. |
| (b) | The maximum potential amount the Fund could be required to pay as a seller of credit protection or receive as a buyer of credit protection if a credit event occurs as defined under the terms of that particular swap agreement. |
Foreign Currency Contracts Outstanding at October 31, 2014
| Unrealized Appreciation/(Depreciation) | ||||||||||||||||||||||
| Currency | Buy / Sell | Delivery Date | Counterparty | Contract Amount | Market Value ╪ | Asset | Liability | |||||||||||||||
| EUR | Sell | 11/28/2014 | JPM | $ | 9,820 | $ | 9,717 | $ | 103 | $ | – | |||||||||||
| ╪ | See Significant Accounting Policies of accompanying Notes to Financial Statements regarding valuation of securities. |
| GLOSSARY: (abbreviations used in preceding Schedule of Investments) |
| Counterparty Abbreviations: | |
| CME | Chicago Mercantile Exchange |
| FCM | Futures Commission Merchant |
| GSC | Goldman Sachs & Co. |
| JPM | JP Morgan Chase & Co. |
| Currency Abbreviations: | |
| EUR | EURO |
| USD | U.S. Dollar |
| Index Abbreviations: | |
| CDX.NA.HY | Credit Derivatives North American High Yield |
| Other Abbreviations: | |
| FHLMC | Federal Home Loan Mortgage Corp. |
| FNMA | Federal National Mortgage Association |
| GNMA | Government National Mortgage Association |
| LIBOR | London Interbank Offered Rate |
The accompanying notes are an integral part of these financial statements.
| 11 |
| The Hartford High Yield Fund |
| Schedule of Investments – (continued) |
| October 31, 2014 |
| (000’s Omitted) |
| Investment Valuation Hierarchy Level Summary |
| October 31, 2014 |
| Total | Level 1 ♦ | Level 2 ♦ | Level 3 | |||||||||||||
| Assets: | ||||||||||||||||
| Asset and Commercial Mortgage Backed Securities | $ | – | $ | – | $ | – | $ | – | ||||||||
| Common Stocks ‡ | 511 | – | – | 511 | ||||||||||||
| Corporate Bonds | 371,555 | – | 371,555 | – | ||||||||||||
| Preferred Stocks | 5,187 | 5,187 | – | – | ||||||||||||
| Senior Floating Rate Interests | 13,213 | – | 13,213 | – | ||||||||||||
| Short-Term Investments | 26,184 | – | 26,184 | – | ||||||||||||
| Total | $ | 416,650 | $ | 5,187 | $ | 410,952 | $ | 511 | ||||||||
| Foreign Currency Contracts * | $ | 103 | $ | – | $ | 103 | $ | – | ||||||||
| Total | $ | 103 | $ | – | $ | 103 | $ | – | ||||||||
| Liabilities: | ||||||||||||||||
| Swaps - Credit Default * | $ | 26 | $ | – | $ | 26 | $ | – | ||||||||
| Total | $ | 26 | $ | – | $ | 26 | $ | – | ||||||||
| ♦ | For the year ended October 31, 2014, investments valued at $1,224 were transferred from Level 2 to Level 1, and there were no transfers from Level 1 to Level 2. Investments are transferred between Level 1 and Level 2 for a variety of reasons including, but not limited to: |
| 1) | Foreign equities for which a fair value price is more representative of exit value than the local market close (transfer into Level 2). Foreign equities for which the local market close is more representative of exit value (transfer into Level 1). | |
| 2) | U.S. Treasury securities that no longer represent the most recent issue (transfer into Level 2). | |
| 3) | Equity investments with no observable trading but a bid or mean price is used (transfer into Level 2). Equity investments using observable quoted prices in an active market (transfer into Level 1). |
| ‡ | The Fund has all or primarily all of the equity securities categorized in a particular level. Refer to the Schedule of Investments for further industry breakout. |
| * | Derivative instruments (excluding purchased and written options, if applicable) are valued at the unrealized appreciation/depreciation on the investments. |
Following is a reconciliation of Level 3 assets for which significant unobservable inputs were used to determine fair value:
| Balance
as of October 31, 2013 | Realized Gain (Loss) | Change
in Unrealized Appreciation (Depreciation) | Net Amortization | Purchases | Sales | Transfers Into Level 3 | Transfers Out of Level 3 | Balance
as of October 31, 2014 | ||||||||||||||||||||||||||||
| Assets: | ||||||||||||||||||||||||||||||||||||
| Asset & Commercial Mortgage Backed Securities | $ | — | $ | — | $ | — | * | $ | — | $ | — | $ | — | $ | — | $ | — | $ | — | |||||||||||||||||
| Common Stocks | 725 | — | (214 | )† | — | — | — | — | — | 511 | ||||||||||||||||||||||||||
| Preferred Stocks | 64 | — | (64 | ) | — | — | — | — | — | — | ||||||||||||||||||||||||||
| Total | $ | 789 | $ | — | $ | (278 | ) | $ | — | $ | — | $ | — | $ | — | $ | — | $ | 511 | |||||||||||||||||
| * | Change in unrealized appreciation (depreciation) in the current period relating to assets still held at October 31, 2014 was zero. |
| † | Change in unrealized appreciation (depreciation) in the current period relating to assets still held at October 31, 2014 was $(214). |
| Note: | For purposes of reporting transfers between different hierarchy levels, both transfers in and out of each level, as applicable, are shown as if they occurred at the beginning of the period. |
The accompanying notes are an integral part of these financial statements.
| 12 |
| The Hartford High Yield Fund |
| Statement of Assets and Liabilities |
| October 31, 2014 |
| (000’s Omitted) |
| Assets: | ||||
| Investments in securities, at market value (cost $414,225) | $ | 416,650 | ||
| Cash | 4,032 | * | ||
| Unrealized appreciation on foreign currency contracts | 103 | |||
| Receivables: | ||||
| Investment securities sold | 339 | |||
| Fund shares sold | 1,866 | |||
| Dividends and interest | 6,192 | |||
| Variation margin on financial derivative instruments | 28 | |||
| Other assets | 181 | |||
| Total assets | 429,391 | |||
| Liabilities: | ||||
| Payables: | ||||
| Investment securities purchased | 5,162 | |||
| Fund shares redeemed | 389 | |||
| Investment management fees | 51 | |||
| Dividends | 86 | |||
| Administrative fees | — | |||
| Distribution fees | 31 | |||
| Variation margin on financial derivative instruments | 5 | |||
| Accrued expenses | 93 | |||
| Other liabilities | — | |||
| Total liabilities | 5,817 | |||
| Net assets | $ | 423,574 | ||
| Summary of Net Assets: | ||||
| Capital stock and paid-in-capital | $ | 440,074 | ||
| Undistributed net investment income | 150 | |||
| Accumulated net realized loss | (19,149 | ) | ||
| Unrealized appreciation of investments and the translation of assets and liabilities denominated in foreign currency | 2,499 | |||
| Net assets | $ | 423,574 | ||
| Shares authorized | 500,000 | |||
| Par value | $ | 0.001 | ||
| Class A: Net asset value per share/Maximum offering price per share | $7.68/$8.04 | |||
| Shares outstanding | 34,233 | |||
| Net assets | $ | 262,960 | ||
| Class B: Net asset value per share | $ | 7.64 | ||
| Shares outstanding | 744 | |||
| Net assets | $ | 5,683 | ||
| Class C: Net asset value per share | $ | 7.65 | ||
| Shares outstanding | 12,471 | |||
| Net assets | $ | 95,449 | ||
| Class I: Net asset value per share | $ | 7.72 | ||
| Shares outstanding | 6,051 | |||
| Net assets | $ | 46,691 | ||
| Class R3: Net asset value per share | $ | 7.68 | ||
| Shares outstanding | 324 | |||
| Net assets | $ | 2,487 | ||
| Class R4: Net asset value per share | $ | 7.68 | ||
| Shares outstanding | 178 | |||
| Net assets | $ | 1,367 | ||
| Class R5: Net asset value per share | $ | 7.68 | ||
| Shares outstanding | 68 | |||
| Net assets | $ | 522 | ||
| Class Y: Net asset value per share | $ | 7.67 | ||
| Shares outstanding | 1,097 | |||
| Net assets | $ | 8,415 |
* Cash of $567 was pledged as collateral for open financial derivative instruments at October 31, 2014.
The accompanying notes are an integral part of these financial statements.
| 13 |
| The Hartford High Yield Fund |
| Statement of Operations |
| For the Year Ended October 31, 2014 |
| (000’s Omitted) |
| Investment Income: | ||||
| Dividends | $ | 405 | ||
| Interest | 26,843 | |||
| Less: Foreign tax withheld | (4 | ) | ||
| Total investment income | 27,244 | |||
| Expenses: | ||||
| Investment management fees | 2,979 | |||
| Administrative services fees | ||||
| Class R3 | 5 | |||
| Class R4 | 2 | |||
| Class R5 | 1 | |||
| Transfer agent fees | ||||
| Class A | 458 | |||
| Class B | 20 | |||
| Class C | 98 | |||
| Class I | 44 | |||
| Class R3 | 1 | |||
| Class R4 | — | |||
| Class R5 | — | |||
| Class Y | — | |||
| Distribution fees | ||||
| Class A | 725 | |||
| Class B | 69 | |||
| Class C | 986 | |||
| Class R3 | 13 | |||
| Class R4 | 3 | |||
| Custodian fees | 8 | |||
| Accounting services fees | 92 | |||
| Registration and filing fees | 153 | |||
| Board of Directors' fees | 14 | |||
| Audit fees | 14 | |||
| Other expenses | 80 | |||
| Total expenses (before waivers and fees paid indirectly) | 5,765 | |||
| Expense waivers | (319 | ) | ||
| Custodian fee offset | — | |||
| Total waivers and fees paid indirectly | (319 | ) | ||
| Total expenses, net | 5,446 | |||
| Net Investment Income | 21,798 | |||
| Net Realized Gain on Investments, Other Financial Instruments and Foreign Currency Transactions: | ||||
| Net realized gain on investments | 9,579 | |||
| Net realized gain on swap contracts | 1,207 | |||
| Net realized gain on foreign currency contracts | 833 | |||
| Net realized gain on other foreign currency transactions | — | |||
| Net Realized Gain on Investments, Other Financial Instruments and Foreign Currency Transactions | 11,619 | |||
| Net Changes in Unrealized Depreciation of Investments, Other Financial Instruments and Foreign Currency Transactions: | ||||
| Net unrealized depreciation of investments | (9,424 | ) | ||
| Net unrealized depreciation of swap contracts | (800 | ) | ||
| Net unrealized appreciation of foreign currency contracts | 103 | |||
| Net unrealized depreciation of translation of other assets and liabilities in foreign currencies | (3 | ) | ||
| Net Changes in Unrealized Depreciation of Investments, Other Financial Instruments and Foreign Currency Transactions | (10,124 | ) | ||
| Net Gain on Investments, Other Financial Instruments and Foreign Currency Transactions | 1,495 | |||
| Net Increase in Net Assets Resulting from Operations | $ | 23,293 |
The accompanying notes are an integral part of these financial statements.
| 14 |
| The Hartford High Yield Fund |
| Statement of Changes in Net Assets |
| (000’s Omitted) |
| For
the Year Ended October 31, 2014 | For
the Year Ended October 31, 2013 | |||||||
| Operations: | ||||||||
| Net investment income | $ | 21,798 | $ | 27,781 | ||||
| Net realized gain on investments, other financial instruments and foreign currency transactions | 11,619 | 13,600 | ||||||
| Net unrealized depreciation of investments, other financial instruments and foreign currency transactions | (10,124 | ) | (4,761 | ) | ||||
| Net Increase in Net Assets Resulting from Operations | 23,293 | 36,620 | ||||||
| Distributions to Shareholders: | ||||||||
| From net investment income | ||||||||
| Class A | (14,416 | ) | (18,776 | ) | ||||
| Class B | (297 | ) | (461 | ) | ||||
| Class C | (4,186 | ) | (4,980 | ) | ||||
| Class I | (2,613 | ) | (3,077 | ) | ||||
| Class R3 | (123 | ) | (131 | ) | ||||
| Class R4 | (62 | ) | (98 | ) | ||||
| Class R5 | (27 | ) | (34 | ) | ||||
| Class Y | (456 | ) | (633 | ) | ||||
| Total distributions | (22,180 | ) | (28,190 | ) | ||||
| Capital Share Transactions: | ||||||||
| Class A | (33,843 | ) | (74,850 | ) | ||||
| Class B | (2,602 | ) | (2,918 | ) | ||||
| Class C | (9,940 | ) | 63 | |||||
| Class I | (18,355 | ) | (491 | ) | ||||
| Class R3 | (403 | ) | 899 | |||||
| Class R4 | 43 | 68 | ||||||
| Class R5 | (88 | ) | 175 | |||||
| Class Y | (210 | ) | (7,083 | ) | ||||
| Net decrease from capital share transactions | (65,398 | ) | (84,137 | ) | ||||
| Net Decrease in Net Assets | (64,285 | ) | (75,707 | ) | ||||
| Net Assets: | ||||||||
| Beginning of period | 487,859 | 563,566 | ||||||
| End of period | $ | 423,574 | $ | 487,859 | ||||
| Undistributed (distributions in excess of) net investment income | $ | 150 | $ | 495 | ||||
The accompanying notes are an integral part of these financial statements.
| 15 |
| The Hartford High Yield Fund |
| Notes to Financial Statements |
| October 31, 2014 |
| (000’s Omitted) |
Organization:
The Hartford Mutual Funds, Inc. (“Company”) is an open-end management investment company comprised of forty-two portfolios. Financial statements for The Hartford High Yield Fund (the "Fund"), a series of the Company, are included in this report.
The Company is organized under the laws of the State of Maryland and is registered with the Securities and Exchange Commission (“SEC”) under the Investment Company Act of 1940, as amended (“1940 Act”). The Fund is a diversified open-end management investment company. The Fund is an investment company and applies specialized accounting and reporting under Accounting Standards Codification Topic 946, Financial Services - Investment Companies.
Class A shares are sold with a front-end sales charge of up to 4.50%. Class B shares were sold with a contingent deferred sales charge which is assessed on the lesser of the per share net asset value (“NAV”) of the shares at the time of redemption or the original purchase price, and declines from up to 5.00% to zero depending on the period of time the shares are held (see note below regarding the closing of Class B shares). Class C shares are sold with a contingent deferred sales charge of up to 1.00% on shares redeemed within twelve months of purchase. Class I shares are sold without sales charges to certain eligible investors primarily through advisory fee-based wrap programs. Class R3, R4 and R5 shares, which are offered to employer-sponsored retirement plans, and Class Y shares, which are sold to certain eligible institutional investors, are sold without a sales charge. All classes of shares have identical voting, redemption, dividend, liquidation and other rights and the same terms and conditions, with the exceptions that each class may have different expenses, which may affect performance, and that Class B shares automatically convert to Class A shares after 8 years.
No new or additional investments are allowed in Class B shares of the Fund (including investments through any systematic investment plan). Existing shareholders of Class B shares may continue to hold their Class B shares, exchange their Class B shares for Class B shares of another Hartford Fund (as permitted by existing exchange privileges), or redeem their Class B shares as described in the Fund’s prospectus. Reinstatement privileges with respect to Class B shares are set forth in the Fund's prospectus. For investors electing to reinvest capital gains and dividends, any such capital gains or dividends on Class B shares will continue to be reinvested in Class B shares of the Fund. All Class B share attributes, including the 12b-1 fee, contingent deferred sales charge schedule, and conversion to Class A shares, remain unchanged.
Significant Accounting Policies:
The following is a summary of significant accounting policies of the Fund in the preparation of its financial statements, which are in accordance with United States generally accepted accounting principles (“U.S. GAAP”). The preparation of financial statements in accordance with U.S. GAAP may require management to make estimates and assumptions that affect the reported amounts of assets and liabilities and disclosure of contingent assets and liabilities at the date of the financial statements and the reported amounts of increases and decreases in net assets from operations during the reporting period. Actual results could differ from those estimates.
Determination of Net Asset Value – The NAV of each class of the Fund's shares is determined as of the close of regular trading (normally 4:00 p.m. Eastern Time) (the “NYSE Close”) on each day that the New York Stock Exchange (the “Exchange”) is open (“Valuation Date”). Information that becomes known to the Fund after the NAV has been calculated on a particular day will not generally be used to retroactively adjust the NAV determined earlier that day.
Investment Valuation and Fair Value Measurements – For purposes of calculating the NAV, portfolio investments and other assets held by the Fund's portfolio for which market quotes are readily available are valued at market value. Market value is generally determined on the basis of last reported sales prices or official close price. If no sales are reported, market value is based on quotes obtained from a quotation reporting system, established market makers, or independent pricing services. If market prices are not readily available or are deemed unreliable, the Fund will use the fair value of the investment as determined in good faith under policies and procedures established by and under the supervision of the Company's Board of Directors. Market quotes are considered not readily available where there is an absence of current or reliable market-based data (e.g., trade information or indicative market quotes), including where events occur after the close of the relevant market, but prior to the NYSE Close, that materially affect the values of the Fund's portfolio investments or assets. In addition, market quotes are considered not readily available when, due to extraordinary circumstances, the exchanges or markets on which the investments trade do not open for trading for the entire day and
| 16 |
| The Hartford High Yield Fund |
| Notes to Financial Statements – (continued) |
| October 31, 2014 |
| (000’s Omitted) |
no other market prices are available. There can be no assurance that the Fund could obtain the fair market value assigned to an investment if the Fund were to sell the investment at approximately the time at which the Fund determines its NAV.
Fixed income investments (other than short-term obligations), non-exchange traded derivatives and centrally cleared swaps held by the Fund are normally valued on the basis of quotes obtained from independent pricing services or brokers and dealers in accordance with procedures established by the Company's Board of Directors. Prices obtained from independent pricing services use information provided by market makers or estimates of market values through accepted market modeling, trading and pricing conventions. Inputs to the models may include, but are not limited to, prepayment speeds, pricing spread, yield, trade information, dealer quotes, market color, cash flow models and the investment’s terms and conditions. Generally, the Fund may use fair valuation in regard to fixed income investments when the Fund holds defaulted or distressed investments or investments in a company in which a reorganization is pending. Senior floating rate interests generally trade in over-the-counter (“OTC”) markets and are priced through an independent pricing service utilizing independent market quotations from loan dealers or financial institutions. A composite bid price is used, which is an average of the dealer marks and dealer runs. Short-term investments maturing in 60 days or less are generally valued at amortized cost, if their original term to maturity was 60 days or less, or by amortizing their value on the 61st day prior to maturity, if the original term to maturity exceeded 60 days, which approximates fair value.
Investments valued in currencies other than U.S. dollars are converted to U.S. dollars using exchange rates obtained from independent pricing services for calculation of the NAV. As a result, the NAV of the Fund’s shares may be affected by changes in the value of currencies in relation to the U.S. dollar. The value of investments traded in markets outside the United States or denominated in currencies other than the U.S. dollar may be affected significantly on a day that the NYSE is closed and the market value may change on days when an investor is not able to purchase, redeem or exchange shares of the Fund.
Foreign currency contracts represent agreements to exchange currencies on specific future dates at predetermined rates. Foreign currency contracts are valued using foreign currency exchange rates and forward rates as provided by an independent pricing service on the Valuation Date.
Financial instruments for which prices are not available from an independent pricing service may be valued using market quotations obtained from one or more dealers that make markets in the respective financial instrument in accordance with procedures established by the Company's Board of Directors.
U.S. GAAP defines fair value as the price that the Fund would receive to sell an asset or pay to transfer a liability in an orderly transaction between market participants. The U.S. GAAP fair value measurement standards require disclosure of a fair value hierarchy for each major category of assets and liabilities. Various inputs are used in determining the fair value of the Fund’s investments. These inputs are summarized into three broad hierarchy levels. This hierarchy is based on whether the valuation inputs are observable or unobservable. These levels are:
Level 1 – Quoted prices in active markets for identical investments. Level 1 may include exchange traded instruments, such as domestic equities, some foreign equities, options, futures, mutual funds, exchange traded funds, rights and warrants.
Level 2 – Observable inputs other than Level 1 prices, such as quoted prices for similar investments; quoted prices in markets that are not active; or other inputs that are observable or can be corroborated by observable market data. Level 2 may include debt investments that are traded less frequently than exchange traded instruments and which are valued using independent pricing services; foreign equities, which are principally traded on certain foreign markets and are adjusted daily pursuant to a fair value pricing service in order to reflect an adjustment for the factors occurring after the close of certain foreign markets but before the NYSE Close; senior floating rate interests, which are valued using an aggregate of dealer bids; short-term investments, which are valued at amortized cost; and swaps, which are valued based upon the terms of each swap contract.
Level 3 – Significant unobservable inputs that are supported by limited or no market activity. Level 3 may include financial instruments whose values are determined using indicative market quotes or require significant management judgment or estimation. These unobservable valuation inputs may include estimates for current yields, maturity/duration, prepayment speed, and indicative market quotes for comparable investments along with other assumptions relating to credit quality, collateral value, complexity of the investment structure, general market conditions and liquidity. This category may include investments where
| 17 |
| The Hartford High Yield Fund |
| Notes to Financial Statements – (continued) |
| October 31, 2014 |
| (000’s Omitted) |
trading has been halted or there are certain restrictions on trading. While these investments are priced using unobservable inputs, the valuation of these investments reflects the best available data and management believes the prices are a reasonable representation of exit price.
The Board of Directors of the Company generally reviews and approves the “Procedures for Valuation of Portfolio Securities” at least once a year. These procedures define how investments are to be valued, including the formation and activities of a Valuation Committee. The Valuation Committee is responsible for determining in good faith the fair value of investments when the value cannot be obtained from primary pricing services or alternative sources or if the valuation of an investment as provided by the primary pricing service or alternative source is believed not to reflect the investment’s fair value as of the Valuation Date. Voting members of the Valuation Committee include the Fund's Treasurer or designee and a Vice President of the investment manager or designee. An Assistant Vice President of the Fund with legal expertise or designee is also included on the Valuation Committee as a non-voting advisory member. In addition, the Fund’s Chief Compliance Officer shall designate a member of the compliance group to attend Valuation Committee meetings as a non-voting resource, to monitor for and provide guidance with respect to compliance with these procedures. Two members of the Valuation Committee or their designees, representing different departments, shall constitute a quorum for purposes of permitting the Valuation Committee to take action. The Valuation Committee will consider all relevant factors in determining an investment’s fair value, and may seek the advice of the Fund’s sub-adviser, knowledgeable brokers, and legal counsel in making such determination. The Valuation Committee reports to the Audit Committee of the Company's Board of Directors. The Audit Committee receives quarterly written reports which include details of all fair-valued investments, including the reason for the fair valuation, and an indication, when possible, of the accuracy of the valuation by disclosing the next available reliable public price quotation or the disposition price of such investments (the “look-back” test). The Board of Directors then must consider for ratification all of the fair value determinations made during the previous quarter.
Valuation levels are not necessarily indicative of the risk associated with investing in such investments. Individual investments within any of the above mentioned asset classes may be assigned a different hierarchical level than those presented above, as individual circumstances dictate.
For additional information, refer to the Investment Valuation Hierarchy Level Summary and the Level 3 roll-forward reconciliation, if applicable, which follow the Schedule of Investments.
Investment Transactions and Investment Income – Investment transactions are recorded as of the trade date (the date the order to buy or sell is executed) for financial reporting purposes. Investments purchased or sold on a when-issued or delayed-delivery basis may be settled a month or more after the trade date. Realized gains and losses are determined on the basis of identified cost.
Trade date for senior floating rate interests purchased in the primary loan market is considered the date on which the loan allocations are determined. Trade date for senior floating rate interests purchased in the secondary loan market is the date on which the transaction is entered into.
Dividend income from domestic securities is accrued on the ex-dividend date. Interest income, including amortization of premium, accretion of discounts and additional principal received in-kind in lieu of cash, is accrued on a daily basis. Paydown gains and losses on mortgage related and other asset backed securities are included in interest income in the Statement of Operations, as applicable.
Foreign Currency Transactions – Assets and liabilities denominated in currencies other than U.S. dollars are translated into U.S. dollars at the exchange rates in effect on the valuation date. Purchases and sales of investments, income and expenses are translated into U.S. dollars at the exchange rates on the dates of such transactions.
The Fund does not isolate that portion of portfolio investment valuation resulting from fluctuations in the foreign currency exchange rates from the fluctuations arising from changes in the market prices of investments held. Exchange rate fluctuations are included with the net realized and unrealized gain or loss on investments in the accompanying financial statements.
Net realized foreign exchange gains or losses arise from sales of foreign currencies and the difference between asset and liability amounts initially stated in foreign currencies and the U.S. dollar value of the amounts actually received or paid. Net unrealized foreign
| 18 |
| The Hartford High Yield Fund |
| Notes to Financial Statements – (continued) |
| October 31, 2014 |
| (000’s Omitted) |
exchange gains or losses arise from changes in the value of other assets and liabilities at the end of the reporting period, resulting from changes in the exchange rates.
Joint Trading Account – The Fund may invest cash balances into a joint trading account that may be invested in one or more repurchase agreements.
Fund Share Valuation and Dividend Distributions to Shareholders – Orders for the Fund’s shares are executed in accordance with the investment instructions of the shareholders. The NAV of the Fund’s shares is determined as of the close of business on each business day of the Exchange. The NAV is determined separately for each class of shares of the Fund by dividing the Fund’s net assets attributable to that class by the number of shares of the class outstanding. Each class of shares offered by the Fund has equal rights as to assets and voting privileges (except that shareholders of a class have exclusive voting rights regarding any matter relating solely to that class of shares). Income and non-class specific expenses are allocated daily to each class on the basis of the relative net assets of the class. Realized and unrealized gains and losses are allocated daily based on the relative net assets of each class of shares of the Fund.
Orders for the purchase of the Fund’s shares received prior to the close of the Exchange on any day the Exchange is open for business are priced at the NAV determined as of the close of the Exchange. Orders received after the close of the Exchange, or on a day on which the Exchange and/or the Fund is not open for business, are priced at the next determined NAV.
Dividends are declared pursuant to a policy adopted by the Company's Board of Directors based upon the investment performance of the Fund. Normally, dividends from net investment income are declared daily and paid monthly. Dividends from realized gains, if any, are paid at least once a year.
Net investment income, dividends and distributions from net realized gains and capital are determined in accordance with federal income tax regulations, which may differ from U.S. GAAP with respect to character and timing (see Federal Income Taxes: Distributions and Components of Distributable Earnings and Reclassification of Capital Accounts).
Securities and Other Investments:
Repurchase Agreements – A repurchase agreement is an agreement by which a counterparty agrees to sell an investment and agrees to repurchase the investment sold from the buyer at a mutually agreed upon time and price. During the period of the repurchase agreement, the counterparty will deposit cash and or securities in a third party custodial account to serve as collateral. At the time the Fund enters into a repurchase agreement, the value of the underlying collateral, including accrued interest, will be equal to or exceed the value of the repurchase agreement. Repurchase agreements expose the Fund to counterparty risk - that is, the risk that the counterparty will not fulfill its obligations. To minimize counterparty risk, the investments that serve to collateralize the repurchase agreement are held by the Fund’s custodian in book entry or physical form in the custodial account of the Fund or in a third party custodial account. Repurchase agreements are valued at cost plus accrued interest, which approximates fair value. Repurchase agreements have master netting arrangements which allow the Fund to offset amounts owed to a counterparty with amounts owed by the counterparty, including any collateral. Upon an event of default under a master repurchase agreement, the non-defaulting party may close out all transactions traded under such agreement and net amounts owed under each transaction to one net amount payable by one party to the other. Absent an event of default, the master repurchase agreement does not result in an offset of reported amounts of assets and liabilities in the Statement of Assets and Liabilities across transactions between the Fund and the applicable counterparty. The Fund, as shown on the Schedule of Investments, had outstanding repurchase agreements and related collateral as of October 31, 2014.
Illiquid and Restricted Investments – The Fund is permitted to invest up to 15% of its net assets in illiquid investments. Illiquid investments are those that may not be sold or disposed of in the ordinary course of business within seven days, at approximately the price used to determine the Fund’s NAV. The Fund may not be able to sell illiquid investments when its sub-adviser considers it desirable to do so or may have to sell such investments at a price that is lower than the price that could be obtained if the investments were more liquid. A sale of illiquid investments may require more time and may result in higher dealer discounts and other selling expenses than does the sale of those that are liquid. Illiquid investments also may be more difficult to value due to the unavailability of reliable market quotations for such investments, and an investment in them may have an adverse impact on the Fund’s NAV. The
| 19 |
| The Hartford High Yield Fund |
| Notes to Financial Statements – (continued) |
| October 31, 2014 |
| (000’s Omitted) |
Fund may also purchase certain restricted investments that can only be resold to certain qualified investors and may be determined to be liquid pursuant to policies and guidelines established by the Company's Board of Directors. The Fund, as shown on the Schedule of Investments, had illiquid or restricted investments as of October 31, 2014.
Investments Purchased on a When-Issued or Delayed-Delivery Basis – Delivery and payment for investments that have been purchased by the Fund on a forward commitment, or when-issued or delayed-delivery basis, take place beyond the customary settlement period. The Fund may dispose of or renegotiate a delayed-delivery transaction after it is entered into, and may sell delayed-delivery investments before they are delivered, which may result in a realized gain or loss. During this period, such investments are subject to market fluctuations, and the Fund identifies investments segregated in its records with a value at least equal to the amount of the commitment. The Fund, as shown on the Schedule of Investments, had when-issued or delayed-delivery investments as of October 31, 2014.
Senior Floating Rate Interests – The Fund may invest in senior floating rate interests. Senior floating rate interests hold the most senior position in the capital structure of a business entity (the “Borrower”), are typically secured by specific collateral and have a claim on the assets and/or stock of the Borrower that is senior to the assets held by subordinated debtholders and stockholders of the Borrower. Senior floating rate interests are typically structured and administered by a financial institution that acts as the agent of the lenders participating in the senior floating rate interest. The Fund may invest in multiple series or tranches of a senior floating rate interest, which may have varying terms and carry different associated risks. The Fund may also enter into unfunded loan commitments, which are contractual obligations for future funding. Unfunded loan commitments may include revolving credit facilities, which may obligate the Fund to supply additional cash to the borrower on demand, representing a potential financial obligation by the Fund in the future. The Fund may receive a commitment fee based on the undrawn portion of the underlying line of credit portion of a senior floating rate interest. In certain circumstances, the Fund may receive various fees upon the restructure of a senior floating rate interest by a borrower. Fees earned/paid are recorded as a component of income or realized gain/loss in the Statement of Operations.
Senior floating rate interests are typically rated below-investment-grade, which suggests the risk of default is higher, and generally pay higher interest rates than investment-grade debt securities. A default could lead to non-payment of income or principal, which would result in a reduction of investment income to the Fund, and there can be no assurance that the liquidation of any collateral would satisfy the Borrower’s obligation in the event of non-payment of scheduled interest or principal payments, or that such collateral could be readily liquidated. The Fund, as shown on the Schedule of Investments, had senior floating rate interests as of October 31, 2014.
Mortgage Related and Other Asset Backed Securities – The Fund may invest in mortgage related and other asset backed securities. These securities include mortgage pass-through securities, collateralized mortgage obligations, commercial mortgage backed securities, stripped mortgage backed securities, asset backed securities, collateralized debt obligations and other securities that directly or indirectly represent a participation in, or are secured by and payable from, mortgage loans on real property. Mortgage related securities are created from pools of residential or commercial mortgage loans, including mortgage loans made by savings and loan institutions, mortgage bankers, commercial banks and other similar financial institutions. Asset backed securities are created from many types of assets, including auto loans, credit card receivables, home equity loans, and student loans. These securities provide a monthly payment that consists of both interest and principal payments. Interest payments may be determined by fixed or adjustable rates. The rate of pre-payments on underlying mortgages will affect the price and volatility of a mortgage related security, and may have the effect of shortening or extending the effective duration of the security relative to what was anticipated at the time of purchase. The timely payment of principal and interest of certain mortgage related securities is guaranteed by the full faith and credit of the United States Government. Mortgage related and other asset backed securities created and guaranteed by non-governmental issuers, including government-sponsored corporations, may be supported by various forms of insurance or guarantees, but there can be no assurance that the private insurers or guarantors can meet their obligations under the insurance policies or guarantee arrangements. The Fund, as shown on the Schedule of Investments, had outstanding mortgage related and other asset backed securities as of October 31, 2014.
Financial Derivative Instruments:
The following disclosures contain information on how and why the Fund uses derivative instruments, the credit-risk-related contingent features in certain derivative instruments and how derivative instruments affect the Fund’s financial position and results of operations. The
| 20 |
| The Hartford High Yield Fund |
| Notes to Financial Statements – (continued) |
| October 31, 2014 |
| (000’s Omitted) |
location and fair value amounts of these instruments on the Statement of Assets and Liabilities and the realized gains and losses and changes in unrealized gains and losses on the Statement of Operations, each categorized by type of derivative contract, are included in the following Additional Derivative Instrument Information footnote. The derivative instruments outstanding as of year-end are disclosed in the notes to the Schedule of Investments, if applicable. The amounts of realized gains and losses and changes in unrealized gains and losses on derivative instruments during the year are disclosed in the Statement of Operations.
Foreign Currency Contracts – The Fund may enter into foreign currency contracts that obligate the Fund to purchase or sell currencies at specified future dates. Foreign currency contracts are used to hedge the currency exposure associated with some or all of the Fund’s investments and/or as part of an investment strategy. Foreign currency contracts are marked to market daily and the change in value is recorded by the Fund as an unrealized gain or loss. The Fund will record a realized gain or loss when the foreign currency contract is settled.
Foreign currency contracts involve elements of market risk in excess of the amounts reflected in the Statement of Assets and Liabilities. In addition, risks may arise upon entering into these contracts from the potential inability of the counterparties to meet the terms of the contracts and from unanticipated movements in the value of the foreign currencies relative to the U.S. dollar. The Fund, as shown on the Schedule of Investments, had outstanding foreign currency contracts as of October 31, 2014.
Swap Contracts – The Fund may invest in swap contracts. Swap contracts are agreements to exchange or swap investment cash flows, assets, foreign currencies or market-linked returns at specified, future intervals. Swap contracts are either privately negotiated in the over-the-counter market (“OTC swaps”) or cleared in a central clearing house (“centrally cleared swaps”). The Fund may enter into credit default, total return, cross-currency, interest rate, inflation and other forms of swap contracts to manage its exposure to credit, currency, interest rate, commodity and inflation risk. Swap contracts are also used to gain exposure to certain markets. In connection with these contracts, investments or cash may be identified as collateral or margin in accordance with the terms of the respective swap contracts and/or master netting arrangement to provide assets of value and recourse in the event of default or bankruptcy/insolvency.
Swaps are valued based on custom valuations furnished by an independent pricing service. Swaps for which prices are not available from an independent pricing service are valued in accordance with procedures established by the Company's Board of Directors. Changes in market value, if any, are reflected as a component of net changes in unrealized appreciation or depreciation on the Statement of Operations. Daily changes in valuation of centrally cleared swaps, if any, are recorded as a receivable or payable for the change in value (“variation margin”) on the Statement of Assets and Liabilities. Realized gains or losses on centrally cleared swaps are recorded upon the termination of the swap. OTC swap payments received or paid at the beginning of the measurement period are reflected as such on the Statement of Assets and Liabilities and represent premiums paid or received upon entering into the swap contract to compensate for differences between the stated terms of the swap contract and prevailing market conditions (credit spreads, currency exchange rates, interest rates and other relevant factors). These upfront premiums are recorded as realized gains or losses on the Statement of Operations upon termination or maturity of the swap. A liquidation payment received or made at the termination or maturity of the swap is recorded as a realized gain or loss on the Statement of Operations. Net periodic payments received or paid by the Fund are included as part of realized gains or losses on the Statement of Operations.
Entering into these contracts involves, to varying degrees, elements of liquidation, counterparty, credit and market risk in excess of the amounts recognized on the Statement of Assets and Liabilities. Such risks involve the possibility that there will be no liquid market for these contracts, that the counterparty to the contracts may default on its obligation to perform or disagree as to the meaning of contractual terms in the contracts, and that there may be unfavorable changes in market conditions (credit spreads, currency exchange rates, interest rates and other relevant factors).
The Fund’s maximum risk of loss from counterparty risk for OTC swaps is the net value of the discounted cash flows to be received from the counterparty over the contract’s remaining life, and current market value, to the extent that amount is positive. The risk is mitigated by having a master netting arrangement between the Fund and the counterparty, which allows for the netting of payments made or received (although such amounts are presented on a gross basis within the Statement of Assets and Liabilities, as applicable) as well as the posting of collateral to the Fund to cover the Fund’s exposure to the counterparty. In a centrally cleared swap, while the Fund enters into an agreement with a clearing broker to execute contracts with a counterparty, the performance of the swap is guaranteed by the central clearinghouse, which reduces the Fund’s exposure to counterparty risk. The Fund is still exposed to
| 21 |
| The Hartford High Yield Fund |
| Notes to Financial Statements – (continued) |
| October 31, 2014 |
| (000’s Omitted) |
the counterparty risk through the clearing broker and clearinghouse. The clearinghouse attempts to minimize this risk to its participants through the use of mandatory margin requirements, daily cash settlements and other procedures. Likewise, the clearing broker reduces its risk through margin requirements and required segregation of customer balances.
Credit Default Swap Contracts – The credit default swap market allows the Fund to manage its exposure to the market or certain sectors of the market, to reduce its risk exposure to defaults of corporate and sovereign issuers, or to create exposure to corporate or sovereign issuers to which it is not otherwise exposed. Certain credit default swaps involve the exchange of a fixed rate premium for protection against the loss in value of an underlying investment or index in the event of a credit event, such as payment default or bankruptcy.
Under a credit default swap contract, one party acts as guarantor by receiving the fixed periodic payment in exchange for the commitment to purchase the underlying investment at par if the defined credit event occurs. Upon the occurrence of a defined credit event, the difference between the value of the reference obligation and the swap’s notional amount is recorded as realized gain or loss on swap transactions in the Statement of Operations. A “buyer” of credit protection agrees to pay a counterparty to assume the credit risk of an issuer upon the occurrence of certain events. The “seller” of the protection receives periodic payments and agrees to assume the credit risk of an issuer upon the occurrence of certain events. Although specified events are contract specific, credit events are generally defined as bankruptcy, failure to pay, restructuring, obligation acceleration, obligation default or repudiation/moratorium. A “seller’s” exposure is limited to the total notional amount of the credit default swap contract. These potential amounts would be partially offset by any recovery values of the respective referenced obligations or upfront payments received upon entering into the contract.
Implied credit spreads, represented in absolute terms, utilized in determining the market value of credit default swap contracts on corporate issues, sovereign government issues or U.S. municipal issues as of year-end are disclosed in the notes to the Schedule of Investments, as applicable, and serve as an indicator of the current status of the payment/performance risk and represent the likelihood or risk of default for the credit derivative. The implied credit spread of a particular referenced entity reflects the cost of buying/selling protection and there may also be upfront payments required to be made to enter into the contract. Wider credit spreads represent a deterioration of the referenced entity’s credit soundness and a greater likelihood or risk of default or other credit event occurring as defined under the terms of the contract. For credit default swap contracts on credit indices, the quoted market prices and resulting values serve as the indicator of the current status of the payment/performance risk. Increasing market values, in absolute terms when compared to the notional amount of the swap, represent a deterioration of the referenced equity’s credit soundness and a greater likelihood or risk of default or other credit event occurring as defined under the terms of the contract. The Fund, as shown on the Schedule of Investments, had outstanding credit default swap contracts as of October 31, 2014.
Additional Derivative Instrument Information:
Fair Value of Derivative Instruments on the Statement of Assets and Liabilities as of October 31, 2014:
| Risk Exposure Category | ||||||||||||||||||||||||||||
| Interest
Rate Contracts | Foreign Exchange Contracts | Credit Contracts | Equity Contracts | Commodity Contracts | Other Contracts | Total | ||||||||||||||||||||||
| Assets: | ||||||||||||||||||||||||||||
| Unrealized appreciation on foreign currency contracts | $ | — | $ | 103 | $ | — | $ | — | $ | — | $ | — | $ | 103 | ||||||||||||||
| Variation margin receivable * | — | — | 28 | — | — | — | 28 | |||||||||||||||||||||
| Total | $ | — | $ | 103 | $ | 28 | $ | — | $ | — | $ | — | $ | 131 | ||||||||||||||
| Liabilities: | ||||||||||||||||||||||||||||
| Variation margin payable * | $ | — | $ | — | $ | 5 | $ | — | $ | — | $ | — | $ | 5 | ||||||||||||||
| Total | $ | — | $ | — | $ | 5 | $ | — | $ | — | $ | — | $ | 5 | ||||||||||||||
* Only current day's variation margin is reported within the Statement of Assets and Liabilities. The variation margin is included in the open centrally cleared swaps net cumulative depreciation of $(26) as reported in the Schedule of Investments.
The volume of derivatives that is presented in the Schedule of Investments is consistent with the derivative activity during the year ended October 31, 2014.
| 22 |
| The Hartford High Yield Fund |
| Notes to Financial Statements – (continued) |
| October 31, 2014 |
| (000’s Omitted) |
The Effect of Derivative Instruments on the Statement of Operations for the year ended October 31, 2014:
| Risk Exposure Category | ||||||||||||||||||||||||||||
| Interest Rate Contracts | Foreign Exchange Contracts | Credit Contracts | Equity Contracts | Commodity Contracts | Other Contracts | Total | ||||||||||||||||||||||
| Realized Gain on Derivatives Recognized as a Result of Operations: | ||||||||||||||||||||||||||||
| Net realized gain on swap contracts | $ | — | $ | — | $ | 1,207 | $ | — | $ | — | $ | — | $ | 1,207 | ||||||||||||||
| Net realized gain on foreign currency contracts | — | 833 | — | — | — | — | 833 | |||||||||||||||||||||
| Total | $ | — | $ | 833 | $ | 1,207 | $ | — | $ | — | $ | — | $ | 2,040 | ||||||||||||||
| Net Change in Unrealized Appreciation (Depreciation) on Derivatives Recognized as a Result of Operations: | ||||||||||||||||||||||||||||
| Net change in unrealized depreciation of swap contracts | $ | — | $ | — | $ | (800 | ) | $ | — | $ | — | $ | — | $ | (800 | ) | ||||||||||||
| Net change in unrealized appreciation of foreign currency contracts | — | 103 | — | — | — | — | 103 | |||||||||||||||||||||
| Total | $ | — | $ | 103 | $ | (800 | ) | $ | — | $ | — | $ | — | $ | (697 | ) | ||||||||||||
Balance Sheet Offsetting Information - The following discloses both gross information and net information about instruments and transactions eligible for offset in the financial statements, and instruments and transactions that are subject to a master netting arrangement, as well as amounts related to margin, reflected as financial collateral (including cash collateral), held at clearing brokers, counterparties and the Fund’s custodian. The master netting arrangements allow the clearing brokers to net any collateral held in or on behalf of the Fund, or liabilities or payment obligations of the clearing brokers to the Fund, against any liabilities or payment obligations of the Fund to the clearing brokers. The Fund is required to deposit financial collateral (including cash collateral) at the Futures Commission Merchant's ("FCM") custodian on behalf of clearing brokers and counterparties to continually meet the original and maintenance requirements established by the clearing brokers and counterparties. Such requirements are specific to the respective clearing broker or counterparty. Certain master netting arrangements may not be enforceable in the bankruptcy proceedings of a counterparty.
Offsetting of Financial Assets and Derivative Assets as of October 31, 2014:
| Gross Amounts* of Assets Presented in Statement of Assets and Liabilities | Financial Instruments with Allowable Netting | Non-cash Collateral Received | Cash Collateral Received | Net Amount (not less than $0) | ||||||||||||||||
| Description | ||||||||||||||||||||
| Swap contracts - variation margin receivable | $ | 28 | $ | (5 | ) | $ | — | $ | — | $ | 23 | |||||||||
| Unrealized appreciation on foreign currency contracts | 103 | — | — | — | 103 | |||||||||||||||
| Total subject to a master netting or similar arrangement | $ | 131 | $ | (5 | ) | $ | — | $ | — | $ | 126 | |||||||||
* Gross amounts are presented here as there are no amounts that are netted within the Statement of Assets and Liabilities.
Offsetting of Financial Liabilities and Derivative Liabilities as of October 31, 2014:
| Gross Amounts* of Liabilities Presented in Statement of Assets and Liabilities | Financial Instruments with Allowable Netting | Non-cash Collateral Pledged | Cash Collateral Pledged | Net Amount (not less than $0) | ||||||||||||||||
| Description | ||||||||||||||||||||
| Swaps contracts - variation margin payable | $ | 5 | $ | (5 | ) | $ | — | $ | (567 | ) | $ | — | ||||||||
| Total subject to a master netting or similar arrangement | $ | 5 | $ | (5 | ) | $ | — | $ | (567 | ) | $ | — | ||||||||
* Gross amounts are presented here as there are no amounts that are netted within the Statement of Assets and Liabilities.
| 23 |
| The Hartford High Yield Fund |
| Notes to Financial Statements – (continued) |
| October 31, 2014 |
| (000’s Omitted) |
Principal Risks:
Credit risk depends largely on the perceived financial health of bond issuers. In general, the credit rating is inversely related to the credit risk of the issuer. Higher rated bonds generally are deemed to have less credit risk, while lower or unrated bonds are deemed to have higher risk of default. The share price, yield and total return of a fund that holds securities with higher credit risk may be more volatile than those of a fund that holds bonds with lower credit risk. Similar to credit risk, the Fund may be exposed to counterparty risk, or the risk that an institution or other entity with which the Fund has unsettled or open transactions will default.
The Fund’s investments expose the Fund to various risks including, but not limited to, interest rate, prepayment, extension, foreign currency and equity risks. Interest rate risk is the risk that fixed income securities will decline in value because of changes in interest rates. As nominal interest rates rise, the values of certain fixed income securities held by the Fund are likely to decrease. A nominal interest rate can be described as the sum of a real interest rate and an expected inflation rate. Fixed income securities with longer durations tend to be more sensitive to changes in interest rates, usually making them more volatile than securities with shorter durations. Duration is useful primarily as a measure of the sensitivity of a fixed income security’s market price to interest rate (i.e., yield) movements. Senior floating rate interests and securities subject to prepayment and extension risk generally offer less potential for gains when interest rates decline. Rising interest rates may cause prepayments to occur at a slower than expected rate, thereby effectively lengthening the maturity of the security and making the security more sensitive to interest rate changes. Prepayment and extension risk are major risks of mortgage backed securities, senior floating rate interests and certain asset backed securities. For certain asset backed securities, the actual maturity may be less than the stated maturity shown in the Schedule of Investments, if applicable. As a result, the timing of income recognition relating to these securities may vary based upon the actual maturity.
If the Fund invests directly in foreign currencies or in securities that trade in, and receive revenues in, foreign currencies, or in derivatives that provide exposure to foreign currencies, it will be subject to the risk that those currencies will decline in value relative to the base currency (U.S. dollars) of the Fund, or, in the case of hedging positions, that the Fund’s base currency will decline in value relative to the currency being hedged. Currency rates in foreign countries may fluctuate significantly over short periods of time for a number of reasons, including changes in interest rates, intervention (or the failure to intervene) by U.S. or foreign governments, central banks or supranational entities, such as the International Monetary Fund, or by the imposition of currency controls or other political developments in the United States or abroad. As a result, the Fund’s investments in foreign currency denominated securities may reduce the returns of the Fund. The market values of equity securities, such as common stocks and preferred stocks, or equity related investments, such as futures and options, may decline due to general market conditions which are not specifically related to a particular company, such as real or perceived adverse economic conditions, changes in the general outlook for corporate earnings, changes in interest or currency rates or adverse investor sentiment generally. The market value of equity securities may also decline due to factors which affect a particular industry or industries, such as labor shortages or increased production costs and competitive conditions within an industry. Equity securities and equity related investments generally have greater market price volatility than fixed income securities.
Federal Income Taxes:
Federal Income Taxes – For federal income tax purposes, the Fund intends to continue to qualify as a Regulated Investment Company ("RIC") under Subchapter M of the Internal Revenue Code (“IRC”) by distributing substantially all of its taxable net investment income and net realized capital gains to its shareholders and otherwise complying with the requirements of the IRC. The Fund has distributed substantially all of its income and capital gains in prior years, if applicable, and intends to distribute substantially all of its income and capital gains during the calendar year ending December 31, 2014. Accordingly, no provision for federal income or excise taxes has been made in the accompanying financial statements. Distributions from short-term capital gains are treated as ordinary income distributions for federal income tax purposes.
Net Investment Income (Loss), Net Realized Gains (Losses) and Distributions – Net investment income (loss) and net realized gains (losses) may differ for financial statement and tax purposes primarily because of losses deferred due to wash sale adjustments, foreign currency gains and losses, adjustments related to Passive Foreign Investment Companies ("PFICs"), Real Estate Investment Trusts ("REITs"), RICs, certain derivatives and partnerships. The character of distributions made during the year from net investment income or net realized gains may differ from their ultimate characterization for federal income tax purposes. Also, due to the timing of
| 24 |
| The Hartford High Yield Fund |
| Notes to Financial Statements – (continued) |
| October 31, 2014 |
| (000’s Omitted) |
dividend distributions, the fiscal year in which amounts are distributed may differ from the year that the income or realized gains (losses) were recorded by the Fund.
Distributions and Components of Distributable Earnings – The tax character of distributions paid by the Fund for the periods indicated is as follows (as adjusted for dividends payable, if applicable):
| For
the Year Ended October 31, 2014 | For
the Year Ended October 31, 2013 | |||||||
| Ordinary Income | $ | 22,188 | $ | 28,130 | ||||
As of October 31, 2014, the Fund’s components of distributable earnings (deficit) on a tax basis are as follows:
| Amount | ||||
| Undistributed Ordinary Income | $ | 362 | ||
| Accumulated Capital and Other Losses* | (18,838 | ) | ||
| Unrealized Appreciation† | 2,188 | |||
| Total Accumulated Deficit | $ | (16,288 | ) | |
| * | The Fund has capital loss carryforwards that are identified in the Capital Loss Carryforward note that follows. |
| † | Differences between book-basis and tax-basis unrealized appreciation (depreciation) may be attributable to the losses deferred due to wash sale adjustments, foreign currency gains and losses, adjustments related to PFICs, REITs, RICs, certain derivatives and partnerships. |
Reclassification of Capital Accounts – The Fund may record reclassifications in its capital accounts. These reclassifications have no impact on the total net assets of the Fund. The reclassifications are a result of permanent differences between U.S. GAAP and tax accounting for such items as foreign currency, PFICs, expiration or utilization of capital loss carryforwards or net operating losses. Adjustments are made to reflect the impact these items have on current and future distributions to shareholders. Therefore, the source of the Fund’s distributions may be shown in the accompanying Statement of Changes in Net Assets as from undistributed net investment income, from accumulated net realized gains on investments or from capital depending on the type of book and tax differences that exist. For the year ended October 31, 2014, the Fund recorded reclassifications to increase (decrease) the accounts listed below:
| Amount | ||||
| Undistributed Net Investment Income (Loss) | $ | 37 | ||
| Accumulated Net Realized Gain (Loss) | (37 | ) | ||
Capital Loss Carryforward – On December 22, 2010, the Regulated Investment Company Modernization Act of 2010 (the “Act”) was enacted, which made changes to the capital loss carryforward rules. The changes are effective for taxable years beginning after the date of enactment. Under the Act, funds are permitted to carry forward capital losses for an unlimited period. However, any losses incurred during those future taxable years will be required to be utilized prior to the losses incurred in pre-enactment taxable years, which carry an expiration date. As a result of this ordering rule, pre-enactment capital loss carryforwards may be more likely to expire unused. Additionally, post-enactment capital loss carryforwards retain their character as either short-term or long-term capital losses rather than being considered all short-term as permitted under prior regulation.
At October 31, 2014 (tax year end), the Fund had capital loss carryforwards for U.S. federal income tax purposes as follows:
| Year of Expiration | Amount | |||
| 2016 | $ | 734 | ||
| 2017 | 18,104 | |||
| Total | $ | 18,838 | ||
During the year ended October 31, 2014, the Fund utilized $11,429 of prior year capital loss carryforwards.
| 25 |
| The Hartford High Yield Fund |
| Notes to Financial Statements – (continued) |
| October 31, 2014 |
| (000’s Omitted) |
Accounting for Uncertainty in Income Taxes – The Fund has adopted financial reporting rules that require the Fund to analyze all open tax years, as defined by the statute of limitations, for all major jurisdictions. Generally, tax authorities can examine all tax returns filed for the last three years. The Fund does not have an examination in progress.
The Fund has reviewed all open tax years and major jurisdictions and concluded that these financial reporting rules had no effect on the Fund’s financial position or results of operations. There is no tax liability resulting from unrecognized tax benefits relating to uncertain income tax positions taken or expected to be taken on the tax return for the fiscal year ended October 31, 2014. The Fund is also not aware of any tax positions for which it is reasonably possible that the total amounts of unrecognized tax benefits will significantly change in the next twelve months.
Expenses:
Investment Management Agreement – Hartford Funds Management Company, LLC ("HFMC") serves as the Fund’s investment manager pursuant to an Investment Management Agreement with the Company. HFMC is an indirect wholly owned subsidiary of The Hartford Financial Services Group, Inc. ("The Hartford"). The investment manager has overall investment supervisory responsibility for the Fund. In addition, the investment manager provides administrative personnel, services, equipment, facilities and office space for proper operation of the Fund. HFMC has contracted with Wellington Management Company, LLP ("Wellington Management") under a sub-advisory agreement for the provision of day-to-day investment management services to the Fund in accordance with the Fund’s investment objective and policies. The Fund pays a fee to the investment manager, a portion of which may be used to compensate Wellington Management.
The schedule below reflects the rates of compensation paid to the investment manager for investment management services rendered as of October 31, 2014; the rates are accrued daily and paid monthly:
| Average Daily Net Assets | Annual Fee | |||
| On first $500 million | 0.650% | |||
| On next $500 million | 0.600% | |||
| On next $1.5 billion | 0.595% | |||
| On next $2.5 billion | 0.590% | |||
| On next $5 billion | 0.580% | |||
| Over $10 billion | 0.570% | |||
Accounting Services Agreement – Pursuant to the Fund Accounting Agreement between HFMC and the Company, on behalf of the Fund, HFMC provides accounting services to the Fund and receives monthly compensation based on the Fund’s average daily net assets at the rates set forth below. The Fund’s accounting services fees are accrued daily and paid monthly.
| Average Daily Net Assets | Annual Fee | |||
| On first $5 billion | 0.020% | |||
| On next $5 billion | 0.015% | |||
| Over $10 billion | 0.010% | |||
Operating Expenses – Allocable expenses incurred by the Company are allocated to each Fund and allocated to classes within the Fund in proportion to the average daily net assets of the Fund and each class, except where allocation of certain expenses is more fairly made directly to the Fund or to specific classes within a Fund. As of October 31, 2014, HFMC contractually limited the total operating expenses of this Fund, exclusive of taxes, interest expense, brokerage commissions, acquired fund fees and expenses and extraordinary expenses, through February 28, 2015 as follows:
| Class A | Class B | Class C | Class I | Class R3 | Class R4 | Class R5 | Class Y | |||||||
| 1.05% | 1.80% | 1.80% | 0.80% | 1.35% | 1.05% | 0.75% | 0.70% |
| 26 |
| The Hartford High Yield Fund |
| Notes to Financial Statements – (continued) |
| October 31, 2014 |
| (000’s Omitted) |
Fees Paid Indirectly – The Fund's custodian bank has agreed to reduce its fees when the Fund maintains cash on deposit in a non-interest-bearing custody account. For the year ended October 31, 2014, this amount, if any, is included in the Statement of Operations.
The ratio of expenses to average net assets in the accompanying financial highlights excludes the reduction in expenses related to fees paid indirectly. The annualized expense ratio after waivers for the period listed below reflecting the reduction for fees paid indirectly is as follows:
| Year
Ended October 31, 2014 | ||||
| Class A | 1.05 | % | ||
| Class B | 1.80 | |||
| Class C | 1.80 | |||
| Class I | 0.78 | |||
| Class R3 | 1.35 | |||
| Class R4 | 1.05 | |||
| Class R5 | 0.75 | |||
| Class Y | 0.70 | |||
Distribution and Service Plan for Class A, B, C, R3 and R4 Shares – Hartford Funds Distributors, LLC ("HFD"), an indirect wholly owned subsidiary of The Hartford, is the principal underwriter and distributor of the Fund. HFD is engaged in distribution activities, which include marketing and distribution of shares through broker/dealers, financing distribution costs and maintaining financial books and records. For the year ended October 31, 2014, HFD received front-end load sales charges of $893 and contingent deferred sales charges of $11 from the Fund.
The Fund has adopted a Distribution and Service Plan in accordance with Rule 12b-1 of the 1940 Act to compensate the distributor (HFD) for activities intended to result in the sale and distribution of Class A, B, C, R3 and R4 shares and for providing services for shareholders. The Rule 12b-1 plan applicable to Class A shares of the Fund provides for payment of a Rule 12b-1 fee of 0.25% of average daily net assets. Some or all of the fee may be used for shareholder servicing expenses with the remainder used for distribution expenses. Under the Class B Plan, the Fund pays the distributor 1.00% of the average daily net assets of Class B shares that are outstanding for 8 years or less, 0.25% of which is a fee for services provided to existing shareholders with the remainder used for distribution expenses. Some or the entire Rule 12b-1 fee for Class B shares may be remitted to broker/dealers for distribution and/or shareholder account services. After eight years, Class B shares convert to Class A shares. Upon conversion to Class A shares, the Class A plan described above will apply to those shares. Under the Class C Plan, the Fund pays the distributor 1.00% of the average daily net assets of Class C shares outstanding, 0.25% of which is intended as a fee for services provided to existing shareholders with the remainder used for distribution expenses. For Class C shares, some or the entire fee may be remitted to broker/dealers for distribution and/or shareholder account services. Class R3 shares have a distribution fee of 0.50% of average daily net assets and Class R4 shares have a distribution fee of 0.25% of average daily net assets. For Class R3 and R4 shares, some or the entire fee may be remitted to broker/dealers for distribution and/or shareholder account services. The Fund’s 12b-1 fees are accrued daily and paid monthly or at such other intervals as the Board of Directors may determine.
Other Related Party Transactions – Certain officers of the Fund are directors and/or officers of HFMC and/or The Hartford or its subsidiaries. For the year ended October 31, 2014, a portion of the Fund’s Chief Compliance Officer’s compensation was paid by all of the investment companies in the Hartford fund complex. The portion allocated to the Fund, as represented in other expenses on the Statement of Operations, was in the amount of $1. Hartford Administrative Services Company (“HASCO”), an indirect wholly-owned subsidiary of The Hartford, provides transfer agent services to the Fund. HASCO has contractually agreed to reimburse any portion of the transfer agency fees over 0.30% of average daily net assets per fiscal year for each class. Any transfer agency fee reimbursement is determined before considering the contractual operating expense limitation. For providing such services, HASCO is compensated on a per account basis that varies by account type, except with respect to Class Y, for which it is compensated based on average daily net assets. The amount paid to HASCO and any related contractual reimbursement amounts, if applicable, can be found in the Statement of Operations. These fees are accrued daily and paid monthly.
| 27 |
| The Hartford High Yield Fund |
| Notes to Financial Statements – (continued) |
| October 31, 2014 |
| (000’s Omitted) |
Administrative services fees are paid to HASCO for third-party recordkeeping services that are payable as a percentage of net assets in the amount of up to 0.20%, 0.15% and 0.10% for Classes R3, R4 and R5 shares, respectively. The total administrative services fees are shown on the Statement of Operations. These fees are accrued daily and paid monthly.
Investment Transactions:
For the year ended October 31, 2014, the cost of purchases and proceeds from sales of investment securities (excluding short-term investments) were as follows:
| Excluding
U.S. Government Obligations | U.S. Government Obligations | Total | ||||||||||
| Cost of Purchases | $ | 234,719 | $ | — | $ | 234,719 | ||||||
| Sales Proceeds | 302,164 | — | 302,164 | |||||||||
Capital Share Transactions:
The following information is for the year ended October 31, 2014, and the year ended October 31, 2013:
| For the Year Ended October 31, 2014 | For the Year Ended October 31, 2013 | |||||||||||||||||||||||||||||||
| Shares Sold | Shares
Issued for Reinvested Dividends | Shares Redeemed | Net
Increase (Decrease) of Shares | Shares Sold | Shares
Issued for Reinvested Dividends | Shares Redeemed | Net
Increase (Decrease) of Shares | |||||||||||||||||||||||||
| Class A | ||||||||||||||||||||||||||||||||
| Shares | 8,737 | 1,808 | (14,957 | ) | (4,412 | ) | 19,401 | 2,361 | (31,662 | ) | (9,900 | ) | ||||||||||||||||||||
| Amount | $ | 67,625 | $ | 13,985 | $ | (115,453 | ) | $ | (33,843 | ) | $ | 147,549 | $ | 17,991 | $ | (240,390 | ) | $ | (74,850 | ) | ||||||||||||
| Class B | ||||||||||||||||||||||||||||||||
| Shares | 63 | 36 | (437 | ) | (338 | ) | 149 | 55 | (588 | ) | (384 | ) | ||||||||||||||||||||
| Amount | $ | 480 | $ | 279 | $ | (3,361 | ) | $ | (2,602 | ) | $ | 1,126 | $ | 421 | $ | (4,465 | ) | $ | (2,918 | ) | ||||||||||||
| Class C | ||||||||||||||||||||||||||||||||
| Shares | 4,682 | 487 | (6,482 | ) | (1,313 | ) | 8,229 | 573 | (8,816 | ) | (14 | ) | ||||||||||||||||||||
| Amount | $ | 36,062 | $ | 3,755 | $ | (49,757 | ) | $ | (9,940 | ) | $ | 62,636 | $ | 4,351 | $ | (66,924 | ) | $ | 63 | |||||||||||||
| Class I | ||||||||||||||||||||||||||||||||
| Shares | 9,790 | 311 | (12,501 | ) | (2,400 | ) | 10,333 | 369 | (10,735 | ) | (33 | ) | ||||||||||||||||||||
| Amount | $ | 75,850 | $ | 2,418 | $ | (96,623 | ) | $ | (18,355 | ) | $ | 78,852 | $ | 2,828 | $ | (82,171 | ) | $ | (491 | ) | ||||||||||||
| Class R3 | ||||||||||||||||||||||||||||||||
| Shares | 125 | 16 | (192 | ) | (51 | ) | 177 | 17 | (76 | ) | 118 | |||||||||||||||||||||
| Amount | $ | 967 | $ | 123 | $ | (1,493 | ) | $ | (403 | ) | $ | 1,347 | $ | 130 | $ | (578 | ) | $ | 899 | |||||||||||||
| Class R4 | ||||||||||||||||||||||||||||||||
| Shares | 94 | 7 | (96 | ) | 5 | 240 | 11 | (236 | ) | 15 | ||||||||||||||||||||||
| Amount | $ | 735 | $ | 53 | $ | (745 | ) | $ | 43 | $ | 1,813 | $ | 84 | $ | (1,829 | ) | $ | 68 | ||||||||||||||
| Class R5 | ||||||||||||||||||||||||||||||||
| Shares | 19 | 3 | (34 | ) | (12 | ) | 41 | 4 | (22 | ) | 23 | |||||||||||||||||||||
| Amount | $ | 147 | $ | 27 | $ | (262 | ) | $ | (88 | ) | $ | 304 | $ | 34 | $ | (163 | ) | $ | 175 | |||||||||||||
| Class Y | ||||||||||||||||||||||||||||||||
| Shares | 79 | 60 | (166 | ) | (27 | ) | 221 | 83 | (1,235 | ) | (931 | ) | ||||||||||||||||||||
| Amount | $ | 610 | $ | 456 | $ | (1,276 | ) | $ | (210 | ) | $ | 1,682 | $ | 633 | $ | (9,398 | ) | $ | (7,083 | ) | ||||||||||||
| Total | ||||||||||||||||||||||||||||||||
| Shares | 23,589 | 2,728 | (34,865 | ) | (8,548 | ) | 38,791 | 3,473 | (53,370 | ) | (11,106 | ) | ||||||||||||||||||||
| Amount | $ | 182,476 | $ | 21,096 | $ | (268,970 | ) | $ | (65,398 | ) | $ | 295,309 | $ | 26,472 | $ | (405,918 | ) | $ | (84,137 | ) | ||||||||||||
The following reflects the conversion of Class B shares into Class A shares (reflected as Class A shares sold) for the year ended October 31, 2014, and the year ended October 31, 2013:
| Shares | Dollars | |||||||
| For the Year Ended October 31, 2014 | 83 | $ | 636 | |||||
| For the Year Ended October 31, 2013 | 92 | $ | 703 | |||||
| 28 |
| The Hartford High Yield Fund |
| Notes to Financial Statements – (continued) |
| October 31, 2014 |
| (000’s Omitted) |
Line of Credit:
The Fund is one of several Hartford Funds that participate in a $500 million committed revolving line of credit facility. The facility is to be used for temporary or emergency purposes. Under the arrangement, the funds are required to own securities having a market value in excess of 300% of the total bank borrowings. The interest rate on borrowings varies depending on the nature of the loan. The facility also requires a fee to be paid based on the amount of the commitment. This commitment fee is allocated to all the funds participating in the line of credit based on the average net assets of the funds. During the year ended October 31, 2014, the Fund did not have any borrowings under this facility.
Pending Legal Proceedings:
On February 25, 2011, Jennifer L. Kasilag, Louis Mellinger, Judith M. Menendez, Jacqueline M. Robinson, and Linda A. Russell filed a derivative lawsuit against Hartford Investment Financial Services, LLC (“HIFSCO”) (now known as HFD) on behalf of six Hartford retail mutual funds in the United States District Court for the District of New Jersey, alleging that HIFSCO received excessive advisory and distribution fees in violation of its statutory fiduciary duty under Section 36(b) of the 1940 Act when serving as investment manager and principal underwriter, respectively, to the Hartford retail mutual funds. Although this action was purportedly filed on behalf of certain of the Hartford Funds, none of the Hartford Funds is itself a defendant to the suit. HIFSCO moved to dismiss and, in September 2011, the motion was granted in part and denied in part, with leave to amend the complaint. In November 2011, plaintiffs filed an amended complaint on behalf of certain Hartford retail mutual funds, The Hartford Global Health Fund (now known as The Hartford Healthcare Fund), The Hartford Conservative Allocation Fund, The Hartford Growth Opportunities Fund, The Hartford Inflation Plus Fund, The Hartford Advisers Fund (now known as The Hartford Balanced Fund), and The Hartford Capital Appreciation Fund. Plaintiffs seek to rescind the investment management agreements and distribution plans between HIFSCO and these funds and to recover the total fees charged thereunder or, in the alternative, to recover any improper compensation HIFSCO received, in addition to lost earnings. HIFSCO filed a partial motion to dismiss the amended complaint and, in December 2012, the court dismissed without prejudice the claims regarding distribution fees and denied the motion with respect to the advisory fees claims. HIFSCO disputes the allegations and intends to defend vigorously.
In March 2014, the plaintiffs filed a new complaint that added as new plaintiffs The Hartford Floating Rate Fund and The Hartford Small Company Fund and named as a defendant HFMC, which assumed the role as investment manager to the funds as of January 2013. HFMC and HIFSCO dispute the allegations and intend to defend vigorously.
No accrual for litigation relating to this matter has been recorded in the financial statements of the Fund because the Fund is not party to the suit.
Indemnifications:
Under the Company's organizational documents, the Company shall indemnify its officers and directors to the full extent required or permitted under Maryland General Corporation Law and the federal securities laws. In addition, the Company, on behalf of the Fund, may enter into contracts that contain a variety of indemnifications. The Company's maximum exposure under these arrangements is unknown. However, as of the date of these financial statements, the Company has not had prior claims or losses pursuant to these contracts and expects the risk of loss to be remote.
Subsequent Event:
Effective December 1, 2014, pursuant to a sub-transfer agency agreement between HASCO and Boston Financial Data Services, Inc. (“BFDS”), HASCO has delegated certain transfer agent, dividend disbursing agent and shareholder servicing agent functions to BFDS. The costs and expenses of such delegation are borne by HASCO, not by the Fund.
| 29 |
| The Hartford High Yield Fund |
| Financial Highlights |
| - Selected Per-Share Data - (A) | - Ratios and Supplemental Data - | |||||||||||||||||||||||||||||||||||||||||||||||||||
| Class | Net
Asset Value at Beginning of Period | Net Investment Income (Loss) | Net Realized and Unrealized Gain (Loss) on Invest- ments | Total
from Investment Operations | Dividends from Net Investment Income | Distribu- tions from Realized Capital Gains | Total Dividends and Distributions | Net
Asset Value at End of Period | Total Return(B) | Net
Assets at End of Period (000's) | Ratio
of Expenses to Average Net Assets Before Adjust- ments(C) | Ratio
of Expenses to Average Net Assets After Adjust- ments(C) | Ratio
of Net Investment Income (Loss) to Average Net Assets | |||||||||||||||||||||||||||||||||||||||
| For the Year Ended October 31, 2014 | ||||||||||||||||||||||||||||||||||||||||||||||||||||
| A | $ | 7.66 | $ | 0.38 | $ | 0.02 | $ | 0.40 | $ | (0.38 | ) | $ | – | $ | (0.38 | ) | $ | 7.68 | 5.35 | % | $ | 262,960 | 1.14 | % | 1.05 | % | 4.90 | % | ||||||||||||||||||||||||
| B | 7.62 | 0.32 | 0.02 | 0.34 | (0.32 | ) | – | (0.32 | ) | 7.64 | 4.60 | 5,683 | 2.02 | 1.80 | 4.17 | |||||||||||||||||||||||||||||||||||||
| C | 7.63 | 0.32 | 0.02 | 0.34 | (0.32 | ) | – | (0.32 | ) | 7.65 | 4.60 | 95,449 | 1.83 | 1.80 | 4.15 | |||||||||||||||||||||||||||||||||||||
| I | 7.70 | 0.40 | 0.03 | 0.43 | (0.41 | ) | – | (0.41 | ) | 7.72 | 5.60 | 46,691 | 0.81 | 0.78 | 5.17 | |||||||||||||||||||||||||||||||||||||
| R3 | 7.65 | 0.36 | 0.03 | 0.39 | (0.36 | ) | – | (0.36 | ) | 7.68 | 5.18 | 2,487 | 1.47 | 1.35 | 4.60 | |||||||||||||||||||||||||||||||||||||
| R4 | 7.66 | 0.38 | 0.03 | 0.41 | (0.39 | ) | – | (0.39 | ) | 7.68 | 5.35 | 1,367 | 1.16 | 1.05 | 4.91 | |||||||||||||||||||||||||||||||||||||
| R5 | 7.65 | 0.40 | 0.04 | 0.44 | (0.41 | ) | – | (0.41 | ) | 7.68 | 5.81 | 522 | 0.85 | 0.75 | 5.21 | |||||||||||||||||||||||||||||||||||||
| Y | 7.65 | 0.41 | 0.01 | 0.42 | (0.40 | ) | – | (0.40 | ) | 7.67 | 5.73 | 8,415 | 0.73 | 0.70 | 5.25 | |||||||||||||||||||||||||||||||||||||
| For the Year Ended October 31, 2013 | ||||||||||||||||||||||||||||||||||||||||||||||||||||
| A | $ | 7.53 | $ | 0.40 | $ | 0.14 | $ | 0.54 | $ | (0.41 | ) | $ | – | $ | (0.41 | ) | $ | 7.66 | 7.33 | % | $ | 295,950 | 1.15 | % | 1.05 | % | 5.29 | % | ||||||||||||||||||||||||
| B | 7.50 | 0.34 | 0.13 | 0.47 | (0.35 | ) | – | (0.35 | ) | 7.62 | 6.43 | 8,242 | 1.99 | 1.80 | 4.54 | |||||||||||||||||||||||||||||||||||||
| C | 7.51 | 0.34 | 0.13 | 0.47 | (0.35 | ) | – | (0.35 | ) | 7.63 | 6.42 | 105,204 | 1.81 | 1.80 | 4.54 | |||||||||||||||||||||||||||||||||||||
| I | 7.57 | 0.42 | 0.14 | 0.56 | (0.43 | ) | – | (0.43 | ) | 7.70 | 7.56 | 65,060 | 0.81 | 0.79 | 5.54 | |||||||||||||||||||||||||||||||||||||
| R3 | 7.53 | 0.38 | 0.13 | 0.51 | (0.39 | ) | – | (0.39 | ) | 7.65 | 6.87 | 2,872 | 1.47 | 1.35 | 4.96 | |||||||||||||||||||||||||||||||||||||
| R4 | 7.54 | 0.40 | 0.13 | 0.53 | (0.41 | ) | – | (0.41 | ) | 7.66 | 7.18 | 1,323 | 1.14 | 1.05 | 5.30 | |||||||||||||||||||||||||||||||||||||
| R5 | 7.53 | 0.42 | 0.13 | 0.55 | (0.43 | ) | – | (0.43 | ) | 7.65 | 7.51 | 609 | 0.84 | 0.75 | 5.57 | |||||||||||||||||||||||||||||||||||||
| Y | 7.53 | 0.43 | 0.13 | 0.56 | (0.44 | ) | – | (0.44 | ) | 7.65 | 7.57 | 8,599 | 0.72 | 0.70 | 5.65 | |||||||||||||||||||||||||||||||||||||
| For the Year Ended October 31, 2012 (D) | ||||||||||||||||||||||||||||||||||||||||||||||||||||
| A | $ | 7.20 | $ | 0.44 | $ | 0.33 | $ | 0.77 | $ | (0.44 | ) | $ | – | $ | (0.44 | ) | $ | 7.53 | 11.00 | % | $ | 365,718 | 1.12 | % | 1.05 | % | 5.97 | % | ||||||||||||||||||||||||
| B | 7.17 | 0.38 | 0.33 | 0.71 | (0.38 | ) | – | (0.38 | ) | 7.50 | 10.24 | 10,990 | 2.00 | 1.80 | 5.28 | |||||||||||||||||||||||||||||||||||||
| C | 7.18 | 0.38 | 0.33 | 0.71 | (0.38 | ) | – | (0.38 | ) | 7.51 | 10.23 | 103,639 | 1.82 | 1.79 | 5.24 | |||||||||||||||||||||||||||||||||||||
| I | 7.23 | 0.46 | 0.34 | 0.80 | (0.46 | ) | – | (0.46 | ) | 7.57 | 11.39 | 64,195 | 0.83 | 0.80 | 6.24 | |||||||||||||||||||||||||||||||||||||
| R3 | 7.20 | 0.42 | 0.33 | 0.75 | (0.42 | ) | – | (0.42 | ) | 7.53 | 10.68 | 1,934 | 1.49 | 1.35 | 5.65 | |||||||||||||||||||||||||||||||||||||
| R4 | 7.20 | 0.44 | 0.34 | 0.78 | (0.44 | ) | – | (0.44 | ) | 7.54 | 11.15 | 1,191 | 1.16 | 1.05 | 5.85 | |||||||||||||||||||||||||||||||||||||
| R5 | 7.20 | 0.46 | 0.33 | 0.79 | (0.46 | ) | – | (0.46 | ) | 7.53 | 11.34 | 431 | 0.86 | 0.75 | 6.25 | |||||||||||||||||||||||||||||||||||||
| Y | 7.19 | 0.47 | 0.33 | 0.80 | (0.46 | ) | – | (0.46 | ) | 7.53 | 11.55 | 15,468 | 0.73 | 0.70 | 6.39 | |||||||||||||||||||||||||||||||||||||
| For the Year Ended October 31, 2011 (D) | ||||||||||||||||||||||||||||||||||||||||||||||||||||
| A | $ | 7.37 | $ | 0.53 | $ | (0.17 | ) | $ | 0.36 | $ | (0.53 | ) | $ | – | $ | (0.53 | ) | $ | 7.20 | 4.95 | % | $ | 280,568 | 1.14 | % | 1.05 | % | 7.19 | % | |||||||||||||||||||||||
| B | 7.34 | 0.48 | (0.17 | ) | 0.31 | (0.48 | ) | – | (0.48 | ) | 7.17 | 4.19 | 13,007 | 1.99 | 1.80 | 6.45 | ||||||||||||||||||||||||||||||||||||
| C | 7.35 | 0.47 | (0.16 | ) | 0.31 | (0.48 | ) | – | (0.48 | ) | 7.18 | 4.20 | 102,694 | 1.83 | 1.80 | 6.43 | ||||||||||||||||||||||||||||||||||||
| I | 7.39 | 0.55 | (0.16 | ) | 0.39 | (0.55 | ) | – | (0.55 | ) | 7.23 | 5.36 | 86,138 | 0.82 | 0.79 | 7.38 | ||||||||||||||||||||||||||||||||||||
| R3 | 7.36 | 0.51 | (0.16 | ) | 0.35 | (0.51 | ) | – | (0.51 | ) | 7.20 | 4.79 | 1,423 | 1.51 | 1.35 | 6.85 | ||||||||||||||||||||||||||||||||||||
| R4 | 7.37 | 0.53 | (0.17 | ) | 0.36 | (0.53 | ) | – | (0.53 | ) | 7.20 | 4.95 | 483 | 1.19 | 1.05 | 7.13 | ||||||||||||||||||||||||||||||||||||
| R5 | 7.37 | 0.56 | (0.18 | ) | 0.38 | (0.55 | ) | – | (0.55 | ) | 7.20 | 5.27 | 321 | 0.84 | 0.75 | 7.45 | ||||||||||||||||||||||||||||||||||||
| Y | 7.36 | 0.57 | (0.18 | ) | 0.39 | (0.56 | ) | – | (0.56 | ) | 7.19 | 5.32 | 20,136 | 0.73 | 0.70 | 7.53 | ||||||||||||||||||||||||||||||||||||
See Portfolio Turnover information on the next page.
| 30 |
| The Hartford High Yield Fund |
| Financial Highlights – (continued) |
| - Selected Per-Share Data - (A) | - Ratios and Supplemental Data - | |||||||||||||||||||||||||||||||||||||||||||||||||||
| Class | Net
Asset Value at Beginning of Period | Net Investment Income (Loss) | Net Realized and Unrealized Gain (Loss) on Invest- ments | Total
from Investment Operations | Dividends from Net Investment Income | Distribu- tions from Realized Capital Gains | Total Dividends and Distributions | Net
Asset Value at End of Period | Total Return(B) | Net
Assets at End of Period (000's) | Ratio
of Expenses to Average Net Assets Before Adjust- ments(C) | Ratio
of Expenses to Average Net Assets After Adjust- ments(C) | Ratio
of Net Investment Income (Loss) to Average Net Assets | |||||||||||||||||||||||||||||||||||||||
| For the Year Ended October 31, 2010 (D) | ||||||||||||||||||||||||||||||||||||||||||||||||||||
| A | $ | 6.73 | $ | 0.59 | $ | 0.65 | $ | 1.24 | $ | (0.60 | ) | $ | – | $ | (0.60 | ) | $ | 7.37 | 19.14 | % | $ | 284,606 | 1.20 | % | 1.20 | % | 8.43 | % | ||||||||||||||||||||||||
| B | 6.71 | 0.54 | 0.64 | 1.18 | (0.55 | ) | – | (0.55 | ) | 7.34 | 18.17 | 19,919 | 2.06 | 1.95 | 7.73 | |||||||||||||||||||||||||||||||||||||
| C | 6.71 | 0.54 | 0.65 | 1.19 | (0.55 | ) | – | (0.55 | ) | 7.35 | 18.38 | 85,523 | 1.89 | 1.89 | 7.73 | |||||||||||||||||||||||||||||||||||||
| I | 6.74 | 0.61 | 0.66 | 1.27 | (0.62 | ) | – | (0.62 | ) | 7.39 | 19.63 | 21,098 | 0.88 | 0.88 | 8.51 | |||||||||||||||||||||||||||||||||||||
| R3 | 6.73 | 0.56 | 0.65 | 1.21 | (0.58 | ) | – | (0.58 | ) | 7.36 | 18.70 | 371 | 1.61 | 1.45 | 8.16 | |||||||||||||||||||||||||||||||||||||
| R4 | 6.73 | 0.59 | 0.65 | 1.24 | (0.60 | ) | – | (0.60 | ) | 7.37 | 19.20 | 318 | 1.27 | 1.15 | 8.24 | |||||||||||||||||||||||||||||||||||||
| R5 | 6.73 | 0.61 | 0.65 | 1.26 | (0.62 | ) | – | (0.62 | ) | 7.37 | 19.51 | 492 | 0.90 | 0.88 | 8.52 | |||||||||||||||||||||||||||||||||||||
| Y | 6.73 | 0.62 | 0.64 | 1.26 | (0.63 | ) | – | (0.63 | ) | 7.36 | 19.47 | 44,553 | 0.79 | 0.79 | 8.85 | |||||||||||||||||||||||||||||||||||||
| (A) | Information presented relates to a share outstanding throughout the indicated period. Net investment income (loss) per share amounts are calculated based on average shares outstanding unless otherwise noted. |
| (B) | Assumes initial investment at net asset value at the beginning of each period, reinvestment of all distributions, the complete redemption of the investment at net asset value at the end of each period and no sales charge. Total return would be reduced if sales charges were taken into account. |
| (C) | Adjustments include waivers and reimbursements, if applicable. Ratios do not include fees paid indirectly (see Expenses in the accompanying Notes to Financial Statements). |
| (D) | Net investment income (loss) per share amounts have been calculated using the SEC method. |
| Portfolio
Turnover Rate for All Share Classes | ||||
| For the Year Ended October 31, 2014 | 54 | % | ||
| For the Year Ended October 31, 2013 | 58 | |||
| For the Year Ended October 31, 2012 | 138 | |||
| For the Year Ended October 31, 2011 | 117 | |||
| For the Year Ended October 31, 2010 | 141 | |||
| 31 |
| Report of Independent Registered Public Accounting Firm |
| The Board of Directors and Shareholders of |
| The Hartford Mutual Funds, Inc. |
We have audited the accompanying statement of assets and liabilities, including the schedule of investments, of The Hartford High Yield Fund (one of the portfolios constituting The Hartford Mutual Funds, Inc. (the Funds)) as of October 31, 2014, and the related statement of operations for the year then ended, the statements of changes in net assets for each of the two years in the period then ended, and the financial highlights for each of the five years in the period then ended. These financial statements and financial highlights are the responsibility of the Funds’ management. Our responsibility is to express an opinion on these financial statements and financial highlights based on our audits.
We conducted our audits in accordance with the standards of the Public Company Accounting Oversight Board (United States). Those standards require that we plan and perform the audit to obtain reasonable assurance about whether the financial statements and financial highlights are free of material misstatement. We were not engaged to perform an audit of the Funds’ internal control over financial reporting. Our audits included consideration of internal control over financial reporting as a basis for designing audit procedures that are appropriate in the circumstances, but not for the purpose of expressing an opinion on the effectiveness of the Funds’ internal control over financial reporting. Accordingly, we express no such opinion. An audit also includes examining, on a test basis, evidence supporting the amounts and disclosures in the financial statements and financial highlights, assessing the accounting principles used and significant estimates made by management, and evaluating the overall financial statement presentation. Our procedures included confirmation of securities owned as of October 31, 2014, by correspondence with the custodian, agent banks and brokers or by other appropriate auditing procedures where replies from agent banks and brokers were not received. We believe that our audits provide a reasonable basis for our opinion.
In our opinion, the financial statements and financial highlights referred to above present fairly, in all material respects, the financial position of The Hartford High Yield Fund of The Hartford Mutual Funds, Inc. at October 31, 2014, the results of its operations for the year then ended, the changes in its net assets for each of the two years in the period then ended, and the financial highlights for each of the five years in the period then ended, in conformity with U.S. generally accepted accounting principles.
| |
| Minneapolis, Minnesota | |
| December 18, 2014 |
| 32 |
| The Hartford High Yield Fund |
| Directors and Officers (Unaudited) |
The Board of Directors of the Company (the "Directors") appoints officers who are responsible for the day-to-day operations of the Fund and who execute policies formulated by the Directors. Each Director serves until his or her death, resignation, or retirement or until the next annual meeting of shareholders is held or until his or her successor is elected and qualifies.
Directors and officers who are employed by or who have a financial interest in The Hartford Financial Services Group, Inc. ("The Hartford") are considered “interested” persons of the Fund pursuant to the 1940 Act. Each officer and two of the Company's Directors, as noted in the chart below, are “interested” persons of the Fund. Each Director serves as a director for The Hartford Mutual Funds, Inc., The Hartford Mutual Funds II, Inc., Hartford Series Fund, Inc., and Hartford HLS Series Fund II, Inc., and as a trustee for The Hartford Alternative Strategies Fund, which, as of October 31, 2014, collectively consist of 66 funds. Correspondence may be sent to Directors and officers c/o Hartford Funds, 5 Radnor Corporate Center, Suite 300, 100 Matsonford Road, Radnor, Pennsylvania 19087, except that correspondence to Mr. Annoni, Mr. Dressen and Ms. Quade may be sent to 500 Bielenberg Drive, Suite 500, Woodbury, Minnesota 55125.
The table below sets forth, for each Director and officer, his or her name, year of birth, current position with the Company and date first elected or appointed to The Hartford Mutual Funds, Inc. ("MF") and The Hartford Mutual Funds II, Inc. ("MF2"), principal occupation, and, for Directors, other directorships held. The Fund’s Statement of Additional Information contains further information on the Directors and is available free of charge by calling 1-888-843-7824 or writing to: Hartford Funds, P.O. Box 55022, Boston, MA 02205-5022.
Information on the aggregate remuneration paid to the directors of the Company can be found in the Statement of Operations herein. The Fund pays to The Hartford a portion of the Chief Compliance Officer’s compensation, but does not pay salaries or compensation to any of its other officers or Directors who are employed by The Hartford.
Non-Interested Directors
Hilary E. Ackermann (1956) Director since September 23, 2014
Ms. Ackermann served as Chief Risk Officer at Goldman Sachs Bank USA from October 2008 to November 2011 and serves as a Director of Dynegy, Inc., an independent power company, from October 2012 to present.
Lynn S. Birdsong (1946) Director since 2003, Chairman of the Investment Committee since 2014
Mr. Birdsong is a private investor. Mr. Birdsong currently serves as a Director of the Sovereign High Yield Investment Company (April 2010 to current). Mr. Birdsong currently serves as an Independent Director of Nomura Partners Funds, Inc. (formerly, The Japan Fund) (April 2003 to current). From 2003 to March 2005, Mr. Birdsong was an Independent Director of the Atlantic Whitehall Funds. From 1979 to 2002, Mr. Birdsong was a Managing Director of Zurich Scudder Investments, an investment management firm. During his employment with Scudder, Mr. Birdsong was an Interested Director of The Japan Fund. From January 1981 through December 2013, Mr. Birdsong was a partner in Birdsong Company, an advertising specialty firm.
Robert M. Gavin, Jr. (1940) Director since 2002 (MF) and 1986 (MF2), Chairman of the Board for each since 2004
Dr. Gavin is an educational consultant. Prior to September 1, 2001, he was President of Cranbrook Education Community and prior to July 1996, he was President of Macalester College, St. Paul, Minnesota.
Duane E. Hill (1945) Director since 2001 (MF) and 2002 (MF2), Chairman of the Nominating Committee since 2003
Mr. Hill is a Partner of TSG Ventures L.P., a private equity investment company. Mr. Hill is a former partner of TSG Capital Group, a private equity investment firm that served as sponsor and lead investor in leveraged buyouts of middle market companies.
Sandra S. Jaffee (1941) Director since 2005
Ms. Jaffee is the founder and Chief Executive Officer of a private company, Homeworks Concierge, LLC, which provides residential property management services in Westchester County, New York (January 2012 to present). Ms. Jaffee served as Chairman (2008 to 2009) and Chief Executive Officer of Fortent (formerly Searchspace Group), a leading provider of compliance/regulatory technology to financial institutions from August 2005 to August 2009. From August 2004 to August 2005, Ms. Jaffee served as an Entrepreneur in Residence with Warburg Pincus, a private equity firm. Prior to joining Warburg Pincus, Ms. Jaffee served as Executive Vice President at Citigroup, from September 1995 to July 2004, where she was President and Chief Executive Officer of Citibank’s Global Securities Services (1995 to 2003). Ms. Jaffee currently serves as a member of the Board of Directors of Broadridge Financial Solutions as well as a Trustee of Muhlenberg College.
| 33 |
| The Hartford High Yield Fund |
| Directors and Officers (Unaudited) – (continued) |
William P. Johnston (1944) Director since 2005, Chairman of the Compliance Committee since 2005
In June 2006, Mr. Johnston was appointed as Senior Advisor to The Carlyle Group, a global private equity and other alternative asset investment firm and currently serves as an Operating Executive. In July 2006, Mr. Johnston was elected to the Board of Directors of MultiPlan, Inc. and served as a Director (July 2006 to August 2010). In August 2007, Mr. Johnston was elected to the Board of Directors of LifeCare Holdings, Inc. and served as a Director (August 2007 to June 2013). In February 2008, Mr. Johnston was elected to the Board of Directors of HCR-ManorCare, Inc. In May 2006, Mr. Johnston was elected to the Supervisory Board of Fresenius Medical Care AG & Co. KGaA, after its acquisition of Renal Care Group, Inc. in March 2006. Mr. Johnston joined Renal Care Group in November 2002 as a member of the Board of Directors and served as Chairman of the Board from March 2003 through March 2006. From 2002 through 2013, Mr. Johnston served as a Board member of the Georgia O’Keefe Museum. From September 1987 to December 2002, Mr. Johnston was with Equitable Securities Corporation (and its successors, SunTrust Equitable Securities and SunTrust Robinson Humphrey) serving in various investment banking and managerial positions, including Managing Director and Head of Investment Banking, Chief Executive Officer and Vice Chairman.
Phillip O. Peterson (1944) Director since 2002 (MF) and 2000 (MF2), Chairman of the Audit Committee since 2002
Mr. Peterson is a mutual fund industry consultant. He was a partner of KPMG LLP (an accounting firm) until July 1999. Mr. Peterson joined William Blair Funds in February 2007 as a member of the Board of Trustees. From February 2012 to February 2014, Mr. Peterson served as a Trustee of Symetra Variable Mutual Funds. From January 2004 to April 2005, Mr. Peterson served as Independent President of the Strong Mutual Funds.
Lemma W. Senbet (1946) Director since 2005
Dr. Senbet is the William E. Mayer Chair Professor of Finance and Founding Director, Center for Financial Policy, at the University of Maryland, Robert H. Smith School of Business. He was chair of the Finance Department of the University of Maryland, Robert H. Smith School of Business from 1998 to 2006. Since June 2013, he has been on leave from the University to serve as Executive Director of African Economic Research Consortium which focuses on economic policy research and training. Previously, he was a chaired professor of finance at the University of Wisconsin-Madison. Also, he was a Director of the Fortis Funds from March 2000 to July 2002. Dr. Senbet served as Director of the American Finance Association and President of the Western Finance Association. In 2006, Dr. Senbet was inducted Fellow of Financial Management Association International for his career-long distinguished scholarship and professional service.
Interested Directors and Officers
James E. Davey (1964) Director since 2012, President and Chief Executive Officer since 2010
Mr. Davey serves as Executive Vice President of Hartford Life Insurance Company (“HLIC”) and The Hartford. Additionally, Mr. Davey serves as Chairman of the Board, Manager and Senior Managing Director of Hartford Funds Distributors, LLC (“HFD”). He also currently serves as Director, Chairman of the Board, President and Senior Managing Director of Hartford Administrative Services Company (“HASCO”). Mr. Davey also serves as Manager, Chairman of the Board and Senior Managing Director for Hartford Funds Management Company, LLC (“HFMC”) and Director, Chairman of the Board and Senior Managing Director for Hartford Funds Management Group, Inc. ("HFMG"). Mr. Davey has served in various positions within The Hartford and its subsidiaries in connection with the operation of the Hartford Funds. Mr. Davey joined The Hartford in 2002.
Lowndes A. Smith* (1939) Director since 1996 (MF) and 2002 (MF2)
Mr. Smith served as Vice Chairman of The Hartford from February 1997 to January 2002, as President and Chief Executive Officer of Hartford Life, Inc. from February 1997 to January 2002, and as President and Chief Operating Officer of The Hartford Life Insurance Companies from January 1989 to January 2002. Mr. Smith serves as a Director of White Mountains Insurance Group Ltd. (October 2003 to current); One Beacon Insurance (October 2006 to current); Symetra Financial (August 2007 to current) and is a Managing Director of Whittington Gray Associates (January 2007 to current).
* Mr. Smith resigned as a Director of MF, MF2, Hartford Series Fund, Inc. and Hartford HLS Series Fund II, Inc. and as a Trustee of The Hartford Alternative Strategies Fund effective September 17, 2014.
Other Officers
Mark A. Annoni (1964) Vice President, Controller and Treasurer since 2012
Mr. Annoni currently serves as the Assistant Vice President of HLIC (February 2004 to present) and Senior Vice President of HFMG (December 2013 to present). Mr. Annoni has served in various positions within The Hartford and its subsidiaries in connection with the operation of the Hartford Funds. Mr. Annoni joined The Hartford in 2001.
| 34 |
| The Hartford High Yield Fund |
| Directors and Officers (Unaudited) – (continued) |
Michael R. Dressen (1963) AML Compliance Officer since 2011
Mr. Dressen currently serves as Assistant Vice President of HLIC. He also serves as Chief Compliance Officer and AML Compliance Officer of HASCO and as AML Officer of HFD. Mr. Dressen has served in various positions within The Hartford and its subsidiaries in connection with the operation of the Hartford Funds.
Edward P. Macdonald (1967) Vice President, Secretary and Chief Legal Officer since 2005
Mr. Macdonald currently serves as Assistant Secretary, Executive Vice President and Deputy General Counsel of HFD, HASCO, HFMC and HFMG. He also serves as Vice President of HLIC. Mr. Macdonald has served in various positions within The Hartford and its subsidiaries in connection with the operation of the Hartford Funds. Mr. Macdonald joined The Hartford in 2005.
Joseph G. Melcher (1973) Vice President and Chief Compliance Officer since 2013
Mr. Melcher currently serves as Executive Vice President of HFD, HFMG and HASCO. Mr. Melcher also currently serves as Executive Vice President and Chief Compliance Officer of HFMC. Mr. Melcher has served in various positions within The Hartford and its subsidiaries in connection with the operation of the Hartford Funds since joining The Hartford in 2012. Prior to joining The Hartford, Mr. Melcher worked at Touchstone Investments, a member of the Western & Southern Financial Group, where he held the position of Vice President and Chief Compliance Officer from 2010 through 2012 and Assistant Vice President, Compliance from 2005 to 2010.
Vernon J. Meyer (1964) Vice President since 2006
Mr. Meyer currently serves as Senior Vice President of HLIC. He also currently serves as Managing Director and Chief Investment Officer of HFMC and Managing Director of HFMG. Mr. Meyer has served in various positions within The Hartford and its subsidiaries in connection with the operation of the Hartford Funds. Mr. Meyer joined The Hartford in 2004.
Laura S. Quade (1969) Vice President since 2012
Ms. Quade currently serves as Vice President of HASCO, HFD and HFMG. She is the Head of Operations of HASCO and formerly served as Director, Enterprise Operations of HLIC. Ms. Quade has served in various positions within The Hartford and its subsidiaries in connection with the operation of the Hartford Funds. Ms. Quade joined The Hartford in 2001.
Martin A. Swanson** (1962) Vice President since 2010
Mr. Swanson currently serves as Vice President of HLIC. Mr. Swanson also serves as Managing Director, Chief Marketing Officer and Principal of HFD and Managing Director of HFMG. Mr. Swanson has served in various positions within The Hartford and its subsidiaries in connection with the operation of the Hartford Funds.
** Mr. Swanson resigned as an officer effective November 6, 2014.
HOW TO OBTAIN A COPY OF THE FUND’S PROXY VOTING POLICIES AND VOTING RECORDS (UNAUDITED)
A description of the policies and procedures that the Fund uses to determine how to vote proxies relating to portfolio securities and information about how the Fund voted proxies relating to portfolio securities during the most recent twelve-month period ended June 30 are available (1) without charge, upon request, by calling 888-843-7824 and (2) on the SEC’s website at http://www.sec.gov.
QUARTERLY PORTFOLIO HOLDINGS INFORMATION (UNAUDITED)
The Fund files a complete schedule of portfolio holdings with the SEC for the first and third quarters of each fiscal year on Form N-Q. The Fund’s Forms N-Q are available (1) without charge, upon request, by calling 888-843-7824 and (2) on the SEC’s website at http://www.sec.gov. The Form N-Q may be reviewed and copied at the SEC’s Public Reference Room in Washington, DC. Information on the operation of the Public Reference Room may be obtained by calling 1-800-SEC-0330.
| 35 |
| The Hartford High Yield Fund |
| Federal Tax Information (Unaudited) |
For the fiscal year ended October 31, 2014, there is no further federal tax information required for this Fund.
| 36 |
| The Hartford High Yield Fund |
| Expense Example (Unaudited) |
Your Fund's Expenses
As a shareholder of the Fund, you incur two types of costs: (1) transaction costs, including sales charges (loads) on purchase payments, if any, and contingent deferred sales charges (CDSC), if any, and (2) ongoing costs, including investment management fees, distribution and/or service (12b-1) fees, if any, and other fund expenses. This example is intended to help you understand your ongoing costs (in dollars) of investing in the Fund and to compare these costs with the ongoing costs of investing in other mutual funds. The example is based on an investment of $1,000 invested at the beginning of the period and held for the entire period of April 30, 2014 through October 31, 2014.
Actual Expenses
The first set of columns of the table below provides information about actual account values and actual expenses. You may use the information in this column, together with the amount you invested, to estimate the expenses that you paid over the period. Simply divide your account value by $1,000 (for example, an $8,600 account value divided by $1,000 = 8.6), then multiply the result by the number in the line under the heading entitled “Expenses Paid During Period” to estimate the expenses you paid on your account during this period.
Hypothetical Example for Comparison Purposes
The second set of columns of the table below provides information about hypothetical account values and hypothetical expenses based on the Fund's actual expense ratio and an assumed rate of return of 5% per year before expenses, which is not the Fund's actual return. The hypothetical account values and expenses may not be used to estimate the actual ending account balance or expenses you paid for the period. You may use this information to compare the ongoing costs of investing in the Fund and other funds. To do so, compare this 5% hypothetical example with the 5% hypothetical examples that appear in the shareholder reports of the other funds.
Please note that the expenses shown in the table are meant to highlight your ongoing costs only and do not reflect any transactional costs, such as sales charges (loads) and CDSC. Therefore, the second set of columns of the table is useful in comparing ongoing costs only, and will not help you determine the relative total costs of owning different funds. In addition, if these transactional costs were included, your costs would be higher. Expenses are equal to the Fund's annualized expense ratios multiplied by average account value over the period, multiplied by 184/365 (to reflect the one-half year period).
| Actual return | Hypothetical (5% return before expenses) | |||||||||||||||||||||||||||||||||
| Beginning Account Value April 30, 2014 |
Ending Account Value October 31, 2014 |
Expenses
paid during the period April 30, 2014 through October 31, 2014 |
Beginning Account Value April 30, 2014 |
Ending Account Value October 31, 2014 |
Expenses
paid during the period April 30, 2014 through October 31, 2014 |
Annualized expense ratio |
Days in the current 1/2 year |
Days in the full year |
||||||||||||||||||||||||||
| Class A | $ | 1,000.00 | $ | 1,009.50 | $ | 5.32 | $ | 1,000.00 | $ | 1,019.91 | $ | 5.35 | 1.05 | % | 184 | 365 | ||||||||||||||||||
| Class B | $ | 1,000.00 | $ | 1,005.80 | $ | 9.10 | $ | 1,000.00 | $ | 1,016.13 | $ | 9.15 | 1.80 | 184 | 365 | |||||||||||||||||||
| Class C | $ | 1,000.00 | $ | 1,004.40 | $ | 9.04 | $ | 1,000.00 | $ | 1,016.18 | $ | 9.10 | 1.79 | 184 | 365 | |||||||||||||||||||
| Class I | $ | 1,000.00 | $ | 1,010.70 | $ | 3.90 | $ | 1,000.00 | $ | 1,021.32 | $ | 3.92 | 0.77 | 184 | 365 | |||||||||||||||||||
| Class R3 | $ | 1,000.00 | $ | 1,008.00 | $ | 6.83 | $ | 1,000.00 | $ | 1,018.40 | $ | 6.87 | 1.35 | 184 | 365 | |||||||||||||||||||
| Class R4 | $ | 1,000.00 | $ | 1,009.50 | $ | 5.32 | $ | 1,000.00 | $ | 1,019.91 | $ | 5.35 | 1.05 | 184 | 365 | |||||||||||||||||||
| Class R5 | $ | 1,000.00 | $ | 1,011.00 | $ | 3.80 | $ | 1,000.00 | $ | 1,021.42 | $ | 3.82 | 0.75 | 184 | 365 | |||||||||||||||||||
| Class Y | $ | 1,000.00 | $ | 1,011.20 | $ | 3.55 | $ | 1,000.00 | $ | 1,021.68 | $ | 3.57 | 0.70 | 184 | 365 | |||||||||||||||||||
| 37 |
| The Hartford High Yield Fund |
| Approval of Investment Management and Investment Sub-Advisory Agreements (Unaudited) |
Section 15(c) of the Investment Company Act of 1940, as amended (the “1940 Act”), requires that each mutual fund’s board of directors, including a majority of those directors who are not “interested persons” of the mutual fund, as defined in the 1940 Act (the “Independent Directors”), annually review and consider the continuation of the mutual fund’s investment advisory and sub-advisory agreements. At its meeting held on August 5-6, 2014, the Board of Directors (the “Board”) of The Hartford Mutual Funds, Inc., including each of the Independent Directors, unanimously voted to approve the continuation of the investment management agreement for The Hartford High Yield Fund (the “Fund”) with Hartford Funds Management Company, LLC (“HFMC”) and the continuation of the investment sub-advisory agreement between HFMC and the Fund’s sub-adviser, Wellington Management Company, LLP (the “Sub-adviser,” and together with HFMC, the “Advisers”) (collectively, the “Agreements”).
In the months preceding the August 5-6, 2014 meeting, the Board requested, received and reviewed written responses from the Advisers to questions posed to them on behalf of the Independent Directors and supporting materials relating to those questions and responses. The Board considered information furnished to the Board at its meetings throughout the year, as well as information specifically prepared in connection with the annual approval of the Agreements at the Board’s meetings held on June 17-18, 2014 and August 5-6, 2014. Information provided to the Board at its meetings throughout the year included, among other things, reports on Fund performance, legal and compliance matters, sales and marketing activity, shareholder services, and the other services provided to the Fund by the Advisers and their affiliates. The Board also received in-person presentations by Fund officers and representatives of HFMC at the Board’s meetings on June 17-18, 2014 and August 5-6, 2014 concerning the Agreements.
The Independent Directors, advised by independent legal counsel, engaged service providers to assist them with evaluating the Agreements with respect to the Fund. Lipper Inc. (“Lipper”), an independent provider of investment company data, was retained to provide the Board with reports on how the Fund’s contractual management fees, actual management fees, other non-management fees, overall expense ratios and investment performance compared to those of mutual funds with similar investment objectives. The Independent Directors also engaged an independent financial services consultant (the “Consultant”) to assist them in evaluating the Fund’s management fees, sub-advisory fees, other non-management fees, overall expense ratios and investment performance. In addition, the Consultant reviewed the profitability calculations utilized by HFMC in connection with the continuation of the investment management agreement.
In determining whether to continue the Agreements for the Fund, the members of the Board reviewed and evaluated information and factors they believed to be relevant and appropriate in light of the information that the Board deemed necessary and appropriate through the exercise of its reasonable business judgment. While individual members of the Board may have weighed certain factors differently, the Board’s determination to continue the Agreements was based on a comprehensive consideration of all information provided to the Board throughout the year and specifically with respect to the continuation of the Agreements. A more detailed discussion of the factors the Board considered with respect to its approval of the Agreements is provided below.
Nature, Extent and Quality of Services Provided by the Advisers
The Board requested and considered information concerning the nature, extent and quality of the services provided to the Fund by the Advisers. The Board considered, among other things, the terms of the Agreements and the range of services provided by the Advisers. The Board considered the Advisers’ professional personnel who provide services to the Fund, including each Adviser’s ability and experience in attracting and retaining qualified personnel to service the Fund. The Board considered each Adviser’s reputation and overall financial strength, as well as its willingness to consider and implement organizational and operational changes designed to enhance services to the Hartford Funds. In addition, the Board considered the quality of each Adviser’s communications with the Board and responsiveness to Board inquiries and requests made from time to time with respect to the Fund and other Hartford Funds.
The Board also requested and evaluated information concerning each Adviser’s regulatory and compliance environment. In this regard, the Board requested and reviewed information on each Adviser’s compliance policies and procedures, compliance history, and a report from the Fund’s Chief Compliance Officer on each Adviser’s compliance with applicable laws and regulations, including responses to regulatory developments and compliance issues raised by regulators. The Board also noted the Advisers’ support of the Fund’s compliance control structure, particularly the resources devoted by the Advisers in support of the Fund’s obligations pursuant to Rule 38a-1 under the 1940 Act.
With respect to HFMC, the Board noted that, under the Agreements, HFMC is responsible for the management of the Fund, including oversight of fund operations and service providers, and provides administrative and investment advisory services in connection with selecting, monitoring and supervising the Sub-adviser. The Board considered HFMC’s ongoing monitoring of people, process and performance, including its quarterly reviews of each of the Hartford Funds, semi-annual meetings with the leaders of each Fund’s portfolio management team, and oversight of the Hartford Funds’ approximately 66 portfolio managers. The Board recognized that HFMC has demonstrated a record of making changes to the
| 38 |
| The Hartford High Yield Fund |
| Approval of Investment Management and Investment Sub-Advisory Agreements (Unaudited) – (continued) |
management and/or strategies of the Hartford Funds when warranted. The Board considered HFMC’s oversight of the Sub-adviser’s investment approach and results, process for monitoring best execution of portfolio trades by the Sub-adviser, and approach to risk management with respect to the Fund and the service providers to the Fund. The Board also considered HFMC’s oversight of compliance with the Fund’s objective and policies as well as with applicable laws and regulations, noting that regulatory and other developments had over time led to an increase in the scope of HFMC’s services in this regard.
In addition, the Board considered HFMC’s ongoing commitment to review and rationalize the Hartford Funds product line-up and the expenses that HFMC had incurred in connection with fund combinations in recent years. The Board considered that HFMC or its affiliates are responsible for providing the Fund’s officers.
With respect to the Sub-adviser, which provides certain day-to-day portfolio management services for the Fund, the Board considered the quality of the Fund’s portfolio manager, the Sub-adviser’s other investment personnel, its investment philosophy and process, investment research capabilities and resources, performance record, trade execution capabilities and experience. The Board considered the experience of the Fund’s portfolio manager, the number of accounts managed by the portfolio manager, and the Sub-adviser’s method for compensating the portfolio manager.
Based on these considerations, the Board concluded that it was satisfied with the nature, extent and quality of the services provided to the Fund by HFMC and the Sub-adviser.
Performance of the Fund and the Advisers
The Board considered the investment performance of the Fund. In this regard, the Board reviewed the performance of the Fund over different time periods presented in the materials and evaluated HFMC’s analysis of the Fund’s performance for these time periods. The Board considered information and materials provided to the Board by the Advisers concerning Fund performance, as well as information from Lipper comparing the investment performance of the Fund to an appropriate benchmark and universe of peer funds. The Board noted that the Fund’s performance was in the 3rd quintile of its performance universe for the 1-year period and the 4th quintile for the 3- and 5-year periods. The Board also noted that the Fund’s performance was in line with its benchmark for the 1-year period and below its benchmark for the 3- and 5-year periods. In considering the Fund’s performance record, the Board noted that the Fund had transitioned to Wellington Management Company, LLP as sub-adviser in 2012.
The Board considered the detailed investment analytics reports provided by Hartford Funds’ Investment Advisory Group throughout the year. These reports include, among other things, information on the Fund’s gross and net returns, the Fund’s investment performance relative to an appropriate benchmark and peer group, various statistics concerning the Fund’s portfolio, and a narrative summary of various factors affecting Fund performance. The Board considered the Advisers’ cooperation with the Investment Committee, which assists the Board in evaluating the performance of the Fund at periodic meetings throughout the year. The Board also considered the analysis provided by the Consultant relating to the Fund’s performance track record.
In light of all the considerations noted above, the Board concluded that it had continued confidence in HFMC’s and the Sub-adviser’s overall capabilities to manage the Fund.
Costs of the Services and Profitability of the Advisers
The Board reviewed information regarding HFMC’s cost to provide investment management and related services to the Fund and HFMC’s profitability, both overall and for the Fund, on a pre-tax basis without regard to distribution expenses. The Board also requested and reviewed information about the profitability to HFMC and its affiliates from all services provided to the Fund and all aspects of their relationship with the Fund. The Board also requested and received information relating to the operations and profitability of the Sub-adviser.
The Board considered the Consultant’s review of the profitability calculations used by HFMC in connection with the continuation of the investment management agreement, noting the Consultant’s view that Hartford Funds’ process for calculating and reporting Fund profitability is reasonable. In this regard, the Board noted that the Consultant performed a full review of this process in light of the recent restructuring of the Hartford Funds business and reported that the approach to analyzing Fund profitability, including the use of common expense allocation methodologies, is reasonable, sound and well within common industry practice.
| 39 |
| The Hartford High Yield Fund |
| Approval of Investment Management and Investment Sub-Advisory Agreements (Unaudited) – (continued) |
Based on these considerations, the Board concluded that the profits anticipated to be realized by the Advisers and their affiliates from their relationships with the Fund would not be excessive.
Comparison of Fees and Services Provided by the Advisers
The Board considered comparative information with respect to the management fees to be paid by the Fund to HFMC and the total expense ratios of the Fund. The Board also considered comparative information with respect to the sub-advisory fees to be paid by HFMC to the Sub-adviser. In this regard, the Board requested and reviewed information from HFMC and the Sub-adviser relating to the management and sub-advisory fees, including the sub-advisory fee schedule for the Fund, and total operating expenses for the Fund. With respect to the sub-advisory fee schedule, the Board considered representations from HFMC and the Sub-adviser that the Sub-adviser’s fees were negotiated at arm’s length on a fund-by-fund basis. The Board also reviewed information from Lipper comparing the Fund’s contractual management fees, actual management fees and overall expense ratios relative to a group of funds selected by Lipper, in consultation with the Consultant, and a broader universe of funds selected by Lipper. The Board considered that the Fund’s contractual management fee and actual management fee were in the 2nd quintile of its expense group, while its total expenses (less 12b-1 and shareholder service fees) were in the 1st quintile. The Board noted that the Fund has an automatically renewable contractual expense cap on each share class. The expense cap resulted in reimbursement of certain expenses incurred in 2013.
While the Board recognized that comparisons between the Fund and peer funds may be imprecise, given the different service levels and characteristics of mutual funds and the different business models and cost structures of the Advisers, the comparative information provided by Lipper assisted the Board in evaluating the reasonableness of the Fund’s management and sub-advisory fees and total operating expenses. In addition, the Board considered the analysis and recommendations of the Consultant relating to the Fund’s management and sub-advisory fees and total operating expenses.
Based on these considerations, the Board concluded that the Fund’s fees and total operating expenses, in conjunction with the information about quality of services, profitability, economies of scale, and other matters discussed, were reasonable in light of the services provided.
Economies of Scale
The Board requested and considered information regarding the Advisers’ realization of economies of scale with respect to the Fund and whether the fee levels reflect these economies of scale for the benefit of the Fund’s shareholders. The Board reviewed the breakpoints in the management fee schedule for the Fund, which reduce fee rates as Fund assets grow over time. The Board recognized that a fund with assets beyond the highest breakpoint level will continue to benefit from economies of scale because additional assets are charged the lowest breakpoint fee resulting in lower overall effective management fee rates. The Board also considered that expense limitations and fee waivers that reduce the Fund’s expenses at all asset levels can have the same effect as breakpoints in sharing economies of scale with shareholders and provide protection from an increase in expenses if Fund assets decline. The Board recognized that a fee schedule that reaches a lower breakpoint quickly provides shareholders with the benefit of anticipated or potential economies of scale. The Board also considered that HFMC has been active in managing expenses, which has resulted in benefits being realized by shareholders as assets within the Hartford Funds family of funds have grown over time, including through lower transfer agent costs and other operating expenses.
The Board reviewed and evaluated materials from Lipper and the Consultant showing how management fee schedules of peer funds reflect economies of scale for the benefit of shareholders as a peer fund’s assets hypothetically increase over time. Based on information provided by HFMC, Lipper, and the Consultant, the Board recognized that there is no uniform methodology for establishing breakpoints or uniform pattern in asset levels that trigger breakpoints or the amounts of breakpoints triggered.
After considering all of the information available to it, the Board concluded that it was satisfied with the extent to which economies of scale would be shared for the benefit of the Fund’s shareholders based on currently available information and the effective advisory fees and expense ratios for the Fund at its current and reasonably anticipated asset levels. The Board noted, however, that it would continue to monitor future growth in Fund assets and the appropriateness of additional breakpoints.
Other Benefits
The Board considered other benefits to the Advisers and their affiliates from their relationships with the Fund.
| 40 |
| The Hartford High Yield Fund |
| Approval of Investment Management and Investment Sub-Advisory Agreements (Unaudited) – (continued) |
The Board noted that HFMC receives fees for fund accounting and related services from the Fund, and the Board considered information on profits to HFMC for such services. The Board also considered that Hartford Administrative Services Company (“HASCO”), the Fund’s transfer agent and an affiliate of HFMC, receives transfer agency compensation from the Fund, and the Board reviewed information on the profitability of the Fund’s transfer agency function to HASCO. The Board considered information provided by HASCO indicating that the transfer agent fees charged by HASCO to the Fund were fair and reasonable based on publicly available information.
The Board also considered that Hartford Funds Distributors, LLC (“HFD”), an affiliate of HFMC, serves as principal underwriter of the Fund. As principal underwriter, HFD receives 12b-1 fees from the Fund and receives all or a portion of the sales charges on sales or redemptions of certain classes of shares. The Board also noted that certain affiliates of HFD distribute shares of the Fund and receive compensation in that connection.
The Board considered the benefits, if any, to the Sub-adviser from any use of the Fund’s brokerage commissions to obtain soft dollar research, and representations from HFMC and the Sub-adviser that the Sub-adviser would not make any revenue-sharing payments or any other type of distribution payments to HFMC or its affiliates.
The Board considered the benefits to shareholders of being part of the Hartford Funds family of funds, including the right to exchange investments between the same class of funds without a sales charge, the ability to reinvest Fund dividends into other funds in the family, and the ability to combine holdings in the Fund with holdings in other funds to obtain a reduced sales charge. The Board considered HFMC’s efforts to provide investors in the family with a broad range of investment styles and asset classes and its entrepreneurial risk in initiating new funds to expand these opportunities for shareholders.
* * * *
Based upon its review of these various factors, among others, the Board concluded that it is in the best interests of the Fund and its shareholders for the Board to approve the Agreements for an additional year. In reaching this decision, the Board did not assign relative weights to the factors discussed above or deem any one or group of them to be controlling in and of themselves. In connection with their deliberations, the Independent Directors met separately in executive session on several occasions, with independent legal counsel and the Consultant, to review the relevant materials and consider their responsibilities under relevant laws and regulations.
| 41 |
| The Hartford High Yield Fund |
| Main Risks (Unaudited) |
The main risks of investing in the Fund are described below.
Market, Selection and Strategy Risk: The Fund’s share price may fluctuate due to market risk and/or security selections that may underperform the market or relevant benchmarks. If the sub-adviser's investment strategy does not perform as expected, the Fund could underperform its peers or lose money. There is no guarantee the Fund will achieve its stated objective.
Junk Bond Risk: Investments in junk bonds involve greater risk of price volatility, illiquidity, and default than higher-rated debt securities.
Fixed Income Risk: The Fund is subject to interest rate risk (the risk that the value of an investment decreases when interest rates rise), credit risk (the risk that the issuing company of a security is unable to pay interest and principal when due), liquidity risk (the risk that an investment may be difficult to sell at an advantageous time or price) and call risk (the risk that an investment may be redeemed early).
Foreign Investment Risk: Investments in foreign securities may be riskier than investments in U.S. securities. Potential risks include the risks of illiquidity, increased price volatility, less government regulation, less extensive and less frequent accounting and other reporting requirements, unfavorable changes in currency exchange rates, and economic and political disruptions.
Derivatives Risk: Investments in derivatives can be volatile. Potential risks include currency risk, leverage risk (the risk that small market movements may result in large changes in the value of an investment), liquidity risk, index risk, pricing risk, and counterparty risk (the risk that the counterparty may be unwilling or unable to honor its obligations).
Active Trading Risk: Actively trading investments may result in higher costs and higher taxable income.
| 42 |
THIS PRIVACY POLICY IS NOT PART OF THIS REPORT
Privacy Policy and Practices of The Hartford Financial Services Group, Inc. and its Affiliates
(herein called “we, our and us”)
This Privacy Policy applies to our United States Operations
We value your trust. We are committed to the responsible: a) management; b) use; and c) protection; of Personal Information.
This notice describes how we collect, disclose, and protect Personal Information.
We collect Personal Information to: a) service your Transactions with us; and b) support our business functions.
We may obtain Personal Information from: a) You; b) your Transactions with us; and c) third parties such as a consumer-reporting agency.
Based on the type of product or service You apply for or get from us, Personal Information such as: a) your name; b) your address; c) your income; d) your payment; or e) your credit history; may be gathered from sources such as applications, Transactions, and consumer reports.
To serve You and service our business, we may share certain Personal Information. We will share Personal Information, only as allowed by law, with affiliates such as: a) our insurance companies; b) our employee agents; c) our brokerage firms; and d) our administrators.
As allowed by law, we may share Personal Financial Information with our affiliates to: a) market our products; or b) market our services; to You without providing You with an option to prevent these disclosures. |
We may also share Personal Information, only as allowed by law, with unaffiliated third parties including: a) independent agents; b) brokerage firms; c) insurance companies; d) administrators; and e) service providers; who help us serve You and service our business.
When allowed by law, we may share certain Personal Financial Information with other unaffiliated third parties who assist us by performing services or functions such as: a) taking surveys; b) marketing our products or services; or c) offering financial products or services under a joint agreement between us and one or more financial institutions.
We, and third parties we partner with, may track some of the pages You visit through the use of: a) cookies; b) pixel tagging; or c) other technologies; and currently do not process or comply with any web browser’s “do not track” signal or similar mechanism that indicates a request to disable online tracking of individual users who visit our websites or use our services.
We will not sell or share your Personal Financial Information with anyone for purposes unrelated to our business functions without offering You the opportunity to: a) “opt-out;” or b) “opt-in;” as required by law.
We only disclose Personal Health Information with: a) your proper written authorization; or b) as otherwise allowed or required by law.
Our employees have access to Personal Information in the course of doing their jobs, such as: a) underwriting policies; b) paying claims; c) developing new products; or d) advising customers of our products and services. |
We use manual and electronic security procedures to maintain: a) the confidentiality; and b) the integrity of; Personal Information that we have. We use these procedures to guard against unauthorized access.
Some techniques we use to protect Personal Information include: a) secured files; b) user authentication; c) encryption; d) firewall technology; and e) the use of detection software.
We are responsible for and must: a) identify information to be protected; b) provide an adequate level of protection for that data; c) grant access to protected data only to those people who must use it in the performance of their job-related duties.
Employees who violate our Privacy Policy will be subject to discipline, which may include ending their employment with us.
At the start of our business relationship, we will give You a copy of our current Privacy Policy.
We will also give You a copy of our current Privacy Policy once a year if You maintain a continuing business relationship with us.
We will continue to follow our Privacy Policy regarding Personal Information even when a business relationship no longer exists between us.
|
As used in this Privacy Notice:
Application means your request for our product or service.
Personal Financial Information means financial information such as: a) credit history; b) income; c) financial benefits; or d) policy or claim information.
Personal Health Information means health information such as: a) your medical records; or b) information about your illness, disability or injury.
Personal Information means information that identifies You personally and is not otherwise available to the public. It includes: a) Personal Financial Information; and b) Personal Health Information.
Transaction means your business dealings with us, such as: a) your Application; b) your request for us to pay a claim; and c) your request for us to take an action on your account.
You means an individual who has given us Personal Information in conjunction with: a) asking about; b) applying for; or c) obtaining; a financial product or service from us if the product or service is used mainly for personal, family, or household purposes. |
This Privacy Policy is being provided on behalf of the following affiliates of The Hartford Financial Services Group, Inc.:
1stAGChoice, Inc.; Access CoverageCorp, Inc.; Access CoverageCorp Technologies, Inc.; American Maturity Life Insurance Company; Archway 60 R, LLC; Business Management Group, Inc.; Champlain Life Reinsurance Company; DMS R, LLC; Eloy R, LLC; Ersatz Corporation; First State Insurance Company; Hartford Accident and Indemnity Company; Hartford Administrative Services Company; Hartford Casualty General Agency, Inc.; Hartford Casualty Insurance Company; Hartford-Comprehensive Employee Benefit Service Company; Hartford Equity Sales Company, Inc.; Hartford Fire General Agency, Inc.; Hartford Fire Insurance Company; Hartford Funds Management Company, LLC; Hartford Funds Management Group, Inc.; Hartford HLS Series Fund II, Inc.; Hartford Insurance Company of Illinois; Hartford Insurance Company of the Midwest; Hartford Insurance Company of the Southeast; Hartford Integrated Technologies, Inc.; Hartford International Life Reassurance Corporation; Hartford Funds Distributors, LLC; Hartford Investment Management Company; Hartford Life and Accident Insurance Company; Hartford Life and Annuity Insurance Company; Hartford Life Insurance Company; Hartford Life Private Placement, LLC; Hartford Lloyd’s Corporation; Hartford Lloyd’s Insurance Company; Hartford Mezzanine Investors I, LLC; Hartford Residual Market, L.C.C.; Hartford Retirement Services, LLC; Hartford Securities Distribution Company, Inc.; Hartford Series Fund, Inc.; Hartford Specialty Insurance Services of Texas, LLC; Hartford Strategic Investments, LLC; Hartford Underwriters Insurance Company; Hartford Technology Services Company, L.L.C.; Hartford of Texas General Agency, Inc.; Hartford Underwriters General Agency, Inc.; HARTRE Company, L.C.C.; HL Investment Advisors, LLC; HLA LLC; Horizon Management Group, LLC; HRA Brokerage Services, Inc.; Lanidex Class B, LLC; M-CAP Insurance Agency, LLC; New England Insurance Company; New England Reinsurance Corporation; Nutmeg Insurance Agency, Inc.; Nutmeg Insurance Company; Pacific Insurance Company, Limited; Planco, LLC: Property and Casualty Insurance Company of Hartford; Revere R, LLC; RVR R, LLC; Sentinel Insurance Company, Ltd.; Sunstone R, LLC; Symphony R, LLC; The Evergreen Group Incorporated; The Hartford Alternative Strategies Fund; The Hartford Mutual Funds, Inc.; The Hartford Mutual Funds II, Inc.; Trumbull Flood Management, L.L.C.; Trumbull Insurance Company; Twin City Fire Insurance Company; White River Life Reinsurance Company.
HPP Revised January 2014
HARTFORDFUNDS
hartfordfunds.com
This information is written in connection with the promotion or marketing of the matter(s) addressed in this material.
This report is submitted for the general information of the shareholders of the Fund. It is not authorized for distribution unless preceded or accompanied by a current prospectus for the Fund.
The information cannot be used or relied upon for the purpose of avoiding IRS penalties. These materials are not intended to provide tax, accounting or legal advice. As with all matters of a tax or legal nature, you should consult your own tax or legal counsel for advice.
Investors should carefully consider the investment objectives, risks, charges, and expenses of Hartford Funds before investing. This and other information can be found in the prospectus and summary prospectus, which can be obtained by calling 888-843-7824 (retail) or 800-279-1541 (institutional). Investors should read them carefully before they invest.
Hartford Funds are underwritten and distributed by Hartford Funds Distributors, LLC.
MFAR-HY14 12/14 113985-3 Printed in U.S.A.
HARTFORDFUNDS
|
THE HARTFORD
2014 Annual Report |
A MESSAGE FROM THE PRESIDENT
Dear Fellow Shareholders:
Thank you for investing in Hartford Funds.
Market Review
U.S. equities (as represented by the S&P 500 Index) rose steadily for the fiscal year ended October 31, 2014, with a return of 17.27% for the period. With the exception of short-lived geopolitical scares early in 2014 and concerns about continuing global growth near the end of the period, stocks generally rose on solid fundamentals and encouraging macroeconomic data during the year.
September 2014 marked the six-year anniversary of the start of the financial crisis. Within weeks of that anniversary, both the S&P 500 Index and the Dow Jones Industrial Average set new all-time highs, closing at 2,018 and 17,391, respectively, on October 31. Although the fallout of the crisis continues to influence investor behavior, stocks have recovered and risen dramatically, up 198% from their low in March 2009. Meanwhile, the domestic economy is notching strong growth, and the unemployment rate has reached its lowest level since August 2008.
While the U.S. economy appears to have stabilized and to have reverted to a solid growth path, the outlook for the global economy appears to have gotten cloudier. The U.S. Federal Reserve has ended quantitative easing, while Europe and Japan are pursuing stimulus options to avoid a double-dip recession and deflation, respectively. Diverging central-bank policies will likely continue to play an important role in market movements going forward as investors wait to see the reactions to their efforts and their impacts on global markets.
How have market movements impacted your portfolio throughout the last year? Are your investments still on track to provide the growth or income you need, and are you comfortable with their progress during times of volatility?
Your financial professional can help you navigate today’s markets with confidence, as well as assist you to achieve your investment goals by providing advice on the best options within our fund family to help you work toward overcoming today’s investing challenges. Meet with your financial advisor regularly to examine your portfolio and your investment strategy, and to determine if you’re still on track to meet your goals.
Thank you again for investing with Hartford Funds.
James Davey
President
Hartford Funds
1 The S&P 500 Index is a market capitalization-weighted price index composed of 500 widely held common stocks.
2 The Dow Jones Industrial Average is an unmanaged, price-weighted index of 30 of the largest, most widely held stocks traded on the NYSE
The Hartford Inflation Plus Fund
Table of Contents
The views expressed in the Fund’s Manager Discussion under ‘‘Why did the Fund perform this way?’’ and ‘‘What is the outlook?’’ are views of the Fund’s sub-adviser and portfolio management team through the end of the period and are subject to change based on market and other conditions. The Fund’s Manager Discussion is for informational purposes only and does not represent an offer, recommendation or solicitation to buy, hold or sell any security. The specific securities identified and described, if any, do not represent all of the securities purchased or sold and you should not assume that investments in the securities identified and discussed will be profitable.
| The Hartford Inflation Plus Fund inception 10/31/2002 |
| (sub-advised by Wellington Management Company, LLP) |
| Investment objective – The Fund seeks a total return that exceeds the rate of inflation over an economic cycle. |
Performance Overview 10/31/04 - 10/31/14
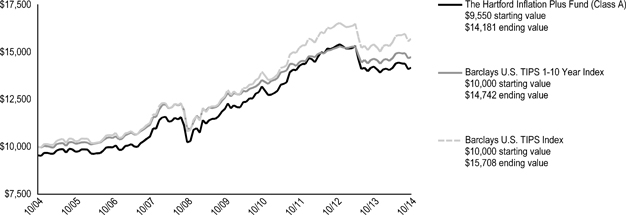
The chart above represents the hypothetical growth of a $10,000 investment in Class A, which includes a sales charge. Growth results in classes other than Class A will vary from what is seen above due to differences in the expenses charged to those share classes.
| Average Annual Total Returns (as of 10/31/14) |
| 1 Year | 5 Years | 10 Years | ||||||||||
| Inflation Plus A# | -0.43 | % | 3.41 | % | 4.03 | % | ||||||
| Inflation Plus A## | -4.91 | % | 2.46 | % | 3.55 | % | ||||||
| Inflation Plus B# | -1.16 | % | 2.64 | % | 3.41 | %* | ||||||
| Inflation Plus B## | -5.90 | % | 2.30 | % | 3.41 | %* | ||||||
| Inflation Plus C# | -1.16 | % | 2.66 | % | 3.25 | % | ||||||
| Inflation Plus C## | -2.11 | % | 2.66 | % | 3.25 | % | ||||||
| Inflation Plus I# | -0.16 | % | 3.68 | % | 4.27 | % | ||||||
| Inflation Plus R3# | -0.74 | % | 3.06 | % | 3.80 | % | ||||||
| Inflation Plus R4# | -0.54 | % | 3.36 | % | 4.03 | % | ||||||
| Inflation Plus R5# | -0.16 | % | 3.68 | % | 4.27 | % | ||||||
| Inflation Plus Y# | -0.13 | % | 3.78 | % | 4.34 | % | ||||||
| Barclays U.S. TIPS 1-10 Year Index | 0.60 | % | 3.21 | % | 3.96 | % | ||||||
| Barclays U.S. TIPS Index | 1.90 | % | 4.41 | % | 4.62 | % | ||||||
| # | Without sales charge |
| ## | With sales charge |
| * | Class B shares convert to Class A shares after 8 years. The return shown reflects the conversion to Class A shares, which had different operating expenses, for the period after conversion. |
PERFORMANCE DATA QUOTED REPRESENTS PAST PERFORMANCE AND DOES NOT GUARANTEE FUTURE RESULTS. The investment return and principal value of the investment will fluctuate so that investors’ shares, when redeemed, may be worth more or less than their original cost. Current performance may be lower or higher than the performance data quoted. To obtain performance data current to the most recent month-end, please visit our website www.hartfordfunds.com.
The initial investment in Class A shares reflects the maximum sales charge of 4.50% and returns for Class B shares reflect a contingent deferred sales charge of up to 5.00% and declining to zero, depending on the period of time the shares are held. Returns for Class C shares reflect a contingent deferred sales charge of up to 1.00% on shares redeemed within twelve months of purchase.
Total returns presented above were calculated using the Fund’s net asset value available to shareholders for sale or redemption of Fund shares on October 31, 2014, which may exclude investment transactions as of this date. All share class returns assume the reinvestment of all distributions at net asset value and the deduction of all fund expenses.
Effective 9/30/09, Class B shares of the Fund were closed to new investments.
Class I shares commenced operations on 8/31/06. Performance prior to that date is that of the Fund’s Class A shares (excluding sales charges), which had different operating expenses. Class R3, R4 and R5 shares commenced operations on 12/22/06. Performance prior to that date is that of the Fund’s Class Y shares, which had different operating expenses.
Performance information includes performance under the Fund’s previous sub-adviser, Hartford Investment Management Company. As of March 5, 2012, Hartford Investment Management Company no longer served as the sub-adviser to the Fund.
Barclays U.S. TIPS 1-10 Year Index represents securities that protect against adverse inflation and provide a minimum level of real return. To be included in this index, bonds must have cash flows linked to an inflation index, be sovereign issues denominated in U.S. currency, and have maturities of 1 to 10 years.
Barclays U.S. TIPS Index represents securities that protect against adverse inflation and provide a minimum level of real return. To be included in this index, bonds must have cash flows linked to an inflation index, be sovereign issues denominated in U.S. currency, and have more than one year to maturity.
You cannot invest directly in an index.
The chart and table do not reflect the deductions of taxes that a shareholder would pay on Fund distributions or the redemption of Fund shares.
Performance information may reflect historical or current expense waivers/reimbursements from the investment adviser, without which performance would have been lower. For information on current expense waivers/reimbursements, please see the prospectus.
| 2 |
| The Hartford Inflation Plus Fund |
| Manager Discussion |
| October 31, 2014 (Unaudited) |
| Operating Expenses* | ||||||||
| Net | Gross | |||||||
| Inflation Plus Class A | 0.85 | % | 0.88 | % | ||||
| Inflation Plus Class B | 1.60 | % | 1.69 | % | ||||
| Inflation Plus Class C | 1.60 | % | 1.60 | % | ||||
| Inflation Plus Class I | 0.60 | % | 0.65 | % | ||||
| Inflation Plus Class R3 | 1.20 | % | 1.22 | % | ||||
| Inflation Plus Class R4 | 0.90 | % | 0.91 | % | ||||
| Inflation Plus Class R5 | 0.60 | % | 0.63 | % | ||||
| Inflation Plus Class Y | 0.51 | % | 0.51 | % | ||||
| * | As shown in the Fund's current prospectus dated March 1, 2014. Actual expenses may be higher or lower. Please see accompanying Financial Highlights for expense ratios for the year ended October 31, 2014. |
Gross expenses are the Fund's total annual operating expenses shown in the Fund's most recent prospectus. Net expenses are the Fund's total annual operating expenses shown in the Fund's most recent prospectus and reflect contractual expense reimbursements in instances when these reductions reduce the Fund's gross expenses. Contractual reimbursements remain in effect until February 28, 2015, and automatically renew for one-year terms unless terminated.
All investments are subject to risk including the possible loss of principal. For a discussion of the Fund’s risks, please see the Main Risks section of this report. For more detailed information on the risks associated with an investment in the Fund, please see the prospectus.
| Portfolio Manager |
| Lindsay T. Politi |
| Vice President and Fixed Income Portfolio Manager |
How did the Fund perform?
The Class A shares of The Hartford Inflation Plus Fund returned -0.43%, before sales charge, for the twelve-month period ended October 31, 2014, underperforming the Fund’s benchmarks, the Barclays U.S. TIPS 1-10 Year Index, and Barclays U.S. TIPS Index, which returned 0.60%, and 1.90%, respectively, for the same time period. The Fund also underperformed the 1.34% average return of the Lipper Inflation Protected Bond Funds peer group, a group of funds that invest primarily in inflation-indexed fixed income securities. Inflation-linked bonds are fixed income securities structured to provide protection against inflation.
Why did the Fund perform this way?
Fixed income markets gained throughout much of the period as expectations of prolonged easy monetary policy by major central banks and a supportive macroeconomic environment kept rates low and suppressed volatility. Early in the period emerging markets dominated headlines as economic and political developments sparked risk aversion across global markets, pushing bond prices higher and yields lower amid a flight to quality. Toward the end of the period, however, persistent geopolitical risks – tensions between Ukraine and Russia and violence in Iraq – and Chinese economic slowdown concerns raised questions about the global growth rate, keeping a lid on risk appetites overall.
The period was also highlighted by a divergence in central bank policies. The European Central Bank (ECB) cut its benchmark lending and deposit rates and announced a host of stimulus measures in an effort to encourage lending and fend off fears of deflation. China’s central bank joined the ECB in boosting liquidity by injecting funds into the nation’s largest banks in an attempt to combat weakening growth. The Bank of Japan pre-emptively announced incremental monetary easing to counter the risk of missing the country’s inflation and growth targets. In contrast, the Bank of England and U.S. Federal Reserve (Fed) leaned toward tighter policies. The Fed ended its quantitative easing program as U.S. data largely suggested the economy was on a sustainable growth path. In the U.S., second quarter Gross Domestic Product rebounded after the first quarter’s steep contraction. The labor market strengthened as the unemployment rate dropped to a six-year low. Housing regained some lost ground after a weak start to the year, though the pace of home price appreciation started to slow after a strong 2013. Inflation pressures were muted overall, alleviating pressure on the Fed to raise rates.
The U.S. Treasury curve flattened as markets contemplated bringing interest rates to normal levels; short-term yields rose while longer term rates declined. Most credit risk sectors posted positive absolute returns and outperformed duration-equivalent government bonds as credit spreads tightened.
TIPS returns were positive for the twelve months ended October 31, 2014, though TIPS returned less than nominal Treasuries of similar durations. The TIPS curve flattened during the period; consequently, longer dated maturities outperformed shorter maturities. Breakeven inflation rates, which can be regarded as a proxy for the market’s inflation expectations, rose during the early part of the period before falling sharply in the 3rd quarter of 2014 as a strengthening U.S. dollar and falling energy prices weighed on inflation.
The Fund lagged its benchmarks during the period primarily due to relative value positioning within the TIPS market. The Fund was overweight TIPS with shorter maturities, which were more sensitive to falling near-term inflation expectations in the 3rd quarter. This was partially offset by out-of-benchmark allocations, relative to both benchmarks, to Japanese inflation-linked bonds, as well as bank loans and the Fund’s developed market currency strategy, which were all additive to relative results.
| 3 |
| The Hartford Inflation Plus Fund |
| Manager Discussion – (continued) |
| October 31, 2014 (Unaudited) |
The Fund’s positions in CPI swaps, used to manage inflation exposure, detracted marginally from relative results.
What is the outlook?
In the short term, we believe that recent trends such as falling energy prices, as well as U.S. dollar strength and economic weakness in Europe may continue to weigh on inflation. Over the longer term, however, we believe that inflation will move higher in the U.S. and that the valuation in U.S. breakeven inflation rates is becoming increasingly compelling. In light of this view, the Fund is currently underweight shorter maturity TIPS, which are sensitive to near term inflation expectations, while being simultaneously positioned to benefit if longer term breakeven inflation expectations rise. We expect the Fed to raise rates at a measured pace next year, but we believe that interest rate markets generally incorporate these expectations into current prices. The Fund is therefore positioned close to neutral duration with respect to the Barclays U.S. TIPS 1-10 Year Index. The Fund continued to maintain an allocation to bank loans at the end of the period, which is not included in either benchmark, as we believe that an improving economic environment should be supportive of corporate credit. The Fund also maintained an opportunistic exposure to emerging market inflation-linked bonds, which are not included in either benchmark.
| Credit Exposure | ||||
| as of October 31, 2014 | ||||
| Credit Rating * | Percentage of Net Assets | |||
| Aaa/ AAA | 0.0 | % | ||
| Aa/ AA | 90.9 | |||
| A | 0.2 | |||
| Baa/ BBB | 0.6 | |||
| Ba/ BB | 2.4 | |||
| B | 1.6 | |||
| Not Rated | 0.3 | |||
| Short-Term Instruments | 9.5 | |||
| Other Assets and Liabilities | (5.5 | ) | ||
| Total | 100.0 | % | ||
| * | Credit exposure is the long-term credit ratings for the Fund's holdings, as of the date noted, as provided by Standard and Poor's (S&P) or Moody's Investors Service (Moody's) and typically range from AAA/Aaa (highest) to C/D (lowest). Presentation of S&P and Moody's credit ratings in this report have been selected for informational purposes for shareholders, as well as the Fund's consideration of industry practice. If Moody's and S&P assign different ratings, the lower rating is used. Fixed income securities that are not rated by either agency are listed as "Not Rated." Ratings do not apply to the Fund itself or to the Fund's shares. Ratings may change. |
Diversification by Security Type
as of October 31, 2014
| Category | Percentage of Net Assets | |||
| Fixed Income Securities | ||||
| Foreign Government Obligations | 0.8 | % | ||
| Senior Floating Rate Interests | 4.3 | |||
| U.S. Government Agencies | 0.0 | |||
| U.S. Government Securities | 90.9 | |||
| Total | 96.0 | % | ||
| Short-Term Investments | 9.5 | |||
| Other Assets and Liabilities | (5.5 | ) | ||
| Total | 100.0 | % | ||
| 4 |
| The Hartford Inflation Plus Fund |
| Schedule of Investments |
| October 31, 2014 |
| (000’s Omitted) |
| Shares or Principal Amount ╬ | Market Value ╪ | |||||||
| Foreign Government Obligations - 0.8% | ||||||||
| Brazil - 0.3% | ||||||||
| Brazil (Republic of) | ||||||||
| BRL | 11,820 | 9.67%, 09/01/2020 ○ | $ | 3,063 | ||||
| Mexico - 0.2% | ||||||||
| Mexico (United Mexican States) | ||||||||
| MXN | 24,930 | 4.00%, 06/13/2019 ◄ | 2,045 | |||||
| Uruguay - 0.3% | ||||||||
| Uruguay (Republic of) | ||||||||
| UYU | 59,518 | 4.25%, 04/05/2027 ◄ | 2,639 | |||||
| Total Foreign Government Obligations | ||||||||
| (Cost $7,987) | $ | 7,747 | ||||||
| Senior Floating Rate Interests ♦ - 4.3% | ||||||||
| Air Transportation - 0.2% | ||||||||
| Delta Air Lines, Inc., Term Loan | ||||||||
| $ | 1,937 | 3.25%, 04/20/2017 | $ | 1,921 | ||||
| Apparel Manufacturing - 0.1% | ||||||||
| PVH Corp. | ||||||||
| 847 | 3.25%, 02/13/2020 | 847 | ||||||
| Arts, Entertainment and Recreation - 0.1% | ||||||||
| Numericable | ||||||||
| 550 | 4.50%, 05/21/2020 | 551 | ||||||
| Univision Communications, Inc. | ||||||||
| 1,010 | 4.00%, 03/01/2020 | 999 | ||||||
| 1,550 | ||||||||
| Chemical Manufacturing - 0.2% | ||||||||
| Ineos US Finance LLC | ||||||||
| 1,001 | 3.75%, 05/04/2018 | 987 | ||||||
| Minerals Technologies, Inc. | ||||||||
| 699 | 4.00%, 05/07/2021 | 696 | ||||||
| 1,683 | ||||||||
| Computer and Electronic Product Manufacturing - 0.4% | ||||||||
| Avago Technologies Ltd. | ||||||||
| 1,342 | 3.75%, 05/06/2021 | 1,337 | ||||||
| Freescale Semiconductor, Inc. | ||||||||
| 1,970 | 4.25%, 02/28/2020 | 1,941 | ||||||
| Vantiv LLC | ||||||||
| 409 | 3.75%, 06/13/2021 | 406 | ||||||
| 3,684 | ||||||||
| Finance and Insurance - 0.5% | ||||||||
| Asurion LLC | ||||||||
| 1,528 | 5.00%, 05/24/2019 | 1,529 | ||||||
| Chrysler Group LLC | ||||||||
| 1,455 | 3.50%, 05/24/2017 | 1,446 | ||||||
| RPI Finance Trust | ||||||||
| 2,300 | 3.25%, 11/09/2018 | 2,286 | ||||||
| 5,261 | ||||||||
| Food Manufacturing - 0.1% | ||||||||
| H.J. Heinz Co. | ||||||||
| 923 | 3.50%, 06/05/2020 | 917 | ||||||
| Health Care and Social Assistance - 0.5% | ||||||||
| Community Health Systems, Inc. | ||||||||
| 318 | 4.25%, 01/27/2021 | 317 | ||||||
| Grifols Worldwide Operations USA, Inc. | ||||||||
| 871 | 3.15%, 02/27/2021 | 859 | ||||||
| HCA, Inc. | ||||||||
| 1,980 | 2.98%, 05/01/2018 | 1,970 | ||||||
| IMS Health, Inc. | ||||||||
| 1,484 | 3.50%, 03/17/2021 | 1,465 | ||||||
| Ortho-Clinical Diagnostics, Inc. | ||||||||
| 434 | 4.75%, 06/30/2021 | 429 | ||||||
| Truven Health Analytics, Inc. | ||||||||
| 489 | 4.50%, 06/06/2019 | 479 | ||||||
| 5,519 | ||||||||
| Health Care Providers and Services - 0.0% | ||||||||
| Multiplan, Inc. | ||||||||
| 425 | 4.00%, 03/31/2021 | 419 | ||||||
| Information - 0.9% | ||||||||
| Charter Communications Operating LLC | ||||||||
| 966 | 3.00%, 01/03/2021 | 949 | ||||||
| Kronos, Inc. | ||||||||
| 1,030 | 4.50%, 10/30/2019 | 1,025 | ||||||
| Lawson Software, Inc. | ||||||||
| 1,185 | 3.75%, 06/03/2020 | 1,168 | ||||||
| Level 3 Financing, Inc. | ||||||||
| 630 | 4.50%, 01/31/2022 ☼ | 633 | ||||||
| MISYS plc | ||||||||
| 1,720 | 5.00%, 12/12/2018 | 1,720 | ||||||
| Telesat Canada | ||||||||
| 1,521 | 3.50%, 03/28/2019 | 1,503 | ||||||
| Virgin Media Finance plc | ||||||||
| 1,000 | 3.50%, 06/07/2020 | 985 | ||||||
| Ziggo B.V. | ||||||||
| 520 | 2.75%, 01/15/2022 ☼Б | 506 | ||||||
| 305 | 3.25%, 01/15/2022 | 297 | ||||||
| 8,786 | ||||||||
| Mining - 0.1% | ||||||||
| Fortescue Metals Group Ltd. | ||||||||
| 1,010 | 3.75%, 06/30/2019 | 984 | ||||||
| Miscellaneous Manufacturing - 0.2% | ||||||||
| DigitalGlobe, Inc. | ||||||||
| 586 | 3.75%, 01/31/2020 | 582 | ||||||
| Reynolds Group Holdings, Inc. | ||||||||
| 1,081 | 4.00%, 11/30/2018 | 1,074 | ||||||
| 1,656 | ||||||||
| Other Services - 0.2% | ||||||||
| Rexnord LLC | ||||||||
| 2,179 | 4.00%, 08/21/2020 | 2,147 | ||||||
| Petroleum and Coal Products Manufacturing - 0.1% | ||||||||
| MEG Energy Corp. | ||||||||
| 860 | 3.75%, 03/31/2020 | 844 | ||||||
| Plastics and Rubber Products Manufacturing - 0.3% | ||||||||
| Berry Plastics Group, Inc. | ||||||||
| 1,010 | 3.50%, 02/08/2020 | 988 | ||||||
| Goodyear (The) Tire & Rubber Co. | ||||||||
| 2,000 | 4.75%, 04/30/2019 | 2,004 | ||||||
| 2,992 | ||||||||
The accompanying notes are an integral part of these financial statements.
| 5 |
| The Hartford Inflation Plus Fund |
| Schedule of Investments – (continued) |
| October 31, 2014 |
| (000’s Omitted) |
| Shares or Principal Amount ╬ | Market Value ╪ | |||||||
| Senior Floating Rate Interests ♦ - 4.3% - (continued) | ||||||||
| Real Estate, Rental and Leasing - 0.1% | ||||||||
| International Lease Finance Corp. | ||||||||
| $ | 685 | 3.50%, 03/06/2021 | $ | 681 | ||||
| Retail Trade - 0.0% | ||||||||
| Michaels Stores, Inc. | ||||||||
| 400 | 4.00%, 01/28/2020 | 395 | ||||||
| Utilities - 0.3% | ||||||||
| Calpine Corp. | ||||||||
| 1,201 | 4.00%, 10/09/2019 | 1,189 | ||||||
| Energy Transfer Equity L.P. | ||||||||
| 2,000 | 3.25%, 12/02/2019 | 1,958 | ||||||
| 3,147 | ||||||||
| Total Senior Floating Rate Interests | ||||||||
| (Cost $43,695) | $ | 43,433 | ||||||
| U.S. Government Agencies - 0.0% | ||||||||
| FNMA - 0.0% | ||||||||
| $ | 2 | 10.50%, 12/01/2018 | $ | 2 | ||||
| GNMA - 0.0% | ||||||||
| 1 | 11.00%, 12/20/2015 - 12/20/2018 | 2 | ||||||
| Total U.S. Government Agencies | ||||||||
| (Cost $4) | $ | 4 | ||||||
| U.S. Government Securities - 90.9% | ||||||||
| U.S. Treasury Securities - 90.9% | ||||||||
| U.S. Treasury Bonds - 1.9% | ||||||||
| $ | 13,800 | 2.38%, 01/15/2027 ◄ | $ | 19,604 | ||||
| U.S. Treasury Notes - 89.0% | ||||||||
| 484,365 | 0.13%, 04/15/2017 - 07/15/2024 □◄‡Θ | 496,004 | ||||||
| 66,630 | 0.38%, 07/15/2023 ◄ | 68,116 | ||||||
| 100,300 | 0.63%, 07/15/2021 - 01/15/2024 ◄ | 105,854 | ||||||
| 55,450 | 1.13%, 01/15/2021 ◄ | 63,678 | ||||||
| 52,115 | 1.25%, 07/15/2020 ◄ | 60,688 | ||||||
| 24,525 | 1.38%, 01/15/2020 ◄ | 28,817 | ||||||
| 37,875 | 1.88%, 07/15/2019 ◄ | 46,203 | ||||||
| 29,830 | 2.13%, 01/15/2019 ◄ | 36,197 | ||||||
| 905,557 | ||||||||
| 925,161 | ||||||||
| Total U.S. Government Securities | ||||||||
| (Cost $934,839) | $ | 925,161 | ||||||
| Total Long-Term Investments | ||||||||
| (Cost $986,525) | $ | 976,345 | ||||||
| Short-Term Investments - 9.5% | ||||||||
| Repurchase Agreements - 9.5% | ||||||||
| Bank of America Merrill Lynch TriParty Repurchase Agreement (maturing on 11/03/2014 in the amount of $277, collateralized by U.S. Treasury Note 1.50%, 2019, value of $282) | ||||||||
| $ | 277 | 0.08%, 10/31/2014 | $ | 277 | ||||
| Bank of America Merrill Lynch TriParty Repurchase Agreement (maturing on 11/03/2014 in the amount of $4,708, collateralized by GNMA 1.63% - 7.00%, 2031 - 2054, value of $4,803) | ||||||||
| 4,708 | 0.09%, 10/31/2014 | 4,708 | ||||||
| Bank of Montreal TriParty Repurchase Agreement (maturing on 11/03/2014 in the amount of $1,265, collateralized by U.S. Treasury Bond 2.88% - 5.25%, 2029 - 2043, U.S. Treasury Note 0.38% - 4.50%, 2015 - 2022, value of $1,290) | ||||||||
| 1,265 | 0.08%, 10/31/2014 | 1,265 | ||||||
| Bank of Montreal TriParty Repurchase Agreement (maturing on 11/03/2014 in the amount of $4,288, collateralized by FHLMC 2.00% - 5.50%, 2022 - 2034, FNMA 2.00% - 4.50%, 2024 - 2039, GNMA 3.00%, 2043, U.S. Treasury Note 4.63%, 2017, value of $4,374) | ||||||||
| 4,288 | 0.10%, 10/31/2014 | 4,288 | ||||||
| Barclays Capital TriParty Repurchase Agreement (maturing on 11/03/2014 in the amount of $16,158, collateralized by U.S. Treasury Bond 4.50% - 6.25%, 2023 - 2036, U.S. Treasury Note 1.63% - 2.13%, 2015 - 2019, value of $16,481) | ||||||||
| 16,158 | 0.08%, 10/31/2014 | 16,158 | ||||||
| Citigroup Global Markets, Inc. TriParty Repurchase Agreement (maturing on 11/03/2014 in the amount of $18,572, collateralized by U.S. Treasury Bill 0.02%, 2015, U.S. Treasury Bond 3.88% - 11.25%, 2015 - 2040, U.S. Treasury Note 2.00% - 3.38%, 2019 - 2021, value of $18,943) | ||||||||
| 18,572 | 0.09%, 10/31/2014 | 18,572 | ||||||
| Deutsche Bank Securities TriParty Repurchase Agreement (maturing on 11/03/2014 in the amount of $1,072, collateralized by U.S. Treasury Note 0.88%, 2017, value of $1,093) | ||||||||
| 1,072 | 0.13%, 10/31/2014 | 1,072 | ||||||
| RBS Securities, Inc. TriParty Repurchase Agreement (maturing on 11/03/2014 in the amount of $1,578, collateralized by U.S. Treasury Bond 3.63% - 5.00%, 2037 - 2043, U.S. Treasury Note 2.13%, 2020, value of $1,610) | ||||||||
| 1,578 | 0.07%, 10/31/2014 | 1,578 | ||||||
| Societe Generale TriParty Repurchase Agreement (maturing on 11/03/2014 in the amount of $16,625, collateralized by U.S. Treasury Bill 0.02%, 2015, U.S. Treasury Bond 3.75% - 11.25%, 2015 - 2043, U.S. Treasury Note 1.38% - 4.25%, 2015 - 2022, value of $16,958) | ||||||||
| 16,625 | 0.08%, 10/31/2014 | 16,625 | ||||||
The accompanying notes are an integral part of these financial statements.
| 6 |
| The Hartford Inflation Plus Fund |
| Schedule of Investments – (continued) |
| October 31, 2014 |
| (000’s Omitted) |
| Shares or Principal Amount ╬ | Market Value ╪ | |||||||||||
| Short-Term Investments - 9.5% - (continued) | ||||||||||||
| Repurchase Agreements - 9.5% - (continued) | ||||||||||||
| TD Securities TriParty Repurchase Agreement (maturing on 11/03/2014 in the amount of $32,217, collateralized by FHLMC 3.00% - 4.00%, 2026 - 2044, FNMA 2.50% - 5.00%, 2025 - 2044, U.S. Treasury Bond 3.50% - 6.50%, 2026 - 2041, U.S. Treasury Note 1.75% - 2.88%, 2018 - 2019, value of $32,861) | ||||||||||||
| $ | 32,217 | 0.10%, 10/31/2014 | $ | 32,217 | ||||||||
| 96,760 | ||||||||||||
| Total Short-Term Investments | ||||||||||||
| (Cost $96,760) | $ | 96,760 | ||||||||||
| Total Investments | ||||||||||||
| (Cost $1,083,285) ▲ | 105.5 | % | $ | 1,073,105 | ||||||||
| Other Assets and Liabilities | (5.5 | )% | (55,480 | ) | ||||||||
| Total Net Assets | 100.0 | % | $ | 1,017,625 | ||||||||
The accompanying notes are an integral part of these financial statements.
| 7 |
| The Hartford Inflation Plus Fund |
| Schedule of Investments – (continued) |
| October 31, 2014 |
| (000’s Omitted) |
| Note: | Percentage of investments as shown is the ratio of the total market value to total net assets. |
The Fund may refer to any one or more of the industry classifications used by one or more widely recognized market indices, ratings group indices and/or as defined by Fund management. Industry classifications may not be identical across all security types.
For Fund compliance purposes, the Fund may not use the same classification system shown in this report as these classifications are used for reporting ease.
| ▲ | At October 31, 2014, the cost of securities for federal income tax purposes was $1,090,511 and the aggregate gross unrealized appreciation and depreciation based on that cost were: |
| Unrealized Appreciation | $ | 1,028 | ||
| Unrealized Depreciation | (18,434 | ) | ||
| Net Unrealized Depreciation | $ | (17,406 | ) |
| ╬ | All principal amounts are in U.S. dollars unless otherwise indicated. |
| ○ | The interest rate disclosed for these securities represents the effective yield on the date of the acquisition. |
| ◄ | The principal amount for this security is adjusted for inflation and the interest payments equal a fixed percentage of the inflation-adjusted principal amount. |
| ♦ | Senior floating rate interests generally pay interest rates which are periodically adjusted by reference to a base short-term, floating lending rate plus a premium. The base lending rates are primarily the LIBOR, and secondarily the prime rate offered by one or more major United States banks (the "Prime Rate") and the certificate of deposit rate or other base lending rates used by commercial lenders. Senior floating rate interests often require prepayments from excess cash flows or permit the borrower to repay at its election. The rate at which the borrower repays cannot be predicted with accuracy. As a result, the actual remaining maturity may be substantially less than the stated maturities shown. Unless otherwise noted, the interest rate disclosed for these securities represents the average coupon as of October 31, 2014. |
| Б | This security, or a portion of this security, has unfunded loan commitments. As of October 31, 2014, the aggregate value of the unfunded commitment was $339, which rounds to zero percent of total net assets. |
| ☼ | This security, or a portion of this security, was purchased on a when-issued or delayed-delivery basis. The cost of these securities was $964 at October 31, 2014. |
| ‡ | This security, or a portion of this security, has been segregated to cover funding requirements on investment transactions settling in the future. |
| Θ | This security, or a portion of this security, has been pledged as collateral in connection with OTC option and/or swaption contracts. |
| □ | This security, or a portion of this security, has been pledged as collateral in connection with futures contracts. |
OTC Option Contracts Outstanding at October 31, 2014
| Description | Counter
- party | Risk Exposure Category | Exercise
Price/ FX Rate/ Rate | Expiration Date | Number
of Contracts * | Market Value ╪ | Premiums Received by Fund | Unrealized Appreciation (Depreciation) | ||||||||||||||||||||||
| Written option contracts: | ||||||||||||||||||||||||||||||
| Calls | ||||||||||||||||||||||||||||||
| GBP Call/USD Put | DEUT | FX | 1.62 USD per GBP | 12/08/14 | GBP | 3,790,000 | $ | 18 | $ | 88 | $ | 70 | ||||||||||||||||||
| Puts | ||||||||||||||||||||||||||||||
| GBP Put/USD Call | DEUT | FX | 1.62 USD per GBP | 12/08/14 | GBP | 3,790,000 | $ | 81 | $ | 91 | $ | 10 | ||||||||||||||||||
| Total written option contracts | 7,580,000 | $ | 99 | $ | 179 | $ | 80 | |||||||||||||||||||||||
| * | The number of contracts does not omit 000's. |
The accompanying notes are an integral part of these financial statements.
| 8 |
| The Hartford Inflation Plus Fund |
| Schedule of Investments – (continued) |
| October 31, 2014 |
| (000’s Omitted) |
Futures Contracts Outstanding at October 31, 2014
| Number of | Expiration | Notional | Market | Unrealized
Appreciation/(Depreciation) | Variation Margin | |||||||||||||||||||||||||||
| Description | Contracts* | Date | Amount | Value ╪ | Asset | Liability | Asset | Liability | ||||||||||||||||||||||||
| Short position contracts: | ||||||||||||||||||||||||||||||||
| U.S. Treasury 10-Year Note Future | 769 | 12/19/2014 | $ | 97,191 | $ | 97,170 | $ | 21 | $ | – | $ | 21 | $ | – | ||||||||||||||||||
* The number of contracts does not omit 000's.
Foreign Currency Contracts Outstanding at October 31, 2014
| Unrealized Appreciation/(Depreciation) | ||||||||||||||||||||||||
| Currency | Buy / Sell | Delivery Date | Counterparty | Contract Amount | Market Value ╪ | Asset | Liability | |||||||||||||||||
| AUD | Buy | 11/28/2014 | BCLY | $ | 4,271 | $ | 4,281 | $ | 10 | $ | – | |||||||||||||
| AUD | Buy | 11/28/2014 | BOA | 3,263 | 3,263 | – | – | |||||||||||||||||
| AUD | Buy | 11/28/2014 | CBA | 3,264 | 3,264 | – | – | |||||||||||||||||
| AUD | Sell | 11/28/2014 | GSC | 4,311 | 4,281 | 30 | – | |||||||||||||||||
| CAD | Buy | 11/28/2014 | RBC | 8,441 | 8,390 | – | (51 | ) | ||||||||||||||||
| CHF | Buy | 11/28/2014 | JPM | 5,225 | 5,199 | – | (26 | ) | ||||||||||||||||
| CHF | Sell | 11/28/2014 | HSBC | 10,667 | 10,580 | 87 | – | |||||||||||||||||
| EUR | Buy | 12/17/2014 | CSFB | 34,993 | 34,776 | – | (217 | ) | ||||||||||||||||
| EUR | Buy | 12/17/2014 | GSC | 13,871 | 13,537 | – | (334 | ) | ||||||||||||||||
| EUR | Buy | 12/17/2014 | SCB | 1,324 | 1,297 | – | (27 | ) | ||||||||||||||||
| EUR | Buy | 11/28/2014 | UBS | 5,218 | 5,194 | – | (24 | ) | ||||||||||||||||
| EUR | Sell | 12/17/2014 | DEUT | 50,858 | 49,238 | 1,620 | – | |||||||||||||||||
| EUR | Sell | 11/28/2014 | JPM | 10,684 | 10,571 | 113 | – | |||||||||||||||||
| EUR | Sell | 12/17/2014 | JPM | 373 | 372 | 1 | – | |||||||||||||||||
| GBP | Buy | 11/28/2014 | CBK | 6,066 | 6,057 | – | (9 | ) | ||||||||||||||||
| JPY | Buy | 12/17/2014 | JPM | 366 | 347 | – | (19 | ) | ||||||||||||||||
| JPY | Sell | 12/17/2014 | JPM | 363 | 347 | 16 | – | |||||||||||||||||
| JPY | Sell | 11/28/2014 | RBS | 6,362 | 6,117 | 245 | – | |||||||||||||||||
| Total | $ | 2,122 | $ | (707 | ) | |||||||||||||||||||
| ╪ | See Significant Accounting Policies of accompanying Notes to Financial Statements regarding valuation of securities. |
| GLOSSARY: (abbreviations used in preceding Schedule of Investments) | |
| Counterparty Abbreviations: | |
| BCLY | Barclays |
| BOA | Banc of America Securities LLC |
| CBA | Commonwealth Bank of Australia |
| CBK | Citibank NA |
| CSFB | Credit Suisse First Boston Corp. |
| DEUT | Deutsche Bank Securities, Inc. |
| GSC | Goldman Sachs & Co. |
| HSBC | HSBC Bank USA |
| JPM | JP Morgan Chase & Co. |
| RBC | RBC Dominion Securities, Inc. |
| RBS | RBS Greenwich Capital |
| SCB | Standard Chartered Bank |
| UBS | UBS AG |
| Currency Abbreviations: | |
| AUD | Australian Dollar |
| BRL | Brazilian Real |
| CAD | Canadian Dollar |
| CHF | Swiss Franc |
| EUR | EURO |
| GBP | British Pound |
| JPY | Japanese Yen |
| MXN | Mexican New Peso |
| UYU | Uruguayan Peso |
| Other Abbreviations: | |
| FHLMC | Federal Home Loan Mortgage Corp. |
| FNMA | Federal National Mortgage Association |
| FX | Foreign Exchange |
| GNMA | Government National Mortgage Association |
| LIBOR | London Interbank Offered Rate |
| OTC | Over-the-Counter |
The accompanying notes are an integral part of these financial statements.
| 9 |
| The Hartford Inflation Plus Fund |
| Schedule of Investments – (continued) |
| October 31, 2014 |
| (000’s Omitted) |
Investment Valuation Hierarchy Level Summary
October 31, 2014
| Total | Level 1 ♦ | Level 2 ♦ | Level 3 | |||||||||||||
| Assets: | ||||||||||||||||
| Foreign Government Obligations | $ | 7,747 | $ | – | $ | 7,747 | $ | – | ||||||||
| Senior Floating Rate Interests | 43,433 | – | 43,433 | – | ||||||||||||
| U.S. Government Agencies | 4 | – | 4 | – | ||||||||||||
| U.S. Government Securities | 925,161 | 135,197 | 789,964 | – | ||||||||||||
| Short-Term Investments | 96,760 | – | 96,760 | – | ||||||||||||
| Total | $ | 1,073,105 | $ | 135,197 | $ | 937,908 | $ | – | ||||||||
| Foreign Currency Contracts * | $ | 2,122 | $ | – | $ | 2,122 | $ | – | ||||||||
| Futures * | 21 | 21 | – | – | ||||||||||||
| Total | $ | 2,143 | $ | 21 | $ | 2,122 | $ | – | ||||||||
| Liabilities: | ||||||||||||||||
| Written Options | $ | 99 | $ | – | $ | 99 | $ | – | ||||||||
| Total | $ | 99 | $ | – | $ | 99 | $ | – | ||||||||
| Foreign Currency Contracts * | $ | 707 | $ | – | $ | 707 | $ | – | ||||||||
| Total | $ | 707 | $ | – | $ | 707 | $ | – | ||||||||
| ♦ | For the year ended October 31, 2014, investments valued at $90,947 were transferred from Level 1 to Level 2, and there were no transfers from Level 2 to Level 1. Investments are transferred between Level 1 and Level 2 for a variety of reasons including, but not limited to: |
| 1) | Foreign equities for which a fair value price is more representative of exit value than the local market close (transfer into Level 2). Foreign equities for which the local market close is more representative of exit value (transfer into Level 1). |
| 2) | U.S. Treasury securities that no longer represent the most recent issue (transfer into Level 2). |
| 3) | Equity investments with no observable trading but a bid or mean price is used (transfer into Level 2). Equity investments using observable quoted prices in an active market (transfer into Level 1). |
| * | Derivative instruments (excluding purchased and written options, if applicable) are valued at the unrealized appreciation/depreciation on the investments. |
| Note: | For purposes of reporting transfers between different hierarchy levels, both transfers in and out of each level, as applicable, are shown as if they occurred at the beginning of the period. |
The accompanying notes are an integral part of these financial statements.
| 10 |
| The Hartford Inflation Plus Fund |
| Statement of Assets and Liabilities |
| October 31, 2014 |
| (000’s Omitted) |
| Assets: | ||||
| Investments in securities, at market value (cost $1,083,285) | $ | 1,073,105 | ||
| Cash | 24 | |||
| Unrealized appreciation on foreign currency contracts | 2,122 | |||
| Receivables: | ||||
| Fund shares sold | 663 | |||
| Interest | 1,622 | |||
| Variation margin on financial derivative instruments | 21 | |||
| Other assets | 63 | |||
| Total assets | 1,077,620 | |||
| Liabilities: | ||||
| Unrealized depreciation on foreign currency contracts | 707 | |||
| Payables: | ||||
| Investment securities purchased | 56,272 | |||
| Fund shares redeemed | 2,577 | |||
| Investment management fees | 93 | |||
| Administrative fees | 3 | |||
| Distribution fees | 74 | |||
| Accrued expenses | 155 | |||
| Written option contracts (proceeds $179) | 99 | |||
| Other liabilities | 15 | |||
| Total liabilities | 59,995 | |||
| Net assets | $ | 1,017,625 | ||
| Summary of Net Assets: | ||||
| Capital stock and paid-in-capital | $ | 1,072,477 | ||
| Distributions in excess of net investment income | (582 | ) | ||
| Accumulated net realized loss | (45,605 | ) | ||
| Unrealized depreciation of investments and the translation of assets and liabilities denominated in foreign currency | (8,665 | ) | ||
| Net assets | $ | 1,017,625 | ||
| Shares authorized | 6,245,000 | |||
| Par value | $ | 0.001 | ||
| Class A: Net asset value per share/Maximum offering price per share | $10.79/$11.30 | |||
| Shares outstanding | 31,501 | |||
| Net assets | $ | 339,993 | ||
| Class B: Net asset value per share | $ | 10.47 | ||
| Shares outstanding | 1,602 | |||
| Net assets | $ | 16,784 | ||
| Class C: Net asset value per share | $ | 10.47 | ||
| Shares outstanding | 22,992 | |||
| Net assets | $ | 240,647 | ||
| Class I: Net asset value per share | $ | 10.94 | ||
| Shares outstanding | 8,328 | |||
| Net assets | $ | 91,095 | ||
| Class R3: Net asset value per share | $ | 10.66 | ||
| Shares outstanding | 6,527 | |||
| Net assets | $ | 69,577 | ||
| Class R4: Net asset value per share | $ | 10.79 | ||
| Shares outstanding | 2,098 | |||
| Net assets | $ | 22,639 | ||
| Class R5: Net asset value per share | $ | 10.91 | ||
| Shares outstanding | 469 | |||
| Net assets | $ | 5,119 | ||
| Class Y: Net asset value per share | $ | 10.95 | ||
| Shares outstanding | 21,162 | |||
| Net assets | $ | 231,771 |
The accompanying notes are an integral part of these financial statements.
| 11 |
| The Hartford Inflation Plus Fund |
| Statement of Operations |
| For the Year Ended October 31, 2014 |
| (000’s Omitted) |
| Investment Income: | ||||
| Interest | $ | 15,550 | ||
| Total investment income | 15,550 | |||
| Expenses: | ||||
| Investment management fees | 5,577 | |||
| Administrative services fees | ||||
| Class R3 | 142 | |||
| Class R4 | 38 | |||
| Class R5 | 6 | |||
| Transfer agent fees | ||||
| Class A | 623 | |||
| Class B | 48 | |||
| Class C | 332 | |||
| Class I | 149 | |||
| Class R3 | 9 | |||
| Class R4 | 2 | |||
| Class R5 | 2 | |||
| Class Y | 5 | |||
| Distribution fees | ||||
| Class A | 1,035 | |||
| Class B | 216 | |||
| Class C | 2,915 | |||
| Class R3 | 355 | |||
| Class R4 | 63 | |||
| Custodian fees | 10 | |||
| Accounting services fees | 166 | |||
| Registration and filing fees | 144 | |||
| Board of Directors' fees | 33 | |||
| Audit fees | 15 | |||
| Other expenses | 151 | |||
| Total expenses (before waivers and fees paid indirectly) | 12,036 | |||
| Expense waivers | (486 | ) | ||
| Custodian fee offset | — | |||
| Total waivers and fees paid indirectly | (486 | ) | ||
| Total expenses, net | 11,550 | |||
| Net Investment Income | 4,000 | |||
| Net Realized Loss on Investments, Other Financial Instruments and Foreign Currency Transactions: | ||||
| Net realized loss on investments | (38,094 | ) | ||
| Net realized loss on futures contracts | (2,745 | ) | ||
| Net realized loss on swap contracts | (714 | ) | ||
| Net realized gain on foreign currency contracts | 4,402 | |||
| Net realized loss on other foreign currency transactions | (656 | ) | ||
| Net Realized Loss on Investments, Other Financial Instruments and Foreign Currency Transactions | (37,807 | ) | ||
| Net Changes in Unrealized Appreciation of Investments, Other Financial Instruments and Foreign Currency Transactions: | ||||
| Net unrealized appreciation of investments | 24,036 | |||
| Net unrealized appreciation of futures contracts | 21 | |||
| Net unrealized appreciation of written option contracts | 80 | |||
| Net unrealized appreciation of swap contracts | 246 | |||
| Net unrealized appreciation of foreign currency contracts | 982 | |||
| Net unrealized depreciation of translation of other assets and liabilities in foreign currencies | (1 | ) | ||
| Net Changes in Unrealized Appreciation of Investments, Other Financial Instruments and Foreign Currency Transactions | 25,364 | |||
| Net Loss on Investments, Other Financial Instruments and Foreign Currency Transactions | (12,443 | ) | ||
| Net Decrease in Net Assets Resulting from Operations | $ | (8,443 | ) |
The accompanying notes are an integral part of these financial statements.
| 12 |
| The Hartford Inflation Plus Fund |
| Statement of Changes in Net Assets |
| (000’s Omitted) |
| For the Year Ended October 31, 2014 | For the Year Ended October 31, 2013 | |||||||
| Operations: | ||||||||
| Net investment income | $ | 4,000 | $ | 3,002 | ||||
| Net realized gain (loss) on investments, other financial instruments and foreign currency transactions | (37,807 | ) | 43,823 | |||||
| Net unrealized appreciation (depreciation) of investments, other financial instruments and foreign currency transactions | 25,364 | (203,225 | ) | |||||
| Net Decrease in Net Assets Resulting from Operations | (8,443 | ) | (156,400 | ) | ||||
| Distributions to Shareholders: | ||||||||
| From net investment income | ||||||||
| Class A | (2,508 | ) | (2,474 | ) | ||||
| Class B | (76 | ) | (90 | ) | ||||
| Class C | (1,044 | ) | (1,248 | ) | ||||
| Class I | (610 | ) | (963 | ) | ||||
| Class R3 | (361 | ) | (221 | ) | ||||
| Class R4 | (145 | ) | (115 | ) | ||||
| Class R5 | (39 | ) | (27 | ) | ||||
| Class Y | (1,803 | ) | (1,298 | ) | ||||
| Total from net investment income | (6,586 | ) | (6,436 | ) | ||||
| From net realized gain on investments | ||||||||
| Class A | (17,316 | ) | (28,407 | ) | ||||
| Class B | (993 | ) | (1,765 | ) | ||||
| Class C | (12,950 | ) | (24,327 | ) | ||||
| Class I | (3,925 | ) | (9,692 | ) | ||||
| Class R3 | (2,610 | ) | (3,142 | ) | ||||
| Class R4 | (1,010 | ) | (1,360 | ) | ||||
| Class R5 | (219 | ) | (272 | ) | ||||
| Class Y | (10,242 | ) | (12,267 | ) | ||||
| Total from net realized gain on investments | (49,265 | ) | (81,232 | ) | ||||
| Total distributions | (55,851 | ) | (87,668 | ) | ||||
| Capital Share Transactions: | ||||||||
| Class A | (145,705 | ) | (256,996 | ) | ||||
| Class B | (10,465 | ) | (19,364 | ) | ||||
| Class C | (117,005 | ) | (266,637 | ) | ||||
| Class I | (27,892 | ) | (147,208 | ) | ||||
| Class R3 | (293 | ) | (10,753 | ) | ||||
| Class R4 | (5,670 | ) | (7,454 | ) | ||||
| Class R5 | (838 | ) | (1,005 | ) | ||||
| Class Y | (43,514 | ) | (54,921 | ) | ||||
| Net decrease from capital share transactions | (351,382 | ) | (764,338 | ) | ||||
| Net Decrease in Net Assets | (415,676 | ) | (1,008,406 | ) | ||||
| Net Assets: | ||||||||
| Beginning of period | 1,433,301 | 2,441,707 | ||||||
| End of period | $ | 1,017,625 | $ | 1,433,301 | ||||
| Undistributed (distributions in excess of) net investment income | $ | (582 | ) | $ | 684 | |||
The accompanying notes are an integral part of these financial statements.
| 13 |
| The Hartford Inflation Plus Fund |
| Notes to Financial Statements |
| October 31, 2014 |
| (000’s Omitted) |
Organization:
The Hartford Mutual Funds, Inc. (“Company”) is an open-end management investment company comprised of forty-two portfolios. Financial statements for The Hartford Inflation Plus Fund (the "Fund"), a series of the Company, are included in this report.
The Company is organized under the laws of the State of Maryland and is registered with the Securities and Exchange Commission (“SEC”) under the Investment Company Act of 1940, as amended (“1940 Act”). The Fund is a diversified open-end management investment company. The Fund is an investment company and applies specialized accounting and reporting under Accounting Standards Codification Topic 946, Financial Services - Investment Companies.
Class A shares are sold with a front-end sales charge of up to 4.50%. Class B shares were sold with a contingent deferred sales charge which is assessed on the lesser of the per share net asset value (“NAV”) of the shares at the time of redemption or the original purchase price, and declines from up to 5.00% to zero depending on the period of time the shares are held (see note below regarding the closing of Class B shares). Class C shares are sold with a contingent deferred sales charge of up to 1.00% on shares redeemed within twelve months of purchase. Class I shares are sold without sales charges to certain eligible investors primarily through advisory fee-based wrap programs. Class R3, R4 and R5 shares, which are offered to employer-sponsored retirement plans, and Class Y shares, which are sold to certain eligible institutional investors, are sold without a sales charge. All classes of shares have identical voting, redemption, dividend, liquidation and other rights and the same terms and conditions, with the exceptions that each class may have different expenses, which may affect performance, and that Class B shares automatically convert to Class A shares after 8 years.
No new or additional investments are allowed in Class B shares of the Fund (including investments through any systematic investment plan). Existing shareholders of Class B shares may continue to hold their Class B shares, exchange their Class B shares for Class B shares of another Hartford Fund (as permitted by existing exchange privileges), or redeem their Class B shares as described in the Fund’s prospectus. Reinstatement privileges with respect to Class B shares are set forth in the Fund's prospectus. For investors electing to reinvest capital gains and dividends, any such capital gains or dividends on Class B shares will continue to be reinvested in Class B shares of the Fund. All Class B share attributes, including the 12b-1 fee, contingent deferred sales charge schedule, and conversion to Class A shares, remain unchanged.
Significant Accounting Policies:
The following is a summary of significant accounting policies of the Fund in the preparation of its financial statements, which are in accordance with United States generally accepted accounting principles (“U.S. GAAP”). The preparation of financial statements in accordance with U.S. GAAP may require management to make estimates and assumptions that affect the reported amounts of assets and liabilities and disclosure of contingent assets and liabilities at the date of the financial statements and the reported amounts of increases and decreases in net assets from operations during the reporting period. Actual results could differ from those estimates.
Determination of Net Asset Value – The NAV of each class of the Fund's shares is determined as of the close of regular trading (normally 4:00 p.m. Eastern Time) (the “NYSE Close”) on each day that the New York Stock Exchange (the “Exchange”) is open (“Valuation Date”). Information that becomes known to the Fund after the NAV has been calculated on a particular day will not generally be used to retroactively adjust the NAV determined earlier that day.
Investment Valuation and Fair Value Measurements – For purposes of calculating the NAV, portfolio investments and other assets held by the Fund's portfolio for which market quotes are readily available are valued at market value. Market value is generally determined on the basis of last reported sales prices or official close price. If no sales are reported, market value is based on quotes obtained from a quotation reporting system, established market makers, or independent pricing services. If market prices are not readily available or are deemed unreliable, the Fund will use the fair value of the investment as determined in good faith under policies and procedures established by and under the supervision of the Company's Board of Directors. Market quotes are considered not readily available where there is an absence of current or reliable market-based data (e.g., trade information or indicative market quotes), including where events occur after the close of the relevant market, but prior to the NYSE Close, that materially affect the values of the Fund's portfolio investments or assets. In addition, market quotes are considered not readily available when, due to extraordinary circumstances, the exchanges or markets on which the investments trade do not open for trading for the entire day and no other market prices are available. In addition, prices of foreign equities that are principally traded on certain foreign markets may
| 14 |
| The Hartford Inflation Plus Fund |
| Notes to Financial Statements – (continued) |
| October 31, 2014 |
| (000’s Omitted) |
be adjusted daily pursuant to a fair value pricing service approved by the Board of Directors in order to reflect an adjustment for the factors occurring after the close of certain foreign markets but before the NYSE Close. Investments that are primarily traded on foreign markets may trade on days that are not business days of the Fund. The value of the foreign investments in which the Fund invests may change on days when a shareholder will not be able to purchase or redeem shares of the Fund. Fair value pricing is subjective in nature and the use of fair value pricing by the Fund may cause the NAV of its shares to differ significantly from the NAV that would have been calculated using market prices at the close of the exchange on which a portfolio investment is primarily traded. There can be no assurance that the Fund could obtain the fair market value assigned to an investment if the Fund were to sell the investment at approximately the time at which the Fund determines its NAV.
Fixed income investments (other than short-term obligations), non-exchange traded derivatives and centrally cleared swaps held by the Fund are normally valued on the basis of quotes obtained from independent pricing services or brokers and dealers in accordance with procedures established by the Company's Board of Directors. Prices obtained from independent pricing services use information provided by market makers or estimates of market values through accepted market modeling, trading and pricing conventions. Inputs to the models may include, but are not limited to, prepayment speeds, pricing spread, yield, trade information, dealer quotes, market color, cash flow models and the investment’s terms and conditions. Generally, the Fund may use fair valuation in regard to fixed income investments when the Fund holds defaulted or distressed investments or investments in a company in which a reorganization is pending. Senior floating rate interests generally trade in over-the-counter (“OTC”) markets and are priced through an independent pricing service utilizing independent market quotations from loan dealers or financial institutions. A composite bid price is used, which is an average of the dealer marks and dealer runs. Short-term investments maturing in 60 days or less are generally valued at amortized cost, if their original term to maturity was 60 days or less, or by amortizing their value on the 61st day prior to maturity, if the original term to maturity exceeded 60 days, which approximates fair value.
Exchange traded options, futures and options on futures are valued at the settlement price or last trade price determined by the relevant exchange as of the NYSE Close. If the last trade price for exchange traded options does not fall between the bid and ask prices, the value will be the mean of the bid and ask prices as of the NYSE Close. If a last trade price is not available, the value will be the mean of the bid and ask prices as of the NYSE Close. If a mean of the bid and ask prices cannot be calculated for the day, the value will be the bid price as of the NYSE Close. In the case of OTC options and such instruments that do not trade on an exchange, values may be supplied by a pricing service using a formula or other objective method that may take into consideration the style, direction, expiration, strike price, notional value and volatility or other special adjustments.
Investments valued in currencies other than U.S. dollars are converted to U.S. dollars using exchange rates obtained from independent pricing services for calculation of the NAV. As a result, the NAV of the Fund’s shares may be affected by changes in the value of currencies in relation to the U.S. dollar. The value of investments traded in markets outside the United States or denominated in currencies other than the U.S. dollar may be affected significantly on a day that the NYSE is closed and the market value may change on days when an investor is not able to purchase, redeem or exchange shares of the Fund.
Foreign currency contracts represent agreements to exchange currencies on specific future dates at predetermined rates. Foreign currency contracts are valued using foreign currency exchange rates and forward rates as provided by an independent pricing service on the Valuation Date.
Financial instruments for which prices are not available from an independent pricing service may be valued using market quotations obtained from one or more dealers that make markets in the respective financial instrument in accordance with procedures established by the Company's Board of Directors.
U.S. GAAP defines fair value as the price that the Fund would receive to sell an asset or pay to transfer a liability in an orderly transaction between market participants. The U.S. GAAP fair value measurement standards require disclosure of a fair value hierarchy for each major category of assets and liabilities. Various inputs are used in determining the fair value of the Fund’s investments. These inputs are summarized into three broad hierarchy levels. This hierarchy is based on whether the valuation inputs are observable or unobservable. These levels are:
Level 1 – Quoted prices in active markets for identical investments. Level 1 may include exchange traded instruments, such as domestic equities, some foreign equities, options, futures, mutual funds, exchange traded funds, rights and warrants.
| 15 |
| The Hartford Inflation Plus Fund |
| Notes to Financial Statements – (continued) |
| October 31, 2014 |
| (000’s Omitted) |
Level 2 – Observable inputs other than Level 1 prices, such as quoted prices for similar investments; quoted prices in markets that are not active; or other inputs that are observable or can be corroborated by observable market data. Level 2 may include debt investments that are traded less frequently than exchange traded instruments and which are valued using independent pricing services; foreign equities, which are principally traded on certain foreign markets and are adjusted daily pursuant to a fair value pricing service in order to reflect an adjustment for the factors occurring after the close of certain foreign markets but before the NYSE Close; senior floating rate interests, which are valued using an aggregate of dealer bids; short-term investments, which are valued at amortized cost; and swaps, which are valued based upon the terms of each swap contract.
Level 3 – Significant unobservable inputs that are supported by limited or no market activity. Level 3 may include financial instruments whose values are determined using indicative market quotes or require significant management judgment or estimation. These unobservable valuation inputs may include estimates for current yields, maturity/duration, prepayment speed, and indicative market quotes for comparable investments along with other assumptions relating to credit quality, collateral value, complexity of the investment structure, general market conditions and liquidity. This category may include investments where trading has been halted or there are certain restrictions on trading. While these investments are priced using unobservable inputs, the valuation of these investments reflects the best available data and management believes the prices are a reasonable representation of exit price.
The Board of Directors of the Company generally reviews and approves the “Procedures for Valuation of Portfolio Securities” at least once a year. These procedures define how investments are to be valued, including the formation and activities of a Valuation Committee. The Valuation Committee is responsible for determining in good faith the fair value of investments when the value cannot be obtained from primary pricing services or alternative sources or if the valuation of an investment as provided by the primary pricing service or alternative source is believed not to reflect the investment’s fair value as of the Valuation Date. Voting members of the Valuation Committee include the Fund's Treasurer or designee and a Vice President of the investment manager or designee. An Assistant Vice President of the Fund with legal expertise or designee is also included on the Valuation Committee as a non-voting advisory member. In addition, the Fund’s Chief Compliance Officer shall designate a member of the compliance group to attend Valuation Committee meetings as a non-voting resource, to monitor for and provide guidance with respect to compliance with these procedures. Two members of the Valuation Committee or their designees, representing different departments, shall constitute a quorum for purposes of permitting the Valuation Committee to take action. The Valuation Committee will consider all relevant factors in determining an investment’s fair value, and may seek the advice of the Fund’s sub-adviser, knowledgeable brokers, and legal counsel in making such determination. The Valuation Committee reports to the Audit Committee of the Company's Board of Directors. The Audit Committee receives quarterly written reports which include details of all fair-valued investments, including the reason for the fair valuation, and an indication, when possible, of the accuracy of the valuation by disclosing the next available reliable public price quotation or the disposition price of such investments (the “look-back” test). The Board of Directors then must consider for ratification all of the fair value determinations made during the previous quarter.
Valuation levels are not necessarily indicative of the risk associated with investing in such investments. Individual investments within any of the above mentioned asset classes may be assigned a different hierarchical level than those presented above, as individual circumstances dictate.
For additional information, refer to the Investment Valuation Hierarchy Level Summary which follows the Schedule of Investments.
Investment Transactions and Investment Income – Investment transactions are recorded as of the trade date (the date the order to buy or sell is executed) for financial reporting purposes. Investments purchased or sold on a when-issued or delayed-delivery basis may be settled a month or more after the trade date. Realized gains and losses are determined on the basis of identified cost.
Trade date for senior floating rate interests purchased in the primary loan market is considered the date on which the loan allocations are determined. Trade date for senior floating rate interests purchased in the secondary loan market is the date on which the transaction is entered into.
| 16 |
| The Hartford Inflation Plus Fund |
| Notes to Financial Statements – (continued) |
| October 31, 2014 |
| (000’s Omitted) |
Interest income, including amortization of premium, accretion of discounts and additional principal received in-kind in lieu of cash, is accrued on a daily basis. Paydown gains and losses on mortgage related and other asset backed securities are included in interest income in the Statement of Operations.
Foreign Currency Transactions – Assets and liabilities denominated in currencies other than U.S. dollars are translated into U.S. dollars at the exchange rates in effect on the valuation date. Purchases and sales of investments, income and expenses are translated into U.S. dollars at the exchange rates on the dates of such transactions.
The Fund does not isolate that portion of portfolio investment valuation resulting from fluctuations in the foreign currency exchange rates from the fluctuations arising from changes in the market prices of investments held. Exchange rate fluctuations are included with the net realized and unrealized gain or loss on investments in the accompanying financial statements.
Net realized foreign exchange gains or losses arise from sales of foreign currencies and the difference between asset and liability amounts initially stated in foreign currencies and the U.S. dollar value of the amounts actually received or paid. Net unrealized foreign exchange gains or losses arise from changes in the value of other assets and liabilities at the end of the reporting period, resulting from changes in the exchange rates.
Joint Trading Account – The Fund may invest cash balances into a joint trading account that may be invested in one or more repurchase agreements.
Fund Share Valuation and Dividend Distributions to Shareholders – Orders for the Fund’s shares are executed in accordance with the investment instructions of the shareholders. The NAV of the Fund’s shares is determined as of the close of business on each business day of the Exchange. The NAV is determined separately for each class of shares of the Fund by dividing the Fund’s net assets attributable to that class by the number of shares of the class outstanding. Each class of shares offered by the Fund has equal rights as to assets and voting privileges (except that shareholders of a class have exclusive voting rights regarding any matter relating solely to that class of shares). Income and non-class specific expenses are allocated daily to each class on the basis of the relative net assets of the class. Realized and unrealized gains and losses are allocated daily based on the relative net assets of each class of shares of the Fund.
Orders for the purchase of the Fund’s shares received prior to the close of the Exchange on any day the Exchange is open for business are priced at the NAV determined as of the close of the Exchange. Orders received after the close of the Exchange, or on a day on which the Exchange and/or the Fund is not open for business, are priced at the next determined NAV.
Dividends are declared pursuant to a policy adopted by the Company's Board of Directors based upon the investment performance of the Fund. Normally, dividends from net investment income are declared daily and paid monthly. Dividends from realized gains, if any, are paid at least once a year.
Net investment income, dividends and distributions from net realized gains and capital are determined in accordance with federal income tax regulations, which may differ from U.S. GAAP with respect to character and timing (see Federal Income Taxes: Distributions and Components of Distributable Earnings and Reclassification of Capital Accounts).
Securities and Other Investments:
Repurchase Agreements – A repurchase agreement is an agreement by which a counterparty agrees to sell an investment and agrees to repurchase the investment sold from the buyer at a mutually agreed upon time and price. During the period of the repurchase agreement, the counterparty will deposit cash and or securities in a third party custodial account to serve as collateral. At the time the Fund enters into a repurchase agreement, the value of the underlying collateral, including accrued interest, will be equal to or exceed the value of the repurchase agreement. Repurchase agreements expose the Fund to counterparty risk - that is, the risk that the counterparty will not fulfill its obligations. To minimize counterparty risk, the investments that serve to collateralize the repurchase agreement are held by the Fund’s custodian in book entry or physical form in the custodial account of the Fund or in a third party custodial account. Repurchase agreements are valued at cost plus accrued interest, which approximates fair value. Repurchase agreements have master netting arrangements which allow the Fund to offset amounts owed to a counterparty with
| 17 |
| The Hartford Inflation Plus Fund |
| Notes to Financial Statements – (continued) |
| October 31, 2014 |
| (000’s Omitted) |
amounts owed by the counterparty, including any collateral. Upon an event of default under a master repurchase agreement, the non-defaulting party may close out all transactions traded under such agreement and net amounts owed under each transaction to one net amount payable by one party to the other. Absent an event of default, the master repurchase agreement does not result in an offset of reported amounts of assets and liabilities in the Statement of Assets and Liabilities across transactions between the Fund and the applicable counterparty. The Fund, as shown on the Schedule of Investments, had outstanding repurchase agreements and related collateral as of October 31, 2014.
Investments Purchased on a When-Issued or Delayed-Delivery Basis – Delivery and payment for investments that have been purchased by the Fund on a forward commitment, or when-issued or delayed-delivery basis, take place beyond the customary settlement period. The Fund may dispose of or renegotiate a delayed-delivery transaction after it is entered into, and may sell delayed-delivery investments before they are delivered, which may result in a realized gain or loss. During this period, such investments are subject to market fluctuations, and the Fund identifies investments segregated in its records with a value at least equal to the amount of the commitment. The Fund, as shown on the Schedule of Investments, had when-issued or delayed-delivery investments as of October 31, 2014.
Senior Floating Rate Interests – The Fund may invest in senior floating rate interests. Senior floating rate interests hold the most senior position in the capital structure of a business entity (the “Borrower”), are typically secured by specific collateral and have a claim on the assets and/or stock of the Borrower that is senior to the assets held by subordinated debtholders and stockholders of the Borrower. Senior floating rate interests are typically structured and administered by a financial institution that acts as the agent of the lenders participating in the senior floating rate interest. The Fund may invest in multiple series or tranches of a senior floating rate interest, which may have varying terms and carry different associated risks. The Fund may also enter into unfunded loan commitments, which are contractual obligations for future funding. Unfunded loan commitments may include revolving credit facilities, which may obligate the Fund to supply additional cash to the borrower on demand, representing a potential financial obligation by the Fund in the future. The Fund may receive a commitment fee based on the undrawn portion of the underlying line of credit portion of a senior floating rate interest. In certain circumstances, the Fund may receive various fees upon the restructure of a senior floating rate interest by a borrower. Fees earned/paid are recorded as a component of income or realized gain/loss in the Statement of Operations.
Senior floating rate interests are typically rated below-investment-grade, which suggests the risk of default is higher, and generally pay higher interest rates than investment-grade debt securities. A default could lead to non-payment of income or principal, which would result in a reduction of investment income to the Fund, and there can be no assurance that the liquidation of any collateral would satisfy the Borrower’s obligation in the event of non-payment of scheduled interest or principal payments, or that such collateral could be readily liquidated. The Fund, as shown on the Schedule of Investments, had senior floating rate interests as of October 31, 2014.
Inflation Indexed Bonds – The Fund may invest in inflation indexed bonds. Inflation indexed bonds are fixed income investments whose principal value is periodically adjusted to the rate of inflation. The interest rate on these bonds is generally fixed at issuance at a rate lower than typical bonds. Over the life of an inflation indexed bond, however, interest will be paid based on a principal value, which is adjusted for inflation. Any increase or decrease in the principal amount of an inflation indexed bond will be included as interest income on the Statement of Operations, even though investors do not receive the principal amount until maturity. The Fund, as shown on the Schedule of Investments, had inflation indexed bonds as of October 31, 2014.
Financial Derivative Instruments:
The following disclosures contain information on how and why the Fund uses derivative instruments, the credit-risk-related contingent features in certain derivative instruments and how derivative instruments affect the Fund’s financial position and results of operations. The location and fair value amounts of these instruments on the Statement of Assets and Liabilities and the realized gains and losses and changes in unrealized gains and losses on the Statement of Operations, each categorized by type of derivative contract, are included in the following Additional Derivative Instrument Information footnote. The derivative instruments outstanding as of year-end are disclosed in the notes to the Schedule of Investments, if applicable. The amounts of realized gains and losses and changes in unrealized gains and losses on derivative instruments during the year are disclosed in the Statement of Operations.
| 18 |
| The Hartford Inflation Plus Fund |
| Notes to Financial Statements – (continued) |
| October 31, 2014 |
| (000’s Omitted) |
Foreign Currency Contracts – The Fund may enter into foreign currency contracts that obligate the Fund to purchase or sell currencies at specified future dates. Foreign currency contracts are used to hedge the currency exposure associated with some or all of the Fund’s investments and/or as part of an investment strategy. Foreign currency contracts are marked to market daily and the change in value is recorded by the Fund as an unrealized gain or loss. The Fund will record a realized gain or loss when the foreign currency contract is settled.
Foreign currency contracts involve elements of market risk in excess of the amounts reflected in the Statement of Assets and Liabilities. In addition, risks may arise upon entering into these contracts from the potential inability of the counterparties to meet the terms of the contracts and from unanticipated movements in the value of the foreign currencies relative to the U.S. dollar. The Fund, as shown on the Schedule of Investments, had outstanding foreign currency contracts as of October 31, 2014.
Futures Contracts – The Fund may enter into futures contracts. A futures contract is an agreement between two parties to buy or sell an asset at a set price on a future date. The Fund uses futures contracts to manage or obtain exposure to the investment markets, commodities, or movements in interest rates and currency values. The primary risks associated with the use of futures contracts are the imperfect correlation between the change in market value of the investments held by the Fund and the prices of futures contracts and the possibility of an illiquid market. Upon entering into a futures contract, the Fund is required to deposit with a futures commission merchant (“FCM”) an amount of cash or U.S. Government or Agency Obligations in accordance with the initial margin requirements of the broker or exchange. Futures contracts are marked to market daily at the most recent settlement price reported by an exchange on which, over time, they are traded most extensively, and an appropriate payable or receivable for the change in value (“variation margin”) is recorded by the Fund. Gains or losses are recognized but not considered realized until the contracts expire or are closed. Futures contracts involve, to varying degrees, risk of loss in excess of the variation margin disclosed on the Statement of Assets and Liabilities; however, the Fund seeks to reduce this risk through the use of an FCM. The Fund, as shown on the Schedule of Investments, had outstanding futures contracts as of October 31, 2014.
Options Contracts – An option contract is a contract sold by one party to another party that offers the buyer the right, but not the obligation, to buy (call) or sell (put) an investment or other financial asset at an agreed-upon price during a specific period of time or on a specific date. Options contracts are either privately negotiated in the over-the-counter market ("OTC options") or executed in a registered exchange ("exchange traded options"). The Fund may write (sell) covered call and put options on futures, swaps (“swaptions”), securities, commodities or currencies. “Covered” means that so long as the Fund is obligated as the writer of an option, it will own either the underlying investments or currency or an option to purchase the same underlying investments or currency having an expiration date of the covered option and an exercise price equal to or less than the exercise price of the covered option, or will pledge cash or other liquid investments having a value equal to or greater than the fluctuating market value of the option investment or currency. Writing put options increases the Fund’s exposure to the underlying instrument. Writing call options decreases the Fund’s exposure to the underlying instrument. Premiums received from writing options that expire are treated as realized gains. Premiums received from writing options that are exercised or closed are added to the proceeds or offset amounts paid on the underlying futures, swap, investment or currency transaction to determine the realized gain or loss. The Fund as a writer of an option has no control over whether the underlying instrument may be sold (call) or purchased (put) and as a result bears the market risk of an unfavorable change in the price of the instrument underlying the written option. There is the risk the Fund may not be able to enter into a closing transaction because of an illiquid market. The Fund may also purchase put and call options. Purchasing call options increases the Fund’s exposure to the underlying instrument. Purchasing put options decreases the Fund’s exposure to the underlying instrument. The Fund pays a premium, which is included on the Fund’s Statement of Assets and Liabilities as an investment and is subsequently marked to market to reflect the current value of the option. Premiums paid for purchasing options that expire are treated as realized losses. Certain options may be purchased with premiums to be determined on a future date. The premiums for these options are based upon implied volatility parameters at specified terms. The risk associated with purchasing put and call options is generally limited to the premium paid. Premiums paid for purchasing options that are exercised or closed are added to the amounts paid or offset against the proceeds on the underlying investment transaction to determine the realized gain or loss. Entering into over-the-counter options also exposes the Fund to counterparty risk. Counterparty risk is the possibility that the counterparty to the agreements may default on its obligation to perform or disagree as to the meaning of the contractual terms in the agreements.
| 19 |
| The Hartford Inflation Plus Fund |
| Notes to Financial Statements – (continued) |
| October 31, 2014 |
| (000’s Omitted) |
The Fund had no outstanding purchased option contracts as of October 31, 2014. The Fund, as shown on the Schedule of Investments, had outstanding written option contracts as of October 31, 2014. Transactions involving written option contracts during the year ended October 31, 2014, are summarized below:
Options Contract Activity During the Year Ended October 31, 2014:
| Call Options Written During the Year | Number of Contracts* | Premium Amounts | ||||||
| Beginning of the period | — | $ | — | |||||
| Written | 3,790,000 | 88 | ||||||
| Expired | — | — | ||||||
| Closed | — | — | ||||||
| Exercised | — | — | ||||||
| End of period | 3,790,000 | $ | 88 | |||||
| Put Options Written During the Year | Number of Contracts* | Premium Amounts | ||||||
| Beginning of the period | — | $ | — | |||||
| Written | 3,790,000 | 91 | ||||||
| Expired | — | — | ||||||
| Closed | — | — | ||||||
| Exercised | — | — | ||||||
| End of period | 3,790,000 | $ | 91 | |||||
* The number of contracts does not omit 000's.
Swap Contracts – The Fund may invest in swap contracts. Swap contracts are agreements to exchange or swap investment cash flows, assets, foreign currencies or market-linked returns at specified, future intervals. Swap contracts are either privately negotiated in the over-the-counter market (“OTC swaps”) or cleared in a central clearing house (“centrally cleared swaps”). The Fund may enter into credit default, total return, cross-currency, interest rate, inflation and other forms of swap contracts to manage its exposure to credit, currency, interest rate, commodity and inflation risk. Swap contracts are also used to gain exposure to certain markets. In connection with these contracts, investments or cash may be identified as collateral or margin in accordance with the terms of the respective swap contracts and/or master netting arrangement to provide assets of value and recourse in the event of default or bankruptcy/insolvency.
Swaps are valued based on custom valuations furnished by an independent pricing service. Swaps for which prices are not available from an independent pricing service are valued in accordance with procedures established by the Company's Board of Directors. Changes in market value, if any, are reflected as a component of net changes in unrealized appreciation or depreciation on the Statement of Operations. Daily changes in valuation of centrally cleared swaps, if any, are recorded as a receivable or payable for the change in value (“variation margin”) on the Statement of Assets and Liabilities. Realized gains or losses on centrally cleared swaps are recorded upon the termination of the swap. OTC swap payments received or paid at the beginning of the measurement period are reflected as such on the Statement of Assets and Liabilities and represent premiums paid or received upon entering into the swap contract to compensate for differences between the stated terms of the swap contract and prevailing market conditions (credit spreads, currency exchange rates, interest rates and other relevant factors). These upfront premiums are recorded as realized gains or losses on the Statement of Operations upon termination or maturity of the swap. A liquidation payment received or made at the termination or maturity of the swap is recorded as a realized gain or loss on the Statement of Operations. Net periodic payments received or paid by the Fund are included as part of realized gains or losses on the Statement of Operations.
Entering into these contracts involves, to varying degrees, elements of liquidation, counterparty, credit and market risk in excess of the amounts recognized on the Statement of Assets and Liabilities. Such risks involve the possibility that there will be no liquid market for these contracts, that the counterparty to the contracts may default on its obligation to perform or disagree as to the meaning of contractual terms in the contracts, and that there may be unfavorable changes in market conditions (credit spreads, currency exchange rates, interest rates and other relevant factors).
The Fund’s maximum risk of loss from counterparty risk for OTC swaps is the net value of the discounted cash flows to be received from the counterparty over the contract’s remaining life, and current market value, to the extent that amount is positive. The risk is mitigated by having a master netting arrangement between the Fund and the counterparty, which allows for the netting of payments made or received (although such amounts are presented on a gross basis within the Statement of Assets and Liabilities, as
| 20 |
| The Hartford Inflation Plus Fund |
| Notes to Financial Statements – (continued) |
| October 31, 2014 |
| (000’s Omitted) |
applicable) as well as the posting of collateral to the Fund to cover the Fund’s exposure to the counterparty. In a centrally cleared swap, while the Fund enters into an agreement with a clearing broker to execute contracts with a counterparty, the performance of the swap is guaranteed by the central clearinghouse, which reduces the Fund’s exposure to counterparty risk. The Fund is still exposed to the counterparty risk through the clearing broker and clearinghouse. The clearinghouse attempts to minimize this risk to its participants through the use of mandatory margin requirements, daily cash settlements and other procedures. Likewise, the clearing broker reduces its risk through margin requirements and required segregation of customer balances.
Interest Rate Swap Contracts – The Fund is subject to interest rate risk exposure in the normal course of pursuing its investment objectives. Because the Fund holds fixed rate bonds, the value of these bonds may decrease if interest rates rise. To hedge against this risk and to maintain its ability to generate income at prevailing market rates, the Fund may enter into interest rate swap contracts. In a typical interest rate swap, one party agrees to make regular payments equal to a floating interest rate, based on a specified interest rate or benchmark (e.g. London Interbank Offered Rate (“LIBOR”)), multiplied by a notional amount, in return for payments equal to a fixed rate multiplied by the same amount, for a specific period of time. The net interest received or paid on interest rate swap contracts is recorded as a realized gain or loss. Interest rate swaps are marked to market daily and the change, if any, is recorded as an unrealized gain or loss in the Statement of Operations. When the interest rate swap contract is terminated early, the Fund records a realized gain or loss equal to the difference between the current market value and the upfront premium or cost.
If an interest rate swap contract provides for payments in different currencies, the parties might agree to exchange the notional amount as well. Interest rate swaps may also depend on other prices or rates, such as the value of an index. The risks of interest rate swaps include changes in market conditions which will affect the value of the contract or the cash flows and the possible inability of the counterparty to fulfill its obligations under the contract. The Fund’s maximum risk of loss from counterparty credit risk is the discounted net value of the cash flows to be received from the counterparty over the contract’s remaining life, to the extent that amount is positive. The Fund had no outstanding interest rate swap contracts as of October 31, 2014.
Additional Derivative Instrument Information:
Fair Value of Derivative Instruments on the Statement of Assets and Liabilities as of October 31, 2014:
| Risk Exposure Category | ||||||||||||||||||||||||||||
| Interest Rate Contracts | Foreign Exchange Contracts | Credit Contracts | Equity Contracts | Commodity Contracts | Other Contracts | Total | ||||||||||||||||||||||
| Assets: | ||||||||||||||||||||||||||||
| Unrealized appreciation on foreign currency contracts | $ | — | $ | 2,122 | $ | — | $ | — | $ | — | $ | — | $ | 2,122 | ||||||||||||||
| Variation margin receivable * | 21 | — | — | — | — | — | 21 | |||||||||||||||||||||
| Total | $ | 21 | $ | 2,122 | $ | — | $ | — | $ | — | $ | — | $ | 2,143 | ||||||||||||||
| Liabilities: | ||||||||||||||||||||||||||||
| Unrealized depreciation on foreign currency contracts | $ | — | $ | 707 | $ | — | $ | — | $ | — | $ | — | $ | 707 | ||||||||||||||
| Written option contracts, market value | — | 99 | — | — | — | — | 99 | |||||||||||||||||||||
| Total | $ | — | $ | 806 | $ | — | $ | — | $ | — | $ | — | $ | 806 | ||||||||||||||
* Only current day's variation margin is reported within the Statement of Assets and Liabilities. The variation margin is included in the open futures net cumulative appreciation of $21 as reported in the Schedule of Investments.
The ratio of foreign currency contracts market value to net assets at October 31, 2014 was 14.15%, compared to the twelve-month average ratio of 8.30% during the year ended October 31, 2014. The volume of other derivatives that are presented in the Schedule of Investments is consistent with the derivative activity during the year ended October 31, 2014.
| 21 |
| The Hartford Inflation Plus Fund |
| Notes to Financial Statements – (continued) |
| October 31, 2014 |
| (000’s Omitted) |
The Effect of Derivative Instruments on the Statement of Operations for the year ended October 31, 2014:
| Risk Exposure Category | ||||||||||||||||||||||||||||
| Interest
Rate Contracts | Foreign Exchange Contracts | Credit Contracts | Equity Contracts | Commodity Contracts | Other Contracts | Total | ||||||||||||||||||||||
| Realized Gain (Loss) on Derivatives Recognized as a Result of Operations: | ||||||||||||||||||||||||||||
| Net realized loss on futures contracts | $ | (2,745 | ) | $ | — | $ | — | $ | — | $ | — | $ | — | $ | (2,745 | ) | ||||||||||||
| Net realized loss on swap contracts | (714 | ) | — | — | — | — | — | (714 | ) | |||||||||||||||||||
| Net realized gain on foreign currency contracts | — | 4,402 | — | — | — | — | 4,402 | |||||||||||||||||||||
| Total | $ | (3,459 | ) | $ | 4,402 | $ | — | $ | — | $ | — | $ | — | $ | 943 | |||||||||||||
| Net Change in Unrealized Appreciation (Depreciation) on Derivatives Recognized as a Result of Operations: | ||||||||||||||||||||||||||||
| Net change in unrealized appreciation of futures contracts | $ | 21 | $ | — | $ | — | $ | — | $ | — | $ | — | $ | 21 | ||||||||||||||
| Net change in unrealized appreciation of written option contracts | — | 80 | — | — | — | — | 80 | |||||||||||||||||||||
| Net change in unrealized appreciation of swap contracts | 246 | — | — | — | — | — | 246 | |||||||||||||||||||||
| Net change in unrealized appreciation of foreign currency contracts | — | 982 | — | — | — | — | 982 | |||||||||||||||||||||
| Total | $ | 267 | $ | 1,062 | $ | — | $ | — | $ | — | $ | — | $ | 1,329 | ||||||||||||||
Balance Sheet Offsetting Information - The following discloses both gross information and net information about instruments and transactions eligible for offset in the financial statements, and instruments and transactions that are subject to a master netting arrangement, as well as amounts related to margin, reflected as financial collateral (including cash collateral), held at clearing brokers, counterparties and the Fund’s custodian. The master netting arrangements allow the clearing brokers to net any collateral held in or on behalf of the Fund, or liabilities or payment obligations of the clearing brokers to the Fund, against any liabilities or payment obligations of the Fund to the clearing brokers. The Fund is required to deposit financial collateral (including cash collateral) at the FCM's custodian on behalf of clearing brokers and counterparties to continually meet the original and maintenance requirements established by the clearing brokers and counterparties. Such requirements are specific to the respective clearing broker or counterparty. Certain master netting arrangements may not be enforceable in the bankruptcy proceedings of a counterparty.
Offsetting of Financial Assets and Derivative Assets as of October 31, 2014:
| Gross Amounts* of Assets Presented in Statement of Assets and Liabilities | Financial Instruments with Allowable Netting | Non-cash Collateral Received | Cash Collateral Received | Net Amount (not less than $0) | ||||||||||||||||
| Description | ||||||||||||||||||||
| Futures contracts - variation margin receivable | $ | 21 | $ | — | $ | — | ‡ | $ | — | $ | 21 | |||||||||
| Unrealized appreciation on foreign currency contracts | 2,122 | (75 | ) | — | — | 2,047 | ||||||||||||||
| Total subject to a master netting or similar arrangement | $ | 2,143 | $ | (75 | ) | $ | — | $ | — | $ | 2,068 | |||||||||
* Gross amounts are presented here as there are no amounts that are netted within the Statement of Assets and Liabilities.
‡ The Fund has pledged $2,418 as collateral for open futures contracts held at October 31, 2014.
| 22 |
| The Hartford Inflation Plus Fund |
| Notes to Financial Statements – (continued) |
| October 31, 2014 |
| (000’s Omitted) |
Offsetting of Financial Liabilities and Derivative Liabilities as of October 31, 2014:
| Gross Amounts* of Liabilities Presented in Statement of Assets and Liabilities | Financial Instruments with Allowable Netting | Non-cash Collateral Pledged | Cash Collateral Pledged | Net Amount (not less than $0) | ||||||||||||||||
| Description | ||||||||||||||||||||
| OTC written option contracts at market value | $ | 99 | $ | — | $ | — | $ | — | $ | 99 | ||||||||||
| Unrealized depreciation on foreign currency contracts | 707 | (75 | ) | — | — | 632 | ||||||||||||||
| Total subject to a master netting or similar arrangement | $ | 806 | $ | (75 | ) | $ | — | $ | — | $ | 731 | |||||||||
* Gross amounts are presented here as there are no amounts that are netted within the Statement of Assets and Liabilities.
Principal Risks:
Credit risk depends largely on the perceived financial health of bond issuers. In general, the credit rating is inversely related to the credit risk of the issuer. Higher rated bonds generally are deemed to have less credit risk, while lower or unrated bonds are deemed to have higher risk of default. The share price, yield and total return of a fund that holds securities with higher credit risk may be more volatile than those of a fund that holds bonds with lower credit risk. Similar to credit risk, the Fund may be exposed to counterparty risk, or the risk that an institution or other entity with which the Fund has unsettled or open transactions will default.
The Fund’s investments expose the Fund to various risks including, but not limited to, interest rate, prepayment, extension and foreign currency risks. Interest rate risk is the risk that fixed income securities will decline in value because of changes in interest rates. As nominal interest rates rise, the values of certain fixed income securities held by the Fund are likely to decrease. A nominal interest rate can be described as the sum of a real interest rate and an expected inflation rate. Fixed income securities with longer durations tend to be more sensitive to changes in interest rates, usually making them more volatile than securities with shorter durations. Duration is useful primarily as a measure of the sensitivity of a fixed income security’s market price to interest rate (i.e., yield) movements. Senior floating rate interests and securities subject to prepayment and extension risk generally offer less potential for gains when interest rates decline. Rising interest rates may cause prepayments to occur at a slower than expected rate, thereby effectively lengthening the maturity of the security and making the security more sensitive to interest rate changes. Prepayment and extension risk are major risks of mortgage backed securities, senior floating rate interests and certain asset backed securities. For certain asset backed securities, the actual maturity may be less than the stated maturity shown in the Schedule of Investments, if applicable. As a result, the timing of income recognition relating to these securities may vary based upon the actual maturity.
If the Fund invests directly in foreign currencies or in securities that trade in, and receive revenues in, foreign currencies, or in derivatives that provide exposure to foreign currencies, it will be subject to the risk that those currencies will decline in value relative to the base currency (U.S. dollars) of the Fund, or, in the case of hedging positions, that the Fund’s base currency will decline in value relative to the currency being hedged. Currency rates in foreign countries may fluctuate significantly over short periods of time for a number of reasons, including changes in interest rates, intervention (or the failure to intervene) by U.S. or foreign governments, central banks or supranational entities, such as the International Monetary Fund, or by the imposition of currency controls or other political developments in the United States or abroad. As a result, the Fund’s investments in foreign currency denominated securities may reduce the returns of the Fund. The market values of equity securities, such as common stocks and preferred stocks, or equity related investments, such as futures and options, may decline due to general market conditions which are not specifically related to a particular company, such as real or perceived adverse economic conditions, changes in the general outlook for corporate earnings, changes in interest or currency rates or adverse investor sentiment generally. The market value of equity securities may also decline due to factors which affect a particular industry or industries, such as labor shortages or increased production costs and competitive conditions within an industry. Equity securities and equity related investments generally have greater market price volatility than fixed income securities.
| 23 |
| The Hartford Inflation Plus Fund |
| Notes to Financial Statements – (continued) |
| October 31, 2014 |
| (000’s Omitted) |
Federal Income Taxes:
Federal Income Taxes – For federal income tax purposes, the Fund intends to continue to qualify as a Regulated Investment Company ("RIC") under Subchapter M of the Internal Revenue Code (“IRC”) by distributing substantially all of its taxable net investment income and net realized capital gains to its shareholders and otherwise complying with the requirements of the IRC. The Fund has distributed substantially all of its income and capital gains in prior years, if applicable, and intends to distribute substantially all of its income and capital gains during the calendar year ending December 31, 2014. Accordingly, no provision for federal income or excise taxes has been made in the accompanying financial statements. Distributions from short-term capital gains are treated as ordinary income distributions for federal income tax purposes.
Net Investment Income (Loss), Net Realized Gains (Losses) and Distributions – Net investment income (loss) and net realized gains (losses) may differ for financial statement and tax purposes primarily because of losses deferred due to wash sale adjustments, foreign currency gains and losses, adjustments related to Passive Foreign Investment Companies ("PFICs"), Real Estate Investment Trusts ("REITs"), RICs, certain derivatives and partnerships. The character of distributions made during the year from net investment income or net realized gains may differ from their ultimate characterization for federal income tax purposes. Also, due to the timing of dividend distributions, the fiscal year in which amounts are distributed may differ from the year that the income or realized gains (losses) were recorded by the Fund.
Distributions and Components of Distributable Earnings – The tax character of distributions paid by the Fund for the periods indicated is as follows (as adjusted for dividends payable, if applicable):
| For the Year Ended October 31, 2014 | For the Year Ended October 31, 2013 | |||||||
| Ordinary Income | $ | 6,586 | $ | 66,249 | ||||
| Long-Term Capital Gains ‡ | 49,265 | 21,680 | ||||||
‡ The Fund designates these distributions as long-term capital gain dividends pursuant to IRC Sec. 852(b)(3)(C).
As of October 31, 2014, the Fund’s components of distributable earnings (deficit) on a tax basis are as follows:
| Amount | ||||
| Undistributed Ordinary Income | $ | 459 | ||
| Accumulated Capital and Other Losses* | (37,984 | ) | ||
| Unrealized Depreciation† | (17,327 | ) | ||
| Total Accumulated Deficit | $ | (54,852 | ) | |
| * | The Fund has capital loss carryforwards that are identified in the Capital Loss Carryforward note that follows. |
| † | Differences between book-basis and tax-basis unrealized appreciation (depreciation) may be attributable to the losses deferred due to wash sale adjustments, foreign currency gains and losses, adjustments related to PFICs, REITs, RICs, certain derivatives and partnerships. |
Reclassification of Capital Accounts – The Fund may record reclassifications in its capital accounts. These reclassifications have no impact on the total net assets of the Fund. The reclassifications are a result of permanent differences between U.S. GAAP and tax accounting for such items as foreign currency, PFICs, expiration or utilization of capital loss carryforwards or net operating losses. Adjustments are made to reflect the impact these items have on current and future distributions to shareholders. Therefore, the source of the Fund’s distributions may be shown in the accompanying Statement of Changes in Net Assets as from undistributed net investment income, from accumulated net realized gains on investments or from capital depending on the type of book and tax differences that exist. For the year ended October 31, 2014, the Fund recorded reclassifications to increase (decrease) the accounts listed below:
| Amount | ||||
| Undistributed Net Investment Income (Loss) | $ | 1,320 | ||
| Accumulated Net Realized Gain (Loss) | (1,320 | ) | ||
| 24 |
| The Hartford Inflation Plus Fund |
| Notes to Financial Statements – (continued) |
| October 31, 2014 |
| (000’s Omitted) |
Capital Loss Carryforward – On December 22, 2010, the Regulated Investment Company Modernization Act of 2010 (the “Act”) was enacted, which made changes to the capital loss carryforward rules. The changes are effective for taxable years beginning after the date of enactment. Under the Act, funds are permitted to carry forward capital losses for an unlimited period. Additionally, capital loss carryforwards retain their character as either short-term or long-term capital losses rather than being considered all short-term as permitted under prior regulation.
At October 31, 2014 (tax year end), the Fund had capital loss carryforwards for U.S. federal income tax purposes as follows:
| Amount | ||||
| Short-Term Capital Loss Carryforward | $ | 7,787 | ||
| Long-Term Capital Loss Carryforward | 30,197 | |||
| Total | $ | 37,984 | ||
Accounting for Uncertainty in Income Taxes – The Fund has adopted financial reporting rules that require the Fund to analyze all open tax years, as defined by the statute of limitations, for all major jurisdictions. Generally, tax authorities can examine all tax returns filed for the last three years. The Fund does not have an examination in progress.
The Fund has reviewed all open tax years and major jurisdictions and concluded that these financial reporting rules had no effect on the Fund’s financial position or results of operations. There is no tax liability resulting from unrecognized tax benefits relating to uncertain income tax positions taken or expected to be taken on the tax return for the fiscal year ended October 31, 2014. The Fund is also not aware of any tax positions for which it is reasonably possible that the total amounts of unrecognized tax benefits will significantly change in the next twelve months.
Expenses:
Investment Management Agreement – Hartford Funds Management Company, LLC ("HFMC") serves as the Fund’s investment manager pursuant to an Investment Management Agreement with the Company. HFMC is an indirect wholly owned subsidiary of The Hartford Financial Services Group, Inc. ("The Hartford"). The investment manager has overall investment supervisory responsibility for the Fund. In addition, the investment manager provides administrative personnel, services, equipment, facilities and office space for proper operation of the Fund. HFMC has contracted with Wellington Management Company, LLP ("Wellington Management") under a sub-advisory agreement for the provision of day-to-day investment management services to the Fund in accordance with the Fund’s investment objective and policies. The Fund pays a fee to the investment manager, a portion of which may be used to compensate Wellington Management.
The schedule below reflects the rates of compensation paid to the investment manager for investment management services rendered as of October 31, 2014; the rates are accrued daily and paid monthly:
| Average Daily Net Assets | Annual Fee | |||
| On first $500 million | 0.500% | |||
| On next $500 million | 0.450% | |||
| On next $1.5 billion | 0.445% | |||
| On next $2.5 billion | 0.440% | |||
| On next $5 billion | 0.430% | |||
| Over $10 billion | 0.420% | |||
| 25 |
| The Hartford Inflation Plus Fund |
| Notes to Financial Statements – (continued) |
| October 31, 2014 |
| (000’s Omitted) |
Accounting Services Agreement – Pursuant to the Fund Accounting Agreement between HFMC and the Company, on behalf of the Fund, HFMC provides accounting services to the Fund and receives monthly compensation based on the Fund’s average daily net assets at the rates set forth below. The Fund’s accounting services fees are accrued daily and paid monthly.
| Average Daily Net Assets | Annual Fee | |||
| On first $5 billion | 0.014% | |||
| On next $5 billion | 0.012% | |||
| Over $10 billion | 0.010% | |||
Operating Expenses – Allocable expenses incurred by the Company are allocated to each Fund and allocated to classes within the Fund in proportion to the average daily net assets of the Fund and each class, except where allocation of certain expenses is more fairly made directly to the Fund or to specific classes within a Fund. As of October 31, 2014, HFMC contractually limited the total operating expenses of this Fund, exclusive of taxes, interest expense, brokerage commissions, acquired fund fees and expenses and extraordinary expenses, through February 28, 2015 as follows:
| Class A | Class B | Class C | Class I | Class R3 | Class R4 | Class R5 | Class Y | |||||||
| 0.85% | 1.60% | 1.60% | 0.60% | 1.20% | 0.90% | 0.60% | 0.55% |
Fees Paid Indirectly – The Fund's custodian bank has agreed to reduce its fees when the Fund maintains cash on deposit in a non-interest-bearing custody account. For the year ended October 31, 2014, this amount, if any, is included in the Statement of Operations.
The ratio of expenses to average net assets in the accompanying financial highlights excludes the reduction in expenses related to fees paid indirectly. The annualized expense ratio after waivers for the period listed below reflecting the reduction for fees paid indirectly is as follows:
| Year Ended October 31, 2014 | ||||
| Class A | 0.85 | % | ||
| Class B | 1.60 | |||
| Class C | 1.60 | |||
| Class I | 0.60 | |||
| Class R3 | 1.20 | |||
| Class R4 | 0.90 | |||
| Class R5 | 0.60 | |||
| Class Y | 0.52 | |||
Distribution and Service Plan for Class A, B, C, R3 and R4 Shares – Hartford Funds Distributors, LLC ("HFD"), an indirect wholly owned subsidiary of The Hartford, is the principal underwriter and distributor of the Fund. HFD is engaged in distribution activities, which include marketing and distribution of shares through broker/dealers, financing distribution costs and maintaining financial books and records. For the year ended October 31, 2014, HFD received front-end load sales charges of $282 and contingent deferred sales charges of $58 from the Fund.
The Fund has adopted a Distribution and Service Plan in accordance with Rule 12b-1 of the 1940 Act to compensate the distributor (HFD) for activities intended to result in the sale and distribution of Class A, B, C, R3 and R4 shares and for providing services for shareholders. The Rule 12b-1 plan applicable to Class A shares of the Fund provides for payment of a Rule 12b-1 fee of 0.25% of average daily net assets. Some or all of the fee may be used for shareholder servicing expenses with the remainder used for distribution expenses. Under the Class B Plan, the Fund pays the distributor 1.00% of the average daily net assets of Class B shares that are outstanding for 8 years or less, 0.25% of which is a fee for services provided to existing shareholders with the remainder used for distribution expenses. Some or the entire Rule 12b-1 fee for Class B shares may be remitted to broker/dealers for distribution and/or shareholder account services. After eight years, Class B shares convert to Class A shares. Upon conversion to Class A
| 26 |
| The Hartford Inflation Plus Fund |
| Notes to Financial Statements – (continued) |
| October 31, 2014 |
| (000’s Omitted) |
shares, the Class A plan described above will apply to those shares. Under the Class C Plan, the Fund pays the distributor 1.00% of the average daily net assets of Class C shares outstanding, 0.25% of which is intended as a fee for services provided to existing shareholders with the remainder used for distribution expenses. For Class C shares, some or the entire fee may be remitted to broker/dealers for distribution and/or shareholder account services. Class R3 shares have a distribution fee of 0.50% of average daily net assets and Class R4 shares have a distribution fee of 0.25% of average daily net assets. For Class R3 and R4 shares, some or the entire fee may be remitted to broker/dealers for distribution and/or shareholder account services. The Fund’s 12b-1 fees are accrued daily and paid monthly or at such other intervals as the Board of Directors may determine.
Other Related Party Transactions – Certain officers of the Fund are directors and/or officers of HFMC and/or The Hartford or its subsidiaries. For the year ended October 31, 2014, a portion of the Fund’s Chief Compliance Officer’s compensation was paid by all of the investment companies in the Hartford fund complex. The portion allocated to the Fund, as represented in other expenses on the Statement of Operations, was in the amount of $2. Hartford Administrative Services Company (“HASCO”), an indirect wholly-owned subsidiary of The Hartford, provides transfer agent services to the Fund. HASCO has contractually agreed to reimburse any portion of the transfer agency fees over 0.30% of average daily net assets per fiscal year for each class. Any transfer agency fee reimbursement is determined before considering the contractual operating expense limitation. For providing such services, HASCO is compensated on a per account basis that varies by account type, except with respect to Class Y, for which it is compensated based on average daily net assets. The amount paid to HASCO and any related contractual reimbursement amounts, if applicable, can be found in the Statement of Operations. These fees are accrued daily and paid monthly.
Administrative services fees are paid to HASCO for third-party recordkeeping services that are payable as a percentage of net assets in the amount of up to 0.20%, 0.15% and 0.10% for Classes R3, R4 and R5 shares, respectively. The total administrative services fees are shown on the Statement of Operations. These fees are accrued daily and paid monthly.
Affiliate Holdings:
As of October 31, 2014, the Fund's shares were owned in aggregate by affiliated fund of funds. Therefore, the Fund may experience relatively large purchases or redemptions of its shares from these affiliated fund of funds. Affiliated fund of funds owned shares in the Fund as follows:
| Percentage of Fund | ||||
| Class Y | 14 | % | ||
Investment Transactions:
For the year ended October 31, 2014, the cost of purchases and proceeds from sales of investment securities (excluding short-term investments) were as follows:
| Excluding U.S. Government Obligations | U.S. Government Obligations | Total | ||||||||||
| Cost of Purchases | $ | 130,790 | $ | 1,138,701 | $ | 1,269,491 | ||||||
| Sales Proceeds | 155,462 | 1,513,403 | 1,668,865 | |||||||||
| 27 |
| The Hartford Inflation Plus Fund |
| Notes to Financial Statements – (continued) |
| October 31, 2014 |
| (000’s Omitted) |
Capital Share Transactions:
The following information is for the year ended October 31, 2014, and the year ended October 31, 2013:
| For the Year Ended October 31, 2014 | For the Year Ended October 31, 2013 | |||||||||||||||||||||||||||||||
| Shares Sold | Shares Issued for Reinvested Dividends | Shares Redeemed | Net Increase (Decrease) of Shares | Shares Sold | Shares Issued for Reinvested Dividends | Shares Redeemed | Net Increase (Decrease) of Shares | |||||||||||||||||||||||||
| Class A | ||||||||||||||||||||||||||||||||
| Shares | 3,542 | 1,773 | (18,673 | ) | (13,358 | ) | 7,848 | 2,394 | (32,643 | ) | (22,401 | ) | ||||||||||||||||||||
| Amount | $ | 38,522 | $ | 19,023 | $ | (203,250 | ) | $ | (145,705 | ) | $ | 94,162 | $ | 29,217 | $ | (380,375 | ) | $ | (256,996 | ) | ||||||||||||
| Class B | ||||||||||||||||||||||||||||||||
| Shares | 24 | 89 | (1,101 | ) | (988 | ) | 68 | 133 | (1,893 | ) | (1,692 | ) | ||||||||||||||||||||
| Amount | $ | 253 | $ | 932 | $ | (11,650 | ) | $ | (10,465 | ) | $ | 812 | $ | 1,594 | $ | (21,770 | ) | $ | (19,364 | ) | ||||||||||||
| Class C | ||||||||||||||||||||||||||||||||
| Shares | 779 | 1,177 | (12,991 | ) | (11,035 | ) | 4,240 | 1,830 | (29,790 | ) | (23,720 | ) | ||||||||||||||||||||
| Amount | $ | 8,221 | $ | 12,281 | $ | (137,507 | ) | $ | (117,005 | ) | $ | 50,424 | $ | 21,931 | $ | (338,992 | ) | $ | (266,637 | ) | ||||||||||||
| Class I | ||||||||||||||||||||||||||||||||
| Shares | 3,632 | 324 | (6,487 | ) | (2,531 | ) | 4,774 | 668 | (17,931 | ) | (12,489 | ) | ||||||||||||||||||||
| Amount | $ | 40,082 | $ | 3,516 | $ | (71,490 | ) | $ | (27,892 | ) | $ | 57,480 | $ | 8,218 | $ | (212,906 | ) | $ | (147,208 | ) | ||||||||||||
| Class R3 | ||||||||||||||||||||||||||||||||
| Shares | 1,108 | 275 | (1,400 | ) | (17 | ) | 1,447 | 273 | (2,663 | ) | (943 | ) | ||||||||||||||||||||
| Amount | $ | 11,857 | $ | 2,915 | $ | (15,065 | ) | $ | (293 | ) | $ | 16,922 | $ | 3,307 | $ | (30,982 | ) | $ | (10,753 | ) | ||||||||||||
| Class R4 | ||||||||||||||||||||||||||||||||
| Shares | 709 | 86 | (1,309 | ) | (514 | ) | 1,126 | 98 | (1,871 | ) | (647 | ) | ||||||||||||||||||||
| Amount | $ | 7,685 | $ | 920 | $ | (14,275 | ) | $ | (5,670 | ) | $ | 13,352 | $ | 1,201 | $ | (22,007 | ) | $ | (7,454 | ) | ||||||||||||
| Class R5 | ||||||||||||||||||||||||||||||||
| Shares | 215 | 24 | (314 | ) | (75 | ) | 338 | 24 | (454 | ) | (92 | ) | ||||||||||||||||||||
| Amount | $ | 2,365 | $ | 258 | $ | (3,461 | ) | $ | (838 | ) | $ | 4,063 | $ | 298 | $ | (5,366 | ) | $ | (1,005 | ) | ||||||||||||
| Class Y | ||||||||||||||||||||||||||||||||
| Shares | 4,656 | 1,087 | (9,663 | ) | (3,920 | ) | 8,469 | 1,082 | (14,094 | ) | (4,543 | ) | ||||||||||||||||||||
| Amount | $ | 51,326 | $ | 11,804 | $ | (106,644 | ) | $ | (43,514 | ) | $ | 101,097 | $ | 13,318 | $ | (169,336 | ) | $ | (54,921 | ) | ||||||||||||
| Total | ||||||||||||||||||||||||||||||||
| Shares | 14,665 | 4,835 | (51,938 | ) | (32,438 | ) | 28,310 | 6,502 | (101,339 | ) | (66,527 | ) | ||||||||||||||||||||
| Amount | $ | 160,311 | $ | 51,649 | $ | (563,342 | ) | $ | (351,382 | ) | $ | 338,312 | $ | 79,084 | $ | (1,181,734 | ) | $ | (764,338 | ) | ||||||||||||
The following reflects the conversion of Class B shares into Class A shares (reflected as Class A shares sold) for the year ended October 31, 2014, and the year ended October 31, 2013:
| Shares | Dollars | |||||||
| For the Year Ended October 31, 2014 | 65 | $ | 710 | |||||
| For the Year Ended October 31, 2013 | 131 | $ | 1,540 | |||||
Line of Credit:
The Fund is one of several Hartford Funds that participate in a $500 million committed revolving line of credit facility. The facility is to be used for temporary or emergency purposes. Under the arrangement, the funds are required to own securities having a market value in excess of 300% of the total bank borrowings. The interest rate on borrowings varies depending on the nature of the loan. The facility also requires a fee to be paid based on the amount of the commitment. This commitment fee is allocated to all the funds participating in the line of credit based on the average net assets of the funds. During the year ended October 31, 2014, the Fund did not have any borrowings under this facility.
Pending Legal Proceedings:
On February 25, 2011, Jennifer L. Kasilag, Louis Mellinger, Judith M. Menendez, Jacqueline M. Robinson, and Linda A. Russell filed a derivative lawsuit against Hartford Investment Financial Services, LLC (“HIFSCO”) (now known as HFD) on behalf of six Hartford retail mutual funds in the United States District Court for the District of New Jersey, alleging that HIFSCO received excessive advisory and distribution fees in violation of its statutory fiduciary duty under Section 36(b) of the 1940 Act when serving as investment manager and principal underwriter, respectively, to the Hartford retail mutual funds. Although this action was purportedly filed on behalf of certain of the
| 28 |
| The Hartford Inflation Plus Fund |
| Notes to Financial Statements – (continued) |
| October 31, 2014 |
| (000’s Omitted) |
Hartford Funds, none of the Hartford Funds is itself a defendant to the suit. HIFSCO moved to dismiss and, in September 2011, the motion was granted in part and denied in part, with leave to amend the complaint. In November 2011, plaintiffs filed an amended complaint on behalf of certain Hartford retail mutual funds, The Hartford Global Health Fund (now known as The Hartford Healthcare Fund), The Hartford Conservative Allocation Fund, The Hartford Growth Opportunities Fund, The Hartford Inflation Plus Fund, The Hartford Advisers Fund (now known as The Hartford Balanced Fund), and The Hartford Capital Appreciation Fund. Plaintiffs seek to rescind the investment management agreements and distribution plans between HIFSCO and these funds and to recover the total fees charged thereunder or, in the alternative, to recover any improper compensation HIFSCO received, in addition to lost earnings. HIFSCO filed a partial motion to dismiss the amended complaint and, in December 2012, the court dismissed without prejudice the claims regarding distribution fees and denied the motion with respect to the advisory fees claims. HIFSCO disputes the allegations and intends to defend vigorously.
In March 2014, the plaintiffs filed a new complaint that added as new plaintiffs The Hartford Floating Rate Fund and The Hartford Small Company Fund and named as a defendant HFMC, which assumed the role as investment manager to the funds as of January 2013. HFMC and HIFSCO dispute the allegations and intend to defend vigorously.
No accrual for litigation relating to this matter has been recorded in the financial statements of the Fund because the Fund is not party to the suit.
Indemnifications:
Under the Company's organizational documents, the Company shall indemnify its officers and directors to the full extent required or permitted under Maryland General Corporation Law and the federal securities laws. In addition, the Company, on behalf of the Fund, may enter into contracts that contain a variety of indemnifications. The Company's maximum exposure under these arrangements is unknown. However, as of the date of these financial statements, the Company has not had prior claims or losses pursuant to these contracts and expects the risk of loss to be remote.
Subsequent Event:
Effective December 1, 2014, pursuant to a sub-transfer agency agreement between HASCO and Boston Financial Data Services, Inc. (“BFDS”), HASCO has delegated certain transfer agent, dividend disbursing agent and shareholder servicing agent functions to BFDS. The costs and expenses of such delegation are borne by HASCO, not by the Fund.
| 29 |
| The Hartford Inflation Plus Fund |
| Financial Highlights |
| - Selected Per-Share Data - (A) | - Ratios and Supplemental Data - | |||||||||||||||||||||||||||||||||||||||||||||||||||
| Class | Net
Asset Value at Beginning of Period | Net
Investment Income (Loss) | Net
Realized and Unrealized Gain (Loss) on Invest- ments | Total
from Investment Operations | Dividends
from Net Investment Income | Distribu- tions from Realized Capital Gains | Total
Dividends and Distributions | Net
Asset Value at End of Period | Total Return(B) | Net
Assets at End of Period (000's) | Ratio
of Expenses to Average Net Assets Before Adjust- ments(C) | Ratio
of Expenses to Average Net Assets After Adjust- ments(C) | Ratio
of Net Investment Income (Loss) to Average Net Assets | |||||||||||||||||||||||||||||||||||||||
| For the Year Ended October 31, 2014 | ||||||||||||||||||||||||||||||||||||||||||||||||||||
| A | $ | 11.32 | $ | 0.05 | $ | (0.10 | ) | $ | (0.05 | ) | $ | (0.07 | ) | $ | (0.41 | ) | $ | (0.48 | ) | $ | 10.79 | (0.43 | )% | $ | 339,993 | 0.92 | % | 0.85 | % | 0.48 | % | |||||||||||||||||||||
| B | 11.05 | (0.04 | ) | (0.09 | ) | (0.13 | ) | (0.04 | ) | (0.41 | ) | (0.45 | ) | 10.47 | (1.16 | ) | 16,784 | 1.74 | 1.60 | (0.35 | ) | |||||||||||||||||||||||||||||||
| C | 11.05 | (0.04 | ) | (0.09 | ) | (0.13 | ) | (0.04 | ) | (0.41 | ) | (0.45 | ) | 10.47 | (1.16 | ) | 240,647 | 1.63 | 1.60 | (0.33 | ) | |||||||||||||||||||||||||||||||
| I | 11.45 | 0.06 | (0.08 | ) | (0.02 | ) | (0.08 | ) | (0.41 | ) | (0.49 | ) | 10.94 | (0.16 | ) | 91,095 | 0.67 | 0.60 | 0.58 | |||||||||||||||||||||||||||||||||
| R3 | 11.21 | 0.02 | (0.11 | ) | (0.09 | ) | (0.05 | ) | (0.41 | ) | (0.46 | ) | 10.66 | (0.74 | ) | 69,577 | 1.23 | 1.20 | 0.19 | |||||||||||||||||||||||||||||||||
| R4 | 11.33 | 0.05 | (0.12 | ) | (0.07 | ) | (0.06 | ) | (0.41 | ) | (0.47 | ) | 10.79 | (0.54 | ) | 22,639 | 0.92 | 0.90 | 0.43 | |||||||||||||||||||||||||||||||||
| R5 | 11.42 | 0.09 | (0.11 | ) | (0.02 | ) | (0.08 | ) | (0.41 | ) | (0.49 | ) | 10.91 | (0.16 | ) | 5,119 | 0.64 | 0.60 | 0.79 | |||||||||||||||||||||||||||||||||
| Y | 11.46 | 0.09 | (0.11 | ) | (0.02 | ) | (0.08 | ) | (0.41 | ) | (0.49 | ) | 10.95 | (0.13 | ) | 231,771 | 0.52 | 0.52 | 0.84 | |||||||||||||||||||||||||||||||||
| For the Year Ended October 31, 2013 | ||||||||||||||||||||||||||||||||||||||||||||||||||||
| A | $ | 12.65 | $ | 0.04 | $ | (0.91 | ) | $ | (0.87 | ) | $ | (0.04 | ) | $ | (0.42 | ) | $ | (0.46 | ) | $ | 11.32 | (7.15 | )% | $ | 507,889 | 0.88 | % | 0.85 | % | 0.34 | % | |||||||||||||||||||||
| B | 12.44 | (0.05 | ) | (0.90 | ) | (0.95 | ) | (0.02 | ) | (0.42 | ) | (0.44 | ) | 11.05 | (7.88 | ) | 28,633 | 1.69 | 1.60 | (0.43 | ) | |||||||||||||||||||||||||||||||
| C | 12.43 | (0.05 | ) | (0.89 | ) | (0.94 | ) | (0.02 | ) | (0.42 | ) | (0.44 | ) | 11.05 | (7.81 | ) | 375,906 | 1.60 | 1.60 | (0.42 | ) | |||||||||||||||||||||||||||||||
| I | 12.76 | 0.06 | (0.91 | ) | (0.85 | ) | (0.04 | ) | (0.42 | ) | (0.46 | ) | 11.45 | (6.88 | ) | 124,329 | 0.65 | 0.60 | 0.51 | |||||||||||||||||||||||||||||||||
| R3 | 12.57 | – | (0.91 | ) | (0.91 | ) | (0.03 | ) | (0.42 | ) | (0.45 | ) | 11.21 | (7.49 | ) | 73,380 | 1.22 | 1.20 | 0.01 | |||||||||||||||||||||||||||||||||
| R4 | 12.66 | 0.04 | (0.91 | ) | (0.87 | ) | (0.04 | ) | (0.42 | ) | (0.46 | ) | 11.33 | (7.15 | ) | 29,584 | 0.91 | 0.90 | 0.30 | |||||||||||||||||||||||||||||||||
| R5 | 12.73 | 0.08 | (0.93 | ) | (0.85 | ) | (0.04 | ) | (0.42 | ) | (0.46 | ) | 11.42 | (6.90 | ) | 6,219 | 0.63 | 0.60 | 0.69 | |||||||||||||||||||||||||||||||||
| Y | 12.76 | 0.07 | (0.90 | ) | (0.83 | ) | (0.05 | ) | (0.42 | ) | (0.47 | ) | 11.46 | (6.79 | ) | 287,361 | 0.51 | 0.51 | 0.60 | |||||||||||||||||||||||||||||||||
| For the Year Ended October 31, 2012 | ||||||||||||||||||||||||||||||||||||||||||||||||||||
| A | $ | 12.36 | $ | 0.08 | $ | 0.80 | $ | 0.88 | $ | (0.07 | ) | $ | (0.52 | ) | $ | (0.59 | ) | $ | 12.65 | 7.41 | % | $ | 851,003 | 0.86 | % | 0.85 | % | 0.69 | % | |||||||||||||||||||||||
| B | 12.22 | (0.01 | ) | 0.79 | 0.78 | (0.04 | ) | (0.52 | ) | (0.56 | ) | 12.44 | 6.65 | 53,262 | 1.66 | 1.60 | (0.11 | ) | ||||||||||||||||||||||||||||||||||
| C | 12.21 | (0.01 | ) | 0.79 | 0.78 | (0.04 | ) | (0.52 | ) | (0.56 | ) | 12.43 | 6.66 | 717,899 | 1.59 | 1.59 | (0.04 | ) | ||||||||||||||||||||||||||||||||||
| I | 12.44 | 0.11 | 0.81 | 0.92 | (0.08 | ) | (0.52 | ) | (0.60 | ) | 12.76 | 7.70 | 297,985 | 0.64 | 0.60 | 0.91 | ||||||||||||||||||||||||||||||||||||
| R3 | 12.31 | 0.05 | 0.78 | 0.83 | (0.05 | ) | (0.52 | ) | (0.57 | ) | 12.57 | 7.07 | 94,112 | 1.21 | 1.20 | 0.41 | ||||||||||||||||||||||||||||||||||||
| R4 | 12.37 | 0.08 | 0.80 | 0.88 | (0.07 | ) | (0.52 | ) | (0.59 | ) | 12.66 | 7.39 | 41,261 | 0.91 | 0.90 | 0.69 | ||||||||||||||||||||||||||||||||||||
| R5 | 12.42 | 0.13 | 0.78 | 0.91 | (0.08 | ) | (0.52 | ) | (0.60 | ) | 12.73 | 7.63 | 8,096 | 0.62 | 0.60 | 1.05 | ||||||||||||||||||||||||||||||||||||
| Y | 12.44 | 0.12 | 0.80 | 0.92 | (0.08 | ) | (0.52 | ) | (0.60 | ) | 12.76 | 7.73 | 378,089 | 0.50 | 0.50 | 0.99 | ||||||||||||||||||||||||||||||||||||
| For the Year Ended October 31, 2011 (D) | ||||||||||||||||||||||||||||||||||||||||||||||||||||
| A(E) | $ | 12.27 | $ | 0.35 | $ | 0.58 | $ | 0.93 | $ | (0.32 | ) | $ | (0.52 | ) | $ | (0.84 | ) | $ | 12.36 | 8.19 | % | $ | 836,386 | 0.87 | % | 0.85 | % | 2.89 | % | |||||||||||||||||||||||
| B | 12.16 | 0.26 | 0.57 | 0.83 | (0.25 | ) | (0.52 | ) | (0.77 | ) | 12.22 | 7.35 | 72,383 | 1.67 | 1.60 | 2.14 | ||||||||||||||||||||||||||||||||||||
| C | 12.15 | 0.26 | 0.57 | 0.83 | (0.25 | ) | (0.52 | ) | (0.77 | ) | 12.21 | 7.36 | 678,916 | 1.60 | 1.60 | 2.16 | ||||||||||||||||||||||||||||||||||||
| I | 12.34 | 0.37 | 0.59 | 0.96 | (0.34 | ) | (0.52 | ) | (0.86 | ) | 12.44 | 8.45 | 300,497 | 0.64 | 0.60 | 3.19 | ||||||||||||||||||||||||||||||||||||
| R3 | 12.23 | 0.30 | 0.59 | 0.89 | (0.29 | ) | (0.52 | ) | (0.81 | ) | 12.31 | 7.83 | 65,208 | 1.22 | 1.20 | 2.70 | ||||||||||||||||||||||||||||||||||||
| R4 | 12.28 | 0.34 | 0.58 | 0.92 | (0.31 | ) | (0.52 | ) | (0.83 | ) | 12.37 | 8.14 | 25,566 | 0.92 | 0.90 | 2.93 | ||||||||||||||||||||||||||||||||||||
| R5 | 12.31 | 0.36 | 0.61 | 0.97 | (0.34 | ) | (0.52 | ) | (0.86 | ) | 12.42 | 8.55 | 14,764 | 0.63 | 0.60 | 3.69 | ||||||||||||||||||||||||||||||||||||
| Y | 12.33 | 0.39 | 0.59 | 0.98 | (0.35 | ) | (0.52 | ) | (0.87 | ) | 12.44 | 8.63 | 299,096 | 0.51 | 0.51 | 3.37 | ||||||||||||||||||||||||||||||||||||
See Portfolio Turnover information on the next page.
| 30 |
| The Hartford Inflation Plus Fund |
| Financial Highlights – (continued) |
| - Selected Per-Share Data - (A) | - Ratios and Supplemental Data - | |||||||||||||||||||||||||||||||||||||||||||||||||||
| Class | Net
Asset Value at Beginning of Period | Net
Investment Income (Loss) | Net
Realized and Unrealized Gain (Loss) on Invest- ments | Total
from Investment Operations | Dividends
from Net Investment Income | Distribu- tions from Realized Capital Gains | Total
Dividends and Distributions | Net
Asset Value at End of Period | Total Return(B) | Net
Assets at End of Period (000's) | Ratio
of Expenses to Average Net Assets Before Adjust- ments(C) | Ratio
of Expenses to Average Net Assets After Adjust- ments(C) | Ratio
of Net Investment Income (Loss) to Average Net Assets | |||||||||||||||||||||||||||||||||||||||
| For the Year Ended October 31, 2010 | ||||||||||||||||||||||||||||||||||||||||||||||||||||
| A | $ | 11.39 | $ | 0.17 | $ | 0.96 | $ | 1.13 | $ | (0.18 | ) | $ | (0.07 | ) | $ | (0.25 | ) | $ | 12.27 | 10.06 | % | $ | 822,952 | 0.92 | % | 0.90 | % | 1.52 | % | |||||||||||||||||||||||
| B | 11.30 | 0.09 | 0.95 | 1.04 | (0.11 | ) | (0.07 | ) | (0.18 | ) | 12.16 | 9.28 | 103,313 | 1.71 | 1.65 | 0.77 | ||||||||||||||||||||||||||||||||||||
| C | 11.29 | 0.08 | 0.96 | 1.04 | (0.11 | ) | (0.07 | ) | (0.18 | ) | 12.15 | 9.28 | 674,801 | 1.65 | 1.65 | 0.75 | ||||||||||||||||||||||||||||||||||||
| I | 11.45 | 0.20 | 0.96 | 1.16 | (0.20 | ) | (0.07 | ) | (0.27 | ) | 12.34 | 10.32 | 243,916 | 0.71 | 0.65 | 1.74 | ||||||||||||||||||||||||||||||||||||
| R3 | 11.36 | 0.12 | 0.96 | 1.08 | (0.14 | ) | (0.07 | ) | (0.21 | ) | 12.23 | 9.67 | 33,638 | 1.29 | 1.25 | 1.09 | ||||||||||||||||||||||||||||||||||||
| R4 | 11.40 | 0.15 | 0.97 | 1.12 | (0.17 | ) | (0.07 | ) | (0.24 | ) | 12.28 | 9.97 | 14,398 | 0.98 | 0.97 | 1.35 | ||||||||||||||||||||||||||||||||||||
| R5 | 11.42 | 0.18 | 0.98 | 1.16 | (0.20 | ) | (0.07 | ) | (0.27 | ) | 12.31 | 10.30 | 2,878 | 0.68 | 0.67 | 1.60 | ||||||||||||||||||||||||||||||||||||
| Y | 11.43 | 0.21 | 0.97 | 1.18 | (0.21 | ) | (0.07 | ) | (0.28 | ) | 12.33 | 10.49 | 318,524 | 0.57 | 0.57 | 1.88 | ||||||||||||||||||||||||||||||||||||
| (A) | Information presented relates to a share outstanding throughout the indicated period. Net investment income (loss) per share amounts are calculated based on average shares outstanding unless otherwise noted. |
| (B) | Assumes initial investment at net asset value at the beginning of each period, reinvestment of all distributions, the complete redemption of the investment at net asset value at the end of each period and no sales charge. Total return would be reduced if sales charges were taken into account. |
| (C) | Adjustments include waivers and reimbursements, if applicable. Ratios do not include fees paid indirectly (see Expenses in the accompanying Notes to Financial Statements). |
| (D) | Net investment income (loss) per share amounts have been calculated using the SEC method. (E) Class L was merged into Class A on August 5, 2011. |
| Portfolio Turnover Rate for All Share Classes | ||||
| For the Year Ended October 31, 2014 | 108 | % | ||
| For the Year Ended October 31, 2013 | 82 | |||
| For the Year Ended October 31, 2012 | 102 | |||
| For the Year Ended October 31, 2011 | 232 | |||
| For the Year Ended October 31, 2010 | 322 | |||
| 31 |
| Report of Independent Registered Public Accounting Firm |
| The Board of Directors and Shareholders of |
| The Hartford Mutual Funds, Inc. |
We have audited the accompanying statement of assets and liabilities, including the schedule of investments, of The Hartford Inflation Plus Fund (one of the portfolios constituting The Hartford Mutual Funds, Inc. (the Funds)) as of October 31, 2014, and the related statement of operations for the year then ended, the statements of changes in net assets for each of the two years in the period then ended, and the financial highlights for each of the five years in the period then ended. These financial statements and financial highlights are the responsibility of the Funds’ management. Our responsibility is to express an opinion on these financial statements and financial highlights based on our audits.
We conducted our audits in accordance with the standards of the Public Company Accounting Oversight Board (United States). Those standards require that we plan and perform the audit to obtain reasonable assurance about whether the financial statements and financial highlights are free of material misstatement. We were not engaged to perform an audit of the Funds’ internal control over financial reporting. Our audits included consideration of internal control over financial reporting as a basis for designing audit procedures that are appropriate in the circumstances, but not for the purpose of expressing an opinion on the effectiveness of the Funds’ internal control over financial reporting. Accordingly, we express no such opinion. An audit also includes examining, on a test basis, evidence supporting the amounts and disclosures in the financial statements and financial highlights, assessing the accounting principles used and significant estimates made by management, and evaluating the overall financial statement presentation. Our procedures included confirmation of securities owned as of October 31, 2014, by correspondence with the custodian, agent banks and brokers or by other appropriate auditing procedures where replies from agent banks and brokers were not received. We believe that our audits provide a reasonable basis for our opinion.
In our opinion, the financial statements and financial highlights referred to above present fairly, in all material respects, the financial position of The Hartford Inflation Plus Fund of The Hartford Mutual Funds, Inc. at October 31, 2014, the results of its operations for the year then ended, the changes in its net assets for each of the two years in the period then ended, and the financial highlights for each of the five years in the period then ended, in conformity with U.S. generally accepted accounting principles.
Minneapolis, Minnesota
December 18, 2014
| 32 |
| The Hartford Inflation Plus Fund |
| Directors and Officers (Unaudited) |
The Board of Directors of the Company (the "Directors") appoints officers who are responsible for the day-to-day operations of the Fund and who execute policies formulated by the Directors. Each Director serves until his or her death, resignation, or retirement or until the next annual meeting of shareholders is held or until his or her successor is elected and qualifies.
Directors and officers who are employed by or who have a financial interest in The Hartford Financial Services Group, Inc. ("The Hartford") are considered “interested” persons of the Fund pursuant to the 1940 Act. Each officer and two of the Company's Directors, as noted in the chart below, are “interested” persons of the Fund. Each Director serves as a director for The Hartford Mutual Funds, Inc., The Hartford Mutual Funds II, Inc., Hartford Series Fund, Inc., and Hartford HLS Series Fund II, Inc., and as a trustee for The Hartford Alternative Strategies Fund, which, as of October 31, 2014, collectively consist of 66 funds. Correspondence may be sent to Directors and officers c/o Hartford Funds, 5 Radnor Corporate Center, Suite 300, 100 Matsonford Road, Radnor, Pennsylvania 19087, except that correspondence to Mr. Annoni, Mr. Dressen and Ms. Quade may be sent to 500 Bielenberg Drive, Suite 500, Woodbury, Minnesota 55125.
The table below sets forth, for each Director and officer, his or her name, year of birth, current position with the Company and date first elected or appointed to The Hartford Mutual Funds, Inc. ("MF") and The Hartford Mutual Funds II, Inc. ("MF2"), principal occupation, and, for Directors, other directorships held. The Fund’s Statement of Additional Information contains further information on the Directors and is available free of charge by calling 1-888-843-7824 or writing to: Hartford Funds, P.O. Box 55022, Boston, MA 02205-5022.
Information on the aggregate remuneration paid to the directors of the Company can be found in the Statement of Operations herein. The Fund pays to The Hartford a portion of the Chief Compliance Officer’s compensation, but does not pay salaries or compensation to any of its other officers or Directors who are employed by The Hartford.
Non-Interested Directors
Hilary E. Ackermann (1956) Director since September 23, 2014
Ms. Ackermann served as Chief Risk Officer at Goldman Sachs Bank USA from October 2008 to November 2011 and serves as a Director of Dynegy, Inc., an independent power company, from October 2012 to present.
Lynn S. Birdsong (1946) Director since 2003, Chairman of the Investment Committee since 2014
Mr. Birdsong is a private investor. Mr. Birdsong currently serves as a Director of the Sovereign High Yield Investment Company (April 2010 to current). Mr. Birdsong currently serves as an Independent Director of Nomura Partners Funds, Inc. (formerly, The Japan Fund) (April 2003 to current). From 2003 to March 2005, Mr. Birdsong was an Independent Director of the Atlantic Whitehall Funds. From 1979 to 2002, Mr. Birdsong was a Managing Director of Zurich Scudder Investments, an investment management firm. During his employment with Scudder, Mr. Birdsong was an Interested Director of The Japan Fund. From January 1981 through December 2013, Mr. Birdsong was a partner in Birdsong Company, an advertising specialty firm.
Robert M. Gavin, Jr. (1940) Director since 2002 (MF) and 1986 (MF2), Chairman of the Board for each since 2004
Dr. Gavin is an educational consultant. Prior to September 1, 2001, he was President of Cranbrook Education Community and prior to July 1996, he was President of Macalester College, St. Paul, Minnesota.
Duane E. Hill (1945) Director since 2001 (MF) and 2002 (MF2), Chairman of the Nominating Committee since 2003
Mr. Hill is a Partner of TSG Ventures L.P., a private equity investment company. Mr. Hill is a former partner of TSG Capital Group, a private equity investment firm that served as sponsor and lead investor in leveraged buyouts of middle market companies.
Sandra S. Jaffee (1941) Director since 2005
Ms. Jaffee is the founder and Chief Executive Officer of a private company, Homeworks Concierge, LLC, which provides residential property management services in Westchester County, New York (January 2012 to present). Ms. Jaffee served as Chairman (2008 to 2009) and Chief Executive Officer of Fortent (formerly Searchspace Group), a leading provider of compliance/regulatory technology to financial institutions from August 2005 to August 2009. From August 2004 to August 2005, Ms. Jaffee served as an Entrepreneur in Residence with Warburg Pincus, a private equity firm. Prior to joining Warburg Pincus, Ms. Jaffee served as Executive Vice President at Citigroup, from September 1995 to July 2004, where she was President and Chief Executive Officer of Citibank’s Global Securities Services (1995 to 2003). Ms. Jaffee currently serves as a member of the Board of Directors of Broadridge Financial Solutions as well as a Trustee of Muhlenberg College.
| 33 |
| The Hartford Inflation Plus Fund |
Directors and Officers (Unaudited) – (continued) |
William P. Johnston (1944) Director since 2005, Chairman of the Compliance Committee since 2005
In June 2006, Mr. Johnston was appointed as Senior Advisor to The Carlyle Group, a global private equity and other alternative asset investment firm and currently serves as an Operating Executive. In July 2006, Mr. Johnston was elected to the Board of Directors of MultiPlan, Inc. and served as a Director (July 2006 to August 2010). In August 2007, Mr. Johnston was elected to the Board of Directors of LifeCare Holdings, Inc. and served as a Director (August 2007 to June 2013). In February 2008, Mr. Johnston was elected to the Board of Directors of HCR-ManorCare, Inc. In May 2006, Mr. Johnston was elected to the Supervisory Board of Fresenius Medical Care AG & Co. KGaA, after its acquisition of Renal Care Group, Inc. in March 2006. Mr. Johnston joined Renal Care Group in November 2002 as a member of the Board of Directors and served as Chairman of the Board from March 2003 through March 2006. From 2002 through 2013, Mr. Johnston served as a Board member of the Georgia O’Keefe Museum. From September 1987 to December 2002, Mr. Johnston was with Equitable Securities Corporation (and its successors, SunTrust Equitable Securities and SunTrust Robinson Humphrey) serving in various investment banking and managerial positions, including Managing Director and Head of Investment Banking, Chief Executive Officer and Vice Chairman.
Phillip O. Peterson (1944) Director since 2002 (MF) and 2000 (MF2), Chairman of the Audit Committee since 2002
Mr. Peterson is a mutual fund industry consultant. He was a partner of KPMG LLP (an accounting firm) until July 1999. Mr. Peterson joined William Blair Funds in February 2007 as a member of the Board of Trustees. From February 2012 to February 2014, Mr. Peterson served as a Trustee of Symetra Variable Mutual Funds. From January 2004 to April 2005, Mr. Peterson served as Independent President of the Strong Mutual Funds.
Lemma W. Senbet (1946) Director since 2005
Dr. Senbet is the William E. Mayer Chair Professor of Finance and Founding Director, Center for Financial Policy, at the University of Maryland, Robert H. Smith School of Business. He was chair of the Finance Department of the University of Maryland, Robert H. Smith School of Business from 1998 to 2006. Since June 2013, he has been on leave from the University to serve as Executive Director of African Economic Research Consortium which focuses on economic policy research and training. Previously, he was a chaired professor of finance at the University of Wisconsin-Madison. Also, he was a Director of the Fortis Funds from March 2000 to July 2002. Dr. Senbet served as Director of the American Finance Association and President of the Western Finance Association. In 2006, Dr. Senbet was inducted Fellow of Financial Management Association International for his career-long distinguished scholarship and professional service.
Interested Directors and Officers
James E. Davey (1964) Director since 2012, President and Chief Executive Officer since 2010
Mr. Davey serves as Executive Vice President of Hartford Life Insurance Company (“HLIC”) and The Hartford. Additionally, Mr. Davey serves as Chairman of the Board, Manager and Senior Managing Director of Hartford Funds Distributors, LLC (“HFD”). He also currently serves as Director, Chairman of the Board, President and Senior Managing Director of Hartford Administrative Services Company (“HASCO”). Mr. Davey also serves as Manager, Chairman of the Board and Senior Managing Director for Hartford Funds Management Company, LLC (“HFMC”) and Director, Chairman of the Board and Senior Managing Director for Hartford Funds Management Group, Inc. ("HFMG"). Mr. Davey has served in various positions within The Hartford and its subsidiaries in connection with the operation of the Hartford Funds. Mr. Davey joined The Hartford in 2002.
Lowndes A. Smith* (1939) Director since 1996 (MF) and 2002 (MF2)
Mr. Smith served as Vice Chairman of The Hartford from February 1997 to January 2002, as President and Chief Executive Officer of Hartford Life, Inc. from February 1997 to January 2002, and as President and Chief Operating Officer of The Hartford Life Insurance Companies from January 1989 to January 2002. Mr. Smith serves as a Director of White Mountains Insurance Group Ltd. (October 2003 to current); One Beacon Insurance (October 2006 to current); Symetra Financial (August 2007 to current) and is a Managing Director of Whittington Gray Associates (January 2007 to current).
* Mr. Smith resigned as a Director of MF, MF2, Hartford Series Fund, Inc. and Hartford HLS Series Fund II, Inc. and as a Trustee of The Hartford Alternative Strategies Fund effective September 17, 2014.
Other Officers
Mark A. Annoni (1964) Vice President, Controller and Treasurer since 2012
Mr. Annoni currently serves as the Assistant Vice President of HLIC (February 2004 to present) and Senior Vice President of HFMG (December 2013 to present). Mr. Annoni has served in various positions within The Hartford and its subsidiaries in connection with the operation of the Hartford Funds. Mr. Annoni joined The Hartford in 2001.
| 34 |
| The Hartford Inflation Plus Fund |
| Directors and Officers (Unaudited) – (continued) |
Michael R. Dressen (1963) AML Compliance Officer since 2011
Mr. Dressen currently serves as Assistant Vice President of HLIC. He also serves as Chief Compliance Officer and AML Compliance Officer of HASCO and as AML Officer of HFD. Mr. Dressen has served in various positions within The Hartford and its subsidiaries in connection with the operation of the Hartford Funds.
Edward P. Macdonald (1967) Vice President, Secretary and Chief Legal Officer since 2005
Mr. Macdonald currently serves as Assistant Secretary, Executive Vice President and Deputy General Counsel of HFD, HASCO, HFMC and HFMG. He also serves as Vice President of HLIC. Mr. Macdonald has served in various positions within The Hartford and its subsidiaries in connection with the operation of the Hartford Funds. Mr. Macdonald joined The Hartford in 2005.
Joseph G. Melcher (1973) Vice President and Chief Compliance Officer since 2013
Mr. Melcher currently serves as Executive Vice President of HFD, HFMG and HASCO. Mr. Melcher also currently serves as Executive Vice President and Chief Compliance Officer of HFMC. Mr. Melcher has served in various positions within The Hartford and its subsidiaries in connection with the operation of the Hartford Funds since joining The Hartford in 2012. Prior to joining The Hartford, Mr. Melcher worked at Touchstone Investments, a member of the Western & Southern Financial Group, where he held the position of Vice President and Chief Compliance Officer from 2010 through 2012 and Assistant Vice President, Compliance from 2005 to 2010.
Vernon J. Meyer (1964) Vice President since 2006
Mr. Meyer currently serves as Senior Vice President of HLIC. He also currently serves as Managing Director and Chief Investment Officer of HFMC and Managing Director of HFMG. Mr. Meyer has served in various positions within The Hartford and its subsidiaries in connection with the operation of the Hartford Funds. Mr. Meyer joined The Hartford in 2004.
Laura S. Quade (1969) Vice President since 2012
Ms. Quade currently serves as Vice President of HASCO, HFD and HFMG. She is the Head of Operations of HASCO and formerly served as Director, Enterprise Operations of HLIC. Ms. Quade has served in various positions within The Hartford and its subsidiaries in connection with the operation of the Hartford Funds. Ms. Quade joined The Hartford in 2001.
Martin A. Swanson** (1962) Vice President since 2010
Mr. Swanson currently serves as Vice President of HLIC. Mr. Swanson also serves as Managing Director, Chief Marketing Officer and Principal of HFD and Managing Director of HFMG. Mr. Swanson has served in various positions within The Hartford and its subsidiaries in connection with the operation of the Hartford Funds.
** Mr. Swanson resigned as an officer effective November 6, 2014.
HOW TO OBTAIN A COPY OF THE FUND’S PROXY VOTING POLICIES AND VOTING RECORDS (UNAUDITED)
A description of the policies and procedures that the Fund uses to determine how to vote proxies relating to portfolio securities and information about how the Fund voted proxies relating to portfolio securities during the most recent twelve-month period ended June 30 are available (1) without charge, upon request, by calling 888-843-7824 and (2) on the SEC’s website at http://www.sec.gov.
QUARTERLY PORTFOLIO HOLDINGS INFORMATION (UNAUDITED)
The Fund files a complete schedule of portfolio holdings with the SEC for the first and third quarters of each fiscal year on Form N-Q. The Fund’s Forms N-Q are available (1) without charge, upon request, by calling 888-843-7824 and (2) on the SEC’s website at http://www.sec.gov. The Form N-Q may be reviewed and copied at the SEC’s Public Reference Room in Washington, DC. Information on the operation of the Public Reference Room may be obtained by calling 1-800-SEC-0330.
| 35 |
| The Hartford Inflation Plus Fund |
| Federal Tax Information (Unaudited) |
For the fiscal year ended October 31, 2014, there is no further federal tax information required for this Fund.
| 36 |
| The Hartford Inflation Plus Fund |
| Expense Example (Unaudited) |
Your Fund's Expenses
As a shareholder of the Fund, you incur two types of costs: (1) transaction costs, including sales charges (loads) on purchase payments, if any, and contingent deferred sales charges (CDSC), if any, and (2) ongoing costs, including investment management fees, distribution and/or service (12b-1) fees, if any, and other fund expenses. This example is intended to help you understand your ongoing costs (in dollars) of investing in the Fund and to compare these costs with the ongoing costs of investing in other mutual funds. The example is based on an investment of $1,000 invested at the beginning of the period and held for the entire period of April 30, 2014 through October 31, 2014.
Actual Expenses
The first set of columns of the table below provides information about actual account values and actual expenses. You may use the information in this column, together with the amount you invested, to estimate the expenses that you paid over the period. Simply divide your account value by $1,000 (for example, an $8,600 account value divided by $1,000 = 8.6), then multiply the result by the number in the line under the heading entitled “Expenses Paid During Period” to estimate the expenses you paid on your account during this period.
Hypothetical Example for Comparison Purposes
The second set of columns of the table below provides information about hypothetical account values and hypothetical expenses based on the Fund's actual expense ratio and an assumed rate of return of 5% per year before expenses, which is not the Fund's actual return. The hypothetical account values and expenses may not be used to estimate the actual ending account balance or expenses you paid for the period. You may use this information to compare the ongoing costs of investing in the Fund and other funds. To do so, compare this 5% hypothetical example with the 5% hypothetical examples that appear in the shareholder reports of the other funds.
Please note that the expenses shown in the table are meant to highlight your ongoing costs only and do not reflect any transactional costs, such as sales charges (loads) and CDSC. Therefore, the second set of columns of the table is useful in comparing ongoing costs only, and will not help you determine the relative total costs of owning different funds. In addition, if these transactional costs were included, your costs would be higher. Expenses are equal to the Fund's annualized expense ratios multiplied by average account value over the period, multiplied by 184/365 (to reflect the one-half year period).
| Actual return | Hypothetical (5% return before expenses) | |||||||||||||||||||||||||||||||||||
| Beginning Account Value April 30, 2014 | Ending Account Value October 31, 2014 | Expenses paid during the period April 30, 2014 through October 31, 2014 | Beginning Account Value April 30, 2014 | Ending
Account Value October 31, 2014 | Expenses
paid during the period April 30, 2014 through October 31, 2014 | Annualized expense ratio | Days in the current 1/2 year | Days in the full year | ||||||||||||||||||||||||||||
| Class A | $ | 1,000.00 | $ | 1,000.60 | $ | 4.29 | $ | 1,000.00 | $ | 1,020.92 | $ | 4.33 | 0.85 | % | 184 | 365 | ||||||||||||||||||||
| Class B | $ | 1,000.00 | $ | 995.90 | $ | 8.05 | $ | 1,000.00 | $ | 1,017.14 | $ | 8.13 | 1.60 | 184 | 365 | |||||||||||||||||||||
| Class C | $ | 1,000.00 | $ | 996.80 | $ | 8.05 | $ | 1,000.00 | $ | 1,017.14 | $ | 8.13 | 1.60 | 184 | 365 | |||||||||||||||||||||
| Class I | $ | 1,000.00 | $ | 1,002.10 | $ | 3.03 | $ | 1,000.00 | $ | 1,022.18 | $ | 3.06 | 0.60 | 184 | 365 | |||||||||||||||||||||
| Class R3 | $ | 1,000.00 | $ | 998.80 | $ | 6.05 | $ | 1,000.00 | $ | 1,019.16 | $ | 6.11 | 1.20 | 184 | 365 | |||||||||||||||||||||
| Class R4 | $ | 1,000.00 | $ | 999.50 | $ | 4.54 | $ | 1,000.00 | $ | 1,020.67 | $ | 4.58 | 0.90 | 184 | 365 | |||||||||||||||||||||
| Class R5 | $ | 1,000.00 | $ | 1,002.10 | $ | 3.03 | $ | 1,000.00 | $ | 1,022.18 | $ | 3.06 | 0.60 | 184 | 365 | |||||||||||||||||||||
| Class Y | $ | 1,000.00 | $ | 1,002.30 | $ | 2.57 | $ | 1,000.00 | $ | 1,022.64 | $ | 2.60 | 0.51 | 184 | 365 | |||||||||||||||||||||
| 37 |
| The Hartford Inflation Plus Fund |
| Approval of Investment Management and Investment Sub-Advisory Agreements (Unaudited) |
Section 15(c) of the Investment Company Act of 1940, as amended (the “1940 Act”), requires that each mutual fund’s board of directors, including a majority of those directors who are not “interested persons” of the mutual fund, as defined in the 1940 Act (the “Independent Directors”), annually review and consider the continuation of the mutual fund’s investment advisory and sub-advisory agreements. At its meeting held on August 5-6, 2014, the Board of Directors (the “Board”) of The Hartford Mutual Funds, Inc., including each of the Independent Directors, unanimously voted to approve the continuation of the investment management agreement for The Hartford Inflation Plus Fund (the “Fund”) with Hartford Funds Management Company, LLC (“HFMC”) and the continuation of the investment sub-advisory agreement between HFMC and the Fund’s sub-adviser, Wellington Management Company, LLP (the “Sub-adviser,” and together with HFMC, the “Advisers”) (collectively, the “Agreements”).
In the months preceding the August 5-6, 2014 meeting, the Board requested, received and reviewed written responses from the Advisers to questions posed to them on behalf of the Independent Directors and supporting materials relating to those questions and responses. The Board considered information furnished to the Board at its meetings throughout the year, as well as information specifically prepared in connection with the annual approval of the Agreements at the Board’s meetings held on June 17-18, 2014 and August 5-6, 2014. Information provided to the Board at its meetings throughout the year included, among other things, reports on Fund performance, legal and compliance matters, sales and marketing activity, shareholder services, and the other services provided to the Fund by the Advisers and their affiliates. The Board also received in-person presentations by Fund officers and representatives of HFMC at the Board’s meetings on June 17-18, 2014 and August 5-6, 2014 concerning the Agreements.
The Independent Directors, advised by independent legal counsel, engaged service providers to assist them with evaluating the Agreements with respect to the Fund. Lipper Inc. (“Lipper”), an independent provider of investment company data, was retained to provide the Board with reports on how the Fund’s contractual management fees, actual management fees, other non-management fees, overall expense ratios and investment performance compared to those of mutual funds with similar investment objectives. The Independent Directors also engaged an independent financial services consultant (the “Consultant”) to assist them in evaluating the Fund’s management fees, sub-advisory fees, other non-management fees, overall expense ratios and investment performance. In addition, the Consultant reviewed the profitability calculations utilized by HFMC in connection with the continuation of the investment management agreement.
In determining whether to continue the Agreements for the Fund, the members of the Board reviewed and evaluated information and factors they believed to be relevant and appropriate in light of the information that the Board deemed necessary and appropriate through the exercise of its reasonable business judgment. While individual members of the Board may have weighed certain factors differently, the Board’s determination to continue the Agreements was based on a comprehensive consideration of all information provided to the Board throughout the year and specifically with respect to the continuation of the Agreements. A more detailed discussion of the factors the Board considered with respect to its approval of the Agreements is provided below.
Nature, Extent and Quality of Services Provided by the Advisers
The Board requested and considered information concerning the nature, extent and quality of the services provided to the Fund by the Advisers. The Board considered, among other things, the terms of the Agreements and the range of services provided by the Advisers. The Board considered the Advisers’ professional personnel who provide services to the Fund, including each Adviser’s ability and experience in attracting and retaining qualified personnel to service the Fund. The Board considered each Adviser’s reputation and overall financial strength, as well as its willingness to consider and implement organizational and operational changes designed to enhance services to the Hartford Funds. In addition, the Board considered the quality of each Adviser’s communications with the Board and responsiveness to Board inquiries and requests made from time to time with respect to the Fund and other Hartford Funds.
The Board also requested and evaluated information concerning each Adviser’s regulatory and compliance environment. In this regard, the Board requested and reviewed information on each Adviser’s compliance policies and procedures, compliance history, and a report from the Fund’s Chief Compliance Officer on each Adviser’s compliance with applicable laws and regulations, including responses to regulatory developments and compliance issues raised by regulators. The Board also noted the Advisers’ support of the Fund’s compliance control structure, particularly the resources devoted by the Advisers in support of the Fund’s obligations pursuant to Rule 38a-1 under the 1940 Act.
With respect to HFMC, the Board noted that, under the Agreements, HFMC is responsible for the management of the Fund, including oversight of fund operations and service providers, and provides administrative and investment advisory services in connection with selecting, monitoring and supervising the Sub-adviser. The Board considered HFMC’s ongoing monitoring of people, process and performance, including its quarterly reviews of each of the Hartford Funds, semi-annual meetings with the leaders of each Fund’s portfolio management team, and oversight of the Hartford Funds’ approximately 66 portfolio managers. The Board recognized that HFMC has demonstrated a record of making changes to the
| 38 |
| The Hartford Inflation Plus Fund |
| Approval of Investment Management and Investment Sub-Advisory Agreements (Unaudited) – (continued) |
management and/or strategies of the Hartford Funds when warranted. The Board considered HFMC’s oversight of the Sub-adviser’s investment approach and results, process for monitoring best execution of portfolio trades by the Sub-adviser, and approach to risk management with respect to the Fund and the service providers to the Fund. The Board also considered HFMC’s oversight of compliance with the Fund’s objective and policies as well as with applicable laws and regulations, noting that regulatory and other developments had over time led to an increase in the scope of HFMC’s services in this regard.
In addition, the Board considered HFMC’s ongoing commitment to review and rationalize the Hartford Funds product line-up and the expenses that HFMC had incurred in connection with fund combinations in recent years. The Board considered that HFMC or its affiliates are responsible for providing the Fund’s officers.
With respect to the Sub-adviser, which provides certain day-to-day portfolio management services for the Fund, the Board considered the quality of the Fund’s portfolio manager, the Sub-adviser’s other investment personnel, its investment philosophy and process, investment research capabilities and resources, its use of the Fund’s investment flexibility, performance record, trade execution capabilities and experience. The Board considered the experience of the Fund’s portfolio manager, the number of accounts managed by the portfolio manager, and the Sub-adviser’s method for compensating the portfolio manager.
Based on these considerations, the Board concluded that it was satisfied with the nature, extent and quality of the services provided to the Fund by HFMC and the Sub-adviser.
Performance of the Fund and the Advisers
The Board considered the investment performance of the Fund. In this regard, the Board reviewed the performance of the Fund over different time periods presented in the materials and evaluated HFMC’s analysis of the Fund’s performance for these time periods. The Board considered information and materials provided to the Board by the Advisers concerning Fund performance, as well as information from Lipper comparing the investment performance of the Fund to an appropriate benchmark and universe of peer funds. The Board noted that the Fund’s performance was in the 5th quintile of its performance universe for the 1-year period, the 3rd quintile for the 3-year period and the 4th quintile for the 5-year period. The Board also noted that the Fund’s performance was in line with its benchmark for the 1-, 3- and 5-year periods.
The Board considered the detailed investment analytics reports provided by Hartford Funds’ Investment Advisory Group throughout the year. These reports include, among other things, information on the Fund’s gross and net returns, the Fund’s investment performance relative to an appropriate benchmark and peer group, various statistics concerning the Fund’s portfolio, and a narrative summary of various factors affecting Fund performance. The Board considered the Advisers’ cooperation with the Investment Committee, which assists the Board in evaluating the performance of the Fund at periodic meetings throughout the year. The Board also considered the analysis provided by the Consultant relating to the Fund’s performance track record.
In light of all the considerations noted above, the Board concluded that it had continued confidence in HFMC’s and the Sub-adviser’s overall capabilities to manage the Fund.
Costs of the Services and Profitability of the Advisers
The Board reviewed information regarding HFMC’s cost to provide investment management and related services to the Fund and HFMC’s profitability, both overall and for the Fund, on a pre-tax basis without regard to distribution expenses. The Board also requested and reviewed information about the profitability to HFMC and its affiliates from all services provided to the Fund and all aspects of their relationship with the Fund. The Board also requested and received information relating to the operations and profitability of the Sub-adviser.
The Board considered the Consultant’s review of the profitability calculations used by HFMC in connection with the continuation of the investment management agreement, noting the Consultant’s view that Hartford Funds’ process for calculating and reporting Fund profitability is reasonable. In this regard, the Board noted that the Consultant performed a full review of this process in light of the recent restructuring of the Hartford Funds business and reported that the approach to analyzing Fund profitability, including the use of common expense allocation methodologies, is reasonable, sound and well within common industry practice.
Based on these considerations, the Board concluded that the profits anticipated to be realized by the Advisers and their affiliates from their relationships with the Fund would not be excessive.
| 39 |
| The Hartford Inflation Plus Fund |
| Approval of Investment Management and Investment Sub-Advisory Agreements (Unaudited) – (continued) |
Comparison of Fees and Services Provided by the Advisers
The Board considered comparative information with respect to the management fees to be paid by the Fund to HFMC and the total expense ratios of the Fund. The Board also considered comparative information with respect to the sub-advisory fees to be paid by HFMC to the Sub-adviser. In this regard, the Board requested and reviewed information from HFMC and the Sub-adviser relating to the management and sub-advisory fees, including the sub-advisory fee schedule for the Fund, and total operating expenses for the Fund. With respect to the sub-advisory fee schedule, the Board considered representations from HFMC and the Sub-adviser that the Sub-adviser’s fees were negotiated at arm’s length on a fund-by-fund basis. The Board also reviewed information from Lipper comparing the Fund’s contractual management fees, actual management fees and overall expense ratios relative to a group of funds selected by Lipper, in consultation with the Consultant, and a broader universe of funds selected by Lipper. The Board considered that the Fund’s contractual management fee was in the 3rd quintile of its expense group, while its actual management fee was in the 5th quintile and its total expenses (less 12b-1 and shareholder service fees) were in the 4th quintile. The Board noted that the Fund has an automatically renewable contractual expense cap and a permanent expense cap on each share class. These arrangements resulted in reimbursement of certain expenses incurred in 2013.
While the Board recognized that comparisons between the Fund and peer funds may be imprecise, given the different service levels and characteristics of mutual funds and the different business models and cost structures of the Advisers, the comparative information provided by Lipper assisted the Board in evaluating the reasonableness of the Fund’s management and sub-advisory fees and total operating expenses. In addition, the Board considered the analysis and recommendations of the Consultant relating to the Fund’s management and sub-advisory fees and total operating expenses.
Based on these considerations, the Board concluded that the Fund’s fees and total operating expenses, in conjunction with the information about quality of services, profitability, economies of scale, and other matters discussed, were reasonable in light of the services provided.
Economies of Scale
The Board requested and considered information regarding the Advisers’ realization of economies of scale with respect to the Fund and whether the fee levels reflect these economies of scale for the benefit of the Fund’s shareholders. The Board reviewed the breakpoints in the management fee schedule for the Fund, which reduce fee rates as Fund assets grow over time. The Board recognized that a fund with assets beyond the highest breakpoint level will continue to benefit from economies of scale because additional assets are charged the lowest breakpoint fee resulting in lower overall effective management fee rates. The Board also considered that expense limitations and fee waivers that reduce the Fund’s expenses at all asset levels can have the same effect as breakpoints in sharing economies of scale with shareholders and provide protection from an increase in expenses if Fund assets decline. The Board recognized that a fee schedule that reaches a lower breakpoint quickly provides shareholders with the benefit of anticipated or potential economies of scale. The Board also considered that HFMC has been active in managing expenses, which has resulted in benefits being realized by shareholders as assets within the Hartford Funds family of funds have grown over time, including through lower transfer agent costs and other operating expenses. The Board also noted the decrease in the Fund’s assets.
The Board reviewed and evaluated materials from Lipper and the Consultant showing how management fee schedules of peer funds reflect economies of scale for the benefit of shareholders as a peer fund’s assets hypothetically increase over time. Based on information provided by HFMC, Lipper, and the Consultant, the Board recognized that there is no uniform methodology for establishing breakpoints or uniform pattern in asset levels that trigger breakpoints or the amounts of breakpoints triggered.
After considering all of the information available to it, the Board concluded that it was satisfied with the extent to which economies of scale would be shared for the benefit of the Fund’s shareholders based on currently available information and the effective advisory fees and expense ratios for the Fund at its current and reasonably anticipated asset levels. The Board noted, however, that it would continue to monitor future growth in Fund assets and the appropriateness of additional breakpoints.
Other Benefits
The Board considered other benefits to the Advisers and their affiliates from their relationships with the Fund.
The Board noted that HFMC receives fees for fund accounting and related services from the Fund, and the Board considered information on profits to HFMC for such services. The Board also considered that Hartford Administrative Services Company (“HASCO”), the Fund’s transfer agent and an affiliate of HFMC, receives transfer agency compensation from the Fund, and the Board reviewed information on the profitability of
| 40 |
| The Hartford Inflation Plus Fund |
| Approval of Investment Management and Investment Sub-Advisory Agreements (Unaudited) – (continued) |
the Fund’s transfer agency function to HASCO. The Board considered information provided by HASCO indicating that the transfer agent fees charged by HASCO to the Fund were fair and reasonable based on publicly available information.
The Board also considered that Hartford Funds Distributors, LLC (“HFD”), an affiliate of HFMC, serves as principal underwriter of the Fund. As principal underwriter, HFD receives 12b-1 fees from the Fund and receives all or a portion of the sales charges on sales or redemptions of certain classes of shares. The Board also noted that certain affiliates of HFD distribute shares of the Fund and receive compensation in that connection.
The Board considered the benefits, if any, to the Sub-adviser from any use of the Fund’s brokerage commissions to obtain soft dollar research, and representations from HFMC and the Sub-adviser that the Sub-adviser would not make any revenue-sharing payments or any other type of distribution payments to HFMC or its affiliates.
The Board considered the benefits to shareholders of being part of the Hartford Funds family of funds, including the right to exchange investments between the same class of funds without a sales charge, the ability to reinvest Fund dividends into other funds in the family, and the ability to combine holdings in the Fund with holdings in other funds to obtain a reduced sales charge. The Board considered HFMC’s efforts to provide investors in the family with a broad range of investment styles and asset classes and its entrepreneurial risk in initiating new funds to expand these opportunities for shareholders.
* * * *
Based upon its review of these various factors, among others, the Board concluded that it is in the best interests of the Fund and its shareholders for the Board to approve the Agreements for an additional year. In reaching this decision, the Board did not assign relative weights to the factors discussed above or deem any one or group of them to be controlling in and of themselves. In connection with their deliberations, the Independent Directors met separately in executive session on several occasions, with independent legal counsel and the Consultant, to review the relevant materials and consider their responsibilities under relevant laws and regulations.
| 41 |
| The Hartford Inflation Plus Fund |
| Main Risks (Unaudited) |
The main risks of investing in the Fund are described below.
Market, Selection and Strategy Risk: The Fund’s share price may fluctuate due to market risk and/or security selections that may underperform the market or relevant benchmarks. If the sub-adviser's investment strategy does not perform as expected, the Fund could underperform its peers or lose money. There is no guarantee the Fund will achieve its stated objective.
Fixed Income Risk: The Fund is subject to interest rate risk (the risk that the value of an investment decreases when interest rates rise), credit risk (the risk that the issuing company of a security is unable to pay interest and principal when due) and call risk (the risk that an investment may be redeemed early). These risks also apply to the Fund’s investments in U.S. government securities, which may not be guaranteed by the U.S. government.
Inflation Protected Securities Risk: The market for inflation protected securities may be less developed or liquid, and more volatile, than other securities markets.
Derivatives Risk: Investments in derivatives can be volatile. Potential risks include currency risk, leverage risk (the risk that small market movements may result in large changes in the value of an investment), liquidity risk, index risk, pricing risk, and counterparty risk (the risk that the counterparty may be unwilling or unable to honor its obligations).
Mortgage-Backed Securities Risk: Mortgage-backed securities are subject to interest rate risk, credit risk, prepayment risk, extension risk, and the risk that an investment’s value may be reduced or become worthless if it receives interest or income payments only after other investments in the same pool.
Foreign Investment and Sovereign Debt Risk: Investments in foreign investments and sovereign debt can be riskier than U.S. investments. Potential risks include currency risk that may result from unfavorable exchange rates, liquidity risk if decreased demand for a security makes it difficult to sell at the desired price, risks that stem from substantially lower trading volume on foreign markets, and default risk.
Active Trading Risk: Actively trading investments may result in higher costs and higher taxable income.
| 42 |
THIS PRIVACY POLICY IS NOT PART OF THIS REPORT
Privacy Policy and Practices of The Hartford Financial Services Group, Inc. and its Affiliates
(herein called “we, our and us”)
This Privacy Policy applies to our United States Operations
| We value your trust. We are committed to the responsible: a) management; b) use; and c) protection; of Personal Information. This notice describes how we collect, disclose, and protect Personal Information. We collect Personal Information to: a) service your Transactions with us; and b) support our business functions. We may obtain Personal Information from: a) You; b) your Transactions with us; and c) third parties such as a consumer-reporting agency. Based on the type of product or service You apply for or get from us, Personal Information such as: a) your name; b) your address; c) your income; d) your payment; or e) your credit history; may be gathered from sources such as applications, Transactions, and consumer reports. To serve You and service our business, we may share certain Personal Information. We will share Personal Information, only as allowed by law, with affiliates such as: a) our insurance companies; b) our employee agents; c) our brokerage firms; and d) our administrators. As allowed by law, we may share Personal Financial Information with our affiliates to: a) market our products; or b) market our services; to You without providing You with an option to prevent these disclosures. |
We may also share Personal Information, only as
allowed by law, with unaffiliated third parties including: a) independent agents; b) brokerage firms; c) insurance companies; d) administrators; and e) service providers; who help us serve You and service our business. When allowed by law, we may share certain Personal Financial Information with other unaffiliated third parties who assist us by performing services or functions such as: a) taking surveys; b) marketing our products or services; or c) offering financial products or services under a joint agreement between us and one or more financial institutions. We, and third parties we partner with, may track some of the pages You visit through the use of: a) cookies; b) pixel tagging; or c) other technologies; and currently do not process or comply with any web browser’s “do not track” signal or similar mechanism that indicates a request to disable online tracking of individual users who visit our websites or use our services. We will not sell or share your Personal Financial Information with anyone for purposes unrelated to our business functions without offering You the opportunity to: a) “opt-out;” or b) “opt-in;” as required by law. We only disclose Personal Health Information with: a) your proper written authorization; or b) as otherwise allowed or required by law. Our employees have access to Personal Information in the course of doing their jobs, such as: a) underwriting policies; b) paying claims; c) developing new products; or d) advising customers of our products and services. |
| We use manual and electronic security procedures to
maintain: a) the confidentiality; and b) the integrity of; Personal Information that we have. We use these procedures to guard against unauthorized access. Some techniques we use to protect Personal Information include: a) secured files; b) user authentication; c) encryption; d) firewall technology; and e) the use of detection software. We are responsible for and must: a) identify information to be protected; b) provide an adequate level of protection for that data; c) grant access to protected data only to those people who must use it in the performance of their job-related duties. Employees who violate our Privacy Policy will be subject to discipline, which may include ending their employment with us. At the start of our business relationship, we will give You a copy of our current Privacy Policy. We will also give You a copy of our current Privacy Policy once a year if You maintain a continuing business relationship with us. We will continue to follow our Privacy Policy regarding Personal Information even when a business relationship no longer exists between us. |
As used in this Privacy Notice: Application means your request for our product or service. Personal Financial Information means financial information such as: a) credit history; b) income; c) financial benefits; or d) policy or claim information. Personal Health Information means health information such as: a) your medical records; or b) information about your illness, disability or injury. Personal Information means information that identifies You personally and is not otherwise available to the public. It includes: a) Personal Financial Information; and b) Personal Health Information. Transaction means your business dealings with us, such as: a) your Application; b) your request for us to pay a claim; and c) your request for us to take an action on your account. You means an individual who has given us Personal Information in conjunction with: a) asking about; b) applying for; or c) obtaining; a financial product or service from us if the product or service is used mainly for personal, family, or household purposes. |
This Privacy Policy is being provided on behalf of the following affiliates of The Hartford Financial Services Group, Inc.:
1stAGChoice, Inc.; Access CoverageCorp, Inc.; Access CoverageCorp Technologies, Inc.; American Maturity Life Insurance Company; Archway 60 R, LLC; Business Management Group, Inc.; Champlain Life Reinsurance Company; DMS R, LLC; Eloy R, LLC; Ersatz Corporation; First State Insurance Company; Hartford Accident and Indemnity Company; Hartford Administrative Services Company; Hartford Casualty General Agency, Inc.; Hartford Casualty Insurance Company; Hartford-Comprehensive Employee Benefit Service Company; Hartford Equity Sales Company, Inc.; Hartford Fire General Agency, Inc.; Hartford Fire Insurance Company; Hartford Funds Management Company, LLC; Hartford Funds Management Group, Inc.; Hartford HLS Series Fund II, Inc.; Hartford Insurance Company of Illinois; Hartford Insurance Company of the Midwest; Hartford Insurance Company of the Southeast; Hartford Integrated Technologies, Inc.; Hartford International Life Reassurance Corporation; Hartford Funds Distributors, LLC; Hartford Investment Management Company; Hartford Life and Accident Insurance Company; Hartford Life and Annuity Insurance Company; Hartford Life Insurance Company; Hartford Life Private Placement, LLC; Hartford Lloyd’s Corporation; Hartford Lloyd’s Insurance Company; Hartford Mezzanine Investors I, LLC; Hartford Residual Market, L.C.C.; Hartford Retirement Services, LLC; Hartford Securities Distribution Company, Inc.; Hartford Series Fund, Inc.; Hartford Specialty Insurance Services of Texas, LLC; Hartford Strategic Investments, LLC; Hartford Underwriters Insurance Company; Hartford Technology Services Company, L.L.C.; Hartford of Texas General Agency, Inc.; Hartford Underwriters General Agency, Inc.; HARTRE Company, L.C.C.; HL Investment Advisors, LLC; HLA LLC; Horizon Management Group, LLC; HRA Brokerage Services, Inc.; Lanidex Class B, LLC; M-CAP Insurance Agency, LLC; New England Insurance Company; New England Reinsurance Corporation; Nutmeg Insurance Agency, Inc.; Nutmeg Insurance Company; Pacific Insurance Company, Limited; Planco, LLC: Property and Casualty Insurance Company of Hartford; Revere R, LLC; RVR R, LLC; Sentinel Insurance Company, Ltd.; Sunstone R, LLC; Symphony R, LLC; The Evergreen Group Incorporated; The Hartford Alternative Strategies Fund; The Hartford Mutual Funds, Inc.; The Hartford Mutual Funds II, Inc.; Trumbull Flood Management, L.L.C.; Trumbull Insurance Company; Twin City Fire Insurance Company; White River Life Reinsurance Company.
HPP Revised January 2014
HARTFORDFUNDS
hartfordfunds.com
This information is written in connection with the promotion or marketing of the matter(s) addressed in this material.
This report is submitted for the general information of the shareholders of the Fund. It is not authorized for distribution unless preceded or accompanied by a current prospectus for the Fund.
The information cannot be used or relied upon for the purpose of avoiding IRS penalties. These materials are not intended to provide tax, accounting or legal advice. As with all matters of a tax or legal nature, you should consult your own tax or legal counsel for advice.
Investors should carefully consider the investment objectives, risks, charges, and expenses of Hartford Funds before investing. This and other information can be found in the prospectus and summary prospectus, which can be obtained by calling 888-843-7824 (retail) or 800-279-1541 (institutional). Investors should read them carefully before they invest.
Hartford Funds are underwritten and distributed by Hartford Funds Distributors, LLC.
MFAR-IP14 12/14 113986-3 Printed in U.S.A.
HARTFORDFUNDS
|
HARTFORD INTERNATIONAL
2014 Annual Report
*Prior to March 1, 2014, Hartford International Capital Appreciation Fund was known as The Hartford Diversified International Fund |
A MESSAGE FROM THE PRESIDENT
Dear Fellow Shareholders:
Thank you for investing in Hartford Funds.
Market Review
U.S. equities (as represented by the S&P 500 Index) rose steadily for the fiscal year ended October 31, 2014, with a return of 17.27% for the period. With the exception of short-lived geopolitical scares early in 2014 and concerns about continuing global growth near the end of the period, stocks generally rose on solid fundamentals and encouraging macroeconomic data during the year.
September 2014 marked the six-year anniversary of the start of the financial crisis. Within weeks of that anniversary, both the S&P 500 Index and the Dow Jones Industrial Average set new all-time highs, closing at 2,018 and 17,391, respectively, on October 31. Although the fallout of the crisis continues to influence investor behavior, stocks have recovered and risen dramatically, up 198% from their low in March 2009. Meanwhile, the domestic economy is notching strong growth, and the unemployment rate has reached its lowest level since August 2008.
While the U.S. economy appears to have stabilized and to have reverted to a solid growth path, the outlook for the global economy appears to have gotten cloudier. The U.S. Federal Reserve has ended quantitative easing, while Europe and Japan are pursuing stimulus options to avoid a double-dip recession and deflation, respectively. Diverging central-bank policies will likely continue to play an important role in market movements going forward as investors wait to see the reactions to their efforts and their impacts on global markets.
How have market movements impacted your portfolio throughout the last year? Are your investments still on track to provide the growth or income you need, and are you comfortable with their progress during times of volatility?
Your financial professional can help you navigate today’s markets with confidence, as well as assist you to achieve your investment goals by providing advice on the best options within our fund family to help you work toward overcoming today’s investing challenges. Meet with your financial advisor regularly to examine your portfolio and your investment strategy, and to determine if you’re still on track to meet your goals.
Thank you again for investing with Hartford Funds.
James Davey
President
Hartford Funds
1 The S&P 500 Index is a market capitalization-weighted price index composed of 500 widely held common stocks.
2 The Dow Jones Industrial Average is an unmanaged, price-weighted index of 30 of the largest, most widely held stocks traded on the NYSE
Hartford International Capital Appreciation Fund
Table of Contents
The views expressed in the Fund’s Manager Discussion under “Why did the Fund perform this way?” and “What is the outlook?” are views of the Fund’s sub-adviser and portfolio management team through the end of the period and are subject to change based on market and other conditions. The Fund’s Manager Discussion is for informational purposes only and does not represent an offer, recommendation or solicitation to buy, hold or sell any security. The specific securities identified and described, if any, do not represent all of the securities purchased or sold and you should not assume that investments in the securities identified and discussed will be profitable.
| Hartford International Capital Appreciation Fund inception 06/30/2008 |
| (sub-advised by Wellington Management Company, LLP) |
| Investment objective – The Fund seeks long-term capital appreciation. |
Performance Overview 6/30/08 - 10/31/14
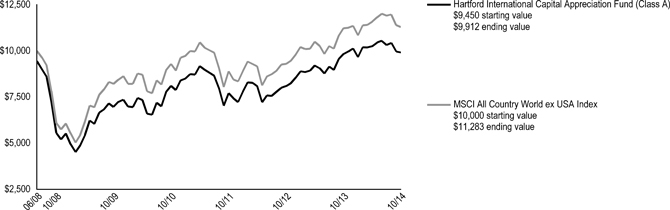
The chart above represents the hypothetical growth of a $10,000 investment in Class A, which includes a sales charge. Growth results in classes other than Class A will vary from what is seen above due to differences in the expenses charged to those share classes.
| Average Annual Total Returns (as of 10/31/14) |
| 1 Year | 5 Years | Since Inception▲ | ||||||||||
| International Capital Appreciation A# | 0.89 | % | 7.30 | % | 0.76 | % | ||||||
| International Capital Appreciation A## | -4.65 | % | 6.10 | % | -0.14 | % | ||||||
| International Capital Appreciation B# | 0.10 | % | 6.52 | % | 0.04 | % | ||||||
| International Capital Appreciation B## | -4.90 | % | 6.21 | % | 0.04 | % | ||||||
| International Capital Appreciation C# | 0.06 | % | 6.49 | % | 0.01 | % | ||||||
| International Capital Appreciation C## | -0.94 | % | 6.49 | % | 0.01 | % | ||||||
| International Capital Appreciation I# | 1.19 | % | 7.71 | % | 1.14 | % | ||||||
| International Capital Appreciation R3# | 0.54 | % | 7.03 | % | 0.51 | % | ||||||
| International Capital Appreciation R4# | 0.90 | % | 7.37 | % | 0.81 | % | ||||||
| International Capital Appreciation R5# | 1.18 | % | 7.69 | % | 1.09 | % | ||||||
| International Capital Appreciation Y# | 1.22 | % | 7.72 | % | 1.15 | % | ||||||
| MSCI All Country World ex USA Index | 0.49 | % | 6.55 | % | 1.92 | % | ||||||
| ▲ | Inception: 06/30/2008 |
| # | Without sales charge |
| ## | With sales charge |
PERFORMANCE DATA QUOTED REPRESENTS PAST PERFORMANCE AND DOES NOT GUARANTEE FUTURE RESULTS. The investment return and principal value of the investment will fluctuate so that investors’ shares, when redeemed, may be worth more or less than their original cost. Current performance may be lower or higher than the performance data quoted. To obtain performance data current to the most recent month-end, please visit our website www.hartfordfunds.com.
The initial investment in Class A shares reflects the maximum sales charge of 5.50% and returns for Class B shares reflect a contingent deferred sales charge of up to 5.00% and declining to zero, depending on the period of time the shares are held. Returns for Class C shares reflect a contingent deferred sales charge of up to 1.00% on shares redeemed within twelve months of purchase.
Total returns presented above were calculated using the Fund’s net asset value available to shareholders for sale or redemption of Fund shares on October 31, 2014, which may exclude investment transactions as of this date. All share class returns assume the reinvestment of all distributions at net asset value and the deduction of all fund expenses.
Effective 9/30/09, Class B shares of the Fund were closed to new investments.
MSCI All Country World ex USA Index is a broad-based, unmanaged, market capitalization weighted, total return index that measures the performance of both developed and emerging stock markets, excluding the U.S. The index is calculated to exclude companies and share classes which cannot be freely purchased by foreigners.
You cannot invest directly in an index.
The chart and table do not reflect the deductions of taxes that a shareholder would pay on Fund distributions or the redemption of Fund shares.
Performance information may reflect historical or current expense waivers/reimbursements from the investment adviser, without which performance would have been lower. For information on current expense waivers/reimbursements, please see the prospectus.
| 2 |
| Hartford International Capital Appreciation Fund |
| Manager Discussion |
| October 31, 2014 (Unaudited) |
| Operating Expenses* | ||||||||
| Net | Gross | |||||||
| International Capital Appreciation Class A | 1.45 | % | 1.95 | % | ||||
| International Capital Appreciation Class B | 2.20 | % | 2.64 | % | ||||
| International Capital Appreciation Class C | 2.20 | % | 2.68 | % | ||||
| International Capital Appreciation Class I | 1.20 | % | 1.56 | % | ||||
| International Capital Appreciation Class R3 | 1.65 | % | 2.25 | % | ||||
| International Capital Appreciation Class R4 | 1.35 | % | 1.94 | % | ||||
| International Capital Appreciation Class R5 | 1.05 | % | 1.63 | % | ||||
| International Capital Appreciation Class Y | 1.00 | % | 1.53 | % | ||||
| * | As shown in the Fund's current prospectus dated March 1, 2014. Actual expenses may be higher or lower. Please see accompanying Financial Highlights for expense ratios for the year ended October 31, 2014. |
Gross expenses are the Fund's total annual operating expenses shown in the Fund's most recent prospectus. Net expenses are the Fund's total annual operating expenses shown in the Fund's most recent prospectus and reflect contractual expense reimbursements in instances when these reductions reduce the Fund's gross expenses. Contractual reimbursements remain in effect until February 28, 2015, and automatically renew for one-year terms unless terminated.
All investments are subject to risk including the possible loss of principal. For a discussion of the Fund’s risks, please see the Main Risks section of this report. For more detailed information on the risks associated with an investment in the Fund, please see the prospectus.
| Portfolio Managers | ||
| Kent M. Stahl, CFA | Gregg R. Thomas, CFA | Jean-Marc Berteaux |
| Senior Vice President and Director of Investments and Risk Management | Senior Vice President and Director, Risk Management | Senior Vice President and Equity Portfolio Manager |
| James H. Shakin, CFA | Tara Connolly Stilwell, CFA | |
| Senior Vice President and Equity Portfolio Manager | Vice President and Equity Portfolio Manager |
How did the Fund perform?
The Class A shares of the Hartford International Capital Appreciation Fund returned 0.89%, before sales charge, for the twelve-month period ended October 31, 2014, outperforming the Fund’s benchmark, the MSCI All Country World ex USA Index, which returned 0.49% for the same period. The Fund also outperformed the 0.35% average return of the Lipper International Multi-Cap Growth peer group, a group of funds with investment strategies similar to those of the Fund.
Why did the Fund perform this way?
Global equities rose during the period, notwithstanding bouts of significant volatility. Despite ongoing geopolitical tensions in Ukraine and the Middle East, concerns about a Chinese economic growth slowdown, and unsettling economic and political developments in several other emerging market countries, the five-year-old bull market continued in the first half of 2014. Robust merger and acquisition activity, along with continued accommodative monetary policy from central banks around the globe, aided positive investor sentiment in May and June. However, Portuguese banking woes, European economic malaise, and the prospect of an accelerated U.S. Federal Reserve (Fed) interest-rate-hike timeline all contributed to stall the global stock rally near the tail end of the period. In addition, China's property slump and poor gross domestic product (GDP) readings in Japan and the eurozone raised the specter of a slowdown in global economic growth. Nevertheless, there were several positive developments, including monetary easing by the European Central Bank and the People's Bank of China, as well as an encouraging U.S. corporate earnings season. Despite these positives, many market participants found ample reason to reassess their risk appetites (i.e. reduce risks), given the strong performance in recent years. During the period, emerging market equities underperformed their developed market counterparts and U.S. stocks generally outperformed non-U.S. stocks.
Six of the ten sectors within the MSCI All Country World ex USA Index posted positive returns for the period. The Healthcare (+15%), Information Technology (+8%), and Utilities (+8%) sectors posted the largest gains while the Materials (-9%), Energy (-7%), and Consumer Discretionary (-3%) sectors lagged on a relative basis.
Both security selection and sector allocation, a result of our bottom-up stock selection, contributed to the Fund’s relative outperformance versus the benchmark during the period. Stock selection was strongest within the Materials, Utilities, and Telecommunication Services sectors. This was partially offset by weaker selection in the Financials and Industrials sectors. The benefit of being overweight the Information Technology sector and underweight the lagging Energy sector was partially offset by an overweight to the Consumer Discretionary sector. On a regional basis, an underweight allocation to North America detracted as the U.S. outperformed over the period. However, this was more than offset by strong security selection in Japan and emerging markets.
Top contributors to relative performance during the period included Huabao International (Materials), Ono Pharmaceuticals (Healthcare), and WuXi PharmaTech (Healthcare). Shares of Huabao International, China’s leading producer of tobacco flavors and reconstituted tobacco leaves products, rose as the company posted solid earnings and investor concerns around short-seller accusations in 2011 dissipated. Ono Pharmaceuticals, a Japan-based pharmaceutical firm, is directly leveraged to the future success of
| 3 |
| Hartford International Capital Appreciation Fund |
| Manager Discussion – (continued) |
| October 31, 2014 (Unaudited) |
Bristol-Myers Squibb's immuno-oncology pipeline drug Nivolumab. Ono has marketing rights in Japan and Asia, and owns royalty rights on Bristol's sales in the rest of the world. Ono’s shares have benefitted from enthusiasm building around Nivolumab as clinical data point to its potential in multiple tumor types. WuXi PharmaTech, a China-based provider of research and development outsourcing laboratory services, saw shares rise as the company experienced acceleration in growth due to improvements in U.S. laboratory service demand and improved traction in China. WuXi also reported strong second quarter 2014 results with sales exceeding consensus estimates. Top contributors to absolute performance also included AstraZeneca (Healthcare) and Teva Pharmaceuticals (Healthcare).
The largest detractors from absolute and relative performance were Vallourec (Industrials), Trican Well Services (Energy), and Renault (Consumer Discretionary). Shares of Vallourec, an industrial machinery company primarily focused on serving the energy/powergen market, fell on news that its largest single customer, Petrobras, changed its focus from exploration to production resulting in a significant decrease in the firm’s inventory of and demand for Vallourec tubes. Shares of Trican Well Services, a North American supplier of pressure pumping services to the oil and gas industry, fell during the period despite beating consensus earnings and revenue estimates; the stock price fell along with the broader sector as energy was the worst performing sector in the benchmark. Renault, a France-based automobile manufacturer, saw shares fall after an announcement of an agreement with Fiat under which Renault will supply Fiat with light commercial vehicles, a move investors viewed unfavorably.
Derivatives are not used in a significant manner in this Fund and did not have a material impact on performance during the period.
What is the outlook?
We believe the global cycle continues to advance at a moderate pace with a mix of stronger growth in the U.S. and more sluggish activity in Europe, Japan, and China. After three years of fiscal consolidation it appears that the U.S. expansion will no longer require support of the Fed and policy tightening appears to be on the horizon. Europe is adding layer after layer of central bank accommodation while Japan contemplates extending its quantitative easing program. In the meantime, China continues to use targeted easing measures to maintain growth. We believe that the combined effects of these policy actions will be the primary market driver in coming months.
The Fund ended the period most overweight the Industrials, Consumer Discretionary, and Information Technology sectors and most underweight the Financials, Energy, and Consumer Staples sectors, relative to its benchmark. On a regional basis, the Fund was most overweight Japan and most underweight North America.
| Diversification by Sector | ||||
| as of October 31, 2014 | ||||
| Sector | Percentage of Net Assets | |||
| Equity Securities | ||||
| Consumer Discretionary | 16.4 | % | ||
| Consumer Staples | 6.7 | |||
| Energy | 3.2 | |||
| Financials | 16.4 | |||
| Health Care | 10.6 | |||
| Industrials | 16.2 | |||
| Information Technology | 11.6 | |||
| Materials | 9.1 | |||
| Services | 3.1 | |||
| Utilities | 2.9 | |||
| Total | 96.2 | % | ||
| Short-Term Investments | 4.0 | |||
| Other Assets and Liabilities | (0.2 | ) | ||
| Total | 100.0 | % | ||
A sector may be comprised of several industries. For Fund compliance purposes, the Fund may not use the same classification system and these sector classifications are used for reporting ease.
| 4 |
| Hartford International Capital Appreciation Fund |
| Schedule of Investments |
| October 31, 2014 |
| (000’s Omitted) |
| Shares or Principal Amount | Market Value ╪ | |||||||
Common Stocks - 95.4% | ||||||||
| Argentina - 0.5% | ||||||||
| 1 | Banco Macro S.A. ‡ | $ | 37 | |||||
| 3 | Empresa Distribuidora y Comercializadora Norte S.A ● | 33 | ||||||
| 2 | Grupo Financiero Galicia S.A. | 30 | ||||||
| 1 | YPF Sociedad Anonima ADR | 35 | ||||||
| 135 | ||||||||
| Australia - 3.5% | ||||||||
| 84 | AJ Lucas Group Ltd. ● | 53 | ||||||
| 97 | Alumina Ltd. ● | 141 | ||||||
| 16 | Aquarius Platinum Ltd. ● | 4 | ||||||
| 6 | Austbrokers Holdings Ltd. | 51 | ||||||
| 9 | Challenger Financial Services Group Ltd. ☼ | 54 | ||||||
| 27 | Dick Smith Holdings Ltd. | 52 | ||||||
| 2 | Domino's Pizza Enterprises Ltd. | 52 | ||||||
| 4 | Energy Resources of Australia Ltd. ● | 5 | ||||||
| 21 | Federation Centres | 51 | ||||||
| 16 | ING Office Fund REIT | 52 | ||||||
| 20 | Karoon Gas Australia Ltd. ●☼ | 52 | ||||||
| 42 | National Storage REIT ● | 52 | ||||||
| 11 | NuFarm Ltd. | 50 | ||||||
| 34 | Orora Ltd. | 52 | ||||||
| 25 | Qantas Airways Ltd. ● | 38 | ||||||
| 29 | Resolute Mining Ltd. ● | 8 | ||||||
| 4 | Seek Ltd. | 54 | ||||||
| 61 | Spotless Group Holdings Ltd. ● | 104 | ||||||
| 13 | Treasury Wine Estates Ltd. | 51 | ||||||
| 14 | Western Areas Ltd. ☼ | 53 | ||||||
| 1,029 | ||||||||
| Austria - 0.0% | ||||||||
| 1 | Zumtobel Group AG | 10 | ||||||
| Belgium - 1.8% | ||||||||
| 1 | Ageas | 40 | ||||||
| 5 | Agfa Gevaert N.V. ● | 12 | ||||||
| 3 | Anheuser-Busch InBev N.V. | 359 | ||||||
| — | Delhaize-Le Lion S.A. | 18 | ||||||
| 1 | UCB S.A. | 100 | ||||||
| 529 | ||||||||
| Brazil - 1.3% | ||||||||
| 4 | BB Seguridade Participacoes | 47 | ||||||
| 3 | Cia Brasileira de Meios de Pagamentos | 52 | ||||||
| — | HRT Participacoes em Petroleo S.A. ● | 2 | ||||||
| 4 | Itau Unibanco Banco Multiplo S.A. ADR | 56 | ||||||
| 7 | Kroton Educacional S.A. | 47 | ||||||
| 1 | Linx S.A. | 25 | ||||||
| 4 | Petroleo Brasileiro S.A. ADR | 47 | ||||||
| 5 | Raia Drogasil S.A. | 45 | ||||||
| 2 | Smiles S.A. | 38 | ||||||
| 2 | Valid Solucoes S.A. | 37 | ||||||
| 396 | ||||||||
| Canada - 2.6% | ||||||||
| 5 | Alimentation Couche-Tard, Inc. | 186 | ||||||
| 2 | Barrick Gold Corp. | 21 | ||||||
| 8 | CAE, Inc. | 106 | ||||||
| 4 | Centerra Gold, Inc. | 14 | ||||||
| 4 | Eldorado Gold Corp. | 20 | ||||||
| 1 | EnCana Corp. | 22 | ||||||
| 9 | Kinross Gold Corp. ● | 20 | ||||||
| 3 | Legacy Oil + Gas, Inc. ● | 12 | ||||||
| 3 | Methanex Corp. | 165 | ||||||
| 2 | Northern Dynasty Minerals Ltd. ● | 1 | ||||||
| 2 | Painted Pony Petroleum Ltd. ● | 15 | ||||||
| 2 | Talisman Energy, Inc. | 15 | ||||||
| 16 | Trican Well Service Ltd. | 147 | ||||||
| 4 | Uranium Participation Corp. ● | 16 | ||||||
| 760 | ||||||||
| Cayman Islands - 0.2% | ||||||||
| 45 | HC International, Inc. ● | 55 | ||||||
| China - 8.0% | ||||||||
| 6 | 21Vianet Group, Inc. ADR ● | 135 | ||||||
| 78 | Air China Ltd. | 51 | ||||||
| 1 | Alibaba Group Holding Ltd. ● | 85 | ||||||
| 146 | AMVIG Holdings Ltd. | 69 | ||||||
| — | Baidu, Inc. ADR ● | 104 | ||||||
| 7 | ChinaCache International Holdings Ltd. ADR ● | 70 | ||||||
| 46 | Daphne International Holdings Ltd. | 23 | ||||||
| 57 | Dongfeng Motor Group Co., Ltd. | 88 | ||||||
| 12 | E-House China Holdings Ltd. | 120 | ||||||
| 14 | ENN Energy Holdings Ltd. | 88 | ||||||
| 391 | Greatview Aseptic Packaging Co., Ltd. | 256 | ||||||
| 67 | Guangdong Investment Ltd. | 88 | ||||||
| 106 | Huabao International Holdings Ltd. | 76 | ||||||
| 120 | Huadian Fuxin Energy Corp., Ltd. | 69 | ||||||
| 158 | Intime Retail Group Co., Ltd. | 137 | ||||||
| 39 | Kingboard Laminates Holdings Ltd. ● | 16 | ||||||
| 29 | Mandarin Oriental International Ltd. | 51 | ||||||
| 311 | Maoye International Holdings | 48 | ||||||
| 1 | NetEase, Inc. ADR | 102 | ||||||
| 6 | New Oriental Education & Technology Group, Inc. ADR ● | 122 | ||||||
| 24 | New World Department Store China | 9 | ||||||
| 1 | NQ Mobile, Inc. ADR ● | 6 | ||||||
| 43 | PetroChina Co., Ltd. | 54 | ||||||
| 9 | Phoenix New Media Ltd. ADR ● | 94 | ||||||
| 8 | Ping An Insurance (Group) Co. | 62 | ||||||
| 3 | Sinovac Biotech Ltd. ● | 14 | ||||||
| 31 | Sunny Optical Technology Group | 51 | ||||||
| 7 | WuXi PharmaTech Cayman, Inc. ● | 274 | ||||||
| 2,362 | ||||||||
| Colombia - 0.1% | ||||||||
| 3 | Pacific Rubiales Energy Corp. | 40 | ||||||
| Denmark - 1.4% | ||||||||
| 9 | DSV AS | 280 | ||||||
| 7 | H. Lundbeck A/S | 145 | ||||||
| 425 | ||||||||
| Finland - 1.0% | ||||||||
| 4 | Kone Oyj Class B | 193 | ||||||
| 2 | Sampo Oyj Class A | 95 | ||||||
| 288 | ||||||||
| France - 9.5% | ||||||||
| 1 | Air Liquide | 168 | ||||||
| — | Alten Ltd. | 19 | ||||||
| 1 | BNP Paribas | 49 | ||||||
| 3 | Bureau Veritas S.A. | 63 | ||||||
| 1 | Capital Gemini S.A. | 48 | ||||||
| 3 | Cie Generale d'Optique Essilor International S.A. | 306 | ||||||
| 1 | Compagnie De Saint-Gobain | 58 | ||||||
| — | Devoteam S.A. | 4 | ||||||
The accompanying notes are an integral part of these financial statements.
| 5 |
| Hartford International Capital Appreciation Fund |
| Schedule of Investments – (continued) |
| October 31, 2014 |
| (000’s Omitted) |
| Shares or Principal Amount | Market Value ╪ | |||||||
Common Stocks - 95.4% - (continued) | ||||||||
| France - 9.5% - (continued) | ||||||||
| 9 | Edenred | $ | 239 | |||||
| 2 | GDF Suez | 56 | ||||||
| 1 | GFI Informatique S.A. | 3 | ||||||
| 1 | Groupe Steria SCA | 23 | ||||||
| — | Lafarge S.A. | 25 | ||||||
| 3 | Legrand S.A. | 168 | ||||||
| 1 | L'Oreal S.A. | 118 | ||||||
| 1 | Metropole Television S.A. | 20 | ||||||
| 8 | Orange S.A. | 134 | ||||||
| 1 | Pernod-Ricard S.A. | 150 | ||||||
| 3 | Peugeot S.A. ● | 38 | ||||||
| 3 | Renault S.A. | 190 | ||||||
| 3 | Rexel S.A. | 56 | ||||||
| — | S.p.A.Group S.A. ‡ | 10 | ||||||
| 1 | Saft Groupe S.A. | 16 | ||||||
| 2 | Sanofi-Aventis S.A. | 172 | ||||||
| 1 | Schneider Electric S.A. | 110 | ||||||
| 1 | Societe Generale Class A | 37 | ||||||
| 1 | Thales S.A. | 35 | ||||||
| 1 | Total S.A. | 86 | ||||||
| 1 | Unibail Rodamco REIT | 131 | ||||||
| 1 | Valeo S.A. | 153 | ||||||
| 4 | Vallourec S.A. | 152 | ||||||
| 2,837 | ||||||||
| Germany - 3.4% | ||||||||
| 1 | Bayer AG | 184 | ||||||
| — | Bertrandt AG | 27 | ||||||
| 3 | Brenntag AG | 163 | ||||||
| 2 | Deutsche Lufthansa AG | 29 | ||||||
| 2 | E.On SE | 29 | ||||||
| 1 | Gerry Weber International AG | 28 | ||||||
| 1 | Hamburger Hafen und Logistik | 15 | ||||||
| 1 | Hugo Boss AG | 109 | ||||||
| 13 | Infineon Technologies AG | 123 | ||||||
| — | Koenig & Bauer AG ● | 4 | ||||||
| 2 | Kontron AG ● | 10 | ||||||
| 1 | Norma Group SE | 36 | ||||||
| 1 | Osram Licht AG ● | 22 | ||||||
| 1 | Rheinmetall AG | 34 | ||||||
| 1 | RWE AG | 31 | ||||||
| 1 | Salzgitter AG | 22 | ||||||
| 1 | Suedzucker AG | 16 | ||||||
| 6 | Tom Tailor Holding AG ● | 80 | ||||||
| 1 | United Internet AG | 49 | ||||||
| 1,011 | ||||||||
| Greece - 0.3% | ||||||||
| 106 | Alpha Bank A.E. ● | 69 | ||||||
| 11 | Piraeus Bank S.A. ● | 16 | ||||||
| 85 | ||||||||
| Hong Kong - 4.1% | ||||||||
| 9 | AAC Technologies Holdings, Inc. | 53 | ||||||
| 12 | AIA Group Ltd. | 65 | ||||||
| 39 | Baoxin Automotive Group Ltd. | 30 | ||||||
| 15 | CafT de Coral Holdings Ltd. | 52 | ||||||
| 80 | China High Precision Automation Group Ltd. ⌂●† | — | ||||||
| 107 | China Lesso Group Holdings Ltd. | 56 | ||||||
| 8 | China Merchants Holdings International Co., Ltd. | 25 | ||||||
| 124 | China Resources Cement | 84 | ||||||
| 26 | China Resources Gas Group LT | 75 | ||||||
| 32 | China Resources Land Ltd. | 75 | ||||||
| 6 | Clear Media Ltd. | 6 | ||||||
| 2 | Dah Sing Financial Group | 13 | ||||||
| 40 | Esprit Holdings Ltd. | 50 | ||||||
| 234 | Global Brands Group Holding Ltd. ● | 52 | ||||||
| 525 | G-Resources Group Ltd. ● | 13 | ||||||
| 1 | Lifestyle Properties Development Ltd. ● | — | ||||||
| 39 | MGM China Holdings Ltd. | 126 | ||||||
| 104 | Pacific Basin Ship | 50 | ||||||
| 17 | Samsonite International S.A. | 55 | ||||||
| 11 | Sands China Ltd. | 68 | ||||||
| 19 | Shanghai Industrial Holdings Ltd. | 58 | ||||||
| 17 | Techtronic Industries Co., Ltd. | 53 | ||||||
| 51 | Towngas China Co., Ltd. | 53 | ||||||
| 216 | Trinity Ltd. | 52 | ||||||
| 106 | Xingda International Holdings | 37 | ||||||
| 48 | Xinyi Glass Holdings Co., Ltd. | 28 | ||||||
| 1,229 | ||||||||
| Hungary - 0.1% | ||||||||
| 12 | Magyar Tavkozlesi Rt ● | 16 | ||||||
| 1 | OTP Bank plc ● | 17 | ||||||
| 33 | ||||||||
| India - 0.6% | ||||||||
| 5 | Allahabad Bank Ltd. | 10 | ||||||
| 2 | Canara Bank Ltd. | 13 | ||||||
| 1 | Corp. Bank | 8 | ||||||
| 2 | ICICI Bank Ltd. | 104 | ||||||
| 31 | Manappuram Finance Ltd. | 16 | ||||||
| 6 | NTPC Ltd. | 15 | ||||||
| 166 | ||||||||
| Ireland - 0.6% | ||||||||
| 5 | AER Lingus Group plc | 9 | ||||||
| 176 | Bank of Ireland ● | 69 | ||||||
| 5 | CRH plc | 114 | ||||||
| 192 | ||||||||
| Israel - 0.8% | ||||||||
| 4 | Teva Pharmaceutical Industries Ltd. ADR | 228 | ||||||
| Italy - 1.7% | ||||||||
| 8 | Assicurazioni Generali S.p.A. | 156 | ||||||
| 1 | Banca Popolare dell-Emilia Romagna Scrl ● | 10 | ||||||
| 2 | Buzzi Unicem S.p.A. | 27 | ||||||
| 1 | DiaSorin S.p.A. | 41 | ||||||
| 3 | Eni S.p.A. | 64 | ||||||
| 30 | Intesa Sanpaolo S.p.A. | 87 | ||||||
| 17 | UniCredit S.p.A. | 120 | ||||||
| 505 | ||||||||
| Japan - 19.0% | ||||||||
| 1 | Adastria Holdings Co., Ltd. | 23 | ||||||
| 1 | AEON Delight Co., Ltd. | 15 | ||||||
| 4 | AEON Mall Co., Ltd. | 72 | ||||||
| 2 | Aichi Steel Corp. | 7 | ||||||
| 2 | Aisan Industry Co., Ltd. | 14 | ||||||
| 2 | Aisin Seiki Co., Ltd. | 59 | ||||||
| — | Alpha Systems, Inc. | 3 | ||||||
| 6 | Anritsu Corp. | 46 | ||||||
| 1 | Avex, Inc. | 12 | ||||||
| 6 | Bridgestone Corp. ☼ | 188 | ||||||
| 2 | Canon, Inc. | 46 | ||||||
| 1 | Cawachi Ltd. | 14 | ||||||
| 1 | Chubu Steel Plate Co., Ltd. | 5 | ||||||
The accompanying notes are an integral part of these financial statements.
| 6 |
| Hartford International Capital Appreciation Fund |
| Schedule of Investments – (continued) |
| October 31, 2014 |
| (000’s Omitted) |
| Shares or Principal Amount | Market Value ╪ | |||||||
Common Stocks - 95.4% - (continued) | ||||||||
| Japan - 19.0% - (continued) | ||||||||
| 1 | CMIC Holdings Co., Ltd. | $ | 12 | |||||
| 2 | Dai-ichi Life Insurance Co., Ltd. | 32 | ||||||
| 1 | Daiichi Sankyo Co., Ltd. | 20 | ||||||
| 1 | Dai-Ichi Seiko Co., Ltd. | 13 | ||||||
| 2 | DeNa Co., Ltd. | 19 | ||||||
| 2 | Denso Corp. | 107 | ||||||
| 4 | DMG Mori Seiki Co., Ltd. | 49 | ||||||
| 3 | Eighteenth (The) Bank Ltd. | 8 | ||||||
| 1 | Eisai Co., Ltd. | 43 | ||||||
| 1 | En-Japan, Inc. | 14 | ||||||
| 1 | Exedy Corp. | 20 | ||||||
| 1 | Fuji Heavy Industries Ltd. | 40 | ||||||
| 2 | Fuji Machine Manufacturing Co. | 14 | ||||||
| 1 | Fujimi, Inc. | 16 | ||||||
| 8 | Fujitsu Ltd. | 49 | ||||||
| 2 | Funai Electric Co., Ltd. | 20 | ||||||
| 1 | Futaba Corp. | 9 | ||||||
| 1 | Gendai Agency, Inc. | 4 | ||||||
| 2 | Gree, Inc. | 16 | ||||||
| 3 | Higashi-Nippon Bank Ltd. | 8 | ||||||
| 1 | Hisaka Works Ltd. | 9 | ||||||
| 2 | Hitachi Chemical Co., Ltd. | 37 | ||||||
| 11 | Hitachi Ltd. | 86 | ||||||
| 2 | Hitachi Metals Ltd. | 28 | ||||||
| 3 | Honda Motor Co., Ltd. | 107 | ||||||
| 2 | Honeys Co., Ltd. | 15 | ||||||
| 3 | Hosiden Corp. | 17 | ||||||
| 6 | Inpex Corp. | 78 | ||||||
| 3 | Isuzu Motors Ltd. | 38 | ||||||
| 1 | Itochu Techno-Solutions Corp. | 28 | ||||||
| — | Japan Digital Laboratory Co., Ltd. | 7 | ||||||
| 7 | Japan Display, Inc. ● | 22 | ||||||
| 1 | Japan Petroleum Exploration Co., Ltd. | 23 | ||||||
| 7 | Japan Steel Works Ltd. ☼ | 25 | ||||||
| 2 | JSR Corp. | 31 | ||||||
| 4 | KDDI Corp. | 240 | ||||||
| 2 | Keihin Corp. | 23 | ||||||
| 5 | Kubota Corp. | 85 | ||||||
| 1 | Kuroda Electric Co., Ltd. ☼ | 14 | ||||||
| 8 | Kyushu Electric Power Co., Inc. ● | 81 | ||||||
| 13 | Leopalace21 Corp. ● | 79 | ||||||
| 7 | Makino Milling Machine Co. | 50 | ||||||
| 1 | Maruichi Steel Tube Ltd. | 14 | ||||||
| 1 | Melco Holdings, Inc. | 11 | ||||||
| 2 | Mimasu Semiconductor Industry Co., Ltd. | 15 | ||||||
| 1 | Miraial Co., Ltd. | 14 | ||||||
| 2 | Mitsubishi Estate Co., Ltd. | 61 | ||||||
| 9 | Mitsubishi Gas Chemical Co. | 54 | ||||||
| 28 | Mitsubishi Materials Corp. | 88 | ||||||
| 60 | Mitsubishi UFJ Financial Group, Inc. | 350 | ||||||
| 15 | Mitsubishi UFJ Lease & Finance Co., Ltd. | 78 | ||||||
| 11 | Mitsui Chemicals, Inc. | 32 | ||||||
| 12 | Mitsui O.S.K. Lines Ltd. | 39 | ||||||
| 2 | Mitsumi Electric Co., Ltd. | 10 | ||||||
| 1 | Moshi Moshi Hotline, Inc. | 12 | ||||||
| 63 | NEC Corp. ☼ | 221 | ||||||
| 2 | Net One Systems Co., Ltd. | 14 | ||||||
| 1 | Neturen Co., Ltd. | 5 | ||||||
| 3 | Nichicon Corp. | 21 | ||||||
| — | Nintendo Co., Ltd. | 22 | ||||||
| 2 | Nippon Telegraph & Telephone Corp. | 147 | ||||||
| 6 | Nippon Television Network Corp. | 85 | ||||||
| 2 | Nishimatsuya Chain Co., Ltd. | 20 | ||||||
| 1 | Nitto Denko Corp. | 32 | ||||||
| 1 | NSD Co., Ltd. | 9 | ||||||
| 1 | OBIC Co., Ltd. | 45 | ||||||
| 3 | Oita Bank Ltd. | 11 | ||||||
| 3 | Ono Pharmaceutical Co., Ltd. ☼ | 285 | ||||||
| 1 | Pal Co., Ltd. | 22 | ||||||
| 1 | Proto Corp. | 10 | ||||||
| 8 | Rakuten, Inc. | 96 | ||||||
| 1 | Recruit Holdings Co., Ltd. ● | 23 | ||||||
| 1 | Rohm Co., Ltd. | 37 | ||||||
| 7 | SCREEN Holdings Co., Ltd. | 38 | ||||||
| — | Shimamura Co., Ltd. | 18 | ||||||
| 2 | Shinkawa Ltd. ● | 9 | ||||||
| 4 | Shinko Electric Industries Co., Ltd. | 23 | ||||||
| 29 | Shinsei Bank Ltd. | 65 | ||||||
| 1 | SoftBank Corp. | 44 | ||||||
| 5 | Sony Financial Holdings, Inc. | 76 | ||||||
| 7 | Sumitomo Bakelite Co., Ltd. | 28 | ||||||
| 1 | Sumitomo Mitsui Financial Group, Inc. | 53 | ||||||
| 2 | Sumitomo Riko Co., Ltd. | 14 | ||||||
| 20 | T&D Holdings, Inc. | 261 | ||||||
| 50 | Taiheyo Cement Corp. ☼ | 184 | ||||||
| 1 | Takata Corp. ☼ | 18 | ||||||
| 4 | Takeda Pharmaceutical Co., Ltd. | 167 | ||||||
| 3 | Tochigi (The) Bank Ltd. | 12 | ||||||
| 1 | Tokai Rika Co., Ltd. | 25 | ||||||
| 2 | Tokio Marine Holdings, Inc. | 73 | ||||||
| 1 | Tokyo Ohka Kogyo Co., Ltd. | 33 | ||||||
| 1 | Tokyo Seimitsu Co., Ltd. | 23 | ||||||
| 3 | Tokyo Steel Manufacturing Co., Ltd. | 18 | ||||||
| 1 | Topre Corp. | 16 | ||||||
| 23 | Toshiba Corp. | 101 | ||||||
| 5 | Toshiba Machine Co., Ltd. | 20 | ||||||
| 2 | Toyoda Gosei Co., Ltd. | 35 | ||||||
| 2 | Toyota Boshoku Corp. | 28 | ||||||
| 2 | Toyota Industries Corp. | 77 | ||||||
| — | Tri-Stage, Inc. | 5 | ||||||
| 3 | TS Technology Co., Ltd. | 70 | ||||||
| 2 | Ushio, Inc. | 23 | ||||||
| 1 | XEBIO Co., Ltd. | 19 | ||||||
| 2 | Yamanashi (The) Chuo Bank Ltd. | 9 | ||||||
| 1 | Yamato Kogyo Co. | 26 | ||||||
| 2 | Yodogawa Steel Works Ltd. | 8 | ||||||
| — | Zuken, Inc. | 4 | ||||||
| 5,646 | ||||||||
| Jersey - 0.4% | ||||||||
| 24 | Glencore plc | 123 | ||||||
| Luxembourg - 0.1% | ||||||||
| 1 | Oriflame Cosmetics S.A. ADR | 17 | ||||||
| Malaysia - 1.0% | ||||||||
| 321 | AirAsia Berhad | 244 | ||||||
| 45 | MY EG Services BHD | 55 | ||||||
| 299 | ||||||||
| Mexico - 1.2% | ||||||||
| 17 | Alfa S.A.B. de C.V. | 54 | ||||||
The accompanying notes are an integral part of these financial statements.
| 7 |
| Hartford International Capital Appreciation Fund |
| Schedule of Investments – (continued) |
| October 31, 2014 |
| (000’s Omitted) |
| Shares or Principal Amount | Market Value ╪ | |||||||
Common Stocks - 95.4% - (continued) | ||||||||
| Mexico - 1.2% - (continued) | ||||||||
| 20 | Compartamos S.A.B. de C.V. ● | $ | 45 | |||||
| 19 | Corporacion Inmobiliaria Vesta S. de RL de C.V. | 41 | ||||||
| 17 | Credito Real S.A. de C.V. | 43 | ||||||
| 3 | Gruma S.A.B de C.V. ● | 33 | ||||||
| 9 | Grupo Financiero Banorte S.A.B. de C.V. | 59 | ||||||
| 26 | Hoteles City Express S.A.B. de C.V. ● | 48 | ||||||
| 12 | OHL Mexico S.A.B. de C.V. ● | 34 | ||||||
| 357 | ||||||||
| Netherlands - 2.8% | ||||||||
| 1 | ASML Holding N.V. | 127 | ||||||
| 2 | Delta Lloyd N.V. | 41 | ||||||
| 2 | Heineken N.V. | 138 | ||||||
| 18 | ING Groep N.V. ● | 257 | ||||||
| 29 | Koninklijke (Royal) KPN N.V. | 96 | ||||||
| 1 | Koninklijke Philips N.V. | 39 | ||||||
| 1 | NXP Semiconductors N.V. ● | 74 | ||||||
| 9 | PostNL ● | 37 | ||||||
| 1 | USG People N.V. | 13 | ||||||
| 822 | ||||||||
| Norway - 0.1% | ||||||||
| 5 | Storebrand ASA ● | 26 | ||||||
| Panama - 0.6% | ||||||||
| 2 | Copa Holdings S.A. Class A | 188 | ||||||
| Portugal - 0.2% | ||||||||
| 9 | Banco Espirito Santo S.A. ⌂●† | — | ||||||
| 5 | Galp Energia SGPS S.A. | 67 | ||||||
| 67 | ||||||||
| Russia - 0.1% | ||||||||
| 4 | OAO Gazprom Class S ADR | 29 | ||||||
| Singapore - 0.5% | ||||||||
| 39 | ARA Asset Management | 52 | ||||||
| 107 | Biosensors International Group Ltd. ● | 52 | ||||||
| 17 | Petra Foods Ltd. | 52 | ||||||
| 156 | ||||||||
| South Africa - 0.2% | ||||||||
| 1 | Anglo American Platinum Ltd. ● | 20 | ||||||
| 4 | Impala Platinum Holdings Ltd. ● | 28 | ||||||
| 8 | Raubex Group Ltd. | 16 | ||||||
| 64 | ||||||||
| South Korea - 3.2% | ||||||||
| 1 | Coway Co., Ltd. | 48 | ||||||
| 1 | Doosan Corp. | 71 | ||||||
| 2 | Doosan Heavy Industrions and Construction Co. ● | 39 | ||||||
| 2 | Hana Financial Holdings | 54 | ||||||
| — | Hyundai Department Store Co., Ltd. | 44 | ||||||
| 1 | Hyundai Home Shopping Network Corp. | 133 | ||||||
| — | Hyundai Motor Co., Ltd. | 51 | ||||||
| 1 | KB Financial Group, Inc. | 30 | ||||||
| 1 | Kia Motors Corp. | 35 | ||||||
| 2 | Korea Electric Power Corp. | 69 | ||||||
| 1 | Korea Telecom Corp. | 34 | ||||||
| 9 | LG Telecom Ltd. | 90 | ||||||
| — | Posco Ltd. | 114 | ||||||
| — | Shinhan Financial Group Co., Ltd. | 18 | ||||||
| — | SK Telecom Co., Ltd. | 59 | ||||||
| 2 | Suprema, Inc. ● | 47 | ||||||
| 1 | Tongyang Life Insurance | 13 | ||||||
| 949 | ||||||||
| Spain - 0.2% | ||||||||
| 1 | Almirall S.A. ● | 24 | ||||||
| 3 | Telefonica S.A. | 48 | ||||||
| 72 | ||||||||
| Sweden - 3.7% | ||||||||
| 5 | Alfa Laval Ab | 109 | ||||||
| 4 | Assa Abloy Ab | 224 | ||||||
| 7 | Atlas Copco Ab | 191 | ||||||
| 1 | Axis Communications Ab | 32 | ||||||
| 5 | Boliden Ab | 89 | ||||||
| 7 | Electrolux AB Series B | 210 | ||||||
| 5 | Nordea Bank Ab | 60 | ||||||
| 3 | SKF AB Class B | 70 | ||||||
| 7 | Trelleborg AB | 122 | ||||||
| 1,107 | ||||||||
| Switzerland - 5.9% | ||||||||
| — | Adecco S.A. | 34 | ||||||
| — | Belimon Holding AG | 35 | ||||||
| 2 | Compagnie Financiere Richemont S.A. | 128 | ||||||
| — | Daetwyler Holding AG | 6 | ||||||
| — | Geberit AG | 126 | ||||||
| — | Givaudan | 48 | ||||||
| — | Holcim Ltd. | 26 | ||||||
| — | Inficon Holdings AG | 21 | ||||||
| 6 | Julius Baer Group Ltd. | 264 | ||||||
| — | Kuehne & Nagel International AG | 41 | ||||||
| — | LEM Holdings S.A. | 19 | ||||||
| — | Lindt & Spruengli AG | 30 | ||||||
| 2 | Micronas Semiconductor Holding AG | 13 | ||||||
| 2 | Novartis AG | 228 | ||||||
| 1 | Roche Holding AG | 293 | ||||||
| — | SGS S.A. | 64 | ||||||
| 1 | Tecan Group AG | 54 | ||||||
| 18 | UBS AG | 311 | ||||||
| 1,741 | ||||||||
| Taiwan - 2.2% | ||||||||
| 7 | Advantech Co., Ltd. | 51 | ||||||
| 7 | AirTac International Group | 54 | ||||||
| 1 | Hermes Microvision, Inc. | 53 | ||||||
| 5 | Pchome Online, Inc. | 52 | ||||||
| 7 | Silergy Corp. | 52 | ||||||
| 78 | Taiwan Semiconductor Manufacturing Co., Ltd. | 339 | ||||||
| 35 | WPG Holdings Co., Ltd. | 43 | ||||||
| 644 | ||||||||
| Thailand - 0.4% | ||||||||
| 39 | PTT Chemical Public Co., Ltd. | 75 | ||||||
| 16 | Total Access Communication Public Co., Ltd. | 50 | ||||||
| 125 | ||||||||
| United Kingdom - 11.5% | ||||||||
| 2 | Anglo American plc | 45 | ||||||
| 12 | Arm Holdings plc | 173 | ||||||
| 10 | Ashtead Group plc | 165 | ||||||
| 4 | AstraZeneca plc | 297 | ||||||
| 6 | BG Group plc | 100 | ||||||
| 22 | Booker Group plc | 50 | ||||||
| 14 | BP plc | 98 | ||||||
| 6 | British American Tobacco plc | 320 | ||||||
| 9 | Burberry Group plc | 210 | ||||||
The accompanying notes are an integral part of these financial statements.
| 8 |
| Hartford International Capital Appreciation Fund |
| Schedule of Investments – (continued) |
| October 31, 2014 |
| (000’s Omitted) |
| Shares or Principal Amount | Market Value ╪ | |||||||
Common Stocks - 95.4% - (continued) | ||||||||
| United Kingdom - 11.5% - (continued) | ||||||||
| 2 | Catlin Group Ltd. | $ | 14 | |||||
| 8 | Compass Group plc ● | 124 | ||||||
| 6 | Diageo Capital plc | 169 | ||||||
| 5 | Halma plc | 51 | ||||||
| 10 | Hays plc ‡ | 21 | ||||||
| 6 | Home Retail Group | 18 | ||||||
| 11 | HSBC Holdings plc | 115 | ||||||
| 11 | International Consolidated Airlines Group S.A. ● | 71 | ||||||
| 2 | Intertek Group plc | 69 | ||||||
| 5 | J. Sainsbury plc | 18 | ||||||
| 3 | Jardine Lloyd Thompson Group plc | 44 | ||||||
| 15 | Kingfisher plc | 73 | ||||||
| 7 | Lonmin plc ● | 21 | ||||||
| 12 | National Grid plc | 179 | ||||||
| 8 | Prudential plc | 180 | ||||||
| 2 | Reckitt Benckiser Group plc | 190 | ||||||
| 6 | SIG plc | 14 | ||||||
| 8 | Smith & Nephew plc | 138 | ||||||
| 3 | Spectris plc | 94 | ||||||
| 2 | Spirax-Sarco Engineering plc | 88 | ||||||
| 3 | Standard Chartered plc | 47 | ||||||
| 3 | SuperGroup plc ● | 34 | ||||||
| 1 | Victrex plc | 28 | ||||||
| 3 | WH Smith plc | 50 | ||||||
| 1 | Whitbread plc | 48 | ||||||
| 4 | WPP plc | 72 | ||||||
| 3,428 | ||||||||
| United States - 0.6% | ||||||||
| 2 | Home Inns & Hotels Management, Inc. ● | 73 | ||||||
| 3 | Markit Ltd. ● | 75 | ||||||
| — | Qihoo 360 Technology Co., Ltd. ● | 28 | ||||||
| 176 | ||||||||
| Total Common Stocks | ||||||||
| (Cost $27,190) | $ | 28,351 | ||||||
Preferred Stocks - 0.4% | ||||||||
| Germany - 0.4% | ||||||||
| 3 | ProSieben Sat.1 Media AG | $ | 118 | |||||
| Total Preferred Stocks | ||||||||
| (Cost $123) | $ | 118 | ||||||
Exchange Traded Funds - 0.4% |
||||||||
| United States - 0.4% | ||||||||
| 2 | iShares MSCI ACWI ex US ETF | $ | 102 | |||||
| — | iShares MSCI EAFE ETF | 8 | ||||||
| 110 | ||||||||
| Total Exchange Traded Funds | ||||||||
| (Cost $109) | $ | 110 | ||||||
| Total Long-Term Investments | ||||||||
| (Cost $27,422) | $ | 28,579 | ||||||
| Short-Term Investments - 4.0% | ||||||||
| Repurchase Agreements - 4.0% | ||||||||
| Bank of America Merrill Lynch TriParty Repurchase Agreement (maturing on 11/03/2014 in the amount of $3, collateralized by U.S. Treasury Note 1.50%, 2019, value of $3) | ||||||||
| $ | 3 | 0.08%, 10/31/2014 | $ | 3 | ||||
| Bank of America Merrill Lynch TriParty Repurchase Agreement (maturing on 11/03/2014 in the amount of $57, collateralized by GNMA 1.63% - 7.00%, 2031 - 2054, value of $59) | ||||||||
| 57 | 0.09%, 10/31/2014 | 57 | ||||||
| Bank of Montreal TriParty Repurchase Agreement (maturing on 11/03/2014 in the amount of $16, collateralized by U.S. Treasury Bond 2.88% - 5.25%, 2029 - 2043, U.S. Treasury Note 0.38% - 4.50%, 2015 - 2022, value of $16) | ||||||||
| 16 | 0.08%, 10/31/2014 | 16 | ||||||
| Bank of Montreal TriParty Repurchase Agreement (maturing on 11/03/2014 in the amount of $52, collateralized by FHLMC 2.00% - 5.50%, 2022 - 2034, FNMA 2.00% - 4.50%, 2024 - 2039, GNMA 3.00%, 2043, U.S. Treasury Note 4.63%, 2017, value of $53) | ||||||||
| 52 | 0.10%, 10/31/2014 | 52 | ||||||
| Barclays Capital TriParty Repurchase Agreement (maturing on 11/03/2014 in the amount of $197, collateralized by U.S. Treasury Bond 4.50% - 6.25%, 2023 - 2036, U.S. Treasury Note 1.63% - 2.13%, 2015 - 2019, value of $201) | ||||||||
| 197 | 0.08%, 10/31/2014 | 197 | ||||||
| Citigroup Global Markets, Inc. TriParty Repurchase Agreement (maturing on 11/03/2014 in the amount of $227, collateralized by U.S. Treasury Bill 0.02%, 2015, U.S. Treasury Bond 3.88% - 11.25%, 2015 - 2040, U.S. Treasury Note 2.00% - 3.38%, 2019 - 2021, value of $231) | ||||||||
| 227 | 0.09%, 10/31/2014 | 227 | ||||||
| Deutsche Bank Securities TriParty Repurchase Agreement (maturing on 11/03/2014 in the amount of $13, collateralized by U.S. Treasury Note 0.88%, 2017, value of $13) | ||||||||
| 13 | 0.13%, 10/31/2014 | 13 | ||||||
| RBS Securities, Inc. TriParty Repurchase Agreement (maturing on 11/03/2014 in the amount of $19, collateralized by U.S. Treasury Bond 3.63% - 5.00%, 2037 - 2043, U.S. Treasury Note 2.13%, 2020, value of $20) | ||||||||
| 19 | 0.07%, 10/31/2014 | 19 | ||||||
| Societe Generale TriParty Repurchase Agreement (maturing on 11/03/2014 in the amount of $203, collateralized by U.S. Treasury Bill 0.02%, 2015, U.S. Treasury Bond 3.75% - 11.25%, 2015 - 2043, U.S. Treasury Note 1.38% - 4.25%, 2015 - 2022, value of $207) | ||||||||
| 203 | 0.08%, 10/31/2014 | 203 | ||||||
The accompanying notes are an integral part of these financial statements.
| 9 |
| Hartford International Capital Appreciation Fund |
| Schedule of Investments – (continued) |
| October 31, 2014 |
| (000’s Omitted) |
| Shares or Principal Amount | Market Value ╪ | |||||||
| Short-Term Investments - 4.0% - (continued) | ||||||||
| Repurchase Agreements - 4.0% - (continued) | ||||||||
| TD Securities TriParty Repurchase Agreement (maturing on 11/03/2014 in the amount of $393, collateralized by FHLMC 3.00% - 4.00%, 2026 - 2044, FNMA 2.50% - 5.00%, 2025 - 2044, U.S. Treasury Bond 3.50% - 6.50%, 2026 - 2041, U.S. Treasury Note 1.75% - 2.88%, 2018 - 2019, value of $401) | ||||||||
| $ | 393 | 0.10%, 10/31/2014 | $ | 393 | ||||
| 1,180 | ||||||||
| Total Short-Term Investments | ||||||||
| (Cost $1,180) | $ | 1,180 | ||||||
| Total Investments | ||||||||
| (Cost $28,602) ▲ | 100.2 | % | $ | 29,759 | ||||||||
| Other Assets and Liabilities | (0.2 | )% | (60 | ) | ||||||||
| Total Net Assets | 100.0 | % | $ | 29,699 |
The accompanying notes are an integral part of these financial statements.
| 10 |
| Hartford International Capital Appreciation Fund |
| Schedule of Investments – (continued) |
| October 31, 2014 |
| (000’s Omitted) |
| Note: | Percentage of investments as shown is the ratio of the total market value to total net assets. |
Prices of foreign equities that are principally traded on certain foreign markets may be adjusted daily pursuant to a fair value pricing service approved by the Board of Directors in order to reflect an adjustment for factors occurring after the close of certain foreign markets but before the close of the New York Stock Exchange.
Other than the industry classifications "Other Investment Pools and Funds" and "Exchange Traded Funds," equity industry classifications used in this report are the Global Industry Classification Standard, which was developed by and is the exclusive property and service mark of MSCI, Inc. and Standard & Poor’s.
For Fund compliance purposes, the Fund may not use the same classification system shown in this report as these classifications are used for reporting ease.
| ▲ | At October 31, 2014, the cost of securities for federal income tax purposes was $28,829 and the aggregate gross unrealized appreciation and depreciation based on that cost were: |
| Unrealized Appreciation | $ | 2,568 | ||
| Unrealized Depreciation | (1,638 | ) | ||
| Net Unrealized Appreciation | $ | 930 |
| † | These securities were valued in good faith at fair value as determined under policies and procedures established by and under the supervision of the Board of Directors. At October 31, 2014, the aggregate fair value and percentage of net assets of these securities rounds to zero. This amount excludes securities that are principally traded in certain foreign markets and whose prices are adjusted pursuant to a third party pricing service methodology approved by the Board of Directors. |
| ● |
Non-income producing. |
| ☼ | This security, or a portion of this security, was purchased on a when-issued or delayed-delivery basis. The cost of these securities was $58 at October 31, 2014. |
| ‡ | This security, or a portion of this security, has been segregated to cover funding requirements on investment transactions settling in the future. |
| ⌂ | The following securities are considered illiquid. Illiquid securities are often purchased in private placement transactions, are often not registered under the Securities Act of 1933, as amended, and may have contractual restrictions on resale. A security may also be considered illiquid if the security lacks a readily available market or if its valuation has not changed for a certain period of time. |
| Period Acquired | Shares/ Par | Security | Cost Basis | |||||||
| 09/2013 - 06/2014 | 9 | Banco Espirito Santo S.A. | $ | 11 | ||||||
| 09/2011 - 10/2011 | 80 | China High Precision Automation Group Ltd. | 31 | |||||||
The aggregate value and percentage of net assets of these securities at October 31, 2014, rounds to zero.
| Foreign Currency Contracts Outstanding at October 31, 2014 | ||||||||||||||||||||||
| Unrealized Appreciation/(Depreciation) | ||||||||||||||||||||||
| Currency | Buy / Sell | Delivery Date | Counterparty | Contract Amount | Market Value ╪ | Asset | Liability | |||||||||||||||
| AUD | Buy | 11/06/2014 | DEUT | $ | 7 | $ | 7 | $ | – | $ | – | |||||||||||
| AUD | Buy | 11/03/2014 | SSG | 4 | 4 | – | – | |||||||||||||||
| AUD | Sell | 11/05/2014 | UBS | 47 | 47 | – | – | |||||||||||||||
| CHF | Sell | 11/03/2014 | BMO | 9 | 9 | – | – | |||||||||||||||
| CHF | Sell | 11/04/2014 | BNY | 4 | 4 | – | – | |||||||||||||||
| EUR | Buy | 11/03/2014 | RBC | 10 | 10 | – | – | |||||||||||||||
| EUR | Buy | 11/04/2014 | WEST | 5 | 5 | – | – | |||||||||||||||
| GBP | Buy | 11/03/2014 | BMO | 39 | 39 | – | – | |||||||||||||||
| GBP | Buy | 11/04/2014 | MSC | 10 | 10 | – | – | |||||||||||||||
| HKD | Buy | 11/04/2014 | BCLY | 59 | 59 | – | – | |||||||||||||||
| HKD | Buy | 11/03/2014 | UBS | 12 | 12 | – | – | |||||||||||||||
| HKD | Sell | 11/04/2014 | BCLY | 27 | 27 | – | – | |||||||||||||||
| JPY | Buy | 12/18/2014 | BCLY | 72 | 68 | – | (4 | ) | ||||||||||||||
| JPY | Buy | 11/06/2014 | DEUT | 3 | 3 | – | – | |||||||||||||||
| JPY | Buy | 11/04/2014 | SSG | 30 | 29 | – | (1 | ) | ||||||||||||||
| JPY | Buy | 11/05/2014 | UBS | – | – | – | – | |||||||||||||||
| JPY | Sell | 11/13/2014 | DEUT | 45 | 41 | 4 | – | |||||||||||||||
| JPY | Sell | 12/18/2014 | MSC | 72 | 68 | 4 | – | |||||||||||||||
The accompanying notes are an integral part of these financial statements.
| 11 |
| Hartford International Capital Appreciation Fund |
| Schedule of Investments – (continued) |
| October 31, 2014 |
| (000’s Omitted) |
| Foreign Currency Contracts Outstanding at October 31, 2014 - (continued) | ||||||||||||||||||||||
| Unrealized Appreciation/(Depreciation) | ||||||||||||||||||||||
| Currency | Buy / Sell | Delivery Date | Counterparty | Contract Amount | Market Value ╪ | Asset | Liability | |||||||||||||||
| JPY | Sell | 11/04/2014 | SSG | $ | 7 | $ | 7 | $ | – | $ | – | |||||||||||
| JPY | Sell | 12/18/2014 | UBS | 79 | 75 | 4 | – | |||||||||||||||
| MXN | Buy | 11/05/2014 | SSG | 7 | 7 | – | – | |||||||||||||||
| MYR | Buy | 11/03/2014 | JPM | 7 | 7 | – | – | |||||||||||||||
| MYR | Buy | 11/05/2014 | JPM | 2 | 2 | – | – | |||||||||||||||
| SEK | Sell | 11/03/2014 | UBS | 2 | 2 | – | – | |||||||||||||||
| SGD | Buy | 11/05/2014 | BCLY | 19 | 19 | – | – | |||||||||||||||
| Total | $ | 12 | $ | (5 | ) | |||||||||||||||||
| ╪ | See Significant Accounting Policies of accompanying Notes to Financial Statements regarding valuation of securities. |
| GLOSSARY: (abbreviations used in preceding Schedule of Investments) | ||
| Counterparty Abbreviations: | ||
| BCLY | Barclays | |
| BMO | Bank of Montreal | |
| BNY | BNY Mellon | |
| DEUT | Deutsche Bank Securities, Inc. | |
| JPM | JP Morgan Chase & Co. | |
| MSC | Morgan Stanley | |
| RBC | RBC Dominion Securities, Inc. | |
| SSG | State Street Global Markets LLC | |
| UBS | UBS AG | |
| WEST | Westpac International | |
| Currency Abbreviations: | ||
| AUD | Australian Dollar | |
| CHF | Swiss Franc | |
| EUR | EURO | |
| GBP | British Pound | |
| HKD | Hong Kong Dollar | |
| JPY | Japanese Yen | |
| MXN | Mexican New Peso | |
| MYR | Malaysian Ringgit | |
| SEK | Swedish Krona | |
| SGD | Singapore Dollar | |
| Index Abbreviations: | ||
| ACWI | All Country World | |
| EAFE | Europe, Australasia and Far East | |
| MSCI | Morgan Stanley Capital International | |
| Other Abbreviations: | ||
| ADR | American Depositary Receipt | |
| ETF | Exchange Traded Fund | |
| FHLMC | Federal Home Loan Mortgage Corp. | |
| FNMA | Federal National Mortgage Association | |
| GNMA | Government National Mortgage Association | |
| REIT | Real Estate Investment Trust | |
The accompanying notes are an integral part of these financial statements.
| 12 |
| Hartford International Capital Appreciation Fund |
| Schedule of Investments – (continued) |
| October 31, 2014 |
| (000’s Omitted) |
| Investment Valuation Hierarchy Level Summary |
| October 31, 2014 |
| Total | Level 1 ♦ | Level 2 ♦ | Level 3 | |||||||||||||
| Assets: | ||||||||||||||||
| Common Stocks | ||||||||||||||||
| Argentina | $ | 135 | $ | 135 | $ | – | $ | – | ||||||||
| Australia | 1,029 | 117 | 912 | – | ||||||||||||
| Austria | 10 | 10 | – | – | ||||||||||||
| Belgium | 529 | 12 | 517 | – | ||||||||||||
| Brazil | 396 | 396 | – | – | ||||||||||||
| Canada | 760 | 760 | – | – | ||||||||||||
| Cayman Islands | 55 | 55 | – | – | ||||||||||||
| China | 2,362 | 1,511 | 851 | – | ||||||||||||
| Colombia | 40 | 40 | – | – | ||||||||||||
| Denmark | 425 | – | 425 | – | ||||||||||||
| Finland | 288 | – | 288 | – | ||||||||||||
| France | 2,837 | 7 | 2,830 | – | ||||||||||||
| Germany | 1,011 | – | 1,011 | – | ||||||||||||
| Greece | 85 | – | 85 | – | ||||||||||||
| Hong Kong | 1,229 | 88 | 1,141 | – | ||||||||||||
| Hungary | 33 | – | 33 | – | ||||||||||||
| India | 166 | 104 | 62 | – | ||||||||||||
| Ireland | 192 | 9 | 183 | – | ||||||||||||
| Israel | 228 | 228 | – | – | ||||||||||||
| Italy | 505 | – | 505 | – | ||||||||||||
| Japan | 5,646 | 23 | 5,623 | – | ||||||||||||
| Jersey | 123 | – | 123 | – | ||||||||||||
| Luxembourg | 17 | – | 17 | – | ||||||||||||
| Malaysia | 299 | – | 299 | – | ||||||||||||
| Mexico | 357 | 357 | – | – | ||||||||||||
| Netherlands | 822 | 74 | 748 | – | ||||||||||||
| Norway | 26 | – | 26 | – | ||||||||||||
| Panama | 188 | 188 | – | – | ||||||||||||
| Portugal | 67 | – | 67 | – | ||||||||||||
| Russia | 29 | 29 | – | – | ||||||||||||
| Singapore | 156 | 52 | 104 | – | ||||||||||||
| South Africa | 64 | 16 | 48 | – | ||||||||||||
| South Korea | 949 | – | 949 | – | ||||||||||||
| Spain | 72 | – | 72 | – | ||||||||||||
| Sweden | 1,107 | – | 1,107 | – | ||||||||||||
| Switzerland | 1,741 | 40 | 1,701 | – | ||||||||||||
| Taiwan | 644 | – | 644 | – | ||||||||||||
| Thailand | 125 | – | 125 | – | ||||||||||||
| United Kingdom | 3,428 | 78 | 3,350 | – | ||||||||||||
| United States | 176 | 176 | – | – | ||||||||||||
| Total | $ | 28,351 | $ | 4,505 | $ | 23,846 | $ | – | ||||||||
| Exchange Traded Funds | 110 | 110 | – | – | ||||||||||||
| Preferred Stocks | 118 | – | 118 | – | ||||||||||||
| Short-Term Investments | 1,180 | – | 1,180 | – | ||||||||||||
| Total | $ | 29,759 | $ | 4,615 | $ | 25,144 | $ | – | ||||||||
| Foreign Currency Contracts* | $ | 12 | $ | – | $ | 12 | $ | – | ||||||||
| Total | $ | 12 | $ | – | $ | 12 | $ | – | ||||||||
| Liabilities: | ||||||||||||||||
| Foreign Currency Contracts* | $ | 5 | $ | – | $ | 5 | $ | – | ||||||||
| Total | $ | 5 | $ | – | $ | 5 | $ | – | ||||||||
The accompanying notes are an integral part of these financial statements.
| 13 |
| Hartford International Capital Appreciation Fund |
| Schedule of Investments – (continued) |
| October 31, 2014 |
| (000’s Omitted) |
| Investment Valuation Hierarchy Level Summary - (continued) |
| October 31, 2014 |
| ♦ | For the year ended October 31, 2014, investments valued at $475 were transferred from Level 1 to Level 2, and investments valued at $508 were transferred from Level 2 to Level 1. Investments are transferred between Level 1 and Level 2 for a variety of reasons including, but not limited to: |
| 1) | Foreign equities for which a fair value price is more representative of exit value than the local market close (transfer into Level 2). Foreign equities for which the local market close is more representative of exit value (transfer into Level 1). |
| 2) | U.S. Treasury securities that no longer represent the most recent issue (transfer into Level 2). |
| 3) | Equity investments with no observable trading but a bid or mean price is used (transfer into Level 2). Equity investments using observable quoted prices in an active market (transfer into Level 1). |
| * | Derivative instruments (excluding purchased and written options, if applicable) are valued at the unrealized appreciation/depreciation on the investments. |
| Following is a reconciliation of Level 3 assets for which significant unobservable inputs were used to determine fair value: |
| Balance
as of October 31, 2013 | Realized
Gain (Loss) | Change
in Unrealized Appreciation (Depreciation) | Net
Amortization | Purchases | Sales | Transfers Into Level 3 * | Transfers
Out of Level 3 * | Balance
as of October 31, 2014 | ||||||||||||||||||||||||||||
| Assets: | ||||||||||||||||||||||||||||||||||||
| Common Stocks | $ | 10 | $ | 6 | $ | (23 | )† | $ | — | $ | 10 | $ | (16 | ) | $ | 13 | $ | — | $ | — | ||||||||||||||||
| Total | $ | 10 | $ | 6 | $ | (23 | ) | $ | — | $ | 10 | $ | (16 | ) | $ | 13 | $ | — | $ | — | ||||||||||||||||
| * | Investments are transferred into and out of Level 3 for a variety of reasons including, but not limited to: |
| 1) | Investments where trading has been halted (transfer into Level 3) or investments where trading has resumed (transfer out of Level 3). |
| 2) | Broker quoted investments (transfer into Level 3) or quoted prices in active markets (transfer out of Level 3). |
| 3) | Investments that have certain restrictions on trading (transfer into Level 3) or investments where trading restrictions have expired (transfer out of Level 3). |
| † | Change in unrealized appreciation (depreciation) in the current period relating to assets still held at October 31, 2014 was $(23). |
| Note: | For purposes of reporting transfers between different hierarchy levels, both transfers in and out of each level, as applicable, are shown as if they occurred at the beginning of the period. |
The accompanying notes are an integral part of these financial statements.
| 14 |
| Hartford International Capital Appreciation Fund |
| Statement of Assets and Liabilities |
| October 31, 2014 |
| (000’s Omitted) |
| Assets: | ||||
| Investments in securities, at market value (cost $28,602) | $ | 29,759 | ||
| Cash | — | |||
| Foreign currency on deposit with custodian (cost $3) | 3 | |||
| Unrealized appreciation on foreign currency contracts | 12 | |||
| Receivables: | ||||
| Investment securities sold | 129 | |||
| Fund shares sold | 5 | |||
| Dividends and interest | 67 | |||
| Other assets | 52 | |||
| Total assets | 30,027 | |||
| Liabilities: | ||||
| Unrealized depreciation on foreign currency contracts | 5 | |||
| Payables: | ||||
| Investment securities purchased | 262 | |||
| Fund shares redeemed | 36 | |||
| Investment management fees | 5 | |||
| Administrative fees | — | |||
| Distribution fees | 1 | |||
| Accrued expenses | 19 | |||
| Total liabilities | 328 | |||
| Net assets | $ | 29,699 | ||
| Summary of Net Assets: | ||||
| Capital stock and paid-in-capital | $ | 27,688 | ||
| Undistributed net investment income | 228 | |||
| Accumulated net realized gain | 621 | |||
| Unrealized appreciation of investments and the translation of assets and liabilities denominated in foreign currency | 1,162 | |||
| Net assets | $ | 29,699 | ||
| Shares authorized | 525,000 | |||
| Par value | $ | 0.001 | ||
| Class A: Net asset value per share/Maximum offering price per share | $9.92/$10.50 | |||
| Shares outstanding | 1,090 | |||
| Net assets | $ | 10,810 | ||
| Class B: Net asset value per share | $ | 9.84 | ||
| Shares outstanding | 92 | |||
| Net assets | $ | 908 | ||
| Class C: Net asset value per share | $ | 9.80 | ||
| Shares outstanding | 195 | |||
| Net assets | $ | 1,910 | ||
| Class I: Net asset value per share | $ | 9.98 | ||
| Shares outstanding | 184 | |||
| Net assets | $ | 1,835 | ||
| Class R3: Net asset value per share | $ | 9.91 | ||
| Shares outstanding | 127 | |||
| Net assets | $ | 1,258 | ||
| Class R4: Net asset value per share | $ | 9.95 | ||
| Shares outstanding | 116 | |||
| Net assets | $ | 1,151 | ||
| Class R5: Net asset value per share | $ | 9.98 | ||
| Shares outstanding | 107 | |||
| Net assets | $ | 1,071 | ||
| Class Y: Net asset value per share | $ | 9.98 | ||
| Shares outstanding | 1,078 | |||
| Net assets | $ | 10,756 |
The accompanying notes are an integral part of these financial statements.
| 15 |
| Hartford International Capital Appreciation Fund |
| Statement of Operations |
| For the Year Ended October 31, 2014 |
| (000’s Omitted) |
| Investment Income: | ||||
| Dividends | $ | 699 | ||
| Interest | 1 | |||
| Less: Foreign tax withheld | (76 | ) | ||
| Total investment income | 624 | |||
| Expenses: | ||||
| Investment management fees | 275 | |||
| Administrative services fees | ||||
| Class R3 | 3 | |||
| Class R4 | 2 | |||
| Class R5 | 1 | |||
| Transfer agent fees | ||||
| Class A | 21 | |||
| Class B | 2 | |||
| Class C | 4 | |||
| Class I | 1 | |||
| Class R3 | — | |||
| Class R4 | — | |||
| Class Y | — | |||
| Distribution fees | ||||
| Class A | 28 | |||
| Class B | 11 | |||
| Class C | 21 | |||
| Class R3 | 6 | |||
| Class R4 | 3 | |||
| Custodian fees | 12 | |||
| Accounting services fees | 6 | |||
| Registration and filing fees | 89 | |||
| Board of Directors' fees | 1 | |||
| Audit fees | 29 | |||
| Other expenses | 15 | |||
| Total expenses (before waivers and fees paid indirectly) | 530 | |||
| Expense waivers | (124 | ) | ||
| Commission recapture | (1 | ) | ||
| Total waivers and fees paid indirectly | (125 | ) | ||
| Total expenses, net | 405 | |||
| Net Investment Income | 219 | |||
| Net Realized Gain on Investments and Foreign Currency Transactions: | ||||
| Net realized gain on investments | 2,787 | |||
| Net realized gain on foreign currency contracts | 7 | |||
| Net realized gain on other foreign currency transactions | 2 | |||
| Net Realized Gain on Investments and Foreign Currency Transactions | 2,796 | |||
| Net Changes in Unrealized Depreciation of Investments and Foreign Currency Transactions: | ||||
| Net unrealized depreciation of investments | (2,939 | ) | ||
| Net unrealized appreciation of foreign currency contracts | 8 | |||
| Net unrealized depreciation of translation of other assets and liabilities in foreign currencies | (3 | ) | ||
| Net Changes in Unrealized Depreciation of Investments and Foreign Currency Transactions | (2,934 | ) | ||
| Net Loss on Investments and Foreign Currency Transactions | (138 | ) | ||
| Net Increase in Net Assets Resulting from Operations | $ | 81 |
The accompanying notes are an integral part of these financial statements.
| 16 |
| Hartford International Capital Appreciation Fund |
| Statement of Changes in Net Assets |
| (000’s Omitted) |
| For the Year Ended October 31, 2014 | For the Year Ended October 31, 2013 | |||||||
| Operations: | ||||||||
| Net investment income | $ | 219 | $ | 337 | ||||
| Net realized gain on investments and foreign currency transactions | 2,796 | 1,943 | ||||||
| Net unrealized appreciation (depreciation) of investments and foreign currency transactions | (2,934 | ) | 3,075 | |||||
| Net Increase in Net Assets Resulting from Operations | 81 | 5,355 | ||||||
| Distributions to Shareholders: | ||||||||
| From net investment income | ||||||||
| Class A | (104 | ) | (158 | ) | ||||
| Class B | (1 | ) | (13 | ) | ||||
| Class C | (4 | ) | (22 | ) | ||||
| Class I | (17 | ) | (26 | ) | ||||
| Class R3 | (7 | ) | (17 | ) | ||||
| Class R4 | (9 | ) | (18 | ) | ||||
| Class R5 | (12 | ) | (20 | ) | ||||
| Class Y | (121 | ) | (202 | ) | ||||
| Total distributions | (275 | ) | (476 | ) | ||||
| Capital Share Transactions: | ||||||||
| Class A | (1,415 | ) | 2,156 | |||||
| Class B | (486 | ) | 69 | |||||
| Class C | (559 | ) | 395 | |||||
| Class I | 395 | 116 | ||||||
| Class R3 | 32 | 68 | ||||||
| Class R4 | 28 | 17 | ||||||
| Class R5 | 12 | 20 | ||||||
| Class Y | 121 | 202 | ||||||
| Net increase (decrease) from capital share transactions | (1,872 | ) | 3,043 | |||||
| Net Increase (Decrease) in Net Assets | (2,066 | ) | 7,922 | |||||
| Net Assets: | ||||||||
| Beginning of period | 31,765 | 23,843 | ||||||
| End of period | $ | 29,699 | $ | 31,765 | ||||
| Undistributed (distributions in excess of) net investment income | $ | 228 | $ | 185 | ||||
The accompanying notes are an integral part of these financial statements.
| 17 |
| Hartford International Capital Appreciation Fund |
| Notes to Financial Statements |
| October 31, 2014 |
| (000’s Omitted) |
Organization:
The Hartford Mutual Funds, Inc. (“Company”) is an open-end management investment company comprised of forty-two portfolios. Financial statements for Hartford International Capital Appreciation Fund (the "Fund"), a series of the Company, are included in this report. Prior to March 1, 2014, the Fund was known as The Hartford Diversified International Fund.
The Company is organized under the laws of the State of Maryland and is registered with the Securities and Exchange Commission (“SEC”) under the Investment Company Act of 1940, as amended (“1940 Act”). The Fund is a diversified open-end management investment company. The Fund is an investment company and applies specialized accounting and reporting under Accounting Standards Codification Topic 946, Financial Services - Investment Companies.
Class A shares are sold with a front-end sales charge of up to 5.50%. Class B shares were sold with a contingent deferred sales charge which is assessed on the lesser of the per share net asset value (“NAV”) of the shares at the time of redemption or the original purchase price, and declines from up to 5.00% to zero depending on the period of time the shares are held (see note below regarding the closing of Class B shares). Class C shares are sold with a contingent deferred sales charge of up to 1.00% on shares redeemed within twelve months of purchase. Class I shares are sold without sales charges to certain eligible investors primarily through advisory fee-based wrap programs. Class R3, R4 and R5 shares, which are offered to employer-sponsored retirement plans, and Class Y shares, which are sold to certain eligible institutional investors, are sold without a sales charge. All classes of shares have identical voting, redemption, dividend, liquidation and other rights and the same terms and conditions, with the exceptions that each class may have different expenses, which may affect performance, and that Class B shares automatically convert to Class A shares after 8 years.
No new or additional investments are allowed in Class B shares of the Fund (including investments through any systematic investment plan). Existing shareholders of Class B shares may continue to hold their Class B shares, exchange their Class B shares for Class B shares of another Hartford Fund (as permitted by existing exchange privileges), or redeem their Class B shares as described in the Fund’s prospectus. Reinstatement privileges with respect to Class B shares are set forth in the Fund's prospectus. For investors electing to reinvest capital gains and dividends, any such capital gains or dividends on Class B shares will continue to be reinvested in Class B shares of the Fund. All Class B share attributes, including the 12b-1 fee, contingent deferred sales charge schedule, and conversion to Class A shares, remain unchanged.
Significant Accounting Policies:
The following is a summary of significant accounting policies of the Fund in the preparation of its financial statements, which are in accordance with United States generally accepted accounting principles (“U.S. GAAP”). The preparation of financial statements in accordance with U.S. GAAP may require management to make estimates and assumptions that affect the reported amounts of assets and liabilities and disclosure of contingent assets and liabilities at the date of the financial statements and the reported amounts of increases and decreases in net assets from operations during the reporting period. Actual results could differ from those estimates.
Determination of Net Asset Value – The NAV of each class of the Fund's shares is determined as of the close of regular trading (normally 4:00 p.m. Eastern Time) (the “NYSE Close”) on each day that the New York Stock Exchange (the “Exchange”) is open (“Valuation Date”). Information that becomes known to the Fund after the NAV has been calculated on a particular day will not generally be used to retroactively adjust the NAV determined earlier that day.
Investment Valuation and Fair Value Measurements – For purposes of calculating the NAV, portfolio investments and other assets held by the Fund's portfolio for which market quotes are readily available are valued at market value. Market value is generally determined on the basis of last reported sales prices or official close price. If no sales are reported, market value is based on quotes obtained from a quotation reporting system, established market makers, or independent pricing services. If market prices are not readily available or are deemed unreliable, the Fund will use the fair value of the investment as determined in good faith under policies and procedures established by and under the supervision of the Company's Board of Directors. Market quotes are considered not readily available where there is an absence of current or reliable market-based data (e.g., trade information or indicative market quotes), including where events occur after the close of the relevant market, but prior to the NYSE Close, that materially affect the values of the Fund's portfolio investments or assets. In addition, market quotes are considered not readily available when, due to extraordinary circumstances, the exchanges or markets on which the investments trade do not open for trading for the entire day and
| 18 |
| Hartford International Capital Appreciation Fund |
| Notes to Financial Statements – (continued) |
| October 31, 2014 |
| (000’s Omitted) |
no other market prices are available. In addition, prices of foreign equities that are principally traded on certain foreign markets may be adjusted daily pursuant to a fair value pricing service approved by the Board of Directors in order to reflect an adjustment for the factors occurring after the close of certain foreign markets but before the NYSE Close. Investments that are primarily traded on foreign markets may trade on days that are not business days of the Fund. The value of the foreign investments in which the Fund invests may change on days when a shareholder will not be able to purchase or redeem shares of the Fund. Fair value pricing is subjective in nature and the use of fair value pricing by the Fund may cause the NAV of its shares to differ significantly from the NAV that would have been calculated using market prices at the close of the exchange on which a portfolio investment is primarily traded. There can be no assurance that the Fund could obtain the fair market value assigned to an investment if the Fund were to sell the investment at approximately the time at which the Fund determines its NAV.
Investments valued in currencies other than U.S. dollars are converted to U.S. dollars using exchange rates obtained from independent pricing services for calculation of the NAV. As a result, the NAV of the Fund’s shares may be affected by changes in the value of currencies in relation to the U.S. dollar. The value of investments traded in markets outside the United States or denominated in currencies other than the U.S. dollar may be affected significantly on a day that the NYSE is closed and the market value may change on days when an investor is not able to purchase, redeem or exchange shares of the Fund.
Foreign currency contracts represent agreements to exchange currencies on specific future dates at predetermined rates. Foreign currency contracts are valued using foreign currency exchange rates and forward rates as provided by an independent pricing service on the Valuation Date.
Financial instruments for which prices are not available from an independent pricing service may be valued using market quotations obtained from one or more dealers that make markets in the respective financial instrument in accordance with procedures established by the Company's Board of Directors.
U.S. GAAP defines fair value as the price that the Fund would receive to sell an asset or pay to transfer a liability in an orderly transaction between market participants. The U.S. GAAP fair value measurement standards require disclosure of a fair value hierarchy for each major category of assets and liabilities. Various inputs are used in determining the fair value of the Fund’s investments. These inputs are summarized into three broad hierarchy levels. This hierarchy is based on whether the valuation inputs are observable or unobservable. These levels are:
Level 1 – Quoted prices in active markets for identical investments. Level 1 may include exchange traded instruments, such as domestic equities, some foreign equities, options, futures, mutual funds, exchange traded funds, rights and warrants.
Level 2 – Observable inputs other than Level 1 prices, such as quoted prices for similar investments; quoted prices in markets that are not active; or other inputs that are observable or can be corroborated by observable market data. Level 2 may include debt investments that are traded less frequently than exchange traded instruments and which are valued using independent pricing services; foreign equities, which are principally traded on certain foreign markets and are adjusted daily pursuant to a fair value pricing service in order to reflect an adjustment for the factors occurring after the close of certain foreign markets but before the NYSE Close; senior floating rate interests, which are valued using an aggregate of dealer bids; short-term investments, which are valued at amortized cost; and swaps, which are valued based upon the terms of each swap contract.
Level 3 – Significant unobservable inputs that are supported by limited or no market activity. Level 3 may include financial instruments whose values are determined using indicative market quotes or require significant management judgment or estimation. These unobservable valuation inputs may include estimates for current yields, maturity/duration, prepayment speed, and indicative market quotes for comparable investments along with other assumptions relating to credit quality, collateral value, complexity of the investment structure, general market conditions and liquidity. This category may include investments where trading has been halted or there are certain restrictions on trading. While these investments are priced using unobservable inputs, the valuation of these investments reflects the best available data and management believes the prices are a reasonable representation of exit price.
The Board of Directors of the Company generally reviews and approves the “Procedures for Valuation of Portfolio Securities” at least once a year. These procedures define how investments are to be valued, including the formation and activities of a
| 19 |
| Hartford International Capital Appreciation Fund |
| Notes to Financial Statements – (continued) |
| October 31, 2014 |
| (000’s Omitted) |
Valuation Committee. The Valuation Committee is responsible for determining in good faith the fair value of investments when the value cannot be obtained from primary pricing services or alternative sources or if the valuation of an investment as provided by the primary pricing service or alternative source is believed not to reflect the investment’s fair value as of the Valuation Date. Voting members of the Valuation Committee include the Fund's Treasurer or designee and a Vice President of the investment manager or designee. An Assistant Vice President of the Fund with legal expertise or designee is also included on the Valuation Committee as a non-voting advisory member. In addition, the Fund’s Chief Compliance Officer shall designate a member of the compliance group to attend Valuation Committee meetings as a non-voting resource, to monitor for and provide guidance with respect to compliance with these procedures. Two members of the Valuation Committee or their designees, representing different departments, shall constitute a quorum for purposes of permitting the Valuation Committee to take action. The Valuation Committee will consider all relevant factors in determining an investment’s fair value, and may seek the advice of the Fund’s sub-adviser, knowledgeable brokers, and legal counsel in making such determination. The Valuation Committee reports to the Audit Committee of the Company's Board of Directors. The Audit Committee receives quarterly written reports which include details of all fair-valued investments, including the reason for the fair valuation, and an indication, when possible, of the accuracy of the valuation by disclosing the next available reliable public price quotation or the disposition price of such investments (the “look-back” test). The Board of Directors then must consider for ratification all of the fair value determinations made during the previous quarter.
Valuation levels are not necessarily indicative of the risk associated with investing in such investments. Individual investments within any of the above mentioned asset classes may be assigned a different hierarchical level than those presented above, as individual circumstances dictate.
For additional information, refer to the Investment Valuation Hierarchy Level Summary and the Level 3 roll-forward reconciliation, if applicable, which follow the Schedule of Investments.
Investment Transactions and Investment Income – Investment transactions are recorded as of the trade date (the date the order to buy or sell is executed) for financial reporting purposes. Investments purchased or sold on a when-issued or delayed-delivery basis may be settled a month or more after the trade date. Realized gains and losses are determined on the basis of identified cost.
Dividend income from domestic securities is accrued on the ex-dividend date. In general, dividend income from foreign securities is recorded on the ex-date; however, dividend notifications in certain foreign jurisdictions may not be available in a timely manner and as a result, the Fund will record the dividend as soon as the relevant details (i.e., rate per share, payment date, shareholders of record, etc.) are publicly available. Interest income, including amortization of premium, accretion of discounts and additional principal received in-kind in lieu of cash, is accrued on a daily basis.
Foreign Currency Transactions – Assets and liabilities denominated in currencies other than U.S. dollars are translated into U.S. dollars at the exchange rates in effect on the valuation date. Purchases and sales of investments, income and expenses are translated into U.S. dollars at the exchange rates on the dates of such transactions.
The Fund does not isolate that portion of portfolio investment valuation resulting from fluctuations in the foreign currency exchange rates from the fluctuations arising from changes in the market prices of investments held. Exchange rate fluctuations are included with the net realized and unrealized gain or loss on investments in the accompanying financial statements.
Net realized foreign exchange gains or losses arise from sales of foreign currencies and the difference between asset and liability amounts initially stated in foreign currencies and the U.S. dollar value of the amounts actually received or paid. Net unrealized foreign exchange gains or losses arise from changes in the value of other assets and liabilities at the end of the reporting period, resulting from changes in the exchange rates.
Joint Trading Account – The Fund may invest cash balances into a joint trading account that may be invested in one or more repurchase agreements.
Fund Share Valuation and Dividend Distributions to Shareholders – Orders for the Fund’s shares are executed in accordance with the investment instructions of the shareholders. The NAV of the Fund’s shares is determined as of the close of business on each
| 20 |
| Hartford International Capital Appreciation Fund |
| Notes to Financial Statements – (continued) |
| October 31, 2014 |
| (000’s Omitted) |
business day of the Exchange. The NAV is determined separately for each class of shares of the Fund by dividing the Fund’s net assets attributable to that class by the number of shares of the class outstanding. Each class of shares offered by the Fund has equal rights as to assets and voting privileges (except that shareholders of a class have exclusive voting rights regarding any matter relating solely to that class of shares). Income and non-class specific expenses are allocated daily to each class on the basis of the relative net assets of the class. Realized and unrealized gains and losses are allocated daily based on the relative net assets of each class of shares of the Fund.
Orders for the purchase of the Fund’s shares received prior to the close of the Exchange on any day the Exchange is open for business are priced at the NAV determined as of the close of the Exchange. Orders received after the close of the Exchange, or on a day on which the Exchange and/or the Fund is not open for business, are priced at the next determined NAV.
Dividends are declared pursuant to a policy adopted by the Company's Board of Directors based upon the investment performance of the Fund. The policy of the Fund is to pay dividends from net investment income and realized gains, if any, at least once a year.
Net investment income, dividends and distributions from net realized gains and capital are determined in accordance with federal income tax regulations, which may differ from U.S. GAAP with respect to character and timing (see Federal Income Taxes: Distributions and Components of Distributable Earnings and Reclassification of Capital Accounts).
Securities and Other Investments:
Repurchase Agreements – A repurchase agreement is an agreement by which a counterparty agrees to sell an investment and agrees to repurchase the investment sold from the buyer at a mutually agreed upon time and price. During the period of the repurchase agreement, the counterparty will deposit cash and or securities in a third party custodial account to serve as collateral. At the time the Fund enters into a repurchase agreement, the value of the underlying collateral, including accrued interest, will be equal to or exceed the value of the repurchase agreement. Repurchase agreements expose the Fund to counterparty risk - that is, the risk that the counterparty will not fulfill its obligations. To minimize counterparty risk, the investments that serve to collateralize the repurchase agreement are held by the Fund’s custodian in book entry or physical form in the custodial account of the Fund or in a third party custodial account. Repurchase agreements are valued at cost plus accrued interest, which approximates fair value. Repurchase agreements have master netting arrangements which allow the Fund to offset amounts owed to a counterparty with amounts owed by the counterparty, including any collateral. Upon an event of default under a master repurchase agreement, the non-defaulting party may close out all transactions traded under such agreement and net amounts owed under each transaction to one net amount payable by one party to the other. Absent an event of default, the master repurchase agreement does not result in an offset of reported amounts of assets and liabilities in the Statement of Assets and Liabilities across transactions between the Fund and the applicable counterparty. The Fund, as shown on the Schedule of Investments, had outstanding repurchase agreements and related collateral as of October 31, 2014.
Illiquid and Restricted Investments – The Fund is permitted to invest up to 15% of its net assets in illiquid investments. Illiquid investments are those that may not be sold or disposed of in the ordinary course of business within seven days, at approximately the price used to determine the Fund’s NAV. The Fund may not be able to sell illiquid investments when its sub-adviser considers it desirable to do so or may have to sell such investments at a price that is lower than the price that could be obtained if the investments were more liquid. A sale of illiquid investments may require more time and may result in higher dealer discounts and other selling expenses than does the sale of those that are liquid. Illiquid investments also may be more difficult to value due to the unavailability of reliable market quotations for such investments, and an investment in them may have an adverse impact on the Fund’s NAV. The Fund may also purchase certain restricted investments that can only be resold to certain qualified investors and may be determined to be liquid pursuant to policies and guidelines established by the Company's Board of Directors. The Fund, as shown on the Schedule of Investments, had illiquid or restricted investments as of October 31, 2014.
Investments Purchased on a When-Issued or Delayed-Delivery Basis – Delivery and payment for investments that have been purchased by the Fund on a forward commitment, or when-issued or delayed-delivery basis, take place beyond the customary settlement period. The Fund may dispose of or renegotiate a delayed-delivery transaction after it is entered into, and may sell delayed-delivery investments before they are delivered, which may result in a realized gain or loss. During this period, such investments are subject to market fluctuations, and the Fund identifies investments segregated in its records with a value at least
| 21 |
| Hartford International Capital Appreciation Fund |
| Notes to Financial Statements – (continued) |
| October 31, 2014 |
| (000’s Omitted) |
equal to the amount of the commitment. The Fund, as shown on the Schedule of Investments, had when-issued or delayed-delivery investments as of October 31, 2014.
Financial Derivative Instruments:
The following disclosures contain information on how and why the Fund uses derivative instruments, the credit-risk-related contingent features in certain derivative instruments and how derivative instruments affect the Fund’s financial position and results of operations. The location and fair value amounts of these instruments on the Statement of Assets and Liabilities and the realized gains and losses and changes in unrealized gains and losses on the Statement of Operations, each categorized by type of derivative contract, are included in the following Additional Derivative Instrument Information footnote. The derivative instruments outstanding as of year-end are disclosed in the notes to the Schedule of Investments, if applicable. The amounts of realized gains and losses and changes in unrealized gains and losses on derivative instruments during the year are disclosed in the Statement of Operations.
Foreign Currency Contracts – The Fund may enter into foreign currency contracts that obligate the Fund to purchase or sell currencies at specified future dates. Foreign currency contracts are used to hedge the currency exposure associated with some or all of the Fund’s investments and/or as part of an investment strategy. Foreign currency contracts are marked to market daily and the change in value is recorded by the Fund as an unrealized gain or loss. The Fund will record a realized gain or loss when the foreign currency contract is settled.
Foreign currency contracts involve elements of market risk in excess of the amounts reflected in the Statement of Assets and Liabilities. In addition, risks may arise upon entering into these contracts from the potential inability of the counterparties to meet the terms of the contracts and from unanticipated movements in the value of the foreign currencies relative to the U.S. dollar. The Fund, as shown on the Schedule of Investments, had outstanding foreign currency contracts as of October 31, 2014.
Additional Derivative Instrument Information:
Fair Value of Derivative Instruments on the Statement of Assets and Liabilities as of October 31, 2014:
| Risk Exposure Category | ||||||||||||||||||||||||||||
| Interest
Rate Contracts | Foreign Exchange Contracts | Credit
Contracts | Equity
Contracts | Commodity
Contracts | Other
Contracts | Total | ||||||||||||||||||||||
| Assets: | ||||||||||||||||||||||||||||
| Unrealized appreciation on foreign currency contracts | $ | — | $ | 12 | $ | — | $ | — | $ | — | $ | — | $ | 12 | ||||||||||||||
| Total | $ | — | $ | 12 | $ | — | $ | — | $ | — | $ | — | $ | 12 | ||||||||||||||
| Liabilities: | ||||||||||||||||||||||||||||
| Unrealized depreciation on foreign currency contracts | $ | — | $ | 5 | $ | — | $ | — | $ | — | $ | — | $ | 5 | ||||||||||||||
| Total | $ | — | $ | 5 | $ | — | $ | — | $ | — | $ | — | $ | 5 | ||||||||||||||
| The volume of derivatives that is presented in the Schedule of Investments is consistent with the derivative activity during the year ended October 31, 2014. |
| 22 |
| Hartford International Capital Appreciation Fund |
| Notes to Financial Statements – (continued) |
| October 31, 2014 |
| (000’s Omitted) |
The Effect of Derivative Instruments on the Statement of Operations for the year ended October 31, 2014:
| Risk Exposure Category | ||||||||||||||||||||||||||||
| Interest
Rate Contracts | Foreign
Exchange Contracts | Credit
Contracts | Equity
Contracts | Commodity
Contracts | Other
Contracts | Total | ||||||||||||||||||||||
| Realized Gain on Derivatives Recognized as a Result of Operations: | ||||||||||||||||||||||||||||
| Net realized gain on foreign currency contracts | $ | — | $ | 7 | $ | — | $ | — | $ | — | $ | — | $ | 7 | ||||||||||||||
| Total | $ | — | $ | 7 | $ | — | $ | — | $ | — | $ | — | $ | 7 | ||||||||||||||
| Net Change in Unrealized Appreciation (Depreciation) on Derivatives Recognized as a Result of Operations: | ||||||||||||||||||||||||||||
| Net change in unrealized appreciation of foreign currency contracts | $ | — | $ | 8 | $ | — | $ | — | $ | — | $ | — | $ | 8 | ||||||||||||||
| Total | $ | — | $ | 8 | $ | — | $ | — | $ | — | $ | — | $ | 8 | ||||||||||||||
Balance Sheet Offsetting Information - The following discloses both gross information and net information about instruments and transactions eligible for offset in the financial statements, and instruments and transactions that are subject to a master netting arrangement, as well as amounts related to margin, reflected as financial collateral (including cash collateral), held at clearing brokers, counterparties and the Fund’s custodian. The master netting arrangements allow the clearing brokers to net any collateral held in or on behalf of the Fund, or liabilities or payment obligations of the clearing brokers to the Fund, against any liabilities or payment obligations of the Fund to the clearing brokers. The Fund is required to deposit financial collateral (including cash collateral) at the Futures Commission Merchant's ("FCM") custodian on behalf of clearing brokers and counterparties to continually meet the original and maintenance requirements established by the clearing brokers and counterparties. Such requirements are specific to the respective clearing broker or counterparty. Certain master netting arrangements may not be enforceable in the bankruptcy proceedings of a counterparty.
Offsetting of Financial Assets and Derivative Assets as of October 31, 2014:
| Gross
Amounts* of Assets Presented in Statement of Assets and Liabilities | Financial
Instruments with Allowable Netting | Non-cash
Collateral Received | Cash
Collateral Received | Net
Amount (not less than $0) | ||||||||||||||||
| Description | ||||||||||||||||||||
| Unrealized appreciation on foreign currency contracts | $ | 12 | $ | — | $ | — | $ | — | $ | 12 | ||||||||||
| Total subject to a master netting or similar arrangement | $ | 12 | $ | — | $ | — | $ | — | $ | 12 | ||||||||||
| * | Gross amounts are presented here as there are no amounts that are netted within the Statement of Assets and Liabilities. |
Offsetting of Financial Liabilities and Derivative Liabilities as of October 31, 2014:
| Gross
Amounts* of Liabilities Presented in Statement of Assets and Liabilities | Financial
Instruments with Allowable Netting | Non-cash
Collateral Pledged | Cash
Collateral Pledged | Net
Amount (not less than $0) | ||||||||||||||||
| Description | ||||||||||||||||||||
| Unrealized depreciation on foreign currency contracts | $ | 4 | $ | — | $ | — | $ | — | $ | 4 | ||||||||||
| Total subject to a master netting or similar arrangement | $ | 4 | $ | — | $ | — | $ | — | $ | 4 | ||||||||||
| * | Gross amounts are presented here as there are no amounts that are netted within the Statement of Assets and Liabilities. |
Certain derivatives held by the Fund, as of October 31, 2014, are not subject to a master netting arrangement and are excluded from the table above.
| 23 |
| Hartford International Capital Appreciation Fund |
| Notes to Financial Statements – (continued) |
| October 31, 2014 |
| (000’s Omitted) |
Principal Risks:
The Fund may be exposed to counterparty risk, or the risk that an institution or other entity with which the Fund has unsettled or open transactions will default.
If the Fund invests directly in foreign currencies or in securities that trade in, and receive revenues in, foreign currencies, or in derivatives that provide exposure to foreign currencies, it will be subject to the risk that those currencies will decline in value relative to the base currency (U.S. dollars) of the Fund, or, in the case of hedging positions, that the Fund’s base currency will decline in value relative to the currency being hedged. Currency rates in foreign countries may fluctuate significantly over short periods of time for a number of reasons, including changes in interest rates, intervention (or the failure to intervene) by U.S. or foreign governments, central banks or supranational entities, such as the International Monetary Fund, or by the imposition of currency controls or other political developments in the United States or abroad. As a result, the Fund’s investments in foreign currency denominated securities may reduce the returns of the Fund. The market values of equity securities, such as common stocks and preferred stocks, or equity related investments, such as futures and options, may decline due to general market conditions which are not specifically related to a particular company, such as real or perceived adverse economic conditions, changes in the general outlook for corporate earnings, changes in interest or currency rates or adverse investor sentiment generally. The market value of equity securities may also decline due to factors which affect a particular industry or industries, such as labor shortages or increased production costs and competitive conditions within an industry. Equity securities and equity related investments generally have greater market price volatility than fixed income securities.
Federal Income Taxes:
Federal Income Taxes – For federal income tax purposes, the Fund intends to continue to qualify as a Regulated Investment Company ("RIC") under Subchapter M of the Internal Revenue Code (“IRC”) by distributing substantially all of its taxable net investment income and net realized capital gains to its shareholders and otherwise complying with the requirements of the IRC. The Fund has distributed substantially all of its income and capital gains in prior years, if applicable, and intends to distribute substantially all of its income and capital gains during the calendar year ending December 31, 2014. Accordingly, no provision for federal income or excise taxes has been made in the accompanying financial statements. Distributions from short-term capital gains are treated as ordinary income distributions for federal income tax purposes.
Net Investment Income (Loss), Net Realized Gains (Losses) and Distributions – Net investment income (loss) and net realized gains (losses) may differ for financial statement and tax purposes primarily because of losses deferred due to wash sale adjustments, foreign currency gains and losses, adjustments related to Passive Foreign Investment Companies ("PFICs"), Real Estate Investment Trusts ("REITs"), RICs, certain derivatives and partnerships. The character of distributions made during the year from net investment income or net realized gains may differ from their ultimate characterization for federal income tax purposes. Also, due to the timing of dividend distributions, the fiscal year in which amounts are distributed may differ from the year that the income or realized gains (losses) were recorded by the Fund.
Distributions and Components of Distributable Earnings – The tax character of distributions paid by the Fund for the periods indicated is as follows (as adjusted for dividends payable, if applicable):
| For the Year Ended October 31, 2014 | For the Year Ended October 31, 2013 | |||||||
| Ordinary Income | $ | 275 | $ | 476 | ||||
| 24 |
| Hartford International Capital Appreciation Fund |
| Notes to Financial Statements – (continued) |
| October 31, 2014 |
| (000’s Omitted) |
As of October 31, 2014, the Fund’s components of distributable earnings (deficit) on a tax basis are as follows:
| Amount | ||||
| Undistributed Ordinary Income | $ | 298 | ||
| Undistributed Long-Term Capital Gain | 786 | |||
| Unrealized Appreciation* | 927 | |||
| Total Accumulated Earnings | $ | 2,011 | ||
| * | Differences between book-basis and tax-basis unrealized appreciation (depreciation) may be attributable to the losses deferred due to wash sale adjustments, foreign currency gains and losses, adjustments related to PFICs, REITs, RICs, certain derivatives and partnerships. |
Reclassification of Capital Accounts – The Fund may record reclassifications in its capital accounts. These reclassifications have no impact on the total net assets of the Fund. The reclassifications are a result of permanent differences between U.S. GAAP and tax accounting for such items as foreign currency, PFICs, expiration or utilization of capital loss carryforwards or net operating losses. Adjustments are made to reflect the impact these items have on current and future distributions to shareholders. Therefore, the source of the Fund’s distributions may be shown in the accompanying Statement of Changes in Net Assets as from undistributed net investment income, from accumulated net realized gains on investments or from capital depending on the type of book and tax differences that exist. For the year ended October 31, 2014, the Fund recorded reclassifications to increase (decrease) the accounts listed below:
| Amount | ||||
| Undistributed Net Investment Income (Loss) | $ | 99 | ||
| Accumulated Net Realized Gain (Loss) | (99 | ) | ||
Capital Loss Carryforward – On December 22, 2010, the Regulated Investment Company Modernization Act of 2010 (the “Act”) was enacted, which made changes to the capital loss carryforward rules. The changes are effective for taxable years beginning after the date of enactment. Under the Act, funds are permitted to carry forward capital losses for an unlimited period. However, any losses incurred during those future taxable years will be required to be utilized prior to the losses incurred in pre-enactment taxable years, which carry an expiration date. As a result of this ordering rule, pre-enactment capital loss carryforwards may be more likely to expire unused. Additionally, post-enactment capital loss carryforwards retain their character as either short-term or long-term capital losses rather than being considered all short-term as permitted under prior regulation.
The Fund had no capital loss carryforward for U.S. federal income tax purposes as of October 31, 2014.
During the year ended October 31, 2014, the Fund utilized $1,831 of prior year capital loss carryforwards.
Accounting for Uncertainty in Income Taxes – The Fund has adopted financial reporting rules that require the Fund to analyze all open tax years, as defined by the statute of limitations, for all major jurisdictions. Generally, tax authorities can examine all tax returns filed for the last three years. The Fund does not have an examination in progress.
The Fund has reviewed all open tax years and major jurisdictions and concluded that these financial reporting rules had no effect on the Fund’s financial position or results of operations. There is no tax liability resulting from unrecognized tax benefits relating to uncertain income tax positions taken or expected to be taken on the tax return for the fiscal year ended October 31, 2014. The Fund is also not aware of any tax positions for which it is reasonably possible that the total amounts of unrecognized tax benefits will significantly change in the next twelve months.
Expenses:
Investment Management Agreement – Hartford Funds Management Company, LLC ("HFMC") serves as the Fund’s investment manager pursuant to an Investment Management Agreement with the Company. HFMC is an indirect wholly owned subsidiary of The Hartford Financial Services Group, Inc. ("The Hartford"). The investment manager has overall investment supervisory responsibility for
| 25 |
| Hartford International Capital Appreciation Fund |
| Notes to Financial Statements – (continued) |
| October 31, 2014 |
| (000’s Omitted) |
the Fund. In addition, the investment manager provides administrative personnel, services, equipment, facilities and office space for proper operation of the Fund. HFMC has contracted with Wellington Management Company, LLP ("Wellington Management") under a sub-advisory agreement for the provision of day-to-day investment management services to the Fund in accordance with the Fund’s investment objective and policies. The Fund pays a fee to the investment manager, a portion of which may be used to compensate Wellington Management.
The schedule below reflects the rates of compensation paid to the investment manager for investment management services rendered as of October 31, 2014; the rates are accrued daily and paid monthly:
| Average Daily Net Assets | Annual Fee |
| On first $500 million | 0.9000% |
| On next $4.5 billion | 0.8500% |
| On next $5 billion | 0.8475% |
| Over $10 billion | 0.8450% |
Accounting Services Agreement – Pursuant to the Fund Accounting Agreement between HFMC and the Company, on behalf of the Fund, HFMC provides accounting services to the Fund and receives monthly compensation based on the Fund’s average daily net assets at the rates set forth below. The Fund’s accounting services fees are accrued daily and paid monthly.
| Average Daily Net Assets | Annual Fee |
| On first $5 billion | 0.020% |
| On next $5 billion | 0.015% |
| Over $10 billion | 0.010% |
Operating Expenses – Allocable expenses incurred by the Company are allocated to each Fund and allocated to classes within the Fund in proportion to the average daily net assets of the Fund and each class, except where allocation of certain expenses is more fairly made directly to the Fund or to specific classes within a Fund. As of October 31, 2014, HFMC contractually limited the total operating expenses of this Fund, exclusive of taxes, interest expense, brokerage commissions, acquired fund fees and expenses and extraordinary expenses, through February 28, 2015 as follows:
| Class A | Class B | Class C | Class I | Class R3 | Class R4 | Class R5 | Class Y |
| 1.45% | 2.20% | 2.20% | 1.20% | 1.65% | 1.35% | 1.05% | 1.00% |
Fees Paid Indirectly – The Fund has entered into agreements with State Street Global Markets, LLC and Russell Implementation Services, Inc. to partially recapture non-discounted trade commissions. Such rebates are used to pay a portion of the Fund's expenses. For the year ended October 31, 2014, this amount, if any, is included in the Statement of Operations.
| 26 |
| Hartford International Capital Appreciation Fund |
| Notes to Financial Statements – (continued) |
| October 31, 2014 |
| (000’s Omitted) |
The ratio of expenses to average net assets in the accompanying financial highlights excludes the reduction in expenses related to fees paid indirectly. The annualized expense ratio after waivers for the period listed below reflecting the reduction for fees paid indirectly is as follows:
| Year Ended October 31, 2014 | ||||
| Class A | 1.44 | % | ||
| Class B | 2.13 | |||
| Class C | 2.19 | |||
| Class I | 1.04 | |||
| Class R3 | 1.65 | |||
| Class R4 | 1.35 | |||
| Class R5 | 1.05 | |||
| Class Y | 1.00 | |||
Distribution and Service Plan for Class A, B, C, R3 and R4 Shares – Hartford Funds Distributors, LLC ("HFD"), an indirect wholly owned subsidiary of The Hartford, is the principal underwriter and distributor of the Fund. HFD is engaged in distribution activities, which include marketing and distribution of shares through broker/dealers, financing distribution costs and maintaining financial books and records. For the year ended October 31, 2014, HFD received front-end load sales charges of $52 and contingent deferred sales charges of zero from the Fund.
The Fund has adopted a Distribution and Service Plan in accordance with Rule 12b-1 of the 1940 Act to compensate the distributor (HFD) for activities intended to result in the sale and distribution of Class A, B, C, R3 and R4 shares and for providing services for shareholders. The Rule 12b-1 plan applicable to Class A shares of the Fund provides for payment of a Rule 12b-1 fee of 0.25% of average daily net assets. Some or all of the fee may be used for shareholder servicing expenses with the remainder used for distribution expenses. Under the Class B Plan, the Fund pays the distributor 1.00% of the average daily net assets of Class B shares that are outstanding for 8 years or less, 0.25% of which is a fee for services provided to existing shareholders with the remainder used for distribution expenses. Some or the entire Rule 12b-1 fee for Class B shares may be remitted to broker/dealers for distribution and/or shareholder account services. After eight years, Class B shares convert to Class A shares. Upon conversion to Class A shares, the Class A plan described above will apply to those shares. Under the Class C Plan, the Fund pays the distributor 1.00% of the average daily net assets of Class C shares outstanding, 0.25% of which is intended as a fee for services provided to existing shareholders with the remainder used for distribution expenses. For Class C shares, some or the entire fee may be remitted to broker/dealers for distribution and/or shareholder account services. Class R3 shares have a distribution fee of 0.50% of average daily net assets and Class R4 shares have a distribution fee of 0.25% of average daily net assets. For Class R3 and R4 shares, some or the entire fee may be remitted to broker/dealers for distribution and/or shareholder account services. The Fund’s 12b-1 fees are accrued daily and paid monthly or at such other intervals as the Board of Directors may determine.
Other Related Party Transactions – Certain officers of the Fund are directors and/or officers of HFMC and/or The Hartford or its subsidiaries. For the year ended October 31, 2014, a portion of the Fund’s Chief Compliance Officer’s compensation was paid by all of the investment companies in the Hartford fund complex. The portion allocated to the Fund, as represented in other expenses on the Statement of Operations, rounds to zero. Hartford Administrative Services Company (“HASCO”), an indirect wholly-owned subsidiary of The Hartford, provides transfer agent services to the Fund. HASCO has contractually agreed to reimburse any portion of the transfer agency fees over 0.30% of average daily net assets per fiscal year for each class. Any transfer agency fee reimbursement is determined before considering the contractual operating expense limitation. For providing such services, HASCO is compensated on a per account basis that varies by account type, except with respect to Class Y, for which it is compensated based on average daily net assets. The amount paid to HASCO and any related contractual reimbursement amounts, if applicable, can be found in the Statement of Operations. These fees are accrued daily and paid monthly.
Administrative services fees are paid to HASCO for third-party recordkeeping services that are payable as a percentage of net assets in the amount of up to 0.20%, 0.15% and 0.10% for Classes R3, R4 and R5 shares, respectively. The total administrative services fees are shown on the Statement of Operations. These fees are accrued daily and paid monthly.
| 27 |
| Hartford International Capital Appreciation Fund |
| Notes to Financial Statements – (continued) |
| October 31, 2014 |
| (000’s Omitted) |
Affiliate Holdings:
As of October 31, 2014, affiliates of The Hartford had ownership of shares in the Fund as follows:
| Percentage of Class | Percentage of Fund | |||||||
| Class A | 10 | % | 4 | % | ||||
| Class B | 65 | 2 | ||||||
| Class I | 59 | 4 | ||||||
| Class R3 | 82 | 3 | ||||||
| Class R4 | 91 | 4 | ||||||
| Class R5 | 100 | 4 | ||||||
| Class Y | 100 | 36 | ||||||
Investment Transactions:
For the year ended October 31, 2014, the cost of purchases and proceeds from sales of investment securities (excluding short-term investments) were as follows:
| Excluding U.S. Government Obligations | U.S. Government Obligations | Total | ||||||||||
| Cost of Purchases | $ | 20,360 | $ | — | $ | 20,360 | ||||||
| Sales Proceeds | 22,295 | — | 22,295 | |||||||||
| 28 |
| Hartford International Capital Appreciation Fund |
| Notes to Financial Statements – (continued) |
| October 31, 2014 |
| (000’s Omitted) |
Capital Share Transactions:
The following information is for the year ended October 31, 2014, and the year ended October 31, 2013:
| For the Year Ended October 31, 2014 | For the Year Ended October 31, 2013 | |||||||||||||||||||||||||||||||
| Shares Sold | Shares Issued for Reinvested Dividends | Shares Redeemed | Net Increase (Decrease) of Shares | Shares Sold | Shares Issued for Reinvested Dividends | Shares Redeemed | Net Increase (Decrease) of Shares | |||||||||||||||||||||||||
| Class A | ||||||||||||||||||||||||||||||||
| Shares | 255 | 10 | (421 | ) | (156 | ) | 365 | 18 | (147 | ) | 236 | |||||||||||||||||||||
| Amount | $ | 2,572 | $ | 102 | $ | (4,089 | ) | $ | (1,415 | ) | $ | 3,316 | $ | 157 | $ | (1,317 | ) | $ | 2,156 | |||||||||||||
| Class B | ||||||||||||||||||||||||||||||||
| Shares | 2 | — | (53 | ) | (51 | ) | 14 | 1 | (7 | ) | 8 | |||||||||||||||||||||
| Amount | $ | 27 | $ | 1 | $ | (514 | ) | $ | (486 | ) | $ | 125 | $ | 13 | $ | (69 | ) | $ | 69 | |||||||||||||
| Class C | ||||||||||||||||||||||||||||||||
| Shares | 69 | 1 | (131 | ) | (61 | ) | 60 | 2 | (19 | ) | 43 | |||||||||||||||||||||
| Amount | $ | 698 | $ | 4 | $ | (1,261 | ) | $ | (559 | ) | $ | 543 | $ | 22 | $ | (170 | ) | $ | 395 | |||||||||||||
| Class I | ||||||||||||||||||||||||||||||||
| Shares | 73 | 2 | (38 | ) | 37 | 20 | 3 | (10 | ) | 13 | ||||||||||||||||||||||
| Amount | $ | 755 | $ | 17 | $ | (377 | ) | $ | 395 | $ | 178 | $ | 26 | $ | (88 | ) | $ | 116 | ||||||||||||||
| Class R3 | ||||||||||||||||||||||||||||||||
| Shares | 6 | 1 | (4 | ) | 3 | 7 | 2 | (1 | ) | 8 | ||||||||||||||||||||||
| Amount | $ | 62 | $ | 7 | $ | (37 | ) | $ | 32 | $ | 61 | $ | 17 | $ | (10 | ) | $ | 68 | ||||||||||||||
| Class R4 | ||||||||||||||||||||||||||||||||
| Shares | 3 | 1 | (1 | ) | 3 | 3 | 2 | (3 | ) | 2 | ||||||||||||||||||||||
| Amount | $ | 26 | $ | 9 | $ | (7 | ) | $ | 28 | $ | 24 | $ | 18 | $ | (25 | ) | $ | 17 | ||||||||||||||
| Class R5 | ||||||||||||||||||||||||||||||||
| Shares | — | 1 | — | 1 | — | 2 | — | 2 | ||||||||||||||||||||||||
| Amount | $ | — | $ | 12 | $ | — | $ | 12 | $ | — | $ | 20 | $ | — | $ | 20 | ||||||||||||||||
| Class Y | ||||||||||||||||||||||||||||||||
| Shares | — | 12 | — | 12 | — | 24 | — | 24 | ||||||||||||||||||||||||
| Amount | $ | — | $ | 121 | $ | — | $ | 121 | $ | — | $ | 202 | $ | — | $ | 202 | ||||||||||||||||
| Total | ||||||||||||||||||||||||||||||||
| Shares | 408 | 28 | (648 | ) | (212 | ) | 469 | 54 | (187 | ) | 336 | |||||||||||||||||||||
| Amount | $ | 4,140 | $ | 273 | $ | (6,285 | ) | $ | (1,872 | ) | $ | 4,247 | $ | 475 | $ | (1,679 | ) | $ | 3,043 | |||||||||||||
The following reflects the conversion of Class B shares into Class A shares (reflected as Class A shares sold) for the year ended October 31, 2014, and the year ended October 31, 2013:
| Shares | Dollars | |||||||
| For the Year Ended October 31, 2014 | 4 | $ | 39 | |||||
| For the Year Ended October 31, 2013 | 3 | $ | 27 | |||||
Line of Credit:
The Fund is one of several Hartford Funds that participate in a $500 million committed revolving line of credit facility. The facility is to be used for temporary or emergency purposes. Under the arrangement, the funds are required to own securities having a market value in excess of 300% of the total bank borrowings. The interest rate on borrowings varies depending on the nature of the loan. The facility also requires a fee to be paid based on the amount of the commitment. This commitment fee is allocated to all the funds participating in the line of credit based on the average net assets of the funds. During the year ended October 31, 2014, the Fund did not have any borrowings under this facility.
Pending Legal Proceedings:
On February 25, 2011, Jennifer L. Kasilag, Louis Mellinger, Judith M. Menendez, Jacqueline M. Robinson, and Linda A. Russell filed a derivative lawsuit against Hartford Investment Financial Services, LLC (“HIFSCO”) (now known as HFD) on behalf of six Hartford retail mutual funds in the United States District Court for the District of New Jersey, alleging that HIFSCO received excessive advisory and distribution fees in violation of its statutory fiduciary duty under Section 36(b) of the 1940 Act when serving as investment manager and principal underwriter, respectively, to the Hartford retail mutual funds. Although this action was purportedly filed on behalf of certain of the
| 29 |
| Hartford International Capital Appreciation Fund |
| Notes to Financial Statements – (continued) |
| October 31, 2014 |
| (000’s Omitted) |
Hartford Funds, none of the Hartford Funds is itself a defendant to the suit. HIFSCO moved to dismiss and, in September 2011, the motion was granted in part and denied in part, with leave to amend the complaint. In November 2011, plaintiffs filed an amended complaint on behalf of certain Hartford retail mutual funds, The Hartford Global Health Fund (now known as The Hartford Healthcare Fund), The Hartford Conservative Allocation Fund, The Hartford Growth Opportunities Fund, The Hartford Inflation Plus Fund, The Hartford Advisers Fund (now known as The Hartford Balanced Fund), and The Hartford Capital Appreciation Fund. Plaintiffs seek to rescind the investment management agreements and distribution plans between HIFSCO and these funds and to recover the total fees charged thereunder or, in the alternative, to recover any improper compensation HIFSCO received, in addition to lost earnings. HIFSCO filed a partial motion to dismiss the amended complaint and, in December 2012, the court dismissed without prejudice the claims regarding distribution fees and denied the motion with respect to the advisory fees claims. HIFSCO disputes the allegations and intends to defend vigorously.
In March 2014, the plaintiffs filed a new complaint that added as new plaintiffs The Hartford Floating Rate Fund and The Hartford Small Company Fund and named as a defendant HFMC, which assumed the role as investment manager to the funds as of January 2013. HFMC and HIFSCO dispute the allegations and intend to defend vigorously.
No accrual for litigation relating to this matter has been recorded in the financial statements of the Fund because the Fund is not party to the suit.
Indemnifications:
Under the Company's organizational documents, the Company shall indemnify its officers and directors to the full extent required or permitted under Maryland General Corporation Law and the federal securities laws. In addition, the Company, on behalf of the Fund, may enter into contracts that contain a variety of indemnifications. The Company's maximum exposure under these arrangements is unknown. However, as of the date of these financial statements, the Company has not had prior claims or losses pursuant to these contracts and expects the risk of loss to be remote.
Subsequent Event:
Effective December 1, 2014, pursuant to a sub-transfer agency agreement between HASCO and Boston Financial Data Services, Inc. (“BFDS”), HASCO has delegated certain transfer agent, dividend disbursing agent and shareholder servicing agent functions to BFDS. The costs and expenses of such delegation are borne by HASCO, not by the Fund.
| 30 |
| Hartford International Capital Appreciation Fund |
| Financial Highlights |
| - Selected Per-Share Data - (A) | - Ratios and Supplemental Data - | |||||||||||||||||||||||||||||||||||||||||||||||||||
| Class | Net
Asset Value at Beginning of Period | Net Investment Income (Loss) | Net
Realized and Unrealized Gain (Loss) on Invest- ments | Total
from Investment Operations | Dividends from Net Investment Income | Distribu- tions from Realized Capital Gains | Total
Dividends and Distributions | Net
Asset Value at End of Period | Total
Return(B) | Net
Assets at End of Period (000's) | Ratio
of Expenses to Average Net Assets Before Adjust- ments(C) | Ratio
of Expenses to Average Net Assets After Adjust- ments(C) | Ratio
of Net Investment Income (Loss) to Average Net Assets | |||||||||||||||||||||||||||||||||||||||
| For the Year Ended October 31, 2014 | ||||||||||||||||||||||||||||||||||||||||||||||||||||
| A | $ | 9.91 | $ | 0.06 | $ | 0.03 | $ | 0.09 | $ | (0.08 | ) | $ | – | $ | (0.08 | ) | $ | 9.92 | 0.89 | % | $ | 10,810 | 1.84 | % | 1.44 | % | 0.57 | % | ||||||||||||||||||||||||
| B | 9.84 | (0.02 | ) | 0.03 | 0.01 | (0.01 | ) | – | (0.01 | ) | 9.84 | 0.10 | 908 | 2.53 | 2.13 | (0.18 | ) | |||||||||||||||||||||||||||||||||||
| C | 9.81 | (0.03 | ) | 0.04 | 0.01 | (0.02 | ) | – | (0.02 | ) | 9.80 | 0.06 | 1,910 | 2.59 | 2.19 | (0.26 | ) | |||||||||||||||||||||||||||||||||||
| I | 9.97 | 0.10 | 0.02 | 0.12 | (0.11 | ) | – | (0.11 | ) | 9.98 | 1.19 | 1,835 | 1.44 | 1.04 | 1.03 | |||||||||||||||||||||||||||||||||||||
| R3 | 9.91 | 0.05 | 0.01 | 0.06 | (0.06 | ) | – | (0.06 | ) | 9.91 | 0.54 | 1,258 | 2.12 | 1.65 | 0.44 | |||||||||||||||||||||||||||||||||||||
| R4 | 9.94 | 0.08 | 0.01 | 0.09 | (0.08 | ) | – | (0.08 | ) | 9.95 | 0.90 | 1,151 | 1.81 | 1.35 | 0.74 | |||||||||||||||||||||||||||||||||||||
| R5 | 9.97 | 0.11 | 0.01 | 0.12 | (0.11 | ) | – | (0.11 | ) | 9.98 | 1.18 | 1,071 | 1.50 | 1.05 | 1.04 | |||||||||||||||||||||||||||||||||||||
| Y | 9.97 | 0.11 | 0.01 | 0.12 | (0.11 | ) | – | (0.11 | ) | 9.98 | 1.22 | 10,756 | 1.40 | 1.00 | 1.09 | |||||||||||||||||||||||||||||||||||||
| For the Year Ended October 31, 2013 | ||||||||||||||||||||||||||||||||||||||||||||||||||||
| A | $ | 8.31 | $ | 0.10 | $ | 1.66 | $ | 1.76 | $ | (0.16 | ) | $ | – | $ | (0.16 | ) | $ | 9.91 | 21.43 | % | $ | 12,351 | 1.95 | % | 1.41 | % | 1.12 | % | ||||||||||||||||||||||||
| B | 8.25 | 0.04 | 1.65 | 1.69 | (0.10 | ) | – | (0.10 | ) | 9.84 | 20.63 | 1,404 | 2.64 | 2.11 | 0.44 | |||||||||||||||||||||||||||||||||||||
| C | 8.23 | 0.04 | 1.64 | 1.68 | (0.10 | ) | – | (0.10 | ) | 9.81 | 20.64 | 2,514 | 2.68 | 2.15 | 0.39 | |||||||||||||||||||||||||||||||||||||
| I | 8.36 | 0.14 | 1.66 | 1.80 | (0.19 | ) | – | (0.19 | ) | 9.97 | 21.90 | 1,467 | 1.56 | 1.03 | 1.50 | |||||||||||||||||||||||||||||||||||||
| R3 | 8.31 | 0.08 | 1.66 | 1.74 | (0.14 | ) | – | (0.14 | ) | 9.91 | 21.22 | 1,225 | 2.25 | 1.65 | 0.91 | |||||||||||||||||||||||||||||||||||||
| R4 | 8.33 | 0.11 | 1.67 | 1.78 | (0.17 | ) | – | (0.17 | ) | 9.94 | 21.62 | 1,122 | 1.94 | 1.35 | 1.21 | |||||||||||||||||||||||||||||||||||||
| R5 | 8.35 | 0.14 | 1.67 | 1.81 | (0.19 | ) | – | (0.19 | ) | 9.97 | 22.02 | 1,059 | 1.63 | 1.05 | 1.50 | |||||||||||||||||||||||||||||||||||||
| Y | 8.36 | 0.14 | 1.66 | 1.80 | (0.19 | ) | – | (0.19 | ) | 9.97 | 21.93 | 10,623 | 1.53 | 1.00 | 1.55 | |||||||||||||||||||||||||||||||||||||
| For the Year Ended October 31, 2012 | ||||||||||||||||||||||||||||||||||||||||||||||||||||
| A | $ | 7.98 | $ | 0.10 | $ | 0.29 | $ | 0.39 | $ | (0.06 | ) | $ | – | $ | (0.06 | ) | $ | 8.31 | 4.94 | % | $ | 8,397 | 2.11 | % | 1.44 | % | 1.26 | % | ||||||||||||||||||||||||
| B | 7.92 | 0.04 | 0.29 | 0.33 | – | – | – | 8.25 | 4.17 | 1,111 | 2.80 | 2.13 | 0.57 | |||||||||||||||||||||||||||||||||||||||
| C | 7.90 | 0.04 | 0.29 | 0.33 | – | – | – | 8.23 | 4.18 | 1,753 | 2.83 | 2.16 | 0.53 | |||||||||||||||||||||||||||||||||||||||
| I | 8.03 | 0.13 | 0.29 | 0.42 | (0.09 | ) | – | (0.09 | ) | 8.36 | 5.39 | 1,119 | 1.69 | 1.02 | 1.67 | |||||||||||||||||||||||||||||||||||||
| R3 | 7.98 | 0.08 | 0.29 | 0.37 | (0.04 | ) | – | (0.04 | ) | 8.31 | 4.68 | 963 | 2.39 | 1.65 | 1.05 | |||||||||||||||||||||||||||||||||||||
| R4 | 8.00 | 0.11 | 0.28 | 0.39 | (0.06 | ) | – | (0.06 | ) | 8.33 | 5.02 | 924 | 2.08 | 1.35 | 1.34 | |||||||||||||||||||||||||||||||||||||
| R5 | 8.03 | 0.13 | 0.28 | 0.41 | (0.09 | ) | – | (0.09 | ) | 8.35 | 5.23 | 868 | 1.77 | 1.05 | 1.64 | |||||||||||||||||||||||||||||||||||||
| Y | 8.03 | 0.14 | 0.28 | 0.42 | (0.09 | ) | – | (0.09 | ) | 8.36 | 5.42 | 8,708 | 1.67 | 1.00 | 1.69 | |||||||||||||||||||||||||||||||||||||
| For the Year Ended October 31, 2011 | ||||||||||||||||||||||||||||||||||||||||||||||||||||
| A | $ | 8.46 | $ | 0.07 | $ | (0.48 | ) | $ | (0.41 | ) | $ | (0.07 | ) | $ | – | $ | (0.07 | ) | $ | 7.98 | (4.87 | )% | $ | 8,137 | 2.01 | % | 1.41 | % | 0.84 | % | ||||||||||||||||||||||
| B | 8.39 | 0.01 | (0.47 | ) | (0.46 | ) | (0.01 | ) | – | (0.01 | ) | 7.92 | (5.47 | ) | 1,141 | 2.72 | 2.12 | 0.14 | ||||||||||||||||||||||||||||||||||
| C | 8.39 | 0.01 | (0.48 | ) | (0.47 | ) | (0.02 | ) | – | (0.02 | ) | 7.90 | (5.67 | ) | 1,513 | 2.75 | 2.15 | 0.13 | ||||||||||||||||||||||||||||||||||
| I | 8.50 | 0.11 | (0.48 | ) | (0.37 | ) | (0.10 | ) | – | (0.10 | ) | 8.03 | (4.43 | ) | 941 | 1.61 | 1.01 | 1.26 | ||||||||||||||||||||||||||||||||||
| R3 | 8.46 | 0.05 | (0.48 | ) | (0.43 | ) | (0.05 | ) | – | (0.05 | ) | 7.98 | (5.10 | ) | 890 | 2.31 | 1.65 | 0.60 | ||||||||||||||||||||||||||||||||||
| R4 | 8.48 | 0.08 | (0.49 | ) | (0.41 | ) | (0.07 | ) | – | (0.07 | ) | 8.00 | (4.87 | ) | 859 | 2.01 | 1.35 | 0.91 | ||||||||||||||||||||||||||||||||||
| R5 | 8.49 | 0.10 | (0.47 | ) | (0.37 | ) | (0.09 | ) | – | (0.09 | ) | 8.03 | (4.40 | ) | 824 | 1.70 | 1.05 | 1.21 | ||||||||||||||||||||||||||||||||||
| Y | 8.50 | 0.11 | (0.48 | ) | (0.37 | ) | (0.10 | ) | – | (0.10 | ) | 8.03 | (4.44 | ) | 8,264 | 1.60 | 1.00 | 1.26 | ||||||||||||||||||||||||||||||||||
See Portfolio Turnover information on the next page.
| 31 |
| Hartford International Capital Appreciation Fund |
| Financial Highlights – (continued) |
| - Selected Per-Share Data - (A) | - Ratios and Supplemental Data - | |||||||||||||||||||||||||||||||||||||||||||||||||||
| Class | Net
Asset Value at Beginning of Period | Net Investment Income (Loss) | Net
Realized and Unrealized Gain (Loss) on Invest- ments | Total
from Investment Operations | Dividends from Net Investment Income | Distribu- tions from Realized Capital Gains | Total
Dividends and Distributions | Net
Asset Value at End of Period | Total
Return(B) | Net
Assets at End of Period (000's) | Ratio
of Expenses to Average Net Assets Before Adjust- ments(C) | Ratio
of Expenses to Average Net Assets After Adjust- ments(C) | Ratio
of Net Investment Income (Loss) to Average Net Assets | |||||||||||||||||||||||||||||||||||||||
| For the Year Ended October 31, 2010 | ||||||||||||||||||||||||||||||||||||||||||||||||||||
| A | $ | 7.35 | $ | 0.05 | $ | 1.14 | $ | 1.19 | $ | (0.08 | ) | $ | – | $ | (0.08 | ) | $ | 8.46 | 16.31 | % | $ | 8,005 | 2.29 | % | 1.58 | % | 0.58 | % | ||||||||||||||||||||||||
| B | 7.31 | (0.01 | ) | 1.13 | 1.12 | (0.04 | ) | – | (0.04 | ) | 8.39 | 15.36 | 1,177 | 3.01 | 2.32 | (0.18 | ) | |||||||||||||||||||||||||||||||||||
| C | 7.31 | (0.01 | ) | 1.13 | 1.12 | (0.04 | ) | – | (0.04 | ) | 8.39 | 15.43 | 1,452 | 3.05 | 2.33 | (0.20 | ) | |||||||||||||||||||||||||||||||||||
| I | 7.38 | 0.07 | 1.15 | 1.22 | (0.10 | ) | – | (0.10 | ) | 8.50 | 16.69 | 880 | 1.90 | 1.21 | 0.90 | |||||||||||||||||||||||||||||||||||||
| R3 | 7.35 | 0.02 | 1.15 | 1.17 | (0.06 | ) | – | (0.06 | ) | 8.46 | 16.02 | 906 | 2.59 | 1.81 | 0.30 | |||||||||||||||||||||||||||||||||||||
| R4 | 7.36 | 0.04 | 1.16 | 1.20 | (0.08 | ) | – | (0.08 | ) | 8.48 | 16.38 | 877 | 2.29 | 1.55 | 0.57 | |||||||||||||||||||||||||||||||||||||
| R5 | 7.37 | 0.06 | 1.15 | 1.21 | (0.09 | ) | – | (0.09 | ) | 8.49 | 16.61 | 863 | 1.99 | 1.28 | 0.83 | |||||||||||||||||||||||||||||||||||||
| Y | 7.38 | 0.07 | 1.15 | 1.22 | (0.10 | ) | – | (0.10 | ) | 8.50 | 16.69 | 8,650 | 1.89 | 1.20 | 0.92 | |||||||||||||||||||||||||||||||||||||
| (A) | Information presented relates to a share outstanding throughout the indicated period. Net investment income (loss) per share amounts are calculated based on average shares outstanding unless otherwise noted. |
| (B) | Assumes initial investment at net asset value at the beginning of each period, reinvestment of all distributions, the complete redemption of the investment at net asset value at the end of each period and no sales charge. Total return would be reduced if sales charges were taken into account. |
| (C) | Adjustments include waivers and reimbursements, if applicable. Ratios do not include fees paid indirectly (see Expenses in the accompanying Notes to Financial Statements). |
| Portfolio Turnover Rate for All Share Classes | ||||
| For the Year Ended October 31, 2014 | 69 | % | ||
| For the Year Ended October 31, 2013 | 106 | |||
| For the Year Ended October 31, 2012 | 85 | |||
| For the Year Ended October 31, 2011 | 89 | |||
| For the Year Ended October 31, 2010 | 155 | |||
| 32 |
| Report of Independent Registered Public Accounting Firm |
|
The Board of Directors and Shareholders of The Hartford Mutual Funds, Inc. |
We have audited the accompanying statement of assets and liabilities, including the schedule of investments, of Hartford International Capital Appreciation Fund (formerly The Hartford Diversified International Fund) (one of the portfolios constituting The Hartford Mutual Funds, Inc. (the Funds)) as of October 31, 2014, and the related statement of operations for the year then ended, the statements of changes in net assets for each of the two years in the period then ended, and the financial highlights for each of the five years in the period then ended. These financial statements and financial highlights are the responsibility of the Funds’ management. Our responsibility is to express an opinion on these financial statements and financial highlights based on our audits.
We conducted our audits in accordance with the standards of the Public Company Accounting Oversight Board (United States). Those standards require that we plan and perform the audit to obtain reasonable assurance about whether the financial statements and financial highlights are free of material misstatement. We were not engaged to perform an audit of the Funds’ internal control over financial reporting. Our audits included consideration of internal control over financial reporting as a basis for designing audit procedures that are appropriate in the circumstances, but not for the purpose of expressing an opinion on the effectiveness of the Funds’ internal control over financial reporting. Accordingly, we express no such opinion. An audit also includes examining, on a test basis, evidence supporting the amounts and disclosures in the financial statements and financial highlights, assessing the accounting principles used and significant estimates made by management, and evaluating the overall financial statement presentation. Our procedures included confirmation of securities owned as of October 31, 2014, by correspondence with the custodian and brokers or by other appropriate auditing procedures where replies from brokers were not received. We believe that our audits provide a reasonable basis for our opinion.
In our opinion, the financial statements and financial highlights referred to above present fairly, in all material respects, the financial position of Hartford International Capital Appreciation Fund (formerly The Hartford Diversified International Fund) of The Hartford Mutual Funds, Inc. at October 31, 2014, the results of its operations for the year then ended, the changes in its net assets for each of the two years in the period then ended, and the financial highlights for each of the five years in the period then ended, in conformity with U.S. generally accepted accounting principles.
| |
| Minneapolis, Minnesota | |
| December 18, 2014 |
| 33 |
| Hartford International Capital Appreciation Fund |
| Directors and Officers (Unaudited) |
The Board of Directors of the Company (the "Directors") appoints officers who are responsible for the day-to-day operations of the Fund and who execute policies formulated by the Directors. Each Director serves until his or her death, resignation, or retirement or until the next annual meeting of shareholders is held or until his or her successor is elected and qualifies.
Directors and officers who are employed by or who have a financial interest in The Hartford Financial Services Group, Inc. ("The Hartford") are considered “interested” persons of the Fund pursuant to the 1940 Act. Each officer and two of the Company's Directors, as noted in the chart below, are “interested” persons of the Fund. Each Director serves as a director for The Hartford Mutual Funds, Inc., The Hartford Mutual Funds II, Inc., Hartford Series Fund, Inc., and Hartford HLS Series Fund II, Inc., and as a trustee for The Hartford Alternative Strategies Fund, which, as of October 31, 2014, collectively consist of 66 funds. Correspondence may be sent to Directors and officers c/o Hartford Funds, 5 Radnor Corporate Center, Suite 300, 100 Matsonford Road, Radnor, Pennsylvania 19087, except that correspondence to Mr. Annoni, Mr. Dressen and Ms. Quade may be sent to 500 Bielenberg Drive, Suite 500, Woodbury, Minnesota 55125.
The table below sets forth, for each Director and officer, his or her name, year of birth, current position with the Company and date first elected or appointed to The Hartford Mutual Funds, Inc. ("MF") and The Hartford Mutual Funds II, Inc. ("MF2"), principal occupation, and, for Directors, other directorships held. The Fund’s Statement of Additional Information contains further information on the Directors and is available free of charge by calling 1-888-843-7824 or writing to: Hartford Funds, P.O. Box 55022, Boston, MA 02205-5022.
Information on the aggregate remuneration paid to the directors of the Company can be found in the Statement of Operations herein. The Fund pays to The Hartford a portion of the Chief Compliance Officer’s compensation, but does not pay salaries or compensation to any of its other officers or Directors who are employed by The Hartford.
Non-Interested Directors
Hilary E. Ackermann (1956) Director since September 23, 2014
Ms. Ackermann served as Chief Risk Officer at Goldman Sachs Bank USA from October 2008 to November 2011 and serves as a Director of Dynegy, Inc., an independent power company, from October 2012 to present.
Lynn S. Birdsong (1946) Director since 2003, Chairman of the Investment Committee since 2014
Mr. Birdsong is a private investor. Mr. Birdsong currently serves as a Director of the Sovereign High Yield Investment Company (April 2010 to current). Mr. Birdsong currently serves as an Independent Director of Nomura Partners Funds, Inc. (formerly, The Japan Fund) (April 2003 to current). From 2003 to March 2005, Mr. Birdsong was an Independent Director of the Atlantic Whitehall Funds. From 1979 to 2002, Mr. Birdsong was a Managing Director of Zurich Scudder Investments, an investment management firm. During his employment with Scudder, Mr. Birdsong was an Interested Director of The Japan Fund. From January 1981 through December 2013, Mr. Birdsong was a partner in Birdsong Company, an advertising specialty firm.
Robert M. Gavin, Jr. (1940) Director since 2002 (MF) and 1986 (MF2), Chairman of the Board for each since 2004
Dr. Gavin is an educational consultant. Prior to September 1, 2001, he was President of Cranbrook Education Community and prior to July 1996, he was President of Macalester College, St. Paul, Minnesota.
Duane E. Hill (1945) Director since 2001 (MF) and 2002 (MF2), Chairman of the Nominating Committee since 2003
Mr. Hill is a Partner of TSG Ventures L.P., a private equity investment company. Mr. Hill is a former partner of TSG Capital Group, a private equity investment firm that served as sponsor and lead investor in leveraged buyouts of middle market companies.
Sandra S. Jaffee (1941) Director since 2005
Ms. Jaffee is the founder and Chief Executive Officer of a private company, Homeworks Concierge, LLC, which provides residential property management services in Westchester County, New York (January 2012 to present). Ms. Jaffee served as Chairman (2008 to 2009) and Chief Executive Officer of Fortent (formerly Searchspace Group), a leading provider of compliance/regulatory technology to financial institutions from August 2005 to August 2009. From August 2004 to August 2005, Ms. Jaffee served as an Entrepreneur in Residence with Warburg Pincus, a private equity firm. Prior to joining Warburg Pincus, Ms. Jaffee served as Executive Vice President at Citigroup, from September 1995 to July 2004, where she was President and Chief Executive Officer of Citibank’s Global Securities Services (1995 to 2003). Ms. Jaffee currently serves as a member of the Board of Directors of Broadridge Financial Solutions as well as a Trustee of Muhlenberg College.
| 34 |
| Hartford International Capital Appreciation Fund |
| Directors and Officers (Unaudited) – (continued) |
William P. Johnston (1944) Director since 2005, Chairman of the Compliance Committee since 2005
In June 2006, Mr. Johnston was appointed as Senior Advisor to The Carlyle Group, a global private equity and other alternative asset investment firm and currently serves as an Operating Executive. In July 2006, Mr. Johnston was elected to the Board of Directors of MultiPlan, Inc. and served as a Director (July 2006 to August 2010). In August 2007, Mr. Johnston was elected to the Board of Directors of LifeCare Holdings, Inc. and served as a Director (August 2007 to June 2013). In February 2008, Mr. Johnston was elected to the Board of Directors of HCR-ManorCare, Inc. In May 2006, Mr. Johnston was elected to the Supervisory Board of Fresenius Medical Care AG & Co. KGaA, after its acquisition of Renal Care Group, Inc. in March 2006. Mr. Johnston joined Renal Care Group in November 2002 as a member of the Board of Directors and served as Chairman of the Board from March 2003 through March 2006. From 2002 through 2013, Mr. Johnston served as a Board member of the Georgia O’Keefe Museum. From September 1987 to December 2002, Mr. Johnston was with Equitable Securities Corporation (and its successors, SunTrust Equitable Securities and SunTrust Robinson Humphrey) serving in various investment banking and managerial positions, including Managing Director and Head of Investment Banking, Chief Executive Officer and Vice Chairman.
Phillip O. Peterson (1944) Director since 2002 (MF) and 2000 (MF2), Chairman of the Audit Committee since 2002
Mr. Peterson is a mutual fund industry consultant. He was a partner of KPMG LLP (an accounting firm) until July 1999. Mr. Peterson joined William Blair Funds in February 2007 as a member of the Board of Trustees. From February 2012 to February 2014, Mr. Peterson served as a Trustee of Symetra Variable Mutual Funds. From January 2004 to April 2005, Mr. Peterson served as Independent President of the Strong Mutual Funds.
Lemma W. Senbet (1946) Director since 2005
Dr. Senbet is the William E. Mayer Chair Professor of Finance and Founding Director, Center for Financial Policy, at the University of Maryland, Robert H. Smith School of Business. He was chair of the Finance Department of the University of Maryland, Robert H. Smith School of Business from 1998 to 2006. Since June 2013, he has been on leave from the University to serve as Executive Director of African Economic Research Consortium which focuses on economic policy research and training. Previously, he was a chaired professor of finance at the University of Wisconsin-Madison. Also, he was a Director of the Fortis Funds from March 2000 to July 2002. Dr. Senbet served as Director of the American Finance Association and President of the Western Finance Association. In 2006, Dr. Senbet was inducted Fellow of Financial Management Association International for his career-long distinguished scholarship and professional service.
Interested Directors and Officers
James E. Davey (1964) Director since 2012, President and Chief Executive Officer since 2010
Mr. Davey serves as Executive Vice President of Hartford Life Insurance Company (“HLIC”) and The Hartford. Additionally, Mr. Davey serves as Chairman of the Board, Manager and Senior Managing Director of Hartford Funds Distributors, LLC (“HFD”). He also currently serves as Director, Chairman of the Board, President and Senior Managing Director of Hartford Administrative Services Company (“HASCO”). Mr. Davey also serves as Manager, Chairman of the Board and Senior Managing Director for Hartford Funds Management Company, LLC (“HFMC”) and Director, Chairman of the Board and Senior Managing Director for Hartford Funds Management Group, Inc. ("HFMG"). Mr. Davey has served in various positions within The Hartford and its subsidiaries in connection with the operation of the Hartford Funds. Mr. Davey joined The Hartford in 2002.
Lowndes A. Smith* (1939) Director since 1996 (MF) and 2002 (MF2)
Mr. Smith served as Vice Chairman of The Hartford from February 1997 to January 2002, as President and Chief Executive Officer of Hartford Life, Inc. from February 1997 to January 2002, and as President and Chief Operating Officer of The Hartford Life Insurance Companies from January 1989 to January 2002. Mr. Smith serves as a Director of White Mountains Insurance Group Ltd. (October 2003 to current); One Beacon Insurance (October 2006 to current); Symetra Financial (August 2007 to current) and is a Managing Director of Whittington Gray Associates (January 2007 to current).
* Mr. Smith resigned as a Director of MF, MF2, Hartford Series Fund, Inc. and Hartford HLS Series Fund II, Inc. and as a Trustee of The Hartford Alternative Strategies Fund effective September 17, 2014.
Other Officers
Mark A. Annoni (1964) Vice President, Controller and Treasurer since 2012
Mr. Annoni currently serves as the Assistant Vice President of HLIC (February 2004 to present) and Senior Vice President of HFMG (December 2013 to present). Mr. Annoni has served in various positions within The Hartford and its subsidiaries in connection with the operation of the Hartford Funds. Mr. Annoni joined The Hartford in 2001.
| 35 |
| Hartford International Capital Appreciation Fund |
| Directors and Officers (Unaudited) – (continued) |
Michael R. Dressen (1963) AML Compliance Officer since 2011
Mr. Dressen currently serves as Assistant Vice President of HLIC. He also serves as Chief Compliance Officer and AML Compliance Officer of HASCO and as AML Officer of HFD. Mr. Dressen has served in various positions within The Hartford and its subsidiaries in connection with the operation of the Hartford Funds.
Edward P. Macdonald (1967) Vice President, Secretary and Chief Legal Officer since 2005
Mr. Macdonald currently serves as Assistant Secretary, Executive Vice President and Deputy General Counsel of HFD, HASCO, HFMC and HFMG. He also serves as Vice President of HLIC. Mr. Macdonald has served in various positions within The Hartford and its subsidiaries in connection with the operation of the Hartford Funds. Mr. Macdonald joined The Hartford in 2005.
Joseph G. Melcher (1973) Vice President and Chief Compliance Officer since 2013
Mr. Melcher currently serves as Executive Vice President of HFD, HFMG and HASCO. Mr. Melcher also currently serves as Executive Vice President and Chief Compliance Officer of HFMC. Mr. Melcher has served in various positions within The Hartford and its subsidiaries in connection with the operation of the Hartford Funds since joining The Hartford in 2012. Prior to joining The Hartford, Mr. Melcher worked at Touchstone Investments, a member of the Western & Southern Financial Group, where he held the position of Vice President and Chief Compliance Officer from 2010 through 2012 and Assistant Vice President, Compliance from 2005 to 2010.
Vernon J. Meyer (1964) Vice President since 2006
Mr. Meyer currently serves as Senior Vice President of HLIC. He also currently serves as Managing Director and Chief Investment Officer of HFMC and Managing Director of HFMG. Mr. Meyer has served in various positions within The Hartford and its subsidiaries in connection with the operation of the Hartford Funds. Mr. Meyer joined The Hartford in 2004.
Laura S. Quade (1969) Vice President since 2012
Ms. Quade currently serves as Vice President of HASCO, HFD and HFMG. She is the Head of Operations of HASCO and formerly served as Director, Enterprise Operations of HLIC. Ms. Quade has served in various positions within The Hartford and its subsidiaries in connection with the operation of the Hartford Funds. Ms. Quade joined The Hartford in 2001.
Martin A. Swanson** (1962) Vice President since 2010
Mr. Swanson currently serves as Vice President of HLIC. Mr. Swanson also serves as Managing Director, Chief Marketing Officer and Principal of HFD and Managing Director of HFMG. Mr. Swanson has served in various positions within The Hartford and its subsidiaries in connection with the operation of the Hartford Funds.
** Mr. Swanson resigned as an officer effective November 6, 2014.
HOW TO OBTAIN A COPY OF THE FUND’S PROXY VOTING POLICIES AND VOTING RECORDS (UNAUDITED)
A description of the policies and procedures that the Fund uses to determine how to vote proxies relating to portfolio securities and information about how the Fund voted proxies relating to portfolio securities during the most recent twelve-month period ended June 30 are available (1) without charge, upon request, by calling 888-843-7824 and (2) on the SEC’s website at http://www.sec.gov.
QUARTERLY PORTFOLIO HOLDINGS INFORMATION (UNAUDITED)
The Fund files a complete schedule of portfolio holdings with the SEC for the first and third quarters of each fiscal year on Form N-Q. The Fund’s Forms N-Q are available (1) without charge, upon request, by calling 888-843-7824 and (2) on the SEC’s website at http://www.sec.gov. The Form N-Q may be reviewed and copied at the SEC’s Public Reference Room in Washington, DC. Information on the operation of the Public Reference Room may be obtained by calling 1-800-SEC-0330.
| 36 |
| Hartford International Capital Appreciation Fund |
| Federal Tax Information (Unaudited) |
For the fiscal year ended October 31, 2014, there is no further federal tax information required for this Fund.
| 37 |
| Hartford International Capital Appreciation Fund |
| Expense Example (Unaudited) |
Your Fund's Expenses
As a shareholder of the Fund, you incur two types of costs: (1) transaction costs, including sales charges (loads) on purchase payments, if any, and contingent deferred sales charges (CDSC), if any, and (2) ongoing costs, including investment management fees, distribution and/or service (12b-1) fees, if any, and other fund expenses. This example is intended to help you understand your ongoing costs (in dollars) of investing in the Fund and to compare these costs with the ongoing costs of investing in other mutual funds. The example is based on an investment of $1,000 invested at the beginning of the period and held for the entire period of April 30, 2014 through October 31, 2014.
Actual Expenses
The first set of columns of the table below provides information about actual account values and actual expenses. You may use the information in this column, together with the amount you invested, to estimate the expenses that you paid over the period. Simply divide your account value by $1,000 (for example, an $8,600 account value divided by $1,000 = 8.6), then multiply the result by the number in the line under the heading entitled “Expenses Paid During Period” to estimate the expenses you paid on your account during this period.
Hypothetical Example for Comparison Purposes
The second set of columns of the table below provides information about hypothetical account values and hypothetical expenses based on the Fund's actual expense ratio and an assumed rate of return of 5% per year before expenses, which is not the Fund's actual return. The hypothetical account values and expenses may not be used to estimate the actual ending account balance or expenses you paid for the period. You may use this information to compare the ongoing costs of investing in the Fund and other funds. To do so, compare this 5% hypothetical example with the 5% hypothetical examples that appear in the shareholder reports of the other funds.
Please note that the expenses shown in the table are meant to highlight your ongoing costs only and do not reflect any transactional costs, such as sales charges (loads) and CDSC. Therefore, the second set of columns of the table is useful in comparing ongoing costs only, and will not help you determine the relative total costs of owning different funds. In addition, if these transactional costs were included, your costs would be higher. Expenses are equal to the Fund's annualized expense ratios multiplied by average account value over the period, multiplied by 184/365 (to reflect the one-half year period).
| Actual return | Hypothetical (5% return before expenses) | |||||||||||||||||||||||||||||||
| Beginning Account Value April 30, 2014 | Ending
Account Value October 31, 2014 | Expenses
paid during the period April 30, 2014 through October 31, 2014 | Beginning Account Value April 30, 2014 | Ending
Account Value October 31, 2014 | Expenses
paid during the period April 30, 2014 through October 31, 2014 | Annualized expense ratio | Days in the current 1/2 year | Days in the full year | ||||||||||||||||||||||||
| Class A | $ | 1,000.00 | $ | 966.90 | $ | 7.19 | $ | 1,000.00 | $ | 1,017.90 | $ | 7.37 | 1.45 | % | 184 | 365 | ||||||||||||||||
| Class B | $ | 1,000.00 | $ | 963.80 | $ | 10.58 | $ | 1,000.00 | $ | 1,014.43 | $ | 10.85 | 2.14 | 184 | 365 | |||||||||||||||||
| Class C | $ | 1,000.00 | $ | 962.70 | $ | 10.88 | $ | 1,000.00 | $ | 1,014.12 | $ | 11.17 | 2.20 | 184 | 365 | |||||||||||||||||
| Class I | $ | 1,000.00 | $ | 968.90 | $ | 5.21 | $ | 1,000.00 | $ | 1,019.91 | $ | 5.35 | 1.05 | 184 | 365 | |||||||||||||||||
| Class R3 | $ | 1,000.00 | $ | 964.90 | $ | 8.17 | $ | 1,000.00 | $ | 1,016.89 | $ | 8.39 | 1.65 | 184 | 365 | |||||||||||||||||
| Class R4 | $ | 1,000.00 | $ | 967.90 | $ | 6.69 | $ | 1,000.00 | $ | 1,018.40 | $ | 6.87 | 1.35 | 184 | 365 | |||||||||||||||||
| Class R5 | $ | 1,000.00 | $ | 968.90 | $ | 5.21 | $ | 1,000.00 | $ | 1,019.91 | $ | 5.34 | 1.05 | 184 | 365 | |||||||||||||||||
| Class Y | $ | 1,000.00 | $ | 968.90 | $ | 4.96 | $ | 1,000.00 | $ | 1,020.17 | $ | 5.09 | 1.00 | 184 | 365 | |||||||||||||||||
| 38 |
| Hartford International Capital Appreciation Fund |
| Approval of Investment Management and Investment Sub-Advisory Agreements (Unaudited) |
Section 15(c) of the Investment Company Act of 1940, as amended (the “1940 Act”), requires that each mutual fund’s board of directors, including a majority of those directors who are not “interested persons” of the mutual fund, as defined in the 1940 Act (the “Independent Directors”), annually review and consider the continuation of the mutual fund’s investment advisory and sub-advisory agreements. At its meeting held on August 5-6, 2014, the Board of Directors (the “Board”) of The Hartford Mutual Funds, Inc., including each of the Independent Directors, unanimously voted to approve the continuation of the investment management agreement for Hartford International Capital Appreciation Fund (the “Fund”) with Hartford Funds Management Company, LLC (“HFMC”) and the continuation of the investment sub-advisory agreement between HFMC and the Fund’s sub-adviser, Wellington Management Company, LLP (the “Sub-adviser,” and together with HFMC, the “Advisers”) (collectively, the “Agreements”).
In the months preceding the August 5-6, 2014 meeting, the Board requested, received and reviewed written responses from the Advisers to questions posed to them on behalf of the Independent Directors and supporting materials relating to those questions and responses. The Board considered information furnished to the Board at its meetings throughout the year, as well as information specifically prepared in connection with the annual approval of the Agreements at the Board’s meetings held on June 17-18, 2014 and August 5-6, 2014. Information provided to the Board at its meetings throughout the year included, among other things, reports on Fund performance, legal and compliance matters, sales and marketing activity, shareholder services, and the other services provided to the Fund by the Advisers and their affiliates. The Board also received in-person presentations by Fund officers and representatives of HFMC at the Board’s meetings on June 17-18, 2014 and August 5-6, 2014 concerning the Agreements.
The Independent Directors, advised by independent legal counsel, engaged service providers to assist them with evaluating the Agreements with respect to the Fund. Lipper Inc. (“Lipper”), an independent provider of investment company data, was retained to provide the Board with reports on how the Fund’s contractual management fees, actual management fees, other non-management fees, overall expense ratios and investment performance compared to those of mutual funds with similar investment objectives. The Independent Directors also engaged an independent financial services consultant (the “Consultant”) to assist them in evaluating the Fund’s management fees, sub-advisory fees, other non-management fees, overall expense ratios and investment performance. In addition, the Consultant reviewed the profitability calculations utilized by HFMC in connection with the continuation of the investment management agreement.
In determining whether to continue the Agreements for the Fund, the members of the Board reviewed and evaluated information and factors they believed to be relevant and appropriate in light of the information that the Board deemed necessary and appropriate through the exercise of its reasonable business judgment. While individual members of the Board may have weighed certain factors differently, the Board’s determination to continue the Agreements was based on a comprehensive consideration of all information provided to the Board throughout the year and specifically with respect to the continuation of the Agreements. A more detailed discussion of the factors the Board considered with respect to its approval of the Agreements is provided below.
Nature, Extent and Quality of Services Provided by the Advisers
The Board requested and considered information concerning the nature, extent and quality of the services provided to the Fund by the Advisers. The Board considered, among other things, the terms of the Agreements and the range of services provided by the Advisers. The Board considered the Advisers’ professional personnel who provide services to the Fund, including each Adviser’s ability and experience in attracting and retaining qualified personnel to service the Fund. The Board considered each Adviser’s reputation and overall financial strength, as well as its willingness to consider and implement organizational and operational changes designed to enhance services to the Hartford Funds. In addition, the Board considered the quality of each Adviser’s communications with the Board and responsiveness to Board inquiries and requests made from time to time with respect to the Fund and other Hartford Funds.
The Board also requested and evaluated information concerning each Adviser’s regulatory and compliance environment. In this regard, the Board requested and reviewed information on each Adviser’s compliance policies and procedures, compliance history, and a report from the Fund’s Chief Compliance Officer on each Adviser’s compliance with applicable laws and regulations, including responses to regulatory developments and compliance issues raised by regulators. The Board also noted the Advisers’ support of the Fund’s compliance control structure, particularly the resources devoted by the Advisers in support of the Fund’s obligations pursuant to Rule 38a-1 under the 1940 Act.
With respect to HFMC, the Board noted that, under the Agreements, HFMC is responsible for the management of the Fund, including oversight of fund operations and service providers, and provides administrative and investment advisory services in connection with selecting, monitoring and supervising the Sub-adviser. The Board considered HFMC’s ongoing monitoring of people, process and performance, including its quarterly reviews of each of the Hartford Funds, semi-annual meetings with the leaders of each Fund’s portfolio management team, and oversight of the Hartford Funds’ approximately 66 portfolio managers. The Board recognized that HFMC has demonstrated a record of making changes to the
| 39 |
| Hartford International Capital Appreciation Fund |
| Approval of Investment Management and Investment Sub-Advisory Agreements (Unaudited) – (continued) |
management and/or strategies of the Hartford Funds when warranted. The Board considered HFMC’s oversight of the Sub-adviser’s investment approach and results, process for monitoring best execution of portfolio trades by the Sub-adviser, and approach to risk management with respect to the Fund and the service providers to the Fund. The Board also considered HFMC’s oversight of compliance with the Fund’s objective and policies as well as with applicable laws and regulations, noting that regulatory and other developments had over time led to an increase in the scope of HFMC’s services in this regard.
In addition, the Board considered HFMC’s ongoing commitment to review and rationalize the Hartford Funds product line-up and the expenses that HFMC had incurred in connection with fund combinations in recent years. The Board considered that HFMC or its affiliates are responsible for providing the Fund’s officers.
With respect to the Sub-adviser, which provides certain day-to-day portfolio management services for the Fund, the Board considered the quality of the Fund’s portfolio managers, the Sub-adviser’s other investment personnel, its investment philosophy and process, investment research capabilities and resources, performance record, trade execution capabilities and experience. The Board considered the experience of the Fund’s portfolio managers, the number of accounts managed by the portfolio managers, and the Sub-adviser’s method for compensating the portfolio managers.
Based on these considerations, the Board concluded that it was satisfied with the nature, extent and quality of the services provided to the Fund by HFMC and the Sub-adviser.
Performance of the Fund and the Advisers
The Board considered the investment performance of the Fund. In this regard, the Board reviewed the performance of the Fund over different time periods presented in the materials and evaluated HFMC’s analysis of the Fund’s performance for these time periods. The Board considered information and materials provided to the Board by the Advisers concerning Fund performance, as well as information from Lipper comparing the investment performance of the Fund to an appropriate benchmark and universe of peer funds. The Board noted that the Fund’s performance was in the 3rd quintile of its performance universe for the 1-, 3- and 5-year periods. The Board also noted that the Fund’s performance was above its benchmark for the 1-, 3- and 5-year periods. The Board further noted recent changes to the Fund’s portfolio management team.
The Board considered the detailed investment analytics reports provided by Hartford Funds’ Investment Advisory Group throughout the year. These reports include, among other things, information on the Fund’s gross and net returns, the Fund’s investment performance relative to an appropriate benchmark and peer group, various statistics concerning the Fund’s portfolio, and a narrative summary of various factors affecting Fund performance. The Board considered the Advisers’ cooperation with the Investment Committee, which assists the Board in evaluating the performance of the Fund at periodic meetings throughout the year. The Board also considered the analysis provided by the Consultant relating to the Fund’s performance track record.
In light of all the considerations noted above, the Board concluded that it had continued confidence in HFMC’s and the Sub-adviser’s overall capabilities to manage the Fund.
Costs of the Services and Profitability of the Advisers
The Board reviewed information regarding HFMC’s cost to provide investment management and related services to the Fund and HFMC’s profitability, both overall and for the Fund, on a pre-tax basis without regard to distribution expenses. The Board also requested and reviewed information about the profitability to HFMC and its affiliates from all services provided to the Fund and all aspects of their relationship with the Fund. The Board also requested and received information relating to the operations and profitability of the Sub-adviser.
The Board considered the Consultant’s review of the profitability calculations used by HFMC in connection with the continuation of the investment management agreement, noting the Consultant’s view that Hartford Funds’ process for calculating and reporting Fund profitability is reasonable. In this regard, the Board noted that the Consultant performed a full review of this process in light of the recent restructuring of the Hartford Funds business and reported that the approach to analyzing Fund profitability, including the use of common expense allocation methodologies, is reasonable, sound and well within common industry practice.
Based on these considerations, the Board concluded that the profits anticipated to be realized by the Advisers and their affiliates from their relationships with the Fund would not be excessive.
| 40 |
| Hartford International Capital Appreciation Fund |
| Approval of Investment Management and Investment Sub-Advisory Agreements (Unaudited) – (continued) |
Comparison of Fees and Services Provided by the Advisers
The Board considered comparative information with respect to the management fees to be paid by the Fund to HFMC and the total expense ratios of the Fund. The Board also considered comparative information with respect to the sub-advisory fees to be paid by HFMC to the Sub-adviser. In this regard, the Board requested and reviewed information from HFMC and the Sub-adviser relating to the management and sub-advisory fees, including the sub-advisory fee schedule for the Fund, and total operating expenses for the Fund. With respect to the sub-advisory fee schedule, the Board considered representations from HFMC and the Sub-adviser that the Sub-adviser’s fees were negotiated at arm’s length on a fund-by-fund basis. The Board also reviewed information from Lipper comparing the Fund’s contractual management fees, actual management fees and overall expense ratios relative to a group of funds selected by Lipper, in consultation with the Consultant, and a broader universe of funds selected by Lipper. The Board considered that the Fund’s contractual management fee was in the 3rd quintile of its expense group, while its actual management fee was in the 1st quintile and its total expenses (less 12b-1 and shareholder service fees) were in the 2nd quintile. The Board noted that the Fund has an automatically renewable contractual expense cap on each share class. The expense cap resulted in reimbursement of certain expenses incurred in 2013.
While the Board recognized that comparisons between the Fund and peer funds may be imprecise, given the different service levels and characteristics of mutual funds and the different business models and cost structures of the Advisers, the comparative information provided by Lipper assisted the Board in evaluating the reasonableness of the Fund’s management and sub-advisory fees and total operating expenses. In addition, the Board considered the analysis and recommendations of the Consultant relating to the Fund’s management and sub-advisory fees and total operating expenses.
Based on these considerations, the Board concluded that the Fund’s fees and total operating expenses, in conjunction with the information about quality of services, profitability, economies of scale, and other matters discussed, were reasonable in light of the services provided.
Economies of Scale
The Board requested and considered information regarding the Advisers’ realization of economies of scale with respect to the Fund and whether the fee levels reflect these economies of scale for the benefit of the Fund’s shareholders. The Board reviewed the breakpoints in the management fee schedule for the Fund, which reduce fee rates as Fund assets grow over time. The Board recognized that a fund with assets beyond the highest breakpoint level will continue to benefit from economies of scale because additional assets are charged the lowest breakpoint fee resulting in lower overall effective management fee rates. The Board also considered that expense limitations and fee waivers that reduce the Fund’s expenses at all asset levels can have the same effect as breakpoints in sharing economies of scale with shareholders and provide protection from an increase in expenses if Fund assets decline. The Board recognized that a fee schedule that reaches a lower breakpoint quickly provides shareholders with the benefit of anticipated or potential economies of scale. The Board also considered that HFMC has been active in managing expenses, which has resulted in benefits being realized by shareholders as assets within the Hartford Funds family of funds have grown over time, including through lower transfer agent costs and other operating expenses.
The Board reviewed and evaluated materials from Lipper and the Consultant showing how management fee schedules of peer funds reflect economies of scale for the benefit of shareholders as a peer fund’s assets hypothetically increase over time. Based on information provided by HFMC, Lipper, and the Consultant, the Board recognized that there is no uniform methodology for establishing breakpoints or uniform pattern in asset levels that trigger breakpoints or the amounts of breakpoints triggered.
After considering all of the information available to it, the Board concluded that it was satisfied with the extent to which economies of scale would be shared for the benefit of the Fund’s shareholders based on currently available information and the effective advisory fees and expense ratios for the Fund at its current and reasonably anticipated asset levels. The Board noted, however, that it would continue to monitor future growth in Fund assets and the appropriateness of additional breakpoints.
Other Benefits
The Board considered other benefits to the Advisers and their affiliates from their relationships with the Fund.
The Board noted that HFMC receives fees for fund accounting and related services from the Fund, and the Board considered information on profits to HFMC for such services. The Board also considered that Hartford Administrative Services Company (“HASCO”), the Fund’s transfer agent and an affiliate of HFMC, receives transfer agency compensation from the Fund, and the Board reviewed information on the profitability of
| 41 |
| Hartford International Capital Appreciation Fund |
| Approval of Investment Management and Investment Sub-Advisory Agreements (Unaudited) – (continued) |
the Fund’s transfer agency function to HASCO. The Board considered information provided by HASCO indicating that the transfer agent fees charged by HASCO to the Fund were fair and reasonable based on publicly available information.
The Board also considered that Hartford Funds Distributors, LLC (“HFD”), an affiliate of HFMC, serves as principal underwriter of the Fund. As principal underwriter, HFD receives 12b-1 fees from the Fund and receives all or a portion of the sales charges on sales or redemptions of certain classes of shares. The Board also noted that certain affiliates of HFD distribute shares of the Fund and receive compensation in that connection.
The Board considered benefits to the Sub-adviser from its use of the Fund’s brokerage commissions to obtain soft dollar research, and representations from HFMC and the Sub-adviser that the Sub-adviser would not make any revenue-sharing payments or any other type of distribution payments to HFMC or its affiliates.
The Board considered the benefits to shareholders of being part of the Hartford Funds family of funds, including the right to exchange investments between the same class of funds without a sales charge, the ability to reinvest Fund dividends into other funds in the family, and the ability to combine holdings in the Fund with holdings in other funds to obtain a reduced sales charge. The Board considered HFMC’s efforts to provide investors in the family with a broad range of investment styles and asset classes and its entrepreneurial risk in initiating new funds to expand these opportunities for shareholders.
* * * *
Based upon its review of these various factors, among others, the Board concluded that it is in the best interests of the Fund and its shareholders for the Board to approve the Agreements for an additional year. In reaching this decision, the Board did not assign relative weights to the factors discussed above or deem any one or group of them to be controlling in and of themselves. In connection with their deliberations, the Independent Directors met separately in executive session on several occasions, with independent legal counsel and the Consultant, to review the relevant materials and consider their responsibilities under relevant laws and regulations.
| 42 |
| Hartford International Capital Appreciation Fund |
| Main Risks (Unaudited) |
The main risks of investing in the Fund are described below.
Market, Selection and Strategy Risk: The Fund’s share price may fluctuate due to market risk and/or security selections that may underperform the market or relevant benchmarks. If the sub-adviser's investment strategy does not perform as expected, the Fund could underperform its peers or lose money. There is no guarantee the Fund will achieve its stated objective.
Asset Allocation Strategy Risk: The portfolio managers' asset allocation strategy may not always work as intended, and asset allocation does not guarantee better performance or reduce the risk of investment loss. The investment styles employed by the portfolio managers may not be complimentary, which could adversely affect the performance of the Fund.
Small/Mid-Cap Stock Risk: Small- and mid-cap stocks are generally more volatile and risky and may be less liquid than large-cap stocks because they may have limited operating histories, narrow product lines, and focus on niche markets.
Foreign Investment and Emerging Markets Risk: Investments in foreign securities may be riskier than investments in U.S. securities. Potential risks include the risks of illiquidity, increased price volatility, less government regulation, less extensive and less frequent accounting and other reporting requirements, unfavorable changes in currency exchange rates, and economic and political disruptions. These risks are generally greater for investments in emerging markets.
Active Trading Risk: Actively trading investments may result in higher costs and higher taxable income.
| 43 |
THIS PRIVACY POLICY IS NOT PART OF THIS REPORT
Privacy Policy and Practices of The Hartford Financial Services Group, Inc. and its Affiliates
(herein called “we, our and us”)
This Privacy Policy applies to our United States Operations
|
We value your trust. We are committed to the responsible: a) management; b) use; and c) protection; of Personal Information.
This notice describes how we collect, disclose, and protect Personal Information.
We collect Personal Information to: a) service your Transactions with us; and b) support our business functions.
We may obtain Personal Information from: a) You; b) your Transactions with us; and c) third parties such as a consumer-reporting agency.
Based on the type of product or service You apply for or get from us, Personal Information such as: a) your name; b) your address; c) your income; d) your payment; or e) your credit history; may be gathered from sources such as applications, Transactions, and consumer reports.
To serve You and service our business, we may share certain Personal Information. We will share Personal Information, only as allowed by law, with affiliates such as: a) our insurance companies; b) our employee agents; c) our brokerage firms; and d) our administrators.
As allowed by law, we may share Personal Financial Information with our affiliates to: a) market our products; or b) market our services; to You without providing You with an option to prevent these disclosures.
|
We may also share Personal Information, only as allowed by law, with unaffiliated third parties including: a) independent agents; b) brokerage firms; c) insurance companies; d) administrators; and e) service providers; who help us serve You and service our business.
When allowed by law, we may share certain Personal Financial Information with other unaffiliated third parties who assist us by performing services or functions such as: a) taking surveys; b) marketing our products or services; or c) offering financial products or services under a joint agreement between us and one or more financial institutions.
We, and third parties we partner with, may track some of the pages You visit through the use of: a) cookies; b) pixel tagging; or c) other technologies; and currently do not process or comply with any web browser’s “do not track” signal or similar mechanism that indicates a request to disable online tracking of individual users who visit our websites or use our services.
We will not sell or share your Personal Financial Information with anyone for purposes unrelated to our business functions without offering You the opportunity to: a) “opt-out;” or b) “opt-in;” as required by law.
We only disclose Personal Health Information with: a) your proper written authorization; or b) as otherwise allowed or required by law.
Our employees have access to Personal Information in the course of doing their jobs, such as: a) underwriting policies; b) paying claims; c) developing new products; or d) advising customers of our products and services. |
|
We use manual and electronic security procedures to maintain: a) the confidentiality; and b) the integrity of; Personal Information that we have. We use these procedures to guard against unauthorized access.
Some techniques we use to protect Personal Information include: a) secured files; b) user authentication; c) encryption; d) firewall technology; and e) the use of detection software.
We are responsible for and must: a) identify information to be protected; b) provide an adequate level of protection for that data; c) grant access to protected data only to those people who must use it in the performance of their job-related duties.
Employees who violate our Privacy Policy will be subject to discipline, which may include ending their employment with us.
At the start of our business relationship, we will give You a copy of our current Privacy Policy.
We will also give You a copy of our current Privacy Policy once a year if You maintain a continuing business relationship with us.
We will continue to follow our Privacy Policy regarding Personal Information even when a business relationship no longer exists between us.
|
As used in this Privacy Notice:
Application means your request for our product or service.
Personal Financial Information means financial information such as: a) credit history; b) income; c) financial benefits; or d) policy or claim information.
Personal Health Information means health information such as: a) your medical records; or b) information about your illness, disability or injury.
Personal Information means information that identifies You personally and is not otherwise available to the public. It includes: a) Personal Financial Information; and b) Personal Health Information.
Transaction means your business dealings with us, such as: a) your Application; b) your request for us to pay a claim; and c) your request for us to take an action on your account.
You means an individual who has given us Personal Information in conjunction with: a) asking about; b) applying for; or c) obtaining; a financial product or service from us if the product or service is used mainly for personal, family, or household purposes. |
This Privacy Policy is being provided on behalf of the following affiliates of The Hartford Financial Services Group, Inc.:
1stAGChoice, Inc.; Access CoverageCorp, Inc.; Access CoverageCorp Technologies, Inc.; American Maturity Life Insurance Company; Archway 60 R, LLC; Business Management Group, Inc.; Champlain Life Reinsurance Company; DMS R, LLC; Eloy R, LLC; Ersatz Corporation; First State Insurance Company; Hartford Accident and Indemnity Company; Hartford Administrative Services Company; Hartford Casualty General Agency, Inc.; Hartford Casualty Insurance Company; Hartford-Comprehensive Employee Benefit Service Company; Hartford Equity Sales Company, Inc.; Hartford Fire General Agency, Inc.; Hartford Fire Insurance Company; Hartford Funds Management Company, LLC; Hartford Funds Management Group, Inc.; Hartford HLS Series Fund II, Inc.; Hartford Insurance Company of Illinois; Hartford Insurance Company of the Midwest; Hartford Insurance Company of the Southeast; Hartford Integrated Technologies, Inc.; Hartford International Life Reassurance Corporation; Hartford Funds Distributors, LLC; Hartford Investment Management Company; Hartford Life and Accident Insurance Company; Hartford Life and Annuity Insurance Company; Hartford Life Insurance Company; Hartford Life Private Placement, LLC; Hartford Lloyd’s Corporation; Hartford Lloyd’s Insurance Company; Hartford Mezzanine Investors I, LLC; Hartford Residual Market, L.C.C.; Hartford Retirement Services, LLC; Hartford Securities Distribution Company, Inc.; Hartford Series Fund, Inc.; Hartford Specialty Insurance Services of Texas, LLC; Hartford Strategic Investments, LLC; Hartford Underwriters Insurance Company; Hartford Technology Services Company, L.L.C.; Hartford of Texas General Agency, Inc.; Hartford Underwriters General Agency, Inc.; HARTRE Company, L.C.C.; HL Investment Advisors, LLC; HLA LLC; Horizon Management Group, LLC; HRA Brokerage Services, Inc.; Lanidex Class B, LLC; M-CAP Insurance Agency, LLC; New England Insurance Company; New England Reinsurance Corporation; Nutmeg Insurance Agency, Inc.; Nutmeg Insurance Company; Pacific Insurance Company, Limited; Planco, LLC: Property and Casualty Insurance Company of Hartford; Revere R, LLC; RVR R, LLC; Sentinel Insurance Company, Ltd.; Sunstone R, LLC; Symphony R, LLC; The Evergreen Group Incorporated; The Hartford Alternative Strategies Fund; The Hartford Mutual Funds, Inc.; The Hartford Mutual Funds II, Inc.; Trumbull Flood Management, L.L.C.; Trumbull Insurance Company; Twin City Fire Insurance Company; White River Life Reinsurance Company.
HPP Revised January 2014
HARTFORDFUNDS
hartfordfunds.com
This information is written in connection with the promotion or marketing of the matter(s) addressed in this material.
This report is submitted for the general information of the shareholders of the Fund. It is not authorized for distribution unless preceded or accompanied by a current prospectus for the Fund.
The information cannot be used or relied upon for the purpose of avoiding IRS penalties. These materials are not intended to provide tax, accounting or legal advice. As with all matters of a tax or legal nature, you should consult your own tax or legal counsel for advice.
Investors should carefully consider the investment objectives, risks, charges, and expenses of Hartford Funds before investing. This and other information can be found in the prospectus and summary prospectus, which can be obtained by calling 888-843-7824 (retail) or 800-279-1541 (institutional). Investors should read them carefully before they invest.
Hartford Funds are underwritten and distributed by Hartford Funds Distributors, LLC.
MFAR-ICA14 12/14 113969-3 Printed in U.S.A.
HARTFORDFUNDS
|
THE HARTFORD
2014 Annual Report |
A MESSAGE FROM THE PRESIDENT
Dear Fellow Shareholders:
Thank you for investing in Hartford Funds.
Market Review
U.S. equities (as represented by the S&P 500 Index) rose steadily for the fiscal year ended October 31, 2014, with a return of 17.27% for the period. With the exception of short-lived geopolitical scares early in 2014 and concerns about continuing global growth near the end of the period, stocks generally rose on solid fundamentals and encouraging macroeconomic data during the year.
September 2014 marked the six-year anniversary of the start of the financial crisis. Within weeks of that anniversary, both the S&P 500 Index and the Dow Jones Industrial Average set new all-time highs, closing at 2,018 and 17,391, respectively, on October 31. Although the fallout of the crisis continues to influence investor behavior, stocks have recovered and risen dramatically, up 198% from their low in March 2009. Meanwhile, the domestic economy is notching strong growth, and the unemployment rate has reached its lowest level since August 2008.
While the U.S. economy appears to have stabilized and to have reverted to a solid growth path, the outlook for the global economy appears to have gotten cloudier. The U.S. Federal Reserve has ended quantitative easing, while Europe and Japan are pursuing stimulus options to avoid a double-dip recession and deflation, respectively. Diverging central-bank policies will likely continue to play an important role in market movements going forward as investors wait to see the reactions to their efforts and their impacts on global markets.
How have market movements impacted your portfolio throughout the last year? Are your investments still on track to provide the growth or income you need, and are you comfortable with their progress during times of volatility?
Your financial professional can help you navigate today’s markets with confidence, as well as assist you to achieve your investment goals by providing advice on the best options within our fund family to help you work toward overcoming today’s investing challenges. Meet with your financial advisor regularly to examine your portfolio and your investment strategy, and to determine if you’re still on track to meet your goals.
Thank you again for investing with Hartford Funds.
James Davey
President
Hartford Funds
1 The S&P 500 Index is a market capitalization-weighted price index composed of 500 widely held common stocks.
2 The Dow Jones Industrial Average is an unmanaged, price-weighted index of 30 of the largest, most widely held stocks traded on the NYSE
The Hartford International Growth Fund
The views expressed in the Fund’s Manager Discussion under ‘‘Why did the Fund perform this way?’’ and ‘‘What is the outlook?’’ are views of the Fund’s sub-adviser and portfolio management team through the end of the period and are subject to change based on market and other conditions. The Fund’s Manager Discussion is for informational purposes only and does not represent an offer, recommendation or solicitation to buy, hold or sell any security. The specific securities identified and described, if any, do not represent all of the securities purchased or sold and you should not assume that investments in the securities identified and discussed will be profitable.
| The Hartford International Growth Fund inception 04/30/2001 |
| (sub-advised by Wellington Management Company, LLP) |
| Investment objective – The Fund seeks capital appreciation. |
Performance Overview 10/31/04 - 10/31/14
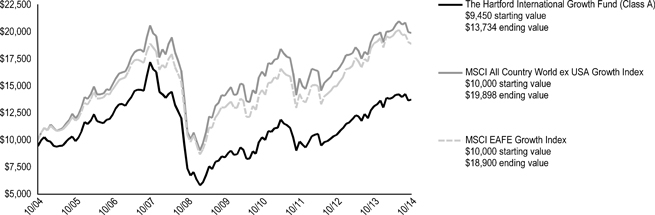
The chart above represents the hypothetical growth of a $10,000 investment in Class A, which includes a sales charge. Growth results in classes other than Class A will vary form what is seen above due to differences in the expenses charged to those share classes.
| Average Annual Total Returns (as of 10/31/14) |
| 1 Year | 5 Years | 10 Years | ||||||||||
| International Growth A# | 4.52 | % | 10.36 | % | 3.81 | % | ||||||
| International Growth A## | -1.23 | % | 9.12 | % | 3.22 | % | ||||||
| International Growth B# | 3.74 | % | 9.55 | % | 3.22 | %* | ||||||
| International Growth B## | -1.26 | % | 9.27 | % | 3.22 | %* | ||||||
| International Growth C# | 3.65 | % | 9.54 | % | 3.03 | % | ||||||
| International Growth C## | 2.65 | % | 9.54 | % | 3.03 | % | ||||||
| International Growth I# | 4.94 | % | 10.74 | % | 4.11 | % | ||||||
| International Growth R3# | 4.40 | % | 10.24 | % | 3.73 | % | ||||||
| International Growth R4# | 4.68 | % | 10.61 | % | 4.01 | % | ||||||
| International Growth R5# | 4.99 | % | 10.94 | % | 4.26 | % | ||||||
| International Growth Y# | 5.10 | % | 11.02 | % | 4.35 | % | ||||||
| MSCI All Country World ex USA Growth Index | 1.01 | % | 7.14 | % | 7.12 | % | ||||||
| MSCI EAFE Growth Index | -0.25 | % | 7.76 | % | 6.57 | % | ||||||
| # | Without sales charge |
| ## | With sales charge |
| * | Class B shares convert to Class A shares after 8 years. The return shown reflects the conversion to Class A shares, which had different operating expenses, for the period after conversion. |
PERFORMANCE DATA QUOTED REPRESENTS PAST PERFORMANCE AND DOES NOT GUARANTEE FUTURE RESULTS. The investment return and principal value of the investment will fluctuate so that investors’ shares, when redeemed, may be worth more or less than their original cost. Current performance may be lower or higher than the performance data quoted. To obtain performance data current to the most recent month-end, please visit our website www.hartfordfunds.com.
The initial investment in Class A shares reflects the maximum sales charge of 5.50% and returns for Class B shares reflect a contingent deferred sales charge of up to 5.00% and declining to zero, depending on the period of time the shares are held. Returns for Class C shares reflect a contingent deferred sales charge of up to 1.00% on shares redeemed within twelve months of purchase.
Total returns presented above were calculated using the Fund’s net asset value available to shareholders for sale or redemption of Fund shares on October 31, 2014, which may exclude investment transactions as of this date. All share class returns assume the reinvestment of all distributions at net asset value and the deduction of all fund expenses.
Effective 9/30/09, Class B shares of the Fund were closed to new investments.
Class I shares commenced operations on 8/31/06. Performance prior to that date is that of the Fund's Class A shares (excluding sales charges), which had different operating expenses. Class R3, R4 and R5 shares commenced operations on 12/22/06. Performance prior to that date is that of the Fund's Class Y shares which had different operating expenses.
MSCI All Country World ex USA Growth Index is a free float-adjusted market capitalization weighted index that is designed to measure the equity market performance of both developed and emerging stock markets, excluding the U.S., of the growth securities within the MSCI All Country World ex USA Index.
MSCI EAFE Growth Index is a free float-adjusted market capitalization index that is designed to measure developed market equity performance (excluding the U.S. and Canada) of the growth securities within the MSCI EAFE Index.
You cannot invest directly in an index.
The chart and table do not reflect the deductions of taxes that a shareholder would pay on Fund distributions or the redemption of Fund shares.
Performance information may reflect historical or current expense waivers/reimbursements from the investment adviser, without which performance would have been lower. For information on current expense waivers/reimbursements, please see the prospectus.
| 2 |
| The Hartford International Growth Fund |
| Manager Discussion |
| October 31, 2014 (Unaudited) |
| Operating Expenses* | ||||||||
| Net | Gross | |||||||
| International Growth Class A | 1.55 | % | 1.65 | % | ||||
| International Growth Class B | 2.30 | % | 2.66 | % | ||||
| International Growth Class C | 2.30 | % | 2.35 | % | ||||
| International Growth Class I | 1.24 | % | 1.24 | % | ||||
| International Growth Class R3 | 1.60 | % | 1.83 | % | ||||
| International Growth Class R4 | 1.30 | % | 1.45 | % | ||||
| International Growth Class R5 | 1.00 | % | 1.15 | % | ||||
| International Growth Class Y | 0.95 | % | 1.02 | % | ||||
| * |
As shown in the Fund's current prospectus dated March 1, 2014. Actual expenses may be higher or lower. Please see accompanying Financial Highlights for expense ratios for the year ended October 31, 2014. |
Gross expenses are the Fund's total annual operating expenses shown in the Fund's most recent prospectus. Net expenses are the Fund's total annual operating expenses shown in the Fund's most recent prospectus and reflect contractual expense reimbursements in instances when these reductions reduce the Fund's gross expenses. Contractual reimbursements remain in effect until February 28, 2015, and automatically renew for one-year terms unless terminated.
All investments are subject to risk including the possible loss of principal. For a discussion of the Fund’s risks, please see the Main Risks section of this report. For more detailed information on the risks associated with an investment in the Fund, please see the prospectus.
| Portfolio Managers | |
| Jean-Marc Berteaux | John A. Boselli, CFA |
| Senior Vice President and Equity Portfolio Manager | Senior Vice President and Equity Portfolio Manager |
How did the Fund perform?
The Class A shares of The Hartford International Growth Fund returned 4.52%, before sales charge, for the twelve-month period ended October 31, 2014, outperforming its benchmarks, the MSCI All Country World ex USA Growth Index and the MSCI EAFE Growth Index, which returned 1.01% and -0.25%, respectively, for the same period. The Fund outperformed the 0.35% average return of the International Multi-Cap Growth Funds peer group, a group of funds with investment strategies similar to those of the Fund.
Why did the Fund perform this way?
Global equities rose during the period, notwithstanding bouts of significant volatility. Despite ongoing geopolitical tensions in Ukraine and the Middle East, concerns about a Chinese economic growth slowdown, and unsettling economic and political developments in several other emerging market countries, the five-year-old bull market continued in the first half of 2014. Robust merger and acquisition activity, along with continued accommodative monetary policy from central banks around the globe, aided positive investor sentiment in May and June. However, Portuguese banking woes, European economic malaise, and the prospect of an accelerated U.S. Federal Reserve (Fed) interest-rate-hike timeline all contributed to stall the global stock rally near the tail end of the period. In addition, China's property slump and poor gross domestic product (GDP) readings in Japan and the eurozone raised the specter of a slowdown in global economic growth. Nevertheless, there were several positive developments, including monetary easing by the European Central Bank and the People's Bank of China, as well as an encouraging U.S. corporate earnings season. During the period, emerging market equities underperformed their developed market counterparts and U.S. stocks generally outperformed non-U.S. stocks.
Six of the ten sectors in the MSCI All Country World ex USA Growth Index rose during the period. Within the Index, the Healthcare (+16%), Information Technology (+7%), and Utilities (+4%) sectors gained the most during the period. Energy (-11%), Materials (-6%), and Industrials (-2%) lagged on a relative basis.
The Fund’s outperformance relative to the MSCI All Country World ex USA Growth Index was primarily the result of strong security selection. Positive stock selection within Healthcare, Information Technology, and Consumer Discretionary more than offset weak security selection within Energy and Industrials. Sector allocation, a residual of bottom-up stock selection, also contributed to benchmark-relative performance over the period. The Fund’s overweight exposure to the Healthcare sector and underweight exposure to the Energy sector contributed to relative results, while an underweight to the Consumer Staples sector and an overweight to the Consumer Discretionary sector detracted from relative returns over the period.
Ono Pharmaceutical (Healthcare), Ashtead Group (Industrials), and Teva Pharmaceutical Industries (Healthcare) were the top contributors to performance relative to the MSCI All Country World ex USA Growth Index during the period. Shares of Ono Pharmaceutical, a Japanese pharmaceutical company, performed well over the period due to reporting earnings that were above consensus, production growth, and rising cash flow margins. Ashtead Group, a UK-based equipment rental company that rents equipment for non-residential construction purposes in the U.S., contributed to relative returns as the company handily beat consensus earnings expectations due to improved capacity utilization and market share gains, which expanded margins. Shares of Teva Pharmaceutical Industries, an Israel-based global pharmaceutical company specializing in generic formulations, rose during the period due to the company receiving FDA approval for a version of Copaxone, a drug used to treat multiple sclerosis. Largan Precision (Information Technology) and WuXi Pharmatech
| 3 |
| The Hartford International Growth Fund |
| Manager Discussion – (continued) |
| October 31, 2014 (Unaudited) |
(Healthcare) contributed to relative performance during the period as well.
Top detractors from both absolute performance and performance relative to the MSCI All Country World ex USA Growth Index during the period were Vallourec (Industrials), Trican Well Service (Energy), and Renault (Consumer Discretionary). Shares of Vallourec, an industrial machinery company based in France that specializes in serving the energy and power generation market, underperformed after its largest single customer, Petrobras, changed its focus from exploration to production resulting in a significant destocking of Vallourec tubes. Shares of Trican Well Service, a Canada-based supplier of pressure-pumping services to the oil and gas industry, declined during the period despite beating consensus earnings and revenue estimates. The stock price fell along with the broader energy sector which performed poorly over the period. Shares of Renault, an automobile manufacturer based in France, fell as free cash flow results in the first half of 2014 disappointed and pricing was below estimates although the operating profit met expectations driven by cost savings.
Derivatives are not used in a significant manner in this Fund and did not have a material impact on performance during the period,
What is the outlook?
Geographically, at the end of the period the Fund remained overweight relative to the MSCI All Country World ex USA Growth Index in its exposure to Europe with the majority of our European stocks being domiciled in the U.K. We believe many companies have global end markets and/or benefit from secular growth trends, such as AstraZeneca (immuno-oncology) or the Fund’s U.K.-based tobacco companies, semi-conductor company ARM Holdings, and luxury clothing maker Burberry. Within emerging markets, Fund holdings were focused in Chinese and Taiwanese companies benefiting either from domestic or global growth trends, such as semiconductor company Taiwan Semi, internet company Tencent, AAC Technologies which makes miniature acoustic components for Apple products, or contract drug manufacturer WuXi Pharmatech. In Japan, we own shares of healthcare companies Ono Pharmaceutical and Astellas Pharma as well as global tiremaker Bridgestone that benefit from global secular trends, but the Fund remained underweight in its exposure to Japan overall at the end of the period.
We select stocks individually based on their merits. As a result of bottom-up stock selection, Healthcare was the Fund’s largest overweight exposure relative to the MSCI All Country World ex USA Growth Index at the end of the period. Other sectors where the Fund ended the period with weights above the MSCI All Country World ex USA Growth Index included Information Technology and Materials. The largest underweights relative to the above benchmark were the Consumer Staples, Energy, and Telecommunication Services sectors.
| Diversification by Sector | ||||
| as of October 31, 2014 | ||||
| Sector | Percentage of Net Assets | |||
| Equity Securities | ||||
| Consumer Discretionary | 16.2 | % | ||
| Consumer Staples | 6.2 | |||
| Energy | 1.5 | |||
| Financials | 13.5 | |||
| Health Care | 19.2 | |||
| Industrials | 15.2 | |||
| Information Technology | 16.0 | |||
| Materials | 9.2 | |||
| Utilities | 0.8 | |||
| Total | 97.8 | % | ||
| Short-Term Investments | 3.2 | |||
| Other Assets and Liabilities | (1.0 | ) | ||
| Total | 100.0 | % | ||
| A sector may be comprised of several industries. For Fund compliance purposes, the Fund may not use the same classification system and these sector classifications are used for reporting ease. |
| 4 |
| The Hartford International Growth Fund |
| Schedule of Investments |
| October 31, 2014 |
| (000’s Omitted) |
| Shares or Principal Amount | Market Value ╪ | |||||||
| Common Stocks - 97.8% | ||||||||
| Australia - 2.3% | ||||||||
| 1,016 | Alumina Ltd. ● | $ | 1,469 | |||||
| 79 | Seek Ltd. | 1,158 | ||||||
| 701 | Spotless Group Holdings Ltd. ● | 1,186 | ||||||
| 3,813 | ||||||||
| Belgium - 1.3% | ||||||||
| 19 | Anheuser-Busch InBev N.V. | 2,077 | ||||||
| Brazil - 1.4% | ||||||||
| 89 | BB Seguridade Participacoes | 1,189 | ||||||
| 153 | Kroton Educacional S.A. | 1,089 | ||||||
| 2,278 | ||||||||
| Canada - 7.6% | ||||||||
| 89 | Alimentation Couche-Tard, Inc. | 3,009 | ||||||
| 135 | CAE, Inc. | 1,733 | ||||||
| 14 | Magna International, Inc. | 1,347 | ||||||
| 65 | Methanex Corp. | 3,839 | ||||||
| 267 | Trican Well Service Ltd. | 2,395 | ||||||
| 12,323 | ||||||||
| China - 8.0% | ||||||||
| 6 | Baidu, Inc. ADR ● | 1,321 | ||||||
| 5,066 | Greatview Aseptic Packaging Co., Ltd. | 3,318 | ||||||
| 1,006 | Guangdong Investment Ltd. | 1,323 | ||||||
| 850 | Lenovo Group Ltd. | 1,253 | ||||||
| 698 | PICC Property and Casualty Co., Ltd. | 1,281 | ||||||
| 118 | WuXi PharmaTech Cayman, Inc. ● | 4,442 | ||||||
| 12,938 | ||||||||
| Denmark - 3.8% | ||||||||
| 93 | DSV AS | 2,784 | ||||||
| 44 | Novo Nordisk A/S | 1,980 | ||||||
| 16 | Pandora A/S | 1,384 | ||||||
| 6,148 | ||||||||
| Finland - 0.7% | ||||||||
| 25 | Sampo Oyj Class A | 1,207 | ||||||
| France - 8.9% | ||||||||
| 33 | Cie Generale d'Optique Essilor International S.A. | 3,675 | ||||||
| 80 | Edenred | 2,213 | ||||||
| 35 | Renault S.A. | 2,595 | ||||||
| 12 | Sanofi-Aventis S.A. | 1,046 | ||||||
| 22 | Valeo S.A. | 2,418 | ||||||
| 68 | Vallourec S.A. | 2,473 | ||||||
| 14,420 | ||||||||
| Germany - 3.2% | ||||||||
| 54 | Brenntag AG | 2,644 | ||||||
| 92 | Tom Tailor Holding AG ● | 1,289 | ||||||
| 31 | United Internet AG | 1,196 | ||||||
| 5,129 | ||||||||
| Hong Kong - 3.8% | ||||||||
| 214 | AAC Technologies Holdings, Inc. | 1,284 | ||||||
| 334 | AIA Group Ltd. | 1,865 | ||||||
| 341 | Samsonite International S.A. | 1,132 | ||||||
| 114 | Tencent Holdings Ltd. ● | 1,834 | ||||||
| 6,115 | ||||||||
| India - 2.1% | ||||||||
| 32 | HCL Technologies Ltd. | 837 | ||||||
| 89 | HDFC Bank Ltd. | 1,328 | ||||||
| 22 | ICICI Bank Ltd. | 1,264 | ||||||
| 3,429 | ||||||||
| Israel - 3.0% | ||||||||
| 17 | Check Point Software Technologies Ltd. ADR ● | 1,297 | ||||||
| 64 | Teva Pharmaceutical Industries Ltd. ADR | 3,638 | ||||||
| 4,935 | ||||||||
| Italy - 0.8% | ||||||||
| 189 | UniCredit S.p.A. | 1,368 | ||||||
| Japan - 9.7% | ||||||||
| 100 | Astellas Pharma, Inc. | 1,546 | ||||||
| 90 | Bridgestone Corp. ☼ | 3,019 | ||||||
| 11 | Daito Trust Construction Co., Ltd. | 1,358 | ||||||
| 635 | NEC Corp. ☼ | 2,245 | ||||||
| 46 | Ono Pharmaceutical Co., Ltd. ☼ | 4,618 | ||||||
| 803 | Taiheyo Cement Corp. ☼ | 2,948 | ||||||
| 15,734 | ||||||||
| Jersey - 1.2% | ||||||||
| 389 | Glencore plc | 1,994 | ||||||
| Malaysia - 2.0% | ||||||||
| 4,191 | AirAsia Berhad | 3,186 | ||||||
| Netherlands - 0.7% | ||||||||
| 11 | ASML Holding N.V. | 1,126 | ||||||
| Panama - 1.8% | ||||||||
| 25 | Copa Holdings S.A. Class A | 2,957 | ||||||
| Sweden - 2.6% | ||||||||
| 118 | Electrolux AB Series B | 3,347 | ||||||
| 74 | Skandinaviska Enskilda Banken Ab | 955 | ||||||
| 4,302 | ||||||||
| Switzerland - 6.3% | ||||||||
| 11 | Actelion Ltd. | 1,316 | ||||||
| 1 | Givaudan | 1,313 | ||||||
| 20 | Novartis AG | 1,869 | ||||||
| 5 | Partners Group | 1,240 | ||||||
| 11 | Roche Holding AG | 3,117 | ||||||
| 4 | Zurich Financial Services AG | 1,299 | ||||||
| 10,154 | ||||||||
| Taiwan - 5.6% | ||||||||
| 89 | Catcher Technology Co., Ltd. | 751 | ||||||
| 179 | Delta Electronics, Inc. | 1,074 | ||||||
| 17 | Largan Precision Co., Ltd. | 1,166 | ||||||
| 65 | MediaTek, Inc. | 929 | ||||||
| 1,174 | Taiwan Semiconductor Manufacturing Co., Ltd. | 5,090 | ||||||
| 9,010 | ||||||||
| United Kingdom - 17.4% | ||||||||
| 55 | Admiral Group plc | 1,170 | ||||||
| 198 | Arm Holdings plc | 2,797 | ||||||
| 136 | Ashtead Group plc | 2,271 | ||||||
| 18 | AstraZeneca plc | 1,303 | ||||||
| 108 | BAE Systems plc | 796 | ||||||
| 39 | British American Tobacco plc | 2,219 | ||||||
| 99 | British Sky Broadcasting Group plc ‡ | 1,400 | ||||||
| 138 | Burberry Group plc | 3,399 | ||||||
| 93 | Compass Group plc ● | 1,500 | ||||||
| 251 | Direct Line Insurance Group plc | 1,109 | ||||||
| 111 | IG Group Holdings plc | 1,067 | ||||||
| 28 | Imperial Tobacco Group plc | 1,224 | ||||||
| 12 | Next plc | 1,216 | ||||||
The accompanying notes are an integral part of these financial statements.
| 5 |
| The Hartford International Growth Fund |
| Schedule of Investments – (continued) |
| October 31, 2014 |
| (000’s Omitted) |
| Shares or Principal Amount | Market Value ╪ | |||||||||||
| Common Stocks - 97.8% - (continued) | ||||||||||||
| United Kingdom - 17.4% - (continued) | ||||||||||||
| 73 | Prudential plc | $ | 1,690 | |||||||||
| 19 | Reckitt Benckiser Group plc | 1,614 | ||||||||||
| 144 | Sage (The) Group plc | 875 | ||||||||||
| 84 | Smith & Nephew plc | 1,429 | ||||||||||
| 103 | St. James's Place Capital plc | 1,231 | ||||||||||
| 28,310 | ||||||||||||
| United States - 3.6% | ||||||||||||
| 17 | Amdocs Ltd. | 818 | ||||||||||
| 15 | Aon plc | 1,259 | ||||||||||
| 14 | Covidien plc | 1,264 | ||||||||||
| 24 | Sensata Technologies Holding N.V. ● | 1,187 | ||||||||||
| 13 | Wabco Holdings, Inc. ● | 1,240 | ||||||||||
| 5,768 | ||||||||||||
| Total Common Stocks | ||||||||||||
| (Cost $147,006) | $ | 158,721 | ||||||||||
| Total Long-Term Investments | ||||||||||||
| (Cost $147,006) | $ | 158,721 | ||||||||||
| Short-Term Investments - 3.2% | ||||||||||||
| Repurchase Agreements - 3.2% | ||||||||||||
| Bank of America Merrill Lynch TriParty Repurchase Agreement (maturing on 11/03/2014 in the amount of $15, collateralized by U.S. Treasury Note 1.50%, 2019, value of $15) | ||||||||||||
| $ | 15 | 0.08%, 10/31/2014 | $ | 15 | ||||||||
| Bank of America Merrill Lynch TriParty Repurchase Agreement (maturing on 11/03/2014 in the amount of $254, collateralized by GNMA 1.63% - 7.00%, 2031 - 2054, value of $259) | ||||||||||||
| 254 | 0.09%, 10/31/2014 | 254 | ||||||||||
| Bank of Montreal TriParty Repurchase Agreement (maturing on 11/03/2014 in the amount of $68, collateralized by U.S. Treasury Bond 2.88% - 5.25%, 2029 - 2043, U.S. Treasury Note 0.38% - 4.50%, 2015 - 2022, value of $70) | ||||||||||||
| 68 | 0.08%, 10/31/2014 | 68 | ||||||||||
| Bank of Montreal TriParty Repurchase Agreement (maturing on 11/03/2014 in the amount of $232, collateralized by FHLMC 2.00% - 5.50%, 2022 - 2034, FNMA 2.00% - 4.50%, 2024 - 2039, GNMA 3.00%, 2043, U.S. Treasury Note 4.63%, 2017, value of $236) | ||||||||||||
| 232 | 0.10%, 10/31/2014 | 232 | ||||||||||
| Barclays Capital TriParty Repurchase Agreement (maturing on 11/03/2014 in the amount of $872, collateralized by U.S. Treasury Bond 4.50% - 6.25%, 2023 - 2036, U.S. Treasury Note 1.63% - 2.13%, 2015 - 2019, value of $889) | ||||||||||||
| 872 | 0.08%, 10/31/2014 | 872 | ||||||||||
| Citigroup Global Markets, Inc. TriParty Repurchase Agreement (maturing on 11/03/2014 in the amount of $1,002, collateralized by U.S. Treasury Bill 0.02%, 2015, U.S. Treasury Bond 3.88% - 11.25%, 2015 - 2040, U.S. Treasury Note 2.00% - 3.38%, 2019 - 2021, value of $1,022) | ||||||||||||
| 1,002 | 0.09%, 10/31/2014 | 1,002 | ||||||||||
| Deutsche Bank Securities TriParty Repurchase Agreement (maturing on 11/03/2014 in the amount of $58, collateralized by U.S. Treasury Note 0.88%, 2017, value of $59) | ||||||||||||
| 58 | 0.13%, 10/31/2014 | 58 | ||||||||||
| RBS Securities, Inc. TriParty Repurchase Agreement (maturing on 11/03/2014 in the amount of $85, collateralized by U.S. Treasury Bond 3.63% - 5.00%, 2037 - 2043, U.S. Treasury Note 2.13%, 2020, value of $87) | ||||||||||||
| 85 | 0.07%, 10/31/2014 | 85 | ||||||||||
| Societe Generale TriParty Repurchase Agreement (maturing on 11/03/2014 in the amount of $897, collateralized by U.S. Treasury Bill 0.02%, 2015, U.S. Treasury Bond 3.75% - 11.25%, 2015 - 2043, U.S. Treasury Note 1.38% - 4.25%, 2015 - 2022, value of $915) | ||||||||||||
| 897 | 0.08%, 10/31/2014 | 897 | ||||||||||
| TD Securities TriParty Repurchase Agreement (maturing on 11/03/2014 in the amount of $1,739, collateralized by FHLMC 3.00% - 4.00%, 2026 - 2044, FNMA 2.50% - 5.00%, 2025 - 2044, U.S. Treasury Bond 3.50% - 6.50%, 2026 - 2041, U.S. Treasury Note 1.75% - 2.88%, 2018 - 2019, value of $1,773) | ||||||||||||
| 1,739 | 0.10%, 10/31/2014 | 1,739 | ||||||||||
| 5,222 | ||||||||||||
| Total Short-Term Investments | ||||||||||||
| (Cost $5,222) | $ | 5,222 | ||||||||||
| Total Investments | ||||||||||||
| (Cost $152,228) ▲ | 101.0 | % | $ | 163,943 | ||||||||
| Other Assets and Liabilities | (1.0 | )% | (1,630 | ) | ||||||||
| Total Net Assets | 100.0 | % | $ | 162,313 | ||||||||
The accompanying notes are an integral part of these financial statements.
| 6 |
| The Hartford International Growth Fund |
| Schedule of Investments – (continued) |
| October 31, 2014 |
| (000’s Omitted) |
| Note: | Percentage of investments as shown is the ratio of the total market value to total net assets. |
Prices of foreign equities that are principally traded on certain foreign markets may be adjusted daily pursuant to a fair value pricing service approved by the Board of Directors in order to reflect an adjustment for factors occurring after the close of certain foreign markets but before the close of the New York Stock Exchange.
Equity industry classifications used in this report are the Global Industry Classification Standard, which was developed by and is the exclusive property and service mark of MSCI, Inc. and Standard & Poor’s.
For Fund compliance purposes, the Fund may not use the same classification system shown in this report as these classifications are used for reporting ease.
| ▲ | At October 31, 2014, the cost of securities for federal income tax purposes was $152,603 and the aggregate gross unrealized appreciation and depreciation based on that cost were: |
| Unrealized Appreciation | $ | 17,878 | ||
| Unrealized Depreciation | (6,538 | ) | ||
| Net Unrealized Appreciation | $ | 11,340 |
| ● | Non-income producing. |
| ☼ | This security, or a portion of this security, was purchased on a when-issued or delayed-delivery basis. The cost of these securities was $528 at October 31, 2014. |
| ‡ | This security, or a portion of this security, has been segregated to cover funding requirements on investment transactions settling in the future. |
| Foreign Currency Contracts Outstanding at October 31, 2014 | ||||||||||||||||||||||
| Unrealized Appreciation/(Depreciation) | ||||||||||||||||||||||
| Currency | Buy / Sell | Delivery Date | Counterparty | Contract Amount | Market Value ╪ | Asset | Liability | |||||||||||||||
| AUD | Buy | 11/03/2014 | SSG | $ | 366 | $ | 362 | $ | – | $ | (4 | ) | ||||||||||
| AUD | Buy | 11/05/2014 | UBS | 276 | 276 | – | – | |||||||||||||||
| EUR | Buy | 11/04/2014 | WEST | 1,119 | 1,119 | – | – | |||||||||||||||
| HKD | Buy | 11/04/2014 | BCLY | 113 | 113 | – | – | |||||||||||||||
| HKD | Buy | 11/03/2014 | UBS | 41 | 41 | – | – | |||||||||||||||
| JPY | Buy | 11/04/2014 | SSG | 549 | 528 | – | (21 | ) | ||||||||||||||
| MYR | Buy | 11/03/2014 | JPM | 89 | 89 | – | – | |||||||||||||||
| Total | $ | – | $ | (25 | ) | |||||||||||||||||
| ╪ | See Significant Accounting Policies of accompanying Notes to Financial Statements regarding valuation of securities. |
| GLOSSARY: (abbreviations used in preceding Schedule of Investments) | |
| Counterparty Abbreviations: | |
| BCLY | Barclays |
| JPM | JP Morgan Chase & Co. |
| SSG | State Street Global Markets LLC |
| UBS | UBS AG |
| WEST | Westpac International |
| Currency Abbreviations: | |
| AUD | Australian Dollar |
| EUR | EURO |
| HKD | Hong Kong Dollar |
| JPY | Japanese Yen |
| MYR | Malaysian Ringgit |
| Other Abbreviations: | |
| ADR | American Depositary Receipt |
| FHLMC | Federal Home Loan Mortgage Corp. |
| FNMA | Federal National Mortgage Association |
| GNMA | Government National Mortgage Association |
The accompanying notes are an integral part of these financial statements.
| 7 |
| The Hartford International Growth Fund |
| Schedule of Investments – (continued) |
| October 31, 2014 |
| (000’s Omitted) |
| Investment Valuation Hierarchy Level Summary |
| October 31, 2014 |
| Total | Level 1 ♦ | Level 2 ♦ | Level 3 | |||||||||||||
| Assets: | ||||||||||||||||
| Common Stocks | ||||||||||||||||
| Australia | $ | 3,813 | $ | – | $ | 3,813 | $ | – | ||||||||
| Belgium | 2,077 | – | 2,077 | – | ||||||||||||
| Brazil | 2,278 | 2,278 | – | – | ||||||||||||
| Canada | 12,323 | 12,323 | – | – | ||||||||||||
| China | 12,938 | 9,081 | 3,857 | – | ||||||||||||
| Denmark | 6,148 | – | 6,148 | – | ||||||||||||
| Finland | 1,207 | – | 1,207 | – | ||||||||||||
| France | 14,420 | – | 14,420 | – | ||||||||||||
| Germany | 5,129 | – | 5,129 | – | ||||||||||||
| Hong Kong | 6,115 | – | 6,115 | – | ||||||||||||
| India | 3,429 | 1,264 | 2,165 | – | ||||||||||||
| Israel | 4,935 | 4,935 | – | – | ||||||||||||
| Italy | 1,368 | – | 1,368 | – | ||||||||||||
| Japan | 15,734 | – | 15,734 | – | ||||||||||||
| Jersey | 1,994 | – | 1,994 | – | ||||||||||||
| Malaysia | 3,186 | – | 3,186 | – | ||||||||||||
| Netherlands | 1,126 | – | 1,126 | – | ||||||||||||
| Panama | 2,957 | 2,957 | – | – | ||||||||||||
| Sweden | 4,302 | – | 4,302 | – | ||||||||||||
| Switzerland | 10,154 | – | 10,154 | – | ||||||||||||
| Taiwan | 9,010 | – | 9,010 | – | ||||||||||||
| United Kingdom | 28,310 | – | 28,310 | – | ||||||||||||
| United States | 5,768 | 5,768 | – | – | ||||||||||||
| Total | $ | 158,721 | $ | 38,606 | $ | 120,115 | $ | – | ||||||||
| Short-Term Investments | 5,222 | – | 5,222 | – | ||||||||||||
| Total | $ | 163,943 | $ | 38,606 | $ | 125,337 | $ | – | ||||||||
| Foreign Currency Contracts* | $ | – | $ | – | $ | – | $ | – | ||||||||
| Total | $ | – | $ | – | $ | – | $ | – | ||||||||
| Liabilities: | ||||||||||||||||
| Foreign Currency Contracts* | $ | 25 | $ | – | $ | 25 | $ | – | ||||||||
| Total | $ | 25 | $ | – | $ | 25 | $ | – | ||||||||
| ♦ | For the year ended October 31, 2014, investments valued at $2,505 were transferred from Level 1 to Level 2, and investments valued at $2,291 were transferred from Level 2 to Level 1. Investments are transferred between Level 1 and Level 2 for a variety of reasons including, but not limited to: | ||
| 1) | Foreign equities for which a fair value price is more representative of exit value than the local market close (transfer into Level 2). Foreign equities for which the local market close is more representative of exit value (transfer into Level 1). | ||
| 2) | U.S. Treasury securities that no longer represent the most recent issue (transfer into Level 2). | ||
| 3) | Equity investments with no observable trading but a bid or mean price is used (transfer into Level 2). Equity investments using observable quoted prices in an active market (transfer into Level 1). | ||
| * | Derivative instruments (excluding purchased and written options, if applicable) are valued at the unrealized appreciation/depreciation on the investments. |
| Note: | For purposes of reporting transfers between different hierarchy levels, both transfers in and out of each level, as applicable, are shown as if they occurred at the beginning of the period. |
The accompanying notes are an integral part of these financial statements.
| 8 |
| The Hartford International Growth Fund |
|
Statement of Assets and Liabilities |
| October 31, 2014 |
| (000’s Omitted) |
| Assets: | ||||
| Investments in securities, at market value (cost $152,228) | $ | 163,943 | ||
| Cash | 2 | |||
| Foreign currency on deposit with custodian (cost $—) | — | |||
| Unrealized appreciation on foreign currency contracts | — | |||
| Receivables: | ||||
| Investment securities sold | 1,656 | |||
| Fund shares sold | 231 | |||
| Dividends and interest | 317 | |||
| Other assets | 53 | |||
| Total assets | 166,202 | |||
| Liabilities: | ||||
| Unrealized depreciation on foreign currency contracts | 25 | |||
| Payables: | ||||
| Investment securities purchased | 3,608 | |||
| Fund shares redeemed | 160 | |||
| Investment management fees | 26 | |||
| Administrative fees | — | |||
| Distribution fees | 8 | |||
| Accrued expenses | 62 | |||
| Total liabilities | 3,889 | |||
| Net assets | $ | 162,313 | ||
| Summary of Net Assets: | ||||
| Capital stock and paid-in-capital | $ | 391,138 | ||
| Undistributed net investment income | 574 | |||
| Accumulated net realized loss | (241,096 | ) | ||
| Unrealized appreciation of investments and the translation of assets and liabilities denominated in foreign currency | 11,697 | |||
| Net assets | $ | 162,313 | ||
| Shares authorized | 500,000 | |||
| Par value | $ | 0.001 | ||
| Class A: Net asset value per share/Maximum offering price per share | $12.56/$13.29 | |||
| Shares outstanding | 7,781 | |||
| Net assets | $ | 97,732 | ||
| Class B: Net asset value per share | $ | 11.65 | ||
| Shares outstanding | 376 | |||
| Net assets | $ | 4,384 | ||
| Class C: Net asset value per share | $ | 11.63 | ||
| Shares outstanding | 1,116 | |||
| Net assets | $ | 12,978 | ||
| Class I: Net asset value per share | $ | 12.51 | ||
| Shares outstanding | 539 | |||
| Net assets | $ | 6,748 | ||
| Class R3: Net asset value per share | $ | 12.68 | ||
| Shares outstanding | 36 | |||
| Net assets | $ | 458 | ||
| Class R4: Net asset value per share | $ | 12.92 | ||
| Shares outstanding | 100 | |||
| Net assets | $ | 1,293 | ||
| Class R5: Net asset value per share | $ | 13.01 | ||
| Shares outstanding | 14 | |||
| Net assets | $ | 182 | ||
| Class Y: Net asset value per share | $ | 13.06 | ||
| Shares outstanding | 2,952 | |||
| Net assets | $ | 38,538 |
The accompanying notes are an integral part of these financial statements.
| 9 |
| The Hartford International Growth Fund |
| Statement of Operations |
|
For the Year Ended October 31, 2014 |
|
(000’s Omitted) |
| Investment Income: | ||||
| Dividends | $ | 3,125 | ||
| Interest | 2 | |||
| Less: Foreign tax withheld | (353 | ) | ||
| Total investment income | 2,774 | |||
| Expenses: | ||||
| Investment management fees | 1,161 | |||
| Administrative services fees | 3 | |||
| Class R3 | 1 | |||
| Class R4 | 2 | |||
| Class R5 | — | |||
| Transfer agent fees | 395 | |||
| Class A | 311 | |||
| Class B | 35 | |||
| Class C | 38 | |||
| Class I | 10 | |||
| Class R3 | 1 | |||
| Class R4 | — | |||
| Class R5 | — | |||
| Class Y | — | |||
| Distribution fees | ||||
| Class A | 242 | |||
| Class B | 56 | |||
| Class C | 133 | |||
| Class R3 | 2 | |||
| Class R4 | 3 | |||
| Custodian fees | 19 | |||
| Accounting services fees | 27 | |||
| Registration and filing fees | 106 | |||
| Board of Directors' fees | 4 | |||
| Audit fees | 23 | |||
| Other expenses | 42 | |||
| Total expenses (before waivers and fees paid indirectly) | 2,216 | |||
| Expense waivers | (80 | ) | ||
| Transfer agent fee waivers | (39 | ) | ||
| Commission recapture | (1 | ) | ||
| Custodian fee offset | — | |||
| Total waivers and fees paid indirectly | (120 | ) | ||
| Total expenses, net | 2,096 | |||
| Net Investment Income | 678 | |||
| Net Realized Gain on Investments and Foreign Currency Transactions: | ||||
| Net realized gain on investments | 15,066 | |||
| Net realized loss on foreign currency contracts | (115 | ) | ||
| Net realized gain on other foreign currency transactions | 30 | |||
| Net Realized Gain on Investments and Foreign Currency Transactions | 14,981 | |||
| Net Changes in Unrealized Depreciation of Investments and Foreign Currency Transactions: | ||||
| Net unrealized depreciation of investments | (10,504 | ) | ||
| Net unrealized depreciation of foreign currency contracts | (26 | ) | ||
| Net unrealized appreciation of translation of other assets and liabilities in foreign currencies | 6 | |||
| Net Changes in Unrealized Depreciation of Investments and Foreign Currency Transactions | (10,524 | ) | ||
| Net Gain on Investments and Foreign Currency Transactions | 4,457 | |||
| Net Increase in Net Assets Resulting from Operations | $ | 5,135 |
The accompanying notes are an integral part of these financial statements.
| 10 |
| The Hartford International Growth Fund |
| Statement of Changes in Net Assets |
| (000’s Omitted) |
| For the Year Ended October 31, 2014 | For the Year Ended October 31, 2013 | |||||||
| Operations: | ||||||||
| Net investment income | $ | 678 | $ | 938 | ||||
| Net realized gain on investments and foreign currency transactions | 14,981 | 15,645 | ||||||
| Net unrealized appreciation (depreciation) of investments and foreign currency transactions | (10,524 | ) | 9,919 | |||||
| Net Increase in Net Assets Resulting from Operations | 5,135 | 26,502 | ||||||
| Distributions to Shareholders: | ||||||||
| From net investment income | ||||||||
| Class A | (665 | ) | (713 | ) | ||||
| Class B | — | (3 | ) | |||||
| Class C | — | (20 | ) | |||||
| Class I | (56 | ) | (66 | ) | ||||
| Class R3 | (2 | ) | (5 | ) | ||||
| Class R4 | (9 | ) | (7 | ) | ||||
| Class R5 | (2 | ) | (2 | ) | ||||
| Class Y | (45 | ) | (40 | ) | ||||
| Total distributions | (779 | ) | (856 | ) | ||||
| Capital Share Transactions: | ||||||||
| Class A | 1,178 | (9,166 | ) | |||||
| Class B | (2,689 | ) | (3,914 | ) | ||||
| Class C | (723 | ) | (2,007 | ) | ||||
| Class I | 1,012 | (1,266 | ) | |||||
| Class R3 | (48 | ) | (360 | ) | ||||
| Class R4 | 337 | 21 | ||||||
| Class R5 | 25 | 6 | ||||||
| Class Y | 35,170 | 18 | ||||||
| Net increase (decrease) from capital share transactions | 34,262 | (16,668 | ) | |||||
| Net Increase in Net Assets | 38,618 | 8,978 | ||||||
| Net Assets: | ||||||||
| Beginning of period | 123,695 | 114,717 | ||||||
| End of period | $ | 162,313 | $ | 123,695 | ||||
| Undistributed (distributions in excess of) net investment income | $ | 574 | $ | 755 | ||||
The accompanying notes are an integral part of these financial statements.
| 11 |
| The Hartford International Growth Fund |
| Notes to Financial Statements |
| October 31, 2014 |
| (000’s Omitted) |
Organization:
The Hartford Mutual Funds, Inc. (“Company”) is an open-end management investment company comprised of forty-two portfolios. Financial statements for The Hartford International Growth Fund (the "Fund"), a series of the Company, are included in this report.
The Company is organized under the laws of the State of Maryland and is registered with the Securities and Exchange Commission (“SEC”) under the Investment Company Act of 1940, as amended (“1940 Act”). The Fund's portfolio managers are John A. Boselli (50%) and Jean-Marc Berteaux (50%). The Fund is a diversified open-end management investment company. The Fund is an investment company and applies specialized accounting and reporting under Accounting Standards Codification Topic 946, Financial Services - Investment Companies.
Class A shares are sold with a front-end sales charge of up to 5.50%. Class B shares were sold with a contingent deferred sales charge which is assessed on the lesser of the per share net asset value (“NAV”) of the shares at the time of redemption or the original purchase price, and declines from up to 5.00% to zero depending on the period of time the shares are held (see note below regarding the closing of Class B shares). Class C shares are sold with a contingent deferred sales charge of up to 1.00% on shares redeemed within twelve months of purchase. Class I shares are sold without sales charges to certain eligible investors primarily through advisory fee-based wrap programs. Class R3, R4 and R5 shares, which are offered to employer-sponsored retirement plans, and Class Y shares, which are sold to certain eligible institutional investors, are sold without a sales charge. All classes of shares have identical voting, redemption, dividend, liquidation and other rights and the same terms and conditions, with the exceptions that each class may have different expenses, which may affect performance, and that Class B shares automatically convert to Class A shares after 8 years.
No new or additional investments are allowed in Class B shares of the Fund (including investments through any systematic investment plan). Existing shareholders of Class B shares may continue to hold their Class B shares, exchange their Class B shares for Class B shares of another Hartford Fund (as permitted by existing exchange privileges), or redeem their Class B shares as described in the Fund’s prospectus. Reinstatement privileges with respect to Class B shares are set forth in the Fund's prospectus. For investors electing to reinvest capital gains and dividends, any such capital gains or dividends on Class B shares will continue to be reinvested in Class B shares of the Fund. All Class B share attributes, including the 12b-1 fee, contingent deferred sales charge schedule, and conversion to Class A shares, remain unchanged.
Significant Accounting Policies:
The following is a summary of significant accounting policies of the Fund in the preparation of its financial statements, which are in accordance with United States generally accepted accounting principles (“U.S. GAAP”). The preparation of financial statements in accordance with U.S. GAAP may require management to make estimates and assumptions that affect the reported amounts of assets and liabilities and disclosure of contingent assets and liabilities at the date of the financial statements and the reported amounts of increases and decreases in net assets from operations during the reporting period. Actual results could differ from those estimates.
Determination of Net Asset Value – The NAV of each class of the Fund's shares is determined as of the close of regular trading (normally 4:00 p.m. Eastern Time) (the “NYSE Close”) on each day that the New York Stock Exchange (the “Exchange”) is open (“Valuation Date”). Information that becomes known to the Fund after the NAV has been calculated on a particular day will not generally be used to retroactively adjust the NAV determined earlier that day.
Investment Valuation and Fair Value Measurements – For purposes of calculating the NAV, portfolio investments and other assets held by the Fund's portfolio for which market quotes are readily available are valued at market value. Market value is generally determined on the basis of last reported sales prices or official close price. If no sales are reported, market value is based on quotes obtained from a quotation reporting system, established market makers, or independent pricing services. If market prices are not readily available or are deemed unreliable, the Fund will use the fair value of the investment as determined in good faith under policies and procedures established by and under the supervision of the Company's Board of Directors. Market quotes are considered not readily available where there is an absence of current or reliable market-based data (e.g., trade information or indicative market quotes), including where events occur after the close of the relevant market, but prior to the NYSE Close, that materially affect the values of the Fund's portfolio investments or assets. In addition, market quotes are considered not readily available when, due to extraordinary circumstances, the exchanges or markets on which the investments trade do not open for trading for the entire day and
| 12 |
| The Hartford International Growth Fund |
| Notes to Financial Statements – (continued) |
| October 31, 2014 |
| (000’s Omitted) |
no other market prices are available. In addition, prices of foreign equities that are principally traded on certain foreign markets may be adjusted daily pursuant to a fair value pricing service approved by the Board of Directors in order to reflect an adjustment for the factors occurring after the close of certain foreign markets but before the NYSE Close. Investments that are primarily traded on foreign markets may trade on days that are not business days of the Fund. The value of the foreign investments in which the Fund invests may change on days when a shareholder will not be able to purchase or redeem shares of the Fund. Fair value pricing is subjective in nature and the use of fair value pricing by the Fund may cause the NAV of its shares to differ significantly from the NAV that would have been calculated using market prices at the close of the exchange on which a portfolio investment is primarily traded. There can be no assurance that the Fund could obtain the fair market value assigned to an investment if the Fund were to sell the investment at approximately the time at which the Fund determines its NAV.
Investments valued in currencies other than U.S. dollars are converted to U.S. dollars using exchange rates obtained from independent pricing services for calculation of the NAV. As a result, the NAV of the Fund’s shares may be affected by changes in the value of currencies in relation to the U.S. dollar. The value of investments traded in markets outside the United States or denominated in currencies other than the U.S. dollar may be affected significantly on a day that the NYSE is closed and the market value may change on days when an investor is not able to purchase, redeem or exchange shares of the Fund.
Foreign currency contracts represent agreements to exchange currencies on specific future dates at predetermined rates. Foreign currency contracts are valued using foreign currency exchange rates and forward rates as provided by an independent pricing service on the Valuation Date.
Financial instruments for which prices are not available from an independent pricing service may be valued using market quotations obtained from one or more dealers that make markets in the respective financial instrument in accordance with procedures established by the Company's Board of Directors.
U.S. GAAP defines fair value as the price that the Fund would receive to sell an asset or pay to transfer a liability in an orderly transaction between market participants. The U.S. GAAP fair value measurement standards require disclosure of a fair value hierarchy for each major category of assets and liabilities. Various inputs are used in determining the fair value of the Fund’s investments. These inputs are summarized into three broad hierarchy levels. This hierarchy is based on whether the valuation inputs are observable or unobservable. These levels are:
Level 1 – Quoted prices in active markets for identical investments. Level 1 may include exchange traded instruments, such as domestic equities, some foreign equities, options, futures, mutual funds, exchange traded funds, rights and warrants.
Level 2 – Observable inputs other than Level 1 prices, such as quoted prices for similar investments; quoted prices in markets that are not active; or other inputs that are observable or can be corroborated by observable market data. Level 2 may include debt investments that are traded less frequently than exchange traded instruments and which are valued using independent pricing services; foreign equities, which are principally traded on certain foreign markets and are adjusted daily pursuant to a fair value pricing service in order to reflect an adjustment for the factors occurring after the close of certain foreign markets but before the NYSE Close; senior floating rate interests, which are valued using an aggregate of dealer bids; short-term investments, which are valued at amortized cost; and swaps, which are valued based upon the terms of each swap contract.
Level 3 – Significant unobservable inputs that are supported by limited or no market activity. Level 3 may include financial instruments whose values are determined using indicative market quotes or require significant management judgment or estimation. These unobservable valuation inputs may include estimates for current yields, maturity/duration, prepayment speed, and indicative market quotes for comparable investments along with other assumptions relating to credit quality, collateral value, complexity of the investment structure, general market conditions and liquidity. This category may include investments where trading has been halted or there are certain restrictions on trading. While these investments are priced using unobservable inputs, the valuation of these investments reflects the best available data and management believes the prices are a reasonable representation of exit price.
The Board of Directors of the Company generally reviews and approves the “Procedures for Valuation of Portfolio Securities” at least once a year. These procedures define how investments are to be valued, including the formation and activities of a
| 13 |
| The Hartford International Growth Fund |
| Notes to Financial Statements – (continued) |
| October 31, 2014 |
| (000’s Omitted) |
Valuation Committee. The Valuation Committee is responsible for determining in good faith the fair value of investments when the value cannot be obtained from primary pricing services or alternative sources or if the valuation of an investment as provided by the primary pricing service or alternative source is believed not to reflect the investment’s fair value as of the Valuation Date. Voting members of the Valuation Committee include the Fund's Treasurer or designee and a Vice President of the investment manager or designee. An Assistant Vice President of the Fund with legal expertise or designee is also included on the Valuation Committee as a non-voting advisory member. In addition, the Fund’s Chief Compliance Officer shall designate a member of the compliance group to attend Valuation Committee meetings as a non-voting resource, to monitor for and provide guidance with respect to compliance with these procedures. Two members of the Valuation Committee or their designees, representing different departments, shall constitute a quorum for purposes of permitting the Valuation Committee to take action. The Valuation Committee will consider all relevant factors in determining an investment’s fair value, and may seek the advice of the Fund’s sub-adviser, knowledgeable brokers, and legal counsel in making such determination. The Valuation Committee reports to the Audit Committee of the Company's Board of Directors. The Audit Committee receives quarterly written reports which include details of all fair-valued investments, including the reason for the fair valuation, and an indication, when possible, of the accuracy of the valuation by disclosing the next available reliable public price quotation or the disposition price of such investments (the “look-back” test). The Board of Directors then must consider for ratification all of the fair value determinations made during the previous quarter.
Valuation levels are not necessarily indicative of the risk associated with investing in such investments. Individual investments within any of the above mentioned asset classes may be assigned a different hierarchical level than those presented above, as individual circumstances dictate.
For additional information, refer to the Investment Valuation Hierarchy Level Summary which follows the Schedule of Investments.
Investment Transactions and Investment Income – Investment transactions are recorded as of the trade date (the date the order to buy or sell is executed) for financial reporting purposes. Investments purchased or sold on a when-issued or delayed-delivery basis may be settled a month or more after the trade date. Realized gains and losses are determined on the basis of identified cost.
Dividend income from domestic securities is accrued on the ex-dividend date. In general, dividend income from foreign securities is recorded on the ex-date; however, dividend notifications in certain foreign jurisdictions may not be available in a timely manner and as a result, the Fund will record the dividend as soon as the relevant details (i.e., rate per share, payment date, shareholders of record, etc.) are publicly available. Interest income, including amortization of premium, accretion of discounts and additional principal received in-kind in lieu of cash, is accrued on a daily basis.
Foreign Currency Transactions – Assets and liabilities denominated in currencies other than U.S. dollars are translated into U.S. dollars at the exchange rates in effect on the valuation date. Purchases and sales of investments, income and expenses are translated into U.S. dollars at the exchange rates on the dates of such transactions.
The Fund does not isolate that portion of portfolio investment valuation resulting from fluctuations in the foreign currency exchange rates from the fluctuations arising from changes in the market prices of investments held. Exchange rate fluctuations are included with the net realized and unrealized gain or loss on investments in the accompanying financial statements.
Net realized foreign exchange gains or losses arise from sales of foreign currencies and the difference between asset and liability amounts initially stated in foreign currencies and the U.S. dollar value of the amounts actually received or paid. Net unrealized foreign exchange gains or losses arise from changes in the value of other assets and liabilities at the end of the reporting period, resulting from changes in the exchange rates.
Joint Trading Account – The Fund may invest cash balances into a joint trading account that may be invested in one or more repurchase agreements.
Fund Share Valuation and Dividend Distributions to Shareholders – Orders for the Fund’s shares are executed in accordance with the investment instructions of the shareholders. The NAV of the Fund’s shares is determined as of the close of business on each business day of the Exchange. The NAV is determined separately for each class of shares of the Fund by dividing the Fund’s net
| 14 |
| The Hartford International Growth Fund |
| Notes to Financial Statements – (continued) |
| October 31, 2014 |
| (000’s Omitted) |
assets attributable to that class by the number of shares of the class outstanding. Each class of shares offered by the Fund has equal rights as to assets and voting privileges (except that shareholders of a class have exclusive voting rights regarding any matter relating solely to that class of shares). Income and non-class specific expenses are allocated daily to each class on the basis of the relative net assets of the class. Realized and unrealized gains and losses are allocated daily based on the relative net assets of each class of shares of the Fund.
Orders for the purchase of the Fund’s shares received prior to the close of the Exchange on any day the Exchange is open for business are priced at the NAV determined as of the close of the Exchange. Orders received after the close of the Exchange, or on a day on which the Exchange and/or the Fund is not open for business, are priced at the next determined NAV.
Dividends are declared pursuant to a policy adopted by the Company's Board of Directors based upon the investment performance of the Fund. The policy of the Fund is to pay dividends from net investment income and realized gains, if any, at least once a year.
Net investment income, dividends and distributions from net realized gains and capital are determined in accordance with federal income tax regulations, which may differ from U.S. GAAP with respect to character and timing (see Federal Income Taxes: Distributions and Components of Distributable Earnings and Reclassification of Capital Accounts).
Securities and Other Investments:
Repurchase Agreements – A repurchase agreement is an agreement by which a counterparty agrees to sell an investment and agrees to repurchase the investment sold from the buyer at a mutually agreed upon time and price. During the period of the repurchase agreement, the counterparty will deposit cash and or securities in a third party custodial account to serve as collateral. At the time the Fund enters into a repurchase agreement, the value of the underlying collateral, including accrued interest, will be equal to or exceed the value of the repurchase agreement. Repurchase agreements expose the Fund to counterparty risk - that is, the risk that the counterparty will not fulfill its obligations. To minimize counterparty risk, the investments that serve to collateralize the repurchase agreement are held by the Fund’s custodian in book entry or physical form in the custodial account of the Fund or in a third party custodial account. Repurchase agreements are valued at cost plus accrued interest, which approximates fair value. Repurchase agreements have master netting arrangements which allow the Fund to offset amounts owed to a counterparty with amounts owed by the counterparty, including any collateral. Upon an event of default under a master repurchase agreement, the non-defaulting party may close out all transactions traded under such agreement and net amounts owed under each transaction to one net amount payable by one party to the other. Absent an event of default, the master repurchase agreement does not result in an offset of reported amounts of assets and liabilities in the Statement of Assets and Liabilities across transactions between the Fund and the applicable counterparty. The Fund, as shown on the Schedule of Investments, had outstanding repurchase agreements and related collateral as of October 31, 2014.
Investments Purchased on a When-Issued or Delayed-Delivery Basis – Delivery and payment for investments that have been purchased by the Fund on a forward commitment, or when-issued or delayed-delivery basis, take place beyond the customary settlement period. The Fund may dispose of or renegotiate a delayed-delivery transaction after it is entered into, and may sell delayed-delivery investments before they are delivered, which may result in a realized gain or loss. During this period, such investments are subject to market fluctuations, and the Fund identifies investments segregated in its records with a value at least equal to the amount of the commitment. The Fund, as shown on the Schedule of Investments, had when-issued or delayed-delivery investments as of October 31, 2014.
Financial Derivative Instruments:
The following disclosures contain information on how and why the Fund uses derivative instruments, the credit-risk-related contingent features in certain derivative instruments and how derivative instruments affect the Fund’s financial position and results of operations. The location and fair value amounts of these instruments on the Statement of Assets and Liabilities and the realized gains and losses and changes in unrealized gains and losses on the Statement of Operations, each categorized by type of derivative contract, are included in the following Additional Derivative Instrument Information footnote. The derivative instruments outstanding as of year-end are disclosed in the notes to the Schedule of Investments, if applicable. The amounts of realized gains and losses and changes in unrealized gains and losses on derivative instruments during the year are disclosed in the Statement of Operations.
| 15 |
| The Hartford International Growth Fund |
| Notes to Financial Statements – (continued) |
| October 31, 2014 |
| (000’s Omitted) |
Foreign Currency Contracts – The Fund may enter into foreign currency contracts that obligate the Fund to purchase or sell currencies at specified future dates. Foreign currency contracts are used to hedge the currency exposure associated with some or all of the Fund’s investments and/or as part of an investment strategy. Foreign currency contracts are marked to market daily and the change in value is recorded by the Fund as an unrealized gain or loss. The Fund will record a realized gain or loss when the foreign currency contract is settled.
Foreign currency contracts involve elements of market risk in excess of the amounts reflected in the Statement of Assets and Liabilities. In addition, risks may arise upon entering into these contracts from the potential inability of the counterparties to meet the terms of the contracts and from unanticipated movements in the value of the foreign currencies relative to the U.S. dollar. The Fund, as shown on the Schedule of Investments, had outstanding foreign currency contracts as of October 31, 2014.
Additional Derivative Instrument Information:
Fair Value of Derivative Instruments on the Statement of Assets and Liabilities as of October 31, 2014:
| Risk Exposure Category | ||||||||||||||||||||||||||||
| Interest
Rate Contracts | Foreign Exchange Contracts | Credit Contracts | Equity Contracts | Commodity Contracts | Other Contracts | Total | ||||||||||||||||||||||
| Assets: | ||||||||||||||||||||||||||||
| Unrealized appreciation on foreign currency contracts | $ | — | $ | — | $ | — | $ | — | $ | — | $ | — | $ | — | ||||||||||||||
| Total | $ | — | $ | — | $ | — | $ | — | $ | — | $ | — | $ | — | ||||||||||||||
| Liabilities: | ||||||||||||||||||||||||||||
| Unrealized depreciation on foreign currency contracts | $ | — | $ | 25 | $ | — | $ | — | $ | — | $ | — | $ | 25 | ||||||||||||||
| Total | $ | — | $ | 25 | $ | — | $ | — | $ | — | $ | — | $ | 25 | ||||||||||||||
The volume of derivatives that is presented in the Schedule of Investments is consistent with the derivative activity during the year ended October 31, 2014.
The Effect of Derivative Instruments on the Statement of Operations for the year ended October 31, 2014:
| Risk Exposure Category | ||||||||||||||||||||||||||||
| Interest
Rate Contracts | Foreign Exchange Contracts | Credit Contracts | Equity Contracts | Commodity Contracts | Other Contracts | Total | ||||||||||||||||||||||
| Realized Loss on Derivatives Recognized as a Result of Operations: | ||||||||||||||||||||||||||||
| Net realized loss on foreign currency contracts | $ | — | $ | (115 | ) | $ | — | $ | — | $ | — | $ | — | $ | (115 | ) | ||||||||||||
| Total | $ | — | $ | (115 | ) | $ | — | $ | — | $ | — | $ | — | $ | (115 | ) | ||||||||||||
| Net Change in Unrealized Appreciation (Depreciation) on Derivatives Recognized as a Result of Operations: | ||||||||||||||||||||||||||||
| Net change in unrealized depreciation of foreign currency contracts | $ | — | $ | (26 | ) | $ | — | $ | — | $ | — | $ | — | $ | (26 | ) | ||||||||||||
| Total | $ | — | $ | (26 | ) | $ | — | $ | — | $ | — | $ | — | $ | (26 | ) | ||||||||||||
The derivatives held by the Fund as of October 31, 2014 are not subject to a master netting arrangement; therefore, no balance sheet offsetting disclosure is presented.
Principal Risks:
The Fund may be exposed to counterparty risk, or the risk that an institution or other entity with which the Fund has unsettled or open transactions will default.
If the Fund invests directly in foreign currencies or in securities that trade in, and receive revenues in, foreign currencies, or in derivatives that provide exposure to foreign currencies, it will be subject to the risk that those currencies will decline in value relative to the base currency (U.S. dollars) of the Fund, or, in the case of hedging positions, that the Fund’s base currency will decline in value
| 16 |
| The Hartford International Growth Fund |
| Notes to Financial Statements – (continued) |
| October 31, 2014 |
| (000’s Omitted) |
relative to the currency being hedged. Currency rates in foreign countries may fluctuate significantly over short periods of time for a number of reasons, including changes in interest rates, intervention (or the failure to intervene) by U.S. or foreign governments, central banks or supranational entities, such as the International Monetary Fund, or by the imposition of currency controls or other political developments in the United States or abroad. As a result, the Fund’s investments in foreign currency denominated securities may reduce the returns of the Fund. The market values of equity securities, such as common stocks and preferred stocks, or equity related investments, such as futures and options, may decline due to general market conditions which are not specifically related to a particular company, such as real or perceived adverse economic conditions, changes in the general outlook for corporate earnings, changes in interest or currency rates or adverse investor sentiment generally. The market value of equity securities may also decline due to factors which affect a particular industry or industries, such as labor shortages or increased production costs and competitive conditions within an industry. Equity securities and equity related investments generally have greater market price volatility than fixed income securities.
Federal Income Taxes:
Federal Income Taxes – For federal income tax purposes, the Fund intends to continue to qualify as a Regulated Investment Company ("RIC") under Subchapter M of the Internal Revenue Code (“IRC”) by distributing substantially all of its taxable net investment income and net realized capital gains to its shareholders and otherwise complying with the requirements of the IRC. The Fund has distributed substantially all of its income and capital gains in prior years, if applicable, and intends to distribute substantially all of its income and capital gains during the calendar year ending December 31, 2014. Accordingly, no provision for federal income or excise taxes has been made in the accompanying financial statements. Distributions from short-term capital gains are treated as ordinary income distributions for federal income tax purposes.
Net Investment Income (Loss), Net Realized Gains (Losses) and Distributions – Net investment income (loss) and net realized gains (losses) may differ for financial statement and tax purposes primarily because of losses deferred due to wash sale adjustments, foreign currency gains and losses, adjustments related to Passive Foreign Investment Companies ("PFICs"), Real Estate Investment Trusts ("REITs"), RICs, certain derivatives and partnerships. The character of distributions made during the year from net investment income or net realized gains may differ from their ultimate characterization for federal income tax purposes. Also, due to the timing of dividend distributions, the fiscal year in which amounts are distributed may differ from the year that the income or realized gains (losses) were recorded by the Fund.
Distributions and Components of Distributable Earnings – The tax character of distributions paid by the Fund for the periods indicated is as follows (as adjusted for dividends payable, if applicable):
| For the Year Ended October 31, 2014 | For the Year Ended October 31, 2013 | |||||||
| Ordinary Income | $ | 779 | $ | 856 | ||||
As of October 31, 2014, the Fund’s components of distributable earnings (deficit) on a tax basis are as follows:
| Amount | ||||
| Undistributed Ordinary Income | $ | 590 | ||
| Accumulated Capital and Other Losses* | (240,737 | ) | ||
| Unrealized Appreciation† | 11,322 | |||
| Total Accumulated Deficit | $ | (228,825 | ) | |
| * | The Fund has capital loss carryforwards that are identified in the Capital Loss Carryforward note that follows. |
| † | Differences between book-basis and tax-basis unrealized appreciation (depreciation) may be attributable to the losses deferred due to wash sale adjustments, foreign currency gains and losses, adjustments related to PFICs, REITs, RICs, certain derivatives and partnerships. |
Reclassification of Capital Accounts – The Fund may record reclassifications in its capital accounts. These reclassifications have no impact on the total net assets of the Fund. The reclassifications are a result of permanent differences between U.S. GAAP and tax accounting for such items as foreign currency, PFICs, expiration or utilization of capital loss carryforwards or net operating losses.
| 17 |
| The Hartford International Growth Fund |
| Notes to Financial Statements – (continued) |
| October 31, 2014 |
| (000’s Omitted) |
Adjustments are made to reflect the impact these items have on current and future distributions to shareholders. Therefore, the source of the Fund’s distributions may be shown in the accompanying Statement of Changes in Net Assets as from undistributed net investment income, from accumulated net realized gains on investments or from capital depending on the type of book and tax differences that exist. For the year ended October 31, 2014, the Fund recorded reclassifications to increase (decrease) the accounts listed below:
| Amount | ||||
| Undistributed Net Investment Income (Loss) | $ | (80 | ) | |
| Accumulated Net Realized Gain (Loss) | 80 | |||
Capital Loss Carryforward – On December 22, 2010, the Regulated Investment Company Modernization Act of 2010 (the “Act”) was enacted, which made changes to the capital loss carryforward rules. The changes are effective for taxable years beginning after the date of enactment. Under the Act, funds are permitted to carry forward capital losses for an unlimited period. However, any losses incurred during those future taxable years will be required to be utilized prior to the losses incurred in pre-enactment taxable years, which carry an expiration date. As a result of this ordering rule, pre-enactment capital loss carryforwards may be more likely to expire unused. Additionally, post-enactment capital loss carryforwards retain their character as either short-term or long-term capital losses rather than being considered all short-term as permitted under prior regulation.
At October 31, 2014 (tax year end), the Fund had capital loss carryforwards for U.S. federal income tax purposes as follows:
| Year of Expiration | Amount | |||
| 2016 | $ | 130,192 | ||
| 2017 | 110,545 | |||
| Total | $ | 240,737 | ||
During the year ended October 31, 2014, the Fund utilized $15,344 of prior year capital loss carryforwards.
Accounting for Uncertainty in Income Taxes – The Fund has adopted financial reporting rules that require the Fund to analyze all open tax years, as defined by the statute of limitations, for all major jurisdictions. Generally, tax authorities can examine all tax returns filed for the last three years. The Fund does not have an examination in progress.
The Fund has reviewed all open tax years and major jurisdictions and concluded that these financial reporting rules had no effect on the Fund’s financial position or results of operations. There is no tax liability resulting from unrecognized tax benefits relating to uncertain income tax positions taken or expected to be taken on the tax return for the fiscal year ended October 31, 2014. The Fund is also not aware of any tax positions for which it is reasonably possible that the total amounts of unrecognized tax benefits will significantly change in the next twelve months.
Expenses:
Investment Management Agreement – Hartford Funds Management Company, LLC ("HFMC") serves as the Fund’s investment manager pursuant to an Investment Management Agreement with the Company. HFMC is an indirect wholly owned subsidiary of The Hartford Financial Services Group, Inc. ("The Hartford"). The investment manager has overall investment supervisory responsibility for the Fund. In addition, the investment manager provides administrative personnel, services, equipment, facilities and office space for proper operation of the Fund. HFMC has contracted with Wellington Management Company, LLP ("Wellington Management") under a sub-advisory agreement for the provision of day-to-day investment management services to the Fund in accordance with the Fund’s investment objective and policies. The Fund pays a fee to the investment manager, a portion of which may be used to compensate Wellington Management.
| 18 |
| The Hartford International Growth Fund |
| Notes to Financial Statements – (continued) |
| October 31, 2014 |
| (000’s Omitted) |
The schedule below reflects the rates of compensation paid to the investment manager for investment management services rendered as of October 31, 2014; the rates are accrued daily and paid monthly:
| Average Daily Net Assets | Annual Fee |
| On first $500 million | 0.8500% |
| On next $500 million | 0.8000% |
| On next $4 billion | 0.7500% |
| On next $5 billion | 0.7475% |
| Over $10 billion | 0.7450% |
Accounting Services Agreement – Pursuant to the Fund Accounting Agreement between HFMC and the Company, on behalf of the Fund, HFMC provides accounting services to the Fund and receives monthly compensation based on the Fund’s average daily net assets at the rates set forth below. The Fund’s accounting services fees are accrued daily and paid monthly.
| Average Daily Net Assets | Annual Fee |
| On first $5 billion | 0.020% |
| On next $5 billion | 0.015% |
| Over $10 billion | 0.010% |
Operating Expenses – Allocable expenses incurred by the Company are allocated to each Fund and allocated to classes within the Fund in proportion to the average daily net assets of the Fund and each class, except where allocation of certain expenses is more fairly made directly to the Fund or to specific classes within a Fund. As of October 31, 2014, HFMC contractually limited the total operating expenses of this Fund, exclusive of taxes, interest expense, brokerage commissions, acquired fund fees and expenses and extraordinary expenses, through February 28, 2015 as follows:
| Class A | Class B | Class C | Class I | Class R3 | Class R4 | Class R5 | Class Y |
| 1.55% | 2.30% | 2.30% | 1.30% | 1.60% | 1.30% | 1.00% | 0.95% |
Fees Paid Indirectly – The Fund has entered into agreements with State Street Global Markets, LLC and Russell Implementation Services, Inc. to partially recapture non-discounted trade commissions. Such rebates are used to pay a portion of the Fund’s expenses. In addition, the Fund's custodian bank has agreed to reduce its fees when the Fund maintains cash on deposit in a non-interest-bearing custody account. For the year ended October 31, 2014, these amounts, if any, are included in the Statement of Operations.
The ratio of expenses to average net assets in the accompanying financial highlights excludes the reduction in expenses related to fees paid indirectly. The annualized expense ratio after waivers for the period listed below reflecting the reduction for fees paid indirectly is as follows:
| Year Ended October 31, 2014 | ||||
| Class A | 1.50 | % | ||
| Class B | 2.25 | |||
| Class C | 2.24 | |||
| Class I | 1.12 | |||
| Class R3 | 1.60 | |||
| Class R4 | 1.30 | |||
| Class R5 | 1.00 | |||
| Class Y | 0.95 | |||
| 19 |
| The Hartford International Growth Fund |
Notes to Financial Statements – (continued)
October 31, 2014
(000’s Omitted)
Distribution and Service Plan for Class A, B, C, R3 and R4 Shares – Hartford Funds Distributors, LLC ("HFD"), an indirect wholly owned subsidiary of The Hartford, is the principal underwriter and distributor of the Fund. HFD is engaged in distribution activities, which include marketing and distribution of shares through broker/dealers, financing distribution costs and maintaining financial books and records. For the year ended October 31, 2014, HFD received front-end load sales charges of $283 and contingent deferred sales charges of an amount which rounds to zero from the Fund.
The Fund has adopted a Distribution and Service Plan in accordance with Rule 12b-1 of the 1940 Act to compensate the distributor (HFD) for activities intended to result in the sale and distribution of Class A, B, C, R3 and R4 shares and for providing services for shareholders. The Rule 12b-1 plan applicable to Class A shares of the Fund provides for payment of a Rule 12b-1 fee of 0.25% of average daily net assets. Some or all of the fee may be used for shareholder servicing expenses with the remainder used for distribution expenses. Under the Class B Plan, the Fund pays the distributor 1.00% of the average daily net assets of Class B shares that are outstanding for 8 years or less, 0.25% of which is a fee for services provided to existing shareholders with the remainder used for distribution expenses. Some or the entire Rule 12b-1 fee for Class B shares may be remitted to broker/dealers for distribution and/or shareholder account services. After eight years, Class B shares convert to Class A shares. Upon conversion to Class A shares, the Class A plan described above will apply to those shares. Under the Class C Plan, the Fund pays the distributor 1.00% of the average daily net assets of Class C shares outstanding, 0.25% of which is intended as a fee for services provided to existing shareholders with the remainder used for distribution expenses. For Class C shares, some or the entire fee may be remitted to broker/dealers for distribution and/or shareholder account services. Class R3 shares have a distribution fee of 0.50% of average daily net assets and Class R4 shares have a distribution fee of 0.25% of average daily net assets. For Class R3 and R4 shares, some or the entire fee may be remitted to broker/dealers for distribution and/or shareholder account services. The Fund’s 12b-1 fees are accrued daily and paid monthly or at such other intervals as the Board of Directors may determine.
Other Related Party Transactions – Certain officers of the Fund are directors and/or officers of HFMC and/or The Hartford or its subsidiaries. For the year ended October 31, 2014, a portion of the Fund’s Chief Compliance Officer’s compensation was paid by all of the investment companies in the Hartford fund complex. The portion allocated to the Fund, as represented in other expenses on the Statement of Operations, rounds to zero. Hartford Administrative Services Company (“HASCO”), an indirect wholly-owned subsidiary of The Hartford, provides transfer agent services to the Fund. HASCO has contractually agreed to reimburse any portion of the transfer agency fees over 0.30% of average daily net assets per fiscal year for each class. Any transfer agency fee reimbursement is determined before considering the contractual operating expense limitation. For providing such services, HASCO is compensated on a per account basis that varies by account type, except with respect to Class Y, for which it is compensated based on average daily net assets. The amount paid to HASCO and any related contractual reimbursement amounts, if applicable, can be found in the Statement of Operations. These fees are accrued daily and paid monthly.
Administrative services fees are paid to HASCO for third-party recordkeeping services that are payable as a percentage of net assets in the amount of up to 0.20%, 0.15% and 0.10% for Classes R3, R4 and R5 shares, respectively. The total administrative services fees are shown on the Statement of Operations. These fees are accrued daily and paid monthly.
| 20 |
| The Hartford International Growth Fund |
Notes to Financial Statements – (continued)
October 31, 2014
(000’s Omitted)
Affiliate Holdings:
As of October 31, 2014, affiliates of The Hartford had ownership of shares in the Fund as follows:
| Percentage of Class | Percentage of Fund |
||||||
| Class R5 | 83 | % | — | %* | |||
As of October 31, 2014, the Fund's shares were owned in aggregate by affiliated fund of funds. Therefore, the Fund may experience relatively large purchases or redemptions of its shares from these affiliated fund of funds. Affiliated fund of funds owned shares in the Fund as follows:
| Percentage of Fund | ||||
| Class Y | 16 | % | ||
| * | Percentage rounds to zero. |
Investment Transactions:
For the year ended October 31, 2014, the cost of purchases and proceeds from sales of investment securities (excluding short-term investments) were as follows:
| Excluding U.S. Government Obligations | U.S. Government Obligations | Total | ||||||||||
| Cost of Purchases | $ | 145,744 | $ | — | $ | 145,744 | ||||||
| Sales Proceeds | 114,205 | — | 114,205 | |||||||||
| 21 |
| The Hartford International Growth Fund |
Notes to Financial Statements – (continued)
October 31, 2014
(000’s Omitted)
Capital Share Transactions:
The following information is for the year ended October 31, 2014, and the year ended October 31, 2013:
| For the Year Ended October 31, 2014 | For the Year Ended October 31, 2013 | |||||||||||||||||||||||||||||||
| Shares Sold | Shares Issued for Reinvested Dividends | Shares Redeemed | Net Increase (Decrease) of Shares | Shares Sold | Shares Issued for Reinvested Dividends | Shares Redeemed | Net Increase (Decrease) of Shares | |||||||||||||||||||||||||
| Class A | ||||||||||||||||||||||||||||||||
| Shares | 1,226 | 53 | (1,185 | ) | 94 | 823 | 69 | (1,750 | ) | (858 | ) | |||||||||||||||||||||
| Amount | $ | 15,404 | $ | 658 | $ | (14,884 | ) | $ | 1,178 | $ | 9,072 | $ | 704 | $ | (18,942 | ) | $ | (9,166 | ) | |||||||||||||
| Class B | ||||||||||||||||||||||||||||||||
| Shares | 6 | — | (237 | ) | (231 | ) | 10 | — | (395 | ) | (385 | ) | ||||||||||||||||||||
| Amount | $ | 70 | $ | — | $ | (2,759 | ) | $ | (2,689 | ) | $ | 101 | $ | 3 | $ | (4,018 | ) | $ | (3,914 | ) | ||||||||||||
| Class C | ||||||||||||||||||||||||||||||||
| Shares | 112 | — | (174 | ) | (62 | ) | 72 | 2 | (275 | ) | (201 | ) | ||||||||||||||||||||
| Amount | $ | 1,302 | $ | — | $ | (2,025 | ) | $ | (723 | ) | $ | 746 | $ | 20 | $ | (2,773 | ) | $ | (2,007 | ) | ||||||||||||
| Class I | ||||||||||||||||||||||||||||||||
| Shares | 171 | 4 | (97 | ) | 78 | 47 | 6 | (168 | ) | (115 | ) | |||||||||||||||||||||
| Amount | $ | 2,145 | $ | 51 | $ | (1,184 | ) | $ | 1,012 | $ | 513 | $ | 59 | $ | (1,838 | ) | $ | (1,266 | ) | |||||||||||||
| Class R3 | ||||||||||||||||||||||||||||||||
| Shares | 9 | — | (13 | ) | (4 | ) | 13 | 1 | (45 | ) | (31 | ) | ||||||||||||||||||||
| Amount | $ | 116 | $ | 2 | $ | (166 | ) | $ | (48 | ) | $ | 141 | $ | 5 | $ | (506 | ) | $ | (360 | ) | ||||||||||||
| Class R4 | ||||||||||||||||||||||||||||||||
| Shares | 30 | 1 | (4 | ) | 27 | 14 | 1 | (14 | ) | 1 | ||||||||||||||||||||||
| Amount | $ | 376 | $ | 9 | $ | (48 | ) | $ | 337 | $ | 161 | $ | 7 | $ | (147 | ) | $ | 21 | ||||||||||||||
| Class R5 | ||||||||||||||||||||||||||||||||
| Shares | 2 | — | — | 2 | — | — | — | — | ||||||||||||||||||||||||
| Amount | $ | 25 | $ | 2 | $ | (2 | ) | $ | 25 | $ | 5 | $ | 1 | $ | — | $ | 6 | |||||||||||||||
| Class Y | ||||||||||||||||||||||||||||||||
| Shares | 3,600 | 3 | (931 | ) | 2,672 | 45 | 3 | (48 | ) | — | ||||||||||||||||||||||
| Amount | $ | 47,612 | $ | 45 | $ | (12,487 | ) | $ | 35,170 | $ | 518 | $ | 40 | $ | (540 | ) | $ | 18 | ||||||||||||||
| Total | ||||||||||||||||||||||||||||||||
| Shares | 5,156 | 61 | (2,641 | ) | 2,576 | 1,024 | 82 | (2,695 | ) | (1,589 | ) | |||||||||||||||||||||
| Amount | $ | 67,050 | $ | 767 | $ | (33,555 | ) | $ | 34,262 | $ | 11,257 | $ | 839 | $ | (28,764 | ) | $ | (16,668 | ) | |||||||||||||
The following reflects the conversion of Class B shares into Class A shares (reflected as Class A shares sold) for the year ended October 31, 2014, and the year ended October 31, 2013:
| Shares | Dollars | |||||||
| For the Year Ended October 31, 2014 | 54 | $ | 672 | |||||
| For the Year Ended October 31, 2013 | 78 | $ | 862 | |||||
Line of Credit:
The Fund is one of several Hartford Funds that participate in a $500 million committed revolving line of credit facility. The facility is to be used for temporary or emergency purposes. Under the arrangement, the funds are required to own securities having a market value in excess of 300% of the total bank borrowings. The interest rate on borrowings varies depending on the nature of the loan. The facility also requires a fee to be paid based on the amount of the commitment. This commitment fee is allocated to all the funds participating in the line of credit based on the average net assets of the funds. During the year ended October 31, 2014, the Fund did not have any borrowings under this facility.
Pending Legal Proceedings:
On February 25, 2011, Jennifer L. Kasilag, Louis Mellinger, Judith M. Menendez, Jacqueline M. Robinson, and Linda A. Russell filed a derivative lawsuit against Hartford Investment Financial Services, LLC (“HIFSCO”) (now known as HFD) on behalf of six Hartford retail mutual funds in the United States District Court for the District of New Jersey, alleging that HIFSCO received excessive advisory and distribution fees in violation of its statutory fiduciary duty under Section 36(b) of the 1940 Act when serving as investment manager and principal underwriter, respectively, to the Hartford retail mutual funds. Although this action was purportedly filed on behalf of certain of the
| 22 |
| The Hartford International Growth Fund |
Notes to Financial Statements – (continued)
October 31, 2014
(000’s Omitted)
Hartford Funds, none of the Hartford Funds is itself a defendant to the suit. HIFSCO moved to dismiss and, in September 2011, the motion was granted in part and denied in part, with leave to amend the complaint. In November 2011, plaintiffs filed an amended complaint on behalf of certain Hartford retail mutual funds, The Hartford Global Health Fund (now known as The Hartford Healthcare Fund), The Hartford Conservative Allocation Fund, The Hartford Growth Opportunities Fund, The Hartford Inflation Plus Fund, The Hartford Advisers Fund (now known as The Hartford Balanced Fund), and The Hartford Capital Appreciation Fund. Plaintiffs seek to rescind the investment management agreements and distribution plans between HIFSCO and these funds and to recover the total fees charged thereunder or, in the alternative, to recover any improper compensation HIFSCO received, in addition to lost earnings. HIFSCO filed a partial motion to dismiss the amended complaint and, in December 2012, the court dismissed without prejudice the claims regarding distribution fees and denied the motion with respect to the advisory fees claims. HIFSCO disputes the allegations and intends to defend vigorously.
In March 2014, the plaintiffs filed a new complaint that added as new plaintiffs The Hartford Floating Rate Fund and The Hartford Small Company Fund and named as a defendant HFMC, which assumed the role as investment manager to the funds as of January 2013. HFMC and HIFSCO dispute the allegations and intend to defend vigorously.
No accrual for litigation relating to this matter has been recorded in the financial statements of the Fund because the Fund is not party to the suit.
Indemnifications:
Under the Company's organizational documents, the Company shall indemnify its officers and directors to the full extent required or permitted under Maryland General Corporation Law and the federal securities laws. In addition, the Company, on behalf of the Fund, may enter into contracts that contain a variety of indemnifications. The Company's maximum exposure under these arrangements is unknown. However, as of the date of these financial statements, the Company has not had prior claims or losses pursuant to these contracts and expects the risk of loss to be remote.
Subsequent Event:
Effective December 1, 2014, pursuant to a sub-transfer agency agreement between HASCO and Boston Financial Data Services, Inc. (“BFDS”), HASCO has delegated certain transfer agent, dividend disbursing agent and shareholder servicing agent functions to BFDS. The costs and expenses of such delegation are borne by HASCO, not by the Fund.
| 23 |
The Hartford International Growth Fund
Financial Highlights
| - Selected Per-Share Data - (A) | - Ratios and Supplemental Data - | |||||||||||||||||||||||||||||||||||||||||||||||||||
| Class | Net Asset
Value at Beginning of Period | Net Investment Income (Loss) | Net Realized and Unrealized Gain (Loss) on Invest- ments | Total from Investment Operations | Dividends from Net Investment Income | Distribu- tions from Realized Capital Gains | Total Dividends and Distributions | Net Asset Value at End of Period | Total Return(B) | Net Assets at End of Period (000's) | Ratio of Expenses to Average Net Assets Before Adjust- ments(C) | Ratio of Expenses to Average Net Assets After Adjust- ments(C) | Ratio of Net Investment Income (Loss) to Average Net Assets | |||||||||||||||||||||||||||||||||||||||
| For the Year Ended October 31, 2014 | ||||||||||||||||||||||||||||||||||||||||||||||||||||
| A | $ | 12.10 | $ | 0.07 | $ | 0.48 | $ | 0.55 | $ | (0.09 | ) | $ | – | $ | (0.09 | ) | $ | 12.56 | 4.52 | % | $ | 97,732 | 1.58 | % | 1.50 | % | 0.55 | % | ||||||||||||||||||||||||
| B | 11.23 | (0.03 | ) | 0.45 | 0.42 | – | – | – | 11.65 | 3.74 | 4,384 | 2.64 | 2.25 | (0.25 | ) | |||||||||||||||||||||||||||||||||||||
| C | 11.22 | (0.02 | ) | 0.43 | 0.41 | – | – | – | 11.63 | 3.65 | 12,978 | 2.30 | 2.24 | (0.19 | ) | |||||||||||||||||||||||||||||||||||||
| I | 12.04 | 0.12 | 0.47 | 0.59 | (0.12 | ) | – | (0.12 | ) | 12.51 | 4.94 | 6,748 | 1.18 | 1.12 | 0.92 | |||||||||||||||||||||||||||||||||||||
| R3 | 12.19 | 0.06 | 0.48 | 0.54 | (0.05 | ) | – | (0.05 | ) | 12.68 | 4.40 | 458 | 1.83 | 1.60 | 0.48 | |||||||||||||||||||||||||||||||||||||
| R4 | 12.45 | 0.10 | 0.48 | 0.58 | (0.11 | ) | – | (0.11 | ) | 12.92 | 4.68 | 1,293 | 1.44 | 1.30 | 0.77 | |||||||||||||||||||||||||||||||||||||
| R5 | 12.53 | 0.13 | 0.49 | 0.62 | (0.14 | ) | – | (0.14 | ) | 13.01 | 4.99 | 182 | 1.13 | 1.00 | 1.03 | |||||||||||||||||||||||||||||||||||||
| Y | 12.57 | 0.11 | 0.53 | 0.64 | (0.15 | ) | – | (0.15 | ) | 13.06 | 5.10 | 38,538 | 1.01 | 0.95 | 0.87 | |||||||||||||||||||||||||||||||||||||
| For the Year Ended October 31, 2013 | ||||||||||||||||||||||||||||||||||||||||||||||||||||
| A | $ | 9.75 | $ | 0.10 | $ | 2.34 | $ | 2.44 | $ | (0.09 | ) | $ | – | $ | (0.09 | ) | $ | 12.10 | 25.15 | % | $ | 93,051 | 1.65 | % | 1.50 | % | 0.88 | % | ||||||||||||||||||||||||
| B | 9.04 | 0.02 | 2.17 | 2.19 | – | – | – | 11.23 | 24.27 | 6,816 | 2.66 | 2.25 | 0.16 | |||||||||||||||||||||||||||||||||||||||
| C | 9.04 | 0.01 | 2.19 | 2.20 | (0.02 | ) | – | (0.02 | ) | 11.22 | 24.32 | 13,213 | 2.35 | 2.25 | 0.14 | |||||||||||||||||||||||||||||||||||||
| I | 9.70 | 0.14 | 2.32 | 2.46 | (0.12 | ) | – | (0.12 | ) | 12.04 | 25.58 | 5,549 | 1.24 | 1.16 | 1.25 | |||||||||||||||||||||||||||||||||||||
| R3 | 9.82 | 0.09 | 2.36 | 2.45 | (0.08 | ) | – | (0.08 | ) | 12.19 | 25.03 | 485 | 1.83 | 1.60 | 0.81 | |||||||||||||||||||||||||||||||||||||
| R4 | 10.03 | 0.12 | 2.41 | 2.53 | (0.11 | ) | – | (0.11 | ) | 12.45 | 25.42 | 905 | 1.45 | 1.30 | 1.08 | |||||||||||||||||||||||||||||||||||||
| R5 | 10.09 | 0.16 | 2.42 | 2.58 | (0.14 | ) | – | (0.14 | ) | 12.53 | 25.83 | 152 | 1.15 | 1.00 | 1.37 | |||||||||||||||||||||||||||||||||||||
| Y | 10.12 | 0.16 | 2.44 | 2.60 | (0.15 | ) | – | (0.15 | ) | 12.57 | 25.91 | 3,524 | 1.02 | 0.95 | 1.41 | |||||||||||||||||||||||||||||||||||||
| For the Year Ended October 31, 2012 | ||||||||||||||||||||||||||||||||||||||||||||||||||||
| A | $ | 9.25 | $ | 0.07 | $ | 0.51 | $ | 0.58 | $ | (0.08 | ) | $ | – | $ | (0.08 | ) | $ | 9.75 | 6.33 | % | $ | 83,324 | 1.68 | % | 1.50 | % | 0.72 | % | ||||||||||||||||||||||||
| B | 8.57 | – | 0.47 | 0.47 | – | – | – | 9.04 | 5.48 | 8,974 | 2.67 | 2.25 | (0.03 | ) | ||||||||||||||||||||||||||||||||||||||
| C | 8.57 | – | 0.47 | 0.47 | – | – | – | 9.04 | 5.50 | 12,465 | 2.39 | 2.25 | (0.02 | ) | ||||||||||||||||||||||||||||||||||||||
| I | 9.21 | 0.10 | 0.50 | 0.60 | (0.11 | ) | – | (0.11 | ) | 9.70 | 6.63 | 5,585 | 1.28 | 1.21 | 1.08 | |||||||||||||||||||||||||||||||||||||
| R3 | 9.33 | 0.06 | 0.51 | 0.57 | (0.08 | ) | – | (0.08 | ) | 9.82 | 6.23 | 700 | 1.83 | 1.60 | 0.65 | |||||||||||||||||||||||||||||||||||||
| R4 | 9.45 | 0.09 | 0.53 | 0.62 | (0.04 | ) | – | (0.04 | ) | 10.03 | 6.61 | 718 | 1.46 | 1.30 | 0.98 | |||||||||||||||||||||||||||||||||||||
| R5 | 9.58 | 0.12 | 0.52 | 0.64 | (0.13 | ) | – | (0.13 | ) | 10.09 | 6.87 | 117 | 1.16 | 1.00 | 1.21 | |||||||||||||||||||||||||||||||||||||
| Y | 9.61 | 0.12 | 0.53 | 0.65 | (0.14 | ) | – | (0.14 | ) | 10.12 | 6.93 | 2,834 | 1.02 | 0.95 | 1.29 | |||||||||||||||||||||||||||||||||||||
| For the Year Ended October 31, 2011 | ||||||||||||||||||||||||||||||||||||||||||||||||||||
| A | $ | 9.61 | $ | 0.06 | $ | (0.42 | ) | $ | (0.36 | ) | $ | – | $ | – | $ | – | $ | 9.25 | (3.75 | )% | $ | 101,400 | 1.58 | % | 1.50 | % | 0.58 | % | ||||||||||||||||||||||||
| B | 8.96 | (0.02 | ) | (0.37 | ) | (0.39 | ) | – | – | – | 8.57 | (4.35 | ) | 12,013 | 2.54 | 2.25 | (0.17 | ) | ||||||||||||||||||||||||||||||||||
| C | 8.97 | (0.02 | ) | (0.38 | ) | (0.40 | ) | – | – | – | 8.57 | (4.46 | ) | 14,806 | 2.31 | 2.25 | (0.17 | ) | ||||||||||||||||||||||||||||||||||
| I | 9.53 | 0.11 | (0.43 | ) | (0.32 | ) | – | – | – | 9.21 | (3.36 | ) | 5,354 | 1.21 | 1.17 | 1.06 | ||||||||||||||||||||||||||||||||||||
| R3 | 9.70 | 0.05 | (0.42 | ) | (0.37 | ) | – | – | – | 9.33 | (3.81 | ) | 777 | 1.79 | 1.60 | 0.47 | ||||||||||||||||||||||||||||||||||||
| R4 | 9.79 | 0.09 | (0.43 | ) | (0.34 | ) | – | – | – | 9.45 | (3.47 | ) | 1,335 | 1.39 | 1.30 | 0.88 | ||||||||||||||||||||||||||||||||||||
| R5 | 9.90 | 0.12 | (0.44 | ) | (0.32 | ) | – | – | – | 9.58 | (3.23 | ) | 139 | 1.09 | 1.00 | 1.14 | ||||||||||||||||||||||||||||||||||||
| Y | 9.93 | 0.12 | (0.44 | ) | (0.32 | ) | – | – | – | 9.61 | (3.22 | ) | 3,237 | 0.98 | 0.95 | 1.13 | ||||||||||||||||||||||||||||||||||||
See Portfolio Turnover information on the next page.
| 24 |
| The Hartford International Growth Fund |
Financial Highlights – (continued)
| - Selected Per-Share Data - (A) | - Ratios and Supplemental Data - | |||||||||||||||||||||||||||||||||||||||||||||||||||
| Class | Net Asset
Value at Beginning of Period | Net Investment Income (Loss) | Net Realized and Unrealized Gain (Loss) on Invest- ments | Total from Investment Operations | Dividends from Net Investment Income | Distribu- tions from Realized Capital Gains | Total Dividends and Distributions | Net Asset Value at End of Period | Total Return(B) | Net Assets at End of Period (000's) | Ratio of Expenses to Average Net Assets Before Adjust- ments(C) | Ratio of Expenses to Average Net Assets After Adjust- ments(C) | Ratio of Net Investment Income (Loss) to Average Net Assets | |||||||||||||||||||||||||||||||||||||||
| For the Year Ended October 31, 2010 | ||||||||||||||||||||||||||||||||||||||||||||||||||||
| A | $ | 8.00 | $ | 0.05 | $ | 1.71 | $ | 1.76 | $ | (0.15 | ) | $ | – | $ | (0.15 | ) | $ | 9.61 | 22.29 | % | $ | 134,685 | 1.67 | % | 1.55 | % | 0.58 | % | ||||||||||||||||||||||||
| B | 7.50 | (0.01 | ) | 1.59 | 1.58 | (0.12 | ) | – | (0.12 | ) | 8.96 | 21.30 | 16,390 | 2.63 | 2.30 | (0.17 | ) | |||||||||||||||||||||||||||||||||||
| C | 7.48 | (0.01 | ) | 1.60 | 1.59 | (0.10 | ) | – | (0.10 | ) | 8.97 | 21.41 | 19,892 | 2.38 | 2.30 | (0.17 | ) | |||||||||||||||||||||||||||||||||||
| I | 7.95 | 0.08 | 1.69 | 1.77 | (0.19 | ) | – | (0.19 | ) | 9.53 | 22.65 | 6,674 | 1.21 | 1.21 | 0.88 | |||||||||||||||||||||||||||||||||||||
| R3 | 8.08 | 0.03 | 1.73 | 1.76 | (0.14 | ) | – | (0.14 | ) | 9.70 | 22.05 | 583 | 1.84 | 1.76 | 0.40 | |||||||||||||||||||||||||||||||||||||
| R4 | 8.14 | 0.06 | 1.75 | 1.81 | (0.16 | ) | – | (0.16 | ) | 9.79 | 22.52 | 400 | 1.46 | 1.44 | 0.67 | |||||||||||||||||||||||||||||||||||||
| R5 | 8.21 | 0.09 | 1.77 | 1.86 | (0.17 | ) | – | (0.17 | ) | 9.90 | 22.99 | 110 | 1.08 | 1.08 | 1.08 | |||||||||||||||||||||||||||||||||||||
| Y | 8.24 | 0.12 | 1.76 | 1.88 | (0.19 | ) | – | (0.19 | ) | 9.93 | 23.17 | 3,491 | 1.05 | 1.05 | 1.36 | |||||||||||||||||||||||||||||||||||||
| (A) | Information presented relates to a share outstanding throughout the indicated period. Net investment income (loss) per share amounts are calculated based on average shares outstanding unless otherwise noted. |
| (B) | Assumes initial investment at net asset value at the beginning of each period, reinvestment of all distributions, the complete redemption of the investment at net asset value at the end of each period and no sales charge. Total return would be reduced if sales charges were taken into account. |
| (C) | Adjustments include waivers and reimbursements, if applicable. Ratios do not include fees paid indirectly (see Expenses in the accompanying Notes to Financial Statements). |
| Portfolio Turnover Rate for All Share Classes | ||||
| For the Year Ended October 31, 2014 | 84 | % | ||
| For the Year Ended October 31, 2013 | 99 | |||
| For the Year Ended October 31, 2012 | 106 | |||
| For the Year Ended October 31, 2011 | 88 | |||
| For the Year Ended October 31, 2010 | 110 | |||
| 25 |
| Report of Independent Registered Public Accounting Firm |
The Board of Directors and Shareholders of
The Hartford Mutual Funds, Inc.
We have audited the accompanying statement of assets and liabilities, including the schedule of investments, of The Hartford International Growth Fund (one of the portfolios constituting The Hartford Mutual Funds, Inc. (the Funds)) as of October 31, 2014, and the related statement of operations for the year then ended, the statements of changes in net assets for each of the two years in the period then ended, and the financial highlights for each of the five years in the period then ended. These financial statements and financial highlights are the responsibility of the Funds’ management. Our responsibility is to express an opinion on these financial statements and financial highlights based on our audits.
We conducted our audits in accordance with the standards of the Public Company Accounting Oversight Board (United States). Those standards require that we plan and perform the audit to obtain reasonable assurance about whether the financial statements and financial highlights are free of material misstatement. We were not engaged to perform an audit of the Funds’ internal control over financial reporting. Our audits included consideration of internal control over financial reporting as a basis for designing audit procedures that are appropriate in the circumstances, but not for the purpose of expressing an opinion on the effectiveness of the Funds’ internal control over financial reporting. Accordingly, we express no such opinion. An audit also includes examining, on a test basis, evidence supporting the amounts and disclosures in the financial statements and financial highlights, assessing the accounting principles used and significant estimates made by management, and evaluating the overall financial statement presentation. Our procedures included confirmation of securities owned as of October 31, 2014, by correspondence with the custodian and brokers or by other appropriate auditing procedures where replies from brokers were not received. We believe that our audits provide a reasonable basis for our opinion.
In our opinion, the financial statements and financial highlights referred to above present fairly, in all material respects, the financial position of The Hartford International Growth Fund of The Hartford Mutual Funds, Inc. at October 31, 2014, the results of its operations for the year then ended, the changes in its net assets for each of the two years in the period then ended, and the financial highlights for each of the five years in the period then ended, in conformity with U.S. generally accepted accounting principles.
|
Minneapolis, Minnesota
December 18, 2014
| 26 |
| The Hartford International Growth Fund |
Directors and Officers (Unaudited)
The Board of Directors of the Company (the "Directors") appoints officers who are responsible for the day-to-day operations of the Fund and who execute policies formulated by the Directors. Each Director serves until his or her death, resignation, or retirement or until the next annual meeting of shareholders is held or until his or her successor is elected and qualifies.
Directors and officers who are employed by or who have a financial interest in The Hartford Financial Services Group, Inc. ("The Hartford") are considered “interested” persons of the Fund pursuant to the 1940 Act. Each officer and two of the Company's Directors, as noted in the chart below, are “interested” persons of the Fund. Each Director serves as a director for The Hartford Mutual Funds, Inc., The Hartford Mutual Funds II, Inc., Hartford Series Fund, Inc., and Hartford HLS Series Fund II, Inc., and as a trustee for The Hartford Alternative Strategies Fund, which, as of October 31, 2014, collectively consist of 66 funds. Correspondence may be sent to Directors and officers c/o Hartford Funds, 5 Radnor Corporate Center, Suite 300, 100 Matsonford Road, Radnor, Pennsylvania 19087, except that correspondence to Mr. Annoni, Mr. Dressen and Ms. Quade may be sent to 500 Bielenberg Drive, Suite 500, Woodbury, Minnesota 55125.
The table below sets forth, for each Director and officer, his or her name, year of birth, current position with the Company and date first elected or appointed to The Hartford Mutual Funds, Inc. ("MF") and The Hartford Mutual Funds II, Inc. ("MF2"), principal occupation, and, for Directors, other directorships held. The Fund’s Statement of Additional Information contains further information on the Directors and is available free of charge by calling 1-888-843-7824 or writing to: Hartford Funds, P.O. Box 55022, Boston, MA 02205-5022.
Information on the aggregate remuneration paid to the directors of the Company can be found in the Statement of Operations herein. The Fund pays to The Hartford a portion of the Chief Compliance Officer’s compensation, but does not pay salaries or compensation to any of its other officers or Directors who are employed by The Hartford.
Non-Interested Directors
Hilary E. Ackermann (1956) Director since September 23, 2014
Ms. Ackermann served as Chief Risk Officer at Goldman Sachs Bank USA from October 2008 to November 2011 and serves as a Director of Dynegy, Inc., an independent power company, from October 2012 to present.
Lynn S. Birdsong (1946) Director since 2003, Chairman of the Investment Committee since 2014
Mr. Birdsong is a private investor. Mr. Birdsong currently serves as a Director of the Sovereign High Yield Investment Company (April 2010 to current). Mr. Birdsong currently serves as an Independent Director of Nomura Partners Funds, Inc. (formerly, The Japan Fund) (April 2003 to current). From 2003 to March 2005, Mr. Birdsong was an Independent Director of the Atlantic Whitehall Funds. From 1979 to 2002, Mr. Birdsong was a Managing Director of Zurich Scudder Investments, an investment management firm. During his employment with Scudder, Mr. Birdsong was an Interested Director of The Japan Fund. From January 1981 through December 2013, Mr. Birdsong was a partner in Birdsong Company, an advertising specialty firm.
Robert M. Gavin, Jr. (1940) Director since 2002 (MF) and 1986 (MF2), Chairman of the Board for each since 2004
Dr. Gavin is an educational consultant. Prior to September 1, 2001, he was President of Cranbrook Education Community and prior to July 1996, he was President of Macalester College, St. Paul, Minnesota.
Duane E. Hill (1945) Director since 2001 (MF) and 2002 (MF2), Chairman of the Nominating Committee since 2003
Mr. Hill is a Partner of TSG Ventures L.P., a private equity investment company. Mr. Hill is a former partner of TSG Capital Group, a private equity investment firm that served as sponsor and lead investor in leveraged buyouts of middle market companies.
Sandra S. Jaffee (1941) Director since 2005
Ms. Jaffee is the founder and Chief Executive Officer of a private company, Homeworks Concierge, LLC, which provides residential property management services in Westchester County, New York (January 2012 to present). Ms. Jaffee served as Chairman (2008 to 2009) and Chief Executive Officer of Fortent (formerly Searchspace Group), a leading provider of compliance/regulatory technology to financial institutions from August 2005 to August 2009. From August 2004 to August 2005, Ms. Jaffee served as an Entrepreneur in Residence with Warburg Pincus, a private equity firm. Prior to joining Warburg Pincus, Ms. Jaffee served as Executive Vice President at Citigroup, from September 1995 to July 2004, where she was President and Chief Executive Officer of Citibank’s Global Securities Services (1995 to 2003). Ms. Jaffee currently serves as a member of the Board of Directors of Broadridge Financial Solutions as well as a Trustee of Muhlenberg College.
| 27 |
| The Hartford International Growth Fund |
Directors and Officers (Unaudited) – (continued)
William P. Johnston (1944) Director since 2005, Chairman of the Compliance Committee since 2005
In June 2006, Mr. Johnston was appointed as Senior Advisor to The Carlyle Group, a global private equity and other alternative asset investment firm and currently serves as an Operating Executive. In July 2006, Mr. Johnston was elected to the Board of Directors of MultiPlan, Inc. and served as a Director (July 2006 to August 2010). In August 2007, Mr. Johnston was elected to the Board of Directors of LifeCare Holdings, Inc. and served as a Director (August 2007 to June 2013). In February 2008, Mr. Johnston was elected to the Board of Directors of HCR-ManorCare, Inc. In May 2006, Mr. Johnston was elected to the Supervisory Board of Fresenius Medical Care AG & Co. KGaA, after its acquisition of Renal Care Group, Inc. in March 2006. Mr. Johnston joined Renal Care Group in November 2002 as a member of the Board of Directors and served as Chairman of the Board from March 2003 through March 2006. From 2002 through 2013, Mr. Johnston served as a Board member of the Georgia O’Keefe Museum. From September 1987 to December 2002, Mr. Johnston was with Equitable Securities Corporation (and its successors, SunTrust Equitable Securities and SunTrust Robinson Humphrey) serving in various investment banking and managerial positions, including Managing Director and Head of Investment Banking, Chief Executive Officer and Vice Chairman.
Phillip O. Peterson (1944) Director since 2002 (MF) and 2000 (MF2), Chairman of the Audit Committee since 2002
Mr. Peterson is a mutual fund industry consultant. He was a partner of KPMG LLP (an accounting firm) until July 1999. Mr. Peterson joined William Blair Funds in February 2007 as a member of the Board of Trustees. From February 2012 to February 2014, Mr. Peterson served as a Trustee of Symetra Variable Mutual Funds. From January 2004 to April 2005, Mr. Peterson served as Independent President of the Strong Mutual Funds.
Lemma W. Senbet (1946) Director since 2005
Dr. Senbet is the William E. Mayer Chair Professor of Finance and Founding Director, Center for Financial Policy, at the University of Maryland, Robert H. Smith School of Business. He was chair of the Finance Department of the University of Maryland, Robert H. Smith School of Business from 1998 to 2006. Since June 2013, he has been on leave from the University to serve as Executive Director of African Economic Research Consortium which focuses on economic policy research and training. Previously, he was a chaired professor of finance at the University of Wisconsin-Madison. Also, he was a Director of the Fortis Funds from March 2000 to July 2002. Dr. Senbet served as Director of the American Finance Association and President of the Western Finance Association. In 2006, Dr. Senbet was inducted Fellow of Financial Management Association International for his career-long distinguished scholarship and professional service.
Interested Directors and Officers
James E. Davey (1964) Director since 2012, President and Chief Executive Officer since 2010
Mr. Davey serves as Executive Vice President of Hartford Life Insurance Company (“HLIC”) and The Hartford. Additionally, Mr. Davey serves as Chairman of the Board, Manager and Senior Managing Director of Hartford Funds Distributors, LLC (“HFD”). He also currently serves as Director, Chairman of the Board, President and Senior Managing Director of Hartford Administrative Services Company (“HASCO”). Mr. Davey also serves as Manager, Chairman of the Board and Senior Managing Director for Hartford Funds Management Company, LLC (“HFMC”) and Director, Chairman of the Board and Senior Managing Director for Hartford Funds Management Group, Inc. ("HFMG"). Mr. Davey has served in various positions within The Hartford and its subsidiaries in connection with the operation of the Hartford Funds. Mr. Davey joined The Hartford in 2002.
Lowndes A. Smith* (1939) Director since 1996 (MF) and 2002 (MF2)
Mr. Smith served as Vice Chairman of The Hartford from February 1997 to January 2002, as President and Chief Executive Officer of Hartford Life, Inc. from February 1997 to January 2002, and as President and Chief Operating Officer of The Hartford Life Insurance Companies from January 1989 to January 2002. Mr. Smith serves as a Director of White Mountains Insurance Group Ltd. (October 2003 to current); One Beacon Insurance (October 2006 to current); Symetra Financial (August 2007 to current) and is a Managing Director of Whittington Gray Associates (January 2007 to current).
* Mr. Smith resigned as a Director of MF, MF2, Hartford Series Fund, Inc. and Hartford HLS Series Fund II, Inc. and as a Trustee of The Hartford Alternative Strategies Fund effective September 17, 2014.
Other Officers
Mark A. Annoni (1964) Vice President, Controller and Treasurer since 2012
Mr. Annoni currently serves as the Assistant Vice President of HLIC (February 2004 to present) and Senior Vice President of HFMG (December 2013 to present). Mr. Annoni has served in various positions within The Hartford and its subsidiaries in connection with the operation of the Hartford Funds. Mr. Annoni joined The Hartford in 2001.
| 28 |
| The Hartford International Growth Fund |
Directors and Officers (Unaudited) – (continued)
Michael R. Dressen (1963) AML Compliance Officer since 2011
Mr. Dressen currently serves as Assistant Vice President of HLIC. He also serves as Chief Compliance Officer and AML Compliance Officer of HASCO and as AML Officer of HFD. Mr. Dressen has served in various positions within The Hartford and its subsidiaries in connection with the operation of the Hartford Funds.
Edward P. Macdonald (1967) Vice President, Secretary and Chief Legal Officer since 2005
Mr. Macdonald currently serves as Assistant Secretary, Executive Vice President and Deputy General Counsel of HFD, HASCO, HFMC and HFMG. He also serves as Vice President of HLIC. Mr. Macdonald has served in various positions within The Hartford and its subsidiaries in connection with the operation of the Hartford Funds. Mr. Macdonald joined The Hartford in 2005.
Joseph G. Melcher (1973) Vice President and Chief Compliance Officer since 2013
Mr. Melcher currently serves as Executive Vice President of HFD, HFMG and HASCO. Mr. Melcher also currently serves as Executive Vice President and Chief Compliance Officer of HFMC. Mr. Melcher has served in various positions within The Hartford and its subsidiaries in connection with the operation of the Hartford Funds since joining The Hartford in 2012. Prior to joining The Hartford, Mr. Melcher worked at Touchstone Investments, a member of the Western & Southern Financial Group, where he held the position of Vice President and Chief Compliance Officer from 2010 through 2012 and Assistant Vice President, Compliance from 2005 to 2010.
Vernon J. Meyer (1964) Vice President since 2006
Mr. Meyer currently serves as Senior Vice President of HLIC. He also currently serves as Managing Director and Chief Investment Officer of HFMC and Managing Director of HFMG. Mr. Meyer has served in various positions within The Hartford and its subsidiaries in connection with the operation of the Hartford Funds. Mr. Meyer joined The Hartford in 2004.
Laura S. Quade (1969) Vice President since 2012
Ms. Quade currently serves as Vice President of HASCO, HFD and HFMG. She is the Head of Operations of HASCO and formerly served as Director, Enterprise Operations of HLIC. Ms. Quade has served in various positions within The Hartford and its subsidiaries in connection with the operation of the Hartford Funds. Ms. Quade joined The Hartford in 2001.
Martin A. Swanson** (1962) Vice President since 2010
Mr. Swanson currently serves as Vice President of HLIC. Mr. Swanson also serves as Managing Director, Chief Marketing Officer and Principal of HFD and Managing Director of HFMG. Mr. Swanson has served in various positions within The Hartford and its subsidiaries in connection with the operation of the Hartford Funds.
** Mr. Swanson resigned as an officer effective November 6, 2014.
HOW TO OBTAIN A COPY OF THE FUND’S PROXY VOTING POLICIES AND VOTING RECORDS (UNAUDITED)
A description of the policies and procedures that the Fund uses to determine how to vote proxies relating to portfolio securities and information about how the Fund voted proxies relating to portfolio securities during the most recent twelve-month period ended June 30 are available (1) without charge, upon request, by calling 888-843-7824 and (2) on the SEC’s website at http://www.sec.gov.
QUARTERLY PORTFOLIO HOLDINGS INFORMATION (UNAUDITED)
The Fund files a complete schedule of portfolio holdings with the SEC for the first and third quarters of each fiscal year on Form N-Q. The Fund’s Forms N-Q are available (1) without charge, upon request, by calling 888-843-7824 and (2) on the SEC’s website at http://www.sec.gov. The Form N-Q may be reviewed and copied at the SEC’s Public Reference Room in Washington, DC. Information on the operation of the Public Reference Room may be obtained by calling 1-800-SEC-0330.
| 29 |
| The Hartford International Growth Fund |
Federal Tax Information (Unaudited)
For the fiscal year ended October 31, 2014, there is no further federal tax information required for this Fund.
| 30 |
| The Hartford International Growth Fund |
Expense Example (Unaudited)
Your Fund's Expenses
As a shareholder of the Fund, you incur two types of costs: (1) transaction costs, including sales charges (loads) on purchase payments, if any, and contingent deferred sales charges (CDSC), if any, and (2) ongoing costs, including investment management fees, distribution and/or service (12b-1) fees, if any, and other fund expenses. This example is intended to help you understand your ongoing costs (in dollars) of investing in the Fund and to compare these costs with the ongoing costs of investing in other mutual funds. The example is based on an investment of $1,000 invested at the beginning of the period and held for the entire period of April 30, 2014 through October 31, 2014.
Actual Expenses
The first set of columns of the table below provides information about actual account values and actual expenses. You may use the information in this column, together with the amount you invested, to estimate the expenses that you paid over the period. Simply divide your account value by $1,000 (for example, an $8,600 account value divided by $1,000 = 8.6), then multiply the result by the number in the line under the heading entitled “Expenses Paid During Period” to estimate the expenses you paid on your account during this period.
Hypothetical Example for Comparison Purposes
The second set of columns of the table below provides information about hypothetical account values and hypothetical expenses based on the Fund's actual expense ratio and an assumed rate of return of 5% per year before expenses, which is not the Fund's actual return. The hypothetical account values and expenses may not be used to estimate the actual ending account balance or expenses you paid for the period. You may use this information to compare the ongoing costs of investing in the Fund and other funds. To do so, compare this 5% hypothetical example with the 5% hypothetical examples that appear in the shareholder reports of the other funds.
Please note that the expenses shown in the table are meant to highlight your ongoing costs only and do not reflect any transactional costs, such as sales charges (loads) and CDSC. Therefore, the second set of columns of the table is useful in comparing ongoing costs only, and will not help you determine the relative total costs of owning different funds. In addition, if these transactional costs were included, your costs would be higher. Expenses are equal to the Fund's annualized expense ratios multiplied by average account value over the period, multiplied by 184/365 (to reflect the one-half year period).
| Actual return | Hypothetical (5% return before expenses) | |||||||||||||||||||||||||||||||||||
| Beginning Account Value April 30, 2014 | Ending Account Value October 31, 2014 | Expenses paid during the period April 30, 2014 through October 31, 2014 | Beginning Account Value April 30, 2014 | Ending Account Value October 31, 2014 | Expenses paid during the period April 30, 2014 through October 31, 2014 | Annualized expense ratio | Days in the current 1/2 year | Days in the full year | ||||||||||||||||||||||||||||
| Class A | $ | 1,000.00 | $ | 985.10 | $ | 7.56 | $ | 1,000.00 | $ | 1,017.59 | $ | 7.68 | 1.51 | % | 184 | 365 | ||||||||||||||||||||
| Class B | $ | 1,000.00 | $ | 982.30 | $ | 11.44 | $ | 1,000.00 | $ | 1,013.66 | $ | 11.62 | 2.29 | 184 | 365 | |||||||||||||||||||||
| Class C | $ | 1,000.00 | $ | 981.40 | $ | 11.15 | $ | 1,000.00 | $ | 1,013.95 | $ | 11.34 | 2.23 | 184 | 365 | |||||||||||||||||||||
| Class I | $ | 1,000.00 | $ | 987.40 | $ | 5.51 | $ | 1,000.00 | $ | 1,019.66 | $ | 5.60 | 1.10 | 184 | 365 | |||||||||||||||||||||
| Class R3 | $ | 1,000.00 | $ | 984.50 | $ | 8.00 | $ | 1,000.00 | $ | 1,017.14 | $ | 8.13 | 1.60 | 184 | 365 | |||||||||||||||||||||
| Class R4 | $ | 1,000.00 | $ | 986.30 | $ | 6.51 | $ | 1,000.00 | $ | 1,018.65 | $ | 6.61 | 1.30 | 184 | 365 | |||||||||||||||||||||
| Class R5 | $ | 1,000.00 | $ | 987.90 | $ | 5.01 | $ | 1,000.00 | $ | 1,020.17 | $ | 5.09 | 1.00 | 184 | 365 | |||||||||||||||||||||
| Class Y | $ | 1,000.00 | $ | 988.60 | $ | 4.76 | $ | 1,000.00 | $ | 1,020.42 | $ | 4.84 | 0.95 | 184 | 365 | |||||||||||||||||||||
| 31 |
| The Hartford International Growth Fund |
Approval of Investment Management and Investment Sub-Advisory Agreements (Unaudited)
Section 15(c) of the Investment Company Act of 1940, as amended (the “1940 Act”), requires that each mutual fund’s board of directors, including a majority of those directors who are not “interested persons” of the mutual fund, as defined in the 1940 Act (the “Independent Directors”), annually review and consider the continuation of the mutual fund’s investment advisory and sub-advisory agreements. At its meeting held on August 5-6, 2014, the Board of Directors (the “Board”) of The Hartford Mutual Funds, Inc., including each of the Independent Directors, unanimously voted to approve the continuation of the investment management agreement for The Hartford International Growth Fund (the “Fund”) with Hartford Funds Management Company, LLC (“HFMC”) and the continuation of the investment sub-advisory agreement between HFMC and the Fund’s sub-adviser, Wellington Management Company, LLP (the “Sub-adviser,” and together with HFMC, the “Advisers”) (collectively, the “Agreements”).
In the months preceding the August 5-6, 2014 meeting, the Board requested, received and reviewed written responses from the Advisers to questions posed to them on behalf of the Independent Directors and supporting materials relating to those questions and responses. The Board considered information furnished to the Board at its meetings throughout the year, as well as information specifically prepared in connection with the annual approval of the Agreements at the Board’s meetings held on June 17-18, 2014 and August 5-6, 2014. Information provided to the Board at its meetings throughout the year included, among other things, reports on Fund performance, legal and compliance matters, sales and marketing activity, shareholder services, and the other services provided to the Fund by the Advisers and their affiliates. The Board also received in-person presentations by Fund officers and representatives of HFMC at the Board’s meetings on June 17-18, 2014 and August 5-6, 2014 concerning the Agreements.
The Independent Directors, advised by independent legal counsel, engaged service providers to assist them with evaluating the Agreements with respect to the Fund. Lipper Inc. (“Lipper”), an independent provider of investment company data, was retained to provide the Board with reports on how the Fund’s contractual management fees, actual management fees, other non-management fees, overall expense ratios and investment performance compared to those of mutual funds with similar investment objectives. The Independent Directors also engaged an independent financial services consultant (the “Consultant”) to assist them in evaluating the Fund’s management fees, sub-advisory fees, other non-management fees, overall expense ratios and investment performance. In addition, the Consultant reviewed the profitability calculations utilized by HFMC in connection with the continuation of the investment management agreement.
In determining whether to continue the Agreements for the Fund, the members of the Board reviewed and evaluated information and factors they believed to be relevant and appropriate in light of the information that the Board deemed necessary and appropriate through the exercise of its reasonable business judgment. While individual members of the Board may have weighed certain factors differently, the Board’s determination to continue the Agreements was based on a comprehensive consideration of all information provided to the Board throughout the year and specifically with respect to the continuation of the Agreements. A more detailed discussion of the factors the Board considered with respect to its approval of the Agreements is provided below.
Nature, Extent and Quality of Services Provided by the Advisers
The Board requested and considered information concerning the nature, extent and quality of the services provided to the Fund by the Advisers. The Board considered, among other things, the terms of the Agreements and the range of services provided by the Advisers. The Board considered the Advisers’ professional personnel who provide services to the Fund, including each Adviser’s ability and experience in attracting and retaining qualified personnel to service the Fund. The Board considered each Adviser’s reputation and overall financial strength, as well as its willingness to consider and implement organizational and operational changes designed to enhance services to the Hartford Funds. In addition, the Board considered the quality of each Adviser’s communications with the Board and responsiveness to Board inquiries and requests made from time to time with respect to the Fund and other Hartford Funds.
The Board also requested and evaluated information concerning each Adviser’s regulatory and compliance environment. In this regard, the Board requested and reviewed information on each Adviser’s compliance policies and procedures, compliance history, and a report from the Fund’s Chief Compliance Officer on each Adviser’s compliance with applicable laws and regulations, including responses to regulatory developments and compliance issues raised by regulators. The Board also noted the Advisers’ support of the Fund’s compliance control structure, particularly the resources devoted by the Advisers in support of the Fund’s obligations pursuant to Rule 38a-1 under the 1940 Act.
With respect to HFMC, the Board noted that, under the Agreements, HFMC is responsible for the management of the Fund, including oversight of fund operations and service providers, and provides administrative and investment advisory services in connection with selecting, monitoring and supervising the Sub-adviser. The Board considered HFMC’s ongoing monitoring of people, process and performance, including its quarterly reviews of each of the Hartford Funds, semi-annual meetings with the leaders of each Fund’s portfolio management team, and oversight of the Hartford Funds’ approximately 66 portfolio managers. The Board recognized that HFMC has demonstrated a record of making changes to the
| 32 |
| The Hartford International Growth Fund |
Approval of Investment Management and Investment Sub-Advisory Agreements (Unaudited) – (continued)
management and/or strategies of the Hartford Funds when warranted. The Board considered HFMC’s oversight of the Sub-adviser’s investment approach and results, process for monitoring best execution of portfolio trades by the Sub-adviser, and approach to risk management with respect to the Fund and the service providers to the Fund. The Board also considered HFMC’s oversight of compliance with the Fund’s objective and policies as well as with applicable laws and regulations, noting that regulatory and other developments had over time led to an increase in the scope of HFMC’s services in this regard.
In addition, the Board considered HFMC’s ongoing commitment to review and rationalize the Hartford Funds product line-up and the expenses that HFMC had incurred in connection with fund combinations in recent years. The Board considered that HFMC or its affiliates are responsible for providing the Fund’s officers.
With respect to the Sub-adviser, which provides certain day-to-day portfolio management services for the Fund, the Board considered the quality of the Fund’s portfolio managers, the Sub-adviser’s other investment personnel, its investment philosophy and process, investment research capabilities and resources, performance record, trade execution capabilities and experience. The Board considered the experience of the Fund’s portfolio managers, the number of accounts managed by the portfolio managers, and the Sub-adviser’s method for compensating the portfolio managers.
Based on these considerations, the Board concluded that it was satisfied with the nature, extent and quality of the services provided to the Fund by HFMC and the Sub-adviser.
Performance of the Fund and the Advisers
The Board considered the investment performance of the Fund. In this regard, the Board reviewed the performance of the Fund over different time periods presented in the materials and evaluated HFMC’s analysis of the Fund’s performance for these time periods. The Board considered information and materials provided to the Board by the Advisers concerning Fund performance, as well as information from Lipper comparing the investment performance of the Fund to an appropriate benchmark and universe of peer funds. The Board noted that the Fund’s performance was in the 3rd quintile of its performance universe for the 1-year period and the 2nd quintile for the 3- and 5-year periods. The Board also noted that the Fund’s performance was above its benchmark for the 1-, 3- and 5-year periods.
The Board considered the detailed investment analytics reports provided by Hartford Funds’ Investment Advisory Group throughout the year. These reports include, among other things, information on the Fund’s gross and net returns, the Fund’s investment performance relative to an appropriate benchmark and peer group, various statistics concerning the Fund’s portfolio, and a narrative summary of various factors affecting Fund performance. The Board considered the Advisers’ cooperation with the Investment Committee, which assists the Board in evaluating the performance of the Fund at periodic meetings throughout the year. The Board also considered the analysis provided by the Consultant relating to the Fund’s performance track record.
In light of all the considerations noted above, the Board concluded that it had continued confidence in HFMC’s and the Sub-adviser’s overall capabilities to manage the Fund.
Costs of the Services and Profitability of the Advisers
The Board reviewed information regarding HFMC’s cost to provide investment management and related services to the Fund and HFMC’s profitability, both overall and for the Fund, on a pre-tax basis without regard to distribution expenses. The Board also requested and reviewed information about the profitability to HFMC and its affiliates from all services provided to the Fund and all aspects of their relationship with the Fund. The Board also requested and received information relating to the operations and profitability of the Sub-adviser.
The Board considered the Consultant’s review of the profitability calculations used by HFMC in connection with the continuation of the investment management agreement, noting the Consultant’s view that Hartford Funds’ process for calculating and reporting Fund profitability is reasonable. In this regard, the Board noted that the Consultant performed a full review of this process in light of the recent restructuring of the Hartford Funds business and reported that the approach to analyzing Fund profitability, including the use of common expense allocation methodologies, is reasonable, sound and well within common industry practice.
Based on these considerations, the Board concluded that the profits anticipated to be realized by the Advisers and their affiliates from their relationships with the Fund would not be excessive.
| 33 |
| The Hartford International Growth Fund |
Approval of Investment Management and Investment Sub-Advisory Agreements (Unaudited) – (continued)
Comparison of Fees and Services Provided by the Advisers
The Board considered comparative information with respect to the management fees to be paid by the Fund to HFMC and the total expense ratios of the Fund. The Board also considered comparative information with respect to the sub-advisory fees to be paid by HFMC to the Sub-adviser. In this regard, the Board requested and reviewed information from HFMC and the Sub-adviser relating to the management and sub-advisory fees, including the sub-advisory fee schedule for the Fund, and total operating expenses for the Fund. With respect to the sub-advisory fee schedule, the Board considered representations from HFMC and the Sub-adviser that the Sub-adviser’s fees were negotiated at arm’s length on a fund-by-fund basis. The Board also reviewed information from Lipper comparing the Fund’s contractual management fees, actual management fees and overall expense ratios relative to a group of funds selected by Lipper, in consultation with the Consultant, and a broader universe of funds selected by Lipper. The Board considered that the Fund’s contractual management fee and actual management fee were in the 2nd quintile of its expense group, while its total expenses (less 12b-1 and shareholder service fees) were in the 3rd quintile. The Board noted that the Fund has an automatically renewable contractual expense cap on each share class. The expense cap resulted in reimbursement of certain expenses incurred in 2013.
While the Board recognized that comparisons between the Fund and peer funds may be imprecise, given the different service levels and characteristics of mutual funds and the different business models and cost structures of the Advisers, the comparative information provided by Lipper assisted the Board in evaluating the reasonableness of the Fund’s management and sub-advisory fees and total operating expenses. In addition, the Board considered the analysis and recommendations of the Consultant relating to the Fund’s management and sub-advisory fees and total operating expenses.
Based on these considerations, the Board concluded that the Fund’s fees and total operating expenses, in conjunction with the information about quality of services, profitability, economies of scale, and other matters discussed, were reasonable in light of the services provided.
Economies of Scale
The Board requested and considered information regarding the Advisers’ realization of economies of scale with respect to the Fund and whether the fee levels reflect these economies of scale for the benefit of the Fund’s shareholders. The Board reviewed the breakpoints in the management fee schedule for the Fund, which reduce fee rates as Fund assets grow over time. The Board recognized that a fund with assets beyond the highest breakpoint level will continue to benefit from economies of scale because additional assets are charged the lowest breakpoint fee resulting in lower overall effective management fee rates. The Board also considered that expense limitations and fee waivers that reduce the Fund’s expenses at all asset levels can have the same effect as breakpoints in sharing economies of scale with shareholders and provide protection from an increase in expenses if Fund assets decline. The Board recognized that a fee schedule that reaches a lower breakpoint quickly provides shareholders with the benefit of anticipated or potential economies of scale, although the Board noted that the Fund’s current low asset levels have kept the Fund from fully realizing this benefit. The Board also considered that HFMC has been active in managing expenses, which has resulted in benefits being realized by shareholders as assets within the Hartford Funds family of funds have grown over time, including through lower transfer agent costs and other operating expenses.
The Board reviewed and evaluated materials from Lipper and the Consultant showing how management fee schedules of peer funds reflect economies of scale for the benefit of shareholders as a peer fund’s assets hypothetically increase over time. Based on information provided by HFMC, Lipper, and the Consultant, the Board recognized that there is no uniform methodology for establishing breakpoints or uniform pattern in asset levels that trigger breakpoints or the amounts of breakpoints triggered.
After considering all of the information available to it, the Board concluded that it was satisfied with the extent to which economies of scale would be shared for the benefit of the Fund’s shareholders based on currently available information and the effective advisory fees and expense ratios for the Fund at its current and reasonably anticipated asset levels. The Board noted, however, that it would continue to monitor future growth in Fund assets and the appropriateness of additional breakpoints.
Other Benefits
The Board considered other benefits to the Advisers and their affiliates from their relationships with the Fund.
The Board noted that HFMC receives fees for fund accounting and related services from the Fund, and the Board considered information on profits to HFMC for such services. The Board also considered that Hartford Administrative Services Company (“HASCO”), the Fund’s transfer agent and an affiliate of HFMC, receives transfer agency compensation from the Fund, and the Board reviewed information on the profitability of
| 34 |
| The Hartford International Growth Fund |
Approval of Investment Management and Investment Sub-Advisory Agreements (Unaudited) – (continued)
the Fund’s transfer agency function to HASCO. The Board considered information provided by HASCO indicating that the transfer agent fees charged by HASCO to the Fund were fair and reasonable based on publicly available information.
The Board also considered that Hartford Funds Distributors, LLC (“HFD”), an affiliate of HFMC, serves as principal underwriter of the Fund. As principal underwriter, HFD receives 12b-1 fees from the Fund and receives all or a portion of the sales charges on sales or redemptions of certain classes of shares. The Board also noted that certain affiliates of HFD distribute shares of the Fund and receive compensation in that connection.
The Board considered benefits to the Sub-adviser from its use of the Fund’s brokerage commissions to obtain soft dollar research, and representations from HFMC and the Sub-adviser that the Sub-adviser would not make any revenue-sharing payments or any other type of distribution payments to HFMC or its affiliates.
The Board considered the benefits to shareholders of being part of the Hartford Funds family of funds, including the right to exchange investments between the same class of funds without a sales charge, the ability to reinvest Fund dividends into other funds in the family, and the ability to combine holdings in the Fund with holdings in other funds to obtain a reduced sales charge. The Board considered HFMC’s efforts to provide investors in the family with a broad range of investment styles and asset classes and its entrepreneurial risk in initiating new funds to expand these opportunities for shareholders.
* * * *
Based upon its review of these various factors, among others, the Board concluded that it is in the best interests of the Fund and its shareholders for the Board to approve the Agreements for an additional year. In reaching this decision, the Board did not assign relative weights to the factors discussed above or deem any one or group of them to be controlling in and of themselves. In connection with their deliberations, the Independent Directors met separately in executive session on several occasions, with independent legal counsel and the Consultant, to review the relevant materials and consider their responsibilities under relevant laws and regulations.
| 35 |
| The Hartford International Growth Fund |
Main Risks (Unaudited)
The main risks of investing in the Fund are described below.
Market, Selection and Strategy Risk: The Fund’s share price may fluctuate due to market risk and/or security selections that may underperform the market or relevant benchmarks. If the sub-adviser's investment strategy does not perform as expected, the Fund could underperform its peers or lose money. There is no guarantee the Fund will achieve its stated objective.
Foreign Investment and Emerging Markets Risk: Investments in foreign securities may be riskier than investments in U.S. securities. Potential risks include the risks of illiquidity, increased price volatility, less government regulation, less extensive and less frequent accounting and other reporting requirements, unfavorable changes in currency exchange rates, and economic and political disruptions. These risks are generally greater for investments in emerging markets.
Growth Investing Risk: Growth investments can be volatile, and may fail to increase earnings or grow as quickly as anticipated. Growth-style investing falls in and out of favor, which may result in periods of underperformance.
Mid-Cap Stock Risk: Mid-cap stocks are generally more volatile and risky and may be less liquid than large-cap stocks because they may have limited operating histories, narrow product lines, and focus on niche markets.
Active Trading Risk: Actively trading investments may result in higher costs and higher taxable income.
| 36 |
THIS PRIVACY POLICY IS NOT PART OF THIS REPORT
Privacy Policy and Practices of The Hartford Financial Services Group, Inc. and its Affiliates
(herein called “we, our and us”)
This Privacy Policy applies to our United States Operations
|
We value your trust. We are committed to the responsible: a) management; b) use; and c) protection; of Personal Information.
This notice describes how we collect, disclose, and protect Personal Information.
We collect Personal Information to: a) service your Transactions with us; and b) support our business functions.
We may obtain Personal Information from: a) You; b) your Transactions with us; and c) third parties such as a consumer-reporting agency.
Based on the type of product or service You apply for or get from us, Personal Information such as: a) your name; b) your address; c) your income; d) your payment; or e) your credit history; may be gathered from sources such as applications, Transactions, and consumer reports.
To serve You and service our business, we may share certain Personal Information. We will share Personal Information, only as allowed by law, with affiliates such as: a) our insurance companies; b) our employee agents; c) our brokerage firms; and d) our administrators.
As allowed by law, we may share Personal Financial Information with our affiliates to: a) market our products; or b) market our services; to You without providing You with an option to prevent these disclosures. |
We may also share Personal Information, only as allowed by law, with unaffiliated third parties including: a) independent agents; b) brokerage firms; c) insurance companies; d) administrators; and e) service providers; who help us serve You and service our business.
When allowed by law, we may share certain Personal Financial Information with other unaffiliated third parties who assist us by performing services or functions such as: a) taking surveys; b) marketing our products or services; or c) offering financial products or services under a joint agreement between us and one or more financial institutions.
We, and third parties we partner with, may track some of the pages You visit through the use of: a) cookies; b) pixel tagging; or c) other technologies; and currently do not process or comply with any web browser’s “do not track” signal or similar mechanism that indicates a request to disable online tracking of individual users who visit our websites or use our services.
We will not sell or share your Personal Financial Information with anyone for purposes unrelated to our business functions without offering You the opportunity to: a) “opt-out;” or b) “opt-in;” as required by law.
We only disclose Personal Health Information with: a) your proper written authorization; or b) as otherwise allowed or required by law.
Our employees have access to Personal Information in the course of doing their jobs, such as: a) underwriting policies; b) paying claims; c) developing new products; or d) advising customers of our products and services. |
|
We use manual and electronic security procedures to maintain: a) the confidentiality; and b) the integrity of; Personal Information that we have. We use these procedures to guard against unauthorized access.
Some techniques we use to protect Personal Information include: a) secured files; b) user authentication; c) encryption; d) firewall technology; and e) the use of detection software.
We are responsible for and must: a) identify information to be protected; b) provide an adequate level of protection for that data; c) grant access to protected data only to those people who must use it in the performance of their job-related duties.
Employees who violate our Privacy Policy will be subject to discipline, which may include ending their employment with us.
At the start of our business relationship, we will give You a copy of our current Privacy Policy.
We will also give You a copy of our current Privacy Policy once a year if You maintain a continuing business relationship with us.
We will continue to follow our Privacy Policy regarding Personal Information even when a business relationship no longer exists between us.
|
As used in this Privacy Notice:
Application means your request for our product or service.
Personal Financial Information means financial information such as: a) credit history; b) income; c) financial benefits; or d) policy or claim information.
Personal Health Information means health information such as: a) your medical records; or b) information about your illness, disability or injury.
Personal Information means information that identifies You personally and is not otherwise available to the public. It includes: a) Personal Financial Information; and b) Personal Health Information.
Transaction means your business dealings with us, such as: a) your Application; b) your request for us to pay a claim; and c) your request for us to take an action on your account.
You means an individual who has given us Personal Information in conjunction with: a) asking about; b) applying for; or c) obtaining; a financial product or service from us if the product or service is used mainly for personal, family, or household purposes.
|
This Privacy Policy is being provided on behalf of the following affiliates of The Hartford Financial Services Group, Inc.:
1stAGChoice, Inc.; Access CoverageCorp, Inc.; Access CoverageCorp Technologies, Inc.; American Maturity Life Insurance Company; Archway 60 R, LLC; Business Management Group, Inc.; Champlain Life Reinsurance Company; DMS R, LLC; Eloy R, LLC; Ersatz Corporation; First State Insurance Company; Hartford Accident and Indemnity Company; Hartford Administrative Services Company; Hartford Casualty General Agency, Inc.; Hartford Casualty Insurance Company; Hartford-Comprehensive Employee Benefit Service Company; Hartford Equity Sales Company, Inc.; Hartford Fire General Agency, Inc.; Hartford Fire Insurance Company; Hartford Funds Management Company, LLC; Hartford Funds Management Group, Inc.; Hartford HLS Series Fund II, Inc.; Hartford Insurance Company of Illinois; Hartford Insurance Company of the Midwest; Hartford Insurance Company of the Southeast; Hartford Integrated Technologies, Inc.; Hartford International Life Reassurance Corporation; Hartford Funds Distributors, LLC; Hartford Investment Management Company; Hartford Life and Accident Insurance Company; Hartford Life and Annuity Insurance Company; Hartford Life Insurance Company; Hartford Life Private Placement, LLC; Hartford Lloyd’s Corporation; Hartford Lloyd’s Insurance Company; Hartford Mezzanine Investors I, LLC; Hartford Residual Market, L.C.C.; Hartford Retirement Services, LLC; Hartford Securities Distribution Company, Inc.; Hartford Series Fund, Inc.; Hartford Specialty Insurance Services of Texas, LLC; Hartford Strategic Investments, LLC; Hartford Underwriters Insurance Company; Hartford Technology Services Company, L.L.C.; Hartford of Texas General Agency, Inc.; Hartford Underwriters General Agency, Inc.; HARTRE Company, L.C.C.; HL Investment Advisors, LLC; HLA LLC; Horizon Management Group, LLC; HRA Brokerage Services, Inc.; Lanidex Class B, LLC; M-CAP Insurance Agency, LLC; New England Insurance Company; New England Reinsurance Corporation; Nutmeg Insurance Agency, Inc.; Nutmeg Insurance Company; Pacific Insurance Company, Limited; Planco, LLC: Property and Casualty Insurance Company of Hartford; Revere R, LLC; RVR R, LLC; Sentinel Insurance Company, Ltd.; Sunstone R, LLC; Symphony R, LLC; The Evergreen Group Incorporated; The Hartford Alternative Strategies Fund; The Hartford Mutual Funds, Inc.; The Hartford Mutual Funds II, Inc.; Trumbull Flood Management, L.L.C.; Trumbull Insurance Company; Twin City Fire Insurance Company; White River Life Reinsurance Company.
HPP Revised January 2014
HARTFORDFUNDS
hartfordfunds.com
This information is written in connection with the promotion or marketing of the matter(s) addressed in this material.
This report is submitted for the general information of the shareholders of the Fund. It is not authorized for distribution unless preceded or accompanied by a current prospectus for the Fund.
The information cannot be used or relied upon for the purpose of avoiding IRS penalties. These materials are not intended to provide tax, accounting or legal advice. As with all matters of a tax or legal nature, you should consult your own tax or legal counsel for advice.
Investors should carefully consider the investment objectives, risks, charges, and expenses of Hartford Funds before investing. This and other information can be found in the prospectus and summary prospectus, which can be obtained by calling 888-843-7824 (retail) or 800-279-1541 (institutional). Investors should read them carefully before they invest.
Hartford Funds are underwritten and distributed by Hartford Funds Distributors, LLC.
MFAR-IG14 12/14 113987-3 Printed in U.S.A.
HARTFORDFUNDS
|
THE HARTFORD INTERNATIONAL
2014 Annual Report |
A MESSAGE FROM THE PRESIDENT
Dear Fellow Shareholders:
Thank you for investing in Hartford Funds.
Market Review
U.S. equities (as represented by the S&P 500 Index) rose steadily for the fiscal year ended October 31, 2014, with a return of 17.27% for the period. With the exception of short-lived geopolitical scares early in 2014 and concerns about continuing global growth near the end of the period, stocks generally rose on solid fundamentals and encouraging macroeconomic data during the year.
September 2014 marked the six-year anniversary of the start of the financial crisis. Within weeks of that anniversary, both the S&P 500 Index and the Dow Jones Industrial Average set new all-time highs, closing at 2,018 and 17,391, respectively, on October 31. Although the fallout of the crisis continues to influence investor behavior, stocks have recovered and risen dramatically, up 198% from their low in March 2009. Meanwhile, the domestic economy is notching strong growth, and the unemployment rate has reached its lowest level since August 2008.
While the U.S. economy appears to have stabilized and to have reverted to a solid growth path, the outlook for the global economy appears to have gotten cloudier. The U.S. Federal Reserve has ended quantitative easing, while Europe and Japan are pursuing stimulus options to avoid a double-dip recession and deflation, respectively. Diverging central-bank policies will likely continue to play an important role in market movements going forward as investors wait to see the reactions to their efforts and their impacts on global markets.
How have market movements impacted your portfolio throughout the last year? Are your investments still on track to provide the growth or income you need, and are you comfortable with their progress during times of volatility?
Your financial professional can help you navigate today’s markets with confidence, as well as assist you to achieve your investment goals by providing advice on the best options within our fund family to help you work toward overcoming today’s investing challenges. Meet with your financial advisor regularly to examine your portfolio and your investment strategy, and to determine if you’re still on track to meet your goals.
Thank you again for investing with Hartford Funds.
James Davey
President
Hartford Funds
1 The S&P 500 Index is a market capitalization-weighted price index composed of 500 widely held common stocks.
2 The Dow Jones Industrial Average is an unmanaged, price-weighted index of 30 of the largest, most widely held stocks traded on the NYSE
The Hartford International Opportunities Fund
Table of Contents
The views expressed in the Fund’s Manager Discussion under ‘‘Why did the Fund perform this way?’’ and ‘‘What is the outlook?’’ are views of the Fund’s sub-adviser and portfolio management team through the end of the period and are subject to change based on market and other conditions. The Fund’s Manager Discussion is for informational purposes only and does not represent an offer, recommendation or solicitation to buy, hold or sell any security. The specific securities identified and described, if any, do not represent all of the securities purchased or sold and you should not assume that investments in the securities identified and discussed will be profitable.
The Hartford International Opportunities Fund inception 07/22/1996
(sub-advised by Wellington Management Company, LLP)
| Investment objective – The Fund seeks long-term growth of capital. |
Performance Overview 10/31/04 - 10/31/04
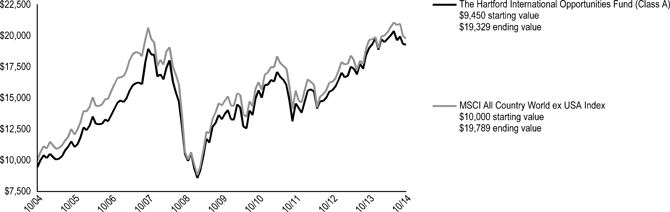
The chart above represents the hypothetical growth of a $10,000 investment in Class A, which includes a sales charge. Growth results in classes other than Class A will vary from what is seen above due to differences in the expenses charged to those share classes.
Average Annual Total Returns (as of 10/31/14)
| 1 Year | 5 Years | 10 Years | ||||||||||
| International Opportunities A# | 1.45 | % | 7.76 | % | 7.42 | % | ||||||
| International Opportunities A## | -4.13 | % | 6.55 | % | 6.81 | % | ||||||
| International Opportunities B# | 0.58 | % | 6.92 | % | 6.84 | %* | ||||||
| International Opportunities B## | -4.26 | % | 6.61 | % | 6.84 | %* | ||||||
| International Opportunities C# | 0.68 | % | 6.97 | % | 6.62 | % | ||||||
| International Opportunities C## | -0.28 | % | 6.97 | % | 6.62 | % | ||||||
| International Opportunities I# | 1.76 | % | 8.14 | % | 7.66 | % | ||||||
| International Opportunities R3# | 1.19 | % | 7.53 | % | 7.32 | % | ||||||
| International Opportunities R4# | 1.47 | % | 7.87 | % | 7.62 | % | ||||||
| International Opportunities R5# | 1.83 | % | 8.21 | % | 7.86 | % | ||||||
| International Opportunities Y# | 1.90 | % | 8.30 | % | 7.96 | % | ||||||
| MSCI All Country World ex USA Index | 0.49 | % | 6.55 | % | 7.06 | % | ||||||
| # | Without sales charge |
| ## | With sales charge |
| * | Class B shares convert to Class A shares after 8 years. The return shown reflects the conversion to Class A shares, which had different operating expenses, for the period after conversion. |
PERFORMANCE DATA QUOTED REPRESENTS PAST PERFORMANCE AND DOES NOT GUARANTEE FUTURE RESULTS. The investment return and principal value of the investment will fluctuate so that investors’ shares, when redeemed, may be worth more or less than their original cost. Current performance may be lower or higher than the performance data quoted. To obtain performance data current to the most recent month-end, please visit our website www.hartfordfunds.com.
The initial investment in Class A shares reflects the maximum sales charge of 5.50% and returns for Class B shares reflect a contingent deferred sales charge of up to 5.00% and declining to zero, depending on the period of time the shares are held. Returns for Class C shares reflect a contingent deferred sales charge of up to 1.00% on shares redeemed within twelve months of purchase.
Total returns presented above were calculated using the Fund’s net asset value available to shareholders for sale or redemption of Fund shares on October 31, 2014, which may exclude investment transactions as of this date. All share class returns assume the reinvestment of all distributions at net asset value and the deduction of all fund expenses.
Effective 9/30/09, Class B shares of the Fund were closed to new investments.
Class I shares commenced operations on 5/30/08. Performance prior to that date is that of the Fund’s Class A shares (excluding sales charges), which had different operating expenses. Class R3, R4 and R5 shares commenced operations on 12/22/06. Performance prior to that date is that of the Fund’s Class Y shares which had different operating expenses.
MSCI All Country World ex USA Index is a broad-based, unmanaged, market capitalization weighted, total return index that measures the performance of both developed and emerging stock markets, excluding the U.S. The index is calculated to exclude companies and share classes which cannot be freely purchased by foreigners.
You cannot invest directly in an index.
The chart and table do not reflect the deductions of taxes that a shareholder would pay on Fund distributions or the redemption of Fund shares.
Performance information may reflect historical or current expense waivers/reimbursements from the investment adviser, without which performance would have been lower. For information on current expense waivers/reimbursements, please see the prospectus.
| 2 |
The Hartford International Opportunities Fund
Manager Discussion
October 31, 2014 (Unaudited)
Operating Expenses*
| Net | Gross | |||||||
| International Opportunities Class A | 1.26 | % | 1.26 | % | ||||
| International Opportunities Class B | 2.05 | % | 2.35 | % | ||||
| International Opportunities Class C | 1.98 | % | 1.98 | % | ||||
| International Opportunities Class I | 0.90 | % | 0.90 | % | ||||
| International Opportunities Class R3 | 1.46 | % | 1.46 | % | ||||
| International Opportunities Class R4 | 1.15 | % | 1.15 | % | ||||
| International Opportunities Class R5 | 0.85 | % | 0.85 | % | ||||
| International Opportunities Class Y | 0.75 | % | 0.75 | % | ||||
| * | As shown in the Fund's prospectus dated March 1, 2014. Actual expenses may be higher or lower. Please see accompanying Financial Highlights for expense ratios for the year ended October 31, 2014. |
Gross expenses are the Fund's total annual operating expenses shown in the Fund's prospectus dated March 1, 2014. Net expenses are the Fund's total annual operating expenses shown in the Fund's prospectus dated March 1, 2014 and reflect contractual expense reimbursements in instances when these reductions reduce the Fund's gross expenses. Contractual reimbursements remain in effect until February 28, 2015, and automatically renew for one-year terms unless terminated.
The Fund filed an updated prospectus, dated November 7, 2014, with the U.S. Securities and Exchange Commission that became effective on that date. However, the information in this annual report is as of October 31, 2014 and does not reflect any changes made to the total annual fund operating expense table in the November 7, 2014 prospectus.
All investments are subject to risk including the possible loss of principal. For a discussion of the Fund’s risks, please see the Main Risks section of this report. For more detailed information on the risks associated with an investment in the Fund, please see the prospectus.
| Portfolio Managers | |
| Nicolas M. Choumenkovitch | Tara C. Stilwell, CFA |
| Senior Vice President and Equity Portfolio Manager | Vice President and Equity Portfolio Manager |
How did the Fund perform?
The Class A shares of The Hartford International Opportunities Fund returned 1.45%, before sales charge, for the twelve-month period ended October 31, 2014, outperforming the Fund’s benchmark, the MSCI All Country World ex USA Index, which returned 0.49% for the same period. The Fund also outperformed the 0.35% average return of the Lipper International Multi-Cap Growth Funds peer group, a group of funds with investment strategies similar to those of the Fund.
Why did the Fund perform this way?
Non-U.S. equities (+0.65%) rose during the period, notwithstanding bouts of significant volatility. Despite ongoing geopolitical tensions in Ukraine and the Middle East, concerns about a Chinese economic growth slowdown, and unsettling economic and political developments in several other emerging market countries, the five-year-old bull market continued in the first half of 2014. Robust merger and acquisition activity, along with continued accommodative monetary policy from central banks around the globe, aided positive investor sentiment in May and June. However, Portuguese banking woes, European economic malaise, and the prospect of an accelerated U.S. Federal Reserve (Fed) interest-rate-hike timeline all contributed to stall the global stock rally near the tail end of the period. In addition, China's property slump and poor gross domestic product (GDP) readings in Japan and the eurozone raised the specter of a slowdown in global economic growth. Nevertheless, there were several positive developments, including monetary easing by the European Central Bank and the People's Bank of China. Despite these positives, many market participants found ample reason to reassess their risk appetites (i.e. reduce risks), given the strong performance in recent years. Also, emerging market equities underperformed their developed market counterparts during the period.
Within the MSCI All Country World ex USA Index six of the ten sectors rose during the period. Healthcare (+15%), Information Technology (+9%), and Utilities (+8%) gained the most. Materials (-9%), Energy (-7%) and Consumer Discretionary (-3%) lagged on a relative basis.
The Fund’s benchmark-relative outperformance over the period was largely due to strong security selection. Strong stock selection in the Information Technology, Healthcare, and Consumer Discretionary sectors more than offset weaker stock selection in Financials, Industrials and Telecommunications Services. Sector allocation, a result of the bottom-up stock selection process, contributed positively to benchmark-relative returns as well, largely due to an overweight in Healthcare and an underweight in Materials.
Top contributors to relative performance during the period included AstraZeneca (Healthcare), NXP Semiconductors (Information Technology), and Tim Hortons (Consumer Discretionary). Shares of AstraZeneca, a U.K.-based multinational pharmaceutical company focused on cardiovascular, gastrointestinal, respiratory, oncology, and neuroscience treatments, outperformed on news that U.S.-based pharmaceutical giant Pfizer offered to acquire the company at a price that AstraZeneca dismissed as too low. The company also has a number of drugs in phase III trials; that number has doubled over the past year and new management is allocating capital to drive long-term growth through investments in immuno-oncology and selective acquisitions. NXP Semiconductors, a Netherlands-based semiconductor company, gained as NXP continued to benefit from a powerful combination of product cycles, structural cost savings,
| 3 |
The Hartford International Opportunities Fund
Manager Discussion – (continued)
October 31, 2014 (Unaudited)
margin expansion, and a competitive advantage in sizable markets such as identification and smart mobile businesses. Shares of Tim Hortons, the dominant player in the Canadian away-from-home coffee market, rose during the period on the announcement of takeover bid from Burger King. Novartis (Healthcare) was also a top contributor to absolute performance.
The largest detractors from relative returns were Deutsche Lufthansa (Industrials), Rexel (Industrials), and BG Group (Energy). Shares of Deutsche Lufthansa, a German international airline, suffered following disappointing earnings driven by unused capacity due to the economic slowdown in Europe. Shares of Rexel, a France-based global distributor of low voltage electrical products, declined due to downward pressure on margins driven by weaker than expected performance by the company’s non-residential business lines. Shares of BG Group, a U.K.-based natural gas-focused oil and gas exploration company, declined as a result of weak upstream earnings over the period. Alpha Bank (Financials) also detracted from absolute and relative performance.
Derivatives are not used in a significant manner in this Fund and did not have a material impact on performance during the period.
What is the outlook?
Despite the downbeat backdrop, we still believe global economic growth will move forward at a modest pace. In this lower growth environment, we are looking to invest in companies which can improve returns on capital by restructuring and building efficiencies in their operations. We also seek to identify companies that can sustain their returns on capital through competitive advantages.
At the end of the period, the Fund was most overweight the Healthcare, Information Technology, and Industrials sectors and most underweight the Financials, Consumer Staples, and Materials sectors relative to its benchmark. On a country basis, the Fund ended the period with an overweight to Japan and Italy and underweight to Australia and Germany.
Currency Concentration of Securities
as of October 31, 2014
| Description | Percentage of Net Assets | |||
| Brazilian Real | 0.4 | % | ||
| British Pound | 14.8 | |||
| Canadian Dollar | 5.7 | |||
| Danish Kroner | 0.2 | |||
| Euro | 29.0 | |||
| Hong Kong Dollar | 2.8 | |||
| Indian Rupee | 2.1 | |||
| Japanese Yen | 20.2 | |||
| Republic of Korea Won | 1.7 | |||
| Swedish Krona | 2.6 | |||
| Swiss Franc | 9.8 | |||
| Taiwanese Dollar | 2.1 | |||
| United States Dollar | 8.4 | |||
| Other Assets and Liabilities | 0.2 | |||
| Total | 100.0 | % | ||
Diversification by Sector
as of October 31, 2014
| Sector | Percentage of Net Assets | |||
| Equity Securities | ||||
| Consumer Discretionary | 10.0 | % | ||
| Consumer Staples | 6.9 | |||
| Energy | 7.9 | |||
| Financials | 21.8 | |||
| Health Care | 15.4 | |||
| Industrials | 11.7 | |||
| Information Technology | 9.7 | |||
| Materials | 5.1 | |||
| Services | 3.7 | |||
| Utilities | 3.9 | |||
| Total | 96.1 | % | ||
| Short-Term Investments | 3.7 | |||
| Other Assets and Liabilities | 0.2 | |||
| Total | 100.0 | % |
A sector may be comprised of several industries. For Fund compliance purposes, the Fund may not use the same classification system and these sector classifications are used for reporting ease.
| 4 |
The Hartford International Opportunities Fund
Schedule of Investments
October 31, 2014
(000’s Omitted)
| Shares or Principal Amount | Market Value ╪ | |||||||
| Common Stocks - 96.1% | ||||||||
| Belgium - 3.1% | ||||||||
| 379 | Anheuser-Busch InBev N.V. | $ | 42,007 | |||||
| 75 | Umicore S.A. | 2,933 | ||||||
| 44,940 | ||||||||
| Brazil - 0.9% | ||||||||
| 458 | BB Seguridade Participacoes | 6,108 | ||||||
| 525 | Petroleo Brasileiro S.A. ADR | 6,138 | ||||||
| 12,246 | ||||||||
| Canada - 5.7% | ||||||||
| 242 | Canadian National Railway Co. | 17,041 | ||||||
| 470 | Imperial Oil Ltd. | 22,625 | ||||||
| 195 | Tim Hortons, Inc. | 15,783 | ||||||
| 533 | Transcanada Corp. | 26,291 | ||||||
| 81,740 | ||||||||
| China - 4.1% | ||||||||
| 155 | Alibaba Group Holding Ltd. ● | 15,251 | ||||||
| 53 | Baidu, Inc. ADR ● | 12,700 | ||||||
| 1,966 | ENN Energy Holdings Ltd. | 12,756 | ||||||
| 5,172 | Lenovo Group Ltd. | 7,623 | ||||||
| 8,394 | PetroChina Co., Ltd. | 10,509 | ||||||
| 58,839 | ||||||||
| Colombia - 0.3% | ||||||||
| 374 | Grupo Aval Acciones y Valores S.A. | 5,043 | ||||||
| Denmark - 0.2% | ||||||||
| 156 | H. Lundbeck A/S | 3,313 | ||||||
| Finland - 0.6% | ||||||||
| 188 | Kone Oyj Class B | 8,113 | ||||||
| France - 9.7% | ||||||||
| 271 | Air Liquide | 32,714 | ||||||
| 114 | BNP Paribas | 7,167 | ||||||
| 171 | Cie Generale d'Optique Essilor International S.A. | 18,866 | ||||||
| 269 | Groupe Eurotunnel S.A. | 3,396 | ||||||
| 427 | Orange S.A. | 6,798 | ||||||
| 114 | Peugeot S.A. ● | 1,355 | ||||||
| 732 | Rexel S.A. | 12,308 | ||||||
| 304 | Schneider Electric S.A. | 23,940 | ||||||
| 84 | Societe Generale Class A | 4,066 | ||||||
| 116 | Unibail Rodamco REIT | 29,619 | ||||||
| 140,229 | ||||||||
| Germany - 2.4% | ||||||||
| 151 | Brenntag AG | 7,328 | ||||||
| 50 | Continental AG | 9,845 | ||||||
| 372 | Deutsche Lufthansa AG | 5,506 | ||||||
| 376 | Deutsche Post AG | 11,854 | ||||||
| 34,533 | ||||||||
| Greece - 1.2% | ||||||||
| 16,455 | Alpha Bank A.E. ● | 10,727 | ||||||
| 593 | Hellenic Telecommunications Organization S.A. ● | 6,701 | ||||||
| 17,428 | ||||||||
| Hong Kong - 0.7% | ||||||||
| 435 | Hong Kong Exchanges & Clearing Ltd. | 9,650 | ||||||
| India - 2.1% | ||||||||
| 702 | ICICI Bank Ltd. | 18,639 | ||||||
| 545 | ITC Ltd. | 3,153 | ||||||
| 970 | Power Grid Corp. of India Ltd. | 2,302 | ||||||
| 339 | Reliance Industries Ltd. | 5,502 | ||||||
| 29,596 | ||||||||
| Ireland - 2.5% | ||||||||
| 28,774 | Bank of Ireland ● | 11,327 | ||||||
| 1,119 | CRH plc | 24,863 | ||||||
| 36,190 | ||||||||
| Italy - 6.1% | ||||||||
| 1,002 | Assicurazioni Generali S.p.A. | 20,554 | ||||||
| 283 | Banca Generali S.p.A. | 7,517 | ||||||
| 1,295 | FinecoBank Banca Fineco S.p.A. ● | 6,738 | ||||||
| 2,320 | Intesa Sanpaolo S.p.A. | 6,820 | ||||||
| 435 | Luxottica Group S.p.A. | 22,187 | ||||||
| 4,335 | Snam S.p.A. | 23,443 | ||||||
| 87,259 | ||||||||
| Japan - 20.2% | ||||||||
| 309 | Aisin Seiki Co., Ltd. ☼ | 10,277 | ||||||
| 388 | Asahi Group Holdings Ltd. | 12,037 | ||||||
| 221 | Asics Corp. | 5,165 | ||||||
| 169 | Bridgestone Corp. | 5,631 | ||||||
| 89 | Daito Trust Construction Co., Ltd. | 11,072 | ||||||
| 501 | Daiwa House Industry Co., Ltd. | 9,481 | ||||||
| 243 | Eisai Co., Ltd. | 9,515 | ||||||
| 1,877 | Hitachi Ltd. | 14,748 | ||||||
| 959 | Isuzu Motors Ltd. | 12,515 | ||||||
| 191 | Japan Exchange Group, Inc. | 4,741 | ||||||
| 245 | Kansai Electric Power Co., Inc. ● | 2,415 | ||||||
| 263 | Kyushu Electric Power Co., Inc. ● | 2,851 | ||||||
| 645 | M3, Inc. | 10,760 | ||||||
| 3,362 | Mitsubishi UFJ Financial Group, Inc. | 19,598 | ||||||
| 627 | Mitsui Fudosan Co., Ltd. | 20,159 | ||||||
| 3,220 | NEC Corp. | 11,387 | ||||||
| 193 | Nippon Telegraph & Telephone Corp. | 11,985 | ||||||
| 358 | Olympus Corp. ● | 12,848 | ||||||
| 189 | Ono Pharmaceutical Co., Ltd. | 19,091 | ||||||
| 1,107 | Rakuten, Inc. | 12,479 | ||||||
| 614 | Seven & I Holdings Co., Ltd. | 23,985 | ||||||
| 173 | Shikoku Electric Power Co. ● | 2,377 | ||||||
| 137 | SoftBank Corp. | 9,981 | ||||||
| 508 | T&D Holdings, Inc. | 6,546 | ||||||
| 247 | Takeda Pharmaceutical Co., Ltd. | 10,727 | ||||||
| 4,023 | Toshiba Corp. | 17,767 | ||||||
| 290,138 | ||||||||
| Jersey - 0.5% | ||||||||
| 1,413 | Glencore plc | 7,251 | ||||||
| Netherlands - 6.1% | ||||||||
| 111 | ASML Holding N.V. | 11,075 | ||||||
| 1,915 | ING Groep N.V. ● | 27,424 | ||||||
| 5,203 | Koninklijke (Royal) KPN N.V. | 17,126 | ||||||
| 219 | NXP Semiconductors N.V. ● | 15,055 | ||||||
| 487 | Royal Dutch Shell plc | 17,407 | ||||||
| 88,087 | ||||||||
| Panama - 0.1% | ||||||||
| 95 | Avianca Holdings S.A. ADR ‡ | 1,409 | ||||||
| Portugal - 0.5% | ||||||||
| 513 | Galp Energia SGPS S.A. | 7,437 | ||||||
The accompanying notes are an integral part of these financial statements.
| 5 |
The Hartford International Opportunities Fund
Schedule of Investments – (continued)
October 31, 2014
(000’s Omitted)
| Shares or Principal Amount | Market Value ╪ | |||||||
| Common Stocks - 96.1% - (continued) | ||||||||
| Romania - 0.3% | ||||||||
| 284 | Electrica S.A. ■● | $ | 3,824 | |||||
| South Korea - 1.7% | ||||||||
| 323 | Hynix Semiconductor, Inc. ● | 14,383 | ||||||
| 80 | Korea Electric Power Corp. | 3,506 | ||||||
| 21 | Posco Ltd. | 6,176 | ||||||
| 24,065 | ||||||||
| Spain - 0.7% | ||||||||
| 1,874 | CaixaBank | 10,239 | ||||||
| Sweden - 2.6% | ||||||||
| 426 | Assa Abloy Ab | 22,638 | ||||||
| 231 | Electrolux AB Series B | 6,556 | ||||||
| 379 | SKF AB Class B | 7,596 | ||||||
| 36,790 | ||||||||
| Switzerland - 9.8% | ||||||||
| 159 | Adecco S.A. | 10,788 | ||||||
| 34 | Compagnie Financiere Richemont S.A. | 2,839 | ||||||
| 542 | Julius Baer Group Ltd. | 23,760 | ||||||
| 524 | Novartis AG | 48,647 | ||||||
| 103 | Roche Holding AG | 30,535 | ||||||
| 1,442 | UBS AG | 25,078 | ||||||
| 141,647 | ||||||||
| Taiwan - 2.1% | ||||||||
| 7,066 | Taiwan Semiconductor Manufacturing Co., Ltd. | 30,631 | ||||||
| United Kingdom - 11.4% | ||||||||
| 273 | Al Noor Hospitals Group | 4,449 | ||||||
| 684 | AstraZeneca plc | 49,991 | ||||||
| 1,040 | BG Group plc | 17,326 | ||||||
| 1,587 | British Sky Broadcasting Group plc | 22,492 | ||||||
| 61 | Derwent London plc REIT | 2,908 | ||||||
| 657 | Diageo Capital plc | 19,369 | ||||||
| 1,276 | Direct Line Insurance Group plc | 5,644 | ||||||
| 369 | easyJet plc | 8,867 | ||||||
| 1,707 | International Consolidated Airlines Group S.A. ● | 11,198 | ||||||
| 597 | NMC Health plc | 4,730 | ||||||
| 120 | Schroders plc | 4,625 | ||||||
| 657 | WPP plc | 12,829 | ||||||
| 164,428 | ||||||||
| United States - 0.5% | ||||||||
| 310 | Markit Ltd. ● | 7,909 | ||||||
| Total Common Stocks | ||||||||
| (Cost $1,332,483) | $ | 1,382,974 | ||||||
| Total Long-Term Investments (Cost $1,332,483) | $ | 1,382,974 | ||||||
| Short-Term Investments - 3.7% | ||||||||
| Repurchase Agreements - 3.7% | ||||||||
| Bank of America Merrill Lynch TriParty Repurchase Agreement (maturing on 11/03/2014 in the amount of $153, collateralized by U.S. Treasury Note 1.50%, 2019, value of $156) | ||||||||
| $ | 153 | 0.08%, 10/31/2014 | $ | 153 | ||||
| Bank of America Merrill Lynch TriParty Repurchase Agreement (maturing on 11/03/2014 in the amount of $2,607, collateralized by GNMA 1.63% - 7.00%, 2031 - 2054, value of $2,659) | ||||||||
| 2,607 | 0.09%, 10/31/2014 | 2,607 | ||||||
| Bank of Montreal TriParty Repurchase Agreement (maturing on 11/03/2014 in the amount of $700, collateralized by U.S. Treasury Bond 2.88% - 5.25%, 2029 - 2043, U.S. Treasury Note 0.38% - 4.50%, 2015 - 2022, value of $714) | ||||||||
| 700 | 0.08%, 10/31/2014 | 700 | ||||||
| Bank of Montreal TriParty Repurchase Agreement (maturing on 11/03/2014 in the amount of $2,374, collateralized by FHLMC 2.00% - 5.50%, 2022 - 2034, FNMA 2.00% - 4.50%, 2024 - 2039, GNMA 3.00%, 2043, U.S. Treasury Note 4.63%, 2017, value of $2,422) | ||||||||
| 2,374 | 0.10%, 10/31/2014 | 2,374 | ||||||
| Barclays Capital TriParty Repurchase Agreement (maturing on 11/03/2014 in the amount of $8,946, collateralized by U.S. Treasury Bond 4.50% - 6.25%, 2023 - 2036, U.S. Treasury Note 1.63% - 2.13%, 2015 - 2019, value of $9,125) | ||||||||
| 8,946 | 0.08%, 10/31/2014 | 8,946 | ||||||
| Citigroup Global Markets, Inc. TriParty Repurchase Agreement (maturing on 11/03/2014 in the amount of $10,283, collateralized by U.S. Treasury Bill 0.02%, 2015, U.S. Treasury Bond 3.88% - 11.25%, 2015 - 2040, U.S. Treasury Note 2.00% - 3.38%, 2019 - 2021, value of $10,488) | ||||||||
| 10,282 | 0.09%, 10/31/2014 | 10,282 | ||||||
| Deutsche Bank Securities TriParty Repurchase Agreement (maturing on 11/03/2014 in the amount of $594, collateralized by U.S. Treasury Note 0.88%, 2017, value of $605) | ||||||||
| 594 | 0.13%, 10/31/2014 | 594 | ||||||
| RBS Securities, Inc. TriParty Repurchase Agreement (maturing on 11/03/2014 in the amount of $874, collateralized by U.S. Treasury Bond 3.63% - 5.00%, 2037 - 2043, U.S. Treasury Note 2.13%, 2020, value of $891) | ||||||||
| 874 | 0.07%, 10/31/2014 | 874 | ||||||
| Societe Generale TriParty Repurchase Agreement (maturing on 11/03/2014 in the amount of $9,205, collateralized by U.S. Treasury Bill 0.02%, 2015, U.S. Treasury Bond 3.75% - 11.25%, 2015 - 2043, U.S. Treasury Note 1.38% - 4.25%, 2015 - 2022, value of $9,389) | ||||||||
| 9,205 | 0.08%, 10/31/2014 | 9,205 | ||||||
The accompanying notes are an integral part of these financial statements.
| 6 |
The Hartford International Opportunities Fund
Schedule of Investments – (continued)
October 31, 2014
(000’s Omitted)
| Shares or Principal Amount | Market Value ╪ | |||||||||||
| Short-Term Investments - 3.7% - (continued) | ||||||||||||
| Repurchase Agreements - 3.7% - (continued) | ||||||||||||
| TD Securities TriParty Repurchase Agreement (maturing on 11/03/2014 in the amount of $17,837, collateralized by FHLMC 3.00% - 4.00%, 2026 - 2044, FNMA 2.50% - 5.00%, 2025 - 2044, U.S. Treasury Bond 3.50% - 6.50%, 2026 - 2041, U.S. Treasury Note 1.75% - 2.88%, 2018 - 2019, value of $18,194) |
||||||||||||
| $ | 17,837 | 0.10%, 10/31/2014 | $ | 17,837 | ||||||||
| 53,572 | ||||||||||||
| Total Short-Term Investments | ||||||||||||
| (Cost $53,572) | $ | 53,572 | ||||||||||
| Total Investments | ||||||||||||
| (Cost $1,386,055) ▲ | 99.8 | % | $ | 1,436,546 | ||||||||
| Other Assets and Liabilities | 0.2 | % | 2,943 | |||||||||
| Total Net Assets | 100.0 | % | $ | 1,439,489 | ||||||||
The accompanying notes are an integral part of these financial statements.
| 7 |
The Hartford International Opportunities Fund
Schedule of Investments – (continued)
October 31, 2014
(000’s Omitted)
Note: Percentage of investments as shown is the ratio of the total market value to total net assets.
Prices of foreign equities that are principally traded on certain foreign markets may be adjusted daily pursuant to a fair value pricing service approved by the Board of Directors in order to reflect an adjustment for factors occurring after the close of certain foreign markets but before the close of the New York Stock Exchange.
Equity industry classifications
used in this report are the Global Industry Classification Standard, which was developed by and is the exclusive property and service
mark of MSCI, Inc. and Standard & Poor’s.
For Fund compliance purposes, the Fund may not use the same classification system shown in this report
as these classifications are used for reporting ease.
| ▲ | At October 31, 2014, the cost of securities for federal income tax purposes was $1,390,775 and the aggregate gross unrealized appreciation and depreciation based on that cost were: |
| Unrealized Appreciation | $ | 102,688 | ||
| Unrealized Depreciation | (56,917 | ) | ||
| Net Unrealized Appreciation | $ | 45,771 |
| ● | Non-income producing. |
| ☼ | This security, or a portion of this security, was purchased on a when-issued or delayed-delivery basis. The cost of these securities was $638 at October 31, 2014. |
| ‡ | This security, or a portion of this security, has been segregated to cover funding requirements on investment transactions settling in the future. |
| ■ | Securities issued within terms of a private placement memorandum, exempt from registration under Rule 144A under the Securities Act of 1933, as amended, and may be sold only to qualified institutional buyers. Unless otherwise indicated, these holdings are determined to be liquid. At October 31, 2014, the aggregate value of these securities was $3,824, which represents 0.3% of total net assets. |
Foreign Currency Contracts Outstanding at October 31, 2014
| Unrealized Appreciation/(Depreciation) | ||||||||||||||||||||||
| Currency | Buy / Sell | Delivery Date | Counterparty | Contract Amount | Market Value ╪ | Asset | Liability | |||||||||||||||
| GBP | Buy | 11/03/2014 | BMO | $ | 670 | $ | 670 | $ | – | $ | – | |||||||||||
| HKD | Buy | 11/04/2014 | BCLY | 1,420 | 1,420 | – | – | |||||||||||||||
| HKD | Buy | 11/03/2014 | UBS | 666 | 666 | – | – | |||||||||||||||
| JPY | Buy | 11/04/2014 | SSG | 663 | 638 | – | (25 | ) | ||||||||||||||
| JPY | Sell | 11/06/2014 | DEUT | 704 | 700 | 4 | – | |||||||||||||||
| Total | $ | 4 | $ | (25 | ) | |||||||||||||||||
| ╪ | See Significant Accounting Policies of accompanying Notes to Financial Statements regarding valuation of securities. |
| GLOSSARY: (abbreviations used in preceding Schedule of Investments) |
| Counterparty Abbreviations: | |
| BCLY | Barclays |
| BMO | Bank of Montreal |
| DEUT | Deutsche Bank Securities, Inc. |
| SSG | State Street Global Markets LLC |
| UBS | UBS AG |
| Currency Abbreviations: | |
| GBP | British Pound |
| HKD | Hong Kong Dollar |
| JPY | Japanese Yen |
| Other Abbreviations: | |
| ADR | American Depositary Receipt |
| FHLMC | Federal Home Loan Mortgage Corp. |
| FNMA | Federal National Mortgage Association |
| GNMA | Government National Mortgage Association |
| REIT | Real Estate Investment Trust |
The accompanying notes are an integral part of these financial statements.
| 8 |
The Hartford International Opportunities Fund
Schedule of Investments – (continued)
October 31, 2014
(000’s Omitted)
Investment Valuation Hierarchy Level Summary
October 31, 2014
| Total | Level 1 ♦ | Level 2 ♦ | Level 3 | ||||||||||
| Assets: | |||||||||||||
| Common Stocks | |||||||||||||
| Belgium | $ | 44,940 | $ | – | $ | 44,940 | $ | – | |||||
| Brazil | 12,246 | 12,246 | – | – | |||||||||
| Canada | 81,740 | 81,740 | – | – | |||||||||
| China | 58,839 | 27,951 | 30,888 | – | |||||||||
| Colombia | 5,043 | 5,043 | – | – | |||||||||
| Denmark | 3,313 | – | 3,313 | – | |||||||||
| Finland | 8,113 | – | 8,113 | – | |||||||||
| France | 140,229 | – | 140,229 | – | |||||||||
| Germany | 34,533 | – | 34,533 | – | |||||||||
| Greece | 17,428 | – | 17,428 | – | |||||||||
| Hong Kong | 9,650 | – | 9,650 | – | |||||||||
| India | 29,596 | – | 29,596 | – | |||||||||
| Ireland | 36,190 | – | 36,190 | – | |||||||||
| Italy | 87,259 | – | 87,259 | – | |||||||||
| Japan | 290,138 | – | 290,138 | – | |||||||||
| Jersey | 7,251 | – | 7,251 | – | |||||||||
| Netherlands | 88,087 | 15,055 | 73,032 | – | |||||||||
| Panama | 1,409 | 1,409 | – | – | |||||||||
| Portugal | 7,437 | – | 7,437 | – | |||||||||
| Romania | 3,824 | – | 3,824 | – | |||||||||
| South Korea | 24,065 | – | 24,065 | – | |||||||||
| Spain | 10,239 | – | 10,239 | – | |||||||||
| Sweden | 36,790 | – | 36,790 | – | |||||||||
| Switzerland | 141,647 | – | 141,647 | – | |||||||||
| Taiwan | 30,631 | – | 30,631 | – | |||||||||
| United Kingdom | 164,428 | 9,179 | 155,249 | – | |||||||||
| United States | 7,909 | 7,909 | – | – | |||||||||
| Total | $ | 1,382,974 | $ | 160,532 | $ | 1,222,442 | $ | – | |||||
| Short-Term Investments | 53,572 | – | 53,572 | – | |||||||||
| Total | $ | 1,436,546 | $ | 160,532 | $ | 1,276,014 | $ | – | |||||
| Foreign Currency Contracts* | $ | 4 | $ | – | $ | 4 | $ | – | |||||
| Total | $ | 4 | $ | – | $ | 4 | $ | – | |||||
| Liabilities: | |||||||||||||
| Foreign Currency Contracts* | $ | 25 | $ | – | $ | 25 | $ | – | |||||
| Total | $ | 25 | $ | – | $ | 25 | $ | – |
| ♦ | For the year ended October 31, 2014, investments valued at $29,635 were transferred from Level 1 to Level 2, and investments valued at $2,502 were transferred from Level 2 to Level 1. Investments are transferred between Level 1 and Level 2 for a variety of reasons including, but not limited to: |
| 1) | Foreign equities for which a fair value price is more representative of exit value than the local market close (transfer into Level 2). Foreign equities for which the local market close is more representative of exit value (transfer into Level 1). |
| 2) | U.S. Treasury securities that no longer represent the most recent issue (transfer into Level 2). |
| 3) | Equity investments with no observable trading but a bid or mean price is used (transfer into Level 2). Equity investments using observable quoted prices in an active market (transfer into Level 1). |
| * | Derivative instruments (excluding purchased and written options, if applicable) are valued at the unrealized appreciation/depreciation on the investments. |
| Note: | For purposes of reporting transfers between different hierarchy levels, both transfers in and out of each level, as applicable, are shown as if they occurred at the beginning of the period. |
The accompanying notes are an integral part of these financial statements.
| 9 |
The Hartford International Opportunities Fund
Statement of Assets and Liabilities
October 31, 2014
(000’s Omitted)
| Assets: | ||||
| Investments in securities, at market value (cost $1,386,055) | $ | 1,436,546 | ||
| Cash | — | |||
| Foreign currency on deposit with custodian (cost $260) | 259 | |||
| Unrealized appreciation on foreign currency contracts | 4 | |||
| Receivables: | ||||
| Investment securities sold | 2,323 | |||
| Fund shares sold | 1,692 | |||
| Dividends and interest | 3,553 | |||
| Other assets | 72 | |||
| Total assets | 1,444,449 | |||
| Liabilities: | ||||
| Unrealized depreciation on foreign currency contracts | 25 | |||
| Payables: | ||||
| Investment securities purchased | 3,394 | |||
| Fund shares redeemed | 1,101 | |||
| Investment management fees | 185 | |||
| Administrative fees | 6 | |||
| Distribution fees | 42 | |||
| Accrued expenses | 207 | |||
| Total liabilities | 4,960 | |||
| Net assets | $ | 1,439,489 | ||
| Summary of Net Assets: | ||||
| Capital stock and paid-in-capital | $ | 1,220,080 | ||
| Undistributed net investment income | 17,084 | |||
| Accumulated net realized gain | 151,982 | |||
| Unrealized appreciation of investments and the translation of assets and liabilities denominated in foreign currency | 50,343 | |||
| Net assets | $ | 1,439,489 | ||
| Shares authorized | 650,000 | |||
| Par value | $ | 0.001 | ||
| Class A: Net asset value per share/Maximum offering price per share | $16.96/$17.95 | |||
| Shares outstanding | 27,476 | |||
| Net assets | $ | 465,854 | ||
| Class B: Net asset value per share | $ | 15.52 | ||
| Shares outstanding | 440 | |||
| Net assets | $ | 6,825 | ||
| Class C: Net asset value per share | $ | 15.20 | ||
| Shares outstanding | 3,626 | |||
| Net assets | $ | 55,122 | ||
| Class I: Net asset value per share | $ | 16.91 | ||
| Shares outstanding | 5,879 | |||
| Net assets | $ | 99,430 | ||
| Class R3: Net asset value per share | $ | 17.18 | ||
| Shares outstanding | 2,376 | |||
| Net assets | $ | 40,827 | ||
| Class R4: Net asset value per share | $ | 17.43 | ||
| Shares outstanding | 6,022 | |||
| Net assets | $ | 104,977 | ||
| Class R5: Net asset value per share | $ | 17.58 | ||
| Shares outstanding | 4,860 | |||
| Net assets | $ | 85,424 | ||
| Class Y: Net asset value per share | $ | 17.66 | ||
| Shares outstanding | 32,906 | |||
| Net assets | $ | 581,030 |
The accompanying notes are an integral part of these financial statements.
| 10 |
The Hartford International Opportunities Fund
Statement of Operations
For the Year Ended October 31, 2014
(000’s Omitted)
| Investment Income: | ||||
| Dividends | $ | 35,848 | ||
| Interest | 25 | |||
| Less: Foreign tax withheld | (4,240 | ) | ||
| Total investment income | 31,633 | |||
| Expenses: | ||||
| Investment management fees | 10,477 | |||
| Administrative services fees | ||||
| Class R3 | 76 | |||
| Class R4 | 143 | |||
| Class R5 | 84 | |||
| Transfer agent fees | ||||
| Class A | 962 | |||
| Class B | 45 | |||
| Class C | 101 | |||
| Class I | 86 | |||
| Class R3 | 3 | |||
| Class R4 | 3 | |||
| Class R5 | 2 | |||
| Class Y | 12 | |||
| Distribution fees | ||||
| Class A | 1,125 | |||
| Class B | 81 | |||
| Class C | 523 | |||
| Class R3 | 189 | |||
| Class R4 | 238 | |||
| Custodian fees | 137 | |||
| Accounting services fees | 278 | |||
| Registration and filing fees | 157 | |||
| Board of Directors' fees | 42 | |||
| Audit fees | 30 | |||
| Other expenses | 234 | |||
| Total expenses (before waivers and fees paid indirectly) | 15,028 | |||
| Transfer agent fee waivers | (21 | ) | ||
| Commission recapture | (58 | ) | ||
| Custodian fee offset | — | |||
| Total waivers and fees paid indirectly | (79 | ) | ||
| Total expenses, net | 14,949 | |||
| Net Investment Income | 16,684 | |||
| Net Realized Gain on Investments and Foreign Currency Transactions: | ||||
| Net realized gain on investments | 158,256 | |||
| Net realized gain on foreign currency contracts | 363 | |||
| Net realized loss on other foreign currency transactions | (1,018 | ) | ||
| Net Realized Gain on Investments and Foreign Currency Transactions | 157,601 | |||
| Net Changes in Unrealized Depreciation of Investments and Foreign Currency Transactions: | ||||
| Net unrealized depreciation of investments | (138,051 | ) | ||
| Net unrealized depreciation of foreign currency contracts | (84 | ) | ||
| Net unrealized depreciation of translation of other assets and liabilities in foreign currencies | (63 | ) | ||
| Net Changes in Unrealized Depreciation of Investments and Foreign Currency Transactions | (138,198 | ) | ||
| Net Gain on Investments and Foreign Currency Transactions | 19,403 | |||
| Net Increase in Net Assets Resulting from Operations | $ | 36,087 |
The accompanying notes are an integral part of these financial statements.
| 11 |
The Hartford International Opportunities Fund
Statement of Changes in Net Assets
(000’s Omitted)
| For the Year Ended October 31, 2014 | For the Year Ended October 31, 2013 | |||||||
| Operations: | ||||||||
| Net investment income | $ | 16,684 | $ | 20,667 | ||||
| Net realized gain on investments and foreign currency transactions | 157,601 | 89,695 | ||||||
| Net unrealized appreciation (depreciation) of investments and foreign currency transactions | (138,198 | ) | 131,298 | |||||
| Net Increase in Net Assets Resulting from Operations | 36,087 | 241,660 | ||||||
| Distributions to Shareholders: | ||||||||
| From net investment income | ||||||||
| Class A | (4,724 | ) | (3,139 | ) | ||||
| Class B | (30 | ) | (36 | ) | ||||
| Class C | (339 | ) | (189 | ) | ||||
| Class I | (972 | ) | (521 | ) | ||||
| Class R3 | (327 | ) | (221 | ) | ||||
| Class R4 | (1,024 | ) | (651 | ) | ||||
| Class R5 | (1,108 | ) | (673 | ) | ||||
| Class Y | (11,428 | ) | (7,618 | ) | ||||
| Total from net investment income | (19,952 | ) | (13,048 | ) | ||||
| From net realized gain on investments | ||||||||
| Class A | (12,862 | ) | — | |||||
| Class B | (303 | ) | — | |||||
| Class C | (1,602 | ) | — | |||||
| Class I | (2,079 | ) | — | |||||
| Class R3 | (1,088 | ) | — | |||||
| Class R4 | (2,675 | ) | — | |||||
| Class R5 | (2,378 | ) | — | |||||
| Class Y | (23,481 | ) | — | |||||
| Total from net realized gain on investments | (46,468 | ) | — | |||||
| Total distributions | (66,420 | ) | (13,048 | ) | ||||
| Capital Share Transactions: | ||||||||
| Class A | 83,346 | 69,952 | ||||||
| Class B | (1,887 | ) | (2,090 | ) | ||||
| Class C | 13,445 | 4,658 | ||||||
| Class I | 40,595 | 21,500 | ||||||
| Class R3 | 8,350 | 9,884 | ||||||
| Class R4 | 21,465 | 30,636 | ||||||
| Class R5 | 17,891 | 23,426 | ||||||
| Class Y | (181,968 | ) | 179,280 | |||||
| Net increase from capital share transactions | 1,237 | 337,246 | ||||||
| Net Increase (Decrease) in Net Assets | (29,096 | ) | 565,858 | |||||
| Net Assets: | ||||||||
| Beginning of period | 1,468,585 | 902,727 | ||||||
| End of period | $ | 1,439,489 | $ | 1,468,585 | ||||
| Undistributed (distributions in excess of) net investment income | $ | 17,084 | $ | 16,902 | ||||
The accompanying notes are an integral part of these financial statements.
| 12 |
The Hartford International Opportunities Fund
Notes to Financial Statements
October 31, 2014
(000’s Omitted)
Organization:
The Hartford Mutual Funds, Inc. (“Company”) is an open-end management investment company comprised of forty-two portfolios. Financial statements for The Hartford International Opportunities Fund (the "Fund"), a series of the Company, are included in this report.
The Company is organized under the laws of the State of Maryland and is registered with the Securities and Exchange Commission (“SEC”) under the Investment Company Act of 1940, as amended (“1940 Act”). The Fund is a diversified open-end management investment company. The Fund is an investment company and applies specialized accounting and reporting under Accounting Standards Codification Topic 946, Financial Services - Investment Companies.
Class A shares are sold with a front-end sales charge of up to 5.50%. Class B shares were sold with a contingent deferred sales charge which is assessed on the lesser of the per share net asset value (“NAV”) of the shares at the time of redemption or the original purchase price, and declines from up to 5.00% to zero depending on the period of time the shares are held (see note below regarding the closing of Class B shares). Class C shares are sold with a contingent deferred sales charge of up to 1.00% on shares redeemed within twelve months of purchase. Class I shares are sold without sales charges to certain eligible investors primarily through advisory fee-based wrap programs. Class R3, R4 and R5 shares, which are offered to employer-sponsored retirement plans, and Class Y shares, which are sold to certain eligible institutional investors, are sold without a sales charge. All classes of shares have identical voting, redemption, dividend, liquidation and other rights and the same terms and conditions, with the exceptions that each class may have different expenses, which may affect performance, and that Class B shares automatically convert to Class A shares after 8 years.
No new or additional investments are allowed in Class B shares of the Fund (including investments through any systematic investment plan). Existing shareholders of Class B shares may continue to hold their Class B shares, exchange their Class B shares for Class B shares of another Hartford Fund (as permitted by existing exchange privileges), or redeem their Class B shares as described in the Fund’s prospectus. Reinstatement privileges with respect to Class B shares are set forth in the Fund's prospectus. For investors electing to reinvest capital gains and dividends, any such capital gains or dividends on Class B shares will continue to be reinvested in Class B shares of the Fund. All Class B share attributes, including the 12b-1 fee, contingent deferred sales charge schedule, and conversion to Class A shares, remain unchanged.
Significant Accounting Policies:
The following is a summary of significant accounting policies of the Fund in the preparation of its financial statements, which are in accordance with United States generally accepted accounting principles (“U.S. GAAP”). The preparation of financial statements in accordance with U.S. GAAP may require management to make estimates and assumptions that affect the reported amounts of assets and liabilities and disclosure of contingent assets and liabilities at the date of the financial statements and the reported amounts of increases and decreases in net assets from operations during the reporting period. Actual results could differ from those estimates.
Determination of Net Asset Value – The NAV of each class of the Fund's shares is determined as of the close of regular trading (normally 4:00 p.m. Eastern Time) (the “NYSE Close”) on each day that the New York Stock Exchange (the “Exchange”) is open (“Valuation Date”). Information that becomes known to the Fund after the NAV has been calculated on a particular day will not generally be used to retroactively adjust the NAV determined earlier that day.
Investment Valuation and Fair Value Measurements – For purposes of calculating the NAV, portfolio investments and other assets held by the Fund's portfolio for which market quotes are readily available are valued at market value. Market value is generally determined on the basis of last reported sales prices or official close price. If no sales are reported, market value is based on quotes obtained from a quotation reporting system, established market makers, or independent pricing services. If market prices are not readily available or are deemed unreliable, the Fund will use the fair value of the investment as determined in good faith under policies and procedures established by and under the supervision of the Company's Board of Directors. Market quotes are considered not readily available where there is an absence of current or reliable market-based data (e.g., trade information or indicative market quotes), including where events occur after the close of the relevant market, but prior to the NYSE Close, that materially affect the values of the Fund's portfolio investments or assets. In addition, market quotes are considered not readily available when, due to extraordinary circumstances, the exchanges or markets on which the investments trade do not open for trading for the entire day and no other market prices are available. In addition, prices of foreign equities that are principally traded on certain foreign markets may
| 13 |
The Hartford International Opportunities Fund
Notes to Financial Statements – (continued)
October 31, 2014
(000’s Omitted)
be adjusted daily pursuant to a fair value pricing service approved by the Board of Directors in order to reflect an adjustment for the factors occurring after the close of certain foreign markets but before the NYSE Close. Investments that are primarily traded on foreign markets may trade on days that are not business days of the Fund. The value of the foreign investments in which the Fund invests may change on days when a shareholder will not be able to purchase or redeem shares of the Fund. Fair value pricing is subjective in nature and the use of fair value pricing by the Fund may cause the NAV of its shares to differ significantly from the NAV that would have been calculated using market prices at the close of the exchange on which a portfolio investment is primarily traded. There can be no assurance that the Fund could obtain the fair market value assigned to an investment if the Fund were to sell the investment at approximately the time at which the Fund determines its NAV.
Investments valued in currencies other than U.S. dollars are converted to U.S. dollars using exchange rates obtained from independent pricing services for calculation of the NAV. As a result, the NAV of the Fund’s shares may be affected by changes in the value of currencies in relation to the U.S. dollar. The value of investments traded in markets outside the United States or denominated in currencies other than the U.S. dollar may be affected significantly on a day that the NYSE is closed and the market value may change on days when an investor is not able to purchase, redeem or exchange shares of the Fund.
Foreign currency contracts represent agreements to exchange currencies on specific future dates at predetermined rates. Foreign currency contracts are valued using foreign currency exchange rates and forward rates as provided by an independent pricing service on the Valuation Date.
Financial instruments for which prices are not available from an independent pricing service may be valued using market quotations obtained from one or more dealers that make markets in the respective financial instrument in accordance with procedures established by the Company's Board of Directors.
U.S. GAAP defines fair value as the price that the Fund would receive to sell an asset or pay to transfer a liability in an orderly transaction between market participants. The U.S. GAAP fair value measurement standards require disclosure of a fair value hierarchy for each major category of assets and liabilities. Various inputs are used in determining the fair value of the Fund’s investments. These inputs are summarized into three broad hierarchy levels. This hierarchy is based on whether the valuation inputs are observable or unobservable. These levels are:
Level 1 – Quoted prices in active markets for identical investments. Level 1 may include exchange traded instruments, such as domestic equities, some foreign equities, options, futures, mutual funds, exchange traded funds, rights and warrants.
Level 2 – Observable inputs other than Level 1 prices, such as quoted prices for similar investments; quoted prices in markets that are not active; or other inputs that are observable or can be corroborated by observable market data. Level 2 may include debt investments that are traded less frequently than exchange traded instruments and which are valued using independent pricing services; foreign equities, which are principally traded on certain foreign markets and are adjusted daily pursuant to a fair value pricing service in order to reflect an adjustment for the factors occurring after the close of certain foreign markets but before the NYSE Close; senior floating rate interests, which are valued using an aggregate of dealer bids; short-term investments, which are valued at amortized cost; and swaps, which are valued based upon the terms of each swap contract.
Level 3 – Significant unobservable inputs that are supported by limited or no market activity. Level 3 may include financial instruments whose values are determined using indicative market quotes or require significant management judgment or estimation. These unobservable valuation inputs may include estimates for current yields, maturity/duration, prepayment speed, and indicative market quotes for comparable investments along with other assumptions relating to credit quality, collateral value, complexity of the investment structure, general market conditions and liquidity. This category may include investments where trading has been halted or there are certain restrictions on trading. While these investments are priced using unobservable inputs, the valuation of these investments reflects the best available data and management believes the prices are a reasonable representation of exit price.
The Board of Directors of the Company generally reviews and approves the “Procedures for Valuation of Portfolio Securities” at least once a year. These procedures define how investments are to be valued, including the formation and activities of a Valuation Committee. The Valuation Committee is responsible for determining in good faith the fair value of investments when
| 14 |
The Hartford International Opportunities Fund
Notes to Financial Statements – (continued)
October 31, 2014
(000’s Omitted)
the value cannot be obtained from primary pricing services or alternative sources or if the valuation of an investment as provided by the primary pricing service or alternative source is believed not to reflect the investment’s fair value as of the Valuation Date. Voting members of the Valuation Committee include the Fund's Treasurer or designee and a Vice President of the investment manager or designee. An Assistant Vice President of the Fund with legal expertise or designee is also included on the Valuation Committee as a non-voting advisory member. In addition, the Fund’s Chief Compliance Officer shall designate a member of the compliance group to attend Valuation Committee meetings as a non-voting resource, to monitor for and provide guidance with respect to compliance with these procedures. Two members of the Valuation Committee or their designees, representing different departments, shall constitute a quorum for purposes of permitting the Valuation Committee to take action. The Valuation Committee will consider all relevant factors in determining an investment’s fair value, and may seek the advice of the Fund’s sub-adviser, knowledgeable brokers, and legal counsel in making such determination. The Valuation Committee reports to the Audit Committee of the Company's Board of Directors. The Audit Committee receives quarterly written reports which include details of all fair-valued investments, including the reason for the fair valuation, and an indication, when possible, of the accuracy of the valuation by disclosing the next available reliable public price quotation or the disposition price of such investments (the “look-back” test). The Board of Directors then must consider for ratification all of the fair value determinations made during the previous quarter.
Valuation levels are not necessarily indicative of the risk associated with investing in such investments. Individual investments within any of the above mentioned asset classes may be assigned a different hierarchical level than those presented above, as individual circumstances dictate.
For additional information, refer to the Investment Valuation Hierarchy Level Summary which follows the Schedule of Investments.
Investment Transactions and Investment Income – Investment transactions are recorded as of the trade date (the date the order to buy or sell is executed) for financial reporting purposes. Investments purchased or sold on a when-issued or delayed-delivery basis may be settled a month or more after the trade date. Realized gains and losses are determined on the basis of identified cost.
Dividend income from domestic securities is accrued on the ex-dividend date. In general, dividend income from foreign securities is recorded on the ex-date; however, dividend notifications in certain foreign jurisdictions may not be available in a timely manner and as a result, the Fund will record the dividend as soon as the relevant details (i.e., rate per share, payment date, shareholders of record, etc.) are publicly available. Interest income, including amortization of premium, accretion of discounts and additional principal received in-kind in lieu of cash, is accrued on a daily basis.
Foreign Currency Transactions – Assets and liabilities denominated in currencies other than U.S. dollars are translated into U.S. dollars at the exchange rates in effect on the valuation date. Purchases and sales of investments, income and expenses are translated into U.S. dollars at the exchange rates on the dates of such transactions.
The Fund does not isolate that portion of portfolio investment valuation resulting from fluctuations in the foreign currency exchange rates from the fluctuations arising from changes in the market prices of investments held. Exchange rate fluctuations are included with the net realized and unrealized gain or loss on investments in the accompanying financial statements.
Net realized foreign exchange gains or losses arise from sales of foreign currencies and the difference between asset and liability amounts initially stated in foreign currencies and the U.S. dollar value of the amounts actually received or paid. Net unrealized foreign exchange gains or losses arise from changes in the value of other assets and liabilities at the end of the reporting period, resulting from changes in the exchange rates.
Joint Trading Account – The Fund may invest cash balances into a joint trading account that may be invested in one or more repurchase agreements.
Fund Share Valuation and Dividend Distributions to Shareholders – Orders for the Fund’s shares are executed in accordance with the investment instructions of the shareholders. The NAV of the Fund’s shares is determined as of the close of business on each business day of the Exchange. The NAV is determined separately for each class of shares of the Fund by dividing the Fund’s net assets attributable to that class by the number of shares of the class outstanding. Each class of shares offered by the Fund has equal
| 15 |
The Hartford International Opportunities Fund
Notes to Financial Statements – (continued)
October 31, 2014
(000’s Omitted)
rights as to assets and voting privileges (except that shareholders of a class have exclusive voting rights regarding any matter relating solely to that class of shares). Income and non-class specific expenses are allocated daily to each class on the basis of the relative net assets of the class. Realized and unrealized gains and losses are allocated daily based on the relative net assets of each class of shares of the Fund.
Orders for the purchase of the Fund’s shares received prior to the close of the Exchange on any day the Exchange is open for business are priced at the NAV determined as of the close of the Exchange. Orders received after the close of the Exchange, or on a day on which the Exchange and/or the Fund is not open for business, are priced at the next determined NAV.
Dividends are declared pursuant to a policy adopted by the Company's Board of Directors based upon the investment performance of the Fund. The policy of the Fund is to pay dividends from net investment income and realized gains, if any, at least once a year.
Net investment income, dividends and distributions from net realized gains and capital are determined in accordance with federal income tax regulations, which may differ from U.S. GAAP with respect to character and timing (see Federal Income Taxes: Distributions and Components of Distributable Earnings and Reclassification of Capital Accounts).
Securities and Other Investments:
Repurchase Agreements – A repurchase agreement is an agreement by which a counterparty agrees to sell an investment and agrees to repurchase the investment sold from the buyer at a mutually agreed upon time and price. During the period of the repurchase agreement, the counterparty will deposit cash and or securities in a third party custodial account to serve as collateral. At the time the Fund enters into a repurchase agreement, the value of the underlying collateral, including accrued interest, will be equal to or exceed the value of the repurchase agreement. Repurchase agreements expose the Fund to counterparty risk - that is, the risk that the counterparty will not fulfill its obligations. To minimize counterparty risk, the investments that serve to collateralize the repurchase agreement are held by the Fund’s custodian in book entry or physical form in the custodial account of the Fund or in a third party custodial account. Repurchase agreements are valued at cost plus accrued interest, which approximates fair value. Repurchase agreements have master netting arrangements which allow the Fund to offset amounts owed to a counterparty with amounts owed by the counterparty, including any collateral. Upon an event of default under a master repurchase agreement, the non-defaulting party may close out all transactions traded under such agreement and net amounts owed under each transaction to one net amount payable by one party to the other. Absent an event of default, the master repurchase agreement does not result in an offset of reported amounts of assets and liabilities in the Statement of Assets and Liabilities across transactions between the Fund and the applicable counterparty. The Fund, as shown on the Schedule of Investments, had outstanding repurchase agreements and related collateral as of October 31, 2014.
Illiquid and Restricted Investments – The Fund is permitted to invest up to 15% of its net assets in illiquid investments. Illiquid investments are those that may not be sold or disposed of in the ordinary course of business within seven days, at approximately the price used to determine the Fund’s NAV. The Fund may not be able to sell illiquid investments when its sub-adviser considers it desirable to do so or may have to sell such investments at a price that is lower than the price that could be obtained if the investments were more liquid. A sale of illiquid investments may require more time and may result in higher dealer discounts and other selling expenses than does the sale of those that are liquid. Illiquid investments also may be more difficult to value due to the unavailability of reliable market quotations for such investments, and an investment in them may have an adverse impact on the Fund’s NAV. The Fund may also purchase certain restricted investments that can only be resold to certain qualified investors and may be determined to be liquid pursuant to policies and guidelines established by the Company's Board of Directors. The Fund, as shown on the Schedule of Investments, had illiquid or restricted investments as of October 31, 2014.
Investments Purchased on a When-Issued or Delayed-Delivery Basis – Delivery and payment for investments that have been purchased by the Fund on a forward commitment, or when-issued or delayed-delivery basis, take place beyond the customary settlement period. The Fund may dispose of or renegotiate a delayed-delivery transaction after it is entered into, and may sell delayed-delivery investments before they are delivered, which may result in a realized gain or loss. During this period, such investments are subject to market fluctuations, and the Fund identifies investments segregated in its records with a value at least equal to the amount of the commitment. The Fund, as shown on the Schedule of Investments, had when-issued or delayed-delivery investments as of October 31, 2014.
| 16 |
The Hartford International Opportunities Fund
Notes to Financial Statements – (continued)
October 31, 2014
(000’s Omitted)
Financial Derivative Instruments:
The following disclosures contain information on how and why the Fund uses derivative instruments, the credit-risk-related contingent features in certain derivative instruments and how derivative instruments affect the Fund’s financial position and results of operations. The location and fair value amounts of these instruments on the Statement of Assets and Liabilities and the realized gains and losses and changes in unrealized gains and losses on the Statement of Operations, each categorized by type of derivative contract, are included in the following Additional Derivative Instrument Information footnote. The derivative instruments outstanding as of year-end are disclosed in the notes to the Schedule of Investments, if applicable. The amounts of realized gains and losses and changes in unrealized gains and losses on derivative instruments during the year are disclosed in the Statement of Operations.
Foreign Currency Contracts – The Fund may enter into foreign currency contracts that obligate the Fund to purchase or sell currencies at specified future dates. Foreign currency contracts are used to hedge the currency exposure associated with some or all of the Fund’s investments and/or as part of an investment strategy. Foreign currency contracts are marked to market daily and the change in value is recorded by the Fund as an unrealized gain or loss. The Fund will record a realized gain or loss when the foreign currency contract is settled.
Foreign currency contracts involve elements of market risk in excess of the amounts reflected in the Statement of Assets and Liabilities. In addition, risks may arise upon entering into these contracts from the potential inability of the counterparties to meet the terms of the contracts and from unanticipated movements in the value of the foreign currencies relative to the U.S. dollar. The Fund, as shown on the Schedule of Investments, had outstanding foreign currency contracts as of October 31, 2014.
Additional Derivative Instrument Information:
Fair Value of Derivative Instruments on the Statement of Assets and Liabilities as of October 31, 2014:
| Risk Exposure Category | ||||||||||||||||||||||||||||
| Interest Rate Contracts | Foreign Exchange Contracts | Credit Contracts | Equity Contracts | Commodity Contracts | Other Contracts | Total | ||||||||||||||||||||||
| Assets: | ||||||||||||||||||||||||||||
| Unrealized appreciation on foreign currency contracts | $ | — | $ | 4 | $ | — | $ | — | $ | — | $ | — | $ | 4 | ||||||||||||||
| Total | $ | — | $ | 4 | $ | — | $ | — | $ | — | $ | — | $ | 4 | ||||||||||||||
| Liabilities: | ||||||||||||||||||||||||||||
| Unrealized depreciation on foreign currency contracts | $ | — | $ | 25 | $ | — | $ | — | $ | — | $ | — | $ | 25 | ||||||||||||||
| Total | $ | — | $ | 25 | $ | — | $ | — | $ | — | $ | — | $ | 25 | ||||||||||||||
The volume of derivatives that is presented in the Schedule of Investments is consistent with the derivative activity during the year ended October 31, 2014.
The Effect of Derivative Instruments on the Statement of Operations for the year ended October 31, 2014:
| Risk Exposure Category | ||||||||||||||||||||||||||||
| Interest Rate Contracts | Foreign Exchange Contracts | Credit Contracts | Equity Contracts | Commodity Contracts | Other Contracts | Total | ||||||||||||||||||||||
| Realized Gain on Derivatives Recognized as a Result of Operations: | ||||||||||||||||||||||||||||
| Net realized gain on foreign currency contracts | $ | — | $ | 363 | $ | — | $ | — | $ | — | $ | — | $ | 363 | ||||||||||||||
| Total | $ | — | $ | 363 | $ | — | $ | — | $ | — | $ | — | $ | 363 | ||||||||||||||
| Net Change in Unrealized Appreciation (Depreciation) on Derivatives Recognized as a Result of Operations: | ||||||||||||||||||||||||||||
| Net change in unrealized depreciation of foreign currency contracts | $ | — | $ | (84 | ) | $ | — | $ | — | $ | — | $ | — | $ | (84 | ) | ||||||||||||
| Total | $ | — | $ | (84 | ) | $ | — | $ | — | $ | — | $ | — | $ | (84 | ) | ||||||||||||
| 17 |
The Hartford International Opportunities Fund
Notes to Financial Statements – (continued)
October 31, 2014
(000’s Omitted)
The derivatives held by the Fund as of October 31, 2014 are not subject to a master netting arrangement; therefore, no balance sheet offsetting disclosure is presented.
Principal Risks:
The Fund may be exposed to counterparty risk, or the risk that an institution or other entity with which the Fund has unsettled or open transactions will default.
If the Fund invests directly in foreign currencies or in securities that trade in, and receive revenues in, foreign currencies, or in derivatives that provide exposure to foreign currencies, it will be subject to the risk that those currencies will decline in value relative to the base currency (U.S. dollars) of the Fund, or, in the case of hedging positions, that the Fund’s base currency will decline in value relative to the currency being hedged. Currency rates in foreign countries may fluctuate significantly over short periods of time for a number of reasons, including changes in interest rates, intervention (or the failure to intervene) by U.S. or foreign governments, central banks or supranational entities, such as the International Monetary Fund, or by the imposition of currency controls or other political developments in the United States or abroad. As a result, the Fund’s investments in foreign currency denominated securities may reduce the returns of the Fund. The market values of equity securities, such as common stocks and preferred stocks, or equity related investments, such as futures and options, may decline due to general market conditions which are not specifically related to a particular company, such as real or perceived adverse economic conditions, changes in the general outlook for corporate earnings, changes in interest or currency rates or adverse investor sentiment generally. The market value of equity securities may also decline due to factors which affect a particular industry or industries, such as labor shortages or increased production costs and competitive conditions within an industry. Equity securities and equity related investments generally have greater market price volatility than fixed income securities.
Federal Income Taxes:
Federal Income Taxes – For federal income tax purposes, the Fund intends to continue to qualify as a Regulated Investment Company ("RIC") under Subchapter M of the Internal Revenue Code (“IRC”) by distributing substantially all of its taxable net investment income and net realized capital gains to its shareholders and otherwise complying with the requirements of the IRC. The Fund has distributed substantially all of its income and capital gains in prior years, if applicable, and intends to distribute substantially all of its income and capital gains during the calendar year ending December 31, 2014. Accordingly, no provision for federal income or excise taxes has been made in the accompanying financial statements. Distributions from short-term capital gains are treated as ordinary income distributions for federal income tax purposes.
Net Investment Income (Loss), Net Realized Gains (Losses) and Distributions – Net investment income (loss) and net realized gains (losses) may differ for financial statement and tax purposes primarily because of losses deferred due to wash sale adjustments, foreign currency gains and losses, adjustments related to Passive Foreign Investment Companies ("PFICs"), Real Estate Investment Trusts ("REITs"), RICs, certain derivatives and partnerships. The character of distributions made during the year from net investment income or net realized gains may differ from their ultimate characterization for federal income tax purposes. Also, due to the timing of dividend distributions, the fiscal year in which amounts are distributed may differ from the year that the income or realized gains (losses) were recorded by the Fund.
Distributions and Components of Distributable Earnings – The tax character of distributions paid by the Fund for the periods indicated is as follows (as adjusted for dividends payable, if applicable):
| For the Year Ended October 31, 2014 | For the Year Ended October 31, 2013 | |||||||
| Ordinary Income | $ | 31,415 | $ | 13,048 | ||||
| Long-Term Capital Gains ‡ | 35,005 | — | ||||||
| ‡ | The Fund designates these distributions as long-term capital gain dividends pursuant to IRC Sec. 852(b)(3)(C). |
| 18 |
The Hartford International Opportunities Fund
Notes to Financial Statements – (continued)
October 31, 2014
(000’s Omitted)
As of October 31, 2014, the Fund’s components of distributable earnings (deficit) on a tax basis are as follows:
| Amount | ||||
| Undistributed Ordinary Income | $ | 53,998 | ||
| Undistributed Long-Term Capital Gain | 119,788 | |||
| Unrealized Appreciation* | 45,623 | |||
| Total Accumulated Earnings | $ | 219,409 | ||
| * | Differences between book-basis and tax-basis unrealized appreciation (depreciation) may be attributable to the losses deferred due to wash sale adjustments, foreign currency gains and losses, adjustments related to PFICs, REITs, RICs, certain derivatives and partnerships. |
Reclassification of Capital Accounts – The Fund may record reclassifications in its capital accounts. These reclassifications have no impact on the total net assets of the Fund. The reclassifications are a result of permanent differences between U.S. GAAP and tax accounting for such items as foreign currency, PFICs, expiration or utilization of capital loss carryforwards or net operating losses. Adjustments are made to reflect the impact these items have on current and future distributions to shareholders. Therefore, the source of the Fund’s distributions may be shown in the accompanying Statement of Changes in Net Assets as from undistributed net investment income, from accumulated net realized gains on investments or from capital depending on the type of book and tax differences that exist. For the year ended October 31, 2014, the Fund recorded reclassifications to increase (decrease) the accounts listed below:
| Amount | ||||
| Undistributed Net Investment Income (Loss) | $ | 3,450 | ||
| Accumulated Net Realized Gain (Loss) | (3,450 | ) | ||
Capital Loss Carryforward – On December 22, 2010, the Regulated Investment Company Modernization Act of 2010 (the “Act”) was enacted, which made changes to the capital loss carryforward rules. The changes are effective for taxable years beginning after the date of enactment. Under the Act, funds are permitted to carry forward capital losses for an unlimited period. Additionally, capital loss carryforwards retain their character as either short-term or long-term capital losses rather than being considered all short-term as permitted under prior regulation.
The Fund had no capital loss carryforward for U.S. federal income tax purposes as of October 31, 2014.
Accounting for Uncertainty in Income Taxes – The Fund has adopted financial reporting rules that require the Fund to analyze all open tax years, as defined by the statute of limitations, for all major jurisdictions. Generally, tax authorities can examine all tax returns filed for the last three years. The Fund does not have an examination in progress.
The Fund has reviewed all open tax years and major jurisdictions and concluded that these financial reporting rules had no effect on the Fund’s financial position or results of operations. There is no tax liability resulting from unrecognized tax benefits relating to uncertain income tax positions taken or expected to be taken on the tax return for the fiscal year ended October 31, 2014. The Fund is also not aware of any tax positions for which it is reasonably possible that the total amounts of unrecognized tax benefits will significantly change in the next twelve months.
Expenses:
Investment Management Agreement – Hartford Funds Management Company, LLC ("HFMC") serves as the Fund’s investment manager pursuant to an Investment Management Agreement with the Company. HFMC is an indirect wholly owned subsidiary of The Hartford Financial Services Group, Inc. ("The Hartford"). The investment manager has overall investment supervisory responsibility for the Fund. In addition, the investment manager provides administrative personnel, services, equipment, facilities and office space for proper operation of the Fund. HFMC has contracted with Wellington Management Company, LLP ("Wellington Management") under a sub-advisory agreement for the provision of day-to-day investment management services to the Fund in accordance with the Fund’s
| 19 |
The Hartford International Opportunities Fund
Notes to Financial Statements – (continued)
October 31, 2014
(000’s Omitted)
investment objective and policies. The Fund pays a fee to the investment manager, a portion of which may be used to compensate Wellington Management.
The schedule below reflects the rates of compensation paid to the investment manager for investment management services rendered as of October 31, 2014; the rates are accrued daily and paid monthly:
| Average Daily Net Assets | Annual Fee | |
| On first $500 million | 0.7500% | |
| On next $500 million | 0.6500% | |
| On next $1.5 billion | 0.6400% | |
| On next $2.5 billion | 0.6350% | |
| On next $5 billion | 0.6300% | |
| Over $10 billion | 0.6250% |
Accounting Services Agreement – Pursuant to the Fund Accounting Agreement between HFMC and the Company, on behalf of the Fund, HFMC provides accounting services to the Fund and receives monthly compensation based on the Fund’s average daily net assets at the rates set forth below. The Fund’s accounting services fees are accrued daily and paid monthly.
| Average Daily Net Assets | Annual Fee | |
| On first $5 billion | 0.018% | |
| On next $5 billion | 0.014% | |
| Over $10 billion | 0.010% |
Operating Expenses – Allocable expenses incurred by the Company are allocated to each Fund and allocated to classes within the Fund in proportion to the average daily net assets of the Fund and each class, except where allocation of certain expenses is more fairly made directly to the Fund or to specific classes within a Fund. As of October 31, 2014, HFMC contractually limited the total operating expenses of this Fund, exclusive of taxes, interest expense, brokerage commissions, acquired fund fees and expenses and extraordinary expenses, through February 28, 2015 as follows:
| Class A | Class B | Class C | Class I | Class R3 | Class R4 | Class R5 | Class Y | |||||||
| 1.30% | 2.05% | 2.05% | 1.05% | 1.50% | 1.20% | 0.90% | 0.85% |
Fees Paid Indirectly – The Fund has entered into agreements with State Street Global Markets, LLC and Russell Implementation Services, Inc. to partially recapture non-discounted trade commissions. Such rebates are used to pay a portion of the Fund’s expenses. In addition, the Fund's custodian bank has agreed to reduce its fees when the Fund maintains cash on deposit in a non-interest-bearing custody account. For the year ended October 31, 2014, these amounts, if any, are included in the Statement of Operations.
| 20 |
The Hartford International Opportunities Fund
Notes to Financial Statements – (continued)
October 31, 2014
(000’s Omitted)
The ratio of expenses to average net assets in the accompanying financial highlights excludes the reduction in expenses related to fees paid indirectly. The annualized expense ratio after waivers for the period listed below reflecting the reduction for fees paid indirectly is as follows:
| Year Ended October 31, 2014 | ||||
| Class A | 1.20 | % | ||
| Class B | 2.03 | |||
| Class C | 1.93 | |||
| Class I | 0.83 | |||
| Class R3 | 1.44 | |||
| Class R4 | 1.14 | |||
| Class R5 | 0.84 | |||
| Class Y | 0.73 | |||
Distribution and Service Plan for Class A, B, C, R3 and R4 Shares – Hartford Funds Distributors, LLC ("HFD"), an indirect wholly owned subsidiary of The Hartford, is the principal underwriter and distributor of the Fund. HFD is engaged in distribution activities, which include marketing and distribution of shares through broker/dealers, financing distribution costs and maintaining financial books and records. For the year ended October 31, 2014, HFD received front-end load sales charges of $3,262 and contingent deferred sales charges of $12 from the Fund.
The Fund has adopted a Distribution and Service Plan in accordance with Rule 12b-1 of the 1940 Act to compensate the distributor (HFD) for activities intended to result in the sale and distribution of Class A, B, C, R3 and R4 shares and for providing services for shareholders. The Rule 12b-1 plan applicable to Class A shares of the Fund provides for payment of a Rule 12b-1 fee of 0.25% of average daily net assets. Some or all of the fee may be used for shareholder servicing expenses with the remainder used for distribution expenses. Under the Class B Plan, the Fund pays the distributor 1.00% of the average daily net assets of Class B shares that are outstanding for 8 years or less, 0.25% of which is a fee for services provided to existing shareholders with the remainder used for distribution expenses. Some or the entire Rule 12b-1 fee for Class B shares may be remitted to broker/dealers for distribution and/or shareholder account services. After eight years, Class B shares convert to Class A shares. Upon conversion to Class A shares, the Class A plan described above will apply to those shares. Under the Class C Plan, the Fund pays the distributor 1.00% of the average daily net assets of Class C shares outstanding, 0.25% of which is intended as a fee for services provided to existing shareholders with the remainder used for distribution expenses. For Class C shares, some or the entire fee may be remitted to broker/dealers for distribution and/or shareholder account services. Class R3 shares have a distribution fee of 0.50% of average daily net assets and Class R4 shares have a distribution fee of 0.25% of average daily net assets. For Class R3 and R4 shares, some or the entire fee may be remitted to broker/dealers for distribution and/or shareholder account services. The Fund’s 12b-1 fees are accrued daily and paid monthly or at such other intervals as the Board of Directors may determine.
Other Related Party Transactions – Certain officers of the Fund are directors and/or officers of HFMC and/or The Hartford or its subsidiaries. For the year ended October 31, 2014, a portion of the Fund’s Chief Compliance Officer’s compensation was paid by all of the investment companies in the Hartford fund complex. The portion allocated to the Fund, as represented in other expenses on the Statement of Operations, was in the amount of $3. Hartford Administrative Services Company (“HASCO”), an indirect wholly-owned subsidiary of The Hartford, provides transfer agent services to the Fund. HASCO has contractually agreed to reimburse any portion of the transfer agency fees over 0.30% of average daily net assets per fiscal year for each class. Any transfer agency fee reimbursement is determined before considering the contractual operating expense limitation. For providing such services, HASCO is compensated on a per account basis that varies by account type, except with respect to Class Y, for which it is compensated based on average daily net assets. The amount paid to HASCO and any related contractual reimbursement amounts, if applicable, can be found in the Statement of Operations. These fees are accrued daily and paid monthly.
Administrative services fees are paid to HASCO for third-party recordkeeping services that are payable as a percentage of net assets in the amount of up to 0.20%, 0.15% and 0.10% for Classes R3, R4 and R5 shares, respectively. The total administrative services fees are shown on the Statement of Operations. These fees are accrued daily and paid monthly.
| 21 |
The Hartford International Opportunities Fund
Notes to Financial Statements – (continued)
October 31, 2014
(000’s Omitted)
Affiliate Holdings:
As of October 31, 2014, the Fund's shares were owned in aggregate by affiliated fund of funds. Therefore, the Fund may experience relatively large purchases or redemptions of its shares from these affiliated fund of funds. Affiliated fund of funds owned shares in the Fund as follows:
| Percentage of Fund | ||||
| Class Y | 4 | % | ||
Investment Transactions:
For the year ended October 31, 2014, the cost of purchases and proceeds from sales of investment securities (excluding short-term investments) were as follows:
| Excluding U.S. Government Obligations | U.S. Government Obligations | Total | ||||||||||
| Cost of Purchases | $ | 1,549,899 | $ | — | $ | 1,549,899 | ||||||
| Sales Proceeds | 1,607,796 | — | 1,607,796 | |||||||||
Capital Share Transactions:
The following information is for the year ended October 31, 2014, and the year ended October 31, 2013:
| For the Year Ended October 31, 2014 | For the Year Ended October 31, 2013 | |||||||||||||||||||||||||||||||
| Shares Sold | Shares Issued for Reinvested Dividends | Shares Redeemed | Net Increase (Decrease) of Shares | Shares Sold | Shares Issued for Reinvested Dividends | Shares Redeemed | Net Increase (Decrease) of Shares | |||||||||||||||||||||||||
| Class A | ||||||||||||||||||||||||||||||||
| Shares | 8,063 | 1,032 | (4,243 | ) | 4,852 | 7,623 | 206 | (3,491 | ) | 4,338 | ||||||||||||||||||||||
| Amount | $ | 138,901 | $ | 17,465 | $ | (73,020 | ) | $ | 83,346 | $ | 121,543 | $ | 3,108 | $ | (54,699 | ) | $ | 69,952 | ||||||||||||||
| Class B | ||||||||||||||||||||||||||||||||
| Shares | 37 | 21 | (177 | ) | (119 | ) | 47 | 3 | (194 | ) | (144 | ) | ||||||||||||||||||||
| Amount | $ | 593 | $ | 323 | $ | (2,803 | ) | $ | (1,887 | ) | $ | 688 | $ | 35 | $ | (2,813 | ) | $ | (2,090 | ) | ||||||||||||
| Class C | ||||||||||||||||||||||||||||||||
| Shares | 1,293 | 121 | (548 | ) | 866 | 816 | 13 | (515 | ) | 314 | ||||||||||||||||||||||
| Amount | $ | 20,057 | $ | 1,835 | $ | (8,447 | ) | $ | 13,445 | $ | 11,820 | $ | 177 | $ | (7,339 | ) | $ | 4,658 | ||||||||||||||
| Class I | ||||||||||||||||||||||||||||||||
| Shares | 3,821 | 153 | (1,616 | ) | 2,358 | 2,583 | 27 | (1,248 | ) | 1,362 | ||||||||||||||||||||||
| Amount | $ | 65,456 | $ | 2,584 | $ | (27,445 | ) | $ | 40,595 | $ | 40,918 | $ | 398 | $ | (19,816 | ) | $ | 21,500 | ||||||||||||||
| Class R3 | ||||||||||||||||||||||||||||||||
| Shares | 811 | 74 | (410 | ) | 475 | 1,005 | 14 | (396 | ) | 623 | ||||||||||||||||||||||
| Amount | $ | 14,208 | $ | 1,274 | $ | (7,132 | ) | $ | 8,350 | $ | 15,998 | $ | 211 | $ | (6,325 | ) | $ | 9,884 | ||||||||||||||
| Class R4 | ||||||||||||||||||||||||||||||||
| Shares | 2,057 | 189 | (1,030 | ) | 1,216 | 2,928 | 35 | (1,031 | ) | 1,932 | ||||||||||||||||||||||
| Amount | $ | 36,385 | $ | 3,293 | $ | (18,213 | ) | $ | 21,465 | $ | 46,780 | $ | 544 | $ | (16,688 | ) | $ | 30,636 | ||||||||||||||
| Class R5 | ||||||||||||||||||||||||||||||||
| Shares | 1,435 | 199 | (634 | ) | 1,000 | 2,112 | 43 | (685 | ) | 1,470 | ||||||||||||||||||||||
| Amount | $ | 25,667 | $ | 3,486 | $ | (11,262 | ) | $ | 17,891 | $ | 33,886 | $ | 673 | $ | (11,133 | ) | $ | 23,426 | ||||||||||||||
| Class Y | ||||||||||||||||||||||||||||||||
| Shares | 16,554 | 1,980 | (28,110 | ) | (9,576 | ) | 21,086 | 487 | (10,193 | ) | 11,380 | |||||||||||||||||||||
| Amount | $ | 295,216 | $ | 34,908 | $ | (512,092 | ) | $ | (181,968 | ) | $ | 339,629 | $ | 7,618 | $ | (167,967 | ) | $ | 179,280 | |||||||||||||
| Total | ||||||||||||||||||||||||||||||||
| Shares | 34,071 | 3,769 | (36,768 | ) | 1,072 | 38,200 | 828 | (17,753 | ) | 21,275 | ||||||||||||||||||||||
| Amount | $ | 596,483 | $ | 65,168 | $ | (660,414 | ) | $ | 1,237 | $ | 611,262 | $ | 12,764 | $ | (286,780 | ) | $ | 337,246 | ||||||||||||||
| 22 |
The Hartford International Opportunities Fund
Notes to Financial Statements – (continued)
October 31, 2014
(000’s Omitted)
The following reflects the conversion of Class B shares into Class A shares (reflected as Class A shares sold) for the year ended October 31, 2014, and the year ended October 31, 2013:
| Shares | Dollars | |||||||
| For the Year Ended October 31, 2014 | 45 | $ | 767 | |||||
| For the Year Ended October 31, 2013 | 48 | $ | 762 | |||||
Line of Credit:
The Fund is one of several Hartford Funds that participate in a $500 million committed revolving line of credit facility. The facility is to be used for temporary or emergency purposes. Under the arrangement, the funds are required to own securities having a market value in excess of 300% of the total bank borrowings. The interest rate on borrowings varies depending on the nature of the loan. The facility also requires a fee to be paid based on the amount of the commitment. This commitment fee is allocated to all the funds participating in the line of credit based on the average net assets of the funds. During the year ended October 31, 2014, the Fund did not have any borrowings under this facility.
Pending Legal Proceedings:
On February 25, 2011, Jennifer L. Kasilag, Louis Mellinger, Judith M. Menendez, Jacqueline M. Robinson, and Linda A. Russell filed a derivative lawsuit against Hartford Investment Financial Services, LLC (“HIFSCO”) (now known as HFD) on behalf of six Hartford retail mutual funds in the United States District Court for the District of New Jersey, alleging that HIFSCO received excessive advisory and distribution fees in violation of its statutory fiduciary duty under Section 36(b) of the 1940 Act when serving as investment manager and principal underwriter, respectively, to the Hartford retail mutual funds. Although this action was purportedly filed on behalf of certain of the Hartford Funds, none of the Hartford Funds is itself a defendant to the suit. HIFSCO moved to dismiss and, in September 2011, the motion was granted in part and denied in part, with leave to amend the complaint. In November 2011, plaintiffs filed an amended complaint on behalf of certain Hartford retail mutual funds, The Hartford Global Health Fund (now known as The Hartford Healthcare Fund), The Hartford Conservative Allocation Fund, The Hartford Growth Opportunities Fund, The Hartford Inflation Plus Fund, The Hartford Advisers Fund (now known as The Hartford Balanced Fund), and The Hartford Capital Appreciation Fund. Plaintiffs seek to rescind the investment management agreements and distribution plans between HIFSCO and these funds and to recover the total fees charged thereunder or, in the alternative, to recover any improper compensation HIFSCO received, in addition to lost earnings. HIFSCO filed a partial motion to dismiss the amended complaint and, in December 2012, the court dismissed without prejudice the claims regarding distribution fees and denied the motion with respect to the advisory fees claims. HIFSCO disputes the allegations and intends to defend vigorously.
In March 2014, the plaintiffs filed a new complaint that added as new plaintiffs The Hartford Floating Rate Fund and The Hartford Small Company Fund and named as a defendant HFMC, which assumed the role as investment manager to the funds as of January 2013. HFMC and HIFSCO dispute the allegations and intend to defend vigorously.
No accrual for litigation relating to this matter has been recorded in the financial statements of the Fund because the Fund is not party to the suit.
Indemnifications:
Under the Company's organizational documents, the Company shall indemnify its officers and directors to the full extent required or permitted under Maryland General Corporation Law and the federal securities laws. In addition, the Company, on behalf of the Fund, may enter into contracts that contain a variety of indemnifications. The Company's maximum exposure under these arrangements is unknown. However, as of the date of these financial statements, the Company has not had prior claims or losses pursuant to these contracts and expects the risk of loss to be remote.
| 23 |
The Hartford International Opportunities Fund
Notes to Financial Statements – (continued)
October 31, 2014
(000’s Omitted)
Subsequent Events:
At the August 5-6, 2014 meeting, the Board of Directors approved the creation of Class R6 shares for the Fund. Class R6 shares launched on November 7, 2014. In connection with the launch of the Class R6 shares, an updated prospectus, dated November 7, 2014, and Statement of Additional Information, dated March 1, 2014, as amended November 7, 2014, for the Fund were filed with the U.S. Securities and Exchange Commission.
Effective December 1, 2014, pursuant to a sub-transfer agency agreement between HASCO and Boston Financial Data Services, Inc. (“BFDS”), HASCO has delegated certain transfer agent, dividend disbursing agent and shareholder servicing agent functions to BFDS. The costs and expenses of such delegation are borne by HASCO, not by the Fund.
| 24 |
The Hartford International Opportunities Fund
Financial Highlights
| - Selected Per-Share Data - (A) | - Ratios and Supplemental Data - | |||||||||||||||||||||||||||||||||||||||||||||||||||
| Class | Net Asset Value at Beginning of Period | Net Investment Income (Loss) | Net Realized and Unrealized Gain (Loss) on Invest- ments | Total from Investment Operations | Dividends from Net Investment Income | Distribu- tions from Realized Capital Gains | Total Dividends and Distributions | Net Asset Value at End of Period | Total Return(B) | Net Assets at End of Period (000's) | Ratio of Expenses to Average Net Assets Before Adjust- ments(C) | Ratio of Expenses to Average Net Assets After Adjust- ments(C) | Ratio of Net Investment Income (Loss) to Average Net Assets | |||||||||||||||||||||||||||||||||||||||
| For the Year Ended October 31, 2014 | ||||||||||||||||||||||||||||||||||||||||||||||||||||
| A | $ | 17.46 | $ | 0.14 | $ | 0.11 | $ | 0.25 | $ | (0.20 | ) | $ | (0.55 | ) | $ | (0.75 | ) | $ | 16.96 | 1.45 | % | $ | 465,854 | 1.20 | % | 1.20 | % | 0.80 | % | |||||||||||||||||||||||
| B | 16.04 | (0.01 | ) | 0.10 | 0.09 | (0.06 | ) | (0.55 | ) | (0.61 | ) | 15.52 | 0.58 | 6,825 | 2.30 | 2.04 | (0.07 | ) | ||||||||||||||||||||||||||||||||||
| C | 15.76 | 0.01 | 0.09 | 0.10 | (0.11 | ) | (0.55 | ) | (0.66 | ) | 15.20 | 0.68 | 55,122 | 1.93 | 1.93 | 0.07 | ||||||||||||||||||||||||||||||||||||
| I | 17.41 | 0.20 | 0.10 | 0.30 | (0.25 | ) | (0.55 | ) | (0.80 | ) | 16.91 | 1.76 | 99,430 | 0.84 | 0.84 | 1.15 | ||||||||||||||||||||||||||||||||||||
| R3 | 17.69 | 0.09 | 0.11 | 0.20 | (0.16 | ) | (0.55 | ) | (0.71 | ) | 17.18 | 1.19 | 40,827 | 1.44 | 1.44 | 0.54 | ||||||||||||||||||||||||||||||||||||
| R4 | 17.93 | 0.15 | 0.11 | 0.26 | (0.21 | ) | (0.55 | ) | (0.76 | ) | 17.43 | 1.47 | 104,977 | 1.14 | 1.14 | 0.83 | ||||||||||||||||||||||||||||||||||||
| R5 | 18.06 | 0.21 | 0.11 | 0.32 | (0.25 | ) | (0.55 | ) | (0.80 | ) | 17.58 | 1.83 | 85,424 | 0.84 | 0.84 | 1.16 | ||||||||||||||||||||||||||||||||||||
| Y | 18.14 | 0.25 | 0.09 | 0.34 | (0.27 | ) | (0.55 | ) | (0.82 | ) | 17.66 | 1.90 | 581,030 | 0.74 | 0.74 | 1.38 | ||||||||||||||||||||||||||||||||||||
| For the Year Ended October 31, 2013 | ||||||||||||||||||||||||||||||||||||||||||||||||||||
| A | $ | 14.49 | $ | 0.22 | $ | 2.92 | $ | 3.14 | $ | (0.17 | ) | $ | – | $ | (0.17 | ) | $ | 17.46 | 21.87 | % | $ | 394,928 | 1.26 | % | 1.26 | % | 1.36 | % | ||||||||||||||||||||||||
| B | 13.32 | 0.08 | 2.69 | 2.77 | (0.05 | ) | – | (0.05 | ) | 16.04 | 20.89 | 8,960 | 2.35 | 2.05 | 0.56 | |||||||||||||||||||||||||||||||||||||
| C | 13.10 | 0.09 | 2.65 | 2.74 | (0.08 | ) | – | (0.08 | ) | 15.76 | 20.99 | 43,495 | 1.98 | 1.98 | 0.66 | |||||||||||||||||||||||||||||||||||||
| I | 14.45 | 0.28 | 2.91 | 3.19 | (0.23 | ) | – | (0.23 | ) | 17.41 | 22.30 | 61,280 | 0.90 | 0.90 | 1.77 | |||||||||||||||||||||||||||||||||||||
| R3 | 14.70 | 0.19 | 2.96 | 3.15 | (0.16 | ) | – | (0.16 | ) | 17.69 | 21.63 | 33,633 | 1.46 | 1.46 | 1.20 | |||||||||||||||||||||||||||||||||||||
| R4 | 14.89 | 0.25 | 3.00 | 3.25 | (0.21 | ) | – | (0.21 | ) | 17.93 | 22.02 | 86,150 | 1.15 | 1.15 | 1.51 | |||||||||||||||||||||||||||||||||||||
| R5 | 14.98 | 0.29 | 3.02 | 3.31 | (0.23 | ) | – | (0.23 | ) | 18.06 | 22.37 | 69,712 | 0.85 | 0.85 | 1.79 | |||||||||||||||||||||||||||||||||||||
| Y | 15.04 | 0.32 | 3.03 | 3.35 | (0.25 | ) | – | (0.25 | ) | 18.14 | 22.51 | 770,427 | 0.75 | 0.75 | 1.97 | |||||||||||||||||||||||||||||||||||||
| For the Year Ended October 31, 2012 | ||||||||||||||||||||||||||||||||||||||||||||||||||||
| A | $ | 13.67 | $ | 0.18 | $ | 0.79 | $ | 0.97 | $ | (0.15 | ) | $ | – | $ | (0.15 | ) | $ | 14.49 | 7.28 | % | $ | 264,957 | 1.36 | % | 1.30 | % | 1.30 | % | ||||||||||||||||||||||||
| B | 12.56 | 0.07 | 0.74 | 0.81 | (0.05 | ) | – | (0.05 | ) | 13.32 | 6.46 | 9,358 | 2.44 | 2.05 | 0.55 | |||||||||||||||||||||||||||||||||||||
| C | 12.37 | 0.07 | 0.72 | 0.79 | (0.06 | ) | – | (0.06 | ) | 13.10 | 6.48 | 32,044 | 2.06 | 2.05 | 0.56 | |||||||||||||||||||||||||||||||||||||
| I | 13.65 | 0.22 | 0.80 | 1.02 | (0.22 | ) | – | (0.22 | ) | 14.45 | 7.68 | 31,190 | 0.97 | 0.97 | 1.60 | |||||||||||||||||||||||||||||||||||||
| R3 | 13.90 | 0.15 | 0.81 | 0.96 | (0.16 | ) | – | (0.16 | ) | 14.70 | 7.05 | 18,786 | 1.52 | 1.50 | 1.10 | |||||||||||||||||||||||||||||||||||||
| R4 | 14.07 | 0.21 | 0.80 | 1.01 | (0.19 | ) | – | (0.19 | ) | 14.89 | 7.40 | 42,803 | 1.20 | 1.20 | 1.45 | |||||||||||||||||||||||||||||||||||||
| R5 | 14.16 | 0.25 | 0.80 | 1.05 | (0.23 | ) | – | (0.23 | ) | 14.98 | 7.67 | 35,803 | 0.91 | 0.90 | 1.73 | |||||||||||||||||||||||||||||||||||||
| Y | 14.20 | 0.19 | 0.89 | 1.08 | (0.24 | ) | – | (0.24 | ) | 15.04 | 7.83 | 467,786 | 0.79 | 0.79 | 1.34 | |||||||||||||||||||||||||||||||||||||
| For the Year Ended October 31, 2011 | ||||||||||||||||||||||||||||||||||||||||||||||||||||
| A | $ | 14.68 | $ | 0.14 | $ | (1.14 | ) | $ | (1.00 | ) | $ | (0.01 | ) | $ | – | $ | (0.01 | ) | $ | 13.67 | (6.80 | )% | $ | 261,920 | 1.34 | % | 1.30 | % | 0.96 | % | ||||||||||||||||||||||
| B | 13.58 | 0.02 | (1.04 | ) | (1.02 | ) | – | – | – | 12.56 | (7.51 | ) | 11,877 | 2.33 | 2.05 | 0.16 | ||||||||||||||||||||||||||||||||||||
| C | 13.37 | 0.03 | (1.03 | ) | (1.00 | ) | – | – | – | 12.37 | (7.48 | ) | 33,621 | 2.04 | 2.04 | 0.19 | ||||||||||||||||||||||||||||||||||||
| I | 14.62 | 0.20 | (1.15 | ) | (0.95 | ) | (0.02 | ) | – | (0.02 | ) | 13.65 | (6.49 | ) | 18,801 | 0.97 | 0.97 | 1.39 | ||||||||||||||||||||||||||||||||||
| R3 | 14.95 | 0.13 | (1.17 | ) | (1.04 | ) | (0.01 | ) | – | (0.01 | ) | 13.90 | (6.97 | ) | 10,727 | 1.54 | 1.50 | 0.89 | ||||||||||||||||||||||||||||||||||
| R4 | 15.10 | 0.17 | (1.18 | ) | (1.01 | ) | (0.02 | ) | – | (0.02 | ) | 14.07 | (6.73 | ) | 11,406 | 1.23 | 1.20 | 1.12 | ||||||||||||||||||||||||||||||||||
| R5 | 15.15 | 0.18 | (1.15 | ) | (0.97 | ) | (0.02 | ) | – | (0.02 | ) | 14.16 | (6.40 | ) | 21,285 | 0.94 | 0.90 | 1.22 | ||||||||||||||||||||||||||||||||||
| Y | 15.19 | 0.21 | (1.17 | ) | (0.96 | ) | (0.03 | ) | – | (0.03 | ) | 14.20 | (6.37 | ) | 114,791 | 0.82 | 0.82 | 1.38 | ||||||||||||||||||||||||||||||||||
See Portfolio Turnover information on the next page.
| 25 |
The Hartford International Opportunities Fund
Financial Highlights – (continued)
| - Selected Per-Share Data - (A) | - Ratios and Supplemental Data - | |||||||||||||||||||||||||||||||||||||||||||||||||||
| Class | Net
Asset Value at Beginning of Period | Net
Investment Income (Loss) | Net
Realized and Unrealized Gain (Loss) on Invest- ments | Total
from Investment Operations | Dividends
from Net Investment Income | Distribu- tions from Realized Capital Gains | Total
Dividends and Distributions | Net
Asset Value at End of Period | Total
Return(B) | Net
Assets at End of Period (000's) | Ratio
of Expenses to Average Net Assets Before Adjust- ments(C) | Ratio
of Expenses to Average Net Assets After Adjust- ments(C) | Ratio
of Net Investment Income (Loss) to Average Net Assets | |||||||||||||||||||||||||||||||||||||||
| For the Year Ended October 31, 2010 | ||||||||||||||||||||||||||||||||||||||||||||||||||||
| A | $ | 12.62 | $ | 0.07 | $ | 2.14 | $ | 2.21 | $ | (0.15 | ) | $ | – | $ | (0.15 | ) | $ | 14.68 | 17.56 | % | $ | 310,049 | 1.47 | % | 1.42 | % | 0.54 | % | ||||||||||||||||||||||||
| B | 11.65 | (0.03 | ) | 1.97 | 1.94 | (0.01 | ) | – | (0.01 | ) | 13.58 | 16.70 | 16,434 | 2.44 | 2.19 | (0.24 | ) | |||||||||||||||||||||||||||||||||||
| C | 11.46 | (0.02 | ) | 1.94 | 1.92 | (0.01 | ) | – | (0.01 | ) | 13.37 | 16.72 | 37,671 | 2.16 | 2.15 | (0.19 | ) | |||||||||||||||||||||||||||||||||||
| I | 12.59 | 0.13 | 2.12 | 2.25 | (0.22 | ) | – | (0.22 | ) | 14.62 | 18.01 | 10,933 | 1.08 | 1.08 | 1.02 | |||||||||||||||||||||||||||||||||||||
| R3 | 12.88 | 0.05 | 2.17 | 2.22 | (0.15 | ) | – | (0.15 | ) | 14.95 | 17.28 | 4,413 | 1.63 | 1.59 | 0.38 | |||||||||||||||||||||||||||||||||||||
| R4 | 12.98 | 0.08 | 2.22 | 2.30 | (0.18 | ) | – | (0.18 | ) | 15.10 | 17.76 | 7,066 | 1.29 | 1.27 | 0.63 | |||||||||||||||||||||||||||||||||||||
| R5 | 13.04 | 0.14 | 2.21 | 2.35 | (0.24 | ) | – | (0.24 | ) | 15.15 | 18.12 | 2,704 | 0.99 | 0.97 | 1.04 | |||||||||||||||||||||||||||||||||||||
| Y | 13.07 | 0.14 | 2.22 | 2.36 | (0.24 | ) | – | (0.24 | ) | 15.19 | 18.20 | 189,576 | 0.90 | 0.90 | 1.05 | |||||||||||||||||||||||||||||||||||||
| (A) | Information presented relates to a share outstanding throughout the indicated period. Net investment income (loss) per share amounts are calculated based on average shares outstanding unless otherwise noted. |
| (B) | Assumes initial investment at net asset value at the beginning of each period, reinvestment of all distributions, the complete redemption of the investment at net asset value at the end of each period and no sales charge. Total return would be reduced if sales charges were taken into account. |
| (C) | Adjustments include waivers and reimbursements, if applicable. Ratios do not include fees paid indirectly (see Expenses in the accompanying Notes to Financial Statements). |
| Portfolio Turnover Rate for All Share Classes | ||||
| For the Year Ended October 31, 2014 | 104 | % | ||
| For the Year Ended October 31, 2013 | 107 | |||
| For the Year Ended October 31, 2012 | 98 | |||
| For the Year Ended October 31, 2011 | 122 | |||
| For the Year Ended October 31, 2010 | 106 | |||
| 26 |
Report of Independent Registered Public Accounting Firm
The Board of Directors and Shareholders of
The Hartford Mutual Funds, Inc.
We have audited the accompanying statement of assets and liabilities, including the schedule of investments, of The Hartford International Opportunities Fund (one of the portfolios constituting The Hartford Mutual Funds, Inc. (the Funds)) as of October 31, 2014, and the related statement of operations for the year then ended, the statements of changes in net assets for each of the two years in the period then ended, and the financial highlights for each of the five years in the period then ended. These financial statements and financial highlights are the responsibility of the Funds’ management. Our responsibility is to express an opinion on these financial statements and financial highlights based on our audits.
We conducted our audits in accordance with the standards of the Public Company Accounting Oversight Board (United States). Those standards require that we plan and perform the audit to obtain reasonable assurance about whether the financial statements and financial highlights are free of material misstatement. We were not engaged to perform an audit of the Funds’ internal control over financial reporting. Our audits included consideration of internal control over financial reporting as a basis for designing audit procedures that are appropriate in the circumstances, but not for the purpose of expressing an opinion on the effectiveness of the Funds’ internal control over financial reporting. Accordingly, we express no such opinion. An audit also includes examining, on a test basis, evidence supporting the amounts and disclosures in the financial statements and financial highlights, assessing the accounting principles used and significant estimates made by management, and evaluating the overall financial statement presentation. Our procedures included confirmation of securities owned as of October 31, 2014, by correspondence with the custodian and brokers or by other appropriate auditing procedures where replies from brokers were not received. We believe that our audits provide a reasonable basis for our opinion.
In our opinion, the financial statements and financial highlights referred to above present fairly, in all material respects, the financial position of The Hartford International Opportunities Fund of The Hartford Mutual Funds, Inc. at October 31, 2014, the results of its operations for the year then ended, the changes in its net assets for each of the two years in the period then ended, and the financial highlights for each of the five years in the period then ended, in conformity with U.S. generally accepted accounting principles.
Minneapolis, Minnesota
December 18, 2014
| 27 |
The Hartford International Opportunities Fund
Directors and Officers (Unaudited)
The Board of Directors of the Company (the "Directors") appoints officers who are responsible for the day-to-day operations of the Fund and who execute policies formulated by the Directors. Each Director serves until his or her death, resignation, or retirement or until the next annual meeting of shareholders is held or until his or her successor is elected and qualifies.
Directors and officers who are employed by or who have a financial interest in The Hartford Financial Services Group, Inc. ("The Hartford") are considered “interested” persons of the Fund pursuant to the 1940 Act. Each officer and two of the Company's Directors, as noted in the chart below, are “interested” persons of the Fund. Each Director serves as a director for The Hartford Mutual Funds, Inc., The Hartford Mutual Funds II, Inc., Hartford Series Fund, Inc., and Hartford HLS Series Fund II, Inc., and as a trustee for The Hartford Alternative Strategies Fund, which, as of October 31, 2014, collectively consist of 66 funds. Correspondence may be sent to Directors and officers c/o Hartford Funds, 5 Radnor Corporate Center, Suite 300, 100 Matsonford Road, Radnor, Pennsylvania 19087, except that correspondence to Mr. Annoni, Mr. Dressen and Ms. Quade may be sent to 500 Bielenberg Drive, Suite 500, Woodbury, Minnesota 55125.
The table below sets forth, for each Director and officer, his or her name, year of birth, current position with the Company and date first elected or appointed to The Hartford Mutual Funds, Inc. ("MF") and The Hartford Mutual Funds II, Inc. ("MF2"), principal occupation, and, for Directors, other directorships held. The Fund’s Statement of Additional Information contains further information on the Directors and is available free of charge by calling 1-888-843-7824 or writing to: Hartford Funds, P.O. Box 55022, Boston, MA 02205-5022.
Information on the aggregate remuneration paid to the directors of the Company can be found in the Statement of Operations herein. The Fund pays to The Hartford a portion of the Chief Compliance Officer’s compensation, but does not pay salaries or compensation to any of its other officers or Directors who are employed by The Hartford.
Non-Interested Directors
Hilary E. Ackermann (1956) Director since September 23, 2014
Ms. Ackermann served as Chief Risk Officer at Goldman Sachs Bank USA from October 2008 to November 2011 and serves as a Director of Dynegy, Inc., an independent power company, from October 2012 to present.
Lynn S. Birdsong (1946) Director since 2003, Chairman of the Investment Committee since 2014
Mr. Birdsong is a private investor. Mr. Birdsong currently serves as a Director of the Sovereign High Yield Investment Company (April 2010 to current). Mr. Birdsong currently serves as an Independent Director of Nomura Partners Funds, Inc. (formerly, The Japan Fund) (April 2003 to current). From 2003 to March 2005, Mr. Birdsong was an Independent Director of the Atlantic Whitehall Funds. From 1979 to 2002, Mr. Birdsong was a Managing Director of Zurich Scudder Investments, an investment management firm. During his employment with Scudder, Mr. Birdsong was an Interested Director of The Japan Fund. From January 1981 through December 2013, Mr. Birdsong was a partner in Birdsong Company, an advertising specialty firm.
Robert M. Gavin, Jr. (1940) Director since 2002 (MF) and 1986 (MF2), Chairman of the Board for each since 2004
Dr. Gavin is an educational consultant. Prior to September 1, 2001, he was President of Cranbrook Education Community and prior to July 1996, he was President of Macalester College, St. Paul, Minnesota.
Duane E. Hill (1945) Director since 2001 (MF) and 2002 (MF2), Chairman of the Nominating Committee since 2003
Mr. Hill is a Partner of TSG Ventures L.P., a private equity investment company. Mr. Hill is a former partner of TSG Capital Group, a private equity investment firm that served as sponsor and lead investor in leveraged buyouts of middle market companies.
Sandra S. Jaffee (1941) Director since 2005
Ms. Jaffee is the founder and Chief Executive Officer of a private company, Homeworks Concierge, LLC, which provides residential property management services in Westchester County, New York (January 2012 to present). Ms. Jaffee served as Chairman (2008 to 2009) and Chief Executive Officer of Fortent (formerly Searchspace Group), a leading provider of compliance/regulatory technology to financial institutions from August 2005 to August 2009. From August 2004 to August 2005, Ms. Jaffee served as an Entrepreneur in Residence with Warburg Pincus, a private equity firm. Prior to joining Warburg Pincus, Ms. Jaffee served as Executive Vice President at Citigroup, from September 1995 to July 2004, where she was President and Chief Executive Officer of Citibank’s Global Securities Services (1995 to 2003). Ms. Jaffee currently serves as a member of the Board of Directors of Broadridge Financial Solutions as well as a Trustee of Muhlenberg College.
| 28 |
The Hartford International Opportunities Fund
Directors and Officers (Unaudited) – (continued)
William P. Johnston (1944) Director since 2005, Chairman of the Compliance Committee since 2005
In June 2006, Mr. Johnston was appointed as Senior Advisor to The Carlyle Group, a global private equity and other alternative asset investment firm and currently serves as an Operating Executive. In July 2006, Mr. Johnston was elected to the Board of Directors of MultiPlan, Inc. and served as a Director (July 2006 to August 2010). In August 2007, Mr. Johnston was elected to the Board of Directors of LifeCare Holdings, Inc. and served as a Director (August 2007 to June 2013). In February 2008, Mr. Johnston was elected to the Board of Directors of HCR-ManorCare, Inc. In May 2006, Mr. Johnston was elected to the Supervisory Board of Fresenius Medical Care AG & Co. KGaA, after its acquisition of Renal Care Group, Inc. in March 2006. Mr. Johnston joined Renal Care Group in November 2002 as a member of the Board of Directors and served as Chairman of the Board from March 2003 through March 2006. From 2002 through 2013, Mr. Johnston served as a Board member of the Georgia O’Keefe Museum. From September 1987 to December 2002, Mr. Johnston was with Equitable Securities Corporation (and its successors, SunTrust Equitable Securities and SunTrust Robinson Humphrey) serving in various investment banking and managerial positions, including Managing Director and Head of Investment Banking, Chief Executive Officer and Vice Chairman.
Phillip O. Peterson (1944) Director since 2002 (MF) and 2000 (MF2), Chairman of the Audit Committee since 2002
Mr. Peterson is a mutual fund industry consultant. He was a partner of KPMG LLP (an accounting firm) until July 1999. Mr. Peterson joined William Blair Funds in February 2007 as a member of the Board of Trustees. From February 2012 to February 2014, Mr. Peterson served as a Trustee of Symetra Variable Mutual Funds. From January 2004 to April 2005, Mr. Peterson served as Independent President of the Strong Mutual Funds.
Lemma W. Senbet (1946) Director since 2005
Dr. Senbet is the William E. Mayer Chair Professor of Finance and Founding Director, Center for Financial Policy, at the University of Maryland, Robert H. Smith School of Business. He was chair of the Finance Department of the University of Maryland, Robert H. Smith School of Business from 1998 to 2006. Since June 2013, he has been on leave from the University to serve as Executive Director of African Economic Research Consortium which focuses on economic policy research and training. Previously, he was a chaired professor of finance at the University of Wisconsin-Madison. Also, he was a Director of the Fortis Funds from March 2000 to July 2002. Dr. Senbet served as Director of the American Finance Association and President of the Western Finance Association. In 2006, Dr. Senbet was inducted Fellow of Financial Management Association International for his career-long distinguished scholarship and professional service.
Interested Directors and Officers
James E. Davey (1964) Director since 2012, President and Chief Executive Officer since 2010
Mr. Davey serves as Executive Vice President of Hartford Life Insurance Company (“HLIC”) and The Hartford. Additionally, Mr. Davey serves as Chairman of the Board, Manager and Senior Managing Director of Hartford Funds Distributors, LLC (“HFD”). He also currently serves as Director, Chairman of the Board, President and Senior Managing Director of Hartford Administrative Services Company (“HASCO”). Mr. Davey also serves as Manager, Chairman of the Board and Senior Managing Director for Hartford Funds Management Company, LLC (“HFMC”) and Director, Chairman of the Board and Senior Managing Director for Hartford Funds Management Group, Inc. ("HFMG"). Mr. Davey has served in various positions within The Hartford and its subsidiaries in connection with the operation of the Hartford Funds. Mr. Davey joined The Hartford in 2002.
Lowndes A. Smith* (1939) Director since 1996 (MF) and 2002 (MF2)
Mr. Smith served as Vice Chairman of The Hartford from February 1997 to January 2002, as President and Chief Executive Officer of Hartford Life, Inc. from February 1997 to January 2002, and as President and Chief Operating Officer of The Hartford Life Insurance Companies from January 1989 to January 2002. Mr. Smith serves as a Director of White Mountains Insurance Group Ltd. (October 2003 to current); One Beacon Insurance (October 2006 to current); Symetra Financial (August 2007 to current) and is a Managing Director of Whittington Gray Associates (January 2007 to current).
* Mr. Smith resigned as a Director of MF, MF2, Hartford Series Fund, Inc. and Hartford HLS Series Fund II, Inc. and as a Trustee of The Hartford Alternative Strategies Fund effective September 17, 2014.
Other Officers
Mark A. Annoni (1964) Vice President, Controller and Treasurer since 2012
Mr. Annoni currently serves as the Assistant Vice President of HLIC (February 2004 to present) and Senior Vice President of HFMG (December 2013 to present). Mr. Annoni has served in various positions within The Hartford and its subsidiaries in connection with the operation of the Hartford Funds. Mr. Annoni joined The Hartford in 2001.
| 29 |
The Hartford International Opportunities Fund
Directors and Officers (Unaudited) – (continued)
Michael R. Dressen (1963) AML Compliance Officer since 2011
Mr. Dressen currently serves as Assistant Vice President of HLIC. He also serves as Chief Compliance Officer and AML Compliance Officer of HASCO and as AML Officer of HFD. Mr. Dressen has served in various positions within The Hartford and its subsidiaries in connection with the operation of the Hartford Funds.
Edward P. Macdonald (1967) Vice President, Secretary and Chief Legal Officer since 2005
Mr. Macdonald currently serves as Assistant Secretary, Executive Vice President and Deputy General Counsel of HFD, HASCO, HFMC and HFMG. He also serves as Vice President of HLIC. Mr. Macdonald has served in various positions within The Hartford and its subsidiaries in connection with the operation of the Hartford Funds. Mr. Macdonald joined The Hartford in 2005.
Joseph G. Melcher (1973) Vice President and Chief Compliance Officer since 2013
Mr. Melcher currently serves as Executive Vice President of HFD, HFMG and HASCO. Mr. Melcher also currently serves as Executive Vice President and Chief Compliance Officer of HFMC. Mr. Melcher has served in various positions within The Hartford and its subsidiaries in connection with the operation of the Hartford Funds since joining The Hartford in 2012. Prior to joining The Hartford, Mr. Melcher worked at Touchstone Investments, a member of the Western & Southern Financial Group, where he held the position of Vice President and Chief Compliance Officer from 2010 through 2012 and Assistant Vice President, Compliance from 2005 to 2010.
Vernon J. Meyer (1964) Vice President since 2006
Mr. Meyer currently serves as Senior Vice President of HLIC. He also currently serves as Managing Director and Chief Investment Officer of HFMC and Managing Director of HFMG. Mr. Meyer has served in various positions within The Hartford and its subsidiaries in connection with the operation of the Hartford Funds. Mr. Meyer joined The Hartford in 2004.
Laura S. Quade (1969) Vice President since 2012
Ms. Quade currently serves as Vice President of HASCO, HFD and HFMG. She is the Head of Operations of HASCO and formerly served as Director, Enterprise Operations of HLIC. Ms. Quade has served in various positions within The Hartford and its subsidiaries in connection with the operation of the Hartford Funds. Ms. Quade joined The Hartford in 2001.
Martin A. Swanson** (1962) Vice President since 2010
Mr. Swanson currently serves as Vice President of HLIC. Mr. Swanson also serves as Managing Director, Chief Marketing Officer and Principal of HFD and Managing Director of HFMG. Mr. Swanson has served in various positions within The Hartford and its subsidiaries in connection with the operation of the Hartford Funds.
** Mr. Swanson resigned as an officer effective November 6, 2014.
HOW TO OBTAIN A COPY OF THE FUND’S PROXY VOTING POLICIES AND VOTING RECORDS (UNAUDITED)
A description of the policies and procedures that the Fund uses to determine how to vote proxies relating to portfolio securities and information about how the Fund voted proxies relating to portfolio securities during the most recent twelve-month period ended June 30 are available (1) without charge, upon request, by calling 888-843-7824 and (2) on the SEC’s website at http://www.sec.gov.
QUARTERLY PORTFOLIO HOLDINGS INFORMATION (UNAUDITED)
The Fund files a complete schedule of portfolio holdings with the SEC for the first and third quarters of each fiscal year on Form N-Q. The Fund’s Forms N-Q are available (1) without charge, upon request, by calling 888-843-7824 and (2) on the SEC’s website at http://www.sec.gov. The Form N-Q may be reviewed and copied at the SEC’s Public Reference Room in Washington, DC. Information on the operation of the Public Reference Room may be obtained by calling 1-800-SEC-0330.
| 30 |
The Hartford International Opportunities Fund
Federal Tax Information (Unaudited)
For the fiscal year ended October 31, 2014, there is no further federal tax information required for this Fund.
| 31 |
The Hartford International Opportunities Fund
Expense Example (Unaudited)
Your Fund's Expenses
As a shareholder of the Fund, you incur two types of costs: (1) transaction costs, including sales charges (loads) on purchase payments, if any, and contingent deferred sales charges (CDSC), if any, and (2) ongoing costs, including investment management fees, distribution and/or service (12b-1) fees, if any, and other fund expenses. This example is intended to help you understand your ongoing costs (in dollars) of investing in the Fund and to compare these costs with the ongoing costs of investing in other mutual funds. The example is based on an investment of $1,000 invested at the beginning of the period and held for the entire period of April 30, 2014 through October 31, 2014.
Actual Expenses
The first set of columns of the table below provides information about actual account values and actual expenses. You may use the information in this column, together with the amount you invested, to estimate the expenses that you paid over the period. Simply divide your account value by $1,000 (for example, an $8,600 account value divided by $1,000 = 8.6), then multiply the result by the number in the line under the heading entitled “Expenses Paid During Period” to estimate the expenses you paid on your account during this period.
Hypothetical Example for Comparison Purposes
The second set of columns of the table below provides information about hypothetical account values and hypothetical expenses based on the Fund's actual expense ratio and an assumed rate of return of 5% per year before expenses, which is not the Fund's actual return. The hypothetical account values and expenses may not be used to estimate the actual ending account balance or expenses you paid for the period. You may use this information to compare the ongoing costs of investing in the Fund and other funds. To do so, compare this 5% hypothetical example with the 5% hypothetical examples that appear in the shareholder reports of the other funds.
Please note that the expenses shown in the table are meant to highlight your ongoing costs only and do not reflect any transactional costs, such as sales charges (loads) and CDSC. Therefore, the second set of columns of the table is useful in comparing ongoing costs only, and will not help you determine the relative total costs of owning different funds. In addition, if these transactional costs were included, your costs would be higher. Expenses are equal to the Fund's annualized expense ratios multiplied by average account value over the period, multiplied by 184/365 (to reflect the one-half year period).
| Actual return | Hypothetical (5% return before expenses) | |||||||||||||||||||||||||||||||||||
| Beginning Account Value April 30, 2014 | Ending Account Value October 31, 2014 | Expenses paid during the period April 30, 2014 through October 31, 2014 | Beginning Account Value April 30, 2014 | Ending Account Value October 31, 2014 | Expenses paid during the period April 30, 2014 through October 31, 2014 | Annualized expense ratio | Days in the current 1/2 year | Days in the full year | ||||||||||||||||||||||||||||
| Class A | $ | 1,000.00 | $ | 977.00 | $ | 6.01 | $ | 1,000.00 | $ | 1,019.12 | $ | 6.14 | 1.21 | % | 184 | 365 | ||||||||||||||||||||
| Class B | $ | 1,000.00 | $ | 972.40 | $ | 10.19 | $ | 1,000.00 | $ | 1,014.87 | $ | 10.41 | 2.05 | 184 | 365 | |||||||||||||||||||||
| Class C | $ | 1,000.00 | $ | 973.10 | $ | 9.65 | $ | 1,000.00 | $ | 1,015.43 | $ | 9.85 | 1.94 | 184 | 365 | |||||||||||||||||||||
| Class I | $ | 1,000.00 | $ | 978.60 | $ | 4.20 | $ | 1,000.00 | $ | 1,020.96 | $ | 4.29 | 0.84 | 184 | 365 | |||||||||||||||||||||
| Class R3 | $ | 1,000.00 | $ | 975.60 | $ | 7.22 | $ | 1,000.00 | $ | 1,017.89 | $ | 7.38 | 1.45 | 184 | 365 | |||||||||||||||||||||
| Class R4 | $ | 1,000.00 | $ | 977.00 | $ | 5.72 | $ | 1,000.00 | $ | 1,019.42 | $ | 5.84 | 1.15 | 184 | 365 | |||||||||||||||||||||
| Class R5 | $ | 1,000.00 | $ | 978.80 | $ | 4.22 | $ | 1,000.00 | $ | 1,020.94 | $ | 4.31 | 0.85 | 184 | 365 | |||||||||||||||||||||
| Class Y | $ | 1,000.00 | $ | 979.50 | $ | 3.71 | $ | 1,000.00 | $ | 1,021.46 | $ | 3.79 | 0.74 | 184 | 365 | |||||||||||||||||||||
| 32 |
The Hartford International Opportunities Fund
Approval of Investment Management and Investment Sub-Advisory Agreements (Unaudited)
Section 15(c) of the Investment Company Act of 1940, as amended (the “1940 Act”), requires that each mutual fund’s board of directors, including a majority of those directors who are not “interested persons” of the mutual fund, as defined in the 1940 Act (the “Independent Directors”), annually review and consider the continuation of the mutual fund’s investment advisory and sub-advisory agreements. At its meeting held on August 5-6, 2014, the Board of Directors (the “Board”) of The Hartford Mutual Funds, Inc., including each of the Independent Directors, unanimously voted to approve the continuation of the investment management agreement for The Hartford International Opportunities Fund (the “Fund”) with Hartford Funds Management Company, LLC (“HFMC”) and the continuation of the investment sub-advisory agreement between HFMC and the Fund’s sub-adviser, Wellington Management Company, LLP (the “Sub-adviser,” and together with HFMC, the “Advisers”) (collectively, the “Agreements”).
In the months preceding the August 5-6, 2014 meeting, the Board requested, received and reviewed written responses from the Advisers to questions posed to them on behalf of the Independent Directors and supporting materials relating to those questions and responses. The Board considered information furnished to the Board at its meetings throughout the year, as well as information specifically prepared in connection with the annual approval of the Agreements at the Board’s meetings held on June 17-18, 2014 and August 5-6, 2014. Information provided to the Board at its meetings throughout the year included, among other things, reports on Fund performance, legal and compliance matters, sales and marketing activity, shareholder services, and the other services provided to the Fund by the Advisers and their affiliates. The Board also received in-person presentations by Fund officers and representatives of HFMC at the Board’s meetings on June 17-18, 2014 and August 5-6, 2014 concerning the Agreements.
The Independent Directors, advised by independent legal counsel, engaged service providers to assist them with evaluating the Agreements with respect to the Fund. Lipper Inc. (“Lipper”), an independent provider of investment company data, was retained to provide the Board with reports on how the Fund’s contractual management fees, actual management fees, other non-management fees, overall expense ratios and investment performance compared to those of mutual funds with similar investment objectives. The Independent Directors also engaged an independent financial services consultant (the “Consultant”) to assist them in evaluating the Fund’s management fees, sub-advisory fees, other non-management fees, overall expense ratios and investment performance. In addition, the Consultant reviewed the profitability calculations utilized by HFMC in connection with the continuation of the investment management agreement.
In determining whether to continue the Agreements for the Fund, the members of the Board reviewed and evaluated information and factors they believed to be relevant and appropriate in light of the information that the Board deemed necessary and appropriate through the exercise of its reasonable business judgment. While individual members of the Board may have weighed certain factors differently, the Board’s determination to continue the Agreements was based on a comprehensive consideration of all information provided to the Board throughout the year and specifically with respect to the continuation of the Agreements. A more detailed discussion of the factors the Board considered with respect to its approval of the Agreements is provided below.
Nature, Extent and Quality of Services Provided by the Advisers
The Board requested and considered information concerning the nature, extent and quality of the services provided to the Fund by the Advisers. The Board considered, among other things, the terms of the Agreements and the range of services provided by the Advisers. The Board considered the Advisers’ professional personnel who provide services to the Fund, including each Adviser’s ability and experience in attracting and retaining qualified personnel to service the Fund. The Board considered each Adviser’s reputation and overall financial strength, as well as its willingness to consider and implement organizational and operational changes designed to enhance services to the Hartford Funds. In addition, the Board considered the quality of each Adviser’s communications with the Board and responsiveness to Board inquiries and requests made from time to time with respect to the Fund and other Hartford Funds.
The Board also requested and evaluated information concerning each Adviser’s regulatory and compliance environment. In this regard, the Board requested and reviewed information on each Adviser’s compliance policies and procedures, compliance history, and a report from the Fund’s Chief Compliance Officer on each Adviser’s compliance with applicable laws and regulations, including responses to regulatory developments and compliance issues raised by regulators. The Board also noted the Advisers’ support of the Fund’s compliance control structure, particularly the resources devoted by the Advisers in support of the Fund’s obligations pursuant to Rule 38a-1 under the 1940 Act.
With respect to HFMC, the Board noted that, under the Agreements, HFMC is responsible for the management of the Fund, including oversight of fund operations and service providers, and provides administrative and investment advisory services in connection with selecting, monitoring and supervising the Sub-adviser. The Board considered HFMC’s ongoing monitoring of people, process and performance, including its quarterly reviews of each of the Hartford Funds, semi-annual meetings with the leaders of each Fund’s portfolio management team, and oversight of the Hartford Funds’ approximately 66 portfolio managers. The Board recognized that HFMC has demonstrated a record of making changes to the
| 33 |
The Hartford International Opportunities Fund
Approval of Investment Management and Investment Sub-Advisory Agreements (Unaudited) – (continued)
management and/or strategies of the Hartford Funds when warranted. The Board considered HFMC’s oversight of the Sub-adviser’s investment approach and results, process for monitoring best execution of portfolio trades by the Sub-adviser, and approach to risk management with respect to the Fund and the service providers to the Fund. The Board also considered HFMC’s oversight of compliance with the Fund’s objective and policies as well as with applicable laws and regulations, noting that regulatory and other developments had over time led to an increase in the scope of HFMC’s services in this regard.
In addition, the Board considered HFMC’s ongoing commitment to review and rationalize the Hartford Funds product line-up and the expenses that HFMC had incurred in connection with fund combinations in recent years. The Board considered that HFMC or its affiliates are responsible for providing the Fund’s officers.
With respect to the Sub-adviser, which provides certain day-to-day portfolio management services for the Fund, the Board considered the quality of the Fund’s portfolio managers, the Sub-adviser’s other investment personnel, its investment philosophy and process, investment research capabilities and resources, performance record, trade execution capabilities and experience. The Board considered the experience of the Fund’s portfolio managers, the number of accounts managed by the portfolio managers, and the Sub-adviser’s method for compensating the portfolio managers.
Based on these considerations, the Board concluded that it was satisfied with the nature, extent and quality of the services provided to the Fund by HFMC and the Sub-adviser.
Performance of the Fund and the Advisers
The Board considered the investment performance of the Fund. In this regard, the Board reviewed the performance of the Fund over different time periods presented in the materials and evaluated HFMC’s analysis of the Fund’s performance for these time periods. The Board considered information and materials provided to the Board by the Advisers concerning Fund performance, as well as information from Lipper comparing the investment performance of the Fund to an appropriate benchmark and universe of peer funds. The Board noted that the Fund’s performance was in the 2nd quintile of its performance universe for the 1- and 5-year periods and the 3rd quintile for the 3-year period. The Board also noted that the Fund’s performance was above its benchmark for the 1-, 3- and 5-year periods.
The Board considered the detailed investment analytics reports provided by Hartford Funds’ Investment Advisory Group throughout the year. These reports include, among other things, information on the Fund’s gross and net returns, the Fund’s investment performance relative to an appropriate benchmark and peer group, various statistics concerning the Fund’s portfolio, and a narrative summary of various factors affecting Fund performance. The Board considered the Advisers’ cooperation with the Investment Committee, which assists the Board in evaluating the performance of the Fund at periodic meetings throughout the year. The Board also considered the analysis provided by the Consultant relating to the Fund’s performance track record.
In light of all the considerations noted above, the Board concluded that it had continued confidence in HFMC’s and the Sub-adviser’s overall capabilities to manage the Fund.
Costs of the Services and Profitability of the Advisers
The Board reviewed information regarding HFMC’s cost to provide investment management and related services to the Fund and HFMC’s profitability, both overall and for the Fund, on a pre-tax basis without regard to distribution expenses. The Board also requested and reviewed information about the profitability to HFMC and its affiliates from all services provided to the Fund and all aspects of their relationship with the Fund. The Board also requested and received information relating to the operations and profitability of the Sub-adviser.
The Board considered the Consultant’s review of the profitability calculations used by HFMC in connection with the continuation of the investment management agreement, noting the Consultant’s view that Hartford Funds’ process for calculating and reporting Fund profitability is reasonable. In this regard, the Board noted that the Consultant performed a full review of this process in light of the recent restructuring of the Hartford Funds business and reported that the approach to analyzing Fund profitability, including the use of common expense allocation methodologies, is reasonable, sound and well within common industry practice.
Based on these considerations, the Board concluded that the profits anticipated to be realized by the Advisers and their affiliates from their relationships with the Fund would not be excessive.
| 34 |
The Hartford International Opportunities Fund
Approval of Investment Management and Investment Sub-Advisory Agreements (Unaudited) – (continued)
Comparison of Fees and Services Provided by the Advisers
The Board considered comparative information with respect to the management fees to be paid by the Fund to HFMC and the total expense ratios of the Fund. The Board also considered comparative information with respect to the sub-advisory fees to be paid by HFMC to the Sub-adviser. In this regard, the Board requested and reviewed information from HFMC and the Sub-adviser relating to the management and sub-advisory fees, including the sub-advisory fee schedule for the Fund, and total operating expenses for the Fund. With respect to the sub-advisory fee schedule, the Board considered representations from HFMC and the Sub-adviser that the Sub-adviser’s fees were negotiated at arm’s length on a fund-by-fund basis. The Board also reviewed information from Lipper comparing the Fund’s contractual management fees, actual management fees and overall expense ratios relative to a group of funds selected by Lipper, in consultation with the Consultant, and a broader universe of funds selected by Lipper. The Board considered that the Fund’s contractual management fee, actual management fee and total expenses (less 12b-1 and shareholder service fees) were in the 1st quintile of its expense group. The Board noted that the Fund has an automatically renewable contractual expense cap on each share class.
While the Board recognized that comparisons between the Fund and peer funds may be imprecise, given the different service levels and characteristics of mutual funds and the different business models and cost structures of the Advisers, the comparative information provided by Lipper assisted the Board in evaluating the reasonableness of the Fund’s management and sub-advisory fees and total operating expenses. In addition, the Board considered the analysis and recommendations of the Consultant relating to the Fund’s management and sub-advisory fees and total operating expenses.
Based on these considerations, the Board concluded that the Fund’s fees and total operating expenses, in conjunction with the information about quality of services, profitability, economies of scale, and other matters discussed, were reasonable in light of the services provided.
Economies of Scale
The Board requested and considered information regarding the Advisers’ realization of economies of scale with respect to the Fund and whether the fee levels reflect these economies of scale for the benefit of the Fund’s shareholders. The Board reviewed the breakpoints in the management fee schedule for the Fund, which reduce fee rates as Fund assets grow over time. The Board recognized that a fund with assets beyond the highest breakpoint level will continue to benefit from economies of scale because additional assets are charged the lowest breakpoint fee resulting in lower overall effective management fee rates. The Board also considered that expense limitations and fee waivers that reduce the Fund’s expenses at all asset levels can have the same effect as breakpoints in sharing economies of scale with shareholders and provide protection from an increase in expenses if Fund assets decline. The Board recognized that a fee schedule that reaches a lower breakpoint quickly provides shareholders with the benefit of anticipated or potential economies of scale. The Board also considered that HFMC has been active in managing expenses, which has resulted in benefits being realized by shareholders as assets within the Hartford Funds family of funds have grown over time, including through lower transfer agent costs and other operating expenses.
The Board reviewed and evaluated materials from Lipper and the Consultant showing how management fee schedules of peer funds reflect economies of scale for the benefit of shareholders as a peer fund’s assets hypothetically increase over time. Based on information provided by HFMC, Lipper, and the Consultant, the Board recognized that there is no uniform methodology for establishing breakpoints or uniform pattern in asset levels that trigger breakpoints or the amounts of breakpoints triggered.
After considering all of the information available to it, the Board concluded that it was satisfied with the extent to which economies of scale would be shared for the benefit of the Fund’s shareholders based on currently available information and the effective advisory fees and expense ratios for the Fund at its current and reasonably anticipated asset levels. The Board noted, however, that it would continue to monitor future growth in Fund assets and the appropriateness of additional breakpoints.
Other Benefits
The Board considered other benefits to the Advisers and their affiliates from their relationships with the Fund.
The Board noted that HFMC receives fees for fund accounting and related services from the Fund, and the Board considered information on profits to HFMC for such services. The Board also considered that Hartford Administrative Services Company (“HASCO”), the Fund’s transfer agent and an affiliate of HFMC, receives transfer agency compensation from the Fund, and the Board reviewed information on the profitability of the Fund’s transfer agency function to HASCO. The Board considered information provided by HASCO indicating that the transfer agent fees charged by HASCO to the Fund were fair and reasonable based on publicly available information.
| 35 |
The Hartford International Opportunities Fund
Approval of Investment Management and Investment Sub-Advisory Agreements (Unaudited) – (continued)
The Board also considered that Hartford Funds Distributors, LLC (“HFD”), an affiliate of HFMC, serves as principal underwriter of the Fund. As principal underwriter, HFD receives 12b-1 fees from the Fund and receives all or a portion of the sales charges on sales or redemptions of certain classes of shares. The Board also noted that certain affiliates of HFD distribute shares of the Fund and receive compensation in that connection.
The Board considered benefits to the Sub-adviser from its use of the Fund’s brokerage commissions to obtain soft dollar research, and representations from HFMC and the Sub-adviser that the Sub-adviser would not make any revenue-sharing payments or any other type of distribution payments to HFMC or its affiliates.
The Board considered the benefits to shareholders of being part of the Hartford Funds family of funds, including the right to exchange investments between the same class of funds without a sales charge, the ability to reinvest Fund dividends into other funds in the family, and the ability to combine holdings in the Fund with holdings in other funds to obtain a reduced sales charge. The Board considered HFMC’s efforts to provide investors in the family with a broad range of investment styles and asset classes and its entrepreneurial risk in initiating new funds to expand these opportunities for shareholders.
* * * *
Based upon its review of these various factors, among others, the Board concluded that it is in the best interests of the Fund and its shareholders for the Board to approve the Agreements for an additional year. In reaching this decision, the Board did not assign relative weights to the factors discussed above or deem any one or group of them to be controlling in and of themselves. In connection with their deliberations, the Independent Directors met separately in executive session on several occasions, with independent legal counsel and the Consultant, to review the relevant materials and consider their responsibilities under relevant laws and regulations.
| 36 |
The Hartford International Opportunities Fund
Main Risks (Unaudited)
The main risks of investing in the Fund are described below.
Market, Selection and Strategy Risk: The Fund’s share price may fluctuate due to market risk and/or security selections that may underperform the market or relevant benchmarks. If the sub-adviser's investment strategy does not perform as expected, the Fund could underperform its peers or lose money. There is no guarantee the Fund will achieve its stated objective.
Foreign Investment and Emerging Markets Risk: Investments in foreign securities may be riskier than investments in U.S. securities. Potential risks include the risks of illiquidity, increased price volatility, less government regulation, less extensive and less frequent accounting and other reporting requirements, unfavorable changes in currency exchange rates, and economic and political disruptions. These risks are generally greater for investments in emerging markets.
Mid-Cap Stock Risk: Mid-cap stocks are generally more volatile and risky and may be less liquid than large-cap stocks because they may have limited operating histories, narrow product lines, and focus on niche markets.
Active Trading Risk: Actively trading investments may result in higher costs and higher taxable income.
| 37 |
THIS PRIVACY POLICY IS NOT PART OF THIS REPORT
Privacy Policy and Practices of The Hartford Financial Services Group, Inc. and its Affiliates
(herein called “we, our and us”)
This Privacy Policy applies to our United States Operations
|
We value your trust. We are committed to the responsible: a) management; b) use; and c) protection; of Personal Information.
This notice describes how we collect, disclose, and protect Personal Information.
We collect Personal Information to: a) service your Transactions with us; and b) support our business functions.
We may obtain Personal Information from: a) You; b) your Transactions with us; and c) third parties such as a consumer-reporting agency.
Based on the type of product or service You apply for or get from us, Personal Information such as: a) your name; b) your address; c) your income; d) your payment; or e) your credit history; may be gathered from sources such as applications, Transactions, and consumer reports.
To serve You and service our business, we may share certain Personal Information. We will share Personal Information, only as allowed by law, with affiliates such as: a) our insurance companies; b) our employee agents; c) our brokerage firms; and d) our administrators.
As allowed by law, we may share Personal Financial Information with our affiliates to: a) market our products; or b) market our services; to You without providing You with an option to prevent these disclosures.
|
We may also share Personal Information, only as allowed by law, with unaffiliated third parties including: a) independent agents; b) brokerage firms; c) insurance companies; d) administrators; and e) service providers; who help us serve You and service our business.
When allowed by law, we may share certain Personal Financial Information with other unaffiliated third parties who assist us by performing services or functions such as: a) taking surveys; b) marketing our products or services; or c) offering financial products or services under a joint agreement between us and one or more financial institutions.
We, and third parties we partner with, may track some of the pages You visit through the use of: a) cookies; b) pixel tagging; or c) other technologies; and currently do not process or comply with any web browser’s “do not track” signal or similar mechanism that indicates a request to disable online tracking of individual users who visit our websites or use our services.
We will not sell or share your Personal Financial Information with anyone for purposes unrelated to our business functions without offering You the opportunity to: a) “opt-out;” or b) “opt-in;” as required by law.
We only disclose Personal Health Information with: a) your proper written authorization; or b) as otherwise allowed or required by law.
Our employees have access to Personal Information in the course of doing their jobs, such as: a) underwriting policies; b) paying claims; c) developing new products; or d) advising customers of our products and services.
|
|
We use manual and electronic security procedures to maintain: a) the confidentiality; and b) the integrity of; Personal Information that we have. We use these procedures to guard against unauthorized access.
Some techniques we use to protect Personal Information include: a) secured files; b) user authentication; c) encryption; d) firewall technology; and e) the use of detection software.
We are responsible for and must: a) identify information to be protected; b) provide an adequate level of protection for that data; c) grant access to protected data only to those people who must use it in the performance of their job-related duties.
Employees who violate our Privacy Policy will be subject to discipline, which may include ending their employment with us.
At the start of our business relationship, we will give You a copy of our current Privacy Policy.
We will also give You a copy of our current Privacy Policy once a year if You maintain a continuing business relationship with us.
We will continue to follow our Privacy Policy regarding Personal Information even when a business relationship no longer exists between us.
|
As used in this Privacy Notice:
Application means your request for our product or service.
Personal Financial Information means financial information such as: a) credit history; b) income; c) financial benefits; or d) policy or claim information.
Personal Health Information means health information such as: a) your medical records; or b) information about your illness, disability or injury.
Personal Information means information that identifies You personally and is not otherwise available to the public. It includes: a) Personal Financial Information; and b) Personal Health Information.
Transaction means your business dealings with us, such as: a) your Application; b) your request for us to pay a claim; and c) your request for us to take an action on your account.
You means an individual who has given us Personal Information in conjunction with: a) asking about; b) applying for; or c) obtaining; a financial product or service from us if the product or service is used mainly for personal, family, or household purposes.
|
This Privacy Policy is being provided on behalf of the following affiliates of The Hartford Financial Services Group, Inc.:
1stAGChoice, Inc.; Access CoverageCorp, Inc.; Access CoverageCorp Technologies, Inc.; American Maturity Life Insurance Company; Archway 60 R, LLC; Business Management Group, Inc.; Champlain Life Reinsurance Company; DMS R, LLC; Eloy R, LLC; Ersatz Corporation; First State Insurance Company; Hartford Accident and Indemnity Company; Hartford Administrative Services Company; Hartford Casualty General Agency, Inc.; Hartford Casualty Insurance Company; Hartford-Comprehensive Employee Benefit Service Company; Hartford Equity Sales Company, Inc.; Hartford Fire General Agency, Inc.; Hartford Fire Insurance Company; Hartford Funds Management Company, LLC; Hartford Funds Management Group, Inc.; Hartford HLS Series Fund II, Inc.; Hartford Insurance Company of Illinois; Hartford Insurance Company of the Midwest; Hartford Insurance Company of the Southeast; Hartford Integrated Technologies, Inc.; Hartford International Life Reassurance Corporation; Hartford Funds Distributors, LLC; Hartford Investment Management Company; Hartford Life and Accident Insurance Company; Hartford Life and Annuity Insurance Company; Hartford Life Insurance Company; Hartford Life Private Placement, LLC; Hartford Lloyd’s Corporation; Hartford Lloyd’s Insurance Company; Hartford Mezzanine Investors I, LLC; Hartford Residual Market, L.C.C.; Hartford Retirement Services, LLC; Hartford Securities Distribution Company, Inc.; Hartford Series Fund, Inc.; Hartford Specialty Insurance Services of Texas, LLC; Hartford Strategic Investments, LLC; Hartford Underwriters Insurance Company; Hartford Technology Services Company, L.L.C.; Hartford of Texas General Agency, Inc.; Hartford Underwriters General Agency, Inc.; HARTRE Company, L.C.C.; HL Investment Advisors, LLC; HLA LLC; Horizon Management Group, LLC; HRA Brokerage Services, Inc.; Lanidex Class B, LLC; M-CAP Insurance Agency, LLC; New England Insurance Company; New England Reinsurance Corporation; Nutmeg Insurance Agency, Inc.; Nutmeg Insurance Company; Pacific Insurance Company, Limited; Planco, LLC: Property and Casualty Insurance Company of Hartford; Revere R, LLC; RVR R, LLC; Sentinel Insurance Company, Ltd.; Sunstone R, LLC; Symphony R, LLC; The Evergreen Group Incorporated; The Hartford Alternative Strategies Fund; The Hartford Mutual Funds, Inc.; The Hartford Mutual Funds II, Inc.; Trumbull Flood Management, L.L.C.; Trumbull Insurance Company; Twin City Fire Insurance Company; White River Life Reinsurance Company.
HPP Revised January 2014
HARTFORDFUNDS
hartfordfunds.com
This information is written in connection with the promotion or marketing of the matter(s) addressed in this material.
This report is submitted for the general information of the shareholders of the Fund. It is not authorized for distribution unless preceded or accompanied by a current prospectus for the Fund.
The information cannot be used or relied upon for the purpose of avoiding IRS penalties. These materials are not intended to provide tax, accounting or legal advice. As with all matters of a tax or legal nature, you should consult your own tax or legal counsel for advice.
Investors should carefully consider the investment objectives, risks, charges, and expenses of Hartford Funds before investing. This and other information can be found in the prospectus and summary prospectus, which can be obtained by calling 888-843-7824 (retail) or 800-279-1541 (institutional). Investors should read them carefully before they invest.
Hartford Funds are underwritten and distributed by Hartford Funds Distributors, LLC.
MFAR-IO14 12/14 113988-3 Printed in U.S.A.
HARTFORDFUNDS
|
THE HARTFORD INTERNATIONAL
2014 Annual Report |
A MESSAGE FROM THE PRESIDENT
Dear Fellow Shareholders:
Thank you for investing in Hartford Funds.
Market Review
U.S. equities (as represented by the S&P 500 Index) rose steadily for the fiscal year ended October 31, 2014, with a return of 17.27% for the period. With the exception of short-lived geopolitical scares early in 2014 and concerns about continuing global growth near the end of the period, stocks generally rose on solid fundamentals and encouraging macroeconomic data during the year.
September 2014 marked the six-year anniversary of the start of the financial crisis. Within weeks of that anniversary, both the S&P 500 Index and the Dow Jones Industrial Average set new all-time highs, closing at 2,018 and 17,391, respectively, on October 31. Although the fallout of the crisis continues to influence investor behavior, stocks have recovered and risen dramatically, up 198% from their low in March 2009. Meanwhile, the domestic economy is notching strong growth, and the unemployment rate has reached its lowest level since August 2008.
While the U.S. economy appears to have stabilized and to have reverted to a solid growth path, the outlook for the global economy appears to have gotten cloudier. The U.S. Federal Reserve has ended quantitative easing, while Europe and Japan are pursuing stimulus options to avoid a double-dip recession and deflation, respectively. Diverging central-bank policies will likely continue to play an important role in market movements going forward as investors wait to see the reactions to their efforts and their impacts on global markets.
How have market movements impacted your portfolio throughout the last year? Are your investments still on track to provide the growth or income you need, and are you comfortable with their progress during times of volatility?
Your financial professional can help you navigate today’s markets with confidence, as well as assist you to achieve your investment goals by providing advice on the best options within our fund family to help you work toward overcoming today’s investing challenges. Meet with your financial advisor regularly to examine your portfolio and your investment strategy, and to determine if you’re still on track to meet your goals.
Thank you again for investing with Hartford Funds.
James Davey
President
Hartford Funds
1 The S&P 500 Index is a market capitalization-weighted price index composed of 500 widely held common stocks.
2 The Dow Jones Industrial Average is an unmanaged, price-weighted index of 30 of the largest, most widely held stocks traded on the NYSE
The Hartford International Small Company Fund
The views expressed in the Fund’s Manager Discussion under ‘‘Why did the Fund perform this way?’’ and ‘‘What is the outlook?’’ are views of the Fund’s sub-adviser and portfolio management team through the end of the period and are subject to change based on market and other conditions. The Fund’s Manager Discussion is for informational purposes only and does not represent an offer, recommendation or solicitation to buy, hold or sell any security. The specific securities identified and described, if any, do not represent all of the securities purchased or sold and you should not assume that investments in the securities identified and discussed will be profitable.
The Hartford International Small Company Fund inception 04/30/2001
(sub-advised by Wellington Management Company, LLP)
|
Investment objective – The Fund seeks capital appreciation. |
Performance Overview 10/31/04 - 10/31/14
The chart above represents the hypothetical growth of a $10,000 investment in Class A, which includes a sales charge. Growth results in classes other than Class A will vary from what is seen above due to differences in the expenses charged to those share classes.
Average Annual Total Returns (as of 10/31/14)
| 1 Year | 5 Years | 10 Years | ||||||||||
| International Small Company A# | -3.33 | % | 10.36 | % | 8.19 | % | ||||||
| International Small Company A## | -8.65 | % | 9.12 | % | 7.58 | % | ||||||
| International Small Company B# | -4.16 | % | 9.51 | % | 7.61 | %* | ||||||
| International Small Company B## | -8.96 | % | 9.23 | % | 7.61 | %* | ||||||
| International Small Company C# | -4.06 | % | 9.52 | % | 7.38 | % | ||||||
| International Small Company C## | -5.02 | % | 9.52 | % | 7.38 | % | ||||||
| International Small Company I# | -3.08 | % | 10.81 | % | 8.49 | % | ||||||
| International Small Company R3# | -3.54 | % | 10.30 | % | 8.40 | % | ||||||
| International Small Company R4# | -3.22 | % | 10.60 | % | 8.55 | % | ||||||
| International Small Company R5# | -2.90 | % | 10.88 | % | 8.69 | % | ||||||
| International Small Company Y# | -2.88 | % | 10.93 | % | 8.72 | % | ||||||
| S&P EPAC SmallCap Index | -0.31 | % | 9.30 | % | 8.27 | % | ||||||
| # | Without sales charge |
| ## | With sales charge |
| * | Class B shares convert to Class A shares after 8 years. The return shown reflects the conversion to Class A shares, which had different operating expenses, for the period after conversion. |
PERFORMANCE DATA QUOTED REPRESENTS PAST PERFORMANCE AND DOES NOT GUARANTEE FUTURE RESULTS. The investment return and principal value of the investment will fluctuate so that investors’ shares, when redeemed, may be worth more or less than their original cost. Current performance may be lower or higher than the performance data quoted. To obtain performance data current to the most recent month-end, please visit our website www.hartfordfunds.com.
The initial investment in Class A shares reflects the maximum sales charge of 5.50% and returns for Class B shares reflect a contingent deferred sales charge of up to 5.00% and declining to zero, depending on the period of time the shares are held. Returns for Class C shares reflect a contingent deferred sales charge of up to 1.00% on shares redeemed within twelve months of purchase.
Total returns presented above were calculated using the Fund’s net asset value available to shareholders for sale or redemption of Fund shares on October 31, 2014, which may exclude investment transactions as of this date. All share class returns assume the reinvestment of all distributions at net asset value and the deduction of all fund expenses.
Effective 9/30/09, Class B shares of the Fund were closed to new investments.
Class I shares commenced operations on 5/31/07. Performance prior to that date is that of the Fund’s Class A shares (excluding sales charges), which had different operating expenses. Class R3, R4 and R5 shares commenced operations on 5/28/10. Performance prior to that date is that of the Fund’s Class Y shares which had different operating expenses.
S&P EPAC SmallCap Index is a global equity index comprised of the smallest 15% of each country’s market capitalization in the S&P BMI (Broad Market Index) World. (The S&P BMI World Index captures all companies in developed markets with free float market capitalization of at least $100 million as of the annual index reconstitution.) All developed market countries are included in the S&P EPAC SmallCap except the U.S. and Canada.
You cannot invest directly in an index.
The chart and table do not reflect the deductions of taxes that a shareholder would pay on Fund distributions or the redemption of Fund shares.
Performance information may reflect historical or current expense waivers/reimbursements from the investment adviser, without which performance would have been lower. For information on current expense waivers/reimbursements, please see the prospectus.
| 2 |
The Hartford International Small Company Fund
Manager Discussion
October 31, 2014 (Unaudited)
| Operating Expenses* | ||||||||
| Net | Gross | |||||||
| International Small Company Class A | 1.54 | % | 1.54 | % | ||||
| International Small Company Class B | 2.29 | % | 2.55 | % | ||||
| International Small Company Class C | 2.28 | % | 2.28 | % | ||||
| International Small Company Class I | 1.11 | % | 1.11 | % | ||||
| International Small Company Class R3 | 1.65 | % | 1.69 | % | ||||
| International Small Company Class R4 | 1.35 | % | 1.39 | % | ||||
| International Small Company Class R5 | 1.05 | % | 1.11 | % | ||||
| International Small Company Class Y | 0.99 | % | 0.99 | % | ||||
| * | As shown in the Fund's current prospectus dated March 1, 2014. Actual expenses may be higher or lower. Please see accompanying Financial Highlights for expense ratios for the year ended October 31, 2014. |
Gross expenses are the Fund's total annual operating expenses shown in the Fund's most recent prospectus. Net expenses are the Fund's total annual operating expenses shown in the Fund's most recent prospectus and reflect contractual expense reimbursements in instances when these reductions reduce the Fund's gross expenses. Contractual reimbursements remain in effect until February 28, 2015, and automatically renew for one-year terms unless terminated.
All investments are subject to risk including the possible loss of principal. For a discussion of the Fund’s risks, please see the Main Risks section of this report. For more detailed information on the risks associated with an investment in the Fund, please see the prospectus.
| Portfolio Managers | |
| Simon Thomas | Daniel Maguire, CFA |
| Senior Vice President and Equity Portfolio Manager | Director and Equity Portfolio Manager |
How did the Fund perform?
The Class A shares of The Hartford International Small Company Fund returned -3.33%, before sales charge, for the twelve-month period ended October 31, 2014, underperforming the Fund’s benchmark, the S&P EPAC SmallCap Index, which returned -0.31% for the same period. The Fund also underperformed the -0.28% average return of the Lipper International Small/Mid-Cap Growth peer group, a group of funds with investment strategies similar to those of the Fund.
Why did the Fund perform this way?
Global equities rose during the period, notwithstanding bouts of significant volatility. Despite ongoing geopolitical tensions in Ukraine and the Middle East, concerns about a Chinese economic growth slowdown, and unsettling economic and political developments in several other emerging market countries, the five-year-old bull market continued in the first half of 2014. Robust merger and acquisition activity, along with continued accommodative monetary policy from central banks around the globe, aided positive investor sentiment in May and June. However, Portuguese banking woes, European economic malaise, and the prospect of an accelerated U.S. Federal Reserve (Fed) interest-rate-hike timeline all contributed to stall the global stock rally near the tail end of the period. In addition, China's property slump and poor gross domestic product (GDP) readings in Japan and the eurozone raised the specter of a slowdown in global economic growth. Nevertheless, there were several positive developments, including monetary easing by the European Central Bank and the People's Bank of China, as well as an encouraging U.S. corporate earnings season. Despite these positives, many market participants found ample reason to reassess their risk appetites (i.e. reduce risks), given the strong performance in recent years. During the period, emerging market equities underperformed their developed market counterparts and U.S. stocks generally outperformed non-U.S. stocks.
Six of the ten sectors within the benchmark posted positive returns. Utilities (+10%), Healthcare (+7%), and Telecommunication Services (+6%) gained the most during the period. Energy (-25%), Materials (-4%), and Industrials (-4%) lagged on a relative basis.
The Fund underperformed its benchmark primarily due to weak stock selection within the Consumer Discretionary, Financials, and Materials sectors; this was partially offset by stronger stock selection within the Healthcare and Industrials sectors. Sector allocation, a fall-out of the bottom-up stock selection process, detracted from the Fund’s relative performance, in part due to overweight allocations to Energy and Industrials. On a regional basis, stock selection within Europe was the primary detractor from benchmark-relative performance which was only partially offset by positive contributions from an overweight to and security selection within Japan.
The largest detractors from absolute and relative performance during the period were Mothercare (Consumer Discretionary), Vocation (Consumer Discretionary), and Iida Group Holdings (Consumer Discretionary). Shares of Mothercare, a U.K.-based retailer of baby clothing and educational toys, declined as earnings results were worse than expected due to gross margin pressure in its U.K. business and lower traffic due to unseasonable weather in Russia and the Middle East, which are important regions for the company. Shares of Vocation, an Australian-based company that delivers government-funded education and training services, fell sharply during the period on the announcement of a larger-than-expected settlement to resolve a dispute with the Australian state of Victoria. Shares of Iida Group Holdings, the newly re-merged group of six homebuilders that is expected to become one of Japan's largest home building companies post the integration, fell during the period as higher costs in the built-for-sale housing segment hurt operating profits by more than expected even though sales volumes rose.
| 3 |
The Hartford International Small Company Fund
Manager Discussion – (continued)
October 31, 2014 (Unaudited)
Top contributors to relative returns during the period were Nippon Shinyaku (Healthcare), Sumco (Information Technology), and Groupe Fnac (Materials). Shares of Nippon Shinyaku , a Japan-based pharmaceutical company, soared as a key drug, developed with Switzerland-based pharmaceutical company Actelion, passed the U.S. Food and Drug Administration’s Phase 3 efficacy test, an important milestone. Shares of Sumco, a Japan-based manufacturer of wafers used to make semiconductor chips, rose during the period as pricing and sales volumes improved. Shares of Groupe Fnac, a leading French retailer of consumer electronics, CDs/DVDs, books and video games, rose as earning results for 4th quarter 2013 beat expectations handily and the momentum continued into the year as 3rd quarter 2014 results were also ahead of expectations due to stabilizing sales and ongoing cost cutting. Top contributors to absolute returns during the period included Zenkoku Hosho (Financials).
Derivatives are not used in a significant manner in this Fund and thus did not have a material impact on performance during the period.
What is the outlook?
Overall, we have observed that the market has been rather narrow and high quality companies with strong returns on invested capital have underperformed. When markets have gone up for a period of time, we believe lower quality companies can gain more attention. Regardless of the market environment, our investment process continues to prioritize intensive fundamental bottom-up research to select stocks that we believe are high quality with strong balance sheets and good business models that are attractively valued relative to their global industry. Further, we buy companies whose results we think will exceed consensus expectations over the next two to three years. We think a disciplined approach to valuation and a quality orientation leads to better results in down markets and overall performance over time.
At the end of the period, we remained most overweight the Industrials, Healthcare, and Energy sectors relative to the benchmark. Our largest underweights were to the Consumer Discretionary, Consumer Staples, and Utilities sectors, relative to the benchmark. On a regional basis, our greatest underweight position, relative to the benchmark, at the end of the period was to Europe (ex U.K.) while we held our largest overweight position in Japan.
Diversification by Sector
as of October 31, 2014
| Sector | Percentage of Net Assets | |||
| Equity Securities | ||||
| Consumer Discretionary | 12.0 | % | ||
| Consumer Staples | 3.2 | |||
| Energy | 3.6 | |||
| Financials | 23.0 | |||
| Health Care | 11.4 | |||
| Industrials | 28.2 | |||
| Information Technology | 8.0 | |||
| Materials | 7.7 | |||
| Utilities | 0.4 | |||
| Total | 97.5 | % | ||
| Short-Term Investments | 1.4 | |||
| Other Assets and Liabilities | 1.1 | |||
| Total | 100.0 | % |
A sector may be comprised of several industries. For Fund compliance purposes, the Fund may not use the same classification system and these sector classifications are used for reporting ease.
Currency Concentration of Securities
as of October 31, 2014
| Description | Percentage of Net Assets | |||
| Australian Dollar | 5.5 | % | ||
| Brazilian Real | 0.5 | |||
| British Pound | 18.5 | |||
| Canadian Dollar | 0.3 | |||
| Danish Kroner | 3.1 | |||
| Euro | 19.3 | |||
| Hong Kong Dollar | 0.9 | |||
| Indonesian New Rupiah | 0.4 | |||
| Japanese Yen | 36.8 | |||
| Mexican New Peso | 0.2 | |||
| Norwegian Krone | 1.4 | |||
| Republic of Korea Won | 1.8 | |||
| South African Rand | 0.4 | |||
| Swedish Krona | 1.8 | |||
| Swiss Franc | 5.0 | |||
| United States Dollar | 3.0 | |||
| Other Assets and Liabilities | 1.1 | |||
| Total | 100.0 | % |
| 4 |
The Hartford International Small Company Fund
Schedule of Investments
October 31, 2014
(000’s Omitted)
| Shares or Principal Amount | Market Value ╪ | |||||||
| Common Stocks - 97.5% | ||||||||
| Australia - 5.5% | ||||||||
| 288 | Challenger Financial Services Group Ltd. | $ | 1,772 | |||||
| 531 | Karoon Gas Australia Ltd. ● | 1,388 | ||||||
| 465 | NuFarm Ltd. | 2,027 | ||||||
| 433 | SAI Global Ltd. ☼ | 1,569 | ||||||
| 1,526 | Spotless Group Holdings Ltd. ● | 2,581 | ||||||
| 196 | Super Retail Group Ltd. | 1,272 | ||||||
| 678 | Tox Free Solutions Ltd. | 1,454 | ||||||
| 2,168 | Transpacific Industries Group Ltd. | 1,717 | ||||||
| 665 | Vocation Ltd. | 530 | ||||||
| 14,310 | ||||||||
| Austria - 1.5% | ||||||||
| 47 | Andritz AG | 2,253 | ||||||
| 19 | Schoeller-Bleckmann Oilfield Equipment AG | 1,640 | ||||||
| 3,893 | ||||||||
| Belgium - 2.9% | ||||||||
| 18 | Ackermans & van Haaren N.V. | 2,250 | ||||||
| 26 | Compagnie d'Entreprises CFE | 2,855 | ||||||
| 66 | D'ieteren S.A. | 2,382 | ||||||
| 7,487 | ||||||||
| Brazil - 0.5% | ||||||||
| 394 | Magazine Luiza S.A. | 1,311 | ||||||
| China - 1.5% | ||||||||
| 2,636 | GCL-Poly Energy Holdings Ltd. ● | 888 | ||||||
| 82 | WuXi PharmaTech Cayman, Inc. ● | 3,080 | ||||||
| 3,968 | ||||||||
| Colombia - 0.3% | ||||||||
| 45 | Pacific Rubiales Energy Corp. | 679 | ||||||
| Denmark - 3.1% | ||||||||
| 97 | DSV AS | 2,892 | ||||||
| 134 | H. Lundbeck A/S | 2,851 | ||||||
| 101 | Matas A/S | 2,217 | ||||||
| 7,960 | ||||||||
| Finland - 0.5% | ||||||||
| 61 | Tikkurila Oyj | 1,263 | ||||||
| France - 2.9% | ||||||||
| 28 | Eurazeo | 1,885 | ||||||
| 38 | Imerys S.A. | 2,714 | ||||||
| 336 | S.O.I. Tec S.A. ● | 837 | ||||||
| 5 | Virbac S.A. | 1,100 | ||||||
| 10 | Wendel S.A. | 1,048 | ||||||
| 7,584 | ||||||||
| Germany - 4.0% | ||||||||
| 55 | DMG Mori Seiki AG | 1,398 | ||||||
| 34 | ElringKlinger AG | 1,055 | ||||||
| 32 | Grenke Leasing | 3,190 | ||||||
| 46 | Rheinmetall AG | 1,986 | ||||||
| 72 | SAF-Holland S.A. | 906 | ||||||
| 33 | STRATEC Biomedical AG | 1,729 | ||||||
| 10,264 | ||||||||
| Greece - 0.6% | ||||||||
| 154 | Grivalia Properties REIC | 1,670 | ||||||
| Hong Kong - 0.6% | ||||||||
| 432 | Shanghai Fosun Pharmaceutical Co., Ltd. | 1,555 | ||||||
| Indonesia - 0.4% | ||||||||
| 7,814 | Gajah Tunggal Tbk PT | 931 | ||||||
| Italy - 4.1% | ||||||||
| 403 | Anima Holding S.p.A. ● | 1,887 | ||||||
| 45 | Banca Generali S.p.A. | 1,200 | ||||||
| 2,472 | Beni Stabili S.p.A. | 1,702 | ||||||
| 58 | Brunello Cucinelli S.p.A. | 1,168 | ||||||
| 39 | DiaSorin S.p.A. | 1,509 | ||||||
| 35 | EI Towers S.p.A. ● | 1,737 | ||||||
| 772 | Immobiliare Grande Distribuzione REIT | 645 | ||||||
| 28 | Salvatore Ferragamo Italia S.p.A. | 656 | ||||||
| 10,504 | ||||||||
| Japan - 36.8% | ||||||||
| 66 | Asahi Intecc Co., Ltd. | 3,011 | ||||||
| 112 | Chiyoda Corp. | 1,154 | ||||||
| 64 | CyberAgent, Inc. | 2,508 | ||||||
| 154 | Denyo Co., Ltd. | 2,045 | ||||||
| 72 | Digital Garage, Inc. | 966 | ||||||
| 149 | DMG Mori Seiki Co., Ltd. | 1,750 | ||||||
| 53 | Exedy Corp. | 1,347 | ||||||
| 334 | Ferrotec Corp. | 1,819 | ||||||
| 3 | GLP J-REIT | 3,170 | ||||||
| 21 | Hitachi Metals Ltd. | 355 | ||||||
| 57 | Hoshizaki Electric Co., Ltd. | 2,771 | ||||||
| 73 | IBJ Leasing Co., Ltd. | 1,727 | ||||||
| 74 | Ichiyoshi Securities Co., Ltd. | 877 | ||||||
| 637 | IHI Corp. | 3,071 | ||||||
| 132 | IIDA Group Holdings Co., Ltd. | 1,471 | ||||||
| 72 | Internet Initiative Japan, Inc. | 1,255 | ||||||
| 203 | Jaccs Co., Ltd. | 1,213 | ||||||
| 90 | Jamco Corp. | 1,995 | ||||||
| 39 | Japan Petroleum Exploration Co., Ltd. | 1,259 | ||||||
| 44 | Kakaku.com, Inc. | 594 | ||||||
| 423 | Kawasaki Heavy Industries Ltd. | 1,662 | ||||||
| 825 | Kobe Steel Ltd. | 1,311 | ||||||
| 224 | Makino Milling Machine Co. | 1,527 | ||||||
| 87 | Message Co., Ltd. | 2,731 | ||||||
| 394 | Mitsubishi Gas Chemical Co. | 2,357 | ||||||
| 750 | Mitsubishi UFJ Lease & Finance Co., Ltd. | 3,957 | ||||||
| 216 | Nikkiso Co., Ltd. | 2,234 | ||||||
| 94 | Nippon Shinyaku Co., Ltd. | 2,706 | ||||||
| 119 | Nippon Shokubai Co., Ltd. ☼ | 1,426 | ||||||
| 156 | Pocket Card Co., Ltd. | 952 | ||||||
| 45 | Sanken Electric Co., Ltd. | 353 | ||||||
| 281 | Sanwa Holdings Corp. | 1,949 | ||||||
| 1,863 | Shinsei Bank Ltd. | 4,187 | ||||||
| 100 | Shionogi & Co., Ltd. | 2,603 | ||||||
| 146 | Shizuoka Gas Co., Ltd. | 957 | ||||||
| 245 | Sumco Corp. | 3,290 | ||||||
| 69 | Sumisho Computer Systems Corp. | 1,860 | ||||||
| 56 | TDK Corp. | 3,201 | ||||||
| 124 | Tenma Corp. | 1,723 | ||||||
| 56 | THK Co., Ltd. | 1,404 | ||||||
| 252 | Tokyo Steel Manufacturing Co., Ltd. | 1,349 | ||||||
| 62 | Tokyo TY Financial Group, Inc. ● | 1,973 | ||||||
| 26 | Tsuruha Holdings, Inc. | 1,506 | ||||||
| 81 | Yamato Kogyo Co. | 2,634 | ||||||
| 186 | Yaskawa Electric Corp. | 2,408 | ||||||
| 138 | Yokogawa Electric Corp. | 1,921 | ||||||
| 125 | Zenkoku Hosho Co., Ltd. | 3,944 | ||||||
The accompanying notes are an integral part of these financial statements.
| 5 |
The Hartford International Small Company Fund
Schedule of Investments – (continued)
October 31, 2014
(000’s Omitted)
| Shares or Principal Amount | Market Value ╪ | |||||||
| Common Stocks - 97.5% - (continued) | ||||||||
| Japan - 36.8% - (continued) | ||||||||
| 62 | Zuiko Corp. | $ | 2,963 | |||||
| 95,446 | ||||||||
| Luxembourg - 1.8% | ||||||||
| 134 | Braas Monier Building Group ● | 2,696 | ||||||
| 96 | Reinet Investments S.A. | 2,043 | ||||||
| 4,739 | ||||||||
| Mexico - 0.2% | ||||||||
| 298 | Grupo Sanborns S.A. de C.V. | 476 | ||||||
| Netherlands - 1.0% | ||||||||
| 255 | USG People N.V. | 2,555 | ||||||
| Norway - 1.4% | ||||||||
| 183 | Kongsberg Gruppen ASA | 3,708 | ||||||
| Russia - 0.4% | ||||||||
| 149 | O'Key Group S.A. GDR ■ | 900 | ||||||
| South Africa - 0.4% | ||||||||
| 352 | Gold Fields Ltd. | 1,141 | ||||||
| South Korea - 1.8% | ||||||||
| 7 | CJ O Shopping Co., Ltd. | 1,626 | ||||||
| 17 | Green Cross Corp. | 2,228 | ||||||
| 21 | Samsung Securities Co., Ltd. | 933 | ||||||
| 4,787 | ||||||||
| Sweden - 1.1% | ||||||||
| 261 | Bufab Holding AB ● | 1,879 | ||||||
| 76 | Haldex AB | 930 | ||||||
| 2,809 | ||||||||
| Switzerland - 5.0% | ||||||||
| 19 | Dufry Group ● | 2,693 | ||||||
| 147 | Gategroup Holding AG | 3,303 | ||||||
| 6 | Kuoni Reisen Holding AG | 1,527 | ||||||
| 79 | Oc Oerlikon Corp. Ag-Reg | 1,004 | ||||||
| 9 | Partners Group | 2,280 | ||||||
| 21 | Tecan Group AG | 2,203 | ||||||
| 13,010 | ||||||||
| United Kingdom - 19.2% | ||||||||
| 558 | B&M European Value Retail S.A. ● | 2,234 | ||||||
| 34 | Berkeley (The) Group Holdings plc | 1,261 | ||||||
| 216 | Big Yellow Group REIT | 1,887 | ||||||
| 1,461 | Booker Group plc | 3,284 | ||||||
| 176 | Chemring Group plc | 685 | ||||||
| 152 | Concentric AB | 1,861 | ||||||
| 407 | Crest Nicholson Holdings Ltd. | 2,190 | ||||||
| 155 | De La Rue plc | 1,302 | ||||||
| 563 | Direct Line Insurance Group plc | 2,492 | ||||||
| 241 | Domino's Pizza Group plc | 2,458 | ||||||
| 415 | Elementis plc | 1,758 | ||||||
| 832 | Hansteen Holdings plc REIT | 1,411 | ||||||
| 1,267 | Hays plc | 2,503 | ||||||
| 96 | Hunting plc | 1,127 | ||||||
| 210 | IG Group Holdings plc | 2,020 | ||||||
| 94 | James Fisher & Sons plc | 1,963 | ||||||
| 106 | Keller Group plc | 1,422 | ||||||
| 109 | Kennedy Wilson Europe Real Estate plc | 1,822 | ||||||
| 70 | Kier Group plc | 1,672 | ||||||
| 413 | Mears Group plc | 2,921 | ||||||
| 315 | Michael Page International plc | 1,962 | ||||||
| 470 | Ophilr Energy plc ● | 1,394 | ||||||
| 219 | Savills plc | 2,258 | ||||||
| 282 | TSB Banking Group plc ●‡ | 1,220 | ||||||
| 649 | Tyman plc | 2,811 | ||||||
| 274 | Unite Group plc | 1,875 | ||||||
| 49,793 | ||||||||
| Total Common Stocks | ||||||||
| (Cost $258,168) | $ | 252,743 | ||||||
| Total Long-Term Investments | ||||||||
| (Cost $258,168) | $ | 252,743 | ||||||
| Short-Term Investments - 1.4% | ||||||||
| Repurchase Agreements - 1.4% | ||||||||
| Bank of America Merrill Lynch TriParty Repurchase Agreement (maturing on 11/03/2014 in the amount of $10, collateralized by U.S. Treasury Note 1.50%, 2019, value of $11) | ||||||||
| $ | 10 | 0.08%, 10/31/2014 | $ | 10 | ||||
| Bank of America Merrill Lynch TriParty Repurchase Agreement (maturing on 11/03/2014 in the amount of $178, collateralized by GNMA 1.63% - 7.00%, 2031 - 2054, value of $182) | ||||||||
| 178 | 0.09%, 10/31/2014 | 178 | ||||||
| Bank of Montreal TriParty Repurchase Agreement (maturing on 11/03/2014 in the amount of $48, collateralized by U.S. Treasury Bond 2.88% - 5.25%, 2029 - 2043, U.S. Treasury Note 0.38% - 4.50%, 2015 - 2022, value of $49) | ||||||||
| 48 | 0.08%, 10/31/2014 | 48 | ||||||
| Bank of Montreal TriParty Repurchase Agreement (maturing on 11/03/2014 in the amount of $162, collateralized by FHLMC 2.00% - 5.50%, 2022 - 2034, FNMA 2.00% - 4.50%, 2024 - 2039, GNMA 3.00%, 2043, U.S. Treasury Note 4.63%, 2017, value of $165) | ||||||||
| 162 | 0.10%, 10/31/2014 | 162 | ||||||
| Barclays Capital TriParty Repurchase Agreement (maturing on 11/03/2014 in the amount of $611, collateralized by U.S. Treasury Bond 4.50% - 6.25%, 2023 - 2036, U.S. Treasury Note 1.63% - 2.13%, 2015 - 2019, value of $623) | ||||||||
| 611 | 0.08%, 10/31/2014 | 611 | ||||||
| Citigroup Global Markets, Inc. TriParty Repurchase Agreement (maturing on 11/03/2014 in the amount of $702, collateralized by U.S. Treasury Bill 0.02%, 2015, U.S. Treasury Bond 3.88% - 11.25%, 2015 - 2040, U.S. Treasury Note 2.00% - 3.38%, 2019 - 2021, value of $716) | ||||||||
| 702 | 0.09%, 10/31/2014 | 702 | ||||||
| Deutsche Bank Securities TriParty Repurchase Agreement (maturing on 11/03/2014 in the amount of $41, collateralized by U.S. Treasury Note 0.88%, 2017, value of $41) | ||||||||
| 41 | 0.13%, 10/31/2014 | 41 | ||||||
The accompanying notes are an integral part of these financial statements.
| 6 |
The Hartford International Small Company Fund
Schedule of Investments – (continued)
October 31, 2014
(000’s Omitted)
| Shares or Principal Amount | Market Value ╪ | |||||||||||
| Short-Term Investments - 1.4% - (continued) | ||||||||||||
| Repurchase Agreements - 1.4% - (continued) | ||||||||||||
| RBS Securities, Inc. TriParty Repurchase Agreement (maturing on 11/03/2014 in the amount of $60, collateralized by U.S. Treasury Bond 3.63% - 5.00%, 2037 - 2043, U.S. Treasury Note 2.13%, 2020, value of $61) |
||||||||||||
| $ | 60 | 0.07%, 10/31/2014 | $ | 60 | ||||||||
| Societe Generale TriParty Repurchase Agreement (maturing on 11/03/2014 in the amount of $629, collateralized by U.S. Treasury Bill 0.02%, 2015, U.S. Treasury Bond 3.75% - 11.25%, 2015 - 2043, U.S. Treasury Note 1.38% - 4.25%, 2015 - 2022, value of $641) |
||||||||||||
| 629 | 0.08%, 10/31/2014 | 629 | ||||||||||
| TD Securities TriParty Repurchase Agreement (maturing on 11/03/2014 in the amount of $1,218, collateralized by FHLMC 3.00% - 4.00%, 2026 - 2044, FNMA 2.50% - 5.00%, 2025 - 2044, U.S. Treasury Bond 3.50% - 6.50%, 2026 - 2041, U.S. Treasury Note 1.75% - 2.88%, 2018 - 2019, value of $1,243) |
||||||||||||
| 1,218 | 0.10%, 10/31/2014 | 1,218 | ||||||||||
| 3,659 | ||||||||||||
| Total Short-Term Investments | ||||||||||||
| (Cost $3,659) | $ | 3,659 | ||||||||||
| Total Investments | ||||||||||||
| (Cost $261,827) ▲ | 98.9 | % | $ | 256,402 | ||||||||
| Other Assets and Liabilities | 1.1 | % | 2,905 | |||||||||
| Total Net Assets | 100.0 | % | $ | 259,307 | ||||||||
The accompanying notes are an integral part of these financial statements.
| 7 |
The Hartford International Small Company Fund
Schedule of Investments – (continued)
October 31, 2014
(000’s Omitted)
| Note: | Percentage of investments as shown is the ratio of the total market value to total net assets. |
Prices of foreign equities that are principally traded on certain foreign markets may be adjusted daily pursuant to a fair value pricing service approved by the Board of Directors in order to reflect an adjustment for factors occurring after the close of certain foreign markets but before the close of the New York Stock Exchange.
Equity industry classifications used in this report are the Global Industry Classification Standard, which was developed by and is the exclusive property and service mark of MSCI, Inc. and Standard & Poor’s.
For Fund compliance purposes, the Fund may not use the same classification system shown in this report as these classifications are used for reporting ease.
| ▲ | At October 31, 2014, the cost of securities for federal income tax purposes was $266,241 and the aggregate gross unrealized appreciation and depreciation based on that cost were: Unrealized |
| Appreciation | $ | 18,498 | ||
| Unrealized Depreciation | (28,337 | ) | ||
| Net Unrealized Depreciation | $ | (9,839 | ) |
| ● | Non-income producing. |
| ■ | Securities issued within terms of a private placement memorandum, exempt from registration under Rule 144A under the Securities Act of 1933, as amended, and may be sold only to qualified institutional buyers. Unless otherwise indicated, these holdings are determined to be liquid. At October 31, 2014, the aggregate value of these securities was $900, which represents 0.4% of total net assets. |
| ☼ | This security, or a portion of this security, was purchased on a when-issued or delayed-delivery basis. The cost of these securities was $235 at October 31, 2014. |
| ‡ | This security, or a portion of this security, has been segregated to cover funding requirements on investment transactions settling in the future. |
Foreign Currency Contracts Outstanding at October 31, 2014
| Unrealized Appreciation/(Depreciation) | ||||||||||||||||||||||
| Currency | Buy / Sell | Delivery Date | Counterparty | Contract Amount | Market Value ╪ | Asset | Liability | |||||||||||||||
| AUD | Buy | 11/06/2014 | DEUT | $ | 74 | $ | 74 | $ | – | $ | – | |||||||||||
| AUD | Buy | 11/03/2014 | SSG | 137 | 136 | – | (1 | ) | ||||||||||||||
| AUD | Buy | 11/05/2014 | UBS | 267 | 267 | – | – | |||||||||||||||
| CHF | Buy | 11/03/2014 | BMO | 241 | 239 | – | (2 | ) | ||||||||||||||
| CHF | Buy | 11/04/2014 | BNY | 134 | 134 | – | – | |||||||||||||||
| DKK | Buy | 11/03/2014 | UBS | 162 | 161 | – | (1 | ) | ||||||||||||||
| EUR | Buy | 11/04/2014 | WEST | 308 | 308 | – | – | |||||||||||||||
| EUR | Sell | 11/03/2014 | RBC | 103 | 102 | 1 | – | |||||||||||||||
| GBP | Buy | 11/03/2014 | BMO | 255 | 255 | – | – | |||||||||||||||
| GBP | Buy | 11/04/2014 | MSC | 32 | 32 | – | – | |||||||||||||||
| JPY | Sell | 11/06/2014 | DEUT | 1,315 | 1,307 | 8 | – | |||||||||||||||
| JPY | Sell | 11/04/2014 | SSG | 33 | 32 | 1 | – | |||||||||||||||
| JPY | Sell | 11/05/2014 | UBS | 2,235 | 2,170 | 65 | – | |||||||||||||||
| MXN | Sell | 11/05/2014 | SSG | 52 | 52 | – | – | |||||||||||||||
| SEK | Sell | 11/03/2014 | UBS | 67 | 67 | – | – | |||||||||||||||
| Total | $ | 75 | $ | (4 | ) | |||||||||||||||||
| ╪ | See Significant Accounting Policies of accompanying Notes to Financial Statements regarding valuation of securities. |
The accompanying notes are an integral part of these financial statements.
| 8 |
The Hartford International Small Company Fund
Schedule of Investments – (continued)
October 31, 2014
(000’s Omitted)
| GLOSSARY: (abbreviations used in preceding Schedule of Investments) | |
| Counterparty Abbreviations: | |
| BMO | Bank of Montreal |
| BNY | BNY Mellon |
| DEUT | Deutsche Bank Securities, Inc. |
| MSC | Morgan Stanley |
| RBC | RBC Dominion Securities, Inc. |
| SSG | State Street Global Markets LLC |
| UBS | UBS AG |
| WEST | Westpac International |
| Currency Abbreviations: | |
| AUD | Australian Dollar |
| CHF | Swiss Franc |
| DKK | Danish Krone |
| EUR | EURO |
| GBP | British Pound |
| JPY | Japanese Yen |
| MXN | Mexican New Peso |
| SEK | Swedish Krona |
| Other Abbreviations: | |
| FHLMC | Federal Home Loan Mortgage Corp. |
| FNMA | Federal National Mortgage Association |
| GDR | Global Depositary Receipt |
| GNMA | Government National Mortgage Association |
| J-REIT | Japanese Real Estate Investment Trust |
| REIC | Real Estate Investment Company |
| REIT | Real Estate Investment Trust |
The accompanying notes are an integral part of these financial statements.
| 9 |
The Hartford International Small Company Fund
Schedule of Investments – (continued)
October 31, 2014
(000’s Omitted)
Investment Valuation Hierarchy Level Summary
October 31, 2014
| Total | Level 1 ♦ | Level 2 ♦ | Level 3 | |||||||||||||
| Assets: | ||||||||||||||||
| Common Stocks | ||||||||||||||||
| Australia | $ | 14,310 | $ | 1,717 | $ | 12,593 | $ | – | ||||||||
| Austria | 3,893 | – | 3,893 | – | ||||||||||||
| Belgium | 7,487 | 2,382 | 5,105 | – | ||||||||||||
| Brazil | 1,311 | 1,311 | – | – | ||||||||||||
| China | 3,968 | 3,080 | 888 | – | ||||||||||||
| Colombia | 679 | 679 | – | – | ||||||||||||
| Denmark | 7,960 | – | 7,960 | – | ||||||||||||
| Finland | 1,263 | – | 1,263 | – | ||||||||||||
| France | 7,584 | – | 7,584 | – | ||||||||||||
| Germany | 10,264 | 1,729 | 8,535 | – | ||||||||||||
| Greece | 1,670 | – | 1,670 | – | ||||||||||||
| Hong Kong | 1,555 | – | 1,555 | – | ||||||||||||
| Indonesia | 931 | – | 931 | – | ||||||||||||
| Italy | 10,504 | 3,439 | 7,065 | – | ||||||||||||
| Japan | 95,446 | 1,973 | 93,473 | – | ||||||||||||
| Luxembourg | 4,739 | 2,043 | 2,696 | – | ||||||||||||
| Mexico | 476 | 476 | – | – | ||||||||||||
| Netherlands | 2,555 | – | 2,555 | – | ||||||||||||
| Norway | 3,708 | 3,708 | – | – | ||||||||||||
| Russia | 900 | 900 | – | – | ||||||||||||
| South Africa | 1,141 | – | 1,141 | – | ||||||||||||
| South Korea | 4,787 | – | 4,787 | – | ||||||||||||
| Sweden | 2,809 | 1,879 | 930 | – | ||||||||||||
| Switzerland | 13,010 | – | 13,010 | – | ||||||||||||
| United Kingdom | 49,793 | 8,302 | 41,491 | – | ||||||||||||
| Total | $ | 252,743 | $ | 33,618 | $ | 219,125 | $ | – | ||||||||
| Short-Term Investments | 3,659 | – | 3,659 | – | ||||||||||||
| Total | $ | 256,402 | $ | 33,618 | $ | 222,784 | $ | – | ||||||||
| Foreign Currency Contracts* | $ | 75 | $ | – | $ | 75 | $ | – | ||||||||
| Total | $ | 75 | $ | – | $ | 75 | $ | – | ||||||||
| Liabilities: | ||||||||||||||||
| Foreign Currency Contracts* | $ | 4 | $ | – | $ | 4 | $ | – | ||||||||
| Total | $ | 4 | $ | – | $ | 4 | $ | – | ||||||||
| ♦ | For the year ended October 31, 2014, investments valued at $20,992 were transferred from Level 1 to Level 2, and investments valued at $8,184 were transferred from Level 2 to Level 1. Investments are transferred between Level 1 and Level 2 for a variety of reasons including, but not limited to: |
| 1) | Foreign equities for which a fair value price is more representative of exit value than the local market close (transfer into Level 2). Foreign equities for which the local market close is more representative of exit value (transfer into Level 1). |
| 2) | U.S. Treasury securities that no longer represent the most recent issue (transfer into Level 2). |
| 3) | Equity investments with no observable trading but a bid or mean price is used (transfer into Level 2). Equity investments using observable quoted prices in an active market (transfer into Level 1). |
| * | Derivative instruments (excluding purchased and written options, if applicable) are valued at the unrealized appreciation/depreciation on the investments. |
| Note: | For purposes of reporting transfers between different hierarchy levels, both transfers in and out of each level, as applicable, are shown as if they occurred at the beginning of the period. |
The accompanying notes are an integral part of these financial statements.
| 10 |
The Hartford International Small Company Fund
Statement of Assets and Liabilities
October 31, 2014
(000’s Omitted)
| Assets: | ||||
| Investments in securities, at market value (cost $261,827) | $ | 256,402 | ||
| Cash | 141 | |||
| Foreign currency on deposit with custodian (cost $—) | — | |||
| Unrealized appreciation on foreign currency contracts | 75 | |||
| Receivables: | ||||
| Investment securities sold | 4,224 | |||
| Fund shares sold | 195 | |||
| Dividends and interest | 956 | |||
| Other assets | 40 | |||
| Total assets | 262,033 | |||
| Liabilities: | ||||
| Unrealized depreciation on foreign currency contracts | 4 | |||
| Payables: | ||||
| Investment securities purchased | 2,238 | |||
| Fund shares redeemed | 375 | |||
| Investment management fees | 44 | |||
| Administrative fees | 1 | |||
| Distribution fees | 8 | |||
| Accrued expenses | 56 | |||
| Total liabilities | 2,726 | |||
| Net assets | $ | 259,307 | ||
| Summary of Net Assets: | ||||
| Capital stock and paid-in-capital | $ | 217,903 | ||
| Undistributed net investment income | 2,078 | |||
| Accumulated net realized gain | 44,773 | |||
| Unrealized depreciation of investments and the translation of assets and liabilities denominated in foreign currency | (5,447 | ) | ||
| Net assets | $ | 259,307 | ||
| Shares authorized | 500,000 | |||
| Par value | $ | 0.001 | ||
| Class A: Net asset value per share/Maximum offering price per share | $16.85/$17.83 | |||
| Shares outstanding | 4,101 | |||
| Net assets | $ | 69,074 | ||
| Class B: Net asset value per share | $ | 15.88 | ||
| Shares outstanding | 159 | |||
| Net assets | $ | 2,524 | ||
| Class C: Net asset value per share | $ | 15.61 | ||
| Shares outstanding | 1,073 | |||
| Net assets | $ | 16,752 | ||
| Class I: Net asset value per share | $ | 16.76 | ||
| Shares outstanding | 2,237 | |||
| Net assets | $ | 37,503 | ||
| Class R3: Net asset value per share | $ | 16.94 | ||
| Shares outstanding | 555 | |||
| Net assets | $ | 9,399 | ||
| Class R4: Net asset value per share | $ | 17.02 | ||
| Shares outstanding | 397 | |||
| Net assets | $ | 6,754 | ||
| Class R5: Net asset value per share | $ | 17.11 | ||
| Shares outstanding | 20 | |||
| Net assets | $ | 343 | ||
| Class Y: Net asset value per share | $ | 17.12 | ||
| Shares outstanding | 6,833 | |||
| Net assets | $ | 116,958 |
The accompanying notes are an integral part of these financial statements.
| 11 |
The Hartford International Small Company Fund
Statement of Operations
For the Year Ended October 31, 2014
(000’s Omitted)
| Investment Income: | ||||
| Dividends | $ | 6,861 | ||
| Interest | 4 | |||
| Less: Foreign tax withheld | (806 | ) | ||
| Total investment income | 6,059 | |||
| Expenses: | ||||
| Investment management fees | 2,936 | |||
| Administrative services fees | ||||
| Class R3 | 18 | |||
| Class R4 | 9 | |||
| Class R5 | 1 | |||
| Transfer agent fees | ||||
| Class A | 193 | |||
| Class B | 19 | |||
| Class C | 35 | |||
| Class I | 63 | |||
| Class R3 | — | |||
| Class R4 | — | |||
| Class R5 | — | |||
| Class Y | 3 | |||
| Distribution fees | ||||
| Class A | 194 | |||
| Class B | 37 | |||
| Class C | 175 | |||
| Class R3 | 45 | |||
| Class R4 | 15 | |||
| Custodian fees | 28 | |||
| Accounting services fees | 59 | |||
| Registration and filing fees | 116 | |||
| Board of Directors' fees | 10 | |||
| Audit fees | 20 | |||
| Other expenses | 56 | |||
| Total expenses (before waivers and fees paid indirectly) | 4,032 | |||
| Expense waivers | (7 | ) | ||
| Transfer agent fee waivers | (8 | ) | ||
| Commission recapture | (4 | ) | ||
| Total waivers and fees paid indirectly | (19 | ) | ||
| Total expenses, net | 4,013 | |||
| Net Investment Income | 2,046 | |||
| Net Realized Gain on Investments and Foreign Currency Transactions: | ||||
| Net realized gain on investments | 51,102 | |||
| Net realized gain on foreign currency contracts | 69 | |||
| Net realized loss on other foreign currency transactions | (286 | ) | ||
| Net Realized Gain on Investments and Foreign Currency Transactions | 50,885 | |||
| Net Changes in Unrealized Depreciation of Investments and Foreign Currency Transactions: | ||||
| Net unrealized depreciation of investments | (56,825 | ) | ||
| Net unrealized appreciation of foreign currency contracts | 87 | |||
| Net unrealized depreciation of translation of other assets and liabilities in foreign currencies | (109 | ) | ||
| Net Changes in Unrealized Depreciation of Investments and Foreign Currency Transactions | (56,847 | ) | ||
| Net Loss on Investments and Foreign Currency Transactions | (5,962 | ) | ||
| Net Decrease in Net Assets Resulting from Operations | $ | (3,916 | ) |
The accompanying notes are an integral part of these financial statements.
| 12 |
The Hartford International Small Company Fund
Statement of Changes in Net Assets
(000’s Omitted)
| For the Year Ended October 31, 2014 | For the Year Ended October 31, 2013 | |||||||
| Operations: | ||||||||
| Net investment income | $ | 2,046 | $ | 1,982 | ||||
| Net realized gain on investments and foreign currency transactions | 50,885 | 46,215 | ||||||
| Net unrealized appreciation (depreciation) of investments and foreign currency transactions | (56,847 | ) | 34,230 | |||||
| Net Increase (Decrease) in Net Assets Resulting from Operations | (3,916 | ) | 82,427 | |||||
| Distributions to Shareholders: | ||||||||
| From net investment income | ||||||||
| Class A | (122 | ) | (847 | ) | ||||
| Class B | — | (45 | ) | |||||
| Class C | — | (99 | ) | |||||
| Class I | (56 | ) | (57 | ) | ||||
| Class R3 | (8 | ) | (71 | ) | ||||
| Class R4 | (17 | ) | (37 | ) | ||||
| Class R5 | (4 | ) | (4 | ) | ||||
| Class Y | (1,305 | ) | (3,585 | ) | ||||
| Total distributions | (1,512 | ) | (4,745 | ) | ||||
| Capital Share Transactions: | ||||||||
| Class A | 7,731 | 1,674 | ||||||
| Class B | (1,907 | ) | (1,789 | ) | ||||
| Class C | 5,689 | 445 | ||||||
| Class I | 35,078 | (3,973 | ) | |||||
| Class R3 | 2,525 | 1,471 | ||||||
| Class R4 | 3,481 | 1,149 | ||||||
| Class R5 | (255 | ) | 376 | |||||
| Class Y | (101,696 | ) | (755 | ) | ||||
| Net decrease from capital share transactions | (49,354 | ) | (1,402 | ) | ||||
| Net Increase (Decrease) in Net Assets | (54,782 | ) | 76,280 | |||||
| Net Assets: | ||||||||
| Beginning of period | 314,089 | 237,809 | ||||||
| End of period | $ | 259,307 | $ | 314,089 | ||||
| Undistributed (distributions in excess of) net investment income | $ | 2,078 | $ | 288 | ||||
The accompanying notes are an integral part of these financial statements.
| 13 |
The Hartford International Small Company Fund
Notes to Financial Statements
October 31, 2014
(000’s Omitted)
Organization:
The Hartford Mutual Funds, Inc. (“Company”) is an open-end management investment company comprised of forty-two portfolios. Financial statements for The Hartford International Small Company Fund (the "Fund"), a series of the Company, are included in this report.
The Company is organized under the laws of the State of Maryland and is registered with the Securities and Exchange Commission (“SEC”) under the Investment Company Act of 1940, as amended (“1940 Act”). The Fund is a diversified open-end management investment company. The Fund is an investment company and applies specialized accounting and reporting under Accounting Standards Codification Topic 946, Financial Services - Investment Companies.
Class A shares are sold with a front-end sales charge of up to 5.50%. Class B shares were sold with a contingent deferred sales charge which is assessed on the lesser of the per share net asset value (“NAV”) of the shares at the time of redemption or the original purchase price, and declines from up to 5.00% to zero depending on the period of time the shares are held (see note below regarding the closing of Class B shares). Class C shares are sold with a contingent deferred sales charge of up to 1.00% on shares redeemed within twelve months of purchase. Class I shares are sold without sales charges to certain eligible investors primarily through advisory fee-based wrap programs. Class R3, R4 and R5 shares, which are offered to employer-sponsored retirement plans, and Class Y shares, which are sold to certain eligible institutional investors, are sold without a sales charge. All classes of shares have identical voting, redemption, dividend, liquidation and other rights and the same terms and conditions, with the exceptions that each class may have different expenses, which may affect performance, and that Class B shares automatically convert to Class A shares after 8 years.
No new or additional investments are allowed in Class B shares of the Fund (including investments through any systematic investment plan). Existing shareholders of Class B shares may continue to hold their Class B shares, exchange their Class B shares for Class B shares of another Hartford Fund (as permitted by existing exchange privileges), or redeem their Class B shares as described in the Fund’s prospectus. Reinstatement privileges with respect to Class B shares are set forth in the Fund's prospectus. For investors electing to reinvest capital gains and dividends, any such capital gains or dividends on Class B shares will continue to be reinvested in Class B shares of the Fund. All Class B share attributes, including the 12b-1 fee, contingent deferred sales charge schedule, and conversion to Class A shares, remain unchanged.
Significant Accounting Policies:
The following is a summary of significant accounting policies of the Fund in the preparation of its financial statements, which are in accordance with United States generally accepted accounting principles (“U.S. GAAP”). The preparation of financial statements in accordance with U.S. GAAP may require management to make estimates and assumptions that affect the reported amounts of assets and liabilities and disclosure of contingent assets and liabilities at the date of the financial statements and the reported amounts of increases and decreases in net assets from operations during the reporting period. Actual results could differ from those estimates.
Determination of Net Asset Value – The NAV of each class of the Fund's shares is determined as of the close of regular trading (normally 4:00 p.m. Eastern Time) (the “NYSE Close”) on each day that the New York Stock Exchange (the “Exchange”) is open (“Valuation Date”). Information that becomes known to the Fund after the NAV has been calculated on a particular day will not generally be used to retroactively adjust the NAV determined earlier that day.
Investment Valuation and Fair Value Measurements – For purposes of calculating the NAV, portfolio investments and other assets held by the Fund's portfolio for which market quotes are readily available are valued at market value. Market value is generally determined on the basis of last reported sales prices or official close price. If no sales are reported, market value is based on quotes obtained from a quotation reporting system, established market makers, or independent pricing services. If market prices are not readily available or are deemed unreliable, the Fund will use the fair value of the investment as determined in good faith under policies and procedures established by and under the supervision of the Company's Board of Directors. Market quotes are considered not readily available where there is an absence of current or reliable market-based data (e.g., trade information or indicative market quotes), including where events occur after the close of the relevant market, but prior to the NYSE Close, that materially affect the values of the Fund's portfolio investments or assets. In addition, market quotes are considered not readily available when, due to extraordinary circumstances, the exchanges or markets on which the investments trade do not open for trading for the entire day and no other market prices are available. In addition, prices of foreign equities that are principally traded on certain foreign markets may
| 14 |
The Hartford International Small Company Fund
Notes to Financial Statements – (continued)
October 31, 2014
(000’s Omitted)
be adjusted daily pursuant to a fair value pricing service approved by the Board of Directors in order to reflect an adjustment for the factors occurring after the close of certain foreign markets but before the NYSE Close. Investments that are primarily traded on foreign markets may trade on days that are not business days of the Fund. The value of the foreign investments in which the Fund invests may change on days when a shareholder will not be able to purchase or redeem shares of the Fund. Fair value pricing is subjective in nature and the use of fair value pricing by the Fund may cause the NAV of its shares to differ significantly from the NAV that would have been calculated using market prices at the close of the exchange on which a portfolio investment is primarily traded. There can be no assurance that the Fund could obtain the fair market value assigned to an investment if the Fund were to sell the investment at approximately the time at which the Fund determines its NAV.
Investments valued in currencies other than U.S. dollars are converted to U.S. dollars using exchange rates obtained from independent pricing services for calculation of the NAV. As a result, the NAV of the Fund’s shares may be affected by changes in the value of currencies in relation to the U.S. dollar. The value of investments traded in markets outside the United States or denominated in currencies other than the U.S. dollar may be affected significantly on a day that the NYSE is closed and the market value may change on days when an investor is not able to purchase, redeem or exchange shares of the Fund.
Foreign currency contracts represent agreements to exchange currencies on specific future dates at predetermined rates. Foreign currency contracts are valued using foreign currency exchange rates and forward rates as provided by an independent pricing service on the Valuation Date.
Financial instruments for which prices are not available from an independent pricing service may be valued using market quotations obtained from one or more dealers that make markets in the respective financial instrument in accordance with procedures established by the Company's Board of Directors.
U.S. GAAP defines fair value as the price that the Fund would receive to sell an asset or pay to transfer a liability in an orderly transaction between market participants. The U.S. GAAP fair value measurement standards require disclosure of a fair value hierarchy for each major category of assets and liabilities. Various inputs are used in determining the fair value of the Fund’s investments. These inputs are summarized into three broad hierarchy levels. This hierarchy is based on whether the valuation inputs are observable or unobservable. These levels are:
Level 1 – Quoted prices in active markets for identical investments. Level 1 may include exchange traded instruments, such as domestic equities, some foreign equities, options, futures, mutual funds, exchange traded funds, rights and warrants.
Level 2 – Observable inputs other than Level 1 prices, such as quoted prices for similar investments; quoted prices in markets that are not active; or other inputs that are observable or can be corroborated by observable market data. Level 2 may include debt investments that are traded less frequently than exchange traded instruments and which are valued using independent pricing services; foreign equities, which are principally traded on certain foreign markets and are adjusted daily pursuant to a fair value pricing service in order to reflect an adjustment for the factors occurring after the close of certain foreign markets but before the NYSE Close; senior floating rate interests, which are valued using an aggregate of dealer bids; short-term investments, which are valued at amortized cost; and swaps, which are valued based upon the terms of each swap contract.
Level 3 – Significant unobservable inputs that are supported by limited or no market activity. Level 3 may include financial instruments whose values are determined using indicative market quotes or require significant management judgment or estimation. These unobservable valuation inputs may include estimates for current yields, maturity/duration, prepayment speed, and indicative market quotes for comparable investments along with other assumptions relating to credit quality, collateral value, complexity of the investment structure, general market conditions and liquidity. This category may include investments where trading has been halted or there are certain restrictions on trading. While these investments are priced using unobservable inputs, the valuation of these investments reflects the best available data and management believes the prices are a reasonable representation of exit price.
The Board of Directors of the Company generally reviews and approves the “Procedures for Valuation of Portfolio Securities” at least once a year. These procedures define how investments are to be valued, including the formation and activities of a Valuation Committee. The Valuation Committee is responsible for determining in good faith the fair value of investments when
| 15 |
The Hartford International Small Company Fund
Notes to Financial Statements – (continued)
October 31, 2014
(000’s Omitted)
the value cannot be obtained from primary pricing services or alternative sources or if the valuation of an investment as provided by the primary pricing service or alternative source is believed not to reflect the investment’s fair value as of the Valuation Date. Voting members of the Valuation Committee include the Fund's Treasurer or designee and a Vice President of the investment manager or designee. An Assistant Vice President of the Fund with legal expertise or designee is also included on the Valuation Committee as a non-voting advisory member. In addition, the Fund’s Chief Compliance Officer shall designate a member of the compliance group to attend Valuation Committee meetings as a non-voting resource, to monitor for and provide guidance with respect to compliance with these procedures. Two members of the Valuation Committee or their designees, representing different departments, shall constitute a quorum for purposes of permitting the Valuation Committee to take action. The Valuation Committee will consider all relevant factors in determining an investment’s fair value, and may seek the advice of the Fund’s sub-adviser, knowledgeable brokers, and legal counsel in making such determination. The Valuation Committee reports to the Audit Committee of the Company's Board of Directors. The Audit Committee receives quarterly written reports which include details of all fair-valued investments, including the reason for the fair valuation, and an indication, when possible, of the accuracy of the valuation by disclosing the next available reliable public price quotation or the disposition price of such investments (the “look-back” test). The Board of Directors then must consider for ratification all of the fair value determinations made during the previous quarter.
Valuation levels are not necessarily indicative of the risk associated with investing in such investments. Individual investments within any of the above mentioned asset classes may be assigned a different hierarchical level than those presented above, as individual circumstances dictate.
For additional information, refer to the Investment Valuation Hierarchy Level Summary which follows the Schedule of Investments.
Investment Transactions and Investment Income – Investment transactions are recorded as of the trade date (the date the order to buy or sell is executed) for financial reporting purposes. Investments purchased or sold on a when-issued or delayed-delivery basis may be settled a month or more after the trade date. Realized gains and losses are determined on the basis of identified cost.
Dividend income from domestic securities is accrued on the ex-dividend date. In general, dividend income from foreign securities is recorded on the ex-date; however, dividend notifications in certain foreign jurisdictions may not be available in a timely manner and as a result, the Fund will record the dividend as soon as the relevant details (i.e., rate per share, payment date, shareholders of record, etc.) are publicly available. Interest income, including amortization of premium, accretion of discounts and additional principal received in-kind in lieu of cash, is accrued on a daily basis.
Foreign Currency Transactions – Assets and liabilities denominated in currencies other than U.S. dollars are translated into U.S. dollars at the exchange rates in effect on the valuation date. Purchases and sales of investments, income and expenses are translated into U.S. dollars at the exchange rates on the dates of such transactions.
The Fund does not isolate that portion of portfolio investment valuation resulting from fluctuations in the foreign currency exchange rates from the fluctuations arising from changes in the market prices of investments held. Exchange rate fluctuations are included with the net realized and unrealized gain or loss on investments in the accompanying financial statements.
Net realized foreign exchange gains or losses arise from sales of foreign currencies and the difference between asset and liability amounts initially stated in foreign currencies and the U.S. dollar value of the amounts actually received or paid. Net unrealized foreign exchange gains or losses arise from changes in the value of other assets and liabilities at the end of the reporting period, resulting from changes in the exchange rates.
Joint Trading Account – The Fund may invest cash balances into a joint trading account that may be invested in one or more repurchase agreements.
Fund Share Valuation and Dividend Distributions to Shareholders – Orders for the Fund’s shares are executed in accordance with the investment instructions of the shareholders. The NAV of the Fund’s shares is determined as of the close of business on each business day of the Exchange. The NAV is determined separately for each class of shares of the Fund by dividing the Fund’s net assets attributable to that class by the number of shares of the class outstanding. Each class of shares offered by the Fund has equal
| 16 |
The Hartford International Small Company Fund
Notes to Financial Statements – (continued)
October 31, 2014
(000’s Omitted)
rights as to assets and voting privileges (except that shareholders of a class have exclusive voting rights regarding any matter relating solely to that class of shares). Income and non-class specific expenses are allocated daily to each class on the basis of the relative net assets of the class. Realized and unrealized gains and losses are allocated daily based on the relative net assets of each class of shares of the Fund.
Orders for the purchase of the Fund’s shares received prior to the close of the Exchange on any day the Exchange is open for business are priced at the NAV determined as of the close of the Exchange. Orders received after the close of the Exchange, or on a day on which the Exchange and/or the Fund is not open for business, are priced at the next determined NAV.
Dividends are declared pursuant to a policy adopted by the Company's Board of Directors based upon the investment performance of the Fund. The policy of the Fund is to pay dividends from net investment income and realized gains, if any, at least once a year.
Net investment income, dividends and distributions from net realized gains and capital are determined in accordance with federal income tax regulations, which may differ from U.S. GAAP with respect to character and timing (see Federal Income Taxes: Distributions and Components of Distributable Earnings and Reclassification of Capital Accounts).
Securities and Other Investments:
Repurchase Agreements – A repurchase agreement is an agreement by which a counterparty agrees to sell an investment and agrees to repurchase the investment sold from the buyer at a mutually agreed upon time and price. During the period of the repurchase agreement, the counterparty will deposit cash and or securities in a third party custodial account to serve as collateral. At the time the Fund enters into a repurchase agreement, the value of the underlying collateral, including accrued interest, will be equal to or exceed the value of the repurchase agreement. Repurchase agreements expose the Fund to counterparty risk - that is, the risk that the counterparty will not fulfill its obligations. To minimize counterparty risk, the investments that serve to collateralize the repurchase agreement are held by the Fund’s custodian in book entry or physical form in the custodial account of the Fund or in a third party custodial account. Repurchase agreements are valued at cost plus accrued interest, which approximates fair value. Repurchase agreements have master netting arrangements which allow the Fund to offset amounts owed to a counterparty with amounts owed by the counterparty, including any collateral. Upon an event of default under a master repurchase agreement, the non-defaulting party may close out all transactions traded under such agreement and net amounts owed under each transaction to one net amount payable by one party to the other. Absent an event of default, the master repurchase agreement does not result in an offset of reported amounts of assets and liabilities in the Statement of Assets and Liabilities across transactions between the Fund and the applicable counterparty. The Fund, as shown on the Schedule of Investments, had outstanding repurchase agreements and related collateral as of October 31, 2014.
Illiquid and Restricted Investments – The Fund is permitted to invest up to 15% of its net assets in illiquid investments. Illiquid investments are those that may not be sold or disposed of in the ordinary course of business within seven days, at approximately the price used to determine the Fund’s NAV. The Fund may not be able to sell illiquid investments when its sub-adviser considers it desirable to do so or may have to sell such investments at a price that is lower than the price that could be obtained if the investments were more liquid. A sale of illiquid investments may require more time and may result in higher dealer discounts and other selling expenses than does the sale of those that are liquid. Illiquid investments also may be more difficult to value due to the unavailability of reliable market quotations for such investments, and an investment in them may have an adverse impact on the Fund’s NAV. The Fund may also purchase certain restricted investments that can only be resold to certain qualified investors and may be determined to be liquid pursuant to policies and guidelines established by the Company's Board of Directors. The Fund, as shown on the Schedule of Investments, had illiquid or restricted investments as of October 31, 2014.
Investments Purchased on a When-Issued or Delayed-Delivery Basis – Delivery and payment for investments that have been purchased by the Fund on a forward commitment, or when-issued or delayed-delivery basis, take place beyond the customary settlement period. The Fund may dispose of or renegotiate a delayed-delivery transaction after it is entered into, and may sell delayed-delivery investments before they are delivered, which may result in a realized gain or loss. During this period, such investments are subject to market fluctuations, and the Fund identifies investments segregated in its records with a value at least equal to the amount of the commitment. The Fund, as shown on the Schedule of Investments, had when-issued or delayed-delivery investments as of October 31, 2014.
| 17 |
The Hartford International Small Company Fund
Notes to Financial Statements – (continued)
October 31, 2014
(000’s Omitted)
Financial Derivative Instruments:
The following disclosures contain information on how and why the Fund uses derivative instruments, the credit-risk-related contingent features in certain derivative instruments and how derivative instruments affect the Fund’s financial position and results of operations. The location and fair value amounts of these instruments on the Statement of Assets and Liabilities and the realized gains and losses and changes in unrealized gains and losses on the Statement of Operations, each categorized by type of derivative contract, are included in the following Additional Derivative Instrument Information footnote. The derivative instruments outstanding as of year-end are disclosed in the notes to the Schedule of Investments, if applicable. The amounts of realized gains and losses and changes in unrealized gains and losses on derivative instruments during the year are disclosed in the Statement of Operations.
Foreign Currency Contracts – The Fund may enter into foreign currency contracts that obligate the Fund to purchase or sell currencies at specified future dates. Foreign currency contracts are used to hedge the currency exposure associated with some or all of the Fund’s investments and/or as part of an investment strategy. Foreign currency contracts are marked to market daily and the change in value is recorded by the Fund as an unrealized gain or loss. The Fund will record a realized gain or loss when the foreign currency contract is settled.
Foreign currency contracts involve elements of market risk in excess of the amounts reflected in the Statement of Assets and Liabilities. In addition, risks may arise upon entering into these contracts from the potential inability of the counterparties to meet the terms of the contracts and from unanticipated movements in the value of the foreign currencies relative to the U.S. dollar. The Fund, as shown on the Schedule of Investments, had outstanding foreign currency contracts as of October 31, 2014.
Additional Derivative Instrument Information:
| Fair Value of Derivative Instruments on the Statement of Assets and Liabilities as of October 31, 2014: |
| Risk Exposure Category | ||||||||||||||||||||||||||||
| Interest
Rate Contracts | Foreign Exchange Contracts | Credit Contracts | Equity Contracts | Commodity Contracts | Other Contracts | Total | ||||||||||||||||||||||
| Assets: | ||||||||||||||||||||||||||||
| Unrealized appreciation on foreign currency contracts | $ | — | $ | 75 | $ | — | $ | — | $ | — | $ | — | $ | 75 | ||||||||||||||
| Total | $ | — | $ | 75 | $ | — | $ | — | $ | — | $ | — | $ | 75 | ||||||||||||||
| Liabilities: | ||||||||||||||||||||||||||||
| Unrealized depreciation on foreign currency contracts | $ | — | $ | 4 | $ | — | $ | — | $ | — | $ | — | $ | 4 | ||||||||||||||
| Total | $ | — | $ | 4 | $ | — | $ | — | $ | — | $ | — | $ | 4 | ||||||||||||||
The volume of derivatives that is presented in the Schedule of Investments is consistent with the derivative activity during the year ended October 31, 2014.
| The Effect of Derivative Instruments on the Statement of Operations for the year ended October 31, 2014: |
| Risk Exposure Category | ||||||||||||||||||||||||||||
| Interest
Rate Contracts | Foreign Exchange Contracts | Credit Contracts | Equity Contracts | Commodity Contracts | Other Contracts | Total | ||||||||||||||||||||||
| Realized Gain on Derivatives Recognized as a Result of Operations: | ||||||||||||||||||||||||||||
| Net realized gain on foreign currency contracts | $ | — | $ | 69 | $ | — | $ | — | $ | — | $ | — | $ | 69 | ||||||||||||||
| Total | $ | — | $ | 69 | $ | — | $ | — | $ | — | $ | — | $ | 69 | ||||||||||||||
| Net Change in Unrealized Appreciation (Depreciation) on Derivatives Recognized as a Result of Operations: | ||||||||||||||||||||||||||||
| Net change in unrealized appreciation of foreign currency contracts | $ | — | $ | 87 | $ | — | $ | — | $ | — | $ | — | $ | 87 | ||||||||||||||
| Total | $ | — | $ | 87 | $ | — | $ | — | $ | — | $ | — | $ | 87 | ||||||||||||||
| 18 |
The Hartford International Small Company Fund
Notes to Financial Statements – (continued)
October 31, 2014
(000’s Omitted)
The derivatives held by the Fund as of October 31, 2014 are not subject to a master netting arrangement; therefore, no balance sheet offsetting disclosure is presented.
Principal Risks:
The Fund may be exposed to counterparty risk, or the risk that an institution or other entity with which the Fund has unsettled or open transactions will default.
If the Fund invests directly in foreign currencies or in securities that trade in, and receive revenues in, foreign currencies, or in derivatives that provide exposure to foreign currencies, it will be subject to the risk that those currencies will decline in value relative to the base currency (U.S. dollars) of the Fund, or, in the case of hedging positions, that the Fund’s base currency will decline in value relative to the currency being hedged. Currency rates in foreign countries may fluctuate significantly over short periods of time for a number of reasons, including changes in interest rates, intervention (or the failure to intervene) by U.S. or foreign governments, central banks or supranational entities, such as the International Monetary Fund, or by the imposition of currency controls or other political developments in the United States or abroad. As a result, the Fund’s investments in foreign currency denominated securities may reduce the returns of the Fund. The market values of equity securities, such as common stocks and preferred stocks, or equity related investments, such as futures and options, may decline due to general market conditions which are not specifically related to a particular company, such as real or perceived adverse economic conditions, changes in the general outlook for corporate earnings, changes in interest or currency rates or adverse investor sentiment generally. The market value of equity securities may also decline due to factors which affect a particular industry or industries, such as labor shortages or increased production costs and competitive conditions within an industry. Equity securities and equity related investments generally have greater market price volatility than fixed income securities.
Federal Income Taxes:
Federal Income Taxes – For federal income tax purposes, the Fund intends to continue to qualify as a Regulated Investment Company ("RIC") under Subchapter M of the Internal Revenue Code (“IRC”) by distributing substantially all of its taxable net investment income and net realized capital gains to its shareholders and otherwise complying with the requirements of the IRC. The Fund has distributed substantially all of its income and capital gains in prior years, if applicable, and intends to distribute substantially all of its income and capital gains during the calendar year ending December 31, 2014. Accordingly, no provision for federal income or excise taxes has been made in the accompanying financial statements. Distributions from short-term capital gains are treated as ordinary income distributions for federal income tax purposes.
Net Investment Income (Loss), Net Realized Gains (Losses) and Distributions – Net investment income (loss) and net realized gains (losses) may differ for financial statement and tax purposes primarily because of losses deferred due to wash sale adjustments, foreign currency gains and losses, adjustments related to Passive Foreign Investment Companies ("PFICs"), Real Estate Investment Trusts ("REITs"), RICs, certain derivatives and partnerships. The character of distributions made during the year from net investment income or net realized gains may differ from their ultimate characterization for federal income tax purposes. Also, due to the timing of dividend distributions, the fiscal year in which amounts are distributed may differ from the year that the income or realized gains (losses) were recorded by the Fund.
Distributions and Components of Distributable Earnings – The tax character of distributions paid by the Fund for the periods indicated is as follows (as adjusted for dividends payable, if applicable):
| For the Year Ended October 31, 2014 | For the Year Ended October 31, 2013 | |||||||
| Ordinary Income | $ | 1,512 | $ | 4,745 | ||||
| 19 |
The Hartford International Small Company Fund
Notes to Financial Statements – (continued)
October 31, 2014
(000’s Omitted)
As of October 31, 2014, the Fund’s components of distributable earnings (deficit) on a tax basis are as follows:
| Amount | ||||
| Undistributed Ordinary Income | $ | 11,203 | ||
| Undistributed Long-Term Capital Gain | 40,062 | |||
| Unrealized Depreciation* | (9,861 | ) | ||
| Total Accumulated Earnings | $ | 41,404 | ||
| * | Differences between book-basis and tax-basis unrealized appreciation (depreciation) may be attributable to the losses deferred due to wash sale adjustments, foreign currency gains and losses, adjustments related to PFICs, REITs, RICs, certain derivatives and partnerships. |
Reclassification of Capital Accounts – The Fund may record reclassifications in its capital accounts. These reclassifications have no impact on the total net assets of the Fund. The reclassifications are a result of permanent differences between U.S. GAAP and tax accounting for such items as foreign currency, PFICs, expiration or utilization of capital loss carryforwards or net operating losses. Adjustments are made to reflect the impact these items have on current and future distributions to shareholders. Therefore, the source of the Fund’s distributions may be shown in the accompanying Statement of Changes in Net Assets as from undistributed net investment income, from accumulated net realized gains on investments or from capital depending on the type of book and tax differences that exist. For the year ended October 31, 2014, the Fund recorded reclassifications to increase (decrease) the accounts listed below:
| Amount | ||||
| Undistributed Net Investment Income (Loss) | $ | 1,256 | ||
| Accumulated Net Realized Gain (Loss) | (1,256 | ) | ||
Capital Loss Carryforward – On December 22, 2010, the Regulated Investment Company Modernization Act of 2010 (the “Act”) was enacted, which made changes to the capital loss carryforward rules. The changes are effective for taxable years beginning after the date of enactment. Under the Act, funds are permitted to carry forward capital losses for an unlimited period. Additionally, capital loss carryforwards retain their character as either short-term or long-term capital losses rather than being considered all short-term as permitted under prior regulation.
The Fund had no capital loss carryforward for U.S. federal income tax purposes as of October 31, 2014.
During the year ended October 31, 2014, the Fund utilized $2,972 of prior year capital loss carryforwards.
Accounting for Uncertainty in Income Taxes – The Fund has adopted financial reporting rules that require the Fund to analyze all open tax years, as defined by the statute of limitations, for all major jurisdictions. Generally, tax authorities can examine all tax returns filed for the last three years. The Fund does not have an examination in progress.
The Fund has reviewed all open tax years and major jurisdictions and concluded that these financial reporting rules had no effect on the Fund’s financial position or results of operations. There is no tax liability resulting from unrecognized tax benefits relating to uncertain income tax positions taken or expected to be taken on the tax return for the fiscal year ended October 31, 2014. The Fund is also not aware of any tax positions for which it is reasonably possible that the total amounts of unrecognized tax benefits will significantly change in the next twelve months.
Expenses:
Investment Management Agreement – Hartford Funds Management Company, LLC ("HFMC") serves as the Fund’s investment manager pursuant to an Investment Management Agreement with the Company. HFMC is an indirect wholly owned subsidiary of The Hartford Financial Services Group, Inc. ("The Hartford"). The investment manager has overall investment supervisory responsibility for the Fund. In addition, the investment manager provides administrative personnel, services, equipment, facilities and office space for proper operation of the Fund. HFMC has contracted with Wellington Management Company, LLP ("Wellington Management") under a
| 20 |
The Hartford International Small Company Fund
Notes to Financial Statements – (continued)
October 31, 2014
(000’s Omitted)
sub-advisory agreement for the provision of day-to-day investment management services to the Fund in accordance with the Fund’s investment objective and policies. The Fund pays a fee to the investment manager, a portion of which may be used to compensate Wellington Management.
The schedule below reflects the rates of compensation paid to the investment manager for investment management services rendered as of October 31, 2014; the rates are accrued daily and paid monthly:
| Average Daily Net Assets | Annual Fee | |||
| On first $500 million | 0.9000% | |||
| On next $500 million | 0.8500% | |||
| On next $4 billion | 0.8000% | |||
| On next $5 billion | 0.7975% | |||
| Over $10 billion | 0.7950% | |||
Accounting Services Agreement – Pursuant to the Fund Accounting Agreement between HFMC and the Company, on behalf of the Fund, HFMC provides accounting services to the Fund and receives monthly compensation based on the Fund’s average daily net assets at the rates set forth below. The Fund’s accounting services fees are accrued daily and paid monthly.
| Average Daily Net Assets | Annual Fee | |||
| On first $5 billion | 0.018% | |||
| On next $5 billion | 0.014% | |||
| Over $10 billion | 0.010% | |||
Operating Expenses – Allocable expenses incurred by the Company are allocated to each Fund and allocated to classes within the Fund in proportion to the average daily net assets of the Fund and each class, except where allocation of certain expenses is more fairly made directly to the Fund or to specific classes within a Fund. As of October 31, 2014, HFMC contractually limited the total operating expenses of this Fund, exclusive of taxes, interest expense, brokerage commissions, acquired fund fees and expenses and extraordinary expenses, through February 28, 2015 as follows:
| Class A | Class B | Class C | Class I | Class R3 | Class R4 | Class R5 | Class Y | |||||||
| 1.60% | 2.35% | 2.35% | 1.35% | 1.65% | 1.35% | 1.05% | 1.00% |
Fees Paid Indirectly – The Fund has entered into agreements with State Street Global Markets, LLC and Russell Implementation Services, Inc. to partially recapture non-discounted trade commissions. Such rebates are used to pay a portion of the Fund's expenses. For the year ended October 31, 2014, this amount, if any, is included in the Statement of Operations.
The ratio of expenses to average net assets in the accompanying financial highlights excludes the reduction in expenses related to fees paid indirectly. The annualized expense ratio after waivers for the period listed below reflecting the reduction for fees paid indirectly is as follows:
| Year Ended October 31, 2014 | ||||
| Class A | 1.49 | % | ||
| Class B | 2.29 | |||
| Class C | 2.19 | |||
| Class I | 1.19 | |||
| Class R3 | 1.65 | |||
| Class R4 | 1.35 | |||
| Class R5 | 1.05 | |||
| Class Y | 0.99 | |||
| 21 |
The Hartford International Small Company Fund
Notes to Financial Statements – (continued)
October 31, 2014
(000’s Omitted)
Distribution and Service Plan for Class A, B, C, R3 and R4 Shares – Hartford Funds Distributors, LLC ("HFD"), an indirect wholly owned subsidiary of The Hartford, is the principal underwriter and distributor of the Fund. HFD is engaged in distribution activities, which include marketing and distribution of shares through broker/dealers, financing distribution costs and maintaining financial books and records. For the year ended October 31, 2014, HFD received front-end load sales charges of $317 and contingent deferred sales charges of $3 from the Fund.
The Fund has adopted a Distribution and Service Plan in accordance with Rule 12b-1 of the 1940 Act to compensate the distributor (HFD) for activities intended to result in the sale and distribution of Class A, B, C, R3 and R4 shares and for providing services for shareholders. The Rule 12b-1 plan applicable to Class A shares of the Fund provides for payment of a Rule 12b-1 fee of 0.25% of average daily net assets. Some or all of the fee may be used for shareholder servicing expenses with the remainder used for distribution expenses. Under the Class B Plan, the Fund pays the distributor 1.00% of the average daily net assets of Class B shares that are outstanding for 8 years or less, 0.25% of which is a fee for services provided to existing shareholders with the remainder used for distribution expenses. Some or the entire Rule 12b-1 fee for Class B shares may be remitted to broker/dealers for distribution and/or shareholder account services. After eight years, Class B shares convert to Class A shares. Upon conversion to Class A shares, the Class A plan described above will apply to those shares. Under the Class C Plan, the Fund pays the distributor 1.00% of the average daily net assets of Class C shares outstanding, 0.25% of which is intended as a fee for services provided to existing shareholders with the remainder used for distribution expenses. For Class C shares, some or the entire fee may be remitted to broker/dealers for distribution and/or shareholder account services. Class R3 shares have a distribution fee of 0.50% of average daily net assets and Class R4 shares have a distribution fee of 0.25% of average daily net assets. For Class R3 and R4 shares, some or the entire fee may be remitted to broker/dealers for distribution and/or shareholder account services. The Fund’s 12b-1 fees are accrued daily and paid monthly or at such other intervals as the Board of Directors may determine.
Other Related Party Transactions – Certain officers of the Fund are directors and/or officers of HFMC and/or The Hartford or its subsidiaries. For the year ended October 31, 2014, a portion of the Fund’s Chief Compliance Officer’s compensation was paid by all of the investment companies in the Hartford fund complex. The portion allocated to the Fund, as represented in other expenses on the Statement of Operations, was in the amount of $1. Hartford Administrative Services Company (“HASCO”), an indirect wholly-owned subsidiary of The Hartford, provides transfer agent services to the Fund. HASCO has contractually agreed to reimburse any portion of the transfer agency fees over 0.30% of average daily net assets per fiscal year for each class. Any transfer agency fee reimbursement is determined before considering the contractual operating expense limitation. For providing such services, HASCO is compensated on a per account basis that varies by account type, except with respect to Class Y, for which it is compensated based on average daily net assets. The amount paid to HASCO and any related contractual reimbursement amounts, if applicable, can be found in the Statement of Operations. These fees are accrued daily and paid monthly.
Administrative services fees are paid to HASCO for third-party recordkeeping services that are payable as a percentage of net assets in the amount of up to 0.20%, 0.15% and 0.10% for Classes R3, R4 and R5 shares, respectively. The total administrative services fees are shown on the Statement of Operations. These fees are accrued daily and paid monthly.
Affiliate Holdings:
As of October 31, 2014, the Fund's shares were owned in aggregate by affiliated fund of funds. Therefore, the Fund may experience relatively large purchases or redemptions of its shares from these affiliated fund of funds. Affiliated fund of funds owned shares in the Fund as follows:
| Percentage of Fund | ||||
| Class Y | 14 | % | ||
| 22 |
The Hartford International Small Company Fund
Notes to Financial Statements – (continued)
October 31, 2014
(000’s Omitted)
Investment Transactions:
For the year ended October 31, 2014, the cost of purchases and proceeds from sales of investment securities (excluding short-term investments) were as follows:
| Excluding U.S. Government Obligations | U.S. Government Obligations | Total | ||||||||||
| Cost of Purchases | $ | 208,422 | $ | — | $ | 208,422 | ||||||
| Sales Proceeds | 256,110 | — | 256,110 | |||||||||
Capital Share Transactions:
The following information is for the year ended October 31, 2014, and the year ended October 31, 2013:
| For the Year Ended October 31, 2014 | For the Year Ended October 31, 2013 | |||||||||||||||||||||||||||||||
| Shares Sold | Shares
Issued for Reinvested Dividends | Shares Redeemed | Net
Increase (Decrease) of Shares | Shares Sold | Shares
Issued for Reinvested Dividends | Shares Redeemed | Net
Increase (Decrease) of Shares | |||||||||||||||||||||||||
| Class A | ||||||||||||||||||||||||||||||||
| Shares | 1,926 | 7 | (1,493 | ) | 440 | 801 | 60 | (785 | ) | 76 | ||||||||||||||||||||||
| Amount | $ | 34,615 | $ | 119 | $ | (27,003 | ) | $ | 7,731 | $ | 12,380 | $ | 825 | $ | (11,531 | ) | $ | 1,674 | ||||||||||||||
| Class B | ||||||||||||||||||||||||||||||||
| Shares | 6 | — | (119 | ) | (113 | ) | 10 | 3 | (140 | ) | (127 | ) | ||||||||||||||||||||
| Amount | $ | 98 | $ | — | $ | (2,005 | ) | $ | (1,907 | ) | $ | 132 | $ | 44 | $ | (1,965 | ) | $ | (1,789 | ) | ||||||||||||
| Class C | ||||||||||||||||||||||||||||||||
| Shares | 513 | — | (174 | ) | 339 | 131 | 7 | (109 | ) | 29 | ||||||||||||||||||||||
| Amount | $ | 8,539 | $ | — | $ | (2,850 | ) | $ | 5,689 | $ | 1,867 | $ | 91 | $ | (1,513 | ) | $ | 445 | ||||||||||||||
| Class I | ||||||||||||||||||||||||||||||||
| Shares | 3,241 | 3 | (1,326 | ) | 1,918 | 231 | 3 | (586 | ) | (352 | ) | |||||||||||||||||||||
| Amount | $ | 57,931 | $ | 47 | $ | (22,900 | ) | $ | 35,078 | $ | 3,717 | $ | 47 | $ | (7,737 | ) | $ | (3,973 | ) | |||||||||||||
| Class R3 | ||||||||||||||||||||||||||||||||
| Shares | 257 | 1 | (119 | ) | 139 | 180 | 5 | (94 | ) | 91 | ||||||||||||||||||||||
| Amount | $ | 4,642 | $ | 8 | $ | (2,125 | ) | $ | 2,525 | $ | 2,780 | $ | 71 | $ | (1,380 | ) | $ | 1,471 | ||||||||||||||
| Class R4 | ||||||||||||||||||||||||||||||||
| Shares | 255 | 1 | (67 | ) | 189 | 92 | 3 | (23 | ) | 72 | ||||||||||||||||||||||
| Amount | $ | 4,657 | $ | 16 | $ | (1,192 | ) | $ | 3,481 | $ | 1,456 | $ | 37 | $ | (344 | ) | $ | 1,149 | ||||||||||||||
| Class R5 | ||||||||||||||||||||||||||||||||
| Shares | 17 | — | (32 | ) | (15 | ) | 30 | — | (7 | ) | 23 | |||||||||||||||||||||
| Amount | $ | 309 | $ | 4 | $ | (568 | ) | $ | (255 | ) | $ | 480 | $ | 4 | $ | (108 | ) | $ | 376 | |||||||||||||
| Class Y | ||||||||||||||||||||||||||||||||
| Shares | 2,158 | 71 | (7,611 | ) | (5,382 | ) | 3,549 | 258 | (3,739 | ) | 68 | |||||||||||||||||||||
| Amount | $ | 39,331 | $ | 1,305 | $ | (142,332 | ) | $ | (101,696 | ) | $ | 53,153 | $ | 3,585 | $ | (57,493 | ) | $ | (755 | ) | ||||||||||||
| Total | ||||||||||||||||||||||||||||||||
| Shares | 8,373 | 83 | (10,941 | ) | (2,485 | ) | 5,024 | 339 | (5,483 | ) | (120 | ) | ||||||||||||||||||||
| Amount | $ | 150,122 | $ | 1,499 | $ | (200,975 | ) | $ | (49,354 | ) | $ | 75,965 | $ | 4,704 | $ | (82,071 | ) | $ | (1,402 | ) | ||||||||||||
The following reflects the conversion of Class B shares into Class A shares (reflected as Class A shares sold) for the year ended October 31, 2014, and the year ended October 31, 2013:
| Shares | Dollars | |||||||
| For the Year Ended October 31, 2014 | 45 | $ | 809 | |||||
| For the Year Ended October 31, 2013 | 37 | $ | 548 | |||||
Line of Credit:
The Fund is one of several Hartford Funds that participate in a $500 million committed revolving line of credit facility. The facility is to be used for temporary or emergency purposes. Under the arrangement, the funds are required to own securities having a market value in
| 23 |
The Hartford International Small Company Fund
Notes to Financial Statements – (continued)
October 31, 2014
(000’s Omitted)
excess of 300% of the total bank borrowings. The interest rate on borrowings varies depending on the nature of the loan. The facility also requires a fee to be paid based on the amount of the commitment. This commitment fee is allocated to all the funds participating in the line of credit based on the average net assets of the funds. During the year ended October 31, 2014, the Fund did not have any borrowings under this facility.
Pending Legal Proceedings:
On February 25, 2011, Jennifer L. Kasilag, Louis Mellinger, Judith M. Menendez, Jacqueline M. Robinson, and Linda A. Russell filed a derivative lawsuit against Hartford Investment Financial Services, LLC (“HIFSCO”) (now known as HFD) on behalf of six Hartford retail mutual funds in the United States District Court for the District of New Jersey, alleging that HIFSCO received excessive advisory and distribution fees in violation of its statutory fiduciary duty under Section 36(b) of the 1940 Act when serving as investment manager and principal underwriter, respectively, to the Hartford retail mutual funds. Although this action was purportedly filed on behalf of certain of the Hartford Funds, none of the Hartford Funds is itself a defendant to the suit. HIFSCO moved to dismiss and, in September 2011, the motion was granted in part and denied in part, with leave to amend the complaint. In November 2011, plaintiffs filed an amended complaint on behalf of certain Hartford retail mutual funds, The Hartford Global Health Fund (now known as The Hartford Healthcare Fund), The Hartford Conservative Allocation Fund, The Hartford Growth Opportunities Fund, The Hartford Inflation Plus Fund, The Hartford Advisers Fund (now known as The Hartford Balanced Fund), and The Hartford Capital Appreciation Fund. Plaintiffs seek to rescind the investment management agreements and distribution plans between HIFSCO and these funds and to recover the total fees charged thereunder or, in the alternative, to recover any improper compensation HIFSCO received, in addition to lost earnings. HIFSCO filed a partial motion to dismiss the amended complaint and, in December 2012, the court dismissed without prejudice the claims regarding distribution fees and denied the motion with respect to the advisory fees claims. HIFSCO disputes the allegations and intends to defend vigorously.
In March 2014, the plaintiffs filed a new complaint that added as new plaintiffs The Hartford Floating Rate Fund and The Hartford Small Company Fund and named as a defendant HFMC, which assumed the role as investment manager to the funds as of January 2013. HFMC and HIFSCO dispute the allegations and intend to defend vigorously.
No accrual for litigation relating to this matter has been recorded in the financial statements of the Fund because the Fund is not party to the suit.
Indemnifications:
Under the Company's organizational documents, the Company shall indemnify its officers and directors to the full extent required or permitted under Maryland General Corporation Law and the federal securities laws. In addition, the Company, on behalf of the Fund, may enter into contracts that contain a variety of indemnifications. The Company's maximum exposure under these arrangements is unknown. However, as of the date of these financial statements, the Company has not had prior claims or losses pursuant to these contracts and expects the risk of loss to be remote.
Subsequent Event:
Effective December 1, 2014, pursuant to a sub-transfer agency agreement between HASCO and Boston Financial Data Services, Inc. (“BFDS”), HASCO has delegated certain transfer agent, dividend disbursing agent and shareholder servicing agent functions to BFDS. The costs and expenses of such delegation are borne by HASCO, not by the Fund.
| 24 |
The Hartford International Small Company Fund
Financial Highlights
| - Selected Per-Share Data - (A) | - Ratios and Supplemental Data - | |||||||||||||||||||||||||||||||||||||||||||||||||||
| Class | Net
Asset Value at Beginning of Period | Net Investment Income (Loss) | Net Realized and Unrealized Gain (Loss) on Invest- ments | Total
from Investment Operations | Dividends from Net Investment Income | Distribu- tions from Realized Capital Gains | Total
Dividends and Distributions | Net
Asset Value at End of Period | Total Return(B) | Net Assets at End of Period (000's) | Ratio
of Expenses to Average Net Assets Before Adjust- ments(C) | Ratio
of Expenses to Average Net Assets After Adjust- ments(C) | Ratio
of Net Investment Income (Loss) to Average Net Assets | |||||||||||||||||||||||||||||||||||||||
| For the Year Ended October 31, 2014 | ||||||||||||||||||||||||||||||||||||||||||||||||||||
| A | $ | 17.46 | $ | 0.07 | $ | (0.65 | ) | $ | (0.58 | ) | $ | (0.03 | ) | $ | – | $ | (0.03 | ) | $ | 16.85 | (3.33 | )% | $ | 69,074 | 1.49 | % | 1.49 | % | 0.37 | % | ||||||||||||||||||||||
| B | 16.57 | (0.10 | ) | (0.59 | ) | (0.69 | ) | – | – | – | 15.88 | (4.16 | ) | 2,524 | 2.52 | 2.29 | (0.58 | ) | ||||||||||||||||||||||||||||||||||
| C | 16.27 | (0.05 | ) | (0.61 | ) | (0.66 | ) | – | – | – | 15.61 | (4.06 | ) | 16,752 | 2.19 | 2.19 | (0.32 | ) | ||||||||||||||||||||||||||||||||||
| I | 17.39 | 0.15 | (0.68 | ) | (0.53 | ) | (0.10 | ) | – | (0.10 | ) | 16.76 | (3.08 | ) | 37,503 | 1.19 | 1.19 | 0.86 | ||||||||||||||||||||||||||||||||||
| R3 | 17.58 | 0.04 | (0.66 | ) | (0.62 | ) | (0.02 | ) | – | (0.02 | ) | 16.94 | (3.54 | ) | 9,399 | 1.70 | 1.65 | 0.20 | ||||||||||||||||||||||||||||||||||
| R4 | 17.65 | 0.09 | (0.65 | ) | (0.56 | ) | (0.07 | ) | – | (0.07 | ) | 17.02 | (3.22 | ) | 6,754 | 1.40 | 1.35 | 0.50 | ||||||||||||||||||||||||||||||||||
| R5 | 17.72 | 0.13 | (0.64 | ) | (0.51 | ) | (0.10 | ) | – | (0.10 | ) | 17.11 | (2.90 | ) | 343 | 1.10 | 1.05 | 0.70 | ||||||||||||||||||||||||||||||||||
| Y | 17.73 | 0.15 | (0.65 | ) | (0.50 | ) | (0.11 | ) | – | (0.11 | ) | 17.12 | (2.88 | ) | 116,958 | 0.99 | 0.99 | 0.84 | ||||||||||||||||||||||||||||||||||
| For the Year Ended October 31, 2013 | ||||||||||||||||||||||||||||||||||||||||||||||||||||
| A | $ | 13.14 | $ | 0.05 | $ | 4.51 | $ | 4.56 | $ | (0.24 | ) | $ | – | $ | (0.24 | ) | $ | 17.46 | 35.16 | % | $ | 63,926 | 1.54 | % | 1.54 | % | 0.34 | % | ||||||||||||||||||||||||
| B | 12.47 | (0.06 | ) | 4.28 | 4.22 | (0.12 | ) | – | (0.12 | ) | 16.57 | 34.12 | 4,504 | 2.55 | 2.29 | (0.43 | ) | |||||||||||||||||||||||||||||||||||
| C | 12.26 | (0.05 | ) | 4.20 | 4.15 | (0.14 | ) | – | (0.14 | ) | 16.27 | 34.19 | 11,936 | 2.28 | 2.28 | (0.39 | ) | |||||||||||||||||||||||||||||||||||
| I | 13.09 | 0.10 | 4.49 | 4.59 | (0.29 | ) | – | (0.29 | ) | 17.39 | 35.66 | 5,546 | 1.11 | 1.11 | 0.64 | |||||||||||||||||||||||||||||||||||||
| R3 | 13.24 | 0.04 | 4.53 | 4.57 | (0.23 | ) | – | (0.23 | ) | 17.58 | 35.02 | 7,319 | 1.69 | 1.65 | 0.24 | |||||||||||||||||||||||||||||||||||||
| R4 | 13.29 | 0.08 | 4.55 | 4.63 | (0.27 | ) | – | (0.27 | ) | 17.65 | 35.44 | 3,662 | 1.39 | 1.35 | 0.53 | |||||||||||||||||||||||||||||||||||||
| R5 | 13.34 | 0.14 | 4.54 | 4.68 | (0.30 | ) | – | (0.30 | ) | 17.72 | 35.74 | 622 | 1.11 | 1.05 | 0.93 | |||||||||||||||||||||||||||||||||||||
| Y | 13.34 | 0.14 | 4.56 | 4.70 | (0.31 | ) | – | (0.31 | ) | 17.73 | 35.86 | 216,574 | 0.99 | 0.99 | 0.94 | |||||||||||||||||||||||||||||||||||||
| For the Year Ended October 31, 2012 (D) | ||||||||||||||||||||||||||||||||||||||||||||||||||||
| A | $ | 12.03 | $ | 0.08 | $ | 1.06 | $ | 1.14 | $ | (0.03 | ) | $ | – | $ | (0.03 | ) | $ | 13.14 | 9.56 | % | $ | 47,109 | 1.61 | % | 1.55 | % | 0.59 | % | ||||||||||||||||||||||||
| B | 11.47 | (0.03 | ) | 1.03 | 1.00 | – | – | – | 12.47 | 8.72 | 4,973 | 2.62 | 2.30 | (0.20 | ) | |||||||||||||||||||||||||||||||||||||
| C | 11.28 | (0.02 | ) | 1.00 | 0.98 | – | – | – | 12.26 | 8.69 | 8,647 | 2.37 | 2.30 | (0.17 | ) | |||||||||||||||||||||||||||||||||||||
| I | 12.00 | 0.13 | 1.06 | 1.19 | (0.10 | ) | – | (0.10 | ) | 13.09 | 10.08 | 8,781 | 1.06 | 1.05 | 1.12 | |||||||||||||||||||||||||||||||||||||
| R3 | 12.16 | 0.08 | 1.06 | 1.14 | (0.06 | ) | – | (0.06 | ) | 13.24 | 9.44 | 4,297 | 1.71 | 1.65 | 0.62 | |||||||||||||||||||||||||||||||||||||
| R4 | 12.20 | 0.12 | 1.06 | 1.18 | (0.09 | ) | – | (0.09 | ) | 13.29 | 9.81 | 1,802 | 1.41 | 1.35 | 0.95 | |||||||||||||||||||||||||||||||||||||
| R5 | 12.22 | 0.14 | 1.08 | 1.22 | (0.10 | ) | – | (0.10 | ) | 13.34 | 10.17 | 164 | 1.15 | 1.05 | 1.15 | |||||||||||||||||||||||||||||||||||||
| Y | 12.23 | 0.13 | 1.09 | 1.22 | (0.11 | ) | – | (0.11 | ) | 13.34 | 10.14 | 162,036 | 1.01 | 1.00 | 1.11 | |||||||||||||||||||||||||||||||||||||
| For the Year Ended October 31, 2011 | ||||||||||||||||||||||||||||||||||||||||||||||||||||
| A | $ | 12.56 | $ | 0.07 | $ | (0.47 | ) | $ | (0.40 | ) | $ | (0.13 | ) | $ | – | $ | (0.13 | ) | $ | 12.03 | (3.28 | )% | $ | 50,854 | 1.59 | % | 1.55 | % | 0.51 | % | ||||||||||||||||||||||
| B | 11.97 | (0.04 | ) | (0.43 | ) | (0.47 | ) | (0.03 | ) | – | (0.03 | ) | 11.47 | (3.91 | ) | 6,188 | 2.55 | 2.30 | (0.29 | ) | ||||||||||||||||||||||||||||||||
| C | 11.78 | (0.03 | ) | (0.43 | ) | (0.46 | ) | (0.04 | ) | – | (0.04 | ) | 11.28 | (3.93 | ) | 9,420 | 2.34 | 2.30 | (0.27 | ) | ||||||||||||||||||||||||||||||||
| I | 12.53 | 0.12 | (0.46 | ) | (0.34 | ) | (0.19 | ) | – | (0.19 | ) | 12.00 | (2.82 | ) | 7,309 | 1.09 | 1.07 | 0.94 | ||||||||||||||||||||||||||||||||||
| R3 | 12.72 | 0.09 | (0.50 | ) | (0.41 | ) | (0.15 | ) | – | (0.15 | ) | 12.16 | (3.31 | ) | 2,065 | 1.71 | 1.65 | 0.73 | ||||||||||||||||||||||||||||||||||
| R4 | 12.74 | 0.12 | (0.50 | ) | (0.38 | ) | (0.16 | ) | – | (0.16 | ) | 12.20 | (3.10 | ) | 356 | 1.44 | 1.35 | 0.90 | ||||||||||||||||||||||||||||||||||
| R5 | 12.75 | 0.13 | (0.47 | ) | (0.34 | ) | (0.19 | ) | – | (0.19 | ) | 12.22 | (2.77 | ) | 126 | 1.12 | 1.05 | 0.99 | ||||||||||||||||||||||||||||||||||
| Y | 12.76 | 0.14 | (0.48 | ) | (0.34 | ) | (0.19 | ) | – | (0.19 | ) | 12.23 | (2.72 | ) | 105,329 | 1.02 | 1.00 | 1.03 | ||||||||||||||||||||||||||||||||||
See Portfolio Turnover information on the next page.
| 25 |
The Hartford International Small Company Fund
Financial Highlights – (continued)
| - Selected Per-Share Data - (A) | - Ratios and Supplemental Data - | |||||||||||||||||||||||||||||||||||||||||||||||||||
| Class | Net
Asset Value at Beginning of Period | Net Investment Income (Loss) | Net Realized and Unrealized Gain (Loss) on Invest- ments | Total
from Investment Operations | Dividends from Net Investment Income | Distribu- tions from Realized Capital Gains | Total
Dividends and Distributions | Net
Asset Value at End of Period | Total Return(B) | Net Assets at End of Period (000's) | Ratio
of Expenses to Average Net Assets Before Adjust- ments(C) | Ratio
of Expenses to Average Net Assets After Adjust- ments(C) | Ratio
of Net Investment Income (Loss) to Average Net Assets | |||||||||||||||||||||||||||||||||||||||
| For the Year Ended October 31, 2010 | ||||||||||||||||||||||||||||||||||||||||||||||||||||
| A | $ | 10.74 | $ | 0.02 | $ | 1.92 | $ | 1.94 | $ | (0.12 | ) | $ | – | $ | (0.12 | ) | $ | 12.56 | 18.22 | % | $ | 53,514 | 1.63 | % | 1.57 | % | 0.14 | % | ||||||||||||||||||||||||
| B | 10.28 | (0.07 | ) | 1.84 | 1.77 | (0.08 | ) | – | (0.08 | ) | 11.97 | 17.28 | 7,850 | 2.60 | 2.32 | (0.63 | ) | |||||||||||||||||||||||||||||||||||
| C | 10.10 | (0.07 | ) | 1.80 | 1.73 | (0.05 | ) | – | (0.05 | ) | 11.78 | 17.23 | 11,103 | 2.37 | 2.32 | (0.62 | ) | |||||||||||||||||||||||||||||||||||
| I | 10.70 | 0.07 | 1.91 | 1.98 | (0.15 | ) | – | (0.15 | ) | 12.53 | 18.76 | 7,698 | 1.08 | 1.08 | 0.63 | |||||||||||||||||||||||||||||||||||||
| R3(E) | 10.20 | – | 2.52 | 2.52 | – | – | – | 12.72 | 24.71 | (F) | 125 | 1.73 | (G) | 1.65 | (G) | 0.08 | (G) | |||||||||||||||||||||||||||||||||||
| R4(E) | 10.20 | 0.02 | 2.52 | 2.54 | – | – | – | 12.74 | 24.90 | (F) | 125 | 1.43 | (G) | 1.36 | (G) | 0.38 | (G) | |||||||||||||||||||||||||||||||||||
| R5(E) | 10.20 | 0.04 | 2.51 | 2.55 | – | – | – | 12.75 | 25.00 | (F) | 125 | 1.12 | (G) | 1.06 | (G) | 0.68 | (G) | |||||||||||||||||||||||||||||||||||
| Y | 10.89 | 0.07 | 1.96 | 2.03 | (0.16 | ) | – | (0.16 | ) | 12.76 | 18.83 | 111,493 | 1.02 | 1.02 | 0.68 | |||||||||||||||||||||||||||||||||||||
| (A) | Information presented relates to a share outstanding throughout the indicated period. Net investment income (loss) per share amounts are calculated based on average shares outstanding unless otherwise noted. |
| (B) | Assumes initial investment at net asset value at the beginning of each period, reinvestment of all distributions, the complete redemption of the investment at net asset value at the end of each period and no sales charge. Total return would be reduced if sales charges were taken into account. |
| (C) | Adjustments include waivers and reimbursements, if applicable. Ratios do not include fees paid indirectly (see Expenses in the accompanying Notes to Financial Statements). |
| (D) | Net investment income (loss) per share amounts have been calculated using the SEC method. |
| (E) | Commenced operations on May 28, 2010. |
| (F) | Not annualized. |
| (G) | Annualized. |
| Portfolio Turnover Rate for All Share Classes | ||||
| For the Year Ended October 31, 2014 | 66 | % | ||
| For the Year Ended October 31, 2013 | 78 | |||
| For the Year Ended October 31, 2012 | 61 | |||
| For the Year Ended October 31, 2011 | 69 | |||
| For the Year Ended October 31, 2010 | 97 | |||
| 26 |
Report of Independent Registered Public Accounting Firm
The Board of Directors and Shareholders of
The Hartford Mutual Funds, Inc.
We have audited the accompanying statement of assets and liabilities, including the schedule of investments, of The Hartford International Small Company Fund (one of the portfolios constituting The Hartford Mutual Funds, Inc. (the Funds)) as of October 31, 2014, and the related statement of operations for the year then ended, the statements of changes in net assets for each of the two years in the period then ended, and the financial highlights for the periods indicated therein. These financial statements and financial highlights are the responsibility of the Funds’ management. Our responsibility is to express an opinion on these financial statements and financial highlights based on our audits.
We conducted our audits in accordance with the standards of the Public Company Accounting Oversight Board (United States). Those standards require that we plan and perform the audit to obtain reasonable assurance about whether the financial statements and financial highlights are free of material misstatement. We were not engaged to perform an audit of the Funds’ internal control over financial reporting. Our audits included consideration of internal control over financial reporting as a basis for designing audit procedures that are appropriate in the circumstances, but not for the purpose of expressing an opinion on the effectiveness of the Funds’ internal control over financial reporting. Accordingly, we express no such opinion. An audit also includes examining, on a test basis, evidence supporting the amounts and disclosures in the financial statements and financial highlights, assessing the accounting principles used and significant estimates made by management, and evaluating the overall financial statement presentation. Our procedures included confirmation of securities owned as of October 31, 2014, by correspondence with the custodian and brokers or by other appropriate auditing procedures where replies from brokers were not received. We believe that our audits provide a reasonable basis for our opinion.
In our opinion, the financial statements and financial highlights referred to above present fairly, in all material respects, the financial position of The Hartford International Small Company Fund of The Hartford Mutual Funds, Inc. at October 31, 2014, the results of its operations for the year then ended, the changes in its net assets for each of the two years in the period then ended, and the financial highlights for the periods indicated therein, in conformity with U.S. generally accepted accounting principles.
|
| Minneapolis, Minnesota |
| December 18, 2014 |
| 27 |
The Hartford International Small Company Fund
Directors and Officers (Unaudited)
The Board of Directors of the Company (the "Directors") appoints officers who are responsible for the day-to-day operations of the Fund and who execute policies formulated by the Directors. Each Director serves until his or her death, resignation, or retirement or until the next annual meeting of shareholders is held or until his or her successor is elected and qualifies.
Directors and officers who are employed by or who have a financial interest in The Hartford Financial Services Group, Inc. ("The Hartford") are considered “interested” persons of the Fund pursuant to the 1940 Act. Each officer and two of the Company's Directors, as noted in the chart below, are “interested” persons of the Fund. Each Director serves as a director for The Hartford Mutual Funds, Inc., The Hartford Mutual Funds II, Inc., Hartford Series Fund, Inc., and Hartford HLS Series Fund II, Inc., and as a trustee for The Hartford Alternative Strategies Fund, which, as of October 31, 2014, collectively consist of 66 funds. Correspondence may be sent to Directors and officers c/o Hartford Funds, 5 Radnor Corporate Center, Suite 300, 100 Matsonford Road, Radnor, Pennsylvania 19087, except that correspondence to Mr. Annoni, Mr. Dressen and Ms. Quade may be sent to 500 Bielenberg Drive, Suite 500, Woodbury, Minnesota 55125.
The table below sets forth, for each Director and officer, his or her name, year of birth, current position with the Company and date first elected or appointed to The Hartford Mutual Funds, Inc. ("MF") and The Hartford Mutual Funds II, Inc. ("MF2"), principal occupation, and, for Directors, other directorships held. The Fund’s Statement of Additional Information contains further information on the Directors and is available free of charge by calling 1-888-843-7824 or writing to: Hartford Funds, P.O. Box 55022, Boston, MA 02205-5022.
Information on the aggregate remuneration paid to the directors of the Company can be found in the Statement of Operations herein. The Fund pays to The Hartford a portion of the Chief Compliance Officer’s compensation, but does not pay salaries or compensation to any of its other officers or Directors who are employed by The Hartford.
Non-Interested Directors
Hilary E. Ackermann (1956) Director since September 23, 2014
Ms. Ackermann served as Chief Risk Officer at Goldman Sachs Bank USA from October 2008 to November 2011 and serves as a Director of Dynegy, Inc., an independent power company, from October 2012 to present.
Lynn S. Birdsong (1946) Director since 2003, Chairman of the Investment Committee since 2014
Mr. Birdsong is a private investor. Mr. Birdsong currently serves as a Director of the Sovereign High Yield Investment Company (April 2010 to current). Mr. Birdsong currently serves as an Independent Director of Nomura Partners Funds, Inc. (formerly, The Japan Fund) (April 2003 to current). From 2003 to March 2005, Mr. Birdsong was an Independent Director of the Atlantic Whitehall Funds. From 1979 to 2002, Mr. Birdsong was a Managing Director of Zurich Scudder Investments, an investment management firm. During his employment with Scudder, Mr. Birdsong was an Interested Director of The Japan Fund. From January 1981 through December 2013, Mr. Birdsong was a partner in Birdsong Company, an advertising specialty firm.
Robert M. Gavin, Jr. (1940) Director since 2002 (MF) and 1986 (MF2), Chairman of the Board for each since 2004
Dr. Gavin is an educational consultant. Prior to September 1, 2001, he was President of Cranbrook Education Community and prior to July 1996, he was President of Macalester College, St. Paul, Minnesota.
Duane E. Hill (1945) Director since 2001 (MF) and 2002 (MF2), Chairman of the Nominating Committee since 2003
Mr. Hill is a Partner of TSG Ventures L.P., a private equity investment company. Mr. Hill is a former partner of TSG Capital Group, a private equity investment firm that served as sponsor and lead investor in leveraged buyouts of middle market companies.
Sandra S. Jaffee (1941) Director since 2005
Ms. Jaffee is the founder and Chief Executive Officer of a private company, Homeworks Concierge, LLC, which provides residential property management services in Westchester County, New York (January 2012 to present). Ms. Jaffee served as Chairman (2008 to 2009) and Chief Executive Officer of Fortent (formerly Searchspace Group), a leading provider of compliance/regulatory technology to financial institutions from August 2005 to August 2009. From August 2004 to August 2005, Ms. Jaffee served as an Entrepreneur in Residence with Warburg Pincus, a private equity firm. Prior to joining Warburg Pincus, Ms. Jaffee served as Executive Vice President at Citigroup, from September 1995 to July 2004, where she was President and Chief Executive Officer of Citibank’s Global Securities Services (1995 to 2003). Ms. Jaffee currently serves as a member of the Board of Directors of Broadridge Financial Solutions as well as a Trustee of Muhlenberg College.
| 28 |
The Hartford International Small Company Fund
Directors and Officers (Unaudited) – (continued)
William P. Johnston (1944) Director since 2005, Chairman of the Compliance Committee since 2005
In June 2006, Mr. Johnston was appointed as Senior Advisor to The Carlyle Group, a global private equity and other alternative asset investment firm and currently serves as an Operating Executive. In July 2006, Mr. Johnston was elected to the Board of Directors of MultiPlan, Inc. and served as a Director (July 2006 to August 2010). In August 2007, Mr. Johnston was elected to the Board of Directors of LifeCare Holdings, Inc. and served as a Director (August 2007 to June 2013). In February 2008, Mr. Johnston was elected to the Board of Directors of HCR-ManorCare, Inc. In May 2006, Mr. Johnston was elected to the Supervisory Board of Fresenius Medical Care AG & Co. KGaA, after its acquisition of Renal Care Group, Inc. in March 2006. Mr. Johnston joined Renal Care Group in November 2002 as a member of the Board of Directors and served as Chairman of the Board from March 2003 through March 2006. From 2002 through 2013, Mr. Johnston served as a Board member of the Georgia O’Keefe Museum. From September 1987 to December 2002, Mr. Johnston was with Equitable Securities Corporation (and its successors, SunTrust Equitable Securities and SunTrust Robinson Humphrey) serving in various investment banking and managerial positions, including Managing Director and Head of Investment Banking, Chief Executive Officer and Vice Chairman.
Phillip O. Peterson (1944) Director since 2002 (MF) and 2000 (MF2), Chairman of the Audit Committee since 2002
Mr. Peterson is a mutual fund industry consultant. He was a partner of KPMG LLP (an accounting firm) until July 1999. Mr. Peterson joined William Blair Funds in February 2007 as a member of the Board of Trustees. From February 2012 to February 2014, Mr. Peterson served as a Trustee of Symetra Variable Mutual Funds. From January 2004 to April 2005, Mr. Peterson served as Independent President of the Strong Mutual Funds.
Lemma W. Senbet (1946) Director since 2005
Dr. Senbet is the William E. Mayer Chair Professor of Finance and Founding Director, Center for Financial Policy, at the University of Maryland, Robert H. Smith School of Business. He was chair of the Finance Department of the University of Maryland, Robert H. Smith School of Business from 1998 to 2006. Since June 2013, he has been on leave from the University to serve as Executive Director of African Economic Research Consortium which focuses on economic policy research and training. Previously, he was a chaired professor of finance at the University of Wisconsin-Madison. Also, he was a Director of the Fortis Funds from March 2000 to July 2002. Dr. Senbet served as Director of the American Finance Association and President of the Western Finance Association. In 2006, Dr. Senbet was inducted Fellow of Financial Management Association International for his career-long distinguished scholarship and professional service.
Interested Directors and Officers
James E. Davey (1964) Director since 2012, President and Chief Executive Officer since 2010
Mr. Davey serves as Executive Vice President of Hartford Life Insurance Company (“HLIC”) and The Hartford. Additionally, Mr. Davey serves as Chairman of the Board, Manager and Senior Managing Director of Hartford Funds Distributors, LLC (“HFD”). He also currently serves as Director, Chairman of the Board, President and Senior Managing Director of Hartford Administrative Services Company (“HASCO”). Mr. Davey also serves as Manager, Chairman of the Board and Senior Managing Director for Hartford Funds Management Company, LLC (“HFMC”) and Director, Chairman of the Board and Senior Managing Director for Hartford Funds Management Group, Inc. ("HFMG"). Mr. Davey has served in various positions within The Hartford and its subsidiaries in connection with the operation of the Hartford Funds. Mr. Davey joined The Hartford in 2002.
Lowndes A. Smith* (1939) Director since 1996 (MF) and 2002 (MF2)
Mr. Smith served as Vice Chairman of The Hartford from February 1997 to January 2002, as President and Chief Executive Officer of Hartford Life, Inc. from February 1997 to January 2002, and as President and Chief Operating Officer of The Hartford Life Insurance Companies from January 1989 to January 2002. Mr. Smith serves as a Director of White Mountains Insurance Group Ltd. (October 2003 to current); One Beacon Insurance (October 2006 to current); Symetra Financial (August 2007 to current) and is a Managing Director of Whittington Gray Associates (January 2007 to current).
* Mr. Smith resigned as a Director of MF, MF2, Hartford Series Fund, Inc. and Hartford HLS Series Fund II, Inc. and as a Trustee of The Hartford Alternative Strategies Fund effective September 17, 2014.
Other Officers
Mark A. Annoni (1964) Vice President, Controller and Treasurer since 2012
Mr. Annoni currently serves as the Assistant Vice President of HLIC (February 2004 to present) and Senior Vice President of HFMG (December 2013 to present). Mr. Annoni has served in various positions within The Hartford and its subsidiaries in connection with the operation of the Hartford Funds. Mr. Annoni joined The Hartford in 2001.
| 29 |
The Hartford International Small Company Fund
Directors and Officers (Unaudited) – (continued)
Michael R. Dressen (1963) AML Compliance Officer since 2011
Mr. Dressen currently serves as Assistant Vice President of HLIC. He also serves as Chief Compliance Officer and AML Compliance Officer of HASCO and as AML Officer of HFD. Mr. Dressen has served in various positions within The Hartford and its subsidiaries in connection with the operation of the Hartford Funds.
Edward P. Macdonald (1967) Vice President, Secretary and Chief Legal Officer since 2005
Mr. Macdonald currently serves as Assistant Secretary, Executive Vice President and Deputy General Counsel of HFD, HASCO, HFMC and HFMG. He also serves as Vice President of HLIC. Mr. Macdonald has served in various positions within The Hartford and its subsidiaries in connection with the operation of the Hartford Funds. Mr. Macdonald joined The Hartford in 2005.
Joseph G. Melcher (1973) Vice President and Chief Compliance Officer since 2013
Mr. Melcher currently serves as Executive Vice President of HFD, HFMG and HASCO. Mr. Melcher also currently serves as Executive Vice President and Chief Compliance Officer of HFMC. Mr. Melcher has served in various positions within The Hartford and its subsidiaries in connection with the operation of the Hartford Funds since joining The Hartford in 2012. Prior to joining The Hartford, Mr. Melcher worked at Touchstone Investments, a member of the Western & Southern Financial Group, where he held the position of Vice President and Chief Compliance Officer from 2010 through 2012 and Assistant Vice President, Compliance from 2005 to 2010.
Vernon J. Meyer (1964) Vice President since 2006
Mr. Meyer currently serves as Senior Vice President of HLIC. He also currently serves as Managing Director and Chief Investment Officer of HFMC and Managing Director of HFMG. Mr. Meyer has served in various positions within The Hartford and its subsidiaries in connection with the operation of the Hartford Funds. Mr. Meyer joined The Hartford in 2004.
Laura S. Quade (1969) Vice President since 2012
Ms. Quade currently serves as Vice President of HASCO, HFD and HFMG. She is the Head of Operations of HASCO and formerly served as Director, Enterprise Operations of HLIC. Ms. Quade has served in various positions within The Hartford and its subsidiaries in connection with the operation of the Hartford Funds. Ms. Quade joined The Hartford in 2001.
Martin A. Swanson** (1962) Vice President since 2010
Mr. Swanson currently serves as Vice President of HLIC. Mr. Swanson also serves as Managing Director, Chief Marketing Officer and Principal of HFD and Managing Director of HFMG. Mr. Swanson has served in various positions within The Hartford and its subsidiaries in connection with the operation of the Hartford Funds.
** Mr. Swanson resigned as an officer effective November 6, 2014.
HOW TO OBTAIN A COPY OF THE FUND’S PROXY VOTING POLICIES AND VOTING RECORDS (UNAUDITED)
A description of the policies and procedures that the Fund uses to determine how to vote proxies relating to portfolio securities and information about how the Fund voted proxies relating to portfolio securities during the most recent twelve-month period ended June 30 are available (1) without charge, upon request, by calling 888-843-7824 and (2) on the SEC’s website at http://www.sec.gov.
QUARTERLY PORTFOLIO HOLDINGS INFORMATION (UNAUDITED)
The Fund files a complete schedule of portfolio holdings with the SEC for the first and third quarters of each fiscal year on Form N-Q. The Fund’s Forms N-Q are available (1) without charge, upon request, by calling 888-843-7824 and (2) on the SEC’s website at http://www.sec.gov. The Form N-Q may be reviewed and copied at the SEC’s Public Reference Room in Washington, DC. Information on the operation of the Public Reference Room may be obtained by calling 1-800-SEC-0330.
| 30 |
The Hartford International Small Company Fund
Federal Tax Information (Unaudited)
For the fiscal year ended October 31, 2014, there is no further federal tax information required for this Fund.
| 31 |
The Hartford International Small Company Fund
Expense Example (Unaudited)
Your Fund's Expenses
As a shareholder of the Fund, you incur two types of costs: (1) transaction costs, including sales charges (loads) on purchase payments, if any, and contingent deferred sales charges (CDSC), if any, and (2) ongoing costs, including investment management fees, distribution and/or service (12b-1) fees, if any, and other fund expenses. This example is intended to help you understand your ongoing costs (in dollars) of investing in the Fund and to compare these costs with the ongoing costs of investing in other mutual funds. The example is based on an investment of $1,000 invested at the beginning of the period and held for the entire period of April 30, 2014 through October 31, 2014.
Actual Expenses
The first set of columns of the table below provides information about actual account values and actual expenses. You may use the information in this column, together with the amount you invested, to estimate the expenses that you paid over the period. Simply divide your account value by $1,000 (for example, an $8,600 account value divided by $1,000 = 8.6), then multiply the result by the number in the line under the heading entitled “Expenses Paid During Period” to estimate the expenses you paid on your account during this period.
Hypothetical Example for Comparison Purposes
The second set of columns of the table below provides information about hypothetical account values and hypothetical expenses based on the Fund's actual expense ratio and an assumed rate of return of 5% per year before expenses, which is not the Fund's actual return. The hypothetical account values and expenses may not be used to estimate the actual ending account balance or expenses you paid for the period. You may use this information to compare the ongoing costs of investing in the Fund and other funds. To do so, compare this 5% hypothetical example with the 5% hypothetical examples that appear in the shareholder reports of the other funds.
Please note that the expenses shown in the table are meant to highlight your ongoing costs only and do not reflect any transactional costs, such as sales charges (loads) and CDSC. Therefore, the second set of columns of the table is useful in comparing ongoing costs only, and will not help you determine the relative total costs of owning different funds. In addition, if these transactional costs were included, your costs would be higher. Expenses are equal to the Fund's annualized expense ratios multiplied by average account value over the period, multiplied by 184/365 (to reflect the one-half year period).
| Actual return | Hypothetical (5% return before expenses) | |||||||||||||||||||||||||||||||||||
| Beginning Account Value April 30, 2014 | Ending
Account Value October 31, 2014 | Expenses
paid during the period April 30, 2014 through October 31, 2014 | Beginning Account Value April 30, 2014 | Ending
Account Value October 31, 2014 | Expenses
paid during the period April 30, 2014 through October 31, 2014 | Annualized expense ratio | Days
in the current 1/2 year | Days
in the full year | ||||||||||||||||||||||||||||
| Class A | $ | 1,000.00 | $ | 933.50 | $ | 7.31 | $ | 1,000.00 | $ | 1,017.64 | $ | 7.63 | 1.50 | % | 184 | 365 | ||||||||||||||||||||
| Class B | $ | 1,000.00 | $ | 929.70 | $ | 11.09 | $ | 1,000.00 | $ | 1,013.71 | $ | 11.57 | 2.28 | 184 | 365 | |||||||||||||||||||||
| Class C | $ | 1,000.00 | $ | 930.30 | $ | 10.70 | $ | 1,000.00 | $ | 1,014.12 | $ | 11.17 | 2.20 | 184 | 365 | |||||||||||||||||||||
| Class I | $ | 1,000.00 | $ | 934.70 | $ | 5.90 | $ | 1,000.00 | $ | 1,019.11 | $ | 6.16 | 1.21 | 184 | 365 | |||||||||||||||||||||
| Class R3 | $ | 1,000.00 | $ | 932.30 | $ | 8.03 | $ | 1,000.00 | $ | 1,016.89 | $ | 8.38 | 1.65 | 184 | 365 | |||||||||||||||||||||
| Class R4 | $ | 1,000.00 | $ | 934.10 | $ | 6.58 | $ | 1,000.00 | $ | 1,018.40 | $ | 6.86 | 1.35 | 184 | 365 | |||||||||||||||||||||
| Class R5 | $ | 1,000.00 | $ | 936.00 | $ | 5.12 | $ | 1,000.00 | $ | 1,019.91 | $ | 5.34 | 1.05 | 184 | 365 | |||||||||||||||||||||
| Class Y | $ | 1,000.00 | $ | 935.50 | $ | 4.88 | $ | 1,000.00 | $ | 1,020.16 | $ | 5.09 | 1.00 | 184 | 365 | |||||||||||||||||||||
| 32 |
The Hartford International Small Company Fund
Approval of Investment Management and Investment Sub-Advisory Agreements (Unaudited)
Section 15(c) of the Investment Company Act of 1940, as amended (the “1940 Act”), requires that each mutual fund’s board of directors, including a majority of those directors who are not “interested persons” of the mutual fund, as defined in the 1940 Act (the “Independent Directors”), annually review and consider the continuation of the mutual fund’s investment advisory and sub-advisory agreements. At its meeting held on August 5-6, 2014, the Board of Directors (the “Board”) of The Hartford Mutual Funds, Inc., including each of the Independent Directors, unanimously voted to approve the continuation of the investment management agreement for The Hartford International Small Company Fund (the “Fund”) with Hartford Funds Management Company, LLC (“HFMC”) and the continuation of the investment sub-advisory agreement between HFMC and the Fund’s sub-adviser, Wellington Management Company, LLP (the “Sub-adviser,” and together with HFMC, the “Advisers”) (collectively, the “Agreements”).
In the months preceding the August 5-6, 2014 meeting, the Board requested, received and reviewed written responses from the Advisers to questions posed to them on behalf of the Independent Directors and supporting materials relating to those questions and responses. The Board considered information furnished to the Board at its meetings throughout the year, as well as information specifically prepared in connection with the annual approval of the Agreements at the Board’s meetings held on June 17-18, 2014 and August 5-6, 2014. Information provided to the Board at its meetings throughout the year included, among other things, reports on Fund performance, legal and compliance matters, sales and marketing activity, shareholder services, and the other services provided to the Fund by the Advisers and their affiliates. The Board also received in-person presentations by Fund officers and representatives of HFMC at the Board’s meetings on June 17-18, 2014 and August 5-6, 2014 concerning the Agreements.
The Independent Directors, advised by independent legal counsel, engaged service providers to assist them with evaluating the Agreements with respect to the Fund. Lipper Inc. (“Lipper”), an independent provider of investment company data, was retained to provide the Board with reports on how the Fund’s contractual management fees, actual management fees, other non-management fees, overall expense ratios and investment performance compared to those of mutual funds with similar investment objectives. The Independent Directors also engaged an independent financial services consultant (the “Consultant”) to assist them in evaluating the Fund’s management fees, sub-advisory fees, other non-management fees, overall expense ratios and investment performance. In addition, the Consultant reviewed the profitability calculations utilized by HFMC in connection with the continuation of the investment management agreement.
In determining whether to continue the Agreements for the Fund, the members of the Board reviewed and evaluated information and factors they believed to be relevant and appropriate in light of the information that the Board deemed necessary and appropriate through the exercise of its reasonable business judgment. While individual members of the Board may have weighed certain factors differently, the Board’s determination to continue the Agreements was based on a comprehensive consideration of all information provided to the Board throughout the year and specifically with respect to the continuation of the Agreements. A more detailed discussion of the factors the Board considered with respect to its approval of the Agreements is provided below.
Nature, Extent and Quality of Services Provided by the Advisers
The Board requested and considered information concerning the nature, extent and quality of the services provided to the Fund by the Advisers. The Board considered, among other things, the terms of the Agreements and the range of services provided by the Advisers. The Board considered the Advisers’ professional personnel who provide services to the Fund, including each Adviser’s ability and experience in attracting and retaining qualified personnel to service the Fund. The Board considered each Adviser’s reputation and overall financial strength, as well as its willingness to consider and implement organizational and operational changes designed to enhance services to the Hartford Funds. In addition, the Board considered the quality of each Adviser’s communications with the Board and responsiveness to Board inquiries and requests made from time to time with respect to the Fund and other Hartford Funds.
The Board also requested and evaluated information concerning each Adviser’s regulatory and compliance environment. In this regard, the Board requested and reviewed information on each Adviser’s compliance policies and procedures, compliance history, and a report from the Fund’s Chief Compliance Officer on each Adviser’s compliance with applicable laws and regulations, including responses to regulatory developments and compliance issues raised by regulators. The Board also noted the Advisers’ support of the Fund’s compliance control structure, particularly the resources devoted by the Advisers in support of the Fund’s obligations pursuant to Rule 38a-1 under the 1940 Act.
With respect to HFMC, the Board noted that, under the Agreements, HFMC is responsible for the management of the Fund, including oversight of fund operations and service providers, and provides administrative and investment advisory services in connection with selecting, monitoring and supervising the Sub-adviser. The Board considered HFMC’s ongoing monitoring of people, process and performance, including its quarterly reviews of each of the Hartford Funds, semi-annual meetings with the leaders of each Fund’s portfolio management team, and oversight of the Hartford Funds’ approximately 66 portfolio managers. The Board recognized that HFMC has demonstrated a record of making changes to the
| 33 |
The Hartford International Small Company Fund
Approval of Investment Management and Investment Sub-Advisory Agreements (Unaudited) – (continued)
management and/or strategies of the Hartford Funds when warranted. The Board considered HFMC’s oversight of the Sub-adviser’s investment approach and results, process for monitoring best execution of portfolio trades by the Sub-adviser, and approach to risk management with respect to the Fund and the service providers to the Fund. The Board also considered HFMC’s oversight of compliance with the Fund’s objective and policies as well as with applicable laws and regulations, noting that regulatory and other developments had over time led to an increase in the scope of HFMC’s services in this regard.
In addition, the Board considered HFMC’s ongoing commitment to review and rationalize the Hartford Funds product line-up and the expenses that HFMC had incurred in connection with fund combinations in recent years. The Board considered that HFMC or its affiliates are responsible for providing the Fund’s officers.
With respect to the Sub-adviser, which provides certain day-to-day portfolio management services for the Fund, the Board considered the quality of the Fund’s portfolio managers, the Sub-adviser’s other investment personnel, its investment philosophy and process, investment research capabilities and resources, performance record, trade execution capabilities and experience. The Board considered the experience of the Fund’s portfolio managers, the number of accounts managed by the portfolio managers, and the Sub-adviser’s method for compensating the portfolio managers.
Based on these considerations, the Board concluded that it was satisfied with the nature, extent and quality of the services provided to the Fund by HFMC and the Sub-adviser.
Performance of the Fund and the Advisers
The Board considered the investment performance of the Fund. In this regard, the Board reviewed the performance of the Fund over different time periods presented in the materials and evaluated HFMC’s analysis of the Fund’s performance for these time periods. The Board considered information and materials provided to the Board by the Advisers concerning Fund performance, as well as information from Lipper comparing the investment performance of the Fund to an appropriate benchmark and universe of peer funds. The Board noted that the Fund’s performance was in the 1st quintile of its performance universe for the 1-year period, the 2nd quintile for the 3-year period and the 3rd quintile for the 5-year period. The Board also noted that the Fund’s performance was above its benchmark for the 1-, 3- and 5-year periods. The Board further noted that certain changes had recently been made to the Fund’s principal investment strategy.
The Board considered the detailed investment analytics reports provided by Hartford Funds’ Investment Advisory Group throughout the year. These reports include, among other things, information on the Fund’s gross and net returns, the Fund’s investment performance relative to an appropriate benchmark and peer group, various statistics concerning the Fund’s portfolio, and a narrative summary of various factors affecting Fund performance. The Board considered the Advisers’ cooperation with the Investment Committee, which assists the Board in evaluating the performance of the Fund at periodic meetings throughout the year. The Board also considered the analysis provided by the Consultant relating to the Fund’s performance track record.
In light of all the considerations noted above, the Board concluded that it had continued confidence in HFMC’s and the Sub-adviser’s overall capabilities to manage the Fund.
Costs of the Services and Profitability of the Advisers
The Board reviewed information regarding HFMC’s cost to provide investment management and related services to the Fund and HFMC’s profitability, both overall and for the Fund, on a pre-tax basis without regard to distribution expenses. The Board also requested and reviewed information about the profitability to HFMC and its affiliates from all services provided to the Fund and all aspects of their relationship with the Fund. The Board also requested and received information relating to the operations and profitability of the Sub-adviser.
The Board considered the Consultant’s review of the profitability calculations used by HFMC in connection with the continuation of the investment management agreement, noting the Consultant’s view that Hartford Funds’ process for calculating and reporting Fund profitability is reasonable. In this regard, the Board noted that the Consultant performed a full review of this process in light of the recent restructuring of the Hartford Funds business and reported that the approach to analyzing Fund profitability, including the use of common expense allocation methodologies, is reasonable, sound and well within common industry practice.
Based on these considerations, the Board concluded that the profits anticipated to be realized by the Advisers and their affiliates from their relationships with the Fund would not be excessive.
| 34 |
The Hartford International Small Company Fund
Approval of Investment Management and Investment Sub-Advisory Agreements (Unaudited) – (continued)
Comparison of Fees and Services Provided by the Advisers
The Board considered comparative information with respect to the management fees to be paid by the Fund to HFMC and the total expense ratios of the Fund. The Board also considered comparative information with respect to the sub-advisory fees to be paid by HFMC to the Sub-adviser. In this regard, the Board requested and reviewed information from HFMC and the Sub-adviser relating to the management and sub-advisory fees, including the sub-advisory fee schedule for the Fund, and total operating expenses for the Fund. With respect to the sub-advisory fee schedule, the Board considered representations from HFMC and the Sub-adviser that the Sub-adviser’s fees were negotiated at arm’s length on a fund-by-fund basis and that certain factors were identified by HFMC as having had a potential impact on the negotiation of the Fund’s sub-advisory fee levels. The Board also reviewed information from Lipper comparing the Fund’s contractual management fees, actual management fees and overall expense ratios relative to a group of funds selected by Lipper, in consultation with the Consultant, and a broader universe of funds selected by Lipper. The Board considered that the Fund’s contractual management fee was in the 2nd quintile of its expense group, while its actual management fee and its total expenses (less 12b-1 and shareholder service fees) were in the 3rd quintile. The Board noted that the Fund has an automatically renewable contractual expense cap on each share class. The expense cap resulted in reimbursement of certain expenses incurred in 2013.
While the Board recognized that comparisons between the Fund and peer funds may be imprecise, given the different service levels and characteristics of mutual funds and the different business models and cost structures of the Advisers, the comparative information provided by Lipper assisted the Board in evaluating the reasonableness of the Fund’s management and sub-advisory fees and total operating expenses. In addition, the Board considered the analysis and recommendations of the Consultant relating to the Fund’s management and sub-advisory fees and total operating expenses.
Based on these considerations, the Board concluded that the Fund’s fees and total operating expenses, in conjunction with the information about quality of services, profitability, economies of scale, and other matters discussed, were reasonable in light of the services provided.
Economies of Scale
The Board requested and considered information regarding the Advisers’ realization of economies of scale with respect to the Fund and whether the fee levels reflect these economies of scale for the benefit of the Fund’s shareholders. The Board reviewed the breakpoints in the management fee schedule for the Fund, which reduce fee rates as Fund assets grow over time. The Board recognized that a fund with assets beyond the highest breakpoint level will continue to benefit from economies of scale because additional assets are charged the lowest breakpoint fee resulting in lower overall effective management fee rates. The Board also considered that expense limitations and fee waivers that reduce the Fund’s expenses at all asset levels can have the same effect as breakpoints in sharing economies of scale with shareholders and provide protection from an increase in expenses if Fund assets decline. The Board recognized that a fee schedule that reaches a lower breakpoint quickly provides shareholders with the benefit of anticipated or potential economies of scale. The Board also considered that HFMC has been active in managing expenses, which has resulted in benefits being realized by shareholders as assets within the Hartford Funds family of funds have grown over time, including through lower transfer agent costs and other operating expenses.
The Board reviewed and evaluated materials from Lipper and the Consultant showing how management fee schedules of peer funds reflect economies of scale for the benefit of shareholders as a peer fund’s assets hypothetically increase over time. Based on information provided by HFMC, Lipper, and the Consultant, the Board recognized that there is no uniform methodology for establishing breakpoints or uniform pattern in asset levels that trigger breakpoints or the amounts of breakpoints triggered.
After considering all of the information available to it, the Board concluded that it was satisfied with the extent to which economies of scale would be shared for the benefit of the Fund’s shareholders based on currently available information and the effective advisory fees and expense ratios for the Fund at its current and reasonably anticipated asset levels. The Board noted, however, that it would continue to monitor future growth in Fund assets and the appropriateness of additional breakpoints.
Other Benefits
The Board considered other benefits to the Advisers and their affiliates from their relationships with the Fund.
The Board noted that HFMC receives fees for fund accounting and related services from the Fund, and the Board considered information on profits to HFMC for such services. The Board also considered that Hartford Administrative Services Company (“HASCO”), the Fund’s transfer agent and an affiliate of HFMC, receives transfer agency compensation from the Fund, and the Board reviewed information on the profitability of
| 35 |
The Hartford International Small Company Fund
Approval of Investment Management and Investment Sub-Advisory Agreements (Unaudited) – (continued)
the Fund’s transfer agency function to HASCO. The Board considered information provided by HASCO indicating that the transfer agent fees charged by HASCO to the Fund were fair and reasonable based on publicly available information.
The Board also considered that Hartford Funds Distributors, LLC (“HFD”), an affiliate of HFMC, serves as principal underwriter of the Fund. As principal underwriter, HFD receives 12b-1 fees from the Fund and receives all or a portion of the sales charges on sales or redemptions of certain classes of shares. The Board also noted that certain affiliates of HFD distribute shares of the Fund and receive compensation in that connection.
The Board considered benefits to the Sub-adviser from its use of the Fund’s brokerage commissions to obtain soft dollar research, and representations from HFMC and the Sub-adviser that the Sub-adviser would not make any revenue-sharing payments or any other type of distribution payments to HFMC or its affiliates.
The Board considered the benefits to shareholders of being part of the Hartford Funds family of funds, including the right to exchange investments between the same class of funds without a sales charge, the ability to reinvest Fund dividends into other funds in the family, and the ability to combine holdings in the Fund with holdings in other funds to obtain a reduced sales charge. The Board considered HFMC’s efforts to provide investors in the family with a broad range of investment styles and asset classes and its entrepreneurial risk in initiating new funds to expand these opportunities for shareholders.
* * * *
Based upon its review of these various factors, among others, the Board concluded that it is in the best interests of the Fund and its shareholders for the Board to approve the Agreements for an additional year. In reaching this decision, the Board did not assign relative weights to the factors discussed above or deem any one or group of them to be controlling in and of themselves. In connection with their deliberations, the Independent Directors met separately in executive session on several occasions, with independent legal counsel and the Consultant, to review the relevant materials and consider their responsibilities under relevant laws and regulations.
| 36 |
The Hartford International Small Company Fund
Main Risks (Unaudited)
The main risks of investing in the Fund are described below.
Market, Selection and Strategy Risk: The Fund’s share price may fluctuate due to market risk and/or security selections that may underperform the market or relevant benchmarks. If the sub-adviser's investment strategy does not perform as expected, the Fund could underperform its peers or lose money. There is no guarantee the Fund will achieve its stated objective.
Small-Cap Stock Risk: Small-cap stocks are generally more volatile and risky and may be less liquid than large-cap stocks because they may have limited operating histories, narrow product lines, and focus on niche markets.
Foreign Investment Risk: Investments in foreign securities may be riskier than investments in U.S. securities. Potential risks include the risks of illiquidity, increased price volatility, less government regulation, less extensive and less frequent accounting and other reporting requirements, unfavorable changes in currency exchange rates, and economic and political disruptions.
Active Trading Risk: Actively trading investments may result in higher costs and higher taxable income.
| 37 |
THIS PRIVACY POLICY IS NOT PART OF THIS REPORT
Privacy Policy and Practices of The Hartford Financial Services Group, Inc. and its Affiliates
(herein called “we, our and us”)
This Privacy Policy applies to our United States Operations
|
We value your trust. We are committed to the responsible: a) management; b) use; and c) protection; of Personal Information.
This notice describes how we collect, disclose, and protect Personal Information.
We collect Personal Information to: a) service your Transactions with us; and b) support our business functions.
We may obtain Personal Information from: a) You; b) your Transactions with us; and c) third parties such as a consumer-reporting agency.
Based on the type of product or service You apply for or get from us, Personal Information such as: a) your name; b) your address; c) your income; d) your payment; or e) your credit history; may be gathered from sources such as applications, Transactions, and consumer reports.
To serve You and service our business, we may share certain Personal Information. We will share Personal Information, only as allowed by law, with affiliates such as: a) our insurance companies; b) our employee agents; c) our brokerage firms; and d) our administrators.
As allowed by law, we may share Personal Financial Information with our affiliates to: a) market our products; or b) market our services; to You without providing You with an option to prevent these disclosures.
|
We may also share Personal Information, only as allowed by law, with unaffiliated third parties including: a) independent agents; b) brokerage firms; c) insurance companies; d) administrators; and e) service providers; who help us serve You and service our business.
When allowed by law, we may share certain Personal Financial Information with other unaffiliated third parties who assist us by performing services or functions such as: a) taking surveys; b) marketing our products or services; or c) offering financial products or services under a joint agreement between us and one or more financial institutions.
We, and third parties we partner with, may track some of the pages You visit through the use of: a) cookies; b) pixel tagging; or c) other technologies; and currently do not process or comply with any web browser’s “do not track” signal or similar mechanism that indicates a request to disable online tracking of individual users who visit our websites or use our services.
We will not sell or share your Personal Financial Information with anyone for purposes unrelated to our business functions without offering You the opportunity to: a) “opt-out;” or b) “opt-in;” as required by law.
We only disclose Personal Health Information with: a) your proper written authorization; or b) as otherwise allowed or required by law.
Our employees have access to Personal Information in the course of doing their jobs, such as: a) underwriting policies; b) paying claims; c) developing new products; or d) advising customers of our products and services.
|
|
We use manual and electronic security procedures to maintain: a) the confidentiality; and b) the integrity of; Personal Information that we have. We use these procedures to guard against unauthorized access.
Some techniques we use to protect Personal Information include: a) secured files; b) user authentication; c) encryption; d) firewall technology; and e) the use of detection software.
We are responsible for and must: a) identify information to be protected; b) provide an adequate level of protection for that data; c) grant access to protected data only to those people who must use it in the performance of their job-related duties.
Employees who violate our Privacy Policy will be subject to discipline, which may include ending their employment with us.
At the start of our business relationship, we will give You a copy of our current Privacy Policy.
We will also give You a copy of our current Privacy Policy once a year if You maintain a continuing business relationship with us.
We will continue to follow our Privacy Policy regarding Personal Information even when a business relationship no longer exists between us.
|
As used in this Privacy Notice:
Application means your request for our product or service.
Personal Financial Information means financial information such as: a) credit history; b) income; c) financial benefits; or d) policy or claim information.
Personal Health Information means health information such as: a) your medical records; or b) information about your illness, disability or injury.
Personal Information means information that identifies You personally and is not otherwise available to the public. It includes: a) Personal Financial Information; and b) Personal Health Information.
Transaction means your business dealings with us, such as: a) your Application; b) your request for us to pay a claim; and c) your request for us to take an action on your account.
You means an individual who has given us Personal Information in conjunction with: a) asking about; b) applying for; or c) obtaining; a financial product or service from us if the product or service is used mainly for personal, family, or household purposes.
|
This Privacy Policy is being provided on behalf of the following affiliates of The Hartford Financial Services Group, Inc.:
1stAGChoice, Inc.; Access CoverageCorp, Inc.; Access CoverageCorp Technologies, Inc.; American Maturity Life Insurance Company; Archway 60 R, LLC; Business Management Group, Inc.; Champlain Life Reinsurance Company; DMS R, LLC; Eloy R, LLC; Ersatz Corporation; First State Insurance Company; Hartford Accident and Indemnity Company; Hartford Administrative Services Company; Hartford Casualty General Agency, Inc.; Hartford Casualty Insurance Company; Hartford-Comprehensive Employee Benefit Service Company; Hartford Equity Sales Company, Inc.; Hartford Fire General Agency, Inc.; Hartford Fire Insurance Company; Hartford Funds Management Company, LLC; Hartford Funds Management Group, Inc.; Hartford HLS Series Fund II, Inc.; Hartford Insurance Company of Illinois; Hartford Insurance Company of the Midwest; Hartford Insurance Company of the Southeast; Hartford Integrated Technologies, Inc.; Hartford International Life Reassurance Corporation; Hartford Funds Distributors, LLC; Hartford Investment Management Company; Hartford Life and Accident Insurance Company; Hartford Life and Annuity Insurance Company; Hartford Life Insurance Company; Hartford Life Private Placement, LLC; Hartford Lloyd’s Corporation; Hartford Lloyd’s Insurance Company; Hartford Mezzanine Investors I, LLC; Hartford Residual Market, L.C.C.; Hartford Retirement Services, LLC; Hartford Securities Distribution Company, Inc.; Hartford Series Fund, Inc.; Hartford Specialty Insurance Services of Texas, LLC; Hartford Strategic Investments, LLC; Hartford Underwriters Insurance Company; Hartford Technology Services Company, L.L.C.; Hartford of Texas General Agency, Inc.; Hartford Underwriters General Agency, Inc.; HARTRE Company, L.C.C.; HL Investment Advisors, LLC; HLA LLC; Horizon Management Group, LLC; HRA Brokerage Services, Inc.; Lanidex Class B, LLC; M-CAP Insurance Agency, LLC; New England Insurance Company; New England Reinsurance Corporation; Nutmeg Insurance Agency, Inc.; Nutmeg Insurance Company; Pacific Insurance Company, Limited; Planco, LLC: Property and Casualty Insurance Company of Hartford; Revere R, LLC; RVR R, LLC; Sentinel Insurance Company, Ltd.; Sunstone R, LLC; Symphony R, LLC; The Evergreen Group Incorporated; The Hartford Alternative Strategies Fund; The Hartford Mutual Funds, Inc.; The Hartford Mutual Funds II, Inc.; Trumbull Flood Management, L.L.C.; Trumbull Insurance Company; Twin City Fire Insurance Company; White River Life Reinsurance Company.
HPP Revised January 2014
HARTFORDFUNDS
hartfordfunds.com
This information is written in connection with the promotion or marketing of the matter(s) addressed in this material.
This report is submitted for the general information of the shareholders of the Fund. It is not authorized for distribution unless preceded or accompanied by a current prospectus for the Fund.
The information cannot be used or relied upon for the purpose of avoiding IRS penalties. These materials are not intended to provide tax, accounting or legal advice. As with all matters of a tax or legal nature, you should consult your own tax or legal counsel for advice.
Investors should carefully consider the investment objectives, risks, charges, and expenses of Hartford Funds before investing. This and other information can be found in the prospectus and summary prospectus, which can be obtained by calling 888-843-7824 (retail) or 800-279-1541 (institutional). Investors should read them carefully before they invest.
Hartford Funds are underwritten and distributed by Hartford Funds Distributors, LLC.
MFAR-ISC14 12/14 113989-3 Printed in U.S.A.
HARTFORDFUNDS
|
THE HARTFORD
2014 Annual Report |
A MESSAGE FROM THE PRESIDENT
Dear Fellow Shareholders:
Thank you for investing in Hartford Funds.
Market Review
U.S. equities (as represented by the S&P 500 Index) rose steadily for the fiscal year ended October 31, 2014, with a return of 17.27% for the period. With the exception of short-lived geopolitical scares early in 2014 and concerns about continuing global growth near the end of the period, stocks generally rose on solid fundamentals and encouraging macroeconomic data during the year.
September 2014 marked the six-year anniversary of the start of the financial crisis. Within weeks of that anniversary, both the S&P 500 Index and the Dow Jones Industrial Average set new all-time highs, closing at 2,018 and 17,391, respectively, on October 31. Although the fallout of the crisis continues to influence investor behavior, stocks have recovered and risen dramatically, up 198% from their low in March 2009. Meanwhile, the domestic economy is notching strong growth, and the unemployment rate has reached its lowest level since August 2008.
While the U.S. economy appears to have stabilized and to have reverted to a solid growth path, the outlook for the global economy appears to have gotten cloudier. The U.S. Federal Reserve has ended quantitative easing, while Europe and Japan are pursuing stimulus options to avoid a double-dip recession and deflation, respectively. Diverging central-bank policies will likely continue to play an important role in market movements going forward as investors wait to see the reactions to their efforts and their impacts on global markets.
How have market movements impacted your portfolio throughout the last year? Are your investments still on track to provide the growth or income you need, and are you comfortable with their progress during times of volatility?
Your financial professional can help you navigate today’s markets with confidence, as well as assist you to achieve your investment goals by providing advice on the best options within our fund family to help you work toward overcoming today’s investing challenges. Meet with your financial advisor regularly to examine your portfolio and your investment strategy, and to determine if you’re still on track to meet your goals.
Thank you again for investing with Hartford Funds.
James Davey
President
Hartford Funds
1 The S&P 500 Index is a market capitalization-weighted price index composed of 500 widely held common stocks.
2 The Dow Jones Industrial Average is an unmanaged, price-weighted index of 30 of the largest, most widely held stocks traded on the NYSE
The Hartford International Value Fund
The views expressed in the Fund’s Manager Discussion under ‘‘Why did the Fund perform this way?’’ and ‘‘What is the outlook?’’ are views of the Fund’s sub-adviser and portfolio management team through the end of the period and are subject to change based on market and other conditions. The Fund’s Manager Discussion is for informational purposes only and does not represent an offer, recommendation or solicitation to buy, hold or sell any security. The specific securities identified and described, if any, do not represent all of the securities purchased or sold and you should not assume that investments in the securities identified and discussed will be profitable.
| The Hartford International Value Fund* inception 05/28/2010 |
| (sub-advised by Wellington Management Company, LLP) |
| Investment objective – The Fund seeks long-term total return. |
Performance Overview 5/28/10 - 10/31/14

The chart above represents the hypothetical growth of a $10,000 investment in Class A, which includes a sales charge. Growth results in classes other than Class A will vary from what is seen above due to differences in the expenses charged to those share classes.
Average Annual Total Returns (as of 10/31/14)
| 1 Year | Since Inception▲ | |||||||
| International Value A# | 1.05 | % | 11.42 | % | ||||
| International Value A## | -4.50 | % | 10.00 | % | ||||
| International Value C# | 0.35 | % | 10.65 | % | ||||
| International Value C## | -0.65 | % | 10.65 | % | ||||
| International Value I# | 1.40 | % | 11.81 | % | ||||
| International Value R3# | 0.77 | % | 11.14 | % | ||||
| International Value R4# | 1.12 | % | 11.49 | % | ||||
| International Value R5# | 1.40 | % | 11.82 | % | ||||
| International Value Y# | 1.44 | % | 12.32 | % | ||||
| MSCI EAFE Index | -0.17 | % | 10.20 | % | ||||
| MSCI EAFE Value Index | -0.10 | % | 9.87 | % | ||||
| ▲ | Inception: 05/28/2010 | |
| # | Without sales charge | |
| ## | With sales charge |
PERFORMANCE DATA QUOTED REPRESENTS PAST PERFORMANCE AND DOES NOT GUARANTEE FUTURE RESULTS. The investment return and principal value of the investment will fluctuate so that investors’ shares, when redeemed, may be worth more or less than their original cost. Current performance may be lower or higher than the performance data quoted. To obtain performance data current to the most recent month-end, please visit our website www.hartfordfunds.com.
The initial investment in Class A shares reflects the maximum sales charge of 5.50% and returns for Class C shares reflect a contingent deferred sales charge of up to 1.00% on shares redeemed within twelve months of purchase.
Total returns presented above were calculated using the Fund’s net asset value available to shareholders for sale or redemption of Fund shares on October 31, 2014, which may exclude investment transactions as of this date. All share class returns assume the reinvestment of all distributions at net asset value and the deduction of all fund expenses.
MSCI EAFE Index (Europe, Australasia, Far East) is a free float-adjusted market capitalization index that is designed to measure the equity market performance of developed markets, excluding the U.S. & Canada. The MSCI EAFE Index consists of the following 21 developed market country indices: Australia, Austria, Belgium, Denmark, Finland, France, Germany, Hong Kong, Ireland, Israel, Italy, Japan, the Netherlands, New Zealand, Norway, Portugal, Singapore, Spain, Sweden, Switzerland, and the United Kingdom.
MSCI EAFE Value Index is a free float-adjusted market capitalization-weighted index that is designed to measure developed market equity performance (excluding the U.S. and Canada) of the value securities within the MSCI EAFE Index.
You cannot invest directly in an index.
The chart and table do not reflect the deductions of taxes that a shareholder would pay on Fund distributions or the redemption of Fund shares.
Performance information may reflect historical or current expense waivers/reimbursements from the investment adviser, without which performance would have been lower. For information on current expense waivers/reimbursements, please see the prospectus.
* Effective on the close of business on November 28, 2014, the Fund is closed to new investors until further notice. For more information, please see the Fund’s prospectus.
| 2 |
| The Hartford International Value Fund |
| Manager Discussion |
| October 31, 2014 (Unaudited) |
| Operating Expenses* | ||||||||
| Net | Gross | |||||||
| International Value Class A | 1.40 | % | 1.91 | % | ||||
| International Value Class C | 2.15 | % | 2.57 | % | ||||
| International Value Class I | 1.15 | % | 1.48 | % | ||||
| International Value Class R3 | 1.60 | % | 2.17 | % | ||||
| International Value Class R4 | 1.30 | % | 1.86 | % | ||||
| International Value Class R5 | 1.00 | % | 1.56 | % | ||||
| International Value Class Y | 0.95 | % | 1.27 | % | ||||
| * | As shown in the Fund's current prospectus dated March 1, 2014. Actual expenses may be higher or lower. Please see accompanying Financial Highlights for expense ratios for the year ended October 31, 2014. |
Gross expenses are the Fund's total annual operating expenses shown in the Fund's most recent prospectus. Net expenses are the Fund's total annual operating expenses shown in the Fund's most recent prospectus and reflect contractual expense reimbursements in instances when these reductions reduce the Fund's gross expenses. Contractual reimbursements remain in effect until February 28, 2015, and automatically renew for one-year terms unless terminated.
All investments are subject to risk including the possible loss of principal. For a discussion of the Fund’s risks, please see the Main Risks section of this report. For more detailed information on the risks associated with an investment in the Fund, please see the prospectus.
| Portfolio Manager | ||
| James H. Shakin, CFA | ||
| Senior Vice President and Equity Portfolio Manager | ||
How did the Fund perform?
The Class A shares of The Hartford International Value Fund returned 1.05%, before sales charge, for the twelve-month period ended October 31, 2014, outperforming the Fund’s benchmarks, the MSCI EAFE Index and the MSCI EAFE Value Index, which returned -0.17% and -0.10%, respectively, for the same period. The Fund also outperformed the -1.06% average return of the Lipper International Multi Cap Value Funds peer group, a group of funds with investment strategies similar to those of the Fund.
Why did the Fund perform this way?
Global equities rose during the period, notwithstanding bouts of significant volatility. Despite ongoing geopolitical tensions in Ukraine and the Middle East, concerns about a Chinese economic growth slowdown, and unsettling economic and political developments in several other emerging market countries, the five-year-old bull market continued in the first half of 2014. Robust merger and acquisition activity, along with continued accommodative monetary policy from central banks around the globe, aided positive investor sentiment in May and June. However, Portuguese banking woes, European economic malaise, and the prospect of an accelerated U.S. Federal Reserve (Fed) interest-rate-hike timeline all contributed to stall the global stock rally near the tail end of the period. In addition, China's property slump and poor gross domestic product (GDP) readings in Japan and the eurozone raised the specter of a slowdown in global economic growth. Nevertheless, there were several positive developments, including monetary easing by the European Central Bank and the People's Bank of China, as well as an encouraging U.S. corporate earnings season. During the period, emerging market equities underperformed their developed market counterparts and U.S. stocks generally outperformed non-U.S. stocks.
Seven out of ten sectors in the MSCI EAFE Value Index fell during the period. Within the Index, Consumer Staples (-8%), Materials (-8%), and Consumer Discretionary (-4%) lagged on a relative basis. Healthcare (+11%), Utilities (+10%), and Information Technology (+9%) sectors gained the most during the period.
Sector allocation, which is a result of bottom-up stock selection decisions, was the main driver of relative outperformance during the period, primarily due to the Fund’s overweight to Information Technology and underweight to Consumer Staples sectors. The Fund’s underweight to Utilities and overweight to Materials detracted from relative performance during the period. Security selection, which was strongest in Consumer Discretionary, Information Technology, and Healthcare, contributed positively to benchmark-relative performance during the period. Stock selection was particularly strong in Japan. This was partially offset by weaker stock selection in the Energy, Utilities, and Staples sectors.
Among the top contributors to benchmark-relative returns (i.e. relative to the MSCI EAFE Value Index) were Mixi, Inc. (Information Technology), Fujitsu (Information Technology), and Tesco (Consumer Staples). Japanese social gaming and app developer Mixi, Inc. rose after its new game, Monster Strike, gained popularity across both iOS and Android devices. Fujitsu, a Japan-based information and communication technology company offering a wide range of technology products, rose as the company announced net sales in 2013 increased from the prior year. Shares of Tesco, a U.K.-based company engaged in retailing and associated activities, declined due to a drop in sales and an associated loss of the grocery market share. Not owning Tesco, a component in the MSCI EAFE Value Index, positively contributed to benchmark-relative performance. Top absolute contributors for the period also included AstraZeneca (Healthcare).
Kinross Gold Corp. (Materials), Royal Dutch Shell (Energy), and Lonmin (Materials) were among the top detractors from benchmark-relative returns (i.e. relative to the MSCI EAFE Value Index) during
| 3 |
| The Hartford International Value Fund |
| Manager Discussion – (continued) |
| October 31, 2014 (Unaudited) |
the period. Kinross Gold Corp., gold and silver mining company, underperformed as geopolitical tensions in Russia raised concerns over the company’s assets in the country, and a weak gold price also weighed on shares. Shares of Royal Dutch Shell, a global independent oil and gas company, rose during the period as the company continued to execute on its cost-cutting plans and had benefited from improved operations in its upstream and U.S. unconventional production business. Not owning benchmark constituent Royal Dutch Shell detracted from relative performance during the period. Lonmin, a U.K.-based company that focuses on mining, refining, and marketing of platinum group metals, underperformed as prolonged mine strikes in South Africa raised costs and slowed production across the company’s mines. Top absolute detractors for the period also included Standard Chartered (Financials).
Derivatives are not used in a significant manner in this Fund and did not have a material impact on performance during the period.
What is the outlook?
We believe the global cycle continues to advance at a moderate pace with a mix of stronger growth in the U.S. and more sluggish activity in Europe, Japan, and China. We continue to take modest active positions in companies that we believe have low prices, low valuations and low expectations that provide a base for significant upside potential.
As a result of bottom-up stock selection we ended the period most overweight the Information Technology, Materials, and Industrials sectors and most underweight the Financials, Telecommunication Services, and Utilities sectors relative to the Index. On a country basis, the Fund ended the period with the largest overweights to Japan and Canada and the largest underweights to the United Kingdom and Australia.
Diversification by Sector
as of October 31, 2014
| Sector | Percentage of Net Assets | |||
| Equity Securities | ||||
| Consumer Discretionary | 11.8 | % | ||
| Consumer Staples | 1.9 | |||
| Energy | 9.5 | |||
| Financials | 20.8 | |||
| Health Care | 6.9 | |||
| Industrials | 12.7 | |||
| Information Technology | 13.0 | |||
| Materials | 13.6 | |||
| Services | 2.9 | |||
| Utilities | 2.8 | |||
| Total | 95.9 | % | ||
| Short-Term Investments | 4.9 | |||
| Other Assets and Liabilities | (0.8 | ) | ||
| Total | 100.0 | % | ||
A sector may be comprised of several industries. For Fund compliance purposes, the Fund may not use the same classification system and these sector classifications are used for reporting ease.
Currency Concentration of Securities
as of October 31, 2014
| Percentage of | ||||
| Description | Net Assets | |||
| Australian Dollar | 1.0 | % | ||
| Brazilian Real | 0.0 | |||
| British Pound | 12.0 | |||
| Canadian Dollar | 2.6 | |||
| Danish Kroner | 0.4 | |||
| Euro | 28.4 | |||
| Hong Kong Dollar | 2.0 | |||
| Hungarian Forint | 0.8 | |||
| Indian Rupee | 1.4 | |||
| Japanese Yen | 37.0 | |||
| Norwegian Krone | 0.5 | |||
| Republic of Korea Won | 2.0 | |||
| South African Rand | 1.4 | |||
| Swedish Krona | 0.4 | |||
| Swiss Franc | 3.4 | |||
| Taiwanese Dollar | 0.1 | |||
| United States Dollar | 7.4 | |||
| Other Assets and Liabilities | (0.8 | ) | ||
| Total | 100.0 | % | ||
| 4 |
| The Hartford International Value Fund |
| Schedule of Investments |
| October 31, 2014 |
| (000’s Omitted) |
| Shares or Principal Amount | Market Value ╪ | |||||||
| Common Stocks - 95.9% | ||||||||
| Australia - 1.1% | ||||||||
| 2,430 | Aquarius Platinum Ltd. ● | $ | 642 | |||||
| 533 | Energy Resources of Australia Ltd. ●☼ | 603 | ||||||
| 3,862 | Qantas Airways Ltd. ●☼ | 5,771 | ||||||
| 4,530 | Resolute Mining Ltd. ●☼ | 1,276 | ||||||
| 8,292 | ||||||||
| Austria - 0.2% | ||||||||
| 92 | Zumtobel Group AG | 1,616 | ||||||
| Belgium - 1.5% | ||||||||
| 188 | Ageas | 6,289 | ||||||
| 692 | Agfa Gevaert N.V. ● | 1,745 | ||||||
| 44 | Delhaize-Le Lion S.A. | 3,020 | ||||||
| 11,054 | ||||||||
| Brazil - 0.7% | ||||||||
| 30 | HRT Participacoes em Petroleo S.A. ● | 117 | ||||||
| 425 | Petroleo Brasileiro S.A. ADR | 4,975 | ||||||
| 5,092 | ||||||||
| Canada - 3.4% | ||||||||
| 282 | Barrick Gold Corp. | 3,350 | ||||||
| 591 | Centerra Gold, Inc. | 2,306 | ||||||
| 594 | Eldorado Gold Corp. | 3,257 | ||||||
| 197 | EnCana Corp. | 3,661 | ||||||
| 1,514 | Kinross Gold Corp. ● | 3,254 | ||||||
| 473 | Legacy Oil + Gas, Inc. ● | 1,924 | ||||||
| 154 | Northern Dynasty Minerals Ltd. ● | 59 | ||||||
| 242 | Painted Pony Petroleum Ltd. ● | 2,295 | ||||||
| 368 | Talisman Energy, Inc. | 2,345 | ||||||
| 611 | Uranium Participation Corp. ● | 2,745 | ||||||
| 25,196 | ||||||||
| China - 1.7% | ||||||||
| 4,438 | AMVIG Holdings Ltd. | 2,077 | ||||||
| 7,878 | Daphne International Holdings Ltd. | 3,966 | ||||||
| 6,545 | Kingboard Laminates Holdings Ltd. ● | 2,669 | ||||||
| 3,714 | New World Department Store China | 1,360 | ||||||
| 445 | Sinovac Biotech Ltd. ● | 2,356 | ||||||
| 12,428 | ||||||||
| Denmark - 0.4% | ||||||||
| 153 | H. Lundbeck A/S | 3,237 | ||||||
| France - 13.0% | ||||||||
| 71 | Alten Ltd. | 3,033 | ||||||
| 124 | BNP Paribas | 7,780 | ||||||
| 119 | Capital Gemini S.A. | 7,804 | ||||||
| 218 | Compagnie De Saint-Gobain | 9,375 | ||||||
| 33 | Devoteam S.A. | 535 | ||||||
| 371 | GDF Suez | 9,005 | ||||||
| 74 | GFI Informatique S.A. | 460 | ||||||
| 116 | Groupe Steria SCA | 2,167 | ||||||
| 57 | Lafarge S.A. | 3,966 | ||||||
| 194 | Metropole Television S.A. | 3,365 | ||||||
| 387 | Orange S.A. | 6,169 | ||||||
| 505 | Peugeot S.A. ● | 6,007 | ||||||
| 66 | Renault S.A. | 4,876 | ||||||
| 40 | S.p.A.Group S.A. | 2,983 | ||||||
| 75 | Saft Groupe S.A. | 2,244 | ||||||
| 127 | Societe Generale Class A | 6,101 | ||||||
| 114 | Thales S.A. | 5,685 | ||||||
| 231 | Total S.A. | 13,801 | ||||||
| 95,356 | ||||||||
| Germany - 4.6% | ||||||||
| 316 | Deutsche Lufthansa AG | 4,678 | ||||||
| 273 | E.On SE | 4,714 | ||||||
| 109 | Hamburger Hafen und Logistik | 2,392 | ||||||
| 41 | Koenig & Bauer AG ● | 515 | ||||||
| 260 | Kontron AG ● | 1,505 | ||||||
| 98 | Osram Licht AG ● | 3,455 | ||||||
| 126 | Rheinmetall AG | 5,446 | ||||||
| 132 | RWE AG | 4,696 | ||||||
| 118 | Salzgitter AG | 3,556 | ||||||
| 191 | Suedzucker AG | 2,666 | ||||||
| 33,623 | ||||||||
| Greece - 0.5% | ||||||||
| 1,682 | Alpha Bank A.E. ● | 1,096 | ||||||
| 1,752 | Piraeus Bank S.A. ● | 2,548 | ||||||
| 3,644 | ||||||||
| Hong Kong - 0.6% | ||||||||
| 674 | Clear Media Ltd. | 687 | ||||||
| 312 | Dah Sing Financial Group | 1,940 | ||||||
| 82,869 | G-Resources Group Ltd. ● | 2,026 | ||||||
| 4,653 | ||||||||
| Hungary - 0.8% | ||||||||
| 1,967 | Magyar Tavkozlesi Rt ● | 2,723 | ||||||
| 169 | OTP Bank plc ● | 2,791 | ||||||
| 5,514 | ||||||||
| India - 1.4% | ||||||||
| 815 | Allahabad Bank Ltd. | 1,522 | ||||||
| 331 | Canara Bank Ltd. | 2,168 | ||||||
| 222 | Corp. Bank | 1,223 | ||||||
| 5,175 | Manappuram Finance Ltd. | 2,654 | ||||||
| 987 | NTPC Ltd. | 2,410 | ||||||
| 9,977 | ||||||||
| Ireland - 0.8% | ||||||||
| 770 | AER Lingus Group plc | 1,384 | ||||||
| 208 | CRH plc | 4,616 | ||||||
| 6,000 | ||||||||
| Italy - 2.9% | ||||||||
| 217 | Banca Popolare dell-Emilia Romagna Scrl ● | 1,653 | ||||||
| 320 | Buzzi Unicem S.p.A. | 4,335 | ||||||
| 476 | Eni S.p.A. | 10,148 | ||||||
| 758 | UniCredit S.p.A. | 5,487 | ||||||
| 21,623 | ||||||||
| Japan - 37.0% | ||||||||
| 174 | Adastria Holdings Co., Ltd. ☼ | 3,862 | ||||||
| 90 | AEON Delight Co., Ltd. ☼ | 2,194 | ||||||
| 414 | Aichi Steel Corp. ☼ | 1,489 | ||||||
| 273 | Aisan Industry Co., Ltd. ☼ | 2,189 | ||||||
| 28 | Alpha Systems, Inc. ☼ | 375 | ||||||
| 124 | Avex, Inc. ☼ | 1,837 | ||||||
| 243 | Canon, Inc. ☼ | 7,467 | ||||||
| 139 | Cawachi Ltd. ☼ | 2,156 | ||||||
| 178 | Chubu Steel Plate Co., Ltd. ☼ | 808 | ||||||
| 129 | CMIC Holdings Co., Ltd. ☼ | 1,960 | ||||||
| 333 | Dai-ichi Life Insurance Co., Ltd. ☼ | 5,039 | ||||||
| 258 | Daiichi Sankyo Co., Ltd. | 3,876 | ||||||
| 106 | Dai-Ichi Seiko Co., Ltd. ☼ | 2,002 | ||||||
| 245 | DeNa Co., Ltd. ☼ | 3,161 | ||||||
| 597 | Eighteenth (The) Bank Ltd. | 1,691 | ||||||
| 169 | Eisai Co., Ltd. ☼ | 6,600 | ||||||
| 125 | En-Japan, Inc. ☼ | 2,209 | ||||||
The accompanying notes are an integral part of these financial statements.
| 5 |
| The Hartford International Value Fund |
| Schedule of Investments – (continued) |
| October 31, 2014 |
| (000’s Omitted) |
| Shares or Principal Amount | Market Value ╪ | |||||||
| Common Stocks - 95.9% - (continued) | ||||||||
| Japan - 37.0% - (continued) | ||||||||
| 125 | Exedy Corp. ☼ | $ | 3,162 | |||||
| 252 | Fuji Machine Manufacturing Co. | 2,426 | ||||||
| 200 | Fujimi, Inc. ☼ | 2,754 | ||||||
| 1,351 | Fujitsu Ltd. ☼ | 8,213 | ||||||
| 318 | Funai Electric Co., Ltd. ☼ | 2,851 | ||||||
| 81 | Futaba Corp. ☼ | 1,150 | ||||||
| 84 | Gendai Agency, Inc. ☼ | 492 | ||||||
| 360 | Gree, Inc. ☼ | 2,575 | ||||||
| 469 | Higashi-Nippon Bank Ltd. ☼ | 1,188 | ||||||
| 163 | Hisaka Works Ltd. ☼ | 1,485 | ||||||
| 322 | Hitachi Chemical Co., Ltd. ☼ | 5,681 | ||||||
| 277 | Honda Motor Co., Ltd. ☼ | 8,843 | ||||||
| 253 | Honeys Co., Ltd. ☼ | 2,367 | ||||||
| 547 | Hosiden Corp. ☼ | 2,965 | ||||||
| 404 | Inpex Corp. ☼ | 5,171 | ||||||
| 104 | Itochu Techno-Solutions Corp. ☼ | 4,149 | ||||||
| 75 | Japan Digital Laboratory Co., Ltd. ☼ | 1,334 | ||||||
| 115 | Japan Petroleum Exploration Co., Ltd. ☼ | 3,769 | ||||||
| 908 | Japan Steel Works Ltd. ☼ | 3,248 | ||||||
| 280 | JSR Corp. ☼ | 5,039 | ||||||
| 285 | Keihin Corp. ☼ | 3,603 | ||||||
| 123 | Kuroda Electric Co., Ltd. ☼ | 1,725 | ||||||
| 96 | Maruichi Steel Tube Ltd. ☼ | 2,258 | ||||||
| 123 | Melco Holdings, Inc. ☼ | 1,767 | ||||||
| 261 | Mimasu Semiconductor Industry Co., Ltd. ☼ | 2,352 | ||||||
| 137 | Miraial Co., Ltd. ☼ | 2,111 | ||||||
| 1,731 | Mitsubishi UFJ Financial Group, Inc. ☼ | 10,090 | ||||||
| 1,740 | Mitsui Chemicals, Inc. ☼ | 5,042 | ||||||
| 283 | Mitsumi Electric Co., Ltd. ☼ | 1,762 | ||||||
| 195 | Moshi Moshi Hotline, Inc. ☼ | 1,946 | ||||||
| 416 | Net One Systems Co., Ltd. ☼ | 2,427 | ||||||
| 106 | Neturen Co., Ltd. ☼ | 760 | ||||||
| 512 | Nichicon Corp. ☼ | 3,453 | ||||||
| 36 | Nintendo Co., Ltd. ☼ | 3,923 | ||||||
| 345 | Nishimatsuya Chain Co., Ltd. ☼ | 3,122 | ||||||
| 93 | Nitto Denko Corp. ☼ | 5,008 | ||||||
| 78 | NSD Co., Ltd. | 1,147 | ||||||
| 392 | Oita Bank Ltd. ☼ | 1,469 | ||||||
| 106 | Pal Co., Ltd. ☼ | 3,188 | ||||||
| 104 | Proto Corp. ☼ | 1,429 | ||||||
| 82 | Rohm Co., Ltd. ☼ | 5,010 | ||||||
| 1,040 | SCREEN Holdings Co., Ltd. ☼ | 5,668 | ||||||
| 40 | Shimamura Co., Ltd. ☼ | 3,492 | ||||||
| 261 | Shinkawa Ltd. ●☼ | 1,304 | ||||||
| 639 | Shinko Electric Industries Co., Ltd. ☼ | 3,713 | ||||||
| 1,103 | Sumitomo Bakelite Co., Ltd. ☼ | 4,341 | ||||||
| 206 | Sumitomo Mitsui Financial Group, Inc. ☼ | 8,389 | ||||||
| 264 | Sumitomo Riko Co., Ltd. ☼ | 2,265 | ||||||
| 619 | T&D Holdings, Inc. ☼ | 7,974 | ||||||
| 221 | Takata Corp. ☼ | 2,893 | ||||||
| 213 | Takeda Pharmaceutical Co., Ltd. ☼ | 9,242 | ||||||
| 430 | Tochigi (The) Bank Ltd. | 1,748 | ||||||
| 206 | Tokai Rika Co., Ltd. ☼ | 3,918 | ||||||
| 228 | Tokyo Seimitsu Co., Ltd. ☼ | 3,715 | ||||||
| 535 | Tokyo Steel Manufacturing Co., Ltd. ☼ | 2,869 | ||||||
| 79 | Topre Corp. ☼ | 1,124 | ||||||
| 682 | Toshiba Machine Co., Ltd. ☼ | 2,710 | ||||||
| 280 | Toyoda Gosei Co., Ltd. ☼ | 5,372 | ||||||
| 401 | Toyota Boshoku Corp. ☼ | 4,554 | ||||||
| 47 | Tri-Stage, Inc. | 533 | ||||||
| 339 | Ushio, Inc. ☼ | 3,560 | ||||||
| 187 | XEBIO Co., Ltd. ☼ | 2,928 | ||||||
| 328 | Yamanashi (The) Chuo Bank Ltd. ☼ | 1,484 | ||||||
| 131 | Yamato Kogyo Co. ☼ | 4,257 | ||||||
| 70 | Yamazen Corp. | 543 | ||||||
| 342 | Yodogawa Steel Works Ltd. | 1,338 | ||||||
| 73 | Zuken, Inc. | 648 | ||||||
| 271,951 | ||||||||
| Luxembourg - 0.4% | ||||||||
| 158 | Oriflame Cosmetics S.A. ADR | 2,764 | ||||||
| Netherlands - 3.9% | ||||||||
| 281 | Delta Lloyd N.V. | 6,409 | ||||||
| 599 | ING Groep N.V. ● | 8,576 | ||||||
| 222 | Koninklijke Philips N.V. | 6,205 | ||||||
| 1,344 | PostNL ● | 5,712 | ||||||
| 209 | USG People N.V. | 2,096 | ||||||
| 28,998 | ||||||||
| Norway - 0.5% | ||||||||
| 759 | Storebrand ASA ● | 3,891 | ||||||
| Portugal - 0.0% | ||||||||
| 908 | Banco Espirito Santo S.A. ⌂●† | 21 | ||||||
| Russia - 0.7% | ||||||||
| 725 | OAO Gazprom Class S ADR | 4,806 | ||||||
| South Africa - 1.4% | ||||||||
| 103 | Anglo American Platinum Ltd. ●☼ | 3,244 | ||||||
| 616 | Impala Platinum Holdings Ltd. ●☼ | 4,490 | ||||||
| 1,191 | Raubex Group Ltd. ☼ | 2,407 | ||||||
| 10,141 | ||||||||
| South Korea - 2.0% | ||||||||
| 115 | KB Financial Group, Inc. | 4,501 | ||||||
| 169 | Korea Telecom Corp. | 5,204 | ||||||
| 64 | Shinhan Financial Group Co., Ltd. | 2,999 | ||||||
| 191 | Tongyang Life Insurance | 2,080 | ||||||
| 14,784 | ||||||||
| Spain - 1.6% | ||||||||
| 240 | Almirall S.A. ● | 3,934 | ||||||
| 500 | Telefonica S.A. | 7,517 | ||||||
| 11,451 | ||||||||
| Switzerland - 3.4% | ||||||||
| 81 | Adecco S.A. | 5,460 | ||||||
| 60 | Holcim Ltd. | 4,231 | ||||||
| 55 | Julius Baer Group Ltd. | 2,402 | ||||||
| 300 | Micronas Semiconductor Holding AG | 2,008 | ||||||
| 6 | Roche Holding AG | 1,653 | ||||||
| 545 | UBS AG | 9,478 | ||||||
| 25,232 | ||||||||
| Taiwan - 0.1% | ||||||||
| 1,025 | Compal Electronics, Inc. | 758 | ||||||
| United Kingdom - 11.3% | ||||||||
| 341 | Anglo American plc | 7,208 | ||||||
| 221 | AstraZeneca plc | 16,128 | ||||||
| 2,189 | BP plc | 15,751 | ||||||
| 270 | Catlin Group Ltd. | 2,315 | ||||||
| 1,732 | Hays plc | 3,421 | ||||||
The accompanying notes are an integral part of these financial statements.
| 6 |
| The Hartford International Value Fund |
| Schedule of Investments – (continued) |
| October 31, 2014 |
| (000’s Omitted) |
| Shares or Principal Amount | Market Value ╪ | |||||||||||
| Common Stocks - 95.9% - (continued) | ||||||||||||
| United Kingdom - 11.3% - (continued) | ||||||||||||
| 998 | Home Retail Group | $ | 2,928 | |||||||||
| 1,816 | HSBC Holdings plc ‡ | 18,517 | ||||||||||
| 730 | J. Sainsbury plc | 2,877 | ||||||||||
| 1,206 | Lonmin plc ● | 3,380 | ||||||||||
| 388 | Mothercare plc ● | 1,085 | ||||||||||
| 954 | SIG plc | 2,237 | ||||||||||
| 502 | Standard Chartered plc | 7,549 | ||||||||||
| 83,396 | ||||||||||||
| Total Common Stocks | ||||||||||||
| (Cost $759,861) | $ | 705,498 | ||||||||||
| Total Long-Term Investments | ||||||||||||
| (Cost $759,861) | $ | 705,498 | ||||||||||
| Short-Term Investments - 4.9% | ||||||||||||
| Repurchase Agreements - 4.9% | ||||||||||||
| Bank of America Merrill Lynch TriParty Repurchase Agreement (maturing on 11/03/2014 in the amount of $102, collateralized by U.S. Treasury Note 1.50%, 2019, value of $104) | ||||||||||||
| $ | 102 | 0.08%, 10/31/2014 | $ | 102 | ||||||||
| Bank of America Merrill Lynch TriParty Repurchase Agreement (maturing on 11/03/2014 in the amount of $1,742, collateralized by GNMA 1.63% - 7.00%, 2031 - 2054, value of $1,777) | ||||||||||||
| 1,742 | 0.09%, 10/31/2014 | 1,742 | ||||||||||
| Bank of Montreal TriParty Repurchase Agreement (maturing on 11/03/2014 in the amount of $468, collateralized by U.S. Treasury Bond 2.88% - 5.25%, 2029 - 2043, U.S. Treasury Note 0.38% - 4.50%, 2015 - 2022, value of $477) | ||||||||||||
| 468 | 0.08%, 10/31/2014 | 468 | ||||||||||
| Bank of Montreal TriParty Repurchase Agreement (maturing on 11/03/2014 in the amount of $1,587, collateralized by FHLMC 2.00% - 5.50%, 2022 - 2034, FNMA 2.00% - 4.50%, 2024 - 2039, GNMA 3.00%, 2043, U.S. Treasury Note 4.63%, 2017, value of $1,618) | ||||||||||||
| 1,587 | 0.10%, 10/31/2014 | 1,587 | ||||||||||
| Barclays Capital TriParty Repurchase Agreement (maturing on 11/03/2014 in the amount of $5,979, collateralized by U.S. Treasury Bond 4.50% - 6.25%, 2023 - 2036, U.S. Treasury Note 1.63% - 2.13%, 2015 - 2019, value of $6,098) | ||||||||||||
| 5,979 | 0.08%, 10/31/2014 | 5,979 | ||||||||||
| Citigroup Global Markets, Inc. TriParty Repurchase Agreement (maturing on 11/03/2014 in the amount of $6,872, collateralized by U.S. Treasury Bill 0.02%, 2015, U.S. Treasury Bond 3.88% - 11.25%, 2015 - 2040, U.S. Treasury Note 2.00% - 3.38%, 2019 - 2021, value of $7,010) | ||||||||||||
| 6,872 | 0.09%, 10/31/2014 | 6,872 | ||||||||||
| Deutsche Bank Securities TriParty Repurchase Agreement (maturing on 11/03/2014 in the amount of $397, collateralized by U.S. Treasury Note 0.88%, 2017, value of $405) | ||||||||||||
| 397 | 0.13%, 10/31/2014 | 397 | ||||||||||
| RBS Securities, Inc. TriParty Repurchase Agreement (maturing on 11/03/2014 in the amount of $584, collateralized by U.S. Treasury Bond 3.63% - 5.00%, 2037 - 2043, U.S. Treasury Note 2.13%, 2020, value of $596) | ||||||||||||
| 584 | 0.07%, 10/31/2014 | 584 | ||||||||||
| Societe Generale TriParty Repurchase Agreement (maturing on 11/03/2014 in the amount of $6,152, collateralized by U.S. Treasury Bill 0.02%, 2015, U.S. Treasury Bond 3.75% - 11.25%, 2015 - 2043, U.S. Treasury Note 1.38% - 4.25%, 2015 - 2022, value of $6,275) | ||||||||||||
| 6,152 | 0.08%, 10/31/2014 | 6,152 | ||||||||||
| TD Securities TriParty Repurchase Agreement (maturing on 11/03/2014 in the amount of $11,921, collateralized by FHLMC 3.00% - 4.00%, 2026 - 2044, FNMA 2.50% - 5.00%, 2025 - 2044, U.S. Treasury Bond 3.50% - 6.50%, 2026 - 2041, U.S. Treasury Note 1.75% - 2.88%, 2018 - 2019, value of $12,160) | ||||||||||||
| 11,921 | 0.10%, 10/31/2014 | 11,921 | ||||||||||
| 35,804 | ||||||||||||
| Total Short-Term Investments | ||||||||||||
| (Cost $35,804) | $ | 35,804 | ||||||||||
| Total Investments | ||||||||||||
| (Cost $795,665) ▲ | 100.8 | % | $ | 741,302 | ||||||||
| Other Assets and Liabilities | (0.8 | )% | (5,868 | ) | ||||||||
| Total Net Assets | 100.0 | % | $ | 735,434 | ||||||||
The accompanying notes are an integral part of these financial statements.
| 7 |
| The Hartford International Value Fund |
| Schedule of Investments – (continued) |
| October 31, 2014 |
| (000’s Omitted) |
| Note: | Percentage of investments as shown is the ratio of the total market value to total net assets. |
Prices of foreign equities that are principally traded on certain foreign markets may be adjusted daily pursuant to a fair value pricing service approved by the Board of Directors in order to reflect an adjustment for factors occurring after the close of certain foreign markets but before the close of the New York Stock Exchange.
Equity industry classifications used in this report are the Global Industry Classification Standard, which was developed by and is the exclusive property and service mark of MSCI, Inc. and Standard & Poor’s.
For Fund compliance purposes, the Fund may not use the same classification system shown in this report as these classifications are used for reporting ease.
| ▲ | At October 31, 2014, the cost of securities for federal income tax purposes was $797,411 and the aggregate gross unrealized appreciation and depreciation based on that cost were: |
| Unrealized Appreciation | $ | 11,547 | ||
| Unrealized Depreciation | (67,656 | ) | ||
| Net Unrealized Depreciation | $ | (56,109 | ) |
| † | These securities were valued in good faith at fair value as determined under policies and procedures established by and under the supervision of the Board of Directors. At October 31, 2014, the aggregate fair value of these securities was $21, which rounds to zero percent of total net assets. This amount excludes securities that are principally traded in certain foreign markets and whose prices are adjusted pursuant to a third party pricing service methodology approved by the Board of Directors. |
| ● | Non-income producing. |
| ☼ | This security, or a portion of this security, was purchased on a when-issued or delayed-delivery basis. The cost of these securities was $6,982 at October 31, 2014. |
| ‡ | This security, or a portion of this security, has been segregated to cover funding requirements on investment transactions settling in the future. |
| ⌂ | The following securities are considered illiquid. Illiquid securities are often purchased in private placement transactions, are often not registered under the Securities Act of 1933, as amended, and may have contractual restrictions on resale. A security may also be considered illiquid if the security lacks a readily available market or if its valuation has not changed for a certain period of time. |
| Period Acquired | Shares/ Par | Security | Cost Basis | |||||||
| 03/2014 - 07/2014 | 908 | Banco Espirito Santo S.A. | $ | 1,058 | ||||||
At October 31, 2014, the aggregate value of these securities was $21, which rounds to zero percent of total net assets.
Cash pledged and received as collateral in connection with derivatives at October 31, 2014:
| Pledged | Received | |||||||
| Futures contracts | $ | 260 | $ | – | ||||
| Total | $ | 260 | $ | – | ||||
Futures Contracts Outstanding at October 31, 2014
| Number of | Expiration | Notional | Market | Unrealized Appreciation/(Depreciation) | Variation Margin | |||||||||||||||||||||||
| Description | Contracts* | Date | Amount | Value ╪ | Asset | Liability | Asset | Liability | ||||||||||||||||||||
| Long position contracts: | ||||||||||||||||||||||||||||
| EAFE (mini MSCI) Index Future | 65 | 12/19/2014 | $ | 5,852 | $ | 5,967 | $ | 115 | $ | – | $ | 88 | $ | – | ||||||||||||||
| * | The number of contracts does not omit 000's. |
The accompanying notes are an integral part of these financial statements.
| 8 |
| The Hartford International Value Fund |
| Schedule of Investments – (continued) |
| October 31, 2014 |
| (000’s Omitted) |
Foreign Currency Contracts Outstanding at October 31, 2014
| Unrealized Appreciation/(Depreciation) | ||||||||||||||||||||||
| Currency | Buy / Sell | Delivery Date | Counterparty | Contract Amount | Market Value ╪ | Asset | Liability | |||||||||||||||
| AUD | Buy | 11/06/2014 | DEUT | $ | 163 | $ | 163 | $ | – | $ | – | |||||||||||
| BRL | Buy | 11/04/2014 | JPM | 3 | 3 | – | – | |||||||||||||||
| CAD | Buy | 11/04/2014 | BCLY | 421 | 418 | – | (3 | ) | ||||||||||||||
| CHF | Sell | 11/03/2014 | BMO | 494 | 491 | 3 | – | |||||||||||||||
| CHF | Sell | 11/04/2014 | BNY | 834 | 834 | – | – | |||||||||||||||
| DKK | Buy | 11/03/2014 | UBS | 70 | 70 | – | – | |||||||||||||||
| EUR | Buy | 11/03/2014 | RBC | 4,660 | 4,632 | – | (28 | ) | ||||||||||||||
| EUR | Buy | 11/04/2014 | RBC | 235 | 234 | – | (1 | ) | ||||||||||||||
| EUR | Buy | 11/04/2014 | WEST | 748 | 748 | – | – | |||||||||||||||
| GBP | Buy | 11/03/2014 | BMO | 2,232 | 2,232 | – | – | |||||||||||||||
| HKD | Buy | 11/04/2014 | BCLY | 283 | 283 | – | – | |||||||||||||||
| HUF | Buy | 11/03/2014 | UBS | 115 | 114 | – | (1 | ) | ||||||||||||||
| JPY | Buy | 12/18/2014 | BCLY | 6,609 | 6,276 | – | (333 | ) | ||||||||||||||
| JPY | Buy | 11/06/2014 | DEUT | 4,335 | 4,310 | – | (25 | ) | ||||||||||||||
| JPY | Buy | 11/05/2014 | UBS | 275 | 267 | – | (8 | ) | ||||||||||||||
| JPY | Sell | 11/13/2014 | DEUT | 7,521 | 6,880 | 641 | – | |||||||||||||||
| JPY | Sell | 12/18/2014 | MSC | 6,612 | 6,276 | 336 | – | |||||||||||||||
| JPY | Sell | 11/04/2014 | SSG | 182 | 175 | 7 | – | |||||||||||||||
| JPY | Sell | 12/18/2014 | UBS | 9,903 | 9,404 | 499 | – | |||||||||||||||
| NOK | Buy | 11/03/2014 | UBS | 83 | 82 | – | (1 | ) | ||||||||||||||
| SEK | Buy | 11/03/2014 | UBS | 29 | 29 | – | – | |||||||||||||||
| ZAR | Buy | 11/06/2014 | UBS | 221 | 218 | – | (3 | ) | ||||||||||||||
| Total | $ | 1,486 | $ | (403 | ) | |||||||||||||||||
| ╪ | See Significant Accounting Policies of accompanying Notes to Financial Statements regarding valuation of securities. |
| GLOSSARY: (abbreviations used in preceding Schedule of Investments) | ||
| Counterparty Abbreviations: | ||
| BCLY | Barclays | |
| BMO | Bank of Montreal | |
| BNY | BNY Mellon | |
| DEUT | Deutsche Bank Securities, Inc. | |
| JPM | JP Morgan Chase & Co. | |
| MSC | Morgan Stanley | |
| RBC | RBC Dominion Securities, Inc. | |
| SSG | State Street Global Markets LLC | |
| UBS | UBS AG | |
| WEST | Westpac International | |
| Currency Abbreviations: | ||
| AUD | Australian Dollar |
| BRL | Brazilian Real |
| CAD | Canadian Dollar |
| CHF | Swiss Franc |
| DKK | Danish Krone |
| EUR | EURO |
| GBP | British Pound |
| HKD | Hong Kong Dollar |
| HUF | Hungarian Forint |
| JPY | Japanese Yen |
| NOK | Norwegian Krone |
| SEK | Swedish Krona |
| ZAR | South African Rand |
| Index Abbreviations: | |
| EAFE | Europe, Australasia and Far East |
| MSCI | Morgan Stanley Capital International |
| Other Abbreviations: | |
| ADR | American Depositary Receipt |
| FHLMC | Federal Home Loan Mortgage Corp. |
| FNMA | Federal National Mortgage Association |
| GNMA | Government National Mortgage Association |
The accompanying notes are an integral part of these financial statements.
| 9 |
| The Hartford International Value Fund |
| Schedule of Investments – (continued) |
| October 31, 2014 |
| (000’s Omitted) |
Investment Valuation Hierarchy Level Summary
October 31, 2014
| Total | Level 1 ♦ | Level 2 ♦ | Level 3 | |||||||||||||
| Assets: | ||||||||||||||||
| Common Stocks ‡ | $ | 705,498 | $ | 52,685 | $ | 652,792 | $ | 21 | ||||||||
| Short-Term Investments | 35,804 | – | 35,804 | – | ||||||||||||
| Total | $ | 741,302 | $ | 52,685 | $ | 688,596 | $ | 21 | ||||||||
| Foreign Currency Contracts * | $ | 1,486 | $ | – | $ | 1,486 | $ | – | ||||||||
| Futures * | 115 | 115 | – | – | ||||||||||||
| Total | $ | 1,601 | $ | 115 | $ | 1,486 | $ | – | ||||||||
| Liabilities: | ||||||||||||||||
| Foreign Currency Contracts * | $ | 403 | $ | – | $ | 403 | $ | – | ||||||||
| Total | $ | 403 | $ | – | $ | 403 | $ | – | ||||||||
| ♦ | For the year ended October 31, 2014, investments valued at $705 were transferred from Level 1 to Level 2, and investments valued at $556 were transferred from Level 2 to Level 1. Investments are transferred between Level 1 and Level 2 for a variety of reasons including, but not limited to: |
| 1) | Foreign equities for which a fair value price is more representative of exit value than the local market close (transfer into Level 2). Foreign equities for which the local market close is more representative of exit value (transfer into Level 1). |
| 2) | U.S. Treasury securities that no longer represent the most recent issue (transfer into Level 2). |
| 3) | Equity investments with no observable trading but a bid or mean price is used (transfer into Level 2). Equity investments using observable quoted prices in an active market (transfer into Level 1). |
| ‡ | The Fund has all or primarily all of the equity securities categorized in a particular level. Refer to the Schedule of Investments for further industry breakout. |
| * | Derivative instruments (excluding purchased and written options, if applicable) are valued at the unrealized appreciation/depreciation on the investments. |
Following is a reconciliation of Level 3 assets for which significant unobservable inputs were used to determine fair value:
| Balance as of October 31, 2013 | Realized Gain (Loss) | Change in Unrealized Appreciation (Depreciation) | Net Amortization | Purchases | Sales | Transfers Into Level 3 * | Transfers Out of Level 3 * | Balance as of October 31, 2014 | ||||||||||||||||||||||||||||
| Assets: | ||||||||||||||||||||||||||||||||||||
| Common Stocks | $ | — | $ | 25 | $ | (1,050 | )† | $ | — | $ | 1,245 | $ | (312 | ) | $ | 113 | $ | — | $ | 21 | ||||||||||||||||
| Total | $ | — | $ | 25 | $ | (1,050 | ) | $ | — | $ | 1,245 | $ | (312 | ) | $ | 113 | $ | — | $ | 21 | ||||||||||||||||
| * | Investments are transferred into and out of Level 3 for a variety of reasons including, but not limited to: |
| 1) | Investments where trading has been halted (transfer into Level 3) or investments where trading has resumed (transfer out of Level 3). |
| 2) | Broker quoted investments (transfer into Level 3) or quoted prices in active markets (transfer out of Level 3). |
| 3) | Investments that have certain restrictions on trading (transfer into Level 3) or investments where trading restrictions have expired (transfer out of Level 3). |
| † | Change in unrealized appreciation (depreciation) in the current period relating to assets still held at October 31, 2014 was $(1,050). |
| Note: | For purposes of reporting transfers between different hierarchy levels, both transfers in and out of each level, as applicable, are shown as if they occurred at the beginning of the period. |
The accompanying notes are an integral part of these financial statements.
| 10 |
| The Hartford International Value Fund |
| Statement of Assets and Liabilities |
| October 31, 2014 |
| (000’s Omitted) |
| Assets: | ||||
| Investments in securities, at market value (cost $795,665) | $ | 741,302 | ||
| Cash | 260 | * | ||
| Foreign currency on deposit with custodian (cost $33) | 33 | |||
| Unrealized appreciation on foreign currency contracts | 1,486 | |||
| Receivables: | ||||
| Investment securities sold | 4,040 | |||
| Fund shares sold | 6,957 | |||
| Dividends and interest | 1,833 | |||
| Variation margin on financial derivative instruments | 88 | |||
| Other assets | 104 | |||
| Total assets | 756,103 | |||
| Liabilities: | ||||
| Unrealized depreciation on foreign currency contracts | 403 | |||
| Bank overdraft | 25 | |||
| Payables: | ||||
| Investment securities purchased | 17,338 | |||
| Fund shares redeemed | 2,686 | |||
| Investment management fees | 115 | |||
| Administrative fees | — | |||
| Distribution fees | 15 | |||
| Variation margin on financial derivative instruments | — | |||
| Accrued expenses | 87 | |||
| Total liabilities | 20,669 | |||
| Net assets | $ | 735,434 | ||
| Summary of Net Assets: | ||||
| Capital stock and paid-in-capital | $ | 788,947 | ||
| Undistributed net investment income | 4,097 | |||
| Accumulated net realized loss | (4,428 | ) | ||
| Unrealized depreciation of investments and the translation of assets and liabilities denominated in foreign currency | (53,182 | ) | ||
| Net assets | $ | 735,434 | ||
| Shares authorized | 500,000 | |||
| Par value | $ | 0.001 | ||
| Class A: Net asset value per share/Maximum offering price per share | $14.37/$15.21 | |||
| Shares outstanding | 8,091 | |||
| Net assets | $ | 116,268 | ||
| Class C: Net asset value per share | $ | 14.16 | ||
| Shares outstanding | 3,726 | |||
| Net assets | $ | 52,779 | ||
| Class I: Net asset value per share | $ | 14.49 | ||
| Shares outstanding | 35,571 | |||
| Net assets | $ | 515,604 | ||
| Class R3: Net asset value per share | $ | 14.33 | ||
| Shares outstanding | 85 | |||
| Net assets | $ | 1,223 | ||
| Class R4: Net asset value per share | $ | 14.42 | ||
| Shares outstanding | 77 | |||
| Net assets | $ | 1,111 | ||
| Class R5: Net asset value per share | $ | 14.50 | ||
| Shares outstanding | 82 | |||
| Net assets | $ | 1,185 | ||
| Class Y: Net asset value per share | $ | 14.75 | ||
| Shares outstanding | 3,204 | |||
| Net assets | $ | 47,264 |
| * | Cash of $260 was pledged as collateral for open financial derivative instruments at October 31, 2014. |
The accompanying notes are an integral part of these financial statements.
| 11 |
| The Hartford International Value Fund |
| Statement of Operations |
| For the Year Ended October 31, 2014 |
| (000’s Omitted) |
| Investment Income: | ||||
| Dividends | $ | 7,162 | ||
| Interest | 10 | |||
| Less: Foreign tax withheld | (805 | ) | ||
| Total investment income | 6,367 | |||
| Expenses: | ||||
| Investment management fees | 2,394 | |||
| Administrative services fees | ||||
| Class R3 | 2 | |||
| Class R4 | 2 | |||
| Class R5 | 1 | |||
| Transfer agent fees | ||||
| Class A | 110 | |||
| Class C | 27 | |||
| Class I | 156 | |||
| Class R3 | — | |||
| Class R4 | — | |||
| Class R5 | — | |||
| Class Y | — | |||
| Distribution fees | ||||
| Class A | 155 | |||
| Class C | 226 | |||
| Class R3 | 5 | |||
| Class R4 | 2 | |||
| Custodian fees | 30 | |||
| Accounting services fees | 51 | |||
| Registration and filing fees | 126 | |||
| Board of Directors' fees | 4 | |||
| Audit fees | 18 | |||
| Other expenses | 41 | |||
| Total expenses (before waivers and fees paid indirectly) | 3,350 | |||
| Expense waivers | (23 | ) | ||
| Commission recapture | — | |||
| Total waivers and fees paid indirectly | (23 | ) | ||
| Total expenses, net | 3,327 | |||
| Net Investment Income | 3,040 | |||
| Net Realized Gain on Investments, Other Financial Instruments and Foreign Currency Transactions: | ||||
| Net realized gain on investments | 9,370 | |||
| Less: Foreign taxes paid on realized capital gains | (89 | ) | ||
| Net realized loss on futures contracts | (543 | ) | ||
| Net realized gain on foreign currency contracts | 295 | |||
| Net realized gain on other foreign currency transactions | 405 | |||
| Net Realized Gain on Investments, Other Financial Instruments and Foreign Currency Transactions | 9,438 | |||
| Net Changes in Unrealized Depreciation of Investments, Other Financial Instruments and Foreign Currency Transactions: | ||||
| Net unrealized depreciation of investments | (57,239 | ) | ||
| Net unrealized appreciation of futures contracts | 115 | |||
| Net unrealized appreciation of foreign currency contracts | 1,081 | |||
| Net unrealized depreciation of translation of other assets and liabilities in foreign currencies | (20 | ) | ||
| Net Changes in Unrealized Depreciation of Investments, Other Financial Instruments and Foreign Currency Transactions | (56,063 | ) | ||
| Net Loss on Investments, Other Financial Instruments and Foreign Currency Transactions | (46,625 | ) | ||
| Net Decrease in Net Assets Resulting from Operations | $ | (43,585 | ) |
The accompanying notes are an integral part of these financial statements.
| 12 |
| The Hartford International Value Fund |
| Statement of Changes in Net Assets |
| (000’s Omitted) |
| For the Year Ended October 31, 2014 | For the Year Ended October 31, 2013 | |||||||
| Operations: | ||||||||
| Net investment income | $ | 3,040 | $ | 397 | ||||
| Net realized gain on investments, other financial instruments and foreign currency transactions | 9,438 | 6,739 | ||||||
| Net unrealized appreciation (depreciation) of investments, other financial instruments and foreign currency transactions | (56,063 | ) | 102 | |||||
| Net Increase (Decrease) in Net Assets Resulting from Operations | (43,585 | ) | 7,238 | |||||
| Distributions to Shareholders: | ||||||||
| From net investment income | ||||||||
| Class A | — | (347 | ) | |||||
| Class C | — | (68 | ) | |||||
| Class I | — | (50 | ) | |||||
| Class R3 | — | (49 | ) | |||||
| Class R4 | — | (49 | ) | |||||
| Class R5 | — | (50 | ) | |||||
| Class Y | — | (2,222 | ) | |||||
| Total from net investment income | — | (2,835 | ) | |||||
| From tax return of capital | ||||||||
| Class A | — | (37 | ) | |||||
| Class C | — | (7 | ) | |||||
| Class I | — | (6 | ) | |||||
| Class R3 | — | (5 | ) | |||||
| Class R4 | — | (5 | ) | |||||
| Class R5 | — | (6 | ) | |||||
| Class Y | — | (239 | ) | |||||
| Total from tax return of capital | — | (305 | ) | |||||
| Total distributions | — | (3,140 | ) | |||||
| Capital Share Transactions: | ||||||||
| Class A | 109,185 | 7,495 | ||||||
| Class C | 53,731 | 1,415 | ||||||
| Class I | 544,772 | 1,713 | ||||||
| Class R3 | 402 | 44 | ||||||
| Class R4 | 310 | 55 | ||||||
| Class R5 | 379 | 56 | ||||||
| Class Y | 38,605 | (18,656 | ) | |||||
| Net increase (decrease) from capital share transactions | 747,384 | (7,878 | ) | |||||
| Net Increase (Decrease) in Net Assets | 703,799 | (3,780 | ) | |||||
| Net Assets: | ||||||||
| Beginning of period | 31,635 | 35,415 | ||||||
| End of period | $ | 735,434 | $ | 31,635 | ||||
| Undistributed (distributions in excess of) net investment income | $ | 4,097 | $ | (170 | ) | |||
The accompanying notes are an integral part of these financial statements.
| 13 |
| The Hartford International Value Fund |
| Notes to Financial Statements |
| October 31, 2014 |
| (000’s Omitted) |
Organization:
The Hartford Mutual Funds, Inc. (“Company”) is an open-end management investment company comprised of forty-two portfolios. Financial statements for The Hartford International Value Fund (the "Fund"), a series of the Company, are included in this report.
The Company is organized under the laws of the State of Maryland and is registered with the Securities and Exchange Commission (“SEC”) under the Investment Company Act of 1940, as amended (“1940 Act”). The Fund is a diversified open-end management investment company. The Fund is an investment company and applies specialized accounting and reporting under Accounting Standards Codification Topic 946, Financial Services - Investment Companies.
Class A shares are sold with a front-end sales charge of up to 5.50%. Class C shares are sold with a contingent deferred sales charge of up to 1.00% on shares redeemed within twelve months of purchase. Class I shares are sold without sales charges to certain eligible investors primarily through advisory fee-based wrap programs. Class R3, R4 and R5 shares, which are offered to employer-sponsored retirement plans, and Class Y shares, which are sold to certain eligible institutional investors, are sold without a sales charge. All classes of shares have identical voting, redemption, dividend, liquidation and other rights and the same terms and conditions, with the exceptions that each class may have different expenses, which may affect performance.
Significant Accounting Policies:
The following is a summary of significant accounting policies of the Fund in the preparation of its financial statements, which are in accordance with United States generally accepted accounting principles (“U.S. GAAP”). The preparation of financial statements in accordance with U.S. GAAP may require management to make estimates and assumptions that affect the reported amounts of assets and liabilities and disclosure of contingent assets and liabilities at the date of the financial statements and the reported amounts of increases and decreases in net assets from operations during the reporting period. Actual results could differ from those estimates.
Determination of Net Asset Value – The per share net asset value ("NAV") of each class of the Fund's shares is determined as of the close of regular trading (normally 4:00 p.m. Eastern Time) (the “NYSE Close”) on each day that the New York Stock Exchange (the “Exchange”) is open (“Valuation Date”). Information that becomes known to the Fund after the NAV has been calculated on a particular day will not generally be used to retroactively adjust the NAV determined earlier that day.
Investment Valuation and Fair Value Measurements – For purposes of calculating the NAV, portfolio investments and other assets held by the Fund's portfolio for which market quotes are readily available are valued at market value. Market value is generally determined on the basis of last reported sales prices or official close price. If no sales are reported, market value is based on quotes obtained from a quotation reporting system, established market makers, or independent pricing services. If market prices are not readily available or are deemed unreliable, the Fund will use the fair value of the investment as determined in good faith under policies and procedures established by and under the supervision of the Company's Board of Directors. Market quotes are considered not readily available where there is an absence of current or reliable market-based data (e.g., trade information or indicative market quotes), including where events occur after the close of the relevant market, but prior to the NYSE Close, that materially affect the values of the Fund's portfolio investments or assets. In addition, market quotes are considered not readily available when, due to extraordinary circumstances, the exchanges or markets on which the investments trade do not open for trading for the entire day and no other market prices are available. In addition, prices of foreign equities that are principally traded on certain foreign markets may be adjusted daily pursuant to a fair value pricing service approved by the Board of Directors in order to reflect an adjustment for the factors occurring after the close of certain foreign markets but before the NYSE Close. Investments that are primarily traded on foreign markets may trade on days that are not business days of the Fund. The value of the foreign investments in which the Fund invests may change on days when a shareholder will not be able to purchase or redeem shares of the Fund. Fair value pricing is subjective in nature and the use of fair value pricing by the Fund may cause the NAV of its shares to differ significantly from the NAV that would have been calculated using market prices at the close of the exchange on which a portfolio investment is primarily traded. There can be no assurance that the Fund could obtain the fair market value assigned to an investment if the Fund were to sell the investment at approximately the time at which the Fund determines its NAV.
Exchange traded options, futures and options on futures are valued at the settlement price or last trade price determined by the relevant exchange as of the NYSE Close. If the last trade price for exchange traded options does not fall between the bid and ask
| 14 |
| The Hartford International Value Fund |
| Notes to Financial Statements – (continued) |
| October 31, 2014 |
| (000’s Omitted) |
prices, the value will be the mean of the bid and ask prices as of the NYSE Close. If a last trade price is not available, the value will be the mean of the bid and ask prices as of the NYSE Close. If a mean of the bid and ask prices cannot be calculated for the day, the value will be the bid price as of the NYSE Close. In the case of over-the-counter ("OTC") options and such instruments that do not trade on an exchange, values may be supplied by a pricing service using a formula or other objective method that may take into consideration the style, direction, expiration, strike price, notional value and volatility or other special adjustments.
Investments valued in currencies other than U.S. dollars are converted to U.S. dollars using exchange rates obtained from independent pricing services for calculation of the NAV. As a result, the NAV of the Fund’s shares may be affected by changes in the value of currencies in relation to the U.S. dollar. The value of investments traded in markets outside the United States or denominated in currencies other than the U.S. dollar may be affected significantly on a day that the NYSE is closed and the market value may change on days when an investor is not able to purchase, redeem or exchange shares of the Fund.
Foreign currency contracts represent agreements to exchange currencies on specific future dates at predetermined rates. Foreign currency contracts are valued using foreign currency exchange rates and forward rates as provided by an independent pricing service on the Valuation Date.
Financial instruments for which prices are not available from an independent pricing service may be valued using market quotations obtained from one or more dealers that make markets in the respective financial instrument in accordance with procedures established by the Company's Board of Directors.
U.S. GAAP defines fair value as the price that the Fund would receive to sell an asset or pay to transfer a liability in an orderly transaction between market participants. The U.S. GAAP fair value measurement standards require disclosure of a fair value hierarchy for each major category of assets and liabilities. Various inputs are used in determining the fair value of the Fund’s investments. These inputs are summarized into three broad hierarchy levels. This hierarchy is based on whether the valuation inputs are observable or unobservable. These levels are:
Level 1 – Quoted prices in active markets for identical investments. Level 1 may include exchange traded instruments, such as domestic equities, some foreign equities, options, futures, mutual funds, exchange traded funds, rights and warrants.
Level 2 – Observable inputs other than Level 1 prices, such as quoted prices for similar investments; quoted prices in markets that are not active; or other inputs that are observable or can be corroborated by observable market data. Level 2 may include debt investments that are traded less frequently than exchange traded instruments and which are valued using independent pricing services; foreign equities, which are principally traded on certain foreign markets and are adjusted daily pursuant to a fair value pricing service in order to reflect an adjustment for the factors occurring after the close of certain foreign markets but before the NYSE Close; senior floating rate interests, which are valued using an aggregate of dealer bids; short-term investments, which are valued at amortized cost; and swaps, which are valued based upon the terms of each swap contract.
Level 3 – Significant unobservable inputs that are supported by limited or no market activity. Level 3 may include financial instruments whose values are determined using indicative market quotes or require significant management judgment or estimation. These unobservable valuation inputs may include estimates for current yields, maturity/duration, prepayment speed, and indicative market quotes for comparable investments along with other assumptions relating to credit quality, collateral value, complexity of the investment structure, general market conditions and liquidity. This category may include investments where trading has been halted or there are certain restrictions on trading. While these investments are priced using unobservable inputs, the valuation of these investments reflects the best available data and management believes the prices are a reasonable representation of exit price.
The Board of Directors of the Company generally reviews and approves the “Procedures for Valuation of Portfolio Securities” at least once a year. These procedures define how investments are to be valued, including the formation and activities of a Valuation Committee. The Valuation Committee is responsible for determining in good faith the fair value of investments when the value cannot be obtained from primary pricing services or alternative sources or if the valuation of an investment as provided by the primary pricing service or alternative source is believed not to reflect the investment’s fair value as of the Valuation Date. Voting members of the Valuation Committee include the Fund's Treasurer or designee and a Vice President of the investment
| 15 |
| The Hartford International Value Fund |
| Notes to Financial Statements – (continued) |
| October 31, 2014 |
| (000’s Omitted) |
manager or designee. An Assistant Vice President of the Fund with legal expertise or designee is also included on the Valuation Committee as a non-voting advisory member. In addition, the Fund’s Chief Compliance Officer shall designate a member of the compliance group to attend Valuation Committee meetings as a non-voting resource, to monitor for and provide guidance with respect to compliance with these procedures. Two members of the Valuation Committee or their designees, representing different departments, shall constitute a quorum for purposes of permitting the Valuation Committee to take action. The Valuation Committee will consider all relevant factors in determining an investment’s fair value, and may seek the advice of the Fund’s sub-adviser, knowledgeable brokers, and legal counsel in making such determination. The Valuation Committee reports to the Audit Committee of the Company's Board of Directors. The Audit Committee receives quarterly written reports which include details of all fair-valued investments, including the reason for the fair valuation, and an indication, when possible, of the accuracy of the valuation by disclosing the next available reliable public price quotation or the disposition price of such investments (the “look-back” test). The Board of Directors then must consider for ratification all of the fair value determinations made during the previous quarter.
Valuation levels are not necessarily indicative of the risk associated with investing in such investments. Individual investments within any of the above mentioned asset classes may be assigned a different hierarchical level than those presented above, as individual circumstances dictate.
For additional information, refer to the Investment Valuation Hierarchy Level Summary and the Level 3 roll-forward reconciliation, if applicable, which follow the Schedule of Investments.
Investment Transactions and Investment Income – Investment transactions are recorded as of the trade date (the date the order to buy or sell is executed) for financial reporting purposes. Investments purchased or sold on a when-issued or delayed-delivery basis may be settled a month or more after the trade date. Realized gains and losses are determined on the basis of identified cost.
Dividend income from domestic securities is accrued on the ex-dividend date. In general, dividend income from foreign securities is recorded on the ex-date; however, dividend notifications in certain foreign jurisdictions may not be available in a timely manner and as a result, the Fund will record the dividend as soon as the relevant details (i.e., rate per share, payment date, shareholders of record, etc.) are publicly available. Interest income, including amortization of premium, accretion of discounts and additional principal received in-kind in lieu of cash, is accrued on a daily basis.
Taxes – The Fund may be subject to taxes imposed on realized gains on securities of certain foreign countries in which the Fund invests. The amount of foreign tax expense is included on the accompanying Statement of Operations as a reduction to net realized gain on investments in these securities.
Foreign Currency Transactions – Assets and liabilities denominated in currencies other than U.S. dollars are translated into U.S. dollars at the exchange rates in effect on the valuation date. Purchases and sales of investments, income and expenses are translated into U.S. dollars at the exchange rates on the dates of such transactions.
The Fund does not isolate that portion of portfolio investment valuation resulting from fluctuations in the foreign currency exchange rates from the fluctuations arising from changes in the market prices of investments held. Exchange rate fluctuations are included with the net realized and unrealized gain or loss on investments in the accompanying financial statements.
Net realized foreign exchange gains or losses arise from sales of foreign currencies and the difference between asset and liability amounts initially stated in foreign currencies and the U.S. dollar value of the amounts actually received or paid. Net unrealized foreign exchange gains or losses arise from changes in the value of other assets and liabilities at the end of the reporting period, resulting from changes in the exchange rates.
Joint Trading Account – The Fund may invest cash balances into a joint trading account that may be invested in one or more repurchase agreements.
Fund Share Valuation and Dividend Distributions to Shareholders – Orders for the Fund’s shares are executed in accordance with the investment instructions of the shareholders. The NAV of the Fund’s shares is determined as of the close of business on each
| 16 |
| The Hartford International Value Fund |
| Notes to Financial Statements – (continued) |
| October 31, 2014 |
| (000’s Omitted) |
business day of the Exchange. The NAV is determined separately for each class of shares of the Fund by dividing the Fund’s net assets attributable to that class by the number of shares of the class outstanding. Each class of shares offered by the Fund has equal rights as to assets and voting privileges (except that shareholders of a class have exclusive voting rights regarding any matter relating solely to that class of shares). Income and non-class specific expenses are allocated daily to each class on the basis of the relative net assets of the class. Realized and unrealized gains and losses are allocated daily based on the relative net assets of each class of shares of the Fund.
Orders for the purchase of the Fund’s shares received prior to the close of the Exchange on any day the Exchange is open for business are priced at the NAV determined as of the close of the Exchange. Orders received after the close of the Exchange, or on a day on which the Exchange and/or the Fund is not open for business, are priced at the next determined NAV.
Dividends are declared pursuant to a policy adopted by the Company's Board of Directors based upon the investment performance of the Fund. The policy of the Fund is to pay dividends from net investment income and realized gains, if any, at least once a year.
Net investment income, dividends and distributions from net realized gains and capital are determined in accordance with federal income tax regulations, which may differ from U.S. GAAP with respect to character and timing (see Federal Income Taxes: Distributions and Components of Distributable Earnings and Reclassification of Capital Accounts).
Securities and Other Investments:
Repurchase Agreements – A repurchase agreement is an agreement by which a counterparty agrees to sell an investment and agrees to repurchase the investment sold from the buyer at a mutually agreed upon time and price. During the period of the repurchase agreement, the counterparty will deposit cash and or securities in a third party custodial account to serve as collateral. At the time the Fund enters into a repurchase agreement, the value of the underlying collateral, including accrued interest, will be equal to or exceed the value of the repurchase agreement. Repurchase agreements expose the Fund to counterparty risk - that is, the risk that the counterparty will not fulfill its obligations. To minimize counterparty risk, the investments that serve to collateralize the repurchase agreement are held by the Fund’s custodian in book entry or physical form in the custodial account of the Fund or in a third party custodial account. Repurchase agreements are valued at cost plus accrued interest, which approximates fair value. Repurchase agreements have master netting arrangements which allow the Fund to offset amounts owed to a counterparty with amounts owed by the counterparty, including any collateral. Upon an event of default under a master repurchase agreement, the non-defaulting party may close out all transactions traded under such agreement and net amounts owed under each transaction to one net amount payable by one party to the other. Absent an event of default, the master repurchase agreement does not result in an offset of reported amounts of assets and liabilities in the Statement of Assets and Liabilities across transactions between the Fund and the applicable counterparty. The Fund, as shown on the Schedule of Investments, had outstanding repurchase agreements and related collateral as of October 31, 2014.
Investments Purchased on a When-Issued or Delayed-Delivery Basis – Delivery and payment for investments that have been purchased by the Fund on a forward commitment, or when-issued or delayed-delivery basis, take place beyond the customary settlement period. The Fund may dispose of or renegotiate a delayed-delivery transaction after it is entered into, and may sell delayed-delivery investments before they are delivered, which may result in a realized gain or loss. During this period, such investments are subject to market fluctuations, and the Fund identifies investments segregated in its records with a value at least equal to the amount of the commitment. The Fund, as shown on the Schedule of Investments, had when-issued or delayed-delivery investments as of October 31, 2014.
Illiquid and Restricted Investments – The Fund is permitted to invest up to 15% of its net assets in illiquid investments. Illiquid investments are those that may not be sold or disposed of in the ordinary course of business within seven days, at approximately the price used to determine the Fund’s NAV. The Fund may not be able to sell illiquid investments when its sub-adviser considers it desirable to do so or may have to sell such investments at a price that is lower than the price that could be obtained if the investments were more liquid. A sale of illiquid investments may require more time and may result in higher dealer discounts and other selling expenses than does the sale of those that are liquid. Illiquid investments also may be more difficult to value due to the unavailability of reliable market quotations for such investments, and an investment in them may have an adverse impact on the Fund’s NAV. The Fund may also purchase certain restricted investments that can only be resold to certain qualified investors and may be determined to
| 17 |
| The Hartford International Value Fund |
| Notes to Financial Statements – (continued) |
| October 31, 2014 |
| (000’s Omitted) |
be liquid pursuant to policies and guidelines established by the Company's Board of Directors. The Fund, as shown on the Schedule of Investments, had illiquid or restricted investments as of October 31, 2014.
Financial Derivative Instruments:
The following disclosures contain information on how and why the Fund uses derivative instruments, the credit-risk-related contingent features in certain derivative instruments and how derivative instruments affect the Fund’s financial position and results of operations. The location and fair value amounts of these instruments on the Statement of Assets and Liabilities and the realized gains and losses and changes in unrealized gains and losses on the Statement of Operations, each categorized by type of derivative contract, are included in the following Additional Derivative Instrument Information footnote. The derivative instruments outstanding as of year-end are disclosed in the notes to the Schedule of Investments, if applicable. The amounts of realized gains and losses and changes in unrealized gains and losses on derivative instruments during the year are disclosed in the Statement of Operations.
Foreign Currency Contracts – The Fund may enter into foreign currency contracts that obligate the Fund to purchase or sell currencies at specified future dates. Foreign currency contracts are used to hedge the currency exposure associated with some or all of the Fund’s investments and/or as part of an investment strategy. Foreign currency contracts are marked to market daily and the change in value is recorded by the Fund as an unrealized gain or loss. The Fund will record a realized gain or loss when the foreign currency contract is settled.
Foreign currency contracts involve elements of market risk in excess of the amounts reflected in the Statement of Assets and Liabilities. In addition, risks may arise upon entering into these contracts from the potential inability of the counterparties to meet the terms of the contracts and from unanticipated movements in the value of the foreign currencies relative to the U.S. dollar. The Fund, as shown on the Schedule of Investments, had outstanding foreign currency contracts as of October 31, 2014.
Futures Contracts – The Fund may enter into futures contracts. A futures contract is an agreement between two parties to buy or sell an asset at a set price on a future date. The Fund uses futures contracts to manage or obtain exposure to the investment markets, commodities, or movements in interest rates and currency values. The primary risks associated with the use of futures contracts are the imperfect correlation between the change in market value of the investments held by the Fund and the prices of futures contracts and the possibility of an illiquid market. Upon entering into a futures contract, the Fund is required to deposit with a futures commission merchant (“FCM”) an amount of cash or U.S. Government or Agency Obligations in accordance with the initial margin requirements of the broker or exchange. Futures contracts are marked to market daily at the most recent settlement price reported by an exchange on which, over time, they are traded most extensively, and an appropriate payable or receivable for the change in value (“variation margin”) is recorded by the Fund. Gains or losses are recognized but not considered realized until the contracts expire or are closed. Futures contracts involve, to varying degrees, risk of loss in excess of the variation margin disclosed on the Statement of Assets and Liabilities; however, the Fund seeks to reduce this risk through the use of an FCM. The Fund, as shown on the Schedule of Investments, had outstanding futures contracts as of October 31, 2014.
| 18 |
| The Hartford International Value Fund |
| Notes to Financial Statements – (continued) |
| October 31, 2014 |
| (000’s Omitted) |
Additional Derivative Instrument Information:
Fair Value of Derivative Instruments on the Statement of Assets and Liabilities as of October 31, 2014:
| Risk Exposure Category | ||||||||||||||||||||||||||||
| Interest Rate Contracts | Foreign Exchange Contracts | Credit Contracts | Equity Contracts | Commodity Contracts | Other Contracts | Total | ||||||||||||||||||||||
| Assets: | ||||||||||||||||||||||||||||
| Unrealized appreciation on foreign currency contracts | $ | — | $ | 1,486 | $ | — | $ | — | $ | — | $ | — | $ | 1,486 | ||||||||||||||
| Variation margin receivable * | — | — | — | 88 | — | — | 88 | |||||||||||||||||||||
| Total | $ | — | $ | 1,486 | $ | — | $ | 88 | $ | — | $ | — | $ | 1,574 | ||||||||||||||
| Liabilities: | ||||||||||||||||||||||||||||
| Unrealized depreciation on foreign currency contracts | $ | — | $ | 403 | $ | — | $ | — | $ | — | $ | — | $ | 403 | ||||||||||||||
| Variation margin payable * | — | — | — | — | — | — | — | |||||||||||||||||||||
| Total | $ | — | $ | 403 | $ | — | $ | — | $ | — | $ | — | $ | 403 | ||||||||||||||
| * | Only current day's variation margin is reported within the Statement of Assets and Liabilities. The variation margin is included in the open futures net cumulative appreciation of $115 as reported in the Schedule of Investments. |
The volume of derivatives that is presented in the Schedule of Investments is consistent with the derivative activity during the year ended October 31, 2014.
The Effect of Derivative Instruments on the Statement of Operations for the year ended October 31, 2014:
| Risk Exposure Category | ||||||||||||||||||||||||||||
| Interest Rate Contracts | Foreign Exchange Contracts | Credit Contracts | Equity Contracts | Commodity Contracts | Other Contracts | Total | ||||||||||||||||||||||
| Realized Gain (Loss) on Derivatives Recognized as a Result of Operations: | ||||||||||||||||||||||||||||
| Net realized loss on futures contracts | $ | — | $ | — | $ | — | $ | (543 | ) | $ | — | $ | — | $ | (543 | ) | ||||||||||||
| Net realized gain on foreign currency contracts | — | 295 | — | — | — | — | 295 | |||||||||||||||||||||
| Total | $ | — | $ | 295 | $ | — | $ | (543 | ) | $ | — | $ | — | $ | (248 | ) | ||||||||||||
| Net Change in Unrealized Appreciation (Depreciation) on Derivatives Recognized as a Result of Operations: | ||||||||||||||||||||||||||||
| Net change in unrealized appreciation of futures contracts | $ | — | $ | — | $ | — | $ | 115 | $ | — | $ | — | $ | 115 | ||||||||||||||
| Net change in unrealized appreciation of foreign currency contracts | — | 1,081 | — | — | — | — | 1,081 | |||||||||||||||||||||
| Total | $ | — | $ | 1,081 | $ | — | $ | 115 | $ | — | $ | — | $ | 1,196 | ||||||||||||||
Balance Sheet Offsetting Information - The following discloses both gross information and net information about instruments and transactions eligible for offset in the financial statements, and instruments and transactions that are subject to a master netting arrangement, as well as amounts related to margin, reflected as financial collateral (including cash collateral), held at clearing brokers, counterparties and the Fund’s custodian. The master netting arrangements allow the clearing brokers to net any collateral held in or on behalf of the Fund, or liabilities or payment obligations of the clearing brokers to the Fund, against any liabilities or payment obligations of the Fund to the clearing brokers. The Fund is required to deposit financial collateral (including cash collateral) at the FCM's custodian on behalf of clearing brokers and counterparties to continually meet the original and maintenance requirements established by the clearing brokers and counterparties. Such requirements are specific to the respective clearing broker or counterparty. Certain master netting arrangements may not be enforceable in the bankruptcy proceedings of a counterparty.
| 19 |
| The Hartford International Value Fund |
| Notes to Financial Statements – (continued) |
| October 31, 2014 |
| (000’s Omitted) |
Offsetting of Financial Assets and Derivative Assets as of October 31, 2014:
| Gross Amounts* of Assets Presented in Statement of Assets and Liabilities | Financial Instruments with Allowable Netting | Non-cash Collateral Received | Cash Collateral Received | Net Amount (not less than $0) | ||||||||||||||||
| Description | ||||||||||||||||||||
| Futures contracts - variation margin receivable | $ | 88 | $ | — | $ | — | $ | — | $ | 88 | ||||||||||
| Unrealized appreciation on foreign currency contracts | 1,476 | — | — | — | 1,476 | |||||||||||||||
| Total subject to a master netting or similar arrangement | $ | 1,564 | $ | — | $ | — | $ | — | $ | 1,564 | ||||||||||
| * | Gross amounts are presented here as there are no amounts that are netted within the Statement of Assets and Liabilities. |
Offsetting of Financial Liabilities and Derivative Liabilities as of October 31, 2014:
| Gross Amounts* of Liabilities Presented in Statement of Assets and Liabilities | Financial Instruments with Allowable Netting | Non-cash Collateral Pledged | Cash Collateral Pledged | Net Amount (not less than $0) | ||||||||||||||||
| Description | ||||||||||||||||||||
| Futures contracts - variation margin payable | $ | — | $ | — | $ | — | $ | (260 | ) | $ | — | |||||||||
| Unrealized depreciation on foreign currency contracts | 333 | — | — | — | 333 | |||||||||||||||
| Total subject to a master netting or similar arrangement | $ | 333 | $ | — | $ | — | $ | (260 | ) | $ | 333 | |||||||||
| * | Gross amounts are presented here as there are no amounts that are netted within the Statement of Assets and Liabilities. |
Certain derivatives held by the Fund, as of October 31, 2014, are not subject to a master netting arrangement and are excluded from the table above.
Principal Risks:
The Fund may be exposed to counterparty risk, or the risk that an institution or other entity with which the Fund has unsettled or open transactions will default.
If the Fund invests directly in foreign currencies or in securities that trade in, and receive revenues in, foreign currencies, or in derivatives that provide exposure to foreign currencies, it will be subject to the risk that those currencies will decline in value relative to the base currency (U.S. dollars) of the Fund, or, in the case of hedging positions, that the Fund’s base currency will decline in value relative to the currency being hedged. Currency rates in foreign countries may fluctuate significantly over short periods of time for a number of reasons, including changes in interest rates, intervention (or the failure to intervene) by U.S. or foreign governments, central banks or supranational entities, such as the International Monetary Fund, or by the imposition of currency controls or other political developments in the United States or abroad. As a result, the Fund’s investments in foreign currency denominated securities may reduce the returns of the Fund. The market values of equity securities, such as common stocks and preferred stocks, or equity related investments, such as futures and options, may decline due to general market conditions which are not specifically related to a particular company, such as real or perceived adverse economic conditions, changes in the general outlook for corporate earnings, changes in interest or currency rates or adverse investor sentiment generally. The market value of equity securities may also decline due to factors which affect a particular industry or industries, such as labor shortages or increased production costs and competitive conditions within an industry. Equity securities and equity related investments generally have greater market price volatility than fixed income securities.
| 20 |
| The Hartford International Value Fund |
| Notes to Financial Statements – (continued) |
| October 31, 2014 |
| (000’s Omitted) |
Federal Income Taxes:
Federal Income Taxes – For federal income tax purposes, the Fund intends to continue to qualify as a Regulated Investment Company ("RIC") under Subchapter M of the Internal Revenue Code (“IRC”) by distributing substantially all of its taxable net investment income and net realized capital gains to its shareholders and otherwise complying with the requirements of the IRC. The Fund has distributed substantially all of its income and capital gains in prior years, if applicable, and intends to distribute substantially all of its income and capital gains during the calendar year ending December 31, 2014. Accordingly, no provision for federal income or excise taxes has been made in the accompanying financial statements. Distributions from short-term capital gains are treated as ordinary income distributions for federal income tax purposes.
Net Investment Income (Loss), Net Realized Gains (Losses) and Distributions – Net investment income (loss) and net realized gains (losses) may differ for financial statement and tax purposes primarily because of losses deferred due to wash sale adjustments, foreign currency gains and losses, adjustments related to Passive Foreign Investment Companies ("PFICs"), Real Estate Investment Trusts ("REITs"), RICs, certain derivatives and partnerships. The character of distributions made during the year from net investment income or net realized gains may differ from their ultimate characterization for federal income tax purposes. Also, due to the timing of dividend distributions, the fiscal year in which amounts are distributed may differ from the year that the income or realized gains (losses) were recorded by the Fund.
Distributions and Components of Distributable Earnings – The tax character of distributions paid by the Fund for the periods indicated is as follows (as adjusted for dividends payable, if applicable):
| For the Year Ended October 31, 2014 | For the Year Ended October 31, 2013 | |||||||
| Ordinary Income | $ | — | $ | 2,835 | ||||
| Tax Return of Capital | — | 305 | ||||||
As of October 31, 2014, the Fund’s components of distributable earnings (deficit) on a tax basis are as follows:
| Amount | ||||
| Undistributed Ordinary Income | $ | 5,165 | ||
| Accumulated Capital and Other Losses* | (2,491 | ) | ||
| Unrealized Depreciation† | (56,187 | ) | ||
| Total Accumulated Deficit | $ | (53,513 | ) | |
| * | The Fund has capital loss carryforwards that are identified in the Capital Loss Carryforward note that follows. |
| † | Differences between book-basis and tax-basis unrealized appreciation (depreciation) may be attributable to the losses deferred due to wash sale adjustments, foreign currency gains and losses, adjustments related to PFICs, REITs, RICs, certain derivatives and partnerships. |
Reclassification of Capital Accounts – The Fund may record reclassifications in its capital accounts. These reclassifications have no impact on the total net assets of the Fund. The reclassifications are a result of permanent differences between U.S. GAAP and tax accounting for such items as foreign currency, PFICs, expiration or utilization of capital loss carryforwards or net operating losses. Adjustments are made to reflect the impact these items have on current and future distributions to shareholders. Therefore, the source of the Fund’s distributions may be shown in the accompanying Statement of Changes in Net Assets as from undistributed net investment income, from accumulated net realized gains on investments or from capital depending on the type of book and tax differences that exist. For the year ended October 31, 2014, the Fund recorded reclassifications to increase (decrease) the accounts listed below:
| Amount | ||||
| Undistributed Net Investment Income (Loss) | $ | 1,227 | ||
| Accumulated Net Realized Gain (Loss) | (1,227 | ) | ||
| 21 |
| The Hartford International Value Fund |
| Notes to Financial Statements – (continued) |
| October 31, 2014 |
| (000’s Omitted) |
Capital Loss Carryforward – On December 22, 2010, the Regulated Investment Company Modernization Act of 2010 (the “Act”) was enacted, which made changes to the capital loss carryforward rules. The changes are effective for taxable years beginning after the date of enactment. Under the Act, funds are permitted to carry forward capital losses for an unlimited period. However, any losses incurred during those future taxable years will be required to be utilized prior to the losses incurred in pre-enactment taxable years, which carry an expiration date. As a result of this ordering rule, pre-enactment capital loss carryforwards may be more likely to expire unused. Additionally, post-enactment capital loss carryforwards retain their character as either short-term or long-term capital losses rather than being considered all short-term as permitted under prior regulation.
At October 31, 2014 (tax year end), the Fund had capital loss carryforwards for U.S. federal income tax purposes as follows:
| Year of Expiration | Amount | |||
| 2019 | $ | 2,491 | ||
| Total | $ | 2,491 | ||
During the year ended October 31, 2014, the Fund utilized $6,178 of prior year capital loss carryforwards.
During the year ended October 31, 2014, the Fund utilized $3,951 of prior year short term capital loss carryforwards.
Accounting for Uncertainty in Income Taxes – The Fund has adopted financial reporting rules that require the Fund to analyze all open tax years, as defined by the statute of limitations, for all major jurisdictions. Generally, tax authorities can examine all tax returns filed for the last three years. The Fund does not have an examination in progress.
The Fund has reviewed all open tax years and major jurisdictions and concluded that these financial reporting rules had no effect on the Fund’s financial position or results of operations. There is no tax liability resulting from unrecognized tax benefits relating to uncertain income tax positions taken or expected to be taken on the tax return for the fiscal year ended October 31, 2014. The Fund is also not aware of any tax positions for which it is reasonably possible that the total amounts of unrecognized tax benefits will significantly change in the next twelve months.
Expenses:
Investment Management Agreement – Hartford Funds Management Company, LLC ("HFMC") serves as the Fund’s investment manager pursuant to an Investment Management Agreement with the Company. HFMC is an indirect wholly owned subsidiary of The Hartford Financial Services Group, Inc. ("The Hartford"). The investment manager has overall investment supervisory responsibility for the Fund. In addition, the investment manager provides administrative personnel, services, equipment, facilities and office space for proper operation of the Fund. HFMC has contracted with Wellington Management Company, LLP ("Wellington Management") under a sub-advisory agreement for the provision of day-to-day investment management services to the Fund in accordance with the Fund’s investment objective and policies. The Fund pays a fee to the investment manager, a portion of which may be used to compensate Wellington Management.
The schedule below reflects the rates of compensation paid to the investment manager for investment management services rendered as of October 31, 2014; the rates are accrued daily and paid monthly:
| Average Daily Net Assets | Annual Fee |
| On first $500 million | 0.8500% |
| On next $500 million | 0.8000% |
| On next $4 billion | 0.7500% |
| On next $5 billion | 0.7475% |
| Over $10 billion | 0.7450% |
| 22 |
| The Hartford International Value Fund |
| Notes to Financial Statements – (continued) |
| October 31, 2014 |
| (000’s Omitted) |
Accounting Services Agreement – Pursuant to the Fund Accounting Agreement between HFMC and the Company, on behalf of the Fund, HFMC provides accounting services to the Fund and receives monthly compensation based on the Fund’s average daily net assets at the rates set forth below. The Fund’s accounting services fees are accrued daily and paid monthly.
| Average Daily Net Assets | Annual Fee |
| On first $5 billion | 0.018% |
| On next $5 billion | 0.014% |
| Over $10 billion | 0.010% |
Operating Expenses – Allocable expenses incurred by the Company are allocated to each Fund and allocated to classes within the Fund in proportion to the average daily net assets of the Fund and each class, except where allocation of certain expenses is more fairly made directly to the Fund or to specific classes within a Fund. As of October 31, 2014, HFMC contractually limited the total operating expenses of this Fund, exclusive of taxes, interest expense, brokerage commissions, acquired fund fees and expenses and extraordinary expenses, through February 28, 2015 as follows:
| Class A | Class C | Class I | Class R3 | Class R4 | Class R5 | Class Y |
| 1.40% | 2.15% | 1.15% | 1.60% | 1.30% | 1.00% | 0.95% |
Fees Paid Indirectly – The Fund has entered into agreements with State Street Global Markets, LLC and Russell Implementation Services, Inc. to partially recapture non-discounted trade commissions. Such rebates are used to pay a portion of the Fund's expenses. For the year ended October 31, 2014, this amount, if any, is included in the Statement of Operations.
The ratio of expenses to average net assets in the accompanying financial highlights excludes the reduction in expenses related to fees paid indirectly. The annualized expense ratio after waivers for the period listed below reflecting the reduction for fees paid indirectly is as follows:
| Year Ended October 31, 2014 | ||||
| Class A | 1.36 | % | ||
| Class C | 2.04 | |||
| Class I | 1.01 | |||
| Class R3 | 1.60 | |||
| Class R4 | 1.30 | |||
| Class R5 | 1.00 | |||
| Class Y | 0.95 | |||
Distribution and Service Plan for Class A, C, R3 and R4 Shares – Hartford Funds Distributors, LLC ("HFD"), an indirect wholly owned subsidiary of The Hartford, is the principal underwriter and distributor of the Fund. HFD is engaged in distribution activities, which include marketing and distribution of shares through broker/dealers, financing distribution costs and maintaining financial books and records. For the year ended October 31, 2014, HFD received front-end load sales charges of $1,110 and contingent deferred sales charges of $24 from the Fund.
The Fund has adopted a Distribution and Service Plan in accordance with Rule 12b-1 of the 1940 Act to compensate the distributor (HFD) for activities intended to result in the sale and distribution of Class A, C, R3 and R4 shares and for providing services for shareholders. The Rule 12b-1 plan applicable to Class A shares of the Fund provides for payment of a Rule 12b-1 fee of 0.25% of average daily net assets. Some or all of the fee may be used for shareholder servicing expenses with the remainder used for distribution expenses. Under the Class C Plan, the Fund pays the distributor 1.00% of the average daily net assets of Class C shares outstanding, 0.25% of which is intended as a fee for services provided to existing shareholders with the remainder used for distribution expenses. For Class C shares, some or the entire fee may be remitted to broker/dealers for distribution and/or shareholder account services. Class R3 shares have a distribution fee of 0.50% of average daily net assets and Class R4 shares have a distribution fee of 0.25% of average daily net assets. For Class R3 and R4 shares, some or the entire fee may be remitted to
| 23 |
| The Hartford International Value Fund |
| Notes to Financial Statements – (continued) |
| October 31, 2014 |
| (000’s Omitted) |
broker/dealers for distribution and/or shareholder account services. The Fund’s 12b-1 fees are accrued daily and paid monthly or at such other intervals as the Board of Directors may determine.
Other Related Party Transactions – Certain officers of the Fund are directors and/or officers of HFMC and/or The Hartford or its subsidiaries. For the year ended October 31, 2014, a portion of the Fund’s Chief Compliance Officer’s compensation was paid by all of the investment companies in the Hartford fund complex. The portion allocated to the Fund, as represented in other expenses on the Statement of Operations, rounds to zero. Hartford Administrative Services Company (“HASCO”), an indirect wholly-owned subsidiary of The Hartford, provides transfer agent services to the Fund. HASCO has contractually agreed to reimburse any portion of the transfer agency fees over 0.30% of average daily net assets per fiscal year for each class. Any transfer agency fee reimbursement is determined before considering the contractual operating expense limitation. For providing such services, HASCO is compensated on a per account basis that varies by account type, except with respect to Class Y, for which it is compensated based on average daily net assets. The amount paid to HASCO and any related contractual reimbursement amounts, if applicable, can be found in the Statement of Operations. These fees are accrued daily and paid monthly.
Administrative services fees are paid to HASCO for third-party recordkeeping services that are payable as a percentage of net assets in the amount of up to 0.20%, 0.15% and 0.10% for Classes R3, R4 and R5 shares, respectively. The total administrative services fees are shown on the Statement of Operations. These fees are accrued daily and paid monthly.
Affiliate Holdings:
As of October 31, 2014, affiliates of The Hartford had ownership of shares in the Fund as follows:
| Percentage of Class | Percentage of Fund | |||||||
| Class R3 | 65 | % | — | * | ||||
| Class R4 | 73 | — | * | |||||
| Class R5 | 69 | — | * | |||||
| Class Y | — | * | — | * | ||||
As of October 31, 2014, the Fund's shares were owned in aggregate by affiliated fund of funds. Therefore, the Fund may experience relatively large purchases or redemptions of its shares from these affiliated fund of funds. Affiliated fund of funds owned shares in the Fund as follows:
| Percentage of Fund | ||||
| Class Y | 4 | % | ||
| * | Percentage rounds to zero. |
Investment Transactions:
For the year ended October 31, 2014, the cost of purchases and proceeds from sales of investment securities (excluding short-term investments) were as follows:
| Excluding U.S. Government Obligations | U.S. Government Obligations | Total | ||||||||||
| Cost of Purchases | $ | 807,455 | $ | — | $ | 807,455 | ||||||
| Sales Proceeds | 84,294 | — | 84,294 | |||||||||
| 24 |
| The Hartford International Value Fund |
| Notes to Financial Statements – (continued) |
| October 31, 2014 |
| (000’s Omitted) |
Capital Share Transactions:
The following information is for the year ended October 31, 2014, and the year ended October 31, 2013:
| For the Year Ended October 31, 2014 | For the Year Ended October 31, 2013 | |||||||||||||||||||||||||||||||
| Shares Sold | Shares Issued for Reinvested Dividends | Shares Redeemed | Net Increase (Decrease) of Shares | Shares Sold | Shares Issued for Reinvested Dividends | Shares Redeemed | Net Increase (Decrease) of Shares | |||||||||||||||||||||||||
| Class A | ||||||||||||||||||||||||||||||||
| Shares | 10,989 | — | (3,834 | ) | 7,155 | 675 | 33 | (121 | ) | 587 | ||||||||||||||||||||||
| Amount | $ | 167,818 | $ | — | $ | (58,633 | ) | $ | 109,185 | $ | 8,623 | $ | 382 | $ | (1,510 | ) | $ | 7,495 | ||||||||||||||
| Class C | ||||||||||||||||||||||||||||||||
| Shares | 3,771 | — | (229 | ) | 3,542 | 107 | 6 | (6 | ) | 107 | ||||||||||||||||||||||
| Amount | $ | 57,072 | $ | — | $ | (3,341 | ) | $ | 53,731 | $ | 1,416 | $ | 75 | $ | (76 | ) | $ | 1,415 | ||||||||||||||
| Class I | ||||||||||||||||||||||||||||||||
| Shares | 40,177 | — | (4,785 | ) | 35,392 | 123 | 5 | (1 | ) | 127 | ||||||||||||||||||||||
| Amount | $ | 615,369 | $ | — | $ | (70,597 | ) | $ | 544,772 | $ | 1,670 | $ | 56 | $ | (13 | ) | $ | 1,713 | ||||||||||||||
| Class R3 | ||||||||||||||||||||||||||||||||
| Shares | 29 | — | (2 | ) | 27 | 1 | 5 | (2 | ) | 4 | ||||||||||||||||||||||
| Amount | $ | 424 | $ | — | $ | (22 | ) | $ | 402 | $ | 10 | $ | 54 | $ | (20 | ) | $ | 44 | ||||||||||||||
| Class R4 | ||||||||||||||||||||||||||||||||
| Shares | 22 | — | (1 | ) | 21 | — | 5 | — | 5 | |||||||||||||||||||||||
| Amount | $ | 331 | $ | — | $ | (21 | ) | $ | 310 | $ | 1 | $ | 54 | $ | — | $ | 55 | |||||||||||||||
| Class R5 | ||||||||||||||||||||||||||||||||
| Shares | 41 | — | (16 | ) | 25 | — | 5 | — | 5 | |||||||||||||||||||||||
| Amount | $ | 620 | $ | — | $ | (241 | ) | $ | 379 | $ | — | $ | 56 | $ | — | $ | 56 | |||||||||||||||
| Class Y | ||||||||||||||||||||||||||||||||
| Shares | 3,333 | — | (867 | ) | 2,466 | 890 | 211 | (2,705 | ) | (1,604 | ) | |||||||||||||||||||||
| Amount | $ | 52,411 | $ | — | $ | (13,806 | ) | $ | 38,605 | $ | 11,715 | $ | 2,461 | $ | (32,832 | ) | $ | (18,656 | ) | |||||||||||||
| Total | ||||||||||||||||||||||||||||||||
| Shares | 58,362 | — | (9,734 | ) | 48,628 | 1,796 | 270 | (2,835 | ) | (769 | ) | |||||||||||||||||||||
| Amount | $ | 894,045 | $ | — | $ | (146,661 | ) | $ | 747,384 | $ | 23,435 | $ | 3,138 | $ | (34,451 | ) | $ | (7,878 | ) | |||||||||||||
Line of Credit:
The Fund is one of several Hartford Funds that participate in a $500 million committed revolving line of credit facility. The facility is to be used for temporary or emergency purposes. Under the arrangement, the funds are required to own securities having a market value in excess of 300% of the total bank borrowings. The interest rate on borrowings varies depending on the nature of the loan. The facility also requires a fee to be paid based on the amount of the commitment. This commitment fee is allocated to all the funds participating in the line of credit based on the average net assets of the funds. During the year ended October 31, 2014, the Fund did not have any borrowings under this facility.
Pending Legal Proceedings:
On February 25, 2011, Jennifer L. Kasilag, Louis Mellinger, Judith M. Menendez, Jacqueline M. Robinson, and Linda A. Russell filed a derivative lawsuit against Hartford Investment Financial Services, LLC (“HIFSCO”) (now known as HFD) on behalf of six Hartford retail mutual funds in the United States District Court for the District of New Jersey, alleging that HIFSCO received excessive advisory and distribution fees in violation of its statutory fiduciary duty under Section 36(b) of the 1940 Act when serving as investment manager and principal underwriter, respectively, to the Hartford retail mutual funds. Although this action was purportedly filed on behalf of certain of the Hartford Funds, none of the Hartford Funds is itself a defendant to the suit. HIFSCO moved to dismiss and, in September 2011, the motion was granted in part and denied in part, with leave to amend the complaint. In November 2011, plaintiffs filed an amended complaint on behalf of certain Hartford retail mutual funds, The Hartford Global Health Fund (now known as The Hartford Healthcare Fund), The Hartford Conservative Allocation Fund, The Hartford Growth Opportunities Fund, The Hartford Inflation Plus Fund, The Hartford Advisers Fund (now known as The Hartford Balanced Fund), and The Hartford Capital Appreciation Fund. Plaintiffs seek to rescind the investment management agreements and distribution plans between HIFSCO and these funds and to recover the total fees charged thereunder or, in the alternative, to recover any improper compensation HIFSCO received, in addition to lost earnings. HIFSCO filed a partial motion to
| 25 |
| The Hartford International Value Fund |
| Notes to Financial Statements – (continued) |
| October 31, 2014 |
| (000’s Omitted) |
dismiss the amended complaint and, in December 2012, the court dismissed without prejudice the claims regarding distribution fees and denied the motion with respect to the advisory fees claims. HIFSCO disputes the allegations and intends to defend vigorously.
In March 2014, the plaintiffs filed a new complaint that added as new plaintiffs The Hartford Floating Rate Fund and The Hartford Small Company Fund and named as a defendant HFMC, which assumed the role as investment manager to the funds as of January 2013. HFMC and HIFSCO dispute the allegations and intend to defend vigorously.
No accrual for litigation relating to this matter has been recorded in the financial statements of the Fund because the Fund is not party to the suit.
Indemnifications:
Under the Company's organizational documents, the Company shall indemnify its officers and directors to the full extent required or permitted under Maryland General Corporation Law and the federal securities laws. In addition, the Company, on behalf of the Fund, may enter into contracts that contain a variety of indemnifications. The Company's maximum exposure under these arrangements is unknown. However, as of the date of these financial statements, the Company has not had prior claims or losses pursuant to these contracts and expects the risk of loss to be remote.
Subsequent Events:
Effective on the close of business on November 28, 2014, the Fund is closed to new investors until further notice. For more information, please see the Fund’s prospectus.
Effective December 1, 2014, pursuant to a sub-transfer agency agreement between HASCO and Boston Financial Data Services, Inc. (“BFDS”), HASCO has delegated certain transfer agent, dividend disbursing agent and shareholder servicing agent functions to BFDS. The costs and expenses of such delegation are borne by HASCO, not by the Fund.
| 26 |
| The Hartford International Value Fund |
| Financial Highlights |
| - Selected Per-Share Data - (A) | - Ratios and Supplemental Data - | |||||||||||||||||||||||||||||||||||||||||||||||||||
| Class | Net Asset Value at Beginning of Period | Net Investment Income (Loss) | Net Realized and Unrealized Gain (Loss) on Invest- ments | Total from Investment Operations | Dividends from Net Investment Income | Distribu- tions from Realized Capital Gains | Total Dividends and Distributions | Net Asset Value at End of Period | Total Return(B) | Net Assets at End of Period (000's) | Ratio of Expenses to Average Net Assets Before Adjust- ments(C) | Ratio of Expenses to Average Net Assets After Adjust- ments(C) | Ratio of Net Investment Income (Loss) to Average Net Assets | |||||||||||||||||||||||||||||||||||||||
| For the Year Ended October 31, 2014 | ||||||||||||||||||||||||||||||||||||||||||||||||||||
| A | $ | 14.22 | $ | 0.14 | $ | 0.01 | $ | 0.15 | $ | – | $ | – | $ | – | $ | 14.37 | 1.05 | % | $ | 116,268 | 1.37 | % | 1.36 | % | 0.94 | % | ||||||||||||||||||||||||||
| C | 14.11 | 0.03 | 0.02 | 0.05 | – | – | – | 14.16 | 0.35 | 52,779 | 2.05 | 2.04 | 0.19 | |||||||||||||||||||||||||||||||||||||||
| I | 14.29 | 0.18 | 0.02 | 0.20 | – | – | – | 14.49 | 1.40 | 515,604 | 1.02 | 1.01 | 1.20 | |||||||||||||||||||||||||||||||||||||||
| R3 | 14.22 | 0.10 | 0.01 | 0.11 | – | – | – | 14.33 | 0.77 | 1,223 | 1.70 | 1.60 | 0.66 | |||||||||||||||||||||||||||||||||||||||
| R4 | 14.26 | 0.15 | 0.01 | 0.16 | – | – | – | 14.42 | 1.12 | 1,111 | 1.39 | 1.30 | 0.96 | |||||||||||||||||||||||||||||||||||||||
| R5 | 14.30 | 0.21 | (0.01 | ) | 0.20 | – | – | – | 14.50 | 1.40 | 1,185 | 1.08 | 1.00 | 1.37 | ||||||||||||||||||||||||||||||||||||||
| Y | 14.54 | 0.19 | 0.02 | 0.21 | – | – | – | 14.75 | 1.44 | 47,264 | 0.96 | 0.95 | 1.26 | |||||||||||||||||||||||||||||||||||||||
| For the Year Ended October 31, 2013 | ||||||||||||||||||||||||||||||||||||||||||||||||||||
| A | $ | 11.83 | $ | 0.21 | $ | 3.22 | $ | 3.43 | $ | (1.04 | )(D) | $ | – | $ | (1.04 | ) | $ | 14.22 | 30.95 | % | $ | 13,315 | 1.91 | % | 1.40 | % | 1.67 | % | ||||||||||||||||||||||||
| C | 11.75 | 0.12 | 3.20 | 3.32 | (0.96 | )(E) | – | (0.96 | ) | 14.11 | 30.00 | 2,604 | 2.57 | 2.11 | 0.91 | |||||||||||||||||||||||||||||||||||||
| I | 11.89 | 0.25 | 3.24 | 3.49 | (1.09 | )(F) | – | (1.09 | ) | 14.29 | 31.36 | 2,558 | 1.48 | 1.02 | 1.93 | |||||||||||||||||||||||||||||||||||||
| R3 | 11.83 | 0.21 | 3.20 | 3.41 | (1.02 | )(D) | – | (1.02 | ) | 14.22 | 30.67 | 823 | 2.17 | 1.60 | 1.63 | |||||||||||||||||||||||||||||||||||||
| R4 | 11.86 | 0.24 | 3.21 | 3.45 | (1.05 | )(D) | – | (1.05 | ) | 14.26 | 31.06 | 801 | 1.86 | 1.30 | 1.93 | |||||||||||||||||||||||||||||||||||||
| R5 | 11.89 | 0.28 | 3.22 | 3.50 | (1.09 | )(F) | – | (1.09 | ) | 14.30 | 31.44 | 809 | 1.56 | 1.00 | 2.23 | |||||||||||||||||||||||||||||||||||||
| Y | 11.91 | 0.23 | 3.50 | 3.73 | (1.10 | )(F) | – | (1.10 | ) | 14.54 | 33.53 | 10,725 | 1.27 | 0.81 | 1.86 | |||||||||||||||||||||||||||||||||||||
| For the Year Ended October 31, 2012 | ||||||||||||||||||||||||||||||||||||||||||||||||||||
| A | $ | 11.28 | $ | 0.18 | $ | 0.45 | $ | 0.63 | $ | (0.08 | ) | $ | – | $ | (0.08 | ) | $ | 11.83 | 5.68 | % | $ | 4,126 | 1.57 | % | 1.40 | % | 1.64 | % | ||||||||||||||||||||||||
| C | 11.19 | 0.10 | 0.46 | 0.56 | – | – | – | 11.75 | 5.00 | 901 | 2.18 | 2.09 | 0.94 | |||||||||||||||||||||||||||||||||||||||
| I | 11.32 | 0.23 | 0.45 | 0.68 | (0.11 | ) | – | (0.11 | ) | 11.89 | 6.14 | 615 | 1.09 | 1.00 | 2.02 | |||||||||||||||||||||||||||||||||||||
| R3 | 11.26 | 0.16 | 0.45 | 0.61 | (0.04 | ) | – | (0.04 | ) | 11.83 | 5.47 | 641 | 1.80 | 1.60 | 1.41 | |||||||||||||||||||||||||||||||||||||
| R4 | 11.29 | 0.19 | 0.46 | 0.65 | (0.08 | ) | – | (0.08 | ) | 11.86 | 5.80 | 611 | 1.49 | 1.30 | 1.72 | |||||||||||||||||||||||||||||||||||||
| R5 | 11.32 | 0.23 | 0.45 | 0.68 | (0.11 | ) | – | (0.11 | ) | 11.89 | 6.15 | 615 | 1.19 | 1.00 | 2.02 | |||||||||||||||||||||||||||||||||||||
| Y | 11.34 | 0.28 | 0.42 | 0.70 | (0.13 | ) | – | (0.13 | ) | 11.91 | 6.32 | 27,906 | 1.01 | 0.92 | 2.50 | |||||||||||||||||||||||||||||||||||||
| For the Year Ended October 31, 2011 | ||||||||||||||||||||||||||||||||||||||||||||||||||||
| A | $ | 11.82 | $ | 0.18 | $ | (0.45 | ) | $ | (0.27 | ) | $ | (0.02 | ) | $ | (0.25 | ) | $ | (0.27 | ) | $ | 11.28 | (2.37 | )% | $ | 3,629 | 1.69 | % | 1.34 | % | 1.50 | % | |||||||||||||||||||||
| C | 11.79 | 0.09 | (0.44 | ) | (0.35 | ) | – | (0.25 | ) | (0.25 | ) | 11.19 | (3.10 | ) | 859 | 2.37 | 2.02 | 0.74 | ||||||||||||||||||||||||||||||||||
| I | 11.84 | 0.22 | (0.45 | ) | (0.23 | ) | (0.04 | ) | (0.25 | ) | (0.29 | ) | 11.32 | (2.07 | ) | 621 | 1.34 | 1.00 | 1.85 | |||||||||||||||||||||||||||||||||
| R3 | 11.81 | 0.15 | (0.45 | ) | (0.30 | ) | – | (0.25 | ) | (0.25 | ) | 11.26 | (2.67 | ) | 597 | 2.05 | 1.60 | 1.22 | ||||||||||||||||||||||||||||||||||
| R4 | 11.82 | 0.18 | (0.45 | ) | (0.27 | ) | (0.01 | ) | (0.25 | ) | (0.26 | ) | 11.29 | (2.34 | ) | 577 | 1.74 | 1.30 | 1.52 | |||||||||||||||||||||||||||||||||
| R5 | 11.84 | 0.22 | (0.46 | ) | (0.24 | ) | (0.03 | ) | (0.25 | ) | (0.28 | ) | 11.32 | (2.09 | ) | 580 | 1.44 | 1.00 | 1.82 | |||||||||||||||||||||||||||||||||
| Y | 11.84 | 0.20 | (0.41 | ) | (0.21 | ) | (0.04 | ) | (0.25 | ) | (0.29 | ) | 11.34 | (1.90 | ) | 130,450 | 1.10 | 0.76 | 1.70 | |||||||||||||||||||||||||||||||||
See Portfolio Turnover information on the next page.
| 27 |
| The Hartford International Value Fund |
| Financial Highlights – (continued) |
| - Selected Per-Share Data - (A) | - Ratios and Supplemental Data - | |||||||||||||||||||||||||||||||||||||||||||||||||||
| Class | Net Asset Value at Beginning of Period | Net Investment Income (Loss) | Net Realized and Unrealized Gain (Loss) on Invest- ments | Total from Investment Operations | Dividends from Net Investment Income | Distribu- tions from Realized Capital Gains | Total Dividends and Distributions | Net Asset Value at End of Period | Total Return(B) | Net Assets at End of Period (000's) | Ratio of Expenses to Average Net Assets Before Adjust- ments(C) | Ratio of Expenses to Average Net Assets After Adjust- ments(C) | Ratio of Net Investment Income (Loss) to Average Net Assets | |||||||||||||||||||||||||||||||||||||||
| From May 28, 2010 (commencement of operations), through October 31, 2010 (G) | ||||||||||||||||||||||||||||||||||||||||||||||||||||
| A(H) | $ | 10.00 | $ | 0.02 | $ | 1.80 | $ | 1.82 | $ | – | $ | – | $ | – | $ | 11.82 | 18.20 | %(I) | $ | 1,765 | 3.05 | %(J) | 1.27 | %(J) | 0.50 | %(J) | ||||||||||||||||||||||||||
| C(H) | 10.00 | (0.01 | ) | 1.80 | 1.79 | – | – | – | 11.79 | 17.90 | (I) | 695 | 3.76 | (J) | 1.98 | (J) | (0.28 | )(J) | ||||||||||||||||||||||||||||||||||
| I(H) | 10.00 | 0.03 | 1.81 | 1.84 | – | – | – | 11.84 | 18.40 | (I) | 601 | 2.75 | (J) | 0.97 | (J) | 0.67 | (J) | |||||||||||||||||||||||||||||||||||
| R3(H) | 10.00 | – | 1.81 | 1.81 | – | – | – | 11.81 | 18.10 | (I) | 609 | 3.45 | (J) | 1.62 | (J) | 0.02 | (J) | |||||||||||||||||||||||||||||||||||
| R4(H) | 10.00 | 0.01 | 1.81 | 1.82 | – | – | – | 11.82 | 18.20 | (I) | 591 | 3.15 | (J) | 1.32 | (J) | 0.33 | (J) | |||||||||||||||||||||||||||||||||||
| R5(H) | 10.00 | 0.03 | 1.81 | 1.84 | – | – | – | 11.84 | 18.40 | (I) | 592 | 2.85 | (J) | 1.02 | (J) | 0.63 | (J) | |||||||||||||||||||||||||||||||||||
| Y(H) | 10.00 | 0.03 | 1.81 | 1.84 | – | – | – | 11.84 | 18.40 | (I) | 1,777 | 2.75 | (J) | 0.97 | (J) | 0.68 | (J) | |||||||||||||||||||||||||||||||||||
| (A) | Information presented relates to a share outstanding throughout the indicated period. Net investment income (loss) per share amounts are calculated based on average shares outstanding unless otherwise noted. |
| (B) | Assumes initial investment at net asset value at the beginning of each period, reinvestment of all distributions, the complete redemption of the investment at net asset value at the end of each period and no sales charge. Total return would be reduced if sales charges were taken into account. |
| (C) | Adjustments include waivers and reimbursements, if applicable. Ratios do not include fees paid indirectly (see Expenses in the accompanying Notes to Financial Statements). |
| (D) | Included in this amount are tax distributions from capital of ($0.10). |
| (E) | Included in this amount are tax distributions from capital of ($0.09). |
| (F) | Included in this amount are tax distributions from capital of ($0.11). |
| (G) | Net investment income (loss) per share amounts have been calculated using the SEC method. |
| (H) | Commenced operations on May 28, 2010. |
| (I) | Not annualized. |
| (J) | Annualized. |
| Portfolio Turnover Rate for All Share Classes | ||||
| For the Year Ended October 31, 2014 | 31 | % | ||
| For the Year Ended October 31, 2013 | 253 | |||
| For the Year Ended October 31, 2012 | 137 | |||
| For the Year Ended October 31, 2011 | 112 | |||
| From May 28, 2010 (commencement of operations) through October 31, 2010 | 47 | (A) | ||
| (A) | Not annualized. |
| 28 |
| Report of Independent Registered Public Accounting Firm |
| The Board of Directors and Shareholders of |
| The Hartford Mutual Funds, Inc. |
We have audited the accompanying statement of assets and liabilities, including the schedule of investments, of The Hartford International Value Fund (one of the portfolios constituting The Hartford Mutual Funds, Inc. (the Funds)) as of October 31, 2014, and the related statement of operations for the year then ended, the statements of changes in net assets for each of the two years in the period then ended, and the financial highlights for the periods indicated therein. These financial statements and financial highlights are the responsibility of the Funds’ management. Our responsibility is to express an opinion on these financial statements and financial highlights based on our audits.
We conducted our audits in accordance with the standards of the Public Company Accounting Oversight Board (United States). Those standards require that we plan and perform the audit to obtain reasonable assurance about whether the financial statements and financial highlights are free of material misstatement. We were not engaged to perform an audit of the Funds’ internal control over financial reporting. Our audits included consideration of internal control over financial reporting as a basis for designing audit procedures that are appropriate in the circumstances, but not for the purpose of expressing an opinion on the effectiveness of the Funds’ internal control over financial reporting. Accordingly, we express no such opinion. An audit also includes examining, on a test basis, evidence supporting the amounts and disclosures in the financial statements and financial highlights, assessing the accounting principles used and significant estimates made by management, and evaluating the overall financial statement presentation. Our procedures included confirmation of securities owned as of October 31, 2014, by correspondence with the custodian and brokers or by other appropriate auditing procedures where replies from brokers were not received. We believe that our audits provide a reasonable basis for our opinion.
In our opinion, the financial statements and financial highlights referred to above present fairly, in all material respects, the financial position of The Hartford International Value Fund of The Hartford Mutual Funds, Inc. at October 31, 2014, the results of its operations for the year then ended, the changes in its net assets for each of the two years in the period then ended, and the financial highlights for the periods indicated therein, in conformity with U.S. generally accepted accounting principles.
| |
| Minneapolis, Minnesota December 18, 2014 |
| 29 |
| The Hartford International Value Fund |
| Directors and Officers (Unaudited) |
The Board of Directors of the Company (the "Directors") appoints officers who are responsible for the day-to-day operations of the Fund and who execute policies formulated by the Directors. Each Director serves until his or her death, resignation, or retirement or until the next annual meeting of shareholders is held or until his or her successor is elected and qualifies.
Directors and officers who are employed by or who have a financial interest in The Hartford Financial Services Group, Inc. ("The Hartford") are considered “interested” persons of the Fund pursuant to the 1940 Act. Each officer and two of the Company's Directors, as noted in the chart below, are “interested” persons of the Fund. Each Director serves as a director for The Hartford Mutual Funds, Inc., The Hartford Mutual Funds II, Inc., Hartford Series Fund, Inc., and Hartford HLS Series Fund II, Inc., and as a trustee for The Hartford Alternative Strategies Fund, which, as of October 31, 2014, collectively consist of 66 funds. Correspondence may be sent to Directors and officers c/o Hartford Funds, 5 Radnor Corporate Center, Suite 300, 100 Matsonford Road, Radnor, Pennsylvania 19087, except that correspondence to Mr. Annoni, Mr. Dressen and Ms. Quade may be sent to 500 Bielenberg Drive, Suite 500, Woodbury, Minnesota 55125.
The table below sets forth, for each Director and officer, his or her name, year of birth, current position with the Company and date first elected or appointed to The Hartford Mutual Funds, Inc. ("MF") and The Hartford Mutual Funds II, Inc. ("MF2"), principal occupation, and, for Directors, other directorships held. The Fund’s Statement of Additional Information contains further information on the Directors and is available free of charge by calling 1-888-843-7824 or writing to: Hartford Funds, P.O. Box 55022, Boston, MA 02205-5022.
Information on the aggregate remuneration paid to the directors of the Company can be found in the Statement of Operations herein. The Fund pays to The Hartford a portion of the Chief Compliance Officer’s compensation, but does not pay salaries or compensation to any of its other officers or Directors who are employed by The Hartford.
Non-Interested Directors
Hilary E. Ackermann (1956) Director since September 23, 2014
Ms. Ackermann served as Chief Risk Officer at Goldman Sachs Bank USA from October 2008 to November 2011 and serves as a Director of Dynegy, Inc., an independent power company, from October 2012 to present.
Lynn S. Birdsong (1946) Director since 2003, Chairman of the Investment Committee since 2014
Mr. Birdsong is a private investor. Mr. Birdsong currently serves as a Director of the Sovereign High Yield Investment Company (April 2010 to current). Mr. Birdsong currently serves as an Independent Director of Nomura Partners Funds, Inc. (formerly, The Japan Fund) (April 2003 to current). From 2003 to March 2005, Mr. Birdsong was an Independent Director of the Atlantic Whitehall Funds. From 1979 to 2002, Mr. Birdsong was a Managing Director of Zurich Scudder Investments, an investment management firm. During his employment with Scudder, Mr. Birdsong was an Interested Director of The Japan Fund. From January 1981 through December 2013, Mr. Birdsong was a partner in Birdsong Company, an advertising specialty firm.
Robert M. Gavin, Jr. (1940) Director since 2002 (MF) and 1986 (MF2), Chairman of the Board for each since 2004
Dr. Gavin is an educational consultant. Prior to September 1, 2001, he was President of Cranbrook Education Community and prior to July 1996, he was President of Macalester College, St. Paul, Minnesota.
Duane E. Hill (1945) Director since 2001 (MF) and 2002 (MF2), Chairman of the Nominating Committee since 2003
Mr. Hill is a Partner of TSG Ventures L.P., a private equity investment company. Mr. Hill is a former partner of TSG Capital Group, a private equity investment firm that served as sponsor and lead investor in leveraged buyouts of middle market companies.
Sandra S. Jaffee (1941) Director since 2005
Ms. Jaffee is the founder and Chief Executive Officer of a private company, Homeworks Concierge, LLC, which provides residential property management services in Westchester County, New York (January 2012 to present). Ms. Jaffee served as Chairman (2008 to 2009) and Chief Executive Officer of Fortent (formerly Searchspace Group), a leading provider of compliance/regulatory technology to financial institutions from August 2005 to August 2009. From August 2004 to August 2005, Ms. Jaffee served as an Entrepreneur in Residence with Warburg Pincus, a private equity firm. Prior to joining Warburg Pincus, Ms. Jaffee served as Executive Vice President at Citigroup, from September 1995 to July 2004, where she was President and Chief Executive Officer of Citibank’s Global Securities Services (1995 to 2003). Ms. Jaffee currently serves as a member of the Board of Directors of Broadridge Financial Solutions as well as a Trustee of Muhlenberg College.
| 30 |
| The Hartford International Value Fund |
| Directors and Officers (Unaudited) – (continued) |
William P. Johnston (1944) Director since 2005, Chairman of the Compliance Committee since 2005
In June 2006, Mr. Johnston was appointed as Senior Advisor to The Carlyle Group, a global private equity and other alternative asset investment firm and currently serves as an Operating Executive. In July 2006, Mr. Johnston was elected to the Board of Directors of MultiPlan, Inc. and served as a Director (July 2006 to August 2010). In August 2007, Mr. Johnston was elected to the Board of Directors of LifeCare Holdings, Inc. and served as a Director (August 2007 to June 2013). In February 2008, Mr. Johnston was elected to the Board of Directors of HCR-ManorCare, Inc. In May 2006, Mr. Johnston was elected to the Supervisory Board of Fresenius Medical Care AG & Co. KGaA, after its acquisition of Renal Care Group, Inc. in March 2006. Mr. Johnston joined Renal Care Group in November 2002 as a member of the Board of Directors and served as Chairman of the Board from March 2003 through March 2006. From 2002 through 2013, Mr. Johnston served as a Board member of the Georgia O’Keefe Museum. From September 1987 to December 2002, Mr. Johnston was with Equitable Securities Corporation (and its successors, SunTrust Equitable Securities and SunTrust Robinson Humphrey) serving in various investment banking and managerial positions, including Managing Director and Head of Investment Banking, Chief Executive Officer and Vice Chairman.
Phillip O. Peterson (1944) Director since 2002 (MF) and 2000 (MF2), Chairman of the Audit Committee since 2002
Mr. Peterson is a mutual fund industry consultant. He was a partner of KPMG LLP (an accounting firm) until July 1999. Mr. Peterson joined William Blair Funds in February 2007 as a member of the Board of Trustees. From February 2012 to February 2014, Mr. Peterson served as a Trustee of Symetra Variable Mutual Funds. From January 2004 to April 2005, Mr. Peterson served as Independent President of the Strong Mutual Funds.
Lemma W. Senbet (1946) Director since 2005
Dr. Senbet is the William E. Mayer Chair Professor of Finance and Founding Director, Center for Financial Policy, at the University of Maryland, Robert H. Smith School of Business. He was chair of the Finance Department of the University of Maryland, Robert H. Smith School of Business from 1998 to 2006. Since June 2013, he has been on leave from the University to serve as Executive Director of African Economic Research Consortium which focuses on economic policy research and training. Previously, he was a chaired professor of finance at the University of Wisconsin-Madison. Also, he was a Director of the Fortis Funds from March 2000 to July 2002. Dr. Senbet served as Director of the American Finance Association and President of the Western Finance Association. In 2006, Dr. Senbet was inducted Fellow of Financial Management Association International for his career-long distinguished scholarship and professional service.
Interested Directors and Officers
James E. Davey (1964) Director since 2012, President and Chief Executive Officer since 2010
Mr. Davey serves as Executive Vice President of Hartford Life Insurance Company (“HLIC”) and The Hartford. Additionally, Mr. Davey serves as Chairman of the Board, Manager and Senior Managing Director of Hartford Funds Distributors, LLC (“HFD”). He also currently serves as Director, Chairman of the Board, President and Senior Managing Director of Hartford Administrative Services Company (“HASCO”). Mr. Davey also serves as Manager, Chairman of the Board and Senior Managing Director for Hartford Funds Management Company, LLC (“HFMC”) and Director, Chairman of the Board and Senior Managing Director for Hartford Funds Management Group, Inc. ("HFMG"). Mr. Davey has served in various positions within The Hartford and its subsidiaries in connection with the operation of the Hartford Funds. Mr. Davey joined The Hartford in 2002.
Lowndes A. Smith* (1939) Director since 1996 (MF) and 2002 (MF2)
Mr. Smith served as Vice Chairman of The Hartford from February 1997 to January 2002, as President and Chief Executive Officer of Hartford Life, Inc. from February 1997 to January 2002, and as President and Chief Operating Officer of The Hartford Life Insurance Companies from January 1989 to January 2002. Mr. Smith serves as a Director of White Mountains Insurance Group Ltd. (October 2003 to current); One Beacon Insurance (October 2006 to current); Symetra Financial (August 2007 to current) and is a Managing Director of Whittington Gray Associates (January 2007 to current).
* Mr. Smith resigned as a Director of MF, MF2, Hartford Series Fund, Inc. and Hartford HLS Series Fund II, Inc. and as a Trustee of The Hartford Alternative Strategies Fund effective September 17, 2014.
Other Officers
Mark A. Annoni (1964) Vice President, Controller and Treasurer since 2012
Mr. Annoni currently serves as the Assistant Vice President of HLIC (February 2004 to present) and Senior Vice President of HFMG (December 2013 to present). Mr. Annoni has served in various positions within The Hartford and its subsidiaries in connection with the operation of the Hartford Funds. Mr. Annoni joined The Hartford in 2001.
| 31 |
| The Hartford International Value Fund |
| Directors and Officers (Unaudited) – (continued) |
Michael R. Dressen (1963) AML Compliance Officer since 2011
Mr. Dressen currently serves as Assistant Vice President of HLIC. He also serves as Chief Compliance Officer and AML Compliance Officer of HASCO and as AML Officer of HFD. Mr. Dressen has served in various positions within The Hartford and its subsidiaries in connection with the operation of the Hartford Funds.
Edward P. Macdonald (1967) Vice President, Secretary and Chief Legal Officer since 2005
Mr. Macdonald currently serves as Assistant Secretary, Executive Vice President and Deputy General Counsel of HFD, HASCO, HFMC and HFMG. He also serves as Vice President of HLIC. Mr. Macdonald has served in various positions within The Hartford and its subsidiaries in connection with the operation of the Hartford Funds. Mr. Macdonald joined The Hartford in 2005.
Joseph G. Melcher (1973) Vice President and Chief Compliance Officer since 2013
Mr. Melcher currently serves as Executive Vice President of HFD, HFMG and HASCO. Mr. Melcher also currently serves as Executive Vice President and Chief Compliance Officer of HFMC. Mr. Melcher has served in various positions within The Hartford and its subsidiaries in connection with the operation of the Hartford Funds since joining The Hartford in 2012. Prior to joining The Hartford, Mr. Melcher worked at Touchstone Investments, a member of the Western & Southern Financial Group, where he held the position of Vice President and Chief Compliance Officer from 2010 through 2012 and Assistant Vice President, Compliance from 2005 to 2010.
Vernon J. Meyer (1964) Vice President since 2006
Mr. Meyer currently serves as Senior Vice President of HLIC. He also currently serves as Managing Director and Chief Investment Officer of HFMC and Managing Director of HFMG. Mr. Meyer has served in various positions within The Hartford and its subsidiaries in connection with the operation of the Hartford Funds. Mr. Meyer joined The Hartford in 2004.
Laura S. Quade (1969) Vice President since 2012
Ms. Quade currently serves as Vice President of HASCO, HFD and HFMG. She is the Head of Operations of HASCO and formerly served as Director, Enterprise Operations of HLIC. Ms. Quade has served in various positions within The Hartford and its subsidiaries in connection with the operation of the Hartford Funds. Ms. Quade joined The Hartford in 2001.
Martin A. Swanson** (1962) Vice President since 2010
Mr. Swanson currently serves as Vice President of HLIC. Mr. Swanson also serves as Managing Director, Chief Marketing Officer and Principal of HFD and Managing Director of HFMG. Mr. Swanson has served in various positions within The Hartford and its subsidiaries in connection with the operation of the Hartford Funds.
** Mr. Swanson resigned as an officer effective November 6, 2014.
HOW TO OBTAIN A COPY OF THE FUND’S PROXY VOTING POLICIES AND VOTING RECORDS (UNAUDITED)
A description of the policies and procedures that the Fund uses to determine how to vote proxies relating to portfolio securities and information about how the Fund voted proxies relating to portfolio securities during the most recent twelve-month period ended June 30 are available (1) without charge, upon request, by calling 888-843-7824 and (2) on the SEC’s website at http://www.sec.gov.
QUARTERLY PORTFOLIO HOLDINGS INFORMATION (UNAUDITED)
The Fund files a complete schedule of portfolio holdings with the SEC for the first and third quarters of each fiscal year on Form N-Q. The Fund’s Forms N-Q are available (1) without charge, upon request, by calling 888-843-7824 and (2) on the SEC’s website at http://www.sec.gov. The Form N-Q may be reviewed and copied at the SEC’s Public Reference Room in Washington, DC. Information on the operation of the Public Reference Room may be obtained by calling 1-800-SEC-0330.
| 32 |
| The Hartford International Value Fund |
| Federal Tax Information (Unaudited) |
For the fiscal year ended October 31, 2014, there is no further federal tax information required for this Fund.
| 33 |
| The Hartford International Value Fund |
| Expense Example (Unaudited) |
Your Fund's Expenses
As a shareholder of the Fund, you incur two types of costs: (1) transaction costs, including sales charges (loads) on purchase payments, if any, and contingent deferred sales charges (CDSC), if any, and (2) ongoing costs, including investment management fees, distribution and/or service (12b-1) fees, if any, and other fund expenses. This example is intended to help you understand your ongoing costs (in dollars) of investing in the Fund and to compare these costs with the ongoing costs of investing in other mutual funds. The example is based on an investment of $1,000 invested at the beginning of the period and held for the entire period of April 30, 2014 through October 31, 2014.
Actual Expenses
The first set of columns of the table below provides information about actual account values and actual expenses. You may use the information in this column, together with the amount you invested, to estimate the expenses that you paid over the period. Simply divide your account value by $1,000 (for example, an $8,600 account value divided by $1,000 = 8.6), then multiply the result by the number in the line under the heading entitled “Expenses Paid During Period” to estimate the expenses you paid on your account during this period.
Hypothetical Example for Comparison Purposes
The second set of columns of the table below provides information about hypothetical account values and hypothetical expenses based on the Fund's actual expense ratio and an assumed rate of return of 5% per year before expenses, which is not the Fund's actual return. The hypothetical account values and expenses may not be used to estimate the actual ending account balance or expenses you paid for the period. You may use this information to compare the ongoing costs of investing in the Fund and other funds. To do so, compare this 5% hypothetical example with the 5% hypothetical examples that appear in the shareholder reports of the other funds.
Please note that the expenses shown in the table are meant to highlight your ongoing costs only and do not reflect any transactional costs, such as sales charges (loads) and CDSC. Therefore, the second set of columns of the table is useful in comparing ongoing costs only, and will not help you determine the relative total costs of owning different funds. In addition, if these transactional costs were included, your costs would be higher. Expenses are equal to the Fund's annualized expense ratios multiplied by average account value over the period, multiplied by 184/365 (to reflect the one-half year period).
| Actual return | Hypothetical (5% return before expenses) | |||||||||||||||||||||||||||||||||||
| Beginning Account Value April 30, 2014 | Ending Account Value October 31, 2014 | Expenses paid during the period April 30, 2014 through October 31, 2014 | Beginning Account Value April 30, 2014 | Ending Account Value October 31, 2014 | Expenses paid during the period April 30, 2014 through October 31, 2014 | Annualized expense ratio | Days in the current 1/2 year | Days in the full year | ||||||||||||||||||||||||||||
| Class A | $ | 1,000.00 | $ | 938.00 | $ | 6.58 | $ | 1,000.00 | $ | 1,018.42 | $ | 6.85 | 1.35 | % | 184 | 365 | ||||||||||||||||||||
| Class C | $ | 1,000.00 | $ | 934.00 | $ | 9.93 | $ | 1,000.00 | $ | 1,014.94 | $ | 10.34 | 2.04 | 184 | 365 | |||||||||||||||||||||
| Class I | $ | 1,000.00 | $ | 939.10 | $ | 4.94 | $ | 1,000.00 | $ | 1,020.11 | $ | 5.15 | 1.01 | 184 | 365 | |||||||||||||||||||||
| Class R3 | $ | 1,000.00 | $ | 936.00 | $ | 7.80 | $ | 1,000.00 | $ | 1,017.14 | $ | 8.13 | 1.60 | 184 | 365 | |||||||||||||||||||||
| Class R4 | $ | 1,000.00 | $ | 938.20 | $ | 6.35 | $ | 1,000.00 | $ | 1,018.65 | $ | 6.61 | 1.30 | 184 | 365 | |||||||||||||||||||||
| Class R5 | $ | 1,000.00 | $ | 939.10 | $ | 4.89 | $ | 1,000.00 | $ | 1,020.17 | $ | 5.09 | 1.00 | 184 | 365 | |||||||||||||||||||||
| Class Y | $ | 1,000.00 | $ | 939.50 | $ | 4.49 | $ | 1,000.00 | $ | 1,020.57 | $ | 4.68 | 0.92 | 184 | 365 | |||||||||||||||||||||
| 34 |
| The Hartford International Value Fund |
| Approval of Investment Management and Investment Sub-Advisory Agreements (Unaudited) |
Section 15(c) of the Investment Company Act of 1940, as amended (the “1940 Act”), requires that each mutual fund’s board of directors, including a majority of those directors who are not “interested persons” of the mutual fund, as defined in the 1940 Act (the “Independent Directors”), annually review and consider the continuation of the mutual fund’s investment advisory and sub-advisory agreements. At its meeting held on August 5-6, 2014, the Board of Directors (the “Board”) of The Hartford Mutual Funds, Inc., including each of the Independent Directors, unanimously voted to approve the continuation of the investment management agreement for The Hartford International Value Fund (the “Fund”) with Hartford Funds Management Company, LLC (“HFMC”) and the continuation of the investment sub-advisory agreement between HFMC and the Fund’s sub-adviser, Wellington Management Company, LLP (the “Sub-adviser,” and together with HFMC, the “Advisers”) (collectively, the “Agreements”).
In the months preceding the August 5-6, 2014 meeting, the Board requested, received and reviewed written responses from the Advisers to questions posed to them on behalf of the Independent Directors and supporting materials relating to those questions and responses. The Board considered information furnished to the Board at its meetings throughout the year, as well as information specifically prepared in connection with the annual approval of the Agreements at the Board’s meetings held on June 17-18, 2014 and August 5-6, 2014. Information provided to the Board at its meetings throughout the year included, among other things, reports on Fund performance, legal and compliance matters, sales and marketing activity, shareholder services, and the other services provided to the Fund by the Advisers and their affiliates. The Board also received in-person presentations by Fund officers and representatives of HFMC at the Board’s meetings on June 17-18, 2014 and August 5-6, 2014 concerning the Agreements.
The Independent Directors, advised by independent legal counsel, engaged service providers to assist them with evaluating the Agreements with respect to the Fund. Lipper Inc. (“Lipper”), an independent provider of investment company data, was retained to provide the Board with reports on how the Fund’s contractual management fees, actual management fees, other non-management fees, overall expense ratios and investment performance compared to those of mutual funds with similar investment objectives. The Independent Directors also engaged an independent financial services consultant (the “Consultant”) to assist them in evaluating the Fund’s management fees, sub-advisory fees, other non-management fees, overall expense ratios and investment performance. In addition, the Consultant reviewed the profitability calculations utilized by HFMC in connection with the continuation of the investment management agreement.
In determining whether to continue the Agreements for the Fund, the members of the Board reviewed and evaluated information and factors they believed to be relevant and appropriate in light of the information that the Board deemed necessary and appropriate through the exercise of its reasonable business judgment. While individual members of the Board may have weighed certain factors differently, the Board’s determination to continue the Agreements was based on a comprehensive consideration of all information provided to the Board throughout the year and specifically with respect to the continuation of the Agreements. A more detailed discussion of the factors the Board considered with respect to its approval of the Agreements is provided below.
Nature, Extent and Quality of Services Provided by the Advisers
The Board requested and considered information concerning the nature, extent and quality of the services provided to the Fund by the Advisers. The Board considered, among other things, the terms of the Agreements and the range of services provided by the Advisers. The Board considered the Advisers’ professional personnel who provide services to the Fund, including each Adviser’s ability and experience in attracting and retaining qualified personnel to service the Fund. The Board considered each Adviser’s reputation and overall financial strength, as well as its willingness to consider and implement organizational and operational changes designed to enhance services to the Hartford Funds. In addition, the Board considered the quality of each Adviser’s communications with the Board and responsiveness to Board inquiries and requests made from time to time with respect to the Fund and other Hartford Funds.
The Board also requested and evaluated information concerning each Adviser’s regulatory and compliance environment. In this regard, the Board requested and reviewed information on each Adviser’s compliance policies and procedures, compliance history, and a report from the Fund’s Chief Compliance Officer on each Adviser’s compliance with applicable laws and regulations, including responses to regulatory developments and compliance issues raised by regulators. The Board also noted the Advisers’ support of the Fund’s compliance control structure, particularly the resources devoted by the Advisers in support of the Fund’s obligations pursuant to Rule 38a-1 under the 1940 Act.
With respect to HFMC, the Board noted that, under the Agreements, HFMC is responsible for the management of the Fund, including oversight of fund operations and service providers, and provides administrative and investment advisory services in connection with selecting, monitoring and supervising the Sub-adviser. The Board considered HFMC’s ongoing monitoring of people, process and performance, including its quarterly reviews of each of the Hartford Funds, semi-annual meetings with the leaders of each Fund’s portfolio management team, and oversight of the Hartford Funds’ approximately 66 portfolio managers. The Board recognized that HFMC has demonstrated a record of making changes to the
| 35 |
| The Hartford International Value Fund |
| Approval of Investment Management and Investment Sub-Advisory Agreements (Unaudited) – (continued) |
management and/or strategies of the Hartford Funds when warranted. The Board considered HFMC’s oversight of the Sub-adviser’s investment approach and results, process for monitoring best execution of portfolio trades by the Sub-adviser, and approach to risk management with respect to the Fund and the service providers to the Fund. The Board also considered HFMC’s oversight of compliance with the Fund’s objective and policies as well as with applicable laws and regulations, noting that regulatory and other developments had over time led to an increase in the scope of HFMC’s services in this regard.
In addition, the Board considered HFMC’s ongoing commitment to review and rationalize the Hartford Funds product line-up and the expenses that HFMC had incurred in connection with fund combinations in recent years. The Board considered that HFMC or its affiliates are responsible for providing the Fund’s officers.
With respect to the Sub-adviser, which provides certain day-to-day portfolio management services for the Fund, the Board considered the quality of the Fund’s portfolio manager, the Sub-adviser’s other investment personnel, its investment philosophy and process, investment research capabilities and resources, performance record, trade execution capabilities and experience. The Board considered the experience of the Fund’s portfolio manager, the number of accounts managed by the portfolio manager, and the Sub-adviser’s method for compensating the portfolio manager.
Based on these considerations, the Board concluded that it was satisfied with the nature, extent and quality of the services provided to the Fund by HFMC and the Sub-adviser.
Performance of the Fund and the Advisers
The Board considered the investment performance of the Fund. In this regard, the Board reviewed the performance of the Fund over different time periods presented in the materials and evaluated HFMC’s analysis of the Fund’s performance for these time periods. The Board considered information and materials provided to the Board by the Advisers concerning Fund performance, as well as information from Lipper comparing the investment performance of the Fund to an appropriate benchmark and universe of peer funds. The Board noted that the Fund’s performance was in the 1st quintile of its performance universe for the 1- and 3-year periods. The Board also noted that the Fund’s performance was above its benchmark for the 1- and 3-year periods. The Board further noted recent changes to the Fund’s portfolio management team and principal investment strategy.
The Board considered the detailed investment analytics reports provided by Hartford Funds’ Investment Advisory Group throughout the year. These reports include, among other things, information on the Fund’s gross and net returns, the Fund’s investment performance relative to an appropriate benchmark and peer group, various statistics concerning the Fund’s portfolio, and a narrative summary of various factors affecting Fund performance. The Board considered the Advisers’ cooperation with the Investment Committee, which assists the Board in evaluating the performance of the Fund at periodic meetings throughout the year. The Board also considered the analysis provided by the Consultant relating to the Fund’s performance track record.
In light of all the considerations noted above, the Board concluded that it had continued confidence in HFMC’s and the Sub-adviser’s overall capabilities to manage the Fund.
Costs of the Services and Profitability of the Advisers
The Board reviewed information regarding HFMC’s cost to provide investment management and related services to the Fund and HFMC’s profitability, both overall and for the Fund, on a pre-tax basis without regard to distribution expenses. The Board also requested and reviewed information about the profitability to HFMC and its affiliates from all services provided to the Fund and all aspects of their relationship with the Fund. The Board also requested and received information relating to the operations and profitability of the Sub-adviser.
The Board considered the Consultant’s review of the profitability calculations used by HFMC in connection with the continuation of the investment management agreement, noting the Consultant’s view that Hartford Funds’ process for calculating and reporting Fund profitability is reasonable. In this regard, the Board noted that the Consultant performed a full review of this process in light of the recent restructuring of the Hartford Funds business and reported that the approach to analyzing Fund profitability, including the use of common expense allocation methodologies, is reasonable, sound and well within common industry practice.
Based on these considerations, the Board concluded that the profits anticipated to be realized by the Advisers and their affiliates from their relationships with the Fund would not be excessive.
| 36 |
| The Hartford International Value Fund |
| Approval of Investment Management and Investment Sub-Advisory Agreements (Unaudited) – (continued) |
Comparison of Fees and Services Provided by the Advisers
The Board considered comparative information with respect to the management fees to be paid by the Fund to HFMC and the total expense ratios of the Fund. The Board also considered comparative information with respect to the sub-advisory fees to be paid by HFMC to the Sub-adviser. In this regard, the Board requested and reviewed information from HFMC and the Sub-adviser relating to the management and sub-advisory fees, including the sub-advisory fee schedule for the Fund, and total operating expenses for the Fund. With respect to the sub-advisory fee schedule, the Board considered representations from HFMC and the Sub-adviser that the Sub-adviser’s fees were negotiated at arm’s length on a fund-by-fund basis. The Board also reviewed information from Lipper comparing the Fund’s contractual management fees, actual management fees and overall expense ratios relative to a group of funds selected by Lipper, in consultation with the Consultant, and a broader universe of funds selected by Lipper. The Board considered that the Fund’s contractual management fee was in the 2nd quintile of its expense group, while its actual management fee was in the 1st quintile and its total expenses (less 12b-1 and shareholder service fees) were in the 2nd quintile. The Board noted that the Fund has an automatically renewable contractual expense cap on each share class. The expense cap resulted in reimbursement of certain expenses incurred in 2013.
While the Board recognized that comparisons between the Fund and peer funds may be imprecise, given the different service levels and characteristics of mutual funds and the different business models and cost structures of the Advisers, the comparative information provided by Lipper assisted the Board in evaluating the reasonableness of the Fund’s management and sub-advisory fees and total operating expenses. In addition, the Board considered the analysis and recommendations of the Consultant relating to the Fund’s management and sub-advisory fees and total operating expenses.
Based on these considerations, the Board concluded that the Fund’s fees and total operating expenses, in conjunction with the information about quality of services, profitability, economies of scale, and other matters discussed, were reasonable in light of the services provided.
Economies of Scale
The Board requested and considered information regarding the Advisers’ realization of economies of scale with respect to the Fund and whether the fee levels reflect these economies of scale for the benefit of the Fund’s shareholders. The Board reviewed the breakpoints in the management fee schedule for the Fund, which reduce fee rates as Fund assets grow over time. The Board recognized that a fund with assets beyond the highest breakpoint level will continue to benefit from economies of scale because additional assets are charged the lowest breakpoint fee resulting in lower overall effective management fee rates. The Board also considered that expense limitations and fee waivers that reduce the Fund’s expenses at all asset levels can have the same effect as breakpoints in sharing economies of scale with shareholders and provide protection from an increase in expenses if Fund assets decline. The Board recognized that a fee schedule that reaches a lower breakpoint quickly provides shareholders with the benefit of anticipated or potential economies of scale. The Board also considered that HFMC has been active in managing expenses, which has resulted in benefits being realized by shareholders as assets within the Hartford Funds family of funds have grown over time, including through lower transfer agent costs and other operating expenses.
The Board reviewed and evaluated materials from Lipper and the Consultant showing how management fee schedules of peer funds reflect economies of scale for the benefit of shareholders as a peer fund’s assets hypothetically increase over time. Based on information provided by HFMC, Lipper, and the Consultant, the Board recognized that there is no uniform methodology for establishing breakpoints or uniform pattern in asset levels that trigger breakpoints or the amounts of breakpoints triggered.
After considering all of the information available to it, the Board concluded that it was satisfied with the extent to which economies of scale would be shared for the benefit of the Fund’s shareholders based on currently available information and the effective advisory fees and expense ratios for the Fund at its current and reasonably anticipated asset levels. The Board noted, however, that it would continue to monitor future growth in Fund assets and the appropriateness of additional breakpoints.
Other Benefits
The Board considered other benefits to the Advisers and their affiliates from their relationships with the Fund.
The Board noted that HFMC receives fees for fund accounting and related services from the Fund, and the Board considered information on profits to HFMC for such services. The Board also considered that Hartford Administrative Services Company (“HASCO”), the Fund’s transfer agent and an affiliate of HFMC, receives transfer agency compensation from the Fund, and the Board reviewed information on the profitability of
| 37 |
| The Hartford International Value Fund |
| Approval of Investment Management and Investment Sub-Advisory Agreements (Unaudited) – (continued) |
the Fund’s transfer agency function to HASCO. The Board considered information provided by HASCO indicating that the transfer agent fees charged by HASCO to the Fund were fair and reasonable based on publicly available information.
The Board also considered that Hartford Funds Distributors, LLC (“HFD”), an affiliate of HFMC, serves as principal underwriter of the Fund. As principal underwriter, HFD receives 12b-1 fees from the Fund and receives all or a portion of the sales charges on sales or redemptions of certain classes of shares. The Board also noted that certain affiliates of HFD distribute shares of the Fund and receive compensation in that connection.
The Board considered benefits to the Sub-adviser from its use of the Fund’s brokerage commissions to obtain soft dollar research, and representations from HFMC and the Sub-adviser that the Sub-adviser would not make any revenue-sharing payments or any other type of distribution payments to HFMC or its affiliates.
The Board considered the benefits to shareholders of being part of the Hartford Funds family of funds, including the right to exchange investments between the same class of funds without a sales charge, the ability to reinvest Fund dividends into other funds in the family, and the ability to combine holdings in the Fund with holdings in other funds to obtain a reduced sales charge. The Board considered HFMC’s efforts to provide investors in the family with a broad range of investment styles and asset classes and its entrepreneurial risk in initiating new funds to expand these opportunities for shareholders.
* * * *
Based upon its review of these various factors, among others, the Board concluded that it is in the best interests of the Fund and its shareholders for the Board to approve the Agreements for an additional year. In reaching this decision, the Board did not assign relative weights to the factors discussed above or deem any one or group of them to be controlling in and of themselves. In connection with their deliberations, the Independent Directors met separately in executive session on several occasions, with independent legal counsel and the Consultant, to review the relevant materials and consider their responsibilities under relevant laws and regulations.
| 38 |
| The Hartford International Value Fund |
| Main Risks (Unaudited) |
The main risks of investing in the Fund are described below.
Market, Selection and Strategy Risk: The Fund’s share price may fluctuate due to market risk and/or security selections that may underperform the market or relevant benchmarks. If the sub-adviser's investment strategy does not perform as expected, the Fund could underperform its peers or lose money. There is no guarantee the Fund will achieve its stated objective.
Foreign Investment and Emerging Markets Risk: Investments in foreign securities may be riskier than investments in U.S. securities. Potential risks include the risks of illiquidity, increased price volatility, less government regulation, less extensive and less frequent accounting and other reporting requirements, unfavorable changes in currency exchange rates, and economic and political disruptions. These risks are generally greater for investments in emerging markets.
Value Investing Risk: Value investments are considered to be undervalued, but they may never attain their potential value. Value-style investing falls in and out of favor, which may result in periods of underperformance.
Small/Mid-Cap Stock Risk: Small- and mid-cap stocks are generally more volatile and risky and may be less liquid than large-cap stocks because they may have limited operating histories, narrow product lines, and focus on niche markets.
Active Trading Risk: Actively trading investments may result in higher costs and higher taxable income.
| 39 |
THIS PRIVACY POLICY IS NOT PART OF THIS REPORT
Privacy Policy and Practices of The Hartford Financial Services Group, Inc. and its Affiliates
(herein called “we, our and us”)
This Privacy Policy applies to our United States Operations
|
We value your trust. We are committed to the responsible: a) management; b) use; and c) protection; of Personal Information.
This notice describes how we collect, disclose, and protect Personal Information.
We collect Personal Information to: a) service your Transactions with us; and b) support our business functions.
We may obtain Personal Information from: a) You; b) your Transactions with us; and c) third parties such as a consumer-reporting agency.
Based on the type of product or service You apply for or get from us, Personal Information such as: a) your name; b) your address; c) your income; d) your payment; or e) your credit history; may be gathered from sources such as applications, Transactions, and consumer reports.
To serve You and service our business, we may share certain Personal Information. We will share Personal Information, only as allowed by law, with affiliates such as: a) our insurance companies; b) our employee agents; c) our brokerage firms; and d) our administrators.
As allowed by law, we may share Personal Financial Information with our affiliates to: a) market our products; or b) market our services; to You without providing You with an option to prevent these disclosures.
|
We may also share Personal Information, only as allowed by law, with unaffiliated third parties including: a) independent agents; b) brokerage firms; c) insurance companies; d) administrators; and e) service providers; who help us serve You and service our business.
When allowed by law, we may share certain Personal Financial Information with other unaffiliated third parties who assist us by performing services or functions such as: a) taking surveys; b) marketing our products or services; or c) offering financial products or services under a joint agreement between us and one or more financial institutions.
We, and third parties we partner with, may track some of the pages You visit through the use of: a) cookies; b) pixel tagging; or c) other technologies; and currently do not process or comply with any web browser’s “do not track” signal or similar mechanism that indicates a request to disable online tracking of individual users who visit our websites or use our services.
We will not sell or share your Personal Financial Information with anyone for purposes unrelated to our business functions without offering You the opportunity to: a) “opt-out;” or b) “opt-in;” as required by law.
We only disclose Personal Health Information with: a) your proper written authorization; or b) as otherwise allowed or required by law.
Our employees have access to Personal Information in the course of doing their jobs, such as: a) underwriting policies; b) paying claims; c) developing new products; or d) advising customers of our products and services.
|
|
We use manual and electronic security procedures to maintain: a) the confidentiality; and b) the integrity of; Personal Information that we have. We use these procedures to guard against unauthorized access.
Some techniques we use to protect Personal Information include: a) secured files; b) user authentication; c) encryption; d) firewall technology; and e) the use of detection software.
We are responsible for and must: a) identify information to be protected; b) provide an adequate level of protection for that data; c) grant access to protected data only to those people who must use it in the performance of their job-related duties.
Employees who violate our Privacy Policy will be subject to discipline, which may include ending their employment with us.
At the start of our business relationship, we will give You a copy of our current Privacy Policy.
We will also give You a copy of our current Privacy Policy once a year if You maintain a continuing business relationship with us.
We will continue to follow our Privacy Policy regarding Personal Information even when a business relationship no longer exists between us.
|
As used in this Privacy Notice:
Application means your request for our product or service.
Personal Financial Information means financial information such as: a) credit history; b) income; c) financial benefits; or d) policy or claim information.
Personal Health Information means health information such as: a) your medical records; or b) information about your illness, disability or injury.
Personal Information means information that identifies You personally and is not otherwise available to the public. It includes: a) Personal Financial Information; and b) Personal Health Information.
Transaction means your business dealings with us, such as: a) your Application; b) your request for us to pay a claim; and c) your request for us to take an action on your account.
You means an individual who has given us Personal Information in conjunction with: a) asking about; b) applying for; or c) obtaining; a financial product or service from us if the product or service is used mainly for personal, family, or household purposes.
|
This Privacy Policy is being provided on behalf of the following affiliates of The Hartford Financial Services Group, Inc.:
1stAGChoice, Inc.; Access CoverageCorp, Inc.; Access CoverageCorp Technologies, Inc.; American Maturity Life Insurance Company; Archway 60 R, LLC; Business Management Group, Inc.; Champlain Life Reinsurance Company; DMS R, LLC; Eloy R, LLC; Ersatz Corporation; First State Insurance Company; Hartford Accident and Indemnity Company; Hartford Administrative Services Company; Hartford Casualty General Agency, Inc.; Hartford Casualty Insurance Company; Hartford-Comprehensive Employee Benefit Service Company; Hartford Equity Sales Company, Inc.; Hartford Fire General Agency, Inc.; Hartford Fire Insurance Company; Hartford Funds Management Company, LLC; Hartford Funds Management Group, Inc.; Hartford HLS Series Fund II, Inc.; Hartford Insurance Company of Illinois; Hartford Insurance Company of the Midwest; Hartford Insurance Company of the Southeast; Hartford Integrated Technologies, Inc.; Hartford International Life Reassurance Corporation; Hartford Funds Distributors, LLC; Hartford Investment Management Company; Hartford Life and Accident Insurance Company; Hartford Life and Annuity Insurance Company; Hartford Life Insurance Company; Hartford Life Private Placement, LLC; Hartford Lloyd’s Corporation; Hartford Lloyd’s Insurance Company; Hartford Mezzanine Investors I, LLC; Hartford Residual Market, L.C.C.; Hartford Retirement Services, LLC; Hartford Securities Distribution Company, Inc.; Hartford Series Fund, Inc.; Hartford Specialty Insurance Services of Texas, LLC; Hartford Strategic Investments, LLC; Hartford Underwriters Insurance Company; Hartford Technology Services Company, L.L.C.; Hartford of Texas General Agency, Inc.; Hartford Underwriters General Agency, Inc.; HARTRE Company, L.C.C.; HL Investment Advisors, LLC; HLA LLC; Horizon Management Group, LLC; HRA Brokerage Services, Inc.; Lanidex Class B, LLC; M-CAP Insurance Agency, LLC; New England Insurance Company; New England Reinsurance Corporation; Nutmeg Insurance Agency, Inc.; Nutmeg Insurance Company; Pacific Insurance Company, Limited; Planco, LLC: Property and Casualty Insurance Company of Hartford; Revere R, LLC; RVR R, LLC; Sentinel Insurance Company, Ltd.; Sunstone R, LLC; Symphony R, LLC; The Evergreen Group Incorporated; The Hartford Alternative Strategies Fund; The Hartford Mutual Funds, Inc.; The Hartford Mutual Funds II, Inc.; Trumbull Flood Management, L.L.C.; Trumbull Insurance Company; Twin City Fire Insurance Company; White River Life Reinsurance Company.
HPP Revised January 2014
HARTFORDFUNDS
hartfordfunds.com
This information is written in connection with the promotion or marketing of the matter(s) addressed in this material.
This report is submitted for the general information of the shareholders of the Fund. It is not authorized for distribution unless preceded or accompanied by a current prospectus for the Fund.
The information cannot be used or relied upon for the purpose of avoiding IRS penalties. These materials are not intended to provide tax, accounting or legal advice. As with all matters of a tax or legal nature, you should consult your own tax or legal counsel for advice.
Investors should carefully consider the investment objectives, risks, charges, and expenses of Hartford Funds before investing. This and other information can be found in the prospectus and summary prospectus, which can be obtained by calling 888-843-7824 (retail) or 800-279-1541 (institutional). Investors should read them carefully before they invest.
Hartford Funds are underwritten and distributed by Hartford Funds Distributors, LLC.
MFAR-IV14 12/14 113990-3 Printed in U.S.A.
HARTFORDFUNDS
|
HARTFORD LONG/SHORT
2014 Annual Report |
A MESSAGE FROM THE PRESIDENT
Dear Fellow Shareholders:
Thank you for investing in Hartford Funds.
Market Review
U.S. equities (as represented by the S&P 500 Index) rose steadily for the fiscal year ended October 31, 2014, with a return of 17.27% for the period. With the exception of short-lived geopolitical scares early in 2014 and concerns about continuing global growth near the end of the period, stocks generally rose on solid fundamentals and encouraging macroeconomic data during the year.
September 2014 marked the six-year anniversary of the start of the financial crisis. Within weeks of that anniversary, both the S&P 500 Index and the Dow Jones Industrial Average set new all-time highs, closing at 2,018 and 17,391, respectively, on October 31. Although the fallout of the crisis continues to influence investor behavior, stocks have recovered and risen dramatically, up 198% from their low in March 2009. Meanwhile, the domestic economy is notching strong growth, and the unemployment rate has reached its lowest level since August 2008.
While the U.S. economy appears to have stabilized and to have reverted to a solid growth path, the outlook for the global economy appears to have gotten cloudier. The U.S. Federal Reserve has ended quantitative easing, while Europe and Japan are pursuing stimulus options to avoid a double-dip recession and deflation, respectively. Diverging central-bank policies will likely continue to play an important role in market movements going forward as investors wait to see the reactions to their efforts and their impacts on global markets.
How have market movements impacted your portfolio throughout the last year? Are your investments still on track to provide the growth or income you need, and are you comfortable with their progress during times of volatility?
Your financial professional can help you navigate today’s markets with confidence, as well as assist you to achieve your investment goals by providing advice on the best options within our fund family to help you work toward overcoming today’s investing challenges. Meet with your financial advisor regularly to examine your portfolio and your investment strategy, and to determine if you’re still on track to meet your goals.
Thank you again for investing with Hartford Funds.
James Davey
President
Hartford Funds
1 The S&P 500 Index is a market capitalization-weighted price index composed of 500 widely held common stocks.
2 The Dow Jones Industrial Average is an unmanaged, price-weighted index of 30 of the largest, most widely held stocks traded on the NYSE
Hartford Long/Short Global Equity Fund
Table of Contents
The views expressed in the Fund’s Manager Discussion under ‘‘Why did the Fund perform this way?’’ and ‘‘What is the outlook?’’ are views of the Fund’s sub-adviser and portfolio management team through the end of the period and are subject to change based on market and other conditions. The Fund’s Manager Discussion is for informational purposes only and does not represent an offer, recommendation or solicitation to buy, hold or sell any security. The specific securities identified and described, if any, do not represent all of the securities purchased or sold and you should not assume that investments in the securities identified and discussed will be profitable.
Hartford Long/Short Global Equity
Fund inception 08/29/2014
(sub-advised by Wellington Management Company, LLP)
Investment objective – The Fund seeks to provide long-term capital appreciation
Performance Overview 8/29/14 - 10/31/14
The chart above represents the hypothetical growth of a $10,000 investment in Class A, which includes a sales charge. Growth results in classes other than Class A will vary from what is seen above due to differences in the expenses charged to those share classes.
Cumulative Returns (as of 10/31/14)
| Since Inception▲ | ||||
| Long/Short Global Equity A# | -3.80 | % | ||
| Long/Short Global Equity A## | -9.09 | % | ||
| Long/Short Global Equity C# | -3.90 | % | ||
| Long/Short Global Equity C## | -4.86 | % | ||
| Long/Short Global Equity I# | -3.80 | % | ||
| Long/Short Global Equity Y# | -3.80 | % | ||
| Hedge Fund Research, Inc. Equity Hedge Index | -0.26 | % | ||
| MSCI All Country World Index | -2.50 | % | ||
| ▲ | Inception: 08/29/2014. Cumulative returns not annualized. |
| # | Without sales charge |
| ## | With sales charge |
PERFORMANCE DATA QUOTED REPRESENTS PAST PERFORMANCE AND DOES NOT GUARANTEE FUTURE RESULTS. The investment return and principal value of the investment will fluctuate so that investors’ shares, when redeemed, may be worth more or less than their original cost. Current performance may be lower or higher than the performance data quoted. To obtain performance data current to the most recent month-end, please visit our website www.hartfordfunds.com.
The initial investment in Class A shares reflects the maximum sales charge of 5.50% and returns for Class C shares reflect a contingent deferred sales charge of up to 1.00% on shares redeemed within twelve months of purchase.
Total returns presented above were calculated using the Fund’s net asset value available to shareholders for sale or redemption of Fund shares on October 31, 2014, which may exclude investment transactions as of this date. All share class returns assume the reinvestment of all distributions at net asset value and the deduction of all fund expenses.
Hedge Fund Research, Inc. Equity Hedge Index is an unmanaged index of accounts that maintain positions both long and short in primarily equity and equity derivative securities.
MSCI All Country World Index is a free float-adjusted market capitalization index that measures equity market performance in the global developed and emerging markets, consisting of 45 developed and emerging market country indices.
You cannot invest directly in an index.
The chart and table do not reflect the deductions of taxes that a shareholder would pay on Fund distributions or the redemption of Fund shares.
Performance information may reflect historical or current expense waivers/reimbursements from the investment adviser, without which performance would have been lower. For information on current expense waivers/reimbursements, please see the prospectus.
| 2 |
Hartford Long/Short Global Equity Fund
Manager Discussion
October 31, 2014 (Unaudited)
Operating Expenses*
| Net | Gross | |||||||
| Long/Short Global Equity Class A | 3.25 | % | 3.30 | % | ||||
| Long/Short Global Equity Class C | 4.00 | % | 4.05 | % | ||||
| Long/Short Global Equity Class I | 3.00 | % | 3.05 | % | ||||
| Long/Short Global Equity Class Y | 2.85 | % | 2.87 | % | ||||
| * | As shown in the Fund's most recent prospectus. Actual expenses may be higher or lower. Please see accompanying Financial Highlights for expense ratios for the period ended October 31, 2014. |
Gross expenses are the Fund's total annual operating expenses shown in the Fund's most recent prospectus. Net expenses are the Fund's total annual operating expenses shown in the Fund's most recent prospectus and reflect contractual expense reimbursements in instances when these reductions reduce the Fund's gross expenses. Contractual reimbursements remain in effect until February 29, 2016, and automatically renew for one-year terms unless terminated.
All investments are subject to risk including the possible loss of principal. For a discussion of the Fund’s risks, please see the Main Risks section of this report. For more detailed information on the risks associated with an investment in the Fund, please see the prospectus.
| Portfolio Managers | |
| Kenneth L. Abrams | Donald S. Tunnell, CFA |
| Senior Vice President and Equity Portfolio Manager | Vice President, Co-Director, Quantitative Investments and Portfolio Manager |
How did the Fund perform?
The Class A shares of the Hartford Long/Short Global Equity Fund returned -3.80%, before sales charge, for the period August 29, 2014 (commencement of operations) through October 31, 2014, underperforming the MSCI All Country World Index, which returned -2.50% for the same period. The Fund also underperformed the -1.26% average return of the Lipper Alternative Long Short Global Equity funds peer group, a group of funds with investment strategies similar to those of the Fund.
Why did the Fund perform this way?
Global equities rose during the twelve-month period, notwithstanding bouts of significant volatility. Despite ongoing geopolitical tensions in Ukraine and the Middle East, concerns about a Chinese economic growth slowdown, and unsettling economic and political developments in several other emerging market countries, the five-year-old bull market continued in the first half of 2014. Robust merger and acquisition activity, along with continued accommodative monetary policy from central banks around the globe, aided positive investor sentiment in May and June. However, Portuguese banking woes, European economic malaise, and the prospect of an accelerated U.S. Federal Reserve (Fed) interest-rate-hike timeline all contributed to stall the global stock rally near the tail end of the period. In addition, China's property slump and poor gross domestic product (GDP) readings in Japan and the eurozone raised the specter of a slowdown in global economic growth. Nevertheless, there were several positive developments, including monetary easing by the European Central Bank and the People's Bank of China, as well as an encouraging U.S. corporate earnings season. Despite these positives, many market participants found ample reason to reassess their risk appetites (i.e. reduce risks), given the strong performance in recent years. During the period, emerging market equities underperformed their developed market counterparts and U.S. stocks generally outperformed non-U.S. stocks.
Eight of the ten sectors in the MSCI All Country World Index rose during the twelve-month period. Healthcare (+24%), Information Technology (+21%), and Utilities (+14%) rose the most while returns in Materials (-3%), Energy (-1%), and Consumer Discretionary (+4%) lagged most on a relative basis.
We seek to deliver a portfolio with a target gross long exposure of 110%-130% of the Fund’s net assets and gross short exposure of 50% of the Fund’s gross long exposure resulting in net exposure to the market of roughly 60%. The Fund invests primarily in the small capitalization companies with market capitalization within the collective range of the MSCI All Country World Small Cap Index, which can create a headwind or tailwind (situations where growth is more difficult or easier) when small-caps underperform or outperform the MSCI All Country World Index, respectively. There are two main drivers of Fund performance: whether stocks in the long portion of the Fund outperform the market and whether stocks in the short portion of the Fund underperform the market.
Since the Fund’s inception through October 31, 2014, the MSCI All Country World Index returned -2.50%. Hartford Long/Short Global Equity Fund had a negative absolute return and underperformed the MSCI All Country World Index during the period. Global equity markets declined led by small-cap stocks which created a headwind for the Fund. The combination of negative market returns and weak stock selection in the long and short portions of the Fund drove performance.
In the long portion of the Fund, on an absolute basis, performance was weakest within Financials, Consumer Discretionary, and Energy sectors. On a country basis, absolute performance was weakest within the United States followed by Japan and Spain. Abengoa (Industrials) and New Britain Palm Oil (Consumer Staples) were the top absolute detractor and contributor, respectively, to the long portfolio. Abengoa, a company domiciled in Spain that applies technology solutions for sustainable development in the energy and
| 3 |
Hartford Long/Short Global Equity Fund
Manager Discussion – (continued)
October 31, 2014 (Unaudited)
environment sectors, saw shares fall following the announcement that the company had signed a €1.4B revolving loan in order to lower its cost of financing and extend its maturity profile. New Britain Palm Oil, a Papua New Guinean palm oil producer, saw shares rise on news of an acquisition offer from Sime Darby for $1.7B.
The short portion of the Fund provided a partial hedge to performance in a downward trending market environment and contributed to performance on an absolute basis. Short positions contributed most directly to absolute returns in the Energy, Financials, and Materials sectors; however, this was partially offset by positions in Healthcare, which detracted. On a country basis, short positions in the United Kingdom, Japan, and Italy contributed to absolute returns while China and the United States detracted.
Derivatives are not used in a significant manner in this Fund and did not have a material impact on performance during the period.
What is the outlook?
The global economy continues to advance at a moderate pace with a mix of stronger growth in the U.S. and more sluggish activity in Europe, Japan, and China. We endeavor to maintain balanced positioning regardless of market environment. On the long side, our bottom-up process is driven by fundamental research at the company level and supported by our top down quantitative and macro analytic tools. On the short side, we utilize quantitative model and optimization processes to build a short portfolio of securities that we believe are more likely to underperform the benchmark over time, while maintaining the intended profile of the Fund.
At the end of the period, our largest sector exposures on a net basis were to Financials, Materials, and Information Technology, while Consumer Staples, Telecommunication Services, and Utilities were the smallest. On a regional basis emerging markets and North America represented the largest net region exposures. Net equity exposure was roughly in line with our target at 61%.
| 4 |
Hartford Long/Short Global Equity Fund
Manager Discussion – (continued)
October 31, 2014 (Unaudited)
Diversification by Sector
as of October 31, 2014
| Sector | Percentage of Net Assets | |||
| Long Positions | ||||
| Equity Securities | ||||
| Consumer Discretionary | 16.5 | % | ||
| Consumer Staples | 3.8 | |||
| Energy | 5.9 | |||
| Financials | 30.8 | |||
| Health Care | 12.1 | |||
| Industrials | 17.2 | |||
| Information Technology | 16.5 | |||
| Materials | 11.8 | |||
| Services | 2.3 | |||
| Utilities | 3.5 | |||
| Total | 120.4 | % | ||
| Short-Term Investments | 0.1 | |||
| Securities Sold Short | ||||
| Equity Securities | ||||
| Consumer Discretionary | (8.2 | )% | ||
| Consumer Staples | (4.1 | ) | ||
| Energy | (2.2 | ) | ||
| Financials | (11.5 | ) | ||
| Health Care | (5.2 | ) | ||
| Industrials | (10.8 | ) | ||
| Information Technology | (10.9 | ) | ||
| Materials | (4.7 | ) | ||
| Services | (0.8 | ) | ||
| Utilities | (1.2 | ) | ||
| Total | (59.6 | )% | ||
| Other Assets and Liabilities | 39.1 | |||
| Total | 100.0 | % | ||
A sector may be comprised of several industries. For Fund compliance purposes, the Fund may not use the same classification system and these sector classifications are used for reporting ease.
Diversification by Country - Long Positions
as of October 31, 2014
| Country | Percentage of Net Assets | |||
| Argentina | 0.5 | % | ||
| Australia | 2.3 | |||
| Brazil | 2.0 | |||
| Canada | 5.3 | |||
| China | 3.5 | |||
| Germany | 4.4 | |||
| Greece | 0.9 | |||
| Hong Kong | 0.5 | |||
| Ireland | 3.0 | |||
| Israel | 0.9 | |||
| Italy | 1.2 | |||
| Japan | 9.9 | |||
| Mexico | 1.9 | |||
| Netherlands | 2.7 | |||
| Norway | 1.2 | |||
| Poland | 0.6 | |||
| South Africa | 0.7 | |||
| South Korea | 1.2 | |||
| Spain | 2.1 | |||
| Taiwan | 1.1 | |||
| Turkey | 0.6 | |||
| United Kingdom | 5.8 | |||
| United States | 68.1 | |||
| Short-Term Investments | 0.1 | |||
| Total Long Positions | 120.5 | |||
| Short Positions | (59.6 | ) | ||
| Other Assets and Liabilities | 39.1 | |||
| Total | 100.0 | % | ||
Diversification by Country - Securities Sold Short
as of October 31, 2014
| Country | Percentage of Net Assets | |||
| Australia | 1.8 | % | ||
| Canada | 0.8 | |||
| China | 1.8 | |||
| Denmark | 0.9 | |||
| Finland | 0.4 | |||
| France | 0.6 | |||
| Germany | 1.1 | |||
| Hong Kong | 3.4 | |||
| Hungary | 0.6 | |||
| Italy | 2.1 | |||
| Japan | 7.0 | |||
| Mexico | 1.2 | |||
| South Africa | 1.5 | |||
| Sweden | 0.5 | |||
| Switzerland | 0.4 | |||
| United Kingdom | 4.3 | |||
| United States | 31.2 | |||
| Total | 59.6 | % | ||
| 5 |
Hartford Long/Short Global Equity Fund
Schedule of Investments
October 31, 2014
(000’s Omitted)
| Shares or Principal Amount | Market Value ╪ | |||||||
Long Positions - 120.5% |
||||||||
Common Stocks - 114.1% | ||||||||
| Automobiles and Components - 2.3% | ||||||||
| 10 | Keihin Corp. | $ | 129 | |||||
| 2 | Tenneco Automotive, Inc. ● | 105 | ||||||
| 8 | Toyoda Gosei Co., Ltd. | 148 | ||||||
| 382 | ||||||||
| Banks - 7.3% | ||||||||
| 32 | 77 Bank Ltd. | 179 | ||||||
| 276 | Banca Popolare di Milano Scarl ● | 208 | ||||||
| 20 | Banco ABC Brasil S.A. | 111 | ||||||
| 7 | DGB Financial Group, Inc. | 98 | ||||||
| 5 | Grupo Financiero Galicia S.A. | 76 | ||||||
| 3 | Home Capital Group, Inc. | 158 | ||||||
| 197 | Liberbank S.A. ● | 168 | ||||||
| 5 | Wintrust Financial Corp. | 210 | ||||||
| 1,208 | ||||||||
| Capital Goods - 8.7% | ||||||||
| 41 | Abengoa S.A. ● | 173 | ||||||
| 3 | Canadian Solar, Inc. ● | 91 | ||||||
| 2 | Esterline Technologies Corp. ● | 251 | ||||||
| 16 | Kloeckner & Co. SE ● | 183 | ||||||
| 15 | Meritor, Inc. ● | 178 | ||||||
| 6 | Orbital Sciences Corp. ● | 165 | ||||||
| 2 | Teledyne Technologies, Inc. ● | 247 | ||||||
| 2 | Wabco Holdings, Inc. ● | 148 | ||||||
| 1,436 | ||||||||
| Consumer Durables and Apparel - 2.2% | ||||||||
| 4 | Arctic Cat, Inc. | 145 | ||||||
| 172 | Truly International Holdings | 87 | ||||||
| 7 | Tumi Holdings, Inc. ● | 141 | ||||||
| 373 | ||||||||
| Consumer Services - 3.4% | ||||||||
| 5 | Brinker International, Inc. | 252 | ||||||
| 3 | Cheesecake Factory, Inc. | 156 | ||||||
| 12 | Opap S.A. | 149 | ||||||
| 557 | ||||||||
| Diversified Financials - 6.2% | ||||||||
| 11 | American Capital Ltd. ● | 156 | ||||||
| 10 | Investment Technology Group, Inc. ● | 172 | ||||||
| 4 | Legg Mason, Inc. | 203 | ||||||
| 31 | Mitsubishi UFJ Lease & Finance Co., Ltd. | 161 | ||||||
| 3 | Nelnet, Inc. | 148 | ||||||
| 1 | Virtus Investment Partners, Inc. | 181 | ||||||
| 1,021 | ||||||||
| Energy - 5.9% | ||||||||
| 4 | Carrizo Oil & Gas, Inc. ● | 205 | ||||||
| 339 | China Suntien Green Energy | 90 | ||||||
| 5 | Newfield Exploration Co. ● | 171 | ||||||
| 13 | Painted Pony Petroleum Ltd. ● | 123 | ||||||
| 10 | Patterson-UTI Energy, Inc. | 228 | ||||||
| 4 | Western Refining, Inc. | 168 | ||||||
| 985 | ||||||||
| Food, Beverage and Tobacco - 3.1% | ||||||||
| 69 | Greencore Group plc | 290 | ||||||
| 23 | Minerva S.A. ● | 119 | ||||||
| 14 | Ulker Biskuvi Sanayi AS ● | 106 | ||||||
| 515 | ||||||||
| Health Care Equipment and Services - 8.6% | ||||||||
| 2 | athenahealth, Inc. ● | 194 | ||||||
| 10 | Kindred Healthcare, Inc. | 223 | ||||||
| 5 | LifePoint Hospitals, Inc. ● | 316 | ||||||
| 4 | Molina Healthcare, Inc. ● | 213 | ||||||
| 38 | Netcare Ltd. ● | 115 | ||||||
| 3 | Suzuken Co., Ltd. | 91 | ||||||
| 9 | Synergy Health plc ● | 278 | ||||||
| 1,430 | ||||||||
| Household and Personal Products - 0.7% | ||||||||
| 15 | Hypermarcas S.A. ● | 108 | ||||||
| Insurance - 4.4% | ||||||||
| 4 | Assurant, Inc. | 248 | ||||||
| 33 | Catlin Group Ltd. | 281 | ||||||
| 40 | Storebrand ASA ● | 204 | ||||||
| 733 | ||||||||
| Materials - 11.8% | ||||||||
| 9 | Constellium N.V. ● | 191 | ||||||
| 27 | Graphic Packaging Holding Co. ● | 329 | ||||||
| 6 | KapStone Paper & Packaging Corp. ● | 187 | ||||||
| 4 | Methanex Corp. ADR | 228 | ||||||
| 2 | Minerals Technologies, Inc. | 171 | ||||||
| 3 | Reliance Steel & Aluminum | 196 | ||||||
| 10 | Smurfit Kappa Group plc | 214 | ||||||
| 8 | Tokyo Ohka Kogyo Co., Ltd. | 217 | ||||||
| 2 | Wacker Chemie AG | 248 | ||||||
| 1,981 | ||||||||
| Media - 2.2% | ||||||||
| 11 | Quebecor, Inc. | 277 | ||||||
| 20 | TVN S.A. | 92 | ||||||
| 369 | ||||||||
| Pharmaceuticals, Biotechnology and Life Sciences - 3.5% | ||||||||
| 9 | BioCryst Pharmaceuticals, Inc. ● | 100 | ||||||
| 4 | Charles River Laboratories International, Inc. ● | 226 | ||||||
| 3 | Seattle Genetics, Inc. ● | 118 | ||||||
| 4 | WuXi PharmaTech Cayman, Inc. ● | 135 | ||||||
| 579 | ||||||||
| Real Estate - 6.6% | ||||||||
| 21 | Big Yellow Group REIT | 182 | ||||||
| 4 | Equity Lifestyle Properties, Inc. REIT | 210 | ||||||
| 16 | Gagfah S.A. ● | 296 | ||||||
| 25 | MFA Mortgage Investments, Inc. REIT | 210 | ||||||
| 9 | Starwood Property Trust, Inc. REIT | 200 | ||||||
| 1,098 | ||||||||
| Retailing - 6.4% | ||||||||
| 72 | Dick Smith Holdings Ltd. | 139 | ||||||
| 601 | GOME Electrical Appliances Holdings Ltd. | 95 | ||||||
| 7 | Haverty Furniture Cos., Inc. | 151 | ||||||
| 1 | Hyundai Home Shopping Network Corp. | 99 | ||||||
| 6 | K's Holdings Corp. | 160 | ||||||
| 6 | Urban Outfitters, Inc. ● | 195 | ||||||
| 12 | WH Smith plc | 215 | ||||||
| 1,054 | ||||||||
| Semiconductors and Semiconductor Equipment - 6.3% | ||||||||
| 57 | Elan Microelectronics Corp. | 91 | ||||||
| 3 | First Solar, Inc. ● | 159 | ||||||
| 113 | King Yuan Electronics Co., Ltd. | 90 | ||||||
| 26 | Lattice Semiconductor Corp. ● | 177 | ||||||
| 6 | Microsemi Corp. ● | 160 | ||||||
| 28 | ON Semiconductor Corp. ● | 236 | ||||||
The accompanying notes are an integral part of these financial statements.
| 6 |
Hartford Long/Short Global Equity Fund
Schedule of Investments – (continued)
October 31, 2014
(000’s Omitted)
| Shares or Principal Amount | Market Value ╪ | |||||||||||
Long Positions - 120.5% - (continued) |
||||||||||||
Common Stocks - 114.1% - (continued) | ||||||||||||
| Semiconductors and Semiconductor Equipment - 6.3% - (continued) | ||||||||||||
| 4 | SunPower Corp. ● | $ | 131 | |||||||||
| 1,044 | ||||||||||||
| Software and Services - 7.9% | ||||||||||||
| 10 | Cadence Design Systems, Inc. ● | 177 | ||||||||||
| 14 | Convergys Corp. | 274 | ||||||||||
| 5 | Heartland Payment Systems, Inc. | 257 | ||||||||||
| 3 | IAC/InterActiveCorp. | 177 | ||||||||||
| 5 | Perfect World Co., Ltd. ADR | 98 | ||||||||||
| 4 | PTC, Inc. ● | 147 | ||||||||||
| 7 | Sumisho Computer Systems Corp. | 177 | ||||||||||
| 1,307 | ||||||||||||
| Technology Hardware and Equipment - 2.3% | ||||||||||||
| 7 | Arris Group, Inc. ● | 222 | ||||||||||
| 1 | Hollysys Automation Technology ● | 25 | ||||||||||
| 39 | Sonus Networks, Inc. ● | 135 | ||||||||||
| 382 | ||||||||||||
| Telecommunication Services - 2.3% | ||||||||||||
| 88 | Bezeq Israeli Telecommunication Corp., Ltd. | 151 | ||||||||||
| 65 | Vonage Holdings Corp. ● | 228 | ||||||||||
| 379 | ||||||||||||
| Transportation - 8.5% | ||||||||||||
| 33 | Grupo Aeroportuario del Centro Norte | 162 | ||||||||||
| 16 | JetBlue Airways Corp. ● | 182 | ||||||||||
| 55 | OHL Mexico S.A.B. de C.V. ● | 153 | ||||||||||
| 60 | PostNL ● | 256 | ||||||||||
| 167 | Qantas Airways Ltd. ● | 249 | ||||||||||
| 20 | Seino Holdings Corp. | 157 | ||||||||||
| 10 | Swift Transportation Co. ● | 248 | ||||||||||
| 1,407 | ||||||||||||
| Utilities - 3.5% | ||||||||||||
| 5 | El Paso Electric Co. | 207 | ||||||||||
| 122 | Guangdong Investment Ltd. | 160 | ||||||||||
| 18 | Tohoku Electric Power Co., Inc. | 222 | ||||||||||
| 589 | ||||||||||||
| Total Common Stocks | ||||||||||||
| ( Cost $19,857) | $ | 18,937 | ||||||||||
Exchange Traded Funds - 6.3% | ||||||||||||
| Other Investment Pools and Funds - 6.3% | ||||||||||||
| 5 | iShares MSCI EAFE ETF | $ | 304 | |||||||||
| 3 | iShares Russell 2000 | 310 | ||||||||||
| 19 | WisdomTree India Earnings | 435 | ||||||||||
| Total Exchange Traded Funds | ||||||||||||
| (Cost $1,009) | $ | 1,049 | ||||||||||
| Total Long-Term Investments | ||||||||||||
| (Cost $20,866) | $ | 19,986 | ||||||||||
| Short-Term Investments - 0.1% | ||||||||||||
| Other Investment Pools and Funds - 0.1% | ||||||||||||
| 10 | JP Morgan U.S. Government Money Market Fund | $ | 10 | |||||||||
| Total Short-Term Investments | ||||||||||||
| (Cost $10) | $ | 10 | ||||||||||
| Total Long Positions | ||||||||||||
| (Cost $20,876) ▲ | 120.5 | % | $ | 19,996 | ||||||||
| Total Securities Sold Short | ||||||||||||
| (Proceeds $10,317) ▲ | (59.6 | )% | (9,896 | ) | ||||||||
| Other Assets and Liabilities | 39.1 | % | 6,492 | |||||||||
| Total Net Assets | 100.0 | % | $ | 16,592 | ||||||||
Securities Sold Short - 59.6% | ||||||||
Common Stocks - 59.6% | ||||||||
| Automobiles and Components - 1.6% | ||||||||
| 128 | Avichina Industry & Technology | $ | 97 | |||||
| 2 | Nokian Rendaat Oyj | 66 | ||||||
| 160 | Xinyi Glass Holdings Co., Ltd. | 95 | ||||||
| 258 | ||||||||
| Banks - 2.9% | ||||||||
| 640 | Banca Carige S.p.A. ● | 54 | ||||||
| 3 | Banco Popolare Societa Cooperativa ● | 51 | ||||||
| 3 | Ocwen Financial Corp. ● | 65 | ||||||
| 6 | OTP Bank plc ● | 99 | ||||||
| 5 | Suruga Bank Ltd. | 110 | ||||||
| 2 | Westamerica Bancorporation | 101 | ||||||
| 480 | ||||||||
| Capital Goods - 7.1% | ||||||||
| 2 | Clarcor, Inc. | 109 | ||||||
| 3 | DigitalGlobe, Inc. ● | 97 | ||||||
| 55 | Empresas ICA S.A.B. de C.V. ● | 97 | ||||||
| 33 | Furukawa Co., Ltd. ● | 66 | ||||||
| 13 | Iseki & Co., Ltd. ● | 31 | ||||||
| 19 | Kumagai Gumi Co., Ltd. ● | 70 | ||||||
| 3 | MasTec, Inc. ● | 95 | ||||||
| 35 | Melco International Development Ltd. | 95 | ||||||
| 2 | Monotaro Co. | 40 | ||||||
| 2 | Power Solutions International, Inc. ● | 99 | ||||||
| 2 | Spirax-Sarco Engineering plc | 95 | ||||||
| 35 | Sumitomo Mitsui Construction C ● | 42 | ||||||
| 1 | TAL International Group, Inc. | 59 | ||||||
| 4 | USG Corp. ● | 94 | ||||||
| 2 | Vossloh AG | 88 | ||||||
| 1,177 | ||||||||
| Commercial and Professional Services - 1.3% | ||||||||
| 2 | Advisory (The) Board Co. ● | 109 | ||||||
| 13 | ALS Ltd. | 66 | ||||||
| 5 | Moshi Moshi Hotline, Inc. | 46 | ||||||
| 221 | ||||||||
| Consumer Durables and Apparel - 1.0% | ||||||||
| 7 | TRI Pointe Homes, Inc. ● | 94 | ||||||
| 3 | William Lyon Homes ● | 67 | ||||||
| 161 | ||||||||
| Consumer Services - 2.0% | ||||||||
| 1 | Ascent Capital Group, Inc. ● | 67 | ||||||
| 3 | Boyd Gaming Corp. ● | 37 | ||||||
| 4 | Pinnacle Entertainment, Inc. ● | 108 | ||||||
The accompanying notes are an integral part of these financial statements.
| 7 |
Hartford Long/Short Global Equity Fund
Schedule of Investments – (continued)
October 31, 2014
(000’s Omitted)
| Shares or Principal Amount | Market Value ╪ | |||||||
Securities Sold Short - 59.6% - (continued) | ||||||||
Common Stocks - 59.6% - (continued) | ||||||||
| Consumer Services - 2.0% - (continued) | ||||||||
| 10 | Scientific Games Corp. Class A ● | $ | 120 | |||||
| 332 | ||||||||
| Diversified Financials - 6.5% | ||||||||
| 4 | AEON Financial Service Co., Ltd. | 92 | ||||||
| 2 | Azimut Holding S.p.A. | 46 | ||||||
| 4 | Banca Generali S.p.A. | 99 | ||||||
| 10 | Coronation Fund Managers Ltd. ● | 87 | ||||||
| 3 | Federated Investors, Inc. | 105 | ||||||
| 28 | FlexiGroup Ltd./Australia | 88 | ||||||
| 6 | FXCM, Inc. | 103 | ||||||
| 2 | Greenhill & Co., Inc. | 91 | ||||||
| 2 | MarketAxess Holdings, Inc. | 112 | ||||||
| 32 | Monex Group, Inc. | 82 | ||||||
| 4 | PHH Corp. ● | 102 | ||||||
| 15 | Tullett Prebon plc | 68 | ||||||
| 1,075 | ||||||||
| Energy - 2.2% | ||||||||
| 1 | AltaGas Ltd. | 58 | ||||||
| 4 | Energy XXI (Bermuda) Ltd. | 32 | ||||||
| 5 | Lundin Petroleum Ab ● | 78 | ||||||
| 27 | Ophilr Energy plc ● | 79 | ||||||
| 3 | Sanchez Energy Corp. ● | 54 | ||||||
| 9 | Triangle Petroleum Corp. ● | 66 | ||||||
| 367 | ||||||||
| Food and Staples Retailing - 1.2% | ||||||||
| 45 | Booker Group plc | 102 | ||||||
| 1 | PriceSmart, Inc. | 98 | ||||||
| 200 | ||||||||
| Food, Beverage and Tobacco - 2.9% | ||||||||
| 3 | B&G Foods, Inc. Class A | 99 | ||||||
| 3 | Calbee, Inc. | 102 | ||||||
| 2 | Post Holdings, Inc. ● | 71 | ||||||
| 4 | Snyders-Lance, Inc. | 111 | ||||||
| 113 | Uni-President China Holdings | 104 | ||||||
| 487 | ||||||||
| Health Care Equipment and Services - 5.2% | ||||||||
| 2 | Asahi Intecc Co., Ltd. | 101 | ||||||
| 3 | Cardiovascular Systems, Inc. ● | 80 | ||||||
| 2 | Dexcom, Inc. ● | 105 | ||||||
| — | Heartware International, Inc. ● | 31 | ||||||
| 1 | Medidata Solutions, Inc. ● | 39 | ||||||
| 3 | NxStage Medical, Inc. ● | 47 | ||||||
| 100 | Shandong Weigao Group Medical Polymer Co., Ltd. | 101 | ||||||
| 3 | Spectranetics Corp. ● | 101 | ||||||
| 3 | Tornier N.V. ● | 74 | ||||||
| 1 | William Demant Holding ● | 65 | ||||||
| 5 | Zeltiq Aesthetics, Inc. ● | 124 | ||||||
| 868 | ||||||||
| Insurance - 2.1% | ||||||||
| 3 | Brown & Brown, Inc. | 101 | ||||||
| 6 | Jardine Lloyd Thompson Group plc | 92 | ||||||
| 7 | Mediolanum S.p.A. | 46 | ||||||
| 2 | Mercury General Corp. | 102 | ||||||
| 341 | ||||||||
| Materials - 4.7% | ||||||||
| 1 | Balchem Corp. | 73 | ||||||
| 4 | Daio Paper Corp. ● | 34 | ||||||
| 7 | Essentra plc | 79 | ||||||
| 2 | H.B. Fuller Co. | 67 | ||||||
| 12 | Iluka Resources Ltd. | 78 | ||||||
| 8 | Impala Platinum Holdings Ltd. ● | 61 | ||||||
| 7 | Louisiana-Pacific Corp. ● | 105 | ||||||
| 2 | LSB Industries, Inc. ● | 62 | ||||||
| 25 | Nampak Ltd. ● | 103 | ||||||
| 43 | Nine Dragons Paper Holdings | 33 | ||||||
| 24 | UACJ Corp. | 88 | ||||||
| 783 | ||||||||
| Retailing - 3.6% | ||||||||
| 1 | ASOS plc ● | 34 | ||||||
| 2 | Don Quijote Holdings Co., Ltd. | 112 | ||||||
| 15 | Groupon, Inc. ● | 112 | ||||||
| 3 | HomeAway, Inc. ● | 109 | ||||||
| 113 | Intime Retail Group Co., Ltd. | 98 | ||||||
| 18 | Ocado Group plc ● | 72 | ||||||
| 3 | Yoox S.p.A. ● | 54 | ||||||
| 591 | ||||||||
| Semiconductors and Semiconductor Equipment - 0.9% | ||||||||
| 12 | Applied Micro Circuits Corp. ● | 77 | ||||||
| 3 | Ultratech Stepper, Inc. ● | 67 | ||||||
| 144 | ||||||||
| Software and Services - 7.4% | ||||||||
| 3 | Cornerstone OnDemand, Inc. ● | 100 | ||||||
| 2 | DealerTrack Technologies, Inc. ● | 110 | ||||||
| 3 | GMO Payment Gateway, Inc. | 71 | ||||||
| 2 | Guidewire Software, Inc. ● | 115 | ||||||
| 2 | Interactive Intelligence Group ● | 115 | ||||||
| 9 | Iress Market Technology Ltd. | 74 | ||||||
| 4 | Marketo, Inc. ● | 114 | ||||||
| 5 | RealPage, Inc. ● | 90 | ||||||
| 5 | RetailMeNot, Inc. ● | 114 | ||||||
| 1 | SPS Commerce, Inc. ● | 37 | ||||||
| 2 | Synchronoss Technologies, Inc. ● | 85 | ||||||
| 3 | Wirecard AG | 97 | ||||||
| 3 | Xoom Corp. ● | 44 | ||||||
| 1 | Yelp, Inc. ● | 72 | ||||||
| 1,238 | ||||||||
| Technology Hardware and Equipment - 2.6% | ||||||||
| 5 | Avigilon Corp. ● | 75 | ||||||
| 102 | Digital China Holdings Ltd. | 95 | ||||||
| 5 | Finisar Corp. ● | 85 | ||||||
| 3 | Topcon Corp. | 68 | ||||||
| 2 | ViaSat, Inc. ● | 109 | ||||||
| 432 | ||||||||
| Telecommunication Services - 0.8% | ||||||||
| 6 | 8x8, Inc. ● | 48 | ||||||
| 4 | Telecom Plus plc | 93 | ||||||
| 141 | ||||||||
| Transportation - 2.4% | ||||||||
| 3 | D/S Norden A/S | 83 | ||||||
| 8 | Grupo Aeroportuario del Sureste S.A.B. de C.V. | 106 | ||||||
| 82 | Pacific Basin Ship | 39 | ||||||
| — | Panalpina Welttransport Holding AG | 63 | ||||||
| 3 | XPO Logistics, Inc. ● | 104 | ||||||
| 395 | ||||||||
The accompanying notes are an integral part of these financial statements.
| 8 |
Hartford Long/Short Global Equity Fund
Schedule of Investments – (continued)
October 31, 2014
(000’s Omitted)
| Shares or Principal Amount | Market Value ╪ | |||||||||||
| Securities Sold Short - 59.6% - (continued) | ||||||||||||
| Common Stocks - 59.6% - (continued) | ||||||||||||
| Utilities - 1.2% | ||||||||||||
| 148 | Beijing Enterprises Water Group Ltd. | $ | 106 | |||||||||
| 2 | Rubis SCA ● | 99 | ||||||||||
| 205 | ||||||||||||
| Total Common Stocks | ||||||||||||
| (Proceeds $10,317) | $ | 9,896 | ||||||||||
| Total Securities Sold Short | ||||||||||||
| (Proceeds $10,317) | 59.6 | % | $ | 9,896 | ||||||||
The accompanying notes are an integral part of these financial statements.
| 9 |
Hartford Long/Short Global Equity Fund
Schedule of Investments – (continued)
October 31, 2014
(000’s Omitted)
Note: Percentage of investments as shown is the ratio of the total market value to total net assets.
Prices of foreign equities that are principally traded on certain foreign markets may be adjusted daily pursuant to a fair value pricing service approved by the Board of Directors in order to reflect an adjustment for factors occurring after the close of certain foreign markets but before the close of the New York Stock Exchange.
Other than the industry classifications "Other Investment Pools and Funds" and "Exchange Traded Funds," equity industry classifications used in this report are the Global Industry Classification Standard, which was developed by and is the exclusive property and service mark of MSCI, Inc. and Standard & Poor’s.
For Fund compliance purposes, the Fund may not use the same classification system shown in this report as these classifications are used for reporting ease.
| ▲ | At October 31, 2014, the cost of securities for federal income tax purposes was $10,582, net of short proceeds of $10,320, and the aggregate gross unrealized appreciation and depreciation based on that cost were: |
| Unrealized Appreciation | $ | 1,235 | ||
| Unrealized Depreciation | (1,717 | ) | ||
| Net Unrealized Depreciation | $ | (482 | ) |
| ● | Non-income producing. |
Foreign Currency Contracts Outstanding at October 31, 2014
| Unrealized Appreciation/(Depreciation) | ||||||||||||||||||||||
| Currency | Buy / Sell | Delivery Date | Counterparty | Contract Amount | Market Value ╪ | Asset | Liability | |||||||||||||||
| JPY | Sell | 11/06/2014 | DEUT | $ | 29 | $ | 29 | $ | – | $ | – | |||||||||||
| JPY | Sell | 11/04/2014 | SSG | 10 | 9 | 1 | – | |||||||||||||||
| Total | $ | 1 | $ | – | ||||||||||||||||||
| ╪ | See Significant Accounting Policies of accompanying Notes to Financial Statements regarding valuation of securities. |
| GLOSSARY: (abbreviations used in preceding Schedule of Investments) | |
| Counterparty Abbreviations: | |
| DEUT | Deutsche Bank Securities, Inc. |
| SSG | State Street Global Markets LLC |
| Currency Abbreviations: | |
| JPY | Japanese Yen |
| Index Abbreviations: | |
| EAFE | Europe, Australasia and Far East |
| Other Abbreviations: | |
| ADR | American Depositary Receipt |
| ETF | Exchange Traded Fund |
| REIT | Real Estate Investment Trust |
The accompanying notes are an integral part of these financial statements.
| 10 |
Hartford Long/Short Global Equity Fund
Schedule of Investments – (continued)
October 31, 2014
(000’s Omitted)
Investment Valuation Hierarchy Level Summary
October 31, 2014
| Total | Level 1 ♦ | Level 2 ♦ | Level 3 | |||||||||||||
| Assets: | ||||||||||||||||
| Common Stocks | ||||||||||||||||
| Automobiles and Components | $ | 382 | $ | 105 | $ | 277 | $ | – | ||||||||
| Banks | 1,208 | 555 | 653 | – | ||||||||||||
| Capital Goods | 1,436 | 1,080 | 356 | – | ||||||||||||
| Consumer Durables and Apparel | 373 | 286 | 87 | – | ||||||||||||
| Consumer Services | 557 | 408 | 149 | – | ||||||||||||
| Diversified Financials | 1,021 | 860 | 161 | – | ||||||||||||
| Energy | 985 | 895 | 90 | – | ||||||||||||
| Food, Beverage and Tobacco | 515 | 119 | 396 | – | ||||||||||||
| Health Care Equipment and Services | 1,430 | 946 | 484 | – | ||||||||||||
| Household and Personal Products | 108 | 108 | – | – | ||||||||||||
| Insurance | 733 | 248 | 485 | – | ||||||||||||
| Materials | 1,981 | 1,302 | 679 | – | ||||||||||||
| Media | 369 | 369 | – | – | ||||||||||||
| Pharmaceuticals, Biotechnology and Life Sciences | 579 | 579 | – | – | ||||||||||||
| Real Estate | 1,098 | 620 | 478 | – | ||||||||||||
| Retailing | 1,054 | 346 | 708 | – | ||||||||||||
| Semiconductors and Semiconductor Equipment | 1,044 | 863 | 181 | – | ||||||||||||
| Software and Services | 1,307 | 1,130 | 177 | – | ||||||||||||
| Technology Hardware and Equipment | 382 | 382 | – | – | ||||||||||||
| Telecommunication Services | 379 | 228 | 151 | – | ||||||||||||
| Transportation | 1,407 | 745 | 662 | – | ||||||||||||
| Utilities | 589 | 207 | 382 | – | ||||||||||||
| Total | 18,937 | 12,381 | 6,556 | – | ||||||||||||
| Exchange Traded Funds | 1,049 | 1,049 | – | – | ||||||||||||
| Short-Term Investments | 10 | 10 | – | – | ||||||||||||
| Total | $ | 19,996 | $ | 13,440 | $ | 6,556 | $ | – | ||||||||
| Foreign Currency Contracts* | $ | 1 | $ | – | $ | 1 | $ | – | ||||||||
| Total | $ | 1 | $ | – | $ | 1 | $ | – | ||||||||
| Liabilities: | ||||||||||||||||
| Securities Sold Short | ||||||||||||||||
| Automobiles and Components | $ | 258 | $ | – | $ | 258 | $ | – | ||||||||
| Banks | 480 | 166 | 314 | – | ||||||||||||
| Capital Goods | 1,177 | 650 | 527 | – | ||||||||||||
| Commercial and Professional Services | 221 | 109 | 112 | – | ||||||||||||
| Consumer Durables and Apparel | 161 | 161 | – | – | ||||||||||||
| Consumer Services | 332 | 332 | – | – | ||||||||||||
| Diversified Financials | 1,075 | 513 | 562 | – | ||||||||||||
| Energy | 367 | 152 | 215 | – | ||||||||||||
| Food and Staples Retailing | 200 | 98 | 102 | – | ||||||||||||
| Food, Beverage and Tobacco | 487 | 281 | 206 | – | ||||||||||||
| Health Care Equipment and Services | 868 | 601 | 267 | – | ||||||||||||
| Insurance | 341 | 295 | 46 | – | ||||||||||||
| Materials | 783 | 307 | 476 | – | ||||||||||||
| Retailing | 591 | 221 | 370 | – | ||||||||||||
| Semiconductors and Semiconductor Equipment | 144 | 144 | – | – | ||||||||||||
| Software and Services | 1,238 | 996 | 242 | – | ||||||||||||
| Technology Hardware and Equipment | 432 | 194 | 238 | – | ||||||||||||
| Telecommunication Services | 141 | 48 | 93 | – | ||||||||||||
| Transportation | 395 | 210 | 185 | – | ||||||||||||
| Utilities | 205 | – | 205 | – | ||||||||||||
| Total | $ | 9,896 | $ | 5,478 | $ | 4,418 | $ | – | ||||||||
| ♦ | For the period August 29, 2014 (commencement of operations) through October 31, 2014, there were no transfers between Level 1 and Level 2. |
| * | Derivative instruments (excluding purchased and written options, if applicable) are valued at the unrealized appreciation/depreciation on the investments. |
The accompanying notes are an integral part of these financial statements.
| 11 |
Hartford Long/Short Global Equity Fund
Statement of Assets and Liabilities
October 31, 2014
(000’s Omitted)
| Assets: | ||||
| Investments in securities, at market value (cost $20,876) | $ | 19,996 | ||
| Cash | 6,550 | |||
| Unrealized appreciation on foreign currency contracts | 1 | |||
| Receivables: | ||||
| Investment securities sold | 231 | |||
| Fund shares sold | 1 | |||
| Dividends and interest | 16 | |||
| Other assets | 58 | |||
| Total assets | 26,853 | |||
| Liabilities: | ||||
| Bank overdraft — foreign cash | 5 | |||
| Securities sold short, at market value (proceeds $10,317) | 9,896 | |||
| Payables: | ||||
| Investment securities purchased | 335 | |||
| Investment management fees | 4 | |||
| Distribution fees | 1 | |||
| Dividends on securities sold short | 9 | |||
| Accrued expenses | 11 | |||
| Total liabilities | 10,261 | |||
| Net assets | $ | 16,592 | ||
| Summary of Net Assets: | ||||
| Capital stock and paid-in-capital | $ | 17,246 | ||
| Net investment loss | (22 | ) | ||
| Accumulated net realized loss | (173 | ) | ||
| Unrealized depreciation of investments and the translation of assets and liabilities denominated in foreign currency | (459 | ) | ||
| Net assets | $ | 16,592 | ||
| Shares authorized | 300,000 | |||
| Par value | $ | 0.001 | ||
| Class A: Net asset value per share/Maximum offering price per share | $9.62/$10.18 | |||
| Shares outstanding | 403 | |||
| Net assets | $ | 3,871 | ||
| Class C: Net asset value per share | $ | 9.61 | ||
| Shares outstanding | 209 | |||
| Net assets | $ | 2,004 | ||
| Class I: Net asset value per share | $ | 9.62 | ||
| Shares outstanding | 414 | |||
| Net assets | $ | 3,984 | ||
| Class Y: Net asset value per share | $ | 9.62 | ||
| Shares outstanding | 700 | |||
| Net assets | $ | 6,733 |
The accompanying notes are an integral part of these financial statements.
| 12 |
Hartford Long/Short Global Equity Fund
Statement of Operations
For the Period August 29, 2014 (commencement of operations) through October 31, 2014
(000’s Omitted)
| Investment Income: | ||||
| Dividends | $ | 58 | ||
| Interest | — | |||
| Less: Foreign tax withheld | (5 | ) | ||
| Total investment income | 53 | |||
| Expenses: | ||||
| Investment management fees | 37 | |||
| Transfer agent fees | ||||
| Class A | — | |||
| Class C | — | |||
| Class I | — | |||
| Class Y | — | |||
| Distribution fees | ||||
| Class A | 2 | |||
| Class C | 3 | |||
| Custodian fees | — | |||
| Accounting services fees | 1 | |||
| Registration and filing fees | 5 | |||
| Board of Directors' fees | — | |||
| Dividend and interest expense on securities sold short | 20 | |||
| Audit fees | 5 | |||
| Short position fees | 10 | |||
| Other expenses | 3 | |||
| Total expenses (before waivers) | 86 | |||
| Expense waivers | (12 | ) | ||
| Total waivers | (12 | ) | ||
| Total expenses, net | 74 | |||
| Net Investment Loss | (21 | ) | ||
| Net Realized Loss on Investments and Foreign Currency Transactions: | ||||
| Net realized loss on investments | (177 | ) | ||
| Net realized gain on securities sold short | 4 | |||
| Net realized loss on foreign currency contracts | (16 | ) | ||
| Net realized gain on other foreign currency transactions | 15 | |||
| Net Realized Loss on Investments and Foreign Currency Transactions | (174 | ) | ||
| Net Changes in Unrealized Depreciation of Investments and Foreign Currency Transactions: | ||||
| Net unrealized depreciation of investments | (880 | ) | ||
| Net unrealized appreciation of securities sold short | 421 | |||
| Net unrealized appreciation of foreign currency contracts | 1 | |||
| Net unrealized depreciation of translation of other assets and liabilities in foreign currencies | (1 | ) | ||
| Net Changes in Unrealized Depreciation of Investments and Foreign Currency Transactions | (459 | ) | ||
| Net Loss on Investments and Foreign Currency Transactions | (633 | ) | ||
| Net Decrease in Net Assets Resulting from Operations | $ | (654 | ) |
The accompanying notes are an integral part of these financial statements.
| 13 |
Hartford Long/Short Global Equity Fund
Statement of Changes in Net Assets
(000’s Omitted)
For
the Period | ||||
| Operations: | ||||
| Net investment loss | $ | (21 | ) | |
| Net realized loss on investments and foreign currency transactions | (174 | ) | ||
| Net unrealized depreciation of investments and foreign currency transactions | (459 | ) | ||
| Net Decrease in Net Assets Resulting from Operations | (654 | ) | ||
| Capital Share Transactions: | ||||
| Class A | 4,026 | |||
| Class C | 2,085 | |||
| Class I | 4,135 | |||
| Class Y | 7,000 | |||
| Net increase from capital share transactions | 17,246 | |||
| Net Increase in Net Assets | 16,592 | |||
| Net Assets: | ||||
| Beginning of period | — | |||
| End of period | $ | 16,592 | ||
| Undistributed (distributions in excess of) net investment income | $ | (22 | ) | |
* Commencement of operations.
The accompanying notes are an integral part of these financial statements.
| 14 |
Hartford Long/Short Global Equity Fund
Notes to Financial Statements
October 31, 2014
(000’s Omitted)
Organization:
The Hartford Mutual Funds, Inc. (“Company”) is an open-end management investment company comprised of forty-two portfolios. Financial statements for Hartford Long/Short Global Equity Fund (the "Fund"), a series of the Company, are included in this report.
The Company is organized under the laws of the State of Maryland and is registered with the Securities and Exchange Commission (“SEC”) under the Investment Company Act of 1940, as amended (“1940 Act”). The Fund is a diversified open-end management investment company. The Fund is an investment company and applies specialized accounting and reporting under Accounting Standards Codification Topic 946, Financial Services - Investment Companies.
Class A shares are sold with a front-end sales charge of up to 5.50%. Class C shares are sold with a contingent deferred sales charge of up to 1.00% on shares redeemed within twelve months of purchase. Class I shares are sold without sales charges to certain eligible investors primarily through advisory fee-based wrap programs. Class Y shares, which are sold to certain eligible institutional investors, are sold without a sales charge. All classes of shares have identical voting, redemption, dividend, liquidation and other rights and the same terms and conditions, with the exceptions that each class may have different expenses, which may affect performance.
Significant Accounting Policies:
The following is a summary of significant accounting policies of the Fund in the preparation of its financial statements, which are in accordance with United States generally accepted accounting principles (“U.S. GAAP”). The preparation of financial statements in accordance with U.S. GAAP may require management to make estimates and assumptions that affect the reported amounts of assets and liabilities and disclosure of contingent assets and liabilities at the date of the financial statements and the reported amounts of increases and decreases in net assets from operations during the reporting period. Actual results could differ from those estimates.
Determination of Net Asset Value – The per share net asset value ("NAV") of each class of the Fund's shares is determined as of the close of regular trading (normally 4:00 p.m. Eastern Time) (the “NYSE Close”) on each day that the New York Stock Exchange (the “Exchange”) is open (“Valuation Date”). Information that becomes known to the Fund after the NAV has been calculated on a particular day will not generally be used to retroactively adjust the NAV determined earlier that day.
Investment Valuation and Fair Value Measurements – For purposes of calculating the NAV, portfolio investments and other assets held by the Fund's portfolio for which market quotes are readily available are valued at market value. Market value is generally determined on the basis of last reported sales prices or official close price. If no sales are reported, market value is based on quotes obtained from a quotation reporting system, established market makers, or independent pricing services. If market prices are not readily available or are deemed unreliable, the Fund will use the fair value of the investment as determined in good faith under policies and procedures established by and under the supervision of the Company's Board of Directors. Market quotes are considered not readily available where there is an absence of current or reliable market-based data (e.g., trade information or indicative market quotes), including where events occur after the close of the relevant market, but prior to the NYSE Close, that materially affect the values of the Fund's portfolio investments or assets. In addition, market quotes are considered not readily available when, due to extraordinary circumstances, the exchanges or markets on which the investments trade do not open for trading for the entire day and no other market prices are available. In addition, prices of foreign equities that are principally traded on certain foreign markets may be adjusted daily pursuant to a fair value pricing service approved by the Board of Directors in order to reflect an adjustment for the factors occurring after the close of certain foreign markets but before the NYSE Close. Investments that are primarily traded on foreign markets may trade on days that are not business days of the Fund. The value of the foreign investments in which the Fund invests may change on days when a shareholder will not be able to purchase or redeem shares of the Fund. Fair value pricing is subjective in nature and the use of fair value pricing by the Fund may cause the NAV of its shares to differ significantly from the NAV that would have been calculated using market prices at the close of the exchange on which a portfolio investment is primarily traded. There can be no assurance that the Fund could obtain the fair market value assigned to an investment if the Fund were to sell the investment at approximately the time at which the Fund determines its NAV.
Investments valued in currencies other than U.S. dollars are converted to U.S. dollars using exchange rates obtained from independent pricing services for calculation of the NAV. As a result, the NAV of the Fund’s shares may be affected by changes in the value of currencies in relation to the U.S. dollar. The value of investments traded in markets outside the United States or denominated
| 15 |
Hartford Long/Short Global Equity Fund
Notes to Financial Statements – (continued)
October 31, 2014
(000’s Omitted)
in currencies other than the U.S. dollar may be affected significantly on a day that the NYSE is closed and the market value may change on days when an investor is not able to purchase, redeem or exchange shares of the Fund.
Foreign currency contracts represent agreements to exchange currencies on specific future dates at predetermined rates. Foreign currency contracts are valued using foreign currency exchange rates and forward rates as provided by an independent pricing service on the Valuation Date.
Investments in open-end mutual funds are valued at the respective NAV of each open-end mutual fund on the Valuation Date.
Financial instruments for which prices are not available from an independent pricing service may be valued using market quotations obtained from one or more dealers that make markets in the respective financial instrument in accordance with procedures established by the Company's Board of Directors.
U.S. GAAP defines fair value as the price that the Fund would receive to sell an asset or pay to transfer a liability in an orderly transaction between market participants. The U.S. GAAP fair value measurement standards require disclosure of a fair value hierarchy for each major category of assets and liabilities. Various inputs are used in determining the fair value of the Fund’s investments. These inputs are summarized into three broad hierarchy levels. This hierarchy is based on whether the valuation inputs are observable or unobservable. These levels are:
Level 1 – Quoted prices in active markets for identical investments. Level 1 may include exchange traded instruments, such as domestic equities, some foreign equities, options, futures, mutual funds, exchange traded funds, rights and warrants.
Level 2 – Observable inputs other than Level 1 prices, such as quoted prices for similar investments; quoted prices in markets that are not active; or other inputs that are observable or can be corroborated by observable market data. Level 2 may include debt investments that are traded less frequently than exchange traded instruments and which are valued using independent pricing services; foreign equities, which are principally traded on certain foreign markets and are adjusted daily pursuant to a fair value pricing service in order to reflect an adjustment for the factors occurring after the close of certain foreign markets but before the NYSE Close; senior floating rate interests, which are valued using an aggregate of dealer bids; short-term investments, which are valued at amortized cost; and swaps, which are valued based upon the terms of each swap contract.
Level 3 – Significant unobservable inputs that are supported by limited or no market activity. Level 3 may include financial instruments whose values are determined using indicative market quotes or require significant management judgment or estimation. These unobservable valuation inputs may include estimates for current yields, maturity/duration, prepayment speed, and indicative market quotes for comparable investments along with other assumptions relating to credit quality, collateral value, complexity of the investment structure, general market conditions and liquidity. This category may include investments where trading has been halted or there are certain restrictions on trading. While these investments are priced using unobservable inputs, the valuation of these investments reflects the best available data and management believes the prices are a reasonable representation of exit price.
The Board of Directors of the Company generally reviews and approves the “Procedures for Valuation of Portfolio Securities” at least once a year. These procedures define how investments are to be valued, including the formation and activities of a Valuation Committee. The Valuation Committee is responsible for determining in good faith the fair value of investments when the value cannot be obtained from primary pricing services or alternative sources or if the valuation of an investment as provided by the primary pricing service or alternative source is believed not to reflect the investment’s fair value as of the Valuation Date. Voting members of the Valuation Committee include the Fund's Treasurer or designee and a Vice President of the investment manager or designee. An Assistant Vice President of the Fund with legal expertise or designee is also included on the Valuation Committee as a non-voting advisory member. In addition, the Fund’s Chief Compliance Officer shall designate a member of the compliance group to attend Valuation Committee meetings as a non-voting resource, to monitor for and provide guidance with respect to compliance with these procedures. Two members of the Valuation Committee or their designees, representing different departments, shall constitute a quorum for purposes of permitting the Valuation Committee to take action. The Valuation Committee will consider all relevant factors in determining an investment’s fair value, and may seek the advice of the Fund’s sub-adviser, knowledgeable brokers, and legal counsel in making such determination. The Valuation Committee reports to the Audit
| 16 |
Hartford Long/Short Global Equity Fund
Notes to Financial Statements – (continued)
October 31, 2014
(000’s Omitted)
Committee of the Company's Board of Directors. The Audit Committee receives quarterly written reports which include details of all fair-valued investments, including the reason for the fair valuation, and an indication, when possible, of the accuracy of the valuation by disclosing the next available reliable public price quotation or the disposition price of such investments (the “look-back” test). The Board of Directors then must consider for ratification all of the fair value determinations made during the previous quarter.
Valuation levels are not necessarily indicative of the risk associated with investing in such investments. Individual investments within any of the above mentioned asset classes may be assigned a different hierarchical level than those presented above, as individual circumstances dictate.
For additional information, refer to the Investment Valuation Hierarchy Level Summary which follows the Schedule of Investments.
Investment Transactions and Investment Income – Investment transactions are recorded as of the trade date (the date the order to buy or sell is executed) for financial reporting purposes. Investments purchased or sold on a when-issued or delayed-delivery basis may be settled a month or more after the trade date. Realized gains and losses are determined on the basis of identified cost.
Dividend income from domestic securities is accrued on the ex-dividend date. In general, dividend income from foreign securities is recorded on the ex-date; however, dividend notifications in certain foreign jurisdictions may not be available in a timely manner and as a result, the Fund will record the dividend as soon as the relevant details (i.e., rate per share, payment date, shareholders of record, etc.) are publicly available. Interest income, including amortization of premium, accretion of discounts and additional principal received in-kind in lieu of cash, is accrued on a daily basis.
Foreign Currency Transactions – Assets and liabilities denominated in currencies other than U.S. dollars are translated into U.S. dollars at the exchange rates in effect on the valuation date. Purchases and sales of investments, income and expenses are translated into U.S. dollars at the exchange rates on the dates of such transactions.
The Fund does not isolate that portion of portfolio investment valuation resulting from fluctuations in the foreign currency exchange rates from the fluctuations arising from changes in the market prices of investments held. Exchange rate fluctuations are included with the net realized and unrealized gain or loss on investments in the accompanying financial statements.
Net realized foreign exchange gains or losses arise from sales of foreign currencies and the difference between asset and liability amounts initially stated in foreign currencies and the U.S. dollar value of the amounts actually received or paid. Net unrealized foreign exchange gains or losses arise from changes in the value of other assets and liabilities at the end of the reporting period, resulting from changes in the exchange rates.
Fund Share Valuation and Dividend Distributions to Shareholders – Orders for the Fund’s shares are executed in accordance with the investment instructions of the shareholders. The NAV of the Fund’s shares is determined as of the close of business on each business day of the Exchange. The NAV is determined separately for each class of shares of the Fund by dividing the Fund’s net assets attributable to that class by the number of shares of the class outstanding. Each class of shares offered by the Fund has equal rights as to assets and voting privileges (except that shareholders of a class have exclusive voting rights regarding any matter relating solely to that class of shares). Income and non-class specific expenses are allocated daily to each class on the basis of the relative net assets of the class. Realized and unrealized gains and losses are allocated daily based on the relative net assets of each class of shares of the Fund.
Orders for the purchase of the Fund’s shares received prior to the close of the Exchange on any day the Exchange is open for business are priced at the NAV determined as of the close of the Exchange. Orders received after the close of the Exchange, or on a day on which the Exchange and/or the Fund is not open for business, are priced at the next determined NAV.
Dividends are declared pursuant to a policy adopted by the Company's Board of Directors based upon the investment performance of the Fund. The policy of the Fund is to pay dividends from net investment income and realized gains, if any, at least once a year.
| 17 |
Hartford Long/Short Global Equity Fund
Notes to Financial Statements – (continued)
October 31, 2014
(000’s Omitted)
Net investment income, dividends and distributions from net realized gains and capital are determined in accordance with federal income tax regulations, which may differ from U.S. GAAP with respect to character and timing (see Federal Income Taxes: Distributions and Components of Distributable Earnings and Reclassification of Capital Accounts).
Securities and Other Investments:
Investments Purchased on a When-Issued or Delayed-Delivery Basis – Delivery and payment for investments that have been purchased by the Fund on a forward commitment, or when-issued or delayed-delivery basis, take place beyond the customary settlement period. The Fund may dispose of or renegotiate a delayed-delivery transaction after it is entered into, and may sell delayed-delivery investments before they are delivered, which may result in a realized gain or loss. During this period, such investments are subject to market fluctuations, and the Fund identifies investments segregated in its records with a value at least equal to the amount of the commitment. The Fund had no when-issued or delayed-delivery investments as of October 31, 2014.
Securities Sold Short – As part of its principal investment strategy, the Fund will enter into short sales. In a short sale, the Fund sells a borrowed security (typically from a broker or other institution). The Fund may not always be able to borrow the security at a particular time or at an acceptable price. Thus, there is a risk that the Fund may be unable to implement its investment strategy due to the lack of available stocks or for other reasons. After selling the borrowed security, the Fund is obligated to “cover” the short sale by purchasing the security and returning the security to the lender. If a security sold short increases in price, the Fund may have to cover its short position at a higher price than the short sale price, resulting in a loss. Because the Fund’s loss on a short sale arises from increases in the value of the security sold short, such loss is theoretically unlimited. In certain cases, purchasing a security to cover a short position can itself cause the price of the security to rise further, thereby exacerbating the loss.
Short sales also involve other costs. The Fund must normally repay to the lender an amount equal to any dividends that accrue while the security is on loan. In addition, to borrow the security, the Fund may be required to pay a premium. The Fund also will incur transaction costs in executing short sales. The amount of any gain for the Fund resulting from a short sale will be decreased, and the amount of any loss will be increased, by the amount of the premiums, dividends, interest or expenses the Fund may be required to pay in connection with the short sale. Until the Fund replaces a borrowed security, it is required to maintain a segregated account of cash or liquid assets to cover the Fund’s short position. Investments held in a segregated account cannot be sold while the position they are covering is outstanding, unless they are replaced with similar securities. Additionally, the Fund must maintain sufficient liquid assets (less any additional collateral held by the broker) to cover the short sale obligation. This may limit the Fund’s investment flexibility, as well as its ability to meet redemption or other current obligations.
Dividends declared on short positions existing on the record date are recorded on the ex-dividend date as an expense on the Statement of Operations.
Financial Derivative Instruments:
The following disclosures contain information on how and why the Fund uses derivative instruments, the credit-risk-related contingent features in certain derivative instruments and how derivative instruments affect the Fund’s financial position and results of operations. The location and fair value amounts of these instruments on the Statement of Assets and Liabilities and the realized gains and losses and changes in unrealized gains and losses on the Statement of Operations, each categorized by type of derivative contract, are included in the following Additional Derivative Instrument Information footnote. The derivative instruments outstanding as of period-end are disclosed in the notes to the Schedule of Investments, if applicable. The amounts of realized gains and losses and changes in unrealized gains and losses on derivative instruments during the period are disclosed in the Statement of Operations.
Foreign Currency Contracts – The Fund may enter into foreign currency contracts that obligate the Fund to purchase or sell currencies at specified future dates. Foreign currency contracts are used to hedge the currency exposure associated with some or all of the Fund’s investments and/or as part of an investment strategy. Foreign currency contracts are marked to market daily and the change in value is recorded by the Fund as an unrealized gain or loss. The Fund will record a realized gain or loss when the foreign currency contract is settled.
| 18 |
Hartford Long/Short Global Equity Fund
Notes to Financial Statements – (continued)
October 31, 2014
(000’s Omitted)
Foreign currency contracts involve elements of market risk in excess of the amounts reflected in the Statement of Assets and Liabilities. In addition, risks may arise upon entering into these contracts from the potential inability of the counterparties to meet the terms of the contracts and from unanticipated movements in the value of the foreign currencies relative to the U.S. dollar. The Fund, as shown on the Schedule of Investments, had outstanding foreign currency contracts as of October 31, 2014.
Additional Derivative Instrument Information:
Fair Value of Derivative Instruments on the Statement of Assets and Liabilities as of October 31, 2014:
| Risk Exposure Category | ||||||||||||||||||||||||||||
| Interest Rate Contracts | Foreign Exchange Contracts | Credit Contracts | Equity Contracts | Commodity Contracts | Other Contracts | Total | ||||||||||||||||||||||
| Assets: | ||||||||||||||||||||||||||||
| Unrealized appreciation on foreign currency contracts | $ | — | $ | 1 | $ | — | $ | — | $ | — | $ | — | $ | 1 | ||||||||||||||
| Total | $ | — | $ | 1 | $ | — | $ | — | $ | — | $ | — | $ | 1 | ||||||||||||||
The volume of derivatives that is presented in the Schedule of Investments is consistent with the derivative activity during the period August 29, 2014 (commencement of operations) through October 31, 2014.
The Effect of Derivative Instruments on the Statement of Operations for the period August 29, 2014 (commencement of operations) through October 31, 2014:
| Risk Exposure Category | ||||||||||||||||||||||||||||
| Interest Rate Contracts | Foreign Exchange Contracts | Credit Contracts | Equity Contracts | Commodity Contracts | Other Contracts | Total | ||||||||||||||||||||||
| Realized Loss on Derivatives Recognized as a Result of Operations: | ||||||||||||||||||||||||||||
| Net realized loss on foreign currency contracts | $ | — | $ | (16 | ) | $ | — | $ | — | $ | — | $ | — | $ | (16 | ) | ||||||||||||
| Total | $ | — | $ | (16 | ) | $ | — | $ | — | $ | — | $ | — | $ | (16 | ) | ||||||||||||
| Net Change in Unrealized Appreciation (Depreciation) on Derivatives Recognized as a Result of Operations: | ||||||||||||||||||||||||||||
| Net change in unrealized appreciation of foreign currency contracts | $ | — | $ | 1 | $ | — | $ | — | $ | — | $ | — | $ | 1 | ||||||||||||||
| Total | $ | — | $ | 1 | $ | — | $ | — | $ | — | $ | — | $ | 1 | ||||||||||||||
The derivatives held by the Fund as of October 31, 2014 are not subject to a master netting arrangement; therefore, no balance sheet offsetting disclosure is presented.
Principal Risks:
The Fund may be exposed to counterparty risk, or the risk that an institution or other entity with which the Fund has unsettled or open transactions will default.
If the Fund invests directly in foreign currencies or in securities that trade in, and receive revenues in, foreign currencies, or in derivatives that provide exposure to foreign currencies, it will be subject to the risk that those currencies will decline in value relative to the base currency (U.S. dollars) of the Fund, or, in the case of hedging positions, that the Fund’s base currency will decline in value relative to the currency being hedged. Currency rates in foreign countries may fluctuate significantly over short periods of time for a number of reasons, including changes in interest rates, intervention (or the failure to intervene) by U.S. or foreign governments, central banks or supranational entities, such as the International Monetary Fund, or by the imposition of currency controls or other political developments in the United States or abroad. As a result, the Fund’s investments in foreign currency denominated securities may reduce the returns of the Fund. The market values of equity securities, such as common stocks and preferred stocks, or equity related investments, such as futures and options, may decline due to general market conditions which are not specifically related to a particular company, such as real or perceived adverse economic conditions, changes in the general outlook for corporate earnings, changes in interest or currency rates or adverse investor sentiment generally. The market value of equity securities may also decline due to factors which affect a particular industry or industries, such as labor shortages or increased production costs and competitive
| 19 |
Hartford Long/Short Global Equity Fund
Notes to Financial Statements – (continued)
October 31, 2014
(000’s Omitted)
conditions within an industry. Equity securities and equity related investments generally have greater market price volatility than fixed income securities.
Federal Income Taxes:
Federal Income Taxes – For federal income tax purposes, the Fund intends to continue to qualify as a Regulated Investment Company ("RIC") under Subchapter M of the Internal Revenue Code (“IRC”) by distributing substantially all of its taxable net investment income and net realized capital gains to its shareholders and otherwise complying with the requirements of the IRC. The Fund has distributed substantially all of its income and capital gains in prior years, if applicable, and intends to distribute substantially all of its income and capital gains during the calendar year ending December 31, 2014. Accordingly, no provision for federal income or excise taxes has been made in the accompanying financial statements. Distributions from short-term capital gains are treated as ordinary income distributions for federal income tax purposes.
Net Investment Income (Loss), Net Realized Gains (Losses) and Distributions – Net investment income (loss) and net realized gains (losses) may differ for financial statement and tax purposes primarily because of losses deferred due to wash sale adjustments, foreign currency gains and losses, adjustments related to Passive Foreign Investment Companies ("PFICs"), Real Estate Investment Trusts ("REITs"), RICs, certain derivatives and partnerships. The character of distributions made during the year from net investment income or net realized gains may differ from their ultimate characterization for federal income tax purposes. Also, due to the timing of dividend distributions, the fiscal year in which amounts are distributed may differ from the year that the income or realized gains (losses) were recorded by the Fund.
Components of Distributable Earnings – The Fund’s components of distributable earnings (deficit) on a tax basis at October 31, 2014, are as follows:
| Amount | ||||
| Accumulated Capital and Other Losses* | $ | (173 | ) | |
| Unrealized Depreciation† | (481 | ) | ||
| Total Accumulated Deficit | $ | (654 | ) | |
| * | The Fund has capital loss carryforwards that are identified in the Capital Loss Carryforward note that follows. |
| † | Differences between book-basis and tax-basis unrealized appreciation (depreciation) may be attributable to the losses deferred due to wash sale adjustments, foreign currency gains and losses, adjustments related to PFICs, REITs, RICs, certain derivatives and partnerships. |
Reclassification of Capital Accounts – The Fund may record reclassifications in its capital accounts. These reclassifications have no impact on the total net assets of the Fund. The reclassifications are a result of permanent differences between U.S. GAAP and tax accounting for such items as foreign currency, PFICs, expiration or utilization of capital loss carryforwards or net operating losses. Adjustments are made to reflect the impact these items have on current and future distributions to shareholders. Therefore, the source of the Fund’s distributions may be shown in the accompanying Statement of Changes in Net Assets as from undistributed net investment income, from accumulated net realized gains on investments or from capital depending on the type of book and tax differences that exist. For the period ended October 31, 2014, the Fund recorded reclassifications to increase (decrease) the accounts listed below:
| Amount | ||||
| Undistributed Net Investment Income (Loss) | $ | (1 | ) | |
| Accumulated Net Realized Gain (Loss) | 1 | |||
Capital Loss Carryforward – Under the Regulated Investment Company Modernization Act of 2010 funds are permitted to carry forward capital losses for an unlimited period. Additionally, capital loss carryforwards retain their character as either short-term or long-term capital losses rather than being considered all short-term as permitted under prior regulation.
| 20 |
Hartford Long/Short Global Equity Fund
Notes to Financial Statements – (continued)
October 31, 2014
(000’s Omitted)
At October 31, 2014 (tax year end), the Fund had capital loss carryforwards for U.S. federal income tax purposes as follows:
| Amount | ||||
| Short-Term Capital Loss Carryforward | $ | 160 | ||
| Total | $ | 160 | ||
As of October 31, 2014, the Fund elected to defer the following Late-Year Ordinary Losses:
| Amount | ||||
| Ordinary Income | $ | 13 | ||
Accounting for Uncertainty in Income Taxes – The Fund has adopted financial reporting rules that require the Fund to analyze all open tax years, as defined by the statute of limitations, for all major jurisdictions. Generally, tax authorities can examine all tax returns filed for the last three years. The Fund does not have an examination in progress.
The Fund is also not aware of any tax positions for which it is reasonably possible that the total amounts of unrecognized tax benefits will significantly change in the next twelve months.
Expenses:
Investment Management Agreement – Hartford Funds Management Company, LLC ("HFMC") serves as the Fund’s investment manager pursuant to an Investment Management Agreement with the Company. HFMC is an indirect wholly owned subsidiary of The Hartford Financial Services Group, Inc. ("The Hartford"). The investment manager has overall investment supervisory responsibility for the Fund. In addition, the investment manager provides administrative personnel, services, equipment, facilities and office space for proper operation of the Fund. HFMC has contracted with Wellington Management Company, LLP ("Wellington Management") under a sub-advisory agreement for the provision of day-to-day investment management services to the Fund in accordance with the Fund’s investment objective and policies. The Fund pays a fee to the investment manager, a portion of which may be used to compensate Wellington Management.
The schedule below reflects the rates of compensation paid to the investment manager for investment management services rendered as of October 31, 2014; the rates are accrued daily and paid monthly:
| Average Daily Net Assets | Annual Fee | |||
| On first $1 billion | 1.400% | |||
| On next $1 billion | 1.390% | |||
| Over $2 billion | 1.380% | |||
Accounting Services Agreement – Pursuant to the Fund Accounting Agreement between HFMC and the Company, on behalf of the Fund, HFMC provides accounting services to the Fund and receives monthly compensation based on the Fund’s average daily net assets at the rates set forth below. The Fund’s accounting services fees are accrued daily and paid monthly.
| Average Daily Net Assets | Annual Fee | |||
| On first $5 billion | 0.025% | |||
| On next $5 billion | 0.020% | |||
| Over $10 billion | 0.015% | |||
| 21 |
Hartford Long/Short Global Equity Fund
Notes to Financial Statements – (continued)
October 31, 2014
(000’s Omitted)
Operating Expenses – Allocable expenses incurred by the Company are allocated to each Fund and allocated to classes within the Fund in proportion to the average daily net assets of the Fund and each class, except where allocation of certain expenses is more fairly made directly to the Fund or to specific classes within a Fund. As of October 31, 2014, HFMC contractually limited the total operating expenses of this Fund, exclusive of taxes, interest expense, brokerage commissions, acquired fund fees and expenses, dividend and interest expenses on short sales and extraordinary expenses, through February 29, 2016 as follows:
| Class A | Class C | Class I | Class Y | |||||||||||
| 1.90% | 2.65% | 1.65% | 1.50% | |||||||||||
Distribution and Service Plan for Class A and C Shares – Hartford Funds Distributors, LLC ("HFD"), an indirect wholly owned subsidiary of The Hartford, is the principal underwriter and distributor of the Fund. HFD is engaged in distribution activities, which include marketing and distribution of shares through broker/dealers, financing distribution costs and maintaining financial books and records. For the period August 29, 2014 (commencement of operations) through October 31, 2014, HFD received front-end load sales charges of zero and contingent deferred sales charges of zero from the Fund.
The Fund has adopted a Distribution and Service Plan in accordance with Rule 12b-1 of the 1940 Act to compensate the distributor (HFD) for activities intended to result in the sale and distribution of Class A and C shares and for providing services for shareholders. The Rule 12b-1 plan applicable to Class A shares of the Fund provides for payment of a Rule 12b-1 fee of 0.25% of average daily net assets. Some or all of the fee may be used for shareholder servicing expenses with the remainder used for distribution expenses. Under the Class C Plan, the Fund pays the distributor 1.00% of the average daily net assets of Class C shares outstanding, 0.25% of which is intended as a fee for services provided to existing shareholders with the remainder used for distribution expenses. For Class C shares, some or the entire fee may be remitted to broker/dealers for distribution and/or shareholder account services. The Fund’s 12b-1 fees are accrued daily and paid monthly or at such other intervals as the Board of Directors may determine.
Other Related Party Transactions – Certain officers of the Fund are directors and/or officers of HFMC and/or The Hartford or its subsidiaries. For the period August 29, 2014 (commencement of operations) through October 31, 2014, a portion of the Fund’s Chief Compliance Officer’s compensation was paid by all of the investment companies in the Hartford fund complex. No amount was allocated to the Fund. Hartford Administrative Services Company (“HASCO”), an indirect wholly-owned subsidiary of The Hartford, provides transfer agent services to the Fund. HASCO has contractually agreed to reimburse any portion of the transfer agency fees over 0.30% of average daily net assets per fiscal year for each class. Any transfer agency fee reimbursement is determined before considering the contractual operating expense limitation. For providing such services, HASCO is compensated on a per account basis that varies by account type, except with respect to Class Y, for which it is compensated based on average daily net assets. The amount paid to HASCO and any related contractual reimbursement amounts, if applicable, can be found in the Statement of Operations. These fees are accrued daily and paid monthly.
Affiliate Holdings:
As of October 31, 2014, affiliates of The Hartford had ownership of shares in the Fund as follows:
| Percentage of Class | Percentage of Fund | |||||||
| Class A | 99 | % | 23 | % | ||||
| Class C | 96 | 12 | ||||||
| Class I | 48 | 12 | ||||||
| Class Y | 100 | 41 | ||||||
| 22 |
Hartford Long/Short Global Equity Fund
Notes to Financial Statements – (continued)
October 31, 2014
(000’s Omitted)
Investment Transactions:
For the period August 29, 2014 (commencement of operations) through October 31, 2014, the cost of purchases and proceeds from sales of investment securities (excluding short-term investments) were as follows:
| Excluding U.S. Government Obligations | U.S. Government Obligations | Total | ||||||||||
| Cost of Purchases | $ | 24,458 | $ | — | $ | 24,458 | ||||||
| Sales Proceeds | 3,415 | — | 3,415 | |||||||||
Capital Share Transactions:
The following information is for the period August 29, 2014 (commencement of operations) through October 31, 2014:
| For the Period Ended October 31, 2014 | ||||||||||||||||
| Shares Sold | Shares Issued for Reinvested Dividends | Shares Redeemed | Net Increase (Decrease) of Shares | |||||||||||||
| Class A | ||||||||||||||||
| Shares | 403 | — | — | 403 | ||||||||||||
| Amount | $ | 4,026 | $ | — | $ | — | $ | 4,026 | ||||||||
| Class C | ||||||||||||||||
| Shares | 209 | — | — | 209 | ||||||||||||
| Amount | $ | 2,085 | $ | — | $ | — | $ | 2,085 | ||||||||
| Class I | ||||||||||||||||
| Shares | 414 | — | — | 414 | ||||||||||||
| Amount | $ | 4,135 | $ | — | $ | — | $ | 4,135 | ||||||||
| Class Y | ||||||||||||||||
| Shares | 700 | — | — | 700 | ||||||||||||
| Amount | $ | 7,000 | $ | — | $ | — | $ | 7,000 | ||||||||
| Total | ||||||||||||||||
| Shares | 1,726 | — | — | 1,726 | ||||||||||||
| Amount | $ | 17,246 | $ | — | $ | — | $ | 17,246 | ||||||||
Pending Legal Proceedings:
On February 25, 2011, Jennifer L. Kasilag, Louis Mellinger, Judith M. Menendez, Jacqueline M. Robinson, and Linda A. Russell filed a derivative lawsuit against Hartford Investment Financial Services, LLC (“HIFSCO”) (now known as HFD) on behalf of six Hartford retail mutual funds in the United States District Court for the District of New Jersey, alleging that HIFSCO received excessive advisory and distribution fees in violation of its statutory fiduciary duty under Section 36(b) of the 1940 Act when serving as investment manager and principal underwriter, respectively, to the Hartford retail mutual funds. Although this action was purportedly filed on behalf of certain of the Hartford Funds, none of the Hartford Funds is itself a defendant to the suit. HIFSCO moved to dismiss and, in September 2011, the motion was granted in part and denied in part, with leave to amend the complaint. In November 2011, plaintiffs filed an amended complaint on behalf of certain Hartford retail mutual funds, The Hartford Global Health Fund (now known as The Hartford Healthcare Fund), The Hartford Conservative Allocation Fund, The Hartford Growth Opportunities Fund, The Hartford Inflation Plus Fund, The Hartford Advisers Fund (now known as The Hartford Balanced Fund), and The Hartford Capital Appreciation Fund. Plaintiffs seek to rescind the investment management agreements and distribution plans between HIFSCO and these funds and to recover the total fees charged thereunder or, in the alternative, to recover any improper compensation HIFSCO received, in addition to lost earnings. HIFSCO filed a partial motion to dismiss the amended complaint and, in December 2012, the court dismissed without prejudice the claims regarding distribution fees and denied the motion with respect to the advisory fees claims. HIFSCO disputes the allegations and intends to defend vigorously.
In March 2014, the plaintiffs filed a new complaint that added as new plaintiffs The Hartford Floating Rate Fund and The Hartford Small Company Fund and named as a defendant HFMC, which assumed the role as investment manager to the funds as of January 2013. HFMC and HIFSCO dispute the allegations and intend to defend vigorously.
| 23 |
Hartford Long/Short Global Equity Fund
Notes to Financial Statements – (continued)
October 31, 2014
(000’s Omitted)
No accrual for litigation relating to this matter has been recorded in the financial statements of the Fund because the Fund is not party to the suit.
Indemnifications:
Under the Company's organizational documents, the Company shall indemnify its officers and directors to the full extent required or permitted under Maryland General Corporation Law and the federal securities laws. In addition, the Company, on behalf of the Fund, may enter into contracts that contain a variety of indemnifications. The Company's maximum exposure under these arrangements is unknown. However, as of the date of these financial statements, the Company has not had prior claims or losses pursuant to these contracts and expects the risk of loss to be remote.
Subsequent Event:
Effective December 1, 2014, pursuant to a sub-transfer agency agreement between HASCO and Boston Financial Data Services, Inc. (“BFDS”), HASCO has delegated certain transfer agent, dividend disbursing agent and shareholder servicing agent functions to BFDS. The costs and expenses of such delegation are borne by HASCO, not by the Fund.
| 24 |
Hartford Long/Short Global Equity Fund
Financial Highlights
| - Selected Per-Share Data - (A) | - Ratios and Supplemental Data - | |||||||||||||||||||||||||||||||||||||||||||||||||||
| Class | Net
Asset Value at Beginning of Period | Net
Investment Income (Loss) | Net Realized and Unrealized Gain (Loss) on Invest- ments | Total
from Investment Operations | Dividends from Net Investment Income | Distribu- tions from Realized Capital Gains | Total Dividends and Distributions | Net Asset Value at End of Period | Total Return(B) | Net Assets at End of Period (000's) | Ratio
of Expenses to Average Net Assets Before Adjust- ments(C) | Ratio
of Expenses to Average Net Assets After Adjust- ments(C) | Ratio
of Net Investment Income (Loss) to Average Net Assets | |||||||||||||||||||||||||||||||||||||||
| From August 29, 2014 (commencement of operations), through October 31, 2014 | ||||||||||||||||||||||||||||||||||||||||||||||||||||
| A(D) | $ | 10.00 | $ | (0.01 | ) | $ | (0.37 | ) | $ | (0.38 | ) | $ | – | $ | – | $ | – | $ | 9.62 | (3.80 | )%(E) | $ | 3,871 | 3.32 | %(F) | 2.86 | %(F),(G) | (0.84 | )%(F) | |||||||||||||||||||||||
| C(D) | 10.00 | (0.03 | ) | (0.36 | ) | (0.39 | ) | – | – | – | 9.61 | (3.90 | )(E) | 2,004 | 4.07 | (F) | 3.61 | (F),(G) | (1.60 | )(F) | ||||||||||||||||||||||||||||||||
| I(D) | 10.00 | (0.01 | ) | (0.37 | ) | (0.38 | ) | – | – | – | 9.62 | (3.80 | )(E) | 3,984 | 3.08 | (F) | 2.62 | (F),(G) | (0.73 | )(F) | ||||||||||||||||||||||||||||||||
| Y(D) | 10.00 | (0.01 | ) | (0.37 | ) | (0.38 | ) | – | – | – | 9.62 | (3.80 | )(E) | 6,733 | 3.08 | (F) | 2.62 | (F),(G) | (0.59 | )(F) | ||||||||||||||||||||||||||||||||
| (A) | Information presented relates to a share outstanding throughout the indicated period. Net investment income (loss) per share amounts are calculated based on average shares outstanding unless otherwise noted. |
| (B) | Assumes initial investment at net asset value at the beginning of each period, reinvestment of all distributions, the complete redemption of the investment at net asset value at the end of each period and no sales charge. Total return would be reduced if sales charges were taken into account. |
| (C) | Adjustments include waivers and reimbursements, if applicable. |
| (D) | Commenced operations on August 29, 2014. |
| (E) | Not annualized. |
| (F) | Annualized. |
| (G) | Excluding the expenses not subject to cap, the ratio would have been 1.74%, 2.49%, 1.50% and 1.50% for Class A, Class C, Class I and Class Y, respectively. |
| Portfolio Turnover Rate for All Share Classes |
|||
| From August 29, 2014 (commencement of operations) through October 31, 2014 | 32 | %(A) |
| (A) | Not annualized. |
| 25 |
Report of Independent Registered Public Accounting Firm
The Board of Directors and Shareholders of
The Hartford Mutual Funds, Inc.
We have audited the accompanying statement of assets and liabilities, including the schedule of investments, of Hartford Long/Short Global Equity Fund (one of the portfolios constituting The Hartford Mutual Funds, Inc. (the Funds)) as of October 31, 2014, and the related statement of operations, the statement of changes in net assets, and the financial highlights for the period from August 29, 2014 (commencement of operations) to October 31, 2014. These financial statements and financial highlights are the responsibility of the Funds’ management. Our responsibility is to express an opinion on these financial statements and financial highlights based on our audit.
We conducted our audit in accordance with the standards of the Public Company Accounting Oversight Board (United States). Those standards require that we plan and perform the audit to obtain reasonable assurance about whether the financial statements and financial highlights are free of material misstatement. We were not engaged to perform an audit of the Funds’ internal control over financial reporting. Our audit included consideration of internal control over financial reporting as a basis for designing audit procedures that are appropriate in the circumstances, but not for the purpose of expressing an opinion on the effectiveness of the Funds’ internal control over financial reporting. Accordingly, we express no such opinion. An audit also includes examining, on a test basis, evidence supporting the amounts and disclosures in the financial statements and financial highlights, assessing the accounting principles used and significant estimates made by management, and evaluating the overall financial statement presentation. Our procedures included confirmation of securities owned as of October 31, 2014, by correspondence with the custodian and brokers or by other appropriate auditing procedures where replies from brokers were not received. We believe that our audit provides a reasonable basis for our opinion.
In our opinion, the financial statements and financial highlights referred to above present fairly, in all material respects, the financial position of Hartford Long/Short Global Equity Fund of The Hartford Mutual Funds, Inc. at October 31, 2014, the results of its operations, the changes in its net assets, and the financial highlights for the period from August 29, 2014 (commencement of operations) to October 31, 2014, in conformity with U.S. generally accepted accounting principles.
| |
Minneapolis, Minnesota
December 18, 2014
| 26 |
Hartford Long/Short Global Equity Fund
Directors and Officers (Unaudited)
The Board of Directors of the Company (the "Directors") appoints officers who are responsible for the day-to-day operations of the Fund and who execute policies formulated by the Directors. Each Director serves until his or her death, resignation, or retirement or until the next annual meeting of shareholders is held or until his or her successor is elected and qualifies.
Directors and officers who are employed by or who have a financial interest in The Hartford Financial Services Group, Inc. ("The Hartford") are considered “interested” persons of the Fund pursuant to the 1940 Act. Each officer and two of the Company's Directors, as noted in the chart below, are “interested” persons of the Fund. Each Director serves as a director for The Hartford Mutual Funds, Inc., The Hartford Mutual Funds II, Inc., Hartford Series Fund, Inc., and Hartford HLS Series Fund II, Inc., and as a trustee for The Hartford Alternative Strategies Fund, which, as of October 31, 2014, collectively consist of 66 funds. Correspondence may be sent to Directors and officers c/o Hartford Funds, 5 Radnor Corporate Center, Suite 300, 100 Matsonford Road, Radnor, Pennsylvania 19087, except that correspondence to Mr. Annoni, Mr. Dressen and Ms. Quade may be sent to 500 Bielenberg Drive, Suite 500, Woodbury, Minnesota 55125.
The table below sets forth, for each Director and officer, his or her name, year of birth, current position with the Company and date first elected or appointed to The Hartford Mutual Funds, Inc. ("MF") and The Hartford Mutual Funds II, Inc. ("MF2"), principal occupation, and, for Directors, other directorships held. The Fund’s Statement of Additional Information contains further information on the Directors and is available free of charge by calling 1-888-843-7824 or writing to: Hartford Funds, P.O. Box 55022, Boston, MA 02205-5022.
Information on the aggregate remuneration paid to the directors of the Company can be found in the Statement of Operations herein. The Fund pays to The Hartford a portion of the Chief Compliance Officer’s compensation, but does not pay salaries or compensation to any of its other officers or Directors who are employed by The Hartford.
Non-Interested Directors
Hilary E. Ackermann (1956) Director since September 23, 2014
Ms. Ackermann served as Chief Risk Officer at Goldman Sachs Bank USA from October 2008 to November 2011 and serves as a Director of Dynegy, Inc., an independent power company, from October 2012 to present.
Lynn S. Birdsong (1946) Director since 2003, Chairman of the Investment Committee since 2014
Mr. Birdsong is a private investor. Mr. Birdsong currently serves as a Director of the Sovereign High Yield Investment Company (April 2010 to current). Mr. Birdsong currently serves as an Independent Director of Nomura Partners Funds, Inc. (formerly, The Japan Fund) (April 2003 to current). From 2003 to March 2005, Mr. Birdsong was an Independent Director of the Atlantic Whitehall Funds. From 1979 to 2002, Mr. Birdsong was a Managing Director of Zurich Scudder Investments, an investment management firm. During his employment with Scudder, Mr. Birdsong was an Interested Director of The Japan Fund. From January 1981 through December 2013, Mr. Birdsong was a partner in Birdsong Company, an advertising specialty firm.
Robert M. Gavin, Jr. (1940) Director since 2002 (MF) and 1986 (MF2), Chairman of the Board for each since 2004
Dr. Gavin is an educational consultant. Prior to September 1, 2001, he was President of Cranbrook Education Community and prior to July 1996, he was President of Macalester College, St. Paul, Minnesota.
Duane E. Hill (1945) Director since 2001 (MF) and 2002 (MF2), Chairman of the Nominating Committee since 2003
Mr. Hill is a Partner of TSG Ventures L.P., a private equity investment company. Mr. Hill is a former partner of TSG Capital Group, a private equity investment firm that served as sponsor and lead investor in leveraged buyouts of middle market companies.
Sandra S. Jaffee (1941) Director since 2005
Ms. Jaffee is the founder and Chief Executive Officer of a private company, Homeworks Concierge, LLC, which provides residential property management services in Westchester County, New York (January 2012 to present). Ms. Jaffee served as Chairman (2008 to 2009) and Chief Executive Officer of Fortent (formerly Searchspace Group), a leading provider of compliance/regulatory technology to financial institutions from August 2005 to August 2009. From August 2004 to August 2005, Ms. Jaffee served as an Entrepreneur in Residence with Warburg Pincus, a private equity firm. Prior to joining Warburg Pincus, Ms. Jaffee served as Executive Vice President at Citigroup, from September 1995 to July 2004, where she was President and Chief Executive Officer of Citibank’s Global Securities Services (1995 to 2003). Ms. Jaffee currently serves as a member of the Board of Directors of Broadridge Financial Solutions as well as a Trustee of Muhlenberg College.
| 27 |
Hartford Long/Short Global Equity Fund
Directors and Officers (Unaudited) – (continued)
William P. Johnston (1944) Director since 2005, Chairman of the Compliance Committee since 2005
In June 2006, Mr. Johnston was appointed as Senior Advisor to The Carlyle Group, a global private equity and other alternative asset investment firm and currently serves as an Operating Executive. In July 2006, Mr. Johnston was elected to the Board of Directors of MultiPlan, Inc. and served as a Director (July 2006 to August 2010). In August 2007, Mr. Johnston was elected to the Board of Directors of LifeCare Holdings, Inc. and served as a Director (August 2007 to June 2013). In February 2008, Mr. Johnston was elected to the Board of Directors of HCR-ManorCare, Inc. In May 2006, Mr. Johnston was elected to the Supervisory Board of Fresenius Medical Care AG & Co. KGaA, after its acquisition of Renal Care Group, Inc. in March 2006. Mr. Johnston joined Renal Care Group in November 2002 as a member of the Board of Directors and served as Chairman of the Board from March 2003 through March 2006. From 2002 through 2013, Mr. Johnston served as a Board member of the Georgia O’Keefe Museum. From September 1987 to December 2002, Mr. Johnston was with Equitable Securities Corporation (and its successors, SunTrust Equitable Securities and SunTrust Robinson Humphrey) serving in various investment banking and managerial positions, including Managing Director and Head of Investment Banking, Chief Executive Officer and Vice Chairman.
Phillip O. Peterson (1944) Director since 2002 (MF) and 2000 (MF2), Chairman of the Audit Committee since 2002
Mr. Peterson is a mutual fund industry consultant. He was a partner of KPMG LLP (an accounting firm) until July 1999. Mr. Peterson joined William Blair Funds in February 2007 as a member of the Board of Trustees. From February 2012 to February 2014, Mr. Peterson served as a Trustee of Symetra Variable Mutual Funds. From January 2004 to April 2005, Mr. Peterson served as Independent President of the Strong Mutual Funds.
Lemma W. Senbet (1946) Director since 2005
Dr. Senbet is the William E. Mayer Chair Professor of Finance and Founding Director, Center for Financial Policy, at the University of Maryland, Robert H. Smith School of Business. He was chair of the Finance Department of the University of Maryland, Robert H. Smith School of Business from 1998 to 2006. Since June 2013, he has been on leave from the University to serve as Executive Director of African Economic Research Consortium which focuses on economic policy research and training. Previously, he was a chaired professor of finance at the University of Wisconsin-Madison. Also, he was a Director of the Fortis Funds from March 2000 to July 2002. Dr. Senbet served as Director of the American Finance Association and President of the Western Finance Association. In 2006, Dr. Senbet was inducted Fellow of Financial Management Association International for his career-long distinguished scholarship and professional service.
Interested Directors and Officers
James E. Davey (1964) Director since 2012, President and Chief Executive Officer since 2010
Mr. Davey serves as Executive Vice President of Hartford Life Insurance Company (“HLIC”) and The Hartford. Additionally, Mr. Davey serves as Chairman of the Board, Manager and Senior Managing Director of Hartford Funds Distributors, LLC (“HFD”). He also currently serves as Director, Chairman of the Board, President and Senior Managing Director of Hartford Administrative Services Company (“HASCO”). Mr. Davey also serves as Manager, Chairman of the Board and Senior Managing Director for Hartford Funds Management Company, LLC (“HFMC”) and Director, Chairman of the Board and Senior Managing Director for Hartford Funds Management Group, Inc. ("HFMG"). Mr. Davey has served in various positions within The Hartford and its subsidiaries in connection with the operation of the Hartford Funds. Mr. Davey joined The Hartford in 2002.
Lowndes A. Smith* (1939) Director since 1996 (MF) and 2002 (MF2)
Mr. Smith served as Vice Chairman of The Hartford from February 1997 to January 2002, as President and Chief Executive Officer of Hartford Life, Inc. from February 1997 to January 2002, and as President and Chief Operating Officer of The Hartford Life Insurance Companies from January 1989 to January 2002. Mr. Smith serves as a Director of White Mountains Insurance Group Ltd. (October 2003 to current); One Beacon Insurance (October 2006 to current); Symetra Financial (August 2007 to current) and is a Managing Director of Whittington Gray Associates (January 2007 to current).
* Mr. Smith resigned as a Director of MF, MF2, Hartford Series Fund, Inc. and Hartford HLS Series Fund II, Inc. and as a Trustee of The Hartford Alternative Strategies Fund effective September 17, 2014.
Other Officers
Mark A. Annoni (1964) Vice President, Controller and Treasurer since 2012
Mr. Annoni currently serves as the Assistant Vice President of HLIC (February 2004 to present) and Senior Vice President of HFMG (December 2013 to present). Mr. Annoni has served in various positions within The Hartford and its subsidiaries in connection with the operation of the Hartford Funds. Mr. Annoni joined The Hartford in 2001.
| 28 |
Hartford Long/Short Global Equity Fund
Directors and Officers (Unaudited) – (continued)
Michael R. Dressen (1963) AML Compliance Officer since 2011
Mr. Dressen currently serves as Assistant Vice President of HLIC. He also serves as Chief Compliance Officer and AML Compliance Officer of HASCO and as AML Officer of HFD. Mr. Dressen has served in various positions within The Hartford and its subsidiaries in connection with the operation of the Hartford Funds.
Edward P. Macdonald (1967) Vice President, Secretary and Chief Legal Officer since 2005
Mr. Macdonald currently serves as Assistant Secretary, Executive Vice President and Deputy General Counsel of HFD, HASCO, HFMC and HFMG. He also serves as Vice President of HLIC. Mr. Macdonald has served in various positions within The Hartford and its subsidiaries in connection with the operation of the Hartford Funds. Mr. Macdonald joined The Hartford in 2005.
Joseph G. Melcher (1973) Vice President and Chief Compliance Officer since 2013
Mr. Melcher currently serves as Executive Vice President of HFD, HFMG and HASCO. Mr. Melcher also currently serves as Executive Vice President and Chief Compliance Officer of HFMC. Mr. Melcher has served in various positions within The Hartford and its subsidiaries in connection with the operation of the Hartford Funds since joining The Hartford in 2012. Prior to joining The Hartford, Mr. Melcher worked at Touchstone Investments, a member of the Western & Southern Financial Group, where he held the position of Vice President and Chief Compliance Officer from 2010 through 2012 and Assistant Vice President, Compliance from 2005 to 2010.
Vernon J. Meyer (1964) Vice President since 2006
Mr. Meyer currently serves as Senior Vice President of HLIC. He also currently serves as Managing Director and Chief Investment Officer of HFMC and Managing Director of HFMG. Mr. Meyer has served in various positions within The Hartford and its subsidiaries in connection with the operation of the Hartford Funds. Mr. Meyer joined The Hartford in 2004.
Laura S. Quade (1969) Vice President since 2012
Ms. Quade currently serves as Vice President of HASCO, HFD and HFMG. She is the Head of Operations of HASCO and formerly served as Director, Enterprise Operations of HLIC. Ms. Quade has served in various positions within The Hartford and its subsidiaries in connection with the operation of the Hartford Funds. Ms. Quade joined The Hartford in 2001.
Martin A. Swanson** (1962) Vice President since 2010
Mr. Swanson currently serves as Vice President of HLIC. Mr. Swanson also serves as Managing Director, Chief Marketing Officer and Principal of HFD and Managing Director of HFMG. Mr. Swanson has served in various positions within The Hartford and its subsidiaries in connection with the operation of the Hartford Funds.
** Mr. Swanson resigned as an officer effective November 6, 2014.
HOW TO OBTAIN A COPY OF THE FUND’S PROXY VOTING POLICIES AND VOTING RECORDS (UNAUDITED)
A description of the policies and procedures that the Fund uses to determine how to vote proxies relating to portfolio securities and information about how the Fund voted proxies relating to portfolio securities during the most recent twelve-month period ended June 30 are available (1) without charge, upon request, by calling 888-843-7824 and (2) on the SEC’s website at http://www.sec.gov.
QUARTERLY PORTFOLIO HOLDINGS INFORMATION (UNAUDITED)
The Fund files a complete schedule of portfolio holdings with the SEC for the first and third quarters of each fiscal year on Form N-Q. The Fund’s Forms N-Q are available (1) without charge, upon request, by calling 888-843-7824 and (2) on the SEC’s website at http://www.sec.gov. The Form N-Q may be reviewed and copied at the SEC’s Public Reference Room in Washington, DC. Information on the operation of the Public Reference Room may be obtained by calling 1-800-SEC-0330.
| 29 |
Hartford Long/Short Global Equity Fund
Federal Tax Information (Unaudited)
For the fiscal year ended October 31, 2014, there is no further federal tax information required for this Fund.
| 30 |
Hartford Long/Short Global Equity Fund
Expense Example (Unaudited)
Your Fund's Expenses
As a shareholder of the Fund, you incur two types of costs: (1) transaction costs, including sales charges (loads) on purchase payments, if any, and contingent deferred sales charges (CDSC), if any, and (2) ongoing costs, including investment management fees, distribution and/or service (12b-1) fees, if any, and other fund expenses. This example is intended to help you understand your ongoing costs (in dollars) of investing in the Fund and to compare these costs with the ongoing costs of investing in other mutual funds. The example is based on an investment of $1,000 invested at the beginning of the period and held for the entire period of August 29, 2014 (commencement of operations) through October 31, 2014.
Actual Expenses
The first set of columns of the table below provides information about actual account values and actual expenses. You may use the information in this column, together with the amount you invested, to estimate the expenses that you paid over the period. Simply divide your account value by $1,000 (for example, an $8,600 account value divided by $1,000 = 8.6), then multiply the result by the number in the line under the heading entitled “Expenses Paid During Period” to estimate the expenses you paid on your account during this period.
Hypothetical Example for Comparison Purposes
The second set of columns of the table below provides information about hypothetical account values and hypothetical expenses based on the Fund's actual expense ratio and an assumed rate of return of 5% per year before expenses, which is not the Fund's actual return. The hypothetical account values and expenses may not be used to estimate the actual ending account balance or expenses you paid for the period. You may use this information to compare the ongoing costs of investing in the Fund and other funds. To do so, compare this 5% hypothetical example with the 5% hypothetical examples that appear in the shareholder reports of the other funds.
Please note that the expenses shown in the table are meant to highlight your ongoing costs only and do not reflect any transactional costs, such as sales charges (loads) and CDSC. Therefore, the second set of columns of the table is useful in comparing ongoing costs only, and will not help you determine the relative total costs of owning different funds. In addition, if these transactional costs were included, your costs would be higher. Expenses are equal to the Fund's annualized expense ratios multiplied by average account value over the period, multiplied by 63/365 (to reflect the one-half year period).
| Actual return | Hypothetical (5% return before expenses) | |||||||||||||||||||||||||||||||||||
| Beginning Account Value August 29, 2014 | Ending Account Value October 31, 2014 | Expenses paid during the period August 29, 2014 through October 31, 2014 | Beginning Account Value August 29, 2014 | Ending Account Value October 31, 2014 | Expenses paid during the period August 29, 2014 through October 31, 2014 | Annualized expense ratio | Days in the current 1/2 year | Days in the full year | ||||||||||||||||||||||||||||
| Class A* | $ | 1,000.00 | $ | 962.00 | $ | 4.84 | $ | 1,000.00 | $ | 1,003.69 | $ | 4.95 | 2.86 | % | 63 | 365 | ||||||||||||||||||||
| Class C* | $ | 1,000.00 | $ | 961.00 | $ | 6.11 | $ | 1,000.00 | $ | 1,002.40 | $ | 6.24 | 3.61 | 63 | 365 | |||||||||||||||||||||
| Class I* | $ | 1,000.00 | $ | 962.00 | $ | 4.40 | $ | 1,000.00 | $ | 1,004.14 | $ | 4.50 | 2.60 | 63 | 365 | |||||||||||||||||||||
| Class Y* | $ | 1,000.00 | $ | 962.00 | $ | 4.43 | $ | 1,000.00 | $ | 1,004.11 | $ | 4.53 | 2.62 | 63 | 365 | |||||||||||||||||||||
| * | Commenced operations on August 29, 2014. |
| 31 |
Hartford Long/Short Global Equity Fund
Approval of Investment Management and Investment Sub-Advisory Agreements (Unaudited)
Section 15(c) of the Investment Company Act of 1940, as amended (the “1940 Act”), requires that each mutual fund’s board of directors, including a majority of those directors who are not “interested persons” of the mutual fund, as defined in the 1940 Act (the “Independent Directors”), initially approve, and annually review and consider the continuation of, the mutual fund’s investment advisory and sub-advisory agreements. At its meeting held on May 6, 2014, the Board of Directors (the “Board”) of The Hartford Mutual Funds, Inc., including each of the Independent Directors, unanimously voted to approve an investment management agreement for Hartford Long/Short Global Equity Fund (the “Fund”) with Hartford Funds Management Company, LLC (“HFMC”) and an investment sub-advisory agreement between HFMC and the Fund’s sub-adviser, Wellington Management Company, LLP (the “Sub-adviser,” and together with HFMC, the “Advisers”) (collectively, the “Agreements”).
Prior to approving the Agreements, the Board requested, received and reviewed written responses from the Advisers to questions posed to them on behalf of the Independent Directors and supporting materials relating to those questions and responses (the “Adviser Materials”). In addition, the Board’s Investment Committee received in-person presentations from representatives of the Advisers regarding the Fund and the proposed investment strategy.
In determining whether to approve the Agreements for the Fund, the members of the Board reviewed and evaluated information and factors they believed to be relevant and appropriate in light of the information that the Board deemed necessary and appropriate through the exercise of its reasonable business judgment. While individual members of the Board may have weighed certain factors differently, the Board’s determination to approve the Agreements was based on a comprehensive consideration of all information provided to the Board with respect to the approval of the Agreements. A more detailed discussion of the factors the Board considered with respect to its approval of the Agreements is provided below.
Nature, Extent and Quality of Services to be Provided by the Advisers
The Board requested and considered information concerning the nature, extent and quality of the services to be provided to the Fund by the Advisers. The Board considered, among other things, the terms of the Agreements and the range of services to be provided by the Advisers. The Board considered the Advisers’ organizational structure, systems and personnel. The Board also considered each Adviser’s reputation and overall financial strength and the Board’s past experience with the Advisers with respect to the services they provide to other Hartford Funds.
With respect to HFMC, the Board noted that, under the Agreements, HFMC would be responsible for the management of the Fund, including oversight of fund operations and service providers. The Board also noted that HFMC would provide administrative services to the Fund as well as investment advisory services in connection with selecting, monitoring and supervising the Fund’s sub-adviser, and that HFMC had recommended to the Board that the Sub-adviser be appointed as the sub-adviser to the Fund. The Board considered HFMC’s ongoing monitoring of people, process and performance, including its quarterly reviews of each of the Hartford Funds, semi-annual meetings with the leaders of each Fund’s portfolio management team, and oversight of the Hartford Funds’ approximately 66 portfolio managers. The Board recognized that HFMC has demonstrated a record of making changes to the management and/or strategies of the Hartford Funds when warranted. The Board considered that HFMC would oversee the Sub-adviser’s investment approach and results, process for monitoring best execution of portfolio trades by the Sub-adviser and approach to risk management with respect to the Fund and the service providers to the Fund. The Board also considered that HFMC would oversee compliance with the Fund’s objective and policies as well as with applicable laws and regulations. In addition, the Board considered that HFMC or its affiliates would be responsible for providing the Fund’s officers.
With respect to the Sub-adviser, which would provide certain day-to-day portfolio management services for the Fund, the Investment Committee met with members of the proposed portfolio management team. The Board considered the Sub-adviser’s investment philosophy and process, investment research capabilities and resources, performance record, trade execution capabilities and experience.
The Board also considered information previously provided by the Advisers regarding their compliance policies and procedures and compliance history, and received a representation from HFMC that the written compliance policies and procedures of HFMC and the Sub-adviser are reasonably designed to prevent violations of the federal securities laws. In addition, the Board considered HFMC’s representation that it did not anticipate making any material changes to HFMC’s and the Hartford Funds’ compliance program as a result of the addition of the Fund.
In considering this information, the Board evaluated not only the information presented to the Board and the Investment Committee in connection with its consideration of the Agreements, but also the Board’s experience through past interactions with HFMC and the Sub-adviser. Based on these considerations, the Board concluded that it was satisfied with the nature, extent and quality of the services to be provided to the Fund by HFMC and the Sub-adviser.
| 32 |
Hartford Long/Short Global Equity Fund
Approval of Investment Management and Investment Sub-Advisory Agreements (Unaudited) – (continued)
Performance of the Sub-adviser
The Board considered the investment performance of the Sub-adviser and its portfolio management team, including, for purposes of considering the investment skill and experience of the Fund’s portfolio managers, composite performance data showing the portfolio management team’s capabilities in managing an investment strategy that is similar to the strategy to be used in managing the Fund, as well as the performance of a hypothetical model portfolio. HFMC and the Sub-adviser also provided additional information about the broad range of the portfolio management team’s investment experience and their investment philosophy and process.
Based on these considerations, the Board concluded that it was satisfied that HFMC and the Sub-adviser have the capability of providing satisfactory investment performance for the Fund.
Costs of the Services and Profitability of the Advisers
In considering the proposed advisory and sub-advisory fee schedules for the Fund, the Board reviewed information regarding HFMC’s estimated costs to provide investment management and related services to the Fund and the estimated profitability to HFMC and its affiliates from all services to be provided to the Fund and all aspects of their relationships with the Fund. In evaluating HFMC’s estimated profitability, the Board considered HFMC’s representation that the level of estimated profitability was fair and appropriate based on the nature and quality of the services to be provided to shareholders. The Board also noted that the actual profitability of the Fund to HFMC would depend on the growth of assets under management. The Board also requested and received information relating to the operations and profitability of the Sub-adviser.
Based on these considerations, the Board concluded that the profits anticipated to be realized by the Advisers and their affiliates from their relationships with the Fund would not be excessive.
Comparison of Fees and Services to be Provided by the Advisers
The Board considered comparative information with respect to the management fees to be paid by the Fund to HFMC and the expected total expense ratios of the Fund. The Board also considered the proposed sub-advisory fees to be paid by HFMC to the Sub-adviser. In this regard, the Board requested and reviewed information from HFMC and the Sub-adviser relating to the proposed management and sub-advisory fees and total operating expenses for the Fund. With respect to the sub-advisory fee schedule, the Board considered representations from HFMC and the Sub-adviser that the Sub-adviser’s fees were negotiated at arm’s length on a fund-by-fund basis. The Board also reviewed information comparing the Fund’s proposed management fees and total expenses relative to a peer universe of funds derived from information provided by Lipper, Inc. (“Lipper”), an independent provider of investment company data, in conjunction with input from an independent financial services consultant engaged by the Board. The Board considered that HFMC had contractually agreed to limit the expenses for the Fund’s Class A, Class C, Class I, and Class Y shares to 1.90%, 2.65%, 1.65%, and 1.50%, respectively, through February 29, 2016, with such arrangement automatically renewing on an annual basis unless HFMC provides written notice of termination prior to the start of the next term or upon approval of the Board.
In considering the reasonableness of the Fund’s management and sub-advisory fees and total expense ratios, the Board considered that, according to the information provided by Lipper, the Fund’s proposed weighted management fees were above the Lipper peer group average and median for all asset levels, and that the proposed weighted management fees fell within the 4th quintile for all asset levels. The Board also considered that the Fund’s estimated total expenses, less Rule 12b-1 fees, were below the Lipper peer group average and median and fell within the 3rd quintile.
Based on these considerations, the Board concluded that the Fund’s proposed fees and total operating expenses, in conjunction with the information about quality of services, profitability, economies of scale, and other matters discussed, were reasonable in light of the services to be provided.
Economies of Scale
The Board considered the extent to which economies of scale would be realized as the Fund grows and whether the fee levels reflect these economies of scale for the benefit of the Fund’s future shareholders. The Board reviewed the breakpoints in the proposed management fee schedule for the Fund, which would reduce fee rates as Fund assets grow over time. The Board considered HFMC’s representation that the Fund could be expected to achieve some economies of scale as assets in the Fund grow. The Board recognized that a fund with assets beyond the highest breakpoint level would continue to benefit from economies of scale because additional assets are charged the lowest breakpoint fee
| 33 |
Hartford Long/Short Global Equity Fund
Approval of Investment Management and Investment Sub-Advisory Agreements (Unaudited) – (continued)
resulting in lower overall effective management fee rates. The Board also considered that expense limitations and fee waivers that reduce the Fund’s expenses at all asset levels can have the same effect as breakpoints in sharing economies of scale with shareholders and provide protection from an increase in expenses if Fund assets decline. The Board recognized that a fee schedule that reaches a lower breakpoint quickly provides shareholders with the benefit of anticipated or potential economies of scale. The Board also considered that HFMC has been active in managing expenses for the Hartford Funds.
The Board also considered how any benefits from economies of scale would be realized by the various parties. The Board reviewed relevant information included in the Adviser Materials regarding comparative breakpoint information for other funds in the Fund’s Lipper peer group. Based on these considerations, the Board concluded that it was satisfied with the extent to which economies of scale would be shared for the benefit of the Fund’s future shareholders. The Board noted, however, that it would review future growth in Fund assets and the appropriateness of the breakpoints as part of its future annual review of the Agreements.
Other Benefits
The Board considered other benefits to the Advisers and their affiliates from their relationships with the Fund.
The Board noted that HFMC would receive fees for fund accounting and related services from the Fund. The Board also considered that Hartford Administrative Services Company, the Fund’s transfer agent and an affiliate of HFMC, would receive transfer agency compensation from the Fund.
The Board also considered that Hartford Funds Distributors LLC (“HFD”), an affiliate of HFMC, will serve as principal underwriter of the Fund. As principal underwriter, HFD would receive 12b-1 fees from the Fund and would receive all or a portion of the sales charges on sales or redemptions of certain classes of shares.
The Board considered the benefits to the Fund’s future shareholders of being part of the Hartford Funds family of funds, including the right to exchange investments between the same class of funds without a sales charge, the ability to reinvest Fund dividends into other funds in the family, and the ability to combine holdings in the Fund with holdings in other funds to obtain a reduced sales charge. The Board considered HFMC’s efforts to provide investors in the family with a broad range of investment styles and asset classes and its entrepreneurial risk in initiating new funds to expand these opportunities for shareholders.
* * * *
Based upon its review of these various factors, among others, the Board concluded that it is in the best interests of the Fund and its shareholders for the Board to approve the Agreements. In reaching this decision, the Board did not assign relative weights to the factors discussed above or deem any one or group of them to be controlling in and of themselves. In connection with their deliberations, the Independent Directors met separately in executive session with independent legal counsel to review the relevant materials and consider their responsibilities under relevant laws and regulations.
| 34 |
Hartford Long/Short Global Equity Fund
Main Risks (Unaudited)
The main risks of investing in the Fund are described below.
Market, Selection and Strategy Risk: The Fund’s share price may fluctuate due to market risk and/or security selections that may underperform the market or relevant benchmarks. If the sub-adviser's investment strategy does not perform as expected, the Fund could underperform its peers or lose money. There is no guarantee the Fund will achieve its stated objective.
Foreign Investment and Emerging Markets Risk: Investments in foreign securities may be riskier than investments in U.S. securities. Potential risks include the risks of illiquidity, increased price volatility, less government regulation, less extensive and less frequent accounting and other reporting requirements, unfavorable changes in currency exchange rates, and economic and political disruptions. These risks are generally greater for investments in emerging markets.
Short Sales and Leverage Risk: When selling a borrowed security, the Fund will lose money if it must repurchase the security at a higher price than it received for the borrowed security. The potential loss is theoretically unlimited. The Fund’s use of leverage may not be successful, may increase the volatility of the Fund’s returns, and could cause the Fund to underperform.
Derivatives Risk: Investments in derivatives can be volatile. Potential risks include currency risk, leverage risk (the risk that small market movements may result in large changes in the value of an investment), liquidity risk, index risk, pricing risk, and counterparty risk (the risk that the counterparty may be unwilling or unable to honor its obligations).
Small-Cap Stock Risk: Small-cap stocks are generally more volatile and risky and may be less liquid than large-cap stocks because they may have limited operating histories, narrow product lines, and focus on niche markets.
Active Trading Risk: Actively trading investments may result in higher costs and higher taxable income.
Quantitative Analysis Risk: The Fund uses quantitative analysis in its securities selection; securities selected by this method may perform differently from the broader stock market.
| 35 |
THIS PRIVACY POLICY IS NOT PART OF THIS REPORT
Privacy Policy and Practices of The Hartford Financial Services Group, Inc. and its Affiliates
(herein called “we, our and us”)
This Privacy Policy applies to our United States Operations
|
We value your trust. We are committed to the responsible: a) management; b) use; and c) protection; of Personal Information.
This notice describes how we collect, disclose, and protect Personal Information.
We collect Personal Information to: a) service your Transactions with us; and b) support our business functions.
We may obtain Personal Information from: a) You; b) your Transactions with us; and c) third parties such as a consumer-reporting agency.
Based on the type of product or service You apply for or get from us, Personal Information such as: a) your name; b) your address; c) your income; d) your payment; or e) your credit history; may be gathered from sources such as applications, Transactions, and consumer reports.
To serve You and service our business, we may share certain Personal Information. We will share Personal Information, only as allowed by law, with affiliates such as: a) our insurance companies; b) our employee agents; c) our brokerage firms; and d) our administrators.
As allowed by law, we may share Personal Financial Information with our affiliates to: a) market our products; or b) market our services; to You without providing You with an option to prevent these disclosures. |
We may also share Personal Information, only as allowed by law, with unaffiliated third parties including: a) independent agents; b) brokerage firms; c) insurance companies; d) administrators; and e) service providers; who help us serve You and service our business.
When allowed by law, we may share certain Personal Financial Information with other unaffiliated third parties who assist us by performing services or functions such as: a) taking surveys; b) marketing our products or services; or c) offering financial products or services under a joint agreement between us and one or more financial institutions.
We, and third parties we partner with, may track some of the pages You visit through the use of: a) cookies; b) pixel tagging; or c) other technologies; and currently do not process or comply with any web browser’s “do not track” signal or similar mechanism that indicates a request to disable online tracking of individual users who visit our websites or use our services.
We will not sell or share your Personal Financial Information with anyone for purposes unrelated to our business functions without offering You the opportunity to: a) “opt-out;” or b) “opt-in;” as required by law.
We only disclose Personal Health Information with: a) your proper written authorization; or b) as otherwise allowed or required by law.
Our employees have access to Personal Information in the course of doing their jobs, such as: a) underwriting policies; b) paying claims; c) developing new products; or d) advising customers of our products and services. |
|
We use manual and electronic security procedures to maintain: a) the confidentiality; and b) the integrity of; Personal Information that we have. We use these procedures to guard against unauthorized access.
Some techniques we use to protect Personal Information include: a) secured files; b) user authentication; c) encryption; d) firewall technology; and e) the use of detection software.
We are responsible for and must: a) identify information to be protected; b) provide an adequate level of protection for that data; c) grant access to protected data only to those people who must use it in the performance of their job-related duties.
Employees who violate our Privacy Policy will be subject to discipline, which may include ending their employment with us.
At the start of our business relationship, we will give You a copy of our current Privacy Policy.
We will also give You a copy of our current Privacy Policy once a year if You maintain a continuing business relationship with us.
We will continue to follow our Privacy Policy regarding Personal Information even when a business relationship no longer exists between us.
|
As used in this Privacy Notice:
Application means your request for our product or service.
Personal Financial Information means financial information such as: a) credit history; b) income; c) financial benefits; or d) policy or claim information.
Personal Health Information means health information such as: a) your medical records; or b) information about your illness, disability or injury.
Personal Information means information that identifies You personally and is not otherwise available to the public. It includes: a) Personal Financial Information; and b) Personal Health Information.
Transaction means your business dealings with us, such as: a) your Application; b) your request for us to pay a claim; and c) your request for us to take an action on your account.
You means an individual who has given us Personal Information in conjunction with: a) asking about; b) applying for; or c) obtaining; a financial product or service from us if the product or service is used mainly for personal, family, or household purposes. |
This Privacy Policy is being provided on behalf of the following affiliates of The Hartford Financial Services Group, Inc.:
1stAGChoice, Inc.; Access CoverageCorp, Inc.; Access CoverageCorp Technologies, Inc.; American Maturity Life Insurance Company; Archway 60 R, LLC; Business Management Group, Inc.; Champlain Life Reinsurance Company; DMS R, LLC; Eloy R, LLC; Ersatz Corporation; First State Insurance Company; Hartford Accident and Indemnity Company; Hartford Administrative Services Company; Hartford Casualty General Agency, Inc.; Hartford Casualty Insurance Company; Hartford-Comprehensive Employee Benefit Service Company; Hartford Equity Sales Company, Inc.; Hartford Fire General Agency, Inc.; Hartford Fire Insurance Company; Hartford Funds Management Company, LLC; Hartford Funds Management Group, Inc.; Hartford HLS Series Fund II, Inc.; Hartford Insurance Company of Illinois; Hartford Insurance Company of the Midwest; Hartford Insurance Company of the Southeast; Hartford Integrated Technologies, Inc.; Hartford International Life Reassurance Corporation; Hartford Funds Distributors, LLC; Hartford Investment Management Company; Hartford Life and Accident Insurance Company; Hartford Life and Annuity Insurance Company; Hartford Life Insurance Company; Hartford Life Private Placement, LLC; Hartford Lloyd’s Corporation; Hartford Lloyd’s Insurance Company; Hartford Mezzanine Investors I, LLC; Hartford Residual Market, L.C.C.; Hartford Retirement Services, LLC; Hartford Securities Distribution Company, Inc.; Hartford Series Fund, Inc.; Hartford Specialty Insurance Services of Texas, LLC; Hartford Strategic Investments, LLC; Hartford Underwriters Insurance Company; Hartford Technology Services Company, L.L.C.; Hartford of Texas General Agency, Inc.; Hartford Underwriters General Agency, Inc.; HARTRE Company, L.C.C.; HL Investment Advisors, LLC; HLA LLC; Horizon Management Group, LLC; HRA Brokerage Services, Inc.; Lanidex Class B, LLC; M-CAP Insurance Agency, LLC; New England Insurance Company; New England Reinsurance Corporation; Nutmeg Insurance Agency, Inc.; Nutmeg Insurance Company; Pacific Insurance Company, Limited; Planco, LLC: Property and Casualty Insurance Company of Hartford; Revere R, LLC; RVR R, LLC; Sentinel Insurance Company, Ltd.; Sunstone R, LLC; Symphony R, LLC; The Evergreen Group Incorporated; The Hartford Alternative Strategies Fund; The Hartford Mutual Funds, Inc.; The Hartford Mutual Funds II, Inc.; Trumbull Flood Management, L.L.C.; Trumbull Insurance Company; Twin City Fire Insurance Company; White River Life Reinsurance Company.
HPP Revised January 2014
HARTFORDFUNDS
hartfordfunds.com
This information is written in connection with the promotion or marketing of the matter(s) addressed in this material.
This report is submitted for the general information of the shareholders of the Fund. It is not authorized for distribution unless preceded or accompanied by a current prospectus for the Fund.
The information cannot be used or relied upon for the purpose of avoiding IRS penalties. These materials are not intended to provide tax, accounting or legal advice. As with all matters of a tax or legal nature, you should consult your own tax or legal counsel for advice.
Investors should carefully consider the investment objectives, risks, charges, and expenses of Hartford Funds before investing. This and other information can be found in the prospectus and summary prospectus, which can be obtained by calling 888-843-7824 (retail) or 800-279-1541 (institutional). Investors should read them carefully before they invest.
Hartford Funds are underwritten and distributed by Hartford Funds Distributors, LLC.
MFAR-LS14 12/14 116926 Printed in U.S.A.
HARTFORDFUNDS
|
THE HARTFORD MIDCAP FUND
2014 Annual Report |
A MESSAGE FROM THE PRESIDENT
Dear Fellow Shareholders:
Thank you for investing in Hartford Funds.
Market Review
U.S. equities (as represented by the S&P 500 Index) rose steadily for the fiscal year ended October 31, 2014, with a return of 17.27% for the period. With the exception of short-lived geopolitical scares early in 2014 and concerns about continuing global growth near the end of the period, stocks generally rose on solid fundamentals and encouraging macroeconomic data during the year.
September 2014 marked the six-year anniversary of the start of the financial crisis. Within weeks of that anniversary, both the S&P 500 Index and the Dow Jones Industrial Average set new all-time highs, closing at 2,018 and 17,391, respectively, on October 31. Although the fallout of the crisis continues to influence investor behavior, stocks have recovered and risen dramatically, up 198% from their low in March 2009. Meanwhile, the domestic economy is notching strong growth, and the unemployment rate has reached its lowest level since August 2008.
While the U.S. economy appears to have stabilized and to have reverted to a solid growth path, the outlook for the global economy appears to have gotten cloudier. The U.S. Federal Reserve has ended quantitative easing, while Europe and Japan are pursuing stimulus options to avoid a double-dip recession and deflation, respectively. Diverging central-bank policies will likely continue to play an important role in market movements going forward as investors wait to see the reactions to their efforts and their impacts on global markets.
How have market movements impacted your portfolio throughout the last year? Are your investments still on track to provide the growth or income you need, and are you comfortable with their progress during times of volatility?
Your financial professional can help you navigate today’s markets with confidence, as well as assist you to achieve your investment goals by providing advice on the best options within our fund family to help you work toward overcoming today’s investing challenges. Meet with your financial advisor regularly to examine your portfolio and your investment strategy, and to determine if you’re still on track to meet your goals.
Thank you again for investing with Hartford Funds.
James Davey
President
Hartford Funds
1 The S&P 500 Index is a market capitalization-weighted price index composed of 500 widely held common stocks.
2 The Dow Jones Industrial Average is an unmanaged, price-weighted index of 30 of the largest, most widely held stocks traded on the NYSE
Table of Contents
The views expressed in the Fund’s Manager Discussion under “Why did the Fund perform this way?” and “What is the outlook?” are views of the Fund’s sub-adviser and portfolio management team through the end of the period and are subject to change based on market and other conditions. The Fund’s Manager Discussion is for informational purposes only and does not represent an offer, recommendation or solicitation to buy, hold or sell any security. The specific securities identified and described, if any, do not represent all of the securities purchased or sold and you should not assume that investments in the securities identified and discussed will be profitable.
| The Hartford MidCap Fund inception 12/31/1997 |
| (sub-advised by Wellington Management Company, LLP) |
| Investment objective – The Fund seeks long-term growth of capital. |
Performance Overview 10/31/04 - 10/31/14
The chart above represents the hypothetical growth of a $10,000 investment in Class A, which includes a sales charge. Growth results in classes other than Class A will vary from what is seen above due to differences in the expenses charged to those share classes.
Average Annual Total Returns (as of 10/31/14)
| 1 Year | 5 Years | 10 Years | ||||||||||
| MidCap A# | 15.57 | % | 17.56 | % | 10.72 | % | ||||||
| MidCap A## | 9.22 | % | 16.23 | % | 10.10 | % | ||||||
| MidCap B# | 14.56 | % | 16.56 | % | 10.02 | %* | ||||||
| MidCap B## | 9.56 | % | 16.34 | % | 10.02 | %* | ||||||
| MidCap C# | 14.81 | % | 16.75 | % | 9.97 | % | ||||||
| MidCap C## | 13.81 | % | 16.75 | % | 9.97 | % | ||||||
| MidCap I# | 15.89 | % | 17.87 | % | 10.90 | % | ||||||
| MidCap R3# | 15.24 | % | 17.24 | % | 10.79 | % | ||||||
| MidCap R4# | 15.55 | % | 17.60 | % | 10.98 | % | ||||||
| MidCap R5# | 15.91 | % | 17.96 | % | 11.16 | % | ||||||
| MidCap Y# | 16.08 | % | 18.09 | % | 11.22 | % | ||||||
| S&P MidCap 400 Index | 11.65 | % | 18.28 | % | 10.50 | % | ||||||
| # | Without sales charge |
| ## | With sales charge |
| * | Class B shares convert to Class A shares after 8 years. The return shown reflects the conversion to Class A shares, which had different operating expenses, for the period after conversion. |
PERFORMANCE DATA QUOTED REPRESENTS PAST PERFORMANCE AND DOES NOT GUARANTEE FUTURE RESULTS. The investment return and principal value of the investment will fluctuate so that investors’ shares, when redeemed, may be worth more or less than their original cost. Current performance may be lower or higher than the performance data quoted. To obtain performance data current to the most recent month-end, please visit our website www.hartfordfunds.com.
The initial investment in Class A shares reflects the maximum sales charge of 5.50% and returns for Class B shares reflect a contingent deferred sales charge of up to 5.00% and declining to zero, depending on the period of time the shares are held. Returns for Class C shares reflect a contingent deferred sales charge of up to 1.00% on shares redeemed within twelve months of purchase.
Total returns presented above were calculated using the Fund’s net asset value available to shareholders for sale or redemption of Fund shares on October 31, 2014, which may exclude investment transactions as of this date. All share class returns assume the reinvestment of all distributions at net asset value and the deduction of all fund expenses.
Effective 9/30/09, Class B shares of the Fund were closed to new investments.
Class I shares commenced operations on 2/27/09. Performance prior to that date is that of the Fund’s Class A shares (excluding sales charges), which had different operating expenses. Class R3, R4 and R5 shares commenced operations on 5/29/09. Performance prior to that date is that of the Fund’s Class Y shares which had different operating expenses.
S&P MidCap 400 Index is an unmanaged index of common stocks of companies chosen by S&P designed to represent price movements in the mid-cap U.S. equity market.
You cannot invest directly in an index.
The chart and table do not reflect the deductions of taxes that a shareholder would pay on Fund distributions or the redemption of Fund shares.
Performance information may reflect historical or current expense waivers/reimbursements from the investment adviser, without which performance would have been lower. For information on current expense waivers/reimbursements, please see the prospectus.
| 2 |
| The Hartford MidCap Fund |
| Manager Discussion |
| October 31, 2014 (Unaudited) |
| Operating Expenses* | ||||||||
| Net | Gross | |||||||
| MidCap Class A | 1.20 | % | 1.20 | % | ||||
| MidCap Class B | 2.07 | % | 2.11 | % | ||||
| MidCap Class C | 1.91 | % | 1.91 | % | ||||
| MidCap Class I | 0.96 | % | 0.96 | % | ||||
| MidCap Class R3 | 1.48 | % | 1.48 | % | ||||
| MidCap Class R4 | 1.17 | % | 1.17 | % | ||||
| MidCap Class R5 | 0.87 | % | 0.87 | % | ||||
| MidCap Class Y | 0.77 | % | 0.77 | % | ||||
| * | As shown in the Fund’s prospectus dated March 1, 2014. Actual expenses may be higher or lower. Please see accompanying Financial Highlights for expense ratios for the year ended October 31, 2014. |
Gross expenses are the Fund’s total annual operating expenses shown in the Fund’s prospectus dated March 1, 2014. Net expenses are the Fund’s total annual operating expenses shown in the Fund’s prospectus dated March 1, 2014 and reflect contractual expense reimbursements in instances when these reductions reduce the Fund’s gross expenses. Contractual reimbursements remain in effect until February 28, 2015, and automatically renew for one-year terms unless terminated.
The Fund filed an updated prospectus, dated November 7, 2014, with the U.S. Securities and Exchange Commission that became effective on that date. However, the information in this annual report is as of October 31, 2014 and does not reflect any changes made to the total annual fund operating expense table in the November 7, 2014 prospectus. The net expense ratios shown in the November 7, 2014 prospectus are 1.20%, 2.11%, 1.91%, 0.96%, 1.48%, 1.17%, 0.87%, and 0.77% for Class A, Class B, Class C, Class I, Class R3, Class R4, Class R5 and Class Y, respectively, and reflect contractual expense reimbursements in place until February 29, 2016. The gross expense ratios shown in the November 7, 2014 prospectus are 1.20%, 2.11%, 1.91%, 0.96%, 1.48%, 1.17%, 0.87%, and 0.77% for Class A, Class B, Class C, Class I, Class R3, Class R4, Class R5 and Class Y, respectively.
All investments are subject to risk including the possible loss of principal. For a discussion of the Fund’s risks, please see the Main Risks section of this report. For more detailed information on the risks associated with an investment in the Fund, please see the prospectus.
| Portfolio Managers | |
| Philip W. Ruedi, CFA | Mark A. Whitaker, CFA |
| Senior Vice President and Equity Portfolio Manager | Vice President and Equity Portfolio Manager |
How did the Fund perform?
The Class A shares of The Hartford MidCap Fund returned 15.57%, before sales charge, for the twelve-month period ended October 31, 2014, outperforming the Fund’s benchmark, the S&P MidCap 400 Index, which returned 11.65% for the same period. The Fund also outperformed the 10.25% average return of the Lipper Mid-Cap Growth Funds peer group, a group of funds with investment strategies similar to those of the Fund.
Why did the Fund perform this way?
U.S. equities surged during the period, despite bouts of significant volatility. After finishing their best year since 1997, U.S. stocks began 2014 with their worst month in nearly two years. Worries about an economic slowdown in China and general angst surrounding emerging markets overshadowed a fairly benign domestic environment. However, robust merger and acquisition activity and an uncontested increase in the debt ceiling from Congress helped stoke investors’ risk appetites in February. The rally continued in May amid renewed signs of life in the housing market and the best payroll gain in more than two years. However, a pullback in July ended a streak of five consecutive monthly gains. Fear gripped the market as heightened geopolitical risks, a potential Portuguese banking crisis, and worries of U.S. Federal Reserve (Fed) tightening took center stage. Stocks rebounded in August as investors were emboldened by encouraging economic data, headlined by better-than-expected gross domestic product (GDP) growth and signs that the housing recovery still had legs. In September, U.S. equities retreated for just the third month this year. Despite solid manufacturing and consumer confidence readings, the reality of quantitative easing ending and the prospect of higher federal funds rates in mid-2015 contributed to increased risk aversion levels. Stocks finished a volatile October at an all-time high on the heels of a positive earnings season and generally solid economic data. Returns also varied noticeably by market-cap, as small-cap stocks (+8%) and mid-cap stocks (+12%) underperformed large-cap stocks (+17%), as measured by the Russell 2000, S&P MidCap 400, and S&P 500 Indices, respectively. Within the S&P MidCap 400 Index, nine of the ten sectors posted positive returns. The Consumer Staples (+34%), Healthcare (+22%) and Utilities (+15%) sectors performed best while Energy (-11%) lagged.
The Fund outperformed its benchmark during the period primarily as a result of strong security selection. Stock selection contributed to relative performance in nine of ten sectors, led by the Healthcare, Consumer Discretionary, and Utilities sectors. Sector allocation, a result of our bottom up stock selection process, detracted modestly during the period due primarily to an overweight to the Energy sector and an underweight to the Consumer Staples sector.
Top contributors to relative performance included Incyte (Healthcare), NXP Semiconductors (Information Technology), and Monster Beverage (Consumer Staples). Incyte is a drug developer company focused on the treatment of cancers, myelofibrosis, and inflammation. Shares moved higher following strong third-quarter
| 3 |
| The Hartford MidCap Fund |
| Manager Discussion – (continued) |
| October 31, 2014 (Unaudited) |
results which beat consensus estimates, largely driven by sales of Jakafi, a drug for the treatment of myelofibrosis, a type of bone marrow cancer. Shares of Netherlands-based semiconductor company NXP Semiconductors rose based on a favorable outlook and increasing optimism among investors. Shares of Monster Beverage, a U.S.-based maker of energy drinks, surged after the company announced a long-term strategic partnership with Coca-Cola. As part of the deal, Coca-Cola purchased a 17% stake in Monster. Top absolute contributors for the period included Advanced Auto Parts (Consumer Discretionary) and Alkermes (Healthcare).
Top relative and absolute detractors included Cobalt International Energy (Energy), Genpact (Information Technology), and Jacobs Engineering (Industrials). Shares of Cobalt International Energy, a U.S.-based, oil-focused exploration and production company, underperformed as negative investor sentiment for the subsector dampened the stock price. Uncertainty surrounding the impact of questions from the SEC also weighed on the stock. Shares of Genpact, a business process outsourcing services provider, underperformed after the company lowered revenue guidance due to slower completion of larger deals and lower volumes. Shares of Jacobs Engineering, an engineering and construction firm, declined during the period due to concerns about the energy and mining sectors, which have been soft lately.
Derivatives are not used in a significant manner in this Fund and did not have an impact on performance during the period.
What is the outlook?
We believe the global economic cycle continues to advance at a moderate pace with a mix of stronger growth in the U.S. and more sluggish activity in Europe, Japan, and China. We believe the U.S. economy is on track for a self-sustaining expansion and should, due to a steadily improving labor market, experience rising wage inflation and a moderate increase in policy rates next year. At the end of the period, our largest overweights were in the Healthcare, Industrials, and Information Technology sectors, while our largest underweights were Financials, where our research continues to find that real estate investment trusts (REIT) are not attractively valued, as well as Materials, and Utilities, relative to the benchmark.
| Diversification by Sector | ||||
| as of October 31, 2014 | ||||
| Sector | Percentage of Net Assets | |||
| Equity Securities | ||||
| Consumer Discretionary | 14.2 | % | ||
| Consumer Staples | 2.9 | |||
| Energy | 7.0 | |||
| Financials | 13.4 | |||
| Health Care | 19.1 | |||
| Industrials | 18.5 | |||
| Information Technology | 19.2 | |||
| Materials | 3.1 | |||
| Utilities | 2.2 | |||
| Total | 99.6 | % | ||
| Short-Term Investments | 0.4 | |||
| Other Assets and Liabilities | 0.0 | |||
| Total | 100.0 | % | ||
A sector may be comprised of several industries. For Fund compliance purposes, the Fund may not use the same classification system and these sector classifications are used for reporting ease.
| 4 |
| The Hartford MidCap Fund |
| Schedule of Investments |
| October 31, 2014 |
| (000’s Omitted) |
| Shares or Principal Amount | Market Value ╪ | |||||||
| Common Stocks - 99.6% | ||||||||
| Automobiles and Components - 2.9% | ||||||||
| 1,822 | Allison Transmission Holdings, Inc. | $ | 59,175 | |||||
| 1,018 | Harley-Davidson, Inc. | 66,892 | ||||||
| 126,067 | ||||||||
| Banks - 3.7% | ||||||||
| 226 | Cullen/Frost Bankers, Inc. | 18,234 | ||||||
| 477 | East West Bancorp, Inc. | 17,552 | ||||||
| 858 | First Republic Bank | 43,697 | ||||||
| 679 | M&T Bank Corp. | 82,957 | ||||||
| 162,440 | ||||||||
| Capital Goods - 7.4% | ||||||||
| 370 | Colfax Corp. ● | 20,123 | ||||||
| 638 | IDEX Corp. | 47,783 | ||||||
| 877 | Jacobs Engineering Group, Inc. ● | 41,601 | ||||||
| 782 | Lennox International, Inc. | 69,548 | ||||||
| 667 | MSC Industrial Direct Co., Inc. | 54,016 | ||||||
| 748 | PACCAR, Inc. | 48,858 | ||||||
| 423 | Pall Corp. | 38,653 | ||||||
| 320,582 | ||||||||
| Commercial and Professional Services - 8.7% | ||||||||
| 779 | Clean Harbors, Inc. ● | 38,638 | ||||||
| 1,301 | Equifax, Inc. | 98,521 | ||||||
| 868 | Manpowergroup, Inc. | 57,929 | ||||||
| 1,878 | Robert Half International, Inc. | 102,858 | ||||||
| 436 | Trinet Group, Inc. ● | 13,047 | ||||||
| 1,403 | Waste Connections, Inc. | 70,029 | ||||||
| 381,022 | ||||||||
| Consumer Durables and Apparel - 1.7% | ||||||||
| 59 | NVR, Inc. ● | 71,978 | ||||||
| Consumer Services - 1.2% | ||||||||
| 871 | Apollo Education Group, Inc. ● | 24,970 | ||||||
| 533 | DeVry Education Group, Inc. | 25,826 | ||||||
| 50,796 | ||||||||
| Diversified Financials - 4.0% | ||||||||
| 627 | Invesco Ltd. | 25,385 | ||||||
| 379 | Moody’s Corp. | 37,641 | ||||||
| 701 | MSCI, Inc. | 32,715 | ||||||
| 566 | Northern Trust Corp. | 37,508 | ||||||
| 1,108 | SEI Investments Co. | 42,836 | ||||||
| 176,085 | ||||||||
| Energy - 7.0% | ||||||||
| 80 | Cimarex Energy Co. | 9,076 | ||||||
| 1,895 | Cobalt International Energy, Inc. ● | 22,190 | ||||||
| 905 | Consol Energy, Inc. | 33,291 | ||||||
| 594 | Energen Corp. | 40,240 | ||||||
| 377 | EQT Corp. | 35,410 | ||||||
| 253 | Gulfport Energy Corp. ● | 12,718 | ||||||
| 1,132 | Laredo Petroleum, Inc. ● | 21,466 | ||||||
| 421 | Memorial Resource Development Corp. ● | 11,417 | ||||||
| 334 | Oasis Petroleum, Inc. ● | 10,008 | ||||||
| 1,335 | Patterson-UTI Energy, Inc. | 30,744 | ||||||
| 1,044 | QEP Resources, Inc. | 26,165 | ||||||
| 285 | Range Resources Corp. | 19,479 | ||||||
| 1,070 | Superior Energy Services, Inc. | 26,912 | ||||||
| 111 | Whiting Petroleum Corp. ● | 6,787 | ||||||
| 305,903 | ||||||||
| Food and Staples Retailing - 0.6% | ||||||||
| 274 | PriceSmart, Inc. | 24,383 | ||||||
| Food, Beverage and Tobacco - 2.3% | ||||||||
| 480 | Molson Coors Brewing Co. | 35,736 | ||||||
| 622 | Monster Beverage Corp. ● | 62,724 | ||||||
| 98,460 | ||||||||
| Health Care Equipment and Services - 7.4% | ||||||||
| 1,221 | Envision Healthcare Holdings ● | 42,667 | ||||||
| 1,455 | IMS Health Holdings, Inc. ● | 35,274 | ||||||
| 487 | MEDNAX, Inc. ● | 30,394 | ||||||
| 516 | Omnicare, Inc. | 34,348 | ||||||
| 866 | Patterson Cos., Inc. | 37,315 | ||||||
| 547 | Sirona Dental Systems, Inc. ● | 42,983 | ||||||
| 621 | Team Health Holdings ● | 38,856 | ||||||
| 601 | Universal Health Services, Inc. Class B | 62,348 | ||||||
| 324,185 | ||||||||
| Insurance - 5.7% | ||||||||
| 115 | Alleghany Corp. ● | 51,068 | ||||||
| 96 | Fairfax Financial Holdings Ltd. | 43,696 | ||||||
| 124 | Markel Corp. ● | 85,930 | ||||||
| 687 | W.R. Berkley Corp. | 35,415 | ||||||
| 52 | White Mountains Insurance Group Ltd. | 32,705 | ||||||
| 248,814 | ||||||||
| Materials - 3.1% | ||||||||
| 599 | Packaging Corp. of America | 43,151 | ||||||
| 122 | Reliance Steel & Aluminum | 8,264 | ||||||
| 127 | Sherwin-Williams Co. | 29,226 | ||||||
| 641 | Silgan Holdings, Inc. | 31,516 | ||||||
| 990 | Steel Dynamics, Inc. | 22,777 | ||||||
| 134,934 | ||||||||
| Media - 1.0% | ||||||||
| 689 | DreamWorks Animation SKG, Inc. ● | 15,350 | ||||||
| 1,493 | Pandora Media, Inc. ● | 28,794 | ||||||
| 44,144 | ||||||||
| Pharmaceuticals, Biotechnology and Life Sciences - 11.7% | ||||||||
| 1,996 | Alkermes plc ● | 100,884 | ||||||
| 393 | Alnylam Pharmaceuticals, Inc. ● | 36,431 | ||||||
| 763 | Cubist Pharmaceuticals, Inc. ● | 55,169 | ||||||
| 506 | Hospira, Inc. ● | 27,192 | ||||||
| 927 | Incyte Corp. ● | 62,144 | ||||||
| 1,782 | Ironwood Pharmaceuticals, Inc. ● | 24,989 | ||||||
| 125 | Jazz Pharmaceuticals plc ● | 21,071 | ||||||
| 549 | Medivation, Inc. ● | 58,047 | ||||||
| 82 | Mettler-Toledo International, Inc. ● | 21,275 | ||||||
| 447 | Salix Pharmaceuticals Ltd. ● | 64,362 | ||||||
| 359 | Waters Corp. ● | 39,787 | ||||||
| 511,351 | ||||||||
| Retailing - 7.4% | ||||||||
| 770 | Advance Automotive Parts, Inc. | 113,158 | ||||||
| 1,363 | CarMax, Inc. ● | 76,225 | ||||||
| 1,438 | HomeAway, Inc. ● | 50,171 | ||||||
| 239 | Tiffany & Co. | 22,986 | ||||||
| 681 | TripAdvisor, Inc. ● | 60,389 | ||||||
| 322,929 | ||||||||
| Semiconductors and Semiconductor Equipment - 2.4% | ||||||||
| 328 | First Solar, Inc. ● | 19,303 | ||||||
| 986 | Maxim Integrated Products, Inc. | 28,920 | ||||||
| 513 | NXP Semiconductors N.V. ● | 35,243 | ||||||
| 609 | SunPower Corp. ● | 19,394 | ||||||
| 102,860 | ||||||||
| Software and Services - 11.4% | ||||||||
| 1,161 | Akamai Technologies, Inc. ● | 69,980 | ||||||
The accompanying notes are an integral part of these financial statements.
| 5 |
| The Hartford MidCap Fund |
| Schedule of Investments – (continued) |
| October 31, 2014 |
| (000’s Omitted) |
| Shares or Principal Amount | Market Value ╪ | |||||||||||
| Common Stocks - 99.6% - (continued) | ||||||||||||
| Software and Services - 11.4% - (continued) | ||||||||||||
| 330 | Citrix Systems, Inc. ● | $ | 21,220 | |||||||||
| 468 | Factset Research Systems, Inc. | 61,448 | ||||||||||
| 5,057 | Genpact Ltd. ● | 88,749 | ||||||||||
| 621 | Solera Holdings, Inc. | 32,258 | ||||||||||
| 2,718 | Vantiv, Inc. ● | 84,032 | ||||||||||
| 665 | VeriSign, Inc. ● | 39,748 | ||||||||||
| 502 | WEX, Inc. ● | 56,988 | ||||||||||
| 667 | Yelp, Inc. ● | 40,003 | ||||||||||
| 494,426 | ||||||||||||
| Technology Hardware and Equipment - 5.4% | ||||||||||||
| 823 | Amphenol Corp. Class A | 41,632 | ||||||||||
| 216 | F5 Networks, Inc. ● | 26,606 | ||||||||||
| 245 | FEI Co. | 20,625 | ||||||||||
| 2,127 | National Instruments Corp. | 67,379 | ||||||||||
| 718 | Nimble Storage, Inc. ● | 19,654 | ||||||||||
| 2,171 | Trimble Navigation Ltd. ● | 58,311 | ||||||||||
| 234,207 | ||||||||||||
| Transportation - 2.4% | ||||||||||||
| 82 | AMERCO, Inc. | 22,335 | ||||||||||
| 441 | Genesee & Wyoming, Inc. Class A ● | 42,381 | ||||||||||
| 489 | J.B. Hunt Transport Services, Inc. | 38,979 | ||||||||||
| 103,695 | ||||||||||||
| Utilities - 2.2% | ||||||||||||
| 335 | Northeast Utilities | 16,516 | ||||||||||
| 1,590 | UGI Corp. | 59,929 | ||||||||||
| 416 | Wisconsin Energy Corp. | 20,634 | ||||||||||
| 97,079 | ||||||||||||
| Total Common Stocks | ||||||||||||
| ( Cost $3,240,129) | $ | 4,336,340 | ||||||||||
| Total Long-Term Investments | ||||||||||||
| (Cost $3,240,129) | $ | 4,336,340 | ||||||||||
| Short-Term Investments - 0.4% | ||||||||||||
| Repurchase Agreements - 0.4% | ||||||||||||
| Bank of America Merrill Lynch TriParty Repurchase Agreement (maturing on 11/03/2014 in the amount of $50, collateralized by U.S. Treasury Note 1.50%, 2019, value of $51) |
||||||||||||
| $ | 50 | 0.08%, 10/31/2014 | $ | 50 | ||||||||
| Bank of America Merrill Lynch TriParty Repurchase Agreement (maturing on 11/03/2014 in the amount of $847, collateralized by GNMA 1.63% - 7.00%, 2031 - 2054, value of $863) |
||||||||||||
| 847 | 0.09%, 10/31/2014 | 847 | ||||||||||
| Bank of Montreal TriParty Repurchase Agreement (maturing on 11/03/2014 in the amount of $227, collateralized by U.S. Treasury Bond 2.88% - 5.25%, 2029 - 2043, U.S. Treasury Note 0.38% - 4.50%, 2015 - 2022, value of $232) |
||||||||||||
| 227 | 0.08%, 10/31/2014 | 227 | ||||||||||
| Bank of Montreal TriParty Repurchase Agreement (maturing on 11/03/2014 in the amount of $771, collateralized by FHLMC 2.00% - 5.50%, 2022 - 2034, FNMA 2.00% - 4.50%, 2024 - 2039, GNMA 3.00%, 2043, U.S. Treasury Note 4.63%, 2017, value of $786) |
||||||||||||
| 771 | 0.10%, 10/31/2014 | 771 | ||||||||||
| Barclays Capital TriParty Repurchase Agreement (maturing on 11/03/2014 in the amount of $2,905, collateralized by U.S. Treasury Bond 4.50% - 6.25%, 2023 - 2036, U.S. Treasury Note 1.63% - 2.13%, 2015 - 2019, value of $2,963) | ||||||||||||
| 2,905 | 0.08%, 10/31/2014 | 2,905 | ||||||||||
| Citigroup Global Markets, Inc. TriParty Repurchase Agreement (maturing on 11/03/2014 in the amount of $3,339, collateralized by U.S. Treasury Bill 0.02%, 2015, U.S. Treasury Bond 3.88% - 11.25%, 2015 - 2040, U.S. Treasury Note 2.00% - 3.38%, 2019 - 2021, value of $3,406) | ||||||||||||
| 3,339 | 0.09%, 10/31/2014 | 3,339 | ||||||||||
| Deutsche Bank Securities TriParty Repurchase Agreement (maturing on 11/03/2014 in the amount of $193, collateralized by U.S. Treasury Note 0.88%, 2017, value of $197) | ||||||||||||
| 193 | 0.13%, 10/31/2014 | 193 | ||||||||||
| RBS Securities, Inc. TriParty Repurchase Agreement (maturing on 11/03/2014 in the amount of $284, collateralized by U.S. Treasury Bond 3.63% - 5.00%, 2037 - 2043, U.S. Treasury Note 2.13%, 2020, value of $289) | ||||||||||||
| 284 | 0.07%, 10/31/2014 | 284 | ||||||||||
| Societe Generale TriParty Repurchase Agreement (maturing on 11/03/2014 in the amount of $2,989, collateralized by U.S. Treasury Bill 0.02%, 2015, U.S. Treasury Bond 3.75% - 11.25%, 2015 - 2043, U.S. Treasury Note 1.38% - 4.25%, 2015 - 2022, value of $3,049) | ||||||||||||
| 2,989 | 0.08%, 10/31/2014 | 2,989 | ||||||||||
| TD Securities TriParty Repurchase Agreement (maturing on 11/03/2014 in the amount of $5,792, collateralized by FHLMC 3.00% - 4.00%, 2026 - 2044, FNMA 2.50% - 5.00%, 2025 - 2044, U.S. Treasury Bond 3.50% - 6.50%, 2026 - 2041, U.S. Treasury Note 1.75% - 2.88%, 2018 - 2019, value of $5,908) | ||||||||||||
| 5,792 | 0.10%, 10/31/2014 | 5,792 | ||||||||||
| 17,397 | ||||||||||||
| Total Short-Term Investments | ||||||||||||
| (Cost $17,397) | $ | 17,397 | ||||||||||
| Total Investments | ||||||||||||
| (Cost $3,257,526) ▲ | 100.0 | % | $ | 4,353,737 | ||||||||
| Other Assets and Liabilities | – | % | 1,352 | |||||||||
| Total Net Assets | 100.0 | % | $ | 4,355,089 | ||||||||
The accompanying notes are an integral part of these financial statements.
| 6 |
| The Hartford MidCap Fund |
| Schedule of Investments – (continued) |
| October 31, 2014 |
| (000’s Omitted) |
Note: Percentage of investments as shown is the ratio of the total market value to total net assets.
Prices of foreign equities that are principally traded on certain foreign markets may be adjusted daily pursuant to a fair value pricing service approved by the Board of Directors in order to reflect an adjustment for factors occurring after the close of certain foreign markets but before the close of the New York Stock Exchange.
Equity industry classifications used in this report are the Global Industry Classification Standard, which was developed by and is the exclusive property and service mark of MSCI, Inc. and Standard & Poor’s.
For Fund compliance purposes, the Fund may not use the same classification system shown in this report as these classifications are used for reporting ease.
| ▲ | At October 31, 2014, the cost of securities for federal income tax purposes was $3,264,236 and the aggregate gross unrealized appreciation and depreciation based on that cost were: |
| Unrealized Appreciation | $ | 1,165,136 | ||
| Unrealized Depreciation | (75,635 | ) | ||
| Net Unrealized Appreciation | $ | 1,089,501 |
| ● | Non-income producing. |
| ╪ | See Significant Accounting Policies of accompanying Notes to Financial Statements regarding valuation of securities. |
| GLOSSARY: (abbreviations used in preceding Schedule of Investments) | |
| Other Abbreviations: | |
| FHLMC | Federal Home Loan Mortgage Corp. |
| FNMA | Federal National Mortgage Association |
| GNMA | Government National Mortgage Association |
The accompanying notes are an integral part of these financial statements.
| 7 |
| The Hartford MidCap Fund |
| Schedule of Investments – (continued) |
| October 31, 2014 |
| (000’s Omitted) |
Investment Valuation Hierarchy Level Summary
October 31, 2014
| Total | Level 1 ♦ | Level 2 ♦ | Level 3 | |||||||||||||
| Assets: | ||||||||||||||||
| Common Stocks ‡ | $ | 4,336,340 | $ | 4,336,340 | $ | — | $ | — | ||||||||
| Short-Term Investments | 17,397 | — | 17,397 | — | ||||||||||||
| Total | $ | 4,353,737 | $ | 4,336,340 | $ | 17,397 | $ | — | ||||||||
| ♦ | For the year ended October 31, 2014, there were no transfers between Level 1 and Level 2. |
| ‡ | The Fund has all or primarily all of the equity securities categorized in a particular level. Refer to the Schedule of Investments for further industry breakout. |
| Note: | For purposes of reporting transfers between different hierarchy levels, both transfers in and out of each level, as applicable, are shown as if they occurred at the beginning of the period. |
The accompanying notes are an integral part of these financial statements.
| 8 |
| The Hartford MidCap Fund |
| Statement of Assets and Liabilities |
| October 31, 2014 |
| (000’s Omitted) |
| Assets: | ||||
| Investments in securities, at market value (cost $3,257,526) | $ | 4,353,737 | ||
| Cash | — | |||
| Receivables: | ||||
| Investment securities sold | 4,853 | |||
| Fund shares sold | 8,717 | |||
| Dividends and interest | 603 | |||
| Other assets | 112 | |||
| Total assets | 4,368,022 | |||
| Liabilities: | ||||
| Payables: | ||||
| Investment securities purchased | 7,731 | |||
| Fund shares redeemed | 3,860 | |||
| Investment management fees | 590 | |||
| Administrative fees | 7 | |||
| Distribution fees | 206 | |||
| Accrued expenses | 539 | |||
| Total liabilities | 12,933 | |||
| Net assets | $ | 4,355,089 | ||
| Summary of Net Assets: | ||||
| Capital stock and paid-in-capital | $ | 2,841,272 | ||
| Undistributed net investment income | — | |||
| Accumulated net realized gain | 417,606 | |||
| Unrealized appreciation of investments | 1,096,211 | |||
| Net assets | $ | 4,355,089 | ||
| Shares authorized | 760,000 | |||
| Par value | $ | 0.001 | ||
| Class A: Net asset value per share/Maximum offering price per share | $27.38/$28.97 | |||
| Shares outstanding | 69,057 | |||
| Net assets | $ | 1,891,075 | ||
| Class B: Net asset value per share | $ | 21.65 | ||
| Shares outstanding | 1,360 | |||
| Net assets | $ | 29,446 | ||
| Class C: Net asset value per share | $ | 22.18 | ||
| Shares outstanding | 24,537 | |||
| Net assets | $ | 544,154 | ||
| Class I: Net asset value per share | $ | 27.78 | ||
| Shares outstanding | 19,826 | |||
| Net assets | $ | 550,720 | ||
| Class R3: Net asset value per share | $ | 30.02 | ||
| Shares outstanding | 1,879 | |||
| Net assets | $ | 56,403 | ||
| Class R4: Net asset value per share | $ | 30.61 | ||
| Shares outstanding | 3,078 | |||
| Net assets | $ | 94,232 | ||
| Class R5: Net asset value per share | $ | 30.96 | ||
| Shares outstanding | 3,564 | |||
| Net assets | $ | 110,364 | ||
| Class Y: Net asset value per share | $ | 31.10 | ||
| Shares outstanding | 34,689 | |||
| Net assets | $ | 1,078,695 |
The accompanying notes are an integral part of these financial statements.
| 9 |
| The Hartford MidCap Fund |
| Statement of Operations |
| For the Year Ended October 31, 2014 |
| (000’s Omitted) |
| Investment Income: | ||||
| Dividends | $ | 30,438 | ||
| Interest | 11 | |||
| Less: Foreign tax withheld | (104 | ) | ||
| Total investment income | 30,345 | |||
| Expenses: | ||||
| Investment management fees | 29,404 | |||
| Administrative services fees | ||||
| Class R3 | 105 | |||
| Class R4 | 124 | |||
| Class R5 | 100 | |||
| Transfer agent fees | ||||
| Class A | 2,753 | |||
| Class B | 93 | |||
| Class C | 596 | |||
| Class I | 505 | |||
| Class R3 | 5 | |||
| Class R4 | 3 | |||
| Class R5 | 1 | |||
| Class Y | 15 | |||
| Distribution fees | ||||
| Class A | 4,854 | |||
| Class B | 317 | |||
| Class C | 5,132 | |||
| Class R3 | 263 | |||
| Class R4 | 206 | |||
| Custodian fees | 20 | |||
| Accounting services fees | 487 | |||
| Registration and filing fees | 240 | |||
| Board of Directors’ fees | 106 | |||
| Audit fees | 37 | |||
| Other expenses | 565 | |||
| Total expenses (before fees paid indirectly) | 45,931 | |||
| Commission recapture | (56 | ) | ||
| Custodian fee offset | — | |||
| Total fees paid indirectly | (56 | ) | ||
| Total expenses, net | 45,875 | |||
| Net Investment Loss | (15,530 | ) | ||
| Net Realized Gain on Investments and Foreign Currency Transactions: | ||||
| Net realized gain on investments | 446,237 | |||
| Net realized gain on foreign currency contracts | 30 | |||
| Net realized loss on other foreign currency transactions | (30 | ) | ||
| Net Realized Gain on Investments and Foreign Currency Transactions | 446,237 | |||
| Net Changes in Unrealized Appreciation of Investments: | ||||
| Net unrealized appreciation of investments | 143,809 | |||
| Net Changes in Unrealized Appreciation of Investments | 143,809 | |||
| Net Gain on Investments and Foreign Currency Transactions | 590,046 | |||
| Net Increase in Net Assets Resulting from Operations | $ | 574,516 |
The accompanying notes are an integral part of these financial statements.
| 10 |
| The Hartford MidCap Fund |
| Statement of Changes in Net Assets |
| (000’s Omitted) |
| For the Year Ended October 31, 2014 | For the Year Ended October 31, 2013 | |||||||
| Operations: | ||||||||
| Net investment loss | $ | (15,530 | ) | $ | (4,019 | ) | ||
| Net realized gain on investments and foreign currency transactions | 446,237 | 293,194 | ||||||
| Net unrealized appreciation of investments | 143,809 | 677,846 | ||||||
| Net Increase in Net Assets Resulting from Operations | 574,516 | 967,021 | ||||||
| Distributions to Shareholders: | ||||||||
| From net investment income | ||||||||
| Class A | — | (608 | ) | |||||
| Class I | — | (578 | ) | |||||
| Class R4 | — | (2 | ) | |||||
| Class R5 | — | (235 | ) | |||||
| Class Y | — | (2,944 | ) | |||||
| Total from net investment income | — | (4,367 | ) | |||||
| From net realized gain on investments | ||||||||
| Class A | (143,567 | ) | (96,210 | ) | ||||
| Class B | (3,118 | ) | (2,311 | ) | ||||
| Class C | (44,516 | ) | (28,184 | ) | ||||
| Class I | (21,759 | ) | (13,170 | ) | ||||
| Class R3 | (3,447 | ) | (2,175 | ) | ||||
| Class R4 | (5,330 | ) | (3,216 | ) | ||||
| Class R5 | (6,408 | ) | (3,729 | ) | ||||
| Class Y | (61,071 | ) | (36,780 | ) | ||||
| Total from net realized gain on investments | (289,216 | ) | (185,775 | ) | ||||
| Total distributions | (289,216 | ) | (190,142 | ) | ||||
| Capital Share Transactions: | ||||||||
| Class A | (90,324 | ) | (80,718 | ) | ||||
| Class B | (5,095 | ) | (4,400 | ) | ||||
| Class C | 44,606 | 2,588 | ||||||
| Class I | 244,983 | 7,819 | ||||||
| Class R3 | 4,719 | 82 | ||||||
| Class R4 | 9,864 | 3,947 | ||||||
| Class R5 | 11,117 | 5,419 | ||||||
| Class Y | 128,130 | 45,181 | ||||||
| Net increase (decrease) from capital share transactions | 348,000 | (20,082 | ) | |||||
| Net Increase in Net Assets | 633,300 | 756,797 | ||||||
| Net Assets: | ||||||||
| Beginning of period | 3,721,789 | 2,964,992 | ||||||
| End of period | $ | 4,355,089 | $ | 3,721,789 | ||||
| Undistributed (distributions in excess of) net investment income | $ | — | $ | (4,084 | ) | |||
The accompanying notes are an integral part of these financial statements.
| 11 |
| The Hartford MidCap Fund |
| Notes to Financial Statements |
| October 31, 2014 |
| (000’s Omitted) |
Organization:
The Hartford Mutual Funds, Inc. (“Company”) is an open-end management investment company comprised of forty-two portfolios. Financial statements for The Hartford MidCap Fund (the “Fund”), a series of the Company, are included in this report.
The Company is organized under the laws of the State of Maryland and is registered with the Securities and Exchange Commission (“SEC”) under the Investment Company Act of 1940, as amended (“1940 Act”). The Fund is a diversified open-end management investment company. The Fund is an investment company and applies specialized accounting and reporting under Accounting Standards Codification Topic 946, Financial Services - Investment Companies.
Class A shares are sold with a front-end sales charge of up to 5.50%. Class B shares were sold with a contingent deferred sales charge which is assessed on the lesser of the per share net asset value (“NAV”) of the shares at the time of redemption or the original purchase price, and declines from up to 5.00% to zero depending on the period of time the shares are held (see note below regarding the closing of Class B shares). Class C shares are sold with a contingent deferred sales charge of up to 1.00% on shares redeemed within twelve months of purchase. Class I shares are sold without sales charges to certain eligible investors primarily through advisory fee-based wrap programs. Class R3, R4 and R5 shares, which are offered to employer-sponsored retirement plans, and Class Y shares, which are sold to certain eligible institutional investors, are sold without a sales charge. All classes of shares have identical voting, redemption, dividend, liquidation and other rights and the same terms and conditions, with the exceptions that each class may have different expenses, which may affect performance, and that Class B shares automatically convert to Class A shares after 8 years.
No new or additional investments are allowed in Class B shares of the Fund (including investments through any systematic investment plan). Existing shareholders of Class B shares may continue to hold their Class B shares, exchange their Class B shares for Class B shares of another Hartford Fund (as permitted by existing exchange privileges), or redeem their Class B shares as described in the Fund’s prospectus. Reinstatement privileges with respect to Class B shares are set forth in the Fund’s prospectus. For investors electing to reinvest capital gains and dividends, any such capital gains or dividends on Class B shares will continue to be reinvested in Class B shares of the Fund. All Class B share attributes, including the 12b-1 fee, contingent deferred sales charge schedule, and conversion to Class A shares, remain unchanged.
Significant Accounting Policies:
The following is a summary of significant accounting policies of the Fund in the preparation of its financial statements, which are in accordance with United States generally accepted accounting principles (“U.S. GAAP”). The preparation of financial statements in accordance with U.S. GAAP may require management to make estimates and assumptions that affect the reported amounts of assets and liabilities and disclosure of contingent assets and liabilities at the date of the financial statements and the reported amounts of increases and decreases in net assets from operations during the reporting period. Actual results could differ from those estimates.
Determination of Net Asset Value – The NAV of each class of the Fund’s shares is determined as of the close of regular trading (normally 4:00 p.m. Eastern Time) (the “NYSE Close”) on each day that the New York Stock Exchange (the “Exchange”) is open (“Valuation Date”). Information that becomes known to the Fund after the NAV has been calculated on a particular day will not generally be used to retroactively adjust the NAV determined earlier that day.
Investment Valuation and Fair Value Measurements – For purposes of calculating the NAV, portfolio investments and other assets held by the Fund’s portfolio for which market quotes are readily available are valued at market value. Market value is generally determined on the basis of last reported sales prices or official close price. If no sales are reported, market value is based on quotes obtained from a quotation reporting system, established market makers, or independent pricing services. If market prices are not readily available or are deemed unreliable, the Fund will use the fair value of the investment as determined in good faith under policies and procedures established by and under the supervision of the Company’s Board of Directors. Market quotes are considered not readily available where there is an absence of current or reliable market-based data (e.g., trade information or indicative market quotes), including where events occur after the close of the relevant market, but prior to the NYSE Close, that materially affect the values of the Fund’s portfolio investments or assets. In addition, market quotes are considered not readily available when, due to extraordinary circumstances, the exchanges or markets on which the investments trade do not open for trading for the entire day and no other market prices are available. In addition, prices of foreign equities that are principally traded on certain foreign markets may
| 12 |
| The Hartford MidCap Fund |
| Notes to Financial Statements – (continued) |
| October 31, 2014 |
| (000’s Omitted) |
be adjusted daily pursuant to a fair value pricing service approved by the Board of Directors in order to reflect an adjustment for the factors occurring after the close of certain foreign markets but before the NYSE Close. Investments that are primarily traded on foreign markets may trade on days that are not business days of the Fund. The value of the foreign investments in which the Fund invests may change on days when a shareholder will not be able to purchase or redeem shares of the Fund. Fair value pricing is subjective in nature and the use of fair value pricing by the Fund may cause the NAV of its shares to differ significantly from the NAV that would have been calculated using market prices at the close of the exchange on which a portfolio investment is primarily traded. There can be no assurance that the Fund could obtain the fair market value assigned to an investment if the Fund were to sell the investment at approximately the time at which the Fund determines its NAV.
Investments valued in currencies other than U.S. dollars are converted to U.S. dollars using exchange rates obtained from independent pricing services for calculation of the NAV. As a result, the NAV of the Fund’s shares may be affected by changes in the value of currencies in relation to the U.S. dollar. The value of investments traded in markets outside the United States or denominated in currencies other than the U.S. dollar may be affected significantly on a day that the NYSE is closed and the market value may change on days when an investor is not able to purchase, redeem or exchange shares of the Fund.
Foreign currency contracts represent agreements to exchange currencies on specific future dates at predetermined rates. Foreign currency contracts are valued using foreign currency exchange rates and forward rates as provided by an independent pricing service on the Valuation Date.
Financial instruments for which prices are not available from an independent pricing service may be valued using market quotations obtained from one or more dealers that make markets in the respective financial instrument in accordance with procedures established by the Company’s Board of Directors.
U.S. GAAP defines fair value as the price that the Fund would receive to sell an asset or pay to transfer a liability in an orderly transaction between market participants. The U.S. GAAP fair value measurement standards require disclosure of a fair value hierarchy for each major category of assets and liabilities. Various inputs are used in determining the fair value of the Fund’s investments. These inputs are summarized into three broad hierarchy levels. This hierarchy is based on whether the valuation inputs are observable or unobservable. These levels are:
Level 1 – Quoted prices in active markets for identical investments. Level 1 may include exchange traded instruments, such as domestic equities, some foreign equities, options, futures, mutual funds, exchange traded funds, rights and warrants.
Level 2 – Observable inputs other than Level 1 prices, such as quoted prices for similar investments; quoted prices in markets that are not active; or other inputs that are observable or can be corroborated by observable market data. Level 2 may include debt investments that are traded less frequently than exchange traded instruments and which are valued using independent pricing services; foreign equities, which are principally traded on certain foreign markets and are adjusted daily pursuant to a fair value pricing service in order to reflect an adjustment for the factors occurring after the close of certain foreign markets but before the NYSE Close; senior floating rate interests, which are valued using an aggregate of dealer bids; short-term investments, which are valued at amortized cost; and swaps, which are valued based upon the terms of each swap contract.
Level 3 – Significant unobservable inputs that are supported by limited or no market activity. Level 3 may include financial instruments whose values are determined using indicative market quotes or require significant management judgment or estimation. These unobservable valuation inputs may include estimates for current yields, maturity/duration, prepayment speed, and indicative market quotes for comparable investments along with other assumptions relating to credit quality, collateral value, complexity of the investment structure, general market conditions and liquidity. This category may include investments where trading has been halted or there are certain restrictions on trading. While these investments are priced using unobservable inputs, the valuation of these investments reflects the best available data and management believes the prices are a reasonable representation of exit price.
The Board of Directors of the Company generally reviews and approves the “Procedures for Valuation of Portfolio Securities” at least once a year. These procedures define how investments are to be valued, including the formation and activities of a Valuation Committee. The Valuation Committee is responsible for determining in good faith the fair value of investments when
| 13 |
| The Hartford MidCap Fund |
| Notes to Financial Statements – (continued) |
| October 31, 2014 |
| (000’s Omitted) |
the value cannot be obtained from primary pricing services or alternative sources or if the valuation of an investment as provided by the primary pricing service or alternative source is believed not to reflect the investment’s fair value as of the Valuation Date. Voting members of the Valuation Committee include the Fund’s Treasurer or designee and a Vice President of the investment manager or designee. An Assistant Vice President of the Fund with legal expertise or designee is also included on the Valuation Committee as a non-voting advisory member. In addition, the Fund’s Chief Compliance Officer shall designate a member of the compliance group to attend Valuation Committee meetings as a non-voting resource, to monitor for and provide guidance with respect to compliance with these procedures. Two members of the Valuation Committee or their designees, representing different departments, shall constitute a quorum for purposes of permitting the Valuation Committee to take action. The Valuation Committee will consider all relevant factors in determining an investment’s fair value, and may seek the advice of the Fund’s sub-adviser, knowledgeable brokers, and legal counsel in making such determination. The Valuation Committee reports to the Audit Committee of the Company’s Board of Directors. The Audit Committee receives quarterly written reports which include details of all fair-valued investments, including the reason for the fair valuation, and an indication, when possible, of the accuracy of the valuation by disclosing the next available reliable public price quotation or the disposition price of such investments (the “look-back” test). The Board of Directors then must consider for ratification all of the fair value determinations made during the previous quarter.
Valuation levels are not necessarily indicative of the risk associated with investing in such investments. Individual investments within any of the above mentioned asset classes may be assigned a different hierarchical level than those presented above, as individual circumstances dictate.
For additional information, refer to the Investment Valuation Hierarchy Level Summary which follows the Schedule of Investments.
Investment Transactions and Investment Income – Investment transactions are recorded as of the trade date (the date the order to buy or sell is executed) for financial reporting purposes. Investments purchased or sold on a when-issued or delayed-delivery basis may be settled a month or more after the trade date. Realized gains and losses are determined on the basis of identified cost.
Dividend income from domestic securities is accrued on the ex-dividend date. In general, dividend income from foreign securities is recorded on the ex-date; however, dividend notifications in certain foreign jurisdictions may not be available in a timely manner and as a result, the Fund will record the dividend as soon as the relevant details (i.e., rate per share, payment date, shareholders of record, etc.) are publicly available. Interest income, including amortization of premium, accretion of discounts and additional principal received in-kind in lieu of cash, is accrued on a daily basis.
Joint Trading Account – The Fund may invest cash balances into a joint trading account that may be invested in one or more repurchase agreements.
Fund Share Valuation and Dividend Distributions to Shareholders – Orders for the Fund’s shares are executed in accordance with the investment instructions of the shareholders. The NAV of the Fund’s shares is determined as of the close of business on each business day of the Exchange. The NAV is determined separately for each class of shares of the Fund by dividing the Fund’s net assets attributable to that class by the number of shares of the class outstanding. Each class of shares offered by the Fund has equal rights as to assets and voting privileges (except that shareholders of a class have exclusive voting rights regarding any matter relating solely to that class of shares). Income and non-class specific expenses are allocated daily to each class on the basis of the relative net assets of the class. Realized and unrealized gains and losses are allocated daily based on the relative net assets of each class of shares of the Fund.
Orders for the purchase of the Fund’s shares received prior to the close of the Exchange on any day the Exchange is open for business are priced at the NAV determined as of the close of the Exchange. Orders received after the close of the Exchange, or on a day on which the Exchange and/or the Fund is not open for business, are priced at the next determined NAV.
Dividends are declared pursuant to a policy adopted by the Company’s Board of Directors based upon the investment performance of the Fund. The policy of the Fund is to pay dividends from net investment income and realized gains, if any, at least once a year.
| 14 |
| The Hartford MidCap Fund |
| Notes to Financial Statements – (continued) |
| October 31, 2014 |
| (000’s Omitted) |
Net investment income, dividends and distributions from net realized gains and capital are determined in accordance with federal income tax regulations, which may differ from U.S. GAAP with respect to character and timing (see Federal Income Taxes: Distributions and Components of Distributable Earnings and Reclassification of Capital Accounts).
Securities and Other Investments:
Repurchase Agreements – A repurchase agreement is an agreement by which a counterparty agrees to sell an investment and agrees to repurchase the investment sold from the buyer at a mutually agreed upon time and price. During the period of the repurchase agreement, the counterparty will deposit cash and or securities in a third party custodial account to serve as collateral. At the time the Fund enters into a repurchase agreement, the value of the underlying collateral, including accrued interest, will be equal to or exceed the value of the repurchase agreement. Repurchase agreements expose the Fund to counterparty risk - that is, the risk that the counterparty will not fulfill its obligations. To minimize counterparty risk, the investments that serve to collateralize the repurchase agreement are held by the Fund’s custodian in book entry or physical form in the custodial account of the Fund or in a third party custodial account. Repurchase agreements are valued at cost plus accrued interest, which approximates fair value. Repurchase agreements have master netting arrangements which allow the Fund to offset amounts owed to a counterparty with amounts owed by the counterparty, including any collateral. Upon an event of default under a master repurchase agreement, the non-defaulting party may close out all transactions traded under such agreement and net amounts owed under each transaction to one net amount payable by one party to the other. Absent an event of default, the master repurchase agreement does not result in an offset of reported amounts of assets and liabilities in the Statement of Assets and Liabilities across transactions between the Fund and the applicable counterparty. The Fund, as shown on the Schedule of Investments, had outstanding repurchase agreements and related collateral as of October 31, 2014.
Financial Derivative Instruments:
The following disclosures contain information on how and why the Fund uses derivative instruments, the credit-risk-related contingent features in certain derivative instruments and how derivative instruments affect the Fund’s financial position and results of operations. The location and fair value amounts of these instruments on the Statement of Assets and Liabilities and the realized gains and losses and changes in unrealized gains and losses on the Statement of Operations, each categorized by type of derivative contract, are included in the following Additional Derivative Instrument Information footnote. The derivative instruments outstanding as of year-end are disclosed in the notes to the Schedule of Investments, if applicable. The amounts of realized gains and losses and changes in unrealized gains and losses on derivative instruments during the year are disclosed in the Statement of Operations.
Foreign Currency Contracts – The Fund may enter into foreign currency contracts that obligate the Fund to purchase or sell currencies at specified future dates. Foreign currency contracts are used to hedge the currency exposure associated with some or all of the Fund’s investments and/or as part of an investment strategy. Foreign currency contracts are marked to market daily and the change in value is recorded by the Fund as an unrealized gain or loss. The Fund will record a realized gain or loss when the foreign currency contract is settled.
Foreign currency contracts involve elements of market risk in excess of the amounts reflected in the Statement of Assets and Liabilities. In addition, risks may arise upon entering into these contracts from the potential inability of the counterparties to meet the terms of the contracts and from unanticipated movements in the value of the foreign currencies relative to the U.S. dollar. The Fund had no outstanding foreign currency contracts as of October 31, 2014.
Additional Derivative Instrument Information:
The volume of derivative activity was minimal during the year ended October 31, 2014.
| 15 |
| The Hartford MidCap Fund |
| Notes to Financial Statements – (continued) |
| October 31, 2014 |
| (000’s Omitted) |
The Effect of Derivative Instruments on the Statement of Operations for the year ended October 31, 2014:
| Risk Exposure Category | ||||||||||||||||||||||||||||
| Interest Rate Contracts | Foreign Exchange Contracts | Credit Contracts | Equity Contracts | Commodity Contracts | Other Contracts | Total | ||||||||||||||||||||||
| Realized Gain on Derivatives Recognized as a Result of Operations: | ||||||||||||||||||||||||||||
| Net realized gain on foreign currency contracts | $ | — | $ | 30 | $ | — | $ | — | $ | — | $ | — | $ | 30 | ||||||||||||||
| Total | $ | — | $ | 30 | $ | — | $ | — | $ | — | $ | — | $ | 30 | ||||||||||||||
Principal Risks:
The Fund may be exposed to counterparty risk, or the risk that an institution or other entity with which the Fund has unsettled or open transactions will default.
If the Fund invests directly in foreign currencies or in securities that trade in, and receive revenues in, foreign currencies, or in derivatives that provide exposure to foreign currencies, it will be subject to the risk that those currencies will decline in value relative to the base currency (U.S. dollars) of the Fund, or, in the case of hedging positions, that the Fund’s base currency will decline in value relative to the currency being hedged. Currency rates in foreign countries may fluctuate significantly over short periods of time for a number of reasons, including changes in interest rates, intervention (or the failure to intervene) by U.S. or foreign governments, central banks or supranational entities, such as the International Monetary Fund, or by the imposition of currency controls or other political developments in the United States or abroad. As a result, the Fund’s investments in foreign currency denominated securities may reduce the returns of the Fund. The market values of equity securities, such as common stocks and preferred stocks, or equity related investments, such as futures and options, may decline due to general market conditions which are not specifically related to a particular company, such as real or perceived adverse economic conditions, changes in the general outlook for corporate earnings, changes in interest or currency rates or adverse investor sentiment generally. The market value of equity securities may also decline due to factors which affect a particular industry or industries, such as labor shortages or increased production costs and competitive conditions within an industry. Equity securities and equity related investments generally have greater market price volatility than fixed income securities.
Federal Income Taxes:
Federal Income Taxes – For federal income tax purposes, the Fund intends to continue to qualify as a Regulated Investment Company (“RIC”) under Subchapter M of the Internal Revenue Code (“IRC”) by distributing substantially all of its taxable net investment income and net realized capital gains to its shareholders and otherwise complying with the requirements of the IRC. The Fund has distributed substantially all of its income and capital gains in prior years, if applicable, and intends to distribute substantially all of its income and capital gains during the calendar year ending December 31, 2014. Accordingly, no provision for federal income or excise taxes has been made in the accompanying financial statements. Distributions from short-term capital gains are treated as ordinary income distributions for federal income tax purposes.
Net Investment Income (Loss), Net Realized Gains (Losses) and Distributions – Net investment income (loss) and net realized gains (losses) may differ for financial statement and tax purposes primarily because of losses deferred due to wash sale adjustments, foreign currency gains and losses, adjustments related to Passive Foreign Investment Companies (“PFICs”), Real Estate Investment Trusts (“REITs”), RICs, certain derivatives and partnerships. The character of distributions made during the year from net investment income or net realized gains may differ from their ultimate characterization for federal income tax purposes. Also, due to the timing of dividend distributions, the fiscal year in which amounts are distributed may differ from the year that the income or realized gains (losses) were recorded by the Fund.
Distributions and Components of Distributable Earnings – The tax character of distributions paid by the Fund for the periods indicated is as follows (as adjusted for dividends payable, if applicable):
| For the Year Ended October 31, 2014 | For the Year Ended October 31, 2013 | |||||||
| Ordinary Income | $ | 35,486 | $ | 4,331 | ||||
| Long-Term Capital Gains ‡ | 253,730 | 185,811 | ||||||
| ‡ | The Fund designates these distributions as long-term capital gain dividends pursuant to IRC Sec. 852(b)(3)(C). |
| 16 |
| The Hartford MidCap Fund |
| Notes to Financial Statements – (continued) |
| October 31, 2014 |
| (000’s Omitted) |
As of October 31, 2014, the Fund’s components of distributable earnings (deficit) on a tax basis are as follows:
| Amount | ||||
| Undistributed Ordinary Income | $ | 51,668 | ||
| Undistributed Long-Term Capital Gain | 372,648 | |||
| Unrealized Appreciation* | 1,089,501 | |||
| Total Accumulated Earnings | $ | 1,513,817 | ||
| * | Differences between book-basis and tax-basis unrealized appreciation (depreciation) may be attributable to the losses deferred due to wash sale adjustments, foreign currency gains and losses, adjustments related to PFICs, REITs, RICs, certain derivatives and partnerships. |
Reclassification of Capital Accounts – The Fund may record reclassifications in its capital accounts. These reclassifications have no impact on the total net assets of the Fund. The reclassifications are a result of permanent differences between U.S. GAAP and tax accounting for such items as foreign currency, PFICs, expiration or utilization of capital loss carryforwards or net operating losses. Adjustments are made to reflect the impact these items have on current and future distributions to shareholders. Therefore, the source of the Fund’s distributions may be shown in the accompanying Statement of Changes in Net Assets as from undistributed net investment income, from accumulated net realized gains on investments or from capital depending on the type of book and tax differences that exist. For the year ended October 31, 2014, the Fund recorded reclassifications to increase (decrease) the accounts listed below:
| Amount | ||||
| Undistributed Net Investment Income (Loss) | $ | 19,614 | ||
| Accumulated Net Realized Gain (Loss) | (19,697 | ) | ||
| Capital Stock and Paid-in-Capital | 83 | |||
Capital Loss Carryforward – On December 22, 2010, the Regulated Investment Company Modernization Act of 2010 (the “Act”) was enacted, which made changes to the capital loss carryforward rules. The changes are effective for taxable years beginning after the date of enactment. Under the Act, funds are permitted to carry forward capital losses for an unlimited period. Additionally, capital loss carryforwards retain their character as either short-term or long-term capital losses rather than being considered all short-term as permitted under prior regulation.
The Fund had no capital loss carryforward for U.S. federal income tax purposes as of October 31, 2014.
Accounting for Uncertainty in Income Taxes – The Fund has adopted financial reporting rules that require the Fund to analyze all open tax years, as defined by the statute of limitations, for all major jurisdictions. Generally, tax authorities can examine all tax returns filed for the last three years. The Fund does not have an examination in progress.
The Fund has reviewed all open tax years and major jurisdictions and concluded that these financial reporting rules had no effect on the Fund’s financial position or results of operations. There is no tax liability resulting from unrecognized tax benefits relating to uncertain income tax positions taken or expected to be taken on the tax return for the fiscal year ended October 31, 2014. The Fund is also not aware of any tax positions for which it is reasonably possible that the total amounts of unrecognized tax benefits will significantly change in the next twelve months.
Expenses:
Investment Management Agreement – Hartford Funds Management Company, LLC (“HFMC”) serves as the Fund’s investment manager pursuant to an Investment Management Agreement with the Company. HFMC is an indirect wholly owned subsidiary of The Hartford Financial Services Group, Inc. (“The Hartford”). The investment manager has overall investment supervisory responsibility for the Fund. In addition, the investment manager provides administrative personnel, services, equipment, facilities and office space for proper operation of the Fund. HFMC has contracted with Wellington Management Company, LLP (“Wellington Management”) under a sub-advisory agreement for the provision of day-to-day investment management services to the Fund in accordance with the Fund’s
| 17 |
| The Hartford MidCap Fund |
| Notes to Financial Statements – (continued) |
| October 31, 2014 |
| (000’s Omitted) |
investment objective and policies. The Fund pays a fee to the investment manager, a portion of which may be used to compensate Wellington Management.
The schedule below reflects the rates of compensation paid to the investment manager for investment management services rendered as of October 31, 2014; the rates are accrued daily and paid monthly:
| Average Daily Net Assets | Annual Fee |
| On first $500 million | 0.8500% |
| On next $500 million | 0.7500% |
| On next $4 billion | 0.7000% |
| On next $5 billion | 0.6975% |
| Over $10 billion | 0.6950% |
Accounting Services Agreement – Pursuant to the Fund Accounting Agreement between HFMC and the Company, on behalf of the Fund, HFMC provides accounting services to the Fund and receives monthly compensation based on the Fund’s average daily net assets at the rates set forth below. The Fund’s accounting services fees are accrued daily and paid monthly.
| Average Daily Net Assets | Annual Fee |
| On first $5 billion | 0.012% |
| Over $5 billion | 0.010% |
Operating Expenses – Allocable expenses incurred by the Company are allocated to each Fund and allocated to classes within the Fund in proportion to the average daily net assets of the Fund and each class, except where allocation of certain expenses is more fairly made directly to the Fund or to specific classes within a Fund. As of October 31, 2014, HFMC contractually limited the total operating expenses of this Fund, exclusive of taxes, interest expense, brokerage commissions, acquired fund fees and expenses and extraordinary expenses, through February 28, 2015 as follows:
| Class A | Class B | Class C | Class I | Class R3 | Class R4 | Class R5 | Class Y |
| 1.37% | NA | NA | 1.12% | 1.50% | 1.20% | 0.90% | NA |
Fees Paid Indirectly – The Fund has entered into agreements with State Street Global Markets, LLC and Russell Implementation Services, Inc. to partially recapture non-discounted trade commissions. Such rebates are used to pay a portion of the Fund’s expenses. In addition, the Fund’s custodian bank has agreed to reduce its fees when the Fund maintains cash on deposit in a non-interest-bearing custody account. For the year ended October 31, 2014, these amounts, if any, are included in the Statement of Operations.
The ratio of expenses to average net assets in the accompanying financial highlights excludes the reduction in expenses related to fees paid indirectly. The annualized expense ratio after waivers for the period listed below reflecting the reduction for fees paid indirectly is as follows:
| Year Ended October 31, 2014 | ||||
| Class A | 1.15 | % | ||
| Class B | 2.05 | |||
| Class C | 1.87 | |||
| Class I | 0.90 | |||
| Class R3 | 1.47 | |||
| Class R4 | 1.16 | |||
| Class R5 | 0.86 | |||
| Class Y | 0.76 | |||
| 18 |
| The Hartford MidCap Fund |
| Notes to Financial Statements – (continued) |
| October 31, 2014 |
| (000’s Omitted) |
Distribution and Service Plan for Class A, B, C, R3 and R4 Shares – Hartford Funds Distributors, LLC (“HFD”), an indirect wholly owned subsidiary of The Hartford, is the principal underwriter and distributor of the Fund. HFD is engaged in distribution activities, which include marketing and distribution of shares through broker/dealers, financing distribution costs and maintaining financial books and records. For the year ended October 31, 2014, HFD received front-end load sales charges of $3,571 and contingent deferred sales charges of $38 from the Fund.
The Fund has adopted a Distribution and Service Plan in accordance with Rule 12b-1 of the 1940 Act to compensate the distributor (HFD) for activities intended to result in the sale and distribution of Class A, B, C, R3 and R4 shares and for providing services for shareholders. The Rule 12b-1 plan applicable to Class A shares of the Fund provides for payment of a Rule 12b-1 fee of 0.25% of average daily net assets. Some or all of the fee may be used for shareholder servicing expenses with the remainder used for distribution expenses. Under the Class B Plan, the Fund pays the distributor 1.00% of the average daily net assets of Class B shares that are outstanding for 8 years or less, 0.25% of which is a fee for services provided to existing shareholders with the remainder used for distribution expenses. Some or the entire Rule 12b-1 fee for Class B shares may be remitted to broker/dealers for distribution and/or shareholder account services. After eight years, Class B shares convert to Class A shares. Upon conversion to Class A shares, the Class A plan described above will apply to those shares. Under the Class C Plan, the Fund pays the distributor 1.00% of the average daily net assets of Class C shares outstanding, 0.25% of which is intended as a fee for services provided to existing shareholders with the remainder used for distribution expenses. For Class C shares, some or the entire fee may be remitted to broker/dealers for distribution and/or shareholder account services. Class R3 shares have a distribution fee of 0.50% of average daily net assets and Class R4 shares have a distribution fee of 0.25% of average daily net assets. For Class R3 and R4 shares, some or the entire fee may be remitted to broker/dealers for distribution and/or shareholder account services. The Fund’s 12b-1 fees are accrued daily and paid monthly or at such other intervals as the Board of Directors may determine.
Other Related Party Transactions – Certain officers of the Fund are directors and/or officers of HFMC and/or The Hartford or its subsidiaries. For the year ended October 31, 2014, a portion of the Fund’s Chief Compliance Officer’s compensation was paid by all of the investment companies in the Hartford fund complex. The portion allocated to the Fund, as represented in other expenses on the Statement of Operations, was in the amount of $7. Hartford Administrative Services Company (“HASCO”), an indirect wholly-owned subsidiary of The Hartford, provides transfer agent services to the Fund. HASCO has contractually agreed to reimburse any portion of the transfer agency fees over 0.30% of average daily net assets per fiscal year for each class. Any transfer agency fee reimbursement is determined before considering the contractual operating expense limitation. For providing such services, HASCO is compensated on a per account basis that varies by account type, except with respect to Class Y, for which it is compensated based on average daily net assets. The amount paid to HASCO and any related contractual reimbursement amounts, if applicable, can be found in the Statement of Operations. These fees are accrued daily and paid monthly.
Administrative services fees are paid to HASCO for third-party recordkeeping services that are payable as a percentage of net assets in the amount of up to 0.20%, 0.15% and 0.10% for Classes R3, R4 and R5 shares, respectively. The total administrative services fees are shown on the Statement of Operations. These fees are accrued daily and paid monthly.
Affiliate Holdings:
As of October 31, 2014, the Fund’s shares were owned in aggregate by affiliated fund of funds. Therefore, the Fund may experience relatively large purchases or redemptions of its shares from these affiliated fund of funds. Affiliated fund of funds owned shares in the Fund as follows:
| Percentage of Fund | ||||
| Class Y | 1 | % | ||
| 19 |
| The Hartford MidCap Fund |
| Notes to Financial Statements – (continued) |
| October 31, 2014 |
| (000’s Omitted) |
Investment Transactions:
For the year ended October 31, 2014, the cost of purchases and proceeds from sales of investment securities (excluding short-term investments) were as follows:
| Excluding U.S. Government Obligations | U.S. Government Obligations | Total | ||||||||||
| Cost of Purchases | $ | 1,420,328 | $ | — | $ | 1,420,328 | ||||||
| Sales Proceeds | 1,372,547 | — | 1,372,547 | |||||||||
Capital Share Transactions:
The following information is for the year ended October 31, 2014, and the year ended October 31, 2013:
| For the Year Ended October 31, 2014 | For the Year Ended October 31, 2013 | |||||||||||||||||||||||||||||||
| Shares Sold | Shares
Issued for Reinvested Dividends | Shares Redeemed | Net
Increase (Decrease) of Shares | Shares Sold | Shares
Issued for Reinvested Dividends | Shares Redeemed | Net
Increase (Decrease) of Shares | |||||||||||||||||||||||||
| Class A | ||||||||||||||||||||||||||||||||
| Shares | 7,751 | 5,886 | (16,536 | ) | (2,899 | ) | 7,012 | 4,997 | (15,207 | ) | (3,198 | ) | ||||||||||||||||||||
| Amount | $ | 203,757 | $ | 141,547 | $ | (435,628 | ) | $ | (90,324 | ) | $ | 157,694 | $ | 95,264 | $ | (333,676 | ) | $ | (80,718 | ) | ||||||||||||
| Class B | ||||||||||||||||||||||||||||||||
| Shares | 49 | 159 | (440 | ) | (232 | ) | 56 | 145 | (421 | ) | (220 | ) | ||||||||||||||||||||
| Amount | $ | 1,025 | $ | 3,057 | $ | (9,177 | ) | $ | (5,095 | ) | $ | 1,008 | $ | 2,262 | $ | (7,670 | ) | $ | (4,400 | ) | ||||||||||||
| Class C | ||||||||||||||||||||||||||||||||
| Shares | 3,285 | 2,159 | (3,187 | ) | 2,257 | 2,564 | 1,671 | (3,953 | ) | 282 | ||||||||||||||||||||||
| Amount | $ | 70,122 | $ | 42,325 | $ | (67,841 | ) | $ | 44,606 | $ | 48,353 | $ | 26,598 | $ | (72,363 | ) | $ | 2,588 | ||||||||||||||
| Class I | ||||||||||||||||||||||||||||||||
| Shares | 11,260 | 821 | (2,967 | ) | 9,114 | 2,631 | 643 | (2,921 | ) | 353 | ||||||||||||||||||||||
| Amount | $ | 303,600 | $ | 19,983 | $ | (78,600 | ) | $ | 244,983 | $ | 60,544 | $ | 12,414 | $ | (65,139 | ) | $ | 7,819 | ||||||||||||||
| Class R3 | ||||||||||||||||||||||||||||||||
| Shares | 511 | 130 | (468 | ) | 173 | 522 | 102 | (616 | ) | 8 | ||||||||||||||||||||||
| Amount | $ | 14,735 | $ | 3,410 | $ | (13,426 | ) | $ | 4,719 | $ | 12,692 | $ | 2,140 | $ | (14,750 | ) | $ | 82 | ||||||||||||||
| Class R4 | ||||||||||||||||||||||||||||||||
| Shares | 1,098 | 196 | (942 | ) | 352 | 1,033 | 151 | (1,025 | ) | 159 | ||||||||||||||||||||||
| Amount | $ | 32,081 | $ | 5,271 | $ | (27,488 | ) | $ | 9,864 | $ | 26,004 | $ | 3,184 | $ | (25,241 | ) | $ | 3,947 | ||||||||||||||
| Class R5 | ||||||||||||||||||||||||||||||||
| Shares | 838 | 236 | (688 | ) | 386 | 885 | 177 | (795 | ) | 267 | ||||||||||||||||||||||
| Amount | $ | 24,802 | $ | 6,408 | $ | (20,093 | ) | $ | 11,117 | $ | 21,928 | $ | 3,778 | $ | (20,287 | ) | $ | 5,419 | ||||||||||||||
| Class Y | ||||||||||||||||||||||||||||||||
| Shares | 8,285 | 2,068 | (5,979 | ) | 4,374 | 7,932 | 1,708 | (7,546 | ) | 2,094 | ||||||||||||||||||||||
| Amount | $ | 247,564 | $ | 56,270 | $ | (175,704 | ) | $ | 128,130 | $ | 198,979 | $ | 36,553 | $ | (190,351 | ) | $ | 45,181 | ||||||||||||||
| Total | ||||||||||||||||||||||||||||||||
| Shares | 33,077 | 11,655 | (31,207 | ) | 13,525 | 22,635 | 9,594 | (32,484 | ) | (255 | ) | |||||||||||||||||||||
| Amount | $ | 897,686 | $ | 278,271 | $ | (827,957 | ) | $ | 348,000 | $ | 527,202 | $ | 182,193 | $ | (729,477 | ) | $ | (20,082 | ) | |||||||||||||
The following reflects the conversion of Class B shares into Class A shares (reflected as Class A shares sold) for the year ended October 31, 2014, and the year ended October 31, 2013:
| Shares | Dollars | |||||||
| For the Year Ended October 31, 2014 | 82 | $ | 2,154 | |||||
| For the Year Ended October 31, 2013 | 79 | $ | 1,773 | |||||
Line of Credit:
The Fund is one of several Hartford Funds that participate in a $500 million committed revolving line of credit facility. The facility is to be used for temporary or emergency purposes. Under the arrangement, the funds are required to own securities having a market value in
| 20 |
| The Hartford MidCap Fund |
| Notes to Financial Statements – (continued) |
| October 31, 2014 |
| (000’s Omitted) |
excess of 300% of the total bank borrowings. The interest rate on borrowings varies depending on the nature of the loan. The facility also requires a fee to be paid based on the amount of the commitment. This commitment fee is allocated to all the funds participating in the line of credit based on the average net assets of the funds. During the year ended October 31, 2014, the Fund did not have any borrowings under this facility.
Pending Legal Proceedings:
On February 25, 2011, Jennifer L. Kasilag, Louis Mellinger, Judith M. Menendez, Jacqueline M. Robinson, and Linda A. Russell filed a derivative lawsuit against Hartford Investment Financial Services, LLC (“HIFSCO”) (now known as HFD) on behalf of six Hartford retail mutual funds in the United States District Court for the District of New Jersey, alleging that HIFSCO received excessive advisory and distribution fees in violation of its statutory fiduciary duty under Section 36(b) of the 1940 Act when serving as investment manager and principal underwriter, respectively, to the Hartford retail mutual funds. Although this action was purportedly filed on behalf of certain of the Hartford Funds, none of the Hartford Funds is itself a defendant to the suit. HIFSCO moved to dismiss and, in September 2011, the motion was granted in part and denied in part, with leave to amend the complaint. In November 2011, plaintiffs filed an amended complaint on behalf of certain Hartford retail mutual funds, The Hartford Global Health Fund (now known as The Hartford Healthcare Fund), The Hartford Conservative Allocation Fund, The Hartford Growth Opportunities Fund, The Hartford Inflation Plus Fund, The Hartford Advisers Fund (now known as The Hartford Balanced Fund), and The Hartford Capital Appreciation Fund. Plaintiffs seek to rescind the investment management agreements and distribution plans between HIFSCO and these funds and to recover the total fees charged thereunder or, in the alternative, to recover any improper compensation HIFSCO received, in addition to lost earnings. HIFSCO filed a partial motion to dismiss the amended complaint and, in December 2012, the court dismissed without prejudice the claims regarding distribution fees and denied the motion with respect to the advisory fees claims. HIFSCO disputes the allegations and intends to defend vigorously.
In March 2014, the plaintiffs filed a new complaint that added as new plaintiffs The Hartford Floating Rate Fund and The Hartford Small Company Fund and named as a defendant HFMC, which assumed the role as investment manager to the funds as of January 2013. HFMC and HIFSCO dispute the allegations and intend to defend vigorously.
No accrual for litigation relating to this matter has been recorded in the financial statements of the Fund because the Fund is not party to the suit.
Indemnifications:
Under the Company’s organizational documents, the Company shall indemnify its officers and directors to the full extent required or permitted under Maryland General Corporation Law and the federal securities laws. In addition, the Company, on behalf of the Fund, may enter into contracts that contain a variety of indemnifications. The Company’s maximum exposure under these arrangements is unknown. However, as of the date of these financial statements, the Company has not had prior claims or losses pursuant to these contracts and expects the risk of loss to be remote.
Subsequent Events:
At the August 5-6, 2014 meeting, the Board of Directors approved the creation of Class R6 shares for the Fund. Class R6 shares launched on November 7, 2014. In connection with the launch of the Class R6 shares, an updated prospectus, dated November 7, 2014, and Statement of Additional Information, dated March 1, 2014, as amended November 7, 2014, for the Fund were filed with the U.S. Securities and Exchange Commission.
Effective December 1, 2014, pursuant to a sub-transfer agency agreement between HASCO and Boston Financial Data Services, Inc. (“BFDS”), HASCO has delegated certain transfer agent, dividend disbursing agent and shareholder servicing agent functions to BFDS. The costs and expenses of such delegation are borne by HASCO, not by the Fund.
| 21 |
| The Hartford MidCap Fund |
| Financial Highlights |
| - Selected Per-Share Data - (A) | - Ratios and Supplemental Data - | |||||||||||||||||||||||||||||||||||||||||||||||||||
| Class | Net
Asset Value at Beginning of Period | Net Investment Income (Loss) | Net Realized and Unrealized Gain (Loss) on Invest- ments | Total from Investment Operations | Dividends from Net Investment Income | Distribu- tions from Realized Capital Gains | Total Dividends and Distributions | Net Asset Value at End of Period | Total Return(B) | Net
Assets at End of Period (000’s) | Ratio
of Expenses to Average Net Assets Before Adjust- ments(C) | Ratio
of Expenses to Average Net Assets After Adjust- ments(C) | Ratio
of Net Investment Income (Loss) to Average Net Assets | |||||||||||||||||||||||||||||||||||||||
| For the Year Ended October 31, 2014 | ||||||||||||||||||||||||||||||||||||||||||||||||||||
| A | $ | 25.67 | $ | (0.10 | ) | $ | 3.82 | $ | 3.72 | $ | – | $ | (2.01 | ) | $ | (2.01 | ) | $ | 27.38 | 15.57 | % | $ | 1,891,075 | 1.15 | % | 1.15 | % | (0.40 | )% | |||||||||||||||||||||||
| B | 20.88 | (0.27 | ) | 3.05 | 2.78 | – | (2.01 | ) | (2.01 | ) | 21.65 | 14.56 | 29,446 | 2.05 | 2.05 | (1.29 | ) | |||||||||||||||||||||||||||||||||||
| C | 21.30 | (0.24 | ) | 3.13 | 2.89 | – | (2.01 | ) | (2.01 | ) | 22.18 | 14.81 | 544,154 | 1.88 | 1.88 | (1.13 | ) | |||||||||||||||||||||||||||||||||||
| I | 25.95 | (0.04 | ) | 3.88 | 3.84 | – | (2.01 | ) | (2.01 | ) | 27.78 | 15.89 | 550,720 | 0.90 | 0.90 | (0.17 | ) | |||||||||||||||||||||||||||||||||||
| R3 | 28.03 | (0.21 | ) | 4.21 | 4.00 | – | (2.01 | ) | (2.01 | ) | 30.02 | 15.24 | 56,403 | 1.47 | 1.47 | (0.72 | ) | |||||||||||||||||||||||||||||||||||
| R4 | 28.47 | (0.12 | ) | 4.27 | 4.15 | – | (2.01 | ) | (2.01 | ) | 30.61 | 15.55 | 94,232 | 1.16 | 1.16 | (0.41 | ) | |||||||||||||||||||||||||||||||||||
| R5 | 28.69 | (0.03 | ) | 4.31 | 4.28 | – | (2.01 | ) | (2.01 | ) | 30.96 | 15.91 | 110,364 | 0.86 | 0.86 | (0.11 | ) | |||||||||||||||||||||||||||||||||||
| Y | 28.77 | (0.01 | ) | 4.35 | 4.34 | – | (2.01 | ) | (2.01 | ) | 31.10 | 16.08 | 1,078,695 | 0.76 | 0.76 | (0.02 | ) | |||||||||||||||||||||||||||||||||||
| For the Year Ended October 31, 2013 | ||||||||||||||||||||||||||||||||||||||||||||||||||||
| A | $ | 20.44 | $ | (0.03 | ) | $ | 6.56 | $ | 6.53 | $ | – | $ | (1.30 | ) | $ | (1.30 | ) | $ | 25.67 | 34.17 | % | $ | 1,847,041 | 1.20 | % | 1.20 | % | (0.14 | )% | |||||||||||||||||||||||
| B | 17.00 | (0.18 | ) | 5.36 | 5.18 | – | (1.30 | ) | (1.30 | ) | 20.88 | 33.01 | 33,232 | 2.11 | 2.07 | (1.00 | ) | |||||||||||||||||||||||||||||||||||
| C | 17.29 | (0.16 | ) | 5.47 | 5.31 | – | (1.30 | ) | (1.30 | ) | 21.30 | 33.21 | 474,663 | 1.91 | 1.91 | (0.85 | ) | |||||||||||||||||||||||||||||||||||
| I | 20.65 | 0.02 | 6.63 | 6.65 | (0.05 | ) | (1.30 | ) | (1.35 | ) | 25.95 | 34.48 | 277,953 | 0.96 | 0.96 | 0.09 | ||||||||||||||||||||||||||||||||||||
| R3 | 22.25 | (0.10 | ) | 7.18 | 7.08 | – | (1.30 | ) | (1.30 | ) | 28.03 | 33.80 | 47,837 | 1.48 | 1.48 | (0.43 | ) | |||||||||||||||||||||||||||||||||||
| R4 | 22.51 | (0.03 | ) | 7.29 | 7.26 | – | (1.30 | ) | (1.30 | ) | 28.47 | 34.24 | 77,603 | 1.17 | 1.17 | (0.13 | ) | |||||||||||||||||||||||||||||||||||
| R5 | 22.69 | 0.04 | 7.33 | 7.37 | (0.07 | ) | (1.30 | ) | (1.37 | ) | 28.69 | 34.60 | 91,163 | 0.87 | 0.87 | 0.17 | ||||||||||||||||||||||||||||||||||||
| Y | 22.75 | 0.07 | 7.34 | 7.41 | (0.09 | ) | (1.30 | ) | (1.39 | ) | 28.77 | 34.73 | 872,297 | 0.77 | 0.77 | 0.28 | ||||||||||||||||||||||||||||||||||||
| For the Year Ended October 31, 2012 | ||||||||||||||||||||||||||||||||||||||||||||||||||||
| A | $ | 20.67 | $ | 0.05 | $ | 2.22 | $ | 2.27 | $ | – | $ | (2.50 | ) | $ | (2.50 | ) | $ | 20.44 | 13.47 | % | $ | 1,536,203 | 1.23 | % | 1.23 | % | 0.25 | % | ||||||||||||||||||||||||
| B | 17.77 | (0.10 | ) | 1.83 | 1.73 | – | (2.50 | ) | (2.50 | ) | 17.00 | 12.50 | 30,803 | 2.16 | 2.08 | (0.62 | ) | |||||||||||||||||||||||||||||||||||
| C | 18.01 | (0.08 | ) | 1.86 | 1.78 | – | (2.50 | ) | (2.50 | ) | 17.29 | 12.63 | 380,413 | 1.93 | 1.93 | (0.45 | ) | |||||||||||||||||||||||||||||||||||
| I | 20.85 | 0.09 | 2.25 | 2.34 | (0.04 | ) | (2.50 | ) | (2.54 | ) | 20.65 | 13.78 | 213,875 | 0.99 | 0.99 | 0.48 | ||||||||||||||||||||||||||||||||||||
| R3 | 22.32 | – | 2.43 | 2.43 | – | (2.50 | ) | (2.50 | ) | 22.25 | 13.16 | 37,776 | 1.49 | 1.49 | (0.01 | ) | ||||||||||||||||||||||||||||||||||||
| R4 | 22.49 | 0.06 | 2.46 | 2.52 | – | (2.50 | ) | (2.50 | ) | 22.51 | 13.50 | 57,799 | 1.18 | 1.18 | 0.29 | |||||||||||||||||||||||||||||||||||||
| R5 | 22.66 | 0.13 | 2.47 | 2.60 | (0.07 | ) | (2.50 | ) | (2.57 | ) | 22.69 | 13.85 | 66,039 | 0.88 | 0.88 | 0.59 | ||||||||||||||||||||||||||||||||||||
| Y | 22.71 | 0.15 | 2.48 | 2.63 | (0.09 | ) | (2.50 | ) | (2.59 | ) | 22.75 | 13.98 | 642,084 | 0.78 | 0.78 | 0.70 | ||||||||||||||||||||||||||||||||||||
| For the Year Ended October 31, 2011 | ||||||||||||||||||||||||||||||||||||||||||||||||||||
| A | $ | 20.16 | $ | 0.02 | $ | 0.49 | $ | 0.51 | $ | – | $ | – | $ | – | $ | 20.67 | 2.53 | % | $ | 1,754,028 | 1.21 | % | 1.21 | % | 0.09 | % | ||||||||||||||||||||||||||
| B | 17.48 | (0.14 | ) | 0.43 | 0.29 | – | – | – | 17.77 | 1.66 | 44,266 | 2.06 | 2.06 | (0.72 | ) | |||||||||||||||||||||||||||||||||||||
| C | 17.68 | (0.12 | ) | 0.45 | 0.33 | – | – | – | 18.01 | 1.87 | 422,515 | 1.91 | 1.91 | (0.63 | ) | |||||||||||||||||||||||||||||||||||||
| I | 20.28 | 0.09 | 0.48 | 0.57 | – | – | – | 20.85 | 2.81 | 324,002 | 0.92 | 0.92 | 0.40 | |||||||||||||||||||||||||||||||||||||||
| R3 | 21.82 | (0.05 | ) | 0.55 | 0.50 | – | – | – | 22.32 | 2.29 | 40,311 | 1.48 | 1.48 | (0.23 | ) | |||||||||||||||||||||||||||||||||||||
| R4 | 21.92 | 0.02 | 0.55 | 0.57 | – | – | – | 22.49 | 2.60 | 65,550 | 1.18 | 1.18 | 0.07 | |||||||||||||||||||||||||||||||||||||||
| R5 | 22.02 | 0.09 | 0.55 | 0.64 | – | – | – | 22.66 | 2.91 | 73,192 | 0.87 | 0.87 | 0.38 | |||||||||||||||||||||||||||||||||||||||
| Y | 22.05 | 0.12 | 0.54 | 0.66 | – | – | – | 22.71 | 2.99 | 678,566 | 0.77 | 0.77 | 0.50 | |||||||||||||||||||||||||||||||||||||||
See Portfolio Turnover information on the next page.
| 22 |
| The Hartford MidCap Fund |
| Financial Highlights – (continued) |
| - Selected Per-Share Data - (A) | - Ratios and Supplemental Data - | |||||||||||||||||||||||||||||||||||||||||||||||||||
| Class | Net
Asset Value at Beginning of Period | Net Investment Income (Loss) | Net Realized and Unrealized Gain (Loss) on Invest- ments | Total from Investment Operations | Dividends from Net Investment Income | Distribu- tions from Realized Capital Gains | Total Dividends and Distributions | Net Asset Value at End of Period | Total Return(B) | Net
Assets at End of Period (000’s) | Ratio
of Expenses to Average Net Assets Before Adjust- ments(C) | Ratio
of Expenses to Average Net Assets After Adjust- ments(C) | Ratio
of Net Investment Income (Loss) to Average Net Assets | |||||||||||||||||||||||||||||||||||||||
| For the Year Ended October 31, 2010 | ||||||||||||||||||||||||||||||||||||||||||||||||||||
| A | $ | 16.20 | $ | (0.04 | ) | $ | 4.00 | $ | 3.96 | $ | – | $ | – | $ | – | $ | 20.16 | 24.44 | % | $ | 2,275,785 | 1.25 | % | 1.25 | % | (0.24 | )% | |||||||||||||||||||||||||
| B | 14.16 | (0.17 | ) | 3.49 | 3.32 | – | – | – | 17.48 | 23.45 | 108,330 | 2.05 | 2.05 | (1.03 | ) | |||||||||||||||||||||||||||||||||||||
| C | 14.30 | (0.15 | ) | 3.53 | 3.38 | – | – | – | 17.68 | 23.64 | 448,592 | 1.93 | 1.93 | (0.92 | ) | |||||||||||||||||||||||||||||||||||||
| I | 16.25 | – | 4.03 | 4.03 | – | – | – | 20.28 | 24.80 | 541,255 | 0.96 | 0.96 | 0.01 | |||||||||||||||||||||||||||||||||||||||
| R3 | 17.58 | (0.11 | ) | 4.35 | 4.24 | – | – | – | 21.82 | 24.12 | 22,038 | 1.49 | 1.49 | (0.57 | ) | |||||||||||||||||||||||||||||||||||||
| R4 | 17.60 | (0.04 | ) | 4.36 | 4.32 | – | – | – | 21.92 | 24.55 | 41,422 | 1.18 | 1.18 | (0.23 | ) | |||||||||||||||||||||||||||||||||||||
| R5 | 17.62 | 0.01 | 4.39 | 4.40 | – | – | – | 22.02 | 24.97 | 47,915 | 0.88 | 0.88 | 0.05 | |||||||||||||||||||||||||||||||||||||||
| Y | 17.63 | 0.05 | 4.37 | 4.42 | – | – | – | 22.05 | 25.07 | 556,046 | 0.78 | 0.78 | 0.23 | |||||||||||||||||||||||||||||||||||||||
| (A) | Information presented relates to a share outstanding throughout the indicated period. Net investment income (loss) per share amounts are calculated based on average shares outstanding unless otherwise noted. |
| (B) | Assumes initial investment at net asset value at the beginning of each period, reinvestment of all distributions, the complete redemption of the investment at net asset value at the end of each period and no sales charge. Total return would be reduced if sales charges were taken into account. |
| (C) | Adjustments include waivers and reimbursements, if applicable. Ratios do not include fees paid indirectly (see Expenses in the accompanying Notes to Financial Statements). |
| Portfolio Turnover Rate for All Share Classes | ||||
| For the Year Ended October 31, 2014 | 34 | % | ||
| For the Year Ended October 31, 2013 | 38 | |||
| For the Year Ended October 31, 2012 | 45 | |||
| For the Year Ended October 31, 2011 | 70 | |||
| For the Year Ended October 31, 2010 | 56 | |||
| 23 |
| Report of Independent Registered Public Accounting Firm |
| The Board of Directors and Shareholders of |
| The Hartford Mutual Funds, Inc. |
We have audited the accompanying statement of assets and liabilities, including the schedule of investments, of The Hartford MidCap Fund (one of the portfolios constituting The Hartford Mutual Funds, Inc. (the Funds)) as of October 31, 2014, and the related statement of operations for the year then ended, the statements of changes in net assets for each of the two years in the period then ended, and the financial highlights for each of the five years in the period then ended. These financial statements and financial highlights are the responsibility of the Funds’ management. Our responsibility is to express an opinion on these financial statements and financial highlights based on our audits.
We conducted our audits in accordance with the standards of the Public Company Accounting Oversight Board (United States). Those standards require that we plan and perform the audit to obtain reasonable assurance about whether the financial statements and financial highlights are free of material misstatement. We were not engaged to perform an audit of the Funds’ internal control over financial reporting. Our audits included consideration of internal control over financial reporting as a basis for designing audit procedures that are appropriate in the circumstances, but not for the purpose of expressing an opinion on the effectiveness of the Funds’ internal control over financial reporting. Accordingly, we express no such opinion. An audit also includes examining, on a test basis, evidence supporting the amounts and disclosures in the financial statements and financial highlights, assessing the accounting principles used and significant estimates made by management, and evaluating the overall financial statement presentation. Our procedures included confirmation of securities owned as of October 31, 2014, by correspondence with the custodian and brokers or by other appropriate auditing procedures where replies from brokers were not received. We believe that our audits provide a reasonable basis for our opinion.
In our opinion, the financial statements and financial highlights referred to above present fairly, in all material respects, the financial position of The Hartford MidCap Fund of The Hartford Mutual Funds, Inc. at October 31, 2014, the results of its operations for the year then ended, the changes in its net assets for each of the two years in the period then ended, and the financial highlights for each of the five years in the period then ended, in conformity with U.S. generally accepted accounting principles.
|
Minneapolis, Minnesota
December 18, 2014
| 24 |
| The Hartford MidCap Fund |
| Directors and Officers (Unaudited) |
The Board of Directors of the Company (the “Directors”) appoints officers who are responsible for the day-to-day operations of the Fund and who execute policies formulated by the Directors. Each Director serves until his or her death, resignation, or retirement or until the next annual meeting of shareholders is held or until his or her successor is elected and qualifies.
Directors and officers who are employed by or who have a financial interest in The Hartford Financial Services Group, Inc. (“The Hartford”) are considered “interested” persons of the Fund pursuant to the 1940 Act. Each officer and two of the Company’s Directors, as noted in the chart below, are “interested” persons of the Fund. Each Director serves as a director for The Hartford Mutual Funds, Inc., The Hartford Mutual Funds II, Inc., Hartford Series Fund, Inc., and Hartford HLS Series Fund II, Inc., and as a trustee for The Hartford Alternative Strategies Fund, which, as of October 31, 2014, collectively consist of 66 funds. Correspondence may be sent to Directors and officers c/o Hartford Funds, 5 Radnor Corporate Center, Suite 300, 100 Matsonford Road, Radnor, Pennsylvania 19087, except that correspondence to Mr. Annoni, Mr. Dressen and Ms. Quade may be sent to 500 Bielenberg Drive, Suite 500, Woodbury, Minnesota 55125.
The table below sets forth, for each Director and officer, his or her name, year of birth, current position with the Company and date first elected or appointed to The Hartford Mutual Funds, Inc. (“MF”) and The Hartford Mutual Funds II, Inc. (“MF2”), principal occupation, and, for Directors, other directorships held. The Fund’s Statement of Additional Information contains further information on the Directors and is available free of charge by calling 1-888-843-7824 or writing to: Hartford Funds, P.O. Box 55022, Boston, MA 02205-5022.
Information on the aggregate remuneration paid to the directors of the Company can be found in the Statement of Operations herein. The Fund pays to The Hartford a portion of the Chief Compliance Officer’s compensation, but does not pay salaries or compensation to any of its other officers or Directors who are employed by The Hartford.
Non-Interested Directors
Hilary E. Ackermann (1956) Director since September 23, 2014
Ms. Ackermann served as Chief Risk Officer at Goldman Sachs Bank USA from October 2008 to November 2011 and serves as a Director of Dynegy, Inc., an independent power company, from October 2012 to present.
Lynn S. Birdsong (1946) Director since 2003, Chairman of the Investment Committee since 2014
Mr. Birdsong is a private investor. Mr. Birdsong currently serves as a Director of the Sovereign High Yield Investment Company (April 2010 to current). Mr. Birdsong currently serves as an Independent Director of Nomura Partners Funds, Inc. (formerly, The Japan Fund) (April 2003 to current). From 2003 to March 2005, Mr. Birdsong was an Independent Director of the Atlantic Whitehall Funds. From 1979 to 2002, Mr. Birdsong was a Managing Director of Zurich Scudder Investments, an investment management firm. During his employment with Scudder, Mr. Birdsong was an Interested Director of The Japan Fund. From January 1981 through December 2013, Mr. Birdsong was a partner in Birdsong Company, an advertising specialty firm.
Robert M. Gavin, Jr. (1940) Director since 2002 (MF) and 1986 (MF2), Chairman of the Board for each since 2004
Dr. Gavin is an educational consultant. Prior to September 1, 2001, he was President of Cranbrook Education Community and prior to July 1996, he was President of Macalester College, St. Paul, Minnesota.
Duane E. Hill (1945) Director since 2001 (MF) and 2002 (MF2), Chairman of the Nominating Committee since 2003
Mr. Hill is a Partner of TSG Ventures L.P., a private equity investment company. Mr. Hill is a former partner of TSG Capital Group, a private equity investment firm that served as sponsor and lead investor in leveraged buyouts of middle market companies.
Sandra S. Jaffee (1941) Director since 2005
Ms. Jaffee is the founder and Chief Executive Officer of a private company, Homeworks Concierge, LLC, which provides residential property management services in Westchester County, New York (January 2012 to present). Ms. Jaffee served as Chairman (2008 to 2009) and Chief Executive Officer of Fortent (formerly Searchspace Group), a leading provider of compliance/regulatory technology to financial institutions from August 2005 to August 2009. From August 2004 to August 2005, Ms. Jaffee served as an Entrepreneur in Residence with Warburg Pincus, a private equity firm. Prior to joining Warburg Pincus, Ms. Jaffee served as Executive Vice President at Citigroup, from September 1995 to July 2004, where she was President and Chief Executive Officer of Citibank’s Global Securities Services (1995 to 2003). Ms. Jaffee currently serves as a member of the Board of Directors of Broadridge Financial Solutions as well as a Trustee of Muhlenberg College.
| 25 |
| The Hartford MidCap Fund |
| Directors and Officers (Unaudited) – (continued) |
William P. Johnston (1944) Director since 2005, Chairman of the Compliance Committee since 2005
In June 2006, Mr. Johnston was appointed as Senior Advisor to The Carlyle Group, a global private equity and other alternative asset investment firm and currently serves as an Operating Executive. In July 2006, Mr. Johnston was elected to the Board of Directors of MultiPlan, Inc. and served as a Director (July 2006 to August 2010). In August 2007, Mr. Johnston was elected to the Board of Directors of LifeCare Holdings, Inc. and served as a Director (August 2007 to June 2013). In February 2008, Mr. Johnston was elected to the Board of Directors of HCR-ManorCare, Inc. In May 2006, Mr. Johnston was elected to the Supervisory Board of Fresenius Medical Care AG & Co. KGaA, after its acquisition of Renal Care Group, Inc. in March 2006. Mr. Johnston joined Renal Care Group in November 2002 as a member of the Board of Directors and served as Chairman of the Board from March 2003 through March 2006. From 2002 through 2013, Mr. Johnston served as a Board member of the Georgia O’Keefe Museum. From September 1987 to December 2002, Mr. Johnston was with Equitable Securities Corporation (and its successors, SunTrust Equitable Securities and SunTrust Robinson Humphrey) serving in various investment banking and managerial positions, including Managing Director and Head of Investment Banking, Chief Executive Officer and Vice Chairman.
Phillip O. Peterson (1944) Director since 2002 (MF) and 2000 (MF2), Chairman of the Audit Committee since 2002
Mr. Peterson is a mutual fund industry consultant. He was a partner of KPMG LLP (an accounting firm) until July 1999. Mr. Peterson joined William Blair Funds in February 2007 as a member of the Board of Trustees. From February 2012 to February 2014, Mr. Peterson served as a Trustee of Symetra Variable Mutual Funds. From January 2004 to April 2005, Mr. Peterson served as Independent President of the Strong Mutual Funds.
Lemma W. Senbet (1946) Director since 2005
Dr. Senbet is the William E. Mayer Chair Professor of Finance and Founding Director, Center for Financial Policy, at the University of Maryland, Robert H. Smith School of Business. He was chair of the Finance Department of the University of Maryland, Robert H. Smith School of Business from 1998 to 2006. Since June 2013, he has been on leave from the University to serve as Executive Director of African Economic Research Consortium which focuses on economic policy research and training. Previously, he was a chaired professor of finance at the University of Wisconsin-Madison. Also, he was a Director of the Fortis Funds from March 2000 to July 2002. Dr. Senbet served as Director of the American Finance Association and President of the Western Finance Association. In 2006, Dr. Senbet was inducted Fellow of Financial Management Association International for his career-long distinguished scholarship and professional service.
Interested Directors and Officers
James E. Davey (1964) Director since 2012, President and Chief Executive Officer since 2010
Mr. Davey serves as Executive Vice President of Hartford Life Insurance Company (“HLIC”) and The Hartford. Additionally, Mr. Davey serves as Chairman of the Board, Manager and Senior Managing Director of Hartford Funds Distributors, LLC (“HFD”). He also currently serves as Director, Chairman of the Board, President and Senior Managing Director of Hartford Administrative Services Company (“HASCO”). Mr. Davey also serves as Manager, Chairman of the Board and Senior Managing Director for Hartford Funds Management Company, LLC (“HFMC”) and Director, Chairman of the Board and Senior Managing Director for Hartford Funds Management Group, Inc. (“HFMG”). Mr. Davey has served in various positions within The Hartford and its subsidiaries in connection with the operation of the Hartford Funds. Mr. Davey joined The Hartford in 2002.
Lowndes A. Smith* (1939) Director since 1996 (MF) and 2002 (MF2)
Mr. Smith served as Vice Chairman of The Hartford from February 1997 to January 2002, as President and Chief Executive Officer of Hartford Life, Inc. from February 1997 to January 2002, and as President and Chief Operating Officer of The Hartford Life Insurance Companies from January 1989 to January 2002. Mr. Smith serves as a Director of White Mountains Insurance Group Ltd. (October 2003 to current); One Beacon Insurance (October 2006 to current); Symetra Financial (August 2007 to current) and is a Managing Director of Whittington Gray Associates (January 2007 to current).
* Mr. Smith resigned as a Director of MF, MF2, Hartford Series Fund, Inc. and Hartford HLS Series Fund II, Inc. and as a Trustee of The Hartford Alternative Strategies Fund effective September 17, 2014.
Other Officers
Mark A. Annoni (1964) Vice President, Controller and Treasurer since 2012
Mr. Annoni currently serves as the Assistant Vice President of HLIC (February 2004 to present) and Senior Vice President of HFMG (December 2013 to present). Mr. Annoni has served in various positions within The Hartford and its subsidiaries in connection with the operation of the Hartford Funds. Mr. Annoni joined The Hartford in 2001.
| 26 |
| The Hartford MidCap Fund |
| Directors and Officers (Unaudited) – (continued) |
Michael R. Dressen (1963) AML Compliance Officer since 2011
Mr. Dressen currently serves as Assistant Vice President of HLIC. He also serves as Chief Compliance Officer and AML Compliance Officer of HASCO and as AML Officer of HFD. Mr. Dressen has served in various positions within The Hartford and its subsidiaries in connection with the operation of the Hartford Funds.
Edward P. Macdonald (1967) Vice President, Secretary and Chief Legal Officer since 2005
Mr. Macdonald currently serves as Assistant Secretary, Executive Vice President and Deputy General Counsel of HFD, HASCO, HFMC and HFMG. He also serves as Vice President of HLIC. Mr. Macdonald has served in various positions within The Hartford and its subsidiaries in connection with the operation of the Hartford Funds. Mr. Macdonald joined The Hartford in 2005.
Joseph G. Melcher (1973) Vice President and Chief Compliance Officer since 2013
Mr. Melcher currently serves as Executive Vice President of HFD, HFMG and HASCO. Mr. Melcher also currently serves as Executive Vice President and Chief Compliance Officer of HFMC. Mr. Melcher has served in various positions within The Hartford and its subsidiaries in connection with the operation of the Hartford Funds since joining The Hartford in 2012. Prior to joining The Hartford, Mr. Melcher worked at Touchstone Investments, a member of the Western & Southern Financial Group, where he held the position of Vice President and Chief Compliance Officer from 2010 through 2012 and Assistant Vice President, Compliance from 2005 to 2010.
Vernon J. Meyer (1964) Vice President since 2006
Mr. Meyer currently serves as Senior Vice President of HLIC. He also currently serves as Managing Director and Chief Investment Officer of HFMC and Managing Director of HFMG. Mr. Meyer has served in various positions within The Hartford and its subsidiaries in connection with the operation of the Hartford Funds. Mr. Meyer joined The Hartford in 2004.
Laura S. Quade (1969) Vice President since 2012
Ms. Quade currently serves as Vice President of HASCO, HFD and HFMG. She is the Head of Operations of HASCO and formerly served as Director, Enterprise Operations of HLIC. Ms. Quade has served in various positions within The Hartford and its subsidiaries in connection with the operation of the Hartford Funds. Ms. Quade joined The Hartford in 2001.
Martin A. Swanson** (1962) Vice President since 2010
Mr. Swanson currently serves as Vice President of HLIC. Mr. Swanson also serves as Managing Director, Chief Marketing Officer and Principal of HFD and Managing Director of HFMG. Mr. Swanson has served in various positions within The Hartford and its subsidiaries in connection with the operation of the Hartford Funds.
** Mr. Swanson resigned as an officer effective November 6, 2014.
HOW TO OBTAIN A COPY OF THE FUND’S PROXY VOTING POLICIES AND VOTING RECORDS (UNAUDITED)
A description of the policies and procedures that the Fund uses to determine how to vote proxies relating to portfolio securities and information about how the Fund voted proxies relating to portfolio securities during the most recent twelve-month period ended June 30 are available (1) without charge, upon request, by calling 888-843-7824 and (2) on the SEC’s website at http://www.sec.gov.
QUARTERLY PORTFOLIO HOLDINGS INFORMATION (UNAUDITED)
The Fund files a complete schedule of portfolio holdings with the SEC for the first and third quarters of each fiscal year on Form N-Q. The Fund’s Forms N-Q are available (1) without charge, upon request, by calling 888-843-7824 and (2) on the SEC’s website at http://www.sec.gov. The Form N-Q may be reviewed and copied at the SEC’s Public Reference Room in Washington, DC. Information on the operation of the Public Reference Room may be obtained by calling 1-800-SEC-0330.
| 27 |
| The Hartford MidCap Fund |
| Federal Tax Information (Unaudited) |
For the fiscal year ended October 31, 2014, there is no further federal tax information required for this Fund.
| 28 |
| The Hartford MidCap Fund |
| Expense Example (Unaudited) |
Your Fund’s Expenses
As a shareholder of the Fund, you incur two types of costs: (1) transaction costs, including sales charges (loads) on purchase payments, if any, and contingent deferred sales charges (CDSC), if any, and (2) ongoing costs, including investment management fees, distribution and/or service (12b-1) fees, if any, and other fund expenses. This example is intended to help you understand your ongoing costs (in dollars) of investing in the Fund and to compare these costs with the ongoing costs of investing in other mutual funds. The example is based on an investment of $1,000 invested at the beginning of the period and held for the entire period of April 30, 2014 through October 31, 2014.
Actual Expenses
The first set of columns of the table below provides information about actual account values and actual expenses. You may use the information in this column, together with the amount you invested, to estimate the expenses that you paid over the period. Simply divide your account value by $1,000 (for example, an $8,600 account value divided by $1,000 = 8.6), then multiply the result by the number in the line under the heading entitled “Expenses Paid During Period” to estimate the expenses you paid on your account during this period.
Hypothetical Example for Comparison Purposes
The second set of columns of the table below provides information about hypothetical account values and hypothetical expenses based on the Fund’s actual expense ratio and an assumed rate of return of 5% per year before expenses, which is not the Fund’s actual return. The hypothetical account values and expenses may not be used to estimate the actual ending account balance or expenses you paid for the period. You may use this information to compare the ongoing costs of investing in the Fund and other funds. To do so, compare this 5% hypothetical example with the 5% hypothetical examples that appear in the shareholder reports of the other funds.
Please note that the expenses shown in the table are meant to highlight your ongoing costs only and do not reflect any transactional costs, such as sales charges (loads) and CDSC. Therefore, the second set of columns of the table is useful in comparing ongoing costs only, and will not help you determine the relative total costs of owning different funds. In addition, if these transactional costs were included, your costs would be higher. Expenses are equal to the Fund’s annualized expense ratios multiplied by average account value over the period, multiplied by 184/365 (to reflect the one-half year period).
| Actual return | Hypothetical (5% return before expenses) | |||||||||||||||||||||||||||||||||||
| Beginning Account Value April 30, 2014 | Ending
Account Value October 31, 2014 | Expenses
paid during the period April 30, 2014 through October 31, 2014 | Beginning Account Value April 30, 2014 | Ending Account Value October 31, 2014 | Expenses
paid during the period April 30, 2014 through October 31, 2014 | Annualized expense ratio | Days in the current 1/2 year | Days in the full year | ||||||||||||||||||||||||||||
| Class A | $ | 1,000.00 | $ | 1,059.20 | $ | 5.99 | $ | 1,000.00 | $ | 1,019.39 | $ | 5.87 | 1.15 | % | 184 | 365 | ||||||||||||||||||||
| Class B | $ | 1,000.00 | $ | 1,055.10 | $ | 10.59 | $ | 1,000.00 | $ | 1,014.90 | $ | 10.38 | 2.04 | 184 | 365 | |||||||||||||||||||||
| Class C | $ | 1,000.00 | $ | 1,055.70 | $ | 9.72 | $ | 1,000.00 | $ | 1,015.75 | $ | 9.53 | 1.88 | 184 | 365 | |||||||||||||||||||||
| Class I | $ | 1,000.00 | $ | 1,061.10 | $ | 4.63 | $ | 1,000.00 | $ | 1,020.71 | $ | 4.54 | 0.89 | 184 | 365 | |||||||||||||||||||||
| Class R3 | $ | 1,000.00 | $ | 1,057.80 | $ | 7.63 | $ | 1,000.00 | $ | 1,017.79 | $ | 7.48 | 1.47 | 184 | 365 | |||||||||||||||||||||
| Class R4 | $ | 1,000.00 | $ | 1,059.20 | $ | 6.04 | $ | 1,000.00 | $ | 1,019.33 | $ | 5.93 | 1.16 | 184 | 365 | |||||||||||||||||||||
| Class R5 | $ | 1,000.00 | $ | 1,061.00 | $ | 4.48 | $ | 1,000.00 | $ | 1,020.86 | $ | 4.39 | 0.86 | 184 | 365 | |||||||||||||||||||||
| Class Y | $ | 1,000.00 | $ | 1,061.80 | $ | 3.96 | $ | 1,000.00 | $ | 1,021.36 | $ | 3.89 | 0.76 | 184 | 365 | |||||||||||||||||||||
| 29 |
| The Hartford MidCap Fund |
| Approval of Investment Management and Investment Sub-Advisory Agreements (Unaudited) |
Section 15(c) of the Investment Company Act of 1940, as amended (the “1940 Act”), requires that each mutual fund’s board of directors, including a majority of those directors who are not “interested persons” of the mutual fund, as defined in the 1940 Act (the “Independent Directors”), annually review and consider the continuation of the mutual fund’s investment advisory and sub-advisory agreements. At its meeting held on August 5-6, 2014, the Board of Directors (the “Board”) of The Hartford Mutual Funds, Inc., including each of the Independent Directors, unanimously voted to approve the continuation of the investment management agreement for The Hartford MidCap Fund (the “Fund”) with Hartford Funds Management Company, LLC (“HFMC”) and the continuation of the investment sub-advisory agreement between HFMC and the Fund’s sub-adviser, Wellington Management Company, LLP (the “Sub-adviser,” and together with HFMC, the “Advisers”) (collectively, the “Agreements”).
In the months preceding the August 5-6, 2014 meeting, the Board requested, received and reviewed written responses from the Advisers to questions posed to them on behalf of the Independent Directors and supporting materials relating to those questions and responses. The Board considered information furnished to the Board at its meetings throughout the year, as well as information specifically prepared in connection with the annual approval of the Agreements at the Board’s meetings held on June 17-18, 2014 and August 5-6, 2014. Information provided to the Board at its meetings throughout the year included, among other things, reports on Fund performance, legal and compliance matters, sales and marketing activity, shareholder services, and the other services provided to the Fund by the Advisers and their affiliates. The Board also received in-person presentations by Fund officers and representatives of HFMC at the Board’s meetings on June 17-18, 2014 and August 5-6, 2014 concerning the Agreements.
The Independent Directors, advised by independent legal counsel, engaged service providers to assist them with evaluating the Agreements with respect to the Fund. Lipper Inc. (“Lipper”), an independent provider of investment company data, was retained to provide the Board with reports on how the Fund’s contractual management fees, actual management fees, other non-management fees, overall expense ratios and investment performance compared to those of mutual funds with similar investment objectives. The Independent Directors also engaged an independent financial services consultant (the “Consultant”) to assist them in evaluating the Fund’s management fees, sub-advisory fees, other non-management fees, overall expense ratios and investment performance. In addition, the Consultant reviewed the profitability calculations utilized by HFMC in connection with the continuation of the investment management agreement.
In determining whether to continue the Agreements for the Fund, the members of the Board reviewed and evaluated information and factors they believed to be relevant and appropriate in light of the information that the Board deemed necessary and appropriate through the exercise of its reasonable business judgment. While individual members of the Board may have weighed certain factors differently, the Board’s determination to continue the Agreements was based on a comprehensive consideration of all information provided to the Board throughout the year and specifically with respect to the continuation of the Agreements. A more detailed discussion of the factors the Board considered with respect to its approval of the Agreements is provided below.
Nature, Extent and Quality of Services Provided by the Advisers
The Board requested and considered information concerning the nature, extent and quality of the services provided to the Fund by the Advisers. The Board considered, among other things, the terms of the Agreements and the range of services provided by the Advisers. The Board considered the Advisers’ professional personnel who provide services to the Fund, including each Adviser’s ability and experience in attracting and retaining qualified personnel to service the Fund. The Board considered each Adviser’s reputation and overall financial strength, as well as its willingness to consider and implement organizational and operational changes designed to enhance services to the Hartford Funds. In addition, the Board considered the quality of each Adviser’s communications with the Board and responsiveness to Board inquiries and requests made from time to time with respect to the Fund and other Hartford Funds.
The Board also requested and evaluated information concerning each Adviser’s regulatory and compliance environment. In this regard, the Board requested and reviewed information on each Adviser’s compliance policies and procedures, compliance history, and a report from the Fund’s Chief Compliance Officer on each Adviser’s compliance with applicable laws and regulations, including responses to regulatory developments and compliance issues raised by regulators. The Board also noted the Advisers’ support of the Fund’s compliance control structure, particularly the resources devoted by the Advisers in support of the Fund’s obligations pursuant to Rule 38a-1 under the 1940 Act.
With respect to HFMC, the Board noted that, under the Agreements, HFMC is responsible for the management of the Fund, including oversight of fund operations and service providers, and provides administrative and investment advisory services in connection with selecting, monitoring and supervising the Sub-adviser. The Board considered HFMC’s ongoing monitoring of people, process and performance, including its quarterly reviews of each of the Hartford Funds, semi-annual meetings with the leaders of each Fund’s portfolio management team, and oversight of the Hartford Funds’ approximately 66 portfolio managers. The Board recognized that HFMC has demonstrated a record of making changes to the
| 30 |
| The Hartford MidCap Fund |
| Approval of Investment Management and Investment Sub-Advisory Agreements (Unaudited) – (continued) |
management and/or strategies of the Hartford Funds when warranted. The Board considered HFMC’s oversight of the Sub-adviser’s investment approach and results, process for monitoring best execution of portfolio trades by the Sub-adviser, and approach to risk management with respect to the Fund and the service providers to the Fund. The Board also considered HFMC’s oversight of compliance with the Fund’s objective and policies as well as with applicable laws and regulations, noting that regulatory and other developments had over time led to an increase in the scope of HFMC’s services in this regard.
In addition, the Board considered HFMC’s ongoing commitment to review and rationalize the Hartford Funds product line-up and the expenses that HFMC had incurred in connection with fund combinations in recent years. The Board considered that HFMC or its affiliates are responsible for providing the Fund’s officers.
With respect to the Sub-adviser, which provides certain day-to-day portfolio management services for the Fund, the Board considered the quality of the Fund’s portfolio managers, the Sub-adviser’s other investment personnel, its investment philosophy and process, investment research capabilities and resources, performance record, trade execution capabilities and experience. The Board considered the experience of the Fund’s portfolio managers, the number of accounts managed by the portfolio managers, and the Sub-adviser’s method for compensating the portfolio managers.
Based on these considerations, the Board concluded that it was satisfied with the nature, extent and quality of the services provided to the Fund by HFMC and the Sub-adviser.
Performance of the Fund and the Advisers
The Board considered the investment performance of the Fund. In this regard, the Board reviewed the performance of the Fund over different time periods presented in the materials and evaluated HFMC’s analysis of the Fund’s performance for these time periods. The Board considered information and materials provided to the Board by the Advisers concerning Fund performance, as well as information from Lipper comparing the investment performance of the Fund to an appropriate benchmark and universe of peer funds. The Board noted that the Fund’s performance was in the 1st quintile of its performance universe for the 1-year period, the 2nd quintile for the 3-year period and the 4th quintile for the 5-year period. The Board also noted that the Fund’s performance was above its benchmark for the 1- and 3-year periods and below its benchmark for the 5-year period.
The Board considered the detailed investment analytics reports provided by Hartford Funds’ Investment Advisory Group throughout the year. These reports include, among other things, information on the Fund’s gross and net returns, the Fund’s investment performance relative to an appropriate benchmark and peer group, various statistics concerning the Fund’s portfolio, and a narrative summary of various factors affecting Fund performance. The Board considered the Advisers’ cooperation with the Investment Committee, which assists the Board in evaluating the performance of the Fund at periodic meetings throughout the year. The Board also considered the analysis provided by the Consultant relating to the Fund’s performance track record.
In light of all the considerations noted above, the Board concluded that it had continued confidence in HFMC’s and the Sub-adviser’s overall capabilities to manage the Fund.
Costs of the Services and Profitability of the Advisers
The Board reviewed information regarding HFMC’s cost to provide investment management and related services to the Fund and HFMC’s profitability, both overall and for the Fund, on a pre-tax basis without regard to distribution expenses. The Board also requested and reviewed information about the profitability to HFMC and its affiliates from all services provided to the Fund and all aspects of their relationship with the Fund. The Board also requested and received information relating to the operations and profitability of the Sub-adviser.
The Board considered the Consultant’s review of the profitability calculations used by HFMC in connection with the continuation of the investment management agreement, noting the Consultant’s view that Hartford Funds’ process for calculating and reporting Fund profitability is reasonable. In this regard, the Board noted that the Consultant performed a full review of this process in light of the recent restructuring of the Hartford Funds business and reported that the approach to analyzing Fund profitability, including the use of common expense allocation methodologies, is reasonable, sound and well within common industry practice.
Based on these considerations, the Board concluded that the profits anticipated to be realized by the Advisers and their affiliates from their relationships with the Fund would not be excessive.
| 31 |
| The Hartford MidCap Fund |
| Approval of Investment Management and Investment Sub-Advisory Agreements (Unaudited) – (continued) |
Comparison of Fees and Services Provided by the Advisers
The Board considered comparative information with respect to the management fees to be paid by the Fund to HFMC and the total expense ratios of the Fund. The Board also considered comparative information with respect to the sub-advisory fees to be paid by HFMC to the Sub-adviser. In this regard, the Board requested and reviewed information from HFMC and the Sub-adviser relating to the management and sub-advisory fees, including the sub-advisory fee schedule for the Fund, and total operating expenses for the Fund. With respect to the sub-advisory fee schedule, the Board considered representations from HFMC and the Sub-adviser that the Sub-adviser’s fees were negotiated at arm’s length on a fund-by-fund basis. The Board also reviewed information from Lipper comparing the Fund’s contractual management fees, actual management fees and overall expense ratios relative to a group of funds selected by Lipper, in consultation with the Consultant, and a broader universe of funds selected by Lipper. The Board considered that the Fund’s contractual management fee and actual management fee were in the 3rd quintile of its expense group, while its total expenses (less 12b-1 and shareholder service fees) were in the 2nd quintile. The Board noted that the Fund has an automatically renewable contractual expense cap on certain share classes.
While the Board recognized that comparisons between the Fund and peer funds may be imprecise, given the different service levels and characteristics of mutual funds and the different business models and cost structures of the Advisers, the comparative information provided by Lipper assisted the Board in evaluating the reasonableness of the Fund’s management and sub-advisory fees and total operating expenses. In addition, the Board considered the analysis and recommendations of the Consultant relating to the Fund’s management and sub-advisory fees and total operating expenses.
Based on these considerations, the Board concluded that the Fund’s fees and total operating expenses, in conjunction with the information about quality of services, profitability, economies of scale, and other matters discussed, were reasonable in light of the services provided.
Economies of Scale
The Board requested and considered information regarding the Advisers’ realization of economies of scale with respect to the Fund and whether the fee levels reflect these economies of scale for the benefit of the Fund’s shareholders. The Board reviewed the breakpoints in the management fee schedule for the Fund, which reduce fee rates as Fund assets grow over time. The Board recognized that a fund with assets beyond the highest breakpoint level will continue to benefit from economies of scale because additional assets are charged the lowest breakpoint fee resulting in lower overall effective management fee rates. The Board also considered that expense limitations and fee waivers that reduce the Fund’s expenses at all asset levels can have the same effect as breakpoints in sharing economies of scale with shareholders and provide protection from an increase in expenses if Fund assets decline. The Board recognized that a fee schedule that reaches a lower breakpoint quickly provides shareholders with the benefit of anticipated or potential economies of scale. The Board also considered that HFMC has been active in managing expenses, which has resulted in benefits being realized by shareholders as assets within the Hartford Funds family of funds have grown over time, including through lower transfer agent costs and other operating expenses.
The Board reviewed and evaluated materials from Lipper and the Consultant showing how management fee schedules of peer funds reflect economies of scale for the benefit of shareholders as a peer fund’s assets hypothetically increase over time. Based on information provided by HFMC, Lipper, and the Consultant, the Board recognized that there is no uniform methodology for establishing breakpoints or uniform pattern in asset levels that trigger breakpoints or the amounts of breakpoints triggered.
After considering all of the information available to it, the Board concluded that it was satisfied with the extent to which economies of scale would be shared for the benefit of the Fund’s shareholders based on currently available information and the effective advisory fees and expense ratios for the Fund at its current and reasonably anticipated asset levels. The Board noted, however, that it would continue to monitor future growth in Fund assets and the appropriateness of additional breakpoints.
Other Benefits
The Board considered other benefits to the Advisers and their affiliates from their relationships with the Fund.
The Board noted that HFMC receives fees for fund accounting and related services from the Fund, and the Board considered information on profits to HFMC for such services. The Board also considered that Hartford Administrative Services Company (“HASCO”), the Fund’s transfer agent and an affiliate of HFMC, receives transfer agency compensation from the Fund, and the Board reviewed information on the profitability of the Fund’s transfer agency function to HASCO. The Board considered information provided by HASCO indicating that the transfer agent fees charged by HASCO to the Fund were fair and reasonable based on publicly available information.
| 32 |
| The Hartford MidCap Fund |
| Approval of Investment Management and Investment Sub-Advisory Agreements (Unaudited) – (continued) |
The Board also considered that Hartford Funds Distributors, LLC (“HFD”), an affiliate of HFMC, serves as principal underwriter of the Fund. As principal underwriter, HFD receives 12b-1 fees from the Fund and receives all or a portion of the sales charges on sales or redemptions of certain classes of shares. The Board also noted that certain affiliates of HFD distribute shares of the Fund and receive compensation in that connection.
The Board considered benefits to the Sub-adviser from its use of the Fund’s brokerage commissions to obtain soft dollar research, and representations from HFMC and the Sub-adviser that the Sub-adviser would not make any revenue-sharing payments or any other type of distribution payments to HFMC or its affiliates.
The Board considered the benefits to shareholders of being part of the Hartford Funds family of funds, including the right to exchange investments between the same class of funds without a sales charge, the ability to reinvest Fund dividends into other funds in the family, and the ability to combine holdings in the Fund with holdings in other funds to obtain a reduced sales charge. The Board considered HFMC’s efforts to provide investors in the family with a broad range of investment styles and asset classes and its entrepreneurial risk in initiating new funds to expand these opportunities for shareholders.
* * * *
Based upon its review of these various factors, among others, the Board concluded that it is in the best interests of the Fund and its shareholders for the Board to approve the Agreements for an additional year. In reaching this decision, the Board did not assign relative weights to the factors discussed above or deem any one or group of them to be controlling in and of themselves. In connection with their deliberations, the Independent Directors met separately in executive session on several occasions, with independent legal counsel and the Consultant, to review the relevant materials and consider their responsibilities under relevant laws and regulations.
| 33 |
| The Hartford MidCap Fund |
| Main Risks (Unaudited) |
The main risks of investing in the Fund are described below.
Market, Selection and Strategy Risk: The Fund’s share price may fluctuate due to market risk and/or security selections that may underperform the market or relevant benchmarks. If the sub-adviser’s investment strategy does not perform as expected, the Fund could underperform its peers or lose money. There is no guarantee the Fund will achieve its stated objective.
Mid-Cap Stock Risk: Mid-cap stocks are generally more volatile and risky and may be less liquid than large-cap stocks because they may have limited operating histories, narrow product lines, and focus on niche markets.
Foreign Investment Risk: Investments in foreign securities may be riskier than investments in U.S. securities. Potential risks include the risks of illiquidity, increased price volatility, less government regulation, less extensive and less frequent accounting and other reporting requirements, unfavorable changes in currency exchange rates, and economic and political disruptions.
| 34 |
THIS PRIVACY POLICY IS NOT PART OF THIS REPORT
Privacy Policy and Practices of The Hartford Financial Services Group, Inc. and its Affiliates
(herein called “we, our and us”)
This Privacy Policy applies to our United States Operations
|
We value your trust. We are committed to the responsible: a) management; b) use; and c) protection; of Personal Information.
This notice describes how we collect, disclose, and protect Personal Information.
We collect Personal Information to: a) service your Transactions with us; and b) support our business functions.
We may obtain Personal Information from: a) You; b) your Transactions with us; and c) third parties such as a consumer-reporting agency.
Based on the type of product or service You apply for or get from us, Personal Information such as: a) your name; b) your address; c) your income; d) your payment; or e) your credit history; may be gathered from sources such as applications, Transactions, and consumer reports.
To serve You and service our business, we may share certain Personal Information. We will share Personal Information, only as allowed by law, with affiliates such as: a) our insurance companies; b) our employee agents; c) our brokerage firms; and d) our administrators.
As allowed by law, we may share Personal Financial Information with our affiliates to: a) market our products; or b) market our services; to You without providing You with an option to prevent these disclosures.
|
We may also share Personal Information, only as allowed by law, with unaffiliated third parties including: a) independent agents; b) brokerage firms; c) insurance companies; d) administrators; and e) service providers; who help us serve You and service our business.
When allowed by law, we may share certain Personal Financial Information with other unaffiliated third parties who assist us by performing services or functions such as: a) taking surveys; b) marketing our products or services; or c) offering financial products or services under a joint agreement between us and one or more financial institutions.
We, and third parties we partner with, may track some of the pages You visit through the use of: a) cookies; b) pixel tagging; or c) other technologies; and currently do not process or comply with any web browser’s “do not track” signal or similar mechanism that indicates a request to disable online tracking of individual users who visit our websites or use our services.
We will not sell or share your Personal Financial Information with anyone for purposes unrelated to our business functions without offering You the opportunity to: a) “opt-out;” or b) “opt-in;” as required by law.
We only disclose Personal Health Information with: a) your proper written authorization; or b) as otherwise allowed or required by law.
Our employees have access to Personal Information in the course of doing their jobs, such as: a) underwriting policies; b) paying claims; c) developing new products; or d) advising customers of our products and services. |
|
We use manual and electronic security procedures to maintain: a) the confidentiality; and b) the integrity of; Personal Information that we have. We use these procedures to guard against unauthorized access.
Some techniques we use to protect Personal Information include: a) secured files; b) user authentication; c) encryption; d) firewall technology; and e) the use of detection software.
We are responsible for and must: a) identify information to be protected; b) provide an adequate level of protection for that data; c) grant access to protected data only to those people who must use it in the performance of their job-related duties.
Employees who violate our Privacy Policy will be subject to discipline, which may include ending their employment with us.
At the start of our business relationship, we will give You a copy of our current Privacy Policy.
We will also give You a copy of our current Privacy Policy once a year if You maintain a continuing business relationship with us.
We will continue to follow our Privacy Policy regarding Personal Information even when a business relationship no longer exists between us. |
As used in this Privacy Notice:
Application means your request for our product or service.
Personal Financial Information means financial information such as: a) credit history; b) income; c) financial benefits; or d) policy or claim information.
Personal Health Information means health information such as: a) your medical records; or b) information about your illness, disability or injury.
Personal Information means information that identifies You personally and is not otherwise available to the public. It includes: a) Personal Financial Information; and b) Personal Health Information.
Transaction means your business dealings with us, such as: a) your Application; b) your request for us to pay a claim; and c) your request for us to take an action on your account.
You means an individual who has given us Personal Information in conjunction with: a) asking about; b) applying for; or c) obtaining; a financial product or service from us if the product or service is used mainly for personal, family, or household purposes. |
This Privacy Policy is being provided on behalf of the following affiliates of The Hartford Financial Services Group, Inc.:
1stAGChoice, Inc.; Access CoverageCorp, Inc.; Access CoverageCorp Technologies, Inc.; American Maturity Life Insurance Company; Archway 60 R, LLC; Business Management Group, Inc.; Champlain Life Reinsurance Company; DMS R, LLC; Eloy R, LLC; Ersatz Corporation; First State Insurance Company; Hartford Accident and Indemnity Company; Hartford Administrative Services Company; Hartford Casualty General Agency, Inc.; Hartford Casualty Insurance Company; Hartford-Comprehensive Employee Benefit Service Company; Hartford Equity Sales Company, Inc.; Hartford Fire General Agency, Inc.; Hartford Fire Insurance Company; Hartford Funds Management Company, LLC; Hartford Funds Management Group, Inc.; Hartford HLS Series Fund II, Inc.; Hartford Insurance Company of Illinois; Hartford Insurance Company of the Midwest; Hartford Insurance Company of the Southeast; Hartford Integrated Technologies, Inc.; Hartford International Life Reassurance Corporation; Hartford Funds Distributors, LLC; Hartford Investment Management Company; Hartford Life and Accident Insurance Company; Hartford Life and Annuity Insurance Company; Hartford Life Insurance Company; Hartford Life Private Placement, LLC; Hartford Lloyd’s Corporation; Hartford Lloyd’s Insurance Company; Hartford Mezzanine Investors I, LLC; Hartford Residual Market, L.C.C.; Hartford Retirement Services, LLC; Hartford Securities Distribution Company, Inc.; Hartford Series Fund, Inc.; Hartford Specialty Insurance Services of Texas, LLC; Hartford Strategic Investments, LLC; Hartford Underwriters Insurance Company; Hartford Technology Services Company, L.L.C.; Hartford of Texas General Agency, Inc.; Hartford Underwriters General Agency, Inc.; HARTRE Company, L.C.C.; HL Investment Advisors, LLC; HLA LLC; Horizon Management Group, LLC; HRA Brokerage Services, Inc.; Lanidex Class B, LLC; M-CAP Insurance Agency, LLC; New England Insurance Company; New England Reinsurance Corporation; Nutmeg Insurance Agency, Inc.; Nutmeg Insurance Company; Pacific Insurance Company, Limited; Planco, LLC: Property and Casualty Insurance Company of Hartford; Revere R, LLC; RVR R, LLC; Sentinel Insurance Company, Ltd.; Sunstone R, LLC; Symphony R, LLC; The Evergreen Group Incorporated; The Hartford Alternative Strategies Fund; The Hartford Mutual Funds, Inc.; The Hartford Mutual Funds II, Inc.; Trumbull Flood Management, L.L.C.; Trumbull Insurance Company; Twin City Fire Insurance Company; White River Life Reinsurance Company.
HPP Revised January 2014
HARTFORDFUNDS
hartfordfunds.com
This information is written in connection with the promotion or marketing of the matter(s) addressed in this material.
This report is submitted for the general information of the shareholders of the Fund. It is not authorized for distribution unless preceded or accompanied by a current prospectus for the Fund.
The information cannot be used or relied upon for the purpose of avoiding IRS penalties. These materials are not intended to provide tax, accounting or legal advice. As with all matters of a tax or legal nature, you should consult your own tax or legal counsel for advice.
Investors should carefully consider the investment objectives, risks, charges, and expenses of Hartford Funds before investing. This and other information can be found in the prospectus and summary prospectus, which can be obtained by calling 888-843-7824 (retail) or 800-279-1541 (institutional). Investors should read them carefully before they invest.
Hartford Funds are underwritten and distributed by Hartford Funds Distributors, LLC.
MFAR-MC14 12/14 113991-3 Printed in U.S.A.
HARTFORDFUNDS
|
THE HARTFORD
2014 Annual Report |
A MESSAGE FROM THE PRESIDENT
Dear Fellow Shareholders:
Thank you for investing in Hartford Funds.
Market Review
U.S. equities (as represented by the S&P 500 Index) rose steadily for the fiscal year ended October 31, 2014, with a return of 17.27% for the period. With the exception of short-lived geopolitical scares early in 2014 and concerns about continuing global growth near the end of the period, stocks generally rose on solid fundamentals and encouraging macroeconomic data during the year.
September 2014 marked the six-year anniversary of the start of the financial crisis. Within weeks of that anniversary, both the S&P 500 Index and the Dow Jones Industrial Average set new all-time highs, closing at 2,018 and 17,391, respectively, on October 31. Although the fallout of the crisis continues to influence investor behavior, stocks have recovered and risen dramatically, up 198% from their low in March 2009. Meanwhile, the domestic economy is notching strong growth, and the unemployment rate has reached its lowest level since August 2008.
While the U.S. economy appears to have stabilized and to have reverted to a solid growth path, the outlook for the global economy appears to have gotten cloudier. The U.S. Federal Reserve has ended quantitative easing, while Europe and Japan are pursuing stimulus options to avoid a double-dip recession and deflation, respectively. Diverging central-bank policies will likely continue to play an important role in market movements going forward as investors wait to see the reactions to their efforts and their impacts on global markets.
How have market movements impacted your portfolio throughout the last year? Are your investments still on track to provide the growth or income you need, and are you comfortable with their progress during times of volatility?
Your financial professional can help you navigate today’s markets with confidence, as well as assist you to achieve your investment goals by providing advice on the best options within our fund family to help you work toward overcoming today’s investing challenges. Meet with your financial advisor regularly to examine your portfolio and your investment strategy, and to determine if you’re still on track to meet your goals.
Thank you again for investing with Hartford Funds.
James Davey
President
Hartford Funds
1 The S&P 500 Index is a market capitalization-weighted price index composed of 500 widely held common stocks.
2 The Dow Jones Industrial Average is an unmanaged, price-weighted index of 30 of the largest, most widely held stocks traded on the NYSE
The Hartford MidCap Value Fund
Table of Contents
The views expressed in the Fund’s Manager Discussion under ‘‘Why did the Fund perform this way?’’ and ‘‘What is the outlook?’’ are views of the Fund’s sub-adviser and portfolio management team through the end of the period and are subject to change based on market and other conditions. The Fund’s Manager Discussion is for informational purposes only and does not represent an offer, recommendation or solicitation to buy, hold or sell any security. The specific securities identified and described, if any, do not represent all of the securities purchased or sold and you should not assume that investments in the securities identified and discussed will be profitable.
| The Hartford MidCap Value Fund inception 04/30/2001 |
| (sub-advised by Wellington Management Company, LLP) |
| Investment objective – The Fund seeks long-term capital appreciation. |
Performance Overview 10/31/04 - 10/31/14

The chart above represents the hypothetical growth of a $10,000 investment in Class A, which includes a sales charge. Growth results in classes other than Class A will vary from what is seen above due to differences in the expenses charged to those share classes.
| Average Annual Total Returns (as of 10/31/14) |
| 1 Year | 5 Years | 10 Years | ||||||||||
| MidCap Value A# | 12.32 | % | 17.51 | % | 9.34 | % | ||||||
| MidCap Value A## | 6.15 | % | 16.19 | % | 8.72 | % | ||||||
| MidCap Value B# | 11.41 | % | 16.59 | % | 8.71 | %* | ||||||
| MidCap Value B## | 6.42 | % | 16.38 | % | 8.71 | %* | ||||||
| MidCap Value C# | 11.56 | % | 16.66 | % | 8.53 | % | ||||||
| MidCap Value C## | 10.56 | % | 16.66 | % | 8.53 | % | ||||||
| MidCap Value I# | 12.75 | % | 17.90 | % | 9.52 | % | ||||||
| MidCap Value R3# | 12.05 | % | 17.36 | % | 9.50 | % | ||||||
| MidCap Value R4# | 12.42 | % | 17.68 | % | 9.65 | % | ||||||
| MidCap Value R5# | 12.73 | % | 17.97 | % | 9.79 | % | ||||||
| MidCap Value Y# | 12.79 | % | 18.06 | % | 9.83 | % | ||||||
| Russell 2500 Value Index | 10.23 | % | 17.63 | % | 8.93 | % | ||||||
| Russell MidCap Value Index | 16.18 | % | 19.19 | % | 10.29 | % | ||||||
| # | Without sales charge |
| ## | With sales charge |
| * | Class B shares convert to Class A shares after 8 years. The return shown reflects the conversion to Class A shares, which had different operating expenses, for the period after conversion. |
PERFORMANCE DATA QUOTED REPRESENTS PAST PERFORMANCE AND DOES NOT GUARANTEE FUTURE RESULTS. The investment return and principal value of the investment will fluctuate so that investors’ shares, when redeemed, may be worth more or less than their original cost. Current performance may be lower or higher than the performance data quoted. To obtain performance data current to the most recent month-end, please visit our website www.hartfordfunds.com.
The initial investment in Class A shares reflects the maximum sales charge of 5.50% and returns for Class B shares reflect a contingent deferred sales charge of up to 5.00% and declining to zero, depending on the period of time the shares are held. Returns for Class C shares reflect a contingent deferred sales charge of up to 1.00% on shares redeemed within twelve months of purchase.
Total returns presented above were calculated using the Fund’s net asset value available to shareholders for sale or redemption of Fund shares on October 31, 2014, which may exclude investment transactions as of this date. All share class returns assume the reinvestment of all distributions at net asset value and the deduction of all fund expenses.
Effective 9/30/09, Class B shares of the Fund were closed to new investments.
Class I shares commenced operations on 5/28/10. Performance prior to that date is that of the Fund’s Class A shares (excluding sales charges), which had different operating expenses. Class R3, R4 and R5 shares commenced operations on 5/28/10. Performance prior to that date is that of the Fund’s Class Y shares which had different operating expenses.
Russell 2500 Value Index is an unmanaged index that measures the performance of those Russell 2500 Index companies with lower price-to-book ratios and lower forecasted growth values. The Russell 2500 Index is an unmanaged index that measures the performance of the 2,500 smallest U.S. companies based on total market capitalization.
Russell MidCap Value Index measures the performance of the mid-cap value segment of the U.S. equity universe. It includes those Russell MidCap Index companies with lower price-to-book ratios and lower forecasted growth values.
You cannot invest directly in an index.
The chart and table do not reflect the deductions of taxes that a shareholder would pay on Fund distributions or the redemption of Fund shares.
Performance information may reflect historical or current expense waivers/reimbursements from the investment adviser, without which performance would have been lower. For information on current expense waivers/reimbursements, please see the prospectus.
| 2 |
| The Hartford MidCap Value Fund |
Manager Discussion
October 31, 2014 (Unaudited)
| Operating Expenses* | ||||||||
| Net | Gross | |||||||
| MidCap Value Class A | 1.31 | % | 1.31 | % | ||||
| MidCap Value Class B | 2.10 | % | 2.33 | % | ||||
| MidCap Value Class C | 2.01 | % | 2.01 | % | ||||
| MidCap Value Class I | 0.96 | % | 0.96 | % | ||||
| MidCap Value Class R3 | 1.53 | % | 1.53 | % | ||||
| MidCap Value Class R4 | 1.22 | % | 1.22 | % | ||||
| MidCap Value Class R5 | 0.93 | % | 0.93 | % | ||||
| MidCap Value Class Y | 0.82 | % | 0.82 | % | ||||
| * | As shown in the Fund's current prospectus dated March 1, 2014. Actual expenses may be higher or lower. Please see accompanying Financial Highlights for expense ratios for the year ended October 31, 2014. |
Gross expenses are the Fund's total annual operating expenses shown in the Fund's most recent prospectus. Net expenses are the Fund's total annual operating expenses shown in the Fund's most recent prospectus and reflect contractual expense reimbursements in instances when these reductions reduce the Fund's gross expenses. Contractual reimbursements remain in effect until February 28, 2015, and automatically renew for one-year terms unless terminated.
All investments are subject to risk including the possible loss of principal. For a discussion of the Fund’s risks, please see the Main Risks section of this report. For more detailed information on the risks associated with an investment in the Fund, please see the prospectus.
| Portfolio Manager |
| James N. Mordy |
| Senior Vice President and Equity Portfolio Manager |
How did the Fund perform?
The Class A shares of The Hartford MidCap Value Fund returned 12.32%, before sales charge, for the twelve-month period ended October 31, 2014, outperforming the Fund’s benchmark, the Russell 2500 Value Index, which returned 10.23% for the same period, but underperforming the Fund’s other benchmark, the Russell MidCap Value Index, which returned 16.18% for the same period. The Fund also outperformed the 11.40% average return of the Lipper Mid-Cap Value Fund peer group, a group of funds with investment strategies similar to those of the Fund.
Why did the Fund perform this way?
The S&P 500 Index surged during the period, despite bouts of significant volatility. After finishing its best year since 1997, the S&P 500 Index began 2014 with its worst month in nearly two years. Worries about an economic slowdown in China and general angst surrounding emerging markets overshadowed a fairly benign domestic environment. However, robust merger and acquisition activity and an uncontested increase in the debt ceiling from Congress helped stoke investors' risk appetites in February. The rally continued in May amid renewed signs of life in the housing market and the best payroll gain in more than two years. However, a pullback in July ended a streak of five consecutive monthly gains. Fear gripped the market as heightened geopolitical risks, a potential Portuguese banking crisis, and worries of U.S. Federal Reserve (Fed) tightening took center stage. Stocks rebounded in August as investors were emboldened by encouraging economic data, headlined by better-than-expected gross domestic product (GDP) growth and signs that the housing recovery still had legs. In September, U.S. equities retreated for just the third month this year. Despite solid manufacturing and consumer confidence readings, the reality of quantitative easing ending and the prospect of higher federal funds rates in mid-2015 contributed to increased risk aversion levels. Stocks finished a volatile October at an all-time high on the heels of a positive earnings season and generally solid economic data.
During the period, small-cap equities (+8%) underperformed mid-caps (+12%) and large-caps (+17%) as represented by the Russell 2000, S&P 400 MidCap, and S&P 500 Indices respectively. Returns also varied by style, with the Russell 2500 Value Index outperforming both the Russell 2500 Growth Index and the broader Russell 2500 Index. Eight of the ten sectors in the Russell 2500 Value Index gained during the period, with Healthcare (+21%), Utilities (+20%), and Telecommunication Services and Media (+14%) performing the best. Energy (-16%), Materials (-1%), and Industrials (+6%) lagged during the period.
The Fund’s relative outperformance versus the Russell 2500 Value Index was driven by strong security selection within Information Technology, Industrials, and Financials, which more than offset weak stock selection within Consumer Discretionary, Energy, and Healthcare. Overall sector allocation, primarily a result of the stock selection process, detracted from relative returns, in part due to a modest overweight in Energy and an underweight allocation to Financials. A modest cash balance detracted in an upward trending environment.
Top contributors to both absolute and returns relative to the Russell 2500 Value Index included Skyworks Solutions (Information Technology), Avago Technologies (Information Technology), and NXP Semiconductors (Information Technology). Shares of Skyworks Solutions, a U.S.-based designer and manufacturer of radio and semiconductor system solutions for mobile communications applications, rose during the period as the firm continued to see market share and content gains across multiple handset platforms as well as better-than-forecasted growth from Skyworks' increasingly important integrated analog solution segment. Shares of Avago Technologies, a U.S.-based supplier of analog semiconductor
| 3 |
| The Hartford MidCap Value Fund |
Manager Discussion – (continued)
October 31, 2014 (Unaudited)
devices, rose early in the period due to continued solid operating results from their core businesses, as well as the December 2013 announcement of the $6.6 billion acquisition of LSI. The share price of Netherlands-based semiconductor company NXP Semiconductors moved higher as it continued to maintain its status as a well-positioned semiconductor manufacturer. Overall, NXP Semiconductors continued to benefit from a powerful combination of product cycles, structural cost savings, margin expansion, and a competitive advantage in sizable markets such as identification and smart mobile businesses.
Top detractors from returns relative to the Russell 2500 Value Index included Cobalt International Energy (Energy), GNC Holdings (Consumer Discretionary), and Trican Well Services (Energy). Shares of Cobalt International Energy, a U.S.-based oil-focused exploration and production company, declined due to disappointing well test results at multiple wells, uncertainty surrounding the impact of the SEC’s investigation into its Angola operations, and negative investor sentiment for the subsector. Shares of GNC Holdings, a U.S.-based vitamin and health supplements retailer, fell after the company reported, for the first time since 2005, negative same store sales in January 2014. A combination of weaker industry trends and GNC-specific issues has led to the deceleration in same-store-sales trend. Shares of Trican Well Services, a North American supplier of pressure pumping services to the oil and gas industry, fell during the period despite beating consensus earnings and revenue estimates; the stock price fell along with the broader sector as energy was the worst performing sector in the benchmark.
Derivatives are not used in a significant manner in the Fund and did not have a material impact on performance during the period.
What is the outlook?
We remain generally constructive on the outlook for U.S. economic growth. Job gains have averaged a healthy 245,000 per month for the last 6 months, with the unemployment rate now dropping below 6%. We believe the outlook for capital spending appears healthy, while we expect consumer spending should at least track income growth. The pace of housing recovery has disappointed but may continue to slowly improve. China’s economy seems to have stabilized, but huge transformational challenges and declining property prices would seem to prevent any meaningful acceleration. In our view the biggest risks to the global outlook are probably now in Europe (given the Russia-Ukraine conflict), Japan and emerging markets. The European recovery has disappointed versus our expectations one year ago.
Given this outlook, and recent underperformance of some cyclical stocks, we continue to express a slight preference for the more economically sensitive sectors. At the end of the period, our overweight allocations, relative to the Russell 2500 Index, were in Information Technology, Consumer Discretionary, and Materials, while our greatest underweights continued to be in Financials and Utilities.
| Diversification by Sector | ||||
| as of October 31, 2014 | ||||
| Sector | Percentage of Net Assets | |||
| Equity Securities | ||||
| Consumer Discretionary | 13.9 | % | ||
| Consumer Staples | 3.2 | |||
| Energy | 5.4 | |||
| Financials | 26.0 | |||
| Health Care | 7.5 | |||
| Industrials | 14.7 | |||
| Information Technology | 13.5 | |||
| Materials | 8.3 | |||
| Utilities | 5.9 | |||
| Total | 98.4 | % | ||
| Short-Term Investments | 1.3 | |||
| Other Assets and Liabilities | 0.3 | |||
| Total | 100.0 | % | ||
A sector may be comprised of several industries. For Fund compliance purposes, the Fund may not use the same classification system and these sector classifications are used for reporting ease.
| 4 |
| The Hartford MidCap Value Fund |
Schedule of Investments
October 31, 2014
(000’s Omitted)
| Shares or Principal Amount | Market Value ╪ | |||||||
| Common Stocks - 98.4% | ||||||||
| Automobiles and Components - 0.9% | ||||||||
| 179 | Goodyear (The) Tire & Rubber Co. | $ | 4,335 | |||||
| Banks - 6.9% | ||||||||
| 201 | BankUnited, Inc. | 6,023 | ||||||
| 181 | Comerica, Inc. | 8,641 | ||||||
| 167 | EverBank Financial Corp. | 3,192 | ||||||
| 97 | Iberiabank Corp. | 6,693 | ||||||
| 329 | Zions Bancorporation | 9,537 | ||||||
| 34,086 | ||||||||
| Capital Goods - 14.7% | ||||||||
| 252 | Barnes Group, Inc. | 9,224 | ||||||
| 73 | Curtis-Wright Corp. | 5,018 | ||||||
| 68 | Esterline Technologies Corp. ● | 7,920 | ||||||
| 117 | Generac Holdings, Inc. ● | 5,309 | ||||||
| 79 | Hubbell, Inc. Class B | 8,948 | ||||||
| 124 | Moog, Inc. Class A ● | 9,514 | ||||||
| 235 | Orbital Sciences Corp. ● | 6,180 | ||||||
| 101 | Rexel S.A. | 1,692 | ||||||
| 131 | Sensata Technologies Holding N.V. ● | 6,414 | ||||||
| 24 | Teledyne Technologies, Inc. ● | 2,435 | ||||||
| 121 | WESCO International, Inc. ● | 10,005 | ||||||
| 72,659 | ||||||||
| Consumer Durables and Apparel - 8.0% | ||||||||
| 149 | D.R. Horton, Inc. | 3,395 | ||||||
| 187 | Lennar Corp. | 8,069 | ||||||
| 300 | Newell Rubbermaid, Inc. | 9,989 | ||||||
| 373 | Performance Sports Group Ltd. ● | 6,427 | ||||||
| 1,721 | Samsonite International S.A. | 5,718 | ||||||
| 179 | Toll Brothers, Inc. ● | 5,706 | ||||||
| 39,304 | ||||||||
| Consumer Services - 1.4% | ||||||||
| 172 | Norwegian Cruise Line Holdings Ltd. ● | 6,716 | ||||||
| Diversified Financials - 1.7% | ||||||||
| 115 | LPL Financial Holdings, Inc. | 4,739 | ||||||
| 73 | MSCI, Inc. | 3,401 | ||||||
| 182 | Solar Cayman Ltd. ⌂■●† | 13 | ||||||
| 8,153 | ||||||||
| Energy - 5.4% | ||||||||
| 417 | Cobalt International Energy, Inc. ● | 4,888 | ||||||
| 90 | Diamondback Energy, Inc. ● | 6,146 | ||||||
| 85 | HollyFrontier Corp. | 3,835 | ||||||
| 80 | Newfield Exploration Co. ● | 2,596 | ||||||
| 193 | QEP Resources, Inc. | 4,833 | ||||||
| 462 | Trican Well Service Ltd. | 4,136 | ||||||
| 26,434 | ||||||||
| Food, Beverage and Tobacco - 3.2% | ||||||||
| 137 | Ebro Foods S.A. | 2,458 | ||||||
| 94 | Ingredion, Inc. | 7,277 | ||||||
| 1,427 | Treasury Wine Estates Ltd. | 5,826 | ||||||
| 15,561 | ||||||||
| Health Care Equipment and Services - 3.1% | ||||||||
| 260 | Brookdale Senior Living, Inc. ● | 8,751 | ||||||
| 94 | Wellcare Health Plans, Inc. ● | 6,400 | ||||||
| 15,151 | ||||||||
| Insurance - 8.4% | ||||||||
| 102 | Argo Group International Holdings Ltd. | 5,708 | ||||||
| 122 | Hanover Insurance Group, Inc. | 8,167 | ||||||
| 58 | NN Group N.V. ● | 1,667 | ||||||
| 73 | Reinsurance Group of America, Inc. | 6,171 | ||||||
| 82 | StanCorp Financial Group, Inc. | 5,704 | ||||||
| 188 | Unum Group | 6,294 | ||||||
| 223 | XL Group plc | 7,548 | ||||||
| 41,259 | ||||||||
| Materials - 8.3% | ||||||||
| 145 | Cabot Corp. | 6,746 | ||||||
| 113 | Celanese Corp. | 6,636 | ||||||
| 309 | Louisiana-Pacific Corp. ● | 4,514 | ||||||
| 228 | Methanex Corp. ADR | 13,518 | ||||||
| 119 | Owens-Illinois, Inc. ● | 3,072 | ||||||
| 34 | Packaging Corp. of America | 2,443 | ||||||
| 59 | Reliance Steel & Aluminum | 3,975 | ||||||
| 40,904 | ||||||||
| Media - 2.5% | ||||||||
| 77 | AMC Entertainment Holdings | 1,951 | ||||||
| 264 | Interpublic Group of Cos., Inc. | 5,115 | ||||||
| 212 | Quebecor, Inc. | 5,436 | ||||||
| 12,502 | ||||||||
| Pharmaceuticals, Biotechnology and Life Sciences - 4.4% | ||||||||
| 621 | Almirall S.A. ● | 10,192 | ||||||
| 85 | Ono Pharmaceutical Co., Ltd. | 8,560 | ||||||
| 39 | UCB S.A. | 3,150 | ||||||
| 21,902 | ||||||||
| Real Estate - 9.0% | ||||||||
| 161 | American Assets Trust, Inc. REIT | 6,180 | ||||||
| 240 | Blackstone Mortgage Trust, Inc. REIT | 6,692 | ||||||
| 174 | Equity Lifestyle Properties, Inc. REIT | 8,519 | ||||||
| 136 | Extra Space Storage, Inc. REIT | 7,916 | ||||||
| 259 | Forest City Enterprises, Inc. REIT ● | 5,402 | ||||||
| 77 | Plum Creek Timber Co., Inc. REIT | 3,146 | ||||||
| 57 | SL Green Realty Corp. REIT | 6,641 | ||||||
| 44,496 | ||||||||
| Retailing - 1.1% | ||||||||
| 190 | DSW, Inc. | 5,622 | ||||||
| Semiconductors and Semiconductor Equipment - 4.7% | ||||||||
| 54 | Maxim Integrated Products, Inc. | 1,570 | ||||||
| 298 | Microsemi Corp. ● | 7,764 | ||||||
| 126 | NXP Semiconductors N.V. ● | 8,658 | ||||||
| 314 | RF Micro Devices, Inc. ● | 4,090 | ||||||
| 23 | Skyworks Solutions, Inc. | 1,322 | ||||||
| 23,404 | ||||||||
| Software and Services - 5.3% | ||||||||
| 154 | Booz Allen Hamilton Holding Corp. | 4,063 | ||||||
| 80 | Check Point Software Technologies Ltd. ADR ● | 5,933 | ||||||
| 156 | Teradata Corp. ● | 6,581 | ||||||
| 169 | Verint Systems, Inc. ● | 9,704 | ||||||
| 26,281 | ||||||||
| Technology Hardware and Equipment - 3.5% | ||||||||
| 239 | Arris Group, Inc. ● | 7,181 | ||||||
| 175 | Arrow Electronics, Inc. ● | 9,933 | ||||||
| 17,114 | ||||||||
| Utilities - 5.9% | ||||||||
| 49 | Alliant Energy Corp. | 3,009 | ||||||
| 170 | Great Plains Energy, Inc. | 4,578 | ||||||
| 195 | Portland General Electric Co. | 7,093 | ||||||
| 253 | UGI Corp. | 9,552 | ||||||
The accompanying notes are an integral part of these financial statements.
| 5 |
| The Hartford MidCap Value Fund |
Schedule of Investments – (continued)
October 31, 2014
(000’s Omitted)
| Shares or Principal Amount | Market Value ╪ | |||||||
| Common Stocks - 98.4% - (continued) | ||||||||
| Utilities - 5.9% - (continued) | ||||||||
| 132 | Westar Energy, Inc. | $ | 5,006 | |||||
| 29,238 | ||||||||
| Total Common Stocks | ||||||||
| (Cost $397,839) | $ | 485,121 | ||||||
| Total Long-Term Investments | ||||||||
| (Cost $397,839) | $ | 485,121 | ||||||
| Short-Term Investments - 1.3% | ||||||||||||
| Repurchase Agreements - 1.3% | ||||||||||||
| Bank of America Merrill Lynch TriParty Repurchase Agreement (maturing on 11/03/2014 in the amount of $19, collateralized by U.S. Treasury Note 1.50%, 2019, value of $19) | ||||||||||||
| $ | 19 | 0.08%, 10/31/2014 | $ | 19 | ||||||||
| Bank of America Merrill Lynch TriParty Repurchase Agreement (maturing on 11/03/2014 in the amount of $321, collateralized by GNMA 1.63% - 7.00%, 2031 - 2054, value of $328) | ||||||||||||
| 321 | 0.09%, 10/31/2014 | 321 | ||||||||||
| Bank of Montreal TriParty Repurchase Agreement (maturing on 11/03/2014 in the amount of $86, collateralized by U.S. Treasury Bond 2.88% - 5.25%, 2029 - 2043, U.S. Treasury Note 0.38% - 4.50%, 2015 - 2022, value of $88) | ||||||||||||
| 86 | 0.08%, 10/31/2014 | 86 | ||||||||||
| Bank of Montreal TriParty Repurchase Agreement (maturing on 11/03/2014 in the amount of $293, collateralized by FHLMC 2.00% - 5.50%, 2022 - 2034, FNMA 2.00% - 4.50%, 2024 - 2039, GNMA 3.00%, 2043, U.S. Treasury Note 4.63%, 2017, value of $298) | ||||||||||||
| 293 | 0.10%, 10/31/2014 | 293 | ||||||||||
| Barclays Capital TriParty Repurchase Agreement (maturing on 11/03/2014 in the amount of $1,103, collateralized by U.S. Treasury Bond 4.50% - 6.25%, 2023 - 2036, U.S. Treasury Note 1.63% - 2.13%, 2015 - 2019, value of $1,125) | ||||||||||||
| 1,103 | 0.08%, 10/31/2014 | 1,103 | ||||||||||
| Citigroup Global Markets, Inc. TriParty Repurchase Agreement (maturing on 11/03/2014 in the amount of $1,267, collateralized by U.S. Treasury Bill 0.02%, 2015, U.S. Treasury Bond 3.88% - 11.25%, 2015 - 2040, U.S. Treasury Note 2.00% - 3.38%, 2019 - 2021, value of $1,293) | ||||||||||||
| 1,267 | 0.09%, 10/31/2014 | 1,267 | ||||||||||
| Deutsche Bank Securities TriParty Repurchase Agreement (maturing on 11/03/2014 in the amount of $73, collateralized by U.S. Treasury Note 0.88%, 2017, value of $75) | ||||||||||||
| 73 | 0.13%, 10/31/2014 | 73 | ||||||||||
| RBS Securities, Inc. TriParty Repurchase Agreement (maturing on 11/03/2014 in the amount of $108, collateralized by U.S. Treasury Bond 3.63% - 5.00%, 2037 - 2043, U.S. Treasury Note 2.13%, 2020, value of $110) | ||||||||||||
| 108 | 0.07%, 10/31/2014 | 108 | ||||||||||
| Societe Generale TriParty Repurchase Agreement (maturing on 11/03/2014 in the amount of $1,134, collateralized by U.S. Treasury Bill 0.02%, 2015, U.S. Treasury Bond 3.75% - 11.25%, 2015 - 2043, U.S. Treasury Note 1.38% - 4.25%, 2015 - 2022, value of $1,157) | ||||||||||||
| 1,134 | 0.08%, 10/31/2014 | 1,134 | ||||||||||
| TD Securities TriParty Repurchase Agreement (maturing on 11/03/2014 in the amount of $2,198, collateralized by FHLMC 3.00% - 4.00%, 2026 - 2044, FNMA 2.50% - 5.00%, 2025 - 2044, U.S. Treasury Bond 3.50% - 6.50%, 2026 - 2041, U.S. Treasury Note 1.75% - 2.88%, 2018 - 2019, value of $2,242) | ||||||||||||
| 2,198 | 0.10%, 10/31/2014 | 2,198 | ||||||||||
| 6,602 | ||||||||||||
| Total Short-Term Investments | ||||||||||||
| (Cost $6,602) | $ | 6,602 | ||||||||||
| Total Investments | ||||||||||||
| (Cost $404,441) ▲ | 99.7 | % | $ | 491,723 | ||||||||
| Other Assets and Liabilities | 0.3 | % | 1,348 | |||||||||
| Total Net Assets | 100.0 | % | $ | 493,071 | ||||||||
The accompanying notes are an integral part of these financial statements.
| 6 |
| The Hartford MidCap Value Fund |
Schedule of Investments – (continued)
October 31, 2014
(000’s Omitted)
Note: Percentage of investments as shown is the ratio of the total market value to total net assets.
Prices of foreign equities that are principally traded on certain foreign markets may be adjusted daily pursuant to a fair value pricing service approved by the Board of Directors in order to reflect an adjustment for factors occurring after the close of certain foreign markets but before the close of the New York Stock Exchange.
Equity industry classifications used in this report are the Global Industry Classification Standard, which was developed by and is the exclusive property and service mark of MSCI, Inc. and Standard & Poor’s.
For Fund compliance purposes, the Fund may not use the same classification system shown in this report as these classifications are used for reporting ease.
| ▲ | At October 31, 2014, the cost of securities for federal income tax purposes was $406,259 and the aggregate gross unrealized appreciation and depreciation based on that cost were: |
| Unrealized Appreciation | $ | 95,937 | ||
| Unrealized Depreciation | (10,473 | ) | ||
| Net Unrealized Appreciation | $ | 85,464 |
| † | These securities were valued in good faith at fair value as determined under policies and procedures established by and under the supervision of the Board of Directors. At October 31, 2014, the aggregate fair value of these securities was $13, which rounds to zero percent of total net assets. This amount excludes securities that are principally traded in certain foreign markets and whose prices are adjusted pursuant to a third party pricing service methodology approved by the Board of Directors. |
| ● | Non-income producing. |
| ■ | Securities issued within terms of a private placement memorandum, exempt from registration under Rule 144A under the Securities Act of 1933, as amended, and may be sold only to qualified institutional buyers. Unless otherwise indicated, these holdings are determined to be liquid. At October 31, 2014, the aggregate value of these securities was $13, which rounds to zero percent of total net assets. |
| ⌂ | The following securities are considered illiquid. Illiquid securities are often purchased in private placement transactions, are often not registered under the Securities Act of 1933, as amended, and may have contractual restrictions on resale. A security may also be considered illiquid if the security lacks a readily available market or if its valuation has not changed for a certain period of time. |
| Period Acquired | Shares/ Par | Security | Cost Basis | |||||
| 03/2007 | 182 | Solar Cayman Ltd. - 144A | $ | 53 | ||||
At October 31, 2014, the aggregate value of these securities was $13, which rounds to zero percent of total net assets.
| Foreign Currency Contracts Outstanding at October 31, 2014 | ||||||||||||||||||||||
| Unrealized Appreciation/(Depreciation) | ||||||||||||||||||||||
| Currency | Buy / Sell | Delivery Date | Counterparty | Contract Amount | Market Value ╪ | Asset | Liability | |||||||||||||||
| AUD | Sell | 11/06/2014 | DEUT | $ | 8 | $ | 8 | $ | – | $ | – | |||||||||||
| CAD | Sell | 11/04/2014 | BCLY | 13 | 13 | – | – | |||||||||||||||
| EUR | Sell | 11/03/2014 | RBC | 486 | 483 | 3 | – | |||||||||||||||
| EUR | Sell | 11/04/2014 | RBC | 16 | 16 | – | – | |||||||||||||||
| Total | $ | 3 | $ | – | ||||||||||||||||||
| ╪ | See Significant Accounting Policies of accompanying Notes to Financial Statements regarding valuation of securities. |
| GLOSSARY: (abbreviations used in preceding Schedule of Investments) | |
| Counterparty Abbreviations: | |
| BCLY | Barclays |
| DEUT | Deutsche Bank Securities, Inc. |
| RBC | RBC Dominion Securities, Inc. |
| Currency Abbreviations: | |
| AUD | Australian Dollar |
| CAD | Canadian Dollar |
| EUR | EURO |
| Other Abbreviations: | |
| ADR | American Depositary Receipt |
| FHLMC | Federal Home Loan Mortgage Corp. |
| FNMA | Federal National Mortgage Association |
| GNMA | Government National Mortgage Association |
| REIT | Real Estate Investment Trust |
The accompanying notes are an integral part of these financial statements.
| 7 |
| The Hartford MidCap Value Fund |
Schedule of Investments – (continued)
October 31, 2014
(000’s Omitted)
Investment Valuation Hierarchy Level Summary
October 31, 2014
| Total | Level 1 ♦ | Level 2 ♦ | Level 3 | |||||||||||||
| Assets: | ||||||||||||||||
| Common Stocks ‡ | $ | 485,121 | $ | 445,845 | $ | 39,263 | $ | 13 | ||||||||
| Short-Term Investments | 6,602 | – | 6,602 | – | ||||||||||||
| Total | $ | 491,723 | $ | 445,845 | $ | 45,865 | $ | 13 | ||||||||
| Foreign Currency Contracts * | $ | 3 | $ | – | $ | 3 | $ | – | ||||||||
| Total | $ | 3 | $ | – | $ | 3 | $ | – | ||||||||
| ♦ | For the year ended October 31, 2014, investments valued at $5,381 were transferred from Level 1 to Level 2, and there were no transfers from Level 2 to Level 1. Investments are transferred between Level 1 and Level 2 for a variety of reasons including, but not limited to: |
| 1) | Foreign equities for which a fair value price is more representative of exit value than the local market close (transfer into Level 2). Foreign equities for which the local market close is more representative of exit value (transfer into Level 1). |
| 2) | U.S. Treasury securities that no longer represent the most recent issue (transfer into Level 2). |
| 3) | Equity investments with no observable trading but a bid or mean price is used (transfer into Level 2). Equity investments using observable quoted prices in an active market (transfer into Level 1). |
| ‡ | The Fund has all or primarily all of the equity securities categorized in a particular level. Refer to the Schedule of Investments for further industry breakout. |
| * | Derivative instruments (excluding purchased and written options, if applicable) are valued at the unrealized appreciation/depreciation on the investments. |
| Following is a reconciliation of Level 3 assets for which significant unobservable inputs were used to determine fair value: |
| Balance as of October 31, 2013 | Realized Gain (Loss) | Change in Unrealized Appreciation (Depreciation) | Net Amortization | Purchases | Sales | Transfers Into Level 3 | Transfers Out of Level 3 | Balance as of October 31, 2014 | ||||||||||||||||||||||||||||
| Assets: | ||||||||||||||||||||||||||||||||||||
| Common Stocks | $ | 280 | $ | 245 | $ | (203 | )* | $ | — | $ | — | $ | (309 | ) | $ | — | $ | — | $ | 13 | ||||||||||||||||
| Total | $ | 280 | $ | 245 | $ | (203 | ) | $ | — | $ | — | $ | (309 | ) | $ | — | $ | — | $ | 13 | ||||||||||||||||
| * | Change in unrealized appreciation (depreciation) in the current period relating to assets still held at October 31, 2014 was zero. |
| Note: | For purposes of reporting transfers between different hierarchy levels, both transfers in and out of each level, as applicable, are shown as if they occurred at the beginning of the period. |
The accompanying notes are an integral part of these financial statements.
| 8 |
The Hartford MidCap Value Fund
Statement of Assets and Liabilities
October 31, 2014
(000’s Omitted)
| Assets: | ||||
| Investments in securities, at market value (cost $404,441) | $ | 491,723 | ||
| Cash | 236 | |||
| Unrealized appreciation on foreign currency contracts | 3 | |||
| Receivables: | ||||
| Investment securities sold | 3,617 | |||
| Fund shares sold | 838 | |||
| Dividends and interest | 182 | |||
| Other assets | 39 | |||
| Total assets | 496,638 | |||
| Liabilities: | ||||
| Payables: | ||||
| Investment securities purchased | 3,142 | |||
| Fund shares redeemed | 255 | |||
| Investment management fees | 69 | |||
| Administrative fees | 1 | |||
| Distribution fees | 20 | |||
| Accrued expenses | 80 | |||
| Total liabilities | 3,567 | |||
| Net assets | $ | 493,071 | ||
| Summary of Net Assets: | ||||
| Capital stock and paid-in-capital | $ | 353,954 | ||
| Undistributed net investment income | 446 | |||
| Accumulated net realized gain | 51,391 | |||
| Unrealized appreciation of investments and the translation of assets and liabilities denominated in foreign currency | 87,280 | |||
| Net assets | $ | 493,071 | ||
| Shares authorized | 500,000 | |||
| Par value | $ | 0.001 | ||
| Class A: Net asset value per share/Maximum offering price per share | $16.73/$17.70 | |||
| Shares outstanding | 13,320 | |||
| Net assets | $ | 222,876 | ||
| Class B: Net asset value per share | $ | 14.91 | ||
| Shares outstanding | 145 | |||
| Net assets | $ | 2,156 | ||
| Class C: Net asset value per share | $ | 14.84 | ||
| Shares outstanding | 2,789 | |||
| Net assets | $ | 41,382 | ||
| Class I: Net asset value per share | $ | 16.85 | ||
| Shares outstanding | 2,221 | |||
| Net assets | $ | 37,414 | ||
| Class R3: Net asset value per share | $ | 17.45 | ||
| Shares outstanding | 584 | |||
| Net assets | $ | 10,187 | ||
| Class R4: Net asset value per share | $ | 17.61 | ||
| Shares outstanding | 538 | |||
| Net assets | $ | 9,476 | ||
| Class R5: Net asset value per share | $ | 17.75 | ||
| Shares outstanding | 161 | |||
| Net assets | $ | 2,851 | ||
| Class Y: Net asset value per share | $ | 17.78 | ||
| Shares outstanding | 9,376 | |||
| Net assets | $ | 166,729 |
The accompanying notes are an integral part of these financial statements.
| 9 |
| The Hartford MidCap Value Fund |
Statement of Operations
For the Year Ended October 31, 2014
(000’s Omitted)
| Investment Income: | ||||
| Dividends | $ | 6,912 | ||
| Interest | 3 | |||
| Less: Foreign tax withheld | (145 | ) | ||
| Total investment income | 6,770 | |||
| Expenses: | ||||
| Investment management fees | 3,500 | |||
| Administrative services fees | ||||
| Class R3 | 15 | |||
| Class R4 | 10 | |||
| Class R5 | 2 | |||
| Transfer agent fees | ||||
| Class A | 440 | |||
| Class B | 12 | |||
| Class C | 68 | |||
| Class I | 25 | |||
| Class R3 | 1 | |||
| Class R4 | — | |||
| Class R5 | — | |||
| Class Y | 3 | |||
| Distribution fees | ||||
| Class A | 556 | |||
| Class B | 25 | |||
| Class C | 406 | |||
| Class R3 | 37 | |||
| Class R4 | 17 | |||
| Custodian fees | 7 | |||
| Accounting services fees | 65 | |||
| Registration and filing fees | 140 | |||
| Board of Directors' fees | 13 | |||
| Audit fees | 23 | |||
| Other expenses | 74 | |||
| Total expenses (before waivers and fees paid indirectly) | 5,439 | |||
| Expense waivers | (1 | ) | ||
| Transfer agent fee waivers | (4 | ) | ||
| Commission recapture | (10 | ) | ||
| Total waivers and fees paid indirectly | (15 | ) | ||
| Total expenses, net | 5,424 | |||
| Net Investment Income | 1,346 | |||
| Net Realized Gain on Investments and Foreign Currency Transactions: | ||||
| Net realized gain on investments | 52,776 | |||
| Net realized loss on foreign currency contracts | (16 | ) | ||
| Net realized gain on other foreign currency transactions | 1 | |||
| Net Realized Gain on Investments and Foreign Currency Transactions | 52,761 | |||
| Net Changes in Unrealized Depreciation of Investments and Foreign Currency Transactions: | ||||
| Net unrealized depreciation of investments | (1,008 | ) | ||
| Net unrealized appreciation of foreign currency contracts | 3 | |||
| Net unrealized depreciation of translation of other assets and liabilities in foreign currencies | (6 | ) | ||
| Net Changes in Unrealized Depreciation of Investments and Foreign Currency Transactions | (1,011 | ) | ||
| Net Gain on Investments and Foreign Currency Transactions | 51,750 | |||
| Net Increase in Net Assets Resulting from Operations | $ | 53,096 |
The accompanying notes are an integral part of these financial statements.
| 10 |
| The Hartford MidCap Value Fund |
Statement of Changes in Net Assets
(000’s Omitted)
| For the Year Ended October 31, 2014 | For the Year Ended October 31, 2013 | |||||||
| Operations: | ||||||||
| Net investment income | $ | 1,346 | $ | 860 | ||||
| Net realized gain on investments and foreign currency transactions | 52,761 | 52,046 | ||||||
| Net unrealized appreciation (depreciation) of investments and foreign currency transactions | (1,011 | ) | 51,965 | |||||
| Net Increase in Net Assets Resulting from Operations | 53,096 | 104,871 | ||||||
| Distributions to Shareholders: | ||||||||
| From net investment income | ||||||||
| Class A | — | (1,652 | ) | |||||
| Class C | — | (126 | ) | |||||
| Class I | — | (84 | ) | |||||
| Class R3 | — | (32 | ) | |||||
| Class R4 | — | (30 | ) | |||||
| Class R5 | — | (5 | ) | |||||
| Class Y | — | (2,004 | ) | |||||
| Total from net investment income | — | (3,933 | ) | |||||
| From net realized gain on investments | ||||||||
| Class A | (19,548 | ) | — | |||||
| Class B | (287 | ) | — | |||||
| Class C | (3,955 | ) | — | |||||
| Class I | (1,836 | ) | — | |||||
| Class R3 | (483 | ) | — | |||||
| Class R4 | (471 | ) | — | |||||
| Class R5 | (124 | ) | — | |||||
| Class Y | (13,321 | ) | — | |||||
| Total from net realized gain on investments | (40,025 | ) | — | |||||
| Total distributions | (40,025 | ) | (3,933 | ) | ||||
| Capital Share Transactions: | ||||||||
| Class A | 9,384 | (214 | ) | |||||
| Class B | (663 | ) | (752 | ) | ||||
| Class C | 2,899 | 957 | ||||||
| Class I | 17,868 | 10,395 | ||||||
| Class R3 | 4,839 | 456 | ||||||
| Class R4 | 4,347 | 1,263 | ||||||
| Class R5 | 1,456 | 820 | ||||||
| Class Y | 11,005 | (23,681 | ) | |||||
| Net increase (decrease) from capital share transactions | 51,135 | (10,756 | ) | |||||
| Net Increase in Net Assets | 64,206 | 90,182 | ||||||
| Net Assets: | ||||||||
| Beginning of period | 428,865 | 338,683 | ||||||
| End of period | $ | 493,071 | $ | 428,865 | ||||
| Undistributed (distributions in excess of) net investment income | $ | 446 | $ | (698 | ) | |||
The accompanying notes are an integral part of these financial statements.
| 11 |
| The Hartford MidCap Value Fund |
Notes to Financial Statements
October 31, 2014
(000’s Omitted)
Organization:
The Hartford Mutual Funds, Inc. (“Company”) is an open-end management investment company comprised of forty-two portfolios. Financial statements for The Hartford MidCap Value Fund (the "Fund"), a series of the Company, are included in this report.
The Company is organized under the laws of the State of Maryland and is registered with the Securities and Exchange Commission (“SEC”) under the Investment Company Act of 1940, as amended (“1940 Act”). The Fund is a diversified open-end management investment company. The Fund is an investment company and applies specialized accounting and reporting under Accounting Standards Codification Topic 946, Financial Services - Investment Companies.
Class A shares are sold with a front-end sales charge of up to 5.50%. Class B shares were sold with a contingent deferred sales charge which is assessed on the lesser of the per share net asset value (“NAV”) of the shares at the time of redemption or the original purchase price, and declines from up to 5.00% to zero depending on the period of time the shares are held (see note below regarding the closing of Class B shares). Class C shares are sold with a contingent deferred sales charge of up to 1.00% on shares redeemed within twelve months of purchase. Class I shares are sold without sales charges to certain eligible investors primarily through advisory fee-based wrap programs. Class R3, R4 and R5 shares, which are offered to employer-sponsored retirement plans, and Class Y shares, which are sold to certain eligible institutional investors, are sold without a sales charge. All classes of shares have identical voting, redemption, dividend, liquidation and other rights and the same terms and conditions, with the exceptions that each class may have different expenses, which may affect performance, and that Class B shares automatically convert to Class A shares after 8 years.
No new or additional investments are allowed in Class B shares of the Fund (including investments through any systematic investment plan). Existing shareholders of Class B shares may continue to hold their Class B shares, exchange their Class B shares for Class B shares of another Hartford Fund (as permitted by existing exchange privileges), or redeem their Class B shares as described in the Fund’s prospectus. Reinstatement privileges with respect to Class B shares are set forth in the Fund's prospectus. For investors electing to reinvest capital gains and dividends, any such capital gains or dividends on Class B shares will continue to be reinvested in Class B shares of the Fund. All Class B share attributes, including the 12b-1 fee, contingent deferred sales charge schedule, and conversion to Class A shares, remain unchanged.
Significant Accounting Policies:
The following is a summary of significant accounting policies of the Fund in the preparation of its financial statements, which are in accordance with United States generally accepted accounting principles (“U.S. GAAP”). The preparation of financial statements in accordance with U.S. GAAP may require management to make estimates and assumptions that affect the reported amounts of assets and liabilities and disclosure of contingent assets and liabilities at the date of the financial statements and the reported amounts of increases and decreases in net assets from operations during the reporting period. Actual results could differ from those estimates.
Determination of Net Asset Value – The NAV of each class of the Fund's shares is determined as of the close of regular trading (normally 4:00 p.m. Eastern Time) (the “NYSE Close”) on each day that the New York Stock Exchange (the “Exchange”) is open (“Valuation Date”). Information that becomes known to the Fund after the NAV has been calculated on a particular day will not generally be used to retroactively adjust the NAV determined earlier that day.
Investment Valuation and Fair Value Measurements – For purposes of calculating the NAV, portfolio investments and other assets held by the Fund's portfolio for which market quotes are readily available are valued at market value. Market value is generally determined on the basis of last reported sales prices or official close price. If no sales are reported, market value is based on quotes obtained from a quotation reporting system, established market makers, or independent pricing services. If market prices are not readily available or are deemed unreliable, the Fund will use the fair value of the investment as determined in good faith under policies and procedures established by and under the supervision of the Company's Board of Directors. Market quotes are considered not readily available where there is an absence of current or reliable market-based data (e.g., trade information or indicative market quotes), including where events occur after the close of the relevant market, but prior to the NYSE Close, that materially affect the values of the Fund's portfolio investments or assets. In addition, market quotes are considered not readily available when, due to extraordinary circumstances, the exchanges or markets on which the investments trade do not open for trading for the entire day and no other market prices are available. In addition, prices of foreign equities that are principally traded on certain foreign markets may
| 12 |
The Hartford MidCap Value Fund
Notes to Financial Statements – (continued)
October 31, 2014
(000’s Omitted)
be adjusted daily pursuant to a fair value pricing service approved by the Board of Directors in order to reflect an adjustment for the factors occurring after the close of certain foreign markets but before the NYSE Close. Investments that are primarily traded on foreign markets may trade on days that are not business days of the Fund. The value of the foreign investments in which the Fund invests may change on days when a shareholder will not be able to purchase or redeem shares of the Fund. Fair value pricing is subjective in nature and the use of fair value pricing by the Fund may cause the NAV of its shares to differ significantly from the NAV that would have been calculated using market prices at the close of the exchange on which a portfolio investment is primarily traded. There can be no assurance that the Fund could obtain the fair market value assigned to an investment if the Fund were to sell the investment at approximately the time at which the Fund determines its NAV.
Investments valued in currencies other than U.S. dollars are converted to U.S. dollars using exchange rates obtained from independent pricing services for calculation of the NAV. As a result, the NAV of the Fund’s shares may be affected by changes in the value of currencies in relation to the U.S. dollar. The value of investments traded in markets outside the United States or denominated in currencies other than the U.S. dollar may be affected significantly on a day that the NYSE is closed and the market value may change on days when an investor is not able to purchase, redeem or exchange shares of the Fund.
Foreign currency contracts represent agreements to exchange currencies on specific future dates at predetermined rates. Foreign currency contracts are valued using foreign currency exchange rates and forward rates as provided by an independent pricing service on the Valuation Date.
Financial instruments for which prices are not available from an independent pricing service may be valued using market quotations obtained from one or more dealers that make markets in the respective financial instrument in accordance with procedures established by the Company's Board of Directors.
U.S. GAAP defines fair value as the price that the Fund would receive to sell an asset or pay to transfer a liability in an orderly transaction between market participants. The U.S. GAAP fair value measurement standards require disclosure of a fair value hierarchy for each major category of assets and liabilities. Various inputs are used in determining the fair value of the Fund’s investments. These inputs are summarized into three broad hierarchy levels. This hierarchy is based on whether the valuation inputs are observable or unobservable. These levels are:
Level 1 – Quoted prices in active markets for identical investments. Level 1 may include exchange traded instruments, such as domestic equities, some foreign equities, options, futures, mutual funds, exchange traded funds, rights and warrants.
Level 2 – Observable inputs other than Level 1 prices, such as quoted prices for similar investments; quoted prices in markets that are not active; or other inputs that are observable or can be corroborated by observable market data. Level 2 may include debt investments that are traded less frequently than exchange traded instruments and which are valued using independent pricing services; foreign equities, which are principally traded on certain foreign markets and are adjusted daily pursuant to a fair value pricing service in order to reflect an adjustment for the factors occurring after the close of certain foreign markets but before the NYSE Close; senior floating rate interests, which are valued using an aggregate of dealer bids; short-term investments, which are valued at amortized cost; and swaps, which are valued based upon the terms of each swap contract.
Level 3 – Significant unobservable inputs that are supported by limited or no market activity. Level 3 may include financial instruments whose values are determined using indicative market quotes or require significant management judgment or estimation. These unobservable valuation inputs may include estimates for current yields, maturity/duration, prepayment speed, and indicative market quotes for comparable investments along with other assumptions relating to credit quality, collateral value, complexity of the investment structure, general market conditions and liquidity. This category may include investments where trading has been halted or there are certain restrictions on trading. While these investments are priced using unobservable inputs, the valuation of these investments reflects the best available data and management believes the prices are a reasonable representation of exit price.
The Board of Directors of the Company generally reviews and approves the “Procedures for Valuation of Portfolio Securities” at least once a year. These procedures define how investments are to be valued, including the formation and activities of a Valuation Committee. The Valuation Committee is responsible for determining in good faith the fair value of investments when
| 13 |
| The Hartford MidCap Value Fund |
Notes to Financial Statements – (continued)
October 31, 2014
(000’s Omitted)
the value cannot be obtained from primary pricing services or alternative sources or if the valuation of an investment as provided by the primary pricing service or alternative source is believed not to reflect the investment’s fair value as of the Valuation Date. Voting members of the Valuation Committee include the Fund's Treasurer or designee and a Vice President of the investment manager or designee. An Assistant Vice President of the Fund with legal expertise or designee is also included on the Valuation Committee as a non-voting advisory member. In addition, the Fund’s Chief Compliance Officer shall designate a member of the compliance group to attend Valuation Committee meetings as a non-voting resource, to monitor for and provide guidance with respect to compliance with these procedures. Two members of the Valuation Committee or their designees, representing different departments, shall constitute a quorum for purposes of permitting the Valuation Committee to take action. The Valuation Committee will consider all relevant factors in determining an investment’s fair value, and may seek the advice of the Fund’s sub-adviser, knowledgeable brokers, and legal counsel in making such determination. The Valuation Committee reports to the Audit Committee of the Company's Board of Directors. The Audit Committee receives quarterly written reports which include details of all fair-valued investments, including the reason for the fair valuation, and an indication, when possible, of the accuracy of the valuation by disclosing the next available reliable public price quotation or the disposition price of such investments (the “look-back” test). The Board of Directors then must consider for ratification all of the fair value determinations made during the previous quarter.
Valuation levels are not necessarily indicative of the risk associated with investing in such investments. Individual investments within any of the above mentioned asset classes may be assigned a different hierarchical level than those presented above, as individual circumstances dictate.
For additional information, refer to the Investment Valuation Hierarchy Level Summary and the Level 3 roll-forward reconciliation, if applicable, which follow the Schedule of Investments.
Investment Transactions and Investment Income – Investment transactions are recorded as of the trade date (the date the order to buy or sell is executed) for financial reporting purposes. Investments purchased or sold on a when-issued or delayed-delivery basis may be settled a month or more after the trade date. Realized gains and losses are determined on the basis of identified cost.
Dividend income from domestic securities is accrued on the ex-dividend date. In general, dividend income from foreign securities is recorded on the ex-date; however, dividend notifications in certain foreign jurisdictions may not be available in a timely manner and as a result, the Fund will record the dividend as soon as the relevant details (i.e., rate per share, payment date, shareholders of record, etc.) are publicly available. Interest income, including amortization of premium, accretion of discounts and additional principal received in-kind in lieu of cash, is accrued on a daily basis.
Foreign Currency Transactions – Assets and liabilities denominated in currencies other than U.S. dollars are translated into U.S. dollars at the exchange rates in effect on the valuation date. Purchases and sales of investments, income and expenses are translated into U.S. dollars at the exchange rates on the dates of such transactions.
The Fund does not isolate that portion of portfolio investment valuation resulting from fluctuations in the foreign currency exchange rates from the fluctuations arising from changes in the market prices of investments held. Exchange rate fluctuations are included with the net realized and unrealized gain or loss on investments in the accompanying financial statements.
Net realized foreign exchange gains or losses arise from sales of foreign currencies and the difference between asset and liability amounts initially stated in foreign currencies and the U.S. dollar value of the amounts actually received or paid. Net unrealized foreign exchange gains or losses arise from changes in the value of other assets and liabilities at the end of the reporting period, resulting from changes in the exchange rates.
Joint Trading Account – The Fund may invest cash balances into a joint trading account that may be invested in one or more repurchase agreements.
Fund Share Valuation and Dividend Distributions to Shareholders – Orders for the Fund’s shares are executed in accordance with the investment instructions of the shareholders. The NAV of the Fund’s shares is determined as of the close of business on each business day of the Exchange. The NAV is determined separately for each class of shares of the Fund by dividing the Fund’s net
| 14 |
| The Hartford MidCap Value Fund |
Notes to Financial Statements – (continued)
October 31, 2014
(000’s Omitted)
assets attributable to that class by the number of shares of the class outstanding. Each class of shares offered by the Fund has equal rights as to assets and voting privileges (except that shareholders of a class have exclusive voting rights regarding any matter relating solely to that class of shares). Income and non-class specific expenses are allocated daily to each class on the basis of the relative net assets of the class. Realized and unrealized gains and losses are allocated daily based on the relative net assets of each class of shares of the Fund.
Orders for the purchase of the Fund’s shares received prior to the close of the Exchange on any day the Exchange is open for business are priced at the NAV determined as of the close of the Exchange. Orders received after the close of the Exchange, or on a day on which the Exchange and/or the Fund is not open for business, are priced at the next determined NAV.
Dividends are declared pursuant to a policy adopted by the Company's Board of Directors based upon the investment performance of the Fund. The policy of the Fund is to pay dividends from net investment income and realized gains, if any, at least once a year.
Net investment income, dividends and distributions from net realized gains and capital are determined in accordance with federal income tax regulations, which may differ from U.S. GAAP with respect to character and timing (see Federal Income Taxes: Distributions and Components of Distributable Earnings and Reclassification of Capital Accounts).
Securities and Other Investments:
Repurchase Agreements – A repurchase agreement is an agreement by which a counterparty agrees to sell an investment and agrees to repurchase the investment sold from the buyer at a mutually agreed upon time and price. During the period of the repurchase agreement, the counterparty will deposit cash and or securities in a third party custodial account to serve as collateral. At the time the Fund enters into a repurchase agreement, the value of the underlying collateral, including accrued interest, will be equal to or exceed the value of the repurchase agreement. Repurchase agreements expose the Fund to counterparty risk - that is, the risk that the counterparty will not fulfill its obligations. To minimize counterparty risk, the investments that serve to collateralize the repurchase agreement are held by the Fund’s custodian in book entry or physical form in the custodial account of the Fund or in a third party custodial account. Repurchase agreements are valued at cost plus accrued interest, which approximates fair value. Repurchase agreements have master netting arrangements which allow the Fund to offset amounts owed to a counterparty with amounts owed by the counterparty, including any collateral. Upon an event of default under a master repurchase agreement, the non-defaulting party may close out all transactions traded under such agreement and net amounts owed under each transaction to one net amount payable by one party to the other. Absent an event of default, the master repurchase agreement does not result in an offset of reported amounts of assets and liabilities in the Statement of Assets and Liabilities across transactions between the Fund and the applicable counterparty. The Fund, as shown on the Schedule of Investments, had outstanding repurchase agreements and related collateral as of October 31, 2014.
Illiquid and Restricted Investments – The Fund is permitted to invest up to 15% of its net assets in illiquid investments. Illiquid investments are those that may not be sold or disposed of in the ordinary course of business within seven days, at approximately the price used to determine the Fund’s NAV. The Fund may not be able to sell illiquid investments when its sub-adviser considers it desirable to do so or may have to sell such investments at a price that is lower than the price that could be obtained if the investments were more liquid. A sale of illiquid investments may require more time and may result in higher dealer discounts and other selling expenses than does the sale of those that are liquid. Illiquid investments also may be more difficult to value due to the unavailability of reliable market quotations for such investments, and an investment in them may have an adverse impact on the Fund’s NAV. The Fund may also purchase certain restricted investments that can only be resold to certain qualified investors and may be determined to be liquid pursuant to policies and guidelines established by the Company's Board of Directors. The Fund, as shown on the Schedule of Investments, had illiquid or restricted investments as of October 31, 2014.
Investments Purchased on a When-Issued or Delayed-Delivery Basis – Delivery and payment for investments that have been purchased by the Fund on a forward commitment, or when-issued or delayed-delivery basis, take place beyond the customary settlement period. The Fund may dispose of or renegotiate a delayed-delivery transaction after it is entered into, and may sell delayed-delivery investments before they are delivered, which may result in a realized gain or loss. During this period, such investments are subject to market fluctuations, and the Fund identifies investments segregated in its records with a value at least equal to the amount of the commitment. The Fund had no when-issued or delayed-delivery investments as of October 31, 2014.
| 15 |
| The Hartford MidCap Value Fund |
Notes to Financial Statements – (continued)
October 31, 2014
(000’s Omitted)
Financial Derivative Instruments:
The following disclosures contain information on how and why the Fund uses derivative instruments, the credit-risk-related contingent features in certain derivative instruments and how derivative instruments affect the Fund’s financial position and results of operations. The location and fair value amounts of these instruments on the Statement of Assets and Liabilities and the realized gains and losses and changes in unrealized gains and losses on the Statement of Operations, each categorized by type of derivative contract, are included in the following Additional Derivative Instrument Information footnote. The derivative instruments outstanding as of year-end are disclosed in the notes to the Schedule of Investments, if applicable. The amounts of realized gains and losses and changes in unrealized gains and losses on derivative instruments during the year are disclosed in the Statement of Operations.
Foreign Currency Contracts – The Fund may enter into foreign currency contracts that obligate the Fund to purchase or sell currencies at specified future dates. Foreign currency contracts are used to hedge the currency exposure associated with some or all of the Fund’s investments and/or as part of an investment strategy. Foreign currency contracts are marked to market daily and the change in value is recorded by the Fund as an unrealized gain or loss. The Fund will record a realized gain or loss when the foreign currency contract is settled.
Foreign currency contracts involve elements of market risk in excess of the amounts reflected in the Statement of Assets and Liabilities. In addition, risks may arise upon entering into these contracts from the potential inability of the counterparties to meet the terms of the contracts and from unanticipated movements in the value of the foreign currencies relative to the U.S. dollar. The Fund, as shown on the Schedule of Investments, had outstanding foreign currency contracts as of October 31, 2014.
Additional Derivative Instrument Information:
Fair Value of Derivative Instruments on the Statement of Assets and Liabilities as of October 31, 2014:
| Risk Exposure Category | ||||||||||||||||||||||||||||
| Interest Rate Contracts | Foreign Exchange Contracts | Credit Contracts | Equity Contracts | Commodity Contracts | Other Contracts | Total | ||||||||||||||||||||||
| Assets: | ||||||||||||||||||||||||||||
| Unrealized appreciation on foreign currency contracts | $ | — | $ | 3 | $ | — | $ | — | $ | — | $ | — | $ | 3 | ||||||||||||||
| Total | $ | — | $ | 3 | $ | — | $ | — | $ | — | $ | — | $ | 3 | ||||||||||||||
The volume of derivatives that is presented in the Schedule of Investments is consistent with the derivative activity during the year ended October 31, 2014.
The Effect of Derivative Instruments on the Statement of Operations for the year ended October 31, 2014:
| Risk Exposure Category | ||||||||||||||||||||||||||||
| Interest Rate Contracts | Foreign Exchange Contracts | Credit Contracts | Equity Contracts | Commodity Contracts | Other Contracts | Total | ||||||||||||||||||||||
| Realized Loss on Derivatives Recognized as a Result of Operations: | ||||||||||||||||||||||||||||
| Net realized loss on foreign currency contracts | $ | — | $ | (16 | ) | $ | — | $ | — | $ | — | $ | — | $ | (16 | ) | ||||||||||||
| Total | $ | — | $ | (16 | ) | $ | — | $ | — | $ | — | $ | — | $ | (16 | ) | ||||||||||||
| Net Change in Unrealized Appreciation (Depreciation) on Derivatives Recognized as a Result of Operations: | ||||||||||||||||||||||||||||
| Net change in unrealized appreciation of foreign currency contracts | $ | — | $ | 3 | $ | — | $ | — | $ | — | $ | — | $ | 3 | ||||||||||||||
| Total | $ | — | $ | 3 | $ | — | $ | — | $ | — | $ | — | $ | 3 | ||||||||||||||
The derivatives held by the Fund as of October 31, 2014 are not subject to a master netting arrangement; therefore, no balance sheet offsetting disclosure is presented.
| 16 |
| The Hartford MidCap Value Fund |
Notes to Financial Statements – (continued)
October 31, 2014
(000’s Omitted)
Principal Risks:
The Fund may be exposed to counterparty risk, or the risk that an institution or other entity with which the Fund has unsettled or open transactions will default.
If the Fund invests directly in foreign currencies or in securities that trade in, and receive revenues in, foreign currencies, or in derivatives that provide exposure to foreign currencies, it will be subject to the risk that those currencies will decline in value relative to the base currency (U.S. dollars) of the Fund, or, in the case of hedging positions, that the Fund’s base currency will decline in value relative to the currency being hedged. Currency rates in foreign countries may fluctuate significantly over short periods of time for a number of reasons, including changes in interest rates, intervention (or the failure to intervene) by U.S. or foreign governments, central banks or supranational entities, such as the International Monetary Fund, or by the imposition of currency controls or other political developments in the United States or abroad. As a result, the Fund’s investments in foreign currency denominated securities may reduce the returns of the Fund. The market values of equity securities, such as common stocks and preferred stocks, or equity related investments, such as futures and options, may decline due to general market conditions which are not specifically related to a particular company, such as real or perceived adverse economic conditions, changes in the general outlook for corporate earnings, changes in interest or currency rates or adverse investor sentiment generally. The market value of equity securities may also decline due to factors which affect a particular industry or industries, such as labor shortages or increased production costs and competitive conditions within an industry. Equity securities and equity related investments generally have greater market price volatility than fixed income securities.
Federal Income Taxes:
Federal Income Taxes – For federal income tax purposes, the Fund intends to continue to qualify as a Regulated Investment Company ("RIC") under Subchapter M of the Internal Revenue Code (“IRC”) by distributing substantially all of its taxable net investment income and net realized capital gains to its shareholders and otherwise complying with the requirements of the IRC. The Fund has distributed substantially all of its income and capital gains in prior years, if applicable, and intends to distribute substantially all of its income and capital gains during the calendar year ending December 31, 2014. Accordingly, no provision for federal income or excise taxes has been made in the accompanying financial statements. Distributions from short-term capital gains are treated as ordinary income distributions for federal income tax purposes.
Net Investment Income (Loss), Net Realized Gains (Losses) and Distributions – Net investment income (loss) and net realized gains (losses) may differ for financial statement and tax purposes primarily because of losses deferred due to wash sale adjustments, foreign currency gains and losses, adjustments related to Passive Foreign Investment Companies ("PFICs"), Real Estate Investment Trusts ("REITs"), RICs, certain derivatives and partnerships. The character of distributions made during the year from net investment income or net realized gains may differ from their ultimate characterization for federal income tax purposes. Also, due to the timing of dividend distributions, the fiscal year in which amounts are distributed may differ from the year that the income or realized gains (losses) were recorded by the Fund.
Distributions and Components of Distributable Earnings – The tax character of distributions paid by the Fund for the periods indicated is as follows (as adjusted for dividends payable, if applicable):
| For the Year Ended October 31, 2014 | For the Year Ended October 31, 2013 | |||||||
| Ordinary Income | $ | — | $ | 3,468 | ||||
| Long-Term Capital Gains ‡ | 40,025 | 465 | ||||||
| ‡ | The Fund designates these distributions as long-term capital gain dividends pursuant to IRC Sec. 852(b)(3)(C). |
| 17 |
| The Hartford MidCap Value Fund |
Notes to Financial Statements – (continued)
October 31, 2014
(000’s Omitted)
As of October 31, 2014, the Fund’s components of distributable earnings (deficit) on a tax basis are as follows:
| Amount | ||||
| Undistributed Ordinary Income | $ | 5,050 | ||
| Undistributed Long-Term Capital Gain | 50,444 | |||
| Accumulated Capital and Other Losses* | (1,838 | ) | ||
| Unrealized Appreciation† | 85,461 | |||
| Total Accumulated Earnings | $ | 139,117 | ||
| * | The Fund has capital loss carryforwards that are identified in the Capital Loss Carryforward note that follows. |
| † | Differences between book-basis and tax-basis unrealized appreciation (depreciation) may be attributable to the losses deferred due to wash sale adjustments, foreign currency gains and losses, adjustments related to PFICs, REITs, RICs, certain derivatives and partnerships. |
Reclassification of Capital Accounts – The Fund may record reclassifications in its capital accounts. These reclassifications have no impact on the total net assets of the Fund. The reclassifications are a result of permanent differences between U.S. GAAP and tax accounting for such items as foreign currency, PFICs, expiration or utilization of capital loss carryforwards or net operating losses. Adjustments are made to reflect the impact these items have on current and future distributions to shareholders. Therefore, the source of the Fund’s distributions may be shown in the accompanying Statement of Changes in Net Assets as from undistributed net investment income, from accumulated net realized gains on investments or from capital depending on the type of book and tax differences that exist. For the year ended October 31, 2014, the Fund recorded reclassifications to increase (decrease) the accounts listed below:
| Amount | ||||
| Undistributed Net Investment Income (Loss) | $ | (202 | ) | |
| Accumulated Net Realized Gain (Loss) | 202 | |||
Capital Loss Carryforward – On December 22, 2010, the Regulated Investment Company Modernization Act of 2010 (the “Act”) was enacted, which made changes to the capital loss carryforward rules. The changes are effective for taxable years beginning after the date of enactment. Under the Act, funds are permitted to carry forward capital losses for an unlimited period. However, any losses incurred during those future taxable years will be required to be utilized prior to the losses incurred in pre-enactment taxable years, which carry an expiration date. As a result of this ordering rule, pre-enactment capital loss carryforwards may be more likely to expire unused. Additionally, post-enactment capital loss carryforwards retain their character as either short-term or long-term capital losses rather than being considered all short-term as permitted under prior regulation.
At October 31, 2014 (tax year end), the Fund had capital loss carryforwards for U.S. federal income tax purposes as follows:
| Year of Expiration | Amount | |||
| 2015 | $ | 919 | ||
| 2016 | 919 | |||
| Total | $ | 1,838 | ||
As a result of mergers in the Fund, certain provisions in the IRC may limit the future utilization of capital losses. During the year ended October 31, 2014, the Fund utilized $919 of prior year capital loss carryforwards.
Accounting for Uncertainty in Income Taxes – The Fund has adopted financial reporting rules that require the Fund to analyze all open tax years, as defined by the statute of limitations, for all major jurisdictions. Generally, tax authorities can examine all tax returns filed for the last three years. The Fund does not have an examination in progress.
The Fund has reviewed all open tax years and major jurisdictions and concluded that these financial reporting rules had no effect on the Fund’s financial position or results of operations. There is no tax liability resulting from unrecognized tax benefits relating to uncertain income tax positions taken or expected to be taken on the tax return for the fiscal year ended October 31, 2014. The Fund
| 18 |
| The Hartford MidCap Value Fund |
Notes to Financial Statements – (continued)
October 31, 2014
(000’s Omitted)
is also not aware of any tax positions for which it is reasonably possible that the total amounts of unrecognized tax benefits will significantly change in the next twelve months.
Expenses:
Investment Management Agreement – Hartford Funds Management Company, LLC ("HFMC") serves as the Fund’s investment manager pursuant to an Investment Management Agreement with the Company. HFMC is an indirect wholly owned subsidiary of The Hartford Financial Services Group, Inc. ("The Hartford"). The investment manager has overall investment supervisory responsibility for the Fund. In addition, the investment manager provides administrative personnel, services, equipment, facilities and office space for proper operation of the Fund. HFMC has contracted with Wellington Management Company, LLP ("Wellington Management") under a sub-advisory agreement for the provision of day-to-day investment management services to the Fund in accordance with the Fund’s investment objective and policies. The Fund pays a fee to the investment manager, a portion of which may be used to compensate Wellington Management.
The schedule below reflects the rates of compensation paid to the investment manager for investment management services rendered as of October 31, 2014; the rates are accrued daily and paid monthly:
| Average Daily Net Assets | Annual Fee |
| On first $500 million | 0.7500% |
| On next $500 million | 0.6500% |
| On next $1.5 billion | 0.6000% |
| On next $2.5 billion | 0.5950% |
| On next $5 billion | 0.5900% |
| Over $10 billion | 0.5850% |
Accounting Services Agreement – Pursuant to the Fund Accounting Agreement between HFMC and the Company, on behalf of the Fund, HFMC provides accounting services to the Fund and receives monthly compensation based on the Fund’s average daily net assets at the rates set forth below. The Fund’s accounting services fees are accrued daily and paid monthly.
| Average Daily Net Assets | Annual Fee |
| On first $5 billion | 0.014% |
| On next $5 billion | 0.012% |
| Over $10 billion | 0.010% |
Operating Expenses – Allocable expenses incurred by the Company are allocated to each Fund and allocated to classes within the Fund in proportion to the average daily net assets of the Fund and each class, except where allocation of certain expenses is more fairly made directly to the Fund or to specific classes within a Fund. As of October 31, 2014, HFMC contractually limited the total operating expenses of this Fund, exclusive of taxes, interest expense, brokerage commissions, acquired fund fees and expenses and extraordinary expenses, through February 28, 2015 as follows:
| Class A | Class B | Class C | Class I | Class R3 | Class R4 | Class R5 | Class Y |
| 1.35% | 2.10% | 2.10% | 1.10% | 1.55% | 1.25% | 0.95% | 0.90% |
Fees Paid Indirectly – The Fund has entered into agreements with State Street Global Markets, LLC and Russell Implementation Services, Inc. to partially recapture non-discounted trade commissions. Such rebates are used to pay a portion of the Fund's expenses. For the year ended October 31, 2014, this amount, if any, is included in the Statement of Operations.
| 19 |
| The Hartford MidCap Value Fund |
Notes to Financial Statements – (continued)
October 31, 2014
(000’s Omitted)
The ratio of expenses to average net assets in the accompanying financial highlights excludes the reduction in expenses related to fees paid indirectly. The annualized expense ratio after waivers for the period listed below reflecting the reduction for fees paid indirectly is as follows:
| Year Ended October 31, 2014 | ||||
| Class A | 1.26 | % | ||
| Class B | 2.10 | |||
| Class C | 1.98 | |||
| Class I | 0.91 | |||
| Class R3 | 1.53 | |||
| Class R4 | 1.22 | |||
| Class R5 | 0.93 | |||
| Class Y | 0.82 | |||
Distribution and Service Plan for Class A, B, C, R3 and R4 Shares – Hartford Funds Distributors, LLC ("HFD"), an indirect wholly owned subsidiary of The Hartford, is the principal underwriter and distributor of the Fund. HFD is engaged in distribution activities, which include marketing and distribution of shares through broker/dealers, financing distribution costs and maintaining financial books and records. For the year ended October 31, 2014, HFD received front-end load sales charges of $599 and contingent deferred sales charges of $5 from the Fund.
The Fund has adopted a Distribution and Service Plan in accordance with Rule 12b-1 of the 1940 Act to compensate the distributor (HFD) for activities intended to result in the sale and distribution of Class A, B, C, R3 and R4 shares and for providing services for shareholders. The Rule 12b-1 plan applicable to Class A shares of the Fund provides for payment of a Rule 12b-1 fee of 0.25% of average daily net assets. Some or all of the fee may be used for shareholder servicing expenses with the remainder used for distribution expenses. Under the Class B Plan, the Fund pays the distributor 1.00% of the average daily net assets of Class B shares that are outstanding for 8 years or less, 0.25% of which is a fee for services provided to existing shareholders with the remainder used for distribution expenses. Some or the entire Rule 12b-1 fee for Class B shares may be remitted to broker/dealers for distribution and/or shareholder account services. After eight years, Class B shares convert to Class A shares. Upon conversion to Class A shares, the Class A plan described above will apply to those shares. Under the Class C Plan, the Fund pays the distributor 1.00% of the average daily net assets of Class C shares outstanding, 0.25% of which is intended as a fee for services provided to existing shareholders with the remainder used for distribution expenses. For Class C shares, some or the entire fee may be remitted to broker/dealers for distribution and/or shareholder account services. Class R3 shares have a distribution fee of 0.50% of average daily net assets and Class R4 shares have a distribution fee of 0.25% of average daily net assets. For Class R3 and R4 shares, some or the entire fee may be remitted to broker/dealers for distribution and/or shareholder account services. The Fund’s 12b-1 fees are accrued daily and paid monthly or at such other intervals as the Board of Directors may determine.
Other Related Party Transactions – Certain officers of the Fund are directors and/or officers of HFMC and/or The Hartford or its subsidiaries. For the year ended October 31, 2014, a portion of the Fund’s Chief Compliance Officer’s compensation was paid by all of the investment companies in the Hartford fund complex. The portion allocated to the Fund, as represented in other expenses on the Statement of Operations, was in the amount of $1. Hartford Administrative Services Company (“HASCO”), an indirect wholly-owned subsidiary of The Hartford, provides transfer agent services to the Fund. HASCO has contractually agreed to reimburse any portion of the transfer agency fees over 0.30% of average daily net assets per fiscal year for each class. Any transfer agency fee reimbursement is determined before considering the contractual operating expense limitation. For providing such services, HASCO is compensated on a per account basis that varies by account type, except with respect to Class Y, for which it is compensated based on average daily net assets. The amount paid to HASCO and any related contractual reimbursement amounts, if applicable, can be found in the Statement of Operations. These fees are accrued daily and paid monthly.
Administrative services fees are paid to HASCO for third-party recordkeeping services that are payable as a percentage of net assets in the amount of up to 0.20%, 0.15% and 0.10% for Classes R3, R4 and R5 shares, respectively. The total administrative services fees are shown on the Statement of Operations. These fees are accrued daily and paid monthly.
| 20 |
| The Hartford MidCap Value Fund |
Notes to Financial Statements – (continued)
October 31, 2014
(000’s Omitted)
Affiliate Holdings:
As of October 31, 2014, the Fund's shares were owned in aggregate by affiliated fund of funds. Therefore, the Fund may experience relatively large purchases or redemptions of its shares from these affiliated fund of funds. Affiliated fund of funds owned shares in the Fund as follows:
| Percentage of Fund | ||||
| Class Y | 16 | % | ||
Investment Transactions:
For the year ended October 31, 2014, the cost of purchases and proceeds from sales of investment securities (excluding short-term investments) were as follows:
| Excluding U.S. Government Obligations | U.S. Government Obligations | Total | ||||||||||
| Cost of Purchases | $ | 207,402 | $ | — | $ | 207,402 | ||||||
| Sales Proceeds | 197,204 | — | 197,204 | |||||||||
Capital Share Transactions:
The following information is for the year ended October 31, 2014, and the year ended October 31, 2013:
| For the Year Ended October 31, 2014 | For the Year Ended October 31, 2013 | |||||||||||||||||||||||||||||||
| Shares Sold | Shares Issued for Reinvested Dividends | Shares Redeemed | Net Increase (Decrease) of Shares | Shares Sold | Shares Issued for Reinvested Dividends | Shares Redeemed | Net Increase (Decrease) of Shares | |||||||||||||||||||||||||
| Class A | ||||||||||||||||||||||||||||||||
| Shares | 2,226 | 1,281 | (2,810 | ) | 697 | 2,155 | 124 | (2,299 | ) | (20 | ) | |||||||||||||||||||||
| Amount | $ | 36,329 | $ | 19,132 | $ | (46,077 | ) | $ | 9,384 | $ | 31,262 | $ | 1,616 | $ | (33,092 | ) | $ | (214 | ) | |||||||||||||
| Class B | ||||||||||||||||||||||||||||||||
| Shares | 6 | 21 | (71 | ) | (44 | ) | 19 | — | (77 | ) | (58 | ) | ||||||||||||||||||||
| Amount | $ | 81 | $ | 281 | $ | (1,025 | ) | $ | (663 | ) | $ | 260 | $ | — | $ | (1,012 | ) | $ | (752 | ) | ||||||||||||
| Class C | ||||||||||||||||||||||||||||||||
| Shares | 420 | 258 | (452 | ) | 226 | 496 | 9 | (448 | ) | 57 | ||||||||||||||||||||||
| Amount | $ | 6,066 | $ | 3,437 | $ | (6,604 | ) | $ | 2,899 | $ | 6,668 | $ | 105 | $ | (5,816 | ) | $ | 957 | ||||||||||||||
| Class I | ||||||||||||||||||||||||||||||||
| Shares | 1,557 | 81 | (556 | ) | 1,082 | 1,345 | 4 | (630 | ) | 719 | ||||||||||||||||||||||
| Amount | $ | 25,797 | $ | 1,218 | $ | (9,147 | ) | $ | 17,868 | $ | 19,339 | $ | 55 | $ | (8,999 | ) | $ | 10,395 | ||||||||||||||
| Class R3 | ||||||||||||||||||||||||||||||||
| Shares | 354 | 28 | (95 | ) | 287 | 117 | 2 | (90 | ) | 29 | ||||||||||||||||||||||
| Amount | $ | 5,997 | $ | 435 | $ | (1,593 | ) | $ | 4,839 | $ | 1,761 | $ | 31 | $ | (1,336 | ) | $ | 456 | ||||||||||||||
| Class R4 | ||||||||||||||||||||||||||||||||
| Shares | 302 | 28 | (77 | ) | 253 | 139 | 2 | (64 | ) | 77 | ||||||||||||||||||||||
| Amount | $ | 5,225 | $ | 448 | $ | (1,326 | ) | $ | 4,347 | $ | 2,193 | $ | 28 | $ | (958 | ) | $ | 1,263 | ||||||||||||||
| Class R5 | ||||||||||||||||||||||||||||||||
| Shares | 117 | 8 | (40 | ) | 85 | 60 | — | (8 | ) | 52 | ||||||||||||||||||||||
| Amount | $ | 2,005 | $ | 124 | $ | (673 | ) | $ | 1,456 | $ | 945 | $ | 5 | $ | (130 | ) | $ | 820 | ||||||||||||||
| Class Y | ||||||||||||||||||||||||||||||||
| Shares | 3,018 | 843 | (3,171 | ) | 690 | 1,802 | 147 | (3,567 | ) | (1,618 | ) | |||||||||||||||||||||
| Amount | $ | 53,096 | $ | 13,321 | $ | (55,412 | ) | $ | 11,005 | $ | 27,806 | $ | 2,004 | $ | (53,491 | ) | $ | (23,681 | ) | |||||||||||||
| Total | ||||||||||||||||||||||||||||||||
| Shares | 8,000 | 2,548 | (7,272 | ) | 3,276 | 6,133 | 288 | (7,183 | ) | (762 | ) | |||||||||||||||||||||
| Amount | $ | 134,596 | $ | 38,396 | $ | (121,857 | ) | $ | 51,135 | $ | 90,234 | $ | 3,844 | $ | (104,834 | ) | $ | (10,756 | ) | |||||||||||||
| 21 |
| The Hartford MidCap Value Fund |
Notes to Financial Statements – (continued)
October 31, 2014
(000’s Omitted)
The following reflects the conversion of Class B shares into Class A shares (reflected as Class A shares sold) for the year ended October 31, 2014, and the year ended October 31, 2013:
| Shares | Dollars | |||||||
| For the Year Ended October 31, 2014 | 26 | $ | 422 | |||||
| For the Year Ended October 31, 2013 | 29 | $ | 410 | |||||
Line of Credit:
The Fund is one of several Hartford Funds that participate in a $500 million committed revolving line of credit facility. The facility is to be used for temporary or emergency purposes. Under the arrangement, the funds are required to own securities having a market value in excess of 300% of the total bank borrowings. The interest rate on borrowings varies depending on the nature of the loan. The facility also requires a fee to be paid based on the amount of the commitment. This commitment fee is allocated to all the funds participating in the line of credit based on the average net assets of the funds. During the year ended October 31, 2014, the Fund did not have any borrowings under this facility.
Pending Legal Proceedings:
On February 25, 2011, Jennifer L. Kasilag, Louis Mellinger, Judith M. Menendez, Jacqueline M. Robinson, and Linda A. Russell filed a derivative lawsuit against Hartford Investment Financial Services, LLC (“HIFSCO”) (now known as HFD) on behalf of six Hartford retail mutual funds in the United States District Court for the District of New Jersey, alleging that HIFSCO received excessive advisory and distribution fees in violation of its statutory fiduciary duty under Section 36(b) of the 1940 Act when serving as investment manager and principal underwriter, respectively, to the Hartford retail mutual funds. Although this action was purportedly filed on behalf of certain of the Hartford Funds, none of the Hartford Funds is itself a defendant to the suit. HIFSCO moved to dismiss and, in September 2011, the motion was granted in part and denied in part, with leave to amend the complaint. In November 2011, plaintiffs filed an amended complaint on behalf of certain Hartford retail mutual funds, The Hartford Global Health Fund (now known as The Hartford Healthcare Fund), The Hartford Conservative Allocation Fund, The Hartford Growth Opportunities Fund, The Hartford Inflation Plus Fund, The Hartford Advisers Fund (now known as The Hartford Balanced Fund), and The Hartford Capital Appreciation Fund. Plaintiffs seek to rescind the investment management agreements and distribution plans between HIFSCO and these funds and to recover the total fees charged thereunder or, in the alternative, to recover any improper compensation HIFSCO received, in addition to lost earnings. HIFSCO filed a partial motion to dismiss the amended complaint and, in December 2012, the court dismissed without prejudice the claims regarding distribution fees and denied the motion with respect to the advisory fees claims. HIFSCO disputes the allegations and intends to defend vigorously.
In March 2014, the plaintiffs filed a new complaint that added as new plaintiffs The Hartford Floating Rate Fund and The Hartford Small Company Fund and named as a defendant HFMC, which assumed the role as investment manager to the funds as of January 2013. HFMC and HIFSCO dispute the allegations and intend to defend vigorously.
No accrual for litigation relating to this matter has been recorded in the financial statements of the Fund because the Fund is not party to the suit.
Indemnifications:
Under the Company's organizational documents, the Company shall indemnify its officers and directors to the full extent required or permitted under Maryland General Corporation Law and the federal securities laws. In addition, the Company, on behalf of the Fund, may enter into contracts that contain a variety of indemnifications. The Company's maximum exposure under these arrangements is unknown. However, as of the date of these financial statements, the Company has not had prior claims or losses pursuant to these contracts and expects the risk of loss to be remote.
Subsequent Event:
Effective December 1, 2014, pursuant to a sub-transfer agency agreement between HASCO and Boston Financial Data Services, Inc. (“BFDS”), HASCO has delegated certain transfer agent, dividend disbursing agent and shareholder servicing agent functions to BFDS. The costs and expenses of such delegation are borne by HASCO, not by the Fund.
| 22 |
| The Hartford MidCap Value Fund |
Financial Highlights
| - Selected Per-Share Data - (A) | - Ratios and Supplemental Data - | |||||||||||||||||||||||||||||||||||||||||||||||||||
| Class | Net Asset Value at Beginning of Period | Net Investment Income (Loss) | Net Realized and Unrealized Gain (Loss) on Invest- ments | Total from Investment Operations | Dividends from Net Investment Income | Distribu- tions from Realized Capital Gains | Total Dividends and Distributions | Net Asset Value at End of Period | Total Return(B) | Net Assets at End of Period (000's) | Ratio of Expenses to Average Net Assets Before Adjust- ments(C) | Ratio of Expenses to Average Net Assets After Adjust- ments(C) | Ratio of Net Investment Income (Loss) to Average Net Assets | |||||||||||||||||||||||||||||||||||||||
| For the Year Ended October 31, 2014 | ||||||||||||||||||||||||||||||||||||||||||||||||||||
| A | $ | 16.44 | $ | 0.03 | $ | 1.81 | $ | 1.84 | $ | – | $ | (1.55 | ) | $ | (1.55 | ) | $ | 16.73 | 12.32 | % | $ | 222,876 | 1.27 | % | 1.27 | % | 0.19 | % | ||||||||||||||||||||||||
| B | 14.93 | (0.09 | ) | 1.62 | 1.53 | – | (1.55 | ) | (1.55 | ) | 14.91 | 11.41 | 2,156 | 2.28 | 2.10 | (0.63 | ) | |||||||||||||||||||||||||||||||||||
| C | 14.85 | (0.08 | ) | 1.62 | 1.54 | – | (1.55 | ) | (1.55 | ) | 14.84 | 11.56 | 41,382 | 1.99 | 1.99 | (0.53 | ) | |||||||||||||||||||||||||||||||||||
| I | 16.49 | 0.09 | 1.82 | 1.91 | – | (1.55 | ) | (1.55 | ) | 16.85 | 12.75 | 37,414 | 0.92 | 0.92 | 0.53 | |||||||||||||||||||||||||||||||||||||
| R3 | 17.12 | (0.01 | ) | 1.89 | 1.88 | – | (1.55 | ) | (1.55 | ) | 17.45 | 12.05 | 10,187 | 1.53 | 1.53 | (0.08 | ) | |||||||||||||||||||||||||||||||||||
| R4 | 17.21 | 0.04 | 1.91 | 1.95 | – | (1.55 | ) | (1.55 | ) | 17.61 | 12.42 | 9,476 | 1.22 | 1.22 | 0.22 | |||||||||||||||||||||||||||||||||||||
| R5 | 17.29 | 0.09 | 1.92 | 2.01 | – | (1.55 | ) | (1.55 | ) | 17.75 | 12.73 | 2,851 | 0.93 | 0.93 | 0.52 | |||||||||||||||||||||||||||||||||||||
| Y | 17.31 | 0.11 | 1.91 | 2.02 | – | (1.55 | ) | (1.55 | ) | 17.78 | 12.79 | 166,729 | 0.82 | 0.82 | 0.63 | |||||||||||||||||||||||||||||||||||||
| For the Year Ended October 31, 2013 | ||||||||||||||||||||||||||||||||||||||||||||||||||||
| A | $ | 12.58 | $ | 0.02 | $ | 3.97 | $ | 3.99 | $ | (0.13 | ) | $ | – | $ | (0.13 | ) | $ | 16.44 | 32.01 | % | $ | 207,552 | 1.31 | % | 1.31 | % | 0.11 | % | ||||||||||||||||||||||||
| B | 11.40 | (0.09 | ) | 3.62 | 3.53 | – | – | – | 14.93 | 30.96 | 2,819 | 2.33 | 2.10 | (0.68 | ) | |||||||||||||||||||||||||||||||||||||
| C | 11.38 | (0.08 | ) | 3.60 | 3.52 | (0.05 | ) | – | (0.05 | ) | 14.85 | 31.07 | 38,067 | 2.01 | 2.01 | (0.60 | ) | |||||||||||||||||||||||||||||||||||
| I | 12.62 | 0.06 | 3.99 | 4.05 | (0.18 | ) | – | (0.18 | ) | 16.49 | 32.49 | 18,791 | 0.96 | 0.96 | 0.43 | |||||||||||||||||||||||||||||||||||||
| R3 | 13.12 | (0.02 | ) | 4.15 | 4.13 | (0.13 | ) | – | (0.13 | ) | 17.12 | 31.68 | 5,089 | 1.53 | 1.53 | (0.12 | ) | |||||||||||||||||||||||||||||||||||
| R4 | 13.17 | 0.03 | 4.16 | 4.19 | (0.15 | ) | – | (0.15 | ) | 17.21 | 32.11 | 4,903 | 1.22 | 1.22 | 0.18 | |||||||||||||||||||||||||||||||||||||
| R5 | 13.23 | 0.06 | 4.19 | 4.25 | (0.19 | ) | – | (0.19 | ) | 17.29 | 32.46 | 1,309 | 0.93 | 0.93 | 0.38 | |||||||||||||||||||||||||||||||||||||
| Y | 13.24 | 0.09 | 4.18 | 4.27 | (0.20 | ) | – | (0.20 | ) | 17.31 | 32.64 | 150,335 | 0.82 | 0.82 | 0.60 | |||||||||||||||||||||||||||||||||||||
| For the Year Ended October 31, 2012 | ||||||||||||||||||||||||||||||||||||||||||||||||||||
| A | $ | 10.75 | $ | 0.08 | $ | 1.80 | $ | 1.88 | $ | (0.05 | ) | $ | – | $ | (0.05 | ) | $ | 12.58 | 17.55 | % | $ | 159,104 | 1.38 | % | 1.35 | % | 0.67 | % | ||||||||||||||||||||||||
| B | 9.77 | (0.02 | ) | 1.65 | 1.63 | – | – | – | 11.40 | 16.68 | 2,813 | 2.38 | 2.10 | (0.21 | ) | |||||||||||||||||||||||||||||||||||||
| C | 9.74 | – | 1.64 | 1.64 | – | – | – | 11.38 | 16.84 | 28,522 | 2.06 | 2.06 | (0.05 | ) | ||||||||||||||||||||||||||||||||||||||
| I | 10.79 | 0.12 | 1.81 | 1.93 | (0.10 | ) | – | (0.10 | ) | 12.62 | 18.02 | 5,296 | 1.00 | 1.00 | 1.06 | |||||||||||||||||||||||||||||||||||||
| R3 | 11.23 | 0.06 | 1.88 | 1.94 | (0.05 | ) | – | (0.05 | ) | 13.12 | 17.41 | 3,514 | 1.55 | 1.55 | 0.50 | |||||||||||||||||||||||||||||||||||||
| R4 | 11.28 | 0.10 | 1.88 | 1.98 | (0.09 | ) | – | (0.09 | ) | 13.17 | 17.70 | 2,735 | 1.25 | 1.25 | 0.79 | |||||||||||||||||||||||||||||||||||||
| R5 | 11.31 | 0.14 | 1.88 | 2.02 | (0.10 | ) | – | (0.10 | ) | 13.23 | 18.07 | 311 | 0.96 | 0.95 | 1.14 | |||||||||||||||||||||||||||||||||||||
| Y | 11.31 | 0.15 | 1.89 | 2.04 | (0.11 | ) | – | (0.11 | ) | 13.24 | 18.22 | 136,388 | 0.84 | 0.84 | 1.24 | |||||||||||||||||||||||||||||||||||||
| For the Year Ended October 31, 2011 | ||||||||||||||||||||||||||||||||||||||||||||||||||||
| A | $ | 10.69 | $ | 0.01 | $ | 0.05 | $ | 0.06 | $ | – | $ | – | $ | – | $ | 10.75 | 0.56 | % | $ | 147,222 | 1.38 | % | 1.35 | % | 0.05 | % | ||||||||||||||||||||||||||
| B | 9.79 | (0.07 | ) | 0.05 | (0.02 | ) | – | – | – | 9.77 | (0.20 | ) | 8,100 | 2.32 | 2.10 | (0.69 | ) | |||||||||||||||||||||||||||||||||||
| C | 9.77 | (0.07 | ) | 0.04 | (0.03 | ) | – | – | – | 9.74 | (0.31 | ) | 28,939 | 2.09 | 2.09 | (0.70 | ) | |||||||||||||||||||||||||||||||||||
| I | 10.72 | 0.04 | 0.05 | 0.09 | (0.02 | ) | – | (0.02 | ) | 10.79 | 0.81 | 3,459 | 1.04 | 1.04 | 0.34 | |||||||||||||||||||||||||||||||||||||
| R3 | 11.20 | (0.03 | ) | 0.06 | 0.03 | – | – | – | 11.23 | 0.27 | 1,584 | 1.60 | 1.55 | (0.23 | ) | |||||||||||||||||||||||||||||||||||||
| R4 | 11.21 | (0.01 | ) | 0.08 | 0.07 | – | – | – | 11.28 | 0.62 | 1,523 | 1.29 | 1.25 | (0.05 | ) | |||||||||||||||||||||||||||||||||||||
| R5 | 11.22 | 0.05 | 0.06 | 0.11 | (0.02 | ) | – | (0.02 | ) | 11.31 | 0.96 | 136 | 0.99 | 0.95 | 0.43 | |||||||||||||||||||||||||||||||||||||
| Y | 11.22 | 0.06 | 0.06 | 0.12 | (0.03 | ) | – | (0.03 | ) | 11.31 | 1.01 | 109,944 | 0.88 | 0.88 | 0.51 | |||||||||||||||||||||||||||||||||||||
See Portfolio Turnover information on the next page.
| 23 |
| The Hartford MidCap Value Fund |
Financial Highlights
| - Selected Per-Share Data - (A) | - Ratios and Supplemental Data - | |||||||||||||||||||||||||||||||||||||||||||||||||||
| Class | Net Asset Value at Beginning of Period | Net Investment Income (Loss) | Net Realized and Unrealized Gain (Loss) on Invest- ments | Total from Investment Operations | Dividends from Net Investment Income | Distribu- tions from Realized Capital Gains | Total Dividends and Distributions | Net Asset Value at End of Period | Total Return(B) | Net Assets at End of Period (000's) | Ratio of Expenses to Average Net Assets Before Adjust- ments(C) | Ratio of Expenses to Average Net Assets After Adjust- ments(C) | Ratio of
Net Investment Income (Loss) to Average Net Assets | |||||||||||||||||||||||||||||||||||||||
For the Year Ended October 31, 2010 | ||||||||||||||||||||||||||||||||||||||||||||||||||||
| A | $ | 8.37 | $ | – | $ | 2.33 | $ | 2.33 | $ | (0.01 | )(D) | $ | – | $ | (0.01 | ) | $ | 10.69 | 27.83 | % | $ | 176,359 | 1.44 | % | 1.35 | % | 0.01 | % | ||||||||||||||||||||||||
| B | 7.72 | (0.06 | ) | 2.13 | 2.07 | – | – | – | 9.79 | 26.81 | 14,305 | 2.32 | 2.10 | (0.70 | ) | |||||||||||||||||||||||||||||||||||||
| C | 7.70 | (0.07 | ) | 2.14 | 2.07 | – | – | – | 9.77 | 26.88 | 30,467 | 2.13 | 2.10 | (0.74 | ) | |||||||||||||||||||||||||||||||||||||
| I(E) | 9.71 | – | 1.01 | 1.01 | – | – | – | 10.72 | 10.40 | (F) | 254 | 0.95 | (G) | 0.95 | (G) | 0.06 | (G) | |||||||||||||||||||||||||||||||||||
| R3(E) | 10.17 | (0.02 | ) | 1.05 | 1.03 | – | – | – | 11.20 | 10.13 | (F) | 110 | 1.60 | (G) | 1.55 | (G) | (0.40 | ) (G) | ||||||||||||||||||||||||||||||||||
| R4(E) | 10.17 | – | 1.04 | 1.04 | – | – | – | 11.21 | 10.23 | (F) | 110 | 1.30 | (G) | 1.25 | (G) | (0.10 | ) (G) | |||||||||||||||||||||||||||||||||||
| R5(E) | 10.17 | 0.01 | 1.04 | 1.05 | – | – | – | 11.22 | 10.32 | (F) | 111 | 1.00 | (G) | 0.96 | (G) | 0.20 | (G) | |||||||||||||||||||||||||||||||||||
| Y | 8.77 | 0.04 | 2.44 | 2.48 | (0.03 | )(D) | – | (0.03 | ) | 11.22 | 28.39 | 96,621 | 0.90 | 0.90 | 0.39 | |||||||||||||||||||||||||||||||||||||
| (A) | Information presented relates to a share outstanding throughout the indicated period. Net investment income (loss) per share amounts are calculated based on average shares outstanding unless otherwise noted. |
| (B) | Assumes initial investment at net asset value at the beginning of each period, reinvestment of all distributions, the complete redemption of the investment at net asset value at the end of each period and no sales charge. Total return would be reduced if sales charges were taken into account. |
| (C) | Adjustments include waivers and reimbursements, if applicable. Ratios do not include fees paid indirectly (see Expenses in the accompanying Notes to Financial Statements). |
| (D) | Included in this amount are tax distributions from capital of less than ($0.01). | |
| (E) | Commenced operations on May 28, 2010. | |
| (F) | Not annualized. | |
| (G) | Annualized. |
| Portfolio
Turnover Rate for All Share Classes | ||||
| For the Year Ended October 31, 2014 | 43 | % | ||
| For the Year Ended October 31, 2013 | 59 | |||
| For the Year Ended October 31, 2012 | 59 | |||
| For the Year Ended October 31, 2011 | 54 | |||
| For the Year Ended October 31, 2010 | 48 | (A) | ||
| (A) | During the year ended October 31, 2010, the Fund incurred $22.1 million in sales of securities held associated with the transition of assets from The Hartford Select SmallCap Value Fund, which merged into the Fund on July 31, 2010. These sales are excluded from the portfolio turnover calculation. |
| 24 |
| Report of Independent Registered Public Accounting Firm |
The Board of Directors and Shareholders of
The Hartford Mutual Funds, Inc.
We have audited the accompanying statement of assets and liabilities, including the schedule of investments, of The Hartford MidCap Value Fund (one of the portfolios constituting The Hartford Mutual Funds, Inc. (the Funds)) as of October 31, 2014, and the related statement of operations for the year then ended, the statements of changes in net assets for each of the two years in the period then ended, and the financial highlights for the periods indicated therein. These financial statements and financial highlights are the responsibility of the Funds’ management. Our responsibility is to express an opinion on these financial statements and financial highlights based on our audits.
We conducted our audits in accordance with the standards of the Public Company Accounting Oversight Board (United States). Those standards require that we plan and perform the audit to obtain reasonable assurance about whether the financial statements and financial highlights are free of material misstatement. We were not engaged to perform an audit of the Funds’ internal control over financial reporting. Our audits included consideration of internal control over financial reporting as a basis for designing audit procedures that are appropriate in the circumstances, but not for the purpose of expressing an opinion on the effectiveness of the Funds’ internal control over financial reporting. Accordingly, we express no such opinion. An audit also includes examining, on a test basis, evidence supporting the amounts and disclosures in the financial statements and financial highlights, assessing the accounting principles used and significant estimates made by management, and evaluating the overall financial statement presentation. Our procedures included confirmation of securities owned as of October 31, 2014, by correspondence with the custodian and brokers or by other appropriate auditing procedures where replies from brokers were not received. We believe that our audits provide a reasonable basis for our opinion.
In our opinion, the financial statements and financial highlights referred to above present fairly, in all material respects, the financial position of The Hartford MidCap Value Fund of The Hartford Mutual Funds, Inc. at October 31, 2014, the results of its operations for the year then ended, the changes in its net assets for each of the two years in the period then ended, and the financial highlights for the periods indicated therein, in conformity with U.S. generally accepted accounting principles.
| |
Minneapolis, Minnesota
December 18, 2014
| 25 |
| The Hartford MidCap Value Fund |
Directors and Officers (Unaudited)
The Board of Directors of the Company (the "Directors") appoints officers who are responsible for the day-to-day operations of the Fund and who execute policies formulated by the Directors. Each Director serves until his or her death, resignation, or retirement or until the next annual meeting of shareholders is held or until his or her successor is elected and qualifies.
Directors and officers who are employed by or who have a financial interest in The Hartford Financial Services Group, Inc. ("The Hartford") are considered “interested” persons of the Fund pursuant to the 1940 Act. Each officer and two of the Company's Directors, as noted in the chart below, are “interested” persons of the Fund. Each Director serves as a director for The Hartford Mutual Funds, Inc., The Hartford Mutual Funds II, Inc., Hartford Series Fund, Inc., and Hartford HLS Series Fund II, Inc., and as a trustee for The Hartford Alternative Strategies Fund, which, as of October 31, 2014, collectively consist of 66 funds. Correspondence may be sent to Directors and officers c/o Hartford Funds, 5 Radnor Corporate Center, Suite 300, 100 Matsonford Road, Radnor, Pennsylvania 19087, except that correspondence to Mr. Annoni, Mr. Dressen and Ms. Quade may be sent to 500 Bielenberg Drive, Suite 500, Woodbury, Minnesota 55125.
The table below sets forth, for each Director and officer, his or her name, year of birth, current position with the Company and date first elected or appointed to The Hartford Mutual Funds, Inc. ("MF") and The Hartford Mutual Funds II, Inc. ("MF2"), principal occupation, and, for Directors, other directorships held. The Fund’s Statement of Additional Information contains further information on the Directors and is available free of charge by calling 1-888-843-7824 or writing to: Hartford Funds, P.O. Box 55022, Boston, MA 02205-5022.
Information on the aggregate remuneration paid to the directors of the Company can be found in the Statement of Operations herein. The Fund pays to The Hartford a portion of the Chief Compliance Officer’s compensation, but does not pay salaries or compensation to any of its other officers or Directors who are employed by The Hartford.
Non-Interested Directors
Hilary E. Ackermann (1956) Director since September 23, 2014
Ms. Ackermann served as Chief Risk Officer at Goldman Sachs Bank USA from October 2008 to November 2011 and serves as a Director of Dynegy, Inc., an independent power company, from October 2012 to present.
Lynn S. Birdsong (1946) Director since 2003, Chairman of the Investment Committee since 2014
Mr. Birdsong is a private investor. Mr. Birdsong currently serves as a Director of the Sovereign High Yield Investment Company (April 2010 to current). Mr. Birdsong currently serves as an Independent Director of Nomura Partners Funds, Inc. (formerly, The Japan Fund) (April 2003 to current). From 2003 to March 2005, Mr. Birdsong was an Independent Director of the Atlantic Whitehall Funds. From 1979 to 2002, Mr. Birdsong was a Managing Director of Zurich Scudder Investments, an investment management firm. During his employment with Scudder, Mr. Birdsong was an Interested Director of The Japan Fund. From January 1981 through December 2013, Mr. Birdsong was a partner in Birdsong Company, an advertising specialty firm.
Robert M. Gavin, Jr. (1940) Director since 2002 (MF) and 1986 (MF2), Chairman of the Board for each since 2004
Dr. Gavin is an educational consultant. Prior to September 1, 2001, he was President of Cranbrook Education Community and prior to July 1996, he was President of Macalester College, St. Paul, Minnesota.
Duane E. Hill (1945) Director since 2001 (MF) and 2002 (MF2), Chairman of the Nominating Committee since 2003
Mr. Hill is a Partner of TSG Ventures L.P., a private equity investment company. Mr. Hill is a former partner of TSG Capital Group, a private equity investment firm that served as sponsor and lead investor in leveraged buyouts of middle market companies.
Sandra S. Jaffee (1941) Director since 2005
Ms. Jaffee is the founder and Chief Executive Officer of a private company, Homeworks Concierge, LLC, which provides residential property management services in Westchester County, New York (January 2012 to present). Ms. Jaffee served as Chairman (2008 to 2009) and Chief Executive Officer of Fortent (formerly Searchspace Group), a leading provider of compliance/regulatory technology to financial institutions from August 2005 to August 2009. From August 2004 to August 2005, Ms. Jaffee served as an Entrepreneur in Residence with Warburg Pincus, a private equity firm. Prior to joining Warburg Pincus, Ms. Jaffee served as Executive Vice President at Citigroup, from September 1995 to July 2004, where she was President and Chief Executive Officer of Citibank’s Global Securities Services (1995 to 2003). Ms. Jaffee currently serves as a member of the Board of Directors of Broadridge Financial Solutions as well as a Trustee of Muhlenberg College.
| 26 |
| The Hartford MidCap Value Fund |
Directors and Officers (Unaudited) – (continued)
William P. Johnston (1944) Director since 2005, Chairman of the Compliance Committee since 2005
In June 2006, Mr. Johnston was appointed as Senior Advisor to The Carlyle Group, a global private equity and other alternative asset investment firm and currently serves as an Operating Executive. In July 2006, Mr. Johnston was elected to the Board of Directors of MultiPlan, Inc. and served as a Director (July 2006 to August 2010). In August 2007, Mr. Johnston was elected to the Board of Directors of LifeCare Holdings, Inc. and served as a Director (August 2007 to June 2013). In February 2008, Mr. Johnston was elected to the Board of Directors of HCR-ManorCare, Inc. In May 2006, Mr. Johnston was elected to the Supervisory Board of Fresenius Medical Care AG & Co. KGaA, after its acquisition of Renal Care Group, Inc. in March 2006. Mr. Johnston joined Renal Care Group in November 2002 as a member of the Board of Directors and served as Chairman of the Board from March 2003 through March 2006. From 2002 through 2013, Mr. Johnston served as a Board member of the Georgia O’Keefe Museum. From September 1987 to December 2002, Mr. Johnston was with Equitable Securities Corporation (and its successors, SunTrust Equitable Securities and SunTrust Robinson Humphrey) serving in various investment banking and managerial positions, including Managing Director and Head of Investment Banking, Chief Executive Officer and Vice Chairman.
Phillip O. Peterson (1944) Director since 2002 (MF) and 2000 (MF2), Chairman of the Audit Committee since 2002
Mr. Peterson is a mutual fund industry consultant. He was a partner of KPMG LLP (an accounting firm) until July 1999. Mr. Peterson joined William Blair Funds in February 2007 as a member of the Board of Trustees. From February 2012 to February 2014, Mr. Peterson served as a Trustee of Symetra Variable Mutual Funds. From January 2004 to April 2005, Mr. Peterson served as Independent President of the Strong Mutual Funds.
Lemma W. Senbet (1946) Director since 2005
Dr. Senbet is the William E. Mayer Chair Professor of Finance and Founding Director, Center for Financial Policy, at the University of Maryland, Robert H. Smith School of Business. He was chair of the Finance Department of the University of Maryland, Robert H. Smith School of Business from 1998 to 2006. Since June 2013, he has been on leave from the University to serve as Executive Director of African Economic Research Consortium which focuses on economic policy research and training. Previously, he was a chaired professor of finance at the University of Wisconsin-Madison. Also, he was a Director of the Fortis Funds from March 2000 to July 2002. Dr. Senbet served as Director of the American Finance Association and President of the Western Finance Association. In 2006, Dr. Senbet was inducted Fellow of Financial Management Association International for his career-long distinguished scholarship and professional service.
Interested Directors and Officers
James E. Davey (1964) Director since 2012, President and Chief Executive Officer since 2010
Mr. Davey serves as Executive Vice President of Hartford Life Insurance Company (“HLIC”) and The Hartford. Additionally, Mr. Davey serves as Chairman of the Board, Manager and Senior Managing Director of Hartford Funds Distributors, LLC (“HFD”). He also currently serves as Director, Chairman of the Board, President and Senior Managing Director of Hartford Administrative Services Company (“HASCO”). Mr. Davey also serves as Manager, Chairman of the Board and Senior Managing Director for Hartford Funds Management Company, LLC (“HFMC”) and Director, Chairman of the Board and Senior Managing Director for Hartford Funds Management Group, Inc. ("HFMG"). Mr. Davey has served in various positions within The Hartford and its subsidiaries in connection with the operation of the Hartford Funds. Mr. Davey joined The Hartford in 2002.
Lowndes A. Smith* (1939) Director since 1996 (MF) and 2002 (MF2)
Mr. Smith served as Vice Chairman of The Hartford from February 1997 to January 2002, as President and Chief Executive Officer of Hartford Life, Inc. from February 1997 to January 2002, and as President and Chief Operating Officer of The Hartford Life Insurance Companies from January 1989 to January 2002. Mr. Smith serves as a Director of White Mountains Insurance Group Ltd. (October 2003 to current); One Beacon Insurance (October 2006 to current); Symetra Financial (August 2007 to current) and is a Managing Director of Whittington Gray Associates (January 2007 to current).
* Mr. Smith resigned as a Director of MF, MF2, Hartford Series Fund, Inc. and Hartford HLS Series Fund II, Inc. and as a Trustee of The Hartford Alternative Strategies Fund effective September 17, 2014.
Other Officers
Mark A. Annoni (1964) Vice President, Controller and Treasurer since 2012
Mr. Annoni currently serves as the Assistant Vice President of HLIC (February 2004 to present) and Senior Vice President of HFMG (December 2013 to present). Mr. Annoni has served in various positions within The Hartford and its subsidiaries in connection with the operation of the Hartford Funds. Mr. Annoni joined The Hartford in 2001.
| 27 |
| The Hartford MidCap Value Fund |
Directors and Officers (Unaudited) – (continued)
Michael R. Dressen (1963) AML Compliance Officer since 2011
Mr. Dressen currently serves as Assistant Vice President of HLIC. He also serves as Chief Compliance Officer and AML Compliance Officer of HASCO and as AML Officer of HFD. Mr. Dressen has served in various positions within The Hartford and its subsidiaries in connection with the operation of the Hartford Funds.
Edward P. Macdonald (1967) Vice President, Secretary and Chief Legal Officer since 2005
Mr. Macdonald currently serves as Assistant Secretary, Executive Vice President and Deputy General Counsel of HFD, HASCO, HFMC and HFMG. He also serves as Vice President of HLIC. Mr. Macdonald has served in various positions within The Hartford and its subsidiaries in connection with the operation of the Hartford Funds. Mr. Macdonald joined The Hartford in 2005.
Joseph G. Melcher (1973) Vice President and Chief Compliance Officer since 2013
Mr. Melcher currently serves as Executive Vice President of HFD, HFMG and HASCO. Mr. Melcher also currently serves as Executive Vice President and Chief Compliance Officer of HFMC. Mr. Melcher has served in various positions within The Hartford and its subsidiaries in connection with the operation of the Hartford Funds since joining The Hartford in 2012. Prior to joining The Hartford, Mr. Melcher worked at Touchstone Investments, a member of the Western & Southern Financial Group, where he held the position of Vice President and Chief Compliance Officer from 2010 through 2012 and Assistant Vice President, Compliance from 2005 to 2010.
Vernon J. Meyer (1964) Vice President since 2006
Mr. Meyer currently serves as Senior Vice President of HLIC. He also currently serves as Managing Director and Chief Investment Officer of HFMC and Managing Director of HFMG. Mr. Meyer has served in various positions within The Hartford and its subsidiaries in connection with the operation of the Hartford Funds. Mr. Meyer joined The Hartford in 2004.
Laura S. Quade (1969) Vice President since 2012
Ms. Quade currently serves as Vice President of HASCO, HFD and HFMG. She is the Head of Operations of HASCO and formerly served as Director, Enterprise Operations of HLIC. Ms. Quade has served in various positions within The Hartford and its subsidiaries in connection with the operation of the Hartford Funds. Ms. Quade joined The Hartford in 2001.
Martin A. Swanson** (1962) Vice President since 2010
Mr. Swanson currently serves as Vice President of HLIC. Mr. Swanson also serves as Managing Director, Chief Marketing Officer and Principal of HFD and Managing Director of HFMG. Mr. Swanson has served in various positions within The Hartford and its subsidiaries in connection with the operation of the Hartford Funds.
** Mr. Swanson resigned as an officer effective November 6, 2014.
HOW TO OBTAIN A COPY OF THE FUND’S PROXY VOTING POLICIES AND VOTING RECORDS (UNAUDITED)
A description of the policies and procedures that the Fund uses to determine how to vote proxies relating to portfolio securities and information about how the Fund voted proxies relating to portfolio securities during the most recent twelve-month period ended June 30 are available (1) without charge, upon request, by calling 888-843-7824 and (2) on the SEC’s website at http://www.sec.gov.
QUARTERLY PORTFOLIO HOLDINGS INFORMATION (UNAUDITED)
The Fund files a complete schedule of portfolio holdings with the SEC for the first and third quarters of each fiscal year on Form N-Q. The Fund’s Forms N-Q are available (1) without charge, upon request, by calling 888-843-7824 and (2) on the SEC’s website at http://www.sec.gov. The Form N-Q may be reviewed and copied at the SEC’s Public Reference Room in Washington, DC. Information on the operation of the Public Reference Room may be obtained by calling 1-800-SEC-0330.
| 28 |
| The Hartford MidCap Value Fund |
Federal Tax Information (Unaudited)
For the fiscal year ended October 31, 2014, there is no further federal tax information required for this Fund.
| 29 |
| The Hartford MidCap Value Fund |
Expense Example (Unaudited)
Your Fund's Expenses
As a shareholder of the Fund, you incur two types of costs: (1) transaction costs, including sales charges (loads) on purchase payments, if any, and contingent deferred sales charges (CDSC), if any, and (2) ongoing costs, including investment management fees, distribution and/or service (12b-1) fees, if any, and other fund expenses. This example is intended to help you understand your ongoing costs (in dollars) of investing in the Fund and to compare these costs with the ongoing costs of investing in other mutual funds. The example is based on an investment of $1,000 invested at the beginning of the period and held for the entire period of April 30, 2014 through October 31, 2014.
Actual Expenses
The first set of columns of the table below provides information about actual account values and actual expenses. You may use the information in this column, together with the amount you invested, to estimate the expenses that you paid over the period. Simply divide your account value by $1,000 (for example, an $8,600 account value divided by $1,000 = 8.6), then multiply the result by the number in the line under the heading entitled “Expenses Paid During Period” to estimate the expenses you paid on your account during this period.
Hypothetical Example for Comparison Purposes
The second set of columns of the table below provides information about hypothetical account values and hypothetical expenses based on the Fund's actual expense ratio and an assumed rate of return of 5% per year before expenses, which is not the Fund's actual return. The hypothetical account values and expenses may not be used to estimate the actual ending account balance or expenses you paid for the period. You may use this information to compare the ongoing costs of investing in the Fund and other funds. To do so, compare this 5% hypothetical example with the 5% hypothetical examples that appear in the shareholder reports of the other funds.
Please note that the expenses shown in the table are meant to highlight your ongoing costs only and do not reflect any transactional costs, such as sales charges (loads) and CDSC. Therefore, the second set of columns of the table is useful in comparing ongoing costs only, and will not help you determine the relative total costs of owning different funds. In addition, if these transactional costs were included, your costs would be higher. Expenses are equal to the Fund's annualized expense ratios multiplied by average account value over the period, multiplied by 184/365 (to reflect the one-half year period).
| Actual return | Hypothetical (5% return before expenses) | |||||||||||||||||||||||||||||||||||
| Beginning Account Value April 30, 2014 | Ending
Account Value October 31, 2014 | Expenses
paid during the period April 30, 2014 through October 31, 2014 | Beginning Account Value April 30, 2014 | Ending
Account Value October 31, 2014 | Expenses
paid during the period April 30, 2014 through October 31, 2014 | Annualized expense ratio | Days in the current 1/2 year | Days in the full year | ||||||||||||||||||||||||||||
| Class A | $ | 1,000.00 | $ | 1,025.80 | $ | 6.46 | $ | 1,000.00 | $ | 1,018.83 | $ | 6.43 | 1.26 | % | 184 | 365 | ||||||||||||||||||||
| Class B | $ | 1,000.00 | $ | 1,021.90 | $ | 10.70 | $ | 1,000.00 | $ | 1,014.62 | $ | 10.66 | 2.10 | 184 | 365 | |||||||||||||||||||||
| Class C | $ | 1,000.00 | $ | 1,022.00 | $ | 10.13 | $ | 1,000.00 | $ | 1,015.19 | $ | 10.09 | 1.99 | 184 | 365 | |||||||||||||||||||||
| Class I | $ | 1,000.00 | $ | 1,028.10 | $ | 4.71 | $ | 1,000.00 | $ | 1,020.56 | $ | 4.70 | 0.92 | 184 | 365 | |||||||||||||||||||||
| Class R3 | $ | 1,000.00 | $ | 1,024.70 | $ | 7.82 | $ | 1,000.00 | $ | 1,017.48 | $ | 7.80 | 1.53 | 184 | 365 | |||||||||||||||||||||
| Class R4 | $ | 1,000.00 | $ | 1,026.20 | $ | 6.27 | $ | 1,000.00 | $ | 1,019.02 | $ | 6.24 | 1.23 | 184 | 365 | |||||||||||||||||||||
| Class R5 | $ | 1,000.00 | $ | 1,027.80 | $ | 4.77 | $ | 1,000.00 | $ | 1,020.50 | $ | 4.75 | 0.93 | 184 | 365 | |||||||||||||||||||||
| Class Y | $ | 1,000.00 | $ | 1,027.70 | $ | 4.21 | $ | 1,000.00 | $ | 1,021.05 | $ | 4.19 | 0.82 | 184 | 365 | |||||||||||||||||||||
| 30 |
| The Hartford MidCap Value Fund |
Approval of Investment Management and Investment Sub-Advisory Agreements (Unaudited)
Section 15(c) of the Investment Company Act of 1940, as amended (the “1940 Act”), requires that each mutual fund’s board of directors, including a majority of those directors who are not “interested persons” of the mutual fund, as defined in the 1940 Act (the “Independent Directors”), annually review and consider the continuation of the mutual fund’s investment advisory and sub-advisory agreements. At its meeting held on August 5-6, 2014, the Board of Directors (the “Board”) of The Hartford Mutual Funds, Inc., including each of the Independent Directors, unanimously voted to approve the continuation of the investment management agreement for The Hartford MidCap Value Fund (the “Fund”) with Hartford Funds Management Company, LLC (“HFMC”) and the continuation of the investment sub-advisory agreement between HFMC and the Fund’s sub-adviser, Wellington Management Company, LLP (the “Sub-adviser,” and together with HFMC, the “Advisers”) (collectively, the “Agreements”).
In the months preceding the August 5-6, 2014 meeting, the Board requested, received and reviewed written responses from the Advisers to questions posed to them on behalf of the Independent Directors and supporting materials relating to those questions and responses. The Board considered information furnished to the Board at its meetings throughout the year, as well as information specifically prepared in connection with the annual approval of the Agreements at the Board’s meetings held on June 17-18, 2014 and August 5-6, 2014. Information provided to the Board at its meetings throughout the year included, among other things, reports on Fund performance, legal and compliance matters, sales and marketing activity, shareholder services, and the other services provided to the Fund by the Advisers and their affiliates. The Board also received in-person presentations by Fund officers and representatives of HFMC at the Board’s meetings on June 17-18, 2014 and August 5-6, 2014 concerning the Agreements.
The Independent Directors, advised by independent legal counsel, engaged service providers to assist them with evaluating the Agreements with respect to the Fund. Lipper Inc. (“Lipper”), an independent provider of investment company data, was retained to provide the Board with reports on how the Fund’s contractual management fees, actual management fees, other non-management fees, overall expense ratios and investment performance compared to those of mutual funds with similar investment objectives. The Independent Directors also engaged an independent financial services consultant (the “Consultant”) to assist them in evaluating the Fund’s management fees, sub-advisory fees, other non-management fees, overall expense ratios and investment performance. In addition, the Consultant reviewed the profitability calculations utilized by HFMC in connection with the continuation of the investment management agreement.
In determining whether to continue the Agreements for the Fund, the members of the Board reviewed and evaluated information and factors they believed to be relevant and appropriate in light of the information that the Board deemed necessary and appropriate through the exercise of its reasonable business judgment. While individual members of the Board may have weighed certain factors differently, the Board’s determination to continue the Agreements was based on a comprehensive consideration of all information provided to the Board throughout the year and specifically with respect to the continuation of the Agreements. A more detailed discussion of the factors the Board considered with respect to its approval of the Agreements is provided below.
Nature, Extent and Quality of Services Provided by the Advisers
The Board requested and considered information concerning the nature, extent and quality of the services provided to the Fund by the Advisers. The Board considered, among other things, the terms of the Agreements and the range of services provided by the Advisers. The Board considered the Advisers’ professional personnel who provide services to the Fund, including each Adviser’s ability and experience in attracting and retaining qualified personnel to service the Fund. The Board considered each Adviser’s reputation and overall financial strength, as well as its willingness to consider and implement organizational and operational changes designed to enhance services to the Hartford Funds. In addition, the Board considered the quality of each Adviser’s communications with the Board and responsiveness to Board inquiries and requests made from time to time with respect to the Fund and other Hartford Funds.
The Board also requested and evaluated information concerning each Adviser’s regulatory and compliance environment. In this regard, the Board requested and reviewed information on each Adviser’s compliance policies and procedures, compliance history, and a report from the Fund’s Chief Compliance Officer on each Adviser’s compliance with applicable laws and regulations, including responses to regulatory developments and compliance issues raised by regulators. The Board also noted the Advisers’ support of the Fund’s compliance control structure, particularly the resources devoted by the Advisers in support of the Fund’s obligations pursuant to Rule 38a-1 under the 1940 Act.
With respect to HFMC, the Board noted that, under the Agreements, HFMC is responsible for the management of the Fund, including oversight of fund operations and service providers, and provides administrative and investment advisory services in connection with selecting, monitoring and supervising the Sub-adviser. The Board considered HFMC’s ongoing monitoring of people, process and performance, including its quarterly reviews of each of the Hartford Funds, semi-annual meetings with the leaders of each Fund’s portfolio management team, and oversight of the Hartford Funds’ approximately 66 portfolio managers. The Board recognized that HFMC has demonstrated a record of making changes to the
| 31 |
| The Hartford MidCap Value Fund |
Approval of Investment Management and Investment Sub-Advisory Agreements (Unaudited) – (continued)
management and/or strategies of the Hartford Funds when warranted. The Board considered HFMC’s oversight of the Sub-adviser’s investment approach and results, process for monitoring best execution of portfolio trades by the Sub-adviser, and approach to risk management with respect to the Fund and the service providers to the Fund. The Board also considered HFMC’s oversight of compliance with the Fund’s objective and policies as well as with applicable laws and regulations, noting that regulatory and other developments had over time led to an increase in the scope of HFMC’s services in this regard.
In addition, the Board considered HFMC’s ongoing commitment to review and rationalize the Hartford Funds product line-up and the expenses that HFMC had incurred in connection with fund combinations in recent years. The Board considered that HFMC or its affiliates are responsible for providing the Fund’s officers.
With respect to the Sub-adviser, which provides certain day-to-day portfolio management services for the Fund, the Board considered the quality of the Fund’s portfolio manager, the Sub-adviser’s other investment personnel, its investment philosophy and process, investment research capabilities and resources, performance record, trade execution capabilities and experience. The Board considered the experience of the Fund’s portfolio manager, the number of accounts managed by the portfolio manager, and the Sub-adviser’s method for compensating the portfolio manager.
Based on these considerations, the Board concluded that it was satisfied with the nature, extent and quality of the services provided to the Fund by HFMC and the Sub-adviser.
Performance of the Fund and the Advisers
The Board considered the investment performance of the Fund. In this regard, the Board reviewed the performance of the Fund over different time periods presented in the materials and evaluated HFMC’s analysis of the Fund’s performance for these time periods. The Board considered information and materials provided to the Board by the Advisers concerning Fund performance, as well as information from Lipper comparing the investment performance of the Fund to an appropriate benchmark and universe of peer funds. The Board noted that the Fund’s performance was in the 2nd quintile of its performance universe for the 1- and 5-year periods and the 3rd quintile for the 3-year period. The Board also noted that the Fund’s performance was above its benchmark for the 1-, 3- and 5-year periods.
The Board considered the detailed investment analytics reports provided by Hartford Funds’ Investment Advisory Group throughout the year. These reports include, among other things, information on the Fund’s gross and net returns, the Fund’s investment performance relative to an appropriate benchmark and peer group, various statistics concerning the Fund’s portfolio, and a narrative summary of various factors affecting Fund performance. The Board considered the Advisers’ cooperation with the Investment Committee, which assists the Board in evaluating the performance of the Fund at periodic meetings throughout the year. The Board also considered the analysis provided by the Consultant relating to the Fund’s performance track record.
In light of all the considerations noted above, the Board concluded that it had continued confidence in HFMC’s and the Sub-adviser’s overall capabilities to manage the Fund.
Costs of the Services and Profitability of the Advisers
The Board reviewed information regarding HFMC’s cost to provide investment management and related services to the Fund and HFMC’s profitability, both overall and for the Fund, on a pre-tax basis without regard to distribution expenses. The Board also requested and reviewed information about the profitability to HFMC and its affiliates from all services provided to the Fund and all aspects of their relationship with the Fund. The Board also requested and received information relating to the operations and profitability of the Sub-adviser.
The Board considered the Consultant’s review of the profitability calculations used by HFMC in connection with the continuation of the investment management agreement, noting the Consultant’s view that Hartford Funds’ process for calculating and reporting Fund profitability is reasonable. In this regard, the Board noted that the Consultant performed a full review of this process in light of the recent restructuring of the Hartford Funds business and reported that the approach to analyzing Fund profitability, including the use of common expense allocation methodologies, is reasonable, sound and well within common industry practice.
Based on these considerations, the Board concluded that the profits anticipated to be realized by the Advisers and their affiliates from their relationships with the Fund would not be excessive.
| 32 |
| The Hartford MidCap Value Fund |
Approval of Investment Management and Investment Sub-Advisory Agreements (Unaudited) – (continued)
Comparison of Fees and Services Provided by the Advisers
The Board considered comparative information with respect to the management fees to be paid by the Fund to HFMC and the total expense ratios of the Fund. The Board also considered comparative information with respect to the sub-advisory fees to be paid by HFMC to the Sub-adviser. In this regard, the Board requested and reviewed information from HFMC and the Sub-adviser relating to the management and sub-advisory fees, including the sub-advisory fee schedule for the Fund, and total operating expenses for the Fund. With respect to the sub-advisory fee schedule, the Board considered representations from HFMC and the Sub-adviser that the Sub-adviser’s fees were negotiated at arm’s length on a fund-by-fund basis and that certain factors were identified by HFMC as having had a potential impact on the negotiation of the Fund’s sub-advisory fee levels. The Board also reviewed information from Lipper comparing the Fund’s contractual management fees, actual management fees and overall expense ratios relative to a group of funds selected by Lipper, in consultation with the Consultant, and a broader universe of funds selected by Lipper. The Board considered that the Fund’s contractual management fee and actual management fee were in the 3rd quintile of its expense group, while its total expenses (less 12b-1 and shareholder service fees) were in the 5th quintile. The Board noted that the Fund has an automatically renewable contractual expense cap on each share class. The expense cap resulted in reimbursement of certain expenses incurred in 2013.
While the Board recognized that comparisons between the Fund and peer funds may be imprecise, given the different service levels and characteristics of mutual funds and the different business models and cost structures of the Advisers, the comparative information provided by Lipper assisted the Board in evaluating the reasonableness of the Fund’s management and sub-advisory fees and total operating expenses. In addition, the Board considered the analysis and recommendations of the Consultant relating to the Fund’s management and sub-advisory fees and total operating expenses.
Based on these considerations, the Board concluded that the Fund’s fees and total operating expenses, in conjunction with the information about quality of services, profitability, economies of scale, and other matters discussed, were reasonable in light of the services provided.
Economies of Scale
The Board requested and considered information regarding the Advisers’ realization of economies of scale with respect to the Fund and whether the fee levels reflect these economies of scale for the benefit of the Fund’s shareholders. The Board reviewed the breakpoints in the management fee schedule for the Fund, which reduce fee rates as Fund assets grow over time. The Board recognized that a fund with assets beyond the highest breakpoint level will continue to benefit from economies of scale because additional assets are charged the lowest breakpoint fee resulting in lower overall effective management fee rates. The Board also considered that expense limitations and fee waivers that reduce the Fund’s expenses at all asset levels can have the same effect as breakpoints in sharing economies of scale with shareholders and provide protection from an increase in expenses if Fund assets decline. The Board recognized that a fee schedule that reaches a lower breakpoint quickly provides shareholders with the benefit of anticipated or potential economies of scale. The Board also considered that HFMC has been active in managing expenses, which has resulted in benefits being realized by shareholders as assets within the Hartford Funds family of funds have grown over time, including through lower transfer agent costs and other operating expenses.
The Board reviewed and evaluated materials from Lipper and the Consultant showing how management fee schedules of peer funds reflect economies of scale for the benefit of shareholders as a peer fund’s assets hypothetically increase over time. Based on information provided by HFMC, Lipper, and the Consultant, the Board recognized that there is no uniform methodology for establishing breakpoints or uniform pattern in asset levels that trigger breakpoints or the amounts of breakpoints triggered.
After considering all of the information available to it, the Board concluded that it was satisfied with the extent to which economies of scale would be shared for the benefit of the Fund’s shareholders based on currently available information and the effective advisory fees and expense ratios for the Fund at its current and reasonably anticipated asset levels. The Board noted, however, that it would continue to monitor future growth in Fund assets and the appropriateness of additional breakpoints.
Other Benefits
The Board considered other benefits to the Advisers and their affiliates from their relationships with the Fund.
The Board noted that HFMC receives fees for fund accounting and related services from the Fund, and the Board considered information on profits to HFMC for such services. The Board also considered that Hartford Administrative Services Company (“HASCO”), the Fund’s transfer agent and an affiliate of HFMC, receives transfer agency compensation from the Fund, and the Board reviewed information on the profitability of
| 33 |
| The Hartford MidCap Value Fund |
Approval of Investment Management and Investment Sub-Advisory Agreements (Unaudited) – (continued)
the Fund’s transfer agency function to HASCO. The Board considered information provided by HASCO indicating that the transfer agent fees charged by HASCO to the Fund were fair and reasonable based on publicly available information.
The Board also considered that Hartford Funds Distributors, LLC (“HFD”), an affiliate of HFMC, serves as principal underwriter of the Fund. As principal underwriter, HFD receives 12b-1 fees from the Fund and receives all or a portion of the sales charges on sales or redemptions of certain classes of shares. The Board also noted that certain affiliates of HFD distribute shares of the Fund and receive compensation in that connection.
The Board considered benefits to the Sub-adviser from its use of the Fund’s brokerage commissions to obtain soft dollar research, and representations from HFMC and the Sub-adviser that the Sub-adviser would not make any revenue-sharing payments or any other type of distribution payments to HFMC or its affiliates.
The Board considered the benefits to shareholders of being part of the Hartford Funds family of funds, including the right to exchange investments between the same class of funds without a sales charge, the ability to reinvest Fund dividends into other funds in the family, and the ability to combine holdings in the Fund with holdings in other funds to obtain a reduced sales charge. The Board considered HFMC’s efforts to provide investors in the family with a broad range of investment styles and asset classes and its entrepreneurial risk in initiating new funds to expand these opportunities for shareholders.
* * * *
Based upon its review of these various factors, among others, the Board concluded that it is in the best interests of the Fund and its shareholders for the Board to approve the Agreements for an additional year. In reaching this decision, the Board did not assign relative weights to the factors discussed above or deem any one or group of them to be controlling in and of themselves. In connection with their deliberations, the Independent Directors met separately in executive session on several occasions, with independent legal counsel and the Consultant, to review the relevant materials and consider their responsibilities under relevant laws and regulations.
| 34 |
| The Hartford MidCap Value Fund |
Main Risks (Unaudited)
The main risks of investing in the Fund are described below.
Market, Selection and Strategy Risk: The Fund’s share price may fluctuate due to market risk and/or security selections that may underperform the market or relevant benchmarks. If the sub-adviser's investment strategy does not perform as expected, the Fund could underperform its peers or lose money. There is no guarantee the Fund will achieve its stated objective.
Mid-Cap Stock Risk: Mid-cap stocks are generally more volatile and risky and may be less liquid than large-cap stocks because they may have limited operating histories, narrow product lines, and focus on niche markets.
Value Investing Risk: Value investments are considered to be undervalued, but they may never attain their potential value. Value-style investing falls in and out of favor, which may result in periods of underperformance.
Foreign Investment Risk: Investments in foreign securities may be riskier than investments in U.S. securities. Potential risks include the risks of illiquidity, increased price volatility, less government regulation, less extensive and less frequent accounting and other reporting requirements, unfavorable changes in currency exchange rates, and economic and political disruptions.
| 35 |
THIS PRIVACY POLICY IS NOT PART OF THIS REPORT
Privacy Policy and Practices of The Hartford Financial Services Group, Inc. and its Affiliates
(herein called “we, our and us”)
This Privacy Policy applies to our United States Operations
|
We value your trust. We are committed to the responsible: a) management; b) use; and c) protection; of Personal Information.
This notice describes how we collect, disclose, and protect Personal Information.
We collect Personal Information to: a) service your Transactions with us; and b) support our business functions.
We may obtain Personal Information from: a) You; b) your Transactions with us; and c) third parties such as a consumer-reporting agency.
Based on the type of product or service You apply for or get from us, Personal Information such as: a) your name; b) your address; c) your income; d) your payment; or e) your credit history; may be gathered from sources such as applications, Transactions, and consumer reports.
To serve You and service our business, we may share certain Personal Information. We will share Personal Information, only as allowed by law, with affiliates such as: a) our insurance companies; b) our employee agents; c) our brokerage firms; and d) our administrators.
As allowed by law, we may share Personal Financial Information with our affiliates to: a) market our products; or b) market our services; to You without providing You with an option to prevent these disclosures.
|
We may also share Personal Information, only as allowed by law, with unaffiliated third parties including: a) independent agents; b) brokerage firms; c) insurance companies; d) administrators; and e) service providers; who help us serve You and service our business.
When allowed by law, we may share certain Personal Financial Information with other unaffiliated third parties who assist us by performing services or functions such as: a) taking surveys; b) marketing our products or services; or c) offering financial products or services under a joint agreement between us and one or more financial institutions.
We, and third parties we partner with, may track some of the pages You visit through the use of: a) cookies; b) pixel tagging; or c) other technologies; and currently do not process or comply with any web browser’s “do not track” signal or similar mechanism that indicates a request to disable online tracking of individual users who visit our websites or use our services.
We will not sell or share your Personal Financial Information with anyone for purposes unrelated to our business functions without offering You the opportunity to: a) “opt-out;” or b) “opt-in;” as required by law.
We only disclose Personal Health Information with: a) your proper written authorization; or b) as otherwise allowed or required by law.
Our employees have access to Personal Information in the course of doing their jobs, such as: a) underwriting policies; b) paying claims; c) developing new products; or d) advising customers of our products and services. |
|
We use manual and electronic security procedures to maintain: a) the confidentiality; and b) the integrity of; Personal Information that we have. We use these procedures to guard against unauthorized access.
Some techniques we use to protect Personal Information include: a) secured files; b) user authentication; c) encryption; d) firewall technology; and e) the use of detection software.
We are responsible for and must: a) identify information to be protected; b) provide an adequate level of protection for that data; c) grant access to protected data only to those people who must use it in the performance of their job-related duties.
Employees who violate our Privacy Policy will be subject to discipline, which may include ending their employment with us.
At the start of our business relationship, we will give You a copy of our current Privacy Policy.
We will also give You a copy of our current Privacy Policy once a year if You maintain a continuing business relationship with us.
We will continue to follow our Privacy Policy regarding Personal Information even when a business relationship no longer exists between us.
|
As used in this Privacy Notice:
Application means your request for our product or service.
Personal Financial Information means financial information such as: a) credit history; b) income; c) financial benefits; or d) policy or claim information.
Personal Health Information means health information such as: a) your medical records; or b) information about your illness, disability or injury.
Personal Information means information that identifies You personally and is not otherwise available to the public. It includes: a) Personal Financial Information; and b) Personal Health Information.
Transaction means your business dealings with us, such as: a) your Application; b) your request for us to pay a claim; and c) your request for us to take an action on your account.
You means an individual who has given us Personal Information in conjunction with: a) asking about; b) applying for; or c) obtaining; a financial product or service from us if the product or service is used mainly for personal, family, or household purposes. |
This Privacy Policy is being provided on behalf of the following affiliates of The Hartford Financial Services Group, Inc.:
1stAGChoice, Inc.; Access CoverageCorp, Inc.; Access CoverageCorp Technologies, Inc.; American Maturity Life Insurance Company; Archway 60 R, LLC; Business Management Group, Inc.; Champlain Life Reinsurance Company; DMS R, LLC; Eloy R, LLC; Ersatz Corporation; First State Insurance Company; Hartford Accident and Indemnity Company; Hartford Administrative Services Company; Hartford Casualty General Agency, Inc.; Hartford Casualty Insurance Company; Hartford-Comprehensive Employee Benefit Service Company; Hartford Equity Sales Company, Inc.; Hartford Fire General Agency, Inc.; Hartford Fire Insurance Company; Hartford Funds Management Company, LLC; Hartford Funds Management Group, Inc.; Hartford HLS Series Fund II, Inc.; Hartford Insurance Company of Illinois; Hartford Insurance Company of the Midwest; Hartford Insurance Company of the Southeast; Hartford Integrated Technologies, Inc.; Hartford International Life Reassurance Corporation; Hartford Funds Distributors, LLC; Hartford Investment Management Company; Hartford Life and Accident Insurance Company; Hartford Life and Annuity Insurance Company; Hartford Life Insurance Company; Hartford Life Private Placement, LLC; Hartford Lloyd’s Corporation; Hartford Lloyd’s Insurance Company; Hartford Mezzanine Investors I, LLC; Hartford Residual Market, L.C.C.; Hartford Retirement Services, LLC; Hartford Securities Distribution Company, Inc.; Hartford Series Fund, Inc.; Hartford Specialty Insurance Services of Texas, LLC; Hartford Strategic Investments, LLC; Hartford Underwriters Insurance Company; Hartford Technology Services Company, L.L.C.; Hartford of Texas General Agency, Inc.; Hartford Underwriters General Agency, Inc.; HARTRE Company, L.C.C.; HL Investment Advisors, LLC; HLA LLC; Horizon Management Group, LLC; HRA Brokerage Services, Inc.; Lanidex Class B, LLC; M-CAP Insurance Agency, LLC; New England Insurance Company; New England Reinsurance Corporation; Nutmeg Insurance Agency, Inc.; Nutmeg Insurance Company; Pacific Insurance Company, Limited; Planco, LLC: Property and Casualty Insurance Company of Hartford; Revere R, LLC; RVR R, LLC; Sentinel Insurance Company, Ltd.; Sunstone R, LLC; Symphony R, LLC; The Evergreen Group Incorporated; The Hartford Alternative Strategies Fund; The Hartford Mutual Funds, Inc.; The Hartford Mutual Funds II, Inc.; Trumbull Flood Management, L.L.C.; Trumbull Insurance Company; Twin City Fire Insurance Company; White River Life Reinsurance Company.
HPP Revised January 2014
HARTFORDFUNDS
hartfordfunds.com
This information is written in connection with the promotion or marketing of the matter(s) addressed in this material.
This report is submitted for the general information of the shareholders of the Fund. It is not authorized for distribution unless preceded or accompanied by a current prospectus for the Fund.
The information cannot be used or relied upon for the purpose of avoiding IRS penalties. These materials are not intended to provide tax, accounting or legal advice. As with all matters of a tax or legal nature, you should consult your own tax or legal counsel for advice.
Investors should carefully consider the investment objectives, risks, charges, and expenses of Hartford Funds before investing. This and other information can be found in the prospectus and summary prospectus, which can be obtained by calling 888-843-7824 (retail) or 800-279-1541 (institutional). Investors should read them carefully before they invest.
Hartford Funds are underwritten and distributed by Hartford Funds Distributors, LLC.
MFAR-MCV14 12/14 113992-3 Printed in U.S.A.
HARTFORDFUNDS
|
HARTFORD MODERATE ALLOCATION FUND*
2014 Annual Report
* Prior to May 30, 2014, Hartford Moderate Allocation Fund was known as The Hartford Balanced Allocation Fund. |
A MESSAGE FROM THE PRESIDENT
Dear Fellow Shareholders:
Thank you for investing in Hartford Funds.
Market Review
U.S. equities (as represented by the S&P 500 Index) rose steadily for the fiscal year ended October 31, 2014, with a return of 17.27% for the period. With the exception of short-lived geopolitical scares early in 2014 and concerns about continuing global growth near the end of the period, stocks generally rose on solid fundamentals and encouraging macroeconomic data during the year.
September 2014 marked the six-year anniversary of the start of the financial crisis. Within weeks of that anniversary, both the S&P 500 Index and the Dow Jones Industrial Average set new all-time highs, closing at 2,018 and 17,391, respectively, on October 31. Although the fallout of the crisis continues to influence investor behavior, stocks have recovered and risen dramatically, up 198% from their low in March 2009. Meanwhile, the domestic economy is notching strong growth, and the unemployment rate has reached its lowest level since August 2008.
While the U.S. economy appears to have stabilized and to have reverted to a solid growth path, the outlook for the global economy appears to have gotten cloudier. The U.S. Federal Reserve has ended quantitative easing, while Europe and Japan are pursuing stimulus options to avoid a double-dip recession and deflation, respectively. Diverging central-bank policies will likely continue to play an important role in market movements going forward as investors wait to see the reactions to their efforts and their impacts on global markets.
How have market movements impacted your portfolio throughout the last year? Are your investments still on track to provide the growth or income you need, and are you comfortable with their progress during times of volatility?
Your financial professional can help you navigate today’s markets with confidence, as well as assist you to achieve your investment goals by providing advice on the best options within our fund family to help you work toward overcoming today’s investing challenges. Meet with your financial advisor regularly to examine your portfolio and your investment strategy, and to determine if you’re still on track to meet your goals.
Thank you again for investing with Hartford Funds.
James Davey
President
Hartford Funds
1 The S&P 500 Index is a market capitalization-weighted price index composed of 500 widely held common stocks.
2 The Dow Jones Industrial Average is an unmanaged, price-weighted index of 30 of the largest, most widely held stocks traded on the NYSE
Hartford Moderate Allocation Fund
Table of Contents
The views expressed in the Fund’s Manager Discussion under ‘‘Why did the Fund perform this way?’’ and ‘‘What is the outlook?’’ are views of the Fund’s sub-adviser and portfolio management team through the end of the period and are subject to change based on market and other conditions. The Fund’s Manager Discussion is for informational purposes only and does not represent an offer, recommendation or solicitation to buy, hold or sell any security. The specific securities identified and described, if any, do not represent all of the securities purchased or sold and you should not assume that investments in the securities identified and discussed will be profitable.
| Hartford Moderate Allocation Fund inception 05/28/2004 |
| (sub-advised by Wellington Management Company, LLP) |
| Investment objective – The Fund seeks long-term capital appreciation and income. |
Performance Overview 10/31/04 - 10/31/14
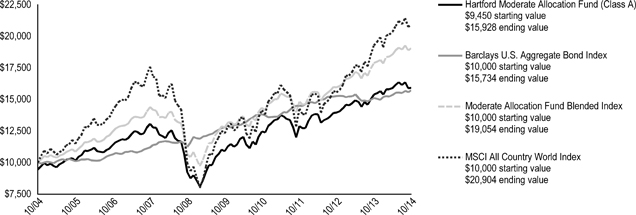
The chart above represents the hypothetical growth of a $10,000 investment in Class A, which includes a sales charge. Growth results in classes other than Class A will vary from what is seen above due to differences in the expenses charged to those share classes.
Average Annual Total Returns (as of 10/31/14)
| 1 Year | 5 Years | 10 Years | ||||||||||
| Moderate Allocation A# | 3.54 | % | 7.88 | % | 5.36 | % | ||||||
| Moderate Allocation A## | -2.16 | % | 6.67 | % | 4.76 | % | ||||||
| Moderate Allocation B# | 2.62 | % | 7.01 | % | 4.70 | %* | ||||||
| Moderate Allocation B## | -2.38 | % | 6.70 | % | 4.70 | %* | ||||||
| Moderate Allocation C# | 2.79 | % | 7.11 | % | 4.59 | % | ||||||
| Moderate Allocation C## | 1.79 | % | 7.11 | % | 4.59 | % | ||||||
| Moderate Allocation I# | 3.87 | % | 8.21 | % | 5.62 | % | ||||||
| Moderate Allocation R3# | 3.11 | % | 7.53 | % | 5.05 | % | ||||||
| Moderate Allocation R4# | 3.44 | % | 7.86 | % | 5.34 | % | ||||||
| Moderate Allocation R5# | 3.79 | % | 8.17 | % | 5.58 | % | ||||||
| Barclays U.S. Aggregate Bond Index | 4.14 | % | 4.22 | % | 4.64 | % | ||||||
| Moderate Allocation Fund Blended Index | 6.51 | % | 8.29 | % | 6.66 | % | ||||||
| MSCI All Country World Index | 8.32 | % | 11.15 | % | 7.65 | % | ||||||
| # | Without sales charge |
| ## | With sales charge |
| * | Class B shares convert to Class A shares after 8 years. The return shown reflects the conversion to Class A shares, which had different operating expenses, for the period after conversion. |
PERFORMANCE DATA QUOTED REPRESENTS PAST PERFORMANCE AND DOES NOT GUARANTEE FUTURE RESULTS. The investment return and principal value of the investment will fluctuate so that investors’ shares, when redeemed, may be worth more or less than their original cost. Current performance may be lower or higher than the performance data quoted. To obtain performance data current to the most recent month-end, please visit our website www.hartfordfunds.com.
The initial investment in Class A shares reflects the maximum sales charge of 5.50% and returns for Class B shares reflect a contingent deferred sales charge of up to 5.00% and declining to zero, depending on the period of time the shares are held. Returns for Class C shares reflect a contingent deferred sales charge of up to 1.00% on shares redeemed within twelve months of purchase.
Total returns presented above were calculated using the Fund’s net asset value available to shareholders for sale or redemption of Fund shares on October 31, 2014, which may exclude investment transactions as of this date. All share class returns assume the reinvestment of all distributions at net asset value and the deduction of all fund expenses.
Effective 9/30/09, Class B shares of the Fund were closed to new investments.
Class I shares commenced operations on 8/31/06. Performance prior to that date is that of the Fund’s Class A shares (excluding sales charges), which had different operating expenses. Class R3, R4 and R5 shares commenced operations on 12/22/06. Performance prior to that date is that of the Fund’s Class A shares (excluding sales charges), which had different operating expenses.
Performance information includes performance under the Fund’s previous sub-adviser, Hartford Investment Management Company, using a modified investment strategy. As of June 4, 2012, Hartford Investment Management Company no longer served as the sub-adviser to the Fund.
Barclays U.S. Aggregate Bond Index is an unmanaged index and is composed of securities from the Barclays Government/Credit Bond Index, Mortgage-Backed Securities Index, Asset-Backed Securities Index and Commercial Mortgage-Backed Securities Index.
Moderate Allocation Fund Blended Index is calculated by Hartford Funds Management Company, LLC and represents the weighted return of 45% Barclays U.S. Aggregate Bond Index and 55% MSCI All Country World Index.
MSCI All Country World Index is a free float-adjusted market capitalization index that measures equity market performance in the global developed and emerging markets, consisting of 45 developed and emerging market country indices.
You cannot invest directly in an index.
The chart and table do not reflect the deductions of taxes that a shareholder would pay on Fund distributions or the redemption of Fund shares.
Performance information may reflect historical or current expense waivers/reimbursements from the investment adviser, without which performance would have been lower. For information on current expense waivers/reimbursements, please see the prospectus.
| 2 |
| Hartford Moderate Allocation Fund |
| Manager Discussion |
| October 31, 2014 (Unaudited) |
| Operating Expenses* | ||||||||
| Net | Gross | |||||||
| Moderate Allocation Class A | 1.26 | % | 1.26 | % | ||||
| Moderate Allocation Class B | 2.08 | % | 2.08 | % | ||||
| Moderate Allocation Class C | 1.99 | % | 1.99 | % | ||||
| Moderate Allocation Class I | 0.95 | % | 0.95 | % | ||||
| Moderate Allocation Class R3 | 1.59 | % | 1.59 | % | ||||
| Moderate Allocation Class R4 | 1.29 | % | 1.29 | % | ||||
| Moderate Allocation Class R5 | 0.99 | % | 0.99 | % | ||||
| * | As shown in the Fund's current prospectus dated March 1, 2014. Actual expenses may be higher or lower. Expenses shown include expenses of the Underlying Funds. Please see accompanying Financial Highlights for expense ratios for the year ended October 31, 2014. |
Gross expenses are the Fund's total annual operating expenses shown in the Fund's most recent prospectus. Net expenses are the Fund's total annual operating expenses shown in the Fund's most recent prospectus and reflect contractual expense reimbursements in instances when these reductions reduce the Fund's gross expenses. Contractual reimbursements remain in effect until February 28, 2015, and automatically renew for one-year terms unless terminated.
All investments are subject to risk including the possible loss of principal. For a discussion of the Fund’s risks, please see the Main Risks section of this report. For more detailed information on the risks associated with an investment in the Fund, please see the prospectus.
| Portfolio Managers | |
| Richard P. Meagher, CFA | Wendy M. Cromwell, CFA |
| Vice President, Asset Allocation Strategist and Portfolio Manager | Senior Vice President, Director of Strategic Asset Allocation, Asset Allocation Strategies Group, and Portfolio Manager |
How did the Fund perform?
The Class A shares of the Hartford Moderate Allocation Fund returned 3.54%, before sales charge, for the twelve-month period ended October 31, 2014, underperforming the Fund’s blended benchmark, 45% Barclays U.S. Aggregate Bond Index and 55% MSCI All Country World Index, which returned 6.51% for the same period. In comparison, the Barclays U.S. Aggregate Bond Index and the MSCI All Country World Index returned 4.14% and 8.32%, respectively, for the same period. The Fund also underperformed the 6.93% average return of the Lipper Mixed-Asset Target Moderate Funds category, a group of funds with equity weights of 40%-60%.
Why did the Fund perform this way?
Fixed income markets gained throughout much of the period as expectations of prolonged easy monetary policy by major central banks and a supportive macroeconomic environment kept rates low and suppressed volatility. Early in the period emerging markets dominated headlines as economic and political developments sparked risk aversion across global markets, pushing bond prices higher and yields lower amid a flight to quality. Toward the end of the period, however, persistent geopolitical risks – tensions between Ukraine and Russia and violence in Iraq – and Chinese economic slowdown concerns raised questions about the global growth rate, keeping a lid on risk appetites overall.
The period was also highlighted by a divergence in central bank policies. The European Central Bank (ECB) cut its benchmark lending and deposit rates and announced a host of stimulus measures in an effort to encourage lending and fend off fears of deflation. China’s central bank joined the ECB in boosting liquidity by injecting funds into the nation’s largest banks in an attempt to combat weakening growth. The Bank of Japan pre-emptively announced incremental monetary easing to counter the risk of missing the country’s inflation and growth targets. In contrast, the Bank of England and U.S. Federal Reserve (Fed) leaned toward tighter policies. The Fed ended its quantitative easing program as U.S. data largely suggested the economy was on a sustainable growth path. In the U.S., second quarter Gross Domestic Product (GDP) rebounded after the first quarter’s steep contraction. The labor market strengthened as the unemployment rate dropped to a six-year low. Housing regained some lost ground after a weak start to the year, though the pace of home price appreciation started to slow after a strong 2013. Inflation pressures were muted overall, alleviating pressure on the Fed to raise rates.
The U.S. Treasury curve flattened as markets contemplated bringing interest rates to normal levels; short-term yields rose while longer term rates declined. Most credit risk sectors posted positive absolute returns and outperformed duration-equivalent government bonds as credit spreads tightened.
Global equities rose during the period, notwithstanding bouts of significant volatility. Despite ongoing geopolitical tensions in Ukraine and the Middle East, concerns about a Chinese growth slowdown, and unsettling economic and political developments in several other emerging market countries, the five-year-old bull market marched on in the first half of 2014. Robust merger and acquisition activity, along with continued accommodative monetary policy from central banks around the globe, aided positive investor sentiment in May and June. However, Portuguese banking woes, European economic malaise, and the prospect of an accelerated Fed interest-rate-hike timeline all contributed to stall the global stock rally near the tail end of the period. In addition, China's property slump and poor GDP readings in Japan and the Eurozone raised the specter of a slowdown in global economic growth. Nevertheless, there were several positive developments, including monetary easing by the ECB and the People's Bank of China, as well as an encouraging U.S. corporate earnings season. During the period, emerging market equities
| 3 |
| Hartford Moderate Allocation Fund |
| Manager Discussion – (continued) |
| October 31, 2014 (Unaudited) |
underperformed their developed market counterparts and U.S. stocks generally outperformed non-U.S. stocks.
There are two main drivers of Fund performance: the asset allocation among various asset classes and the performance of the underlying funds. Value added from Asset Allocation includes the value added by both the Fund’s strategic asset allocation across a diverse set of asset classes and how those allocations are implemented within the asset classes. With regard to the strategic allocation, the stock / bond mix of the Fund was approximately 55% equities and 45% fixed income during the period, in line with the Fund’s blended benchmark. Performance of the underlying funds measures the results of the underlying funds versus their respective benchmarks. The portfolio managers have control over the selection of the underlying funds.
In aggregate, asset allocation detracted from benchmark-relative performance. Exposure to inflation-sensitive assets, such as natural resource-related equities and TIPS, along with an overweight to non-U.S. and emerging markets equities detracted from relative performance. This was partially offset by exposure to global fixed income and high yield credit, which contributed on a relative basis.
Beyond asset class decisions, we seek to add value by selecting the underlying funds available in our investment universe using both quantitative and qualitative criteria. In aggregate, performance from the Underlying Funds (net of fees) detracted on a benchmark relative basis. Weak benchmark-relative performance in The Hartford Capital Appreciation Fund, Hartford Real Total Return Fund, and The Hartford Alternative Strategies Fund more than offsets strong benchmark-relative results from The Hartford Small Company Fund, The Hartford Strategic Income Fund, and The Hartford World Bond Fund. Derivatives are not utilized at the aggregate fund level but are utilized at the underlying fund level.
What is the outlook?
In our view, the global cycle continues to advance at a moderate pace with a mix of stronger growth in the U.S. and more sluggish activity in Europe, Japan, and China. We believe the U.S. economy is on track for a self-sustaining expansion. After three years of fiscal consolidation, it appears that this policy drag is starting to fade, which we believe should support growth. Meanwhile, investment spending appears to be picking up. The euro area and Japan are easing aggressively to help boost inflation and growth. We believe this environment should contribute to a stronger U.S. dollar. Additionally, we retain a constructive view on capital markets and risk assets. The Fund ended the period with an overweight to international equities and an underweight to both large cap U.S. equities and fixed income relative to the Fund’s blended benchmark.
Composition by Investments
as of October 31, 2014
| Fund Name | Percentage of Net Assets | |||
| Hartford Real Total Return Fund | 6.6 | % | ||
| The Hartford Alternative Strategies Fund | 3.4 | |||
| The Hartford Capital Appreciation Fund | 7.0 | |||
| The Hartford Dividend and Growth Fund | 12.7 | |||
| The Hartford Emerging Markets Research Fund | 5.5 | |||
| The Hartford Global Real Asset Fund | 6.9 | |||
| The Hartford Inflation Plus Fund | 12.9 | |||
| The Hartford International Growth Fund | 3.3 | |||
| The Hartford International Opportunities Fund | 6.6 | |||
| The Hartford International Small Company Fund | 4.5 | |||
| The Hartford International Value Fund | 3.3 | |||
| The Hartford MidCap Value Fund | 2.3 | |||
| The Hartford Small Company Fund | 2.3 | |||
| The Hartford Strategic Income Fund | 4.0 | |||
| The Hartford Total Return Bond Fund | 7.9 | |||
| The Hartford World Bond Fund | 10.8 | |||
| Other Assets and Liabilities | 0.0 | |||
| Total | 100.0 | % | ||
| 4 |
| Hartford Moderate Allocation Fund |
| Schedule of Investments |
| October 31, 2014 |
| (000’s Omitted) |
| Shares or Principal Amount | Market Value ╪ | |||||||||||
| Affiliated Investment Companies - 100.0% | ||||||||||||
| Alternative Strategy Funds - 16.9% | ||||||||||||
| 4,801 | Hartford Real Total Return Fund● | $ | 48,682 | |||||||||
| 2,620 | The Hartford Alternative Strategies Fund | 25,467 | ||||||||||
| 5,100 | The Hartford Global Real Asset Fund | 50,436 | ||||||||||
| 124,585 | ||||||||||||
| Total Alternative Strategy Funds | ||||||||||||
| (Cost $127,628) | $ | 124,585 | ||||||||||
| Domestic Equity Funds - 24.3% | ||||||||||||
| 950 | The Hartford Capital Appreciation Fund | $ | 51,431 | |||||||||
| 3,406 | The Hartford Dividend and Growth Fund | 93,653 | ||||||||||
| 939 | The Hartford MidCap Value Fund | 16,694 | ||||||||||
| 593 | The Hartford Small Company Fund | 16,763 | ||||||||||
| 178,541 | ||||||||||||
| Total Domestic Equity Funds | ||||||||||||
| (Cost $128,665) | $ | 178,541 | ||||||||||
| International/Global Equity Funds - 23.2% | ||||||||||||
| 4,459 | The Hartford Emerging Markets Research Fund | $ | 40,486 | |||||||||
| 1,849 | The Hartford International Growth Fund | 24,142 | ||||||||||
| 2,747 | The Hartford International Opportunities Fund | 48,509 | ||||||||||
| 1,931 | The Hartford International Small Company Fund | 33,052 | ||||||||||
| 1,628 | The Hartford International Value Fund● | 24,015 | ||||||||||
| 170,204 | ||||||||||||
| Total International/Global Equity Funds | ||||||||||||
| (Cost $157,980) | $ | 170,204 | ||||||||||
| Taxable Fixed Income Funds - 35.6% | ||||||||||||
| 8,632 | The Hartford Inflation Plus Fund | $ | 94,520 | |||||||||
| 3,128 | The Hartford Strategic Income Fund | 29,088 | ||||||||||
| 5,318 | The Hartford Total Return Bond Fund | 57,803 | ||||||||||
| 7,405 | The Hartford World Bond Fund | 79,748 | ||||||||||
| 261,159 | ||||||||||||
| Total Taxable Fixed Income Funds | ||||||||||||
| (Cost $268,310) | $ | 261,159 | ||||||||||
| Total Investments in Affiliated Investment Companies | ||||||||||||
| (Cost $682,583) | $ | 734,489 | ||||||||||
| Total Long-Term Investments | ||||||||||||
| (Cost $682,583) | $ | 734,489 | ||||||||||
| Total Investments | ||||||||||||
| (Cost $682,583) ▲ | 100.0 | % | $ | 734,489 | ||||||||
| Other Assets and Liabilities | — | % | (255 | ) | ||||||||
| Total Net Assets | 100.0 | % | $ | 734,234 | ||||||||
The accompanying notes are an integral part of these financial statements.
| 5 |
| Hartford Moderate Allocation Fund |
| Schedule of Investments – (continued) |
| October 31, 2014 |
| (000’s Omitted) |
| Note: | Percentage of investments as shown is the ratio of the total market value to total net assets. |
For Fund compliance purposes, the Fund may not use the same classification system shown in this report as these classifications are used for reporting ease.
| ▲ | At October 31, 2014, the cost of securities for federal income tax purposes was $685,104 and the aggregate gross unrealized appreciation and depreciation based on that cost were: |
| Unrealized Appreciation | $ | 65,756 | ||
| Unrealized Depreciation | (16,371 | ) | ||
| Net Unrealized Appreciation | $ | 49,385 |
| ● | Non-income producing. |
| ╪ | See Significant Accounting Policies of accompanying Notes to Financial Statements regarding valuation of securities. |
The accompanying notes are an integral part of these financial statements.
| 6 |
| Hartford Moderate Allocation Fund |
| Schedule of Investments – (continued) |
| October 31, 2014 |
| (000’s Omitted) |
Investment Valuation Hierarchy Level Summary
October 31, 2014
| Total | Level 1 ♦ | Level 2 ♦ | Level 3 | |||||||||||||
| Assets: | ||||||||||||||||
| Affiliated Investment Companies | $ | 734,489 | $ | 734,489 | $ | – | $ | – | ||||||||
| Total | $ | 734,489 | $ | 734,489 | $ | – | $ | – | ||||||||
| ♦ | For the year ended October 31, 2014, there were no transfers between Level 1 and Level 2. |
| Note: | For purposes of reporting transfers between different hierarchy levels, both transfers in and out of each level, as applicable, are shown as if they occurred at the beginning of the period. |
The accompanying notes are an integral part of these financial statements.
| 7 |
| Hartford Moderate Allocation Fund |
| Statement of Assets and Liabilities |
| October 31, 2014 |
| (000’s Omitted) |
| Assets: | ||||
| Investments in affiliated investment companies, at market value (cost $682,583) | $ | 734,489 | ||
| Receivables: | ||||
| Investment securities sold | 481 | |||
| Fund shares sold | 249 | |||
| Dividends | 112 | |||
| Other assets | 45 | |||
| Total assets | 735,376 | |||
| Liabilities: | ||||
| Payables: | ||||
| Investment securities purchased | 130 | |||
| Fund shares redeemed | 818 | |||
| Investment management fees | 19 | |||
| Administrative fees | 2 | |||
| Distribution fees | 63 | |||
| Accrued expenses | 110 | |||
| Total liabilities | 1,142 | |||
| Net assets | $ | 734,234 | ||
| Summary of Net Assets: | ||||
| Capital stock and paid-in-capital | $ | 630,693 | ||
| Undistributed net investment income | — | |||
| Accumulated net realized gain | 51,635 | |||
| Unrealized appreciation of investments | 51,906 | |||
| Net assets | $ | 734,234 | ||
| Shares authorized | 400,000 | |||
| Par value | $ | 0.001 | ||
| Class A: Net asset value per share/Maximum offering price per share | $13.16/$13.93 | |||
| Shares outstanding | 35,164 | |||
| Net assets | $ | 462,724 | ||
| Class B: Net asset value per share | $ | 13.06 | ||
| Shares outstanding | 1,932 | |||
| Net assets | $ | 25,234 | ||
| Class C: Net asset value per share | $ | 13.05 | ||
| Shares outstanding | 12,608 | |||
| Net assets | $ | 164,473 | ||
| Class I: Net asset value per share | $ | 13.16 | ||
| Shares outstanding | 902 | |||
| Net assets | $ | 11,868 | ||
| Class R3: Net asset value per share | $ | 13.04 | ||
| Shares outstanding | 2,960 | |||
| Net assets | $ | 38,607 | ||
| Class R4: Net asset value per share | $ | 13.16 | ||
| Shares outstanding | 1,687 | |||
| Net assets | $ | 22,195 | ||
| Class R5: Net asset value per share | $ | 13.17 | ||
| Shares outstanding | 694 | |||
| Net assets | $ | 9,133 |
The accompanying notes are an integral part of these financial statements.
| 8 |
| Hartford Moderate Allocation Fund |
| Statement of Operations |
| For the Year Ended October 31, 2014 |
| (000’s Omitted) |
| Investment Income: | ||||
| Dividends from affiliated investment companies | $ | 9,532 | ||
| Total investment income | 9,532 | |||
| Expenses: | ||||
| Investment management fees | 1,022 | |||
| Administrative services fees | ||||
| Class R3 | 83 | |||
| Class R4 | 36 | |||
| Class R5 | 9 | |||
| Transfer agent fees | ||||
| Class A | 555 | |||
| Class B | 69 | |||
| Class C | 172 | |||
| Class I | 6 | |||
| Class R3 | 1 | |||
| Class R4 | — | |||
| Class R5 | — | |||
| Distribution fees | ||||
| Class A | 1,198 | |||
| Class B | 337 | |||
| Class C | 1,732 | |||
| Class R3 | 207 | |||
| Class R4 | 61 | |||
| Custodian fees | — | |||
| Accounting services fees | 93 | |||
| Registration and filing fees | 122 | |||
| Board of Directors' fees | 21 | |||
| Audit fees | 14 | |||
| Other expenses | 115 | |||
| Total expenses | 5,853 | |||
| Net Investment Income | 3,679 | |||
| Net Realized Gain on Investments: | ||||
| Capital gain distributions received from affiliated investment companies | 18,827 | |||
| Net realized gain on investments in affiliated investment companies | 35,488 | |||
| Net Realized Gain on Investments | 54,315 | |||
| Net Changes in Unrealized Depreciation of Investments: | ||||
| Net unrealized depreciation of investments in affiliated investment companies | (32,616 | ) | ||
| Net Changes in Unrealized Depreciation of Investments | (32,616 | ) | ||
| Net Gain on Investments | 21,699 | |||
| Net Increase in Net Assets Resulting from Operations | $ | 25,378 |
The accompanying notes are an integral part of these financial statements.
| 9 |
| Hartford Moderate Allocation Fund |
| Statement of Changes in Net Assets |
| (000’s Omitted) |
| For the Year Ended October 31, 2014 | For the Year Ended October 31, 2013 | |||||||
| Operations: | ||||||||
| Net investment income | $ | 3,679 | $ | 6,334 | ||||
| Net realized gain on investments | 54,315 | 45,053 | ||||||
| Net unrealized appreciation (depreciation) of investments | (32,616 | ) | 23,244 | |||||
| Net Increase in Net Assets Resulting from Operations | 25,378 | 74,631 | ||||||
| Distributions to Shareholders: | ||||||||
| From net investment income | ||||||||
| Class A | (4,770 | ) | (12,808 | ) | ||||
| Class B | — | (1,353 | ) | |||||
| Class C | (292 | ) | (3,977 | ) | ||||
| Class I | (150 | ) | (209 | ) | ||||
| Class R3 | (222 | ) | (1,011 | ) | ||||
| Class R4 | (216 | ) | (872 | ) | ||||
| Class R5 | (136 | ) | (320 | ) | ||||
| Total from net investment income | (5,786 | ) | (20,550 | ) | ||||
| From net realized gain on investments | ||||||||
| Class A | (868 | ) | — | |||||
| Class B | (74 | ) | — | |||||
| Class C | (320 | ) | — | |||||
| Class I | (18 | ) | — | |||||
| Class R3 | (74 | ) | — | |||||
| Class R4 | (43 | ) | — | |||||
| Class R5 | (18 | ) | — | |||||
| Total from net realized gain on investments | (1,415 | ) | — | |||||
| Total distributions | (7,201 | ) | (20,550 | ) | ||||
| Capital Share Transactions: | ||||||||
| Class A | (32,392 | ) | (22,803 | ) | ||||
| Class B | (18,195 | ) | (25,277 | ) | ||||
| Class C | (14,403 | ) | (7,970 | ) | ||||
| Class I | 2,017 | 472 | ||||||
| Class R3 | (3,875 | ) | 96 | |||||
| Class R4 | (1,162 | ) | (15,000 | ) | ||||
| Class R5 | (1,232 | ) | (2,404 | ) | ||||
| Net decrease from capital share transactions | (69,242 | ) | (72,886 | ) | ||||
| Net Decrease in Net Assets | (51,065 | ) | (18,805 | ) | ||||
| Net Assets: | ||||||||
| Beginning of period | 785,299 | 804,104 | ||||||
| End of period | $ | 734,234 | $ | 785,299 | ||||
| Undistributed (distributions in excess of) net investment income | $ | — | $ | — | ||||
The accompanying notes are an integral part of these financial statements.
| 10 |
| Hartford Moderate Allocation Fund |
| Notes to Financial Statements |
| October 31, 2014 |
| (000’s Omitted) |
Organization:
The Hartford Mutual Funds, Inc. (“Company”) is an open-end management investment company comprised of forty-two portfolios. Financial statements for Hartford Moderate Allocation Fund (the "Fund"), a series of the Company, are included in this report. Prior to May 30, 2014, the Fund was known as The Hartford Balanced Allocation Fund.
The Company is organized under the laws of the State of Maryland and is registered with the Securities and Exchange Commission (“SEC”) under the Investment Company Act of 1940, as amended (“1940 Act”). The Fund is a diversified open-end management investment company. The Fund is an investment company and applies specialized accounting and reporting under Accounting Standards Codification Topic 946, Financial Services - Investment Companies.
Class A shares are sold with a front-end sales charge of up to 5.50%. Class B shares were sold with a contingent deferred sales charge which is assessed on the lesser of the per share net asset value (“NAV”) of the shares at the time of redemption or the original purchase price, and declines from up to 5.00% to zero depending on the period of time the shares are held (see note below regarding the closing of Class B shares). Class C shares are sold with a contingent deferred sales charge of up to 1.00% on shares redeemed within twelve months of purchase. Class I shares are sold without sales charges to certain eligible investors primarily through advisory fee-based wrap programs. Class R3, R4 and R5 shares, which are offered to employer-sponsored retirement plans, are sold without a sales charge. All classes of shares have identical voting, redemption, dividend, liquidation and other rights and the same terms and conditions, with the exceptions that each class may have different expenses, which may affect performance, and that Class B shares automatically convert to Class A shares after 8 years.
The Fund, as a “Fund of Funds,” invests the majority of its assets in Class Y shares of other Hartford Funds ("Affiliated Investment Companies") and may also invest in one or more unaffiliated money market funds (together with the Affiliated Investment Companies, the "Underlying Funds"), certain exchange traded funds (“ETFs”) and/or exchange traded notes (“ETNs”). The Fund seeks its investment goal through implementation of a strategic asset allocation recommendation provided by Wellington Management Company, LLP (“Wellington Management”), the sub-adviser to the Fund.
No new or additional investments are allowed in Class B shares of the Fund (including investments through any systematic investment plan). Existing shareholders of Class B shares may continue to hold their Class B shares, exchange their Class B shares for Class B shares of another Hartford Fund (as permitted by existing exchange privileges), or redeem their Class B shares as described in the Fund’s prospectus. Reinstatement privileges with respect to Class B shares are set forth in the Fund's prospectus. For investors electing to reinvest capital gains and dividends, any such capital gains or dividends on Class B shares will continue to be reinvested in Class B shares of the Fund. All Class B share attributes, including the 12b-1 fee, contingent deferred sales charge schedule, and conversion to Class A shares, remain unchanged.
Significant Accounting Policies:
The significant accounting policies of the Affiliated Investment Companies are outlined in the shareholder reports for such funds, available (1) without charge, upon request, by calling 888-843-7824, (2) on our website www.hartfordfunds.com and (3) on the SEC’s website at www.sec.gov. The reports may be reviewed and copied at the Commission’s Public Reference Room in Washington, DC. Information on the operation of the Public Reference Room may be obtained by calling 1-800-SEC-0330. The significant accounting policies of the Affiliated Investment Companies are not covered by this report.
The following is a summary of significant accounting policies of the Fund in the preparation of its financial statements, which are in accordance with United States generally accepted accounting principles (“U.S. GAAP”). The preparation of financial statements in accordance with U.S. GAAP may require management to make estimates and assumptions that affect the reported amounts of assets and liabilities and disclosure of contingent assets and liabilities at the date of the financial statements and the reported amounts of increases and decreases in net assets from operations during the reporting period. Actual results could differ from those estimates.
Determination of Net Asset Value – The NAV of each class of the Fund's shares is determined as of the close of regular trading (normally 4:00 p.m. Eastern Time) (the “NYSE Close”) on each day that the New York Stock Exchange (the “Exchange”) is open
| 11 |
| Hartford Moderate Allocation Fund |
| Notes to Financial Statements – (continued) |
| October 31, 2014 |
| (000’s Omitted) |
(“Valuation Date”). Information that becomes known to the Fund after the NAV has been calculated on a particular day will not generally be used to retroactively adjust the NAV determined earlier that day.
Investment Valuation and Fair Value Measurements – Investments in open-end mutual funds are valued at the respective NAV of each Underlying Fund as determined as of the NYSE Close on the Valuation Date. The Fund generally uses market prices in valuing the remaining portfolio investments. If market prices are not readily available or are deemed unreliable, the Fund will use the fair value of the investment as determined in good faith under policies and procedures established by and under the supervision of the Company’s Board of Directors.
U.S. GAAP defines fair value as the price that the Fund would receive to sell an asset or pay to transfer a liability in an orderly transaction between market participants. The U.S. GAAP fair value measurement standards require disclosure of a fair value hierarchy for each major category of assets and liabilities. Various inputs are used in determining the fair value of the Fund’s investments. These inputs are summarized into three broad hierarchy levels. This hierarchy is based on whether the valuation inputs are observable or unobservable. These levels are:
Level 1 – Quoted prices in active markets for identical investments. Level 1 may include exchange traded instruments, such as domestic equities, some foreign equities, options, futures, mutual funds, exchange traded funds, rights and warrants.
Level 2 – Observable inputs other than Level 1 prices, such as quoted prices for similar investments; quoted prices in markets that are not active; or other inputs that are observable or can be corroborated by observable market data. Level 2 may include debt investments that are traded less frequently than exchange traded instruments and which are valued using independent pricing services; foreign equities, which are principally traded on certain foreign markets and are adjusted daily pursuant to a fair value pricing service in order to reflect an adjustment for the factors occurring after the close of certain foreign markets but before the NYSE Close; senior floating rate interests, which are valued using an aggregate of dealer bids; short-term investments, which are valued at amortized cost; and swaps, which are valued based upon the terms of each swap contract.
Level 3 – Significant unobservable inputs that are supported by limited or no market activity. Level 3 may include financial instruments whose values are determined using indicative market quotes or require significant management judgment or estimation. These unobservable valuation inputs may include estimates for current yields, maturity/duration, prepayment speed, and indicative market quotes for comparable investments along with other assumptions relating to credit quality, collateral value, complexity of the investment structure, general market conditions and liquidity. This category may include investments where trading has been halted or there are certain restrictions on trading. While these investments are priced using unobservable inputs, the valuation of these investments reflects the best available data and management believes the prices are a reasonable representation of exit price.
Valuation levels are not necessarily indicative of the risk associated with investing in such investments. Individual investments within any of the above mentioned asset classes may be assigned a different hierarchical level than those presented above, as individual circumstances dictate.
For additional information, refer to the Investment Valuation Hierarchy Level Summary which follows the Schedule of Investments.
Investment Transactions and Investment Income – Investment transactions are recorded as of the trade date (the date the order to buy or sell is executed) for financial reporting purposes. Realized gains and losses are determined on the basis of identified cost.
Dividend income is accrued on the ex-dividend date. Income and capital gain distributions from the Underlying Funds are accrued on the ex-dividend date.
Fund Share Valuation and Dividend Distributions to Shareholders – Orders for the Fund’s shares are executed in accordance with the investment instructions of the shareholders. The NAV of the Fund’s shares is determined as of the close of business on each business day of the Exchange. The NAV is determined separately for each class of shares of the Fund by dividing the Fund’s net assets attributable to that class by the number of shares of the class outstanding. Each class of shares offered by the Fund has equal rights as to assets and voting privileges (except that shareholders of a class have exclusive voting rights regarding any matter relating
| 12 |
| Hartford Moderate Allocation Fund |
| Notes to Financial Statements – (continued) |
| October 31, 2014 |
| (000’s Omitted) |
solely to that class of shares). Income and non-class specific expenses are allocated daily to each class on the basis of the relative net assets of the class. Realized and unrealized gains and losses are allocated daily based on the relative net assets of each class of shares of the Fund.
Orders for the purchase of the Fund’s shares received prior to the close of the Exchange on any day the Exchange is open for business are priced at the NAV determined as of the close of the Exchange. Orders received after the close of the Exchange, or on a day on which the Exchange and/or the Fund is not open for business, are priced at the next determined NAV.
Dividends are declared pursuant to a policy adopted by the Company's Board of Directors based upon the investment performance of the Fund. The policy of the Fund is to pay dividends from net investment income, if any, quarterly and realized gains, if any, at least once a year. Long-term capital gain distributions are distributed by the Underlying Funds at least annually, when required. Unless shareholders specify otherwise, all dividends and distributions will be automatically reinvested in additional full or fractional shares of the Fund.
Net investment income, dividends and distributions from net realized gains and capital are determined in accordance with federal income tax regulations, which may differ from U.S. GAAP with respect to character and timing (see Federal Income Taxes: Distributions and Components of Distributable Earnings and Reclassification of Capital Accounts).
Principal Risks:
The Fund is exposed to the risks of the Underlying Funds and/or ETFs/ETNs in direct proportion to the amount of assets the Fund allocates to each Underlying Fund and/or ETF/ETN. The market values of the Underlying Funds and/or ETFs/ETNs may decline due to general market conditions which are not specifically related to a particular company in which the Underlying Fund and/or ETF/ETN invested, such as real or perceived adverse economic conditions, changes in the general outlook for corporate earnings, changes in interest or currency rates or adverse investor sentiment generally. The market value of equity securities in which the Underlying Funds and/or ETFs/ETNs invest may also decline due to factors which affect a particular industry or industries, such as labor shortages or increased production costs and competitive conditions within an industry.
Federal Income Taxes:
Federal Income Taxes – For federal income tax purposes, the Fund intends to continue to qualify as a Regulated Investment Company ("RIC") under Subchapter M of the Internal Revenue Code (“IRC”) by distributing substantially all of its taxable net investment income and net realized capital gains to its shareholders and otherwise complying with the requirements of the IRC. The Fund has distributed substantially all of its income and capital gains in prior years, if applicable, and intends to distribute substantially all of its income and capital gains during the calendar year ending December 31, 2014. Accordingly, no provision for federal income or excise taxes has been made in the accompanying financial statements. Distributions from short-term capital gains are treated as ordinary income distributions for federal income tax purposes.
Net Investment Income (Loss), Net Realized Gains (Losses) and Distributions – Net investment income (loss) and net realized gains (losses) may differ for financial statement and tax purposes primarily because of losses deferred due to wash sale adjustments and short-term capital gain adjustments. The character of distributions made during the year from net investment income or net realized gains may differ from their ultimate characterization for federal income tax purposes. Also, due to the timing of dividend distributions, the fiscal year in which amounts are distributed may differ from the year that the income or realized gains (losses) were recorded by the Fund.
| 13 |
| Hartford Moderate Allocation Fund |
| Notes to Financial Statements – (continued) |
| October 31, 2014 |
| (000’s Omitted) |
Distributions and Components of Distributable Earnings – The tax character of distributions paid by the Fund for the periods indicated is as follows (as adjusted for dividends payable, if applicable):
| For the Year Ended October 31, 2014 | For the Year Ended October 31, 2013 | |||||||
| Ordinary Income | $ | 5,747 | $ | 14,294 | ||||
| Long-Term Capital Gains ‡ | 1,454 | 6,256 | ||||||
| ‡ | The Fund designates these distributions as long-term capital gain dividends pursuant to IRC Sec. 852(b)(3)(C). |
As of October 31, 2014, the Fund’s components of distributable earnings (deficit) on a tax basis are as follows:
| Amount | ||||
| Undistributed Long-Term Capital Gain | $ | 54,156 | ||
| Unrealized Appreciation* | 49,385 | |||
| Total Accumulated Earnings | $ | 103,541 | ||
| * | Differences between book-basis and tax-basis unrealized appreciation (depreciation) may be attributable to the losses deferred due to wash sale adjustments, foreign currency gains and losses, adjustments related to PFICs, REITs, RICs, certain derivatives and partnerships. |
Reclassification of Capital Accounts – The Fund may record reclassifications in its capital accounts. These reclassifications have no impact on the total net assets of the Fund. The reclassifications are a result of permanent differences between U.S. GAAP and tax accounting for such items as expiration or utilization of capital loss carryforwards or net operating losses. Adjustments are made to reflect the impact these items have on current and future distributions to shareholders. Therefore, the source of the Fund’s distributions may be shown in the accompanying Statement of Changes in Net Assets as from undistributed net investment income, from accumulated net realized gains on investments or from capital depending on the type of book and tax differences that exist. For the year ended October 31, 2014, the Fund recorded reclassifications to increase (decrease) the accounts listed below:
| Amount | ||||
| Undistributed Net Investment Income (Loss) | $ | 2,107 | ||
| Accumulated Net Realized Gain (Loss) | (2,107 | ) | ||
Capital Loss Carryforward – On December 22, 2010, the Regulated Investment Company Modernization Act of 2010 (the “Act”) was enacted, which made changes to the capital loss carryforward rules. The changes are effective for taxable years beginning after the date of enactment. Under the Act, funds are permitted to carry forward capital losses for an unlimited period. Additionally, capital loss carryforwards retain their character as either short-term or long-term capital losses rather than being considered all short-term as permitted under prior regulation.
The Fund had no capital loss carryforward for U.S. federal income tax purposes as of October 31, 2014.
Accounting for Uncertainty in Income Taxes – The Fund has adopted financial reporting rules that require the Fund to analyze all open tax years, as defined by the statute of limitations, for all major jurisdictions. Generally, tax authorities can examine all tax returns filed for the last three years. The Fund does not have an examination in progress.
The Fund has reviewed all open tax years and major jurisdictions and concluded that these financial reporting rules had no effect on the Fund’s financial position or results of operations. There is no tax liability resulting from unrecognized tax benefits relating to uncertain income tax positions taken or expected to be taken on the tax return for the fiscal year ended October 31, 2014. The Fund is also not aware of any tax positions for which it is reasonably possible that the total amounts of unrecognized tax benefits will significantly change in the next twelve months.
| 14 |
| Hartford Moderate Allocation Fund |
| Notes to Financial Statements – (continued) |
| October 31, 2014 |
| (000’s Omitted) |
Expenses:
Investment Management Agreement – Hartford Funds Management Company, LLC ("HFMC") serves as the Fund’s investment manager pursuant to an Investment Management Agreement with the Company. HFMC is an indirect wholly owned subsidiary of The Hartford Financial Services Group, Inc. ("The Hartford"). The investment manager has overall investment supervisory responsibility for the Fund. In addition, the investment manager provides administrative personnel, services, equipment, facilities and office space for proper operation of the Fund. HFMC has contracted with Wellington Management under a sub-advisory agreement for the provision of day-to-day investment management services to the Fund in accordance with the Fund’s investment objective and policies. The Fund pays a fee to the investment manager, a portion of which may be used to compensate Wellington Management.
The schedule below reflects the rates of compensation paid to the investment manager for investment management services rendered as of October 31, 2014; the rates are accrued daily and paid monthly:
| Average Daily Net Assets | Annual Fee |
| On first $500 million | 0.15% |
| On next $500 million | 0.10% |
| On next $1.5 billion | 0.09% |
| On next $2.5 billion | 0.08% |
| On next $2.5 billion | 0.07% |
| On next $2.5 billion | 0.06% |
| Over $10 billion | 0.05% |
Accounting Services Agreement – Pursuant to the Fund Accounting Agreement between HFMC and the Company, on behalf of the Fund, HFMC provides accounting services to the Fund and receives monthly compensation based on the Fund’s average daily net assets at the rates set forth below. The Fund’s accounting services fees are accrued daily and paid monthly.
| Average Daily Net Assets | Annual Fee |
| On first $5 billion | 0.012% |
| Over $5 billion | 0.010% |
Operating Expenses – Allocable expenses incurred by the Company are allocated to each Fund and allocated to classes within the Fund in proportion to the average daily net assets of the Fund and each class, except where allocation of certain expenses is more fairly made directly to the Fund or to specific classes within a Fund. As of October 31, 2014, HFMC contractually limited the total operating expenses of this Fund, exclusive of taxes, interest expense, brokerage commissions and extraordinary expenses, through February 28, 2015 as follows:
| Class A | Class B | Class C | Class I | Class R3 | Class R4 | Class R5 |
| 1.40% | 2.15% | 2.15% | 1.15% | 1.65% | 1.35% | 1.05% |
Contractual limitations for total operating expenses include expenses incurred as the result of investing in other investment companies including the Underlying Funds. Amounts incurred which exceed the above limits are deducted from expenses and are reported as expense waivers on the accompanying Statement of Operations, as applicable.
Distribution and Service Plan for Class A, B, C, R3 and R4 Shares – Hartford Funds Distributors, LLC ("HFD"), an indirect wholly owned subsidiary of The Hartford, is the principal underwriter and distributor of the Fund. HFD is engaged in distribution activities, which include marketing and distribution of shares through broker/dealers, financing distribution costs and maintaining financial books and records. For the year ended October 31, 2014, HFD received front-end load sales charges of $870 and contingent deferred sales charges of $33 from the Fund.
| 15 |
| Hartford Moderate Allocation Fund |
| Notes to Financial Statements – (continued) |
| October 31, 2014 |
| (000’s Omitted) |
The Fund has adopted a Distribution and Service Plan in accordance with Rule 12b-1 of the 1940 Act to compensate the distributor (HFD) for activities intended to result in the sale and distribution of Class A, B, C, R3 and R4 shares and for providing services for shareholders. The Rule 12b-1 plan applicable to Class A shares of the Fund provides for payment of a Rule 12b-1 fee of 0.25% of average daily net assets. Some or all of the fee may be used for shareholder servicing expenses with the remainder used for distribution expenses. Under the Class B Plan, the Fund pays the distributor 1.00% of the average daily net assets of Class B shares that are outstanding for 8 years or less, 0.25% of which is a fee for services provided to existing shareholders with the remainder used for distribution expenses. Some or the entire Rule 12b-1 fee for Class B shares may be remitted to broker/dealers for distribution and/or shareholder account services. After eight years, Class B shares convert to Class A shares. Upon conversion to Class A shares, the Class A plan described above will apply to those shares. Under the Class C Plan, the Fund pays the distributor 1.00% of the average daily net assets of Class C shares outstanding, 0.25% of which is intended as a fee for services provided to existing shareholders with the remainder used for distribution expenses. For Class C shares, some or the entire fee may be remitted to broker/dealers for distribution and/or shareholder account services. Class R3 shares have a distribution fee of 0.50% of average daily net assets and Class R4 shares have a distribution fee of 0.25% of average daily net assets. For Class R3 and R4 shares, some or the entire fee may be remitted to broker/dealers for distribution and/or shareholder account services. The Fund’s 12b-1 fees are accrued daily and paid monthly or at such other intervals as the Board of Directors may determine.
Other Related Party Transactions – Certain officers of the Fund are directors and/or officers of HFMC and/or The Hartford or its subsidiaries. For the year ended October 31, 2014, a portion of the Fund’s Chief Compliance Officer’s compensation was paid by all of the investment companies in the Hartford fund complex. The portion allocated to the Fund, as represented in other expenses on the Statement of Operations, was in the amount of $1. Hartford Administrative Services Company (“HASCO”), an indirect wholly-owned subsidiary of The Hartford, provides transfer agent services to the Fund. HASCO has contractually agreed to reimburse any portion of the transfer agency fees over 0.30% of average daily net assets per fiscal year for each class. Any transfer agency fee reimbursement is determined before considering the contractual operating expense limitation. For providing such services, HASCO is compensated on a per account basis that varies by account type. The amount paid to HASCO and any related contractual reimbursement amounts, if applicable, can be found in the Statement of Operations. These fees are accrued daily and paid monthly.
Administrative services fees are paid to HASCO for third-party recordkeeping services that are payable as a percentage of net assets in the amount of up to 0.20%, 0.15% and 0.10% for Classes R3, R4 and R5 shares, respectively. The total administrative services fees are shown on the Statement of Operations. These fees are accrued daily and paid monthly.
Investment Transactions:
For the year ended October 31, 2014, the cost of purchases and proceeds from sales of investment securities (excluding short-term investments) were as follows:
| Excluding U.S. Government Obligations | U.S. Government Obligations | Total | ||||||||||
| Cost of Purchases | $ | 217,716 | $ | — | $ | 217,716 | ||||||
| Sales Proceeds | 271,529 | — | 271,529 | |||||||||
| 16 |
| Hartford Moderate Allocation Fund |
| Notes to Financial Statements – (continued) |
| October 31, 2014 |
| (000’s Omitted) |
Capital Share Transactions:
The following information is for the year ended October 31, 2014, and the year ended October 31, 2013:
| For the Year Ended October 31, 2014 | For the Year Ended October 31, 2013 | |||||||||||||||||||||||||||||||
| Shares Sold | Shares Issued for Reinvested Dividends | Shares Redeemed | Net Increase (Decrease) of Shares | Shares Sold | Shares Issued for Reinvested Dividends | Shares Redeemed | Net Increase (Decrease) of Shares | |||||||||||||||||||||||||
| Class A | ||||||||||||||||||||||||||||||||
| Shares | 3,818 | 427 | (6,716 | ) | (2,471 | ) | 6,167 | 1,050 | (9,055 | ) | (1,838 | ) | ||||||||||||||||||||
| Amount | $ | 50,074 | $ | 5,534 | $ | (88,000 | ) | $ | (32,392 | ) | $ | 75,890 | $ | 12,515 | $ | (111,208 | ) | $ | (22,803 | ) | ||||||||||||
| Class B | ||||||||||||||||||||||||||||||||
| Shares | 42 | 6 | (1,442 | ) | (1,394 | ) | 106 | 109 | (2,274 | ) | (2,059 | ) | ||||||||||||||||||||
| Amount | $ | 541 | $ | 73 | $ | (18,809 | ) | $ | (18,195 | ) | $ | 1,275 | $ | 1,300 | $ | (27,852 | ) | $ | (25,277 | ) | ||||||||||||
| Class C | ||||||||||||||||||||||||||||||||
| Shares | 1,272 | 46 | (2,416 | ) | (1,098 | ) | 1,992 | 318 | (2,961 | ) | (651 | ) | ||||||||||||||||||||
| Amount | $ | 16,500 | $ | 585 | $ | (31,488 | ) | $ | (14,403 | ) | $ | 24,341 | $ | 3,774 | $ | (36,085 | ) | $ | (7,970 | ) | ||||||||||||
| Class I | ||||||||||||||||||||||||||||||||
| Shares | 430 | 12 | (289 | ) | 153 | 405 | 17 | (387 | ) | 35 | ||||||||||||||||||||||
| Amount | $ | 5,654 | $ | 156 | $ | (3,793 | ) | $ | 2,017 | $ | 4,954 | $ | 203 | $ | (4,685 | ) | $ | 472 | ||||||||||||||
| Class R3 | ||||||||||||||||||||||||||||||||
| Shares | 612 | 23 | (933 | ) | (298 | ) | 680 | 84 | (752 | ) | 12 | |||||||||||||||||||||
| Amount | $ | 7,961 | $ | 293 | $ | (12,129 | ) | $ | (3,875 | ) | $ | 8,277 | $ | 1,000 | $ | (9,181 | ) | $ | 96 | |||||||||||||
| Class R4 | ||||||||||||||||||||||||||||||||
| Shares | 476 | 20 | (581 | ) | (85 | ) | 425 | 73 | (1,728 | ) | (1,230 | ) | ||||||||||||||||||||
| Amount | $ | 6,201 | $ | 257 | $ | (7,620 | ) | $ | (1,162 | ) | $ | 5,261 | $ | 868 | $ | (21,129 | ) | $ | (15,000 | ) | ||||||||||||
| Class R5 | ||||||||||||||||||||||||||||||||
| Shares | 80 | 12 | (186 | ) | (94 | ) | 137 | 27 | (363 | ) | (199 | ) | ||||||||||||||||||||
| Amount | $ | 1,045 | $ | 154 | $ | (2,431 | ) | $ | (1,232 | ) | $ | 1,686 | $ | 320 | $ | (4,410 | ) | $ | (2,404 | ) | ||||||||||||
| Total | ||||||||||||||||||||||||||||||||
| Shares | 6,730 | 546 | (12,563 | ) | (5,287 | ) | 9,912 | 1,678 | (17,520 | ) | (5,930 | ) | ||||||||||||||||||||
| Amount | $ | 87,976 | $ | 7,052 | $ | (164,270 | ) | $ | (69,242 | ) | $ | 121,684 | $ | 19,980 | $ | (214,550 | ) | $ | (72,886 | ) | ||||||||||||
The following reflects the conversion of Class B shares into Class A shares (reflected as Class A shares sold) for the year ended October 31, 2014, and the year ended October 31, 2013:
| Shares | Dollars | |||||||
| For the Year Ended October 31, 2014 | 291 | $ | 3,813 | |||||
| For the Year Ended October 31, 2013 | 388 | $ | 4,786 | |||||
Line of Credit:
The Fund is one of several Hartford Funds that participate in a $500 million committed revolving line of credit facility. The facility is to be used for temporary or emergency purposes. Under the arrangement, the funds are required to own securities having a market value in excess of 300% of the total bank borrowings. The interest rate on borrowings varies depending on the nature of the loan. The facility also requires a fee to be paid based on the amount of the commitment. This commitment fee is allocated to all the funds participating in the line of credit based on the average net assets of the funds. During the year ended October 31, 2014, the Fund did not have any borrowings under this facility.
Pending Legal Proceedings:
On February 25, 2011, Jennifer L. Kasilag, Louis Mellinger, Judith M. Menendez, Jacqueline M. Robinson, and Linda A. Russell filed a derivative lawsuit against Hartford Investment Financial Services, LLC (“HIFSCO”) (now known as HFD) on behalf of six Hartford retail mutual funds in the United States District Court for the District of New Jersey, alleging that HIFSCO received excessive advisory and distribution fees in violation of its statutory fiduciary duty under Section 36(b) of the 1940 Act when serving as investment manager and principal underwriter, respectively, to the Hartford retail mutual funds. Although this action was purportedly filed on behalf of certain of the Hartford Funds, none of the Hartford Funds is itself a defendant to the suit. HIFSCO moved to dismiss and, in September 2011, the motion was granted in part and denied in part, with leave to amend the complaint. In November 2011, plaintiffs filed an amended complaint on
| 17 |
| Hartford Moderate Allocation Fund |
| Notes to Financial Statements – (continued) |
| October 31, 2014 |
| (000’s Omitted) |
behalf of certain Hartford retail mutual funds, The Hartford Global Health Fund (now known as The Hartford Healthcare Fund), The Hartford Conservative Allocation Fund, The Hartford Growth Opportunities Fund, The Hartford Inflation Plus Fund, The Hartford Advisers Fund (now known as The Hartford Balanced Fund), and The Hartford Capital Appreciation Fund. Plaintiffs seek to rescind the investment management agreements and distribution plans between HIFSCO and these funds and to recover the total fees charged thereunder or, in the alternative, to recover any improper compensation HIFSCO received, in addition to lost earnings. HIFSCO filed a partial motion to dismiss the amended complaint and, in December 2012, the court dismissed without prejudice the claims regarding distribution fees and denied the motion with respect to the advisory fees claims. HIFSCO disputes the allegations and intends to defend vigorously.
In March 2014, the plaintiffs filed a new complaint that added as new plaintiffs The Hartford Floating Rate Fund and The Hartford Small Company Fund and named as a defendant HFMC, which assumed the role as investment manager to the funds as of January 2013. HFMC and HIFSCO dispute the allegations and intend to defend vigorously.
No accrual for litigation relating to this matter has been recorded in the financial statements of the Fund because the Fund is not party to the suit.
Indemnifications:
Under the Company's organizational documents, the Company shall indemnify its officers and directors to the full extent required or permitted under Maryland General Corporation Law and the federal securities laws. In addition, the Company, on behalf of the Fund, may enter into contracts that contain a variety of indemnifications. The Company's maximum exposure under these arrangements is unknown. However, as of the date of these financial statements, the Company has not had prior claims or losses pursuant to these contracts and expects the risk of loss to be remote.
Subsequent Event:
Effective December 1, 2014, pursuant to a sub-transfer agency agreement between HASCO and Boston Financial Data Services, Inc. (“BFDS”), HASCO has delegated certain transfer agent, dividend disbursing agent and shareholder servicing agent functions to BFDS. The costs and expenses of such delegation are borne by HASCO, not by the Fund.
| 18 |
| Hartford Moderate Allocation Fund |
| Financial Highlights |
| - Selected Per-Share Data - (A) | - Ratios and Supplemental Data - | |||||||||||||||||||||||||||||||||||||||||||||||||||
| Class | Net Asset Value at Beginning of Period | Net Investment Income (Loss) | Net Realized and Unrealized Gain (Loss) on Invest- ments | Total from Investment Operations | Dividends from Net Investment Income | Distribu- tions from Realized Capital Gains | Total Dividends and Distributions | Net Asset Value at End of Period | Total Return(B) | Net Assets at End of Period (000's) | Ratio of Expenses to Average Net Assets Before Adjust- ments(C),(D) | Ratio of Expenses to Average Net Assets After Adjust- ments(C),(D) | Ratio of Net Investment Income (Loss) to Average Net Assets(D) | |||||||||||||||||||||||||||||||||||||||
| For the Year Ended October 31, 2014 | ||||||||||||||||||||||||||||||||||||||||||||||||||||
| A | $ | 12.86 | $ | 0.09 | $ | 0.36 | $ | 0.45 | $ | (0.13 | ) | $ | (0.02 | ) | $ | (0.15 | ) | $ | 13.16 | 3.54 | % | $ | 462,724 | 0.55 | % | 0.55 | % | 0.69 | % | |||||||||||||||||||||||
| B | 12.75 | (0.01 | ) | 0.34 | 0.33 | – | (0.02 | ) | (0.02 | ) | 13.06 | 2.62 | 25,234 | 1.39 | 1.39 | (0.06 | ) | |||||||||||||||||||||||||||||||||||
| C | 12.74 | (0.01 | ) | 0.37 | 0.36 | (0.03 | ) | (0.02 | ) | (0.05 | ) | 13.05 | 2.79 | 164,473 | 1.28 | 1.28 | (0.04 | ) | ||||||||||||||||||||||||||||||||||
| I | 12.88 | 0.13 | 0.37 | 0.50 | (0.20 | ) | (0.02 | ) | (0.22 | ) | 13.16 | 3.87 | 11,868 | 0.24 | 0.24 | 0.95 | ||||||||||||||||||||||||||||||||||||
| R3 | 12.74 | 0.04 | 0.35 | 0.39 | (0.07 | ) | (0.02 | ) | (0.09 | ) | 13.04 | 3.11 | 38,607 | 0.88 | 0.88 | 0.34 | ||||||||||||||||||||||||||||||||||||
| R4 | 12.86 | 0.08 | 0.36 | 0.44 | (0.12 | ) | (0.02 | ) | (0.14 | ) | 13.16 | 3.44 | 22,195 | 0.58 | 0.58 | 0.64 | ||||||||||||||||||||||||||||||||||||
| R5 | 12.89 | 0.13 | 0.36 | 0.49 | (0.19 | ) | (0.02 | ) | (0.21 | ) | 13.17 | 3.79 | 9,133 | 0.28 | 0.28 | 0.97 | ||||||||||||||||||||||||||||||||||||
| For the Year Ended October 31, 2013 | ||||||||||||||||||||||||||||||||||||||||||||||||||||
| A | $ | 12.00 | $ | 0.12 | $ | 1.07 | $ | 1.19 | $ | (0.33 | ) | $ | – | $ | (0.33 | ) | $ | 12.86 | 10.13 | % | $ | 484,156 | 0.55 | % | 0.55 | % | 1.01 | % | ||||||||||||||||||||||||
| B | 11.93 | 0.05 | 1.04 | 1.09 | (0.27 | ) | – | (0.27 | ) | 12.75 | 9.31 | 42,407 | 1.37 | 1.37 | 0.38 | |||||||||||||||||||||||||||||||||||||
| C | 11.93 | 0.03 | 1.06 | 1.09 | (0.28 | ) | – | (0.28 | ) | 12.74 | 9.34 | 174,647 | 1.28 | 1.28 | 0.27 | |||||||||||||||||||||||||||||||||||||
| I | 11.99 | 0.14 | 1.10 | 1.24 | (0.35 | ) | – | (0.35 | ) | 12.88 | 10.53 | 9,649 | 0.24 | 0.24 | 1.18 | |||||||||||||||||||||||||||||||||||||
| R3 | 11.90 | 0.08 | 1.07 | 1.15 | (0.31 | ) | – | (0.31 | ) | 12.74 | 9.87 | 41,503 | 0.88 | 0.88 | 0.65 | |||||||||||||||||||||||||||||||||||||
| R4 | 11.99 | 0.17 | 1.02 | 1.19 | (0.32 | ) | – | (0.32 | ) | 12.86 | 10.18 | 22,776 | 0.58 | 0.58 | 1.36 | |||||||||||||||||||||||||||||||||||||
| R5 | 12.00 | 0.17 | 1.07 | 1.24 | (0.35 | ) | – | (0.35 | ) | 12.89 | 10.53 | 10,161 | 0.28 | 0.28 | 1.37 | |||||||||||||||||||||||||||||||||||||
| For the Year Ended October 31, 2012 (E) | ||||||||||||||||||||||||||||||||||||||||||||||||||||
| A | $ | 11.21 | $ | 0.11 | $ | 0.82 | $ | 0.93 | $ | (0.14 | ) | $ | – | $ | (0.14 | ) | $ | 12.00 | 8.41 | % | $ | 473,562 | 0.55 | % | 0.55 | % | 0.99 | % | ||||||||||||||||||||||||
| B | 11.19 | 0.01 | 0.81 | 0.82 | (0.08 | ) | – | (0.08 | ) | 11.93 | 7.42 | 64,262 | 1.35 | 1.35 | 0.22 | |||||||||||||||||||||||||||||||||||||
| C | 11.18 | 0.02 | 0.82 | 0.84 | (0.09 | ) | – | (0.09 | ) | 11.93 | 7.54 | 171,252 | 1.29 | 1.29 | 0.23 | |||||||||||||||||||||||||||||||||||||
| I | 11.21 | 0.14 | 0.81 | 0.95 | (0.17 | ) | – | (0.17 | ) | 11.99 | 8.57 | 8,563 | 0.27 | 0.27 | 1.11 | |||||||||||||||||||||||||||||||||||||
| R3 | 11.14 | 0.07 | 0.81 | 0.88 | (0.12 | ) | – | (0.12 | ) | 11.90 | 7.94 | 38,637 | 0.89 | 0.89 | 0.57 | |||||||||||||||||||||||||||||||||||||
| R4 | 11.21 | 0.11 | 0.81 | 0.92 | (0.14 | ) | – | (0.14 | ) | 11.99 | 8.31 | 35,982 | 0.58 | 0.58 | 0.93 | |||||||||||||||||||||||||||||||||||||
| R5 | 11.21 | 0.14 | 0.82 | 0.96 | (0.17 | ) | – | (0.17 | ) | 12.00 | 8.63 | 11,846 | 0.28 | 0.28 | 1.25 | |||||||||||||||||||||||||||||||||||||
| For the Year Ended October 31, 2011 (E) | ||||||||||||||||||||||||||||||||||||||||||||||||||||
| A | $ | 11.03 | $ | 0.17 | $ | 0.21 | $ | 0.38 | $ | (0.20 | ) | $ | – | $ | (0.20 | ) | $ | 11.21 | 3.39 | % | $ | 501,962 | 0.54 | % | 0.54 | % | 1.45 | % | ||||||||||||||||||||||||
| B | 11.00 | 0.07 | 0.22 | 0.29 | (0.10 | ) | – | (0.10 | ) | 11.19 | 2.64 | 78,784 | 1.33 | 1.33 | 0.66 | |||||||||||||||||||||||||||||||||||||
| C | 10.99 | 0.08 | 0.22 | 0.30 | (0.11 | ) | – | (0.11 | ) | 11.18 | 2.72 | 167,049 | 1.28 | 1.28 | 0.71 | |||||||||||||||||||||||||||||||||||||
| I | 11.02 | 0.19 | 0.23 | 0.42 | (0.23 | ) | – | (0.23 | ) | 11.21 | 3.81 | 5,333 | 0.24 | 0.24 | 1.72 | |||||||||||||||||||||||||||||||||||||
| R3 | 10.96 | 0.13 | 0.21 | 0.34 | (0.16 | ) | – | (0.16 | ) | 11.14 | 3.12 | 29,124 | 0.88 | 0.88 | 1.06 | |||||||||||||||||||||||||||||||||||||
| R4 | 11.02 | 0.17 | 0.21 | 0.38 | (0.19 | ) | – | (0.19 | ) | 11.21 | 3.46 | 36,188 | 0.57 | 0.57 | 1.33 | |||||||||||||||||||||||||||||||||||||
| R5 | 11.03 | 0.19 | 0.22 | 0.41 | (0.23 | ) | – | (0.23 | ) | 11.21 | 3.67 | 11,208 | 0.27 | 0.27 | 1.73 | |||||||||||||||||||||||||||||||||||||
See Portfolio Turnover information on the next page.
| 19 |
| Hartford Moderate Allocation Fund |
| Financial Highlights – (continued) |
| - Selected Per-Share Data - (A) | - Ratios and Supplemental Data - | |||||||||||||||||||||||||||||||||||||||||||||||||||
| Class | Net Asset Value at Beginning of Period | Net Investment Income (Loss) | Net Realized and Unrealized Gain (Loss) on Invest- ments | Total from Investment Operations | Dividends from Net Investment Income | Distribu- tions from Realized Capital Gains | Total Dividends and Distributions | Net Asset Value at End of Period | Total Return(B) | Net Assets at End of Period (000's) | Ratio of Expenses to Average Net Assets Before Adjust- ments(C),(D) | Ratio of Expenses to Average Net Assets After Adjust- ments(C),(D) | Ratio of Net Investment Income (Loss) to Average Net Assets(D) | |||||||||||||||||||||||||||||||||||||||
| For the Year Ended October 31, 2010 (E) | ||||||||||||||||||||||||||||||||||||||||||||||||||||
| A | $ | 9.79 | $ | 0.15 | $ | 1.24 | $ | 1.39 | $ | (0.15 | ) | $ | – | $ | (0.15 | ) | $ | 11.03 | 14.33 | % | $ | 519,328 | 0.54 | % | 0.54 | % | 1.48 | % | ||||||||||||||||||||||||
| B | 9.76 | 0.07 | 1.24 | 1.31 | (0.07 | ) | – | (0.07 | ) | 11.00 | 13.44 | 91,904 | 1.35 | 1.35 | 0.68 | |||||||||||||||||||||||||||||||||||||
| C | 9.75 | 0.08 | 1.24 | 1.32 | (0.08 | ) | – | (0.08 | ) | 10.99 | 13.55 | 175,611 | 1.29 | 1.29 | 0.74 | |||||||||||||||||||||||||||||||||||||
| I | 9.78 | 0.18 | 1.24 | 1.42 | (0.18 | ) | – | (0.18 | ) | 11.02 | 14.65 | 3,685 | 0.28 | 0.28 | 1.73 | |||||||||||||||||||||||||||||||||||||
| R3 | 9.74 | 0.13 | 1.23 | 1.36 | (0.14 | ) | – | (0.14 | ) | 10.96 | 14.02 | 18,235 | 0.88 | 0.88 | 1.06 | |||||||||||||||||||||||||||||||||||||
| R4 | 9.78 | 0.15 | 1.24 | 1.39 | (0.15 | ) | – | (0.15 | ) | 11.02 | 14.32 | 19,647 | 0.58 | 0.58 | 1.45 | |||||||||||||||||||||||||||||||||||||
| R5 | 9.79 | 0.18 | 1.24 | 1.42 | (0.18 | ) | – | (0.18 | ) | 11.03 | 14.64 | 13,874 | 0.28 | 0.28 | 1.76 | |||||||||||||||||||||||||||||||||||||
| (A) | Information presented relates to a share outstanding throughout the indicated period. Net investment income (loss) per share amounts are calculated based on average shares outstanding unless otherwise noted. |
| (B) | Assumes initial investment at net asset value at the beginning of each period, reinvestment of all distributions, the complete redemption of the investment at net asset value at the end of each period and no sales charge. Total return would be reduced if sales charges were taken into account. |
| (C) | Adjustments include waivers and reimbursements, if applicable. |
| (D) | Ratios do not include expenses of the Underlying Funds and/or ETFs/ETNs, if applicable. |
| (E) | Net investment income (loss) per share amounts have been calculated using the SEC method. |
| Portfolio Turnover Rate for All Share Classes | ||||
| For the Year Ended October 31, 2014 | 28 | % | ||
| For the Year Ended October 31, 2013 | 21 | |||
| For the Year Ended October 31, 2012 | 79 | |||
| For the Year Ended October 31, 2011 | 36 | |||
| For the Year Ended October 31, 2010 | 25 | |||
| 20 |
| Report of Independent Registered Public Accounting Firm |
| The Board of Directors and Shareholders of |
| The Hartford Mutual Funds, Inc. |
We have audited the accompanying statement of assets and liabilities, including the schedule of investments, of Hartford Moderate Allocation Fund (formerly The Hartford Balanced Allocation Fund) (one of the portfolios constituting The Hartford Mutual Funds, Inc. (the Funds)) as of October 31, 2014, and the related statement of operations for the year then ended, the statements of changes in net assets for each of the two years in the period then ended, and the financial highlights for each of the five years in the period then ended. These financial statements and financial highlights are the responsibility of the Funds’ management. Our responsibility is to express an opinion on these financial statements and financial highlights based on our audits.
We conducted our audits in accordance with the standards of the Public Company Accounting Oversight Board (United States). Those standards require that we plan and perform the audit to obtain reasonable assurance about whether the financial statements and financial highlights are free of material misstatement. We were not engaged to perform an audit of the Funds’ internal control over financial reporting. Our audits included consideration of internal control over financial reporting as a basis for designing audit procedures that are appropriate in the circumstances, but not for the purpose of expressing an opinion on the effectiveness of the Funds’ internal control over financial reporting. Accordingly, we express no such opinion. An audit also includes examining, on a test basis, evidence supporting the amounts and disclosures in the financial statements and financial highlights, assessing the accounting principles used and significant estimates made by management, and evaluating the overall financial statement presentation. Our procedures included confirmation of securities owned as of October 31, 2014, by correspondence with the custodian and brokers or by other appropriate auditing procedures where replies from brokers were not received. We believe that our audits provide a reasonable basis for our opinion.
In our opinion, the financial statements and financial highlights referred to above present fairly, in all material respects, the financial position of Hartford Moderate Allocation Fund (formerly The Hartford Balanced Allocation Fund) of The Hartford Mutual Funds, Inc. at October 31, 2014, the results of its operations for the year then ended, the changes in its net assets for each of the two years in the period then ended, and the financial highlights for each of the five years in the period then ended, in conformity with U.S. generally accepted accounting principles.
| |
| Minneapolis, Minnesota December 18, 2014 |
| 21 |
| Hartford Moderate Allocation Fund |
| Directors and Officers (Unaudited) |
The Board of Directors of the Company (the "Directors") appoints officers who are responsible for the day-to-day operations of the Fund and who execute policies formulated by the Directors. Each Director serves until his or her death, resignation, or retirement or until the next annual meeting of shareholders is held or until his or her successor is elected and qualifies.
Directors and officers who are employed by or who have a financial interest in The Hartford Financial Services Group, Inc. ("The Hartford") are considered “interested” persons of the Fund pursuant to the 1940 Act. Each officer and two of the Company's Directors, as noted in the chart below, are “interested” persons of the Fund. Each Director serves as a director for The Hartford Mutual Funds, Inc., The Hartford Mutual Funds II, Inc., Hartford Series Fund, Inc., and Hartford HLS Series Fund II, Inc., and as a trustee for The Hartford Alternative Strategies Fund, which, as of October 31, 2014, collectively consist of 66 funds. Correspondence may be sent to Directors and officers c/o Hartford Funds, 5 Radnor Corporate Center, Suite 300, 100 Matsonford Road, Radnor, Pennsylvania 19087, except that correspondence to Mr. Annoni, Mr. Dressen and Ms. Quade may be sent to 500 Bielenberg Drive, Suite 500, Woodbury, Minnesota 55125.
The table below sets forth, for each Director and officer, his or her name, year of birth, current position with the Company and date first elected or appointed to The Hartford Mutual Funds, Inc. ("MF") and The Hartford Mutual Funds II, Inc. ("MF2"), principal occupation, and, for Directors, other directorships held. The Fund’s Statement of Additional Information contains further information on the Directors and is available free of charge by calling 1-888-843-7824 or writing to: Hartford Funds, P.O. Box 55022, Boston, MA 02205-5022.
Information on the aggregate remuneration paid to the directors of the Company can be found in the Statement of Operations herein. The Fund pays to The Hartford a portion of the Chief Compliance Officer’s compensation, but does not pay salaries or compensation to any of its other officers or Directors who are employed by The Hartford.
Non-Interested Directors
Hilary E. Ackermann (1956) Director since September 23, 2014
Ms. Ackermann served as Chief Risk Officer at Goldman Sachs Bank USA from October 2008 to November 2011 and serves as a Director of Dynegy, Inc., an independent power company, from October 2012 to present.
Lynn S. Birdsong (1946) Director since 2003, Chairman of the Investment Committee since 2014
Mr. Birdsong is a private investor. Mr. Birdsong currently serves as a Director of the Sovereign High Yield Investment Company (April 2010 to current). Mr. Birdsong currently serves as an Independent Director of Nomura Partners Funds, Inc. (formerly, The Japan Fund) (April 2003 to current). From 2003 to March 2005, Mr. Birdsong was an Independent Director of the Atlantic Whitehall Funds. From 1979 to 2002, Mr. Birdsong was a Managing Director of Zurich Scudder Investments, an investment management firm. During his employment with Scudder, Mr. Birdsong was an Interested Director of The Japan Fund. From January 1981 through December 2013, Mr. Birdsong was a partner in Birdsong Company, an advertising specialty firm.
Robert M. Gavin, Jr. (1940) Director since 2002 (MF) and 1986 (MF2), Chairman of the Board for each since 2004
Dr. Gavin is an educational consultant. Prior to September 1, 2001, he was President of Cranbrook Education Community and prior to July 1996, he was President of Macalester College, St. Paul, Minnesota.
Duane E. Hill (1945) Director since 2001 (MF) and 2002 (MF2), Chairman of the Nominating Committee since 2003
Mr. Hill is a Partner of TSG Ventures L.P., a private equity investment company. Mr. Hill is a former partner of TSG Capital Group, a private equity investment firm that served as sponsor and lead investor in leveraged buyouts of middle market companies.
Sandra S. Jaffee (1941) Director since 2005
Ms. Jaffee is the founder and Chief Executive Officer of a private company, Homeworks Concierge, LLC, which provides residential property management services in Westchester County, New York (January 2012 to present). Ms. Jaffee served as Chairman (2008 to 2009) and Chief Executive Officer of Fortent (formerly Searchspace Group), a leading provider of compliance/regulatory technology to financial institutions from August 2005 to August 2009. From August 2004 to August 2005, Ms. Jaffee served as an Entrepreneur in Residence with Warburg Pincus, a private equity firm. Prior to joining Warburg Pincus, Ms. Jaffee served as Executive Vice President at Citigroup, from September 1995 to July 2004, where she was President and Chief Executive Officer of Citibank’s Global Securities Services (1995 to 2003). Ms. Jaffee currently serves as a member of the Board of Directors of Broadridge Financial Solutions as well as a Trustee of Muhlenberg College.
| 22 |
| Hartford Moderate Allocation Fund |
| Directors and Officers (Unaudited) – (continued) |
William P. Johnston (1944) Director since 2005, Chairman of the Compliance Committee since 2005
In June 2006, Mr. Johnston was appointed as Senior Advisor to The Carlyle Group, a global private equity and other alternative asset investment firm and currently serves as an Operating Executive. In July 2006, Mr. Johnston was elected to the Board of Directors of MultiPlan, Inc. and served as a Director (July 2006 to August 2010). In August 2007, Mr. Johnston was elected to the Board of Directors of LifeCare Holdings, Inc. and served as a Director (August 2007 to June 2013). In February 2008, Mr. Johnston was elected to the Board of Directors of HCR-ManorCare, Inc. In May 2006, Mr. Johnston was elected to the Supervisory Board of Fresenius Medical Care AG & Co. KGaA, after its acquisition of Renal Care Group, Inc. in March 2006. Mr. Johnston joined Renal Care Group in November 2002 as a member of the Board of Directors and served as Chairman of the Board from March 2003 through March 2006. From 2002 through 2013, Mr. Johnston served as a Board member of the Georgia O’Keefe Museum. From September 1987 to December 2002, Mr. Johnston was with Equitable Securities Corporation (and its successors, SunTrust Equitable Securities and SunTrust Robinson Humphrey) serving in various investment banking and managerial positions, including Managing Director and Head of Investment Banking, Chief Executive Officer and Vice Chairman.
Phillip O. Peterson (1944) Director since 2002 (MF) and 2000 (MF2), Chairman of the Audit Committee since 2002
Mr. Peterson is a mutual fund industry consultant. He was a partner of KPMG LLP (an accounting firm) until July 1999. Mr. Peterson joined William Blair Funds in February 2007 as a member of the Board of Trustees. From February 2012 to February 2014, Mr. Peterson served as a Trustee of Symetra Variable Mutual Funds. From January 2004 to April 2005, Mr. Peterson served as Independent President of the Strong Mutual Funds.
Lemma W. Senbet (1946) Director since 2005
Dr. Senbet is the William E. Mayer Chair Professor of Finance and Founding Director, Center for Financial Policy, at the University of Maryland, Robert H. Smith School of Business. He was chair of the Finance Department of the University of Maryland, Robert H. Smith School of Business from 1998 to 2006. Since June 2013, he has been on leave from the University to serve as Executive Director of African Economic Research Consortium which focuses on economic policy research and training. Previously, he was a chaired professor of finance at the University of Wisconsin-Madison. Also, he was a Director of the Fortis Funds from March 2000 to July 2002. Dr. Senbet served as Director of the American Finance Association and President of the Western Finance Association. In 2006, Dr. Senbet was inducted Fellow of Financial Management Association International for his career-long distinguished scholarship and professional service.
Interested Directors and Officers
James E. Davey (1964) Director since 2012, President and Chief Executive Officer since 2010
Mr. Davey serves as Executive Vice President of Hartford Life Insurance Company (“HLIC”) and The Hartford. Additionally, Mr. Davey serves as Chairman of the Board, Manager and Senior Managing Director of Hartford Funds Distributors, LLC (“HFD”). He also currently serves as Director, Chairman of the Board, President and Senior Managing Director of Hartford Administrative Services Company (“HASCO”). Mr. Davey also serves as Manager, Chairman of the Board and Senior Managing Director for Hartford Funds Management Company, LLC (“HFMC”) and Director, Chairman of the Board and Senior Managing Director for Hartford Funds Management Group, Inc. ("HFMG"). Mr. Davey has served in various positions within The Hartford and its subsidiaries in connection with the operation of the Hartford Funds. Mr. Davey joined The Hartford in 2002.
Lowndes A. Smith* (1939) Director since 1996 (MF) and 2002 (MF2)
Mr. Smith served as Vice Chairman of The Hartford from February 1997 to January 2002, as President and Chief Executive Officer of Hartford Life, Inc. from February 1997 to January 2002, and as President and Chief Operating Officer of The Hartford Life Insurance Companies from January 1989 to January 2002. Mr. Smith serves as a Director of White Mountains Insurance Group Ltd. (October 2003 to current); One Beacon Insurance (October 2006 to current); Symetra Financial (August 2007 to current) and is a Managing Director of Whittington Gray Associates (January 2007 to current).
* Mr. Smith resigned as a Director of MF, MF2, Hartford Series Fund, Inc. and Hartford HLS Series Fund II, Inc. and as a Trustee of The Hartford Alternative Strategies Fund effective September 17, 2014.
Other Officers
Mark A. Annoni (1964) Vice President, Controller and Treasurer since 2012
Mr. Annoni currently serves as the Assistant Vice President of HLIC (February 2004 to present) and Senior Vice President of HFMG (December 2013 to present). Mr. Annoni has served in various positions within The Hartford and its subsidiaries in connection with the operation of the Hartford Funds. Mr. Annoni joined The Hartford in 2001.
| 23 |
| Hartford Moderate Allocation Fund |
| Directors and Officers (Unaudited) – (continued) |
Michael R. Dressen (1963) AML Compliance Officer since 2011
Mr. Dressen currently serves as Assistant Vice President of HLIC. He also serves as Chief Compliance Officer and AML Compliance Officer of HASCO and as AML Officer of HFD. Mr. Dressen has served in various positions within The Hartford and its subsidiaries in connection with the operation of the Hartford Funds.
Edward P. Macdonald (1967) Vice President, Secretary and Chief Legal Officer since 2005
Mr. Macdonald currently serves as Assistant Secretary, Executive Vice President and Deputy General Counsel of HFD, HASCO, HFMC and HFMG. He also serves as Vice President of HLIC. Mr. Macdonald has served in various positions within The Hartford and its subsidiaries in connection with the operation of the Hartford Funds. Mr. Macdonald joined The Hartford in 2005.
Joseph G. Melcher (1973) Vice President and Chief Compliance Officer since 2013
Mr. Melcher currently serves as Executive Vice President of HFD, HFMG and HASCO. Mr. Melcher also currently serves as Executive Vice President and Chief Compliance Officer of HFMC. Mr. Melcher has served in various positions within The Hartford and its subsidiaries in connection with the operation of the Hartford Funds since joining The Hartford in 2012. Prior to joining The Hartford, Mr. Melcher worked at Touchstone Investments, a member of the Western & Southern Financial Group, where he held the position of Vice President and Chief Compliance Officer from 2010 through 2012 and Assistant Vice President, Compliance from 2005 to 2010.
Vernon J. Meyer (1964) Vice President since 2006
Mr. Meyer currently serves as Senior Vice President of HLIC. He also currently serves as Managing Director and Chief Investment Officer of HFMC and Managing Director of HFMG. Mr. Meyer has served in various positions within The Hartford and its subsidiaries in connection with the operation of the Hartford Funds. Mr. Meyer joined The Hartford in 2004.
Laura S. Quade (1969) Vice President since 2012
Ms. Quade currently serves as Vice President of HASCO, HFD and HFMG. She is the Head of Operations of HASCO and formerly served as Director, Enterprise Operations of HLIC. Ms. Quade has served in various positions within The Hartford and its subsidiaries in connection with the operation of the Hartford Funds. Ms. Quade joined The Hartford in 2001.
Martin A. Swanson** (1962) Vice President since 2010
Mr. Swanson currently serves as Vice President of HLIC. Mr. Swanson also serves as Managing Director, Chief Marketing Officer and Principal of HFD and Managing Director of HFMG. Mr. Swanson has served in various positions within The Hartford and its subsidiaries in connection with the operation of the Hartford Funds.
** Mr. Swanson resigned as an officer effective November 6, 2014.
HOW TO OBTAIN A COPY OF THE FUND’S PROXY VOTING POLICIES AND VOTING RECORDS (UNAUDITED)
A description of the policies and procedures that the Fund uses to determine how to vote proxies relating to portfolio securities and information about how the Fund voted proxies relating to portfolio securities during the most recent twelve-month period ended June 30 are available (1) without charge, upon request, by calling 888-843-7824 and (2) on the SEC’s website at http://www.sec.gov.
QUARTERLY PORTFOLIO HOLDINGS INFORMATION (UNAUDITED)
The Fund files a complete schedule of portfolio holdings with the SEC for the first and third quarters of each fiscal year on Form N-Q. The Fund’s Forms N-Q are available (1) without charge, upon request, by calling 888-843-7824 and (2) on the SEC’s website at http://www.sec.gov. The Form N-Q may be reviewed and copied at the SEC’s Public Reference Room in Washington, DC. Information on the operation of the Public Reference Room may be obtained by calling 1-800-SEC-0330.
| 24 |
| Hartford Moderate Allocation Fund |
| Federal Tax Information (Unaudited) |
For the fiscal year ended October 31, 2014, there is no further federal tax information required for this Fund.
| 25 |
| Hartford Moderate Allocation Fund |
| Expense Example (Unaudited) |
Your Fund's Expenses
As a shareholder of the Fund, you incur two types of costs: (1) transaction costs, including sales charges (loads) on purchase payments, if any, and contingent deferred sales charges (CDSC), if any, and (2) ongoing costs, including investment management fees, distribution and/or service (12b-1) fees, if any, and other fund expenses. This example is intended to help you understand your ongoing costs (in dollars) of investing in the Fund and to compare these costs with the ongoing costs of investing in other mutual funds. The example is based on an investment of $1,000 invested at the beginning of the period and held for the entire period of April 30, 2014 through October 31, 2014.
Actual Expenses
The first set of columns of the table below provides information about actual account values and actual expenses. You may use the information in this column, together with the amount you invested, to estimate the expenses that you paid over the period. Simply divide your account value by $1,000 (for example, an $8,600 account value divided by $1,000 = 8.6), then multiply the result by the number in the line under the heading entitled “Expenses Paid During Period” to estimate the expenses you paid on your account during this period.
Hypothetical Example for Comparison Purposes
The second set of columns of the table below provides information about hypothetical account values and hypothetical expenses based on the Fund's actual expense ratio and an assumed rate of return of 5% per year before expenses, which is not the Fund's actual return. The hypothetical account values and expenses may not be used to estimate the actual ending account balance or expenses you paid for the period. You may use this information to compare the ongoing costs of investing in the Fund and other funds. To do so, compare this 5% hypothetical example with the 5% hypothetical examples that appear in the shareholder reports of the other funds.
Please note that the expenses shown in the table are meant to highlight your ongoing costs only and do not reflect any transactional costs, such as sales charges (loads) and CDSC. Therefore, the second set of columns of the table is useful in comparing ongoing costs only, and will not help you determine the relative total costs of owning different funds. In addition, if these transactional costs were included, your costs would be higher. Expenses are equal to the Fund's annualized expense ratios multiplied by average account value over the period, multiplied by 184/365 (to reflect the one-half year period).
| Actual return | Hypothetical (5% return before expenses) | |||||||||||||||||||||||||||||||
| Beginning Account Value April 30, 2014 | Ending Account Value October 31, 2014 | Expenses paid during the period April 30, 2014 through October 31, 2014 | Beginning Account Value April 30, 2014 | Ending Account Value October 31, 2014 | Expenses paid during the period April 30, 2014 through October 31, 2014 | Annualized expense ratio(A) | Days in the current 1/2 year | Days in the full year | ||||||||||||||||||||||||
| Class A | $ | 1,000.00 | $ | 1,001.20 | $ | 2.76 | $ | 1,000.00 | $ | 1,022.45 | $ | 2.79 | 0.55 | % | 184 | 365 | ||||||||||||||||
| Class B | $ | 1,000.00 | $ | 996.90 | $ | 6.97 | $ | 1,000.00 | $ | 1,018.23 | $ | 7.04 | 1.38 | 184 | 365 | |||||||||||||||||
| Class C | $ | 1,000.00 | $ | 998.50 | $ | 6.45 | $ | 1,000.00 | $ | 1,018.75 | $ | 6.51 | 1.28 | 184 | 365 | |||||||||||||||||
| Class I | $ | 1,000.00 | $ | 1,003.50 | $ | 1.21 | $ | 1,000.00 | $ | 1,023.99 | $ | 1.23 | 0.24 | 184 | 365 | |||||||||||||||||
| Class R3 | $ | 1,000.00 | $ | 999.20 | $ | 4.46 | $ | 1,000.00 | $ | 1,020.74 | $ | 4.51 | 0.88 | 184 | 365 | |||||||||||||||||
| Class R4 | $ | 1,000.00 | $ | 1,001.30 | $ | 2.95 | $ | 1,000.00 | $ | 1,022.26 | $ | 2.98 | 0.58 | 184 | 365 | |||||||||||||||||
| Class R5 | $ | 1,000.00 | $ | 1,003.30 | $ | 1.43 | $ | 1,000.00 | $ | 1,023.78 | $ | 1.45 | 0.28 | 184 | 365 | |||||||||||||||||
| (A) | Ratios do not include expenses of the Underlying Funds and/or ETFs/ETNs, if applicable. |
| 26 |
| Hartford Moderate Allocation Fund |
| Shareholder Meeting Results (Unaudited) |
A special meeting of shareholders of the Fund was held on April 4, 2014, which was adjourned until May 9, 2014 (“Shareholder Meeting”). Each of the three proposals listed below were approved by shareholders. The final results of the Shareholder Meeting are reported below.
Proposal one:
The ratification and approval of the sub-advisory agreement between HFMC, the investment manager of the Fund, and Wellington Management pursuant to which Wellington Management serves as the sub-adviser to the Fund and manages the Fund's assets.
| For | Against | Abstain | Uninstructed |
| 22,099,467.825 | 979,550.245 | 1,793,879.600 | 5,915,507.000 |
Proposal two:
The approval of the retention of fees paid and the payment of fees payable by Hartford Investment Financial Services, LLC, the Fund’s former investment manager, and HFMC (as applicable) to Wellington Management for its sub-advisory services to the Fund.
| For | Against | Abstain | Uninstructed |
| 21,850,416.330 | 1,151,043.257 | 1,871,438.083 | 5,915,507.000 |
Proposal three:
The authorization of HFMC to select and contract with sub-advisers that are not affiliated with HFMC or the Fund (other than by reason of serving as a sub-adviser to one or more Hartford-sponsored mutual funds) and to materially amend investment sub-advisory agreements without obtaining shareholder approval.
| For | Against | Abstain | Uninstructed |
| 21,201,030.200 | 1,793,032.829 | 1,878,834.641 | 5,915,507.000 |
| 27 |
| Hartford Moderate Allocation Fund |
| Approval of Investment Management and Investment Sub-Advisory Agreements (Unaudited) |
Section 15(c) of the Investment Company Act of 1940, as amended (the “1940 Act”), requires that each mutual fund’s board of directors, including a majority of those directors who are not “interested persons” of the mutual fund, as defined in the 1940 Act (the “Independent Directors”), annually review and consider the continuation of the mutual fund’s investment advisory and sub-advisory agreements. At its meeting held on August 5-6, 2014, the Board of Directors (the “Board”) of The Hartford Mutual Funds, Inc., including each of the Independent Directors, unanimously voted to approve the continuation of the investment management agreement for Hartford Moderate Allocation Fund (formerly The Hartford Balanced Allocation Fund) (the “Fund”) with Hartford Funds Management Company, LLC (“HFMC”) and the continuation of the investment sub-advisory agreement between HFMC and the Fund’s sub-adviser, Wellington Management Company, LLP (the “Sub-adviser,” and together with HFMC, the “Advisers”) (collectively, the “Agreements”).
In the months preceding the August 5-6, 2014 meeting, the Board requested, received and reviewed written responses from the Advisers to questions posed to them on behalf of the Independent Directors and supporting materials relating to those questions and responses. The Board considered information furnished to the Board at its meetings throughout the year, as well as information specifically prepared in connection with the annual approval of the Agreements at the Board’s meetings held on June 17-18, 2014 and August 5-6, 2014. Information provided to the Board at its meetings throughout the year included, among other things, reports on Fund performance, legal and compliance matters, sales and marketing activity, shareholder services, and the other services provided to the Fund by the Advisers and their affiliates. The Board also received in-person presentations by Fund officers and representatives of HFMC at the Board’s meetings on June 17-18, 2014 and August 5-6, 2014 concerning the Agreements.
The Independent Directors, advised by independent legal counsel, engaged service providers to assist them with evaluating the Agreements with respect to the Fund. Lipper Inc. (“Lipper”), an independent provider of investment company data, was retained to provide the Board with reports on how the Fund’s non-management fees, overall expense ratios and investment performance compared to those of mutual funds with similar investment objectives. The Independent Directors also engaged an independent financial services consultant (the “Consultant”) to assist them in evaluating the Fund’s non-management fees, overall expense ratios and investment performance. In addition, the Consultant reviewed the profitability calculations utilized by HFMC in connection with the continuation of the investment management agreement.
In determining whether to continue the Agreements for the Fund, the members of the Board reviewed and evaluated information and factors they believed to be relevant and appropriate in light of the information that the Board deemed necessary and appropriate through the exercise of its reasonable business judgment. While individual members of the Board may have weighed certain factors differently, the Board’s determination to continue the Agreements was based on a comprehensive consideration of all information provided to the Board throughout the year and specifically with respect to the continuation of the Agreements. A more detailed discussion of the factors the Board considered with respect to its approval of the Agreements is provided below.
Nature, Extent and Quality of Services Provided by the Advisers
The Board requested and considered information concerning the nature, extent and quality of the services provided to the Fund by the Advisers. The Board considered, among other things, the terms of the Agreements and the range of services provided by the Advisers. The Board considered the Advisers’ professional personnel who provide services to the Fund, including each Adviser’s ability and experience in attracting and retaining qualified personnel to service the Fund. The Board considered each Adviser’s reputation and overall financial strength, as well as its willingness to consider and implement organizational and operational changes designed to enhance services to the Hartford Funds. In addition, the Board considered the quality of each Adviser’s communications with the Board and responsiveness to Board inquiries and requests made from time to time with respect to the Fund and other Hartford Funds.
The Board also requested and evaluated information concerning each Adviser’s regulatory and compliance environment. In this regard, the Board requested and reviewed information on each Adviser’s compliance policies and procedures, compliance history, and a report from the Fund’s Chief Compliance Officer on each Adviser’s compliance with applicable laws and regulations, including responses to regulatory developments and compliance issues raised by regulators. The Board also noted the Advisers’ support of the Fund’s compliance control structure, particularly the resources devoted by the Advisers in support of the Fund’s obligations pursuant to Rule 38a-1 under the 1940 Act.
With respect to HFMC, the Board noted that, under the Agreements, HFMC is responsible for the management of the Fund, including oversight of fund operations and service providers, and provides administrative and investment advisory services in connection with selecting, monitoring and supervising the Sub-adviser. The Board considered HFMC’s ongoing monitoring of people, process and performance, including its quarterly reviews of each of the Hartford Funds, semi-annual meetings with the leaders of each Fund’s portfolio management team, and oversight of the Hartford Funds’ approximately 66 portfolio managers. The Board recognized that HFMC has demonstrated a record of making changes to the management and/or strategies of the Hartford Funds when warranted. The Board considered HFMC’s oversight of the Sub-adviser’s investment
| 28 |
| Hartford Moderate Allocation Fund |
| Approval of Investment Management and Investment Sub-Advisory Agreements (Unaudited) – (continued) |
approach and results, process for monitoring best execution of portfolio trades by the Sub-adviser, and approach to risk management with respect to the Fund and the service providers to the Fund. The Board also considered HFMC’s oversight of compliance with the Fund’s objective and policies as well as with applicable laws and regulations, noting that regulatory and other developments had over time led to an increase in the scope of HFMC’s services in this regard.
In addition, the Board considered HFMC’s ongoing commitment to review and rationalize the Hartford Funds product line-up and the expenses that HFMC had incurred in connection with fund combinations in recent years. The Board considered that HFMC or its affiliates are responsible for providing the Fund’s officers.
With respect to the Sub-adviser, which provides certain day-to-day portfolio management services for the Fund, the Board considered the quality of the Fund’s portfolio managers, the Sub-adviser’s other investment personnel, its investment philosophy and process, investment research capabilities and resources, performance record, trade execution capabilities and experience. The Board considered the experience of the Fund’s portfolio managers, the number of accounts managed by the portfolio managers, and the Sub-adviser’s method for compensating the portfolio managers.
Based on these considerations, the Board concluded that it was satisfied with the nature, extent and quality of the services provided to the Fund by HFMC and the Sub-adviser.
Performance of the Fund and the Advisers
The Board considered the investment performance of the Fund. In this regard, the Board reviewed the performance of the Fund over different time periods presented in the materials and evaluated HFMC’s analysis of the Fund’s performance for these time periods. The Board considered information and materials provided to the Board by the Advisers concerning Fund performance, as well as information from Lipper comparing the investment performance of the Fund to an appropriate benchmark and universe of peer funds. The Board noted that the Fund’s performance was in the 5th quintile of its performance universe for the 1- and 3-year periods and in the 4th quintile for the 5-year period. The Board also noted that the Fund’s performance was below its blended custom benchmark for the 1- and 3-year periods and above its blended custom benchmark for the 5-year period. In considering the Fund’s performance record, the Board noted that the Fund had transitioned to Wellington Management Company, LLP as sub-adviser in 2012.
The Board considered the detailed investment analytics reports provided by Hartford Funds’ Investment Advisory Group throughout the year. These reports include, among other things, information on the Fund’s gross and net returns, the Fund’s investment performance relative to an appropriate benchmark and peer group, various statistics concerning the Fund’s portfolio, and a narrative summary of various factors affecting Fund performance. The Board considered the Advisers’ cooperation with the Investment Committee, which assists the Board in evaluating the performance of the Fund at periodic meetings throughout the year. The Board also considered the analysis provided by the Consultant relating to the Fund’s performance track record.
In light of all the considerations noted above, the Board concluded that it had continued confidence in HFMC’s and the Sub-adviser’s overall capabilities to manage the Fund.
Costs of the Services and Profitability of the Advisers
The Board reviewed information regarding HFMC’s cost to provide investment management and related services to the Fund and HFMC’s profitability, both overall and for the Fund, on a pre-tax basis without regard to distribution expenses. The Board also requested and reviewed information about the profitability to HFMC and its affiliates from all services provided to the Fund and all aspects of their relationship with the Fund. The Board also requested and received information relating to the operations and profitability of the Sub-adviser.
The Board considered the Consultant’s review of the profitability calculations used by HFMC in connection with the continuation of the investment management agreement, noting the Consultant’s view that Hartford Funds’ process for calculating and reporting Fund profitability is reasonable. In this regard, the Board noted that the Consultant performed a full review of this process in light of the recent restructuring of the Hartford Funds business and reported that the approach to analyzing Fund profitability, including the use of common expense allocation methodologies, is reasonable, sound and well within common industry practice.
Based on these considerations, the Board concluded that the profits anticipated to be realized by the Advisers and their affiliates from their relationships with the Fund would not be excessive.
| 29 |
| Hartford Moderate Allocation Fund |
| Approval of Investment Management and Investment Sub-Advisory Agreements (Unaudited) – (continued) |
Comparison of Fees and Services Provided by the Advisers
The Board considered comparative information with respect to the management fees to be paid by the Fund to HFMC and the total expense ratios of the Fund. The Board also considered comparative information with respect to the sub-advisory fees to be paid by HFMC to the Sub-adviser. In this regard, the Board requested and reviewed information from HFMC and the Sub-adviser relating to the management and sub-advisory fees, including the sub-advisory fee schedule for the Fund, and total operating expenses for the Fund. With respect to the sub-advisory fee schedule, the Board considered representations from HFMC and the Sub-adviser that the Sub-adviser’s fees were negotiated at arm’s length on a fund-by-fund basis. The Board also reviewed information from Lipper comparing the Fund’s overall expense ratios relative to a group of funds selected by Lipper, in consultation with the Consultant, and a broader universe of funds selected by Lipper. The Board considered that the Fund’s total expenses (less 12b-1 and shareholder service fees) were in the 4th quintile. The Board noted that the Fund has an automatically renewable contractual expense cap on each share class.
While the Board recognized that comparisons between the Fund and peer funds may be imprecise, given the different service levels and characteristics of mutual funds and the different business models and cost structures of the Advisers, the comparative information provided by Lipper assisted the Board in evaluating the reasonableness of the Fund’s total operating expenses. In addition, the Board considered the analysis and recommendations of the Consultant relating to the Fund’s total operating expenses.
Based on these considerations, the Board concluded that the Fund’s fees and total operating expenses, in conjunction with the information about quality of services, profitability, economies of scale, and other matters discussed, were reasonable in light of the services provided.
Economies of Scale
The Board requested and considered information regarding the Advisers’ realization of economies of scale with respect to the Fund and whether the fee levels reflect these economies of scale for the benefit of the Fund’s shareholders. The Board reviewed the breakpoints in the management fee schedule for the Fund, which reduce fee rates as Fund assets grow over time. The Board recognized that a fund with assets beyond the highest breakpoint level will continue to benefit from economies of scale because additional assets are charged the lowest breakpoint fee resulting in lower overall effective management fee rates. The Board also considered that expense limitations and fee waivers that reduce the Fund’s expenses at all asset levels can have the same effect as breakpoints in sharing economies of scale with shareholders and provide protection from an increase in expenses if Fund assets decline. The Board recognized that a fee schedule that reaches a lower breakpoint quickly provides shareholders with the benefit of anticipated or potential economies of scale. The Board also considered that HFMC has been active in managing expenses, which has resulted in benefits being realized by shareholders as assets within the Hartford Funds family of funds have grown over time, including through lower transfer agent costs and other operating expenses.
After considering all of the information available to it, the Board concluded that it was satisfied with the extent to which economies of scale would be shared for the benefit of the Fund’s shareholders based on currently available information and the effective advisory fees and expense ratios for the Fund at its current and reasonably anticipated asset levels. The Board noted, however, that it would continue to monitor future growth in Fund assets and the appropriateness of additional breakpoints.
Other Benefits
The Board considered other benefits to the Advisers and their affiliates from their relationships with the Fund.
The Board noted that HFMC receives fees for fund accounting and related services from the Fund, and the Board considered information on profits to HFMC for such services. The Board also considered that Hartford Administrative Services Company (“HASCO”), the Fund’s transfer agent and an affiliate of HFMC, receives transfer agency compensation from the Fund, and the Board reviewed information on the profitability of the Fund’s transfer agency function to HASCO. The Board considered information provided by HASCO indicating that the transfer agent fees charged by HASCO to the Fund were fair and reasonable based on publicly available information.
The Board also considered that Hartford Funds Distributors, LLC (“HFD”), an affiliate of HFMC, serves as principal underwriter of the Fund. As principal underwriter, HFD receives 12b-1 fees from the Fund and receives all or a portion of the sales charges on sales or redemptions of certain classes of shares. The Board also noted that certain affiliates of HFD distribute shares of the Fund and receive compensation in that connection.
| 30 |
| Hartford Moderate Allocation Fund |
| Approval of Investment Management and Investment Sub-Advisory Agreements (Unaudited) – (continued) |
The Board considered the benefits, if any, to the Sub-adviser from any use of the Fund’s brokerage commissions to obtain soft dollar research, and representations from HFMC and the Sub-adviser that the Sub-adviser would not make any revenue-sharing payments or any other type of distribution payments to HFMC or its affiliates.
The Board considered the benefits to shareholders of being part of the Hartford Funds family of funds, including the right to exchange investments between the same class of funds without a sales charge, the ability to reinvest Fund dividends into other funds in the family, and the ability to combine holdings in the Fund with holdings in other funds to obtain a reduced sales charge. The Board considered HFMC’s efforts to provide investors in the family with a broad range of investment styles and asset classes and its entrepreneurial risk in initiating new funds to expand these opportunities for shareholders.
* * * *
Based upon its review of these various factors, among others, the Board concluded that it is in the best interests of the Fund and its shareholders for the Board to approve the Agreements for an additional year. In reaching this decision, the Board did not assign relative weights to the factors discussed above or deem any one or group of them to be controlling in and of themselves. In connection with their deliberations, the Independent Directors met separately in executive session on several occasions, with independent legal counsel and the Consultant, to review the relevant materials and consider their responsibilities under relevant laws and regulations.
| 31 |
| Hartford Moderate Allocation Fund |
| Main Risks (Unaudited) |
The main risks of investing in the Fund are described below.
Market, Selection and Strategy Risk: The Fund’s share price may fluctuate due to market risk and/or security selections that may underperform the market or relevant benchmarks. If the sub-adviser's investment strategy does not perform as expected, the Fund could underperform its peers or lose money. There is no guarantee the Fund will achieve its stated objective.
Fund of Funds Risk:The Fund invests in a number of Underlying Funds, and is subject to the risks of the Underlying Funds in direct proportion to the amount of assets it invests in each Underlying Fund. The Underlying Funds may invest in the following: foreign securities including emerging markets, fixed income securities (which carry credit and interest rate risk) including junk bonds, small- and mid-cap stocks, mortgage- and asset-backed securities, and derivatives.
Asset Allocation Strategy Risk: The portfolio managers' asset allocation strategy may not always work as intended, and asset allocation does not guarantee better performance or reduce the risk of investment loss.
| 32 |
THIS PRIVACY POLICY IS NOT PART OF THIS REPORT
Privacy Policy and Practices of The Hartford Financial Services Group, Inc. and its Affiliates
(herein called “we, our and us”)
This Privacy Policy applies to our United States Operations
We value your trust. We are committed to the responsible: a) management; b) use; and c) protection; of Personal Information.
This notice describes how we collect, disclose, and protect Personal Information.
We collect Personal Information to: a) service your Transactions with us; and b) support our business functions.
We may obtain Personal Information from: a) You; b) your Transactions with us; and c) third parties such as a consumer-reporting agency.
Based on the type of product or service You apply for or get from us, Personal Information such as: a) your name; b) your address; c) your income; d) your payment; or e) your credit history; may be gathered from sources such as applications, Transactions, and consumer reports.
To serve You and service our business, we may share certain Personal Information. We will share Personal Information, only as allowed by law, with affiliates such as: a) our insurance companies; b) our employee agents; c) our brokerage firms; and d) our administrators.
As allowed by law, we may share Personal Financial Information with our affiliates to: a) market our products; or b) market our services; to You without providing You with an option to prevent these disclosures.
|
We may also share Personal Information, only as allowed by law, with unaffiliated third parties including: a) independent agents; b) brokerage firms; c) insurance companies; d) administrators; and e) service providers; who help us serve You and service our business.
When allowed by law, we may share certain Personal Financial Information with other unaffiliated third parties who assist us by performing services or functions such as: a) taking surveys; b) marketing our products or services; or c) offering financial products or services under a joint agreement between us and one or more financial institutions.
We, and third parties we partner with, may track some of the pages You visit through the use of: a) cookies; b) pixel tagging; or c) other technologies; and currently do not process or comply with any web browser’s “do not track” signal or similar mechanism that indicates a request to disable online tracking of individual users who visit our websites or use our services.
We will not sell or share your Personal Financial Information with anyone for purposes unrelated to our business functions without offering You the opportunity to: a) “opt-out;” or b) “opt-in;” as required by law.
We only disclose Personal Health Information with: a) your proper written authorization; or b) as otherwise allowed or required by law.
Our employees have access to Personal Information in the course of doing their jobs, such as: a) underwriting policies; b) paying claims; c) developing new products; or d) advising customers of our products and services.
|
We use manual and electronic security procedures to maintain: a) the confidentiality; and b) the integrity of; Personal Information that we have. We use these procedures to guard against unauthorized access.
Some techniques we use to protect Personal Information include: a) secured files; b) user authentication; c) encryption; d) firewall technology; and e) the use of detection software.
We are responsible for and must: a) identify information to be protected; b) provide an adequate level of protection for that data; c) grant access to protected data only to those people who must use it in the performance of their job-related duties.
Employees who violate our Privacy Policy will be subject to discipline, which may include ending their employment with us.
At the start of our business relationship, we will give You a copy of our current Privacy Policy.
We will also give You a copy of our current Privacy Policy once a year if You maintain a continuing business relationship with us.
We will continue to follow our Privacy Policy regarding Personal Information even when a business relationship no longer exists between us.
|
As used in this Privacy Notice:
Application means your request for our product or service.
Personal Financial Information means financial information such as: a) credit history; b) income; c) financial benefits; or d) policy or claim information.
Personal Health Information means health information such as: a) your medical records; or b) information about your illness, disability or injury.
Personal Information means information that identifies You personally and is not otherwise available to the public. It includes: a) Personal Financial Information; and b) Personal Health Information.
Transaction means your business dealings with us, such as: a) your Application; b) your request for us to pay a claim; and c) your request for us to take an action on your account.
You means an individual who has given us Personal Information in conjunction with: a) asking about; b) applying for; or c) obtaining; a financial product or service from us if the product or service is used mainly for personal, family, or household purposes.
|
This Privacy Policy is being provided on behalf of the following affiliates of The Hartford Financial Services Group, Inc.:
1stAGChoice, Inc.; Access CoverageCorp, Inc.; Access CoverageCorp Technologies, Inc.; American Maturity Life Insurance Company; Archway 60 R, LLC; Business Management Group, Inc.; Champlain Life Reinsurance Company; DMS R, LLC; Eloy R, LLC; Ersatz Corporation; First State Insurance Company; Hartford Accident and Indemnity Company; Hartford Administrative Services Company; Hartford Casualty General Agency, Inc.; Hartford Casualty Insurance Company; Hartford-Comprehensive Employee Benefit Service Company; Hartford Equity Sales Company, Inc.; Hartford Fire General Agency, Inc.; Hartford Fire Insurance Company; Hartford Funds Management Company, LLC; Hartford Funds Management Group, Inc.; Hartford HLS Series Fund II, Inc.; Hartford Insurance Company of Illinois; Hartford Insurance Company of the Midwest; Hartford Insurance Company of the Southeast; Hartford Integrated Technologies, Inc.; Hartford International Life Reassurance Corporation; Hartford Funds Distributors, LLC; Hartford Investment Management Company; Hartford Life and Accident Insurance Company; Hartford Life and Annuity Insurance Company; Hartford Life Insurance Company; Hartford Life Private Placement, LLC; Hartford Lloyd’s Corporation; Hartford Lloyd’s Insurance Company; Hartford Mezzanine Investors I, LLC; Hartford Residual Market, L.C.C.; Hartford Retirement Services, LLC; Hartford Securities Distribution Company, Inc.; Hartford Series Fund, Inc.; Hartford Specialty Insurance Services of Texas, LLC; Hartford Strategic Investments, LLC; Hartford Underwriters Insurance Company; Hartford Technology Services Company, L.L.C.; Hartford of Texas General Agency, Inc.; Hartford Underwriters General Agency, Inc.; HARTRE Company, L.C.C.; HL Investment Advisors, LLC; HLA LLC; Horizon Management Group, LLC; HRA Brokerage Services, Inc.; Lanidex Class B, LLC; M-CAP Insurance Agency, LLC; New England Insurance Company; New England Reinsurance Corporation; Nutmeg Insurance Agency, Inc.; Nutmeg Insurance Company; Pacific Insurance Company, Limited; Planco, LLC: Property and Casualty Insurance Company of Hartford; Revere R, LLC; RVR R, LLC; Sentinel Insurance Company, Ltd.; Sunstone R, LLC; Symphony R, LLC; The Evergreen Group Incorporated; The Hartford Alternative Strategies Fund; The Hartford Mutual Funds, Inc.; The Hartford Mutual Funds II, Inc.; Trumbull Flood Management, L.L.C.; Trumbull Insurance Company; Twin City Fire Insurance Company; White River Life Reinsurance Company.
HPP Revised January 2014
HARTFORDFUNDS
hartfordfunds.com
This information is written in connection with the promotion or marketing of the matter(s) addressed in this material.
This report is submitted for the general information of the shareholders of the Fund. It is not authorized for distribution unless preceded or accompanied by a current prospectus for the Fund.
The information cannot be used or relied upon for the purpose of avoiding IRS penalties. These materials are not intended to provide tax, accounting or legal advice. As with all matters of a tax or legal nature, you should consult your own tax or legal counsel for advice.
Investors should carefully consider the investment objectives, risks, charges, and expenses of Hartford Funds before investing. This and other information can be found in the prospectus and summary prospectus, which can be obtained by calling 888-843-7824 (retail) or 800-279-1541 (institutional). Investors should read them carefully before they invest.
Hartford Funds are underwritten and distributed by Hartford Funds Distributors, LLC.
MFAR-MAL14 12/14 113962-3 Printed in U.S.A.
HARTFORDFUNDS
|
HARTFORD MULTI-ASSET INCOME FUND
2014 Annual Report |
A MESSAGE FROM THE PRESIDENT
Dear Fellow Shareholders:
Thank you for investing in Hartford Funds.
Market Review
U.S. equities (as represented by the S&P 500 Index) rose steadily for the fiscal year ended October 31, 2014, with a return of 17.27% for the period. With the exception of short-lived geopolitical scares early in 2014 and concerns about continuing global growth near the end of the period, stocks generally rose on solid fundamentals and encouraging macroeconomic data during the year.
September 2014 marked the six-year anniversary of the start of the financial crisis. Within weeks of that anniversary, both the S&P 500 Index and the Dow Jones Industrial Average set new all-time highs, closing at 2,018 and 17,391, respectively, on October 31. Although the fallout of the crisis continues to influence investor behavior, stocks have recovered and risen dramatically, up 198% from their low in March 2009. Meanwhile, the domestic economy is notching strong growth, and the unemployment rate has reached its lowest level since August 2008.
While the U.S. economy appears to have stabilized and to have reverted to a solid growth path, the outlook for the global economy appears to have gotten cloudier. The U.S. Federal Reserve has ended quantitative easing, while Europe and Japan are pursuing stimulus options to avoid a double-dip recession and deflation, respectively. Diverging central-bank policies will likely continue to play an important role in market movements going forward as investors wait to see the reactions to their efforts and their impacts on global markets.
How have market movements impacted your portfolio throughout the last year? Are your investments still on track to provide the growth or income you need, and are you comfortable with their progress during times of volatility?
Your financial professional can help you navigate today’s markets with confidence, as well as assist you to achieve your investment goals by providing advice on the best options within our fund family to help you work toward overcoming today’s investing challenges. Meet with your financial advisor regularly to examine your portfolio and your investment strategy, and to determine if you’re still on track to meet your goals.
Thank you again for investing with Hartford Funds.
James Davey
President
Hartford Funds
1 The S&P 500 Index is a market capitalization-weighted price index composed of 500 widely held common stocks.
2 The Dow Jones Industrial Average is an unmanaged, price-weighted index of 30 of the largest, most widely held stocks traded on the NYSE
Hartford Multi-Asset Income Fund
Table of Contents
The views expressed in the Fund’s Manager Discussion under ‘‘Why did the Fund perform this way?’’ and ‘‘What is the outlook?’’ are views of the Fund’s sub-adviser and portfolio management team through the end of the period and are subject to change based on market and other conditions. The Fund’s Manager Discussion is for informational purposes only and does not represent an offer, recommendation or solicitation to buy, hold or sell any security. The specific securities identified and described, if any, do not represent all of the securities purchased or sold and you should not assume that investments in the securities identified and discussed will be profitable.
| Hartford Multi-Asset Income Fund inception 04/30/2014 |
| (sub-advised by Wellington Management Company, LLP) |
| Investment objective – The Fund seeks to provide a high level of current income consistent with growth of capital. |
Performance Overview 4/30/14 - 10/31/14
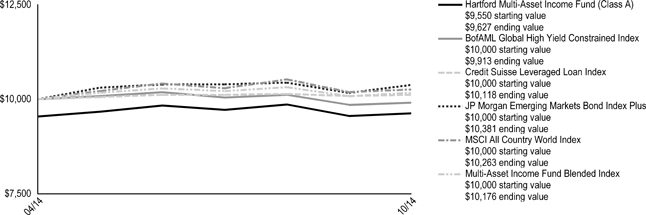
The chart above represents the hypothetical growth of a $10,000 investment in Class A, which includes a sales charge. Growth results in classes other than Class A will vary from what is seen above due to differences in the expenses charged to those share classes.
Cumulative Returns (as of 10/31/14)
| Since Inception▲ | ||||
| Multi-Asset Income A# | 0.80 | % | ||
| Multi-Asset Income A## | -3.73 | % | ||
| Multi-Asset Income C# | 0.37 | % | ||
| Multi-Asset Income C## | -0.62 | % | ||
| Multi-Asset Income I# | 0.92 | % | ||
| Multi-Asset Income R3# | 0.64 | % | ||
| Multi-Asset Income R4# | 0.78 | % | ||
| Multi-Asset Income R5# | 0.88 | % | ||
| Multi-Asset Income Y# | 0.93 | % | ||
| BofAML Global High Yield Constrained Index | -0.87 | % | ||
| Credit Suisse Leveraged Loan Index | 1.18 | % | ||
| JP Morgan Emerging Markets Bond Index Plus | 3.81 | % | ||
| MSCI All Country World Index | 2.63 | % | ||
| Multi-Asset Income Fund Blended Index | 1.91 | % | ||
| ▲ | Inception: 04/30/2014. Cumulative returns not annualized. |
| # | Without sales charge |
| ## | With sales charge |
PERFORMANCE DATA QUOTED REPRESENTS PAST PERFORMANCE AND DOES NOT GUARANTEE FUTURE RESULTS. The investment return and principal value of the investment will fluctuate so that investors’ shares, when redeemed, may be worth more or less than their original cost. Current performance may be lower or higher than the performance data quoted. To obtain performance data current to the most recent month-end, please visit our website www.hartfordfunds.com.
The initial investment in Class A shares reflects the maximum sales charge of 4.50% and returns for Class C shares reflect a contingent deferred sales charge of up to 1.00% on shares redeemed within twelve months of purchase.
Total returns presented above were calculated using the Fund’s net asset value available to shareholders for sale or redemption of Fund shares on October 31, 2014, which may exclude investment transactions as of this date. All share class returns assume the reinvestment of all distributions at net asset value and the deduction of all fund expenses.
Bank of America Merrill Lynch Global High Yield Constrained Index tracks the performance of below investment grade bonds of corporate issuers domiciled in countries with an investment grade foreign currency long-term debt rating (based on a composite of Moody's Investors Service, Inc. and Standard and Poor's Ratings Services). The index is weighted by outstanding issuance, but constrained such that the percentage of any one issuer may not represent more than 2% of the Index.
Credit Suisse Leveraged Loan Index is a market-value weighted index designed to represent the investable universe of the U.S. dollar-denominated leveraged loan market.
JP Morgan Emerging Markets Bond Index Plus (EMBI+) is JP Morgan's most liquid U.S. dollar emerging market debt benchmark, and tracks total returns for actively traded external debt instruments in emerging markets. Included in the EMBI+ are U.S. dollar-denominated Brady bonds, Eurobonds, and traded loans issued by sovereign entities.
MSCI All Country World Index is a free float-adjusted market capitalization index that measures equity market performance in the global developed and emerging markets, consisting of 45 developed and emerging market country indices.
Multi-Asset Income Fund Blended Index is calculated by Hartford Funds Management Company, LLC and represents the weighted return of 30% MSCI All Country World Index, 23.4% Bank of America Merrill Lynch Global High Yield Constrained Index, 23.3% JP Morgan Emerging Markets Bond Index Plus and 23.3% Credit Suisse Leveraged Loan Index.
You cannot invest directly in an index.
The chart and table do not reflect the deductions of taxes that a shareholder would pay on Fund distributions or the redemption of Fund shares.
Performance information may reflect historical or current expense waivers/reimbursements from the investment adviser, without which performance would have been lower. For information on current expense waivers/reimbursements, please see the prospectus.
| 2 |
Hartford Multi-Asset Income Fund
Manager Discussion
October 31, 2014 (Unaudited)
| Operating Expenses* | ||||||||
| Net | Gross | |||||||
| Multi-Asset Income Class A | 1.12 | % | 1.25 | % | ||||
| Multi-Asset Income Class C | 1.87 | % | 2.00 | % | ||||
| Multi-Asset Income Class I | 0.87 | % | 1.00 | % | ||||
| Multi-Asset Income Class R3 | 1.42 | % | 1.55 | % | ||||
| Multi-Asset Income Class R4 | 1.12 | % | 1.25 | % | ||||
| Multi-Asset Income Class R5 | 0.93 | % | 0.95 | % | ||||
| Multi-Asset Income Class Y | 0.83 | % | 0.85 | % | ||||
| * | As shown in the Fund's most recent prospectus. Actual expenses may be higher or lower. Please see accompanying Financial Highlights for expense ratios for the period ended October 31, 2014. |
Gross expenses are the Fund's total annual operating expenses shown in the Fund's most recent prospectus. Net expenses are the Fund's total annual operating expenses shown in the Fund's most recent prospectus and reflect contractual expense reimbursements in instances when these reductions reduce the Fund's gross expenses. Contractual reimbursements remain in effect until February 29, 2016, and automatically renew for one-year terms unless terminated.
All investments are subject to risk including the possible loss of principal. For a discussion of the Fund’s risks, please see the Main Risks section of this report. For more detailed information on the risks associated with an investment in the Fund, please see the prospectus.
| Portfolio Managers | ||
| Richard P. Meagher, CFA | David J. Elliott, CFA | Campe Goodman, CFA |
| Vice President, Asset Allocation Strategist and Portfolio Manager | Vice President, Co-Director of Quantitative Investments, Director of Quantitative Portfolio Management and Portfolio Manager | Senior Vice President and Fixed Income Portfolio Manager |
How did the Fund perform?
The Class A shares of the Hartford Multi-Asset Income Fund returned 0.80%, before sales charge, for the period April 30, 2014 (commencement of operations) through October 31, 2014, underperforming the Fund’s blended benchmark (30% MSCI All Country World Index, 23.4% Bank of America Merrill Lynch Global High Yield Constrained Index, 23.3% JP Morgan Emerging Markets Bond Index Plus and 23.3% Credit Suisse Leveraged Loan Index) which returned 1.91% for the same period. The Fund also underperformed the 5.48% average return of the Lipper Mixed-Asset Target Allocation Conservative Funds category, a group of funds with equity weights of 20%-40%. For the same period, the MSCI All Country World Index returned 2.63%, the Bank of America Merrill Lynch Global High Yield Constrained Index returned -0.87%, the JP Morgan Emerging Markets Bond Index Plus returned 3.81%, and the Credit Suisse Leveraged Loan Index returned 1.18%.
Why did the Fund perform this way?
Fixed income markets gained throughout much of the period as expectations of prolonged easy monetary policy by major central banks and a supportive macroeconomic environment kept rates low and suppressed volatility. Early in the period emerging markets dominated headlines as economic and political developments sparked risk aversion across global markets, pushing bond prices higher and yields lower amid a flight to quality. Toward the end of the period, however, persistent geopolitical risks – tensions between Ukraine and Russia and violence in Iraq – and Chinese economic slowdown concerns raised questions about the global growth rate, keeping a lid on risk appetites overall.
The period was also highlighted by a divergence in central bank policies. The European Central Bank (ECB) cut its benchmark lending and deposit rates and announced a host of stimulus measures in an effort to encourage lending and fend off fears of deflation. China’s central bank joined the ECB in boosting liquidity by injecting funds into the nation’s largest banks in an attempt to combat weakening growth. The Bank of Japan pre-emptively announced incremental monetary easing to counter the risk of missing the country’s inflation and growth targets. In contrast, the Bank of England and U.S. Federal Reserve (Fed) leaned toward tighter policies. The Fed ended its quantitative easing program as U.S. data largely suggested the economy was on a sustainable growth path. Second quarter gross domestic product (GDP) rebounded after the first quarter’s steep contraction. The labor market strengthened as the unemployment rate dropped to a six-year low. Housing regained some lost ground after a weak start to the year, though the pace of home price appreciation started to slow after a strong 2013. Inflation pressures were muted overall, alleviating pressure on the Fed to raise rates.
The U.S. Treasury curve flattened as markets contemplated bringing interest rates to normal levels; short-term yields rose while longer term rates declined. Most credit risk sectors posted positive absolute returns and outperformed duration-equivalent government bonds as credit spreads tightened.
Global equities rose during the period, notwithstanding bouts of significant volatility. Despite ongoing geopolitical tensions in Ukraine and the Middle East, concerns about a Chinese economic growth slowdown, and unsettling economic and political developments in several other emerging market countries, the five-year-old bull market continued in the first half of 2014. Robust merger and acquisition activity, along with continued accommodative monetary policy from central banks around the globe, aided positive investor sentiment in May and June. However, Portuguese banking woes, European economic malaise, and the prospect of an accelerated Fed interest-rate-hike timeline all contributed to stall the global stock rally near the tail end of the period. In addition, China's property
| 3 |
Hartford Multi-Asset Income Fund
Manager Discussion – (continued)
October 31, 2014 (Unaudited)
slump and poor GDP readings in Japan and the eurozone raised the specter of a slowdown in global economic growth. Nevertheless, there were several positive developments, including monetary easing by the ECB and the People's Bank of China, as well as an encouraging U.S. corporate earnings season. Despite these positives, many market participants found ample reason to reassess their risk appetites (i.e. reduce risks), given the strong performance in recent years. During the period, emerging market equities underperformed their developed market counterparts and U.S. stocks generally outperformed non-U.S. stocks.
The Fund’s opportunistic allocation to Greek government bonds was the primary driver of benchmark-relative underperformance during the period. Falling Greek government bond prices reflected elevated fears about European deflation as well as Greek-specific worries on the political front and regarding the capital adequacy of the banking sector. Offsetting this partially were our opportunistic allocations to Master Limited Parterships (MLPs) and security selection within our global income low volatility equities, which contributed to relative returns over the period. MLPs posted strong gains while Infrastructure equities were a modest drag on performance reflecting the broader weakness in yield-oriented equities. MLPs as an asset class have delivered strong performance in recent years and are trading above their historical valuation range.
Our primary fixed income allocation, the multi-sector credit portfolio managed by Campe Goodman, also added value over the period. The multi-sector credit portfolio seeks to generate high income and total return from a broadly diversified portfolio of credit instruments. Our exposure within high yield credit was the largest contributor to relative performance over the period while bank loans partially offset this positive performance.
We tactically managed exposures to high yield credit, investment grade credit and commercial mortgage backed securities through credit default swap index exposure, which contributed positively to overall performance. Additionally, we utilized derivatives in the Fund to tactically manage duration.
What is the outlook?
We believe the global cycle continues to advance at a moderate pace with a mix of stronger growth in the U.S. and more sluggish activity in Europe, Japan, and China. We believe that the U.S. economy is on track for a self-sustaining expansion. After three years of fiscal consolidation, this policy drag is starting to fade, which we believe should support growth. Meanwhile, investment spending appears to be picking up. Wage trends and inflation appear to have been quite muted in the U.S., yet below the surface it appears that U.S. firms are having a tougher time finding qualified labor, which we believe suggests that wages will rise in 2015 with an improving labor market.
Reflecting these trends, we retain a constructive view on capital markets and risk assets. At the end of the period, our opportunistic allocations remained in MLPs, infrastructure equities and Greek government debt, all of which we believe continue to offer attractive income opportunities. At the end of the period, the Fund’s fixed income allocation was at 78%, slightly above the Fund’s 70% strategic allocation.
| 4 |
Hartford Multi-Asset Income Fund
Manager Discussion – (continued)
October 31, 2014 (Unaudited)
| Diversification by Country |
| as of October 31, 2014 |
| Percentage of | ||||
| Country | Net Assets | |||
| Angola | 0.2 | % | ||
| Argentina | 0.4 | |||
| Armenia | 0.1 | |||
| Australia | 0.7 | |||
| Azerbaijan | 0.3 | |||
| Belgium | 0.5 | |||
| Brazil | 1.8 | |||
| British Virgin Islands | 0.5 | |||
| Canada | 1.9 | |||
| China | 0.8 | |||
| Colombia | 0.9 | |||
| Costa Rica | 0.2 | |||
| Croatia | 0.1 | |||
| Czech Republic | 0.1 | |||
| Denmark | 0.1 | |||
| Dominican Republic | 0.2 | |||
| Finland | 0.1 | |||
| France | 1.9 | |||
| Germany | 0.7 | |||
| Greece | 3.3 | |||
| Hong Kong | 0.9 | |||
| Hungary | 0.2 | |||
| India | 0.3 | |||
| Indonesia | 1.1 | |||
| Ireland | 0.4 | |||
| Israel | 0.8 | |||
| Italy | 0.3 | |||
| Japan | 1.4 | |||
| Kazakhstan | 0.2 | |||
| Kenya | 0.0 | |||
| Lithuania | 0.3 | |||
| Luxembourg | 1.5 | |||
| Malaysia | 0.3 | |||
| Marshall Islands | 0.1 | |||
| Mexico | 1.9 | |||
| Netherlands | 0.4 | |||
| New Zealand | 0.0 | |||
| Nigeria | 0.3 | |||
| Norway | 0.2 | |||
| Panama | 0.1 | |||
| Peru | 0.3 | |||
| Philippines | 0.4 | |||
| Poland | 0.0 | |||
| Romania | 0.5 | |||
| Russia | 1.4 | |||
| Singapore | 0.2 | |||
| South Africa | 0.4 | |||
| South Korea | 0.1 | |||
| Spain | 2.6 | |||
| Sweden | 0.1 | |||
| Switzerland | 1.2 | |||
| Taiwan | 0.5 | |||
| Thailand | 0.2 | |||
| Turkey | 1.2 | |||
| Ukraine | 0.3 | |||
| United Kingdom | 3.3 | |||
| Uruguay | 0.4 | |||
| Venezuela | 0.3 | |||
| United States | 66.3 | |||
| Short-Term Investments | 2.2 | |||
| Purchased Options | 0.0 | |||
| Other Assets and Liabilities | (7.4 | ) | ||
| Total | 100.0 | % |
| Credit Exposure |
| as of October 31, 2014 |
| Credit Rating * | Percentage
of Net Assets | |||
| Aaa/ AAA | 8.4 | % | ||
| A | 0.3 | |||
| Baa/ BBB | 8.9 | |||
| Ba/ BB | 17.9 | |||
| B | 27.3 | |||
| Caa/ CCC or Lower | 12.3 | |||
| Not Rated | 4.0 | |||
| Non-Debt Securities and Other Short-Term Instruments | 28.3 | |||
| Other Assets and Liabilities | (7.4 | ) | ||
| Total | 100.0 | % |
| * | Credit exposure is the long-term credit ratings for the Fund's holdings, as of the date noted, as provided by Standard and Poor's (S&P) or Moody's Investors Service (Moody's) and typically range from AAA/Aaa (highest) to C/D (lowest). Presentation of S&P and Moody's credit ratings in this report have been selected for informational purposes for shareholders, as well as the Fund's consideration of industry practice. If Moody's and S&P assign different ratings, the lower rating is used. Fixed income securities that are not rated by either agency are listed as "Not Rated." Ratings do not apply to the Fund itself or to the Fund's shares. Ratings may change. |
| Diversification by Security Type |
| as of October 31, 2014 |
| Category | Percentage
of Net Assets | |||
| Equity Securities | ||||
| Common Stocks | 26.0 | % | ||
| Preferred Stocks | 0.1 | |||
| Total | 26.1 | % | ||
| Fixed Income Securities | ||||
| Asset & Commercial Mortgage Backed Securities | 10.8 | % | ||
| Corporate Bonds | 16.7 | |||
| Foreign Government Obligations | 14.0 | |||
| Municipal Bonds | 0.4 | |||
| Senior Floating Rate Interests | 28.6 | |||
| U.S. Government Agencies | 8.6 | |||
| Total | 79.1 | % | ||
| Short-Term Investments | 2.2 | |||
| Purchased Options | 0.0 | |||
| Other Assets and Liabilities | (7.4 | ) | ||
| Total | 100.0 | % | ||
| 5 |
Hartford Multi-Asset Income Fund
Schedule of Investments
October 31, 2014
(000’s Omitted)
| Shares or Principal Amount ╬ | Market Value ╪ | |||||||
| Asset and Commercial Mortgage Backed Securities - 10.8% | ||||||||
| Finance and Insurance - 10.8% | ||||||||
| Adjustable Rate Mortgage Trust | ||||||||
| $ | 79 | 0.42%, 11/25/2035 Δ | $ | 73 | ||||
| Banc of America Funding Corp. | ||||||||
| 723 | 0.39%, 02/20/2047 Δ | 623 | ||||||
| Bear Stearns Adjustable Rate Mortgage Trust | ||||||||
| 457 | 4.99%, 06/25/2047 Δ | 408 | ||||||
| Bear Stearns Alt-A Trust | ||||||||
| 103 | 0.47%, 08/25/2036 Δ | 78 | ||||||
| 466 | 0.63%, 02/25/2036 Δ | 385 | ||||||
| 88 | 0.67%, 11/25/2035 Δ | 72 | ||||||
| 69 | 2.63%, 09/25/2035 Δ | 63 | ||||||
| 226 | 2.70%, 08/25/2036 Δ | 165 | ||||||
| CHL Mortgage Pass-Through Trust | ||||||||
| 590 | 0.49%, 03/25/2035 Δ | 509 | ||||||
| 731 | 2.42%, 06/20/2035 Δ | 701 | ||||||
| Countrywide Alternative Loan Trust | ||||||||
| 42 | 0.29%, 04/25/2047 Δ | 35 | ||||||
| 270 | 0.42%, 01/25/2036 Δ | 240 | ||||||
| 966 | 0.60%, 04/25/2037 Δ | 647 | ||||||
| 487 | 0.65%, 12/25/2035 Δ | 350 | ||||||
| Countrywide Home Loans, Inc. | ||||||||
| 809 | 4.87%, 11/20/2035 Δ | 726 | ||||||
| 187 | 5.75%, 08/25/2037 | 179 | ||||||
| Downey S & L Association Mortgage Loan Trust | ||||||||
| 62 | 1.04%, 03/19/2046 Δ | 48 | ||||||
| GSAA Home Equity Trust | ||||||||
| 1,099 | 0.22%, 12/25/2046 Δ | 625 | ||||||
| 157 | 0.24%, 12/25/2036 Δ | 78 | ||||||
| 907 | 0.38%, 04/25/2047 Δ | 582 | ||||||
| 953 | 0.45%, 03/25/2036 Δ | 672 | ||||||
| 71 | 0.47%, 04/25/2047 Δ | 46 | ||||||
| 493 | 5.98%, 06/25/2036 | 289 | ||||||
| GSR Mortgage Loan Trust | ||||||||
| 656 | 2.74%, 01/25/2036 Δ | 607 | ||||||
| Harborview Mortgage Loan Trust | ||||||||
| 96 | 0.40%, 03/19/2036 Δ | 70 | ||||||
| 488 | 0.51%, 01/19/2035 Δ | 341 | ||||||
| Home Equity Loan Trust | ||||||||
| 625 | 0.31%, 04/25/2037 Δ | 430 | ||||||
| 336 | 2.45%, 11/25/2035 Δ | 316 | ||||||
| IndyMac Index Mortgage Loan Trust | ||||||||
| 86 | 0.35%, 10/25/2036 Δ | 74 | ||||||
| 197 | 0.39%, 07/25/2035 Δ | 175 | ||||||
| JP Morgan Chase Commercial Mortgage Securities Corp. | ||||||||
| 100 | 4.00%, 08/15/2046 ■ | 87 | ||||||
| JP Morgan Mortgage Trust | ||||||||
| 121 | 2.71%, 05/25/2036 Δ | 107 | ||||||
| Lehman XS Trust | ||||||||
| 46 | 0.41%, 11/25/2035 Δ | 32 | ||||||
| Luminent Mortgage Trust | ||||||||
| 432 | 0.35%, 02/25/2046 Δ | 317 | ||||||
| 747 | 0.39%, 04/25/2036 Δ | 502 | ||||||
| Master Adjustable Rate Mortgages Trust | ||||||||
| 369 | 0.39%, 05/25/2037 Δ | 250 | ||||||
| Morgan Stanley ABS Capital I | ||||||||
| 568 | 0.30%, 06/25/2036 Δ | 416 | ||||||
| Morgan Stanley BAML Trust | ||||||||
| 90 | 4.50%, 08/15/2045 ■ | 69 | ||||||
| Morgan Stanley Mortgage Loan Trust | ||||||||
| 608 | 2.59%, 05/25/2036 Δ | 441 | ||||||
| RBSGC Mortage Pass Through Certificates | ||||||||
| 362 | 6.25%, 01/25/2037 | 339 | ||||||
| Residential Accredit Loans, Inc. | ||||||||
| 370 | 0.37%, 02/25/2046 Δ | 177 | ||||||
| 592 | 1.41%, 11/25/2037 Δ | 377 | ||||||
| Residential Funding Mortgage Securities, Inc. | ||||||||
| 592 | 6.00%, 07/25/2037 | 537 | ||||||
| Sequoia Mortgage Trust | ||||||||
| 252 | 0.43%, 01/20/2035 ╦Δ | 241 | ||||||
| Structured Adjustable Rate Mortgage Loan Trust | ||||||||
| 99 | 0.34%, 07/25/2037 Δ | 73 | ||||||
| UBS-Barclays Commercial Mortgage Trust | ||||||||
| 60 | 4.23%, 03/10/2046 ■Δ | 50 | ||||||
| WaMu Mortgage Pass-Through Certificates | ||||||||
| 445 | 1.10%, 07/25/2046 Δ | 378 | ||||||
| 590 | 4.61%, 08/25/2036 Δ | 540 | ||||||
| Washington Mutual, Inc. | ||||||||
| 529 | 0.94%, 12/25/2046 Δ | 434 | ||||||
| Wells Fargo Alternative Loan Trust | ||||||||
| 165 | 2.60%, 12/28/2037 Δ | 132 | ||||||
| Wells Fargo Mortgage Backed Securities Trust | ||||||||
| 150 | 2.49%, 10/25/2036 Δ | 139 | ||||||
| WF-RBS Commercial Mortgage Trust | ||||||||
| 46 | 5.00%, 04/15/2045 ■ | 35 | ||||||
| 15,280 | ||||||||
| Total Asset and Commercial Mortgage Backed Securities | ||||||||
| (Cost $15,559) | $ | 15,280 | ||||||
| Corporate Bonds - 16.7% | ||||||||
| Accommodation and Food Services - 0.1% | ||||||||
| NH Hoteles S.A. | ||||||||
| EUR | 100 | 6.88%, 11/15/2019 ■ | 133 | |||||
| Administrative, Support, Waste Management and Remediation Services - 0.5% | ||||||||
| ADT (The) Corp. | ||||||||
| $ | 350 | 6.25%, 10/15/2021 | $ | 368 | ||||
| Casella Waste Systems, Inc. | ||||||||
| 50 | 7.75%, 02/15/2019 | 51 | ||||||
| Clean Harbors, Inc. | ||||||||
| 120 | 5.25%, 08/01/2020 | 123 | ||||||
| Equinix, Inc. | ||||||||
| 99 | 5.38%, 04/01/2023 | 102 | ||||||
| ServiceMaster (The) Co. | ||||||||
| 76 | 7.00%, 08/15/2020 | 80 | ||||||
| 724 | ||||||||
| Arts, Entertainment and Recreation - 0.4% | ||||||||
| AMC Entertainment, Inc. | ||||||||
| 40 | 9.75%, 12/01/2020 | 44 | ||||||
| CCO Holdings LLC | ||||||||
| 75 | 5.25%, 09/30/2022 | 75 | ||||||
| 70 | 5.75%, 09/01/2023 | 72 | ||||||
| 65 | 6.63%, 01/31/2022 | 69 | ||||||
| Cequel Communications Holdings I LLC | ||||||||
| 55 | 5.13%, 12/15/2021 ■ | 54 | ||||||
The accompanying notes are an integral part of these financial statements.
| 6 |
Hartford Multi-Asset Income Fund
Schedule of Investments – (continued)
October 31, 2014
(000’s Omitted)
| Shares or Principal Amount ╬ | Market Value ╪ | |||||||
| Corporate Bonds - 16.7% - (continued) | ||||||||
| Arts, Entertainment and Recreation - 0.4% - (continued) | ||||||||
| Emdeon, Inc. | ||||||||
| $ | 40 | 11.00%, 12/31/2019 | $ | 44 | ||||
| Gannett Co., Inc. | ||||||||
| 30 | 4.88%, 09/15/2021 ■ | 30 | ||||||
| 70 | 5.13%, 10/15/2019 | 73 | ||||||
| 5 | 5.50%, 09/15/2024 ■ | 5 | ||||||
| 20 | 6.38%, 10/15/2023 | 22 | ||||||
| Gray Television, Inc. | ||||||||
| 35 | 7.50%, 10/01/2020 | 37 | ||||||
| Sirius XM Radio, Inc. | ||||||||
| 40 | 4.25%, 05/15/2020 ■ | 40 | ||||||
| 565 | ||||||||
| Chemical Manufacturing - 0.2% | ||||||||
| Faenza Acquisition Gmbh | ||||||||
| EUR | 100 | 8.25%, 08/15/2021 § | 134 | |||||
| Hexion U.S. Finance Corp. | ||||||||
| 20 | 6.63%, 04/15/2020 | 20 | ||||||
| Ineos Group Holdings plc | ||||||||
| EUR | 100 | 6.50%, 08/15/2018 § | 127 | |||||
| 281 | ||||||||
| Computer and Electronic Product Manufacturing - 0.2% | ||||||||
| CDW Escrow Corp. | ||||||||
| 25 | 8.50%, 04/01/2019 | 26 | ||||||
| CDW LLC / CDW Finance Corp. | ||||||||
| 65 | 6.00%, 08/15/2022 | 69 | ||||||
| Freescale Semiconductor, Inc. | ||||||||
| 105 | 6.00%, 01/15/2022 ■ | 108 | ||||||
| Lucent Technologies, Inc. | ||||||||
| 110 | 6.45%, 03/15/2029 | 106 | ||||||
| 309 | ||||||||
| Construction - 0.3% | ||||||||
| K Hovnanian Enterprises, Inc. | ||||||||
| 50 | 7.00%, 01/15/2019 ■ | 49 | ||||||
| 35 | 8.00%, 11/01/2019 ■ | 35 | ||||||
| KB Home | ||||||||
| 95 | 7.00%, 12/15/2021 | 102 | ||||||
| Lennar Corp. | ||||||||
| 40 | 4.75%, 11/15/2022 | 40 | ||||||
| M/I Homes, Inc. | ||||||||
| 20 | 3.00%, 03/01/2018 β | 20 | ||||||
| MPH Acquisition Holdings LLC | ||||||||
| 30 | 6.63%, 04/01/2022 ■ | 31 | ||||||
| Paragon Offshore plc | ||||||||
| 70 | 6.75%, 07/15/2022 ■ | 53 | ||||||
| Ply Gem Industries, Inc. | ||||||||
| 40 | 6.50%, 02/01/2022 | 39 | ||||||
| 369 | ||||||||
| Electrical Equipment and Appliance Manufacturing - 0.0% | ||||||||
| Sensata Technologies B.V. | ||||||||
| 20 | 5.63%, 11/01/2024 ■ | 21 | ||||||
| Fabricated Metal Product Manufacturing - 0.0% | ||||||||
| Entegris, Inc. | ||||||||
| 50 | 6.00%, 04/01/2022 ■ | 51 | ||||||
| Finance and Insurance - 7.3% | ||||||||
| Ally Financial, Inc. | ||||||||
| 85 | 5.13%, 09/30/2024 | 88 | ||||||
| Banco Bilbao Vizcaya Argentaria S.A. | ||||||||
| EUR | 600 | 7.00%, 12/29/2049 § | 771 | |||||
| 400 | 9.00%, 05/09/2018 §♠ | 433 | ||||||
| Banco do Brasil | ||||||||
| 221 | 6.25%, 04/15/2024 §♠ | 173 | ||||||
| Banco Santander S.A. | ||||||||
| EUR | 900 | 6.25%, 03/12/2049 § | 1,104 | |||||
| Bank of Ireland | ||||||||
| EUR | 100 | 10.00%, 07/30/2016 § | 135 | |||||
| Barclays Bank plc | ||||||||
| EUR | 400 | 8.00%, 12/15/2049 | 520 | |||||
| 425 | 8.25%, 12/15/2018 ♠β | 439 | ||||||
| Brazil Minas SPE via State of Minas Gerais | ||||||||
| 200 | 5.33%, 02/15/2028 § | 201 | ||||||
| CIT Group, Inc. | ||||||||
| 500 | 5.50%, 02/15/2019 ■ | 533 | ||||||
| Credit Agricole S.A. | ||||||||
| EUR | 175 | 6.50%, 06/23/2049 § | 223 | |||||
| 200 | 8.13%, 09/19/2033 ■ | 227 | ||||||
| Credit Suisse Group AG | ||||||||
| EUR | 200 | 5.75%, 09/18/2025 § | 279 | |||||
| Development Bank of Kazakhstan JSC | ||||||||
| 200 | 4.13%, 12/10/2022 ╦§ | 189 | ||||||
| HSBC Holdings plc | ||||||||
| 325 | 5.63%, 01/17/2020 ╦♠ | 330 | ||||||
| Lloyds Banking Group plc | ||||||||
| EUR | 325 | 6.38%, 06/27/2049 § | 421 | |||||
| GBP | 200 | 7.00%, 12/29/2049 § | 319 | |||||
| Nationstar Mortgage LLC | ||||||||
| 80 | 7.88%, 10/01/2020 | 79 | ||||||
| Nationwide Building Society | ||||||||
| GBP | 385 | 6.88%, 03/11/2049 § | 602 | |||||
| Navient Corp. | ||||||||
| 350 | 8.45%, 06/15/2018 | 400 | ||||||
| Provident Funding Associates L.P. | ||||||||
| 135 | 6.75%, 06/15/2021 ■ | 135 | ||||||
| Royal Bank of Scotland Group plc | ||||||||
| 270 | 6.13%, 12/15/2022 | 292 | ||||||
| 100 | 7.64%, 09/27/2017 ♠Δ | 106 | ||||||
| RZD Capital Ltd. | ||||||||
| 525 | 5.70%, 04/05/2022 ╦§ | 521 | ||||||
| Societe Generale | ||||||||
| 225 | 6.00%, 01/27/2020 ■♠ | 212 | ||||||
| EUR | 125 | 6.75%, 04/07/2049 § | 157 | |||||
| 820 | 8.25%, 11/29/2018 §♠ | 867 | ||||||
| SoftBank Corp. | ||||||||
| EUR | 100 | 4.63%, 04/15/2020 § | 135 | |||||
| TMX Finance LLC | ||||||||
| 55 | 8.50%, 09/15/2018 ■ | 54 | ||||||
| UniCredit S.p.A. | ||||||||
| 200 | 8.00%, 06/03/2024 §♠ | 200 | ||||||
| Yasar Holdings | ||||||||
| 220 | 8.88%, 05/06/2020 ■☼ | 220 | ||||||
| 10,365 | ||||||||
| Food Manufacturing - 0.4% | ||||||||
| ESAL GmbH | ||||||||
| 200 | 6.25%, 02/05/2023 § | 204 | ||||||
| Grupo Bimbo S.A.B. de C.V. | ||||||||
| 405 | 4.88%, 06/27/2044 ■ | 397 | ||||||
| 601 | ||||||||
The accompanying notes are an integral part of these financial statements.
| 7 |
Hartford Multi-Asset Income Fund
Schedule of Investments – (continued)
October 31, 2014
(000’s Omitted)
| Shares or Principal Amount ╬ | Market Value ╪ | |||||||
| Corporate Bonds - 16.7% - (continued) | ||||||||
| Food Services - 0.1% | ||||||||
| ARAMARK Corp. | ||||||||
| $ | 70 | 5.75%, 03/15/2020 | $ | 73 | ||||
| CEC Entertainment, Inc. | ||||||||
| 20 | 8.00%, 02/15/2022 ■ | 19 | ||||||
| 92 | ||||||||
| Health Care and Social Assistance - 1.0% | ||||||||
| Alere, Inc. | ||||||||
| 80 | 6.50%, 06/15/2020 | 83 | ||||||
| AmSurg Corp. | ||||||||
| 25 | 5.63%, 07/15/2022 ■ | 26 | ||||||
| Biomet, Inc. | ||||||||
| 40 | 6.50%, 08/01/2020 | 43 | ||||||
| Community Health Systems, Inc. | ||||||||
| 145 | 5.13%, 08/01/2021 | 151 | ||||||
| 40 | 6.88%, 02/01/2022 | 43 | ||||||
| 140 | 7.13%, 07/15/2020 | 152 | ||||||
| Cubist Pharmaceuticals | ||||||||
| 20 | 1.88%, 09/01/2020 β | 23 | ||||||
| Envision Healthcare Corp. | ||||||||
| 10 | 5.13%, 07/01/2022 ■ | 10 | ||||||
| HCA Holdings, Inc. | ||||||||
| 50 | 6.25%, 02/15/2021 | 54 | ||||||
| 20 | 7.50%, 11/15/2095 | 19 | ||||||
| HCA, Inc. | ||||||||
| 340 | 6.50%, 02/15/2020 | 380 | ||||||
| InVentiv Health, Inc. | ||||||||
| 25 | 9.00%, 01/15/2018 ■ | 26 | ||||||
| Pinnacle Merger Sub, Inc. | ||||||||
| 60 | 9.50%, 10/01/2023 ■ | 65 | ||||||
| Salix Pharmaceuticals Ltd. | ||||||||
| 110 | 6.00%, 01/15/2021 ■ | 119 | ||||||
| Tenet Healthcare Corp. | ||||||||
| 70 | 5.00%, 03/01/2019 ■ | 70 | ||||||
| 50 | 8.13%, 04/01/2022 | 57 | ||||||
| Wellcare Health Plans, Inc. | ||||||||
| 75 | 5.75%, 11/15/2020 | 77 | ||||||
| 1,398 | ||||||||
| Information - 2.0% | ||||||||
| Activision Blizzard, Inc. | ||||||||
| 132 | 5.63%, 09/15/2021 ■ | 140 | ||||||
| 10 | 6.13%, 09/15/2023 ■ | 11 | ||||||
| Altice Financing S.A. | ||||||||
| EUR | 100 | 6.50%, 01/15/2022 § | 129 | |||||
| Audatex North America, Inc. | ||||||||
| 50 | 6.00%, 06/15/2021 ■ | 53 | ||||||
| DISH DBS Corp. | ||||||||
| 380 | 6.75%, 06/01/2021 | 422 | ||||||
| 25 | 7.88%, 09/01/2019 | 29 | ||||||
| First Data Corp. | ||||||||
| 60 | 6.75%, 11/01/2020 ■ | 64 | ||||||
| 45 | 8.25%, 01/15/2021 § | 49 | ||||||
| 14 | 14.50%, 09/24/2019 ■Þ | 15 | ||||||
| Harron Communications L.P. | ||||||||
| 30 | 9.13%, 04/01/2020 ■ | 33 | ||||||
| Infor Software Parent LLC | ||||||||
| 85 | 7.13%, 05/01/2021 ■ | 86 | ||||||
| Infor US, Inc. | ||||||||
| 25 | 9.38%, 04/01/2019 | 27 | ||||||
| Intelsat Jackson Holdings S.A. | ||||||||
| 60 | 7.50%, 04/01/2021 | 65 | ||||||
| Intelsat Luxembourg S.A. | ||||||||
| 130 | 7.75%, 06/01/2021 | 136 | ||||||
| Level 3 Escrow, Inc. | ||||||||
| 50 | 5.38%, 08/15/2022 ■ | 51 | ||||||
| Level 3 Financing, Inc. | ||||||||
| 80 | 7.00%, 06/01/2020 | 85 | ||||||
| MetroPCS Wireless, Inc. | ||||||||
| 70 | 6.63%, 11/15/2020 | 74 | ||||||
| Nara Cable Funding Ltd. | ||||||||
| EUR | 100 | 8.88%, 12/01/2018 § | 131 | |||||
| Sprint Communications, Inc. | ||||||||
| 90 | 9.00%, 11/15/2018 ■ | 106 | ||||||
| Sprint Corp. | ||||||||
| 110 | 7.25%, 09/15/2021 ■ | 116 | ||||||
| Syniverse Holdings, Inc. | ||||||||
| 30 | 9.13%, 01/15/2019 | 32 | ||||||
| T-Mobile USA, Inc. | ||||||||
| 230 | 6.46%, 04/28/2019 | 240 | ||||||
| 215 | 6.63%, 04/28/2021 | 226 | ||||||
| Unitymedia Hessen GmbH & Co. | ||||||||
| EUR | 100 | 5.75%, 01/15/2023 § | 136 | |||||
| UPCB Finance V Ltd. | ||||||||
| 150 | 7.25%, 11/15/2021 ■ | 165 | ||||||
| Verint Systems, Inc. | ||||||||
| 22 | 1.50%, 06/01/2021 β | 25 | ||||||
| Wind Acquisition Finance S.A. | ||||||||
| EUR | 100 | 4.00%, 07/15/2020 ■ | 123 | |||||
| Windstream Corp. | ||||||||
| 50 | 7.75%, 10/15/2020 | 53 | ||||||
| 30 | 7.88%, 11/01/2017 | 34 | ||||||
| 2,856 | ||||||||
| Machinery Manufacturing - 0.2% | ||||||||
| Case New Holland Industrial, Inc. | ||||||||
| 290 | 7.88%, 12/01/2017 | 326 | ||||||
| Mining - 0.8% | ||||||||
| ABJA Investment Co. Pte Ltd. | ||||||||
| 415 | 5.95%, 07/31/2024 § | 422 | ||||||
| AK Steel Corp. | ||||||||
| 130 | 7.63%, 05/15/2020 - 10/01/2021 | 131 | ||||||
| FMG Resources Aug 2006 | ||||||||
| 240 | 6.88%, 04/01/2022 ■ | 248 | ||||||
| Peabody Energy Corp. | ||||||||
| 210 | 6.50%, 09/15/2020 | 200 | ||||||
| Steel Dynamics, Inc. | ||||||||
| 40 | 5.13%, 10/01/2021 ■ | 41 | ||||||
| 105 | 5.50%, 10/01/2024 ■ | 111 | ||||||
| 1,153 | ||||||||
| Motor Vehicle and Parts Manufacturing - 0.1% | ||||||||
| General Motors Co. | ||||||||
| 25 | 4.88%, 10/02/2023 | 27 | ||||||
| 135 | 6.25%, 10/02/2043 | 160 | ||||||
| 187 | ||||||||
| Nonmetallic Mineral Product Manufacturing - 0.4% | ||||||||
| Ardagh Packaging Finance plc | ||||||||
| EUR | 100 | 9.25%, 10/15/2020 § | 134 | |||||
| Cemex Finance LLC | ||||||||
| 200 | 7.25%, 01/15/2021 ■ | 216 | ||||||
| HeidelbergCement Finance Luxembourg S.A. | ||||||||
| EUR | 30 | 8.50%, 10/31/2019 § | 49 | |||||
The accompanying notes are an integral part of these financial statements.
| 8 |
Hartford Multi-Asset Income Fund
Schedule of Investments – (continued)
October 31, 2014
(000’s Omitted)
| Shares or Principal Amount ╬ | Market Value ╪ | |||||||
| Corporate Bonds - 16.7% - (continued) | ||||||||
| Nonmetallic Mineral Product Manufacturing - 0.4% - (continued) | ||||||||
| Union Andina de Cementos SAA | ||||||||
| $ | 155 | 5.88%, 10/30/2021 ■ | $ | 157 | ||||
| 556 | ||||||||
| Other Services - 0.2% | ||||||||
| Abengoa Finance | ||||||||
| EUR | 100 | 6.00%, 03/31/2021 § | 122 | |||||
| Cardtronics, Inc. | ||||||||
| 65 | 5.13%, 08/01/2022 ■ | 65 | ||||||
| Service Corp. International | ||||||||
| 20 | 7.63%, 10/01/2018 | 22 | ||||||
| 209 | ||||||||
| Paper Manufacturing - 0.2% | ||||||||
| Clearwater Paper Corp. | ||||||||
| 60 | 5.38%, 02/01/2025 ■ | 61 | ||||||
| Graphic Packaging International | ||||||||
| 60 | 4.88%, 11/15/2022 ☼ | 60 | ||||||
| Smurfit Kappa Acquisitions | ||||||||
| EUR | 100 | 4.13%, 01/30/2020 § | 132 | |||||
| 253 | ||||||||
| Petroleum and Coal Products Manufacturing - 0.7% | ||||||||
| Antero Resources Finance Corp. | ||||||||
| 70 | 6.00%, 12/01/2020 | 73 | ||||||
| Bonanza Creek Energy, Inc. | ||||||||
| 25 | 6.75%, 04/15/2021 | 25 | ||||||
| California Resources Corp. | ||||||||
| 10 | 5.00%, 01/15/2020 ■ | 10 | ||||||
| 25 | 5.50%, 09/15/2021 ■ | 25 | ||||||
| 40 | 6.00%, 11/15/2024 ■ | 41 | ||||||
| Cobalt International Energy, Inc. | ||||||||
| 20 | 2.63%, 12/01/2019 β | 15 | ||||||
| Concho Resources, Inc. | ||||||||
| 5 | 5.50%, 10/01/2022 | 5 | ||||||
| Denbury Resources, Inc. | ||||||||
| 115 | 5.50%, 05/01/2022 | 113 | ||||||
| Diamondback Energy, Inc. | ||||||||
| 50 | 7.63%, 10/01/2021 | 53 | ||||||
| Everest Acquisition LLC | ||||||||
| 60 | 9.38%, 05/01/2020 | 66 | ||||||
| Pertamina Persero PT | ||||||||
| 200 | 5.63%, 05/20/2043 ╦§ | 192 | ||||||
| Petroleos de Venezuela S.A. | ||||||||
| 50 | 6.00%, 11/15/2026 § | 25 | ||||||
| 40 | 8.50%, 11/02/2017 § | 30 | ||||||
| Rosetta Resources, Inc. | ||||||||
| 40 | 5.63%, 05/01/2021 | 39 | ||||||
| Tesoro Corp. | ||||||||
| 75 | 5.13%, 04/01/2024 | 75 | ||||||
| Tesoro Logistics L.P. | ||||||||
| 35 | 5.50%, 10/15/2019 ■ | 36 | ||||||
| 55 | 6.25%, 10/15/2022 ■ | 57 | ||||||
| WPX Energy, Inc. | ||||||||
| 90 | 5.25%, 09/15/2024 ☼ | 88 | ||||||
| 75 | 6.00%, 01/15/2022 | 78 | ||||||
| 1,046 | ||||||||
| Pipeline Transportation - 0.1% | ||||||||
| El Paso Corp. | ||||||||
| 25 | 7.00%, 06/15/2017 | 28 | ||||||
| Energy Transfer Equity L.P. | ||||||||
| 40 | 7.50%, 10/15/2020 | 46 | ||||||
| Southern Star Central Corp. | ||||||||
| 10 | 5.13%, 07/15/2022 ■ | 10 | ||||||
| 84 | ||||||||
| Plastics and Rubber Products Manufacturing - 0.1% | ||||||||
| Associated Materials LLC | ||||||||
| 40 | 9.13%, 11/01/2017 | 39 | ||||||
| Nortek, Inc. | ||||||||
| 50 | 8.50%, 04/15/2021 | 54 | ||||||
| 93 | ||||||||
| Primary Metal Manufacturing - 0.2% | ||||||||
| ArcelorMittal | ||||||||
| 15 | 7.25%, 03/01/2041 | 15 | ||||||
| 25 | 7.50%, 10/15/2039 | 27 | ||||||
| United States Steel Corp. | ||||||||
| 190 | 7.38%, 04/01/2020 | 213 | ||||||
| 255 | ||||||||
| Printing and Related Support Activities - 0.1% | ||||||||
| Quad Graphics, Inc. | ||||||||
| 70 | 7.00%, 05/01/2022 ■ | 67 | ||||||
| Professional, Scientific and Technical Services - 0.0% | ||||||||
| Getty Images, Inc. | ||||||||
| 60 | 7.00%, 10/15/2020 ■ | 46 | ||||||
| Real Estate, Rental and Leasing - 0.3% | ||||||||
| International Lease Finance Corp. | ||||||||
| 200 | 5.88%, 04/01/2019 | 215 | ||||||
| 155 | 6.25%, 05/15/2019 | 170 | ||||||
| 385 | ||||||||
| Retail Trade - 0.5% | ||||||||
| 99 Cents Only Stores | ||||||||
| 50 | 11.00%, 12/15/2019 | 54 | ||||||
| Albertson's Holdings LLC | ||||||||
| 50 | 7.75%, 10/15/2022 ■ | 49 | ||||||
| Building Materials Corp. | ||||||||
| 205 | 5.38%, 11/15/2024 ■☼ | 206 | ||||||
| GRD Holding III Corp. | ||||||||
| 50 | 10.75%, 06/01/2019 ■ | 55 | ||||||
| Group 1 Automotive, Inc. | ||||||||
| 55 | 5.00%, 06/01/2022 ■ | 54 | ||||||
| Michaels Stores, Inc. | ||||||||
| 40 | 5.88%, 12/15/2020 ■ | 41 | ||||||
| Party City Holdings, Inc. | ||||||||
| 40 | 8.88%, 08/01/2020 | 43 | ||||||
| PC Nextco Holdings LLC/PC Nextco Finance, Inc. | ||||||||
| 50 | 8.75%, 08/15/2019 | 51 | ||||||
| Sotheby's | ||||||||
| 125 | 5.25%, 10/01/2022 § | 123 | ||||||
| 676 | ||||||||
| Soap, Cleaning Compound and Toilet Manufacturing - 0.0% | ||||||||
| Sun Products Corp. | ||||||||
| 60 | 7.75%, 03/15/2021 ■ | 44 | ||||||
| Transportation Equipment Manufacturing - 0.1% | ||||||||
| Huntington Ingalls Industries, Inc. | ||||||||
| 170 | 7.13%, 03/15/2021 | 183 | ||||||
The accompanying notes are an integral part of these financial statements.
| 9 |
Hartford Multi-Asset Income Fund
Schedule of Investments – (continued)
October 31, 2014
(000’s Omitted)
| Shares or Principal Amount ╬ | Market Value ╪ | |||||||
| Corporate Bonds - 16.7% - (continued) | ||||||||
| Utilities - 0.2% | ||||||||
| Dolphin Subsidiary II, Inc. | ||||||||
| $ | 150 | 7.25%, 10/15/2021 | $ | 160 | ||||
| National Power Corp. | ||||||||
| 70 | 9.63%, 05/15/2028 ╦ | 105 | ||||||
| Texas Competitive Electric Holdings Co. LLC | ||||||||
| 70 | 11.50%, 10/01/2020 §Ϫ | 56 | ||||||
| 321 | ||||||||
| Wholesale Trade - 0.0% | ||||||||
| Dynegy, Inc. | ||||||||
| 15 | 7.38%, 11/01/2022 ■ | 16 | ||||||
| 10 | 7.63%, 11/01/2024 ■ | 10 | ||||||
| 26 | ||||||||
| Total Corporate Bonds | ||||||||
| (Cost $24,364) | $ | 23,675 | ||||||
Foreign Government Obligations - 14.0% | ||||||||
| Angola - 0.2% | ||||||||
| Angola (Republic of) | ||||||||
| $ | 250 | 7.00%, 08/16/2019 § | $ | 267 | ||||
| Argentina - 0.4% | ||||||||
| Argentina (Republic of) | ||||||||
| 520 | 0.00%, 04/17/2017 - 05/07/2024 ● | 472 | ||||||
| 100 | 8.75%, 06/02/2017 | 88 | ||||||
| 560 | ||||||||
| Armenia - 0.1% | ||||||||
| Armenia (Republic of) | ||||||||
| 200 | 6.00%, 09/30/2020 § | 209 | ||||||
| Azerbaijan - 0.3% | ||||||||
| Azerbaijan (Republic of) | ||||||||
| 400 | 4.75%, 03/13/2023 § | 397 | ||||||
| Brazil - 1.1% | ||||||||
| Brazil (Federative Republic of) | ||||||||
| 400 | 5.00%, 01/27/2045 ╦ | 392 | ||||||
| 100 | 5.63%, 01/07/2041 ╦ | 108 | ||||||
| 125 | 6.00%, 01/17/2017 ╦ | 137 | ||||||
| 19 | 8.00%, 01/15/2018 ╦ | 21 | ||||||
| 150 | 8.25%, 01/20/2034 ╦ | 208 | ||||||
| BRL | 2,140 | 9.70%, 09/01/2020 ○ | $ | 555 | ||||
| 100 | 11.00%, 08/17/2040 ╦ | 108 | ||||||
| 1,529 | ||||||||
| Colombia - 0.9% | ||||||||
| Colombia (Republic of) | ||||||||
| 200 | 4.38%, 07/12/2021 ╦ | 213 | ||||||
| 100 | 6.13%, 01/18/2041 ╦ | 120 | ||||||
| 125 | 7.38%, 09/18/2037 ╦ | 169 | ||||||
| 290 | 10.38%, 01/28/2033 ╦ | 455 | ||||||
| 225 | 11.75%, 02/25/2020 ╦ | 320 | ||||||
| 1,277 | ||||||||
| Costa Rica - 0.2% | ||||||||
| Costa Rica (Republic of) | ||||||||
| 300 | 5.63%, 04/30/2043 § | 262 | ||||||
| Croatia - 0.1% | ||||||||
| Croatia (Republic of) | ||||||||
| 125 | 6.63%, 07/14/2020 | 139 | ||||||
| Dominican Republic - 0.2% | ||||||||
| Dominican (Republic of) | ||||||||
| DOP | 10,000 | 11.50%, 05/10/2024 ■ | 233 | |||||
| Greece - 3.2% | ||||||||
| Greece (Republic of) | ||||||||
| EUR | 6,615 | 2.00%, 02/24/2028 - 02/24/2042 § | 4,554 | |||||
| 4,554 | ||||||||
| Hungary - 0.2% | ||||||||
| Hungary (Republic of) | ||||||||
| 200 | 4.00%, 03/25/2019 | 205 | ||||||
| 75 | 6.25%, 01/29/2020 | 84 | ||||||
| 289 | ||||||||
| Indonesia - 0.9% | ||||||||
| Indonesia (Republic of) | ||||||||
| 150 | 5.88%, 03/13/2020 ╦§ | 168 | ||||||
| 275 | 6.63%, 02/17/2037 ╦§ | 321 | ||||||
| 100 | 6.88%, 01/17/2018 ╦§ | 113 | ||||||
| 175 | 7.75%, 01/17/2038 ╦§ | 230 | ||||||
| IDR | 3,400,000 | 8.38%, 03/15/2024 | 288 | |||||
| 175 | 8.50%, 10/12/2035 ╦§ | 244 | ||||||
| 1,364 | ||||||||
| Lithuania - 0.3% | ||||||||
| Lithuania (Republic of) | ||||||||
| 125 | 5.13%, 09/14/2017 § | 137 | ||||||
| 100 | 6.13%, 03/09/2021 § | 117 | ||||||
| 150 | 7.38%, 02/11/2020 § | 181 | ||||||
| 435 | ||||||||
| Mexico - 1.5% | ||||||||
| Mexico (United Mexican States) | ||||||||
| 125 | 3.50%, 01/21/2021 | 129 | ||||||
| 450 | 3.63%, 03/15/2022 | 461 | ||||||
| MXN | 5,809 | 4.00%, 06/13/2019 ◄ | 477 | |||||
| 50 | 5.55%, 01/21/2045 | 57 | ||||||
| 424 | 5.75%, 10/12/2110 | 449 | ||||||
| 100 | 6.05%, 01/11/2040 | 121 | ||||||
| 175 | 6.63%, 03/03/2015 | 178 | ||||||
| 125 | 6.75%, 09/27/2034 | 161 | ||||||
| 50 | 8.30%, 08/15/2031 | 74 | ||||||
| 2,107 | ||||||||
| Nigeria - 0.3% | ||||||||
| Nigeria (Republic of) | ||||||||
| NGN | 75,000 | 13.05%, 08/16/2016 | 459 | |||||
| Panama - 0.1% | ||||||||
| Panama (Republic of) | ||||||||
| 100 | 9.38%, 04/01/2029 ╦ | 149 | ||||||
| Peru - 0.2% | ||||||||
| Peru (Republic of) | ||||||||
| 75 | 6.55%, 03/14/2037 ╦ | 96 | ||||||
| 100 | 8.38%, 05/03/2016 ╦ | 111 | ||||||
| 85 | 8.75%, 11/21/2033 ╦ | 130 | ||||||
| 337 | ||||||||
| Philippines - 0.3% | ||||||||
| Philippines (Republic of) | ||||||||
| 50 | 9.50%, 10/21/2024 ╦ | 74 | ||||||
| 225 | 10.63%, 03/16/2025 ╦ | 356 | ||||||
| 430 | ||||||||
The accompanying notes are an integral part of these financial statements.
| 10 |
Hartford Multi-Asset Income Fund
Schedule of Investments – (continued)
October 31, 2014
(000’s Omitted)
| Shares or Principal Amount ╬ | Market Value ╪ | |||||||
| Foreign Government Obligations - 14.0% - (continued) | ||||||||
| Romania - 0.4% | ||||||||
| Romania (Republic of) | ||||||||
| $ | 152 | 6.13%, 01/22/2044 ╦§ | $ | 178 | ||||
| 318 | 6.75%, 02/07/2022 ╦§ | 381 | ||||||
| 559 | ||||||||
| Russia - 0.9% | ||||||||
| Russia (Federation of) | ||||||||
| RUB | 11,100 | 7.50%, 02/27/2019 Δ | 237 | |||||
| 524 | 7.50%, 03/31/2030 §‡ | 594 | ||||||
| 250 | 12.75%, 06/24/2028 § | 412 | ||||||
| 1,243 | ||||||||
| South Africa - 0.3% | ||||||||
| South Africa (Republic of) | ||||||||
| ZAR | 4,200 | 7.75%, 02/28/2023 | 382 | |||||
| Turkey - 1.0% | ||||||||
| Turkey (Republic of) | ||||||||
| 100 | 5.63%, 03/30/2021 | 109 | ||||||
| 200 | 5.75%, 03/22/2024 | 221 | ||||||
| 785 | 7.38%, 02/05/2025 ‡ | 970 | ||||||
| 100 | 7.50%, 07/14/2017 | 113 | ||||||
| 1,413 | ||||||||
| Ukraine - 0.3% | ||||||||
| Ukraine (Government of) | ||||||||
| 225 | 6.88%, 09/23/2015 § | 206 | ||||||
| 200 | 7.80%, 11/28/2022 § | 173 | ||||||
| 379 | ||||||||
| Uruguay - 0.4% | ||||||||
| Uruguay (Republic of) | ||||||||
| UYU | 8,541 | 4.25%, 04/05/2027 ◄ | 379 | |||||
| 45 | 4.50%, 08/14/2024 ╦ | 47 | ||||||
| 100 | 5.10%, 06/18/2050 ╦ | 99 | ||||||
| 525 | ||||||||
| Venezuela - 0.2% | ||||||||
| Venezuela (Republic of) | ||||||||
| 525 | 7.00%, 03/31/2038 § | 302 | ||||||
| Total Foreign Government Obligations | ||||||||
| (Cost $21,240) | $ | 19,800 | ||||||
Municipal Bonds - 0.4% | ||||||||
| Miscellaneous - 0.4% | ||||||||
| Puerto Rico Government Employees Retirement System | ||||||||
| $ | 855 | 6.15%, 07/01/2038 | $ | 423 | ||||
| 300 | 6.20%, 07/01/2039 | 148 | ||||||
| 120 | 6.55%, 07/01/2058 | 59 | ||||||
| 630 | ||||||||
| Total Municipal Bonds | ||||||||
| (Cost $646) | $ | 630 | ||||||
Senior Floating Rate Interests ♦ - 28.6% | ||||||||
| Accommodation and Food Services - 0.2% | ||||||||
| Hilton Worldwide Holdings, Inc. | ||||||||
| $ | 224 | 3.50%, 10/26/2020 | $ | 222 | ||||
| Administrative, Support, Waste Management and Remediation Services - 1.8% | ||||||||
| Acosta Holdco, Inc. | ||||||||
| 285 | 5.00%, 09/26/2021 | 285 | ||||||
| Brickman Group Holdings, Inc. | ||||||||
| 728 | 4.00%, 12/18/2020 | 715 | ||||||
| Ipreo Holdings LLC | ||||||||
| 160 | 4.25%, 08/06/2021 | 156 | ||||||
| PRA Holdings, Inc. | ||||||||
| 995 | 4.50%, 09/23/2020 | 981 | ||||||
| ServiceMaster (The) Co. | ||||||||
| 348 | 4.25%, 07/01/2021 | 345 | ||||||
| 2,482 | ||||||||
| Agriculture, Forestry, Fishing and Hunting - 0.3% | ||||||||
| U.S. Ecology, Inc. | ||||||||
| 374 | 3.75%, 06/17/2021 | 372 | ||||||
| Arts, Entertainment and Recreation - 1.6% | ||||||||
| 24 Hour Fitness Worldwide, Inc. | ||||||||
| 264 | 4.75%, 05/28/2021 | 264 | ||||||
| Aristocrat Leisure Ltd. | ||||||||
| 295 | 4.75%, 10/20/2021 | 293 | ||||||
| Formula One Holdings | ||||||||
| 1,048 | 4.75%, 07/30/2021 | 1,039 | ||||||
| 200 | 7.75%, 07/29/2022 | 199 | ||||||
| Scientific Games International, Inc. | ||||||||
| 180 | 6.00%, 10/01/2021 | 176 | ||||||
| Templar Energy | ||||||||
| 100 | 8.50%, 11/25/2020 | 90 | ||||||
| Univision Communications, Inc. | ||||||||
| 274 | 4.00%, 03/01/2020 | 271 | ||||||
| 2,332 | ||||||||
| Beverage and Tobacco Product Manufacturing - 0.2% | ||||||||
| DE Master Blenders 1753 N.V. | ||||||||
| 265 | 3.50%, 07/23/2021 | 262 | ||||||
| Chemical Manufacturing - 1.1% | ||||||||
| Exopack LLC | ||||||||
| 352 | 5.25%, 05/08/2019 | 353 | ||||||
| Ferro Corp. | ||||||||
| 225 | 4.00%, 07/30/2021 | 221 | ||||||
| Ineos US Finance LLC | ||||||||
| 398 | 3.75%, 05/04/2018 | 393 | ||||||
| PQ Corp. | ||||||||
| 398 | 4.00%, 08/07/2017 | 393 | ||||||
| Solenis International L.P. | ||||||||
| 225 | 4.25%, 07/31/2021 | 222 | ||||||
| 1,582 | ||||||||
| Computer and Electronic Product Manufacturing - 1.4% | ||||||||
| CDW LLC | ||||||||
| 473 | 3.25%, 04/29/2020 | 462 | ||||||
| Ceridian LLC | ||||||||
| 147 | 4.12%, 05/09/2017 | 147 | ||||||
| 153 | 4.50%, 05/09/2017 | 152 | ||||||
| Freescale Semiconductor, Inc. | ||||||||
| 497 | 4.25%, 02/28/2020 | 490 | ||||||
| Vantiv LLC | ||||||||
| 788 | 3.75%, 06/13/2021 | 781 | ||||||
| 2,032 | ||||||||
| Finance and Insurance - 2.0% | ||||||||
| Asurion LLC | ||||||||
| 249 | 4.25%, 07/08/2020 | 245 | ||||||
The accompanying notes are an integral part of these financial statements.
| 11 |
| Hartford Multi-Asset Income Fund |
| Schedule of Investments – (continued) |
| October 31, 2014 |
| (000’s Omitted) |
| Shares or Principal Amount ╬ | Market Value ╪ | |||||||
| Senior Floating Rate Interests ♦ - 28.6% - (continued) | ||||||||
| Finance and Insurance - 2.0% - (continued) | ||||||||
| Chrysler Group LLC | ||||||||
| $ | 821 | 3.50%, 05/24/2017 | $ | 816 | ||||
| EFS Cogen Holdings I LLC | ||||||||
| 299 | 3.75%, 12/17/2020 | 296 | ||||||
| Interactive Data Corp. | ||||||||
| 509 | 4.75%, 05/02/2021 | 508 | ||||||
| ION Trading Technologies Ltd. | ||||||||
| 240 | 7.25%, 06/10/2022 | 236 | ||||||
| Sedgwick CMS Holdings, Inc. | ||||||||
| 463 | 3.75%, 03/01/2021 | 449 | ||||||
| Walter Investment Management Corp. | ||||||||
| 358 | 4.75%, 12/18/2020 | 337 | ||||||
| 2,887 | ||||||||
| Food Manufacturing - 1.1% | ||||||||
| Burger King Co. | ||||||||
| 210 | 4.50%, 10/27/2021 | 210 | ||||||
| Dole Food Co., Inc. | ||||||||
| 338 | 4.50%, 11/01/2018 | 336 | ||||||
| Roundy's Supermarkets, Inc. | ||||||||
| 378 | 5.75%, 03/03/2021 | 336 | ||||||
| U.S. Foodservice, Inc. | ||||||||
| 746 | 4.50%, 03/31/2019 | 743 | ||||||
| 1,625 | ||||||||
| Furniture and Related Product Manufacturing - 0.3% | ||||||||
| AOT Bedding Super Holdings LLC | ||||||||
| 484 | 4.25%, 10/01/2019 | 479 | ||||||
| Health Care and Social Assistance - 2.5% | ||||||||
| AmSurg Corp. | ||||||||
| 613 | 3.75%, 07/16/2021 | 608 | ||||||
| Catalent Pharma Solutions, Inc. | ||||||||
| 464 | 4.50%, 05/20/2021 | 463 | ||||||
| DaVita HealthCare Partners, Inc. | ||||||||
| 903 | 3.50%, 06/24/2021 | 894 | ||||||
| HCA, Inc. | ||||||||
| 398 | 2.98%, 05/01/2018 | 396 | ||||||
| Healogics, Inc. | ||||||||
| 160 | 5.25%, 07/01/2021 | 159 | ||||||
| IMS Health, Inc. | ||||||||
| 388 | 3.50%, 03/17/2021 | 383 | ||||||
| One Call Medical, Inc. | ||||||||
| 209 | 5.00%, 11/27/2020 | 208 | ||||||
| Ortho-Clinical Diagnostics, Inc. | ||||||||
| 239 | 4.75%, 06/30/2021 | 237 | ||||||
| STHI Holding Corp. | ||||||||
| 105 | 4.50%, 08/06/2021 | 104 | ||||||
| Surgery Center Holdings, Inc. | ||||||||
| 145 | 5.25%, 07/24/2020 ☼ | 145 | ||||||
| 3,597 | ||||||||
| Health Care Providers and Services - 0.5% | ||||||||
| Multiplan, Inc. | ||||||||
| 669 | 4.00%, 03/31/2021 | 658 | ||||||
| Information - 4.3% | ||||||||
| Cabovisao-Televisao Por Cabo S.A. | ||||||||
| 696 | 5.50%, 07/02/2019 | 700 | ||||||
| Charter Communications Operating LLC | ||||||||
| 298 | 3.00%, 01/03/2021 | 293 | ||||||
| 205 | 4.25%, 09/10/2021 | 206 | ||||||
| Emdeon, Inc. | ||||||||
| 359 | 3.75%, 11/02/2018 | 356 | ||||||
| First Data Corp. | ||||||||
| 1,240 | 3.65%, 03/23/2018 | 1,228 | ||||||
| Gray Television, Inc. | ||||||||
| 170 | 3.75%, 06/13/2021 | 167 | ||||||
| Intelsat Jackson Holdings S.A. | ||||||||
| 400 | 3.75%, 06/30/2019 | 396 | ||||||
| Kronos, Inc. | ||||||||
| 899 | 4.50%, 10/30/2019 | 895 | ||||||
| Level 3 Communications, Inc. | ||||||||
| 300 | 4.00%, 08/01/2019 | 298 | ||||||
| Level 3 Financing, Inc. | ||||||||
| 235 | 4.50%, 01/31/2022 ☼ | 236 | ||||||
| Novell, Inc. | ||||||||
| 505 | 7.25%, 11/22/2017 | 505 | ||||||
| Peak 10, Inc. | ||||||||
| 125 | 5.00%, 06/17/2021 | 124 | ||||||
| RedPrairie Corp. | ||||||||
| 320 | 6.00%, 12/21/2018 | 310 | ||||||
| West Corp. | ||||||||
| 220 | 3.25%, 06/30/2018 | 216 | ||||||
| Zayo Group LLC | ||||||||
| 129 | 4.00%, 07/02/2019 | 128 | ||||||
| 6,058 | ||||||||
| Mining - 1.2% | ||||||||
| American Rock Salt Holdings LLC | ||||||||
| 489 | 4.75%, 05/20/2021 | 484 | ||||||
| Arch Coal, Inc. | ||||||||
| 522 | 6.25%, 05/16/2018 | 460 | ||||||
| BWAY Holding Co. | ||||||||
| 224 | 5.50%, 08/14/2020 | 225 | ||||||
| Fortescue Metals Group Ltd. | ||||||||
| 497 | 3.75%, 06/30/2019 | 485 | ||||||
| 1,654 | ||||||||
| Miscellaneous Manufacturing - 1.0% | ||||||||
| Hamilton Sundstrand Corp. | ||||||||
| 471 | 4.00%, 12/13/2019 | 463 | ||||||
| Reynolds Group Holdings, Inc. | ||||||||
| 647 | 4.00%, 11/30/2018 | 643 | ||||||
| TransDigm Group, Inc. | ||||||||
| 324 | 3.75%, 06/04/2021 | 318 | ||||||
| 1,424 | ||||||||
| Motor Vehicle and Parts Manufacturing - 0.5% | ||||||||
| SRAM LLC | ||||||||
| 688 | 4.01%, 04/10/2020 | 674 | ||||||
| Other Services - 0.7% | ||||||||
| Apex Tool Group LLC | ||||||||
| 224 | 4.50%, 01/31/2020 | 212 | ||||||
| Gardner Denver, Inc. | ||||||||
| 406 | 4.25%, 07/30/2020 | 400 | ||||||
| Husky Injection Molding Systems Ltd. | ||||||||
| 219 | 4.25%, 06/30/2021 | 216 | ||||||
| Husky International Ltd. | ||||||||
| 135 | 7.25%, 06/30/2022 | 132 | ||||||
| 960 | ||||||||
| Petroleum and Coal Products Manufacturing - 2.0% | ||||||||
| American Energy-Marcellus LLC | ||||||||
| 375 | 5.25%, 08/04/2020 | 365 | ||||||
The accompanying notes are an integral part of these financial statements.
| 12 |
| Hartford Multi-Asset Income Fund |
| Schedule of Investments – (continued) |
| October 31, 2014 |
| (000’s Omitted) |
| Shares or Principal Amount ╬ | Market Value ╪ | |||||||
| Senior Floating Rate Interests ♦ - 28.6% - (continued) | ||||||||
| Petroleum and Coal Products Manufacturing - 2.0% - (continued) | ||||||||
| Drillships Ocean Ventures, Inc. | ||||||||
| $ | 190 | 5.50%, 07/25/2021 | $ | 182 | ||||
| Pacific Drilling S.A. | ||||||||
| 444 | 4.50%, 06/03/2018 | 425 | ||||||
| Paragon Offshore Finance Co. | ||||||||
| 465 | 3.75%, 07/16/2021 | 435 | ||||||
| Samson Investment Co. | ||||||||
| 410 | 5.00%, 09/25/2018 | 377 | ||||||
| Seadrill Ltd. | ||||||||
| 925 | 4.00%, 02/21/2021 | 873 | ||||||
| Seventy Seven Energy, Inc. | ||||||||
| 170 | 3.75%, 06/25/2021 | 165 | ||||||
| 2,822 | ||||||||
| Pipeline Transportation - 0.3% | ||||||||
| EP Energy LLC | ||||||||
| 426 | 4.50%, 04/30/2019 | 423 | ||||||
| Plastics and Rubber Products Manufacturing - 0.6% | ||||||||
| Berry Plastics Group, Inc. | ||||||||
| 488 | 3.75%, 01/06/2021 | 480 | ||||||
| Consolidated Container Co. | ||||||||
| 323 | 5.00%, 07/03/2019 | 319 | ||||||
| 799 | ||||||||
| Professional, Scientific and Technical Services - 0.4% | ||||||||
| Advantage Sales & Marketing, Inc. | ||||||||
| 550 | 4.25%, 07/23/2021 | 545 | ||||||
| Real Estate, Rental and Leasing - 0.3% | ||||||||
| International Lease Finance Corp. | ||||||||
| 345 | 3.50%, 03/06/2021 | 343 | ||||||
| Neff Corp. | ||||||||
| 125 | 7.25%, 06/09/2021 | 125 | ||||||
| 468 | ||||||||
| Retail Trade - 2.6% | ||||||||
| Albertson's LLC | ||||||||
| 440 | 4.50%, 08/25/2021 ☼ | 440 | ||||||
| American Tire Distributors, Inc. | ||||||||
| 124 | 5.75%, 06/01/2018 | 124 | ||||||
| BJ's Wholesale Club, Inc. | ||||||||
| 448 | 4.50%, 09/26/2019 | 443 | ||||||
| Hillman (The) Cos., Inc. | ||||||||
| 200 | 4.50%, 06/30/2021 | 198 | ||||||
| Lands' End, Inc. | ||||||||
| 433 | 4.25%, 04/04/2021 | 422 | ||||||
| Mauser-Werke GmbH | ||||||||
| 100 | 4.50%, 07/31/2021 | 99 | ||||||
| Metaldyne Performance Group, Inc. | ||||||||
| 195 | 4.50%, 10/20/2021 ☼ | 195 | ||||||
| Michaels Stores, Inc. | ||||||||
| 770 | 4.00%, 01/28/2020 | 760 | ||||||
| Neiman Marcus (The) Group, Inc. | ||||||||
| 796 | 4.25%, 10/25/2020 | 785 | ||||||
| Rite Aid Corp. | ||||||||
| 275 | 4.88%, 06/21/2021 | 274 | ||||||
| 3,740 | ||||||||
| Truck Transportation - 0.4% | ||||||||
| Nexeo Solutions LLC | ||||||||
| 298 | 5.00%, 09/09/2017 | 294 | ||||||
| Swift Transportation Co., Inc. | ||||||||
| 224 | 3.75%, 06/09/2021 | 222 | ||||||
| 516 | ||||||||
| Utilities - 0.8% | ||||||||
| Energy Future Holdings | ||||||||
| 315 | 4.25%, 06/19/2016 | 314 | ||||||
| La Frontera Generation LLC | ||||||||
| 190 | 4.50%, 09/30/2020 | 189 | ||||||
| NRG Energy, Inc. | ||||||||
| 398 | 2.75%, 07/01/2018 | 391 | ||||||
| Texas Competitive Electric Holdings Co. LLC | ||||||||
| 254 | 3.75%, 05/05/2016 | 255 | ||||||
| 1,149 | ||||||||
| Wholesale Trade - 0.5% | ||||||||
| Gates Global LLC | ||||||||
| 785 | 4.25%, 07/05/2021 | 775 | ||||||
| Total Senior Floating Rate Interests | ||||||||
| (Cost $41,130) | $ | 40,537 | ||||||
| U.S. Government Agencies - 8.6% | ||||||||
| FHLMC - 1.5% | ||||||||
| $ | 200 | 3.00%, 11/15/2044 ☼,Ð | $ | 200 | ||||
| 800 | 4.00%, 11/15/2044 ☼,Ð | 849 | ||||||
| 600 | 4.50%, 11/15/2044 ☼,Ð | 650 | ||||||
| 400 | 5.00%, 11/15/2044 ☼,Ð | 442 | ||||||
| 2,141 | ||||||||
| FNMA - 5.4% | ||||||||
| 2,300 | 3.00%, 11/15/2029 - 11/15/2044 ☼,Ð | 2,323 | ||||||
| 200 | 3.50%, 11/15/2029 ☼,Ð | 211 | ||||||
| 2,700 | 4.00%, 11/15/2029 - 11/15/2044 ☼,Ð | 2,867 | ||||||
| 1,400 | 4.50%, 11/15/2044 ☼,Ð | 1,517 | ||||||
| 400 | 5.00%, 11/15/2044 ☼,Ð | 443 | ||||||
| 200 | 5.50%, 11/15/2044 ☼,Ð | 223 | ||||||
| 7,584 | ||||||||
| GNMA - 1.7% | ||||||||
| 100 | 3.00%, 11/15/2044 ☼,Ð | 102 | ||||||
| 900 | 3.50%, 11/15/2044 ☼,Ð | 941 | ||||||
| 400 | 4.00%, 11/15/2044 ☼,Ð | 428 | ||||||
| 900 | 4.50%, 11/15/2044 ☼,Ð | 982 | ||||||
| 2,453 | ||||||||
| Total U.S. Government Agencies | ||||||||
| (Cost $12,148) | $ | 12,178 | ||||||
| Common Stocks - 26.0% | ||||||||
| Banks - 1.0% | ||||||||
| 28 | Banco Santander Central Hispano S.A. ╦ | $ | 244 | |||||
| 20 | Banco Santander S.A.Rights | 4 | ||||||
| 134 | Bank of China Ltd. ╦ | 64 | ||||||
| 69 | Bank of Communications Co. | 51 | ||||||
| 1 | Canadian Imperial Bank of Commerce | 60 | ||||||
| 375 | China CITIC Bank ╦ | 244 | ||||||
| 1 | Industrial Bank of Korea ╦ | 17 | ||||||
| 13 | National Bank of Canada ‡ | 621 | ||||||
| 11 | New York Community Bancorp, Inc. ╦ | 172 | ||||||
| 1,477 | ||||||||
The accompanying notes are an integral part of these financial statements.
| 13 |
| Hartford Multi-Asset Income Fund |
| Schedule of Investments – (continued) |
| October 31, 2014 |
| (000’s Omitted) |
| Shares or Principal Amount ╬ | Market Value ╪ | |||||||
| Common Stocks - 26.0% - (continued) | ||||||||
| Capital Goods - 0.6% | ||||||||
| 26 | Asahi Glass Co., Ltd. ╦ | $ | 134 | |||||
| 17 | Mitsui & Co., Ltd. ╦ | 251 | ||||||
| 41 | Sumitomo Corp. ╦ | 440 | ||||||
| 1 | Vinci S.A. ╦ | 73 | ||||||
| 898 | ||||||||
| Commercial and Professional Services - 0.2% | ||||||||
| 32 | Dai Nippon Printing Co., Ltd. ╦ | 315 | ||||||
| Consumer Durables and Apparel - 0.2% | ||||||||
| 7 | Coach, Inc. ╦ | 243 | ||||||
| Energy - 7.0% | ||||||||
| 51 | BP plc ╦ | 369 | ||||||
| 8 | BreitBurn Energy Partners L.P. ╦ | 141 | ||||||
| 2 | Buckeye Partners L.P. ╦ | 172 | ||||||
| 40 | CNOOC Ltd. | 62 | ||||||
| — | ConocoPhillips Holding Co. ╦ | 8 | ||||||
| 11 | Crestwood Midstream Partners L.P. ╦ | 212 | ||||||
| 3 | Delek Logistics Partners L.P. ╦ | 133 | ||||||
| 10 | Enbridge Energy Partners L.P. ╦ | 369 | ||||||
| 4 | Enbridge, Inc. ╦ | 189 | ||||||
| 15 | Energy Transfer Partners L.P. ‡ | 975 | ||||||
| 11 | Ensco plc ╦ | 455 | ||||||
| 24 | Enterprise Products Partners L.P. ‡ | 880 | ||||||
| 3 | Inter Pipeline Ltd. | 91 | ||||||
| 20 | Kinder Morgan, Inc. ‡ | 790 | ||||||
| — | Lukoil ADR | 17 | ||||||
| 4 | Magellan Midstream Partners L.P. ╦ | 360 | ||||||
| 1 | Marathon Petroleum Corp. | 55 | ||||||
| 7 | MarkWest Energy Partners L.P. ╦ | 484 | ||||||
| 5 | NGL Energy Partners L.P. ╦ | 189 | ||||||
| 1 | Occidental Petroleum Corp. ╦ | 99 | ||||||
| 7 | ONEOK Partners L.P. ╦ | 354 | ||||||
| 4 | Pembina Pipeline Corp. ╦ | 152 | ||||||
| 5 | Plains All American Pipeline L.P. ╦ | 309 | ||||||
| 10 | PTT Public Co., Ltd. | 111 | ||||||
| 21 | Repsol S.A. ╦ | 479 | ||||||
| 14 | Royal Dutch Shell plc Class B ╦ | 507 | ||||||
| 2 | Seadrill Ltd. | 55 | ||||||
| 6 | Tallgrass Energy Partners L.P. ╦ | 274 | ||||||
| 6 | Targa Resources Partners L.P. ╦ | 349 | ||||||
| 3 | Teekay Shipping Corp. ╦ | 159 | ||||||
| 4 | Transcanada Corp. ╦ | 197 | ||||||
| 37 | Veresen, Inc. ‡ | 576 | ||||||
| 5 | Viper Energy Partners L.P. ● | 106 | ||||||
| 5 | Williams Cos., Inc. ╦ | 266 | ||||||
| 1 | Woodside Petroleum Ltd. | 46 | ||||||
| 9,990 | ||||||||
| Food and Staples Retailing - 0.2% | ||||||||
| 3 | Wal-Mart Stores, Inc. ╦ | 236 | ||||||
| Food, Beverage and Tobacco - 0.2% | ||||||||
| 13 | British American Tobacco Malaysia Bhd ╦ | 277 | ||||||
| — | Bunge Ltd. Finance Corp. | 9 | ||||||
| 286 | ||||||||
| Health Care Equipment and Services - 0.1% | ||||||||
| — | Aetna, Inc. ╦ | 22 | ||||||
| — | Humana, Inc. ╦ | 24 | ||||||
| 1 | Wellpoint, Inc. ╦ | 109 | ||||||
| 155 | ||||||||
| Insurance - 1.6% | ||||||||
| 1 | Baloise Holding AG | 75 | ||||||
| 1 | CNA Financial Corp. | 47 | ||||||
| 11 | CNP Assurances ╦ | 208 | ||||||
| 13 | Direct Line Insurance Group plc ☼ | 55 | ||||||
| — | Hannover Rueck SE | 7 | ||||||
| 2 | Scor SE | 66 | ||||||
| 14 | Suncorp-Metway Ltd. ╦ | 176 | ||||||
| 8 | Swiss Re Ltd. ‡ | 608 | ||||||
| 13 | Talanx AG ╦ | 433 | ||||||
| 2 | Zurich Financial Services AG ‡ | 615 | ||||||
| 2,290 | ||||||||
| Materials - 0.6% | ||||||||
| — | CF Industries Holdings, Inc. | 52 | ||||||
| 6 | First Quantum Minerals Ltd. | 86 | ||||||
| 6 | Kumba Iron Ore Ltd. ╦ | 153 | ||||||
| 2 | LyondellBasell Industries Class A ╦ | 147 | ||||||
| 26 | Mitsubishi Chemical Holdings | 129 | ||||||
| 6 | MMC Norilsk Nickel OJSC ADR ☼ | 104 | ||||||
| 23 | PETRONAS Chemicals Group Berhad | 43 | ||||||
| 7 | Severstal GDR §☼ | 74 | ||||||
| 788 | ||||||||
| Media - 0.6% | ||||||||
| 15 | British Sky Broadcasting Group plc | 213 | ||||||
| 4 | Comcast Corp. Class A ╦ | 198 | ||||||
| 70 | John Fairfax Holdings Ltd. | 50 | ||||||
| 4 | Liberty Global plc ●╦ | 161 | ||||||
| 6 | SES Global ╦ | 192 | ||||||
| 814 | ||||||||
| Pharmaceuticals, Biotechnology and Life Sciences - 1.6% | ||||||||
| 1 | AbbVie, Inc. | 44 | ||||||
| 2 | AstraZeneca plc ☼ | 117 | ||||||
| 10 | Eli Lilly & Co. ‡ | 662 | ||||||
| 6 | Johnson & Johnson ‡ | 661 | ||||||
| — | Otsuka Holdings Co., Ltd. ╦ | 18 | ||||||
| 7 | Pfizer, Inc. ╦ | 215 | ||||||
| 7 | Teva Pharmaceutical Industries Ltd. ADR ╦ | 395 | ||||||
| 1 | United Therapeutics Corp. ● | 92 | ||||||
| 2,204 | ||||||||
| Real Estate - 2.8% | ||||||||
| 28 | American Capital Agency Corp. ‡ | 639 | ||||||
| 19 | Annaly Capital Management, Inc. ╦ | 213 | ||||||
| 192 | Chimera Investment Corp. REIT ‡ | 600 | ||||||
| 1,204 | Evergrande Real Estate Group Ltd. ╦ | 463 | ||||||
| 11 | HongKong Land Holdings Ltd. | 76 | ||||||
| 8 | Link (The) REIT | 48 | ||||||
| 76 | MFA Mortgage Investments, Inc. REIT ‡ | 634 | ||||||
| 41 | New World Development Co., Ltd. | 52 | ||||||
| 212 | Sino Land Co., Ltd. ╦ | 350 | ||||||
| 1 | Sun Hung Kai Properties Ltd. | 22 | ||||||
| 11 | Swire Pacific Ltd. ╦ | 142 | ||||||
| 15 | Swire Properties Ltd. | 49 | ||||||
| 59 | Two Harbors Investment Corp. REIT ‡ | 602 | ||||||
| 4 | Wheelock & Co., Ltd. | 21 | ||||||
| 3,911 | ||||||||
The accompanying notes are an integral part of these financial statements.
| 14 |
| Hartford Multi-Asset Income Fund |
| Schedule of Investments – (continued) |
| October 31, 2014 |
| (000’s Omitted) |
| Shares or Principal Amount ╬ | Market Value ╪ | |||||||
| Common Stocks - 26.0% - (continued) | ||||||||
| Retailing - 0.6% | ||||||||
| 1 | Expedia, Inc. | $ | 119 | |||||
| 3 | Foot Locker, Inc. ╦ | 157 | ||||||
| 1 | Gap, Inc. | 42 | ||||||
| 9 | Kohl's Corp. ╦ | 494 | ||||||
| 1 | Macy's, Inc. | 46 | ||||||
| — | Ulta Salon, Cosmetics & Fragrances, Inc. ● | 48 | ||||||
| 906 | ||||||||
| Semiconductors and Semiconductor Equipment - 0.1% | ||||||||
| 3 | Intel Corp. | 88 | ||||||
| Software and Services - 0.0% | ||||||||
| — | Microsoft Corp. | 9 | ||||||
| Technology Hardware and Equipment - 1.0% | ||||||||
| 4 | Apple, Inc. ╦ | 478 | ||||||
| 58 | Asustek Computer, Inc. ‡ | 596 | ||||||
| 7 | Cisco Systems, Inc. ╦ | 168 | ||||||
| 39 | Gigabyte Technology Co., Ltd. | 45 | ||||||
| 2 | Qualcomm, Inc. ╦ | 195 | ||||||
| 1,482 | ||||||||
| Telecommunication Services - 3.9% | ||||||||
| 15 | AT&T, Inc. ╦ | 525 | ||||||
| 6 | BCE, Inc. ╦ | 280 | ||||||
| 18 | Belgacom S.A. ‡ | 663 | ||||||
| 468 | Bezeq Israeli Telecommunication Corp., Ltd. ‡ | 800 | ||||||
| 16 | CenturyLink, Inc. ‡ | 669 | ||||||
| 31 | DiGi.com Berhad | 58 | ||||||
| 7 | Elisa Oyj ╦ | 191 | ||||||
| 25 | Frontier Communications Co. ╦ | 162 | ||||||
| 7 | Hellenic Telecommunications Organization S.A. ●╦ | 75 | ||||||
| 212 | HKT Trust and HKT Ltd. ╦ | 258 | ||||||
| 9 | Kcell JSC ╦§ | 124 | ||||||
| 36 | Koninklijke (Royal) KPN N.V. | 120 | ||||||
| — | Nippon Telegraph & Telephone Corp. | 22 | ||||||
| 9 | NTT DoCoMo, Inc. ╦ | 149 | ||||||
| 76 | PCCW Ltd. | 48 | ||||||
| 514 | Safaricom Ltd. | 70 | ||||||
| 34 | Singapore Telecommunications Ltd. ╦ | 100 | ||||||
| — | SK Telecom Co., Ltd. | 112 | ||||||
| — | Swisscom AG ╦ | 108 | ||||||
| 24 | TDC AS ╦ | 183 | ||||||
| 2 | Telekom Malaysia Berhad | 4 | ||||||
| 10 | Telenor ASA ╦ | 226 | ||||||
| 19 | Telia Ab ╦ | 132 | ||||||
| 10 | Telstra Corp., Ltd. | 50 | ||||||
| 3 | Telus Corp. ╦ | 122 | ||||||
| 33 | Total Access Communication Public Co., Ltd. | 106 | ||||||
| 2 | Verizon Communications, Inc. ╦ | 105 | ||||||
| 4 | Windstream Holdings, Inc. | 46 | ||||||
| 5,508 | ||||||||
| Transportation - 0.5% | ||||||||
| 5 | Abertis Infraestructuras S.A. ╦ | 109 | ||||||
| 4 | Air New Zealand Ltd. | 7 | ||||||
| 324 | Hutchinson Port Holdings Trust Θ | 219 | ||||||
| 7 | West Japan Railway Co. ╦ | 349 | ||||||
| 684 | ||||||||
| Utilities - 3.2% | ||||||||
| 23 | CESP - Companhia Energetica de Sao Paulo ╦ | 231 | ||||||
| 5 | CEZ AS ● | 146 | ||||||
| 26 | Cheung Kong Infrastructure Holdings Ltd. ╦ | 190 | ||||||
| 10 | Cia de Saneamento Basico do Estado de Sao Paulo ADR ╦ | 81 | ||||||
| 30 | Companhia Energetica de Minas Gerais ╦ | 174 | ||||||
| 2 | Consolidated Edison, Inc. ╦ | 148 | ||||||
| 2 | DTE Energy Co. ╦ | 165 | ||||||
| 2 | Duke Energy Corp. ╦ | 152 | ||||||
| 3 | E.On SE ╦ | 47 | ||||||
| 8 | Electrica S.A. ■● | 111 | ||||||
| 10 | Endesa S.A. ╦ | 199 | ||||||
| 8 | Entergy Corp. ‡ | 644 | ||||||
| — | Exelon Corp. | 8 | ||||||
| 21 | GDF Suez ╦ | 508 | ||||||
| 190 | Guangdong Investment Ltd. ╦ | 250 | ||||||
| 16 | Iberdrola S.A. ╦ | 116 | ||||||
| 12 | National Grid plc ╦ | 175 | ||||||
| 3 | PG&E Corp. ╦ | 154 | ||||||
| 6 | PGE S.A. | 41 | ||||||
| 4 | Pinnacle West Capital Corp. ╦ | 234 | ||||||
| 28 | Snam S.p.A. ╦ | 150 | ||||||
| 2 | Southern Co. ╦ | 97 | ||||||
| 8 | SSE plc ╦ | 193 | ||||||
| 8 | Suez Environment S.A. ╦ | 143 | ||||||
| 4 | UGI Corp. ╦ | 134 | ||||||
| 4,491 | ||||||||
| Total Common Stocks | ||||||||
| (Cost $37,382) | $ | 36,775 | ||||||
| Preferred Stocks - 0.1% | ||||||||
| Media - 0.1% | ||||||||
| 4 | ProSieben Sat.1 Media AG ☼ | $ | 143 | |||||
| Total Preferred Stocks | ||||||||
| (Cost $147) | $ | 143 | ||||||
| Total Long-Term Investments Excluding Purchased Options | ||||||||
| (Cost $152,616) | $ | 149,018 | ||||||
| Short-Term Investments - 2.2% | ||||||||
| Repurchase Agreements - 2.2% | ||||||||
| Bank of America Merrill Lynch TriParty Repurchase Agreement (maturing on 11/03/2014 in the amount of $9, collateralized by U.S. Treasury Note 1.50%, 2019, value of $9) | ||||||||
| $ | 9 | 0.08%, 10/31/2014 | $ | 9 | ||||
| Bank of America Merrill Lynch TriParty Repurchase Agreement (maturing on 11/03/2014 in the amount of $148, collateralized by GNMA 1.63% - 7.00%, 2031 - 2054, value of $151) | ||||||||
| 148 | 0.09%, 10/31/2014 | 148 | ||||||
The accompanying notes are an integral part of these financial statements.
| 15 |
| Hartford Multi-Asset Income Fund |
| Schedule of Investments – (continued) |
| October 31, 2014 |
| (000’s Omitted) |
| Shares or Principal Amount ╬ | Market Value ╪ | |||||||||||
| Short-Term Investments - 2.2% - (continued) | ||||||||||||
| Repurchase Agreements - 2.2% - (continued) | ||||||||||||
| Bank of Montreal TriParty Repurchase Agreement (maturing on 11/03/2014 in the amount of $40, collateralized by U.S. Treasury Bond 2.88% - 5.25%, 2029 - 2043, U.S. Treasury Note 0.38% - 4.50%, 2015 - 2022, value of $41) | ||||||||||||
| $ | 40 | 0.08%, 10/31/2014 | $ | 40 | ||||||||
| Bank of Montreal TriParty Repurchase Agreement (maturing on 11/03/2014 in the amount of $135, collateralized by FHLMC 2.00% - 5.50%, 2022 - 2034, FNMA 2.00% - 4.50%, 2024 - 2039, GNMA 3.00%, 2043, U.S. Treasury Note 4.63%, 2017, value of $138) | ||||||||||||
| 135 | 0.10%, 10/31/2014 | 135 | ||||||||||
| Barclays Capital TriParty Repurchase Agreement (maturing on 11/03/2014 in the amount of $509, collateralized by U.S. Treasury Bond 4.50% - 6.25%, 2023 - 2036, U.S. Treasury Note 1.63% - 2.13%, 2015 - 2019, value of $519) | ||||||||||||
| 509 | 0.08%, 10/31/2014 | 509 | ||||||||||
| Citigroup Global Markets, Inc. TriParty Repurchase Agreement (maturing on 11/03/2014 in the amount of $585, collateralized by U.S. Treasury Bill 0.02%, 2015, U.S. Treasury Bond 3.88% - 11.25%, 2015 - 2040, U.S. Treasury Note 2.00% - 3.38%, 2019 - 2021, value of $597) | ||||||||||||
| 585 | 0.09%, 10/31/2014 | 585 | ||||||||||
| Deutsche Bank Securities TriParty Repurchase Agreement (maturing on 11/03/2014 in the amount of $34, collateralized by U.S. Treasury Note 0.88%, 2017, value of $34) | ||||||||||||
| 34 | 0.13%, 10/31/2014 | 34 | ||||||||||
| RBS Securities, Inc. TriParty Repurchase Agreement (maturing on 11/03/2014 in the amount of $50, collateralized by U.S. Treasury Bond 3.63% - 5.00%, 2037 - 2043, U.S. Treasury Note 2.13%, 2020, value of $51) | ||||||||||||
| 50 | 0.07%, 10/31/2014 | 50 | ||||||||||
| Societe Generale TriParty Repurchase Agreement (maturing on 11/03/2014 in the amount of $524, collateralized by U.S. Treasury Bill 0.02%, 2015, U.S. Treasury Bond 3.75% - 11.25%, 2015 - 2043, U.S. Treasury Note 1.38% - 4.25%, 2015 - 2022, value of $534) | ||||||||||||
| 523 | 0.08%, 10/31/2014 | 523 | ||||||||||
| TD Securities TriParty Repurchase Agreement (maturing on 11/03/2014 in the amount of $1,015, collateralized by FHLMC 3.00% - 4.00%, 2026 - 2044, FNMA 2.50% - 5.00%, 2025 - 2044, U.S. Treasury Bond 3.50% - 6.50%, 2026 - 2041, U.S. Treasury Note 1.75% - 2.88%, 2018 - 2019, value of $1,035) | ||||||||||||
| 1,014 | 0.10%, 10/31/2014 | 1,014 | ||||||||||
| 3,047 | ||||||||||||
| Total Short-Term Investments | ||||||||||||
| (Cost $3,047) | $ | 3,047 | ||||||||||
| Total Investments Excluding Purchased Options | ||||||||||||
| (Cost $155,663) | 107.4 | % | $ | 152,065 | ||||||||
| Total Purchased Options | ||||||||||||
| (Cost $68) | – | % | 65 | |||||||||
| Total Investments | ||||||||||||
| (Cost $155,731) ▲ | 107.4 | % | $ | 152,130 | ||||||||
| Other Assets and Liabilities | (7.4 | )% | (10,546 | ) | ||||||||
| Total Net Assets | 100.0 | % | $ | 141,584 | ||||||||
The accompanying notes are an integral part of these financial statements.
| 16 |
| Hartford Multi-Asset Income Fund | |
| Schedule of Investments – (continued) | |
| October 31, 2014 | |
| (000’s Omitted) | |
| Note: | Percentage of investments as shown is the ratio of the total market value to total net assets. |
Prices of foreign equities that are principally traded on certain foreign markets may be adjusted daily pursuant to a fair value pricing service approved by the Board of Directors in order to reflect an adjustment for factors occurring after the close of certain foreign markets but before the close of the New York Stock Exchange.
The Fund may refer to any one or more of the industry classifications used by one or more widely recognized market indices, ratings group indices and/or as defined by Fund management. Industry classifications may not be identical across all security types.
Equity industry classifications used in this report are the Global Industry Classification Standard, which was developed by and is the exclusive property and service mark of MSCI, Inc. and Standard & Poor’s.
For Fund compliance purposes, the Fund may not use the same classification system shown in this report as these classifications are used for reporting ease.
| ▲ | At October 31, 2014, the cost of securities for federal income tax purposes was $155,711 and the aggregate gross unrealized appreciation and depreciation based on that cost were: |
| Unrealized Appreciation | $ | 1,587 | ||
| Unrealized Depreciation | (5,168 | ) | ||
| Net Unrealized Depreciation | $ | (3,581 | ) |
| ╬ | All principal amounts are in U.S. dollars unless otherwise indicated. |
| ● | Non-income producing. For long-term debt securities, items identified are in default as to payment of interest and/or principal. |
| Ϫ |
The issuer is in bankruptcy. The investment held by the Fund has made partial interest payments. |
| Δ | Variable rate securities; the rate reported is the coupon rate in effect at October 31, 2014. |
| ○ | The interest rate disclosed for these securities represents the effective yield on the date of the acquisition. |
| ◄ | The principal amount for this security is adjusted for inflation and the interest payments equal a fixed percentage of the inflation-adjusted principal amount. |
| ♦ | Senior floating rate interests generally pay interest rates which are periodically adjusted by reference to a base short-term, floating lending rate plus a premium. The base lending rates are primarily the LIBOR, and secondarily the prime rate offered by one or more major United States banks (the "Prime Rate") and the certificate of deposit rate or other base lending rates used by commercial lenders. Senior floating rate interests often require prepayments from excess cash flows or permit the borrower to repay at its election. The rate at which the borrower repays cannot be predicted with accuracy. As a result, the actual remaining maturity may be substantially less than the stated maturities shown. Unless otherwise noted, the interest rate disclosed for these securities represents the average coupon as of October 31, 2014. |
| ■ | Securities issued within terms of a private placement memorandum, exempt from registration under Rule 144A under the Securities Act of 1933, as amended, and may be sold only to qualified institutional buyers. Unless otherwise indicated, these holdings are determined to be liquid. At October 31, 2014, the aggregate value of these securities was $5,937, which represents 4.2% of total net assets. |
| § | These securities were sold to the Fund under Regulation S, rules governing offers and sales made outside the United States without registration under the Securities Act of 1933, as amended. The Fund may only be able to resell these securities in the United States if an exemption from registration under the federal and state securities laws is available, or the Fund may only be able to sell these securities outside of the United States (such as on a foreign exchange) to a non-U.S. person. Unless otherwise indicated, these holdings are determined to be liquid. At October 31, 2014, the aggregate value of these securities was $18,569, which represents 13.1% of total net assets. |
| β | Convertible security. |
| ♠ | Perpetual maturity security. Maturity date shown is the next call date or final legal maturity date, whichever comes first. |
| Þ | This security may pay interest in the form of additional principal in lieu of cash. |
| Ð | Represents or includes a TBA transaction. |
| ☼ | This security, or a portion of this security, was purchased on a when-issued or delayed-delivery basis. The cost of these securities was $13,724 at October 31, 2014. |
| ‡ | This security, or a portion of this security, has been segregated to cover funding requirements on investment transactions settling in the future. |
| ╦ | This security, or a portion of this security, has been pledged as collateral in connection with OTC swap contracts. |
| Θ | This security, or a portion of this security, has been pledged as collateral in connection with OTC option and/or swaption contracts. |
The accompanying notes are an integral part of these financial statements.
| 17 |
| Hartford Multi-Asset Income Fund |
| Schedule of Investments – (continued) |
| October 31, 2014 |
| (000’s Omitted) |
Cash and securities pledged and received as collateral in connection with derivatives at October 31, 2014:
| Pledged | Received * | |||||||
| OTC option and/or OTC swap contracts | $ | 540 | $ | 491 | ||||
| Exchange traded options contracts | 210 | – | ||||||
| Futures contracts | 127 | – | ||||||
| Centrally cleared swaps contracts | 674 | – | ||||||
| Total | $ | 1,551 | $ | 491 | ||||
* Securities valued at $176, held on behalf of the Fund at the custodian bank, were designated by broker(s) as collateral in connection with OTC option and/or OTC swap contracts.
Exchange Traded Option Contracts Outstanding at October 31, 2014
| Description | Risk Exposure Category | Exercise Price/
FX Rate/ Rate | Expiration Date | Number
of Contracts * | Market Value ╪ | Premiums
Paid by Fund | Unrealized Appreciation (Depreciation) | |||||||||||||||||||
| Purchased option contracts: | ||||||||||||||||||||||||||
| Calls | ||||||||||||||||||||||||||
| TransCanada Corp. Option | EQ | 55.00 USD | 01/17/15 | USD | 250 | $ | 21 | $ | 24 | $ | (3 | ) | ||||||||||||||
* The number of contracts does not omit 000's.
OTC Option Contracts Outstanding at October 31, 2014
| Description | Counter - party | Risk Exposure Category | Exercise Price/
FX Rate/ Rate | Expiration Date | Number
of Contracts * | Market Value ╪ | Premiums
Paid by Fund | Unrealized Appreciation (Depreciation) | ||||||||||||||||
| Purchased Option contracts: | ||||||||||||||||||||||||
| Calls | ||||||||||||||||||||||||
| BRL Call/USD Put | JPM | FX | 2.43 BRL per USD | 09/28/15 | BRL | 600,000 | $ | 2 | $ | 4 | $ | (2 | ) | |||||||||||
| INR Call/USD Put | BOA | FX | 62.55 INR per USD | 01/16/15 | INR | 40,000,000 | 11 | 11 | – | |||||||||||||||
| MXN Call/USD Put | JPM | FX | 13.61 MXN per USD | 01/15/15 | MXN | 7,735,248 | 10 | 11 | (1 | ) | ||||||||||||||
| RUB Call/USD Put | GSC | FX | 36.97 RUB per USD | 09/02/15 | RUB | 9,000,000 | – | 3 | (3 | ) | ||||||||||||||
| TRY Call/USD Put | JPM | FX | 2.31 TRY per USD | 01/19/15 | TRY | 1,500,000 | 21 | 15 | 6 | |||||||||||||||
| Total Calls | 58,835,248 | $ | 44 | $ | 44 | $ | – | |||||||||||||||||
| Total purchased option contracts | 58,835,248 | $ | 44 | $ | 44 | $ | – | |||||||||||||||||
* The number of contracts does not omit 000's.
OTC Swaption Contracts Outstanding at October 31, 2014
| Description | Counter
- party | Risk Exposure Category | Exercise
Price/ FX Rate/ Rate | Expiration Date | Number
of Contracts * | Market Value ╪ | Premiums Received by Fund | Unrealized Appreciation (Depreciation) | ||||||||||||||||
| Written swaption contracts: | ||||||||||||||||||||||||
| Calls | ||||||||||||||||||||||||
| Credit Default Swaption ITRAXX.22 | MSC | CR | 0.70% | 11/19/14 | EUR | 19,205,000 | $ | 77 | $ | 74 | $ | (3 | ) | |||||||||||
| Credit Default Swaption ITRAXX.22 | BNP | CR | 0.70% | 11/19/14 | EUR | 18,780,000 | 75 | 58 | (17 | ) | ||||||||||||||
| Total Calls | 37,985,000 | $ | 152 | $ | 132 | $ | (20 | ) | ||||||||||||||||
| Puts | ||||||||||||||||||||||||
| Credit Default Swaption ITRAXX.22 | MSC | CR | 0.70% | 11/19/14 | EUR | 19,205,000 | $ | 25 | $ | 56 | $ | 31 | ||||||||||||
| Credit Default Swaption ITRAXX.22 | BNP | CR | 0.70% | 11/19/14 | EUR | 18,780,000 | 25 | 58 | 33 | |||||||||||||||
| Total Puts | 37,985,000 | $ | 50 | $ | 114 | $ | 64 | |||||||||||||||||
| Total written swaption contracts | 75,970,000 | $ | 202 | $ | 246 | $ | 44 | |||||||||||||||||
* The number of contracts does not omit 000’s.
The accompanying notes are an integral part of these financial statements.
| 18 |
| Hartford Multi-Asset Income Fund |
| Schedule of Investments – (continued) |
| October 31, 2014 |
| (000’s Omitted) |
| Futures Contracts Outstanding at October 31, 2014 |
| Number of | Expiration | Notional | Market | Unrealized Appreciation/(Depreciation) | Variation Margin | |||||||||||||||||||||||||
| Description | Contracts* | Date | Amount | Value ╪ | Asset | Liability | Asset | Liability | ||||||||||||||||||||||
| Long position contracts: | ||||||||||||||||||||||||||||||
| U.S. Treasury 5-Year Note Future | 17 | 12/31/2014 | $ | 2,032 | $ | 2,030 | $ | – | $ | (2 | ) | $ | – | $ | (3 | ) | ||||||||||||||
| U.S. Treasury CME Ultra Long Term Bond Future | 9 | 12/19/2014 | 1,427 | 1,412 | – | (15 | ) | – | (5 | ) | ||||||||||||||||||||
| U.S. Treasury Long Bond Future | 15 | 12/19/2014 | 2,114 | 2,116 | 2 | – | – | (7 | ) | |||||||||||||||||||||
| Total | $ | 2 | $ | (17 | ) | $ | – | $ | (15 | ) | ||||||||||||||||||||
| Short position contracts: | ||||||||||||||||||||||||||||||
| 90-Day Eurodollar Future | 28 | 12/14/2015 | $ | 6,945 | $ | 6,941 | $ | 4 | $ | – | $ | 3 | $ | – | ||||||||||||||||
| U.S. Treasury 10-Year Note Future | 89 | 12/19/2014 | 11,280 | 11,246 | 34 | – | 9 | – | ||||||||||||||||||||||
| U.S. Treasury 5-Year Note Future | 72 | 12/31/2014 | 8,597 | 8,599 | – | (2 | ) | – | (2 | ) | ||||||||||||||||||||
| Total | $ | 38 | $ | (2 | ) | $ | 12 | $ | (2 | ) | ||||||||||||||||||||
| Total futures contracts | $ | 40 | $ | (19 | ) | $ | 12 | $ | (17 | ) | ||||||||||||||||||||
* The number of contracts does not omit 000's.
| OTC Credit Default Swap Contracts Outstanding at October 31, 2014 |
| Counter- | Notional | (Pay)/ Receive Fixed Rate/ Implied |
Expiration | Upfront Premiums |
Upfront Premiums |
Market | Unrealized Appreciation/ (Depreciation) |
||||||||||||||||||||||
| Reference Entity | party | Amount (a) | Credit Spread (b) | Date | Paid | Received | Value ╪ | Asset | Liability | ||||||||||||||||||||
| Credit default swaps on indices: | |||||||||||||||||||||||||||||
| Buy protection: | |||||||||||||||||||||||||||||
| ABX.HE.AAA.06-1 | JPM | USD | 10 | (0.18)% | 07/25/45 | $ | – | $ | – | $ | – | $ | – | $ | – | ||||||||||||||
| ABX.HE.AAA.06-2 | CSI | USD | 127 | (0.11)% | 05/25/46 | 25 | – | 25 | – | – | |||||||||||||||||||
| ABX.HE.AAA.06-2 | MSC | USD | 163 | (0.11)% | 05/25/46 | 34 | – | 33 | – | (1 | ) | ||||||||||||||||||
| ABX.HE.AAA.07 | MSC | USD | 441 | (0.09)% | 08/25/37 | 115 | – | 115 | – | – | |||||||||||||||||||
| ABX.HE.AAA.07-1 | GSC | USD | 387 | (0.09)% | 08/25/37 | 98 | – | 101 | 3 | – | |||||||||||||||||||
| ABX.HE.AAA.07-1 | MSC | USD | 471 | (0.09)% | 08/25/37 | 116 | – | 122 | 6 | – | |||||||||||||||||||
| CMBX.NA.A.7 | JPM | USD | 170 | (2.00)% | 01/17/47 | – | (3 | ) | – | 3 | – | ||||||||||||||||||
| CMBX.NA.AA.2 | CSI | USD | 578 | (0.15)% | 03/15/49 | 161 | – | 187 | 26 | – | |||||||||||||||||||
| CMBX.NA.AA.7 | CSI | USD | 230 | (1.50)% | 01/17/47 | – | – | – | – | – | |||||||||||||||||||
| CMBX.NA.AA.7 | CSI | USD | 630 | (1.50)% | 01/17/47 | – | (5 | ) | 2 | 7 | – | ||||||||||||||||||
| CMBX.NA.AJ.1 | JPM | USD | 255 | (0.84)% | 10/12/52 | 5 | – | 6 | 1 | – | |||||||||||||||||||
| CMBX.NA.AJ.2 | JPM | USD | 238 | (1.09)% | 03/15/49 | 18 | – | 20 | 2 | – | |||||||||||||||||||
| CMBX.NA.AJ.4 | CSI | USD | 60 | (0.96)% | 02/17/51 | 12 | – | 12 | – | – | |||||||||||||||||||
| CMBX.NA.AJ.4 | CSI | USD | 284 | (0.96)% | 02/17/51 | 54 | – | 55 | 1 | – | |||||||||||||||||||
| CMBX.NA.AJ.4 | GSC | USD | 264 | (0.96)% | 02/17/51 | 46 | – | 52 | 6 | – | |||||||||||||||||||
| CMBX.NA.AJ.4 | JPM | USD | 647 | (0.96)% | 02/17/51 | 118 | – | 126 | 8 | – | |||||||||||||||||||
| CMBX.NA.AJ.4 | MSC | USD | 169 | (0.96)% | 02/17/51 | 36 | – | 34 | – | (2 | ) | ||||||||||||||||||
| CMBX.NA.AM.2 | JPM | USD | 1,025 | (0.50)% | 03/15/49 | 13 | – | 13 | – | – | |||||||||||||||||||
| CMBX.NA.AM.4 | JPM | USD | 155 | (0.50)% | 02/17/51 | 6 | – | 6 | – | – | |||||||||||||||||||
| CMBX.NA.AS.6 | CSI | USD | 385 | (1.00)% | 05/11/63 | 1 | – | 4 | 3 | – | |||||||||||||||||||
| CMBX.NA.AS.7 | CSI | USD | 190 | (1.00)% | 01/17/47 | 1 | – | 3 | 2 | – | |||||||||||||||||||
| Total | $ | 859 | $ | (8 | ) | $ | 916 | $ | 68 | $ | (3 | ) | |||||||||||||||||
| Sell protection: | |||||||||||||||||||||||||||||
| CDX.EM.22 | CBK | USD | 2,025 | 1.00% | 12/20/19 | $ | – | $ | (150 | ) | $ | (131 | ) | $ | 19 | $ | – | ||||||||||||
| CMBX.NA.A.2 | BOA | USD | 97 | 0.25% | 03/15/49 | – | (57 | ) | (63 | ) | – | (6 | ) | ||||||||||||||||
| CMBX.NA.AAA.6 | BCLY | USD | 12,150 | 0.50% | 05/11/63 | – | (177 | ) | (237 | ) | – | (60 | ) | ||||||||||||||||
| CMBX.NA.AAA.6 | BOA | USD | 80 | 0.50% | 05/11/63 | – | (3 | ) | (2 | ) | 1 | – | |||||||||||||||||
| CMBX.NA.AAA.6 | CSI | USD | 3,105 | 0.50% | 05/11/63 | – | (52 | ) | (61 | ) | – | (9 | ) | ||||||||||||||||
| CMBX.NA.BB.6 | BCLY | USD | 55 | 5.00% | 05/11/63 | – | – | – | – | – | |||||||||||||||||||
| CMBX.NA.BB.6 | CSI | USD | 280 | 5.00% | 05/11/63 | – | (1 | ) | – | 1 | – | ||||||||||||||||||
| CMBX.NA.BB.6 | CSI | USD | 1,075 | 5.00% | 05/11/63 | 15 | – | (2 | ) | – | (17 | ) | |||||||||||||||||
| CMBX.NA.BB.6 | CSI | USD | 55 | 5.00% | 05/11/63 | – | – | – | – | – | |||||||||||||||||||
| CMBX.NA.BB.7 | BCLY | USD | 45 | 5.00% | 01/17/47 | – | (1 | ) | (1 | ) | – | – | |||||||||||||||||
| CMBX.NA.BB.7 | BOA | USD | 105 | 5.00% | 01/17/47 | – | (4 | ) | (3 | ) | 1 | – | |||||||||||||||||
| CMBX.NA.BB.7 | CBK | USD | 45 | 5.00% | 01/17/47 | – | (1 | ) | (1 | ) | – | – | |||||||||||||||||
| CMBX.NA.BB.7 | CSI | USD | 110 | 5.00% | 01/17/47 | – | (6 | ) | (3 | ) | 3 | – | |||||||||||||||||
The accompanying notes are an integral part of these financial statements.
| 19 |
| Hartford Multi-Asset Income Fund |
| Schedule of Investments – (continued) |
| October 31, 2014 |
| (000’s Omitted) |
| OTC Credit Default Swap Contracts Outstanding at October 31, 2014 - (continued) |
| Counter- | Notional | (Pay)/ Receive Fixed Rate/ Implied |
Expiration | Upfront Premiums |
Upfront Premiums |
Market | Unrealized Appreciation/ (Depreciation) |
||||||||||||||||||||||
| Reference Entity | party | Amount (a) | Credit Spread (b) | Date | Paid | Received | Value ╪ | Asset | Liability | ||||||||||||||||||||
| Credit default swaps on indices: - (continued) | |||||||||||||||||||||||||||||
| Sell protection: - (continued) | |||||||||||||||||||||||||||||
| CMBX.NA.BB.7 | DEUT | USD | 70 | 5.00% | 01/17/47 | $ | – | $ | (2 | ) | $ | (2 | ) | $ | – | $ | – | ||||||||||||
| CMBX.NA.BB.7 | JPM | USD | 625 | 5.00% | 01/17/47 | 1 | – | (12 | ) | – | (13 | ) | |||||||||||||||||
| CMBX.NA.BBB-.7 | CSI | USD | 213 | 3.00% | 01/17/47 | – | (1 | ) | (4 | ) | – | (3 | ) | ||||||||||||||||
| PrimeX.ARM.2 | JPM | USD | 343 | 4.58% | 12/25/37 | 12 | – | 11 | – | (1 | ) | ||||||||||||||||||
| PrimeX.FRM.1 | JPM | USD | 44 | 4.42% | 07/25/36 | 5 | – | 5 | – | – | |||||||||||||||||||
| Total | $ | 33 | $ | (455 | ) | $ | (506 | ) | $ | 25 | $ | (109 | ) | ||||||||||||||||
| Total traded indices | $ | 892 | $ | (463 | ) | $ | 410 | $ | 93 | $ | (112 | ) | |||||||||||||||||
| Credit default swaps on single-name issues: | |||||||||||||||||||||||||||||
| Sell protection: | |||||||||||||||||||||||||||||
| Bank of America Corp. | BCLY | USD | 500 | 1.00% / 0.63% | 06/20/19 | $ | 7 | $ | – | $ | 8 | $ | 1 | $ | – | ||||||||||||||
| Bank of America Corp. | GSC | USD | 1,425 | 1.00% / 0.66% | 09/20/19 | 24 | – | 23 | – | (1 | ) | ||||||||||||||||||
| Citigroup, Inc. | GSC | USD | 1,425 | 1.00% / 0.67% | 09/20/19 | 25 | – | 22 | – | (3 | ) | ||||||||||||||||||
| Citigroup, Inc. | GSC | USD | 500 | 1.00% / 0.63% | 06/20/19 | 7 | – | 8 | 1 | – | |||||||||||||||||||
| Goldman Sachs Group, Inc. | BCLY | USD | 250 | 1.00% / 0.75% | 06/20/19 | 2 | – | 3 | 1 | – | |||||||||||||||||||
| Goldman Sachs Group, Inc. | CSI | USD | 725 | 1.00% / 0.79% | 09/20/19 | 11 | – | 7 | – | (4 | ) | ||||||||||||||||||
| Morgan Stanley | BCLY | USD | 725 | 1.00% / 0.76% | 09/20/19 | 11 | – | 8 | – | (3 | ) | ||||||||||||||||||
| Morgan Stanley | GSC | USD | 250 | 1.00% / 0.72% | 06/20/19 | 3 | – | 3 | – | – | |||||||||||||||||||
| Total | $ | 90 | $ | – | $ | 82 | $ | 3 | $ | (11 | ) | ||||||||||||||||||
| $ | 982 | $ | (463 | ) | $ | 492 | $ | 96 | $ | (123 | ) | ||||||||||||||||||
| (a) | The maximum potential amount the Fund could be required to pay as a seller of credit protection or receive as a buyer of credit protection if a credit event occurs as defined under the terms of that particular swap agreement. |
| (b) | Implied credit spreads, utilized in determining the market value of credit default swap agreements on corporate issues, U.S. municipal issues or sovereign government issues as of period end serve as an indicator of the current status of the payment/performance risk and represent the likelihood of risk of default for the credit derivative. The implied credit spread of a particular entity reflects the cost of buying/selling protection and may include upfront payments required to be made to enter into the agreement. Wider credit spreads represent a deterioration of the reference entity's credit soundness and a greater likelihood or risk of default or other credit event occurring as defined under the terms of the agreement. The percentage shown is the implied credit spread on October 31, 2014. For credit default swap agreements on indices, the quoted market prices and resulting values serve as the indicator of the current status of the payment/performance risk. |
Centrally Cleared Credit Default Swap Contracts Outstanding at October 31, 2014
| Clearing | Notional | (Pay)/ Receive Fixed | Expiration | Market | Unrealized Appreciation/ (Depreciation) | Variation Margin | |||||||||||||||||||||||||||
| Reference Entity | House (a) | Amount (b) | Rate | Date | Cost Basis | Value ╪ | Asset | Liability | Asset | Liability | |||||||||||||||||||||||
| Credit default swaps on indices: | |||||||||||||||||||||||||||||||||
| Buy protection: | |||||||||||||||||||||||||||||||||
| CDX.NA.IG.23 | CME | USD | 3,765 | (1.00)% | 12/20/19 | $ | (57 | ) | $ | (66 | ) | $ | – | $ | (9 | ) | $ | – | $ | (3 | ) | ||||||||||||
| ITRAXX.EUR.22 | ICE | EUR | 4,855 | (1.00)% | 12/20/19 | (96 | ) | (107 | ) | – | (11 | ) | – | (9 | ) | ||||||||||||||||||
| ITRAXX.XOV.22 | ICE | EUR | 2,650 | (5.00)% | 12/20/19 | (208 | ) | (213 | ) | – | (5 | ) | – | (13 | ) | ||||||||||||||||||
| Total | $ | (361 | ) | $ | (386 | ) | $ | – | $ | (25 | ) | $ | – | $ | (25 | ) | |||||||||||||||||
| Sell protection: | |||||||||||||||||||||||||||||||||
| CDX.NA.HY.22 | CME | USD | 8,207 | 5.00% | 06/20/19 | $ | 575 | $ | 615 | $ | 40 | $ | – | $ | 28 | $ | – | ||||||||||||||||
| CDX.NA.HY.23 | CME | USD | 3,050 | 5.00% | 12/20/19 | 200 | 213 | 13 | – | 12 | – | ||||||||||||||||||||||
| Total | $ | 775 | $ | 828 | $ | 53 | $ | – | $ | 40 | $ | – | |||||||||||||||||||||
| Total traded indices | $ | 414 | $ | 442 | $ | 53 | $ | (25 | ) | $ | 40 | $ | (25 | ) | |||||||||||||||||||
| (a) | The FCM to the contracts is MSC. |
| (b) | The maximum potential amount the Fund could be required to pay as a seller of credit protection or receive as a buyer of credit protection if a credit event occurs as defined under the terms of that particular swap agreement. |
The accompanying notes are an integral part of these financial statements.
| 20 |
| Hartford Multi-Asset Income Fund |
| Schedule of Investments – (continued) |
| October 31, 2014 |
| (000’s Omitted) |
OTC Total Return Swap Contracts Outstanding at October 31, 2014
| Notional | Payments received | Expiration | Upfront Premiums | Upfront Premiums | Market | Unrealized Appreciation/(Depreciation) | |||||||||||||||||||||||
| Reference Entity | Counterparty | Amount | (paid) by Fund | Date | Paid | Received | Value ╪ | Asset | Liability | ||||||||||||||||||||
| JPM CORP EMBI † | JPM | USD | 2,925 | 3M LIBOR - 1.00% | 12/24/14 | $ | – | $ | – | $ | (9 | ) | $ | – | $ | (9 | ) | ||||||||||||
| JPM EMBI Plus | JPM | USD | 10,225 | 3M LIBOR + 0.95% | 12/24/14 | – | – | (149 | ) | – | (149 | ) | |||||||||||||||||
| Total | $ | – | $ | – | $ | (158 | ) | $ | – | $ | (158 | ) | |||||||||||||||||
| † | These securities were valued in good faith at fair value as determined under policies and procedures established by and under the supervision of the Company's Board of Directors. At October 31, 2014, the aggregate market value of these securities was $(9), which rounds to zero percent of total net assets. |
| TBA Sale Commitments Outstanding at October 31, 2014 |
| Description | Principal Amount | Maturity Date | Market Value ╪ | Unrealized Appreciation/ Depreciation | ||||||||||
| FNMA, 3.50% | $ | 2,600 | 11/15/2044 | $ | 2,689 | $ | (11 | ) | ||||||
| GNMA, 3.00% | 500 | 11/15/2044 | 509 | 2 | ||||||||||
| Total | $ | 3,198 | $ | (9 | ) | |||||||||
At October 31, 2014, the aggregate market value of these securities represents 2.3% of total net assets.
| Foreign Currency Contracts Outstanding at October 31, 2014 |
| Unrealized Appreciation/(Depreciation) | ||||||||||||||||||||||
| Currency | Buy / Sell | Delivery Date | Counterparty | Contract Amount | Market Value ╪ | Asset | Liability | |||||||||||||||
| EUR | Buy | 11/04/2014 | CBK | $ | 67 | $ | 66 | $ | – | $ | (1 | ) | ||||||||||
| EUR | Buy | 12/17/2014 | DEUT | 20 | 19 | – | (1 | ) | ||||||||||||||
| EUR | Buy | 11/28/2014 | GSC | 13 | 13 | – | – | |||||||||||||||
| EUR | Buy | 12/17/2014 | HSBC | 283 | 283 | – | – | |||||||||||||||
| EUR | Sell | 12/17/2014 | BCLY | 283 | 281 | 2 | – | |||||||||||||||
| EUR | Sell | 09/18/2015 | CBK | 194 | 188 | 6 | – | |||||||||||||||
| EUR | Sell | 12/17/2014 | DEUT | 2,052 | 1,987 | 65 | – | |||||||||||||||
| EUR | Sell | 11/04/2014 | HSBC | 283 | 283 | – | – | |||||||||||||||
| EUR | Sell | 11/28/2014 | JPM | 3,554 | 3,516 | 38 | – | |||||||||||||||
| EUR | Sell | 12/17/2014 | TDS | 4,851 | 4,817 | 34 | – | |||||||||||||||
| GBP | Buy | 11/04/2014 | BNY | 113 | 112 | – | (1 | ) | ||||||||||||||
| GBP | Sell | 11/28/2014 | CBK | 147 | 147 | – | – | |||||||||||||||
| GBP | Sell | 12/17/2014 | RBS | 789 | 777 | 12 | – | |||||||||||||||
| INR | Buy | 12/17/2014 | CBK | 1,364 | 1,357 | – | (7 | ) | ||||||||||||||
| RSD | Buy | 09/18/2015 | CBK | 182 | 178 | – | (4 | ) | ||||||||||||||
| ZAR | Sell | 11/04/2014 | NAB | 350 | 345 | 5 | – | |||||||||||||||
| Total | $ | 162 | $ | (14 | ) | |||||||||||||||||
| ╪ | See Significant Accounting Policies of accompanying Notes to Financial Statements regarding valuation of securities. |
The accompanying notes are an integral part of these financial statements.
| 21 |
| Hartford Multi-Asset Income Fund |
| Schedule of Investments – (continued) |
| October 31, 2014 |
| (000’s Omitted) |
| GLOSSARY: (abbreviations used in preceding Schedule of Investments) |
| Counterparty Abbreviations: | |
| BCLY | Barclays |
| BNP | BNP Paribas Securities Services |
| BNY | BNY Mellon |
| BOA | Banc of America Securities LLC |
| CBK | Citibank NA |
| CME | Chicago Mercantile Exchange |
| CSI | Credit Suisse International |
| DEUT | Deutsche Bank Securities, Inc. |
| FCM | Futures Commission Merchant |
| GSC | Goldman Sachs & Co. |
| HSBC | HSBC Bank USA |
| ICE | Intercontinental Exchange |
| JPM | JP Morgan Chase & Co. |
| MSC | Morgan Stanley |
| NAB | National Australia Bank Limited |
| RBS | RBS Greenwich Capital |
| TDS | TD Securities, Inc. |
| Currency Abbreviations: | |
| BRL | Brazilian Real |
| DOP | Dominican Peso |
| EUR | EURO |
| GBP | British Pound |
| IDR | Indonesian New Rupiah |
| INR | Indian Rupee |
| MXN | Mexican New Peso |
| NGN | Nigerian Naira |
| RSD | Serbian Dinar |
| RUB | Russian New Ruble |
| TRY | Turkish New Lira |
| USD | U.S. Dollar |
| UYU | Uruguayan Peso |
| ZAR | South African Rand |
| Index Abbreviations: | |
| ABX.HE | Markit Asset Backed Security Home Equity |
| CDX.EM | Credit Derivatives Emerging Markets |
| CDX.NA.HY | Credit Derivatives North American High Yield |
| CDX.NA.IG | Credit Derivatives North American Investment Grade |
| CMBX.NA | Markit Commercial Mortgage Backed North American |
| EMBI | Emerging Markets Bond Index |
| ITRAXX.EUR | Markit iTraxx - Europe |
| ITRAXX.XOV | Markit iTraxx Index - Europe Crossover |
| PrimeX.ARM | Markit PrimeX Adjustable Rate Mortgage Backed Security |
| PrimeX.FRM | Markit PrimeX Fixed Rate Mortgage Backed Security |
| Other Abbreviations: | |
| ADR | American Depositary Receipt |
| CR | Credit |
| EQ | Equity |
| FHLMC | Federal Home Loan Mortgage Corp. |
| FNMA | Federal National Mortgage Association |
| FX | Foreign Exchange |
| GDR | Global Depositary Receipt |
| GNMA | Government National Mortgage Association |
| LIBOR | London Interbank Offered Rate |
| OTC | Over-the-Counter |
| REIT | Real Estate Investment Trust |
| TBA | To Be Announced |
The accompanying notes are an integral part of these financial statements.
| 22 |
| Hartford Multi-Asset Income Fund |
| Schedule of Investments – (continued) |
| October 31, 2014 |
| (000’s Omitted) |
Investment Valuation Hierarchy Level Summary
October 31, 2014
| Total | Level 1 ♦ | Level 2 ♦ | Level 3 | |||||||||||||
| Assets: | ||||||||||||||||
| Common Stocks | ||||||||||||||||
| Banks | $ | 1,477 | $ | 857 | $ | 620 | $ | – | ||||||||
| Capital Goods | 898 | – | 898 | – | ||||||||||||
| Commercial and Professional Services | 315 | – | 315 | – | ||||||||||||
| Consumer Durables and Apparel | 243 | 243 | – | – | ||||||||||||
| Energy | 9,990 | 8,416 | 1,574 | – | ||||||||||||
| Food and Staples Retailing | 236 | 236 | – | – | ||||||||||||
| Food, Beverage and Tobacco | 286 | 9 | 277 | – | ||||||||||||
| Health Care Equipment and Services | 155 | 155 | – | – | ||||||||||||
| Insurance | 2,290 | 47 | 2,243 | – | ||||||||||||
| Materials | 788 | 463 | 325 | – | ||||||||||||
| Media | 814 | 551 | 263 | – | ||||||||||||
| Pharmaceuticals, Biotechnology and Life Sciences | 2,204 | 2,069 | 135 | – | ||||||||||||
| Real Estate | 3,911 | 2,764 | 1,147 | – | ||||||||||||
| Retailing | 906 | 906 | – | – | ||||||||||||
| Semiconductors and Semiconductor Equipment | 88 | 88 | – | – | ||||||||||||
| Software and Services | 9 | 9 | – | – | ||||||||||||
| Technology Hardware and Equipment | 1,482 | 841 | 641 | – | ||||||||||||
| Telecommunication Services | 5,508 | 2,107 | 3,401 | – | ||||||||||||
| Transportation | 684 | 219 | 465 | – | ||||||||||||
| Utilities | 4,491 | 2,222 | 2,269 | – | ||||||||||||
| Total | 36,775 | 22,202 | 14,573 | – | ||||||||||||
| Asset and Commercial Mortgage Backed Securities | 15,280 | – | 10,146 | 5,134 | ||||||||||||
| Corporate Bonds | 23,675 | – | 23,455 | 220 | ||||||||||||
| Foreign Government Obligations | 19,800 | – | 19,800 | – | ||||||||||||
| Municipal Bonds | 630 | – | 630 | – | ||||||||||||
| Preferred Stocks | 143 | – | 143 | – | ||||||||||||
| Senior Floating Rate Interests | 40,537 | – | 40,537 | – | ||||||||||||
| U.S. Government Agencies | 12,178 | – | 12,178 | – | ||||||||||||
| Short-Term Investments | 3,047 | – | 3,047 | – | ||||||||||||
| Purchased Options | 65 | 21 | 44 | – | ||||||||||||
| Total | $ | 152,130 | $ | 22,223 | $ | 124,553 | $ | 5,354 | ||||||||
| Foreign Currency Contracts* | $ | 162 | $ | – | $ | 162 | $ | – | ||||||||
| Futures* | 40 | 40 | – | – | ||||||||||||
| Swaps - Credit Default* | 149 | – | 149 | – | ||||||||||||
| Total | $ | 351 | $ | 40 | $ | 311 | $ | – | ||||||||
| Liabilities: | ||||||||||||||||
| Securities Sold Short | $ | 3,198 | $ | – | $ | 3,198 | $ | – | ||||||||
| Written Options | 202 | – | 202 | – | ||||||||||||
| Total | $ | 3,400 | $ | – | $ | 3,400 | $ | – | ||||||||
| Foreign Currency Contracts* | $ | 14 | $ | – | $ | 14 | $ | – | ||||||||
| Futures* | 19 | 19 | – | – | ||||||||||||
| Swaps - Credit Default* | 148 | – | 148 | – | ||||||||||||
| Swaps - Total Return* | 158 | – | 149 | 9 | ||||||||||||
| Total | $ | 339 | $ | 19 | $ | 311 | $ | 9 | ||||||||
| ♦ | For the period April 30, 2014 (commencement of operations) through October 31, 2014, there were no transfers between Level 1 and Level 2. |
| * | Derivative instruments (excluding purchased and written options, if applicable) are valued at the unrealized appreciation/depreciation on the investments. |
The accompanying notes are an integral part of these financial statements.
| 23 |
| Hartford Multi-Asset Income Fund |
| Schedule of Investments – (continued) |
| October 31, 2014 |
| (000’s Omitted) |
Following is a reconciliation of Level 3 assets for which significant unobservable inputs were used to determine fair value:
| Balance as of April 30, 2014* | Realized Gain (Loss) | Change
in Unrealized Appreciation (Depreciation) | Net Amortization | Purchases | Sales | Transfers Into Level 3 | Transfers Out of Level 3 | Balance as of October 31, 2014 | ||||||||||||||||||||||||||||
| Assets: | ||||||||||||||||||||||||||||||||||||
| Asset & Commercial Mortgage Backed Securities | $ | — | $ | 35 | $ | (96 | )† | $ | 30 | $ | 5,333 | $ | (168 | ) | $ | — | $ | — | $ | 5,134 | ||||||||||||||||
| Corporate Bonds | — | — | — | ‡ | — | 220 | — | — | — | 220 | ||||||||||||||||||||||||||
| Total | $ | — | $ | 35 | $ | (96 | ) | $ | 30 | $ | 5,553 | $ | (168 | ) | $ | — | $ | — | $ | 5,354 | ||||||||||||||||
| Liabilities: | ||||||||||||||||||||||||||||||||||||
| Swaps§ | $ | — | $ | — | $ | 9 | ** | $ | — | $ | — | $ | — | $ | — | $ | — | $ | 9 | |||||||||||||||||
| Total | $ | — | $ | — | $ | 9 | $ | — | $ | — | $ | — | $ | — | $ | — | $ | 9 | ||||||||||||||||||
| * | Commencement of operations. |
| † | Change in unrealized appreciation (depreciation) in the current period relating to assets still held at October 31, 2014 was $(96). |
| ‡ | Change in unrealized appreciation (depreciation) in the current period relating to assets still held at October 31, 2014 was zero. |
| § | Derivative instruments not reflected in the Schedule of Investments are valued at the unrealized appreciation/ depreciation on the investment. |
| ** | Change in unrealized appreciation (depreciation) in the current period relating to assets still held at October 31, 2014 was $(9). |
The accompanying notes are an integral part of these financial statements.
| 24 |
| Hartford Multi-Asset Income Fund |
| Statement of Assets and Liabilities |
| October 31, 2014 |
| (000’s Omitted) |
| Assets: | ||||
| Investments in securities, at market value (cost $155,731) | $ | 152,130 | ||
| Cash | 1,551 | * | ||
| Foreign currency on deposit with custodian (cost $141) | 141 | |||
| Unrealized appreciation on foreign currency contracts | 162 | |||
| Unrealized appreciation on OTC swap contracts | 96 | |||
| Receivables: | ||||
| Investment securities sold | 3,922 | |||
| Fund shares sold | 157 | |||
| Dividends and interest | 995 | |||
| Variation margin on financial derivative instruments | 52 | |||
| OTC swap premiums paid | 982 | |||
| Other assets | 81 | |||
| Total assets | 160,269 | |||
| Liabilities: | ||||
| Unrealized depreciation on foreign currency contracts | 14 | |||
| Unrealized depreciation on OTC swap contracts | 281 | |||
| Bank overdraft | 43 | |||
| TBA sale commitments, at market value (proceeds $3,189) | 3,198 | |||
| Payables: | ||||
| Investment securities purchased | 14,074 | |||
| Investment management fees | 20 | |||
| Administrative fees | — | |||
| Distribution fees | 2 | |||
| Collateral received from broker | 315 | |||
| Variation margin on financial derivative instruments | 42 | |||
| Accrued expenses | 17 | |||
| OTC swap premiums received | 463 | |||
| Written option contracts (proceeds $246) | 202 | |||
| Other liabilities | 14 | |||
| Total liabilities | 18,685 | |||
| Net assets | $ | 141,584 | ||
| Summary of Net Assets: | ||||
| Capital stock and paid-in-capital | $ | 144,171 | ||
| Undistributed net investment income | 1,189 | |||
| Accumulated net realized loss | (209 | ) | ||
| Unrealized depreciation of investments and the translation of assets and liabilities denominated in foreign currency | (3,567 | ) | ||
| Net assets | $ | 141,584 |
* Cash of $1,551 was pledged as collateral for open financial derivative instruments at October 31, 2014.
The accompanying notes are an integral part of these financial statements.
| 25 |
| Hartford Multi-Asset Income Fund |
| Statement of Assets and Liabilities – (continued) |
| October 31, 2014 |
| (000’s Omitted) |
| Shares authorized | 500,000 | |||
| Par value | $ | 0.001 | ||
| Class A: Net asset value per share/Maximum offering price per share | $9.95/$10.42 | |||
| Shares outstanding | 1,057 | |||
| Net assets | $ | 10,514 | ||
| Class C: Net asset value per share | $ | 9.94 | ||
| Shares outstanding | 437 | |||
| Net assets | $ | 4,350 | ||
| Class I: Net asset value per share | $ | 9.95 | ||
| Shares outstanding | 225 | |||
| Net assets | $ | 2,238 | ||
| Class R3: Net asset value per share | $ | 9.95 | ||
| Shares outstanding | 202 | |||
| Net assets | $ | 2,012 | ||
| Class R4: Net asset value per share | $ | 9.95 | ||
| Shares outstanding | 203 | |||
| Net assets | $ | 2,016 | ||
| Class R5: Net asset value per share | $ | 9.95 | ||
| Shares outstanding | 203 | |||
| Net assets | $ | 2,017 | ||
| Class Y: Net asset value per share | $ | 9.95 | ||
| Shares outstanding | 11,901 | |||
| Net assets | $ | 118,437 |
The accompanying notes are an integral part of these financial statements.
| 26 |
| Hartford Multi-Asset Income Fund |
| Statement of Operations |
| For the Period April 30, 2014 (commencement of operations) through October 31, 2014 |
| (000’s Omitted) |
| Investment Income: | ||||
| Dividends | $ | 1,012 | ||
| Interest | 1,749 | |||
| Less: Foreign tax withheld | (78 | ) | ||
| Total investment income | 2,683 | |||
| Expenses: | ||||
| Investment management fees | 436 | |||
| Administrative services fees | ||||
| Class R3 | 2 | |||
| Class R4 | 1 | |||
| Class R5 | 1 | |||
| Transfer agent fees | ||||
| Class A | — | |||
| Class C | — | |||
| Class I | — | |||
| Class Y | — | |||
| Distribution fees | ||||
| Class A | 9 | |||
| Class C | 15 | |||
| Class R3 | 5 | |||
| Class R4 | 3 | |||
| Custodian fees | 12 | |||
| Accounting services fees | 12 | |||
| Registration and filing fees | 36 | |||
| Board of Directors' fees | 2 | |||
| Audit fees | 10 | |||
| Other expenses | 11 | |||
| Total expenses (before waivers and fees paid indirectly) | 555 | |||
| Expense waivers | (32 | ) | ||
| Commission recapture | — | |||
| Custodian fee offset | — | |||
| Total waivers and fees paid indirectly | (32 | ) | ||
| Total expenses, net | 523 | |||
| Net Investment Income | 2,160 | |||
| Net Realized Gain on Investments, Other Financial Instruments and Foreign Currency Transactions: | ||||
| Net realized gain on investments | 393 | |||
| Less: Foreign taxes paid on realized capital gains | (1 | ) | ||
| Net realized loss on purchased option contracts | (125 | ) | ||
| Net realized loss on TBA sale transactions | (233 | ) | ||
| Net realized gain on futures contracts | 438 | |||
| Net realized gain on written option contracts | 455 | |||
| Net realized loss on swap contracts | (720 | ) | ||
| Net realized gain on foreign currency contracts | 368 | |||
| Net realized gain on other foreign currency transactions | 13 | |||
| Net Realized Gain on Investments, Other Financial Instruments and Foreign Currency Transactions | 588 | |||
| Net Changes in Unrealized Depreciation of Investments, Other Financial Instruments and Foreign Currency Transactions: | ||||
| Net unrealized depreciation of investments | (3,598 | ) | ||
| Net unrealized depreciation of purchased option contracts | (3 | ) | ||
| Net unrealized depreciation of TBA sale commitments | (9 | ) | ||
| Net unrealized appreciation of futures contracts | 21 | |||
| Net unrealized appreciation of written option contracts | 44 | |||
| Net unrealized depreciation of swap contracts | (157 | ) | ||
| Net unrealized appreciation of foreign currency contracts | 148 | |||
| Net unrealized depreciation of translation of other assets and liabilities in foreign currencies | (13 | ) | ||
| Net Changes in Unrealized Depreciation of Investments, Other Financial Instruments and Foreign Currency Transactions | (3,567 | ) | ||
| Net Loss on Investments, Other Financial Instruments and Foreign Currency Transactions | (2,979 | ) | ||
| Net Decrease in Net Assets Resulting from Operations | $ | (819 | ) |
The accompanying notes are an integral part of these financial statements.
| 27 |
| Hartford Multi-Asset Income Fund |
| Statement of Changes in Net Assets |
| (000’s Omitted) |
| For the Period April 30, 2014* through October 31, 2014 | ||||
| Operations: | ||||
| Net investment income | $ | 2,160 | ||
| Net realized gain on investments, other financial instruments and foreign currency transactions | 588 | |||
| Net unrealized depreciation of investments, other financial instruments and foreign currency transactions | (3,567 | ) | ||
| Net Decrease in Net Assets Resulting from Operations | (819 | ) | ||
| Distributions to Shareholders: | ||||
| From net investment income | ||||
| Class A | (99 | ) | ||
| Class C | (33 | ) | ||
| Class I | (31 | ) | ||
| Class R3 | (23 | ) | ||
| Class R4 | (26 | ) | ||
| Class R5 | (28 | ) | ||
| Class Y | (1,543 | ) | ||
| Total distributions | (1,783 | ) | ||
| Capital Share Transactions: | ||||
| Class A | 10,517 | |||
| Class C | 4,407 | |||
| Class I | 2,252 | |||
| Class R3 | 2,023 | |||
| Class R4 | 2,026 | |||
| Class R5 | 2,028 | |||
| Class Y | 120,933 | |||
| Net increase from capital share transactions | 144,186 | |||
| Net Increase in Net Assets | 141,584 | |||
| Net Assets: | ||||
| Beginning of period | — | |||
| End of period | $ | 141,584 | ||
| Undistributed (distributions in excess of) net investment income | $ | 1,189 | ||
* Commencement of operations.
The accompanying notes are an integral part of these financial statements.
| 28 |
| Hartford Multi-Asset Income Fund |
| Notes to Financial Statements |
| October 31, 2014 |
| (000’s Omitted) |
Organization:
The Hartford Mutual Funds, Inc. (“Company”) is an open-end management investment company comprised of forty-two portfolios. Financial statements for Hartford Multi-Asset Income Fund (the "Fund"), a series of the Company, are included in this report.
The Company is organized under the laws of the State of Maryland and is registered with the Securities and Exchange Commission (“SEC”) under the Investment Company Act of 1940, as amended (“1940 Act”). The Fund is a diversified open-end management investment company. The Fund is an investment company and applies specialized accounting and reporting under Accounting Standards Codification Topic 946, Financial Services - Investment Companies.
Class A shares are sold with a front-end sales charge of up to 4.50%. Class C shares are sold with a contingent deferred sales charge of up to 1.00% on shares redeemed within twelve months of purchase. Class I shares are sold without sales charges to certain eligible investors primarily through advisory fee-based wrap programs. Class R3, R4 and R5 shares, which are offered to employer-sponsored retirement plans, and Class Y shares, which are sold to certain eligible institutional investors, are sold without a sales charge. All classes of shares have identical voting, redemption, dividend, liquidation and other rights and the same terms and conditions, with the exceptions that each class may have different expenses, which may affect performance.
Significant Accounting Policies:
The following is a summary of significant accounting policies of the Fund in the preparation of its financial statements, which are in accordance with United States generally accepted accounting principles (“U.S. GAAP”). The preparation of financial statements in accordance with U.S. GAAP may require management to make estimates and assumptions that affect the reported amounts of assets and liabilities and disclosure of contingent assets and liabilities at the date of the financial statements and the reported amounts of increases and decreases in net assets from operations during the reporting period. Actual results could differ from those estimates.
Determination of Net Asset Value – The per share net asset value ("NAV") of each class of the Fund's shares is determined as of the close of regular trading (normally 4:00 p.m. Eastern Time) (the “NYSE Close”) on each day that the New York Stock Exchange (the “Exchange”) is open (“Valuation Date”). Information that becomes known to the Fund after the NAV has been calculated on a particular day will not generally be used to retroactively adjust the NAV determined earlier that day.
Investment Valuation and Fair Value Measurements – For purposes of calculating the NAV, portfolio investments and other assets held by the Fund's portfolio for which market quotes are readily available are valued at market value. Market value is generally determined on the basis of last reported sales prices or official close price. If no sales are reported, market value is based on quotes obtained from a quotation reporting system, established market makers, or independent pricing services. If market prices are not readily available or are deemed unreliable, the Fund will use the fair value of the investment as determined in good faith under policies and procedures established by and under the supervision of the Company's Board of Directors. Market quotes are considered not readily available where there is an absence of current or reliable market-based data (e.g., trade information or indicative market quotes), including where events occur after the close of the relevant market, but prior to the NYSE Close, that materially affect the values of the Fund's portfolio investments or assets. In addition, market quotes are considered not readily available when, due to extraordinary circumstances, the exchanges or markets on which the investments trade do not open for trading for the entire day and no other market prices are available. In addition, prices of foreign equities that are principally traded on certain foreign markets may be adjusted daily pursuant to a fair value pricing service approved by the Board of Directors in order to reflect an adjustment for the factors occurring after the close of certain foreign markets but before the NYSE Close. Investments that are primarily traded on foreign markets may trade on days that are not business days of the Fund. The value of the foreign investments in which the Fund invests may change on days when a shareholder will not be able to purchase or redeem shares of the Fund. Fair value pricing is subjective in nature and the use of fair value pricing by the Fund may cause the NAV of its shares to differ significantly from the NAV that would have been calculated using market prices at the close of the exchange on which a portfolio investment is primarily traded. There can be no assurance that the Fund could obtain the fair market value assigned to an investment if the Fund were to sell the investment at approximately the time at which the Fund determines its NAV.
Fixed income investments (other than short-term obligations), non-exchange traded derivatives and centrally cleared swaps held by the Fund are normally valued on the basis of quotes obtained from independent pricing services or brokers and dealers in accordance
| 29 |
| Hartford Multi-Asset Income Fund |
| Notes to Financial Statements – (continued) |
| October 31, 2014 |
| (000’s Omitted) |
with procedures established by the Company's Board of Directors. Prices obtained from independent pricing services use information provided by market makers or estimates of market values through accepted market modeling, trading and pricing conventions. Inputs to the models may include, but are not limited to, prepayment speeds, pricing spread, yield, trade information, dealer quotes, market color, cash flow models and the investment’s terms and conditions. Generally, the Fund may use fair valuation in regard to fixed income investments when the Fund holds defaulted or distressed investments or investments in a company in which a reorganization is pending. Senior floating rate interests generally trade in over-the-counter (“OTC”) markets and are priced through an independent pricing service utilizing independent market quotations from loan dealers or financial institutions. A composite bid price is used, which is an average of the dealer marks and dealer runs. Short-term investments maturing in 60 days or less are generally valued at amortized cost, if their original term to maturity was 60 days or less, or by amortizing their value on the 61st day prior to maturity, if the original term to maturity exceeded 60 days, which approximates fair value.
Exchange traded options, futures and options on futures are valued at the settlement price or last trade price determined by the relevant exchange as of the NYSE Close. If the last trade price for exchange traded options does not fall between the bid and ask prices, the value will be the mean of the bid and ask prices as of the NYSE Close. If a last trade price is not available, the value will be the mean of the bid and ask prices as of the NYSE Close. If a mean of the bid and ask prices cannot be calculated for the day, the value will be the bid price as of the NYSE Close. In the case of OTC options and such instruments that do not trade on an exchange, values may be supplied by a pricing service using a formula or other objective method that may take into consideration the style, direction, expiration, strike price, notional value and volatility or other special adjustments.
Investments valued in currencies other than U.S. dollars are converted to U.S. dollars using exchange rates obtained from independent pricing services for calculation of the NAV. As a result, the NAV of the Fund’s shares may be affected by changes in the value of currencies in relation to the U.S. dollar. The value of investments traded in markets outside the United States or denominated in currencies other than the U.S. dollar may be affected significantly on a day that the NYSE is closed and the market value may change on days when an investor is not able to purchase, redeem or exchange shares of the Fund.
Foreign currency contracts represent agreements to exchange currencies on specific future dates at predetermined rates. Foreign currency contracts are valued using foreign currency exchange rates and forward rates as provided by an independent pricing service on the Valuation Date.
Financial instruments for which prices are not available from an independent pricing service may be valued using market quotations obtained from one or more dealers that make markets in the respective financial instrument in accordance with procedures established by the Company's Board of Directors.
U.S. GAAP defines fair value as the price that the Fund would receive to sell an asset or pay to transfer a liability in an orderly transaction between market participants. The U.S. GAAP fair value measurement standards require disclosure of a fair value hierarchy for each major category of assets and liabilities. Various inputs are used in determining the fair value of the Fund’s investments. These inputs are summarized into three broad hierarchy levels. This hierarchy is based on whether the valuation inputs are observable or unobservable. These levels are:
Level 1 – Quoted prices in active markets for identical investments. Level 1 may include exchange traded instruments, such as domestic equities, some foreign equities, options, futures, mutual funds, exchange traded funds, rights and warrants.
Level 2 – Observable inputs other than Level 1 prices, such as quoted prices for similar investments; quoted prices in markets that are not active; or other inputs that are observable or can be corroborated by observable market data. Level 2 may include debt investments that are traded less frequently than exchange traded instruments and which are valued using independent pricing services; foreign equities, which are principally traded on certain foreign markets and are adjusted daily pursuant to a fair value pricing service in order to reflect an adjustment for the factors occurring after the close of certain foreign markets but before the NYSE Close; senior floating rate interests, which are valued using an aggregate of dealer bids; short-term investments, which are valued at amortized cost; and swaps, which are valued based upon the terms of each swap contract.
Level 3 – Significant unobservable inputs that are supported by limited or no market activity. Level 3 may include financial instruments whose values are determined using indicative market quotes or require significant management judgment or
| 30 |
| Hartford Multi-Asset Income Fund |
| Notes to Financial Statements – (continued) |
| October 31, 2014 |
| (000’s Omitted) |
estimation. These unobservable valuation inputs may include estimates for current yields, maturity/duration, prepayment speed, and indicative market quotes for comparable investments along with other assumptions relating to credit quality, collateral value, complexity of the investment structure, general market conditions and liquidity. This category may include investments where trading has been halted or there are certain restrictions on trading. While these investments are priced using unobservable inputs, the valuation of these investments reflects the best available data and management believes the prices are a reasonable representation of exit price. For more information on specific valuation techniques and unobservable inputs, please see the following table titled "Quantitative Information about Level 3 Fair Value Measurements."
The Board of Directors of the Company generally reviews and approves the “Procedures for Valuation of Portfolio Securities” at least once a year. These procedures define how investments are to be valued, including the formation and activities of a Valuation Committee. The Valuation Committee is responsible for determining in good faith the fair value of investments when the value cannot be obtained from primary pricing services or alternative sources or if the valuation of an investment as provided by the primary pricing service or alternative source is believed not to reflect the investment’s fair value as of the Valuation Date. Voting members of the Valuation Committee include the Fund’s Treasurer or designee and a Vice President of the investment manager or designee. An Assistant Vice President of the Fund with legal expertise or designee is also included on the Valuation Committee as a non-voting advisory member. In addition, the Fund’s Chief Compliance Officer shall designate a member of the compliance group to attend Valuation Committee meetings as a non-voting resource, to monitor for and provide guidance with respect to compliance with these procedures. Two members of the Valuation Committee or their designees, representing different departments, shall constitute a quorum for purposes of permitting the Valuation Committee to take action. The Valuation Committee will consider all relevant factors in determining an investment’s fair value, and may seek the advice of the Fund’s sub-adviser, knowledgeable brokers, and legal counsel in making such determination. The Valuation Committee reports to the Audit Committee of the Company’s Board of Directors. The Audit Committee receives quarterly written reports which include details of all fair-valued investments, including the reason for the fair valuation, and an indication, when possible, of the accuracy of the valuation by disclosing the next available reliable public price quotation or the disposition price of such investments (the “look-back” test). The Board of Directors then must consider for ratification all of the fair value determinations made during the previous quarter.
Valuation levels are not necessarily indicative of the risk associated with investing in such investments. Individual investments within any of the above mentioned asset classes may be assigned a different hierarchical level than those presented above, as individual circumstances dictate.
For additional information, refer to the Investment Valuation Hierarchy Level Summary and the Level 3 roll-forward reconciliation, if applicable, which follow the Schedule of Investments.
Quantitative Information about Level 3 Fair Value Measurements:
| Security Type/Valuation Technique | Unobservable Input * | Input Value(s) Range (Weighted Average) ‡ | Fair Value at October 31, 2014 | |||||
| Assets: | ||||||||
| Asset and Commercial Mortgage Backed Securities | ||||||||
| Discounted cash flow | Internal rate of return | 3.45% - 8.83% (4.74%) | $ | 5,134 | ||||
| Life expectancy (in months) | 69 - 309 (140) | |||||||
| Corporate Bonds | ||||||||
| Cost | Recent trade price | $100.00 | 220 | |||||
| Date | 10/30/2014 | |||||||
| Total | $ | 5,354 | ||||||
| Liabilities: | ||||||||
| Swap Contracts: ▲ | ||||||||
| Independent pricing service | Prior day valuation | ($0.31) | 9 | |||||
| Total | $ | 9 | ||||||
| * | Significant changes to any unobservable inputs may result in a significant change to the fair value. |
| ‡ | Unless otherwise noted, inputs were weighted based on the fair value of the investments included in the range. |
| ▲ | Derivative instruments are valued at the unrealized appreciation/depreciation on the investments. |
| 31 |
| Hartford Multi-Asset Income Fund |
| Notes to Financial Statements – (continued) |
| October 31, 2014 |
| (000’s Omitted) |
Investment Transactions and Investment Income – Investment transactions are recorded as of the trade date (the date the order to buy or sell is executed) for financial reporting purposes. Investments purchased or sold on a when-issued or delayed-delivery basis may be settled a month or more after the trade date. Realized gains and losses are determined on the basis of identified cost.
Trade date for senior floating rate interests purchased in the primary loan market is considered the date on which the loan allocations are determined. Trade date for senior floating rate interests purchased in the secondary loan market is the date on which the transaction is entered into.
Dividend income from domestic securities is accrued on the ex-dividend date. In general, dividend income from foreign securities is recorded on the ex-date; however, dividend notifications in certain foreign jurisdictions may not be available in a timely manner and as a result, the Fund will record the dividend as soon as the relevant details (i.e., rate per share, payment date, shareholders of record, etc.) are publicly available. Interest income, including amortization of premium, accretion of discounts and additional principal received in-kind in lieu of cash, is accrued on a daily basis. Paydown gains and losses on mortgage related and other asset backed securities are included in interest income in the Statement of Operations, as applicable.
Taxes – The Fund may be subject to taxes imposed on realized gains on securities of certain foreign countries in which the Fund invests. The amount of foreign tax expense is included on the accompanying Statement of Operations as a reduction to net realized gain on investments in these securities.
Foreign Currency Transactions – Assets and liabilities denominated in currencies other than U.S. dollars are translated into U.S. dollars at the exchange rates in effect on the valuation date. Purchases and sales of investments, income and expenses are translated into U.S. dollars at the exchange rates on the dates of such transactions.
The Fund does not isolate that portion of portfolio investment valuation resulting from fluctuations in the foreign currency exchange rates from the fluctuations arising from changes in the market prices of investments held. Exchange rate fluctuations are included with the net realized and unrealized gain or loss on investments in the accompanying financial statements.
Net realized foreign exchange gains or losses arise from sales of foreign currencies and the difference between asset and liability amounts initially stated in foreign currencies and the U.S. dollar value of the amounts actually received or paid. Net unrealized foreign exchange gains or losses arise from changes in the value of other assets and liabilities at the end of the reporting period, resulting from changes in the exchange rates.
Joint Trading Account – The Fund may invest cash balances into a joint trading account that may be invested in one or more repurchase agreements.
Fund Share Valuation and Dividend Distributions to Shareholders – Orders for the Fund’s shares are executed in accordance with the investment instructions of the shareholders. The NAV of the Fund’s shares is determined as of the close of business on each business day of the Exchange. The NAV is determined separately for each class of shares of the Fund by dividing the Fund’s net assets attributable to that class by the number of shares of the class outstanding. Each class of shares offered by the Fund has equal rights as to assets and voting privileges (except that shareholders of a class have exclusive voting rights regarding any matter relating solely to that class of shares). Income and non-class specific expenses are allocated daily to each class on the basis of the relative net assets of the class. Realized and unrealized gains and losses are allocated daily based on the relative net assets of each class of shares of the Fund.
Orders for the purchase of the Fund’s shares received prior to the close of the Exchange on any day the Exchange is open for business are priced at the NAV determined as of the close of the Exchange. Orders received after the close of the Exchange, or on a day on which the Exchange and/or the Fund is not open for business, are priced at the next determined NAV.
Dividends are declared pursuant to a policy adopted by the Company's Board of Directors based upon the investment performance of the Fund. Normally, dividends from net investment income are declared and paid monthly. Dividends from realized gains, if any, are paid at least once a year.
| 32 |
| Hartford Multi-Asset Income Fund |
| Notes to Financial Statements – (continued) |
| October 31, 2014 |
| (000’s Omitted) |
Net investment income, dividends and distributions from net realized gains and capital are determined in accordance with federal income tax regulations, which may differ from U.S. GAAP with respect to character and timing (see Federal Income Taxes: Distributions and Components of Distributable Earnings and Reclassification of Capital Accounts).
Securities and Other Investments:
Repurchase Agreements – A repurchase agreement is an agreement by which a counterparty agrees to sell an investment and agrees to repurchase the investment sold from the buyer at a mutually agreed upon time and price. During the period of the repurchase agreement, the counterparty will deposit cash and or securities in a third party custodial account to serve as collateral. At the time the Fund enters into a repurchase agreement, the value of the underlying collateral, including accrued interest, will be equal to or exceed the value of the repurchase agreement. Repurchase agreements expose the Fund to counterparty risk - that is, the risk that the counterparty will not fulfill its obligations. To minimize counterparty risk, the investments that serve to collateralize the repurchase agreement are held by the Fund’s custodian in book entry or physical form in the custodial account of the Fund or in a third party custodial account. Repurchase agreements are valued at cost plus accrued interest, which approximates fair value. Repurchase agreements have master netting arrangements which allow the Fund to offset amounts owed to a counterparty with amounts owed by the counterparty, including any collateral. Upon an event of default under a master repurchase agreement, the non-defaulting party may close out all transactions traded under such agreement and net amounts owed under each transaction to one net amount payable by one party to the other. Absent an event of default, the master repurchase agreement does not result in an offset of reported amounts of assets and liabilities in the Statement of Assets and Liabilities across transactions between the Fund and the applicable counterparty. The Fund, as shown on the Schedule of Investments, had outstanding repurchase agreements and related collateral as of October 31, 2014.
Illiquid and Restricted Investments – The Fund is permitted to invest up to 15% of its net assets in illiquid investments. Illiquid investments are those that may not be sold or disposed of in the ordinary course of business within seven days, at approximately the price used to determine the Fund’s NAV. The Fund may not be able to sell illiquid investments when its sub-adviser considers it desirable to do so or may have to sell such investments at a price that is lower than the price that could be obtained if the investments were more liquid. A sale of illiquid investments may require more time and may result in higher dealer discounts and other selling expenses than does the sale of those that are liquid. Illiquid investments also may be more difficult to value due to the unavailability of reliable market quotations for such investments, and an investment in them may have an adverse impact on the Fund’s NAV. The Fund may also purchase certain restricted investments that can only be resold to certain qualified investors and may be determined to be liquid pursuant to policies and guidelines established by the Company's Board of Directors. The Fund, as shown on the Schedule of Investments, had illiquid or restricted investments as of October 31, 2014.
Investments Purchased on a When-Issued or Delayed-Delivery Basis – Delivery and payment for investments that have been purchased by the Fund on a forward commitment, or when-issued or delayed-delivery basis, take place beyond the customary settlement period. The Fund may dispose of or renegotiate a delayed-delivery transaction after it is entered into, and may sell delayed-delivery investments before they are delivered, which may result in a realized gain or loss. During this period, such investments are subject to market fluctuations, and the Fund identifies investments segregated in its records with a value at least equal to the amount of the commitment. The Fund, as shown on the Schedule of Investments, had when-issued or delayed-delivery investments as of October 31, 2014.
In connection with the Fund’s ability to purchase investments on a when-issued or forward commitment basis, the Fund may enter into to-be announced (“TBA”) commitments. TBA commitments are forward agreements for the purchase or sale of mortgage backed securities for a fixed price, with payment and delivery on an agreed-upon future settlement date. The specific securities to be delivered are not identified at the trade date; however, delivered securities must meet specified terms, including issuer, rate and mortgage terms. Although the Fund may enter into TBA commitments with the intention of acquiring or delivering securities for its portfolio, the Fund can extend the settlement date, roll the transaction, or dispose of a commitment prior to settlement if deemed appropriate to do so. If the TBA commitment is closed through the acquisition of an offsetting TBA commitment, the Fund realizes a gain or loss. In a TBA roll transaction, the Fund generally purchases or sells the initial TBA commitment prior to the agreed upon settlement date and enters into a new TBA commitment for future delivery or receipt of the mortgage backed securities. TBA commitments involve a risk of loss if the value of the security to be purchased or sold declines or increases, respectively, prior to settlement date.
| 33 |
| Hartford Multi-Asset Income Fund |
| Notes to Financial Statements – (continued) |
| October 31, 2014 |
| (000’s Omitted) |
The Fund may enter into “dollar rolls” in which the Fund sells securities and contracts with the same counterparty to repurchase substantially similar securities (for example, same issuer, coupon and maturity) on a specified future date at an agreed upon price. The Fund gives up the right to receive interest paid on the investments sold. The Fund would benefit to the extent of any differences between the price received for the security and the lower forward price for the future purchase. Dollar rolls involve the risk that the market value of the securities that the Fund is required to purchase may decline below the agreed upon repurchase price of those securities. The Fund records dollar roll transactions as purchases and sales and realizes gains and losses on these transactions. These transactions are excluded from the Fund’s portfolio turnover rate. The Fund, as shown on the Schedule of Investments, had open TBA commitments as of October 31, 2014, which may be a part of dollar roll transactions.
Senior Floating Rate Interests – The Fund may invest in senior floating rate interests. Senior floating rate interests hold the most senior position in the capital structure of a business entity (the “Borrower”), are typically secured by specific collateral and have a claim on the assets and/or stock of the Borrower that is senior to the assets held by subordinated debtholders and stockholders of the Borrower. Senior floating rate interests are typically structured and administered by a financial institution that acts as the agent of the lenders participating in the senior floating rate interest. The Fund may invest in multiple series or tranches of a senior floating rate interest, which may have varying terms and carry different associated risks. The Fund may also enter into unfunded loan commitments, which are contractual obligations for future funding. Unfunded loan commitments may include revolving credit facilities, which may obligate the Fund to supply additional cash to the borrower on demand, representing a potential financial obligation by the Fund in the future. The Fund may receive a commitment fee based on the undrawn portion of the underlying line of credit portion of a senior floating rate interest. In certain circumstances, the Fund may receive various fees upon the restructure of a senior floating rate interest by a borrower. Fees earned/paid are recorded as a component of income or realized gain/loss in the Statement of Operations.
Senior floating rate interests are typically rated below-investment-grade, which suggests the risk of default is higher, and generally pay higher interest rates than investment-grade debt securities. A default could lead to non-payment of income or principal, which would result in a reduction of investment income to the Fund, and there can be no assurance that the liquidation of any collateral would satisfy the Borrower’s obligation in the event of non-payment of scheduled interest or principal payments, or that such collateral could be readily liquidated. The Fund, as shown on the Schedule of Investments, had senior floating rate interests as of October 31, 2014.
Mortgage Related and Other Asset Backed Securities – The Fund may invest in mortgage related and other asset backed securities. These securities include mortgage pass-through securities, collateralized mortgage obligations, commercial mortgage backed securities, stripped mortgage backed securities, asset backed securities, collateralized debt obligations and other securities that directly or indirectly represent a participation in, or are secured by and payable from, mortgage loans on real property. Mortgage related securities are created from pools of residential or commercial mortgage loans, including mortgage loans made by savings and loan institutions, mortgage bankers, commercial banks and other similar financial institutions. Asset backed securities are created from many types of assets, including auto loans, credit card receivables, home equity loans, and student loans. These securities provide a monthly payment that consists of both interest and principal payments. Interest payments may be determined by fixed or adjustable rates. The rate of pre-payments on underlying mortgages will affect the price and volatility of a mortgage related security, and may have the effect of shortening or extending the effective duration of the security relative to what was anticipated at the time of purchase. The timely payment of principal and interest of certain mortgage related securities is guaranteed by the full faith and credit of the United States Government. Mortgage related and other asset backed securities created and guaranteed by non-governmental issuers, including government-sponsored corporations, may be supported by various forms of insurance or guarantees, but there can be no assurance that the private insurers or guarantors can meet their obligations under the insurance policies or guarantee arrangements. The Fund, as shown on the Schedule of Investments, had outstanding mortgage related and other asset backed securities as of October 31, 2014.
Inflation Indexed Bonds – The Fund may invest in inflation indexed bonds. Inflation indexed bonds are fixed income investments whose principal value is periodically adjusted to the rate of inflation. The interest rate on these bonds is generally fixed at issuance at a rate lower than typical bonds. Over the life of an inflation indexed bond, however, interest will be paid based on a principal value, which is adjusted for inflation. Any increase or decrease in the principal amount of an inflation indexed bond will be included as interest income on the Statement of Operations, even though investors do not receive the principal amount until maturity. The Fund, as shown on the Schedule of Investments, had inflation indexed bonds as of October 31, 2014.
| 34 |
| Hartford Multi-Asset Income Fund |
| Notes to Financial Statements – (continued) |
| October 31, 2014 |
| (000’s Omitted) |
Financial Derivative Instruments:
The following disclosures contain information on how and why the Fund uses derivative instruments, the credit-risk-related contingent features in certain derivative instruments and how derivative instruments affect the Fund’s financial position and results of operations. The location and fair value amounts of these instruments on the Statement of Assets and Liabilities and the realized gains and losses and changes in unrealized gains and losses on the Statement of Operations, each categorized by type of derivative contract, are included in the following Additional Derivative Instrument Information footnote. The derivative instruments outstanding as of period-end are disclosed in the notes to the Schedule of Investments, if applicable. The amounts of realized gains and losses and changes in unrealized gains and losses on derivative instruments during the period are disclosed in the Statement of Operations.
Foreign Currency Contracts – The Fund may enter into foreign currency contracts that obligate the Fund to purchase or sell currencies at specified future dates. Foreign currency contracts are used to hedge the currency exposure associated with some or all of the Fund’s investments and/or as part of an investment strategy. Foreign currency contracts are marked to market daily and the change in value is recorded by the Fund as an unrealized gain or loss. The Fund will record a realized gain or loss when the foreign currency contract is settled.
Foreign currency contracts involve elements of market risk in excess of the amounts reflected in the Statement of Assets and Liabilities. In addition, risks may arise upon entering into these contracts from the potential inability of the counterparties to meet the terms of the contracts and from unanticipated movements in the value of the foreign currencies relative to the U.S. dollar. The Fund, as shown on the Schedule of Investments, had outstanding foreign currency contracts as of October 31, 2014.
Futures Contracts – The Fund may enter into futures contracts. A futures contract is an agreement between two parties to buy or sell an asset at a set price on a future date. The Fund uses futures contracts to manage or obtain exposure to the investment markets, commodities, or movements in interest rates and currency values. The primary risks associated with the use of futures contracts are the imperfect correlation between the change in market value of the investments held by the Fund and the prices of futures contracts and the possibility of an illiquid market. Upon entering into a futures contract, the Fund is required to deposit with a futures commission merchant (“FCM”) an amount of cash or U.S. Government or Agency Obligations in accordance with the initial margin requirements of the broker or exchange. Futures contracts are marked to market daily at the most recent settlement price reported by an exchange on which, over time, they are traded most extensively, and an appropriate payable or receivable for the change in value (“variation margin”) is recorded by the Fund. Gains or losses are recognized but not considered realized until the contracts expire or are closed. Futures contracts involve, to varying degrees, risk of loss in excess of the variation margin disclosed on the Statement of Assets and Liabilities; however, the Fund seeks to reduce this risk through the use of an FCM. The Fund, as shown on the Schedule of Investments, had outstanding futures contracts as of October 31, 2014.
Options Contracts – An option contract is a contract sold by one party to another party that offers the buyer the right, but not the obligation, to buy (call) or sell (put) an investment or other financial asset at an agreed-upon price during a specific period of time or on a specific date. Options contracts are either privately negotiated in the over-the-counter market ("OTC options") or executed in a registered exchange ("exchange traded options"). The Fund may write (sell) covered call and put options on futures, swaps (“swaptions”), securities, commodities or currencies. “Covered” means that so long as the Fund is obligated as the writer of an option, it will own either the underlying investments or currency or an option to purchase the same underlying investments or currency having an expiration date of the covered option and an exercise price equal to or less than the exercise price of the covered option, or will pledge cash or other liquid investments having a value equal to or greater than the fluctuating market value of the option investment or currency. Writing put options increases the Fund’s exposure to the underlying instrument. Writing call options decreases the Fund’s exposure to the underlying instrument. Premiums received from writing options that expire are treated as realized gains. Premiums received from writing options that are exercised or closed are added to the proceeds or offset amounts paid on the underlying futures, swap, investment or currency transaction to determine the realized gain or loss. The Fund as a writer of an option has no control over whether the underlying instrument may be sold (call) or purchased (put) and as a result bears the market risk of an unfavorable change in the price of the instrument underlying the written option. There is the risk the Fund may not be able to enter into a closing transaction because of an illiquid market. The Fund may also purchase put and call options. Purchasing call options increases the Fund’s exposure to the underlying instrument. Purchasing put options decreases the Fund’s exposure to the underlying instrument. The Fund pays a premium, which is included on the Fund’s Statement of Assets and Liabilities as an investment and is subsequently marked to market to reflect the current value of the option. Premiums paid for purchasing options that expire are treated as realized
| 35 |
| Hartford Multi-Asset Income Fund |
| Notes to Financial Statements – (continued) |
| October 31, 2014 |
| (000’s Omitted) |
losses. Certain options may be purchased with premiums to be determined on a future date. The premiums for these options are based upon implied volatility parameters at specified terms. The risk associated with purchasing put and call options is generally limited to the premium paid. Premiums paid for purchasing options that are exercised or closed are added to the amounts paid or offset against the proceeds on the underlying investment transaction to determine the realized gain or loss. Entering into over-the-counter options also exposes the Fund to counterparty risk. Counterparty risk is the possibility that the counterparty to the agreements may default on its obligation to perform or disagree as to the meaning of the contractual terms in the agreements.
The Fund, as shown on the Schedule of Investments, had outstanding purchased and written option contracts as of October 31, 2014. Transactions involving written option contracts during the period ended October 31, 2014, are summarized below:
Options Contract Activity During the Period April 30, 2014, (commencement of operations), through October 31, 2014:
| Call Options Written During the Period | Number of Contracts* | Premium Amounts | ||||||
| Beginning of the period | — | $ | — | |||||
| Written | 58,906,151 | 405 | ||||||
| Expired | (20,920,000 | ) | (214 | ) | ||||
| Closed | (1,151 | ) | (59 | ) | ||||
| Exercised | — | — | ||||||
| End of period | 37,985,000 | $ | 132 | |||||
| Put Options Written During the Period | Number of Contracts* | Premium Amounts | ||||||
| Beginning of the period | — | $ | — | |||||
| Written | 58,905,576 | 340 | ||||||
| Expired | (20,920,000 | ) | (181 | ) | ||||
| Closed | (576 | ) | (45 | ) | ||||
| Exercised | — | — | ||||||
| End of period | 37,985,000 | $ | 114 | |||||
* The number of contracts does not omit 000's.
Swap Contracts – The Fund may invest in swap contracts. Swap contracts are agreements to exchange or swap investment cash flows, assets, foreign currencies or market-linked returns at specified, future intervals. Swap contracts are either privately negotiated in the over-the-counter market (“OTC swaps”) or cleared in a central clearing house (“centrally cleared swaps”). The Fund may enter into credit default, total return, cross-currency, interest rate, inflation and other forms of swap contracts to manage its exposure to credit, currency, interest rate, commodity and inflation risk. Swap contracts are also used to gain exposure to certain markets. In connection with these contracts, investments or cash may be identified as collateral or margin in accordance with the terms of the respective swap contracts and/or master netting arrangement to provide assets of value and recourse in the event of default or bankruptcy/insolvency.
Swaps are valued based on custom valuations furnished by an independent pricing service. Swaps for which prices are not available from an independent pricing service are valued in accordance with procedures established by the Company's Board of Directors. Changes in market value, if any, are reflected as a component of net changes in unrealized appreciation or depreciation on the Statement of Operations. Daily changes in valuation of centrally cleared swaps, if any, are recorded as a receivable or payable for the change in value (“variation margin”) on the Statement of Assets and Liabilities. Realized gains or losses on centrally cleared swaps are recorded upon the termination of the swap. OTC swap payments received or paid at the beginning of the measurement period are reflected as such on the Statement of Assets and Liabilities and represent premiums paid or received upon entering into the swap contract to compensate for differences between the stated terms of the swap contract and prevailing market conditions (credit spreads, currency exchange rates, interest rates and other relevant factors). These upfront premiums are recorded as realized gains or losses on the Statement of Operations upon termination or maturity of the swap. A liquidation payment received or made at the termination or maturity of the swap is recorded as a realized gain or loss on the Statement of Operations. Net periodic payments received or paid by the Fund are included as part of realized gains or losses on the Statement of Operations.
Entering into these contracts involves, to varying degrees, elements of liquidation, counterparty, credit and market risk in excess of the amounts recognized on the Statement of Assets and Liabilities. Such risks involve the possibility that there will be no liquid market for these contracts, that the counterparty to the contracts may default on its obligation to perform or disagree as to the meaning of
| 36 |
| Hartford Multi-Asset Income Fund |
| Notes to Financial Statements – (continued) |
| October 31, 2014 |
| (000’s Omitted) |
contractual terms in the contracts, and that there may be unfavorable changes in market conditions (credit spreads, currency exchange rates, interest rates and other relevant factors).
The Fund’s maximum risk of loss from counterparty risk for OTC swaps is the net value of the discounted cash flows to be received from the counterparty over the contract’s remaining life, and current market value, to the extent that amount is positive. The risk is mitigated by having a master netting arrangement between the Fund and the counterparty, which allows for the netting of payments made or received (although such amounts are presented on a gross basis within the Statement of Assets and Liabilities, as applicable) as well as the posting of collateral to the Fund to cover the Fund’s exposure to the counterparty. In a centrally cleared swap, while the Fund enters into an agreement with a clearing broker to execute contracts with a counterparty, the performance of the swap is guaranteed by the central clearinghouse, which reduces the Fund’s exposure to counterparty risk. The Fund is still exposed to the counterparty risk through the clearing broker and clearinghouse. The clearinghouse attempts to minimize this risk to its participants through the use of mandatory margin requirements, daily cash settlements and other procedures. Likewise, the clearing broker reduces its risk through margin requirements and required segregation of customer balances.
Credit Default Swap Contracts – The credit default swap market allows the Fund to manage its exposure to the market or certain sectors of the market, to reduce its risk exposure to defaults of corporate and sovereign issuers, or to create exposure to corporate or sovereign issuers to which it is not otherwise exposed. Certain credit default swaps involve the exchange of a fixed rate premium for protection against the loss in value of an underlying investment or index in the event of a credit event, such as payment default or bankruptcy.
Under a credit default swap contract, one party acts as guarantor by receiving the fixed periodic payment in exchange for the commitment to purchase the underlying investment at par if the defined credit event occurs. Upon the occurrence of a defined credit event, the difference between the value of the reference obligation and the swap’s notional amount is recorded as realized gain or loss on swap transactions in the Statement of Operations. A “buyer” of credit protection agrees to pay a counterparty to assume the credit risk of an issuer upon the occurrence of certain events. The “seller” of the protection receives periodic payments and agrees to assume the credit risk of an issuer upon the occurrence of certain events. Although specified events are contract specific, credit events are generally defined as bankruptcy, failure to pay, restructuring, obligation acceleration, obligation default or repudiation/moratorium. A “seller’s” exposure is limited to the total notional amount of the credit default swap contract. These potential amounts would be partially offset by any recovery values of the respective referenced obligations or upfront payments received upon entering into the contract.
Implied credit spreads, represented in absolute terms, utilized in determining the market value of credit default swap contracts on corporate issues, sovereign government issues or U.S. municipal issues as of period-end are disclosed in the notes to the Schedule of Investments, as applicable, and serve as an indicator of the current status of the payment/performance risk and represent the likelihood or risk of default for the credit derivative. The implied credit spread of a particular referenced entity reflects the cost of buying/selling protection and there may also be upfront payments required to be made to enter into the contract. Wider credit spreads represent a deterioration of the referenced entity’s credit soundness and a greater likelihood or risk of default or other credit event occurring as defined under the terms of the contract. For credit default swap contracts on credit indices, the quoted market prices and resulting values serve as the indicator of the current status of the payment/performance risk. Increasing market values, in absolute terms when compared to the notional amount of the swap, represent a deterioration of the referenced equity’s credit soundness and a greater likelihood or risk of default or other credit event occurring as defined under the terms of the contract. The Fund, as shown on the Schedule of Investments, had outstanding credit default swap contracts as of October 31, 2014.
Total Return Swap Contracts – The Fund may invest in total return swap contracts. An investment in a total return swap allows the Fund to gain or mitigate exposure to underlying referenced securities, indices or commodities. Total return swap contracts involve commitments where cash flows are exchanged based on the price of underlying securities, indices or commodities and based on a fixed or variable rate. One party would receive payments based on the price appreciation or depreciation of a commodity index, a portion of the index, or a single commodity in exchange for paying to or receiving from the counterparty seller an agreed-upon rate, which can be fixed or variable. A variable rate may be correlated to a base rate, such as the LIBOR, and is adjusted each reset period, which are defined at the beginning of the contract. Therefore, if interest rates increase over the term of the swap contract, the party paying the rate may be required to pay a higher rate at each swap reset date.
| 37 |
| Hartford Multi-Asset Income Fund |
| Notes to Financial Statements – (continued) |
| October 31, 2014 |
| (000’s Omitted) |
Total return swap contracts on indices involve commitments to pay interest in exchange for a market-linked return. One party pays out the total return of a specific reference asset, which may be an equity, index, or bond, and in return receives a regular stream of payments. To the extent the total return of the security or index underlying the transaction exceeds or falls short of the offsetting interest rate obligation, the Fund will receive a payment from or make a payment to the counterparty. The Fund, as shown on the Schedule of Investments, had outstanding total return swap contracts as of October 31, 2014.
Additional Derivative Instrument Information:
Fair Value of Derivative Instruments on the Statement of Assets and Liabilities as of October 31, 2014:
| Risk Exposure Category | ||||||||||||||||||||||||||||
| Interest Rate Contracts | Foreign Exchange Contracts | Credit Contracts | Equity Contracts | Commodity Contracts | Other Contracts | Total | ||||||||||||||||||||||
| Assets: | ||||||||||||||||||||||||||||
| Investments in securities, at value (purchased option contracts), market value | $ | — | $ | 44 | $ | — | $ | 21 | $ | — | $ | — | $ | 65 | ||||||||||||||
| Unrealized appreciation on foreign currency contracts | — | 162 | — | — | — | — | 162 | |||||||||||||||||||||
| Unrealized appreciation on OTC swap contracts | — | — | 96 | — | — | — | 96 | |||||||||||||||||||||
| Variation margin receivable * | 12 | — | 40 | — | — | — | 52 | |||||||||||||||||||||
| Total | $ | 12 | $ | 206 | $ | 136 | $ | 21 | $ | — | $ | — | $ | 375 | ||||||||||||||
| Liabilities: | ||||||||||||||||||||||||||||
| Unrealized depreciation on foreign currency contracts | $ | — | $ | 14 | $ | — | $ | — | $ | — | $ | — | $ | 14 | ||||||||||||||
| Unrealized depreciation on OTC swap contracts | — | — | 123 | 158 | — | — | 281 | |||||||||||||||||||||
| Variation margin payable * | 17 | — | 25 | — | — | — | 42 | |||||||||||||||||||||
| Written option contracts, market value | — | — | 202 | — | — | — | 202 | |||||||||||||||||||||
| Total | $ | 17 | $ | 14 | $ | 350 | $ | 158 | $ | — | $ | — | $ | 539 | ||||||||||||||
* Only current day's variation margin is reported within the Statement of Assets and Liabilities. The variation margin is included in the open futures net cumulative appreciation of $21 and open centrally cleared swaps net cumulative appreciation of $28 as reported in the Schedule of Investments.
The ratio of futures market value to net assets at October 31, 2014 was 18.59%, compared to the average ratio of 7.15% during the period April 30, 2014 (commencement of operations) through October 31, 2014. The ratio of foreign currency contracts market value to net assets at October 31, 2014 was 8.64%, compared to the average ratio of 3.09% during the period April 30, 2014 (commencement of operations) through October 31, 2014. The volume of other derivatives that are presented in the Schedule of Investments is consistent with the derivative activity during the period ended October 31, 2014.
| 38 |
| Hartford Multi-Asset Income Fund |
| Notes to Financial Statements – (continued) |
| October 31, 2014 |
| (000’s Omitted) |
The Effect of Derivative Instruments on the Statement of Operations for the period April 30, 2014 (commencement of operations) through October 31, 2014:
| Risk Exposure Category | ||||||||||||||||||||||||||||
| Interest Rate Contracts | Foreign Exchange Contracts | Credit Contracts | Equity Contracts | Commodity Contracts | Other Contracts | Total | ||||||||||||||||||||||
| Realized Gain (Loss) on Derivatives Recognized as a Result of Operations: | ||||||||||||||||||||||||||||
| Net realized loss on purchased option contracts | $ | (41 | ) | $ | — | $ | — | $ | (84 | ) | $ | — | $ | — | $ | (125 | ) | |||||||||||
| Net realized gain on futures contracts | 438 | — | — | — | — | — | 438 | |||||||||||||||||||||
| Net realized gain on written option contracts | — | — | 394 | 61 | — | — | 455 | |||||||||||||||||||||
| Net realized loss on swap contracts | (289 | ) | — | (398 | ) | (33 | ) | — | — | (720 | ) | |||||||||||||||||
| Net realized gain on foreign currency contracts | — | 368 | — | — | — | — | 368 | |||||||||||||||||||||
| Total | $ | 108 | $ | 368 | $ | (4 | ) | $ | (56 | ) | $ | — | $ | — | $ | 416 | ||||||||||||
| Net Change in Unrealized Appreciation (Depreciation) on Derivatives Recognized as a Result of Operations: | ||||||||||||||||||||||||||||
| Net change in unrealized depreciation of purchased option contracts | $ | — | $ | — | $ | — | $ | (3 | ) | $ | — | $ | — | $ | (3 | ) | ||||||||||||
| Net change in unrealized appreciation of futures contracts | 21 | — | — | — | — | — | 21 | |||||||||||||||||||||
| Net change in unrealized appreciation of written option contracts | — | — | 44 | — | — | — | 44 | |||||||||||||||||||||
| Net change in unrealized appreciation (depreciation) of swap contracts | — | — | 1 | (158 | ) | — | — | (157 | ) | |||||||||||||||||||
| Net change in unrealized appreciation of foreign currency contracts | — | 148 | — | — | — | — | 148 | |||||||||||||||||||||
| Total | $ | 21 | $ | 148 | $ | 45 | $ | (161 | ) | $ | — | $ | — | $ | 53 | |||||||||||||
Balance Sheet Offsetting Information - The following discloses both gross information and net information about instruments and transactions eligible for offset in the financial statements, and instruments and transactions that are subject to a master netting arrangement, as well as amounts related to margin, reflected as financial collateral (including cash collateral), held at clearing brokers, counterparties and the Fund’s custodian. The master netting arrangements allow the clearing brokers to net any collateral held in or on behalf of the Fund, or liabilities or payment obligations of the clearing brokers to the Fund, against any liabilities or payment obligations of the Fund to the clearing brokers. The Fund is required to deposit financial collateral (including cash collateral) at the FCM's custodian on behalf of clearing brokers and counterparties to continually meet the original and maintenance requirements established by the clearing brokers and counterparties. Such requirements are specific to the respective clearing broker or counterparty. Certain master netting arrangements may not be enforceable in the bankruptcy proceedings of a counterparty.
Offsetting of Financial Assets and Derivative Assets as of October 31, 2014:
| Gross Amounts* of Assets Presented in Statement of Assets and Liabilities | Financial Instruments with Allowable Netting | Non-cash Collateral Received | Cash Collateral Received | Net Amount (not less than $0) | ||||||||||||||||
| Description | ||||||||||||||||||||
| OTC purchased option and OTC swap contracts at market value | $ | 1,058 | $ | (372 | ) | $ | (176 | ) | $ | (270 | )† | $ | 240 | |||||||
| Futures contracts - variation margin receivable | 12 | (12 | ) | — | — | — | ||||||||||||||
| Swap contracts - variation margin receivable | 40 | (25 | ) | — | — | 15 | ||||||||||||||
| Unrealized appreciation on foreign currency contracts | 157 | (7 | ) | — | — | 150 | ||||||||||||||
| Total subject to a master netting or similar arrangement | $ | 1,267 | $ | (416 | ) | $ | (176 | ) | $ | (270 | ) | $ | 405 | |||||||
| * | Gross amounts are presented here as there are no amounts that are netted within the Statement of Assets and Liabilities. |
| † | An additional $45 of cash collateral was received by the Fund related to derivative assets. |
| 39 |
| Hartford Multi-Asset Income Fund |
| Notes to Financial Statements – (continued) |
| October 31, 2014 |
| (000’s Omitted) |
Offsetting of Financial Liabilities and Derivative Liabilities as of October 31, 2014:
| Gross Amounts* of Liabilities Presented in Statement of Assets and Liabilities | Financial Instruments with Allowable Netting | Non-cash Collateral Pledged | Cash
Collateral Pledged | Net Amount (not less than $0) | ||||||||||||||||
| Description | ||||||||||||||||||||
| OTC written option and OTC swap contracts at market value | $ | 882 | $ | (372 | ) | $ | — | $ | (276 | )† | $ | 234 | ||||||||
| Futures contracts - variation margin payable | 17 | (12 | ) | — | (127 | ) | — | |||||||||||||
| Swaps contracts - variation margin payable | 25 | (25 | ) | — | (674 | ) | — | |||||||||||||
| Unrealized depreciation on foreign currency contracts | 12 | (7 | ) | — | — | 5 | ||||||||||||||
| Total subject to a master netting or similar arrangement | $ | 936 | $ | (416 | ) | $ | — | $ | (1,077 | ) | $ | 239 | ||||||||
| * | Gross amounts are presented here as there are no amounts that are netted within the Statement of Assets and Liabilities. |
| † | An additional $264 of cash collateral was pledged to counterparties related to derivative liabilities. |
Certain derivatives held by the Fund, as of October 31, 2014, are not subject to a master netting arrangement and are excluded from the table above.
Principal Risks:
Credit risk depends largely on the perceived financial health of bond issuers. In general, the credit rating is inversely related to the credit risk of the issuer. Higher rated bonds generally are deemed to have less credit risk, while lower or unrated bonds are deemed to have higher risk of default. The share price, yield and total return of a fund that holds securities with higher credit risk may be more volatile than those of a fund that holds bonds with lower credit risk. Similar to credit risk, the Fund may be exposed to counterparty risk, or the risk that an institution or other entity with which the Fund has unsettled or open transactions will default.
The Fund’s investments expose the Fund to various risks including, but not limited to, interest rate, prepayment, extension, foreign currency and equity risks. Interest rate risk is the risk that fixed income securities will decline in value because of changes in interest rates. As nominal interest rates rise, the values of certain fixed income securities held by the Fund are likely to decrease. A nominal interest rate can be described as the sum of a real interest rate and an expected inflation rate. Fixed income securities with longer durations tend to be more sensitive to changes in interest rates, usually making them more volatile than securities with shorter durations. Duration is useful primarily as a measure of the sensitivity of a fixed income security’s market price to interest rate (i.e., yield) movements. Senior floating rate interests and securities subject to prepayment and extension risk generally offer less potential for gains when interest rates decline. Rising interest rates may cause prepayments to occur at a slower than expected rate, thereby effectively lengthening the maturity of the security and making the security more sensitive to interest rate changes. Prepayment and extension risk are major risks of mortgage backed securities, senior floating rate interests and certain asset backed securities. For certain asset backed securities, the actual maturity may be less than the stated maturity shown in the Schedule of Investments, if applicable. As a result, the timing of income recognition relating to these securities may vary based upon the actual maturity.
If the Fund invests directly in foreign currencies or in securities that trade in, and receive revenues in, foreign currencies, or in derivatives that provide exposure to foreign currencies, it will be subject to the risk that those currencies will decline in value relative to the base currency (U.S. dollars) of the Fund, or, in the case of hedging positions, that the Fund’s base currency will decline in value relative to the currency being hedged. Currency rates in foreign countries may fluctuate significantly over short periods of time for a number of reasons, including changes in interest rates, intervention (or the failure to intervene) by U.S. or foreign governments, central banks or supranational entities, such as the International Monetary Fund, or by the imposition of currency controls or other political developments in the United States or abroad. As a result, the Fund’s investments in foreign currency denominated securities may reduce the returns of the Fund. The market values of equity securities, such as common stocks and preferred stocks, or equity related investments, such as futures and options, may decline due to general market conditions which are not specifically related to a particular company, such as real or perceived adverse economic conditions, changes in the general outlook for corporate earnings, changes in interest or currency rates or adverse investor sentiment generally. The market value of equity securities may also decline due to factors which affect a particular industry or industries, such as labor shortages or increased production costs and competitive
| 40 |
| Hartford Multi-Asset Income Fund |
| Notes to Financial Statements – (continued) |
| October 31, 2014 |
| (000’s Omitted) |
conditions within an industry. Equity securities and equity related investments generally have greater market price volatility than fixed income securities.
Federal Income Taxes:
Federal Income Taxes – For federal income tax purposes, the Fund intends to continue to qualify as a Regulated Investment Company ("RIC") under Subchapter M of the Internal Revenue Code (“IRC”) by distributing substantially all of its taxable net investment income and net realized capital gains to its shareholders and otherwise complying with the requirements of the IRC. The Fund has distributed substantially all of its income and capital gains in prior years, if applicable, and intends to distribute substantially all of its income and capital gains during the calendar year ending December 31, 2014. Accordingly, no provision for federal income or excise taxes has been made in the accompanying financial statements. Distributions from short-term capital gains are treated as ordinary income distributions for federal income tax purposes.
Net Investment Income (Loss), Net Realized Gains (Losses) and Distributions – Net investment income (loss) and net realized gains (losses) may differ for financial statement and tax purposes primarily because of losses deferred due to wash sale adjustments, foreign currency gains and losses, adjustments related to Passive Foreign Investment Companies ("PFICs"), Real Estate Investment Trusts ("REITs"), RICs, certain derivatives and partnerships. The character of distributions made during the year from net investment income or net realized gains may differ from their ultimate characterization for federal income tax purposes. Also, due to the timing of dividend distributions, the fiscal year in which amounts are distributed may differ from the year that the income or realized gains (losses) were recorded by the Fund.
Distributions and Components of Distributable Earnings – The tax character of distributions paid by the Fund for the periods indicated is as follows (as adjusted for dividends payable, if applicable):
| For the Year Ended October 31, 2014 * | ||||
| Ordinary Income | $ | 1,783 | ||
* Commenced operations on April 30, 2014.
As of October 31, 2014, the Fund’s components of distributable earnings (deficit) on a tax basis are as follows:
| Amount | ||||
| Undistributed Ordinary Income | $ | 1,359 | ||
| Accumulated Capital and Other Losses* | (200 | ) | ||
| Unrealized Depreciation† | (3,719 | ) | ||
| Total Accumulated Deficit | $ | (2,560 | ) | |
| * | The Fund has capital loss carryforwards that are identified in the Capital Loss Carryforward note that follows. |
| † | Differences between book-basis and tax-basis unrealized appreciation (depreciation) may be attributable to the losses deferred due to wash sale adjustments, foreign currency gains and losses, adjustments related to PFICs, REITs, RICs, certain derivatives and partnerships. |
| 41 |
| Hartford Multi-Asset Income Fund |
| Notes to Financial Statements – (continued) |
| October 31, 2014 |
| (000’s Omitted) |
Reclassification of Capital Accounts – The Fund may record reclassifications in its capital accounts. These reclassifications have no impact on the total net assets of the Fund. The reclassifications are a result of permanent differences between U.S. GAAP and tax accounting for such items as foreign currency, PFICs, expiration or utilization of capital loss carryforwards or net operating losses. Adjustments are made to reflect the impact these items have on current and future distributions to shareholders. Therefore, the source of the Fund’s distributions may be shown in the accompanying Statement of Changes in Net Assets as from undistributed net investment income, from accumulated net realized gains on investments or from capital depending on the type of book and tax differences that exist. For the period ended October 31, 2014, the Fund recorded reclassifications to increase (decrease) the accounts listed below:
| Amount | ||||
| Undistributed Net Investment Income (Loss) | $ | 812 | ||
| Accumulated Net Realized Gain (Loss) | (797 | ) | ||
| Capital Stock and Paid-in-Capital | (15 | ) | ||
Capital Loss Carryforward – Under the Regulated Investment Company Modernization Act of 2010 funds are permitted to carry forward capital losses for an unlimited period. Additionally, capital loss carryforwards retain their character as either short-term or long-term capital losses rather than being considered all short-term as permitted under prior regulation.
At October 31, 2014 (tax year end), the Fund had capital loss carryforwards for U.S. federal income tax purposes as follows:
| Amount | ||||
| Short-Term Capital Loss Carryforward | $ | 200 | ||
| Total | $ | 200 | ||
Accounting for Uncertainty in Income Taxes – The Fund has adopted financial reporting rules that require the Fund to analyze all open tax years, as defined by the statute of limitations, for all major jurisdictions. Generally, tax authorities can examine all tax returns filed for the last three years. The Fund does not have an examination in progress.
The Fund is also not aware of any tax positions for which it is reasonably possible that the total amounts of unrecognized tax benefits will significantly change in the next twelve months.
Expenses:
Investment Management Agreement – Hartford Funds Management Company, LLC ("HFMC") serves as the Fund’s investment manager pursuant to an Investment Management Agreement with the Company. HFMC is an indirect wholly owned subsidiary of The Hartford Financial Services Group, Inc. ("The Hartford"). The investment manager has overall investment supervisory responsibility for the Fund. In addition, the investment manager provides administrative personnel, services, equipment, facilities and office space for proper operation of the Fund. HFMC has contracted with Wellington Management Company, LLP ("Wellington Management") under a sub-advisory agreement for the provision of day-to-day investment management services to the Fund in accordance with the Fund’s investment objective and policies. The Fund pays a fee to the investment manager, a portion of which may be used to compensate Wellington Management.
| 42 |
| Hartford Multi-Asset Income Fund |
| Notes to Financial Statements – (continued) |
| October 31, 2014 |
| (000’s Omitted) |
The schedule below reflects the rates of compensation paid to the investment manager for investment management services rendered as of October 31, 2014; the rates are accrued daily and paid monthly:
| Average Daily Net Assets | Annual Fee | |
| On first $250 million | 0.750% | |
| On next $250 million | 0.700% | |
| On next $500 million | 0.680% | |
| On next $1.5 billion | 0.660% | |
| On next $2.5 billion | 0.650% | |
| On next $5 billion | 0.640% | |
| Over $10 billion | 0.635% |
Accounting Services Agreement – Pursuant to the Fund Accounting Agreement between HFMC and the Company, on behalf of the Fund, HFMC provides accounting services to the Fund and receives monthly compensation based on the Fund’s average daily net assets at the rates set forth below. The Fund’s accounting services fees are accrued daily and paid monthly.
| Average Daily Net Assets | Annual Fee | |
| On first $5 billion | 0.020% | |
| On next $5 billion | 0.015% | |
| Over $10 billion | 0.010% |
Operating Expenses – Allocable expenses incurred by the Company are allocated to each Fund and allocated to classes within the Fund in proportion to the average daily net assets of the Fund and each class, except where allocation of certain expenses is more fairly made directly to the Fund or to specific classes within a Fund. As of October 31, 2014, HFMC contractually limited the total operating expenses of this Fund, exclusive of taxes, interest expense, brokerage commissions, acquired fund fees and expenses and extraordinary expenses, through February 29, 2016 as follows:
| Class A | Class C | Class I | Class R3 | Class R4 | Class R5 | Class Y | ||||||
| 1.12% | 1.87% | 0.87% | 1.42% | 1.12% | 0.93% | 0.83% |
Fees Paid Indirectly – The Fund has entered into agreements with State Street Global Markets, LLC and Russell Implementation Services, Inc. to partially recapture non-discounted trade commissions. Such rebates are used to pay a portion of the Fund’s expenses. In addition, the Fund's custodian bank has agreed to reduce its fees when the Fund maintains cash on deposit in a non-interest-bearing custody account. For the period April 30, 2014 (commencement of operations) through October 31, 2014, these amounts, if any, are included in the Statement of Operations.
The ratio of expenses to average net assets in the accompanying financial highlights excludes the reduction in expenses related to fees paid indirectly. The annualized expense ratio after waivers for the period listed below reflecting the reduction for fees paid indirectly is as follows:
| Annualized Period Ended October 31, 2014 | ||||
| Class A | 1.12 | %* | ||
| Class C | 1.87 | * | ||
| Class I | 0.87 | * | ||
| Class R3 | 1.42 | * | ||
| Class R4 | 1.12 | * | ||
| Class R5 | 0.93 | * | ||
| Class Y | 0.83 | * | ||
* From April 30, 2014 (commencement of operations) through October 31, 2014.
| 43 |
| Hartford Multi-Asset Income Fund |
| Notes to Financial Statements – (continued) |
| October 31, 2014 |
| (000’s Omitted) |
Distribution and Service Plan for Class A, C, R3 and R4 Shares – Hartford Funds Distributors, LLC ("HFD"), an indirect wholly owned subsidiary of The Hartford, is the principal underwriter and distributor of the Fund. HFD is engaged in distribution activities, which include marketing and distribution of shares through broker/dealers, financing distribution costs and maintaining financial books and records. For the period April 30, 2014 (commencement of operations) through October 31, 2014, HFD received front-end load sales charges of $3 and contingent deferred sales charges of an amount which rounds to zero from the Fund.
The Fund has adopted a Distribution and Service Plan in accordance with Rule 12b-1 of the 1940 Act to compensate the distributor (HFD) for activities intended to result in the sale and distribution of Class A, C, R3 and R4 shares and for providing services for shareholders. The Rule 12b-1 plan applicable to Class A shares of the Fund provides for payment of a Rule 12b-1 fee of 0.25% of average daily net assets. Some or all of the fee may be used for shareholder servicing expenses with the remainder used for distribution expenses. Under the Class C Plan, the Fund pays the distributor 1.00% of the average daily net assets of Class C shares outstanding, 0.25% of which is intended as a fee for services provided to existing shareholders with the remainder used for distribution expenses. For Class C shares, some or the entire fee may be remitted to broker/dealers for distribution and/or shareholder account services. Class R3 shares have a distribution fee of 0.50% of average daily net assets and Class R4 shares have a distribution fee of 0.25% of average daily net assets. For Class R3 and R4 shares, some or the entire fee may be remitted to broker/dealers for distribution and/or shareholder account services. The Fund’s 12b-1 fees are accrued daily and paid monthly or at such other intervals as the Board of Directors may determine.
Other Related Party Transactions – Certain officers of the Fund are directors and/or officers of HFMC and/or The Hartford or its subsidiaries. For the period April 30, 2014 (commencement of operations) through October 31, 2014, a portion of the Fund’s Chief Compliance Officer’s compensation was paid by all of the investment companies in the Hartford fund complex. The portion allocated to the Fund, as represented in other expenses on the Statement of Operations, rounds to zero. Hartford Administrative Services Company (“HASCO”), an indirect wholly-owned subsidiary of The Hartford, provides transfer agent services to the Fund. HASCO has contractually agreed to reimburse any portion of the transfer agency fees over 0.30% of average daily net assets per fiscal year for each class. Any transfer agency fee reimbursement is determined before considering the contractual operating expense limitation. For providing such services, HASCO is compensated on a per account basis that varies by account type, except with respect to Class Y, for which it is compensated based on average daily net assets. The amount paid to HASCO and any related contractual reimbursement amounts, if applicable, can be found in the Statement of Operations. These fees are accrued daily and paid monthly.
Administrative services fees are paid to HASCO for third-party recordkeeping services that are payable as a percentage of net assets in the amount of up to 0.20%, 0.15% and 0.10% for Classes R3, R4 and R5 shares, respectively. The total administrative services fees are shown on the Statement of Operations. These fees are accrued daily and paid monthly.
| 44 |
| Hartford Multi-Asset Income Fund |
| Notes to Financial Statements – (continued) |
| October 31, 2014 |
| (000’s Omitted) |
Affiliate Holdings:
As of October 31, 2014, affiliates of The Hartford had ownership of shares in the Fund as follows:
| Percentage of Class | Percentage of Fund | |||||||
| Class A | 58 | % | 4 | % | ||||
| Class C | 46 | 1 | ||||||
| Class I | 90 | 1 | ||||||
| Class R3 | 100 | 1 | ||||||
| Class R4 | 100 | 1 | ||||||
| Class R5 | 100 | 1 | ||||||
| Class Y | 8 | 6 | ||||||
As of October 31, 2014, the Fund's shares were owned in aggregate by affiliated fund of funds. Therefore, the Fund may experience relatively large purchases or redemptions of its shares from these affiliated fund of funds. Affiliated fund of funds owned shares in the Fund as follows:
| Percentage of Fund | ||||
| Class Y | 77 | % | ||
Investment Transactions:
For the period April 30, 2014 (commencement of operations) through October 31, 2014, the cost of purchases and proceeds from sales of investment securities (excluding short-term investments) were as follows:
| Excluding U.S. Government Obligations | U.S. Government Obligations | Total | ||||||||||
| Cost of Purchases | $ | 329,208 | $ | — | $ | 329,208 | ||||||
| Sales Proceeds | 176,792 | — | 176,792 | |||||||||
| 45 |
| Hartford Multi-Asset Income Fund |
| Notes to Financial Statements – (continued) |
| October 31, 2014 |
| (000’s Omitted) |
Capital Share Transactions:
The following information is for the period April 30, 2014 (commencement of operations) through October 31, 2014:
| For the Period Ended October 31, 2014 | ||||||||||||||||
| Shares Sold | Shares Issued for Reinvested Dividends | Shares Redeemed | Net Increase (Decrease) of Shares | |||||||||||||
| Class A | ||||||||||||||||
| Shares | 1,055 | 10 | (8 | ) | 1,057 | |||||||||||
| Amount | $ | 10,494 | $ | 99 | $ | (76 | ) | $ | 10,517 | |||||||
| Class C | ||||||||||||||||
| Shares | 434 | 3 | — | 437 | ||||||||||||
| Amount | $ | 4,377 | $ | 32 | $ | (2 | ) | $ | 4,407 | |||||||
| Class I | ||||||||||||||||
| Shares | 223 | 3 | (1 | ) | 225 | |||||||||||
| Amount | $ | 2,236 | $ | 31 | $ | (15 | ) | $ | 2,252 | |||||||
| Class R3 | ||||||||||||||||
| Shares | 200 | 2 | — | 202 | ||||||||||||
| Amount | $ | 2,000 | $ | 23 | $ | — | $ | 2,023 | ||||||||
| Class R4 | ||||||||||||||||
| Shares | 200 | 3 | — | 203 | ||||||||||||
| Amount | $ | 2,000 | $ | 26 | $ | — | $ | 2,026 | ||||||||
| Class R5 | ||||||||||||||||
| Shares | 200 | 3 | — | 203 | ||||||||||||
| Amount | $ | 2,000 | $ | 28 | $ | — | $ | 2,028 | ||||||||
| Class Y | ||||||||||||||||
| Shares | 12,868 | 153 | (1,120 | ) | 11,901 | |||||||||||
| Amount | $ | 130,661 | $ | 1,543 | $ | (11,271 | ) | $ | 120,933 | |||||||
| Total | ||||||||||||||||
| Shares | 15,180 | 177 | (1,129 | ) | 14,228 | |||||||||||
| Amount | $ | 153,768 | $ | 1,782 | $ | (11,364 | ) | $ | 144,186 | |||||||
Line of Credit:
The Fund is one of several Hartford Funds that participate in a $500 million committed revolving line of credit facility. The facility is to be used for temporary or emergency purposes. Under the arrangement, the funds are required to own securities having a market value in excess of 300% of the total bank borrowings. The interest rate on borrowings varies depending on the nature of the loan. The facility also requires a fee to be paid based on the amount of the commitment. This commitment fee is allocated to all the funds participating in the line of credit based on the average net assets of the funds. During the period April 30, 2014 (commencement of operations) through October 31, 2014, the Fund did not have any borrowings under this facility.
Pending Legal Proceedings:
On February 25, 2011, Jennifer L. Kasilag, Louis Mellinger, Judith M. Menendez, Jacqueline M. Robinson, and Linda A. Russell filed a derivative lawsuit against Hartford Investment Financial Services, LLC (“HIFSCO”) (now known as HFD) on behalf of six Hartford retail mutual funds in the United States District Court for the District of New Jersey, alleging that HIFSCO received excessive advisory and distribution fees in violation of its statutory fiduciary duty under Section 36(b) of the 1940 Act when serving as investment manager and principal underwriter, respectively, to the Hartford retail mutual funds. Although this action was purportedly filed on behalf of certain of the Hartford Funds, none of the Hartford Funds is itself a defendant to the suit. HIFSCO moved to dismiss and, in September 2011, the motion was granted in part and denied in part, with leave to amend the complaint. In November 2011, plaintiffs filed an amended complaint on behalf of certain Hartford retail mutual funds, The Hartford Global Health Fund (now known as The Hartford Healthcare Fund), The Hartford Conservative Allocation Fund, The Hartford Growth Opportunities Fund, The Hartford Inflation Plus Fund, The Hartford Advisers Fund (now known as The Hartford Balanced Fund), and The Hartford Capital Appreciation Fund. Plaintiffs seek to rescind the investment management agreements and distribution plans between HIFSCO and these funds and to recover the total fees charged thereunder or, in the alternative, to recover any improper compensation HIFSCO received, in addition to lost earnings. HIFSCO filed a partial motion to
| 46 |
| Hartford Multi-Asset Income Fund |
| Notes to Financial Statements – (continued) |
| October 31, 2014 |
| (000’s Omitted) |
dismiss the amended complaint and, in December 2012, the court dismissed without prejudice the claims regarding distribution fees and denied the motion with respect to the advisory fees claims. HIFSCO disputes the allegations and intends to defend vigorously.
In March 2014, the plaintiffs filed a new complaint that added as new plaintiffs The Hartford Floating Rate Fund and The Hartford Small Company Fund and named as a defendant HFMC, which assumed the role as investment manager to the funds as of January 2013. HFMC and HIFSCO dispute the allegations and intend to defend vigorously.
No accrual for litigation relating to this matter has been recorded in the financial statements of the Fund because the Fund is not party to the suit.
Indemnifications:
Under the Company's organizational documents, the Company shall indemnify its officers and directors to the full extent required or permitted under Maryland General Corporation Law and the federal securities laws. In addition, the Company, on behalf of the Fund, may enter into contracts that contain a variety of indemnifications. The Company's maximum exposure under these arrangements is unknown. However, as of the date of these financial statements, the Company has not had prior claims or losses pursuant to these contracts and expects the risk of loss to be remote.
Subsequent Event:
Effective December 1, 2014, pursuant to a sub-transfer agency agreement between HASCO and Boston Financial Data Services, Inc. (“BFDS”), HASCO has delegated certain transfer agent, dividend disbursing agent and shareholder servicing agent functions to BFDS. The costs and expenses of such delegation are borne by HASCO, not by the Fund.
| 47 |
| Hartford Multi-Asset Income Fund |
| Financial Highlights |
| - Selected Per-Share Data - (A) | - Ratios and Supplemental Data - | |||||||||||||||||||||||||||||||||||||||||||||||||||
| Class | Net
Asset Value at Beginning of Period | Net Investment Income (Loss) | Net Realized and Unrealized Gain (Loss) on Invest- ments | Total
from Investment Operations | Dividends from Net Investment Income | Distribu- tions from Realized Capital Gains | Total Dividends and Distributions | Net
Asset Value at End of Period | Total Return(B) | Net Assets at End of Period (000's) | Ratio of Expenses to Average Net Assets Before Adjust- ments(C) | Ratio
of Expenses to Average Net Assets After Adjust- ments(C) | Ratio of Net Investment Income (Loss) to Average Net Assets | |||||||||||||||||||||||||||||||||||||||
| From April 30, 2014 (commencement of operations), through October 31, 2014 | ||||||||||||||||||||||||||||||||||||||||||||||||||||
| A(D) | $ | 10.00 | $ | 0.18 | $ | (0.10 | ) | $ | 0.08 | $ | (0.13 | ) | $ | – | $ | (0.13 | ) | $ | 9.95 | 0.80 | %(E) | $ | 10,514 | 1.17 | %(F) | 1.12 | %(F) | 3.37 | %(F) | |||||||||||||||||||||||
| C(D) | 10.00 | 0.14 | (0.10 | ) | 0.04 | (0.10 | ) | – | (0.10 | ) | 9.94 | 0.37 | (E) | 4,350 | 1.93 | (F) | 1.87 | (F) | 2.68 | (F) | ||||||||||||||||||||||||||||||||
| I(D) | 10.00 | 0.18 | (0.09 | ) | 0.09 | (0.14 | ) | – | (0.14 | ) | 9.95 | 0.92 | (E) | 2,238 | 0.93 | (F) | 0.87 | (F) | 3.49 | (F) | ||||||||||||||||||||||||||||||||
| R3(D) | 10.00 | 0.16 | (0.09 | ) | 0.07 | (0.12 | ) | – | (0.12 | ) | 9.95 | 0.64 | (E) | 2,012 | 1.62 | (F) | 1.42 | (F) | 2.93 | (F) | ||||||||||||||||||||||||||||||||
| R4(D) | 10.00 | 0.17 | (0.09 | ) | 0.08 | (0.13 | ) | – | (0.13 | ) | 9.95 | 0.78 | (E) | 2,016 | 1.32 | (F) | 1.12 | (F) | 3.23 | (F) | ||||||||||||||||||||||||||||||||
| R5(D) | 10.00 | 0.18 | (0.09 | ) | 0.09 | (0.14 | ) | – | (0.14 | ) | 9.95 | 0.88 | (E) | 2,017 | 1.02 | (F) | 0.93 | (F) | 3.42 | (F) | ||||||||||||||||||||||||||||||||
| Y(D) | 10.00 | 0.20 | (0.10 | ) | 0.10 | (0.15 | ) | – | (0.15 | ) | 9.95 | 0.93 | (E) | 118,437 | 0.88 | (F) | 0.83 | (F) | 3.74 | (F) | ||||||||||||||||||||||||||||||||
| (A) | Information presented relates to a share outstanding throughout the indicated period. Net investment income (loss) per share amounts are calculated based on average shares outstanding unless otherwise noted. |
| (B) | Assumes initial investment at net asset value at the beginning of each period, reinvestment of all distributions, the complete redemption of the investment at net asset value at the end of each period and no sales charge. Total return would be reduced if sales charges were taken into account. |
| (C) | Adjustments include waivers and reimbursements, if applicable. Ratios do not include fees paid indirectly (see Expenses in the accompanying Notes to Financial Statements). |
| (D) | Commenced operations on April 30, 2014. |
| (E) | Not annualized. |
| (F) | Annualized. |
Portfolio Turnover | ||||
| From April 30, 2014 (commencement of operations) through October 31, 2014 | 26 | %(A) |
| (A) | Not annualized. |
| 48 |
| Report of Independent Registered Public Accounting Firm |
| The Board of Directors and Shareholders of |
| The Hartford Mutual Funds, Inc. |
We have audited the accompanying statement of assets and liabilities, including the schedule of investments, of Hartford Multi-Asset Income Fund (one of the portfolios constituting The Hartford Mutual Funds, Inc. (the Funds)) as of October 31, 2014, and the related statement of operations, the statement of changes in net assets, and the financial highlights for the period from April 30, 2014 (commencement of operations) to October 31, 2014. These financial statements and financial highlights are the responsibility of the Funds’ management. Our responsibility is to express an opinion on these financial statements and financial highlights based on our audit.
We conducted our audit in accordance with the standards of the Public Company Accounting Oversight Board (United States). Those standards require that we plan and perform the audit to obtain reasonable assurance about whether the financial statements and financial highlights are free of material misstatement. We were not engaged to perform an audit of the Funds’ internal control over financial reporting. Our audit included consideration of internal control over financial reporting as a basis for designing audit procedures that are appropriate in the circumstances, but not for the purpose of expressing an opinion on the effectiveness of the Funds’ internal control over financial reporting. Accordingly, we express no such opinion. An audit also includes examining, on a test basis, evidence supporting the amounts and disclosures in the financial statements and financial highlights, assessing the accounting principles used and significant estimates made by management, and evaluating the overall financial statement presentation. Our procedures included confirmation of securities owned as of October 31, 2014, by correspondence with the custodian, agent banks and brokers or by other appropriate auditing procedures where replies from agent banks and brokers were not received. We believe that our audit provides a reasonable basis for our opinion.
In our opinion, the financial statements and financial highlights referred to above present fairly, in all material respects, the financial position of Hartford Multi-Asset Income Fund of The Hartford Mutual Funds, Inc. at October 31, 2014, the results of its operations, the changes in its net assets, and the financial highlights for the period from April 30, 2014 (commencement of operations) to October 31, 2014, in conformity with U.S. generally accepted accounting principles.
|
Minneapolis, Minnesota
December 18, 2014
| 49 |
| Hartford Multi-Asset Income Fund |
| Directors and Officers (Unaudited) |
The Board of Directors of the Company (the "Directors") appoints officers who are responsible for the day-to-day operations of the Fund and who execute policies formulated by the Directors. Each Director serves until his or her death, resignation, or retirement or until the next annual meeting of shareholders is held or until his or her successor is elected and qualifies.
Directors and officers who are employed by or who have a financial interest in The Hartford Financial Services Group, Inc. ("The Hartford") are considered “interested” persons of the Fund pursuant to the 1940 Act. Each officer and two of the Company's Directors, as noted in the chart below, are “interested” persons of the Fund. Each Director serves as a director for The Hartford Mutual Funds, Inc., The Hartford Mutual Funds II, Inc., Hartford Series Fund, Inc., and Hartford HLS Series Fund II, Inc., and as a trustee for The Hartford Alternative Strategies Fund, which, as of October 31, 2014, collectively consist of 66 funds. Correspondence may be sent to Directors and officers c/o Hartford Funds, 5 Radnor Corporate Center, Suite 300, 100 Matsonford Road, Radnor, Pennsylvania 19087, except that correspondence to Mr. Annoni, Mr. Dressen and Ms. Quade may be sent to 500 Bielenberg Drive, Suite 500, Woodbury, Minnesota 55125.
The table below sets forth, for each Director and officer, his or her name, year of birth, current position with the Company and date first elected or appointed to The Hartford Mutual Funds, Inc. ("MF") and The Hartford Mutual Funds II, Inc. ("MF2"), principal occupation, and, for Directors, other directorships held. The Fund’s Statement of Additional Information contains further information on the Directors and is available free of charge by calling 1-888-843-7824 or writing to: Hartford Funds, P.O. Box 55022, Boston, MA 02205-5022.
Information on the aggregate remuneration paid to the directors of the Company can be found in the Statement of Operations herein. The Fund pays to The Hartford a portion of the Chief Compliance Officer’s compensation, but does not pay salaries or compensation to any of its other officers or Directors who are employed by The Hartford.
Non-Interested Directors
Hilary E. Ackermann (1956) Director since September 23, 2014
Ms. Ackermann served as Chief Risk Officer at Goldman Sachs Bank USA from October 2008 to November 2011 and serves as a Director of Dynegy, Inc., an independent power company, from October 2012 to present.
Lynn S. Birdsong (1946) Director since 2003, Chairman of the Investment Committee since 2014
Mr. Birdsong is a private investor. Mr. Birdsong currently serves as a Director of the Sovereign High Yield Investment Company (April 2010 to current). Mr. Birdsong currently serves as an Independent Director of Nomura Partners Funds, Inc. (formerly, The Japan Fund) (April 2003 to current). From 2003 to March 2005, Mr. Birdsong was an Independent Director of the Atlantic Whitehall Funds. From 1979 to 2002, Mr. Birdsong was a Managing Director of Zurich Scudder Investments, an investment management firm. During his employment with Scudder, Mr. Birdsong was an Interested Director of The Japan Fund. From January 1981 through December 2013, Mr. Birdsong was a partner in Birdsong Company, an advertising specialty firm.
Robert M. Gavin, Jr. (1940) Director since 2002 (MF) and 1986 (MF2), Chairman of the Board for each since 2004
Dr. Gavin is an educational consultant. Prior to September 1, 2001, he was President of Cranbrook Education Community and prior to July 1996, he was President of Macalester College, St. Paul, Minnesota.
Duane E. Hill (1945) Director since 2001 (MF) and 2002 (MF2), Chairman of the Nominating Committee since 2003
Mr. Hill is a Partner of TSG Ventures L.P., a private equity investment company. Mr. Hill is a former partner of TSG Capital Group, a private equity investment firm that served as sponsor and lead investor in leveraged buyouts of middle market companies.
Sandra S. Jaffee (1941) Director since 2005
Ms. Jaffee is the founder and Chief Executive Officer of a private company, Homeworks Concierge, LLC, which provides residential property management services in Westchester County, New York (January 2012 to present). Ms. Jaffee served as Chairman (2008 to 2009) and Chief Executive Officer of Fortent (formerly Searchspace Group), a leading provider of compliance/regulatory technology to financial institutions from August 2005 to August 2009. From August 2004 to August 2005, Ms. Jaffee served as an Entrepreneur in Residence with Warburg Pincus, a private equity firm. Prior to joining Warburg Pincus, Ms. Jaffee served as Executive Vice President at Citigroup, from September 1995 to July 2004, where she was President and Chief Executive Officer of Citibank’s Global Securities Services (1995 to 2003). Ms. Jaffee currently serves as a member of the Board of Directors of Broadridge Financial Solutions as well as a Trustee of Muhlenberg College.
| 50 |
| Hartford Multi-Asset Income Fund |
| Directors and Officers (Unaudited) – (continued) |
William P. Johnston (1944) Director since 2005, Chairman of the Compliance Committee since 2005
In June 2006, Mr. Johnston was appointed as Senior Advisor to The Carlyle Group, a global private equity and other alternative asset investment firm and currently serves as an Operating Executive. In July 2006, Mr. Johnston was elected to the Board of Directors of MultiPlan, Inc. and served as a Director (July 2006 to August 2010). In August 2007, Mr. Johnston was elected to the Board of Directors of LifeCare Holdings, Inc. and served as a Director (August 2007 to June 2013). In February 2008, Mr. Johnston was elected to the Board of Directors of HCR-ManorCare, Inc. In May 2006, Mr. Johnston was elected to the Supervisory Board of Fresenius Medical Care AG & Co. KGaA, after its acquisition of Renal Care Group, Inc. in March 2006. Mr. Johnston joined Renal Care Group in November 2002 as a member of the Board of Directors and served as Chairman of the Board from March 2003 through March 2006. From 2002 through 2013, Mr. Johnston served as a Board member of the Georgia O’Keefe Museum. From September 1987 to December 2002, Mr. Johnston was with Equitable Securities Corporation (and its successors, SunTrust Equitable Securities and SunTrust Robinson Humphrey) serving in various investment banking and managerial positions, including Managing Director and Head of Investment Banking, Chief Executive Officer and Vice Chairman.
Phillip O. Peterson (1944) Director since 2002 (MF) and 2000 (MF2), Chairman of the Audit Committee since 2002
Mr. Peterson is a mutual fund industry consultant. He was a partner of KPMG LLP (an accounting firm) until July 1999. Mr. Peterson joined William Blair Funds in February 2007 as a member of the Board of Trustees. From February 2012 to February 2014, Mr. Peterson served as a Trustee of Symetra Variable Mutual Funds. From January 2004 to April 2005, Mr. Peterson served as Independent President of the Strong Mutual Funds.
Lemma W. Senbet (1946) Director since 2005
Dr. Senbet is the William E. Mayer Chair Professor of Finance and Founding Director, Center for Financial Policy, at the University of Maryland, Robert H. Smith School of Business. He was chair of the Finance Department of the University of Maryland, Robert H. Smith School of Business from 1998 to 2006. Since June 2013, he has been on leave from the University to serve as Executive Director of African Economic Research Consortium which focuses on economic policy research and training. Previously, he was a chaired professor of finance at the University of Wisconsin-Madison. Also, he was a Director of the Fortis Funds from March 2000 to July 2002. Dr. Senbet served as Director of the American Finance Association and President of the Western Finance Association. In 2006, Dr. Senbet was inducted Fellow of Financial Management Association International for his career-long distinguished scholarship and professional service.
Interested Directors and Officers
James E. Davey (1964) Director since 2012, President and Chief Executive Officer since 2010
Mr. Davey serves as Executive Vice President of Hartford Life Insurance Company (“HLIC”) and The Hartford. Additionally, Mr. Davey serves as Chairman of the Board, Manager and Senior Managing Director of Hartford Funds Distributors, LLC (“HFD”). He also currently serves as Director, Chairman of the Board, President and Senior Managing Director of Hartford Administrative Services Company (“HASCO”). Mr. Davey also serves as Manager, Chairman of the Board and Senior Managing Director for Hartford Funds Management Company, LLC (“HFMC”) and Director, Chairman of the Board and Senior Managing Director for Hartford Funds Management Group, Inc. ("HFMG"). Mr. Davey has served in various positions within The Hartford and its subsidiaries in connection with the operation of the Hartford Funds. Mr. Davey joined The Hartford in 2002.
Lowndes A. Smith* (1939) Director since 1996 (MF) and 2002 (MF2)
Mr. Smith served as Vice Chairman of The Hartford from February 1997 to January 2002, as President and Chief Executive Officer of Hartford Life, Inc. from February 1997 to January 2002, and as President and Chief Operating Officer of The Hartford Life Insurance Companies from January 1989 to January 2002. Mr. Smith serves as a Director of White Mountains Insurance Group Ltd. (October 2003 to current); One Beacon Insurance (October 2006 to current); Symetra Financial (August 2007 to current) and is a Managing Director of Whittington Gray Associates (January 2007 to current).
* Mr. Smith resigned as a Director of MF, MF2, Hartford Series Fund, Inc. and Hartford HLS Series Fund II, Inc. and as a Trustee of The Hartford Alternative Strategies Fund effective September 17, 2014.
Other Officers
Mark A. Annoni (1964) Vice President, Controller and Treasurer since 2012
Mr. Annoni currently serves as the Assistant Vice President of HLIC (February 2004 to present) and Senior Vice President of HFMG (December 2013 to present). Mr. Annoni has served in various positions within The Hartford and its subsidiaries in connection with the operation of the Hartford Funds. Mr. Annoni joined The Hartford in 2001.
| 51 |
| Hartford Multi-Asset Income Fund |
| Directors and Officers (Unaudited) – (continued) |
Michael R. Dressen (1963) AML Compliance Officer since 2011
Mr. Dressen currently serves as Assistant Vice President of HLIC. He also serves as Chief Compliance Officer and AML Compliance Officer of HASCO and as AML Officer of HFD. Mr. Dressen has served in various positions within The Hartford and its subsidiaries in connection with the operation of the Hartford Funds.
Edward P. Macdonald (1967) Vice President, Secretary and Chief Legal Officer since 2005
Mr. Macdonald currently serves as Assistant Secretary, Executive Vice President and Deputy General Counsel of HFD, HASCO, HFMC and HFMG. He also serves as Vice President of HLIC. Mr. Macdonald has served in various positions within The Hartford and its subsidiaries in connection with the operation of the Hartford Funds. Mr. Macdonald joined The Hartford in 2005.
Joseph G. Melcher (1973) Vice President and Chief Compliance Officer since 2013
Mr. Melcher currently serves as Executive Vice President of HFD, HFMG and HASCO. Mr. Melcher also currently serves as Executive Vice President and Chief Compliance Officer of HFMC. Mr. Melcher has served in various positions within The Hartford and its subsidiaries in connection with the operation of the Hartford Funds since joining The Hartford in 2012. Prior to joining The Hartford, Mr. Melcher worked at Touchstone Investments, a member of the Western & Southern Financial Group, where he held the position of Vice President and Chief Compliance Officer from 2010 through 2012 and Assistant Vice President, Compliance from 2005 to 2010.
Vernon J. Meyer (1964) Vice President since 2006
Mr. Meyer currently serves as Senior Vice President of HLIC. He also currently serves as Managing Director and Chief Investment Officer of HFMC and Managing Director of HFMG. Mr. Meyer has served in various positions within The Hartford and its subsidiaries in connection with the operation of the Hartford Funds. Mr. Meyer joined The Hartford in 2004.
Laura S. Quade (1969) Vice President since 2012
Ms. Quade currently serves as Vice President of HASCO, HFD and HFMG. She is the Head of Operations of HASCO and formerly served as Director, Enterprise Operations of HLIC. Ms. Quade has served in various positions within The Hartford and its subsidiaries in connection with the operation of the Hartford Funds. Ms. Quade joined The Hartford in 2001.
Martin A. Swanson** (1962) Vice President since 2010
Mr. Swanson currently serves as Vice President of HLIC. Mr. Swanson also serves as Managing Director, Chief Marketing Officer and Principal of HFD and Managing Director of HFMG. Mr. Swanson has served in various positions within The Hartford and its subsidiaries in connection with the operation of the Hartford Funds.
** Mr. Swanson resigned as an officer effective November 6, 2014.
HOW TO OBTAIN A COPY OF THE FUND’S PROXY VOTING POLICIES AND VOTING RECORDS (UNAUDITED)
A description of the policies and procedures that the Fund uses to determine how to vote proxies relating to portfolio securities and information about how the Fund voted proxies relating to portfolio securities during the most recent twelve-month period ended June 30 are available (1) without charge, upon request, by calling 888-843-7824 and (2) on the SEC’s website at http://www.sec.gov.
QUARTERLY PORTFOLIO HOLDINGS INFORMATION (UNAUDITED)
The Fund files a complete schedule of portfolio holdings with the SEC for the first and third quarters of each fiscal year on Form N-Q. The Fund’s Forms N-Q are available (1) without charge, upon request, by calling 888-843-7824 and (2) on the SEC’s website at http://www.sec.gov. The Form N-Q may be reviewed and copied at the SEC’s Public Reference Room in Washington, DC. Information on the operation of the Public Reference Room may be obtained by calling 1-800-SEC-0330.
| 52 |
| Hartford Multi-Asset Income Fund |
| Federal Tax Information (Unaudited) |
For the fiscal year ended October 31, 2014, there is no further federal tax information required for this Fund.
| 53 |
| Hartford Multi-Asset Income Fund |
| Expense Example (Unaudited) |
Your Fund's Expenses
As a shareholder of the Fund, you incur two types of costs: (1) transaction costs, including sales charges (loads) on purchase payments, if any, and contingent deferred sales charges (CDSC), if any, and (2) ongoing costs, including investment management fees, distribution and/or service (12b-1) fees, if any, and other fund expenses. This example is intended to help you understand your ongoing costs (in dollars) of investing in the Fund and to compare these costs with the ongoing costs of investing in other mutual funds. The example is based on an investment of $1,000 invested at the beginning of the period and held for the entire period of April 30, 2014 through October 31, 2014.
Actual Expenses
The first set of columns of the table below provides information about actual account values and actual expenses. You may use the information in this column, together with the amount you invested, to estimate the expenses that you paid over the period. Simply divide your account value by $1,000 (for example, an $8,600 account value divided by $1,000 = 8.6), then multiply the result by the number in the line under the heading entitled “Expenses Paid During Period” to estimate the expenses you paid on your account during this period.
Hypothetical Example for Comparison Purposes
The second set of columns of the table below provides information about hypothetical account values and hypothetical expenses based on the Fund's actual expense ratio and an assumed rate of return of 5% per year before expenses, which is not the Fund's actual return. The hypothetical account values and expenses may not be used to estimate the actual ending account balance or expenses you paid for the period. You may use this information to compare the ongoing costs of investing in the Fund and other funds. To do so, compare this 5% hypothetical example with the 5% hypothetical examples that appear in the shareholder reports of the other funds.
Please note that the expenses shown in the table are meant to highlight your ongoing costs only and do not reflect any transactional costs, such as sales charges (loads) and CDSC. Therefore, the second set of columns of the table is useful in comparing ongoing costs only, and will not help you determine the relative total costs of owning different funds. In addition, if these transactional costs were included, your costs would be higher. Expenses are equal to the Fund's annualized expense ratios multiplied by average account value over the period, multiplied by 184/365 (to reflect the one-half year period).
| Actual return | Hypothetical (5% return before expenses) | |||||||||||||||||||||||||||||||
| Beginning Account Value April 30, 2014 | Ending Account Value October 31, 2014 | Expenses paid during the period April 30, 2014 through October 31, 2014 | Beginning Account Value April 30, 2014 | Ending Account Value October 31, 2014 | Expenses paid during the period April 30, 2014 through October 31, 2014 | Annualized expense ratio | Days in the current 1/2 year | Days in the full year | ||||||||||||||||||||||||
| Class A* | $ | 1,000.00 | $ | 1,008.00 | $ | 5.69 | $ | 1,000.00 | $ | 1,019.54 | $ | 5.73 | 1.12 | % | 184 | 365 | ||||||||||||||||
| Class C* | $ | 1,000.00 | $ | 1,003.70 | $ | 9.44 | $ | 1,000.00 | $ | 1,015.78 | $ | 9.50 | 1.87 | 184 | 365 | |||||||||||||||||
| Class I* | $ | 1,000.00 | $ | 1,009.20 | $ | 4.41 | $ | 1,000.00 | $ | 1,020.82 | $ | 4.43 | 0.87 | 184 | 365 | |||||||||||||||||
| Class R3* | $ | 1,000.00 | $ | 1,006.40 | $ | 7.18 | $ | 1,000.00 | $ | 1,018.05 | $ | 7.22 | 1.42 | 184 | 365 | |||||||||||||||||
| Class R4* | $ | 1,000.00 | $ | 1,007.80 | $ | 5.67 | $ | 1,000.00 | $ | 1,019.56 | $ | 5.70 | 1.12 | 184 | 365 | |||||||||||||||||
| Class R5* | $ | 1,000.00 | $ | 1,008.80 | $ | 4.71 | $ | 1,000.00 | $ | 1,020.52 | $ | 4.74 | 0.93 | 184 | 365 | |||||||||||||||||
| Class Y* | $ | 1,000.00 | $ | 1,009.30 | $ | 4.21 | $ | 1,000.00 | $ | 1,021.02 | $ | 4.23 | 0.83 | 184 | 365 | |||||||||||||||||
| * | Commenced operations on April 30, 2014. |
| 54 |
| Hartford Multi-Asset Income Fund |
| Approval of New Investment Management and Investment Sub-Advisory Agreements (Unaudited) |
Section 15(c) of the Investment Company Act of 1940, as amended (the “1940 Act”), requires that each mutual fund’s board of directors, including a majority of those directors who are not “interested persons” of the mutual fund, as defined in the 1940 Act (the “Independent Directors”), initially approve, and annually review and consider the continuation of, the mutual fund’s investment advisory and sub-advisory agreements. At its meeting held on February 4-5, 2014, the Board of Directors (the “Board”) of The Hartford Mutual Funds, Inc., including each of the Independent Directors, unanimously voted to approve an investment management agreement for Hartford Multi-Asset Income Fund (the “Fund”) with Hartford Funds Management Company, LLC (“HFMC”) and an investment sub-advisory agreement between HFMC and the Fund’s sub-adviser, Wellington Management Company, LLP (the “Sub-adviser,” and together with HFMC, the “Advisers”) (collectively, the “Agreements”).
Prior to approving the Agreements, the Board requested, received and reviewed written responses from the Advisers to questions posed to them on behalf of the Independent Directors and supporting materials relating to those questions and responses (the “Adviser Materials”). In addition, the Board’s Investment Committee received in-person presentations from representatives of the Advisers regarding the Fund and the proposed investment strategy.
In determining whether to approve the Agreements for the Fund, the members of the Board reviewed and evaluated information and factors they believed to be relevant and appropriate in light of the information that the Board deemed necessary and appropriate through the exercise of its reasonable business judgment. While individual members of the Board may have weighed certain factors differently, the Board’s determination to approve the Agreements was based on a comprehensive consideration of all information provided to the Board with respect to the approval of the Agreements. A more detailed discussion of the factors the Board considered with respect to its approval of the Agreements is provided below.
Nature, Extent and Quality of Services to be Provided by the Advisers
The Board requested and considered information concerning the nature, extent and quality of the services to be provided to the Fund by the Advisers. The Board considered, among other things, the terms of the Agreements and the range of services to be provided by the Advisers. The Board considered the Advisers’ organizational structure, systems and personnel. The Board also considered each Adviser’s reputation and overall financial strength and the Board’s past experience with the Advisers with respect to the services they provide to other Hartford Funds.
With respect to HFMC, the Board noted that, under the Agreements, HFMC would be responsible for the management of the Fund, including oversight of fund operations and service providers. The Board also noted that HFMC would provide administrative services to the Fund as well as investment advisory services in connection with selecting, monitoring and supervising the Fund’s sub-adviser, and that HFMC had recommended to the Board that the Sub-adviser be appointed as the sub-adviser to the Fund. The Board considered HFMC’s ongoing monitoring of people, process and performance, including its quarterly reviews of each of the Hartford Funds, semi-annual meetings with the leaders of each Fund’s portfolio management team, and oversight of the Hartford Funds’ approximately 66 portfolio managers. The Board recognized that HFMC has demonstrated a record of making changes to the management and/or strategies of the Hartford Funds when warranted. The Board considered that HFMC would oversee the Sub-adviser’s investment approach and results, process for monitoring best execution of portfolio trades by the Sub-adviser and approach to risk management with respect to the Fund and the service providers to the Fund. The Board also considered that HFMC would oversee compliance with the Fund’s objective and policies as well as with applicable laws and regulations. In addition, the Board considered that HFMC or its affiliates would be responsible for providing the Fund’s officers.
With respect to the Sub-adviser, which would provide certain day-to-day portfolio management services for the Fund, the Investment Committee met with members of the proposed portfolio management team. The Board considered the Sub-adviser’s investment philosophy and process, investment research capabilities and resources, performance record, trade execution capabilities and experience.
The Board also considered information previously provided by the Advisers regarding their compliance policies and procedures and compliance history, and received a representation from HFMC that the written compliance policies and procedures of HFMC and the Sub-adviser are reasonably designed to prevent violations of the federal securities laws. In addition, the Board considered HFMC’s representation that it did not anticipate making any material changes to HFMC’s and the Hartford Funds’ compliance program as a result of the addition of the Fund.
In considering this information, the Board evaluated not only the information presented to the Board and the Investment Committee in connection with its consideration of the Agreements, but also the Board’s experience through past interactions with HFMC and the Sub-adviser. Based on these considerations, the Board concluded that it was satisfied with the nature, extent and quality of the services to be provided to the Fund by HFMC and the Sub-adviser.
| 55 |
| Hartford Multi-Asset Income Fund |
| Approval of Investment Management and Investment Sub-Advisory Agreements (Unaudited) – (continued) |
Performance of the Sub-adviser
The Board considered the investment performance of the Sub-adviser and its portfolio management team, including, for purposes of considering the investment skill and experience of the Fund’s portfolio managers, the performance of the Asset Allocation team responsible for overseeing the overall asset allocation and risk management for the Fund as well as the performance of the strategies proposed for the fixed income and equity components of the Fund, noting that the Sub-adviser did not currently manage a strategy similar to that proposed for the Fund. HFMC and the Sub-adviser also provided additional information about the broad range of the portfolio management team’s investment experience and their investment philosophy and process.
Based on these considerations, the Board concluded that it was satisfied that HFMC and the Sub-adviser have the capability of providing satisfactory investment performance for the Fund.
Costs of the Services and Profitability of the Advisers
In considering the proposed advisory and sub-advisory fee schedules for the Fund, the Board reviewed information regarding HFMC’s estimated costs to provide investment management and related services to the Fund and the estimated profitability to HFMC and its affiliates from all services to be provided to the Fund and all aspects of their relationships with the Fund. In evaluating HFMC’s estimated profitability, the Board considered HFMC’s representation that the level of estimated profitability was fair and appropriate based on the nature and quality of the services to be provided to shareholders. The Board also noted that the actual profitability of the Fund to HFMC would depend on the growth of assets under management. The Board also requested and received information relating to the operations and profitability of the Sub-adviser.
Based on these considerations, the Board concluded that the profits anticipated to be realized by the Advisers and their affiliates from their relationships with the Fund would not be excessive.
Comparison of Fees and Services to be Provided by the Advisers
The Board considered comparative information with respect to the management fees to be paid by the Fund to HFMC and the expected total expense ratios of the Fund. The Board also considered the proposed sub-advisory fees to be paid by HFMC to the Sub-adviser, noting that the Sub-adviser had agreed to waive a portion of its sub-advisory fee based on the Fund’s asset levels during the first two years of the Fund’s operation. In this regard, the Board requested and reviewed information from HFMC and the Sub-adviser relating to the proposed management and sub-advisory fees and total operating expenses for the Fund. With respect to the sub-advisory fee schedule, the Board considered representations from HFMC and the Sub-adviser that the Sub-adviser’s fees were negotiated at arm’s length on a fund-by-fund basis. The Board also reviewed information comparing the Fund’s proposed management fees and total expenses relative to a peer universe of funds derived from information provided by Lipper Inc. (“Lipper”), an independent provider of investment company data, in conjunction with input from an independent financial services consultant engaged by the Board. The Board considered that HFMC had contractually agreed to limit the expenses for the Fund’s Class A, Class C, Class I, Class R3, Class R4, Class R5 and Class Y shares to 1.12%, 1.87%, 0.87%, 1.42%, 1.12%, 0.93% and 0.83%, respectively, through February 28, 2015, with such arrangement automatically renewing on an annual basis unless HFMC provides written notice of termination prior to the start of the next term or upon approval of the Board.
In considering the reasonableness of the Fund’s management and sub-advisory fees and total expense ratios, the Board considered that, according to the information provided by Lipper, the Fund’s proposed weighted management fees were below the Lipper peer group average and median for all asset levels, and that the proposed weighted management fees fell within the 2nd quintile for all asset levels. The Board also considered that the Fund’s estimated total expenses, less Rule 12b-1 fees, were below the Lipper peer group average and median and fell within the 1st quintile.
Based on these considerations, the Board concluded that the Fund’s proposed fees and total operating expenses, in conjunction with the information about quality of services, profitability, economies of scale, and other matters discussed, were reasonable in light of the services to be provided.
| 56 |
| Hartford Multi-Asset Income Fund |
| Approval of Investment Management and Investment Sub-Advisory Agreements (Unaudited) – (continued) |
Economies of Scale
The Board considered the extent to which economies of scale would be realized as the Fund grows and whether the fee levels reflect these economies of scale for the benefit of the Fund’s future shareholders. The Board reviewed the breakpoints in the proposed management fee schedule for the Fund, which would reduce fee rates as Fund assets grow over time. The Board considered HFMC’s representation that the Fund could be expected to achieve some economies of scale as assets in the Fund grow. The Board recognized that a fund with assets beyond the highest breakpoint level would continue to benefit from economies of scale because additional assets are charged the lowest breakpoint fee resulting in lower overall effective management fee rates. The Board also considered that expense limitations and fee waivers that reduce the Fund’s expenses at all asset levels can have the same effect as breakpoints in sharing economies of scale with shareholders and provide protection from an increase in expenses if Fund assets decline. The Board recognized that a fee schedule that reaches a lower breakpoint quickly provides shareholders with the benefit of anticipated or potential economies of scale. The Board also considered that HFMC has been active in managing expenses for the Hartford Funds.
The Board also considered how any benefits from economies of scale would be realized by the various parties. The Board reviewed relevant information included in the Adviser Materials regarding comparative breakpoint information for other funds in the Fund’s Lipper peer group. Based on these considerations, the Board concluded that it was satisfied with the extent to which economies of scale would be shared for the benefit of the Fund’s future shareholders. The Board noted, however, that it would review future growth in Fund assets and the appropriateness of the breakpoints as part of its future annual review of the Agreements.
Other Benefits
The Board considered other benefits to the Advisers and their affiliates from their relationships with the Fund.
The Board noted that HFMC would receive fees for fund accounting and related services from the Fund. The Board also considered that Hartford Administrative Services Company, the Fund’s transfer agent and an affiliate of HFMC, would receive transfer agency compensation from the Fund.
The Board also considered that Hartford Funds Distributors LLC (“HFD”), an affiliate of HFMC, will serve as principal underwriter of the Fund. As principal underwriter, HFD would receive 12b-1 fees from the Fund and would receive all or a portion of the sales charges on sales or redemptions of certain classes of shares.
The Board considered the benefits to the Fund’s future shareholders of being part of the Hartford Funds family of funds, including the right to exchange investments between the same class of funds without a sales charge, the ability to reinvest Fund dividends into other funds in the family, and the ability to combine holdings in the Fund with holdings in other funds to obtain a reduced sales charge. The Board considered HFMC’s efforts to provide investors in the family with a broad range of investment styles and asset classes and its entrepreneurial risk in initiating new funds to expand these opportunities for shareholders.
* * * *
Based upon its review of these various factors, among others, the Board concluded that it is in the best interests of the Fund and its shareholders for the Board to approve the Agreements. In reaching this decision, the Board did not assign relative weights to the factors discussed above or deem any one or group of them to be controlling in and of themselves. In connection with their deliberations, the Independent Directors met separately in executive session with independent legal counsel to review the relevant materials and consider their responsibilities under relevant laws and regulations.
| 57 |
| Hartford Multi-Asset Income Fund |
| Main Risks (Unaudited) |
The main risks of investing in the Fund are described below.
Market, Selection and Strategy Risk: The Fund’s share price may fluctuate due to market risk and/or security selections that may underperform the market or relevant benchmarks. If the sub-adviser's investment strategy does not perform as expected, the Fund could underperform its peers or lose money. There is no guarantee the Fund will achieve its stated objective.
Asset Allocation Strategy Risk: The portfolio managers' asset allocation strategy may not always work as intended, and asset allocation does not guarantee better performance or reduce the risk of investment loss.
Fixed Income Risk: The Fund is subject to interest rate risk (the risk that the value of an investment decreases when interest rates rise), credit risk (the risk that the issuing company of a security is unable to pay interest and principal when due) and call risk (the risk that an investment may be redeemed early).
Loan Risk: The Fund’s investments in loans may at times become difficult to value and highly illiquid; they are subject to credit risk such as nonpayment of principal or interest, and risks of bankruptcy and insolvency.
Foreign Investment, Emerging Markets and Sovereign Debt Risk: Investments in foreign securities may be riskier than investments in U.S. securities. Potential risks include the risks of illiquidity, increased price volatility, less government regulation, less extensive and less frequent accounting and other reporting requirements, unfavorable changes in currency exchange rates, and economic and political disruptions. These risks are generally greater for investments in emerging markets. Sovereign debt investments are subject to credit risk and the risk of default.
Dividend Paying Security Investment Risk: Dividends are not guaranteed and are subject to change. Dividend paying securities as a group can fall out of favor with the market, causing the Fund to underperform.
Junk Bond Risk: Investments in junk bonds involve greater risk of price volatility, illiquidity, and default than higher-rated debt securities.
Derivatives Risk: Investments in derivatives can be volatile. Potential risks include currency risk, leverage risk (the risk that small market movements may result in large changes in the value of an investment), liquidity risk, index risk, pricing risk, and counterparty risk (the risk that the counterparty may be unwilling or unable to honor its obligations).
Mortgage-Backed Securities Risk: Mortgage-backed securities are subject to interest rate risk, credit risk, prepayment risk, extension risk, and the risk that an investment’s value may be reduced or become worthless if it receives interest or income payments only after other investments in the same pool.
Active Trading Risk: Actively trading investments may result in higher costs and higher taxable income.
Quantitative Analysis Risk: The Fund uses quantitative analysis in its securities selection; securities selected by this method may perform differently from the broader stock market.
| 58 |
THIS PRIVACY POLICY IS NOT PART OF THIS REPORT
Privacy Policy and Practices of The Hartford Financial Services Group, Inc. and its Affiliates
(herein called “we, our and us”)
This Privacy Policy applies to our United States Operations
|
We value your trust. We are committed to the responsible: a) management; b) use; and c) protection; of Personal Information.
This notice describes how we collect, disclose, and protect Personal Information.
We collect Personal Information to: a) service your Transactions with us; and b) support our business functions.
We may obtain Personal Information from: a) You; b) your Transactions with us; and c) third parties such as a consumer-reporting agency.
Based on the type of product or service You apply for or get from us, Personal Information such as: a) your name; b) your address; c) your income; d) your payment; or e) your credit history; may be gathered from sources such as applications, Transactions, and consumer reports.
To serve You and service our business, we may share certain Personal Information. We will share Personal Information, only as allowed by law, with affiliates such as: a) our insurance companies; b) our employee agents; c) our brokerage firms; and d) our administrators.
As allowed by law, we may share Personal Financial Information with our affiliates to: a) market our products; or b) market our services; to You without providing You with an option to prevent these disclosures. |
We may also share Personal Information, only as allowed by law, with unaffiliated third parties including: a) independent agents; b) brokerage firms; c) insurance companies; d) administrators; and e) service providers; who help us serve You and service our business.
When allowed by law, we may share certain Personal Financial Information with other unaffiliated third parties who assist us by performing services or functions such as: a) taking surveys; b) marketing our products or services; or c) offering financial products or services under a joint agreement between us and one or more financial institutions.
We, and third parties we partner with, may track some of the pages You visit through the use of: a) cookies; b) pixel tagging; or c) other technologies; and currently do not process or comply with any web browser’s “do not track” signal or similar mechanism that indicates a request to disable online tracking of individual users who visit our websites or use our services.
We will not sell or share your Personal Financial Information with anyone for purposes unrelated to our business functions without offering You the opportunity to: a) “opt-out;” or b) “opt-in;” as required by law.
We only disclose Personal Health Information with: a) your proper written authorization; or b) as otherwise allowed or required by law.
Our employees have access to Personal Information in the course of doing their jobs, such as: a) underwriting policies; b) paying claims; c) developing new products; or d) advising customers of our products and services. |
|
We use manual and electronic security procedures to maintain: a) the confidentiality; and b) the integrity of; Personal Information that we have. We use these procedures to guard against unauthorized access.
Some techniques we use to protect Personal Information include: a) secured files; b) user authentication; c) encryption; d) firewall technology; and e) the use of detection software.
We are responsible for and must: a) identify information to be protected; b) provide an adequate level of protection for that data; c) grant access to protected data only to those people who must use it in the performance of their job-related duties.
Employees who violate our Privacy Policy will be subject to discipline, which may include ending their employment with us.
At the start of our business relationship, we will give You a copy of our current Privacy Policy.
We will also give You a copy of our current Privacy Policy once a year if You maintain a continuing business relationship with us.
We will continue to follow our Privacy Policy regarding Personal Information even when a business relationship no longer exists between us.
|
As used in this Privacy Notice:
Application means your request for our product or service.
Personal Financial Information means financial information such as: a) credit history; b) income; c) financial benefits; or d) policy or claim information.
Personal Health Information means health information such as: a) your medical records; or b) information about your illness, disability or injury.
Personal Information means information that identifies You personally and is not otherwise available to the public. It includes: a) Personal Financial Information; and b) Personal Health Information.
Transaction means your business dealings with us, such as: a) your Application; b) your request for us to pay a claim; and c) your request for us to take an action on your account.
You means an individual who has given us Personal Information in conjunction with: a) asking about; b) applying for; or c) obtaining; a financial product or service from us if the product or service is used mainly for personal, family, or household purposes. |
This Privacy Policy is being provided on behalf of the following affiliates of The Hartford Financial Services Group, Inc.:
1stAGChoice, Inc.; Access CoverageCorp, Inc.; Access CoverageCorp Technologies, Inc.; American Maturity Life Insurance Company; Archway 60 R, LLC; Business Management Group, Inc.; Champlain Life Reinsurance Company; DMS R, LLC; Eloy R, LLC; Ersatz Corporation; First State Insurance Company; Hartford Accident and Indemnity Company; Hartford Administrative Services Company; Hartford Casualty General Agency, Inc.; Hartford Casualty Insurance Company; Hartford-Comprehensive Employee Benefit Service Company; Hartford Equity Sales Company, Inc.; Hartford Fire General Agency, Inc.; Hartford Fire Insurance Company; Hartford Funds Management Company, LLC; Hartford Funds Management Group, Inc.; Hartford HLS Series Fund II, Inc.; Hartford Insurance Company of Illinois; Hartford Insurance Company of the Midwest; Hartford Insurance Company of the Southeast; Hartford Integrated Technologies, Inc.; Hartford International Life Reassurance Corporation; Hartford Funds Distributors, LLC; Hartford Investment Management Company; Hartford Life and Accident Insurance Company; Hartford Life and Annuity Insurance Company; Hartford Life Insurance Company; Hartford Life Private Placement, LLC; Hartford Lloyd’s Corporation; Hartford Lloyd’s Insurance Company; Hartford Mezzanine Investors I, LLC; Hartford Residual Market, L.C.C.; Hartford Retirement Services, LLC; Hartford Securities Distribution Company, Inc.; Hartford Series Fund, Inc.; Hartford Specialty Insurance Services of Texas, LLC; Hartford Strategic Investments, LLC; Hartford Underwriters Insurance Company; Hartford Technology Services Company, L.L.C.; Hartford of Texas General Agency, Inc.; Hartford Underwriters General Agency, Inc.; HARTRE Company, L.C.C.; HL Investment Advisors, LLC; HLA LLC; Horizon Management Group, LLC; HRA Brokerage Services, Inc.; Lanidex Class B, LLC; M-CAP Insurance Agency, LLC; New England Insurance Company; New England Reinsurance Corporation; Nutmeg Insurance Agency, Inc.; Nutmeg Insurance Company; Pacific Insurance Company, Limited; Planco, LLC: Property and Casualty Insurance Company of Hartford; Revere R, LLC; RVR R, LLC; Sentinel Insurance Company, Ltd.; Sunstone R, LLC; Symphony R, LLC; The Evergreen Group Incorporated; The Hartford Alternative Strategies Fund; The Hartford Mutual Funds, Inc.; The Hartford Mutual Funds II, Inc.; Trumbull Flood Management, L.L.C.; Trumbull Insurance Company; Twin City Fire Insurance Company; White River Life Reinsurance Company.
HPP Revised January 2014
HARTFORDFUNDS
hartfordfunds.com
This information is written in connection with the promotion or marketing of the matter(s) addressed in this material.
This report is submitted for the general information of the shareholders of the Fund. It is not authorized for distribution unless preceded or accompanied by a current prospectus for the Fund.
The information cannot be used or relied upon for the purpose of avoiding IRS penalties. These materials are not intended to provide tax, accounting or legal advice. As with all matters of a tax or legal nature, you should consult your own tax or legal counsel for advice.
Investors should carefully consider the investment objectives, risks, charges, and expenses of Hartford Funds before investing. This and other information can be found in the prospectus and summary prospectus, which can be obtained by calling 888-843-7824 (retail) or 800-279-1541 (institutional). Investors should read them carefully before they invest.
Hartford Funds are underwritten and distributed by Hartford Funds Distributors, LLC.
MFAR-MAI14 12/14 116927 Printed in U.S.A.
HARTFORDFUNDS
|
THE HARTFORD MUNICIPAL
OPPORTUNITIES FUND
2014 Annual Report |
A MESSAGE FROM THE PRESIDENT
Dear Fellow Shareholders:
Thank you for investing in Hartford Funds.
Market Review
U.S. equities (as represented by the S&P 500 Index) rose steadily for the fiscal year ended October 31, 2014, with a return of 17.27% for the period. With the exception of short-lived geopolitical scares early in 2014 and concerns about continuing global growth near the end of the period, stocks generally rose on solid fundamentals and encouraging macroeconomic data during the year.
September 2014 marked the six-year anniversary of the start of the financial crisis. Within weeks of that anniversary, both the S&P 500 Index and the Dow Jones Industrial Average set new all-time highs, closing at 2,018 and 17,391, respectively, on October 31. Although the fallout of the crisis continues to influence investor behavior, stocks have recovered and risen dramatically, up 198% from their low in March 2009. Meanwhile, the domestic economy is notching strong growth, and the unemployment rate has reached its lowest level since August 2008.
While the U.S. economy appears to have stabilized and to have reverted to a solid growth path, the outlook for the global economy appears to have gotten cloudier. The U.S. Federal Reserve has ended quantitative easing, while Europe and Japan are pursuing stimulus options to avoid a double-dip recession and deflation, respectively. Diverging central-bank policies will likely continue to play an important role in market movements going forward as investors wait to see the reactions to their efforts and their impacts on global markets.
How have market movements impacted your portfolio throughout the last year? Are your investments still on track to provide the growth or income you need, and are you comfortable with their progress during times of volatility?
Your financial professional can help you navigate today’s markets with confidence, as well as assist you to achieve your investment goals by providing advice on the best options within our fund family to help you work toward overcoming today’s investing challenges. Meet with your financial advisor regularly to examine your portfolio and your investment strategy, and to determine if you’re still on track to meet your goals.
Thank you again for investing with Hartford Funds.
James Davey
President
Hartford Funds
1 The S&P 500 Index is a market capitalization-weighted price index composed of 500 widely held common stocks.
2 The Dow Jones Industrial Average is an unmanaged, price-weighted index of 30 of the largest, most widely held stocks traded on the NYSE
The Hartford Municipal Opportunities Fund
Table of Contents
The views expressed in the Fund’s Manager Discussion under ‘‘Why did the Fund perform this way?’’ and ‘‘What is the outlook?’’ are views of the Fund’s sub-adviser and portfolio management team through the end of the period and are subject to change based on market and other conditions. The Fund’s Manager Discussion is for informational purposes only and does not represent an offer, recommendation or solicitation to buy, hold or sell any security. The specific securities identified and described, if any, do not represent all of the securities purchased or sold and you should not assume that investments in the securities identified and discussed will be profitable.
| The Hartford Municipal Opportunities Fund inception 05/31/2007 |
| (sub-advised by Wellington Management Company, LLP) |
| Investment objective – The Fund seeks to provide current income that is generally exempt from federal income taxes and long-term total return. |
Performance Overview 5/31/07-10/31/14
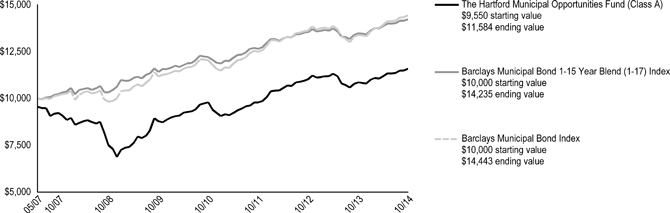
The chart above represents the hypothetical growth of a $10,000 investment in Class A, which includes a sales charge. Growth results in classes other than class A will vary from what is seen above due to differences in the expenses charged to those share classes.
Average Annual Total Returns (as of 10/31/14)
| 1 Year | 5 Years | Since Inception▲ | ||||||||||
| Municipal Opportunities A# | 6.70 | % | 5.70 | % | 2.64 | % | ||||||
| Municipal Opportunities A## | 1.90 | % | 4.73 | % | 2.00 | % | ||||||
| Municipal Opportunities B# | 6.04 | % | 4.93 | % | 1.85 | % | ||||||
| Municipal Opportunities B## | 1.04 | % | 4.60 | % | 1.85 | % | ||||||
| Municipal Opportunities C# | 6.03 | % | 4.93 | % | 1.88 | % | ||||||
| Municipal Opportunities C## | 5.03 | % | 4.93 | % | 1.88 | % | ||||||
| Municipal Opportunities I# | 7.08 | % | 5.97 | % | 2.91 | % | ||||||
| Barclays Municipal Bond 1-15 Year Blend (1-17) Index | 5.56 | % | 4.48 | % | 4.87 | % | ||||||
| Barclays Municipal Bond Index | 7.82 | % | 5.26 | % | 5.08 | % | ||||||
| ▲ | Inception: 05/31/2007 |
| # | Without sales charge |
| ## | With sales charge |
PERFORMANCE DATA QUOTED REPRESENTS PAST PERFORMANCE AND DOES NOT GUARANTEE FUTURE RESULTS. The investment return and principal value of the investment will fluctuate so that investors’ shares, when redeemed, may be worth more or less than their original cost. Current performance may be lower or higher than the performance data quoted. To obtain performance data current to the most recent month-end, please visit our website www.hartfordfunds.com.
The initial investment in Class A shares reflects the maximum sales charge of 4.50% and returns for Class B shares reflect a contingent deferred sales charge of up to 5.00% and declining to zero, depending on the period of time the shares are held. Returns for Class C shares reflect a contingent deferred sales charge of up to 1.00% on shares redeemed within twelve months of purchase.
Total returns presented above were calculated using the Fund’s net asset value available to shareholders for sale or redemption of Fund shares on October 31, 2014, which may exclude investment transactions as of this date. All share class returns assume the reinvestment of all distributions at net asset value and the deduction of all fund expenses.
Effective 9/30/09, Class B shares of the Fund were closed to new investments.
Performance information includes performance under the Fund’s previous sub-adviser, Hartford Investment Management Company, using a modified investment strategy. As of March 5, 2012, Hartford Investment Management Company no longer served as the sub-adviser to the Fund.
Barclays Municipal Bond 1-15 Year Blend (1-17) Index is a sub-index of the Barclays Municipal Bond Index. It is a rules-based market value-weighted index of bonds with maturities of one year to 17 years engineered for the tax-exempt bond market.
Barclays Municipal Bond Index is an unmanaged index of municipal bonds with maturities greater than two years.
The Fund has changed its benchmark from the Barclays Municipal Bond Index to the Barclays Municipal Bond 1-15 Year Blend (1-17) Index because the Fund’s investment manager believes that the Barclays Municipal Bond 1-15 Year Blend (1-17) Index better reflects the Fund’s investment strategy.
You cannot invest directly in an index.
The chart and table do not reflect the deductions of taxes that a shareholder would pay on Fund distributions or the redemption of Fund shares.
Performance information may reflect historical or current expense waivers/reimbursements from the investment adviser, without which performance would have been lower. For information on current expense waivers/reimbursements, please see the prospectus.
| 2 |
| The Hartford Municipal Opportunities Fund |
| Manager Discussion |
| October 31, 2014 (Unaudited) |
| Operating Expenses* | ||||||||
| Net | Gross | |||||||
| Municipal Opportunities Class A | 0.92 | % | 0.92 | % | ||||
| Municipal Opportunities Class B | 1.67 | % | 1.73 | % | ||||
| Municipal Opportunities Class C | 1.67 | % | 1.67 | % | ||||
| Municipal Opportunities Class I | 0.67 | % | 0.67 | % | ||||
| * |
As shown in the Fund's current prospectus dated March 1, 2014. Actual expenses may be higher or lower. Please see accompanying Financial Highlights for expense ratios for the year ended October 31, 2014. |
Gross expenses are the Fund's total annual operating expenses shown in the Fund's most recent prospectus. Net expenses are the Fund's total annual operating expenses shown in the Fund's most recent prospectus and reflect contractual expense reimbursements in instances when these reductions reduce the Fund's gross expenses. Contractual reimbursements remain in effect until February 28, 2015, and automatically renew for one-year terms unless terminated.
All investments are subject to risk including the possible loss of principal. For a discussion of the Fund’s risks, please see the Main Risks section of this report. For more detailed information on the risks associated with an investment in the Fund, please see the prospectus.
| Portfolio Managers | |
| Timothy D. Haney, CFA | Brad W. Libby |
| Senior Vice President and Fixed Income Portfolio Manager | Vice President and Fixed Income Credit Analyst |
How did the Fund perform?
The Class A shares of The Hartford Municipal Opportunities Fund returned 6.70%, before sales charge, for the twelve-month period ended October 31, 2014, outperforming the Fund’s benchmark, the Barclays Municipal Bond 1-15 Year Blend (1-17) Index, which returned 5.56% for the same period. The Fund also outperformed the 5.43% average return of the Lipper Intermediate Municipal Debt Funds peer group, a group of funds with investment strategies similar to those of the Fund.
Why did the Fund perform this way?
Fixed income markets gained throughout much of the period as expectations of prolonged easy monetary policy by major central banks and a supportive macroeconomic environment kept rates low and suppressed volatility. Early in the period emerging markets dominated headlines as economic and political developments sparked risk aversion across global markets, pushing bond prices higher and yields lower amid a flight to quality. Toward the end of the period, however, persistent geopolitical risks – tensions between Ukraine and Russia and violence in Iraq – and Chinese economic slowdown concerns raised questions about the global growth rate, keeping a lid on risk appetites overall.
The period was also highlighted by a divergence in central bank policies. The European Central Bank (ECB) cut its benchmark lending and deposit rates and announced a host of stimulus measures in an effort to encourage lending and fend off fears of deflation. China’s central bank joined the ECB in boosting liquidity by injecting funds into the nation’s largest banks in an attempt to combat weakening growth. The Bank of Japan pre-emptively announced incremental monetary easing to counter the risk of missing the country’s inflation and growth targets. In contrast, the Bank of England and U.S. Federal Reserve (Fed) leaned toward tighter policies. The Fed ended its quantitative easing program as U.S. data largely suggested the economy was on a sustainable growth path. Second quarter Gross Domestic Product (GDP) rebounded after the first quarter’s steep contraction. The labor market strengthened as the unemployment rate dropped to a six-year low. Housing regained some lost ground after a weak start to the year, though the pace of home price appreciation started to slow after a strong 2013. Inflation pressures were muted overall, alleviating pressure on the Fed to raise rates.
The U.S. Treasury curve flattened as markets contemplated bringing interest rates to normal levels; short-term yields rose while longer term rates declined. Most credit risk sectors posted positive absolute returns and outperformed duration-equivalent government bonds as credit spreads tightened.
The yield on 10-year AAA general obligations (GOs) remained inside of 10-year Treasuries throughout the twelve month period, as the GO-to-Treasury yield ratio fell from 96% to 89%. Municipal issuance has remained slow, which continues to create a positive technical market environment as demand for municipal bonds is strong. Municipal credit spreads continued to tighten over the period, but remained attractive relative to corporates on an after-tax basis.
The Fund’s security selection within investment grade revenue bonds was the primary driver of relative outperformance during the period, largely due to selection within the lease and sales tax sectors. Duration and yield curve positioning also contributed to benchmark-relative outperformance, largely due to our relative overweights to the long end (20-30 year) of the curve while long rates came down over the period. Our allocation to high yield revenue bonds (roughly 20% of the Fund over the period) was also additive.
Derivatives are not used in a significant manner in this Fund and did not have a material impact on performance during the period.
What is the outlook?
We expect U.S. economic momentum to be positive. In our view, the global growth outlook is improving, but increasing instability around the world poses a risk. We expect a slow increase in rates as the
| 3 |
| The Hartford Municipal Opportunities Fund |
| Manager Discussion – (continued) |
| October 31, 2014 (Unaudited) |
Fed moves policy and ended the period with a moderately procyclical risk posture. Credit repair continues at the state level and state tax collections are back to pre-recession levels in real terms. Pension and health care costs are projected to absorb almost all of the expected revenue growth of local governments which will continue to pressure municipal budgets. We expect revenue bond fundamentals to remain positive in the near-to medium-term and continue to favor credits in this area, especially special-tax, toll-road, airport, and health care.
Credit Exposure
as of October 31, 2014
| Credit Rating * | Percentage of Net Assets | |||
| Aaa/ AAA | 4.2 | % | ||
| Aa/ AA | 26.0 | |||
| A | 35.7 | |||
| Baa/ BBB | 11.3 | |||
| Ba/ BB | 3.6 | |||
| B | 3.4 | |||
| Not Rated | 11.4 | |||
| Short-Term Instruments | 5.4 | |||
| Other Assets and Liabilities | (1.1 | ) | ||
| Total | 100.0 | % | ||
| * | Credit exposure is the long-term credit ratings for the Fund's holdings, as of the date noted, as provided by Standard and Poor's (S&P) or Moody's Investors Service (Moody's) and typically range from AAA/Aaa (highest) to C/D (lowest). Presentation of S&P and Moody's credit ratings in this report have been selected for informational purposes for shareholders, as well as the Fund's consideration of industry practice. If Moody's and S&P assign different ratings, the lower rating is used. Fixed income securities that are not rated by either agency are listed as "Not Rated." Ratings do not apply to the Fund itself or to the Fund's shares. Ratings may change. |
Diversification by Industry
as of October 31, 2014
| Industry | Percentage of Net Assets | |||
| Airport Revenues | 8.3 | % | ||
| General Obligations | 16.3 | |||
| Health Care/Services | 17.2 | |||
| Higher Education (Univ., Dorms, etc.) | 7.2 | |||
| Housing (HFA'S, etc.) | 1.4 | |||
| Industrial | 3.8 | |||
| Miscellaneous | 9.8 | |||
| Pre-Refunded | 4.9 | |||
| Public Facilities | 3.0 | |||
| Special Tax Assessment | 2.4 | |||
| Tax Allocation | 7.8 | |||
| Transportation | 6.3 | |||
| Utilities - Combined | 0.4 | |||
| Utilities - Electric | 3.5 | |||
| Utilities - Gas | 0.7 | |||
| Utilities - Water and Sewer | 2.5 | |||
| Waste Disposal | 0.2 | |||
| Short-Term Investments | 5.4 | |||
| Other Assets and Liabilities | (1.1 | ) | ||
| Total | 100.0 | % | ||
For Fund compliance purposes, the Fund may use the same classification system; these classifications are used for reporting ease.
| 4 |
| The Hartford Municipal Opportunities Fund |
| Schedule of Investments |
| October 31, 2014 |
| (000’s Omitted) |
| Shares or Principal Amount | Market Value ╪ | |||||||
| Municipal Bonds - 95.7% | ||||||||
| Alabama - 1.5% | ||||||||
| Birmingham, AL, Baptist Medical Center Special Care Fac | ||||||||
| $ | 1,855 | 5.25%, 11/15/2016 | $ | 1,937 | ||||
| Jefferson County, AL, Sewer Rev | ||||||||
| 2,000 | 5.00%, 10/01/2017 | 2,171 | ||||||
| Mobile, AL, Industrial Development Board Pollution | ||||||||
| 1,540 | 1.65%, 06/01/2034 | 1,568 | ||||||
| 5,676 | ||||||||
| Arizona - 1.4% | ||||||||
| Estrella Mountain Ranch, AZ, Community Fac Dist GO | ||||||||
| 265 | 6.20%, 07/15/2032 | 279 | ||||||
| Pima County, AZ, IDA Education Rev, Legacy Traditional Charter School | ||||||||
| 1,435 | 8.50%, 07/01/2039 | 1,629 | ||||||
| Salt River, AZ, Agricultural Improvement | ||||||||
| 3,000 | 5.00%, 12/01/2027 | 3,586 | ||||||
| 5,494 | ||||||||
| California - 12.8% | ||||||||
| Bay Area, CA, Toll Auth Bridge Rev | ||||||||
| 1,450 | 1.50%, 04/01/2047 Δ | 1,469 | ||||||
| California County, CA, Tobacco Securitization | ||||||||
| 1,000 | 5.00%, 06/01/2022 | 1,163 | ||||||
| California State Communities DA Rev | ||||||||
| 955 | 0.94%, 04/01/2036 Δ | 831 | ||||||
| 1,000 | 5.63%, 10/01/2032 | 1,068 | ||||||
| California State GO | ||||||||
| 4,985 | 6.50%, 04/01/2033 | 6,092 | ||||||
| California State Health Facilities | ||||||||
| 1,500 | 6.00%, 07/01/2029 | 1,772 | ||||||
| California State Public Works Board, Correctional Facilities Improvement | ||||||||
| 1,000 | 6.00%, 03/01/2035 | 1,188 | ||||||
| California State Public Works Board, Lease Rev | ||||||||
| 2,000 | 5.25%, 10/01/2023 | 2,442 | ||||||
| California State Public Works Board, State University Trustees | ||||||||
| 2,000 | 6.25%, 04/01/2034 | 2,372 | ||||||
| Foothill-Eastern Transportation Corridor Agency | ||||||||
| 660 | 5.00%, 01/15/2053 Δ | 721 | ||||||
| Irvine, CA, Improvement Bond Act | ||||||||
| 1,065 | 4.00%, 09/02/2016 | 1,120 | ||||||
| Long Beach, CA, FA Natural Gas | ||||||||
| 425 | 1.61%, 11/15/2027 Δ | 392 | ||||||
| Oakland, CA, Airport Rev | ||||||||
| 1,000 | 5.00%, 05/01/2026 | 1,134 | ||||||
| Port of Oakland, CA | ||||||||
| 1,485 | 5.00%, 05/01/2021 - 05/01/2023 | 1,757 | ||||||
| Rancho Cucamonga, CA, Redev Agency Tax | ||||||||
| 1,000 | 5.00%, 09/01/2029 | 1,169 | ||||||
| San Bernardino, CA, USD GO | ||||||||
| 1,150 | 5.00%, 08/01/2021 | 1,372 | ||||||
| San Buenaventura, CA, Community Memorial Health System | ||||||||
| 1,000 | 7.50%, 12/01/2041 | 1,208 | ||||||
| San Diego, CA, Redev Agency Tax Allocation | ||||||||
| 3,000 | 7.00%, 11/01/2039 | 3,597 | ||||||
| San Joaquin Hills, CA, Transporation Auth | ||||||||
| 875 | 5.00%, 01/15/2029 ☼ | 980 | ||||||
| San Jose, CA, Redev Agency | ||||||||
| 2,575 | 5.00%, 08/01/2022 | 2,772 | ||||||
| 500 | 6.50%, 08/01/2023 | 565 | ||||||
| San Mateo Joint Powers Financing Auth | ||||||||
| 2,500 | 5.00%, 06/15/2029 - 06/15/2030 | 2,948 | ||||||
| Santa Cruz County, CA, Redev Agency | ||||||||
| 1,250 | 5.00%, 09/01/2024 | 1,511 | ||||||
| 1,335 | 6.63%, 09/01/2029 | 1,567 | ||||||
| Santa Margarita, CA, Water Dist Special Tax | ||||||||
| 500 | 4.25%, 09/01/2021 | 525 | ||||||
| 2,130 | 5.00%, 09/01/2022 - 09/01/2028 | 2,388 | ||||||
| Successor Agy to the Richmond County Redev Agency | ||||||||
| 640 | 4.00%, 09/01/2016 | 676 | ||||||
| Twin Rivers, CA, Unif School Dist Cops | ||||||||
| 3,000 | 3.45%, 07/01/2037 | 3,005 | ||||||
| University of California | ||||||||
| 1,595 | 5.00%, 05/15/2025 | 1,965 | ||||||
| 49,769 | ||||||||
| Colorado - 0.3% | ||||||||
| Denver, CO, City and County Special Fac Airport Rev | ||||||||
| 1,000 | 5.00%, 11/15/2018 | 1,151 | ||||||
| Connecticut - 1.6% | ||||||||
| City of New Haven, CT, GO | ||||||||
| 2,600 | 5.00%, 08/01/2024 | 3,090 | ||||||
| Connecticut Housing FA | ||||||||
| 1,000 | 4.00%, 11/15/2044 ‡ | 1,093 | ||||||
| Hartford, CT, GO | ||||||||
| 1,850 | 5.00%, 04/01/2026 | 2,147 | ||||||
| 6,330 | ||||||||
| District of Columbia - 0.7% | ||||||||
| Metropolitan Washington, DC, Airport Auth System Rev | ||||||||
| 1,450 | 5.00%, 10/01/2022 | 1,724 | ||||||
| Washington, DC, Metropolitan Airport Auth System Rev | ||||||||
| 1,000 | 5.00%, 10/01/2020 | 1,174 | ||||||
| 2,898 | ||||||||
| Florida - 7.9% | ||||||||
| Arlington of Naples | ||||||||
| 500 | 6.50%, 05/15/2020 ■ | 502 | ||||||
| 500 | 7.00%, 05/15/2024 ■ | 551 | ||||||
| Florida Village Community Development Dist No 8 | ||||||||
| 2,225 | 6.38%, 05/01/2038 | 2,520 | ||||||
| Greater Orlando, FL, Aviation Auth | ||||||||
| 4,340 | 5.00%, 10/01/2021 - 10/01/2024 | 5,095 | ||||||
| Highlands County, FL, Adventist Health (Prerefunded with US Gov't Securities) | ||||||||
| 125 | 5.25%, 11/15/2036 | 137 | ||||||
| Highlands County, FL, Health Fac Auth | ||||||||
| 1,905 | 5.25%, 11/15/2036 | 2,020 | ||||||
| Jacksonville, FL, Econ Development Commission Obligor: Florida Proton Therapy Institute, Inc | ||||||||
| 2,000 | 6.25%, 09/01/2027 | 2,177 | ||||||
| Jacksonville, FL, Sales Tax Rev | ||||||||
| 2,700 | 5.00%, 10/01/2021 | 3,243 | ||||||
| Lake County, FL, School Board | ||||||||
| 2,000 | 5.00%, 06/01/2026 | 2,338 | ||||||
The accompanying notes are an integral part of these financial statements.
| 5 |
| The Hartford Municipal Opportunities Fund |
| Schedule of Investments – (continued) |
|
October 31, 2014 |
| (000’s Omitted) |
| Shares or Principal Amount | Market Value ╪ | |||||||
| Municipal Bonds - 95.7% - (continued) | ||||||||
| Florida - 7.9% - (continued) | ||||||||
| Lakeland, FL, Retirement Community Rev | ||||||||
| $ | 1,750 | 6.38%, 01/01/2043 | $ | 1,819 | ||||
| Lee County, FL, School Board | ||||||||
| 1,000 | 4.00%, 08/01/2016 | 1,060 | ||||||
| Magnolia Creek, FL, Community Development Dist Capital Improvement | ||||||||
| 500 | 0.00%, 05/01/2039 ● | 175 | ||||||
| Miami-Dade County, FL, Aviation Rev | ||||||||
| 3,500 | 5.00%, 10/01/2024 - 10/01/2026 | 4,000 | ||||||
| Orange County, FL, School Board | ||||||||
| 2,130 | 5.00%, 08/01/2026 | 2,448 | ||||||
| Palm Beach County, FL, Health System | ||||||||
| 1,000 | 6.75%, 06/01/2024 | 1,136 | ||||||
| River Bend Community Development Dist, Capital Improvement Rev | ||||||||
| 1,560 | 0.00%, 11/01/2015 ● | 201 | ||||||
| Village, FL, Community Development Dist #11 | ||||||||
| 500 | 3.25%, 05/01/2019 ☼ | 500 | ||||||
| Volusia County, FL, School Board | ||||||||
| 775 | 5.00%, 08/01/2025 | 927 | ||||||
| 30,849 | ||||||||
| Georgia - 1.4% | ||||||||
| Clayton County, GA, DA | ||||||||
| 1,965 | 9.00%, 06/01/2035 | 2,031 | ||||||
| Dekalb Newton and Gwinnett Counties, GA, Joint DA | ||||||||
| 1,500 | 6.00%, 07/01/2034 | 1,718 | ||||||
| Marietta, GA, DA Life University, Inc. Proj | ||||||||
| 1,500 | 7.00%, 06/15/2030 | 1,590 | ||||||
| 5,339 | ||||||||
| Hawaii - 0.3% | ||||||||
| Hawaii State Dept of Transportation | ||||||||
| 1,000 | 5.00%, 08/01/2022 | 1,180 | ||||||
| Idaho - 0.3% | ||||||||
| Idaho State Helath Facilities Auth Rev | ||||||||
| 1,000 | 5.00%, 03/01/2032 | 1,128 | ||||||
| Illinois - 7.8% | ||||||||
| Aurora, IL, Tax Increment Rev | ||||||||
| 870 | 6.75%, 12/30/2027 | 957 | ||||||
| Chicago, IL, Board of Education | ||||||||
| 1,625 | 6.00%, 01/01/2020 | 1,827 | ||||||
| Chicago, IL, O'Hare International Airport Rev | ||||||||
| 345 | 5.00%, 01/01/2015 | 347 | ||||||
| 855 | 5.25%, 01/01/2027 | 858 | ||||||
| Chicago, IL, Park Dist, GO | ||||||||
| 2,750 | 5.00%, 01/01/2026 | 3,192 | ||||||
| City of Chicago, IL, GO | ||||||||
| 1,700 | 4.00%, 01/01/2018 | 1,772 | ||||||
| Hampshire, IL, Special Service Area #13, Tuscany Woods Proj | ||||||||
| 96 | 0.00%, 03/01/2037 ● | 55 | ||||||
| Illinois FA Rev, Art Institute of Chicago Ser A | ||||||||
| 1,400 | 6.00%, 03/01/2038 | 1,608 | ||||||
| Illinois FA Rev, Silver Cross Hospital and Medicine | ||||||||
| 3,000 | 5.50%, 08/15/2030 | 3,169 | ||||||
| Illinois Metropolitan Pier & Exposition Auth | ||||||||
| 4,000 | 4.32%, 12/15/2024 ○ | 2,819 | ||||||
| Illinois State FA Rev | ||||||||
| 1,250 | 7.75%, 08/15/2034 | 1,569 | ||||||
| Illinois State GO | ||||||||
| 3,000 | 5.00%, 01/01/2022 - 08/01/2025 | 3,271 | ||||||
| 1,500 | 5.25%, 01/01/2021 | 1,708 | ||||||
| Illinois State Sales Tax Rev | ||||||||
| 1,830 | 6.50%, 06/15/2022 | 2,131 | ||||||
| Illinois State Toll Highway Auth | ||||||||
| 2,000 | 5.00%, 01/01/2030 ☼ | 2,319 | ||||||
| Illinois State Unemployment Insurance Fund | ||||||||
| 2,500 | 5.00%, 06/15/2019 - 12/15/2019 | 2,573 | ||||||
| 30,175 | ||||||||
| Indiana - 1.4% | ||||||||
| Indiana State FA Hospital Rev | ||||||||
| 1,000 | 5.00%, 12/01/2029 | 1,174 | ||||||
| Indianapolis, IN Airport Auth Rev | ||||||||
| 1,000 | 5.00%, 01/01/2029 | 1,130 | ||||||
| Vigo County, IN, Hospital Auth | ||||||||
| 2,000 | 5.75%, 09/01/2042 ■ | 2,021 | ||||||
| Whiting, IN, Environmental Facilities Rev | ||||||||
| 1,000 | 1.85%, 06/01/2044 Δ | 1,006 | ||||||
| 5,331 | ||||||||
| Kansas - 0.3% | ||||||||
| Wyandotte County-Kansas City, KS | ||||||||
| 1,000 | 5.00%, 09/01/2025 | 1,191 | ||||||
| Kentucky - 1.0% | ||||||||
| Kentucky Public Transportation Inf Auth | ||||||||
| 350 | 5.00%, 07/01/2017 | 387 | ||||||
| Louisville & Jefferson County, KY | ||||||||
| 1,515 | 5.00%, 12/01/2023 | 1,776 | ||||||
| Louisville & Jefferson County, KY, Metropolitan | ||||||||
| 1,710 | 1.65%, 10/01/2033 Δ | 1,734 | ||||||
| 3,897 | ||||||||
| Louisiana - 1.4% | ||||||||
| Louisiana Tobacco Settlement Financing Corp. | ||||||||
| 2,500 | 5.00%, 05/15/2026 | 2,652 | ||||||
| New Orleans, LA, Aviation Board | ||||||||
| 2,500 | 6.00%, 01/01/2023 | 2,913 | ||||||
| 5,565 | ||||||||
| Maryland - 0.4% | ||||||||
| Westminster Maryland Rev | ||||||||
| 1,500 | 4.38%, 07/01/2021 | 1,537 | ||||||
| Massachusetts - 1.7% | ||||||||
| Massachusetts State Development Fin Agency Rev | ||||||||
| 1,200 | 8.00%, 04/15/2031 | 1,430 | ||||||
| Massachusetts State Health and Education Fac Auth | ||||||||
| 1,000 | 5.00%, 07/01/2016 | 1,031 | ||||||
| 2,355 | 8.00%, 10/01/2039 | 2,518 | ||||||
| Massachusetts State PA | ||||||||
| 455 | 4.00%, 07/01/2022 | 506 | ||||||
| 1,035 | 5.00%, 07/01/2021 - 07/01/2023 | 1,216 | ||||||
| 6,701 | ||||||||
| Michigan - 3.5% | ||||||||
| Kent, MI, Hospital FA | ||||||||
| 4,000 | 6.00%, 07/01/2035 | 4,110 | ||||||
| Michigan FA | ||||||||
| 4,350 | 5.00%, 07/01/2018 - 10/01/2030 | 4,910 | ||||||
The accompanying notes are an integral part of these financial statements.
| 6 |
| The Hartford Municipal Opportunities Fund |
| Schedule of Investments – (continued) |
|
October 31, 2014 |
|
(000’s Omitted) |
| Shares or Principal Amount | Market Value ╪ | |||||||
| Municipal Bonds - 95.7% - (continued) | ||||||||
| Michigan - 3.5% - (continued) | ||||||||
| Royal Oak, MI, Hospital FA | ||||||||
| $ | 2,000 | 8.25%, 09/01/2039 ‡ | $ | 2,556 | ||||
| Wayne County, MI, Airport Auth Rev | ||||||||
| 2,000 | 5.00%, 12/01/2015 - 12/01/2030 | 2,200 | ||||||
| 13,776 | ||||||||
| Mississippi - 0.8% | ||||||||
| Mississippi State Business Fin Corp. | ||||||||
| 3,000 | 1.63%, 12/01/2040 | 2,985 | ||||||
| Missouri - 1.0% | ||||||||
| Kirkwood, MO, Industrial DA Retirement Community | ||||||||
| 3,500 | 8.25%, 05/15/2045 | 4,040 | ||||||
| Nevada - 1.6% | ||||||||
| Clark County, NV, School Dist GO | ||||||||
| 1,625 | 5.00%, 06/15/2020 | 1,686 | ||||||
| Mesquite, NV, Special Improvement Dist 07-01 | ||||||||
| 440 | 6.00%, 08/01/2027 | 447 | ||||||
| Nevada State GO | ||||||||
| 2,500 | 5.00%, 08/01/2019 | 2,934 | ||||||
| Nevada State Natural Resources GO | ||||||||
| 1,110 | 5.00%, 03/01/2026 | 1,319 | ||||||
| 6,386 | ||||||||
| New Jersey - 3.6% | ||||||||
| New Jersey Health Care Facilities FA, Hospital Asset Transformation | ||||||||
| 2,855 | 5.75%, 10/01/2031 | 3,302 | ||||||
| New Jersey State Econ DA | ||||||||
| 1,510 | 4.88%, 09/15/2019 | 1,597 | ||||||
| 1,590 | 5.00%, 03/01/2023 | 1,796 | ||||||
| New Jersey State Educational FA Rev, University of Medicine & Dentistry | ||||||||
| 2,000 | 7.50%, 12/01/2032 | 2,563 | ||||||
| New Jersey State Interstate Turnpike Auth Rev | ||||||||
| 3,000 | 5.00%, 01/01/2025 ‡ | 3,536 | ||||||
| New Jersey State Transportation Trust FU | ||||||||
| 1,000 | 5.00%, 09/15/2017 | 1,105 | ||||||
| 13,899 | ||||||||
| New Mexico - 1.2% | ||||||||
| Los Alamos County, NM, Tax Improvement Rev | ||||||||
| 3,000 | 5.88%, 06/01/2027 | 3,530 | ||||||
| Montecito Estates, NM, Public Improvement Dist | ||||||||
| 905 | 7.00%, 10/01/2037 | 947 | ||||||
| 4,477 | ||||||||
| New York - 11.1% | ||||||||
| Liberty, NY, Corp. Development Goldman Sachs Headquarters | ||||||||
| 2,000 | 5.25%, 10/01/2035 | 2,371 | ||||||
| New York & New Jersey PA | ||||||||
| 2,000 | 5.00%, 12/01/2023 | 2,027 | ||||||
| New York City Housing Development Corp | ||||||||
| 940 | 4.50%, 11/15/2024 ■☼ | 957 | ||||||
| New York City, NY, Transitional FA Rev | ||||||||
| 5,000 | 5.00%, 08/01/2031 | 5,913 | ||||||
| New York Metropolitan Transportation Auth Rev | ||||||||
| 2,100 | 5.00%, 11/15/2020 | 2,502 | ||||||
| New York State Dormitory Auth Rev | ||||||||
| 5,640 | 5.00%, 03/15/2022 - 03/15/2030 | 6,632 | ||||||
| New York State Liberty Development Corp. Rev | ||||||||
| 1,535 | 5.15%, 11/15/2034 ■☼ | 1,561 | ||||||
| New York State Thruway Auth | ||||||||
| 3,250 | 5.00%, 01/01/2019 - 03/15/2021 | 3,797 | ||||||
| New York State Urban Development Corp. Rev | ||||||||
| 1,000 | 5.00%, 03/15/2026 | 1,191 | ||||||
| New York, NY, GO | ||||||||
| 4,000 | 6.25%, 10/15/2028 | 4,760 | ||||||
| New York, NY, IDA Terminal One Group Assoc Proj AMT | ||||||||
| 2,000 | 5.50%, 01/01/2024 | 2,104 | ||||||
| Newburth, NY, GO | ||||||||
| 1,145 | 5.00%, 06/15/2019 | 1,256 | ||||||
| Town of Oyster Bay, NY, GO | ||||||||
| 2,340 | 5.00%, 08/15/2024 | 2,780 | ||||||
| TSASC, Inc. | ||||||||
| 2,500 | 5.00%, 06/01/2034 | 2,078 | ||||||
| Ulster County, NY, Capital Resource Corp. Rev | ||||||||
| 940 | 3.72%, 09/15/2044 ■○ | 661 | ||||||
| Ulster County, NY, IDA Kingston Regional Senior Living | ||||||||
| 2,000 | 6.00%, 09/15/2042 | 1,758 | ||||||
| Yonkers, NY, GO | ||||||||
| 885 | 3.00%, 08/15/2019 | 930 | ||||||
| 43,278 | ||||||||
| North Carolina - 1.1% | ||||||||
| North Carolina Eastern Municipal Power | ||||||||
| 1,325 | 4.00%, 01/01/2020 | 1,469 | ||||||
| North Carolina Medical Care Commission Retirement FA Rev, First Mortgage Galloway Ridge | ||||||||
| 1,555 | 5.88%, 01/01/2031 | 1,742 | ||||||
| North Carolina State Medical Care Commission, Galloway Ridge, Inc. | ||||||||
| 1,000 | 6.00%, 01/01/2039 | 1,101 | ||||||
| 4,312 | ||||||||
| Ohio - 3.9% | ||||||||
| Allen County, OH, Hospital Fac Rev | ||||||||
| 2,000 | 5.00%, 05/01/2023 | 2,341 | ||||||
| Buckeye Tobacco Settlement FA | ||||||||
| 4,000 | 5.88%, 06/01/2047 | 3,160 | ||||||
| Buckeye, OH, Tobacco Settlement FA | ||||||||
| 4,580 | 6.00%, 06/01/2042 | 3,630 | ||||||
| Dayton, OH, City School Dist | ||||||||
| 2,000 | 5.00%, 11/01/2027 | 2,425 | ||||||
| Lancaster, OH, Gas Rev | ||||||||
| 2,275 | 0.70%, 02/01/2019 Δ | 2,286 | ||||||
| Ohio State Cultural Sports Fac Building Projects | ||||||||
| 1,235 | 5.00%, 04/01/2020 | 1,451 | ||||||
| 15,293 | ||||||||
| Oregon - 0.5% | ||||||||
| Port of Portland, Oregon Airport Rev | ||||||||
| 1,750 | 5.00%, 07/01/2031 - 07/01/2032 | 2,003 | ||||||
| Other U.S. Territories - 0.2% | ||||||||
| Puerto Rico Highway and Transportation Auth | ||||||||
| 705 | 4.95%, 07/01/2026 | 703 | ||||||
The accompanying notes are an integral part of these financial statements.
| 7 |
| The Hartford Municipal Opportunities Fund |
| Schedule of Investments – (continued) |
|
October 31, 2014 |
|
(000’s Omitted) |
| Shares or Principal Amount | Market Value ╪ | |||||||
| Municipal Bonds - 95.7% - (continued) | ||||||||
| Pennsylvania - 5.1% | ||||||||
| Allegheny County, PA, Industrial DA Charter School | ||||||||
| $ | 985 | 6.75%, 08/15/2035 | $ | 1,082 | ||||
| Montgomery County, PA, Higher Education and Health | ||||||||
| 1,165 | 5.00%, 10/01/2023 | 1,316 | ||||||
| Pennsylvania State GO | ||||||||
| 4,525 | 5.00%, 07/01/2021 | 5,426 | ||||||
| 1,000 | 7.00%, 07/15/2028 | 1,112 | ||||||
| Pennsylvania State IDA | ||||||||
| 2,250 | 5.00%, 07/01/2021 | 2,618 | ||||||
| Pennsylvania State Turnpike Commission Rev | ||||||||
| 575 | 0.93%, 12/01/2020 Δ | 579 | ||||||
| 575 | 1.03%, 12/01/2021 Δ | 581 | ||||||
| 1,335 | 6.00%, 06/01/2028 | 1,536 | ||||||
| Philadelphia, PA, Municipal Auth | ||||||||
| 750 | 6.38%, 04/01/2029 | 875 | ||||||
| 800 | 6.50%, 04/01/2034 | 926 | ||||||
| Pittsburgh, PA, School Dist GO | ||||||||
| 2,325 | 5.00%, 09/01/2021 - 09/01/2023 | 2,716 | ||||||
| Susquehanna, PA, Regional Airport Auth System Rev | ||||||||
| 1,000 | 5.00%, 01/01/2019 | 1,096 | ||||||
| 19,863 | ||||||||
| Rhode Island - 1.3% | ||||||||
| Cranston, RI, GO | ||||||||
| 1,415 | 5.00%, 07/01/2019 | 1,616 | ||||||
| Rhode Island State & Providence Plantations | ||||||||
| 1,500 | 4.00%, 10/01/2018 | 1,654 | ||||||
| Rhode Island State Health & Educational Bldg Corp. | ||||||||
| 1,655 | 4.00%, 05/15/2017 | 1,761 | ||||||
| 5,031 | ||||||||
| South Carolina - 0.1% | ||||||||
| Lancaster County, SC, Sun City Assessment | ||||||||
| 1,987 | 0.00%, 11/01/2017 ● | 397 | ||||||
| South Dakota - 0.6% | ||||||||
| South Dakota State Education Enhancement | ||||||||
| 1,000 | 5.00%, 06/01/2026 | 1,114 | ||||||
| South Dakota State Health & Educational FA | ||||||||
| 1,000 | 5.00%, 11/01/2029 | 1,161 | ||||||
| South Dakota State Housing DA | ||||||||
| 185 | 6.13%, 05/01/2033 | 185 | ||||||
| 2,460 | ||||||||
| Texas - 8.8% | ||||||||
| Arlington, TX, Higher Education Fin | ||||||||
| 1,000 | 5.00%, 08/15/2027 | 1,194 | ||||||
| Barbers Hill Ind School Dist, GO | ||||||||
| 2,875 | 5.00%, 02/15/2026 ☼ | 3,528 | ||||||
| Brazos Harbor, TX, Industrial Development Corp. | ||||||||
| 1,500 | 5.90%, 05/01/2038 | 1,632 | ||||||
| Dallas, TX, Ind School Dist GO | ||||||||
| 1,350 | 5.00%, 08/15/2034 ‡ | 1,396 | ||||||
| Dallas-Fort Worth, TX, International Airport Fac Improvement Corp. | ||||||||
| 2,000 | 6.15%, 01/01/2016 | 2,037 | ||||||
| El Paso, TX, ISD, GO | ||||||||
| 2,860 | 5.00%, 08/15/2026 | 3,170 | ||||||
| Lower Colorado River, TX, Auth Rev | ||||||||
| 55 | 7.25%, 05/15/2037 | 57 | ||||||
| North East TX ISD, GO | ||||||||
| 1,000 | 5.00%, 08/01/2028 | 1,197 | ||||||
| North Texas Tollway Auth Rev | ||||||||
| 2,995 | 5.00%, 01/01/2022 | 3,504 | ||||||
| San Antonio, TX, Airport System Rev | ||||||||
| 1,985 | 5.00%, 07/01/2023 | 2,309 | ||||||
| San Antonio, TX, Water Rev | ||||||||
| 2,200 | 5.00%, 05/15/2026 | 2,648 | ||||||
| Texas State Public FA Charter School | ||||||||
| 3,555 | 5.38%, 02/15/2037 | 3,606 | ||||||
| Texas State Transportation Commission | ||||||||
| 1,500 | 0.39%, 04/01/2032 ‡Δ | 1,503 | ||||||
| Travis County, TX, Health Fac Development | ||||||||
| 2,000 | 7.13%, 11/01/2040 | 2,317 | ||||||
| Travis County, TX, Health Fac, Querencia Barton Creek Project | ||||||||
| 600 | 5.65%, 11/15/2035 | 607 | ||||||
| Wylie, TX, ISD, GO | ||||||||
| 3,500 | 1.55%, 08/15/2018 ○‡ | 3,352 | ||||||
| 34,057 | ||||||||
| Vermont - 0.2% | ||||||||
| Vermont State Econ DA Waste | ||||||||
| 900 | 4.75%, 04/01/2036 ■ | 926 | ||||||
| Virginia - 2.1% | ||||||||
| Norfolk, VA, Redev & Housing Auth Rev Obligor: Fort Norfolk Retirement Community, Inc. | ||||||||
| 1,005 | 6.13%, 01/01/2035 | 1,008 | ||||||
| Virginia Public Building Auth | ||||||||
| 4,000 | 5.00%, 08/01/2023 | 4,918 | ||||||
| Washington County, VA, Industrial DA Hospital | ||||||||
| 1,750 | 7.75%, 07/01/2038 | 2,057 | ||||||
| 7,983 | ||||||||
| Washington - 3.4% | ||||||||
| Grant County, WA, Utility Dist #2 | ||||||||
| 3,730 | 5.00%, 01/01/2022 - 01/01/2023 | 4,417 | ||||||
| Washington State Health Care Fac Auth | ||||||||
| 500 | 4.00%, 11/15/2015 | 519 | ||||||
| 3,650 | 5.00%, 03/01/2029 - 10/01/2042 | 4,262 | ||||||
| Washington State Health Care Fac Auth, VA Mason Medical | ||||||||
| 3,600 | 6.13%, 08/15/2037 | 3,962 | ||||||
| 13,160 | ||||||||
| West Virginia - 0.5% | ||||||||
| West Virginia State Hospital FA | ||||||||
| 1,900 | 9.13%, 10/01/2041 | 2,028 | ||||||
| Wisconsin - 2.9% | ||||||||
| Milwaukee County, WI, Airport Rev | ||||||||
| 1,790 | 5.00%, 12/01/2025 ☼ | 2,077 | ||||||
| Wisconsin Health and Educational Fac, Iowa Health System Obligated Group | ||||||||
| 1,700 | 5.00%, 12/01/2028 | 2,001 | ||||||
| Wisconsin State GO | ||||||||
| 2,685 | 5.75%, 05/01/2033 | 3,166 | ||||||
| 1,295 | 6.00%, 05/01/2036 | 1,535 | ||||||
The accompanying notes are an integral part of these financial statements.
| 8 |
| The Hartford Municipal Opportunities Fund |
| Schedule of Investments – (continued) |
|
October 31, 2014 |
| (000’s Omitted) |
| Shares or Principal Amount | Market Value ╪ | |||||||||||
| Municipal Bonds - 95.7% - (continued) | ||||||||||||
| Wisconsin - 2.9% - (continued) | ||||||||||||
| Wisconsin State Health and Educational Fac Auth Rev | ||||||||||||
| $ | 2,465 | 5.25%, 08/15/2024 | $ | 2,596 | ||||||||
| 11,375 | ||||||||||||
| Total Municipal Bonds | ||||||||||||
| (Cost $355,121) | $ | 372,643 | ||||||||||
| Total Long-Term Investments | ||||||||||||
| (Cost $355,121) | $ | 372,643 | ||||||||||
| Short-Term Investments - 5.4% | ||||||||||||
| Other Investment Pools and Funds - 5.4% | ||||||||||||
| 20,912 | JP Morgan Tax Free Money Market Fund | $ | 20,912 | |||||||||
| Total Short-Term Investments | ||||||||||||
| (Cost $20,912) | $ | 20,912 | ||||||||||
| Total Investments | ||||||||||||
| (Cost $376,033) ▲ | 101.1 | % | $ | 393,555 | ||||||||
| Other Assets and Liabilities | (1.1 | )% | (4,290 | ) | ||||||||
| Total Net Assets | 100.0 | % | $ | 389,265 | ||||||||
The accompanying notes are an integral part of these financial statements.
| 9 |
| The Hartford Municipal Opportunities Fund |
| Schedule of Investments – (continued) |
| October 31, 2014 |
| (000’s Omitted) |
Note: Percentage of investments as shown is the ratio of the total market value to total net assets.
The Fund may refer to any one or more of the industry classifications used by one or more widely recognized market indices, ratings group indices and/or as defined by Fund management. Industry classifications may not be identical across all security types.
For Fund compliance purposes, the Fund may not use the same classification system shown in this report as these classifications are used for reporting ease.
| ▲ | At October 31, 2014, the cost of securities for federal income tax purposes was $376,033 and the aggregate gross unrealized appreciation and depreciation based on that cost were: |
| Unrealized Appreciation | $ | 21,225 | ||
| Unrealized Depreciation | (3,703 | ) | ||
| Net Unrealized Appreciation | $ | 17,522 |
| ● | Non-income producing. For long-term debt securities, items identified are in default as to payment of interest and/or principal. |
| Δ | Variable rate securities; the rate reported is the coupon rate in effect at October 31, 2014. |
| ○ | The interest rate disclosed for these securities represents the effective yield on the date of the acquisition. |
| ■ | Securities issued within terms of a private placement memorandum, exempt from registration under Rule 144A under the Securities Act of 1933, as amended, and may be sold only to qualified institutional buyers. Unless otherwise indicated, these holdings are determined to be liquid. At October 31, 2014, the aggregate value of these securities was $7,179, which represents 1.8% of total net assets. |
| ☼ | This security, or a portion of this security, was purchased on a when-issued or delayed-delivery basis. The cost of these securities was $11,922 at October 31, 2014. |
| ‡ | This security, or a portion of this security, has been segregated to cover funding requirements on investment transactions settling in the future. |
| ╪ | See Significant Accounting Policies of accompanying Notes to Financial Statements regarding valuation of securities. |
| GLOSSARY: (abbreviations used in preceding Schedule of Investments) | |
| Municipal Bond Abbreviations: | |
| AMT | Alternative Minimum Tax |
| DA | Development Authority |
| FA | Finance Authority |
| GO | General Obligation |
| IDA | Industrial Development Authority |
| ISD | Independent School District |
| PA | Port Authority |
| Rev | Revenue |
| USD | United School District |
| VA | Veterans Administration |
The accompanying notes are an integral part of these financial statements.
| 10 |
| The Hartford Municipal Opportunities Fund |
| Schedule of Investments – (continued) |
| October 31, 2014 |
| (000’s Omitted) |
Investment Valuation Hierarchy Level Summary
October 31, 2014
| Total | Level 1 ♦ | Level 2 ♦ | Level 3 | |||||||||||||
| Assets: | ||||||||||||||||
| Municipal Bonds | $ | 372,643 | $ | – | $ | 372,643 | $ | – | ||||||||
| Short-Term Investments | 20,912 | 20,912 | – | – | ||||||||||||
| Total | $ | 393,555 | $ | 20,912 | $ | 372,643 | $ | – | ||||||||
| ♦ | For the year ended October 31, 2014, there were no transfers between Level 1 and Level 2. |
| Note: | For purposes of reporting transfers between different hierarchy levels, both transfers in and out of each level, as applicable, are shown as if they occurred at the beginning of the period. |
The accompanying notes are an integral part of these financial statements.
| 11 |
| The Hartford Municipal Opportunities Fund |
| Statement of Assets and Liabilities |
| October 31, 2014 |
| (000’s Omitted) |
| Assets: | ||||
| Investments in securities, at market value (cost $376,033) | $ | 393,555 | ||
| Receivables: | ||||
| Investment securities sold | 4,936 | |||
| Fund shares sold | 1,585 | |||
| Interest | 4,810 | |||
| Other assets | 98 | |||
| Total assets | 404,984 | |||
| Liabilities: | ||||
| Payables: | ||||
| Investment securities purchased | 15,086 | |||
| Fund shares redeemed | 270 | |||
| Investment management fees | 41 | |||
| Dividends | 146 | |||
| Distribution fees | 27 | |||
| Accrued expenses | 37 | |||
| Other liabilities | 112 | |||
| Total liabilities | 15,719 | |||
| Net assets | $ | 389,265 | ||
| Summary of Net Assets: | ||||
| Capital stock and paid-in-capital | $ | 400,543 | ||
| Undistributed net investment income | 132 | |||
| Accumulated net realized loss | (28,932 | ) | ||
| Unrealized appreciation of investments | 17,522 | |||
| Net assets | $ | 389,265 | ||
| Shares authorized | 650,000 | |||
| Par value | $ | 0.001 | ||
| Class A: Net asset value per share/Maximum offering price per share | $8.53/$8.93 | |||
| Shares outstanding | 22,569 | |||
| Net assets | $ | 192,531 | ||
| Class B: Net asset value per share | $ | 8.53 | ||
| Shares outstanding | 377 | |||
| Net assets | $ | 3,216 | ||
| Class C: Net asset value per share | $ | 8.54 | ||
| Shares outstanding | 10,680 | |||
| Net assets | $ | 91,177 | ||
| Class I: Net asset value per share | $ | 8.55 | ||
| Shares outstanding | 11,972 | |||
| Net assets | $ | 102,341 |
The accompanying notes are an integral part of these financial statements.
| 12 |
| The Hartford Municipal Opportunities Fund |
| Statement of Operations |
| For the Year Ended October 31, 2014 |
| (000’s Omitted) |
| Investment Income: | ||||
| Interest | $ | 12,797 | ||
| Total investment income | 12,797 | |||
| Expenses: | ||||
| Investment management fees | 1,815 | |||
| Transfer agent fees | ||||
| Class A | 62 | |||
| Class B | 4 | |||
| Class C | 44 | |||
| Class I | 32 | |||
| Distribution fees | ||||
| Class A | 413 | |||
| Class B | 36 | |||
| Class C | 855 | |||
| Custodian fees | 4 | |||
| Accounting services fees | 59 | |||
| Registration and filing fees | 86 | |||
| Board of Directors' fees | 9 | |||
| Audit fees | 13 | |||
| Other expenses | 37 | |||
| Total expenses (before waivers) | 3,469 | |||
| Expense waivers | (18 | ) | ||
| Management fee waivers | (165 | ) | ||
| Total waivers | (183 | ) | ||
| Total expenses, net | 3,286 | |||
| Net Investment Income | 9,511 | |||
| Net Realized Gain on Investments: | ||||
| Net realized gain on investments | 2,243 | |||
| Net Realized Gain on Investments | 2,243 | |||
| Net Changes in Unrealized Appreciation of Investments: | ||||
| Net unrealized appreciation of investments | 9,378 | |||
| Net Changes in Unrealized Appreciation of Investments | 9,378 | |||
| Net Gain on Investments | 11,621 | |||
| Net Increase in Net Assets Resulting from Operations | $ | 21,132 |
The accompanying notes are an integral part of these financial statements.
| 13 |
| The Hartford Municipal Opportunities Fund |
| Statement of Changes in Net Assets |
| (000’s Omitted) |
| For the Year Ended October 31, 2014 | For the Year Ended October 31, 2013 | |||||||
| Operations: | ||||||||
| Net investment income | $ | 9,511 | $ | 11,540 | ||||
| Net realized gain on investments | 2,243 | 5,066 | ||||||
| Net unrealized appreciation (depreciation) of investments | 9,378 | (23,491 | ) | |||||
| Net Increase (Decrease) in Net Assets Resulting from Operations | 21,132 | (6,885 | ) | |||||
| Distributions to Shareholders: | ||||||||
| From net investment income | ||||||||
| Class A | (4,987 | ) | (6,237 | ) | ||||
| Class B | (83 | ) | (134 | ) | ||||
| Class C | (1,949 | ) | (2,814 | ) | ||||
| Class I | (2,442 | ) | (2,442 | ) | ||||
| Total distributions | (9,461 | ) | (11,627 | ) | ||||
| Capital Share Transactions: | ||||||||
| Class A | 32,903 | (39,682 | ) | |||||
| Class B | (1,067 | ) | (1,179 | ) | ||||
| Class C | 1,357 | (25,394 | ) | |||||
| Class I | 40,582 | (15,824 | ) | |||||
| Net increase (decrease) from capital share transactions | 73,775 | (82,079 | ) | |||||
| Net Increase (Decrease) in Net Assets | 85,446 | (100,591 | ) | |||||
| Net Assets: | ||||||||
| Beginning of period | 303,819 | 404,410 | ||||||
| End of period | $ | 389,265 | $ | 303,819 | ||||
| Undistributed (distributions in excess of) net investment income | $ | 132 | $ | 82 | ||||
The accompanying notes are an integral part of these financial statements.
| 14 |
| The Hartford Municipal Opportunities Fund |
| Notes to Financial Statements |
| October 31, 2014 |
| (000’s Omitted) |
Organization:
The Hartford Mutual Funds, Inc. (“Company”) is an open-end management investment company comprised of forty-two portfolios. Financial statements for The Hartford Municipal Opportunities Fund (the "Fund"), a series of the Company, are included in this report.
The Company is organized under the laws of the State of Maryland and is registered with the Securities and Exchange Commission (“SEC”) under the Investment Company Act of 1940, as amended (“1940 Act”). The Fund is a diversified open-end management investment company. The Fund is an investment company and applies specialized accounting and reporting under Accounting Standards Codification Topic 946, Financial Services - Investment Companies.
Class A shares are sold with a front-end sales charge of up to 4.50%. Class B shares were sold with a contingent deferred sales charge which is assessed on the lesser of the per share net asset value (“NAV”) of the shares at the time of redemption or the original purchase price, and declines from up to 5.00% to zero depending on the period of time the shares are held (see note below regarding the closing of Class B shares). Class C shares are sold with a contingent deferred sales charge of up to 1.00% on shares redeemed within twelve months of purchase. Class I shares are sold without sales charges to certain eligible investors primarily through advisory fee-based wrap programs. All classes of shares have identical voting, redemption, dividend, liquidation and other rights and the same terms and conditions, with the exceptions that each class may have different expenses, which may affect performance, and that Class B shares automatically convert to Class A shares after 8 years.
No new or additional investments are allowed in Class B shares of the Fund (including investments through any systematic investment plan). Existing shareholders of Class B shares may continue to hold their Class B shares, exchange their Class B shares for Class B shares of another Hartford Fund (as permitted by existing exchange privileges), or redeem their Class B shares as described in the Fund’s prospectus. Reinstatement privileges with respect to Class B shares are set forth in the Fund's prospectus. For investors electing to reinvest capital gains and dividends, any such capital gains or dividends on Class B shares will continue to be reinvested in Class B shares of the Fund. All Class B share attributes, including the 12b-1 fee, contingent deferred sales charge schedule, and conversion to Class A shares, remain unchanged.
Significant Accounting Policies:
The following is a summary of significant accounting policies of the Fund in the preparation of its financial statements, which are in accordance with United States generally accepted accounting principles (“U.S. GAAP”). The preparation of financial statements in accordance with U.S. GAAP may require management to make estimates and assumptions that affect the reported amounts of assets and liabilities and disclosure of contingent assets and liabilities at the date of the financial statements and the reported amounts of increases and decreases in net assets from operations during the reporting period. Actual results could differ from those estimates.
Determination of Net Asset Value – The NAV of each class of the Fund's shares is determined as of the close of regular trading (normally 4:00 p.m. Eastern Time) (the “NYSE Close”) on each day that the New York Stock Exchange (the “Exchange”) is open (“Valuation Date”). Information that becomes known to the Fund after the NAV has been calculated on a particular day will not generally be used to retroactively adjust the NAV determined earlier that day.
Investment Valuation and Fair Value Measurements – For purposes of calculating the NAV, portfolio investments and other assets held by the Fund's portfolio for which market quotes are readily available are valued at market value. Market value is generally determined on the basis of last reported sales prices or official close price. If no sales are reported, market value is based on quotes obtained from a quotation reporting system, established market makers, or independent pricing services. If market prices are not readily available or are deemed unreliable, the Fund will use the fair value of the investment as determined in good faith under policies and procedures established by and under the supervision of the Company's Board of Directors. Market quotes are considered not readily available where there is an absence of current or reliable market-based data (e.g., trade information or indicative market quotes), including where events occur after the close of the relevant market, but prior to the NYSE Close, that materially affect the values of the Fund's portfolio investments or assets. In addition, market quotes are considered not readily available when, due to extraordinary circumstances, the exchanges or markets on which the investments trade do not open for trading for the entire day and no other market prices are available. There can be no assurance that the Fund could obtain the fair market value assigned to an investment if the Fund were to sell the investment at approximately the time at which the Fund determines its NAV.
| 15 |
| The Hartford Municipal Opportunities Fund |
| Notes to Financial Statements – (continued) |
| October 31, 2014 |
| (000’s Omitted) |
Fixed income investments (other than short-term obligations), non-exchange traded derivatives and centrally cleared swaps held by the Fund are normally valued on the basis of quotes obtained from independent pricing services or brokers and dealers in accordance with procedures established by the Company's Board of Directors. Prices obtained from independent pricing services use information provided by market makers or estimates of market values through accepted market modeling, trading and pricing conventions. Inputs to the models may include, but are not limited to, prepayment speeds, pricing spread, yield, trade information, dealer quotes, market color, cash flow models and the investment’s terms and conditions. Generally, the Fund may use fair valuation in regard to fixed income investments when the Fund holds defaulted or distressed investments or investments in a company in which a reorganization is pending. Short-term investments maturing in 60 days or less are generally valued at amortized cost, if their original term to maturity was 60 days or less, or by amortizing their value on the 61st day prior to maturity, if the original term to maturity exceeded 60 days, which approximates fair value.
Investments in open-end mutual funds are valued at the respective NAV of each open-end mutual fund on the Valuation Date.
Financial instruments for which prices are not available from an independent pricing service may be valued using market quotations obtained from one or more dealers that make markets in the respective financial instrument in accordance with procedures established by the Company's Board of Directors.
U.S. GAAP defines fair value as the price that the Fund would receive to sell an asset or pay to transfer a liability in an orderly transaction between market participants. The U.S. GAAP fair value measurement standards require disclosure of a fair value hierarchy for each major category of assets and liabilities. Various inputs are used in determining the fair value of the Fund’s investments. These inputs are summarized into three broad hierarchy levels. This hierarchy is based on whether the valuation inputs are observable or unobservable. These levels are:
Level 1 – Quoted prices in active markets for identical investments. Level 1 may include exchange traded instruments, such as domestic equities, some foreign equities, options, futures, mutual funds, exchange traded funds, rights and warrants.
Level 2 – Observable inputs other than Level 1 prices, such as quoted prices for similar investments; quoted prices in markets that are not active; or other inputs that are observable or can be corroborated by observable market data. Level 2 may include debt investments that are traded less frequently than exchange traded instruments and which are valued using independent pricing services; foreign equities, which are principally traded on certain foreign markets and are adjusted daily pursuant to a fair value pricing service in order to reflect an adjustment for the factors occurring after the close of certain foreign markets but before the NYSE Close; senior floating rate interests, which are valued using an aggregate of dealer bids; short-term investments, which are valued at amortized cost; and swaps, which are valued based upon the terms of each swap contract.
Level 3 – Significant unobservable inputs that are supported by limited or no market activity. Level 3 may include financial instruments whose values are determined using indicative market quotes or require significant management judgment or estimation. These unobservable valuation inputs may include estimates for current yields, maturity/duration, prepayment speed, and indicative market quotes for comparable investments along with other assumptions relating to credit quality, collateral value, complexity of the investment structure, general market conditions and liquidity. This category may include investments where trading has been halted or there are certain restrictions on trading. While these investments are priced using unobservable inputs, the valuation of these investments reflects the best available data and management believes the prices are a reasonable representation of exit price.
The Board of Directors of the Company generally reviews and approves the “Procedures for Valuation of Portfolio Securities” at least once a year. These procedures define how investments are to be valued, including the formation and activities of a Valuation Committee. The Valuation Committee is responsible for determining in good faith the fair value of investments when the value cannot be obtained from primary pricing services or alternative sources or if the valuation of an investment as provided by the primary pricing service or alternative source is believed not to reflect the investment’s fair value as of the Valuation Date. Voting members of the Valuation Committee include the Fund's Treasurer or designee and a Vice President of the investment manager or designee. An Assistant Vice President of the Fund with legal expertise or designee is also included on the Valuation Committee as a non-voting advisory member. In addition, the Fund’s Chief Compliance Officer shall designate a member of the compliance group to attend Valuation Committee meetings as a non-voting resource, to monitor for and provide guidance with
| 16 |
| The Hartford Municipal Opportunities Fund |
| Notes to Financial Statements – (continued) |
| October 31, 2014 |
| (000’s Omitted) |
respect to compliance with these procedures. Two members of the Valuation Committee or their designees, representing different departments, shall constitute a quorum for purposes of permitting the Valuation Committee to take action. The Valuation Committee will consider all relevant factors in determining an investment’s fair value, and may seek the advice of the Fund’s sub-adviser, knowledgeable brokers, and legal counsel in making such determination. The Valuation Committee reports to the Audit Committee of the Company's Board of Directors. The Audit Committee receives quarterly written reports which include details of all fair-valued investments, including the reason for the fair valuation, and an indication, when possible, of the accuracy of the valuation by disclosing the next available reliable public price quotation or the disposition price of such investments (the “look-back” test). The Board of Directors then must consider for ratification all of the fair value determinations made during the previous quarter.
Valuation levels are not necessarily indicative of the risk associated with investing in such investments. Individual investments within any of the above mentioned asset classes may be assigned a different hierarchical level than those presented above, as individual circumstances dictate.
For additional information, refer to the Investment Valuation Hierarchy Level Summary which follows the Schedule of Investments.
Investment Transactions and Investment Income – Investment transactions are recorded as of the trade date (the date the order to buy or sell is executed) for financial reporting purposes. Investments purchased or sold on a when-issued or delayed-delivery basis may be settled a month or more after the trade date. Realized gains and losses are determined on the basis of identified cost.
Dividend income from domestic securities is accrued on the ex-dividend date. Interest income, including amortization of premium, accretion of discounts and additional principal received in-kind in lieu of cash, is accrued on a daily basis.
Fund Share Valuation and Dividend Distributions to Shareholders – Orders for the Fund’s shares are executed in accordance with the investment instructions of the shareholders. The NAV of the Fund’s shares is determined as of the close of business on each business day of the Exchange. The NAV is determined separately for each class of shares of the Fund by dividing the Fund’s net assets attributable to that class by the number of shares of the class outstanding. Each class of shares offered by the Fund has equal rights as to assets and voting privileges (except that shareholders of a class have exclusive voting rights regarding any matter relating solely to that class of shares). Income and non-class specific expenses are allocated daily to each class on the basis of the relative net assets of the class. Realized and unrealized gains and losses are allocated daily based on the relative net assets of each class of shares of the Fund.
Orders for the purchase of the Fund’s shares received prior to the close of the Exchange on any day the Exchange is open for business are priced at the NAV determined as of the close of the Exchange. Orders received after the close of the Exchange, or on a day on which the Exchange and/or the Fund is not open for business, are priced at the next determined NAV.
Dividends are declared pursuant to a policy adopted by the Company's Board of Directors based upon the investment performance of the Fund. Normally, dividends from net investment income are declared daily and paid monthly. Dividends from realized gains, if any, are paid at least once a year.
Net investment income, dividends and distributions from net realized gains and capital are determined in accordance with federal income tax regulations, which may differ from U.S. GAAP with respect to character and timing (see Federal Income Taxes: Distributions and Components of Distributable Earnings and Reclassification of Capital Accounts).
Securities and Other Investments:
Illiquid and Restricted Investments – The Fund is permitted to invest up to 15% of its net assets in illiquid investments. Illiquid investments are those that may not be sold or disposed of in the ordinary course of business within seven days, at approximately the price used to determine the Fund’s NAV. The Fund may not be able to sell illiquid investments when its sub-adviser considers it desirable to do so or may have to sell such investments at a price that is lower than the price that could be obtained if the investments were more liquid. A sale of illiquid investments may require more time and may result in higher dealer discounts and other selling expenses than does the sale of those that are liquid. Illiquid investments also may be more difficult to value due to the unavailability of
| 17 |
| The Hartford Municipal Opportunities Fund |
| Notes to Financial Statements – (continued) |
| October 31, 2014 |
| (000’s Omitted) |
reliable market quotations for such investments, and an investment in them may have an adverse impact on the Fund’s NAV. The Fund may also purchase certain restricted investments that can only be resold to certain qualified investors and may be determined to be liquid pursuant to policies and guidelines established by the Company's Board of Directors. The Fund, as shown on the Schedule of Investments, had illiquid or restricted investments as of October 31, 2014.
Investments Purchased on a When-Issued or Delayed-Delivery Basis – Delivery and payment for investments that have been purchased by the Fund on a forward commitment, or when-issued or delayed-delivery basis, take place beyond the customary settlement period. The Fund may dispose of or renegotiate a delayed-delivery transaction after it is entered into, and may sell delayed-delivery investments before they are delivered, which may result in a realized gain or loss. During this period, such investments are subject to market fluctuations, and the Fund identifies investments segregated in its records with a value at least equal to the amount of the commitment. The Fund, as shown on the Schedule of Investments, had when-issued or delayed-delivery investments as of October 31, 2014.
Principal Risks:
Credit risk depends largely on the perceived financial health of bond issuers. In general, the credit rating is inversely related to the credit risk of the issuer. Higher rated bonds generally are deemed to have less credit risk, while lower or unrated bonds are deemed to have higher risk of default. The share price, yield and total return of a fund that holds securities with higher credit risk may be more volatile than those of a fund that holds bonds with lower credit risk. Similar to credit risk, the Fund may be exposed to counterparty risk, or the risk that an institution or other entity with which the Fund has unsettled or open transactions will default.
The Fund’s investments expose the Fund to various risks including, but not limited to, interest rate, prepayment and extension risks. Interest rate risk is the risk that fixed income securities will decline in value because of changes in interest rates. As nominal interest rates rise, the values of certain fixed income securities held by the Fund are likely to decrease. A nominal interest rate can be described as the sum of a real interest rate and an expected inflation rate. Fixed income securities with longer durations tend to be more sensitive to changes in interest rates, usually making them more volatile than securities with shorter durations. Duration is useful primarily as a measure of the sensitivity of a fixed income security’s market price to interest rate (i.e. yield) movements. Rising interest rates may cause prepayments to occur at a slower than expected rate, thereby effectively lengthening the maturity of the security and making the security more sensitive to interest rate changes.
Federal Income Taxes:
Federal Income Taxes – For federal income tax purposes, the Fund intends to continue to qualify as a Regulated Investment Company ("RIC") under Subchapter M of the Internal Revenue Code (“IRC”) by distributing substantially all of its taxable net investment income and net realized capital gains to its shareholders and otherwise complying with the requirements of the IRC. The Fund has distributed substantially all of its income and capital gains in prior years, if applicable, and intends to distribute substantially all of its income and capital gains during the calendar year ending December 31, 2014. Accordingly, no provision for federal income or excise taxes has been made in the accompanying financial statements. Distributions from short-term capital gains are treated as ordinary income distributions for federal income tax purposes.
Net Investment Income (Loss), Net Realized Gains (Losses) and Distributions – Net investment income (loss) and net realized gains (losses) may differ for financial statement and tax purposes primarily because of losses deferred due to wash sale adjustments, foreign currency gains and losses, adjustments related to Passive Foreign Investment Companies ("PFICs"), Real Estate Investment Trusts ("REITs"), RICs, certain derivatives and partnerships. The character of distributions made during the year from net investment income or net realized gains may differ from their ultimate characterization for federal income tax purposes. Also, due to the timing of dividend distributions, the fiscal year in which amounts are distributed may differ from the year that the income or realized gains (losses) were recorded by the Fund.
| 18 |
| The Hartford Municipal Opportunities Fund |
| Notes to Financial Statements – (continued) |
| October 31, 2014 |
| (000’s Omitted) |
Distributions and Components of Distributable Earnings – The tax character of distributions paid by the Fund for the periods indicated is as follows (as adjusted for dividends payable, if applicable):
| For the Year Ended October 31, 2014 | For the Year Ended October 31, 2013 | |||||||
| Tax Exempt Income | $ | 9,362 | $ | 11,647 | ||||
| Ordinary Income | 73 | 68 | ||||||
As of October 31, 2014, the Fund’s components of distributable earnings (deficit) on a tax basis are as follows:
| Amount | ||||
| Undistributed Ordinary Income | $ | 279 | ||
| Accumulated Capital Losses* | (28,933 | ) | ||
| Unrealized Appreciation† | 17,522 | |||
| Total Accumulated Deficit | $ | (11,132 | ) | |
| * | The Fund has capital loss carryforwards that are identified in the Capital Loss Carryforward note that follows. |
| † | Differences between book-basis and tax-basis unrealized appreciation (depreciation) may be attributable to the losses deferred due to wash sale adjustments, foreign currency gains and losses, adjustments related to PFICs, REITs, RICs, certain derivatives and partnerships. |
Reclassification of Capital Accounts – The Fund may record reclassifications in its capital accounts. These reclassifications have no impact on the total net assets of the Fund. The reclassifications are a result of permanent differences between U.S. GAAP and tax accounting for such items as foreign currency, PFICs, expiration or utilization of capital loss carryforwards or net operating losses. Adjustments are made to reflect the impact these items have on current and future distributions to shareholders. Therefore, the source of the Fund’s distributions may be shown in the accompanying Statement of Changes in Net Assets as from undistributed net investment income, from accumulated net realized gains on investments or from capital depending on the type of book and tax differences that exist. For the year ended October 31, 2014, the Fund had no reclassifications.
Capital Loss Carryforward – On December 22, 2010, the Regulated Investment Company Modernization Act of 2010 (the “Act”) was enacted, which made changes to the capital loss carryforward rules. The changes are effective for taxable years beginning after the date of enactment. Under the Act, funds are permitted to carry forward capital losses for an unlimited period. However, any losses incurred during those future taxable years will be required to be utilized prior to the losses incurred in pre-enactment taxable years, which carry an expiration date. As a result of this ordering rule, pre-enactment capital loss carryforwards may be more likely to expire unused. Additionally, post-enactment capital loss carryforwards retain their character as either short-term or long-term capital losses rather than being considered all short-term as permitted under prior regulation.
At October 31, 2014 (tax year end), the Fund had capital loss carryforwards for U.S. federal income tax purposes as follows:
| Year of Expiration | Amount | |||
| 2017 | $ | 12,266 | ||
| 2018 | 6,121 | |||
| 2019 | 10,546 | |||
| Total | $ | 28,933 | ||
| During the year ended October 31, 2014, the Fund utilized $2,243 of prior year capital loss carryforwards. | ||||
Accounting for Uncertainty in Income Taxes – The Fund has adopted financial reporting rules that require the Fund to analyze all open tax years, as defined by the statute of limitations, for all major jurisdictions. Generally, tax authorities can examine all tax returns filed for the last three years. The Fund does not have an examination in progress.
The Fund has reviewed all open tax years and major jurisdictions and concluded that these financial reporting rules had no effect on the Fund’s financial position or results of operations. There is no tax liability resulting from unrecognized tax benefits relating to
| 19 |
| The Hartford Municipal Opportunities Fund |
| Notes to Financial Statements – (continued) |
| October 31, 2014 |
| (000’s Omitted) |
uncertain income tax positions taken or expected to be taken on the tax return for the fiscal year ended October 31, 2014. The Fund is also not aware of any tax positions for which it is reasonably possible that the total amounts of unrecognized tax benefits will significantly change in the next twelve months.
Expenses:
Investment Management Agreement – Hartford Funds Management Company, LLC ("HFMC") serves as the Fund’s investment manager pursuant to an Investment Management Agreement with the Company. HFMC is an indirect wholly owned subsidiary of The Hartford Financial Services Group, Inc. ("The Hartford"). The investment manager has overall investment supervisory responsibility for the Fund. In addition, the investment manager provides administrative personnel, services, equipment, facilities and office space for proper operation of the Fund. HFMC has contracted with Wellington Management Company, LLP ("Wellington Management") under a sub-advisory agreement for the provision of day-to-day investment management services to the Fund in accordance with the Fund’s investment objective and policies. The Fund pays a fee to the investment manager, a portion of which may be used to compensate Wellington Management.
The schedule below reflects the rates of compensation paid to the investment manager for investment management services rendered as of October 31, 2014; the rates are accrued daily and paid monthly:
| Average Daily Net Assets | Annual Fee |
| On first $500 million | 0.5500% |
| On next $500 million | 0.5000% |
| On next $1.5 billion | 0.4750% |
| On next $2.5 billion | 0.4650% |
| On next $5 billion | 0.4550% |
| Over $10 billion | 0.4450% |
Effective November 1, 2013, the investment manager voluntarily agreed to waive investment management fees of 0.05% of average daily net assets until October 31, 2014. These amounts are deducted from expenses and are reported as expense waivers on the accompanying Statement of Operations, as applicable.
Accounting Services Agreement – Pursuant to the Fund Accounting Agreement between HFMC and the Company, on behalf of the Fund, HFMC provides accounting services to the Fund and receives monthly compensation based on the Fund’s average daily net assets at the rates set forth below. The Fund’s accounting services fees are accrued daily and paid monthly.
| Average Daily Net Assets | Annual Fee |
| On first $5 billion | 0.018% |
| On next $5 billion | 0.014% |
| Over $10 billion | 0.010% |
Operating Expenses – Allocable expenses incurred by the Company are allocated to each Fund and allocated to classes within the Fund in proportion to the average daily net assets of the Fund and each class, except where allocation of certain expenses is more fairly made directly to the Fund or to specific classes within a Fund. Effective November 1, 2014, HFMC contractually limited the total operating expenses of this Fund, exclusive of taxes, interest expense, brokerage commissions, acquired fund fees and expenses and extraordinary expenses, through February 28, 2015 as follows:
| Class A | Class B | Class C | Class I |
| 0.90% | 1.65% | 1.65% | 0.65% |
| 20 |
| The Hartford Municipal Opportunities Fund |
| Notes to Financial Statements – (continued) |
| October 31, 2014 |
| (000’s Omitted) |
Effective November 1, 2013, the investment manager voluntarily agreed to limit the total operating expenses of the Fund, exclusive of taxes, interest expense, brokerage commissions, acquired fund fees and expenses and extraordinary expenses through October 31, 2014, as follows:
| Class A | Class B | Class C | Class I |
| 0.85% | 1.60% | 1.60% | 0.60% |
Distribution and Service Plan for Class A, B and C Shares – Hartford Funds Distributors, LLC ("HFD"), an indirect wholly owned subsidiary of The Hartford, is the principal underwriter and distributor of the Fund. HFD is engaged in distribution activities, which include marketing and distribution of shares through broker/dealers, financing distribution costs and maintaining financial books and records. For the year ended October 31, 2014, HFD received front-end load sales charges of $509 and contingent deferred sales charges of $9 from the Fund.
The Fund has adopted a Distribution and Service Plan in accordance with Rule 12b-1 of the 1940 Act to compensate the distributor (HFD) for activities intended to result in the sale and distribution of Class A, B and C shares and for providing services for shareholders. The Rule 12b-1 plan applicable to Class A shares of the Fund provides for payment of a Rule 12b-1 fee of 0.25% of average daily net assets. Some or all of the fee may be used for shareholder servicing expenses with the remainder used for distribution expenses. Under the Class B Plan, the Fund pays the distributor 1.00% of the average daily net assets of Class B shares that are outstanding for 8 years or less, 0.25% of which is a fee for services provided to existing shareholders with the remainder used for distribution expenses. Some or the entire Rule 12b-1 fee for Class B shares may be remitted to broker/dealers for distribution and/or shareholder account services. After eight years, Class B shares convert to Class A shares. Upon conversion to Class A shares, the Class A plan described above will apply to those shares. Under the Class C Plan, the Fund pays the distributor 1.00% of the average daily net assets of Class C shares outstanding, 0.25% of which is intended as a fee for services provided to existing shareholders with the remainder used for distribution expenses. For Class C shares, some or the entire fee may be remitted to broker/dealers for distribution and/or shareholder account services. The Fund’s 12b-1 fees are accrued daily and paid monthly or at such other intervals as the Board of Directors may determine.
Other Related Party Transactions – Certain officers of the Fund are directors and/or officers of HFMC and/or The Hartford or its subsidiaries. For the year ended October 31, 2014, a portion of the Fund’s Chief Compliance Officer’s compensation was paid by all of the investment companies in the Hartford fund complex. The portion allocated to the Fund, as represented in other expenses on the Statement of Operations, was in the amount of $1. Hartford Administrative Services Company (“HASCO”), an indirect wholly-owned subsidiary of The Hartford, provides transfer agent services to the Fund. HASCO has contractually agreed to reimburse any portion of the transfer agency fees over 0.30% of average daily net assets per fiscal year for each class. Any transfer agency fee reimbursement is determined before considering the contractual operating expense limitation. For providing such services, HASCO is compensated on a per account basis that varies by account type. The amount paid to HASCO and any related contractual reimbursement amounts, if applicable, can be found in the Statement of Operations. These fees are accrued daily and paid monthly.
Investment Transactions:
For the year ended October 31, 2014, the cost of purchases and proceeds from sales of investment securities (excluding short-term investments) were as follows:
| Excluding U.S. Government Obligations | U.S. Government Obligations | Total | ||||||||||
| Cost of Purchases | $ | 161,598 | $ | — | $ | 161,598 | ||||||
| Sales Proceeds | 92,975 | — | 92,975 | |||||||||
| 21 |
| The Hartford Municipal Opportunities Fund |
| Notes to Financial Statements – (continued) |
| October 31, 2014 |
| (000’s Omitted) |
Capital Share Transactions:
The following information is for the year ended October 31, 2014, and the year ended October 31, 2013:
| For the Year Ended October 31, 2014 | For the Year Ended October 31, 2013 | |||||||||||||||||||||||||||||||
| Shares Sold | Shares Issued for Reinvested Dividends | Shares Redeemed | Net Increase (Decrease) of Shares | Shares Sold | Shares Issued for Reinvested Dividends | Shares Redeemed | Net Increase (Decrease) of Shares | |||||||||||||||||||||||||
| Class A | ||||||||||||||||||||||||||||||||
| Shares | 9,412 | 547 | (6,068 | ) | 3,891 | 4,220 | 662 | (9,624 | ) | (4,742 | ) | |||||||||||||||||||||
| Amount | $ | 79,059 | $ | 4,576 | $ | (50,732 | ) | $ | 32,903 | $ | 36,404 | $ | 5,624 | $ | (81,710 | ) | $ | (39,682 | ) | |||||||||||||
| Class B | ||||||||||||||||||||||||||||||||
| Shares | 6 | 8 | (143 | ) | (129 | ) | 23 | 12 | (175 | ) | (140 | ) | ||||||||||||||||||||
| Amount | $ | 55 | $ | 64 | $ | (1,186 | ) | $ | (1,067 | ) | $ | 192 | $ | 105 | $ | (1,476 | ) | $ | (1,179 | ) | ||||||||||||
| Class C | ||||||||||||||||||||||||||||||||
| Shares | 2,441 | 191 | (2,489 | ) | 143 | 1,331 | 265 | (4,633 | ) | (3,037 | ) | |||||||||||||||||||||
| Amount | $ | 20,487 | $ | 1,601 | $ | (20,731 | ) | $ | 1,357 | $ | 11,433 | $ | 2,260 | $ | (39,087 | ) | $ | (25,394 | ) | |||||||||||||
| Class I | ||||||||||||||||||||||||||||||||
| Shares | 7,906 | 195 | (3,279 | ) | 4,822 | 3,190 | 205 | (5,251 | ) | (1,856 | ) | |||||||||||||||||||||
| Amount | $ | 66,313 | $ | 1,641 | $ | (27,372 | ) | $ | 40,582 | $ | 27,001 | $ | 1,745 | $ | (44,570 | ) | $ | (15,824 | ) | |||||||||||||
| Total | ||||||||||||||||||||||||||||||||
| Shares | 19,765 | 941 | (11,979 | ) | 8,727 | 8,764 | 1,144 | (19,683 | ) | (9,775 | ) | |||||||||||||||||||||
| Amount | $ | 165,914 | $ | 7,882 | $ | (100,021 | ) | $ | 73,775 | $ | 75,030 | $ | 9,734 | $ | (166,843 | ) | $ | (82,079 | ) | |||||||||||||
The following reflects the conversion of Class B shares into Class A shares (reflected as Class A shares sold) for the year ended October 31, 2014, and the year ended October 31, 2013:
| Shares | Dollars | |||||||
| For the Year Ended October 31, 2014 | 1 | $ | 7 | |||||
| For the Year Ended October 31, 2013 | 3 | $ | 22 | |||||
Line of Credit:
The Fund is one of several Hartford Funds that participate in a $500 million committed revolving line of credit facility. The facility is to be used for temporary or emergency purposes. Under the arrangement, the funds are required to own securities having a market value in excess of 300% of the total bank borrowings. The interest rate on borrowings varies depending on the nature of the loan. The facility also requires a fee to be paid based on the amount of the commitment. This commitment fee is allocated to all the funds participating in the line of credit based on the average net assets of the funds. During the year ended October 31, 2014, the Fund did not have any borrowings under this facility.
Pending Legal Proceedings:
On February 25, 2011, Jennifer L. Kasilag, Louis Mellinger, Judith M. Menendez, Jacqueline M. Robinson, and Linda A. Russell filed a derivative lawsuit against Hartford Investment Financial Services, LLC (“HIFSCO”) (now known as HFD) on behalf of six Hartford retail mutual funds in the United States District Court for the District of New Jersey, alleging that HIFSCO received excessive advisory and distribution fees in violation of its statutory fiduciary duty under Section 36(b) of the 1940 Act when serving as investment manager and principal underwriter, respectively, to the Hartford retail mutual funds. Although this action was purportedly filed on behalf of certain of the Hartford Funds, none of the Hartford Funds is itself a defendant to the suit. HIFSCO moved to dismiss and, in September 2011, the motion was granted in part and denied in part, with leave to amend the complaint. In November 2011, plaintiffs filed an amended complaint on behalf of certain Hartford retail mutual funds, The Hartford Global Health Fund (now known as The Hartford Healthcare Fund), The Hartford Conservative Allocation Fund, The Hartford Growth Opportunities Fund, The Hartford Inflation Plus Fund, The Hartford Advisers Fund (now known as The Hartford Balanced Fund), and The Hartford Capital Appreciation Fund. Plaintiffs seek to rescind the investment management agreements and distribution plans between HIFSCO and these funds and to recover the total fees charged thereunder or, in the alternative, to recover any improper compensation HIFSCO received, in addition to lost earnings. HIFSCO filed a partial motion to dismiss the amended complaint and, in December 2012, the court dismissed without prejudice the claims regarding distribution fees and denied the motion with respect to the advisory fees claims. HIFSCO disputes the allegations and intends to defend vigorously.
| 22 |
| The Hartford Municipal Opportunities Fund |
| Notes to Financial Statements – (continued) |
| October 31, 2014 |
| (000’s Omitted) |
In March 2014, the plaintiffs filed a new complaint that added as new plaintiffs The Hartford Floating Rate Fund and The Hartford Small Company Fund and named as a defendant HFMC, which assumed the role as investment manager to the funds as of January 2013. HFMC and HIFSCO dispute the allegations and intend to defend vigorously.
No accrual for litigation relating to this matter has been recorded in the financial statements of the Fund because the Fund is not party to the suit.
Indemnifications:
Under the Company's organizational documents, the Company shall indemnify its officers and directors to the full extent required or permitted under Maryland General Corporation Law and the federal securities laws. In addition, the Company, on behalf of the Fund, may enter into contracts that contain a variety of indemnifications. The Company's maximum exposure under these arrangements is unknown. However, as of the date of these financial statements, the Company has not had prior claims or losses pursuant to these contracts and expects the risk of loss to be remote.
Subsequent Event:
Effective December 1, 2014, pursuant to a sub-transfer agency agreement between HASCO and Boston Financial Data Services, Inc. (“BFDS”), HASCO has delegated certain transfer agent, dividend disbursing agent and shareholder servicing agent functions to BFDS. The costs and expenses of such delegation are borne by HASCO, not by the Fund.
| 23 |
| The Hartford Municipal Opportunities Fund |
| Financial Highlights |
| - Selected Per-Share Data - (A) | - Ratios and Supplemental Data - | |||||||||||||||||||||||||||||||||||||||||||||||||||
| Class | Net Asset Value at Beginning of Period | Net Investment Income (Loss) | Net Realized and Unrealized Gain (Loss) on Invest- ments | Total from Investment Operations | Dividends from Net Investment Income | Distribu- tions from Realized Capital Gains | Total Dividends and Distributions | Net Asset Value at End of Period | Total Return(B) | Net Assets at End of Period (000's) | Ratio of Expenses to Average Net Assets Before Adjust- ments(C) | Ratio of Expenses to Average Net Assets After Adjust- ments(C) | Ratio of Net Investment Income (Loss) to Average Net Assets | |||||||||||||||||||||||||||||||||||||||
| For the Year Ended October 31, 2014 | ||||||||||||||||||||||||||||||||||||||||||||||||||||
| A | $ | 8.24 | $ | 0.25 | $ | 0.30 | $ | 0.55 | $ | (0.26 | ) | $ | – | $ | (0.26 | ) | $ | 8.53 | 6.70 | % | $ | 192,531 | 0.90 | % | 0.85 | % | 3.03 | % | ||||||||||||||||||||||||
| B | 8.23 | 0.19 | 0.30 | 0.49 | (0.19 | ) | – | (0.19 | ) | 8.53 | 6.04 | 3,216 | 1.72 | 1.60 | 2.30 | |||||||||||||||||||||||||||||||||||||
| C | 8.24 | 0.19 | 0.30 | 0.49 | (0.19 | ) | – | (0.19 | ) | 8.54 | 6.03 | 91,177 | 1.66 | 1.60 | 2.29 | |||||||||||||||||||||||||||||||||||||
| I | 8.25 | 0.27 | 0.31 | 0.58 | (0.28 | ) | – | (0.28 | ) | 8.55 | 7.08 | 102,341 | 0.65 | 0.60 | 3.26 | |||||||||||||||||||||||||||||||||||||
| For the Year Ended October 31, 2013 | ||||||||||||||||||||||||||||||||||||||||||||||||||||
| A | $ | 8.66 | $ | 0.29 | $ | (0.42 | ) | $ | (0.13 | ) | $ | (0.29 | ) | $ | – | $ | (0.29 | ) | $ | 8.24 | (1.58 | )% | $ | 153,818 | 0.91 | % | 0.91 | %(D) | 3.35 | % | ||||||||||||||||||||||
| B | 8.66 | 0.22 | (0.43 | ) | (0.21 | ) | (0.22 | ) | – | (0.22 | ) | 8.23 | (2.44 | ) | 4,161 | 1.72 | 1.66 | (D) | 2.60 | |||||||||||||||||||||||||||||||||
| C | 8.67 | 0.22 | (0.43 | ) | (0.21 | ) | (0.22 | ) | – | (0.22 | ) | 8.24 | (2.44 | ) | 86,844 | 1.66 | 1.66 | (D) | 2.60 | |||||||||||||||||||||||||||||||||
| I | 8.68 | 0.31 | (0.43 | ) | (0.12 | ) | (0.31 | ) | – | (0.31 | ) | 8.25 | (1.45 | ) | 58,996 | 0.66 | 0.66 | (D) | 3.60 | |||||||||||||||||||||||||||||||||
| For the Year Ended October 31, 2012 (E) | ||||||||||||||||||||||||||||||||||||||||||||||||||||
| A | $ | 8.01 | $ | 0.34 | $ | 0.65 | $ | 0.99 | $ | (0.34 | ) | $ | – | $ | (0.34 | ) | $ | 8.66 | 12.58 | % | $ | 202,931 | 0.91 | % | 0.91 | %(D) | 4.05 | % | ||||||||||||||||||||||||
| B | 8.01 | 0.28 | 0.65 | 0.93 | (0.28 | ) | – | (0.28 | ) | 8.66 | 11.75 | 5,597 | 1.72 | 1.66 | (D) | 3.32 | ||||||||||||||||||||||||||||||||||||
| C | 8.02 | 0.28 | 0.65 | 0.93 | (0.28 | ) | – | (0.28 | ) | 8.67 | 11.73 | 117,699 | 1.67 | 1.66 | (D) | 3.31 | ||||||||||||||||||||||||||||||||||||
| I | 8.03 | 0.36 | 0.65 | 1.01 | (0.36 | ) | – | (0.36 | ) | 8.68 | 12.83 | 78,183 | 0.67 | 0.66 | (D) | 4.31 | ||||||||||||||||||||||||||||||||||||
| For the Year Ended October 31, 2011 (E) | ||||||||||||||||||||||||||||||||||||||||||||||||||||
| A | $ | 8.47 | $ | 0.44 | $ | (0.46 | ) | $ | (0.02 | ) | $ | (0.44 | ) | $ | – | $ | (0.44 | ) | $ | 8.01 | 0.03 | % | $ | 177,569 | 0.94 | % | 0.93 | %(D) | 5.58 | % | ||||||||||||||||||||||
| B | 8.47 | 0.38 | (0.46 | ) | (0.08 | ) | (0.38 | ) | – | (0.38 | ) | 8.01 | (0.72 | ) | 5,739 | 1.75 | 1.68 | (D) | 4.84 | |||||||||||||||||||||||||||||||||
| C | 8.48 | 0.38 | (0.46 | ) | (0.08 | ) | (0.38 | ) | – | (0.38 | ) | 8.02 | (0.72 | ) | 103,439 | 1.70 | 1.68 | (D) | 4.83 | |||||||||||||||||||||||||||||||||
| I | 8.49 | 0.46 | (0.46 | ) | – | (0.46 | ) | – | (0.46 | ) | 8.03 | 0.28 | 69,575 | 0.70 | 0.68 | (D) | 5.82 | |||||||||||||||||||||||||||||||||||
| For the Year Ended October 31, 2010 (E) | ||||||||||||||||||||||||||||||||||||||||||||||||||||
| A | $ | 8.02 | $ | 0.45 | $ | 0.45 | $ | 0.90 | $ | (0.45 | ) | $ | – | $ | (0.45 | ) | $ | 8.47 | 11.56 | % | $ | 238,332 | 0.92 | % | 0.92 | %(F) | 5.49 | % | ||||||||||||||||||||||||
| B | 8.01 | 0.38 | 0.47 | 0.85 | (0.39 | ) | – | (0.39 | ) | 8.47 | 10.82 | 7,475 | 1.72 | 1.72 | (F) | 4.68 | ||||||||||||||||||||||||||||||||||||
| C | 8.02 | 0.39 | 0.46 | 0.85 | (0.39 | ) | – | (0.39 | ) | 8.48 | 10.85 | 128,723 | 1.68 | 1.68 | (F) | 4.72 | ||||||||||||||||||||||||||||||||||||
| I | 8.03 | 0.47 | 0.46 | 0.93 | (0.47 | ) | – | (0.47 | ) | 8.49 | 11.93 | 81,795 | 0.68 | 0.68 | (F) | 5.72 | ||||||||||||||||||||||||||||||||||||
| (A) | Information presented relates to a share outstanding throughout the indicated period. Net investment income (loss) per share amounts are calculated based on average shares outstanding unless otherwise noted. |
| (B) | Assumes initial investment at net asset value at the beginning of each period, reinvestment of all distributions, the complete redemption of the investment at net asset value at the end of each period and no sales charge. Total return would be reduced if sales charges were taken into account. |
| (C) | Adjustments include waivers and reimbursements, if applicable. |
| (D) | Excluding the expenses not subject to cap, the ratio would have been 0.90%, 1.65%, 1.65% and 0.65% for Class A, Class B, Class C and Class I, respectively. |
| (E) | Net investment income (loss) per share amounts have been calculated using the SEC method. |
| (F) | Excluding the expenses not subject to cap, the ratio would have been 0.90%, 1.70%, 1.66% and 0.66% for Class A, Class B, Class C and Class I, respectively. |
See Portfolio Turnover information on the next page.
| 24 |
| The Hartford Municipal Opportunities Fund |
| Financial Highlights – (continued) |
| Portfolio Turnover Rate for All Share Classes | ||||
| For the Year Ended October 31, 2014 | 29 | % | ||
| For the Year Ended October 31, 2013 | 37 | |||
| For the Year Ended October 31, 2012 | 51 | |||
| For the Year Ended October 31, 2011 | 41 | |||
| For the Year Ended October 31, 2010 | 15 | |||
| 25 |
| Report of Independent Registered Public Accounting Firm |
| The Board of Directors and Shareholders of |
| The Hartford Mutual Funds, Inc. |
We have audited the accompanying statement of assets and liabilities, including the schedule of investments, of The Hartford Municipal Opportunities Fund (one of the portfolios constituting The Hartford Mutual Funds, Inc. (the Funds)) as of October 31, 2014, and the related statement of operations for the year then ended, the statements of changes in net assets for each of the two years in the period then ended, and the financial highlights for each of the five years in the period then ended. These financial statements and financial highlights are the responsibility of the Funds’ management. Our responsibility is to express an opinion on these financial statements and financial highlights based on our audits.
We conducted our audits in accordance with the standards of the Public Company Accounting Oversight Board (United States). Those standards require that we plan and perform the audit to obtain reasonable assurance about whether the financial statements and financial highlights are free of material misstatement. We were not engaged to perform an audit of the Funds’ internal control over financial reporting. Our audits included consideration of internal control over financial reporting as a basis for designing audit procedures that are appropriate in the circumstances, but not for the purpose of expressing an opinion on the effectiveness of the Funds’ internal control over financial reporting. Accordingly, we express no such opinion. An audit also includes examining, on a test basis, evidence supporting the amounts and disclosures in the financial statements and financial highlights, assessing the accounting principles used and significant estimates made by management, and evaluating the overall financial statement presentation. Our procedures included confirmation of securities owned as of October 31, 2014, by correspondence with the custodian and brokers or by other appropriate auditing procedures where replies from brokers were not received. We believe that our audits provide a reasonable basis for our opinion.
In our opinion, the financial statements and financial highlights referred to above present fairly, in all material respects, the financial position of The Hartford Municipal Opportunities Fund of The Hartford Mutual Funds, Inc. at October 31, 2014, the results of its operations for the year then ended, the changes in its net assets for each of the two years in the period then ended, and the financial highlights for each of the five years in the period then ended, in conformity with U.S. generally accepted accounting principles.
| |
| Minneapolis, Minnesota December 18, 2014 |
| 26 |
| The Hartford Municipal Opportunities Fund |
| Directors and Officers (Unaudited) |
The Board of Directors of the Company (the "Directors") appoints officers who are responsible for the day-to-day operations of the Fund and who execute policies formulated by the Directors. Each Director serves until his or her death, resignation, or retirement or until the next annual meeting of shareholders is held or until his or her successor is elected and qualifies.
Directors and officers who are employed by or who have a financial interest in The Hartford Financial Services Group, Inc. ("The Hartford") are considered “interested” persons of the Fund pursuant to the 1940 Act. Each officer and two of the Company's Directors, as noted in the chart below, are “interested” persons of the Fund. Each Director serves as a director for The Hartford Mutual Funds, Inc., The Hartford Mutual Funds II, Inc., Hartford Series Fund, Inc., and Hartford HLS Series Fund II, Inc., and as a trustee for The Hartford Alternative Strategies Fund, which, as of October 31, 2014, collectively consist of 66 funds. Correspondence may be sent to Directors and officers c/o Hartford Funds, 5 Radnor Corporate Center, Suite 300, 100 Matsonford Road, Radnor, Pennsylvania 19087, except that correspondence to Mr. Annoni, Mr. Dressen and Ms. Quade may be sent to 500 Bielenberg Drive, Suite 500, Woodbury, Minnesota 55125.
The table below sets forth, for each Director and officer, his or her name, year of birth, current position with the Company and date first elected or appointed to The Hartford Mutual Funds, Inc. ("MF") and The Hartford Mutual Funds II, Inc. ("MF2"), principal occupation, and, for Directors, other directorships held. The Fund’s Statement of Additional Information contains further information on the Directors and is available free of charge by calling 1-888-843-7824 or writing to: Hartford Funds, P.O. Box 55022, Boston, MA 02205-5022.
Information on the aggregate remuneration paid to the directors of the Company can be found in the Statement of Operations herein. The Fund pays to The Hartford a portion of the Chief Compliance Officer’s compensation, but does not pay salaries or compensation to any of its other officers or Directors who are employed by The Hartford.
Non-Interested Directors
Hilary E. Ackermann (1956) Director since September 23, 2014
Ms. Ackermann served as Chief Risk Officer at Goldman Sachs Bank USA from October 2008 to November 2011 and serves as a Director of Dynegy, Inc., an independent power company, from October 2012 to present.
Lynn S. Birdsong (1946) Director since 2003, Chairman of the Investment Committee since 2014
Mr. Birdsong is a private investor. Mr. Birdsong currently serves as a Director of the Sovereign High Yield Investment Company (April 2010 to current). Mr. Birdsong currently serves as an Independent Director of Nomura Partners Funds, Inc. (formerly, The Japan Fund) (April 2003 to current). From 2003 to March 2005, Mr. Birdsong was an Independent Director of the Atlantic Whitehall Funds. From 1979 to 2002, Mr. Birdsong was a Managing Director of Zurich Scudder Investments, an investment management firm. During his employment with Scudder, Mr. Birdsong was an Interested Director of The Japan Fund. From January 1981 through December 2013, Mr. Birdsong was a partner in Birdsong Company, an advertising specialty firm.
Robert M. Gavin, Jr. (1940) Director since 2002 (MF) and 1986 (MF2), Chairman of the Board for each since 2004
Dr. Gavin is an educational consultant. Prior to September 1, 2001, he was President of Cranbrook Education Community and prior to July 1996, he was President of Macalester College, St. Paul, Minnesota.
Duane E. Hill (1945) Director since 2001 (MF) and 2002 (MF2), Chairman of the Nominating Committee since 2003
Mr. Hill is a Partner of TSG Ventures L.P., a private equity investment company. Mr. Hill is a former partner of TSG Capital Group, a private equity investment firm that served as sponsor and lead investor in leveraged buyouts of middle market companies.
Sandra S. Jaffee (1941) Director since 2005
Ms. Jaffee is the founder and Chief Executive Officer of a private company, Homeworks Concierge, LLC, which provides residential property management services in Westchester County, New York (January 2012 to present). Ms. Jaffee served as Chairman (2008 to 2009) and Chief Executive Officer of Fortent (formerly Searchspace Group), a leading provider of compliance/regulatory technology to financial institutions from August 2005 to August 2009. From August 2004 to August 2005, Ms. Jaffee served as an Entrepreneur in Residence with Warburg Pincus, a private equity firm. Prior to joining Warburg Pincus, Ms. Jaffee served as Executive Vice President at Citigroup, from September 1995 to July 2004, where she was President and Chief Executive Officer of Citibank’s Global Securities Services (1995 to 2003). Ms. Jaffee currently serves as a member of the Board of Directors of Broadridge Financial Solutions as well as a Trustee of Muhlenberg College.
| 27 |
| The Hartford Municipal Opportunities Fund |
| Directors and Officers (Unaudited) – (continued) |
William P. Johnston (1944) Director since 2005, Chairman of the Compliance Committee since 2005
In June 2006, Mr. Johnston was appointed as Senior Advisor to The Carlyle Group, a global private equity and other alternative asset investment firm and currently serves as an Operating Executive. In July 2006, Mr. Johnston was elected to the Board of Directors of MultiPlan, Inc. and served as a Director (July 2006 to August 2010). In August 2007, Mr. Johnston was elected to the Board of Directors of LifeCare Holdings, Inc. and served as a Director (August 2007 to June 2013). In February 2008, Mr. Johnston was elected to the Board of Directors of HCR-ManorCare, Inc. In May 2006, Mr. Johnston was elected to the Supervisory Board of Fresenius Medical Care AG & Co. KGaA, after its acquisition of Renal Care Group, Inc. in March 2006. Mr. Johnston joined Renal Care Group in November 2002 as a member of the Board of Directors and served as Chairman of the Board from March 2003 through March 2006. From 2002 through 2013, Mr. Johnston served as a Board member of the Georgia O’Keefe Museum. From September 1987 to December 2002, Mr. Johnston was with Equitable Securities Corporation (and its successors, SunTrust Equitable Securities and SunTrust Robinson Humphrey) serving in various investment banking and managerial positions, including Managing Director and Head of Investment Banking, Chief Executive Officer and Vice Chairman.
Phillip O. Peterson (1944) Director since 2002 (MF) and 2000 (MF2), Chairman of the Audit Committee since 2002
Mr. Peterson is a mutual fund industry consultant. He was a partner of KPMG LLP (an accounting firm) until July 1999. Mr. Peterson joined William Blair Funds in February 2007 as a member of the Board of Trustees. From February 2012 to February 2014, Mr. Peterson served as a Trustee of Symetra Variable Mutual Funds. From January 2004 to April 2005, Mr. Peterson served as Independent President of the Strong Mutual Funds.
Lemma W. Senbet (1946) Director since 2005
Dr. Senbet is the William E. Mayer Chair Professor of Finance and Founding Director, Center for Financial Policy, at the University of Maryland, Robert H. Smith School of Business. He was chair of the Finance Department of the University of Maryland, Robert H. Smith School of Business from 1998 to 2006. Since June 2013, he has been on leave from the University to serve as Executive Director of African Economic Research Consortium which focuses on economic policy research and training. Previously, he was a chaired professor of finance at the University of Wisconsin-Madison. Also, he was a Director of the Fortis Funds from March 2000 to July 2002. Dr. Senbet served as Director of the American Finance Association and President of the Western Finance Association. In 2006, Dr. Senbet was inducted Fellow of Financial Management Association International for his career-long distinguished scholarship and professional service.
Interested Directors and Officers
James E. Davey (1964) Director since 2012, President and Chief Executive Officer since 2010
Mr. Davey serves as Executive Vice President of Hartford Life Insurance Company (“HLIC”) and The Hartford. Additionally, Mr. Davey serves as Chairman of the Board, Manager and Senior Managing Director of Hartford Funds Distributors, LLC (“HFD”). He also currently serves as Director, Chairman of the Board, President and Senior Managing Director of Hartford Administrative Services Company (“HASCO”). Mr. Davey also serves as Manager, Chairman of the Board and Senior Managing Director for Hartford Funds Management Company, LLC (“HFMC”) and Director, Chairman of the Board and Senior Managing Director for Hartford Funds Management Group, Inc. ("HFMG"). Mr. Davey has served in various positions within The Hartford and its subsidiaries in connection with the operation of the Hartford Funds. Mr. Davey joined The Hartford in 2002.
Lowndes A. Smith* (1939) Director since 1996 (MF) and 2002 (MF2)
Mr. Smith served as Vice Chairman of The Hartford from February 1997 to January 2002, as President and Chief Executive Officer of Hartford Life, Inc. from February 1997 to January 2002, and as President and Chief Operating Officer of The Hartford Life Insurance Companies from January 1989 to January 2002. Mr. Smith serves as a Director of White Mountains Insurance Group Ltd. (October 2003 to current); One Beacon Insurance (October 2006 to current); Symetra Financial (August 2007 to current) and is a Managing Director of Whittington Gray Associates (January 2007 to current).
* Mr. Smith resigned as a Director of MF, MF2, Hartford Series Fund, Inc. and Hartford HLS Series Fund II, Inc. and as a Trustee of The Hartford Alternative Strategies Fund effective September 17, 2014.
Other Officers
Mark A. Annoni (1964) Vice President, Controller and Treasurer since 2012
Mr. Annoni currently serves as the Assistant Vice President of HLIC (February 2004 to present) and Senior Vice President of HFMG (December 2013 to present). Mr. Annoni has served in various positions within The Hartford and its subsidiaries in connection with the operation of the Hartford Funds. Mr. Annoni joined The Hartford in 2001.
| 28 |
| The Hartford Municipal Opportunities Fund |
| Directors and Officers (Unaudited) – (continued) |
Michael R. Dressen (1963) AML Compliance Officer since 2011
Mr. Dressen currently serves as Assistant Vice President of HLIC. He also serves as Chief Compliance Officer and AML Compliance Officer of HASCO and as AML Officer of HFD. Mr. Dressen has served in various positions within The Hartford and its subsidiaries in connection with the operation of the Hartford Funds.
Edward P. Macdonald (1967) Vice President, Secretary and Chief Legal Officer since 2005
Mr. Macdonald currently serves as Assistant Secretary, Executive Vice President and Deputy General Counsel of HFD, HASCO, HFMC and HFMG. He also serves as Vice President of HLIC. Mr. Macdonald has served in various positions within The Hartford and its subsidiaries in connection with the operation of the Hartford Funds. Mr. Macdonald joined The Hartford in 2005.
Joseph G. Melcher (1973) Vice President and Chief Compliance Officer since 2013
Mr. Melcher currently serves as Executive Vice President of HFD, HFMG and HASCO. Mr. Melcher also currently serves as Executive Vice President and Chief Compliance Officer of HFMC. Mr. Melcher has served in various positions within The Hartford and its subsidiaries in connection with the operation of the Hartford Funds since joining The Hartford in 2012. Prior to joining The Hartford, Mr. Melcher worked at Touchstone Investments, a member of the Western & Southern Financial Group, where he held the position of Vice President and Chief Compliance Officer from 2010 through 2012 and Assistant Vice President, Compliance from 2005 to 2010.
Vernon J. Meyer (1964) Vice President since 2006
Mr. Meyer currently serves as Senior Vice President of HLIC. He also currently serves as Managing Director and Chief Investment Officer of HFMC and Managing Director of HFMG. Mr. Meyer has served in various positions within The Hartford and its subsidiaries in connection with the operation of the Hartford Funds. Mr. Meyer joined The Hartford in 2004.
Laura S. Quade (1969) Vice President since 2012
Ms. Quade currently serves as Vice President of HASCO, HFD and HFMG. She is the Head of Operations of HASCO and formerly served as Director, Enterprise Operations of HLIC. Ms. Quade has served in various positions within The Hartford and its subsidiaries in connection with the operation of the Hartford Funds. Ms. Quade joined The Hartford in 2001.
Martin A. Swanson** (1962) Vice President since 2010
Mr. Swanson currently serves as Vice President of HLIC. Mr. Swanson also serves as Managing Director, Chief Marketing Officer and Principal of HFD and Managing Director of HFMG. Mr. Swanson has served in various positions within The Hartford and its subsidiaries in connection with the operation of the Hartford Funds.
** Mr. Swanson resigned as an officer effective November 6, 2014.
HOW TO OBTAIN A COPY OF THE FUND’S PROXY VOTING POLICIES AND VOTING RECORDS (UNAUDITED)
A description of the policies and procedures that the Fund uses to determine how to vote proxies relating to portfolio securities and information about how the Fund voted proxies relating to portfolio securities during the most recent twelve-month period ended June 30 are available (1) without charge, upon request, by calling 888-843-7824 and (2) on the SEC’s website at http://www.sec.gov.
QUARTERLY PORTFOLIO HOLDINGS INFORMATION (UNAUDITED)
The Fund files a complete schedule of portfolio holdings with the SEC for the first and third quarters of each fiscal year on Form N-Q. The Fund’s Forms N-Q are available (1) without charge, upon request, by calling 888-843-7824 and (2) on the SEC’s website at http://www.sec.gov. The Form N-Q may be reviewed and copied at the SEC’s Public Reference Room in Washington, DC. Information on the operation of the Public Reference Room may be obtained by calling 1-800-SEC-0330.
| 29 |
| The Hartford Municipal Opportunities Fund |
| Federal Tax Information (Unaudited) |
For the fiscal year ended October 31, 2014, there is no further federal tax information required for this Fund.
| 30 |
| The Hartford Municipal Opportunities Fund |
| Expense Example (Unaudited) |
Your Fund's Expenses
As a shareholder of the Fund, you incur two types of costs: (1) transaction costs, including sales charges (loads) on purchase payments, if any, and contingent deferred sales charges (CDSC), if any, and (2) ongoing costs, including investment management fees, distribution and/or service (12b-1) fees, if any, and other fund expenses. This example is intended to help you understand your ongoing costs (in dollars) of investing in the Fund and to compare these costs with the ongoing costs of investing in other mutual funds. The example is based on an investment of $1,000 invested at the beginning of the period and held for the entire period of April 30, 2014 through October 31, 2014.
Actual Expenses
The first set of columns of the table below provides information about actual account values and actual expenses. You may use the information in this column, together with the amount you invested, to estimate the expenses that you paid over the period. Simply divide your account value by $1,000 (for example, an $8,600 account value divided by $1,000 = 8.6), then multiply the result by the number in the line under the heading entitled “Expenses Paid During Period” to estimate the expenses you paid on your account during this period.
Hypothetical Example for Comparison Purposes
The second set of columns of the table below provides information about hypothetical account values and hypothetical expenses based on the Fund's actual expense ratio and an assumed rate of return of 5% per year before expenses, which is not the Fund's actual return. The hypothetical account values and expenses may not be used to estimate the actual ending account balance or expenses you paid for the period. You may use this information to compare the ongoing costs of investing in the Fund and other funds. To do so, compare this 5% hypothetical example with the 5% hypothetical examples that appear in the shareholder reports of the other funds.
Please note that the expenses shown in the table are meant to highlight your ongoing costs only and do not reflect any transactional costs, such as sales charges (loads) and CDSC. Therefore, the second set of columns of the table is useful in comparing ongoing costs only, and will not help you determine the relative total costs of owning different funds. In addition, if these transactional costs were included, your costs would be higher. Expenses are equal to the Fund's annualized expense ratios multiplied by average account value over the period, multiplied by 184/365 (to reflect the one-half year period).
| Actual return | Hypothetical (5% return before expenses) | |||||||||||||||||||||||||||||||
| Beginning Account Value April 30, 2014 | Ending Account Value October 31, 2014 | Expenses paid during the period April 30, 2014 through October 31, 2014 | Beginning Account Value April 30, 2014 | Ending Account Value October 31, 2014 | Expenses paid during the period April 30, 2014 through October 31, 2014 | Annualized expense ratio | Days in the current 1/2 year | Days in the full year | ||||||||||||||||||||||||
| Class A | $ | 1,000.00 | $ | 1,035.10 | $ | 4.37 | $ | 1,000.00 | $ | 1,020.91 | $ | 4.34 | 0.85 | % | 184 | 365 | ||||||||||||||||
| Class B | $ | 1,000.00 | $ | 1,031.20 | $ | 8.19 | $ | 1,000.00 | $ | 1,017.14 | $ | 8.14 | 1.60 | 184 | 365 | |||||||||||||||||
| Class C | $ | 1,000.00 | $ | 1,031.20 | $ | 8.19 | $ | 1,000.00 | $ | 1,017.14 | $ | 8.14 | 1.60 | 184 | 365 | |||||||||||||||||
| Class I | $ | 1,000.00 | $ | 1,036.30 | $ | 3.08 | $ | 1,000.00 | $ | 1,022.18 | $ | 3.06 | 0.60 | 184 | 365 | |||||||||||||||||
| 31 |
| The Hartford Municipal Opportunities Fund |
| Approval of Investment Management and Investment Sub-Advisory Agreements (Unaudited) |
Section 15(c) of the Investment Company Act of 1940, as amended (the “1940 Act”), requires that each mutual fund’s board of directors, including a majority of those directors who are not “interested persons” of the mutual fund, as defined in the 1940 Act (the “Independent Directors”), annually review and consider the continuation of the mutual fund’s investment advisory and sub-advisory agreements. At its meeting held on August 5-6, 2014, the Board of Directors (the “Board”) of The Hartford Mutual Funds, Inc., including each of the Independent Directors, unanimously voted to approve the continuation of the investment management agreement for The Hartford Municipal Opportunities Fund (the “Fund”) with Hartford Funds Management Company, LLC (“HFMC”) and the continuation of the investment sub-advisory agreement between HFMC and the Fund’s sub-adviser, Wellington Management Company, LLP (the “Sub-adviser,” and together with HFMC, the “Advisers”) (collectively, the “Agreements”).
In the months preceding the August 5-6, 2014 meeting, the Board requested, received and reviewed written responses from the Advisers to questions posed to them on behalf of the Independent Directors and supporting materials relating to those questions and responses. The Board considered information furnished to the Board at its meetings throughout the year, as well as information specifically prepared in connection with the annual approval of the Agreements at the Board’s meetings held on June 17-18, 2014 and August 5-6, 2014. Information provided to the Board at its meetings throughout the year included, among other things, reports on Fund performance, legal and compliance matters, sales and marketing activity, shareholder services, and the other services provided to the Fund by the Advisers and their affiliates. The Board also received in-person presentations by Fund officers and representatives of HFMC at the Board’s meetings on June 17-18, 2014 and August 5-6, 2014 concerning the Agreements.
The Independent Directors, advised by independent legal counsel, engaged service providers to assist them with evaluating the Agreements with respect to the Fund. Lipper Inc. (“Lipper”), an independent provider of investment company data, was retained to provide the Board with reports on how the Fund’s contractual management fees, actual management fees, other non-management fees, overall expense ratios and investment performance compared to those of mutual funds with similar investment objectives. The Independent Directors also engaged an independent financial services consultant (the “Consultant”) to assist them in evaluating the Fund’s management fees, sub-advisory fees, other non-management fees, overall expense ratios and investment performance. In addition, the Consultant reviewed the profitability calculations utilized by HFMC in connection with the continuation of the investment management agreement.
In determining whether to continue the Agreements for the Fund, the members of the Board reviewed and evaluated information and factors they believed to be relevant and appropriate in light of the information that the Board deemed necessary and appropriate through the exercise of its reasonable business judgment. While individual members of the Board may have weighed certain factors differently, the Board’s determination to continue the Agreements was based on a comprehensive consideration of all information provided to the Board throughout the year and specifically with respect to the continuation of the Agreements. A more detailed discussion of the factors the Board considered with respect to its approval of the Agreements is provided below.
Nature, Extent and Quality of Services Provided by the Advisers
The Board requested and considered information concerning the nature, extent and quality of the services provided to the Fund by the Advisers. The Board considered, among other things, the terms of the Agreements and the range of services provided by the Advisers. The Board considered the Advisers’ professional personnel who provide services to the Fund, including each Adviser’s ability and experience in attracting and retaining qualified personnel to service the Fund. The Board considered each Adviser’s reputation and overall financial strength, as well as its willingness to consider and implement organizational and operational changes designed to enhance services to the Hartford Funds. In addition, the Board considered the quality of each Adviser’s communications with the Board and responsiveness to Board inquiries and requests made from time to time with respect to the Fund and other Hartford Funds.
The Board also requested and evaluated information concerning each Adviser’s regulatory and compliance environment. In this regard, the Board requested and reviewed information on each Adviser’s compliance policies and procedures, compliance history, and a report from the Fund’s Chief Compliance Officer on each Adviser’s compliance with applicable laws and regulations, including responses to regulatory developments and compliance issues raised by regulators. The Board also noted the Advisers’ support of the Fund’s compliance control structure, particularly the resources devoted by the Advisers in support of the Fund’s obligations pursuant to Rule 38a-1 under the 1940 Act.
With respect to HFMC, the Board noted that, under the Agreements, HFMC is responsible for the management of the Fund, including oversight of fund operations and service providers, and provides administrative and investment advisory services in connection with selecting, monitoring and supervising the Sub-adviser. The Board considered HFMC’s ongoing monitoring of people, process and performance, including its quarterly reviews of each of the Hartford Funds, semi-annual meetings with the leaders of each Fund’s portfolio management team, and oversight of the Hartford Funds’ approximately 66 portfolio managers. The Board recognized that HFMC has demonstrated a record of making changes to the
| 32 |
| The Hartford Municipal Opportunities Fund |
| Approval of Investment Management and Investment Sub-Advisory Agreements (Unaudited) – (continued) |
management and/or strategies of the Hartford Funds when warranted. The Board considered HFMC’s oversight of the Sub-adviser’s investment approach and results, process for monitoring best execution of portfolio trades by the Sub-adviser, and approach to risk management with respect to the Fund and the service providers to the Fund. The Board also considered HFMC’s oversight of compliance with the Fund’s objective and policies as well as with applicable laws and regulations, noting that regulatory and other developments had over time led to an increase in the scope of HFMC’s services in this regard.
In addition, the Board considered HFMC’s ongoing commitment to review and rationalize the Hartford Funds product line-up and the expenses that HFMC had incurred in connection with fund combinations in recent years. The Board considered that HFMC or its affiliates are responsible for providing the Fund’s officers.
With respect to the Sub-adviser, which provides certain day-to-day portfolio management services for the Fund, the Board considered the quality of the Fund’s portfolio managers, the Sub-adviser’s other investment personnel, its investment philosophy and process, investment research capabilities and resources, performance record, trade execution capabilities and experience. The Board considered the experience of the Fund’s portfolio managers, the number of accounts managed by the portfolio managers, and the Sub-adviser’s method for compensating the portfolio managers.
Based on these considerations, the Board concluded that it was satisfied with the nature, extent and quality of the services provided to the Fund by HFMC and the Sub-adviser.
Performance of the Fund and the Advisers
The Board considered the investment performance of the Fund. In this regard, the Board reviewed the performance of the Fund over different time periods presented in the materials and evaluated HFMC’s analysis of the Fund’s performance for these time periods. The Board considered information and materials provided to the Board by the Advisers concerning Fund performance, as well as information from Lipper comparing the investment performance of the Fund to an appropriate benchmark and universe of peer funds. The Board noted that the Fund’s performance was in the 5th quintile of its performance universe for the 1-year period, the 2nd quintile for the 3-year period and the 1st quintile for the 5-year period. The Board also noted that the Fund’s performance was below its benchmark for the 1-year period and above its benchmark for the 3- and 5-year periods.
The Board considered the detailed investment analytics reports provided by Hartford Funds’ Investment Advisory Group throughout the year. These reports include, among other things, information on the Fund’s gross and net returns, the Fund’s investment performance relative to an appropriate benchmark and peer group, various statistics concerning the Fund’s portfolio, and a narrative summary of various factors affecting Fund performance. The Board considered the Advisers’ cooperation with the Investment Committee, which assists the Board in evaluating the performance of the Fund at periodic meetings throughout the year. The Board also considered the analysis provided by the Consultant relating to the Fund’s performance track record.
In light of all the considerations noted above, the Board concluded that it had continued confidence in HFMC’s and the Sub-adviser’s overall capabilities to manage the Fund.
Costs of the Services and Profitability of the Advisers
The Board reviewed information regarding HFMC’s cost to provide investment management and related services to the Fund and HFMC’s profitability, both overall and for the Fund, on a pre-tax basis without regard to distribution expenses. The Board also requested and reviewed information about the profitability to HFMC and its affiliates from all services provided to the Fund and all aspects of their relationship with the Fund. The Board also requested and received information relating to the operations and profitability of the Sub-adviser.
The Board considered the Consultant’s review of the profitability calculations used by HFMC in connection with the continuation of the investment management agreement, noting the Consultant’s view that Hartford Funds’ process for calculating and reporting Fund profitability is reasonable. In this regard, the Board noted that the Consultant performed a full review of this process in light of the recent restructuring of the Hartford Funds business and reported that the approach to analyzing Fund profitability, including the use of common expense allocation methodologies, is reasonable, sound and well within common industry practice.
Based on these considerations, the Board concluded that the profits anticipated to be realized by the Advisers and their affiliates from their relationships with the Fund would not be excessive.
| 33 |
| The Hartford Municipal Opportunities Fund |
| Approval of Investment Management and Investment Sub-Advisory Agreements (Unaudited) – (continued) |
Comparison of Fees and Services Provided by the Advisers
The Board considered comparative information with respect to the management fees to be paid by the Fund to HFMC and the total expense ratios of the Fund. The Board also considered comparative information with respect to the sub-advisory fees to be paid by HFMC to the Sub-adviser. In this regard, the Board requested and reviewed information from HFMC and the Sub-adviser relating to the management and sub-advisory fees, including the sub-advisory fee schedule for the Fund, and total operating expenses for the Fund. With respect to the sub-advisory fee schedule, the Board considered representations from HFMC and the Sub-adviser that the Sub-adviser’s fees were negotiated at arm’s length on a fund-by-fund basis. The Board also reviewed information from Lipper comparing the Fund’s contractual management fees, actual management fees and overall expense ratios relative to a group of funds selected by Lipper, in consultation with the Consultant, and a broader universe of funds selected by Lipper. The Board considered that the Fund’s contractual management fee was in the 3rd quintile of its expense group, while its actual management fee and its total expenses (less 12b-1 and shareholder service fees) were in the 4th quintile. The Board noted that the Fund has an automatically renewable contractual expense cap for each share class. The expense cap resulted in reimbursement of certain expenses incurred in 2013.
While the Board recognized that comparisons between the Fund and peer funds may be imprecise, given the different service levels and characteristics of mutual funds and the different business models and cost structures of the Advisers, the comparative information provided by Lipper assisted the Board in evaluating the reasonableness of the Fund’s management and sub-advisory fees and total operating expenses. In addition, the Board considered the analysis and recommendations of the Consultant relating to the Fund’s management and sub-advisory fees and total operating expenses.
Based on these considerations, the Board concluded that the Fund’s fees and total operating expenses, in conjunction with the information about quality of services, profitability, economies of scale, and other matters discussed, were reasonable in light of the services provided.
Economies of Scale
The Board requested and considered information regarding the Advisers’ realization of economies of scale with respect to the Fund and whether the fee levels reflect these economies of scale for the benefit of the Fund’s shareholders. The Board reviewed the breakpoints in the management fee schedule for the Fund, which reduce fee rates as Fund assets grow over time. The Board recognized that a fund with assets beyond the highest breakpoint level will continue to benefit from economies of scale because additional assets are charged the lowest breakpoint fee resulting in lower overall effective management fee rates. The Board also considered that expense limitations and fee waivers that reduce the Fund’s expenses at all asset levels can have the same effect as breakpoints in sharing economies of scale with shareholders and provide protection from an increase in expenses if Fund assets decline. The Board recognized that a fee schedule that reaches a lower breakpoint quickly provides shareholders with the benefit of anticipated or potential economies of scale. The Board also considered that HFMC has been active in managing expenses, which has resulted in benefits being realized by shareholders as assets within the Hartford Funds family of funds have grown over time, including through lower transfer agent costs and other operating expenses.
The Board reviewed and evaluated materials from Lipper and the Consultant showing how management fee schedules of peer funds reflect economies of scale for the benefit of shareholders as a peer fund’s assets hypothetically increase over time. Based on information provided by HFMC, Lipper, and the Consultant, the Board recognized that there is no uniform methodology for establishing breakpoints or uniform pattern in asset levels that trigger breakpoints or the amounts of breakpoints triggered.
After considering all of the information available to it, the Board concluded that it was satisfied with the extent to which economies of scale would be shared for the benefit of the Fund’s shareholders based on currently available information and the effective advisory fees and expense ratios for the Fund at its current and reasonably anticipated asset levels. The Board noted, however, that it would continue to monitor future growth in Fund assets and the appropriateness of additional breakpoints.
Other Benefits
The Board considered other benefits to the Advisers and their affiliates from their relationships with the Fund.
The Board noted that HFMC receives fees for fund accounting and related services from the Fund, and the Board considered information on profits to HFMC for such services. The Board also considered that Hartford Administrative Services Company (“HASCO”), the Fund’s transfer agent and an affiliate of HFMC, receives transfer agency compensation from the Fund, and the Board reviewed information on the profitability of
| 34 |
| The Hartford Municipal Opportunities Fund |
| Approval of Investment Management and Investment Sub-Advisory Agreements (Unaudited) – (continued) |
the Fund’s transfer agency function to HASCO. The Board considered information provided by HASCO indicating that the transfer agent fees charged by HASCO to the Fund were fair and reasonable based on publicly available information.
The Board also considered that Hartford Funds Distributors, LLC (“HFD”), an affiliate of HFMC, serves as principal underwriter of the Fund. As principal underwriter, HFD receives 12b-1 fees from the Fund and receives all or a portion of the sales charges on sales or redemptions of certain classes of shares. The Board also noted that certain affiliates of HFD distribute shares of the Fund and receive compensation in that connection.
The Board considered the benefits, if any, to the Sub-adviser from any use of the Fund’s brokerage commissions to obtain soft dollar research, and representations from HFMC and the Sub-adviser that the Sub-adviser would not make any revenue-sharing payments or any other type of distribution payments to HFMC or its affiliates.
The Board considered the benefits to shareholders of being part of the Hartford Funds family of funds, including the right to exchange investments between the same class of funds without a sales charge, the ability to reinvest Fund dividends into other funds in the family, and the ability to combine holdings in the Fund with holdings in other funds to obtain a reduced sales charge. The Board considered HFMC’s efforts to provide investors in the family with a broad range of investment styles and asset classes and its entrepreneurial risk in initiating new funds to expand these opportunities for shareholders.
* * * *
Based upon its review of these various factors, among others, the Board concluded that it is in the best interests of the Fund and its shareholders for the Board to approve the Agreements for an additional year. In reaching this decision, the Board did not assign relative weights to the factors discussed above or deem any one or group of them to be controlling in and of themselves. In connection with their deliberations, the Independent Directors met separately in executive session on several occasions, with independent legal counsel and the Consultant, to review the relevant materials and consider their responsibilities under relevant laws and regulations.
| 35 |
| The Hartford Municipal Opportunities Fund |
| Main Risks (Unaudited) |
The main risks of investing in the Fund are described below.
Market, Selection and Strategy Risk: The Fund’s share price may fluctuate due to market risk and/or security selections that may underperform the market or relevant benchmarks. If the sub-adviser's investment strategy does not perform as expected, the Fund could underperform its peers or lose money. There is no guarantee the Fund will achieve its stated objective.
Muni Bond Risk: Municipal securities are subject to interest rate risk (the risk that the value of an investment decreases when interest rates rise), credit risk (the risk that the issuing company of a security is unable to pay interest and principal when due), liquidity risk (the risk that an investment may be difficult to sell at an advantageous time or price), call risk (the risk that an investment may be redeemed early), and risks related to changes in the tax-exempt status of the securities.
Derivatives Risk: Investments in derivatives can be volatile. Potential risks include currency risk, leverage risk (the risk that small market movements may result in large changes in the value of an investment), liquidity risk, index risk, pricing risk, and counterparty risk (the risk that the counterparty may be unwilling or unable to honor its obligations).
Junk Bond Risk: Investments in junk bonds involve greater risk of price volatility, illiquidity, and default than higher-rated debt securities.
AMT Risk: Income from the Fund may be subject to income tax, including the Alternative Minimum Tax.
| 36 |
THIS PRIVACY POLICY IS NOT PART OF THIS REPORT
Privacy Policy and Practices of The Hartford Financial Services Group, Inc. and its Affiliates
(herein called “we, our and us”)
This Privacy Policy applies to our United States Operations
|
We value your trust. We are committed to the responsible: a) management; b) use; and c) protection; of Personal Information.
This notice describes how we collect, disclose, and protect Personal Information.
We collect Personal Information to: a) service your Transactions with us; and b) support our business functions.
We may obtain Personal Information from: a) You; b) your Transactions with us; and c) third parties such as a consumer-reporting agency.
Based on the type of product or service You apply for or get from us, Personal Information such as: a) your name; b) your address; c) your income; d) your payment; or e) your credit history; may be gathered from sources such as applications, Transactions, and consumer reports.
To serve You and service our business, we may share certain Personal Information. We will share Personal Information, only as allowed by law, with affiliates such as: a) our insurance companies; b) our employee agents; c) our brokerage firms; and d) our administrators.
As allowed by law, we may share Personal Financial Information with our affiliates to: a) market our products; or b) market our services; to You without providing You with an option to prevent these disclosures.
|
We may also share Personal Information, only as allowed by law, with unaffiliated third parties including: a) independent agents; b) brokerage firms; c) insurance companies; d) administrators; and e) service providers; who help us serve You and service our business.
When allowed by law, we may share certain Personal Financial Information with other unaffiliated third parties who assist us by performing services or functions such as: a) taking surveys; b) marketing our products or services; or c) offering financial products or services under a joint agreement between us and one or more financial institutions.
We, and third parties we partner with, may track some of the pages You visit through the use of: a) cookies; b) pixel tagging; or c) other technologies; and currently do not process or comply with any web browser’s “do not track” signal or similar mechanism that indicates a request to disable online tracking of individual users who visit our websites or use our services.
We will not sell or share your Personal Financial Information with anyone for purposes unrelated to our business functions without offering You the opportunity to: a) “opt-out;” or b) “opt-in;” as required by law.
We only disclose Personal Health Information with: a) your proper written authorization; or b) as otherwise allowed or required by law.
Our employees have access to Personal Information in the course of doing their jobs, such as: a) underwriting policies; b) paying claims; c) developing new products; or d) advising customers of our products and services.
|
|
We use manual and electronic security procedures to maintain: a) the confidentiality; and b) the integrity of; Personal Information that we have. We use these procedures to guard against unauthorized access.
Some techniques we use to protect Personal Information include: a) secured files; b) user authentication; c) encryption; d) firewall technology; and e) the use of detection software.
We are responsible for and must: a) identify information to be protected; b) provide an adequate level of protection for that data; c) grant access to protected data only to those people who must use it in the performance of their job-related duties.
Employees who violate our Privacy Policy will be subject to discipline, which may include ending their employment with us.
At the start of our business relationship, we will give You a copy of our current Privacy Policy.
We will also give You a copy of our current Privacy Policy once a year if You maintain a continuing business relationship with us.
We will continue to follow our Privacy Policy regarding Personal Information even when a business relationship no longer exists between us.
|
As used in this Privacy Notice:
Application means your request for our product or service.
Personal Financial Information means financial information such as: a) credit history; b) income; c) financial benefits; or d) policy or claim information.
Personal Health Information means health information such as: a) your medical records; or b) information about your illness, disability or injury.
Personal Information means information that identifies You personally and is not otherwise available to the public. It includes: a) Personal Financial Information; and b) Personal Health Information.
Transaction means your business dealings with us, such as: a) your Application; b) your request for us to pay a claim; and c) your request for us to take an action on your account.
You means an individual who has given us Personal Information in conjunction with: a) asking about; b) applying for; or c) obtaining; a financial product or service from us if the product or service is used mainly for personal, family, or household purposes.
|
This Privacy Policy is being provided on behalf of the following affiliates of The Hartford Financial Services Group, Inc.:
1stAGChoice, Inc.; Access CoverageCorp, Inc.; Access CoverageCorp Technologies, Inc.; American Maturity Life Insurance Company; Archway 60 R, LLC; Business Management Group, Inc.; Champlain Life Reinsurance Company; DMS R, LLC; Eloy R, LLC; Ersatz Corporation; First State Insurance Company; Hartford Accident and Indemnity Company; Hartford Administrative Services Company; Hartford Casualty General Agency, Inc.; Hartford Casualty Insurance Company; Hartford-Comprehensive Employee Benefit Service Company; Hartford Equity Sales Company, Inc.; Hartford Fire General Agency, Inc.; Hartford Fire Insurance Company; Hartford Funds Management Company, LLC; Hartford Funds Management Group, Inc.; Hartford HLS Series Fund II, Inc.; Hartford Insurance Company of Illinois; Hartford Insurance Company of the Midwest; Hartford Insurance Company of the Southeast; Hartford Integrated Technologies, Inc.; Hartford International Life Reassurance Corporation; Hartford Funds Distributors, LLC; Hartford Investment Management Company; Hartford Life and Accident Insurance Company; Hartford Life and Annuity Insurance Company; Hartford Life Insurance Company; Hartford Life Private Placement, LLC; Hartford Lloyd’s Corporation; Hartford Lloyd’s Insurance Company; Hartford Mezzanine Investors I, LLC; Hartford Residual Market, L.C.C.; Hartford Retirement Services, LLC; Hartford Securities Distribution Company, Inc.; Hartford Series Fund, Inc.; Hartford Specialty Insurance Services of Texas, LLC; Hartford Strategic Investments, LLC; Hartford Underwriters Insurance Company; Hartford Technology Services Company, L.L.C.; Hartford of Texas General Agency, Inc.; Hartford Underwriters General Agency, Inc.; HARTRE Company, L.C.C.; HL Investment Advisors, LLC; HLA LLC; Horizon Management Group, LLC; HRA Brokerage Services, Inc.; Lanidex Class B, LLC; M-CAP Insurance Agency, LLC; New England Insurance Company; New England Reinsurance Corporation; Nutmeg Insurance Agency, Inc.; Nutmeg Insurance Company; Pacific Insurance Company, Limited; Planco, LLC: Property and Casualty Insurance Company of Hartford; Revere R, LLC; RVR R, LLC; Sentinel Insurance Company, Ltd.; Sunstone R, LLC; Symphony R, LLC; The Evergreen Group Incorporated; The Hartford Alternative Strategies Fund; The Hartford Mutual Funds, Inc.; The Hartford Mutual Funds II, Inc.; Trumbull Flood Management, L.L.C.; Trumbull Insurance Company; Twin City Fire Insurance Company; White River Life Reinsurance Company.
HPP Revised January 2014
HARTFORDFUNDS
hartfordfunds.com
This information is written in connection with the promotion or marketing of the matter(s) addressed in this material.
This report is submitted for the general information of the shareholders of the Fund. It is not authorized for distribution unless preceded or accompanied by a current prospectus for the Fund.
The information cannot be used or relied upon for the purpose of avoiding IRS penalties. These materials are not intended to provide tax, accounting or legal advice. As with all matters of a tax or legal nature, you should consult your own tax or legal counsel for advice.
Investors should carefully consider the investment objectives, risks, charges, and expenses of Hartford Funds before investing. This and other information can be found in the prospectus and summary prospectus, which can be obtained by calling 888-843-7824 (retail) or 800-279-1541 (institutional). Investors should read them carefully before they invest.
Hartford Funds are underwritten and distributed by Hartford Funds Distributors, LLC.
MFAR-M014 12/14 113994-3 Printed in U.S.A.
HARTFORDFUNDS
|
THE HARTFORD
QUALITY BOND FUND
2014 Annual Report |
A MESSAGE FROM THE PRESIDENT
Dear Fellow Shareholders:
Thank you for investing in Hartford Funds.
Market Review
U.S. equities (as represented by the S&P 500 Index) rose steadily for the fiscal year ended October 31, 2014, with a return of 17.27% for the period. With the exception of short-lived geopolitical scares early in 2014 and concerns about continuing global growth near the end of the period, stocks generally rose on solid fundamentals and encouraging macroeconomic data during the year.
September 2014 marked the six-year anniversary of the start of the financial crisis. Within weeks of that anniversary, both the S&P 500 Index and the Dow Jones Industrial Average set new all-time highs, closing at 2,018 and 17,391, respectively, on October 31. Although the fallout of the crisis continues to influence investor behavior, stocks have recovered and risen dramatically, up 198% from their low in March 2009. Meanwhile, the domestic economy is notching strong growth, and the unemployment rate has reached its lowest level since August 2008.
While the U.S. economy appears to have stabilized and to have reverted to a solid growth path, the outlook for the global economy appears to have gotten cloudier. The U.S. Federal Reserve has ended quantitative easing, while Europe and Japan are pursuing stimulus options to avoid a double-dip recession and deflation, respectively. Diverging central-bank policies will likely continue to play an important role in market movements going forward as investors wait to see the reactions to their efforts and their impacts on global markets.
How have market movements impacted your portfolio throughout the last year? Are your investments still on track to provide the growth or income you need, and are you comfortable with their progress during times of volatility?
Your financial professional can help you navigate today’s markets with confidence, as well as assist you to achieve your investment goals by providing advice on the best options within our fund family to help you work toward overcoming today’s investing challenges. Meet with your financial advisor regularly to examine your portfolio and your investment strategy, and to determine if you’re still on track to meet your goals.
Thank you again for investing with Hartford Funds.
James Davey
President
Hartford Funds
1 The S&P 500 Index is a market capitalization-weighted price index composed of 500 widely held common stocks.
2 The Dow Jones Industrial Average is an unmanaged, price-weighted index of 30 of the largest, most widely held stocks traded on the NYSE
The Hartford Quality Bond Fund
Table of Contents
The views expressed in the Fund’s Manager Discussion under “Why did the Fund perform this way?” and “What is the outlook?” are views of the Fund’s sub-adviser and portfolio management team through the end of the period and are subject to change based on market and other conditions. The Fund’s Manager Discussion is for informational purposes only and does not represent an offer, recommendation or solicitation to buy, hold or sell any security. The specific securities identified and described, if any, do not represent all of the securities purchased or sold and you should not assume that investments in the securities identified and discussed will be profitable.
| The Hartford Quality Bond Fund inception 11/30/2012 |
| (sub-advised by Wellington Management Company, LLP) |
| Investment objective – The Fund seeks to maximize total return while providing a high level of current income consistent with prudent investment risk. |
Performance Overview 11/30/12 - 10/31/14
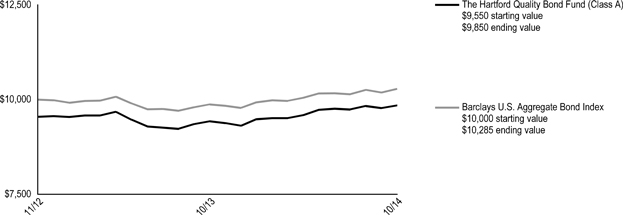
The chart above represents the hypothetical growth of a $10,000 investment in Class A, which includes a sales charge. Growth results in classes other than Class A will vary from what is seen above due to differences in the expenses charged to those share classes.
Average Annual Total Returns (as of 10/31/14)
| 1 Year | Since Inception▲ | |||||||
| Quality Bond A# | 4.48 | % | 1.62 | % | ||||
| Quality Bond A## | -0.22 | % | -0.79 | % | ||||
| Quality Bond C# | 3.75 | % | 0.87 | % | ||||
| Quality Bond C## | 2.75 | % | 0.87 | % | ||||
| Quality Bond I# | 4.83 | % | 1.88 | % | ||||
| Quality Bond R3# | 4.17 | % | 1.25 | % | ||||
| Quality Bond R4# | 4.53 | % | 1.57 | % | ||||
| Quality Bond R5# | 4.79 | % | 1.85 | % | ||||
| Quality Bond Y# | 4.84 | % | 1.89 | % | ||||
| Barclays U.S. Aggregate Bond Index | 4.14 | % | 1.47 | % | ||||
| ▲ | Inception: 11/30/2012 |
| # | Without sales charge |
| ## | With sales charge |
PERFORMANCE DATA QUOTED REPRESENTS PAST PERFORMANCE AND DOES NOT GUARANTEE FUTURE RESULTS. The investment return and principal value of the investment will fluctuate so that investors’ shares, when redeemed, may be worth more or less than their original cost. Current performance may be lower or higher than the performance data quoted. To obtain performance data current to the most recent month-end, please visit our website www.hartfordfunds.com.
The initial investment in Class A shares reflects the maximum sales charge of 4.50% and returns for Class C shares reflect a contingent deferred sales charge of up to 1.00% on shares redeemed within twelve months of purchase.
Total returns presented above were calculated using the Fund’s net asset value available to shareholders for sale or redemption of Fund shares on October 31, 2014, which may exclude investment transactions as of this date. All share class returns assume the reinvestment of all distributions at net asset value and the deduction of all fund expenses.
Barclays U.S. Aggregate Bond Index is an unmanaged index and is composed of securities from the Barclays Government/Credit Bond Index, Mortgage-Backed Securities Index, Asset-Backed Securities Index and Commercial Mortgage-Backed Securities Index.
You cannot invest directly in an index.
The chart and table do not reflect the deductions of taxes that a shareholder would pay on Fund distributions or the redemption of Fund shares.
Performance information may reflect historical or current expense waivers/reimbursements from the investment adviser, without which performance would have been lower. For information on current expense waivers/reimbursements, please see the prospectus.
| 2 |
| The Hartford Quality Bond Fund |
| Manager Discussion |
| October 31, 2014 (Unaudited) |
Operating Expenses*
| Net | Gross | |||||||
| Quality Bond Class A | 0.95 | % | 1.28 | % | ||||
| Quality Bond Class C | 1.70 | % | 2.03 | % | ||||
| Quality Bond Class I | 0.70 | % | 1.03 | % | ||||
| Quality Bond Class R3 | 1.25 | % | 1.72 | % | ||||
| Quality Bond Class R4 | 0.95 | % | 1.42 | % | ||||
| Quality Bond Class R5 | 0.65 | % | 1.12 | % | ||||
| Quality Bond Class Y | 0.60 | % | 1.02 | % | ||||
| * | As shown in the Fund's current prospectus dated March 1, 2014. Actual expenses may be higher or lower. Please see accompanying Financial Highlights for expense ratios for the year ended October 31, 2014. |
Gross expenses are the Fund's total annual operating expenses shown in the Fund's most recent prospectus. Net expenses are the Fund's total annual operating expenses shown in the Fund's most recent prospectus and reflect contractual expense reimbursements in instances when these reductions reduce the Fund's gross expenses. Contractual reimbursements remain in effect until February 28, 2015, and automatically renew for one-year terms unless terminated.
All investments are subject to risk including the possible loss of principal. For a discussion of the Fund’s risks, please see the Main Risks section of this report. For more detailed information on the risks associated with an investment in the Fund, please see the prospectus.
| Portfolio Manager |
| Michael F. Garrett |
| Senior Vice President and Fixed Income Portfolio Manager |
How did the Fund perform?
The Class A shares of The Hartford Quality Bond Fund returned 4.48%, before sales charge, for the twelve-month period ended October 31, 2014, outperforming the Fund’s benchmark, the Barclays U.S. Aggregate Bond Index, which returned 4.14% for the same period. The Fund also outperformed the 3.90% return of the Lipper U.S. Mortgage Funds peer group, a group of funds with investment strategies similar to those of the Fund.
Why did the Fund perform this way?
Fixed income markets gained throughout much of the period as expectations of prolonged easy monetary policy by major central banks and a supportive macroeconomic environment kept rates low and suppressed volatility. Early in the period emerging markets dominated headlines as economic and political developments sparked risk aversion across global markets, pushing bond prices higher and yields lower amid a flight to quality. Toward the end of the period, however, persistent geopolitical risks – tensions between Ukraine and Russia and violence in Iraq – and Chinese economic slowdown concerns raised questions about the global growth rate, keeping a lid on risk appetites overall.
The period was also highlighted by a divergence in central bank policies. The European Central Bank (ECB) cut its benchmark lending and deposit rates and announced a host of stimulus measures in an effort to encourage lending and fend off fears of deflation. China’s central bank joined the ECB in boosting liquidity by injecting funds into the nation’s largest banks in an attempt to combat weakening growth. The Bank of Japan pre-emptively announced incremental monetary easing to counter the risk of missing the country’s inflation and growth targets. In contrast, the Bank of England and U.S. Federal Reserve (Fed) leaned toward tighter policies. The Fed ended its quantitative easing program as U.S. data largely suggested the economy was on a sustainable growth path. Second quarter Gross Domestic Product (GDP) rebounded after the first quarter’s steep contraction. The labor market strengthened as the unemployment rate dropped to a six-year low. Housing regained some lost ground after a weak start to the year, though the pace of home price appreciation started to slow after a strong 2013. Inflation pressures were muted overall, alleviating pressure on the Fed to raise rates.
The U.S. Treasury curve flattened as markets contemplated bringing interest rates to normal levels; short-term yields rose while longer term rates declined. Most credit risk sectors posted positive absolute returns and outperformed duration-equivalent government bonds as credit spreads tightened.
The Fund outperformed its benchmark during the twelve month-period. Sector allocation and yield curve positioning were the main contributors to benchmark-relative performance during the period. The Fund’s curve flattening bias added to benchmark-relative performance as the decline in long Treasury yields outpaced shorter dated maturities. The Fund’s structural underweight to corporate credit detracted from returns during the period, but allocations to other securitized sectors more than made up for the shortfall. For example, the allocation to non-agency Residential Mortgage-Backed Securities (RMBS) and agency Collateralized Mortgage Obligations (CMOs) helped relative performance for the period. An allocation to Federal National Mortgage Association Delegated Underwriting and Servicing bonds (Fannie Mae DUS bonds) and an overweight to Commercial Mortgage-Backed Securities (CMBS) was also positive, as was coupon-positioning and security selection within 30-year Government National Mortgage Association (GNMA) securities. On the other hand, coupon positioning within 30- year conventionals (Federal National Mortgage Association and Federal Home Loan Mortgage Corporation) detracted from relative performance for the year, as did the Fund’s duration positioning.
| 3 |
| The Hartford Quality Bond Fund |
| Manager Discussion – (continued) |
| October 31, 2014 (Unaudited) |
Derivatives are not used in a significant manner in this Fund and did not have a material impact on performance during the period.
What is the outlook?
The Fund maintains a structural overweight to Mortgage-Backed Securities (MBS) as we believe over the long term it should offer better return potential with lower volatility than the corporate or government bond sectors. Tactically, however, we remain cautious on the agency MBS market, and continue to expect spreads to widen from current levels. The Fed’s tapering of MBS purchases ended in October as expected, and although the settlement of new purchases will extend out until January, we expect net supply to continue to increase. This leaves market participants, driven by relative value rather than monetary policy, as the marginal purchaser of newly issued MBS, and we believe they will require wider spreads. Within the securitized sectors, we own fewer pass-throughs, allocating instead to Fannie Mae DUS bonds, CMOs and structured credit. These assets produce a significant spread advantage to corporate bonds of similar credit risk. We continue to be patient and let the rates, volatility, and MBS markets react to the Fed’s exit over the course of the next few months.
We expect home-price appreciation and credit performance to continue to stabilize in 2015; still improving, but at a slower pace than 2014. This is a positive for the market, and consequently, we maintain our constructive outlook on the non-agency RMBS sector with long-term projected loss-adjusted yields in the range of 4% to 5%.
We remain constructive on CMBS, as the sector appears to be supported by a recovering economy, a better lending environment for commercial real estate, and a manageable near-term loan maturity schedule. Overall, the outlook for commercial real estate fundamentals appears strong, with decent demand and limited new construction. Underwriting standards continue to deteriorate, and vary greatly by deal. This credit-quality dispersion across deals should, in our view, result in greater tiering by the market. Valuations remain relatively attractive with room for spread tightening, as the sector remains attractive relative to corporates. Within the sector, we favor high-quality, new-issue conduit deals, select legacy CMBS, and single-borrower deals.
Looking ahead across Asset-Backed Securities sectors, we expect improvements in the economy to be partially offset by increased lending and modestly weaker underwriting standards. We believe this may cause credit performance in 2014 to fall short of post-crisis bests but still exceed long-term averages. Given this supportive backdrop, we remain constructive on the sector.
Credit Exposure
as of October 31, 2014
| Credit Rating * | Percentage of Net Assets | |||
| Aaa/ AAA | 82.7 | % | ||
| Aa/ AA | 9.9 | |||
| A | 2.9 | |||
| Baa/ BBB | 2.5 | |||
| B | 0.5 | |||
| Caa/ CCC or Lower | 5.2 | |||
| Not Rated | 3.1 | |||
| Short-Term Instruments | 48.8 | |||
| Other Assets and Liabilities | (55.6 | ) | ||
| Total | 100.0 | % | ||
| * | Credit exposure is the long-term credit ratings for the Fund's holdings, as of the date noted, as provided by Standard and Poor's (S&P) or Moody's Investors Service (Moody's) and typically range from AAA/Aaa (highest) to C/D (lowest). Presentation of S&P and Moody's credit ratings in this report have been selected for informational purposes for shareholders, as well as the Fund's consideration of industry practice. If Moody's and S&P assign different ratings, the lower rating is used. Fixed income securities that are not rated by either agency are listed as "Not Rated." Ratings do not apply to the Fund itself or to the Fund's shares. Ratings may change. |
Diversification by Security Type
as of October 31, 2014
| Category | Percentage of Net Assets | |||
| Fixed Income Securities | ||||
| Asset & Commercial Mortgage Backed Securities | 28.1 | % | ||
| Municipal Bonds | 0.4 | |||
| U.S. Government Agencies | 74.8 | |||
| U.S. Government Securities | 3.5 | |||
| Total | 106.8 | % | ||
| Short-Term Investments | 48.8 | |||
| Other Assets and Liabilities | (55.6 | ) | ||
| Total | 100.0 | % | ||
| 4 |
| The Hartford Quality Bond Fund |
| Schedule of Investments |
| October 31, 2014 |
| (000’s Omitted) |
| Shares or Principal Amount | Market Value ╪ | |||||||
| Asset and Commercial Mortgage Backed Securities - 28.1% | ||||||||
| Finance and Insurance - 27.4% | ||||||||
| Ally Automotive Receivables Trust | ||||||||
| $ | 60 | 3.38%, 09/15/2017 ■ | $ | 60 | ||||
| Ally Master Owner Trust | ||||||||
| 250 | 1.72%, 07/15/2019 | 252 | ||||||
| American Credit Acceptance Receivables | ||||||||
| 46 | 1.64%, 11/15/2016 ■ | 47 | ||||||
| AmeriCredit Automobile Receivables Trust | ||||||||
| 11 | 2.76%, 05/09/2016 ‡ | 11 | ||||||
| 250 | 3.38%, 04/09/2018 ‡ | 257 | ||||||
| 250 | 4.98%, 01/08/2018 ‡ | 253 | ||||||
| Asset Backed Securities Corp Home Equity | ||||||||
| 212 | 0.66%, 08/25/2034 ‡Δ | 200 | ||||||
| Cabela's Master Credit Card Trust | ||||||||
| 170 | 0.60%, 07/15/2022 Δ | 170 | ||||||
| Carfinance Capital Automotive Trust | ||||||||
| 21 | 1.65%, 07/17/2017 ■‡ | 21 | ||||||
| Carlyle Global Market Strategies | ||||||||
| 250 | 1.75%, 04/17/2025 ■‡Δ | 250 | ||||||
| CIFC Funding Ltd. | ||||||||
| 225 | 1.38%, 08/14/2024 ■‡Δ | 224 | ||||||
| Connecticut Avenue Securities Series | ||||||||
| 50 | 2.75%, 05/25/2024 Δ | 45 | ||||||
| 300 | 4.55%, 01/25/2024 Δ | 316 | ||||||
| 100 | 5.40%, 10/25/2023 Δ | 111 | ||||||
| Dryden Senior Loan Fund | ||||||||
| 250 | 1.70%, 07/15/2026 ■Δ | 249 | ||||||
| First Horizon Mortgage Pass-Through Trust | ||||||||
| 247 | 2.56%, 08/25/2037 Δ | 203 | ||||||
| First Investors Automotive Owner Trust | ||||||||
| 150 | 2.47%, 05/15/2018 ■ | 152 | ||||||
| FREMF Mortgage Trust | ||||||||
| 153 | 3.60%, 11/25/2046 ■‡Δ | 156 | ||||||
| 165 | 4.38%, 06/25/2047 ■‡Δ | 170 | ||||||
| 200 | 4.69%, 10/25/2030 ■‡Δ | 212 | ||||||
| Greenwich Capital Commercial Funding Corp. | ||||||||
| 241 | 5.44%, 03/10/2039 ‡Δ | 259 | ||||||
| GSR Mortgage Loan Trust | ||||||||
| 203 | 2.55%, 04/25/2036 Δ | 173 | ||||||
| IndyMac Index Mortgage Loan Trust | ||||||||
| 103 | 2.80%, 06/25/2036 ‡Δ | 78 | ||||||
| 77 | 5.00%, 08/25/2036 ‡Δ | 77 | ||||||
| JP Morgan Mortgage Trust | ||||||||
| 178 | 3.00%, 09/25/2044 ■ | 181 | ||||||
| LB-UBS Commercial Mortgage Trust | ||||||||
| 90 | 5.37%, 09/15/2039 ‡Δ | 96 | ||||||
| Magnetite CLO Ltd. | ||||||||
| 250 | 1.71%, 04/15/2026 ■‡Δ | 249 | ||||||
| 250 | 2.23%, 07/25/2026 ■‡Δ | 242 | ||||||
| Morgan Stanley Dean Witter Capital I | ||||||||
| 79 | 1.70%, 03/25/2033 ‡Δ | 74 | ||||||
| Morgan Stanley Re-Remic Trust | ||||||||
| 389 | 5.99%, 08/15/2045 ■‡Δ | 422 | ||||||
| MortgageIT Trust | ||||||||
| 226 | 0.47%, 02/25/2035 ‡Δ | 220 | ||||||
| Residential Accredit Loans, Inc. | ||||||||
| 256 | 3.55%, 09/25/2035 ‡Δ | 214 | ||||||
| Residential Funding Mortgage Securities, Inc. | ||||||||
| 174 | 2.78%, 09/25/2035 ‡Δ | 161 | ||||||
| 263 | 3.22%, 02/25/2036 ‡Δ | 234 | ||||||
| 175 | 5.75%, 01/25/2036 ‡ | 144 | ||||||
| Santander Drive Automotive Receivables Trust | ||||||||
| 92 | 3.82%, 08/15/2017 ‡ | 94 | ||||||
| Sequoia Mortgage Trust | ||||||||
| 107 | 0.39%, 02/20/2035 ‡Δ | 103 | ||||||
| SpringCastle America Funding LLC | ||||||||
| 205 | 2.70%, 05/25/2023 ■ | 205 | ||||||
| Springleaf Funding Trust | ||||||||
| 110 | 2.41%, 12/15/2022 ■ | 110 | ||||||
| Springleaf Mortgage Loan Trust | ||||||||
| 200 | 2.31%, 06/25/2058 ■ | 197 | ||||||
| 155 | 3.52%, 12/25/2065 ■ | 158 | ||||||
| Washington Mutual Mortgage Pass-Through | ||||||||
| 44 | 0.31%, 02/25/2037 ‡Δ | 30 | ||||||
| 228 | 5.50%, 03/25/2035 | 223 | ||||||
| Wells Fargo Mortgage Backed Securities Trust | ||||||||
| 218 | 2.63%, 10/25/2036 ‡Δ | 205 | ||||||
| Westlake Automobile Receivables Trust | ||||||||
| 200 | 2.24%, 04/15/2020 ■ | 200 | ||||||
| 7,708 | ||||||||
| Transportation Equipment Manufacturing - 0.7% | ||||||||
| TAL Advantage LLC | ||||||||
| 188 | 2.83%, 02/22/2038 ■ | 185 | ||||||
| Total Asset and Commercial Mortgage Backed Securities | ||||||||
| (Cost $7,800) | $ | 7,893 | ||||||
| Municipal Bonds - 0.4% | ||||||||
| Utilities - Combined - 0.4% | ||||||||
| Utility Debt Securitization Auth, New York | ||||||||
| $ | 110 | 3.44%, 12/15/2025 ‡ | $ | 114 | ||||
| Total Municipal Bonds | ||||||||
| (Cost $110) | $ | 114 | ||||||
| U.S. Government Agencies - 74.8% | ||||||||
| FHLMC - 18.7% | ||||||||
| $ | 3,700 | 1.67%, 08/25/2040 ► | $ | 255 | ||||
| 695 | 1.71%, 07/25/2041 ► | 81 | ||||||
| 2,250 | 1.81%, 11/25/2040 ► | 262 | ||||||
| 2,200 | 3.00%, 11/15/2029 - 11/15/2044 ☼,Ð | 2,209 | ||||||
| 200 | 3.50%, 11/15/2029 ☼,Ð | 211 | ||||||
| 970 | 4.00%, 11/15/2044 ☼,Ð | 1,029 | ||||||
| 1,100 | 4.50%, 11/15/2044 ☼,Ð | 1,191 | ||||||
| 5,238 | ||||||||
| FNMA - 42.2% | ||||||||
| 5 | 2.29%, 10/01/2022 | 5 | ||||||
| 259 | 2.48%, 08/01/2022 | 258 | ||||||
| 484 | 2.71%, 12/01/2027 | 466 | ||||||
| 25 | 2.76%, 05/01/2021 | 26 | ||||||
| 5 | 2.78%, 04/01/2022 | 5 | ||||||
| 365 | 2.95%, 01/01/2028 | 358 | ||||||
| 5 | 2.98%, 01/01/2022 | 5 | ||||||
| 1,665 | 3.00%, 11/15/2044 ☼,Ð | 1,665 | ||||||
| 5 | 3.20%, 04/01/2022 | 5 | ||||||
| 25 | 3.21%, 05/01/2023 | 26 | ||||||
| 15 | 3.34%, 04/01/2024 | 16 | ||||||
| 5 | 3.45%, 01/01/2024 | 5 | ||||||
The accompanying notes are an integral part of these financial statements.
| 5 |
| The Hartford Quality Bond Fund |
| Schedule of Investments – (continued) |
| October 31, 2014 |
| (000’s Omitted) |
| Shares or Principal Amount | Market Value ╪ | |||||||||||
| U.S. Government Agencies - 74.8% - (continued) | ||||||||||||
| FNMA - 42.2% - (continued) | ||||||||||||
| $ | 5 | 3.47%, 01/01/2024 | $ | 5 | ||||||||
| 4,900 | 3.50%, 11/15/2044 - 12/15/2044 ☼,Ð | 5,063 | ||||||||||
| 250 | 3.54%, 02/01/2024 | 265 | ||||||||||
| 15 | 3.67%, 08/01/2023 | 16 | ||||||||||
| 5 | 3.76%, 03/01/2024 | 5 | ||||||||||
| 5 | 3.86%, 12/01/2025 | 5 | ||||||||||
| 15 | 3.87%, 10/01/2025 | 16 | ||||||||||
| 15 | 3.89%, 05/01/2030 | 16 | ||||||||||
| 15 | 3.93%, 10/01/2023 | 17 | ||||||||||
| 5 | 3.96%, 05/01/2034 | 5 | ||||||||||
| 10 | 3.97%, 05/01/2029 | 11 | ||||||||||
| 1,333 | 4.00%, 11/15/2029 - 11/15/2044 ☼,Ð | 1,415 | ||||||||||
| 510 | 4.06%, 10/01/2028 - 03/01/2030 | 552 | ||||||||||
| 1,499 | 4.50%, 08/01/2041 - 11/15/2044 ☼,Ð | 1,627 | ||||||||||
| 11,858 | ||||||||||||
| GNMA - 13.9% | ||||||||||||
| 500 | 3.00%, 11/15/2044 ☼,Ð | 510 | ||||||||||
| 700 | 3.50%, 11/15/2044 ☼,Ð | 731 | ||||||||||
| 900 | 4.00%, 11/15/2044 ☼,Ð | 962 | ||||||||||
| 217 | 4.50%, 09/20/2041 - 11/15/2044 ☼,Ð | 237 | ||||||||||
| 399 | 5.00%, 07/15/2039 - 12/15/2044 ☼,Ð | 442 | ||||||||||
| 100 | 5.50%, 11/15/2044 ☼,Ð | 111 | ||||||||||
| 812 | 6.00%, 07/15/2037 - 09/15/2040 | 916 | ||||||||||
| 3,909 | ||||||||||||
| Total U.S. Government Agencies | ||||||||||||
| (Cost $21,011) | $ | 21,005 | ||||||||||
| U.S. Government Securities - 3.5% | ||||||||||||
| U.S. Treasury Securities - 3.5% | ||||||||||||
| U.S. Treasury Notes - 3.5% | ||||||||||||
| $ | 975 | 2.00%, 02/15/2022 ‡ | $ | 970 | ||||||||
| Total U.S. Government Securities | ||||||||||||
| (Cost $966) | $ | 970 | ||||||||||
| Total Long-Term Investments | ||||||||||||
| (Cost $29,887) | $ | 29,982 | ||||||||||
| Short-Term Investments - 48.8% | ||||||||||||
| Repurchase Agreements - 48.8% | ||||||||||||
| Bank of America Merrill Lynch TriParty Repurchase Agreement (maturing on 11/03/2014 in the amount of $39, collateralized by U.S. Treasury Note 1.50%, 2019, value of $40) |
||||||||||||
| $ | 39 | 0.08%, 10/31/2014 ‡ | $ | 39 | ||||||||
| Bank of America Merrill Lynch TriParty Repurchase Agreement (maturing on 11/03/2014 in the amount of $667, collateralized by GNMA 1.63% - 7.00%, 2031 - 2054, value of $680) |
||||||||||||
| 667 | 0.09%, 10/31/2014 ‡ | 667 | ||||||||||
| Bank of Montreal TriParty Repurchase Agreement (maturing on 11/03/2014 in the amount of $179, collateralized by U.S. Treasury Bond 2.88% - 5.25%, 2029 - 2043, U.S. Treasury Note 0.38% - 4.50%, 2015 - 2022, value of $183) |
||||||||||||
| 179 | 0.08%, 10/31/2014 ‡ | 179 | ||||||||||
| Bank of Montreal TriParty Repurchase Agreement (maturing on 11/03/2014 in the amount of $607, collateralized by FHLMC 2.00% - 5.50%, 2022 - 2034, FNMA 2.00% - 4.50%, 2024 - 2039, GNMA 3.00%, 2043, U.S. Treasury Note 4.63%, 2017, value of $619) | ||||||||||||
| 607 | 0.10%, 10/31/2014 ‡ | 607 | ||||||||||
| Barclays Capital TriParty Repurchase Agreement (maturing on 11/03/2014 in the amount of $2,288, collateralized by U.S. Treasury Bond 4.50% - 6.25%, 2023 - 2036, U.S. Treasury Note 1.63% - 2.13%, 2015 - 2019, value of $2,334) | ||||||||||||
| 2,288 | 0.08%, 10/31/2014 ‡ | 2,288 | ||||||||||
| Citigroup Global Markets, Inc. TriParty Repurchase Agreement (maturing on 11/03/2014 in the amount of $2,630, collateralized by U.S. Treasury Bill 0.02%, 2015, U.S. Treasury Bond 3.88% - 11.25%, 2015 - 2040, U.S. Treasury Note 2.00% - 3.38%, 2019 - 2021, value of $2,683) | ||||||||||||
| 2,630 | 0.09%, 10/31/2014 ‡ | 2,630 | ||||||||||
| Deutsche Bank Securities TriParty Repurchase Agreement (maturing on 11/03/2014 in the amount of $152, collateralized by U.S. Treasury Note 0.88%, 2017, value of $155) | ||||||||||||
| 152 | 0.13%, 10/31/2014 ‡ | 152 | ||||||||||
| RBS Securities, Inc. TriParty Repurchase Agreement (maturing on 11/03/2014 in the amount of $224, collateralized by U.S. Treasury Bond 3.63% - 5.00%, 2037 - 2043, U.S. Treasury Note 2.13%, 2020, value of $228) | ||||||||||||
| 224 | 0.07%, 10/31/2014 ‡ | 224 | ||||||||||
| Societe Generale TriParty Repurchase Agreement (maturing on 11/03/2014 in the amount of $2,354, collateralized by U.S. Treasury Bill 0.02%, 2015, U.S. Treasury Bond 3.75% - 11.25%, 2015 - 2043, U.S. Treasury Note 1.38% - 4.25%, 2015 - 2022, value of $2,401) | ||||||||||||
| 2,354 | 0.08%, 10/31/2014 ‡ | 2,354 | ||||||||||
| TD Securities TriParty Repurchase Agreement (maturing on 11/03/2014 in the amount of $4,562, collateralized by FHLMC 3.00% - 4.00%, 2026 - 2044, FNMA 2.50% - 5.00%, 2025 - 2044, U.S. Treasury Bond 3.50% - 6.50%, 2026 - 2041, U.S. Treasury Note 1.75% - 2.88%, 2018 - 2019, value of $4,653) | ||||||||||||
| 4,562 | 0.10%, 10/31/2014 ‡ | 4,562 | ||||||||||
| 13,702 | ||||||||||||
| Total Short-Term Investments | ||||||||||||
| (Cost $13,702) | $ | 13,702 | ||||||||||
| Total Investments | ||||||||||||
| (Cost $43,589) ▲ | 155.6 | % | $ | 43,684 | ||||||||
| Other Assets and Liabilities | (55.6 | )% | (15,602 | ) | ||||||||
| Total Net Assets | 100.0 | % | $ | 28,082 | ||||||||
The accompanying notes are an integral part of these financial statements.
| 6 |
| The Hartford Quality Bond Fund |
| Schedule of Investments – (continued) |
| October 31, 2014 |
| (000’s Omitted) |
| Note: | Percentage of investments as shown is the ratio of the total market value to total net assets. |
The
Fund may refer to any one or more of the industry classifications used by one or more widely recognized market indices, ratings
group indices and/or as defined by Fund management. Industry classifications may not be identical across all security types.
For Fund compliance purposes, the Fund may not use the same classification system shown in this report as these classifications
are used for reporting ease.
| ▲ | At October 31, 2014, the cost of securities for federal income tax purposes was $43,600 and the aggregate gross unrealized appreciation and depreciation based on that cost were: |
| Unrealized Appreciation | $ | 220 | ||
| Unrealized Depreciation | (136 | ) | ||
| Net Unrealized Appreciation | $ | 84 |
| Δ | Variable rate securities; the rate reported is the coupon rate in effect at October 31, 2014. |
| ► | Securities disclosed are interest-only strips. |
| ■ | Securities issued within terms of a private placement memorandum, exempt from registration under Rule 144A under the Securities Act of 1933, as amended, and may be sold only to qualified institutional buyers. Unless otherwise indicated, these holdings are determined to be liquid. At October 31, 2014, the aggregate value of these securities was $3,690, which represents 13.1% of total net assets. |
| ☼ | This security, or a portion of this security, was purchased on a when-issued or delayed-delivery basis. The cost of these securities was $15,113 at October 31, 2014. |
| ‡ | This security, or a portion of this security, has been segregated to cover funding requirements on investment transactions settling in the future. |
| Ð | Represents or includes a TBA transaction. |
Cash pledged and received as collateral in connection with derivatives at October 31, 2014:
| Pledged | Received | |||||||
| Futures contracts | $ | 52 | $ | – | ||||
| Total | $ | 52 | $ | – | ||||
Futures Contracts Outstanding at October 31, 2014
| Number of | Expiration | Notional | Market | Unrealized Appreciation/(Depreciation) | Variation Margin | |||||||||||||||||||||||||
| Description | Contracts* | Date | Amount | Value ╪ | Asset | Liability | Asset | Liability | ||||||||||||||||||||||
| Long position contracts: | ||||||||||||||||||||||||||||||
| U.S. Treasury 10-Year Note Future | 19 | 12/19/2014 | $ | 2,409 | $ | 2,401 | $ | – | $ | (8 | ) | $ | – | $ | (4 | ) | ||||||||||||||
| U.S. Treasury 2-Year Note Future | 6 | 12/31/2014 | 1,312 | 1,317 | 5 | – | – | – | ||||||||||||||||||||||
| U.S. Treasury 5-Year Note Future | 9 | 12/31/2014 | 1,082 | 1,075 | – | (7 | ) | – | (1 | ) | ||||||||||||||||||||
| U.S. Treasury CME Ultra Long Term Bond Future | 8 | 12/19/2014 | 1,234 | 1,254 | 20 | – | – | (5 | ) | |||||||||||||||||||||
| Total | $ | 25 | $ | (15 | ) | $ | – | $ | (10 | ) | ||||||||||||||||||||
| Short position contracts: | ||||||||||||||||||||||||||||||
| U.S. Treasury Long Bond Future | 2 | 12/19/2014 | $ | 293 | $ | 282 | $ | 11 | $ | – | $ | 1 | $ | – | ||||||||||||||||
| Total futures contracts | $ | 36 | $ | (15 | ) | $ | 1 | $ | (10 | ) | ||||||||||||||||||||
* The number of contracts does not omit 000's.
The accompanying notes are an integral part of these financial statements.
| 7 |
| The Hartford Quality Bond Fund |
| Schedule of Investments – (continued) |
| October 31, 2014 |
| (000’s Omitted) |
TBA Sale Commitments Outstanding at October 31, 2014
| Description | Principal Amount | Maturity Date | Market Value ╪ | Unrealized Appreciation/ Depreciation | ||||||||||
| FHLMC, 3.00% | $ | 1,300 | 11/15/2044 | $ | 1,301 | $ | (8 | ) | ||||||
| FHLMC, 3.50% | 490 | 11/15/2044 | 506 | (4 | ) | |||||||||
| FHLMC, 5.00% | 200 | 11/15/2044 | 221 | – | ||||||||||
| FNMA, 2.50% | 700 | 11/15/2029 | 710 | 7 | ||||||||||
| FNMA, 3.00% | 100 | 11/15/2029 | 104 | – | ||||||||||
| FNMA, 3.50% | 1,200 | 11/15/2029 | 1,268 | 2 | ||||||||||
| GNMA, 3.50% | 300 | 11/15/2044 | 314 | 1 | ||||||||||
| GNMA, 4.50% | 600 | 11/15/2044 | 654 | (3 | ) | |||||||||
| Total | $ | 5,078 | $ | (5 | ) | |||||||||
At October 31, 2014, the aggregate market value of these securities represents 18.1% of total net assets.
| ╪ | See Significant Accounting Policies of accompanying Notes to Financial Statements regarding valuation of securities. |
| GLOSSARY: (abbreviations used in preceding Schedule of Investments) | |
| Other Abbreviations: | |
| CLO | Collateralized Loan Obligation |
| FHLMC | Federal Home Loan Mortgage Corp. |
| FNMA | Federal National Mortgage Association |
| GNMA | Government National Mortgage Association |
| TBA | To Be Announced |
The accompanying notes are an integral part of these financial statements.
| 8 |
| The Hartford Quality Bond Fund |
| Schedule of Investments – (continued) |
| October 31, 2014 |
| (000’s Omitted) |
Investment Valuation Hierarchy Level Summary
October 31, 2014
| Total | Level 1 ♦ | Level 2 ♦ | Level 3 | |||||||||||||
| Assets: | ||||||||||||||||
| Asset and Commercial Mortgage Backed Securities | $ | 7,893 | $ | – | $ | 6,761 | $ | 1,132 | ||||||||
| Municipal Bonds | 114 | – | 114 | – | ||||||||||||
| U.S. Government Agencies | 21,005 | – | 21,005 | – | ||||||||||||
| U.S. Government Securities | 970 | – | 970 | – | ||||||||||||
| Short-Term Investments | 13,702 | – | 13,702 | – | ||||||||||||
| Total | $ | 43,684 | $ | – | $ | 42,552 | $ | 1,132 | ||||||||
| Futures * | $ | 36 | $ | 36 | $ | – | $ | – | ||||||||
| Total | $ | 36 | $ | 36 | $ | – | $ | – | ||||||||
| Liabilities: | ||||||||||||||||
| TBA Sale Commitments | $ | 5,078 | $ | – | $ | 5,078 | $ | – | ||||||||
| Total | $ | 5,078 | $ | – | $ | 5,078 | $ | – | ||||||||
| Futures * | $ | 15 | $ | 15 | $ | – | $ | – | ||||||||
| Total | $ | 15 | $ | 15 | $ | – | $ | – | ||||||||
| ♦ | For the year ended October 31, 2014, there were no transfers between Level 1 and Level 2. |
| * | Derivative instruments (excluding purchased and written options, if applicable) are valued at the unrealized appreciation/depreciation on the investments. |
Following is a reconciliation of Level 3 assets for which significant unobservable inputs were used to determine fair value:
| Balance
as of October 31, 2013 | Realized Gain (Loss) | Change
in Unrealized Appreciation (Depreciation) | Net Amortization | Purchases | Sales | Transfers Into Level 3 * | Transfers Out of Level 3 * | Balance
as of October 31, 2014 | ||||||||||||||||||||||||||||
| Assets: | ||||||||||||||||||||||||||||||||||||
| Asset & Commercial Mortgage Backed Securities | $ | 621 | $ | 1 | $ | 25 | † | $ | 2 | $ | 314 | $ | (25 | ) | $ | 194 | $ | — | $ | 1,132 | ||||||||||||||||
| Total | $ | 621 | $ | 1 | $ | 25 | $ | 2 | $ | 314 | $ | (25 | ) | $ | 194 | $ | — | $ | 1,132 | |||||||||||||||||
| * | Investments are transferred into and out of Level 3 for a variety of reasons including, but not limited to: |
| 1) | Investments where trading has been halted (transfer into Level 3) or investments where trading has resumed (transfer out of Level 3). |
| 2) | Broker quoted investments (transfer into Level 3) or quoted prices in active markets (transfer out of Level 3). |
| 3) | Investments that have certain restrictions on trading (transfer into Level 3) or investments where trading restrictions have expired (transfer out of Level 3). |
| † | Change in unrealized appreciation (depreciation) in the current period relating to assets still held at October 31, 2014 was $25. |
| Note: | For purposes of reporting transfers between different hierarchy levels, both transfers in and out of each level, as applicable, are shown as if they occurred at the beginning of the period. |
The accompanying notes are an integral part of these financial statements.
| 9 |
| The Hartford Quality Bond Fund |
| Statement of Assets and Liabilities |
| October 31, 2014 |
| (000’s Omitted) |
| Assets: | ||||
| Investments in securities, at market value (cost $29,887) | $ | 29,982 | ||
| Investments in repurchase agreements, at market value (cost $13,702) | 13,702 | |||
| Cash | 1,451 | * | ||
| Receivables: | ||||
| Investment securities sold | 13,361 | |||
| Fund shares sold | — | |||
| Interest | 49 | |||
| Variation margin on financial derivative instruments | 1 | |||
| Other assets | 53 | |||
| Total assets | 58,599 | |||
| Liabilities: | ||||
| TBA sale commitments, at market value (proceeds $5,073) | 5,078 | |||
| Payables: | ||||
| Investment securities purchased | 25,410 | |||
| Fund shares redeemed | 2 | |||
| Investment management fees | 3 | |||
| Dividends | — | |||
| Administrative fees | — | |||
| Distribution fees | 1 | |||
| Variation margin on financial derivative instruments | 10 | |||
| Accrued expenses | 13 | |||
| Other liabilities | — | |||
| Total liabilities | 30,517 | |||
| Net assets | $ | 28,082 | ||
| Summary of Net Assets: | ||||
| Capital stock and paid-in-capital | $ | 27,579 | ||
| Undistributed net investment income | 3 | |||
| Accumulated net realized gain | 389 | |||
| Unrealized appreciation of investments | 111 | |||
| Net assets | $ | 28,082 | ||
| Shares authorized | 450,000 | |||
| Par value | $ | 0.001 | ||
| Class A: Net asset value per share/Maximum offering price per share | $10.19/$10.67 | |||
| Shares outstanding | 841 | |||
| Net assets | $ | 8,568 | ||
| Class C: Net asset value per share | $ | 10.15 | ||
| Shares outstanding | 185 | |||
| Net assets | $ | 1,882 | ||
| Class I: Net asset value per share | $ | 10.20 | ||
| Shares outstanding | 208 | |||
| Net assets | $ | 2,119 | ||
| Class R3: Net asset value per share | $ | 10.17 | ||
| Shares outstanding | 201 | |||
| Net assets | $ | 2,048 | ||
| Class R4: Net asset value per share | $ | 10.19 | ||
| Shares outstanding | 202 | |||
| Net assets | $ | 2,060 | ||
| Class R5: Net asset value per share | $ | 10.20 | ||
| Shares outstanding | 203 | |||
| Net assets | $ | 2,072 | ||
| Class Y: Net asset value per share | $ | 10.20 | ||
| Shares outstanding | 915 | |||
| Net assets | $ | 9,333 | ||
* Cash of $52 was pledged as collateral for open financial derivative instruments at October 31, 2014.
The accompanying notes are an integral part of these financial statements.
| 10 |
| The Hartford Quality Bond Fund |
| Statement of Operations |
| For the Year Ended October 31, 2014 |
| (000’s Omitted) |
| Investment Income: | ||||
| Interest | $ | 364 | ||
| Total investment income | 364 | |||
| Expenses: | ||||
| Investment management fees | 130 | |||
| Administrative services fees | ||||
| Class R3 | 4 | |||
| Class R4 | 3 | |||
| Class R5 | 2 | |||
| Transfer agent fees | ||||
| Class A | 2 | |||
| Class C | — | |||
| Class I | — | |||
| Class Y | — | |||
| Distribution fees | ||||
| Class A | 17 | |||
| Class C | 19 | |||
| Class R3 | 10 | |||
| Class R4 | 5 | |||
| Custodian fees | 3 | |||
| Accounting services fees | 4 | |||
| Registration and filing fees | 95 | |||
| Board of Directors' fees | 2 | |||
| Audit fees | 11 | |||
| Other expenses | 11 | |||
| Total expenses (before waivers) | 318 | |||
| Expense waivers | (102 | ) | ||
| Management fee waivers | (4 | ) | ||
| Total waivers | (106 | ) | ||
| Total expenses, net | 212 | |||
| Net Investment Income | 152 | |||
| Net Realized Gain on Investments and Other Financial Instruments: | ||||
| Net realized gain on investments | 838 | |||
| Net realized gain on purchased option contracts | 3 | |||
| Net realized loss on TBA sale transactions | (160 | ) | ||
| Net realized gain on futures contracts | 235 | |||
| Net Realized Gain on Investments and Other Financial Instruments | 916 | |||
| Net Changes in Unrealized Appreciation of Investments and Other Financial Instruments: | ||||
| Net unrealized appreciation of investments | 100 | |||
| Net unrealized depreciation of TBA sale commitments | (3 | ) | ||
| Net unrealized depreciation of futures contracts | (8 | ) | ||
| Net Changes in Unrealized Appreciation of Investments and Other Financial Instruments | 89 | |||
| Net Gain on Investments and Other Financial Instruments | 1,005 | |||
| Net Increase in Net Assets Resulting from Operations | $ | 1,157 |
The accompanying notes are an integral part of these financial statements.
| 11 |
| The Hartford Quality Bond Fund |
| Statement of Changes in Net Assets |
| (000’s Omitted) |
| For the Year Ended October 31, 2014 | For the Period November 30, 2012* through October 31, 2013 | |||||||
| Operations: | ||||||||
| Net investment income | $ | 152 | $ | 125 | ||||
| Net realized gain (loss) on investments and other financial instruments | 916 | (484 | ) | |||||
| Net unrealized appreciation of investments and other financial instruments | 89 | 22 | ||||||
| Net Increase (Decrease) in Net Assets Resulting from Operations | 1,157 | (337 | ) | |||||
| Distributions to Shareholders: | ||||||||
| From net investment income | ||||||||
| Class A | (48 | ) | (34 | ) | ||||
| Class C | (1 | ) | (2 | ) | ||||
| Class I | (19 | ) | (13 | ) | ||||
| Class R3 | (8 | ) | (6 | ) | ||||
| Class R4 | (13 | ) | (10 | ) | ||||
| Class R5 | (18 | ) | (13 | ) | ||||
| Class Y | (84 | ) | (60 | ) | ||||
| Total distributions | (191 | ) | (138 | ) | ||||
| Capital Share Transactions: | ||||||||
| Class A | 1,470 | 6,970 | ||||||
| Class C | (422 | ) | 2,288 | |||||
| Class I | 4 | 2,071 | ||||||
| Class R3 | 8 | 2,006 | ||||||
| Class R4 | 13 | 2,009 | ||||||
| Class R5 | 18 | 2,013 | ||||||
| Class Y | 84 | 9,059 | ||||||
| Net increase from capital share transactions | 1,175 | 26,416 | ||||||
| Net Increase in Net Assets | 2,141 | 25,941 | ||||||
| Net Assets: | ||||||||
| Beginning of period | 25,941 | — | ||||||
| End of period | $ | 28,082 | $ | 25,941 | ||||
| Undistributed (distributions in excess of) net investment income | $ | 3 | $ | 19 | ||||
* Commencement of operations.
The accompanying notes are an integral part of these financial statements.
| 12 |
| The Hartford Quality Bond Fund |
| Notes to Financial Statements |
| October 31, 2014 |
| (000’s Omitted) |
Organization:
The Hartford Mutual Funds, Inc. (“Company”) is an open-end management investment company comprised of forty-two portfolios. Financial statements for The Hartford Quality Bond Fund (the "Fund"), a series of the Company, are included in this report.
The Company is organized under the laws of the State of Maryland and is registered with the Securities and Exchange Commission (“SEC”) under the Investment Company Act of 1940, as amended (“1940 Act”). The Fund is a diversified open-end management investment company. The Fund is an investment company and applies specialized accounting and reporting under Accounting Standards Codification Topic 946, Financial Services - Investment Companies.
Class A shares are sold with a front-end sales charge of up to 4.50%. Class C shares are sold with a contingent deferred sales charge of up to 1.00% on shares redeemed within twelve months of purchase. Class I shares are sold without sales charges to certain eligible investors primarily through advisory fee-based wrap programs. Class R3, R4 and R5 shares, which are offered to employer-sponsored retirement plans, and Class Y shares, which are sold to certain eligible institutional investors, are sold without a sales charge. All classes of shares have identical voting, redemption, dividend, liquidation and other rights and the same terms and conditions, with the exceptions that each class may have different expenses, which may affect performance.
Significant Accounting Policies:
The following is a summary of significant accounting policies of the Fund in the preparation of its financial statements, which are in accordance with United States generally accepted accounting principles (“U.S. GAAP”). The preparation of financial statements in accordance with U.S. GAAP may require management to make estimates and assumptions that affect the reported amounts of assets and liabilities and disclosure of contingent assets and liabilities at the date of the financial statements and the reported amounts of increases and decreases in net assets from operations during the reporting period. Actual results could differ from those estimates.
Determination of Net Asset Value – The per share net asset value ("NAV") of each class of the Fund's shares is determined as of the close of regular trading (normally 4:00 p.m. Eastern Time) (the “NYSE Close”) on each day that the New York Stock Exchange (the “Exchange”) is open (“Valuation Date”). Information that becomes known to the Fund after the NAV has been calculated on a particular day will not generally be used to retroactively adjust the NAV determined earlier that day.
Investment Valuation and Fair Value Measurements – For purposes of calculating the NAV, portfolio investments and other assets held by the Fund's portfolio for which market quotes are readily available are valued at market value. Market value is generally determined on the basis of last reported sales prices or official close price. If no sales are reported, market value is based on quotes obtained from a quotation reporting system, established market makers, or independent pricing services. If market prices are not readily available or are deemed unreliable, the Fund will use the fair value of the investment as determined in good faith under policies and procedures established by and under the supervision of the Company's Board of Directors. Market quotes are considered not readily available where there is an absence of current or reliable market-based data (e.g., trade information or indicative market quotes), including where events occur after the close of the relevant market, but prior to the NYSE Close, that materially affect the values of the Fund's portfolio investments or assets. In addition, market quotes are considered not readily available when, due to extraordinary circumstances, the exchanges or markets on which the investments trade do not open for trading for the entire day and no other market prices are available. There can be no assurance that the Fund could obtain the fair market value assigned to an investment if the Fund were to sell the investment at approximately the time at which the Fund determines its NAV.
Fixed income investments (other than short-term obligations), non-exchange traded derivatives and centrally cleared swaps held by the Fund are normally valued on the basis of quotes obtained from independent pricing services or brokers and dealers in accordance with procedures established by the Company's Board of Directors. Prices obtained from independent pricing services use information provided by market makers or estimates of market values through accepted market modeling, trading and pricing conventions. Inputs to the models may include, but are not limited to, prepayment speeds, pricing spread, yield, trade information, dealer quotes, market color, cash flow models and the investment’s terms and conditions. Generally, the Fund may use fair valuation in regard to fixed income investments when the Fund holds defaulted or distressed investments or investments in a company in which a reorganization is pending. Short-term investments maturing in 60 days or less are generally valued at amortized cost, if their original term to maturity
| 13 |
| The Hartford Quality Bond Fund |
| Notes to Financial Statements – (continued) |
| October 31, 2014 |
| (000’s Omitted) |
was 60 days or less, or by amortizing their value on the 61st day prior to maturity, if the original term to maturity exceeded 60 days, which approximates fair value.
Exchange traded options, futures and options on futures are valued at the settlement price or last trade price determined by the relevant exchange as of the NYSE Close. If the last trade price for exchange traded options does not fall between the bid and ask prices, the value will be the mean of the bid and ask prices as of the NYSE Close. If a last trade price is not available, the value will be the mean of the bid and ask prices as of the NYSE Close. If a mean of the bid and ask prices cannot be calculated for the day, the value will be the bid price as of the NYSE Close. In the case of over-the-counter ("OTC") options and such instruments that do not trade on an exchange, values may be supplied by a pricing service using a formula or other objective method that may take into consideration the style, direction, expiration, strike price, notional value and volatility or other special adjustments.
Financial instruments for which prices are not available from an independent pricing service may be valued using market quotations obtained from one or more dealers that make markets in the respective financial instrument in accordance with procedures established by the Company's Board of Directors.
U.S. GAAP defines fair value as the price that the Fund would receive to sell an asset or pay to transfer a liability in an orderly transaction between market participants. The U.S. GAAP fair value measurement standards require disclosure of a fair value hierarchy for each major category of assets and liabilities. Various inputs are used in determining the fair value of the Fund’s investments. These inputs are summarized into three broad hierarchy levels. This hierarchy is based on whether the valuation inputs are observable or unobservable. These levels are:
Level 1 – Quoted prices in active markets for identical investments. Level 1 may include exchange traded instruments, such as domestic equities, some foreign equities, options, futures, mutual funds, exchange traded funds, rights and warrants.
Level 2 – Observable inputs other than Level 1 prices, such as quoted prices for similar investments; quoted prices in markets that are not active; or other inputs that are observable or can be corroborated by observable market data. Level 2 may include debt investments that are traded less frequently than exchange traded instruments and which are valued using independent pricing services; foreign equities, which are principally traded on certain foreign markets and are adjusted daily pursuant to a fair value pricing service in order to reflect an adjustment for the factors occurring after the close of certain foreign markets but before the NYSE Close; senior floating rate interests, which are valued using an aggregate of dealer bids; short-term investments, which are valued at amortized cost; and swaps, which are valued based upon the terms of each swap contract.
Level 3 – Significant
unobservable inputs that are supported by limited or no market activity. Level 3 may include financial instruments whose values
are determined using indicative market quotes or require significant management judgment or estimation. These unobservable valuation
inputs may include estimates for current yields, maturity/duration, prepayment speed, and indicative market quotes for comparable
investments along with other assumptions relating to credit quality, collateral value, complexity of the investment structure,
general market conditions and liquidity. This category may include investments where trading has been halted or there are certain
restrictions on trading. While these investments are priced using unobservable inputs, the valuation of these investments reflects
the best available data and management believes the prices are a reasonable representation of exit price. For more information
on specific valuation techniques and unobservable inputs, please see the following table titled "Quantitative Information
about Level 3 Fair Value Measurements."
The Board of Directors of the Company generally reviews and approves the “Procedures for Valuation of Portfolio Securities”
at least once a year. These procedures define how investments are to be valued, including the formation and activities of a Valuation
Committee. The Valuation Committee is responsible for determining in good faith the fair value of investments when the value cannot
be obtained from primary pricing services or alternative sources or if the valuation of an investment as provided by the primary
pricing service or alternative source is believed not to reflect the investment’s fair value as of the Valuation Date. Voting
members of the Valuation Committee include the Fund’s Treasurer or designee and a Vice President of the investment manager
or designee. An Assistant Vice President of the Fund with legal expertise or designee is also included on the Valuation Committee
as a non-voting advisory member. In addition, the Fund’s Chief Compliance Officer shall designate a member of the compliance
group to attend Valuation Committee meetings as a non-voting resource, to monitor for and provide guidance with respect to compliance
with these procedures. Two members of the Valuation Committee or their designees, representing
| 14 |
| The Hartford Quality Bond Fund |
| Notes to Financial Statements – (continued) |
| October 31, 2014 |
| (000’s Omitted) |
different departments, shall constitute a quorum for purposes of permitting the Valuation Committee to take action. The Valuation Committee will consider all relevant factors in determining an investment’s fair value, and may seek the advice of the Fund’s sub-adviser, knowledgeable brokers, and legal counsel in making such determination. The Valuation Committee reports to the Audit Committee of the Company’s Board of Directors. The Audit Committee receives quarterly written reports which include details of all fair-valued investments, including the reason for the fair valuation, and an indication, when possible, of the accuracy of the valuation by disclosing the next available reliable public price quotation or the disposition price of such investments (the “look-back” test). The Board of Directors then must consider for ratification all of the fair value determinations made during the previous quarter.
Valuation levels are not necessarily indicative of the risk associated with investing in such investments. Individual investments within any of the above mentioned asset classes may be assigned a different hierarchical level than those presented above, as individual circumstances dictate.
For additional information, refer to the Investment Valuation Hierarchy Level Summary and the Level 3 roll-forward reconciliation, if applicable, which follow the Schedule of Investments.
Quantitative Information about Level 3 Fair Value Measurements:
| Security Type/Valuation Technique | Unobservable Input * | Input
Value(s) Range (Weighted Average) ‡ | Fair
Value at October 31, 2014 | |||||
| Assets: | ||||||||
| Asset and Commercial Mortgage Backed Securities | ||||||||
| Discounted cash flow | Internal rate of return | 2.79% - 5.50% (3.99%) | 1,022 | |||||
| Life expectancy (in months) | 53 - 235 (106) | |||||||
| Indicative market quotations | Broker quote † | $100.22 | 110 | |||||
| Total | $ | 1,132 | ||||||
| * | Significant changes to any unobservable inputs may result in a significant change to the fair value. |
| ‡ | Unless otherwise noted, inputs were weighted based on the fair value of the investments included in the range. |
| † | The broker quote represents the best available estimate of fair value per share as of October 31, 2014. |
Investment Transactions and Investment Income – Investment transactions are recorded as of the trade date (the date the order to buy or sell is executed) for financial reporting purposes. Investments purchased or sold on a when-issued or delayed-delivery basis may be settled a month or more after the trade date. Realized gains and losses are determined on the basis of identified cost.
Interest income, including amortization of premium, accretion of discounts and additional principal received in-kind in lieu of cash, is accrued on a daily basis. Paydown gains and losses on mortgage related and other asset backed securities are included in interest income in the Statement of Operations.
Joint Trading Account – The Fund may invest cash balances into a joint trading account that may be invested in one or more repurchase agreements.
Fund Share Valuation and Dividend Distributions to Shareholders – Orders for the Fund’s shares are executed in accordance with the investment instructions of the shareholders. The NAV of the Fund’s shares is determined as of the close of business on each business day of the Exchange. The NAV is determined separately for each class of shares of the Fund by dividing the Fund’s net assets attributable to that class by the number of shares of the class outstanding. Each class of shares offered by the Fund has equal rights as to assets and voting privileges (except that shareholders of a class have exclusive voting rights regarding any matter relating solely to that class of shares). Income and non-class specific expenses are allocated daily to each class on the basis of the relative net assets of the class. Realized and unrealized gains and losses are allocated daily based on the relative net assets of each class of shares of the Fund.
Orders for the purchase of the Fund’s shares received prior to the close of the Exchange on any day the Exchange is open for business are priced at the NAV determined as of the close of the Exchange. Orders received after the close of the Exchange, or on a day on which the Exchange and/or the Fund is not open for business, are priced at the next determined NAV.
| 15 |
| The Hartford Quality Bond Fund |
| Notes to Financial Statements – (continued) |
| October 31, 2014 |
| (000’s Omitted) |
Dividends are declared pursuant to a policy adopted by the Company's Board of Directors based upon the investment performance of the Fund. Normally, dividends from net investment income are declared daily and paid monthly. Dividends from realized gains, if any, are paid at least once a year.
Net investment income, dividends and distributions from net realized gains and capital are determined in accordance with federal income tax regulations, which may differ from U.S. GAAP with respect to character and timing (see Federal Income Taxes: Distributions and Components of Distributable Earnings and Reclassification of Capital Accounts).
Securities and Other Investments:
Repurchase Agreements – A repurchase agreement is an agreement by which a counterparty agrees to sell an investment and agrees to repurchase the investment sold from the buyer at a mutually agreed upon time and price. During the period of the repurchase agreement, the counterparty will deposit cash and or securities in a third party custodial account to serve as collateral. At the time the Fund enters into a repurchase agreement, the value of the underlying collateral, including accrued interest, will be equal to or exceed the value of the repurchase agreement. Repurchase agreements expose the Fund to counterparty risk - that is, the risk that the counterparty will not fulfill its obligations. To minimize counterparty risk, the investments that serve to collateralize the repurchase agreement are held by the Fund’s custodian in book entry or physical form in the custodial account of the Fund or in a third party custodial account. Repurchase agreements are valued at cost plus accrued interest, which approximates fair value. Repurchase agreements have master netting arrangements which allow the Fund to offset amounts owed to a counterparty with amounts owed by the counterparty, including any collateral. Upon an event of default under a master repurchase agreement, the non-defaulting party may close out all transactions traded under such agreement and net amounts owed under each transaction to one net amount payable by one party to the other. Absent an event of default, the master repurchase agreement does not result in an offset of reported amounts of assets and liabilities in the Statement of Assets and Liabilities across transactions between the Fund and the applicable counterparty. The Fund, as shown on the Schedule of Investments, had outstanding repurchase agreements and related collateral as of October 31, 2014.
Illiquid and Restricted Investments – The Fund is permitted to invest up to 15% of its net assets in illiquid investments. Illiquid investments are those that may not be sold or disposed of in the ordinary course of business within seven days, at approximately the price used to determine the Fund’s NAV. The Fund may not be able to sell illiquid investments when its sub-adviser considers it desirable to do so or may have to sell such investments at a price that is lower than the price that could be obtained if the investments were more liquid. A sale of illiquid investments may require more time and may result in higher dealer discounts and other selling expenses than does the sale of those that are liquid. Illiquid investments also may be more difficult to value due to the unavailability of reliable market quotations for such investments, and an investment in them may have an adverse impact on the Fund’s NAV. The Fund may also purchase certain restricted investments that can only be resold to certain qualified investors and may be determined to be liquid pursuant to policies and guidelines established by the Company's Board of Directors. The Fund, as shown on the Schedule of Investments, had illiquid or restricted investments as of October 31, 2014.
Investments Purchased on a When-Issued or Delayed-Delivery Basis – Delivery and payment for investments that have been purchased by the Fund on a forward commitment, or when-issued or delayed-delivery basis, take place beyond the customary settlement period. The Fund may dispose of or renegotiate a delayed-delivery transaction after it is entered into, and may sell delayed-delivery investments before they are delivered, which may result in a realized gain or loss. During this period, such investments are subject to market fluctuations, and the Fund identifies investments segregated in its records with a value at least equal to the amount of the commitment. The Fund, as shown on the Schedule of Investments, had when-issued or delayed-delivery investments as of October 31, 2014.
In connection with the Fund’s ability to purchase investments on a when-issued or forward commitment basis, the Fund may enter into to-be announced (“TBA”) commitments. TBA commitments are forward agreements for the purchase or sale of mortgage backed securities for a fixed price, with payment and delivery on an agreed-upon future settlement date. The specific securities to be delivered are not identified at the trade date; however, delivered securities must meet specified terms, including issuer, rate and mortgage terms. Although the Fund may enter into TBA commitments with the intention of acquiring or delivering securities for its portfolio, the Fund can extend the settlement date, roll the transaction, or dispose of a commitment prior to settlement if deemed appropriate to do so. If the TBA commitment is closed through the acquisition of an offsetting TBA commitment, the Fund realizes a
| 16 |
| The Hartford Quality Bond Fund |
| Notes to Financial Statements – (continued) |
| October 31, 2014 |
| (000’s Omitted) |
gain or loss. In a TBA roll transaction, the Fund generally purchases or sells the initial TBA commitment prior to the agreed upon settlement date and enters into a new TBA commitment for future delivery or receipt of the mortgage backed securities. TBA commitments involve a risk of loss if the value of the security to be purchased or sold declines or increases, respectively, prior to settlement date.
The Fund may enter into “dollar rolls” in which the Fund sells securities and contracts with the same counterparty to repurchase substantially similar securities (for example, same issuer, coupon and maturity) on a specified future date at an agreed upon price. The Fund gives up the right to receive interest paid on the investments sold. The Fund would benefit to the extent of any differences between the price received for the security and the lower forward price for the future purchase. Dollar rolls involve the risk that the market value of the securities that the Fund is required to purchase may decline below the agreed upon repurchase price of those securities. The Fund records dollar roll transactions as purchases and sales and realizes gains and losses on these transactions. These transactions are excluded from the Fund’s portfolio turnover rate. The Fund, as shown on the Schedule of Investments, had open TBA commitments as of October 31, 2014, which may be a part of dollar roll transactions.
Mortgage Related and Other Asset Backed Securities – The Fund may invest in mortgage related and other asset backed securities. These securities include mortgage pass-through securities, collateralized mortgage obligations, commercial mortgage backed securities, stripped mortgage backed securities, asset backed securities, collateralized debt obligations and other securities that directly or indirectly represent a participation in, or are secured by and payable from, mortgage loans on real property. Mortgage related securities are created from pools of residential or commercial mortgage loans, including mortgage loans made by savings and loan institutions, mortgage bankers, commercial banks and other similar financial institutions. Asset backed securities are created from many types of assets, including auto loans, credit card receivables, home equity loans, and student loans. These securities provide a monthly payment that consists of both interest and principal payments. Interest payments may be determined by fixed or adjustable rates. The rate of pre-payments on underlying mortgages will affect the price and volatility of a mortgage related security, and may have the effect of shortening or extending the effective duration of the security relative to what was anticipated at the time of purchase. The timely payment of principal and interest of certain mortgage related securities is guaranteed by the full faith and credit of the United States Government. Mortgage related and other asset backed securities created and guaranteed by non-governmental issuers, including government-sponsored corporations, may be supported by various forms of insurance or guarantees, but there can be no assurance that the private insurers or guarantors can meet their obligations under the insurance policies or guarantee arrangements. The Fund, as shown on the Schedule of Investments, had outstanding mortgage related and other asset backed securities as of October 31, 2014.
Inflation Indexed Bonds – The Fund may invest in inflation indexed bonds. Inflation indexed bonds are fixed income investments whose principal value is periodically adjusted to the rate of inflation. The interest rate on these bonds is generally fixed at issuance at a rate lower than typical bonds. Over the life of an inflation indexed bond, however, interest will be paid based on a principal value, which is adjusted for inflation. Any increase or decrease in the principal amount of an inflation indexed bond will be included as interest income on the Statement of Operations, even though investors do not receive the principal amount until maturity. The Fund had no inflation indexed bonds as of October 31, 2014.
Financial Derivative Instruments:
The following disclosures contain information on how and why the Fund uses derivative instruments, the credit-risk-related contingent features in certain derivative instruments and how derivative instruments affect the Fund’s financial position and results of operations. The location and fair value amounts of these instruments on the Statement of Assets and Liabilities and the realized gains and losses and changes in unrealized gains and losses on the Statement of Operations, each categorized by type of derivative contract, are included in the following Additional Derivative Instrument Information footnote. The derivative instruments outstanding as of year-end are disclosed in the notes to the Schedule of Investments, if applicable. The amounts of realized gains and losses and changes in unrealized gains and losses on derivative instruments during the year are disclosed in the Statement of Operations.
Futures Contracts – The Fund may enter into futures contracts. A futures contract is an agreement between two parties to buy or sell an asset at a set price on a future date. The Fund uses futures contracts to manage or obtain exposure to the investment markets, commodities, or movements in interest rates and currency values. The primary risks associated with the use of futures contracts are the imperfect correlation between the change in market value of the investments held by the Fund and the prices of futures contracts
| 17 |
| The Hartford Quality Bond Fund |
| Notes to Financial Statements – (continued) |
| October 31, 2014 |
| (000’s Omitted) |
and the possibility of an illiquid market. Upon entering into a futures contract, the Fund is required to deposit with a futures commission merchant (“FCM”) an amount of cash or U.S. Government or Agency Obligations in accordance with the initial margin requirements of the broker or exchange. Futures contracts are marked to market daily at the most recent settlement price reported by an exchange on which, over time, they are traded most extensively, and an appropriate payable or receivable for the change in value (“variation margin”) is recorded by the Fund. Gains or losses are recognized but not considered realized until the contracts expire or are closed. Futures contracts involve, to varying degrees, risk of loss in excess of the variation margin disclosed on the Statement of Assets and Liabilities; however, the Fund seeks to reduce this risk through the use of an FCM. The Fund, as shown on the Schedule of Investments, had outstanding futures contracts as of October 31, 2014.
Options Contracts – An option contract is a contract sold by one party to another party that offers the buyer the right, but not the obligation, to buy (call) or sell (put) an investment or other financial asset at an agreed-upon price during a specific period of time or on a specific date. Options contracts are either privately negotiated in the over-the-counter market ("OTC options") or executed in a registered exchange ("exchange traded options"). The Fund may write (sell) covered call and put options on futures, swaps (“swaptions”), securities, commodities or currencies. “Covered” means that so long as the Fund is obligated as the writer of an option, it will own either the underlying investments or currency or an option to purchase the same underlying investments or currency having an expiration date of the covered option and an exercise price equal to or less than the exercise price of the covered option, or will pledge cash or other liquid investments having a value equal to or greater than the fluctuating market value of the option investment or currency. Writing put options increases the Fund’s exposure to the underlying instrument. Writing call options decreases the Fund’s exposure to the underlying instrument. Premiums received from writing options that expire are treated as realized gains. Premiums received from writing options that are exercised or closed are added to the proceeds or offset amounts paid on the underlying futures, swap, investment or currency transaction to determine the realized gain or loss. The Fund as a writer of an option has no control over whether the underlying instrument may be sold (call) or purchased (put) and as a result bears the market risk of an unfavorable change in the price of the instrument underlying the written option. There is the risk the Fund may not be able to enter into a closing transaction because of an illiquid market. The Fund may also purchase put and call options. Purchasing call options increases the Fund’s exposure to the underlying instrument. Purchasing put options decreases the Fund’s exposure to the underlying instrument. The Fund pays a premium, which is included on the Fund’s Statement of Assets and Liabilities as an investment and is subsequently marked to market to reflect the current value of the option. Premiums paid for purchasing options that expire are treated as realized losses. Certain options may be purchased with premiums to be determined on a future date. The premiums for these options are based upon implied volatility parameters at specified terms. The risk associated with purchasing put and call options is generally limited to the premium paid. Premiums paid for purchasing options that are exercised or closed are added to the amounts paid or offset against the proceeds on the underlying investment transaction to determine the realized gain or loss. Entering into over-the-counter options also exposes the Fund to counterparty risk. Counterparty risk is the possibility that the counterparty to the agreements may default on its obligation to perform or disagree as to the meaning of the contractual terms in the agreements.
As of October 31, 2014 the Fund had no outstanding purchased option or written option contracts. There were no transactions involving written option contracts during the year ended October 31, 2014.
| 18 |
| The Hartford Quality Bond Fund |
| Notes to Financial Statements – (continued) |
| October 31, 2014 |
| (000’s Omitted) |
Additional Derivative Instrument Information:
Fair Value of Derivative Instruments on the Statement of Assets and Liabilities as of October 31, 2014:
| Risk Exposure Category | ||||||||||||||||||||||||||||
| Interest
Rate Contracts | Foreign Exchange Contracts | Credit Contracts | Equity Contracts | Commodity Contracts | Other Contracts | Total | ||||||||||||||||||||||
| Assets: | ||||||||||||||||||||||||||||
| Variation margin receivable * | $ | 1 | $ | — | $ | — | $ | — | $ | — | $ | — | $ | 1 | ||||||||||||||
| Total | $ | 1 | $ | — | $ | — | $ | — | $ | — | $ | — | $ | 1 | ||||||||||||||
| Liabilities: | ||||||||||||||||||||||||||||
| Variation margin payable * | $ | 10 | $ | — | $ | — | $ | — | $ | — | $ | — | $ | 10 | ||||||||||||||
| Total | $ | 10 | $ | — | $ | — | $ | — | $ | — | $ | — | $ | 10 | ||||||||||||||
| * | Only current day's variation margin is reported within the Statement of Assets and Liabilities. The variation margin is included in the open futures net cumulative appreciation of $21 as reported in the Schedule of Investments. |
The ratio of futures market value to net assets at October 31, 2014 was 18.39%, compared to the twelve-month average ratio of 12.26% during the year ended October 31, 2014.
The Effect of Derivative Instruments on the Statement of Operations for the year ended October 31, 2014:
| Risk Exposure Category | ||||||||||||||||||||||||||||
| Interest
Rate Contracts | Foreign Exchange Contracts | Credit Contracts | Equity Contracts | Commodity Contracts | Other Contracts | Total | ||||||||||||||||||||||
| Realized Gain on Derivatives Recognized as a Result of Operations: | ||||||||||||||||||||||||||||
| Net realized gain on purchased option contracts | $ | 3 | $ | — | $ | — | $ | — | $ | — | $ | — | $ | 3 | ||||||||||||||
| Net realized gain on futures contracts | 235 | — | — | — | — | — | 235 | |||||||||||||||||||||
| Total | $ | 238 | $ | — | $ | — | $ | — | $ | — | $ | — | $ | 238 | ||||||||||||||
| Net Change in Unrealized Appreciation (Depreciation) on Derivatives Recognized as a Result of Operations: | ||||||||||||||||||||||||||||
| Net change in unrealized depreciation of futures contracts | $ | (8 | ) | $ | — | $ | — | $ | — | $ | — | $ | — | $ | (8 | ) | ||||||||||||
| Total | $ | (8 | ) | $ | — | $ | — | $ | — | $ | — | $ | — | $ | (8 | ) | ||||||||||||
Balance Sheet Offsetting Information - The following discloses both gross information and net information about instruments and transactions eligible for offset in the financial statements, and instruments and transactions that are subject to a master netting arrangement, as well as amounts related to margin, reflected as financial collateral (including cash collateral), held at clearing brokers, counterparties and the Fund’s custodian. The master netting arrangements allow the clearing brokers to net any collateral held in or on behalf of the Fund, or liabilities or payment obligations of the clearing brokers to the Fund, against any liabilities or payment obligations of the Fund to the clearing brokers. The Fund is required to deposit financial collateral (including cash collateral) at the FCM's custodian on behalf of clearing brokers and counterparties to continually meet the original and maintenance requirements established by the clearing brokers and counterparties. Such requirements are specific to the respective clearing broker or counterparty. Certain master netting arrangements may not be enforceable in the bankruptcy proceedings of a counterparty.
| 19 |
| The Hartford Quality Bond Fund |
| Notes to Financial Statements – (continued) |
| October 31, 2014 |
| (000’s Omitted) |
Offsetting of Financial Assets and Derivative Assets as of October 31, 2014:
| Gross
Amounts* of Assets Presented in Statement of Assets and Liabilities | Financial Instruments with Allowable Netting | Non-cash Collateral Received | Cash
Collateral Received | Net
Amount (not less than $0) | ||||||||||||||||
| Description | ||||||||||||||||||||
| Futures contracts - variation margin receivable | $ | 1 | $ | (1 | ) | $ | — | $ | — | $ | — | |||||||||
| Total subject to a master netting or similar arrangement | $ | 1 | $ | (1 | ) | $ | — | $ | — | $ | — | |||||||||
* Gross amounts are presented here as there are no amounts that are netted within the Statement of Assets and Liabilities.
Offsetting of Financial Liabilities and Derivative Liabilities as of October 31, 2014:
| Gross
Amounts* of Liabilities Presented in Statement of Assets and Liabilities | Financial Instruments with Allowable Netting | Non-cash Collateral Pledged | Cash
Collateral Pledged | Net
Amount (not less than $0) | ||||||||||||||||
| Description | ||||||||||||||||||||
| Futures contracts - variation margin payable | $ | 10 | $ | (1 | ) | $ | — | $ | (52 | ) | $ | — | ||||||||
| Total subject to a master netting or similar arrangement | $ | 10 | $ | (1 | ) | $ | — | $ | (52 | ) | $ | — | ||||||||
* Gross amounts are presented here as there are no amounts that are netted within the Statement of Assets and Liabilities.
Principal Risks:
Credit risk depends largely on the perceived financial health of bond issuers. In general, the credit rating is inversely related to the credit risk of the issuer. Higher rated bonds generally are deemed to have less credit risk, while lower or unrated bonds are deemed to have higher risk of default. The share price, yield and total return of a fund that holds securities with higher credit risk may be more volatile than those of a fund that holds bonds with lower credit risk. Similar to credit risk, the Fund may be exposed to counterparty risk, or the risk that an institution or other entity with which the Fund has unsettled or open transactions will default.
The Fund’s investments expose the Fund to various risks including, but not limited to, interest rate, prepayment and extension risks. Interest rate risk is the risk that fixed income securities will decline in value because of changes in interest rates. As nominal interest rates rise, the values of certain fixed income securities held by the Fund are likely to decrease. A nominal interest rate can be described as the sum of a real interest rate and an expected inflation rate. Fixed income securities with longer durations tend to be more sensitive to changes in interest rates, usually making them more volatile than securities with shorter durations. Duration is useful primarily as a measure of the sensitivity of a fixed income security’s market price to interest rate (i.e., yield) movements. Rising interest rates may cause prepayments to occur at a slower than expected rate, thereby effectively lengthening the maturity of the security and making the security more sensitive to interest rate changes. Prepayment and extension risk are major risks of mortgage backed securities and certain asset backed securities. For certain asset backed securities, the actual maturity may be less than the stated maturity shown in the Schedule of Investments, if applicable. As a result, the timing of income recognition relating to these securities may vary based upon the actual maturity.
The market values of equity securities, such as common stocks and preferred stocks, or equity related investments, such as futures and options, may decline due to general market conditions which are not specifically related to a particular company, such as real or perceived adverse economic conditions, changes in the general outlook for corporate earnings, changes in interest or currency rates or adverse investor sentiment generally. The market value of equity securities may also decline due to factors which affect a particular industry or industries, such as labor shortages or increased production costs and competitive conditions within an industry. Equity securities and equity related investments generally have greater market price volatility than fixed income securities.
| 20 |
| The Hartford Quality Bond Fund |
| Notes to Financial Statements – (continued) |
| October 31, 2014 |
| (000’s Omitted) |
Federal Income Taxes:
Federal Income Taxes – For federal income tax purposes, the Fund intends to continue to qualify as a Regulated Investment Company ("RIC") under Subchapter M of the Internal Revenue Code (“IRC”) by distributing substantially all of its taxable net investment income and net realized capital gains to its shareholders and otherwise complying with the requirements of the IRC. The Fund has distributed substantially all of its income and capital gains in prior years, if applicable, and intends to distribute substantially all of its income and capital gains during the calendar year ending December 31, 2014. Accordingly, no provision for federal income or excise taxes has been made in the accompanying financial statements. Distributions from short-term capital gains are treated as ordinary income distributions for federal income tax purposes.
Net Investment Income (Loss), Net Realized Gains (Losses) and Distributions – Net investment income (loss) and net realized gains (losses) may differ for financial statement and tax purposes primarily because of losses deferred due to wash sale adjustments, foreign currency gains and losses, adjustments related to Passive Foreign Investment Companies ("PFICs"), Real Estate Investment Trusts ("REITs"), RICs, certain derivatives and partnerships. The character of distributions made during the year from net investment income or net realized gains may differ from their ultimate characterization for federal income tax purposes. Also, due to the timing of dividend distributions, the fiscal year in which amounts are distributed may differ from the year that the income or realized gains (losses) were recorded by the Fund.
Distributions and Components of Distributable Earnings – The tax character of distributions paid by the Fund for the periods indicated is as follows (as adjusted for dividends payable, if applicable):
| For the Year Ended October 31, 2014 | For the Year Ended October 31, 2013 * | |||||||
| Ordinary Income | $ | 191 | $ | 138 | ||||
| * | Commenced operations on November 30, 2012. |
As of October 31, 2014, the Fund’s components of distributable earnings (deficit) on a tax basis are as follows:
| Amount | ||||
| Undistributed Ordinary Income | $ | 349 | ||
| Undistributed Long-Term Capital Gain | 75 | |||
| Unrealized Appreciation* | 79 | |||
| Total Accumulated Earnings | $ | 503 | ||
| * | Differences between book-basis and tax-basis unrealized appreciation (depreciation) may be attributable to the losses deferred due to wash sale adjustments, foreign currency gains and losses, adjustments related to PFICs, REITs, RICs, certain derivatives and partnerships. |
Reclassification of Capital Accounts – The Fund may record reclassifications in its capital accounts. These reclassifications have no impact on the total net assets of the Fund. The reclassifications are a result of permanent differences between U.S. GAAP and tax accounting for such items as foreign currency, PFICs, expiration or utilization of capital loss carryforwards or net operating losses. Adjustments are made to reflect the impact these items have on current and future distributions to shareholders. Therefore, the source of the Fund’s distributions may be shown in the accompanying Statement of Changes in Net Assets as from undistributed net investment income, from accumulated net realized gains on investments or from capital depending on the type of book and tax differences that exist. For the year ended October 31, 2014, the Fund recorded reclassifications to increase (decrease) the accounts listed below:
| Amount | ||||
| Undistributed Net Investment Income (Loss) | $ | 23 | ||
| Accumulated Net Realized Gain (Loss) | (23 | ) | ||
| 21 |
| The Hartford Quality Bond Fund |
| Notes to Financial Statements – (continued) |
| October 31, 2014 |
| (000’s Omitted) |
Capital Loss Carryforward – On December 22, 2010, the Regulated Investment Company Modernization Act of 2010 (the “Act”) was enacted, which made changes to the capital loss carryforward rules. The changes are effective for taxable years beginning after the date of enactment. Under the Act, funds are permitted to carry forward capital losses for an unlimited period. Additionally, capital loss carryforwards retain their character as either short-term or long-term capital losses rather than being considered all short-term as permitted under prior regulation.
The Fund had no capital loss carryforward for U.S. federal income tax purposes as of October 31, 2014.
During the year ended October 31, 2014, the Fund utilized $407 of prior year short term capital loss carryforwards and $68 of prior year long term capital loss carryforwards.
Accounting for Uncertainty in Income Taxes – The Fund has adopted financial reporting rules that require the Fund to analyze all open tax years, as defined by the statute of limitations, for all major jurisdictions. Generally, tax authorities can examine all tax returns filed for the last three years. The Fund does not have an examination in progress.
The Fund has reviewed all open tax years and major jurisdictions and concluded that these financial reporting rules had no effect on the Fund’s financial position or results of operations. There is no tax liability resulting from unrecognized tax benefits relating to uncertain income tax positions taken or expected to be taken on the tax return for the fiscal year ended October 31, 2014. The Fund is also not aware of any tax positions for which it is reasonably possible that the total amounts of unrecognized tax benefits will significantly change in the next twelve months.
Expenses:
Investment Management Agreement – Hartford Funds Management Company, LLC ("HFMC") serves as the Fund’s investment manager pursuant to an Investment Management Agreement with the Company. HFMC is an indirect wholly owned subsidiary of The Hartford Financial Services Group, Inc. ("The Hartford"). The investment manager has overall investment supervisory responsibility for the Fund. In addition, the investment manager provides administrative personnel, services, equipment, facilities and office space for proper operation of the Fund. HFMC has contracted with Wellington Management Company, LLP ("Wellington Management") under a sub-advisory agreement for the provision of day-to-day investment management services to the Fund in accordance with the Fund’s investment objective and policies. The Fund pays a fee to the investment manager, a portion of which may be used to compensate Wellington Management.
The schedule below reflects the rates of compensation paid to the investment manager for investment management services rendered as of October 31, 2014; the rates are accrued daily and paid monthly:
| Average Daily Net Assets | Annual Fee |
| On first $500 million | 0.500% |
| On next $500 million | 0.450% |
| On next $1.5 billion | 0.445% |
| On next $2.5 billion | 0.440% |
| On next $5 billion | 0.430% |
| Over $10 billion | 0.420% |
HFMC contractually agreed to waive investment management fees of 0.05% of average daily net assets until February 28, 2014. These amounts are deducted from expenses and are reported as expense waivers on the accompanying Statement of Operations, as applicable.
| 22 |
| The Hartford Quality Bond Fund |
| Notes to Financial Statements – (continued) |
| October 31, 2014 |
| (000’s Omitted) |
Accounting Services Agreement – Pursuant to the Fund Accounting Agreement between HFMC and the Company, on behalf of the Fund, HFMC provides accounting services to the Fund and receives monthly compensation based on the Fund’s average daily net assets at the rates set forth below. The Fund’s accounting services fees are accrued daily and paid monthly.
| Average Daily Net Assets | Annual Fee |
| On first $5 billion | 0.014% |
| On next $5 billion | 0.012% |
| Over $10 billion | 0.010% |
Operating Expenses – Allocable expenses incurred by the Company are allocated to each Fund and allocated to classes within the Fund in proportion to the average daily net assets of the Fund and each class, except where allocation of certain expenses is more fairly made directly to the Fund or to specific classes within a Fund. From March 1, 2014 through October 31, 2014, HFMC contractually limited the total operating expenses of this Fund, exclusive of taxes, interest expense, brokerage commissions, acquired fund fees and expenses and extraordinary expenses, through February 28, 2015 as follows:
| Class A | Class C | Class I | Class R3 | Class R4 | Class R5 | Class Y |
| 0.95% | 1.70% | 0.70% | 1.25% | 0.95% | 0.65% | 0.60% |
From November 1, 2013 through February 28, 2014, the investment manager contractually limited the total operating expenses of this Fund, exclusive of taxes, interest expense, brokerage commissions, acquired fund fees and expenses and extraordinary expenses as follows:
| Class A | Class C | Class I | Class R3 | Class R4 | Class R5 | Class Y |
| 0.90% | 1.65% | 0.65% | 1.20% | 0.90% | 0.60% | 0.55% |
Distribution and Service Plan for Class A, C, R3 and R4 Shares – Hartford Funds Distributors, LLC ("HFD"), an indirect wholly owned subsidiary of The Hartford, is the principal underwriter and distributor of the Fund. HFD is engaged in distribution activities, which include marketing and distribution of shares through broker/dealers, financing distribution costs and maintaining financial books and records. For the year ended October 31, 2014, HFD received front-end load sales charges of $19 and contingent deferred sales charges of an amount which rounds to zero from the Fund.
The Fund has adopted a Distribution and Service Plan in accordance with Rule 12b-1 of the 1940 Act to compensate the distributor (HFD) for activities intended to result in the sale and distribution of Class A, C, R3 and R4 shares and for providing services for shareholders. The Rule 12b-1 plan applicable to Class A shares of the Fund provides for payment of a Rule 12b-1 fee of 0.25% of average daily net assets. Some or all of the fee may be used for shareholder servicing expenses with the remainder used for distribution expenses. Under the Class C Plan, the Fund pays the distributor 1.00% of the average daily net assets of Class C shares outstanding, 0.25% of which is intended as a fee for services provided to existing shareholders with the remainder used for distribution expenses. For Class C shares, some or the entire fee may be remitted to broker/dealers for distribution and/or shareholder account services. Class R3 shares have a distribution fee of 0.50% of average daily net assets and Class R4 shares have a distribution fee of 0.25% of average daily net assets. For Class R3 and R4 shares, some or the entire fee may be remitted to broker/dealers for distribution and/or shareholder account services. The Fund’s 12b-1 fees are accrued daily and paid monthly or at such other intervals as the Board of Directors may determine.
Other Related Party Transactions – Certain officers of the Fund are directors and/or officers of HFMC and/or The Hartford or its subsidiaries. For the year ended October 31, 2014, a portion of the Fund’s Chief Compliance Officer’s compensation was paid by all of the investment companies in the Hartford fund complex. The portion allocated to the Fund, as represented in other expenses on the Statement of Operations, rounds to zero. Hartford Administrative Services Company (“HASCO”), an indirect wholly-owned subsidiary of The Hartford, provides transfer agent services to the Fund. HASCO has contractually agreed to reimburse any portion of the transfer agency fees over 0.30% of average daily net assets per fiscal year for each class. Any transfer agency fee reimbursement is determined before considering the contractual operating expense limitation. For providing such services, HASCO is compensated on a per account basis that varies by account type, except with respect to Class Y, for which it is compensated based on average
| 23 |
| The Hartford Quality Bond Fund |
| Notes to Financial Statements – (continued) |
| October 31, 2014 |
| (000’s Omitted) |
daily net assets. The amount paid to HASCO and any related contractual reimbursement amounts, if applicable, can be found in the Statement of Operations. These fees are accrued daily and paid monthly.
Administrative services fees are paid to HASCO for third-party recordkeeping services that are payable as a percentage of net assets in the amount of up to 0.20%, 0.15% and 0.10% for Classes R3, R4 and R5 shares, respectively. The total administrative services fees are shown on the Statement of Operations. These fees are accrued daily and paid monthly.
Affiliate Holdings:
As of October 31, 2014, affiliates of The Hartford had ownership of shares in the Fund as follows:
| Percentage of Class | Percentage of Fund | |||||||
| Class A | 54 | % | 16 | % | ||||
| Class C | 81 | 5 | ||||||
| Class I | 98 | 7 | ||||||
| Class R3 | 100 | 7 | ||||||
| Class R4 | 100 | 7 | ||||||
| Class R5 | 100 | 7 | ||||||
| Class Y | 100 | 33 | ||||||
Investment Transactions:
For the year ended October 31, 2014, the cost of purchases and proceeds from sales of investment securities (excluding short-term investments) were as follows:
| Excluding U.S. Government Obligations | U.S. Government Obligations | Total | ||||||||||
| Cost of Purchases | $ | 311,943 | $ | 2,620 | $ | 314,563 | ||||||
| Sales Proceeds | 308,953 | 1,954 | 310,907 | |||||||||
| 24 |
| The Hartford Quality Bond Fund |
| Notes to Financial Statements – (continued) |
| October 31, 2014 |
| (000’s Omitted) |
Capital Share Transactions:
The following information is for the year ended October 31, 2014, and the period November 30, 2012 (commencement of operations) through October 31, 2013:
| For the Year Ended October 31, 2014 | For the Period Ended October 31, 2013 | |||||||||||||||||||||||||||||||
| Shares Sold | Shares
Issued for Reinvested Dividends | Shares Redeemed | Net
Increase (Decrease) of Shares | Shares Sold | Shares
Issued for Reinvested Dividends | Shares Redeemed | Net
Increase (Decrease) of Shares | |||||||||||||||||||||||||
| Class A | ||||||||||||||||||||||||||||||||
| Shares | 401 | 5 | (263 | ) | 143 | 722 | 4 | (28 | ) | 698 | ||||||||||||||||||||||
| Amount | $ | 4,030 | $ | 48 | $ | (2,608 | ) | $ | 1,470 | $ | 7,205 | $ | 34 | $ | (269 | ) | $ | 6,970 | ||||||||||||||
| Class C | ||||||||||||||||||||||||||||||||
| Shares | 14 | — | (58 | ) | (44 | ) | 236 | — | (7 | ) | 229 | |||||||||||||||||||||
| Amount | $ | 148 | $ | 1 | $ | (571 | ) | $ | (422 | ) | $ | 2,355 | $ | 2 | $ | (69 | ) | $ | 2,288 | |||||||||||||
| Class I | ||||||||||||||||||||||||||||||||
| Shares | 2 | 2 | (3 | ) | 1 | 206 | 1 | — | 207 | |||||||||||||||||||||||
| Amount | $ | 27 | $ | 19 | $ | (42 | ) | $ | 4 | $ | 2,058 | $ | 13 | $ | — | $ | 2,071 | |||||||||||||||
| Class R3 | ||||||||||||||||||||||||||||||||
| Shares | — | — | — | — | 200 | 1 | — | 201 | ||||||||||||||||||||||||
| Amount | $ | — | $ | 8 | $ | — | $ | 8 | $ | 2,000 | $ | 6 | $ | — | $ | 2,006 | ||||||||||||||||
| Class R4 | ||||||||||||||||||||||||||||||||
| Shares | — | 1 | — | 1 | 200 | 1 | — | 201 | ||||||||||||||||||||||||
| Amount | $ | — | $ | 13 | $ | — | $ | 13 | $ | 2,000 | $ | 9 | $ | — | $ | 2,009 | ||||||||||||||||
| Class R5 | ||||||||||||||||||||||||||||||||
| Shares | — | 2 | — | 2 | 200 | 1 | — | 201 | ||||||||||||||||||||||||
| Amount | $ | — | $ | 18 | $ | — | $ | 18 | $ | 2,000 | $ | 13 | $ | — | $ | 2,013 | ||||||||||||||||
| Class Y | ||||||||||||||||||||||||||||||||
| Shares | — | 9 | — | 9 | 900 | 6 | — | 906 | ||||||||||||||||||||||||
| Amount | $ | — | $ | 84 | $ | — | $ | 84 | $ | 8,999 | $ | 60 | $ | — | $ | 9,059 | ||||||||||||||||
| Total | ||||||||||||||||||||||||||||||||
| Shares | 417 | 19 | (324 | ) | 112 | 2,664 | 14 | (35 | ) | 2,643 | ||||||||||||||||||||||
| Amount | $ | 4,205 | $ | 191 | $ | (3,221 | ) | $ | 1,175 | $ | 26,617 | $ | 137 | $ | (338 | ) | $ | 26,416 | ||||||||||||||
Line of Credit:
The Fund is one of several Hartford Funds that participate in a $500 million committed revolving line of credit facility. The facility is to be used for temporary or emergency purposes. Under the arrangement, the funds are required to own securities having a market value in excess of 300% of the total bank borrowings. The interest rate on borrowings varies depending on the nature of the loan. The facility also requires a fee to be paid based on the amount of the commitment. This commitment fee is allocated to all the funds participating in the line of credit based on the average net assets of the funds. During the year ended October 31, 2014, the Fund did not have any borrowings under this facility.
Pending Legal Proceedings:
On February 25, 2011, Jennifer L. Kasilag, Louis Mellinger, Judith M. Menendez, Jacqueline M. Robinson, and Linda A. Russell filed a derivative lawsuit against Hartford Investment Financial Services, LLC (“HIFSCO”) (now known as HFD) on behalf of six Hartford retail mutual funds in the United States District Court for the District of New Jersey, alleging that HIFSCO received excessive advisory and distribution fees in violation of its statutory fiduciary duty under Section 36(b) of the 1940 Act when serving as investment manager and principal underwriter, respectively, to the Hartford retail mutual funds. Although this action was purportedly filed on behalf of certain of the Hartford Funds, none of the Hartford Funds is itself a defendant to the suit. HIFSCO moved to dismiss and, in September 2011, the motion was granted in part and denied in part, with leave to amend the complaint. In November 2011, plaintiffs filed an amended complaint on behalf of certain Hartford retail mutual funds, The Hartford Global Health Fund (now known as The Hartford Healthcare Fund), The Hartford Conservative Allocation Fund, The Hartford Growth Opportunities Fund, The Hartford Inflation Plus Fund, The Hartford Advisers Fund (now known as The Hartford Balanced Fund), and The Hartford Capital Appreciation Fund. Plaintiffs seek to rescind the investment management agreements and distribution plans between HIFSCO and these funds and to recover the total fees charged thereunder or, in the alternative, to recover any improper compensation HIFSCO received, in addition to lost earnings. HIFSCO filed a partial motion to
| 25 |
| The Hartford Quality Bond Fund |
| Notes to Financial Statements – (continued) |
| October 31, 2014 |
| (000’s Omitted) |
dismiss the amended complaint and, in December 2012, the court dismissed without prejudice the claims regarding distribution fees and denied the motion with respect to the advisory fees claims. HIFSCO disputes the allegations and intends to defend vigorously.
In March 2014, the plaintiffs filed a new complaint that added as new plaintiffs The Hartford Floating Rate Fund and The Hartford Small Company Fund and named as a defendant HFMC, which assumed the role as investment manager to the funds as of January 2013. HFMC and HIFSCO dispute the allegations and intend to defend vigorously.
No accrual for litigation relating to this matter has been recorded in the financial statements of the Fund because the Fund is not party to the suit.
Indemnifications:
Under the Company's organizational documents, the Company shall indemnify its officers and directors to the full extent required or permitted under Maryland General Corporation Law and the federal securities laws. In addition, the Company, on behalf of the Fund, may enter into contracts that contain a variety of indemnifications. The Company's maximum exposure under these arrangements is unknown. However, as of the date of these financial statements, the Company has not had prior claims or losses pursuant to these contracts and expects the risk of loss to be remote.
Subsequent Event:
Effective December 1, 2014, pursuant to a sub-transfer agency agreement between HASCO and Boston Financial Data Services, Inc. (“BFDS”), HASCO has delegated certain transfer agent, dividend disbursing agent and shareholder servicing agent functions to BFDS. The costs and expenses of such delegation are borne by HASCO, not by the Fund.
| 26 |
| The Hartford Quality Bond Fund |
|
Financial Highlights |
| - Selected Per-Share Data - (A) | - Ratios and Supplemental Data - | |||||||||||||||||||||||||||||||||||||||||||||||||||
| Class | Net Asset Value at Beginning of Period | Net Investment Income (Loss) | Net Realized and Unrealized Gain (Loss) on Invest- ments | Total from Investment Operations | Dividends from Net Investment Income | Distribu- tions from Realized Capital Gains | Total Dividends and Distributions | Net Asset Value at End of Period | Total Return(B) | Net Assets at End of Period (000's) | Ratio of Expenses to Average Net Assets Before Adjust- ments(C) | Ratio of Expenses to Average Net Assets After Adjust- ments(C) | Ratio of Net Investment Income (Loss) to Average Net Assets | |||||||||||||||||||||||||||||||||||||||
| For the Year Ended October 31, 2014 | ||||||||||||||||||||||||||||||||||||||||||||||||||||
| A | $ | 9.82 | $ | 0.05 | $ | 0.39 | $ | 0.44 | $ | (0.07 | ) | $ | – | $ | (0.07 | ) | $ | 10.19 | 4.48 | % | $ | 8,568 | 1.26 | % | 0.86 | % | 0.52 | % | ||||||||||||||||||||||||
| C | 9.79 | (0.02 | ) | 0.39 | 0.37 | (0.01 | ) | – | (0.01 | ) | 10.15 | 3.75 | 1,882 | 2.01 | 1.61 | (0.22 | ) | |||||||||||||||||||||||||||||||||||
| I | 9.82 | 0.08 | 0.39 | 0.47 | (0.09 | ) | – | (0.09 | ) | 10.20 | 4.83 | 2,119 | 0.98 | 0.58 | 0.81 | |||||||||||||||||||||||||||||||||||||
| R3 | 9.80 | 0.02 | 0.39 | 0.41 | (0.04 | ) | – | (0.04 | ) | 10.17 | 4.17 | 2,048 | 1.68 | 1.23 | 0.17 | |||||||||||||||||||||||||||||||||||||
| R4 | 9.81 | 0.05 | 0.39 | 0.44 | (0.06 | ) | – | (0.06 | ) | 10.19 | 4.53 | 2,060 | 1.38 | 0.93 | 0.47 | |||||||||||||||||||||||||||||||||||||
| R5 | 9.82 | 0.08 | 0.39 | 0.47 | (0.09 | ) | – | (0.09 | ) | 10.20 | 4.79 | 2,072 | 1.08 | 0.63 | 0.77 | |||||||||||||||||||||||||||||||||||||
| Y | 9.82 | 0.08 | 0.39 | 0.47 | (0.09 | ) | – | (0.09 | ) | 10.20 | 4.84 | 9,333 | 0.98 | 0.58 | 0.82 | |||||||||||||||||||||||||||||||||||||
| From November 30, 2012 (commencement of operations), through October 31, 2013 | ||||||||||||||||||||||||||||||||||||||||||||||||||||
| A(D) | $ | 10.00 | $ | 0.05 | $ | (0.18 | ) | $ | (0.13 | ) | $ | (0.05 | ) | $ | – | $ | (0.05 | ) | $ | 9.82 | (1.29 | )%(E) | $ | 6,849 | 1.28 | %(F) | 0.81 | %(F) | 0.52 | %(F) | ||||||||||||||||||||||
| C(D) | 10.00 | (0.02 | ) | (0.18 | ) | (0.20 | ) | (0.01 | ) | – | (0.01 | ) | 9.79 | (1.99 | )(E) | 2,239 | 2.03 | (F) | 1.56 | (F) | ( 0.23 | )(F) | ||||||||||||||||||||||||||||||
| I(D) | 10.00 | 0.07 | (0.18 | ) | (0.11 | ) | (0.07 | ) | – | (0.07 | ) | 9.82 | (1.14 | )(E) | 2,036 | 1.03 | (F) | 0.55 | (F) | 0.76 | (F) | |||||||||||||||||||||||||||||||
| R3(D) | 10.00 | 0.01 | (0.18 | ) | (0.17 | ) | (0.03 | ) | – | (0.03 | ) | 9.80 | (1.69 | )(E) | 1,966 | 1.72 | (F) | 1.20 | (F) | 0.12 | (F) | |||||||||||||||||||||||||||||||
| R4(D) | 10.00 | 0.04 | (0.18 | ) | (0.14 | ) | (0.05 | ) | – | (0.05 | ) | 9.81 | (1.43 | )(E) | 1,972 | 1.42 | (F) | 0.90 | (F) | 0.41 | (F) | |||||||||||||||||||||||||||||||
| R5(D) | 10.00 | 0.07 | (0.19 | ) | (0.12 | ) | (0.06 | ) | – | (0.06 | ) | 9.82 | (1.16 | )(E) | 1,977 | 1.12 | (F) | 0.60 | (F) | 0.71 | (F) | |||||||||||||||||||||||||||||||
| Y(D) | 10.00 | 0.07 | (0.18 | ) | (0.11 | ) | (0.07 | ) | – | (0.07 | ) | 9.82 | (1.13 | )(E) | 8,902 | 1.02 | (F) | 0.55 | (F) | 0.76 | (F) | |||||||||||||||||||||||||||||||
| (A) | Information presented relates to a share outstanding throughout the indicated period. Net investment income (loss) per share amounts are calculated based on average shares outstanding unless otherwise noted. |
| (B) | Assumes initial investment at net asset value at the beginning of each period, reinvestment of all distributions, the complete redemption of the investment at net asset value at the end of each period and no sales charge. Total return would be reduced if sales charges were taken into account. |
| (C) | Adjustments include waivers and reimbursements, if applicable. |
| (D) | Commenced operations on November 30, 2012. |
| (E) | Not annualized. |
| (F) | Annualized. |
| Portfolio
Turnover Rate for All Share Classes | ||||
| For the Year Ended October 31, 2014 | 27 | % | ||
| From November 30, 2012 (commencement of operations) through October 31, 2013 | 83 | (A) | ||
| (A) | Not annualized. |
| 27 |
| Report of Independent Registered Public Accounting Firm |
| The Board of Directors and Shareholders of |
| The Hartford Mutual Funds, Inc. |
We have audited the accompanying statement of assets and liabilities, including the schedule of investments, of The Hartford Quality Bond Fund (one of the portfolios constituting The Hartford Mutual Funds, Inc. (the Funds)) as of October 31, 2014, and the related statement of operations for the year then ended, and the statements of changes in net assets and the financial highlights for the periods indicated therein. These financial statements and financial highlights are the responsibility of the Funds’ management. Our responsibility is to express an opinion on these financial statements and financial highlights based on our audits.
We conducted our audits in accordance with the standards of the Public Company Accounting Oversight Board (United States). Those standards require that we plan and perform the audit to obtain reasonable assurance about whether the financial statements and financial highlights are free of material misstatement. We were not engaged to perform an audit of the Funds’ internal control over financial reporting. Our audits included consideration of internal control over financial reporting as a basis for designing audit procedures that are appropriate in the circumstances, but not for the purpose of expressing an opinion on the effectiveness of the Funds’ internal control over financial reporting. Accordingly, we express no such opinion. An audit also includes examining, on a test basis, evidence supporting the amounts and disclosures in the financial statements and financial highlights, assessing the accounting principles used and significant estimates made by management, and evaluating the overall financial statement presentation. Our procedures included confirmation of securities owned as of October 31, 2014, by correspondence with the custodian and brokers or by other appropriate auditing procedures where replies from brokers were not received. We believe that our audits provide a reasonable basis for our opinion.
In our opinion, the financial statements and financial highlights referred to above present fairly, in all material respects, the financial position of The Hartford Quality Bond Fund of The Hartford Mutual Funds, Inc. at October 31, 2014, the results of its operations for the year then ended, and the changes in its net assets and the financial highlights for the periods indicated therein, in conformity with U.S. generally accepted accounting principles.
| |
| Minneapolis, Minnesota | |
| December 18, 2014 |
| 28 |
| The Hartford Quality Bond Fund |
| Directors and Officers (Unaudited) |
The Board of Directors of the Company (the "Directors") appoints officers who are responsible for the day-to-day operations of the Fund and who execute policies formulated by the Directors. Each Director serves until his or her death, resignation, or retirement or until the next annual meeting of shareholders is held or until his or her successor is elected and qualifies.
Directors and officers who are employed by or who have a financial interest in The Hartford Financial Services Group, Inc. ("The Hartford") are considered “interested” persons of the Fund pursuant to the 1940 Act. Each officer and two of the Company's Directors, as noted in the chart below, are “interested” persons of the Fund. Each Director serves as a director for The Hartford Mutual Funds, Inc., The Hartford Mutual Funds II, Inc., Hartford Series Fund, Inc., and Hartford HLS Series Fund II, Inc., and as a trustee for The Hartford Alternative Strategies Fund, which, as of October 31, 2014, collectively consist of 66 funds. Correspondence may be sent to Directors and officers c/o Hartford Funds, 5 Radnor Corporate Center, Suite 300, 100 Matsonford Road, Radnor, Pennsylvania 19087, except that correspondence to Mr. Annoni, Mr. Dressen and Ms. Quade may be sent to 500 Bielenberg Drive, Suite 500, Woodbury, Minnesota 55125.
The table below sets forth, for each Director and officer, his or her name, year of birth, current position with the Company and date first elected or appointed to The Hartford Mutual Funds, Inc. ("MF") and The Hartford Mutual Funds II, Inc. ("MF2"), principal occupation, and, for Directors, other directorships held. The Fund’s Statement of Additional Information contains further information on the Directors and is available free of charge by calling 1-888-843-7824 or writing to: Hartford Funds, P.O. Box 55022, Boston, MA 02205-5022.
Information on the aggregate remuneration paid to the directors of the Company can be found in the Statement of Operations herein. The Fund pays to The Hartford a portion of the Chief Compliance Officer’s compensation, but does not pay salaries or compensation to any of its other officers or Directors who are employed by The Hartford.
Non-Interested Directors
Hilary E. Ackermann (1956) Director since September 23, 2014
Ms. Ackermann served as Chief Risk Officer at Goldman Sachs Bank USA from October 2008 to November 2011 and serves as a Director of Dynegy, Inc., an independent power company, from October 2012 to present.
Lynn S. Birdsong (1946) Director since 2003, Chairman of the Investment Committee since 2014
Mr. Birdsong is a private investor. Mr. Birdsong currently serves as a Director of the Sovereign High Yield Investment Company (April 2010 to current). Mr. Birdsong currently serves as an Independent Director of Nomura Partners Funds, Inc. (formerly, The Japan Fund) (April 2003 to current). From 2003 to March 2005, Mr. Birdsong was an Independent Director of the Atlantic Whitehall Funds. From 1979 to 2002, Mr. Birdsong was a Managing Director of Zurich Scudder Investments, an investment management firm. During his employment with Scudder, Mr. Birdsong was an Interested Director of The Japan Fund. From January 1981 through December 2013, Mr. Birdsong was a partner in Birdsong Company, an advertising specialty firm.
Robert M. Gavin, Jr. (1940) Director since 2002 (MF) and 1986 (MF2), Chairman of the Board for each since 2004
Dr. Gavin is an educational consultant. Prior to September 1, 2001, he was President of Cranbrook Education Community and prior to July 1996, he was President of Macalester College, St. Paul, Minnesota.
Duane E. Hill (1945) Director since 2001 (MF) and 2002 (MF2), Chairman of the Nominating Committee since 2003
Mr. Hill is a Partner of TSG Ventures L.P., a private equity investment company. Mr. Hill is a former partner of TSG Capital Group, a private equity investment firm that served as sponsor and lead investor in leveraged buyouts of middle market companies.
Sandra S. Jaffee (1941) Director since 2005
Ms. Jaffee is the founder and Chief Executive Officer of a private company, Homeworks Concierge, LLC, which provides residential property management services in Westchester County, New York (January 2012 to present). Ms. Jaffee served as Chairman (2008 to 2009) and Chief Executive Officer of Fortent (formerly Searchspace Group), a leading provider of compliance/regulatory technology to financial institutions from August 2005 to August 2009. From August 2004 to August 2005, Ms. Jaffee served as an Entrepreneur in Residence with Warburg Pincus, a private equity firm. Prior to joining Warburg Pincus, Ms. Jaffee served as Executive Vice President at Citigroup, from September 1995 to July 2004, where she was President and Chief Executive Officer of Citibank’s Global Securities Services (1995 to 2003). Ms. Jaffee currently serves as a member of the Board of Directors of Broadridge Financial Solutions as well as a Trustee of Muhlenberg College.
| 29 |
| The Hartford Quality Bond Fund |
|
Directors and Officers (Unaudited) – (continued) |
William P. Johnston (1944) Director since 2005, Chairman of the Compliance Committee since 2005
In June 2006, Mr. Johnston was appointed as Senior Advisor to The Carlyle Group, a global private equity and other alternative asset investment firm and currently serves as an Operating Executive. In July 2006, Mr. Johnston was elected to the Board of Directors of MultiPlan, Inc. and served as a Director (July 2006 to August 2010). In August 2007, Mr. Johnston was elected to the Board of Directors of LifeCare Holdings, Inc. and served as a Director (August 2007 to June 2013). In February 2008, Mr. Johnston was elected to the Board of Directors of HCR-ManorCare, Inc. In May 2006, Mr. Johnston was elected to the Supervisory Board of Fresenius Medical Care AG & Co. KGaA, after its acquisition of Renal Care Group, Inc. in March 2006. Mr. Johnston joined Renal Care Group in November 2002 as a member of the Board of Directors and served as Chairman of the Board from March 2003 through March 2006. From 2002 through 2013, Mr. Johnston served as a Board member of the Georgia O’Keefe Museum. From September 1987 to December 2002, Mr. Johnston was with Equitable Securities Corporation (and its successors, SunTrust Equitable Securities and SunTrust Robinson Humphrey) serving in various investment banking and managerial positions, including Managing Director and Head of Investment Banking, Chief Executive Officer and Vice Chairman.
Phillip O. Peterson (1944) Director since 2002 (MF) and 2000 (MF2), Chairman of the Audit Committee since 2002
Mr. Peterson is a mutual fund industry consultant. He was a partner of KPMG LLP (an accounting firm) until July 1999. Mr. Peterson joined William Blair Funds in February 2007 as a member of the Board of Trustees. From February 2012 to February 2014, Mr. Peterson served as a Trustee of Symetra Variable Mutual Funds. From January 2004 to April 2005, Mr. Peterson served as Independent President of the Strong Mutual Funds.
Lemma W. Senbet (1946) Director since 2005
Dr. Senbet is the William E. Mayer Chair Professor of Finance and Founding Director, Center for Financial Policy, at the University of Maryland, Robert H. Smith School of Business. He was chair of the Finance Department of the University of Maryland, Robert H. Smith School of Business from 1998 to 2006. Since June 2013, he has been on leave from the University to serve as Executive Director of African Economic Research Consortium which focuses on economic policy research and training. Previously, he was a chaired professor of finance at the University of Wisconsin-Madison. Also, he was a Director of the Fortis Funds from March 2000 to July 2002. Dr. Senbet served as Director of the American Finance Association and President of the Western Finance Association. In 2006, Dr. Senbet was inducted Fellow of Financial Management Association International for his career-long distinguished scholarship and professional service.
Interested Directors and Officers
James E. Davey (1964) Director since 2012, President and Chief Executive Officer since 2010
Mr. Davey serves as Executive Vice President of Hartford Life Insurance Company (“HLIC”) and The Hartford. Additionally, Mr. Davey serves as Chairman of the Board, Manager and Senior Managing Director of Hartford Funds Distributors, LLC (“HFD”). He also currently serves as Director, Chairman of the Board, President and Senior Managing Director of Hartford Administrative Services Company (“HASCO”). Mr. Davey also serves as Manager, Chairman of the Board and Senior Managing Director for Hartford Funds Management Company, LLC (“HFMC”) and Director, Chairman of the Board and Senior Managing Director for Hartford Funds Management Group, Inc. ("HFMG"). Mr. Davey has served in various positions within The Hartford and its subsidiaries in connection with the operation of the Hartford Funds. Mr. Davey joined The Hartford in 2002.
Lowndes A. Smith* (1939) Director since 1996 (MF) and 2002 (MF2)
Mr. Smith served as Vice Chairman of The Hartford from February 1997 to January 2002, as President and Chief Executive Officer of Hartford Life, Inc. from February 1997 to January 2002, and as President and Chief Operating Officer of The Hartford Life Insurance Companies from January 1989 to January 2002. Mr. Smith serves as a Director of White Mountains Insurance Group Ltd. (October 2003 to current); One Beacon Insurance (October 2006 to current); Symetra Financial (August 2007 to current) and is a Managing Director of Whittington Gray Associates (January 2007 to current).
* Mr. Smith resigned as a Director of MF, MF2, Hartford Series Fund, Inc. and Hartford HLS Series Fund II, Inc. and as a Trustee of The Hartford Alternative Strategies Fund effective September 17, 2014.
Other Officers
Mark A. Annoni (1964) Vice President, Controller and Treasurer since 2012
Mr. Annoni currently serves as the Assistant Vice President of HLIC (February 2004 to present) and Senior Vice President of HFMG (December 2013 to present). Mr. Annoni has served in various positions within The Hartford and its subsidiaries in connection with the operation of the Hartford Funds. Mr. Annoni joined The Hartford in 2001.
| 30 |
| The Hartford Quality Bond Fund |
|
Directors and Officers (Unaudited) – (continued) |
Michael R. Dressen (1963) AML Compliance Officer since 2011
Mr. Dressen currently serves as Assistant Vice President of HLIC. He also serves as Chief Compliance Officer and AML Compliance Officer of HASCO and as AML Officer of HFD. Mr. Dressen has served in various positions within The Hartford and its subsidiaries in connection with the operation of the Hartford Funds.
Edward P. Macdonald (1967) Vice President, Secretary and Chief Legal Officer since 2005
Mr. Macdonald currently serves as Assistant Secretary, Executive Vice President and Deputy General Counsel of HFD, HASCO, HFMC and HFMG. He also serves as Vice President of HLIC. Mr. Macdonald has served in various positions within The Hartford and its subsidiaries in connection with the operation of the Hartford Funds. Mr. Macdonald joined The Hartford in 2005.
Joseph G. Melcher (1973) Vice President and Chief Compliance Officer since 2013
Mr. Melcher currently serves as Executive Vice President of HFD, HFMG and HASCO. Mr. Melcher also currently serves as Executive Vice President and Chief Compliance Officer of HFMC. Mr. Melcher has served in various positions within The Hartford and its subsidiaries in connection with the operation of the Hartford Funds since joining The Hartford in 2012. Prior to joining The Hartford, Mr. Melcher worked at Touchstone Investments, a member of the Western & Southern Financial Group, where he held the position of Vice President and Chief Compliance Officer from 2010 through 2012 and Assistant Vice President, Compliance from 2005 to 2010.
Vernon J. Meyer (1964) Vice President since 2006
Mr. Meyer currently serves as Senior Vice President of HLIC. He also currently serves as Managing Director and Chief Investment Officer of HFMC and Managing Director of HFMG. Mr. Meyer has served in various positions within The Hartford and its subsidiaries in connection with the operation of the Hartford Funds. Mr. Meyer joined The Hartford in 2004.
Laura S. Quade (1969) Vice President since 2012
Ms. Quade currently serves as Vice President of HASCO, HFD and HFMG. She is the Head of Operations of HASCO and formerly served as Director, Enterprise Operations of HLIC. Ms. Quade has served in various positions within The Hartford and its subsidiaries in connection with the operation of the Hartford Funds. Ms. Quade joined The Hartford in 2001.
Martin A. Swanson** (1962) Vice President since 2010
Mr. Swanson currently serves as Vice President of HLIC. Mr. Swanson also serves as Managing Director, Chief Marketing Officer and Principal of HFD and Managing Director of HFMG. Mr. Swanson has served in various positions within The Hartford and its subsidiaries in connection with the operation of the Hartford Funds.
** Mr. Swanson resigned as an officer effective November 6, 2014.
HOW TO OBTAIN A COPY OF THE FUND’S PROXY VOTING POLICIES AND VOTING RECORDS (UNAUDITED)
A description of the policies and procedures that the Fund uses to determine how to vote proxies relating to portfolio securities and information about how the Fund voted proxies relating to portfolio securities during the most recent twelve-month period ended June 30 are available (1) without charge, upon request, by calling 888-843-7824 and (2) on the SEC’s website at http://www.sec.gov.
QUARTERLY PORTFOLIO HOLDINGS INFORMATION (UNAUDITED)
The Fund files a complete schedule of portfolio holdings with the SEC for the first and third quarters of each fiscal year on Form N-Q. The Fund’s Forms N-Q are available (1) without charge, upon request, by calling 888-843-7824 and (2) on the SEC’s website at http://www.sec.gov. The Form N-Q may be reviewed and copied at the SEC’s Public Reference Room in Washington, DC. Information on the operation of the Public Reference Room may be obtained by calling 1-800-SEC-0330.
| 31 |
| The Hartford Quality Bond Fund |
|
Federal Tax Information (Unaudited) |
For the fiscal year ended October 31, 2014, there is no further federal tax information required for this Fund.
| 32 |
| The Hartford Quality Bond Fund |
|
Expense Example (Unaudited) |
Your Fund's Expenses
As a shareholder of the Fund, you incur two types of costs: (1) transaction costs, including sales charges (loads) on purchase payments, if any, and contingent deferred sales charges (CDSC), if any, and (2) ongoing costs, including investment management fees, distribution and/or service (12b-1) fees, if any, and other fund expenses. This example is intended to help you understand your ongoing costs (in dollars) of investing in the Fund and to compare these costs with the ongoing costs of investing in other mutual funds. The example is based on an investment of $1,000 invested at the beginning of the period and held for the entire period of April 30, 2014 through October 31, 2014.
Actual Expenses
The first set of columns of the table below provides information about actual account values and actual expenses. You may use the information in this column, together with the amount you invested, to estimate the expenses that you paid over the period. Simply divide your account value by $1,000 (for example, an $8,600 account value divided by $1,000 = 8.6), then multiply the result by the number in the line under the heading entitled “Expenses Paid During Period” to estimate the expenses you paid on your account during this period.
Hypothetical Example for Comparison Purposes
The second set of columns of the table below provides information about hypothetical account values and hypothetical expenses based on the Fund's actual expense ratio and an assumed rate of return of 5% per year before expenses, which is not the Fund's actual return. The hypothetical account values and expenses may not be used to estimate the actual ending account balance or expenses you paid for the period. You may use this information to compare the ongoing costs of investing in the Fund and other funds. To do so, compare this 5% hypothetical example with the 5% hypothetical examples that appear in the shareholder reports of the other funds.
Please note that the expenses shown in the table are meant to highlight your ongoing costs only and do not reflect any transactional costs, such as sales charges (loads) and CDSC. Therefore, the second set of columns of the table is useful in comparing ongoing costs only, and will not help you determine the relative total costs of owning different funds. In addition, if these transactional costs were included, your costs would be higher. Expenses are equal to the Fund's annualized expense ratios multiplied by average account value over the period, multiplied by 184/365 (to reflect the one-half year period).
| Actual return | Hypothetical (5% return before expenses) | |||||||||||||||||||||||||||||||||||
| Beginning Account Value April 30, 2014 | Ending
Account Value October 31, 2014 | Expenses
paid during the period April 30, 2014 through October 31, 2014 | Beginning Account Value April 30, 2014 | Ending
Account Value October 31, 2014 | Expenses
paid during the period April 30, 2014 through October 31, 2014 | Annualized expense ratio | Days in the current 1/2 year | Days in the full year | ||||||||||||||||||||||||||||
| Class A | $ | 1,000.00 | $ | 1,026.80 | $ | 4.55 | $ | 1,000.00 | $ | 1,020.72 | $ | 4.53 | 0.89 | % | 184 | 365 | ||||||||||||||||||||
| Class C | $ | 1,000.00 | $ | 1,023.20 | $ | 8.31 | $ | 1,000.00 | $ | 1,016.99 | $ | 8.29 | 1.63 | 184 | 365 | |||||||||||||||||||||
| Class I | $ | 1,000.00 | $ | 1,028.20 | $ | 3.12 | $ | 1,000.00 | $ | 1,022.13 | $ | 3.11 | 0.61 | 184 | 365 | |||||||||||||||||||||
| Class R3 | $ | 1,000.00 | $ | 1,025.00 | $ | 6.38 | $ | 1,000.00 | $ | 1,018.90 | $ | 6.36 | 1.25 | 184 | 365 | |||||||||||||||||||||
| Class R4 | $ | 1,000.00 | $ | 1,027.50 | $ | 4.86 | $ | 1,000.00 | $ | 1,020.42 | $ | 4.84 | 0.95 | 184 | 365 | |||||||||||||||||||||
| Class R5 | $ | 1,000.00 | $ | 1,028.00 | $ | 3.32 | $ | 1,000.00 | $ | 1,021.93 | $ | 3.31 | 0.65 | 184 | 365 | |||||||||||||||||||||
| Class Y | $ | 1,000.00 | $ | 1,028.20 | $ | 3.07 | $ | 1,000.00 | $ | 1,022.18 | $ | 3.06 | 0.60 | 184 | 365 | |||||||||||||||||||||
| 33 |
| The Hartford Quality Bond Fund |
| Approval of Investment Management and Investment Sub-Advisory Agreements (Unaudited) |
Section 15(c) of the Investment Company Act of 1940, as amended (the “1940 Act”), requires that each mutual fund’s board of directors, including a majority of those directors who are not “interested persons” of the mutual fund, as defined in the 1940 Act (the “Independent Directors”), annually review and consider the continuation of the mutual fund’s investment advisory and sub-advisory agreements. At its meeting held on August 5-6, 2014, the Board of Directors (the “Board”) of The Hartford Mutual Funds, Inc., including each of the Independent Directors, unanimously voted to approve the continuation of the investment management agreement for The Hartford Quality Bond Fund (the “Fund”) with Hartford Funds Management Company, LLC (“HFMC”) and the continuation of the investment sub-advisory agreement between HFMC and the Fund’s sub-adviser, Wellington Management Company, LLP (the “Sub-adviser,” and together with HFMC, the “Advisers”) (collectively, the “Agreements”).
In the months preceding the August 5-6, 2014 meeting, the Board requested, received and reviewed written responses from the Advisers to questions posed to them on behalf of the Independent Directors and supporting materials relating to those questions and responses. The Board considered information furnished to the Board at its meetings throughout the year, as well as information specifically prepared in connection with the annual approval of the Agreements at the Board’s meetings held on June 17-18, 2014 and August 5-6, 2014. Information provided to the Board at its meetings throughout the year included, among other things, reports on Fund performance, legal and compliance matters, sales and marketing activity, shareholder services, and the other services provided to the Fund by the Advisers and their affiliates. The Board also received in-person presentations by Fund officers and representatives of HFMC at the Board’s meetings on June 17-18, 2014 and August 5-6, 2014 concerning the Agreements.
The Independent Directors, advised by independent legal counsel, engaged service providers to assist them with evaluating the Agreements with respect to the Fund. Lipper Inc. (“Lipper”), an independent provider of investment company data, was retained to provide the Board with reports on how the Fund’s contractual management fees, actual management fees, other non-management fees, overall expense ratios and investment performance compared to those of mutual funds with similar investment objectives. The Independent Directors also engaged an independent financial services consultant (the “Consultant”) to assist them in evaluating the Fund’s management fees, sub-advisory fees, other non-management fees, overall expense ratios and investment performance. In addition, the Consultant reviewed the profitability calculations utilized by HFMC in connection with the continuation of the investment management agreement.
In determining whether to continue the Agreements for the Fund, the members of the Board reviewed and evaluated information and factors they believed to be relevant and appropriate in light of the information that the Board deemed necessary and appropriate through the exercise of its reasonable business judgment. While individual members of the Board may have weighed certain factors differently, the Board’s determination to continue the Agreements was based on a comprehensive consideration of all information provided to the Board throughout the year and specifically with respect to the continuation of the Agreements. A more detailed discussion of the factors the Board considered with respect to its approval of the Agreements is provided below.
Nature, Extent and Quality of Services Provided by the Advisers
The Board requested and considered information concerning the nature, extent and quality of the services provided to the Fund by the Advisers. The Board considered, among other things, the terms of the Agreements and the range of services provided by the Advisers. The Board considered the Advisers’ professional personnel who provide services to the Fund, including each Adviser’s ability and experience in attracting and retaining qualified personnel to service the Fund. The Board considered each Adviser’s reputation and overall financial strength, as well as its willingness to consider and implement organizational and operational changes designed to enhance services to the Hartford Funds. In addition, the Board considered the quality of each Adviser’s communications with the Board and responsiveness to Board inquiries and requests made from time to time with respect to the Fund and other Hartford Funds.
The Board also requested and evaluated information concerning each Adviser’s regulatory and compliance environment. In this regard, the Board requested and reviewed information on each Adviser’s compliance policies and procedures, compliance history, and a report from the Fund’s Chief Compliance Officer on each Adviser’s compliance with applicable laws and regulations, including responses to regulatory developments and compliance issues raised by regulators. The Board also noted the Advisers’ support of the Fund’s compliance control structure, particularly the resources devoted by the Advisers in support of the Fund’s obligations pursuant to Rule 38a-1 under the 1940 Act.
With respect to HFMC, the Board noted that, under the Agreements, HFMC is responsible for the management of the Fund, including oversight of fund operations and service providers, and provides administrative and investment advisory services in connection with selecting, monitoring and supervising the Sub-adviser. The Board considered HFMC’s ongoing monitoring of people, process and performance, including its quarterly reviews of each of the Hartford Funds, semi-annual meetings with the leaders of each Fund’s portfolio management team, and oversight of the Hartford Funds’ approximately 66 portfolio managers. The Board recognized that HFMC has demonstrated a record of making changes to the
| 34 |
| The Hartford Quality Bond Fund |
| Approval of Investment Management and Investment Sub-Advisory Agreements (Unaudited) – (continued) |
management and/or strategies of the Hartford Funds when warranted. The Board considered HFMC’s oversight of the Sub-adviser’s investment approach and results, process for monitoring best execution of portfolio trades by the Sub-adviser, and approach to risk management with respect to the Fund and the service providers to the Fund. The Board also considered HFMC’s oversight of compliance with the Fund’s objective and policies as well as with applicable laws and regulations, noting that regulatory and other developments had over time led to an increase in the scope of HFMC’s services in this regard.
In addition, the Board considered HFMC’s ongoing commitment to review and rationalize the Hartford Funds product line-up and the expenses that HFMC had incurred in connection with fund combinations in recent years. The Board considered that HFMC or its affiliates are responsible for providing the Fund’s officers.
With respect to the Sub-adviser, which provides certain day-to-day portfolio management services for the Fund, the Board considered the quality of the Fund’s portfolio manager, the Sub-adviser’s other investment personnel, its investment philosophy and process, investment research capabilities and resources, performance record, trade execution capabilities and experience. The Board considered the experience of the Fund’s portfolio manager, the number of accounts managed by the portfolio manager, and the Sub-adviser’s method for compensating the portfolio manager.
Based on these considerations, the Board concluded that it was satisfied with the nature, extent and quality of the services provided to the Fund by HFMC and the Sub-adviser.
Performance of the Fund and the Advisers
The Board considered the investment performance of the Fund. In this regard, the Board reviewed the performance of the Fund over different time periods presented in the materials and evaluated HFMC’s analysis of the Fund’s performance for these time periods. The Board considered information and materials provided to the Board by the Advisers concerning Fund performance, as well as information from Lipper comparing the investment performance of the Fund to an appropriate benchmark and universe of peer funds. The Board noted that the Fund’s performance was in the 5th quintile of its performance universe for the 1-year period. The Board also noted that the Fund’s performance was in line with its benchmark for the 1-year period. The Board further noted that certain changes had recently been made to the Fund’s principal investment strategy.
The Board considered the detailed investment analytics reports provided by Hartford Funds’ Investment Advisory Group throughout the year. These reports include, among other things, information on the Fund’s gross and net returns, the Fund’s investment performance relative to an appropriate benchmark and peer group, various statistics concerning the Fund’s portfolio, and a narrative summary of various factors affecting Fund performance. The Board considered the Advisers’ cooperation with the Investment Committee, which assists the Board in evaluating the performance of the Fund at periodic meetings throughout the year. The Board also considered the analysis provided by the Consultant relating to the Fund’s performance track record.
In light of all the considerations noted above, the Board concluded that it had continued confidence in HFMC’s and the Sub-adviser’s overall capabilities to manage the Fund.
Costs of the Services and Profitability of the Advisers
The Board reviewed information regarding HFMC’s cost to provide investment management and related services to the Fund and HFMC’s profitability, both overall and for the Fund, on a pre-tax basis without regard to distribution expenses. The Board also requested and reviewed information about the profitability to HFMC and its affiliates from all services provided to the Fund and all aspects of their relationship with the Fund. The Board also requested and received information relating to the operations and profitability of the Sub-adviser.
The Board considered the Consultant’s review of the profitability calculations used by HFMC in connection with the continuation of the investment management agreement, noting the Consultant’s view that Hartford Funds’ process for calculating and reporting Fund profitability is reasonable. In this regard, the Board noted that the Consultant performed a full review of this process in light of the recent restructuring of the Hartford Funds business and reported that the approach to analyzing Fund profitability, including the use of common expense allocation methodologies, is reasonable, sound and well within common industry practice.
Based on these considerations, the Board concluded that the profits anticipated to be realized by the Advisers and their affiliates from their relationships with the Fund would not be excessive.
| 35 |
| The Hartford Quality Bond Fund |
| Approval of Investment Management and Investment Sub-Advisory Agreements (Unaudited) – (continued) |
Comparison of Fees and Services Provided by the Advisers
The Board considered comparative information with respect to the management fees to be paid by the Fund to HFMC and the total expense ratios of the Fund. The Board also considered comparative information with respect to the sub-advisory fees to be paid by HFMC to the Sub-adviser. In this regard, the Board requested and reviewed information from HFMC and the Sub-adviser relating to the management and sub-advisory fees, including the sub-advisory fee schedule for the Fund, and total operating expenses for the Fund. With respect to the sub-advisory fee schedule, the Board considered representations from HFMC and the Sub-adviser that the Sub-adviser’s fees were negotiated at arm’s length on a fund-by-fund basis. The Board also reviewed information from Lipper comparing the Fund’s contractual management fees, actual management fees and overall expense ratios relative to a group of funds selected by Lipper, in consultation with the Consultant, and a broader universe of funds selected by Lipper. The Board considered that the Fund’s contractual management fee was in the 3rd quintile of its expense group, while its actual management fee was in the 1st quintile and its total expenses (less 12b-1 and shareholder service fees) were in the 2nd quintile. The Board noted that the Fund has an automatically renewable contractual expense cap on each share class. The expense cap resulted in reimbursement of certain expenses incurred in 2013.
While the Board recognized that comparisons between the Fund and peer funds may be imprecise, given the different service levels and characteristics of mutual funds and the different business models and cost structures of the Advisers, the comparative information provided by Lipper assisted the Board in evaluating the reasonableness of the Fund’s management and sub-advisory fees and total operating expenses. In addition, the Board considered the analysis and recommendations of the Consultant relating to the Fund’s management and sub-advisory fees and total operating expenses.
Based on these considerations, the Board concluded that the Fund’s fees and total operating expenses, in conjunction with the information about quality of services, profitability, economies of scale, and other matters discussed, were reasonable in light of the services provided.
Economies of Scale
The Board requested and considered information regarding the Advisers’ realization of economies of scale with respect to the Fund and whether the fee levels reflect these economies of scale for the benefit of the Fund’s shareholders. The Board reviewed the breakpoints in the management fee schedule for the Fund, which reduce fee rates as Fund assets grow over time. The Board recognized that a fund with assets beyond the highest breakpoint level will continue to benefit from economies of scale because additional assets are charged the lowest breakpoint fee resulting in lower overall effective management fee rates. The Board also considered that expense limitations and fee waivers that reduce the Fund’s expenses at all asset levels can have the same effect as breakpoints in sharing economies of scale with shareholders and provide protection from an increase in expenses if Fund assets decline. The Board recognized that a fee schedule that reaches a lower breakpoint quickly provides shareholders with the benefit of anticipated or potential economies of scale. The Board also considered that HFMC has been active in managing expenses, which has resulted in benefits being realized by shareholders as assets within the Hartford Funds family of funds have grown over time, including through lower transfer agent costs and other operating expenses.
The Board reviewed and evaluated materials from Lipper and the Consultant showing how management fee schedules of peer funds reflect economies of scale for the benefit of shareholders as a peer fund’s assets hypothetically increase over time. Based on information provided by HFMC, Lipper, and the Consultant, the Board recognized that there is no uniform methodology for establishing breakpoints or uniform pattern in asset levels that trigger breakpoints or the amounts of breakpoints triggered.
After considering all of the information available to it, the Board concluded that it was satisfied with the extent to which economies of scale would be shared for the benefit of the Fund’s shareholders based on currently available information and the effective advisory fees and expense ratios for the Fund at its current and reasonably anticipated asset levels. The Board noted, however, that it would continue to monitor future growth in Fund assets and the appropriateness of additional breakpoints.
Other Benefits
The Board considered other benefits to the Advisers and their affiliates from their relationships with the Fund.
The Board noted that HFMC receives fees for fund accounting and related services from the Fund, and the Board considered information on profits to HFMC for such services. The Board also considered that Hartford Administrative Services Company (“HASCO”), the Fund’s transfer agent and an affiliate of HFMC, receives transfer agency compensation from the Fund, and the Board reviewed information on the profitability of
| 36 |
| The Hartford Quality Bond Fund |
| Approval of Investment Management and Investment Sub-Advisory Agreements (Unaudited) – (continued) |
the Fund’s transfer agency function to HASCO. The Board considered information provided by HASCO indicating that the transfer agent fees charged by HASCO to the Fund were fair and reasonable based on publicly available information.
The Board also considered that Hartford Funds Distributors, LLC (“HFD”), an affiliate of HFMC, serves as principal underwriter of the Fund. As principal underwriter, HFD receives 12b-1 fees from the Fund and receives all or a portion of the sales charges on sales or redemptions of certain classes of shares. The Board also noted that certain affiliates of HFD distribute shares of the Fund and receive compensation in that connection.
The Board considered the benefits, if any, to the Sub-adviser from any use of the Fund’s brokerage commissions to obtain soft dollar research, and representations from HFMC and the Sub-adviser that the Sub-adviser would not make any revenue-sharing payments or any other type of distribution payments to HFMC or its affiliates.
The Board considered the benefits to shareholders of being part of the Hartford Funds family of funds, including the right to exchange investments between the same class of funds without a sales charge, the ability to reinvest Fund dividends into other funds in the family, and the ability to combine holdings in the Fund with holdings in other funds to obtain a reduced sales charge. The Board considered HFMC’s efforts to provide investors in the family with a broad range of investment styles and asset classes and its entrepreneurial risk in initiating new funds to expand these opportunities for shareholders.
* * * *
Based upon its review of these various factors, among others, the Board concluded that it is in the best interests of the Fund and its shareholders for the Board to approve the Agreements for an additional year. In reaching this decision, the Board did not assign relative weights to the factors discussed above or deem any one or group of them to be controlling in and of themselves. In connection with their deliberations, the Independent Directors met separately in executive session on several occasions, with independent legal counsel and the Consultant, to review the relevant materials and consider their responsibilities under relevant laws and regulations.
| 37 |
| The Hartford Quality Bond Fund |
| Main Risks (Unaudited) |
The main risks of investing in the Fund are described below.
Market, Selection and Strategy Risk: The Fund’s share price may fluctuate due to market risk and/or security selections that may underperform the market or relevant benchmarks. If the sub-adviser's investment strategy does not perform as expected, the Fund could underperform its peers or lose money. There is no guarantee the Fund will achieve its stated objective.
Fixed Income Risk: The Fund is subject to interest rate risk (the risk that the value of an investment decreases when interest rates rise), credit risk (the risk that the issuing company of a security is unable to pay interest and principal when due), liquidity risk (the risk that an investment may be difficult to sell at an advantageous time or price) and call risk (the risk that an investment may be redeemed early). These risks also apply to the Fund’s investments in U.S. government securities, which may not be guaranteed by the U.S. government.
Mortgage-Backed Securities Risk: Mortgage-backed securities are subject to interest rate risk, credit risk, prepayment risk, extension risk, and the risk that an investment’s value may be reduced or become worthless if it receives interest or income payments only after other investments in the same pool. The Fund may purchase mortgage-backed securities in the "to be announced" (TBA) market. This subjects the Fund to counterparty risk and the risk that the security the Fund buys will lose value prior to its delivery.
Derivatives Risk: Investments in derivatives can be volatile. Potential risks include currency risk, leverage risk (the risk that small market movements may result in large changes in the value of an investment), liquidity risk, index risk, pricing risk, and counterparty risk (the risk that the counterparty may be unwilling or unable to honor its obligations).
Reverse Repurchase Agreements and Dollar Rolls Risk: Reverse repurchase agreements and dollar rolls involve the risk that the market value of the securities that the Fund is committed to buy may decline below the repurchase price. These investments may also subject the Fund to the risk that the counterparty will not fulfill its obligations.
Active Trading Risk: Actively trading investments may result in higher costs and higher taxable income.
| 38 |
THIS PRIVACY POLICY IS NOT PART OF THIS REPORT
Privacy Policy and Practices of The Hartford Financial Services Group, Inc. and its Affiliates
(herein called “we, our and us”)
This Privacy Policy applies to our United States Operations
|
We value your trust. We are committed to the responsible: a) management; b) use; and c) protection; of Personal Information.
This notice describes how we collect, disclose, and protect Personal Information.
We collect Personal Information to: a) service your Transactions with us; and b) support our business functions.
We may obtain Personal Information from: a) You; b) your Transactions with us; and c) third parties such as a consumer-reporting agency.
Based on the type of product or service You apply for or get from us, Personal Information such as: a) your name; b) your address; c) your income; d) your payment; or e) your credit history; may be gathered from sources such as applications, Transactions, and consumer reports.
To serve You and service our business, we may share certain Personal Information. We will share Personal Information, only as allowed by law, with affiliates such as: a) our insurance companies; b) our employee agents; c) our brokerage firms; and d) our administrators.
As allowed by law, we may share Personal Financial Information with our affiliates to: a) market our products; or b) market our services; to You without providing You with an option to prevent these disclosures.
|
We may also share Personal Information, only as allowed by law, with unaffiliated third parties including: a) independent agents; b) brokerage firms; c) insurance companies; d) administrators; and e) service providers; who help us serve You and service our business.
When allowed by law, we may share certain Personal Financial Information with other unaffiliated third parties who assist us by performing services or functions such as: a) taking surveys; b) marketing our products or services; or c) offering financial products or services under a joint agreement between us and one or more financial institutions.
We, and third parties we partner with, may track some of the pages You visit through the use of: a) cookies; b) pixel tagging; or c) other technologies; and currently do not process or comply with any web browser’s “do not track” signal or similar mechanism that indicates a request to disable online tracking of individual users who visit our websites or use our services.
We will not sell or share your Personal Financial Information with anyone for purposes unrelated to our business functions without offering You the opportunity to: a) “opt-out;” or b) “opt-in;” as required by law.
We only disclose Personal Health Information with: a) your proper written authorization; or b) as otherwise allowed or required by law.
Our employees have access to Personal Information in the course of doing their jobs, such as: a) underwriting policies; b) paying claims; c) developing new products; or d) advising customers of our products and services.
|
|
We use manual and electronic security procedures to maintain: a) the confidentiality; and b) the integrity of; Personal Information that we have. We use these procedures to guard against unauthorized access.
Some techniques we use to protect Personal Information include: a) secured files; b) user authentication; c) encryption; d) firewall technology; and e) the use of detection software.
We are responsible for and must: a) identify information to be protected; b) provide an adequate level of protection for that data; c) grant access to protected data only to those people who must use it in the performance of their job-related duties.
Employees who violate our Privacy Policy will be subject to discipline, which may include ending their employment with us.
At the start of our business relationship, we will give You a copy of our current Privacy Policy.
We will also give You a copy of our current Privacy Policy once a year if You maintain a continuing business relationship with us.
We will continue to follow our Privacy Policy regarding Personal Information even when a business relationship no longer exists between us.
|
As used in this Privacy Notice:
Application means your request for our product or service.
Personal Financial Information means financial information such as: a) credit history; b) income; c) financial benefits; or d) policy or claim information.
Personal Health Information means health information such as: a) your medical records; or b) information about your illness, disability or injury.
Personal Information means information that identifies You personally and is not otherwise available to the public. It includes: a) Personal Financial Information; and b) Personal Health Information.
Transaction means your business dealings with us, such as: a) your Application; b) your request for us to pay a claim; and c) your request for us to take an action on your account.
You means an individual who has given us Personal Information in conjunction with: a) asking about; b) applying for; or c) obtaining; a financial product or service from us if the product or service is used mainly for personal, family, or household purposes.
|
This Privacy Policy is being provided on behalf of the following affiliates of The Hartford Financial Services Group, Inc.:
1stAGChoice, Inc.; Access CoverageCorp, Inc.; Access CoverageCorp Technologies, Inc.; American Maturity Life Insurance Company; Archway 60 R, LLC; Business Management Group, Inc.; Champlain Life Reinsurance Company; DMS R, LLC; Eloy R, LLC; Ersatz Corporation; First State Insurance Company; Hartford Accident and Indemnity Company; Hartford Administrative Services Company; Hartford Casualty General Agency, Inc.; Hartford Casualty Insurance Company; Hartford-Comprehensive Employee Benefit Service Company; Hartford Equity Sales Company, Inc.; Hartford Fire General Agency, Inc.; Hartford Fire Insurance Company; Hartford Funds Management Company, LLC; Hartford Funds Management Group, Inc.; Hartford HLS Series Fund II, Inc.; Hartford Insurance Company of Illinois; Hartford Insurance Company of the Midwest; Hartford Insurance Company of the Southeast; Hartford Integrated Technologies, Inc.; Hartford International Life Reassurance Corporation; Hartford Funds Distributors, LLC; Hartford Investment Management Company; Hartford Life and Accident Insurance Company; Hartford Life and Annuity Insurance Company; Hartford Life Insurance Company; Hartford Life Private Placement, LLC; Hartford Lloyd’s Corporation; Hartford Lloyd’s Insurance Company; Hartford Mezzanine Investors I, LLC; Hartford Residual Market, L.C.C.; Hartford Retirement Services, LLC; Hartford Securities Distribution Company, Inc.; Hartford Series Fund, Inc.; Hartford Specialty Insurance Services of Texas, LLC; Hartford Strategic Investments, LLC; Hartford Underwriters Insurance Company; Hartford Technology Services Company, L.L.C.; Hartford of Texas General Agency, Inc.; Hartford Underwriters General Agency, Inc.; HARTRE Company, L.C.C.; HL Investment Advisors, LLC; HLA LLC; Horizon Management Group, LLC; HRA Brokerage Services, Inc.; Lanidex Class B, LLC; M-CAP Insurance Agency, LLC; New England Insurance Company; New England Reinsurance Corporation; Nutmeg Insurance Agency, Inc.; Nutmeg Insurance Company; Pacific Insurance Company, Limited; Planco, LLC: Property and Casualty Insurance Company of Hartford; Revere R, LLC; RVR R, LLC; Sentinel Insurance Company, Ltd.; Sunstone R, LLC; Symphony R, LLC; The Evergreen Group Incorporated; The Hartford Alternative Strategies Fund; The Hartford Mutual Funds, Inc.; The Hartford Mutual Funds II, Inc.; Trumbull Flood Management, L.L.C.; Trumbull Insurance Company; Twin City Fire Insurance Company; White River Life Reinsurance Company.
HPP Revised January 2014
HARTFORDFUNDS
hartfordfunds.com
This information is written in connection with the promotion or marketing of the matter(s) addressed in this material.
This report is submitted for the general information of the shareholders of the Fund. It is not authorized for distribution unless preceded or accompanied by a current prospectus for the Fund.
The information cannot be used or relied upon for the purpose of avoiding IRS penalties. These materials are not intended to provide tax, accounting or legal advice. As with all matters of a tax or legal nature, you should consult your own tax or legal counsel for advice.
Investors should carefully consider the investment objectives, risks, charges, and expenses of Hartford Funds before investing. This and other information can be found in the prospectus and summary prospectus, which can be obtained by calling 888-843-7824 (retail) or 800-279-1541 (institutional). Investors should read them carefully before they invest.
Hartford Funds are underwritten and distributed by Hartford Funds Distributors, LLC.
MFAR-QB14 12/14 113996-3 Printed in U.S.A.
HARTFORDFUNDS
|
HARTFORD
REAL TOTAL RETURN FUND
2014 Annual Report |
A MESSAGE FROM THE PRESIDENT
Dear Fellow Shareholders:
Thank you for investing in Hartford Funds.
Market Review
U.S. equities (as represented by the S&P 500 Index) rose steadily for the fiscal year ended October 31, 2014, with a return of 17.27% for the period. With the exception of short-lived geopolitical scares early in 2014 and concerns about continuing global growth near the end of the period, stocks generally rose on solid fundamentals and encouraging macroeconomic data during the year.
September 2014 marked the six-year anniversary of the start of the financial crisis. Within weeks of that anniversary, both the S&P 500 Index and the Dow Jones Industrial Average set new all-time highs, closing at 2,018 and 17,391, respectively, on October 31. Although the fallout of the crisis continues to influence investor behavior, stocks have recovered and risen dramatically, up 198% from their low in March 2009. Meanwhile, the domestic economy is notching strong growth, and the unemployment rate has reached its lowest level since August 2008.
While the U.S. economy appears to have stabilized and to have reverted to a solid growth path, the outlook for the global economy appears to have gotten cloudier. The U.S. Federal Reserve has ended quantitative easing, while Europe and Japan are pursuing stimulus options to avoid a double-dip recession and deflation, respectively. Diverging central-bank policies will likely continue to play an important role in market movements going forward as investors wait to see the reactions to their efforts and their impacts on global markets.
How have market movements impacted your portfolio throughout the last year? Are your investments still on track to provide the growth or income you need, and are you comfortable with their progress during times of volatility?
Your financial professional can help you navigate today’s markets with confidence, as well as assist you to achieve your investment goals by providing advice on the best options within our fund family to help you work toward overcoming today’s investing challenges. Meet with your financial advisor regularly to examine your portfolio and your investment strategy, and to determine if you’re still on track to meet your goals.
Thank you again for investing with Hartford Funds.
James Davey
President
Hartford Funds
1 The S&P 500 Index is a market capitalization-weighted price index composed of 500 widely held common stocks.
2 The Dow Jones Industrial Average is an unmanaged, price-weighted index of 30 of the largest, most widely held stocks traded on the NYSE
Hartford Real Total Return Fund
Table of Contents
The views expressed in the Fund’s Manager Discussion under “Why did the Fund perform this way?” and “What is the outlook?” are views of the Fund’s sub-adviser and portfolio management team through the end of the period and are subject to change based on market and other conditions. The Fund’s Manager Discussion is for informational purposes only and does not represent an offer, recommendation or solicitation to buy, hold or sell any security. The specific securities identified and described, if any, do not represent all of the securities purchased or sold and you should not assume that investments in the securities identified and discussed will be profitable.
| Hartford Real Total Return Fund inception 11/29/2013 |
| (sub-advised by Wellington Management Company, LLP) |
| Investment objective – The Fund seeks long-term real total return. |
Performance Overview 11/29/13 - 10/31/14

The chart above represents the hypothetical growth of a $10,000 investment in Class A, which includes a sales charge. Growth results in classes other than Class A will vary from what is seen above due to differences in the expenses charged to those share classes.
| Cumulative Returns (as of 10/31/14) |
| Since Inception▲ | ||||
| Real Total Return A# | 1.10 | % | ||
| Real Total Return A## | -4.46 | % | ||
| Real Total Return C# | 0.40 | % | ||
| Real Total Return C## | -0.60 | % | ||
| Real Total Return I# | 1.50 | % | ||
| Real Total Return R3# | 0.80 | % | ||
| Real Total Return R4# | 1.00 | % | ||
| Real Total Return R5# | 1.30 | % | ||
| Real Total Return Y# | 1.40 | % | ||
| Bank of America Merrill Lynch 3-Month U.S. Treasury Bill Index | 0.04 | % | ||
| Consumer Price Index + 5% | 6.03 | % | ||
| ▲ | Inception: 11/29/2013. Cumulative returns not annualized. |
| # | Without sales charge |
| ## | With sales charge |
PERFORMANCE DATA QUOTED REPRESENTS PAST PERFORMANCE AND DOES NOT GUARANTEE FUTURE RESULTS. The investment return and principal value of the investment will fluctuate so that investors’ shares, when redeemed, may be worth more or less than their original cost. Current performance may be lower or higher than the performance data quoted. To obtain performance data current to the most recent month-end, please visit our website www.hartfordfunds.com.
The initial investment in Class A shares reflects the maximum sales charge of 5.50% and returns for Class C shares reflect a contingent deferred sales charge of up to 1.00% on shares redeemed within twelve months of purchase.
Total returns presented above were calculated using the Fund’s net asset value available to shareholders for sale or redemption of Fund shares on October 31, 2014, which may exclude investment transactions as of this date. All share class returns assume the reinvestment of all distributions at net asset value and the deduction of all fund expenses.
Bank of America Merrill Lynch 3-Month U.S. Treasury Bill Index is an unmanaged index that tracks the performance of U.S. dollar denominated U.S. Treasury bills publicly issued in the U.S. domestic markets with maturities of 90 days or less that assumes reinvestment of all income.
Consumer Price Index (CPI) + 5% is a custom benchmark created by adding 5% to the annual percentage change in the CPI. The CPI is an unmanaged index representing the rate of inflation of U.S. consumer prices as determined by the U.S. Bureau of Labor Statistics.
You cannot invest directly in an index.
The chart and table do not reflect the deductions of taxes that a shareholder would pay on Fund distributions or the redemption of Fund shares.
Performance information may reflect historical or current expense waivers/reimbursements from the investment adviser, without which performance would have been lower. For information on current expense waivers/reimbursements, please see the prospectus.
| 2 |
| Hartford Real Total Return Fund |
| Manager Discussion |
| October 31, 2014 (Unaudited) |
Operating Expenses*
| Net | Gross | |||||||
| Real Total Return Class A | 1.70 | % | 1.70 | % | ||||
| Real Total Return Class C | 2.45 | % | 2.45 | % | ||||
| Real Total Return Class I | 1.45 | % | 1.45 | % | ||||
| Real Total Return Class R3 | 2.00 | % | 2.00 | % | ||||
| Real Total Return Class R4 | 1.70 | % | 1.70 | % | ||||
| Real Total Return Class R5 | 1.40 | % | 1.40 | % | ||||
| Real Total Return Class Y | 1.30 | % | 1.30 | % | ||||
* As shown in the Fund's most recent prosepectus. Actual expenses may be higher or lower. Please see accompanying Financial Highlights for expense ratios for the year ended October 31, 2014.
Gross expenses are the Fund's total annual operating expenses shown in the Fund's most recent prospectus. Net expenses are the Fund's total annual operating expenses shown in the Fund's most recent prospectus and reflect contractual expense reimbursements in instances when these reductions reduce the Fund's gross expenses. Contractual reimbursements remain in effect until February 28, 2015, and automatically renew for one-year terms unless terminated.
All investments are subject to risk including the possible loss of principal. For a discussion of the Fund’s risks, please see the Main Risks section of this report. For more detailed information on the risks associated with an investment in the Fund, please see the prospectus.
| Portfolio Managers | ||
| Rick A. Wurster, CFA, CMT | Stephen A. Gorman, CFA | |
| Vice President and Asset Allocation Portfolio Manager |
Vice President, Director, Tactical Asset Allocation, Asset Allocation Strategies Group and Portfolio Manager |
|
How did the Fund perform?
The Class A shares of the Hartford Real Total Return Fund returned 1.10%, before sales charge, for the period November 29, 2013 (commencement of operations) to October 31, 2014, outperforming the Fund’s benchmark, the Bank of America Merrill Lynch 3-Month U.S. Treasury Bill Index, which returned 0.04% for the same period. The Fund underperformed the 2.20% average return of the Lipper Absolute Return Funds peer group, a group of funds with investment strategies similar to those of the Fund.
Why did the Fund perform this way?
Global equities rose during the period, notwithstanding bouts of significant volatility. Despite ongoing geopolitical tensions in Ukraine and the Middle East, concerns about a Chinese economic growth slowdown, and unsettling economic and political developments in several other emerging market countries, the five-year-old bull market continued in the first half of 2014. Robust merger and acquisition activity, along with continued accommodative monetary policy from central banks around the globe, aided positive investor sentiment in May and June. However, Portuguese banking woes, European economic malaise, and the prospect of an accelerated U.S. Federal Reserve (Fed) interest-rate-hike timeline all contributed to stall the global stock rally near the tail end of the period. In addition, China's property slump and poor gross domestic product (GDP) readings in Japan and the eurozone raised the specter of a slowdown in global economic growth. Nevertheless, there were several positive developments, including monetary easing by the European Central Bank (ECB) and the People's Bank of China, as well as an encouraging US corporate earnings season. During the period, emerging market equities underperformed their developed market counterparts and U.S. stocks generally outperformed non-U.S. stocks. Natural resource equities also struggled during the period driven primarily by weak performance from metals and mining related companies.
Fixed income markets gained throughout much of the period as expectations of prolonged easy monetary policy by major central banks and a supportive macroeconomic environment kept rates low and suppressed volatility. Early in the period emerging markets dominated headlines as economic and political developments sparked risk aversion across global markets, pushing bond prices higher and yields lower amid a flight to quality. Treasury Inflation Protected Securities (TIPS) returns were positive for the twelve months ended October 31, 2014, though TIPS returned less than nominal Treasuries of similar durations. The TIPS curve flattened during the period; consequently, longer dated maturities outperformed shorter maturities.
The period was also highlighted by a divergence in central bank policies. The ECB cut its benchmark lending and deposit rates and announced a host of stimulus measures in an effort to encourage lending and fend off fears of deflation. China’s central bank joined the ECB in boosting liquidity by injecting funds into the nation’s largest banks in an attempt to combat weakening growth. The Bank of Japan pre-emptively announced incremental monetary easing to counter the risk of missing the country’s inflation and growth targets. In contrast, the Bank of England and the Fed leaned toward tighter policies. The Fed ended its quantitative easing program as U.S. data largely suggested the economy was on a sustainable growth path. Second quarter GDP rebounded after the first quarter’s steep contraction. The labor market strengthened as the unemployment rate dropped to a six-year low. Housing regained some lost ground after a weak start to the year, though the pace of home price appreciation started to slow after a strong 2013. Inflation pressures were muted overall, alleviating pressure on the Fed to raise rates.
Commodities returned -5.94% during the period, as represented by the Bloomberg Commodity Index Total Return. Industrial metals were the only one of the four commodity sectors to post positive returns. Agriculture and livestock, precious metals commodities,
| 3 |
| Hartford Real Total Return Fund |
| Manager Discussion – (continued) |
| October 31, 2014 (Unaudited) |
particularly silver and gold, and energy commodities, particularly heating and crude oil, posted negative returns during the period.
The Fund’s investment objective is to seek long-term real total return. The Fund seeks to achieve its objective by actively allocating the Fund’s assets to multiple global asset classes that we believe provide attractive valuations and technical characteristics.
Positions within the Fund’s market exposure allocation were the primary driver of relative underperformance during the period while the Fund’s active manager allocations were additive. Within the market exposures, global government bonds and tactical positions detracted the most, particularly exposure to Greek sovereign bonds, opportunistic short exposure to U.S. equities implemented via futures, and positioning within emerging market equities also implemented via futures. A position in a broad commodities ETF also detracted. Exposure to inflation-linked bonds in both the U.S. and Mexico contributed as did currency positions, which are implemented through currency forwards. Among currencies, short exposure to the Japanese yen and Euro relative to the U.S. Dollar contributed the most.
Overall, the active manager allocations across all asset classes contributed to returns during the period. The fixed income and currency strategies benefitted from short exposure to the Euro, Japanese yen, and Swiss Franc. These strategies are implemented using futures and currency forwards. Participation in the new issue market was a primary driver of positive returns in the multi-asset strategies. Within our equity strategies, our allocation to Japanese equities contributed, driven primarily by strong security selection, while domestic equity strategies modestly detracted as a result of weak security selection.
As described above, derivatives are integral to the management of the Fund and had an impact on performance within both the market exposures and active manager allocations.
What is the outlook?
Towards the end of the period, many world markets fell amid concerns over the strength of the global economic recovery. Technical conditions weakened globally, though long-term trends remain intact in many markets including the United States. As of the end of the period, we continued to hold exposure consistent with our macro view and pro cyclical positioning through long equity positions primarily in Europe and Asia. The Fund ended the period with long exposure to the Indian rupee and South Korean won, which was offset by short exposure to the Japanese yen and the Euro relative to the U.S. Dollar.
We also continued to hold exposure to U.S. TIPS and emerging market inflation-linked bonds. In the U.S., inflation expectations declined during the period offering what we believe was a good opportunity to add to the exposure. We continue to believe that expectations are low with our models estimating inflation around 2.5% for the upcoming year, above current rates priced into the market. We increased duration to 4.5 years towards the end of the period, largely driven by inflation-linked bonds. Tactically, we believe TIPS are attractive with reasonable value.
| 4 |
| Hartford Real Total Return Fund |
| Manager Discussion – (continued) |
| October 31, 2014 (Unaudited) |
| Diversification by Country | ||||
| as of October 31, 2014 | ||||
| Percentage of | ||||
| Country | Net Assets | |||
| Australia | 0.1 | % | ||
| Bermuda | 0.3 | |||
| Brazil | 1.3 | |||
| Canada | 1.0 | |||
| Cayman Islands | 0.1 | |||
| China | 0.9 | |||
| France | 2.8 | |||
| Germany | 0.5 | |||
| Greece | 10.0 | |||
| Hong Kong | 0.4 | |||
| Jamaica | 0.4 | |||
| Japan | 20.7 | |||
| Luxembourg | 0.9 | |||
| Mexico | 7.8 | |||
| Netherlands | 0.1 | |||
| Norway | 0.4 | |||
| South Korea | 0.4 | |||
| Taiwan | 0.2 | |||
| Thailand | 0.1 | |||
| United Kingdom | 0.1 | |||
| United States | 40.3 | |||
| Short-Term Investments | 5.3 | |||
| Purchased Options | 0.1 | |||
| Other Assets and Liabilities | 5.8 | |||
| Total | 100.0 | % | ||
| Credit Exposure | ||||
| as of October 31, 2014 | ||||
| Credit Rating * | Percentage of Net Assets | |||
| Aa/ AA | 6.8 | % | ||
| A | 7.8 | |||
| Baa/ BBB | 0.9 | |||
| Ba/ BB | 0.8 | |||
| B | 9.1 | |||
| Caa/ CCC or Lower | 1.3 | |||
| Not Rated | 1.2 | |||
| Non-Debt Securities and Other Short-Term Instruments | 66.3 | |||
| Other Assets and Liabilities | 5.8 | |||
| Total | 100.0 | % | ||
| * | Credit exposure is the long-term credit ratings for the Fund's holdings, as of the date noted, as provided by Standard and Poor's (S&P) or Moody's Investors Service (Moody's) and typically range from AAA/Aaa (highest) to C/D (lowest). Presentation of S&P and Moody's credit ratings in this report have been selected for informational purposes for shareholders, as well as the Fund's consideration of industry practice. If Moody's and S&P assign different ratings, the lower rating is used. Fixed income securities that are not rated by either agency are listed as "Not Rated." Ratings do not apply to the Fund itself or to the Fund's shares. Ratings may change. |
Diversification by Security Type
as of October 31, 2014
| Category | Percentage of Net Assets | |||
| Equity Securities | ||||
| Common Stocks | 51.4 | % | ||
| Exchange Traded Funds | 9.1 | |||
| Warrants | 0.5 | |||
| Total | 61.0 | % | ||
| Fixed Income Securities | ||||
| Corporate Bonds | 6.5 | % | ||
| Foreign Government Obligations | 14.5 | |||
| U.S. Government Securities | 6.8 | |||
| Total | 27.8 | % | ||
| Short-Term Investments | 5.3 | |||
| Purchased Options | 0.1 | |||
| Other Assets and Liabilities | 5.8 | |||
| Total | 100.0 | % | ||
| 5 |
| Hartford Real Total Return Fund |
| Schedule of Investments – (continued) |
| October 31, 2014 |
| (000’s Omitted) |
| Shares or Principal Amount ╬ | Market Value ╪ | |||||||
| Common Stocks - 51.4% | ||||||||
| Automobiles and Components - 2.4% | ||||||||
| 1 | Aisin Seiki Co., Ltd. | $ | 30 | |||||
| 1 | Daihatsu Motor Co., Ltd. | 18 | ||||||
| 8 | Fiat Chrysler Automobiles N.V. ● | 91 | ||||||
| 1 | Fuji Heavy Industries Ltd. | 48 | ||||||
| 14 | Hi-Lex Corp. | 360 | ||||||
| 4 | Isuzu Motors Ltd. | 47 | ||||||
| 22 | Nissin Kogyo Co., Ltd. | 337 | ||||||
| 18 | Tachi-S Co., Ltd. | 229 | ||||||
| — | Tesla Motors, Inc. ● | 118 | ||||||
| 19 | Tokai Rika Co., Ltd. | 356 | ||||||
| 14 | Toyota Industries Corp. | 670 | ||||||
| 16 | TS Technology Co., Ltd. | 387 | ||||||
| 2,691 | ||||||||
| Banks - 5.6% | ||||||||
| 750 | Alpha Bank A.E. ● | 489 | ||||||
| 25 | BNP Paribas | 1,547 | ||||||
| 675 | Eurobank Ergasias S.A. ● | 234 | ||||||
| 123 | Mitsubishi UFJ Financial Group, Inc. | 715 | ||||||
| — | Ocwen Financial Corp. ● | 4 | ||||||
| 341 | Piraeus Bank S.A. ● | 496 | ||||||
| 84 | San-In Godo Bank Ltd. | 646 | ||||||
| 40 | Shizuoka Bank Ltd. | 417 | ||||||
| 31 | Societe Generale Class A | 1,482 | ||||||
| 2 | Sumitomo Mitsui Financial Group, Inc. | 69 | ||||||
| 6,099 | ||||||||
| Capital Goods - 4.1% | ||||||||
| 2 | Amada Co., Ltd. | 20 | ||||||
| 137 | Capstone Turbine Corp. ● | 137 | ||||||
| 1 | Curtis-Wright Corp. | 92 | ||||||
| 3 | Doosan Corp. | 329 | ||||||
| 4 | Ellaktor S.A. ● | 11 | ||||||
| 3 | Enphase Energy, Inc. ● | 41 | ||||||
| 1 | Esterline Technologies Corp. ● | 63 | ||||||
| 18 | Fuji Machine Manufacturing Co. | 169 | ||||||
| 4 | HD Supply Holdings, Inc. ● | 124 | ||||||
| 1 | Illinois Tool Works, Inc. | 84 | ||||||
| 14 | Inaba Denki Sangyo Co. | 504 | ||||||
| 3 | Itochu Corp. | 42 | ||||||
| 1 | Jgc Corp. | 23 | ||||||
| 36 | Kinden Corp. | 372 | ||||||
| 25 | Kuroda Electric Co., Ltd. | 356 | ||||||
| 1 | Moog, Inc. Class A ● | 78 | ||||||
| 1 | Northrop Grumman Corp. | 100 | ||||||
| 8 | Obara Group, Inc. | 275 | ||||||
| 8 | Owens Corning, Inc. | 247 | ||||||
| 3 | Polypore International, Inc. ● | 128 | ||||||
| 1 | Raytheon Co. | 105 | ||||||
| 16 | Taikisha Ltd. | 346 | ||||||
| 9 | Toshiba Machine Co., Ltd. | 35 | ||||||
| 2 | Trex Co., Inc. ● | 66 | ||||||
| 19 | Ushio, Inc. | 200 | ||||||
| 69 | Yamazen Corp. | 535 | ||||||
| 4,482 | ||||||||
| Commercial and Professional Services - 1.2% | ||||||||
| 10 | AEON Delight Co., Ltd. | 253 | ||||||
| 2 | Clean Harbors, Inc. ● | 97 | ||||||
| 14 | Enernoc, Inc. ● | 207 | ||||||
| 34 | Heidrick & Struggles International, Inc. Θ | 702 | ||||||
| 2 | Robert Half International, Inc. | 95 | ||||||
| 1,354 | ||||||||
| Consumer Durables and Apparel - 2.6% | ||||||||
| 1 | G-III Apparel Group Ltd. ● | 101 | ||||||
| 1 | GoPro, Inc. ● | 75 | ||||||
| 1 | Helen of Troy Ltd. ● | 60 | ||||||
| 7 | Kate Spade & Co. ● | 177 | ||||||
| 1 | NIKE, Inc. Class B | 129 | ||||||
| 129 | PanaHome Corp. | 866 | ||||||
| 11 | Sankyo Co., Ltd. | 383 | ||||||
| 44 | Sekisui House Ltd. | 551 | ||||||
| 1 | Under Armour, Inc. Class A ● | 78 | ||||||
| 2 | V.F. Corp. | 152 | ||||||
| 19 | Yondoshi Holdings, Inc. | 333 | ||||||
| 2,905 | ||||||||
| Consumer Services - 0.8% | ||||||||
| 4 | Boyd Gaming Corp. ● | 51 | ||||||
| 2 | DeVry Education Group, Inc. | 84 | ||||||
| 1 | Domino's Pizza, Inc. | 93 | ||||||
| 1 | H.I.S. Co., Ltd. | 30 | ||||||
| 1 | Hyatt Hotels Corp. ● | 68 | ||||||
| 2 | Jack in the Box, Inc. | 113 | ||||||
| 1 | Marriott Vacations Worldwide Corp. | 90 | ||||||
| 3 | Opap S.A. | 33 | ||||||
| 1 | Outerwall, Inc. ● | 86 | ||||||
| 4 | Sonic Corp. ● | 103 | ||||||
| 1 | Wyndham Worldwide Corp. | 75 | ||||||
| 826 | ||||||||
| Diversified Financials - 1.8% | ||||||||
| 85 | Aizawa Securities Co., Ltd. | 430 | ||||||
| 1 | CBOE Holdings, Inc. | 72 | ||||||
| 2 | Discover Financial Services | 104 | ||||||
| 4 | E*Trade Financial Corp. ● | 86 | ||||||
| 75 | Hellenic Exchanges - Athens Stock Exchange S.A. | 502 | ||||||
| 4 | Interactive Brokers Group | 110 | ||||||
| — | Intercontinental Exchange, Inc. | 58 | ||||||
| 21 | Kyokuto Securities Co., Ltd. | 351 | ||||||
| 1 | MarketAxess Holdings, Inc. | 69 | ||||||
| 34 | Uranium Participation Corp. ● | 154 | ||||||
| 1,936 | ||||||||
| Energy - 6.8% | ||||||||
| 5 | Anadarko Petroleum Corp. | 441 | ||||||
| 4 | Athlon Energy, Inc. ● | 216 | ||||||
| 18 | Cobalt International Energy, Inc. ● | 206 | ||||||
| 23 | EnCana Corp. ADR | 425 | ||||||
| 3 | Energen Corp. | 176 | ||||||
| 1 | GS Holdings Corp. | 21 | ||||||
| 1 | Hornbeck Offshore Services, Inc. ● | 34 | ||||||
| 52 | Japan Petroleum Exploration Co., Ltd. | 1,707 | ||||||
| 5 | JX Holdings, Inc. | 20 | ||||||
| 13 | K&O Energy Group, Inc. | 159 | ||||||
| 23 | Karoon Gas Australia Ltd. ● | 61 | ||||||
| 40 | Knightsbridge Shipping Ltd. | 350 | ||||||
| 1 | Marathon Petroleum Corp. ‡ | 97 | ||||||
| 20 | McDermott International, Inc. ● | 76 | ||||||
| 62 | Motor Oil Hellas Corinth Refineries S.A. | 454 | ||||||
| 8 | Noble Energy, Inc. | 432 | ||||||
| 2 | Pioneer Natural Resources Co. | 356 | ||||||
| 9 | Range Resources Corp. | 599 | ||||||
| 13 | Southwestern Energy Co. ● | 413 | ||||||
| 19 | Statoilhydro ASA ADR | 431 | ||||||
| 5 | Tesoro Corp. | 329 | ||||||
| 21 | Trican Well Service Ltd. | 184 | ||||||
The accompanying notes are an integral part of these financial statements.
| 6 |
| Hartford Real Total Return Fund |
| Schedule of Investments – (continued) |
| October 31, 2014 |
| (000’s Omitted) |
| Shares or Principal Amount ╬ | Market Value ╪ | |||||||
| Common Stocks - 51.4% - (continued) | ||||||||
| Energy - 6.8% - (continued) | ||||||||
| 31 | Tsakos Energy Navigation Ltd. | $ | 210 | |||||
| 1 | Western Refining, Inc. | 60 | ||||||
| 7,457 | ||||||||
| Food and Staples Retailing - 0.3% | ||||||||
| 2 | CVS Health Corp. | 134 | ||||||
| 8 | Kato Sangyo Co., Ltd. | 166 | ||||||
| 1 | Tsuruha Holdings, Inc. | 50 | ||||||
| 350 | ||||||||
| Food, Beverage and Tobacco - 1.1% | ||||||||
| 6 | Altria Group, Inc. | 271 | ||||||
| 2 | Archer-Daniels-Midland Co. | 99 | ||||||
| 1 | Asahi Group Holdings Ltd. | 38 | ||||||
| 1 | Cal-Maine Foods, Inc. | 75 | ||||||
| 2 | Japan Tobacco, Inc. | 57 | ||||||
| 1 | Keurig Green Mountain, Inc. | 150 | ||||||
| 2 | Kirin Brewery Co., Ltd. | 31 | ||||||
| 1 | Mead Johnson Nutrition Co. | 143 | ||||||
| 1 | Monster Beverage Corp. ● | 138 | ||||||
| 3 | Post Holdings, Inc. ● | 118 | ||||||
| 3 | WhiteWave Foods Co. Class A ● | 120 | ||||||
| 1,240 | ||||||||
| Health Care Equipment and Services - 1.5% | ||||||||
| 2 | Cantel Medical Corp. | 95 | ||||||
| 196 | CareView Communications, Inc. ●† | 60 | ||||||
| 2 | Community Health Systems, Inc. ● | 112 | ||||||
| 2 | LifePoint Hospitals, Inc. ● | 146 | ||||||
| 24 | Medipal Holdings Corp. | 269 | ||||||
| 2 | Medtronic, Inc. | 121 | ||||||
| 2 | Natus Medical, Inc. ● | 84 | ||||||
| 12 | Paramount Bed Holdings Co., Ltd. | 347 | ||||||
| 1 | Sirona Dental Systems, Inc. ● | 103 | ||||||
| 2 | Tenet Healthcare Corp. ● | 113 | ||||||
| 1 | Wellpoint, Inc. | 141 | ||||||
| 2 | Zeltiq Aesthetics, Inc. ● | 53 | ||||||
| 1,644 | ||||||||
| Insurance - 0.5% | ||||||||
| 30 | Sony Financial Holdings, Inc. | 481 | ||||||
| 2 | Tokio Marine Holdings, Inc. | 71 | ||||||
| 552 | ||||||||
| Materials - 3.0% | ||||||||
| 885 | AMVIG Holdings Ltd. | 414 | ||||||
| 2 | Berry Plastics Group, Inc. ● | 47 | ||||||
| 46 | China National Building Material Co., Ltd. | 43 | ||||||
| 9 | Graphic Packaging Holding Co. ● | 110 | ||||||
| 9 | Headwaters, Inc. ● | 120 | ||||||
| 1 | Lotte Chemical Corp. | 120 | ||||||
| 3 | Louisiana-Pacific Corp. ● | 50 | ||||||
| 12 | Maruichi Steel Tube Ltd. | 293 | ||||||
| 2 | Methanex Corp. ADR | 146 | ||||||
| 31 | Mitsui Chemicals, Inc. | 90 | ||||||
| 20 | Neturen Co., Ltd. | 144 | ||||||
| 10 | Norbord, Inc. | 189 | ||||||
| 67 | PTT Chemical Public Co., Ltd. | 127 | ||||||
| 31 | Tenma Corp. | 431 | ||||||
| 15 | Tokyo Ohka Kogyo Co., Ltd. | 413 | ||||||
| 2 | Wacker Chemie AG | 203 | ||||||
| 9 | Yamato Kogyo Co. | 305 | ||||||
| 3,245 | ||||||||
| Media - 1.2% | ||||||||
| 27 | Nippon Television Network Corp. | 408 | ||||||
| 5 | Pandora Media, Inc. ● | 91 | ||||||
| 1 | Time Warner, Inc. | 82 | ||||||
| 1 | Tribune Media Co. Class A ● | 45 | ||||||
| 32 | TV Asahi Holdings Corp. | 511 | ||||||
| 2 | Walt Disney Co. | 164 | ||||||
| 1,301 | ||||||||
| Pharmaceuticals, Biotechnology and Life Sciences - 2.8% | ||||||||
| 1 | Actavis plc ● | 177 | ||||||
| 3 | Akorn, Inc. ● | 130 | ||||||
| 1 | Alexion Pharmaceuticals, Inc. ● | 97 | ||||||
| 1 | Alkermes plc ● | 41 | ||||||
| 1 | Allergan, Inc. | 99 | ||||||
| 28 | Arena Pharmaceuticals, Inc. ● | 124 | ||||||
| — | Biogen Idec, Inc. ● | 124 | ||||||
| 3 | Bristol-Myers Squibb Co. | 181 | ||||||
| 1 | Cubist Pharmaceuticals, Inc. ● | 82 | ||||||
| 2 | Eli Lilly & Co. | 164 | ||||||
| — | Illumina, Inc. ● | 60 | ||||||
| 1 | Incyte Corp. ● | 71 | ||||||
| 3 | Merck & Co., Inc. | 183 | ||||||
| 3 | Mylan, Inc. ● | 147 | ||||||
| 2 | Ono Pharmaceutical Co., Ltd. | 156 | ||||||
| 6 | Portola Pharmaceuticals, Inc. ● | 184 | ||||||
| — | Regeneron Pharmaceuticals, Inc. ● | 136 | ||||||
| 1 | Salix Pharmaceuticals Ltd. ● | 87 | ||||||
| 97 | TherapeuticsMD, Inc. ●╦ | 428 | ||||||
| 1 | Thermo Fisher Scientific, Inc. | 79 | ||||||
| 2 | Vertex Pharmaceuticals, Inc. ● | 196 | ||||||
| 3 | Zoetis, Inc. | 119 | ||||||
| 3,065 | ||||||||
| Real Estate - 1.9% | ||||||||
| 1 | American Tower Corp. REIT | 120 | ||||||
| 3 | CBRE Group, Inc. ● | 104 | ||||||
| 2 | Chesapeake Lodging Trust REIT | 59 | ||||||
| — | Daito Trust Construction Co., Ltd. | 52 | ||||||
| — | GLP J-REIT | 57 | ||||||
| 143 | Grivalia Properties REIC | 1,541 | ||||||
| 3 | Realogy Holdings Corp. ● | 103 | ||||||
| 2,036 | ||||||||
| Retailing - 2.5% | ||||||||
| 1 | Advance Automotive Parts, Inc. | 83 | ||||||
| — | Amazon.com, Inc. ● | 137 | ||||||
| 12 | Coupons.com, Inc. ● | 171 | ||||||
| 23 | Doshisha Co., Ltd. | 387 | ||||||
| 1 | Expedia, Inc. | 62 | ||||||
| 69 | Groupon, Inc. ● | 501 | ||||||
| 2 | HSN, Inc. | 117 | ||||||
| 6 | Joyful Honda Co., Ltd. | 232 | ||||||
| 2 | L Brands, Inc. | 118 | ||||||
| — | Netflix, Inc. ● | 60 | ||||||
| 13 | Office Depot, Inc. ● | 68 | ||||||
| 1 | O'Reilly Automotive, Inc. ● | 141 | ||||||
| 12 | Pal Co., Ltd. | 357 | ||||||
| 1 | Ross Stores, Inc. | 82 | ||||||
| — | Shimamura Co., Ltd. | 29 | ||||||
| 3 | Tuesday Morning Corp. ● | 60 | ||||||
| — | Vipshop Holdings Ltd. ● | 70 | ||||||
| 2 | XEBIO Co., Ltd. ☼ | 25 | ||||||
| 2,700 | ||||||||
The accompanying notes are an integral part of these financial statements.
| 7 |
| Hartford Real Total Return Fund |
| Schedule of Investments – (continued) |
| October 31, 2014 |
| (000’s Omitted) |
| Shares or Principal Amount ╬ | Market Value ╪ | |||||||
| Common Stocks - 51.4% - (continued) | ||||||||
| Semiconductors and Semiconductor Equipment - 1.5% | ||||||||
| 2 | Ambarella, Inc. ● | $ | 85 | |||||
| 729 | GCL-Poly Energy Holdings Ltd. ● | 246 | ||||||
| 11 | Micron Technology, Inc. ● | 354 | ||||||
| 9 | RF Micro Devices, Inc. ● | 121 | ||||||
| 39 | Sumco Corp. | 523 | ||||||
| 17 | SunEdison, Inc. ● | 333 | ||||||
| 1 | Tokyo Seimitsu Co., Ltd. | 22 | ||||||
| 1,684 | ||||||||
| Software and Services - 3.7% | ||||||||
| 4 | Activision Blizzard, Inc. | 90 | ||||||
| 1 | Akamai Technologies, Inc. ● | 64 | ||||||
| 2 | Alibaba Group Holding Ltd. ● | 178 | ||||||
| 10 | Angie's List, Inc. ● | 71 | ||||||
| 8 | AOL, Inc. ● | 358 | ||||||
| 1 | Automatic Data Processing, Inc. | 89 | ||||||
| 1 | Bitauto Holdings Ltd. ● | 59 | ||||||
| 54 | Corindus Vascular Robotics, Inc. ⌂●† | 196 | ||||||
| 4 | Ellie Mae, Inc. ● | 151 | ||||||
| 2 | Facebook, Inc. ● | 115 | ||||||
| 3 | Fortinet, Inc. ● | 73 | ||||||
| 1 | Global Payments, Inc. | 113 | ||||||
| — | Google, Inc. Class A ● | 148 | ||||||
| 2 | IAC/InterActiveCorp. | 164 | ||||||
| 2 | MAXIMUS, Inc. | 90 | ||||||
| 6 | Microsoft Corp. | 289 | ||||||
| 42 | Monster Worldwide, Inc. ● | 163 | ||||||
| 18 | NSD Co., Ltd. | 266 | ||||||
| 8 | OBIC Co., Ltd. | 277 | ||||||
| 23 | Optimal Payments plc ● | 164 | ||||||
| 2 | Paychex, Inc. | 102 | ||||||
| 5 | Rovi Corp. ● | 104 | ||||||
| 1 | Salesforce.com, Inc. ● | 77 | ||||||
| 1 | ServiceNow, Inc. ● | 91 | ||||||
| 4 | Tangoe, Inc. ● | 58 | ||||||
| 3 | UbiSoft Entertainment S.A. ● | 50 | ||||||
| 2 | Verint Systems, Inc. ● | 91 | ||||||
| 21 | WELLNET Corp. | 338 | ||||||
| 1 | WEX, Inc. ● | 70 | ||||||
| 4,099 | ||||||||
| Technology Hardware and Equipment - 3.0% | ||||||||
| 32 | Amano Corp. | 346 | ||||||
| 3 | Apple, Inc. | 361 | ||||||
| 1 | Canon, Inc. | 40 | ||||||
| 1 | F5 Networks, Inc. ● | 63 | ||||||
| 10 | Hitachi High-Technologies Co. | 298 | ||||||
| 21 | Hosiden Corp. | 114 | ||||||
| 32 | Japan Digital Laboratory Co., Ltd. | 569 | ||||||
| 13 | Melco Holdings, Inc. | 192 | ||||||
| 41 | Nichicon Corp. | 274 | ||||||
| 18 | Nippon Ceramic Co., Ltd. | 262 | ||||||
| 1 | Palo Alto Networks, Inc. ● | 81 | ||||||
| 114 | ParkerVision, Inc. ● | 149 | ||||||
| 1 | SanDisk Corp. | 73 | ||||||
| 1 | Seagate Technology plc | 53 | ||||||
| 19 | Star Micronics Co., Ltd. | 289 | ||||||
| 3 | Super Micro Computer, Inc. ● | 86 | ||||||
| — | Western Digital Corp. | 49 | ||||||
| 3,299 | ||||||||
| Telecommunication Services - 0.7% | ||||||||
| 2 | Crown Castle International Corp. | 120 | ||||||
| 18 | Gogo, Inc. ● | 301 | ||||||
| 1 | Nippon Telegraph & Telephone Corp. | 80 | ||||||
| 3 | SoftBank Corp. | 229 | ||||||
| 730 | ||||||||
| Transportation - 2.1% | ||||||||
| 2 | CSX Corp. | 82 | ||||||
| 252 | Daiichi Chuo Kisen Kaisha ● | 152 | ||||||
| 2 | Delta Air Lines, Inc. | 62 | ||||||
| 1 | FedEx Corp. | 132 | ||||||
| 1 | Hertz Global Holdings, Inc. ● | 24 | ||||||
| 1 | Japan Airlines Co., Ltd. | 34 | ||||||
| 7 | JetBlue Airways Corp. ● | 80 | ||||||
| 1 | Old Dominion Freight Line, Inc. ● | 100 | ||||||
| 789 | Pacific Basin Ship | 380 | ||||||
| 51 | Paragon Shipping, Inc. ● | 186 | ||||||
| 47 | Safe Bulkers, Inc. | 250 | ||||||
| 2 | Saia, Inc. ● | 100 | ||||||
| 58 | Scorpio Bulkers, Inc. ● | 282 | ||||||
| 285 | Sinotrans Shipping Ltd. ● | 78 | ||||||
| 1 | Spirit Airlines, Inc. ● | 65 | ||||||
| 8 | Star Bulk Carriers Corp. ● | 77 | ||||||
| 42 | Ultrapetrol Bahamas Ltd. ● | 126 | ||||||
| 8 | UTI Worldwide, Inc. ● | 92 | ||||||
| 2,302 | ||||||||
| Utilities - 0.3% | ||||||||
| 56 | Tokyo Gas Co., Ltd. | 323 | ||||||
| Total Common Stocks | ||||||||
| (Cost $57,901) | $ | 56,320 | ||||||
| Warrants - 0.5% | ||||||||
| Banks - 0.3% | ||||||||
| 197 | Alpha Bank A.E. | $ | 317 | |||||
| Materials - 0.2% | ||||||||
| 232 | Oriental Union Chemical Corp. ⌂ | 175 | ||||||
| Total Warrants | ||||||||
| (Cost $710) | $ | 492 | ||||||
| Exchange Traded Funds - 9.1% | ||||||||
| Other Investment Pools and Funds - 9.1% | ||||||||
| 8 | First Trust ISE-Revere Natural Gas Index Fund | $ | 112 | |||||
| 31 | iShares MSCI Japan ETF | 369 | ||||||
| 1 | iShares Nasdaq Biotechnology Index Fund | 370 | ||||||
| 210 | PowerShares DB Base Metals Fund ● | 3,613 | ||||||
| 162 | PowerShares DB Commodity Index Tracking Fund ● | 3,619 | ||||||
| 32 | SPDR S&P Oil & Gas Exploration & Production | 1,936 | ||||||
| Total Exchange Traded Funds | ||||||||
| (Cost $10,437) | $ | 10,019 | ||||||
The accompanying notes are an integral part of these financial statements.
| 8 |
| Hartford Real Total Return Fund |
| Schedule of Investments – (continued) |
| October 31, 2014 |
| (000’s Omitted) |
| Shares or Principal Amount ╬ | Market Value ╪ | |||||||
| Corporate Bonds - 6.5% | ||||||||
| Computer and Electronic Product Manufacturing - 1.2% | ||||||||
| SunEdison, Inc. | ||||||||
| $ | 352 | 0.25%, 01/15/2020 ■β | $ | 351 | ||||
| 328 | 2.00%, 10/01/2018 ■ | 487 | ||||||
| 328 | 2.75%, 01/01/2021 ■ | 494 | ||||||
| 1,332 | ||||||||
| Finance and Insurance - 0.4% | ||||||||
| Banco do Brasil S.A. | ||||||||
| 450 | 9.00%, 06/18/2024 ■♠ | 442 | ||||||
| Health Care and Social Assistance - 0.4% | ||||||||
| Fresenius Medical Care U.S. Finance II, Inc. | ||||||||
| 380 | 4.75%, 10/15/2024 ■ | 381 | ||||||
| Information - 1.3% | ||||||||
| Altice Financing S.A. | ||||||||
| 936 | 7.88%, 12/15/2019 ■ | 998 | ||||||
| Digicel Group Ltd. | ||||||||
| 470 | 7.13%, 04/01/2022 ■ | 472 | ||||||
| 1,470 | ||||||||
| Motor Vehicle and Parts Manufacturing - 1.5% | ||||||||
| Chrysler Group LLC | ||||||||
| 1,580 | 8.00%, 06/15/2019 | 1,693 | ||||||
| Petroleum and Coal Products Manufacturing - 0.9% | ||||||||
| Cobalt International Energy, Inc. | ||||||||
| 1,192 | 3.13%, 05/15/2024 β | 935 | ||||||
| Real Estate, Rental and Leasing - 0.8% | ||||||||
| Kennedy-Wilson, Inc. | ||||||||
| 855 | 8.75%, 04/01/2019 | 909 | ||||||
| Total Corporate Bonds | ||||||||
| (Cost $7,092) | $ | 7,162 | ||||||
| Foreign Government Obligations - 14.5% | ||||||||
| Brazil - 0.9% | ||||||||
| Brazil (Federative Republic of) | ||||||||
| BRL | 1,983 | 6.00%, 08/15/2022 ◄ | 812 | |||||
| BRL | 375 | 8.50%, 01/05/2024 | 145 | |||||
| $ | 957 | |||||||
| Greece - 5.8% | ||||||||
| Greece (Republic of) | ||||||||
| EUR | 7,865 | 2.00%, 02/24/2023 - 02/24/2029 § | 6,395 | |||||
| 6,395 | ||||||||
| Mexico - 7.8% | ||||||||
| Mexico (United Mexican States) | ||||||||
| MXN | 98,228 | 4.50%, 11/22/2035 ◄ | 8,578 | |||||
| Total Foreign Government Obligations | ||||||||
| (Cost $17,016) | $ | 15,930 | ||||||
| U.S. Government Securities - 6.8% | ||||||||
| U.S. Treasury Securities - 6.8% | ||||||||
| U.S. Treasury Bonds - 6.8% | ||||||||
| $ | 7,925 | 0.63%, 02/15/2043 □◄ | $ | 7,489 | ||||
| Total U.S. Government Securities | ||||||||
| (Cost $6,486) | $ | 7,489 | ||||||
| Total Long-Term Investments Excluding Purchased Options | ||||||||
| (Cost $99,642) | $ | 97,412 | ||||||
| Short-Term Investments - 5.3% | ||||||||
| Repurchase Agreements - 5.3% | ||||||||
| Bank of America Merrill Lynch TriParty Repurchase Agreement (maturing on 11/03/2014 in the amount of $17, collateralized by U.S. Treasury Note 1.50%, 2019, value of $17) | ||||||||
| $ | 17 | 0.08%, 10/31/2014 | $ | 17 | ||||
| Bank of America Merrill Lynch TriParty Repurchase Agreement (maturing on 11/03/2014 in the amount of $285, collateralized by GNMA 1.63% - 7.00%, 2031 - 2054, value of $291) | ||||||||
| 285 | 0.09%, 10/31/2014 | 285 | ||||||
| Bank of Montreal TriParty Repurchase Agreement (maturing on 11/03/2014 in the amount of $77, collateralized by U.S. Treasury Bond 2.88% - 5.25%, 2029 - 2043, U.S. Treasury Note 0.38% - 4.50%, 2015 - 2022, value of $78) | ||||||||
| 77 | 0.08%, 10/31/2014 | 77 | ||||||
| Bank of Montreal TriParty Repurchase Agreement (maturing on 11/03/2014 in the amount of $259, collateralized by FHLMC 2.00% - 5.50%, 2022 - 2034, FNMA 2.00% - 4.50%, 2024 - 2039, GNMA 3.00%, 2043, U.S. Treasury Note 4.63%, 2017, value of $265) | ||||||||
| 259 | 0.10%, 10/31/2014 | 259 | ||||||
| Barclays Capital TriParty Repurchase Agreement (maturing on 11/03/2014 in the amount of $978, collateralized by U.S. Treasury Bond 4.50% - 6.25%, 2023 - 2036, U.S. Treasury Note 1.63% - 2.13%, 2015 - 2019, value of $997) | ||||||||
| 978 | 0.08%, 10/31/2014 | 978 | ||||||
| Citigroup Global Markets, Inc. TriParty Repurchase Agreement (maturing on 11/03/2014 in the amount of $1,124, collateralized by U.S. Treasury Bill 0.02%, 2015, U.S. Treasury Bond 3.88% - 11.25%, 2015 - 2040, U.S. Treasury Note 2.00% - 3.38%, 2019 - 2021, value of $1,146) | ||||||||
| 1,124 | 0.09%, 10/31/2014 | 1,124 | ||||||
| Deutsche Bank Securities TriParty Repurchase Agreement (maturing on 11/03/2014 in the amount of $65, collateralized by U.S. Treasury Note 0.88%, 2017, value of $66) | ||||||||
| 65 | 0.13%, 10/31/2014 | 65 | ||||||
The accompanying notes are an integral part of these financial statements.
| 9 |
| Hartford Real Total Return Fund |
| Schedule of Investments – (continued) |
| October 31, 2014 |
| (000’s Omitted) |
| Shares or Principal Amount ╬ | Market Value ╪ | |||||||||||
| Short-Term Investments - 5.3% - (continued) | ||||||||||||
| Repurchase Agreements - 5.3% - (continued) | ||||||||||||
| RBS Securities, Inc. TriParty Repurchase Agreement (maturing on 11/03/2014 in the amount of $95, collateralized by U.S. Treasury Bond 3.63% - 5.00%, 2037 - 2043, U.S. Treasury Note 2.13%, 2020, value of $97) | ||||||||||||
| $ | 95 | 0.07%, 10/31/2014 | $ | 95 | ||||||||
| Societe Generale TriParty Repurchase Agreement (maturing on 11/03/2014 in the amount of $1,006, collateralized by U.S. Treasury Bill 0.02%, 2015, U.S. Treasury Bond 3.75% - 11.25%, 2015 - 2043, U.S. Treasury Note 1.38% - 4.25%, 2015 - 2022, value of $1,026) | ||||||||||||
| 1,006 | 0.08%, 10/31/2014 | 1,006 | ||||||||||
| TD Securities TriParty Repurchase Agreement (maturing on 11/03/2014 in the amount of $1,950, collateralized by FHLMC 3.00% - 4.00%, 2026 - 2044, FNMA 2.50% - 5.00%, 2025 - 2044, U.S. Treasury Bond 3.50% - 6.50%, 2026 - 2041, U.S. Treasury Note 1.75% - 2.88%, 2018 - 2019, value of $1,989) | ||||||||||||
| 1,950 | 0.10%, 10/31/2014 | 1,950 | ||||||||||
| 5,856 | ||||||||||||
| Total Short-Term Investments | ||||||||||||
| (Cost $5,856) | $ | 5,856 | ||||||||||
| Total Investments Excluding Purchased Options | ||||||||||||
| (Cost $105,498) | 94.1 | % | $ | 103,268 | ||||||||
| Total Purchased Options | ||||||||||||
| (Cost $337) | 0.1 | % | 162 | |||||||||
| Total Investments | ||||||||||||
| (Cost $105,835) ▲ | 94.2 | % | $ | 103,430 | ||||||||
| Other Assets and Liabilities | 5.8 | % | 6,284 | |||||||||
| Total Net Assets | 100.0 | % | $ | 109,714 | ||||||||
The accompanying notes are an integral part of these financial statements.
| 10 |
| Hartford Real Total Return Fund |
| Schedule of Investments – (continued) |
| October 31, 2014 |
| (000’s Omitted) |
| Note: | Percentage of investments as shown is the ratio of the total market value to total net assets. |
Prices of foreign equities that are principally traded on certain foreign markets may be adjusted daily pursuant to a fair value pricing service approved by the Board of Directors in order to reflect an adjustment for factors occurring after the close of certain foreign markets but before the close of the New York Stock Exchange.
The Fund may refer to any one or more of the industry classifications used by one or more widely recognized market indices, ratings group indices and/or as defined by Fund management. Industry classifications may not be identical across all security types.
Other than the industry classifications "Other Investment Pools and Funds" and "Exchange Traded Funds," equity industry classifications used in this report are the Global Industry Classification Standard, which was developed by and is the exclusive property and service mark of MSCI, Inc. and Standard & Poor’s.
For Fund compliance purposes, the Fund may not use the same classification system shown in this report as these classifications are used for reporting ease.
| ▲ | At October 31, 2014, the cost of securities for federal income tax purposes was $106,430 and the aggregate gross unrealized appreciation and depreciation based on that cost were: |
| Unrealized Appreciation | $ | 5,516 | ||
| Unrealized Depreciation | (8,516 | ) | ||
| Net Unrealized Depreciation | $ | (3,000 | ) |
| † | These securities are valued in good faith at fair value as determined under policies and procedures established by and under the supervision of the Board of Directors. At October 31, 2014, the aggregate fair value of these securities was $256, which represents 0.2% of total net assets. This amount excludes securities that are principally traded in certain foreign markets and whose prices are adjusted pursuant to a third party pricing service methodology approved by the Board of Directors. |
| ● | Non-income producing. |
| ◄ | The principal amount for this security is adjusted for inflation and the interest payments equal a fixed percentage of the inflation-adjusted principal amount. |
| ╬ | All principal amounts are in U.S. dollars unless otherwise indicated. |
| ■ | Securities issued within terms of a private placement memorandum, exempt from registration under Rule 144A under the Securities Act of 1933, as amended, and may be sold only to qualified institutional buyers. Unless otherwise indicated, these holdings are determined to be liquid. At October 31, 2014, the aggregate value of these securities was $3,625, which represents 3.3% of total net assets. |
| § | These securities were sold to the Fund under Regulation S, rules governing offers and sales made outside the United States without registration under the Securities Act of 1933, as amended. The Fund may only be able to resell these securities in the United States if an exemption from registration under the federal and state securities laws is available, or the Fund may only be able to sell these securities outside of the United States (such as on a foreign exchange) to a non-U.S. person. Unless otherwise indicated, these holdings are determined to be liquid. At October 31, 2014, the aggregate value of these securities was $6,395, which represents 5.8% of total net assets. |
| ⌂ | The following securities are considered illiquid. Illiquid securities are often purchased in private placement transactions, are often not registered under the Securities Act of 1933, as amended, and may have contractual restrictions on resale. A security may also be considered illiquid if the security lacks a readily available market or if its valuation has not changed for a certain period of time. |
| Period Acquired | Shares/ Par | Security | Cost Basis | |||||||
| 09/2014 | 54 | Corindus Vascular Robotics, Inc. | $ | 134 | ||||||
| 01/2014 - 03/2014 | 232 | Oriental Union Chemical Corp. Warrants | 237 | |||||||
At October 31, 2014, the aggregate value of these securities was $371, which represents 0.3% of total net assets.
| β | Convertible security. |
| ♠ | Perpetual maturity security. Maturity date shown is the next call date or final legal maturity date, whichever comes first. |
| ☼ | This security, or a portion of this security, was purchased on a when-issued or delayed-delivery basis. The cost of these securities was $24 at October 31, 2014. |
| ‡ | This security, or a portion of this security, has been segregated to cover funding requirements on investment transactions settling in the future. |
| ╦ | This security, or a portion of this security, has been pledged as collateral in connection with OTC swap contracts. |
| Θ | This security, or a portion of this security, has been pledged as collateral in connection with OTC option and/or swaption contracts. |
| □ | This security, or a portion of this security, has been pledged as collateral in connection with futures contracts. |
The accompanying notes are an integral part of these financial statements.
| 11 |
| Hartford Real Total Return Fund |
| Schedule of Investments – (continued) |
| October 31, 2014 |
| (000’s Omitted) |
Cash pledged and received as collateral in connection with derivatives at October 31, 2014:
| Pledged ‡ | Received | |||||||
| OTC option and/or OTC swap contracts | $ | 260 | $ | 53 | ||||
| Exchange traded options contracts | 4,058 | – | ||||||
| Centrally cleared swaps contracts | 139 | – | ||||||
| Total | $ | 4,457 | $ | 53 | ||||
| ‡ | As previously noted, certain securities, or a portion of these securities, are pledged as collateral in connection with certain derivative instruments. These securities are held by the Fund but are not represented in the table above. |
OTC Option Contracts Outstanding at October 31, 2014
| Description | Counter
- party | Risk Exposure Category | Exercise
Price/ FX Rate/ Rate | Expiration Date | Number of Contracts * | Market Value ╪ | Premiums Received/ Paid by Fund Δ | Unrealized Appreciation (Depreciation) | ||||||||||||||||
| Purchased Option contracts: | ||||||||||||||||||||||||
| Calls | ||||||||||||||||||||||||
| GBP Call/USD Put | BCLY | FX | 1.66 USD per GBP | 11/17/14 | GBP | 3,459,044 | $ | – | $ | 24 | $ | (24 | ) | |||||||||||
| JSR Corp. Option | GSC | EQ | 1,931.70 JPY | 11/25/14 | JPY | 13,386 | 9 | 3 | 6 | |||||||||||||||
| JSR Corp. Option | JPM | EQ | 2,083.40 JPY | 12/12/14 | JPY | 13,200 | 3 | 4 | (1 | ) | ||||||||||||||
| Mitsui O.S.K. Lines Ltd. Option | GSC | EQ | 419.90 JPY | 12/08/14 | JPY | 129,000 | – | 7 | (7 | ) | ||||||||||||||
| Mitsui O.S.K. Lines Ltd. Option | GSC | EQ | 435.24 JPY | 12/09/14 | JPY | 67,680 | – | 10 | (10 | ) | ||||||||||||||
| Mitsui O.S.K. Lines Ltd. Option | JPM | EQ | 390.50 JPY | 02/06/15 | JPY | 125,900 | 6 | 16 | (10 | ) | ||||||||||||||
| Nippon Yusen Kabushi Option | JPM | EQ | 335.50 JPY | 12/09/14 | JPY | 81,000 | – | 3 | (3 | ) | ||||||||||||||
| Total Calls | 3,889,210 | $ | 18 | $ | 67 | $ | (49 | ) | ||||||||||||||||
| Puts | ||||||||||||||||||||||||
| AS51 Index Option | JPM | EQ | 4,965.80 AUD | 01/08/15 | AUD | 172 | $ | 2 | $ | 11 | $ | (9 | ) | |||||||||||
| AS51 Index Option | DEUT | EQ | 4,689.00 AUD | 12/18/14 | AUD | 250 | 1 | 8 | (7 | ) | ||||||||||||||
| AS51 Index Option | DEUT | EQ | 4,949.50 AUD | 12/18/14 | AUD | 167 | 1 | 10 | (9 | ) | ||||||||||||||
| ASX 200 Index Option | MSC | EQ | 4,788.10 AUD | 01/15/15 | AUD | 335 | 3 | 8 | (5 | ) | ||||||||||||||
| ASX 200 Index Option | MSC | EQ | 5,146.20 AUD | 01/27/15 | AUD | 81 | 3 | 5 | (2 | ) | ||||||||||||||
| ASX 200 Index Option | GSC | EQ | 5,056.60 AUD | 01/15/15 | AUD | 162 | 3 | 9 | (6 | ) | ||||||||||||||
| ASX 200 Index Option | DEUT | EQ | 5,169.90 AUD | 01/29/15 | AUD | 161 | 6 | 8 | (2 | ) | ||||||||||||||
| KOSPI 200 Index Option | JPM | EQ | 236.55 KRW | 01/08/15 | KRW | 3,434,312 | 4 | 9 | (5 | ) | ||||||||||||||
| KOSPI 200 Index Option | BNP | EQ | 232.51 KRW | 01/08/15 | KRW | 1,677,618 | 1 | 4 | (3 | ) | ||||||||||||||
| KOSPI 200 Index Option | MSC | EQ | 233.08 KRW | 01/08/15 | KRW | 5,042,424 | 5 | 16 | (11 | ) | ||||||||||||||
| KOSPI 200 Index Option | GSC | EQ | 236.03 KRW | 01/29/15 | KRW | 1,639,066 | 3 | 4 | (1 | ) | ||||||||||||||
| Taiwan Stock Exchange Index Option | DEUT | EQ | 8,224.20 TWD | 12/17/14 | TWD | 1,360 | 1 | 3 | (2 | ) | ||||||||||||||
| Total Puts | 11,796,108 | $ | 33 | $ | 95 | $ | (62 | ) | ||||||||||||||||
| Total purchased option contracts | 15,685,318 | $ | 51 | $ | 162 | $ | (111 | ) | ||||||||||||||||
| Written option contracts: | ||||||||||||||||||||||||
| Calls | ||||||||||||||||||||||||
| GBP Call/USD Put | DEUT | FX | 1.62 USD per GBP | 12/08/14 | GBP | 3,560,000 | $ | 17 | $ | 82 | $ | 65 | ||||||||||||
| Puts | ||||||||||||||||||||||||
| AS51 Index Option | DEUT | EQ | 4,168.00 AUD | 12/18/14 | AUD | 250 | $ | – | $ | 2 | $ | 2 | ||||||||||||
| AS51 Index Option | DEUT | EQ | 4,428.50 AUD | 12/18/14 | AUD | 167 | – | 2 | 2 | |||||||||||||||
| ASX 200 Index Option | GSC | EQ | 4,524.30 AUD | 01/15/15 | AUD | 162 | – | 2 | 2 | |||||||||||||||
| GBP Put/USD Call | DEUT | FX | 1.62 USD per GBP | 12/08/14 | GBP | 3,560,000 | 77 | 87 | 10 | |||||||||||||||
| JSR Corp. Option | GSC | EQ | 1,580.50 JPY | 11/25/14 | JPY | 13,386 | – | 4 | 4 | |||||||||||||||
| JSR Corp. Option | JPM | EQ | 1,704.60 JPY | 12/12/14 | JPY | 13,200 | – | 3 | 3 | |||||||||||||||
| Mitsui O.S.K. Lines Ltd. Option | GSC | EQ | 342.00 JPY | 12/08/14 | JPY | 129,000 | 12 | 7 | (5 | ) | ||||||||||||||
| Mitsui O.S.K. Lines Ltd. Option | GSC | EQ | 350.37 JPY | 12/09/14 | JPY | 67,680 | 8 | 9 | 1 | |||||||||||||||
| Mitsui O.S.K. Lines Ltd. Option | JPM | EQ | 319.50 JPY | 02/06/15 | JPY | 125,900 | 10 | 14 | 4 | |||||||||||||||
| Nippon Yusen Kabushi Option | JPM | EQ | 274.50 JPY | 12/09/14 | JPY | 81,000 | 4 | 4 | – | |||||||||||||||
| Total Puts | 3,990,745 | $ | 111 | $ | 134 | $ | 23 | |||||||||||||||||
| Total written option contracts | 7,550,745 | $ | 128 | $ | 216 | $ | 88 | |||||||||||||||||
| * | The number of contracts does not omit 000's. |
| Δ | For purchased options, premiums are paid by the Fund, for written options, premiums are received. |
The accompanying notes are an integral part of these financial statements.
| 12 |
| Hartford Real Total Return Fund |
| Schedule of Investments – (continued) |
| October 31, 2014 |
| (000’s Omitted) |
Exchange Traded Option Contracts Outstanding at October 31, 2014
| Description | Risk Exposure Category | Exercise
Price/ FX Rate/ Rate | Expiration Date | Number
of Contracts * | Market Value ╪ | Premiums Received/Paid by Fund Δ | Unrealized Appreciation (Depreciation) | |||||||||||||||
| Purchased option contracts: | ||||||||||||||||||||||
| Calls | ||||||||||||||||||||||
| Health Care Sector SPDR Option | EQ | 67.00 USD | 12/20/14 | USD | 180 | $ | 29 | $ | 14 | $ | 15 | |||||||||||
| HollyFrontier Corp. Option | EQ | 51.00 USD | 01/17/15 | USD | 50 | 2 | 6 | (4 | ) | |||||||||||||
| iShares Nasdaq Biotech Option | EQ | 300.00 USD | 01/17/15 | USD | 17 | 19 | 8 | 11 | ||||||||||||||
| Lyondellbasell Industries Option | EQ | 105.00 USD | 01/17/15 | USD | 40 | 3 | 7 | (4 | ) | |||||||||||||
| Marathon Petroleum Option | EQ | 95.00 USD | 01/17/15 | USD | 27 | 7 | 11 | (4 | ) | |||||||||||||
| Materials Select SPDR Option | EQ | 50.00 USD | 12/20/14 | USD | 79 | 3 | 5 | (2 | ) | |||||||||||||
| Materials Select SPDR Option | EQ | 52.00 USD | 12/20/14 | USD | 93 | 1 | 5 | (4 | ) | |||||||||||||
| Philadelphia Semi Option | EQ | 675.00 USD | 12/20/14 | USD | 18 | 12 | 24 | (12 | ) | |||||||||||||
| S&P 500 Index Option | EQ | 2,050.00 USD | 03/20/15 | USD | 4 | 19 | 19 | – | ||||||||||||||
| Valero Energy Corp. Option | EQ | 57.50 USD | 12/20/14 | USD | 45 | 1 | 10 | (9 | ) | |||||||||||||
| Total Calls | 553 | $ | 96 | $ | 109 | $ | (13 | ) | ||||||||||||||
| Puts | ||||||||||||||||||||||
| Financial Sector SPDR Option | EQ | 22.00 USD | 01/17/15 | USD | 335 | $ | 7 | $ | 20 | $ | (13 | ) | ||||||||||
| S&P 500 Index Option | EQ | 1,900.00 USD | 11/22/14 | USD | 13 | 4 | 26 | (22 | ) | |||||||||||||
| S&P 500 Index Option | EQ | 1,820.00 USD | 12/20/14 | USD | 6 | 4 | 20 | (16 | ) | |||||||||||||
| Total Puts | 354 | $ | 15 | $ | 66 | $ | (51 | ) | ||||||||||||||
| Total purchased option contracts | 907 | $ | 111 | $ | 175 | $ | (64 | ) | ||||||||||||||
| Written option contracts: | ||||||||||||||||||||||
| Puts | ||||||||||||||||||||||
| CBOE Volatility S&P 500 Option | EQ | 14.00 USD | 11/19/14 | USD | 164 | $ | 7 | $ | 7 | $ | – | |||||||||||
| CBOE Volatility S&P 500 Option | EQ | 13.50 USD | 12/17/14 | USD | 157 | 6 | 6 | – | ||||||||||||||
| Financial Sector SPDR Option | EQ | 20.00 USD | 01/17/15 |
USD | 335 | 3 | 8 | 5 | ||||||||||||||
| Health Care Sector SPDR Option | EQ | 60.00 USD | 12/20/14 | USD | 186 | 5 | 20 | 15 | ||||||||||||||
| Health Care Sector SPDR Option | EQ | 61.00 USD | 12/20/14 | USD | 90 | 3 | 6 | 3 | ||||||||||||||
| Health Care Sector SPDR Option | EQ | 62.00 USD | 12/20/14 | USD | 90 | 3 | 5 | 2 | ||||||||||||||
| HollyFrontier Corp. Option | EQ | 42.00 USD | 01/17/15 | USD | 50 | 6 | 6 | – | ||||||||||||||
| iShares FTSE China 25 Option | EQ | 38.00 USD | 12/20/14 | USD | 147 | 9 | 8 | (1 | ) | |||||||||||||
| iShares Nasdaq Biotech Option | EQ | 250.00 USD | 01/17/15 | USD | 17 | 4 | 9 | 5 | ||||||||||||||
| iShares Russell 2000 Option | EQ | 92.00 USD | 03/20/15 | USD | 103 | 8 | 11 | 3 | ||||||||||||||
| iShares S&P MidCap 400 Option | EQ | 123.00 USD | 02/20/15 | USD | 83 | 9 | 12 | 3 | ||||||||||||||
| Marathon Petroleum Option | EQ | 77.50 USD | 01/17/15 | USD | 27 | 3 | 11 | 8 | ||||||||||||||
| S&P 500 Index Option | EQ | 1,925.00 USD | 11/22/14 | USD | 6 | 3 | 9 | 6 | ||||||||||||||
| S&P 500 Index Option | EQ | 1,650.00 USD | 12/20/14 | USD | 6 | 1 | 6 | 5 | ||||||||||||||
| S&P 500 Index Option | EQ | 1,925.00 USD | 12/20/14 | USD | 12 | 19 | 34 | 15 | ||||||||||||||
| Utilities Sector SPDR Option | EQ | 44.00 USD | 12/20/14 | USD | 261 | 16 | 15 | (1 | ) | |||||||||||||
| V.F. Corp. Option | EQ | 65.00 USD | 11/22/14 | USD | 70 | 2 | 4 | 2 | ||||||||||||||
| Valero Energy Corp. Option | EQ | 45.00 USD | 12/20/14 | USD | 45 | 3 | 9 | 6 | ||||||||||||||
| Total put option contracts | 1,849 | $ | 110 | $ | 186 | $ | 76 | |||||||||||||||
| Total written option contracts | 1,849 | $ | 110 | $ | 186 | $ | 76 | |||||||||||||||
| * | The number of contracts does not omit 000's. |
| Δ | For purchased options, premiums are paid by the Fund, for written options, premiums are received. |
Futures Contracts Outstanding at October 31, 2014
| Number of | Expiration | Notional | Market | Unrealized Appreciation/(Depreciation) | Variation Margin | |||||||||||||||||||||||
| Description | Contracts* | Date | Amount | Value ╪ | Asset | Liability | Asset | Liability | ||||||||||||||||||||
| Long position contracts: | ||||||||||||||||||||||||||||
| Euro STOXX 50 Future | 574 | 12/19/2014 | $ | 22,672 | $ | 22,306 | $ | – | $ | (366 | ) | $ | 554 | $ | – | |||||||||||||
| Euro-BUND Future | 108 | 12/08/2014 | 20,393 | 20,424 | 31 | – | 9 | – | ||||||||||||||||||||
| FTSE 100 Index Future | 14 | 12/19/2014 | 1,414 | 1,457 | 43 | – | 12 | – | ||||||||||||||||||||
| FTSE/MIB Index Future | 4 | 12/19/2014 | 510 | 494 | – | (16 | ) | 19 | (3 | ) | ||||||||||||||||||
| IBEX 35 Index Future | 5 | 11/21/2014 | 628 | 654 | 26 | – | 14 | – | ||||||||||||||||||||
The accompanying notes are an integral part of these financial statements.
| 13 |
| Hartford Real Total Return Fund |
| Schedule of Investments – (continued) |
| October 31, 2014 |
| (000’s Omitted) |
Futures Contracts Outstanding at October 31, 2014 - (continued)
| Number of | Expiration | Notional | Market | Unrealized Appreciation/(Depreciation) | Variation Margin | |||||||||||||||||||||||
| Description | Contracts* | Date | Amount | Value ╪ | Asset | Liability | Asset | Liability | ||||||||||||||||||||
| Long position contracts: - (continued) | ||||||||||||||||||||||||||||
| MSCI Taiwan Stock Index Future | 202 | 11/27/2014 | $ | 6,645 | $ | 6,745 | $ | 100 | $ | – | $ | 99 | $ | – | ||||||||||||||
| NIKKEI 225 Index Future | 9 | 12/11/2014 | 1,251 | 1,321 | 70 | – | 66 | – | ||||||||||||||||||||
| S&P 500 (E-Mini) Future | 72 | 12/19/2014 | 7,007 | 7,241 | 234 | – | 84 | (1 | ) | |||||||||||||||||||
| SGX FTSE China A50 Index Future | 93 | 11/27/2014 | 655 | 694 | 39 | – | 21 | – | ||||||||||||||||||||
| U.S. Treasury 10-Year Note Future | 99 | 12/19/2014 | 12,614 | 12,509 | – | (105 | ) | – | (26 | ) | ||||||||||||||||||
| U.S. Treasury CME Ultra Long Term Bond Future | 47 | 12/19/2014 | 7,028 | 7,370 | 342 | – | – | (26 | ) | |||||||||||||||||||
| Total | $ | 885 | $ | (487 | ) | $ | 878 | $ | (56 | ) | ||||||||||||||||||
| Short position contracts: | ||||||||||||||||||||||||||||
| Australian 10-Year Bond Future | 23 | 12/15/2014 | $ | 2,483 | $ | 2,485 | $ | – | $ | (2 | ) | $ | – | $ | (10 | ) | ||||||||||||
| Australian SPI 200 Index Future | 13 | 12/18/2014 | 1,528 | 1,578 | – | (50 | ) | – | (17 | ) | ||||||||||||||||||
| CAC 40 10 EURO Future | 27 | 11/21/2014 | 1,363 | 1,431 | – | (68 | ) | – | (31 | ) | ||||||||||||||||||
| Canadian Government 10-Year Bond Future | 41 | 12/18/2014 | 4,963 | 4,985 | – | (22 | ) | – | (1 | ) | ||||||||||||||||||
| FTSE/JSE Top 40 Future Index | 75 | 12/18/2014 | 2,956 | 3,039 | – | (83 | ) | 41 | (148 | ) | ||||||||||||||||||
| Japan 10-Year Bond Future | 11 | 12/11/2014 | 14,293 | 14,350 | – | (57 | ) | – | – | |||||||||||||||||||
| KOSPI 200 Index Future | 4 | 12/11/2014 | 458 | 468 | – | (10 | ) | – | (2 | ) | ||||||||||||||||||
| Long Gilt Future | 53 | 12/29/2014 | 9,686 | 9,759 | – | (73 | ) | 20 | – | |||||||||||||||||||
| Mexican Stock Exchange Index Future | 118 | 12/19/2014 | 4,032 | 3,948 | 84 | – | 7 | (48 | ) | |||||||||||||||||||
| Russell 2000 Mini Index Future | 35 | 12/19/2014 | 3,897 | 4,099 | – | (202 | ) | – | (60 | ) | ||||||||||||||||||
| S&P 400 (E-Mini) Future | 17 | 12/19/2014 | 2,313 | 2,406 | – | (93 | ) | – | (28 | ) | ||||||||||||||||||
| Stockholm Stock Exchange Future | 7 | 11/21/2014 | 128 | 134 | – | (6 | ) | – | (2 | ) | ||||||||||||||||||
| TDX ISE National-30 Index Future | 30 | 12/31/2014 | 133 | 135 | – | (2 | ) | – | (1 | ) | ||||||||||||||||||
| Tokyo Price Index Future | 147 | 12/11/2014 | 16,958 | 17,497 | – | (539 | ) | – | (733 | ) | ||||||||||||||||||
| U.S. Treasury Long Bond Future | 15 | 12/19/2014 | 2,115 | 2,116 | – | (1 | ) | – | (17 | ) | ||||||||||||||||||
| Total | $ | 84 | $ | (1,208 | ) | $ | 68 | $ | (1,098 | ) | ||||||||||||||||||
| Total futures contracts | $ | 969 | $ | (1,695 | ) | $ | 946 | $ | (1,154 | ) | ||||||||||||||||||
* The number of contracts does not omit 000's.
OTC Credit Default Swap Contracts Outstanding at October 31, 2014
| Counter- | Notional | (Pay)/ Receive Fixed Rate/ Implied | Expiration | Upfront Premiums | Upfront Premiums | Market | Unrealized
Appreciation/ (Depreciation) | ||||||||||||||||||||||
| Reference Entity | party | Amount (a) | Credit Spread (b) | Date | Paid | Received | Value ╪ | Asset | Liability | ||||||||||||||||||||
| Credit default swaps on single-name issues: | |||||||||||||||||||||||||||||
| Sell protection: | |||||||||||||||||||||||||||||
| China (People's Republic of) | JPM | USD | 1,175 | 1.00% / 0.80% | 12/20/19 | $ | 5 | $ | – | $ | 11 | $ | 6 | $ | – | ||||||||||||||
| (a) | The maximum potential amount the Fund could be required to pay as a seller of credit protection or receive as a buyer of credit protection if a credit event occurs as defined under the terms of that particular swap agreement. |
| (b) | Implied credit spreads, utilized in determining the market value of credit default swap agreements on corporate issues, U.S. municipal issues or sovereign government issues as of period end serve as an indicator of the current status of the payment/performance risk and represent the likelihood of risk of default for the credit derivative. The implied credit spread of a particular entity reflects the cost of buying/selling protection and may include upfront payments required to be made to enter into the agreement. Wider credit spreads represent a deterioration of the reference entity's credit soundness and a greater likelihood or risk of default or other credit event occurring as defined under the terms of the agreement. The percentage shown is the implied credit spread on October 31, 2014. For credit default swap agreements on indices, the quoted market prices and resulting values serve as the indicator of the current status of the payment/performance risk. |
The accompanying notes are an integral part of these financial statements.
| 14 |
| Hartford Real Total Return Fund |
| Schedule of Investments – (continued) |
| October 31, 2014 |
| (000’s Omitted) |
| Centrally Cleared Credit Default Swap Contracts Outstanding at October 31, 2014 | ||||||||||||||||||||||||||||||||||||
| Clearing | Notional | (Pay)/ Receive Fixed | Expiration | Market | Unrealized Appreciation/ (Depreciation) | Variation Margin | ||||||||||||||||||||||||||||||
| Reference Entity | House (a) | Amount (b) | Rate | Date | Cost Basis | Value ╪ | Asset | Liability | Asset | Liability | ||||||||||||||||||||||||||
| Credit default swaps on indices: | ||||||||||||||||||||||||||||||||||||
| Buy protection: | ||||||||||||||||||||||||||||||||||||
| CDX.NA.HY.23 | CME | USD | 2,925 | (5.00 | )% | 12/20/19 | $ | (171 | ) | $ | (204 | ) | $ | – | $ | (33 | ) | $ | – | $ | (12 | ) | ||||||||||||||
| (a) | The FCM to the contracts is MSC. |
| (b) | The maximum potential amount the Fund could be required to pay as a seller of credit protection or receive as a buyer of credit protection if a credit event occurs as defined under the terms of that particular swap agreement. |
| OTC Total Return Swap Contracts Outstanding at October 31, 2014 | ||||||||||||||||||||||||||||||
| Notional | Payments received | Expiration | Upfront Premiums | Upfront Premiums | Market | Unrealized Appreciation/(Depreciation) | ||||||||||||||||||||||||
| Reference Entity | Counterparty | Amount | (paid) by Fund | Date | Paid | Received | Value ╪ | Asset | Liability | |||||||||||||||||||||
| Eurex Stoxx Bank | GSC | EUR | 121 | CAZ4 | 12/19/14 | $ | – | $ | – | $ | (10 | ) | $ | – | $ | (10 | ) | |||||||||||||
| Eurex Stoxx Bank | GSC | EUR | 211 | CAZ4 | 12/19/14 | – | – | 1 | 1 | – | ||||||||||||||||||||
| S&P 500 Consumer Discretionary Sector | DEUT | USD | 4,756 | 1M LIBOR + 0.15% | 04/30/15 | – | – | (102 | ) | – | (102 | ) | ||||||||||||||||||
| S&P 500 Consumer Staples Sector | DEUT | USD | 425 | 1M LIBOR + 0.05% | 09/30/15 | – | – | (15 | ) | – | (15 | ) | ||||||||||||||||||
| S&P 500 High Beta Index | DEUT | USD | 10,469 | 1M LIBOR + 0.22% | 04/30/15 | – | – | (282 | ) | – | (282 | ) | ||||||||||||||||||
| S&P 500 Homebuilders Select Industry | BOA | USD | 6,411 | 1M LIBOR - 0.55% | 08/31/15 | – | – | (339 | ) | – | (339 | ) | ||||||||||||||||||
| S&P US Real Estate Select Industry TR | GSC | USD | 6,779 | 1M LIBOR - 0.90% | 01/30/15 | – | – | (226 | ) | – | (226 | ) | ||||||||||||||||||
| WIG20 Index | GSC | PLN | 11,538 | KRZ4 | 12/19/14 | – | – | 58 | 58 | – | ||||||||||||||||||||
| Total | $ | – | $ | – | $ | (915 | ) | $ | 59 | $ | (974 | ) | ||||||||||||||||||
| Foreign Currency Contracts Outstanding at October 31, 2014 | ||||||||||||||||||||||
| Unrealized Appreciation/(Depreciation) | ||||||||||||||||||||||
| Currency | Buy / Sell | Delivery Date | Counterparty | Contract Amount | Market Value ╪ | Asset | Liability | |||||||||||||||
| AUD | Buy | 11/28/2014 | BCLY | $ | 3,893 | $ | 3,902 | $ | 9 | $ | – | |||||||||||
| AUD | Buy | 12/17/2014 | BCLY | 74 | 75 | 1 | – | |||||||||||||||
| AUD | Buy | 12/17/2014 | BNP | 526 | 526 | – | – | |||||||||||||||
| AUD | Buy | 11/28/2014 | BOA | 3,729 | 3,730 | 1 | – | |||||||||||||||
| AUD | Buy | 11/28/2014 | BOA | 738 | 735 | – | (3 | ) | ||||||||||||||
| AUD | Buy | 12/17/2014 | BOA | 225 | 225 | – | – | |||||||||||||||
| AUD | Buy | 11/28/2014 | CBA | 2,975 | 2,975 | – | – | |||||||||||||||
| AUD | Buy | 12/17/2014 | GSC | 270 | 270 | – | – | |||||||||||||||
| AUD | Buy | 12/17/2014 | JPM | 1,092 | 1,078 | – | (14 | ) | ||||||||||||||
| AUD | Buy | 11/03/2014 | SSG | 8 | 8 | – | – | |||||||||||||||
| AUD | Buy | 12/17/2014 | SSG | 288 | 289 | 1 | – | |||||||||||||||
| AUD | Buy | 12/17/2014 | WEST | 846 | 856 | 10 | – | |||||||||||||||
| AUD | Sell | 12/17/2014 | BOA | 1,071 | 1,068 | 3 | – | |||||||||||||||
| AUD | Sell | 12/17/2014 | CBA | 562 | 555 | 7 | – | |||||||||||||||
| AUD | Sell | 12/17/2014 | CSFB | 1,074 | 1,080 | – | (6 | ) | ||||||||||||||
| AUD | Sell | 12/17/2014 | DEUT | 234 | 225 | 9 | – | |||||||||||||||
| AUD | Sell | 11/28/2014 | GSC | 3,930 | 3,902 | 28 | – | |||||||||||||||
| AUD | Sell | 11/28/2014 | NAB | 372 | 374 | – | (2 | ) | ||||||||||||||
| AUD | Sell | 12/17/2014 | RBC | 854 | 827 | 27 | – | |||||||||||||||
| AUD | Sell | 12/17/2014 | RBS | 1,913 | 1,854 | 59 | – | |||||||||||||||
| BRL | Buy | 11/04/2014 | BOA | 111 | 107 | – | (4 | ) | ||||||||||||||
| BRL | Buy | 12/02/2014 | GSC | 1,676 | 1,625 | – | (51 | ) | ||||||||||||||
| BRL | Buy | 11/04/2014 | UBS | 1,008 | 1,002 | – | (6 | ) | ||||||||||||||
| BRL | Sell | 11/04/2014 | CBK | 149 | 149 | – | – | |||||||||||||||
The accompanying notes are an integral part of these financial statements.
| 15 |
| Hartford Real Total Return Fund |
| Schedule of Investments – (continued) |
| October 31, 2014 |
| (000’s Omitted) |
| Foreign Currency Contracts Outstanding at October 31, 2014 - (continued) | ||||||||||||||||||||||
| Unrealized Appreciation/(Depreciation) | ||||||||||||||||||||||
| Currency | Buy / Sell | Delivery Date | Counterparty | Contract Amount | Market Value ╪ | Asset | Liability | |||||||||||||||
| BRL | Sell | 12/02/2014 | MSC | $ | 1,477 | $ | 1,463 | $ | 14 | $ | – | |||||||||||
| BRL | Sell | 11/04/2014 | SCB | 972 | 960 | 12 | – | |||||||||||||||
| BRL | Sell | 12/02/2014 | UBS | 999 | 993 | 6 | – | |||||||||||||||
| CAD | Buy | 12/17/2014 | CBA | 1,128 | 1,098 | – | (30 | ) | ||||||||||||||
| CAD | Buy | 12/17/2014 | HSBC | 285 | 277 | – | (8 | ) | ||||||||||||||
| CAD | Buy | 12/17/2014 | JPM | 117 | 115 | – | (2 | ) | ||||||||||||||
| CAD | Buy | 11/28/2014 | RBC | 7,933 | 7,885 | – | (48 | ) | ||||||||||||||
| CAD | Sell | 12/17/2014 | BOA | 281 | 275 | 6 | – | |||||||||||||||
| CAD | Sell | 12/17/2014 | CBK | 116 | 113 | 3 | – | |||||||||||||||
| CAD | Sell | 12/17/2014 | DEUT | 564 | 553 | 11 | – | |||||||||||||||
| CAD | Sell | 12/17/2014 | GSC | 276 | 273 | 3 | – | |||||||||||||||
| CAD | Sell | 12/17/2014 | WEST | 275 | 276 | – | (1 | ) | ||||||||||||||
| CHF | Buy | 12/17/2014 | HSBC | 1,138 | 1,104 | – | (34 | ) | ||||||||||||||
| CHF | Buy | 11/28/2014 | JPM | 4,760 | 4,737 | – | (23 | ) | ||||||||||||||
| CHF | Sell | 12/17/2014 | BOA | 1,129 | 1,104 | 25 | – | |||||||||||||||
| CHF | Sell | 11/28/2014 | HSBC | 9,722 | 9,643 | 79 | – | |||||||||||||||
| CNH | Buy | 12/17/2014 | BCLY | 1,705 | 1,702 | – | (3 | ) | ||||||||||||||
| CNH | Sell | 12/17/2014 | JPM | 1,685 | 1,702 | – | (17 | ) | ||||||||||||||
| CNH | Sell | 12/17/2014 | MSC | 806 | 806 | – | – | |||||||||||||||
| COP | Buy | 12/17/2014 | BNP | 558 | 550 | – | (8 | ) | ||||||||||||||
| COP | Buy | 12/17/2014 | SCB | 355 | 345 | – | (10 | ) | ||||||||||||||
| COP | Sell | 12/17/2014 | BOA | 925 | 894 | 31 | – | |||||||||||||||
| EUR | Buy | 12/17/2014 | BCLY | 279 | 276 | – | (3 | ) | ||||||||||||||
| EUR | Buy | 11/28/2014 | BOA | 867 | 856 | – | (11 | ) | ||||||||||||||
| EUR | Buy | 12/17/2014 | BOA | 1,390 | 1,354 | – | (36 | ) | ||||||||||||||
| EUR | Buy | 11/04/2014 | CBK | 5 | 5 | – | – | |||||||||||||||
| EUR | Buy | 12/17/2014 | CSFB | 15 | 15 | – | – | |||||||||||||||
| EUR | Buy | 12/17/2014 | DEUT | 864 | 836 | – | (28 | ) | ||||||||||||||
| EUR | Buy | 12/17/2014 | HSBC | 1,069 | 1,047 | – | (22 | ) | ||||||||||||||
| EUR | Buy | 11/03/2014 | RBC | 12 | 12 | – | – | |||||||||||||||
| EUR | Buy | 12/17/2014 | SSG | 274 | 271 | – | (3 | ) | ||||||||||||||
| EUR | Buy | 11/28/2014 | UBS | 4,756 | 4,734 | – | (22 | ) | ||||||||||||||
| EUR | Buy | 11/04/2014 | WEST | 38 | 38 | – | – | |||||||||||||||
| EUR | Sell | 12/17/2014 | BCLY | 1,054 | 1,045 | 9 | – | |||||||||||||||
| EUR | Sell | 11/28/2014 | BNP | 855 | 851 | 4 | – | |||||||||||||||
| EUR | Sell | 12/17/2014 | BNP | 266 | 262 | 4 | – | |||||||||||||||
| EUR | Sell | 12/17/2014 | CBK | 382 | 381 | 1 | – | |||||||||||||||
| EUR | Sell | 12/17/2014 | DEUT | 16,384 | 15,862 | 522 | – | |||||||||||||||
| EUR | Sell | 12/17/2014 | GSC | 14 | 14 | – | – | |||||||||||||||
| EUR | Sell | 12/17/2014 | HSBC | 1,135 | 1,101 | 34 | – | |||||||||||||||
| EUR | Sell | 11/28/2014 | JPM | 10,459 | 10,349 | 110 | – | |||||||||||||||
| EUR | Sell | 12/17/2014 | JPM | 1,004 | 989 | 15 | – | |||||||||||||||
| EUR | Sell | 12/17/2014 | MSC | 2,163 | 2,136 | 27 | – | |||||||||||||||
| GBP | Buy | 12/17/2014 | BCLY | 568 | 560 | – | (8 | ) | ||||||||||||||
| GBP | Buy | 12/17/2014 | BNP | 707 | 699 | – | (8 | ) | ||||||||||||||
| GBP | Buy | 12/17/2014 | BOA | 562 | 553 | – | (9 | ) | ||||||||||||||
| GBP | Buy | 11/28/2014 | CBK | 5,697 | 5,689 | – | (8 | ) | ||||||||||||||
| GBP | Buy | 12/17/2014 | MSC | 441 | 435 | – | (6 | ) | ||||||||||||||
| GBP | Buy | 12/17/2014 | SSG | 280 | 278 | – | (2 | ) | ||||||||||||||
| GBP | Sell | 12/17/2014 | BCLY | 266 | 264 | 2 | – | |||||||||||||||
| GBP | Sell | 12/17/2014 | BOA | 277 | 277 | – | – | |||||||||||||||
| GBP | Sell | 12/17/2014 | CBA | 564 | 553 | 11 | – | |||||||||||||||
| GBP | Sell | 12/17/2014 | CSFB | 877 | 864 | 13 | – | |||||||||||||||
| GBP | Sell | 12/17/2014 | GSC | 279 | 277 | 2 | – | |||||||||||||||
| GBP | Sell | 12/17/2014 | RBS | 569 | 560 | 9 | – | |||||||||||||||
| GBP | Sell | 12/17/2014 | RBS | 141 | 141 | – | – | |||||||||||||||
| HKD | Buy | 12/17/2014 | CSFB | 4 | 4 | – | – | |||||||||||||||
| HKD | Buy | 12/17/2014 | GSC | 5 | 5 | – | – | |||||||||||||||
| HKD | Buy | 12/17/2014 | HSBC | 1 | 1 | – | – | |||||||||||||||
The accompanying notes are an integral part of these financial statements.
| 16 |
| Hartford Real Total Return Fund |
| Schedule of Investments – (continued) |
| October 31, 2014 |
| (000’s Omitted) |
| Foreign Currency Contracts Outstanding at October 31, 2014 - (continued) | ||||||||||||||||||||||
| Unrealized Appreciation/(Depreciation) | ||||||||||||||||||||||
| Currency | Buy / Sell | Delivery Date | Counterparty | Contract Amount | Market Value ╪ | Asset | Liability | |||||||||||||||
| HKD | Sell | 12/17/2014 | BCLY | $ | 4 | $ | 4 | $ | – | $ | – | |||||||||||
| HKD | Sell | 12/17/2014 | JPM | 4 | 4 | – | – | |||||||||||||||
| IDR | Buy | 12/17/2014 | MSC | 269 | 268 | – | (1 | ) | ||||||||||||||
| INR | Buy | 12/17/2014 | CBK | 7,002 | 6,965 | – | (37 | ) | ||||||||||||||
| INR | Buy | 12/17/2014 | DEUT | 137 | 137 | – | – | |||||||||||||||
| INR | Buy | 12/17/2014 | MSC | 402 | 400 | – | (2 | ) | ||||||||||||||
| INR | Sell | 12/17/2014 | CBK | 135 | 134 | 1 | – | |||||||||||||||
| INR | Sell | 12/17/2014 | DEUT | 404 | 403 | 1 | – | |||||||||||||||
| INR | Sell | 12/17/2014 | JPM | 3,255 | 3,258 | – | (3 | ) | ||||||||||||||
| JPY | Buy | 12/17/2014 | BNP | 1,259 | 1,192 | – | (67 | ) | ||||||||||||||
| JPY | Buy | 11/28/2014 | BOA | 1,485 | 1,427 | – | (58 | ) | ||||||||||||||
| JPY | Buy | 12/17/2014 | DEUT | 380 | 366 | – | (14 | ) | ||||||||||||||
| JPY | Buy | 12/17/2014 | HSBC | 424 | 408 | – | (16 | ) | ||||||||||||||
| JPY | Buy | 12/17/2014 | JPM | 3,196 | 3,053 | – | (143 | ) | ||||||||||||||
| JPY | Buy | 12/17/2014 | SSG | 284 | 275 | – | (9 | ) | ||||||||||||||
| JPY | Buy | 11/05/2014 | UBS | 25 | 24 | – | (1 | ) | ||||||||||||||
| JPY | Buy | 12/17/2014 | UBS | 255 | 245 | – | (10 | ) | ||||||||||||||
| JPY | Sell | 12/17/2014 | BCLY | 258 | 248 | 10 | – | |||||||||||||||
| JPY | Sell | 11/28/2014 | BNP | 1,974 | 1,916 | 58 | – | |||||||||||||||
| JPY | Sell | 12/17/2014 | BOA | 536 | 510 | 26 | – | |||||||||||||||
| JPY | Sell | 12/17/2014 | CBK | 1,079 | 1,039 | 40 | – | |||||||||||||||
| JPY | Sell | 11/06/2014 | DEUT | 26 | 26 | – | – | |||||||||||||||
| JPY | Sell | 12/17/2014 | HSBC | 1,075 | 1,023 | 52 | – | |||||||||||||||
| JPY | Sell | 12/17/2014 | JPM | 29,046 | 27,573 | 1,473 | – | |||||||||||||||
| JPY | Sell | 12/17/2014 | MSC | 237 | 237 | – | – | |||||||||||||||
| JPY | Sell | 11/28/2014 | RBS | 6,792 | 6,530 | 262 | – | |||||||||||||||
| JPY | Sell | 11/04/2014 | SSG | 41 | 39 | 2 | – | |||||||||||||||
| JPY | Sell | 12/17/2014 | SSG | 271 | 257 | 14 | – | |||||||||||||||
| JPY | Sell | 11/05/2014 | UBS | 9 | 9 | – | – | |||||||||||||||
| KRW | Buy | 12/17/2014 | BOA | 288 | 285 | – | (3 | ) | ||||||||||||||
| KRW | Sell | 12/17/2014 | MSC | 140 | 140 | – | – | |||||||||||||||
| KRW | Sell | 12/17/2014 | UBS | 567 | 550 | 17 | – | |||||||||||||||
| MXN | Buy | 11/28/2014 | SSG | 3,476 | 3,479 | 3 | – | |||||||||||||||
| MXN | Buy | 12/17/2014 | UBS | 126 | 127 | 1 | – | |||||||||||||||
| MXN | Sell | 12/17/2014 | BCLY | 122 | 122 | – | – | |||||||||||||||
| MXN | Sell | 12/17/2014 | BOA | 1,074 | 1,082 | – | (8 | ) | ||||||||||||||
| MXN | Sell | 12/17/2014 | JPM | 8,199 | 8,059 | 140 | – | |||||||||||||||
| MXN | Sell | 11/28/2014 | MSC | 1,748 | 1,758 | – | (10 | ) | ||||||||||||||
| NOK | Buy | 12/17/2014 | BCLY | 576 | 545 | – | (31 | ) | ||||||||||||||
| NOK | Buy | 12/17/2014 | BOA | 525 | 509 | – | (16 | ) | ||||||||||||||
| NOK | Buy | 12/17/2014 | GSC | 1,398 | 1,326 | – | (72 | ) | ||||||||||||||
| NOK | Buy | 12/17/2014 | HSBC | 547 | 513 | – | (34 | ) | ||||||||||||||
| NOK | Sell | 12/17/2014 | BCLY | 851 | 817 | 34 | – | |||||||||||||||
| NOK | Sell | 12/17/2014 | RBS | 783 | 763 | 20 | – | |||||||||||||||
| NOK | Sell | 12/17/2014 | SCB | 550 | 534 | 16 | – | |||||||||||||||
| NOK | Sell | 12/17/2014 | SSG | 799 | 780 | 19 | – | |||||||||||||||
| NZD | Buy | 12/17/2014 | BCLY | 823 | 795 | – | (28 | ) | ||||||||||||||
| NZD | Buy | 12/17/2014 | BOA | 294 | 289 | – | (5 | ) | ||||||||||||||
| NZD | Buy | 12/17/2014 | CBA | 560 | 535 | – | (25 | ) | ||||||||||||||
| NZD | Buy | 12/17/2014 | MSC | 265 | 265 | – | – | |||||||||||||||
| NZD | Buy | 12/17/2014 | SCB | 273 | 268 | – | (5 | ) | ||||||||||||||
| NZD | Sell | 12/17/2014 | GSC | 1,119 | 1,078 | 41 | – | |||||||||||||||
| NZD | Sell | 12/17/2014 | JPM | 285 | 281 | 4 | – | |||||||||||||||
| NZD | Sell | 12/17/2014 | RBS | 266 | 260 | 6 | – | |||||||||||||||
| NZD | Sell | 12/17/2014 | SSG | 280 | 272 | 8 | – | |||||||||||||||
| NZD | Sell | 12/17/2014 | UBS | 262 | 261 | 1 | – | |||||||||||||||
| PLN | Buy | 12/17/2014 | BNP | 146 | 142 | – | (4 | ) | ||||||||||||||
| SEK | Buy | 12/17/2014 | BCLY | 267 | 261 | – | (6 | ) | ||||||||||||||
| SEK | Buy | 12/17/2014 | BOA | 269 | 267 | – | (2 | ) | ||||||||||||||
The accompanying notes are an integral part of these financial statements.
| 17 |
| Hartford Real Total Return Fund |
| Schedule of Investments – (continued) |
| October 31, 2014 |
| (000’s Omitted) |
| Foreign Currency Contracts Outstanding at October 31, 2014 - (continued) | ||||||||||||||||||||||
| Unrealized Appreciation/(Depreciation) | ||||||||||||||||||||||
| Currency | Buy / Sell | Delivery Date | Counterparty | Contract Amount | Market Value ╪ | Asset | Liability | |||||||||||||||
| SEK | Buy | 12/17/2014 | GSC | $ | 279 | $ | 272 | $ | – | $ | (7 | ) | ||||||||||
| SEK | Buy | 12/17/2014 | JPM | 569 | 548 | – | (21 | ) | ||||||||||||||
| SEK | Sell | 12/17/2014 | BCLY | 568 | 548 | 20 | – | |||||||||||||||
| SEK | Sell | 12/17/2014 | RBS | 261 | 256 | 5 | – | |||||||||||||||
| SEK | Sell | 12/17/2014 | SCB | 286 | 278 | 8 | – | |||||||||||||||
| SGD | Buy | 12/17/2014 | BCLY | 316 | 313 | – | (3 | ) | ||||||||||||||
| SGD | Buy | 12/17/2014 | RBS | 264 | 261 | – | (3 | ) | ||||||||||||||
| SGD | Buy | 12/17/2014 | SCB | 278 | 276 | – | (2 | ) | ||||||||||||||
| SGD | Buy | 12/17/2014 | SSG | 548 | 544 | – | (4 | ) | ||||||||||||||
| SGD | Sell | 12/17/2014 | HSBC | 284 | 280 | 4 | – | |||||||||||||||
| SGD | Sell | 12/17/2014 | JPM | 279 | 275 | 4 | – | |||||||||||||||
| SGD | Sell | 12/17/2014 | RBC | 281 | 276 | 5 | – | |||||||||||||||
| SGD | Sell | 12/17/2014 | UBS | 571 | 562 | 9 | – | |||||||||||||||
| TWD | Buy | 12/17/2014 | UBS | 2,283 | 2,278 | – | (5 | ) | ||||||||||||||
| TWD | Sell | 12/17/2014 | CBK | 8,992 | 8,856 | 136 | – | |||||||||||||||
| ZAR | Buy | 11/28/2014 | BOA | 1,092 | 1,082 | – | (10 | ) | ||||||||||||||
| ZAR | Buy | 12/17/2014 | BOA | 170 | 169 | – | (1 | ) | ||||||||||||||
| ZAR | Buy | 11/28/2014 | CBK | 1,110 | 1,101 | – | (9 | ) | ||||||||||||||
| ZAR | Buy | 12/17/2014 | SSG | 141 | 141 | – | – | |||||||||||||||
| ZAR | Sell | 11/28/2014 | BOA | 1,105 | 1,101 | 4 | – | |||||||||||||||
| ZAR | Sell | 12/17/2014 | BOA | 1,069 | 1,063 | 6 | – | |||||||||||||||
| ZAR | Sell | 12/17/2014 | RBS | 3,552 | 3,560 | – | (8 | ) | ||||||||||||||
| Total | $ | 3,558 | $ | (1,119 | ) | |||||||||||||||||
| ╪ | See Significant Accounting Policies of accompanying Notes to Financial Statements regarding valuation of securities. |
The accompanying notes are an integral part of these financial statements.
| 18 |
| Hartford Real Total Return Fund |
| Schedule of Investments – (continued) |
| October 31, 2014 |
| (000’s Omitted) |
| GLOSSARY: (abbreviations used in preceding Schedule of Investments) | ||
| Counterparty Abbreviations: | ||
| BCLY | Barclays | |
| BNP | BNP Paribas Securities Services | |
| BOA | Banc of America Securities LLC | |
| CBA | Commonwealth Bank of Australia | |
| CBK | Citibank NA | |
| CME | Chicago Mercantile Exchange | |
| CSFB | Credit Suisse First Boston Corp. | |
| DEUT | Deutsche Bank Securities, Inc. | |
| FCM | Futures Commission Merchant | |
| GSC | Goldman Sachs & Co. | |
| HSBC | HSBC Bank USA | |
| JPM | JP Morgan Chase & Co. | |
| MSC | Morgan Stanley | |
| NAB | National Australia Bank Limited | |
| RBC | RBC Dominion Securities, Inc. | |
| RBS | RBS Greenwich Capital | |
| SCB | Standard Chartered Bank | |
| SSG | State Street Global Markets LLC | |
| UBS | UBS AG | |
| WEST | Westpac International | |
| Currency Abbreviations: | ||
| AUD | Australian Dollar | |
| BRL | Brazilian Real | |
| CAD | Canadian Dollar | |
| CHF | Swiss Franc | |
| CNH | Chinese Yuan Renminbi - Hong Kong | |
| COP | Colombian Peso | |
| EUR | EURO | |
| GBP | British Pound | |
| HKD | Hong Kong Dollar | |
| IDR | Indonesian New Rupiah | |
| INR | Indian Rupee | |
| JPY | Japanese Yen | |
| KRW | South Korean Won | |
| MXN | Mexican New Peso | |
| NOK | Norwegian Krone | |
| NZD | New Zealand Dollar | |
| PLN | Polish New Zloty | |
| SEK | Swedish Krona | |
| SGD | Singapore Dollar | |
| TWD | Taiwan Dollar | |
| USD | U.S. Dollar | |
| ZAR | South African Rand | |
| Index Abbreviations: | |
| ASX | Australian Securities Exchange |
| CAC | Cotation Assistee en Continu |
| CAZ4 | EURO STOXX Banks Index Future |
| CBOE | Chicago Board Options Exchange |
| CDX.NA.HY | Credit Derivatives North American High Yield |
| FTSE | Financial Times and Stock Exchange |
| IBEX | Spanish Stock Index |
| ISE | International Security Exchange |
| JSE | Johannesburg Stock Exhange |
| KOSPI | Korea Composite Stock Price |
| KRZ4 | WIG20 Index Future |
| MIB | Milano Italia Borsa |
| MSCI | Morgan Stanley Capital International |
| S&P | Standard & Poors |
| SGX | Singapore Exchange |
| SPI | Share Price Index |
| TDX | db-X In-Target Date Fund |
| WIG20 | Capitilization-weighted stock market index of the 20 largest |
| companies on the Warsaw Stock Exchange | |
| Other Abbreviations: | |
| ADR | American Depositary Receipt |
| EQ | Equity |
| ETF | Exchange Traded Fund |
| FHLMC | Federal Home Loan Mortgage Corp. |
| FNMA | Federal National Mortgage Association |
| FX | Foreign Exchange |
| GNMA | Government National Mortgage Association |
| J-REIT | Japanese Real Estate Investment Trust |
| LIBOR | London Interbank Offered Rate |
| OTC | Over-the-Counter |
| REIC | Real Estate Investment Company |
| REIT | Real Estate Investment Trust |
| SPDR | Standard & Poor's Depositary Receipt |
The accompanying notes are an integral part of these financial statements.
| 19 |
| Hartford Real Total Return Fund |
| Schedule of Investments – (continued) |
| October 31, 2014 |
| (000’s Omitted) |
Investment Valuation Hierarchy Level Summary
October 31, 2014
| Total | Level 1 ♦ | Level 2 ♦ | Level 3 | |||||||||||||
| Assets: | ||||||||||||||||
| Common Stocks | ||||||||||||||||
| Automobiles and Components | $ | 2,691 | $ | 118 | $ | 2,573 | $ | – | ||||||||
| Banks | 6,099 | 4 | 6,095 | – | ||||||||||||
| Capital Goods | 4,482 | 1,265 | 3,217 | – | ||||||||||||
| Commercial and Professional Services | 1,354 | 1,101 | 253 | – | ||||||||||||
| Consumer Durables and Apparel | 2,905 | 772 | 2,133 | – | ||||||||||||
| Consumer Services | 826 | 763 | 63 | – | ||||||||||||
| Diversified Financials | 1,936 | 653 | 1,283 | – | ||||||||||||
| Energy | 7,457 | 5,035 | 2,422 | – | ||||||||||||
| Food and Staples Retailing | 350 | 134 | 216 | – | ||||||||||||
| Food, Beverage and Tobacco | 1,240 | 1,114 | 126 | – | ||||||||||||
| Health Care Equipment and Services | 1,644 | 1,028 | 616 | – | ||||||||||||
| Insurance | 552 | – | 552 | – | ||||||||||||
| Materials | 3,245 | 1,076 | 2,169 | – | ||||||||||||
| Media | 1,301 | 382 | 919 | – | ||||||||||||
| Pharmaceuticals, Biotechnology and Life Sciences | 3,065 | 2,909 | 156 | – | ||||||||||||
| Real Estate | 2,036 | 386 | 1,650 | – | ||||||||||||
| Retailing | 2,700 | 1,670 | 1,030 | – | ||||||||||||
| Semiconductors and Semiconductor Equipment | 1,684 | 893 | 791 | – | ||||||||||||
| Software and Services | 4,099 | 2,808 | 1,095 | 196 | ||||||||||||
| Technology Hardware and Equipment | 3,299 | 915 | 2,384 | – | ||||||||||||
| Telecommunication Services | 730 | 421 | 309 | – | ||||||||||||
| Transportation | 2,302 | 1,658 | 644 | – | ||||||||||||
| Utilities | 323 | – | 323 | – | ||||||||||||
| Total | 56,320 | 25,105 | 31,019 | 196 | ||||||||||||
| Corporate Bonds | 7,162 | – | 7,162 | – | ||||||||||||
| Exchange Traded Funds | 10,019 | 10,019 | – | – | ||||||||||||
| Foreign Government Obligations | 15,930 | – | 15,930 | – | ||||||||||||
| U.S. Government Securities | 7,489 | – | 7,489 | – | ||||||||||||
| Warrants | 492 | 492 | – | – | ||||||||||||
| Short-Term Investments | 5,856 | – | 5,856 | – | ||||||||||||
| Purchased Options | 162 | 141 | 21 | – | ||||||||||||
| Total | $ | 103,430 | $ | 35,757 | $ | 67,477 | $ | 196 | ||||||||
| Foreign Currency Contracts* | $ | 3,558 | $ | – | $ | 3,558 | $ | – | ||||||||
| Futures* | 969 | 969 | – | – | ||||||||||||
| Swaps - Credit Default* | 6 | – | 6 | – | ||||||||||||
| Swaps - Total Return* | 59 | – | 59 | – | ||||||||||||
| Total | $ | 4,592 | $ | 969 | $ | 3,623 | $ | – | ||||||||
| Liabilities: | ||||||||||||||||
| Written Options | 238 | 110 | 128 | – | ||||||||||||
| Total | $ | 238 | $ | 110 | $ | 128 | $ | – | ||||||||
| Foreign Currency Contracts* | $ | 1,119 | $ | – | $ | 1,119 | $ | – | ||||||||
| Futures* | 1,695 | 1,695 | – | – | ||||||||||||
| Swaps - Credit Default* | 33 | – | 33 | – | ||||||||||||
| Swaps - Total Return* | 974 | – | 974 | – | ||||||||||||
| Total | $ | 3,821 | $ | 1,695 | $ | 2,126 | $ | – | ||||||||
| ♦ | For the period November 29, 2013 (commencement of operations) through October 31, 2014, there were no transfers between Level 1 and Level 2. |
| * | Derivative instruments (excluding purchased and written options, if applicable) are valued at the unrealized appreciation/depreciation on the investments. |
The accompanying notes are an integral part of these financial statements.
| 20 |
| Hartford Real Total Return Fund |
| Schedule of Investments – (continued) |
| October 31, 2014 |
| (000’s Omitted) |
Following is a reconciliation of Level 3 assets for which significant unobservable inputs were used to determine fair value:
| Balance
as of November 29, 2013* | Realized Gain (Loss) | Change
in Unrealized Appreciation (Depreciation) | Net Amortization | Purchases | Sales | Transfers
Into Level 3 | Transfers Out of Level 3 | Balance
as of October 31, 2014 | ||||||||||||||||||||||||||||
| Assets: | ||||||||||||||||||||||||||||||||||||
| Common Stocks | $ | — | $ | — | $ | 62 | † | $ | — | $ | 134 | $ | — | $ | — | $ | — | $ | 196 | |||||||||||||||||
| Total | $ | — | $ | — | $ | 62 | $ | — | $ | 134 | $ | — | $ | — | $ | — | $ | 196 | ||||||||||||||||||
| * | Commencement of operations. |
| † | Change in unrealized appreciation (depreciation) in the current period relating to assets still held at October 31, 2014 was $62. |
The accompanying notes are an integral part of these financial statements.
| 21 |
| Hartford Real Total Return Fund |
| Statement of Assets and Liabilities |
| October 31, 2014 |
| (000’s Omitted) |
| Assets: | ||||
| Investments in securities, at market value (cost $105,835) | $ | 103,430 | ||
| Cash | 4,610 | * | ||
| Unrealized appreciation on foreign currency contracts | 3,558 | |||
| Unrealized appreciation on OTC swap contracts | 65 | |||
| Receivables: | ||||
| Investment securities sold | 1,928 | |||
| Fund shares sold | — | |||
| Dividends and interest | 583 | |||
| Variation margin on financial derivative instruments | 946 | |||
| OTC swap premiums paid | 5 | |||
| Other assets | 63 | |||
| Total assets | 115,188 | |||
| Liabilities: | ||||
| Unrealized depreciation on foreign currency contracts | 1,119 | |||
| Unrealized depreciation on OTC swap contracts | 974 | |||
| Bank overdraft — foreign cash | 158 | |||
| Payables: | ||||
| Investment securities purchased | 1,725 | |||
| Investment management fees | 25 | |||
| Administrative fees | — | |||
| Distribution fees | — | |||
| Collateral received from broker | 53 | |||
| Variation margin on financial derivative instruments | 1,166 | |||
| Accrued expenses | 16 | |||
| Written option contracts (proceeds $402) | 238 | |||
| Other liabilities | — | |||
| Total liabilities | 5,474 | |||
| Net assets | $ | 109,714 | ||
| Summary of Net Assets: | ||||
| Capital stock and paid-in-capital | $ | 111,110 | ||
| Distributions in excess of net investment income | (1,173 | ) | ||
| Accumulated net realized gain | 1,261 | |||
| Unrealized depreciation of investments and the translation of assets and liabilities denominated in foreign currency | (1,484 | ) | ||
| Net assets | $ | 109,714 |
* Cash of $4,457 was pledged as collateral for open financial derivative instruments at October 31, 2014.
The accompanying notes are an integral part of these financial statements.
| 22 |
| Hartford Real Total Return Fund |
| Statement of Assets and Liabilities – (continued) |
| October 31, 2014 |
| (000’s Omitted) |
| Shares authorized | 450,000 | |||
| Par value | $ | 0.001 | ||
| Class A: Net asset value per share/Maximum offering price per share | $10.11/$10.70 | |||
| Shares outstanding | 59 | |||
| Net assets | $ | 598 | ||
| Class C: Net asset value per share | $ | 10.04 | ||
| Shares outstanding | 12 | |||
| Net assets | $ | 122 | ||
| Class I: Net asset value per share | $ | 10.15 | ||
| Shares outstanding | 14 | |||
| Net assets | $ | 138 | ||
| Class R3: Net asset value per share | $ | 10.08 | ||
| Shares outstanding | 10 | |||
| Net assets | $ | 101 | ||
| Class R4: Net asset value per share | $ | 10.10 | ||
| Shares outstanding | 10 | |||
| Net assets | $ | 101 | ||
| Class R5: Net asset value per share | $ | 10.13 | ||
| Shares outstanding | 10 | |||
| Net assets | $ | 101 | ||
| Class Y: Net asset value per share | $ | 10.14 | ||
| Shares outstanding | 10,705 | |||
| Net assets | $ | 108,553 |
The accompanying notes are an integral part of these financial statements.
| 23 |
| Hartford Real Total Return Fund |
| Statement of Operations |
| For the Period November 29, 2013 (commencement of operations) through October 31, 2014 |
| (000’s Omitted) |
| Investment Income: | ||||
| Dividends | $ | 855 | ||
| Interest | 1,307 | |||
| Less: Foreign tax withheld | (65 | ) | ||
| Total investment income | 2,097 | |||
| Expenses: | ||||
| Investment management fees | 1,336 | |||
| Administrative services fees | ||||
| Class R3 | — | |||
| Class R4 | — | |||
| Class R5 | — | |||
| Transfer agent fees | ||||
| Class A | — | |||
| Class C | — | |||
| Class I | — | |||
| Class Y | 2 | |||
| Distribution fees | ||||
| Class A | 1 | |||
| Class C | 1 | |||
| Class R3 | — | |||
| Class R4 | — | |||
| Custodian fees | 17 | |||
| Accounting services fees | 28 | |||
| Registration and filing fees | 93 | |||
| Board of Directors' fees | 4 | |||
| Audit fees | 13 | |||
| Other expenses | 19 | |||
| Total expenses (before waivers and fees paid indirectly) | 1,514 | |||
| Expense waivers | (59 | ) | ||
| Commission recapture | (4 | ) | ||
| Total waivers and fees paid indirectly | (63 | ) | ||
| Total expenses, net | 1,451 | |||
| Net Investment Income | 646 | |||
| Net Realized Loss on Investments, Other Financial Instruments and Foreign Currency Transactions: | ||||
| Net realized gain on investments | 4,373 | |||
| Net realized loss on purchased option contracts | (837 | ) | ||
| Net realized loss on futures contracts | (2,443 | ) | ||
| Net realized gain on written option contracts | 19 | |||
| Net realized loss on swap contracts | (3,112 | ) | ||
| Net realized gain on foreign currency contracts | 1,747 | |||
| Net realized loss on other foreign currency transactions | (327 | ) | ||
| Net Realized Loss on Investments, Other Financial Instruments and Foreign Currency Transactions | (580 | ) | ||
| Net Changes in Unrealized Depreciation of Investments, Other Financial Instruments and Foreign Currency Transactions: | ||||
| Net unrealized depreciation of investments | (2,230 | ) | ||
| Net unrealized depreciation of purchased option contracts | (175 | ) | ||
| Net unrealized depreciation of futures contracts | (726 | ) | ||
| Net unrealized appreciation of written option contracts | 164 | |||
| Net unrealized depreciation of swap contracts | (942 | ) | ||
| Net unrealized appreciation of foreign currency contracts | 2,439 | |||
| Net unrealized depreciation of translation of other assets and liabilities in foreign currencies | (14 | ) | ||
| Net Changes in Unrealized Depreciation of Investments, Other Financial Instruments and Foreign Currency Transactions | (1,484 | ) | ||
| Net Loss on Investments, Other Financial Instruments and Foreign Currency Transactions | (2,064 | ) | ||
| Net Decrease in Net Assets Resulting from Operations | $ | (1,418 | ) |
The accompanying notes are an integral part of these financial statements.
| 24 |
| Hartford Real Total Return Fund |
| Statement of Changes in Net Assets |
| (000’s Omitted) |
| For the Period November 29, 2013* through October 31, 2014 | ||||
| Operations: | ||||
| Net investment income | $ | 646 | ||
| Net realized loss on investments, other financial instruments and foreign currency transactions | (580 | ) | ||
| Net unrealized depreciation of investments, other financial instruments and foreign currency transactions | (1,484 | ) | ||
| Net Decrease in Net Assets Resulting from Operations | (1,418 | ) | ||
| Capital Share Transactions: | ||||
| Class A | 622 | |||
| Class C | 123 | |||
| Class I | 137 | |||
| Class R3 | 100 | |||
| Class R4 | 100 | |||
| Class R5 | 100 | |||
| Class Y | 109,950 | |||
| Net increase from capital share transactions | 111,132 | |||
| Net Increase in Net Assets | 109,714 | |||
| Net Assets: | ||||
| Beginning of period | — | |||
| End of period | $ | 109,714 | ||
| Undistributed (distributions in excess of) net investment income | $ | (1,173 | ) | |
* Commencement of operations.
The accompanying notes are an integral part of these financial statements.
| 25 |
| Hartford Real Total Return Fund |
| Notes to Financial Statements |
| October 31, 2014 |
| (000’s Omitted) |
Organization:
The Hartford Mutual Funds, Inc. (“Company”) is an open-end management investment company comprised of forty-two portfolios. Financial statements for Hartford Real Total Return Fund (the "Fund"), a series of the Company, are included in this report.
The Company is organized under the laws of the State of Maryland and is registered with the Securities and Exchange Commission (“SEC”) under the Investment Company Act of 1940, as amended (“1940 Act”). The Fund is a diversified open-end management investment company. The Fund is an investment company and applies specialized accounting and reporting under Accounting Standards Codification Topic 946, Financial Services - Investment Companies.
Class A shares are sold with a front-end sales charge of up to 5.50%. Class C shares are sold with a contingent deferred sales charge of up to 1.00% on shares redeemed within twelve months of purchase. Class I shares are sold without sales charges to certain eligible investors primarily through advisory fee-based wrap programs. Class R3, R4 and R5 shares, which are offered to employer-sponsored retirement plans, and Class Y shares, which are sold to certain eligible institutional investors, are sold without a sales charge. All classes of shares have identical voting, redemption, dividend, liquidation and other rights and the same terms and conditions, with the exceptions that each class may have different expenses, which may affect performance.
Significant Accounting Policies:
The following is a summary of significant accounting policies of the Fund in the preparation of its financial statements, which are in accordance with United States generally accepted accounting principles (“U.S. GAAP”). The preparation of financial statements in accordance with U.S. GAAP may require management to make estimates and assumptions that affect the reported amounts of assets and liabilities and disclosure of contingent assets and liabilities at the date of the financial statements and the reported amounts of increases and decreases in net assets from operations during the reporting period. Actual results could differ from those estimates.
Determination of Net Asset Value – The per share net asset value ("NAV") of each class of the Fund's shares is determined as of the close of regular trading (normally 4:00 p.m. Eastern Time) (the “NYSE Close”) on each day that the New York Stock Exchange (the “Exchange”) is open (“Valuation Date”). Information that becomes known to the Fund after the NAV has been calculated on a particular day will not generally be used to retroactively adjust the NAV determined earlier that day.
Investment Valuation and Fair Value Measurements – For purposes of calculating the NAV, portfolio investments and other assets held by the Fund's portfolio for which market quotes are readily available are valued at market value. Market value is generally determined on the basis of last reported sales prices or official close price. If no sales are reported, market value is based on quotes obtained from a quotation reporting system, established market makers, or independent pricing services. If market prices are not readily available or are deemed unreliable, the Fund will use the fair value of the investment as determined in good faith under policies and procedures established by and under the supervision of the Company's Board of Directors. Market quotes are considered not readily available where there is an absence of current or reliable market-based data (e.g., trade information or indicative market quotes), including where events occur after the close of the relevant market, but prior to the NYSE Close, that materially affect the values of the Fund's portfolio investments or assets. In addition, market quotes are considered not readily available when, due to extraordinary circumstances, the exchanges or markets on which the investments trade do not open for trading for the entire day and no other market prices are available. In addition, prices of foreign equities that are principally traded on certain foreign markets may be adjusted daily pursuant to a fair value pricing service approved by the Board of Directors in order to reflect an adjustment for the factors occurring after the close of certain foreign markets but before the NYSE Close. Investments that are primarily traded on foreign markets may trade on days that are not business days of the Fund. The value of the foreign investments in which the Fund invests may change on days when a shareholder will not be able to purchase or redeem shares of the Fund. Fair value pricing is subjective in nature and the use of fair value pricing by the Fund may cause the NAV of its shares to differ significantly from the NAV that would have been calculated using market prices at the close of the exchange on which a portfolio investment is primarily traded. There can be no assurance that the Fund could obtain the fair market value assigned to an investment if the Fund were to sell the investment at approximately the time at which the Fund determines its NAV.
Fixed income investments (other than short-term obligations), non-exchange traded derivatives and centrally cleared swaps held by the Fund are normally valued on the basis of quotes obtained from independent pricing services or brokers and dealers in accordance
| 26 |
| Hartford Real Total Return Fund |
| Notes to Financial Statements – (continued) |
| October 31, 2014 |
| (000’s Omitted) |
with procedures established by the Company's Board of Directors. Prices obtained from independent pricing services use information provided by market makers or estimates of market values through accepted market modeling, trading and pricing conventions. Inputs to the models may include, but are not limited to, prepayment speeds, pricing spread, yield, trade information, dealer quotes, market color, cash flow models and the investment’s terms and conditions. Generally, the Fund may use fair valuation in regard to fixed income investments when the Fund holds defaulted or distressed investments or investments in a company in which a reorganization is pending. Short-term investments maturing in 60 days or less are generally valued at amortized cost, if their original term to maturity was 60 days or less, or by amortizing their value on the 61st day prior to maturity, if the original term to maturity exceeded 60 days, which approximates fair value.
Exchange traded options, futures and options on futures are valued at the settlement price or last trade price determined by the relevant exchange as of the NYSE Close. If the last trade price for exchange traded options does not fall between the bid and ask prices, the value will be the mean of the bid and ask prices as of the NYSE Close. If a last trade price is not available, the value will be the mean of the bid and ask prices as of the NYSE Close. If a mean of the bid and ask prices cannot be calculated for the day, the value will be the bid price as of the NYSE Close. In the case of over-the-counter ("OTC") options and such instruments that do not trade on an exchange, values may be supplied by a pricing service using a formula or other objective method that may take into consideration the style, direction, expiration, strike price, notional value and volatility or other special adjustments.
Investments valued in currencies other than U.S. dollars are converted to U.S. dollars using exchange rates obtained from independent pricing services for calculation of the NAV. As a result, the NAV of the Fund’s shares may be affected by changes in the value of currencies in relation to the U.S. dollar. The value of investments traded in markets outside the United States or denominated in currencies other than the U.S. dollar may be affected significantly on a day that the NYSE is closed and the market value may change on days when an investor is not able to purchase, redeem or exchange shares of the Fund.
Foreign currency contracts represent agreements to exchange currencies on specific future dates at predetermined rates. Foreign currency contracts are valued using foreign currency exchange rates and forward rates as provided by an independent pricing service on the Valuation Date.
Investments in open-end mutual funds are valued at the respective NAV of each open-end mutual fund on the Valuation Date.
Financial instruments for which prices are not available from an independent pricing service may be valued using market quotations obtained from one or more dealers that make markets in the respective financial instrument in accordance with procedures established by the Company's Board of Directors.
U.S. GAAP defines fair value as the price that the Fund would receive to sell an asset or pay to transfer a liability in an orderly transaction between market participants. The U.S. GAAP fair value measurement standards require disclosure of a fair value hierarchy for each major category of assets and liabilities. Various inputs are used in determining the fair value of the Fund’s investments. These inputs are summarized into three broad hierarchy levels. This hierarchy is based on whether the valuation inputs are observable or unobservable. These levels are:
Level 1 – Quoted prices in active markets for identical investments. Level 1 may include exchange traded instruments, such as domestic equities, some foreign equities, options, futures, mutual funds, exchange traded funds, rights and warrants.
Level 2 – Observable inputs other than Level 1 prices, such as quoted prices for similar investments; quoted prices in markets that are not active; or other inputs that are observable or can be corroborated by observable market data. Level 2 may include debt investments that are traded less frequently than exchange traded instruments and which are valued using independent pricing services; foreign equities, which are principally traded on certain foreign markets and are adjusted daily pursuant to a fair value pricing service in order to reflect an adjustment for the factors occurring after the close of certain foreign markets but before the NYSE Close; senior floating rate interests, which are valued using an aggregate of dealer bids; short-term investments, which are valued at amortized cost; and swaps, which are valued based upon the terms of each swap contract.
Level 3 – Significant unobservable inputs that are supported by limited or no market activity. Level 3 may include financial instruments whose values are determined using indicative market quotes or require significant management judgment or
| 27 |
| Hartford Real Total Return Fund |
| Notes to Financial Statements – (continued) |
| October 31, 2014 |
| (000’s Omitted) |
estimation. These unobservable valuation inputs may include estimates for current yields, maturity/duration, prepayment speed, and indicative market quotes for comparable investments along with other assumptions relating to credit quality, collateral value, complexity of the investment structure, general market conditions and liquidity. This category may include investments where trading has been halted or there are certain restrictions on trading. While these investments are priced using unobservable inputs, the valuation of these investments reflects the best available data and management believes the prices are a reasonable representation of exit price.
The Board of Directors of the Company generally reviews and approves the “Procedures for Valuation of Portfolio Securities” at least once a year. These procedures define how investments are to be valued, including the formation and activities of a Valuation Committee. The Valuation Committee is responsible for determining in good faith the fair value of investments when the value cannot be obtained from primary pricing services or alternative sources or if the valuation of an investment as provided by the primary pricing service or alternative source is believed not to reflect the investment’s fair value as of the Valuation Date. Voting members of the Valuation Committee include the Fund's Treasurer or designee and a Vice President of the investment manager or designee. An Assistant Vice President of the Fund with legal expertise or designee is also included on the Valuation Committee as a non-voting advisory member. In addition, the Fund’s Chief Compliance Officer shall designate a member of the compliance group to attend Valuation Committee meetings as a non-voting resource, to monitor for and provide guidance with respect to compliance with these procedures. Two members of the Valuation Committee or their designees, representing different departments, shall constitute a quorum for purposes of permitting the Valuation Committee to take action. The Valuation Committee will consider all relevant factors in determining an investment’s fair value, and may seek the advice of the Fund’s sub-adviser, knowledgeable brokers, and legal counsel in making such determination. The Valuation Committee reports to the Audit Committee of the Company's Board of Directors. The Audit Committee receives quarterly written reports which include details of all fair-valued investments, including the reason for the fair valuation, and an indication, when possible, of the accuracy of the valuation by disclosing the next available reliable public price quotation or the disposition price of such investments (the “look-back” test). The Board of Directors then must consider for ratification all of the fair value determinations made during the previous quarter.
Valuation levels are not necessarily indicative of the risk associated with investing in such investments. Individual investments within any of the above mentioned asset classes may be assigned a different hierarchical level than those presented above, as individual circumstances dictate.
For additional information, refer to the Investment Valuation Hierarchy Level Summary and the Level 3 roll-forward reconciliation, if applicable, which follow the Schedule of Investments.
Investment Transactions and Investment Income – Investment transactions are recorded as of the trade date (the date the order to buy or sell is executed) for financial reporting purposes. Investments purchased or sold on a when-issued or delayed-delivery basis may be settled a month or more after the trade date. Realized gains and losses are determined on the basis of identified cost.
Dividend income from domestic securities is accrued on the ex-dividend date. In general, dividend income from foreign securities is recorded on the ex-date; however, dividend notifications in certain foreign jurisdictions may not be available in a timely manner and as a result, the Fund will record the dividend as soon as the relevant details (i.e., rate per share, payment date, shareholders of record, etc.) are publicly available. Interest income, including amortization of premium, accretion of discounts and additional principal received in-kind in lieu of cash, is accrued on a daily basis.
Foreign Currency Transactions – Assets and liabilities denominated in currencies other than U.S. dollars are translated into U.S. dollars at the exchange rates in effect on the valuation date. Purchases and sales of investments, income and expenses are translated into U.S. dollars at the exchange rates on the dates of such transactions.
The Fund does not isolate that portion of portfolio investment valuation resulting from fluctuations in the foreign currency exchange rates from the fluctuations arising from changes in the market prices of investments held. Exchange rate fluctuations are included with the net realized and unrealized gain or loss on investments in the accompanying financial statements.
| 28 |
| Hartford Real Total Return Fund |
| Notes to Financial Statements – (continued) |
| October 31, 2014 |
| (000’s Omitted) |
Net realized foreign exchange gains or losses arise from sales of foreign currencies and the difference between asset and liability amounts initially stated in foreign currencies and the U.S. dollar value of the amounts actually received or paid. Net unrealized foreign exchange gains or losses arise from changes in the value of other assets and liabilities at the end of the reporting period, resulting from changes in the exchange rates.
Joint Trading Account – The Fund may invest cash balances into a joint trading account that may be invested in one or more repurchase agreements.
Fund Share Valuation and Dividend Distributions to Shareholders – Orders for the Fund’s shares are executed in accordance with the investment instructions of the shareholders. The NAV of the Fund’s shares is determined as of the close of business on each business day of the Exchange. The NAV is determined separately for each class of shares of the Fund by dividing the Fund’s net assets attributable to that class by the number of shares of the class outstanding. Each class of shares offered by the Fund has equal rights as to assets and voting privileges (except that shareholders of a class have exclusive voting rights regarding any matter relating solely to that class of shares). Income and non-class specific expenses are allocated daily to each class on the basis of the relative net assets of the class. Realized and unrealized gains and losses are allocated daily based on the relative net assets of each class of shares of the Fund.
Orders for the purchase of the Fund’s shares received prior to the close of the Exchange on any day the Exchange is open for business are priced at the NAV determined as of the close of the Exchange. Orders received after the close of the Exchange, or on a day on which the Exchange and/or the Fund is not open for business, are priced at the next determined NAV.
Dividends are declared pursuant to a policy adopted by the Company's Board of Directors based upon the investment performance of the Fund. The policy of the Fund is to pay dividends from net investment income and realized gains, if any, at least once a year.
Net investment income, dividends and distributions from net realized gains and capital are determined in accordance with federal income tax regulations, which may differ from U.S. GAAP with respect to character and timing (see Federal Income Taxes: Distributions and Components of Distributable Earnings and Reclassification of Capital Accounts).
Securities and Other Investments:
Repurchase Agreements – A repurchase agreement is an agreement by which a counterparty agrees to sell an investment and agrees to repurchase the investment sold from the buyer at a mutually agreed upon time and price. During the period of the repurchase agreement, the counterparty will deposit cash and or securities in a third party custodial account to serve as collateral. At the time the Fund enters into a repurchase agreement, the value of the underlying collateral, including accrued interest, will be equal to or exceed the value of the repurchase agreement. Repurchase agreements expose the Fund to counterparty risk - that is, the risk that the counterparty will not fulfill its obligations. To minimize counterparty risk, the investments that serve to collateralize the repurchase agreement are held by the Fund’s custodian in book entry or physical form in the custodial account of the Fund or in a third party custodial account. Repurchase agreements are valued at cost plus accrued interest, which approximates fair value. Repurchase agreements have master netting arrangements which allow the Fund to offset amounts owed to a counterparty with amounts owed by the counterparty, including any collateral. Upon an event of default under a master repurchase agreement, the non-defaulting party may close out all transactions traded under such agreement and net amounts owed under each transaction to one net amount payable by one party to the other. Absent an event of default, the master repurchase agreement does not result in an offset of reported amounts of assets and liabilities in the Statement of Assets and Liabilities across transactions between the Fund and the applicable counterparty. The Fund, as shown on the Schedule of Investments, had outstanding repurchase agreements and related collateral as of October 31, 2014.
Illiquid and Restricted Investments – The Fund is permitted to invest up to 15% of its net assets in illiquid investments. Illiquid investments are those that may not be sold or disposed of in the ordinary course of business within seven days, at approximately the price used to determine the Fund’s NAV. The Fund may not be able to sell illiquid investments when its sub-adviser considers it desirable to do so or may have to sell such investments at a price that is lower than the price that could be obtained if the investments were more liquid. A sale of illiquid investments may require more time and may result in higher dealer discounts and other selling expenses than does the sale of those that are liquid. Illiquid investments also may be more difficult to value due to the unavailability of
| 29 |
| Hartford Real Total Return Fund |
| Notes to Financial Statements – (continued) |
| October 31, 2014 |
| (000’s Omitted) |
reliable market quotations for such investments, and an investment in them may have an adverse impact on the Fund’s NAV. The Fund may also purchase certain restricted investments that can only be resold to certain qualified investors and may be determined to be liquid pursuant to policies and guidelines established by the Company's Board of Directors. The Fund, as shown on the Schedule of Investments, had illiquid or restricted investments as of October 31, 2014.
Investments Purchased on a When-Issued or Delayed-Delivery Basis – Delivery and payment for investments that have been purchased by the Fund on a forward commitment, or when-issued or delayed-delivery basis, take place beyond the customary settlement period. The Fund may dispose of or renegotiate a delayed-delivery transaction after it is entered into, and may sell delayed-delivery investments before they are delivered, which may result in a realized gain or loss. During this period, such investments are subject to market fluctuations, and the Fund identifies investments segregated in its records with a value at least equal to the amount of the commitment. The Fund, as shown on the Schedule of Investments, had when-issued or delayed-delivery investments as of October 31, 2014.
Inflation Indexed Bonds – The Fund may invest in inflation indexed bonds. Inflation indexed bonds are fixed income investments whose principal value is periodically adjusted to the rate of inflation. The interest rate on these bonds is generally fixed at issuance at a rate lower than typical bonds. Over the life of an inflation indexed bond, however, interest will be paid based on a principal value, which is adjusted for inflation. Any increase or decrease in the principal amount of an inflation indexed bond will be included as interest income on the Statement of Operations, even though investors do not receive the principal amount until maturity. The Fund, as shown on the Schedule of Investments, had inflation indexed bonds as of October 31, 2014.
Financial Derivative Instruments:
The following disclosures contain information on how and why the Fund uses derivative instruments, the credit-risk-related contingent features in certain derivative instruments and how derivative instruments affect the Fund’s financial position and results of operations. The location and fair value amounts of these instruments on the Statement of Assets and Liabilities and the realized gains and losses and changes in unrealized gains and losses on the Statement of Operations, each categorized by type of derivative contract, are included in the following Additional Derivative Instrument Information footnote. The derivative instruments outstanding as of period-end are disclosed in the notes to the Schedule of Investments, if applicable. The amounts of realized gains and losses and changes in unrealized gains and losses on derivative instruments during the period are disclosed in the Statement of Operations.
Foreign Currency Contracts – The Fund may enter into foreign currency contracts that obligate the Fund to purchase or sell currencies at specified future dates. Foreign currency contracts are used to hedge the currency exposure associated with some or all of the Fund’s investments and/or as part of an investment strategy. Foreign currency contracts are marked to market daily and the change in value is recorded by the Fund as an unrealized gain or loss. The Fund will record a realized gain or loss when the foreign currency contract is settled.
Foreign currency contracts involve elements of market risk in excess of the amounts reflected in the Statement of Assets and Liabilities. In addition, risks may arise upon entering into these contracts from the potential inability of the counterparties to meet the terms of the contracts and from unanticipated movements in the value of the foreign currencies relative to the U.S. dollar. The Fund, as shown on the Schedule of Investments, had outstanding foreign currency contracts as of October 31, 2014.
Futures Contracts – The Fund may enter into futures contracts. A futures contract is an agreement between two parties to buy or sell an asset at a set price on a future date. The Fund uses futures contracts to manage or obtain exposure to the investment markets, commodities, or movements in interest rates and currency values. The primary risks associated with the use of futures contracts are the imperfect correlation between the change in market value of the investments held by the Fund and the prices of futures contracts and the possibility of an illiquid market. Upon entering into a futures contract, the Fund is required to deposit with a futures commission merchant (“FCM”) an amount of cash or U.S. Government or Agency Obligations in accordance with the initial margin requirements of the broker or exchange. Futures contracts are marked to market daily at the most recent settlement price reported by an exchange on which, over time, they are traded most extensively, and an appropriate payable or receivable for the change in value (“variation margin”) is recorded by the Fund. Gains or losses are recognized but not considered realized until the contracts expire or are closed. Futures contracts involve, to varying degrees, risk of loss in excess of the variation margin disclosed on the Statement of
| 30 |
| Hartford Real Total Return Fund |
| Notes to Financial Statements – (continued) |
| October 31, 2014 |
| (000’s Omitted) |
Assets and Liabilities; however, the Fund seeks to reduce this risk through the use of an FCM. The Fund, as shown on the Schedule of Investments, had outstanding futures contracts as of October 31, 2014.
Options Contracts – An option contract is a contract sold by one party to another party that offers the buyer the right, but not the obligation, to buy (call) or sell (put) an investment or other financial asset at an agreed-upon price during a specific period of time or on a specific date. Options contracts are either privately negotiated in the over-the-counter market ("OTC options") or executed in a registered exchange ("exchange traded options"). The Fund may write (sell) covered call and put options on futures, swaps (“swaptions”), securities, commodities or currencies. “Covered” means that so long as the Fund is obligated as the writer of an option, it will own either the underlying investments or currency or an option to purchase the same underlying investments or currency having an expiration date of the covered option and an exercise price equal to or less than the exercise price of the covered option, or will pledge cash or other liquid investments having a value equal to or greater than the fluctuating market value of the option investment or currency. Writing put options increases the Fund’s exposure to the underlying instrument. Writing call options decreases the Fund’s exposure to the underlying instrument. Premiums received from writing options that expire are treated as realized gains. Premiums received from writing options that are exercised or closed are added to the proceeds or offset amounts paid on the underlying futures, swap, investment or currency transaction to determine the realized gain or loss. The Fund as a writer of an option has no control over whether the underlying instrument may be sold (call) or purchased (put) and as a result bears the market risk of an unfavorable change in the price of the instrument underlying the written option. There is the risk the Fund may not be able to enter into a closing transaction because of an illiquid market. The Fund may also purchase put and call options. Purchasing call options increases the Fund’s exposure to the underlying instrument. Purchasing put options decreases the Fund’s exposure to the underlying instrument. The Fund pays a premium, which is included on the Fund’s Statement of Assets and Liabilities as an investment and is subsequently marked to market to reflect the current value of the option. Premiums paid for purchasing options that expire are treated as realized losses. Certain options may be purchased with premiums to be determined on a future date. The premiums for these options are based upon implied volatility parameters at specified terms. The risk associated with purchasing put and call options is generally limited to the premium paid. Premiums paid for purchasing options that are exercised or closed are added to the amounts paid or offset against the proceeds on the underlying investment transaction to determine the realized gain or loss. Entering into over-the-counter options also exposes the Fund to counterparty risk. Counterparty risk is the possibility that the counterparty to the agreements may default on its obligation to perform or disagree as to the meaning of the contractual terms in the agreements.
The Fund, as shown on the Schedule of Investments, had outstanding purchased and written option contracts as of October 31, 2014. Transactions involving written option contracts during the period ended October 31, 2014, are summarized below:
Options Contract Activity During the Period November 29, 2013, (commencement of operations), through October 31, 2014:
| Call Options Written During the Period | Number of Contracts* | Premium Amounts | ||||||
| Beginning of the period | — | $ | — | |||||
| Written | 3,578,713 | 847 | ||||||
| Expired | (3,492 | ) | (139 | ) | ||||
| Closed | (15,204 | ) | (620 | ) | ||||
| Exercised | (17 | ) | (6 | ) | ||||
| End of period | 3,560,000 | $ | 82 | |||||
| Put Options Written During the Year | Number of Contracts* | Premium Amounts | ||||||
| Beginning of the period | — | $ | — | |||||
| Written | 5,475,140 | 2,347 | ||||||
| Expired | (680,863 | ) | (300 | ) | ||||
| Closed | (801,596 | ) | (1,710 | ) | ||||
| Exercised | (87 | ) | (17 | ) | ||||
| End of period | 3,992,594 | $ | 320 | |||||
* The number of contracts does not omit 000's.
Swap Contracts – The Fund may invest in swap contracts. Swap contracts are agreements to exchange or swap investment cash flows, assets, foreign currencies or market-linked returns at specified, future intervals. Swap contracts are either privately negotiated in the over-the-counter market (“OTC swaps”) or cleared in a central clearing house (“centrally cleared swaps”). The Fund may enter into credit default, total return, cross-currency, interest rate, inflation and other forms of swap contracts to manage its exposure to credit, currency, interest rate, commodity and inflation risk. Swap contracts are also used to gain exposure to certain markets. In
| 31 |
| Hartford Real Total Return Fund |
| Notes to Financial Statements – (continued) |
| October 31, 2014 |
| (000’s Omitted) |
connection with these contracts, investments or cash may be identified as collateral or margin in accordance with the terms of the respective swap contracts and/or master netting arrangement to provide assets of value and recourse in the event of default or bankruptcy/insolvency.
Swaps are valued based on custom valuations furnished by an independent pricing service. Swaps for which prices are not available from an independent pricing service are valued in accordance with procedures established by the Company's Board of Directors. Changes in market value, if any, are reflected as a component of net changes in unrealized appreciation or depreciation on the Statement of Operations. Daily changes in valuation of centrally cleared swaps, if any, are recorded as a receivable or payable for the change in value (“variation margin”) on the Statement of Assets and Liabilities. Realized gains or losses on centrally cleared swaps are recorded upon the termination of the swap. OTC swap payments received or paid at the beginning of the measurement period are reflected as such on the Statement of Assets and Liabilities and represent premiums paid or received upon entering into the swap contract to compensate for differences between the stated terms of the swap contract and prevailing market conditions (credit spreads, currency exchange rates, interest rates and other relevant factors). These upfront premiums are recorded as realized gains or losses on the Statement of Operations upon termination or maturity of the swap. A liquidation payment received or made at the termination or maturity of the swap is recorded as a realized gain or loss on the Statement of Operations. Net periodic payments received or paid by the Fund are included as part of realized gains or losses on the Statement of Operations.
Entering into these contracts involves, to varying degrees, elements of liquidation, counterparty, credit and market risk in excess of the amounts recognized on the Statement of Assets and Liabilities. Such risks involve the possibility that there will be no liquid market for these contracts, that the counterparty to the contracts may default on its obligation to perform or disagree as to the meaning of contractual terms in the contracts, and that there may be unfavorable changes in market conditions (credit spreads, currency exchange rates, interest rates and other relevant factors).
The Fund’s maximum risk of loss from counterparty risk for OTC swaps is the net value of the discounted cash flows to be received from the counterparty over the contract’s remaining life, and current market value, to the extent that amount is positive. The risk is mitigated by having a master netting arrangement between the Fund and the counterparty, which allows for the netting of payments made or received (although such amounts are presented on a gross basis within the Statement of Assets and Liabilities, as applicable) as well as the posting of collateral to the Fund to cover the Fund’s exposure to the counterparty. In a centrally cleared swap, while the Fund enters into an agreement with a clearing broker to execute contracts with a counterparty, the performance of the swap is guaranteed by the central clearinghouse, which reduces the Fund’s exposure to counterparty risk. The Fund is still exposed to the counterparty risk through the clearing broker and clearinghouse. The clearinghouse attempts to minimize this risk to its participants through the use of mandatory margin requirements, daily cash settlements and other procedures. Likewise, the clearing broker reduces its risk through margin requirements and required segregation of customer balances.
Credit Default Swap Contracts – The credit default swap market allows the Fund to manage its exposure to the market or certain sectors of the market, to reduce its risk exposure to defaults of corporate and sovereign issuers, or to create exposure to corporate or sovereign issuers to which it is not otherwise exposed. Certain credit default swaps involve the exchange of a fixed rate premium for protection against the loss in value of an underlying investment or index in the event of a credit event, such as payment default or bankruptcy.
Under a credit default swap contract, one party acts as guarantor by receiving the fixed periodic payment in exchange for the commitment to purchase the underlying investment at par if the defined credit event occurs. Upon the occurrence of a defined credit event, the difference between the value of the reference obligation and the swap’s notional amount is recorded as realized gain or loss on swap transactions in the Statement of Operations. A “buyer” of credit protection agrees to pay a counterparty to assume the credit risk of an issuer upon the occurrence of certain events. The “seller” of the protection receives periodic payments and agrees to assume the credit risk of an issuer upon the occurrence of certain events. Although specified events are contract specific, credit events are generally defined as bankruptcy, failure to pay, restructuring, obligation acceleration, obligation default or repudiation/moratorium. A “seller’s” exposure is limited to the total notional amount of the credit default swap contract. These potential amounts would be partially offset by any recovery values of the respective referenced obligations or upfront payments received upon entering into the contract.
| 32 |
| Hartford Real Total Return Fund |
| Notes to Financial Statements – (continued) |
| October 31, 2014 |
| (000’s Omitted) |
Implied credit spreads, represented in absolute terms, utilized in determining the market value of credit default swap contracts on corporate issues, sovereign government issues or U.S. municipal issues as of period-end are disclosed in the notes to the Schedule of Investments, as applicable, and serve as an indicator of the current status of the payment/performance risk and represent the likelihood or risk of default for the credit derivative. The implied credit spread of a particular referenced entity reflects the cost of buying/selling protection and there may also be upfront payments required to be made to enter into the contract. Wider credit spreads represent a deterioration of the referenced entity’s credit soundness and a greater likelihood or risk of default or other credit event occurring as defined under the terms of the contract. For credit default swap contracts on credit indices, the quoted market prices and resulting values serve as the indicator of the current status of the payment/performance risk. Increasing market values, in absolute terms when compared to the notional amount of the swap, represent a deterioration of the referenced equity’s credit soundness and a greater likelihood or risk of default or other credit event occurring as defined under the terms of the contract. The Fund, as shown on the Schedule of Investments, had outstanding credit default swap contracts as of October 31, 2014.
Interest Rate Swap Contracts – The Fund is subject to interest rate risk exposure in the normal course of pursuing its investment objectives. Because the Fund holds fixed rate bonds, the value of these bonds may decrease if interest rates rise. To hedge against this risk and to maintain its ability to generate income at prevailing market rates, the Fund may enter into interest rate swap contracts. In a typical interest rate swap, one party agrees to make regular payments equal to a floating interest rate, based on a specified interest rate or benchmark (e.g. London Interbank Offered Rate (“LIBOR”)), multiplied by a notional amount, in return for payments equal to a fixed rate multiplied by the same amount, for a specific period of time. The net interest received or paid on interest rate swap contracts is recorded as a realized gain or loss. Interest rate swaps are marked to market daily and the change, if any, is recorded as an unrealized gain or loss in the Statement of Operations. When the interest rate swap contract is terminated early, the Fund records a realized gain or loss equal to the difference between the current market value and the upfront premium or cost.
If an interest rate swap contract provides for payments in different currencies, the parties might agree to exchange the notional amount as well. Interest rate swaps may also depend on other prices or rates, such as the value of an index. The risks of interest rate swaps include changes in market conditions which will affect the value of the contract or the cash flows and the possible inability of the counterparty to fulfill its obligations under the contract. The Fund’s maximum risk of loss from counterparty credit risk is the discounted net value of the cash flows to be received from the counterparty over the contract’s remaining life, to the extent that amount is positive. The Fund had no outstanding interest rate swap contracts as of October 31, 2014.
Total Return Swap Contracts – The Fund may invest in total return swap contracts. An investment in a total return swap allows the Fund to gain or mitigate exposure to underlying referenced securities, indices or commodities. Total return swap contracts involve commitments where cash flows are exchanged based on the price of underlying securities, indices or commodities and based on a fixed or variable rate. One party would receive payments based on the price appreciation or depreciation of a commodity index, a portion of the index, or a single commodity in exchange for paying to or receiving from the counterparty seller an agreed-upon rate, which can be fixed or variable. A variable rate may be correlated to a base rate, such as the LIBOR, and is adjusted each reset period, which are defined at the beginning of the contract. Therefore, if interest rates increase over the term of the swap contract, the party paying the rate may be required to pay a higher rate at each swap reset date.
Total return swap contracts on indices involve commitments to pay interest in exchange for a market-linked return. One party pays out the total return of a specific reference asset, which may be an equity, index, or bond, and in return receives a regular stream of payments. To the extent the total return of the security or index underlying the transaction exceeds or falls short of the offsetting interest rate obligation, the Fund will receive a payment from or make a payment to the counterparty. The Fund, as shown on the Schedule of Investments, had outstanding total return swap contracts as of October 31, 2014.
| 33 |
| Hartford Real Total Return Fund |
| Notes to Financial Statements – (continued) |
| October 31, 2014 |
| (000’s Omitted) |
Additional Derivative Instrument Information:
Fair Value of Derivative Instruments on the Statement of Assets and Liabilities as of October 31, 2014:
| Risk Exposure Category | ||||||||||||||||||||||||||||
| Interest
Rate Contracts | Foreign Exchange Contracts | Credit Contracts | Equity Contracts | Commodity Contracts | Other Contracts | Total | ||||||||||||||||||||||
| Assets: | ||||||||||||||||||||||||||||
| Investments in securities, at value (purchased option contracts), market value | $ | — | $ | — | $ | — | $ | 162 | $ | — | $ | — | $ | 162 | ||||||||||||||
| Unrealized appreciation on foreign currency contracts | — | 3,558 | — | — | — | — | 3,558 | |||||||||||||||||||||
| Unrealized appreciation on OTC swap contracts | — | — | 6 | 59 | — | — | 65 | |||||||||||||||||||||
| Variation margin receivable * | 29 | — | — | 917 | — | — | 946 | |||||||||||||||||||||
| Total | $ | 29 | $ | 3,558 | $ | 6 | $ | 1,138 | $ | — | $ | — | $ | 4,731 | ||||||||||||||
| Liabilities: | ||||||||||||||||||||||||||||
| Unrealized depreciation on foreign currency contracts | $ | — | $ | 1,119 | $ | — | $ | — | $ | — | $ | — | $ | 1,119 | ||||||||||||||
| Unrealized depreciation on OTC swap contracts | — | — | — | 974 | — | — | 974 | |||||||||||||||||||||
| Variation margin payable * | 80 | — | 12 | 1,074 | — | — | 1,166 | |||||||||||||||||||||
| Written option contracts, market value | — | 94 | — | 144 | — | — | 238 | |||||||||||||||||||||
| Total | $ | 80 | $ | 1,213 | $ | 12 | $ | 2,192 | $ | — | $ | — | $ | 3,497 | ||||||||||||||
* Only current day's variation margin is reported within the Statement of Assets and Liabilities. The variation margin is included in the open futures net cumulative depreciation of $(726) and open centrally cleared swaps net cumulative depreciation of $(33) as reported in the Schedule of Investments.
The volume of derivatives that is presented in the Schedule of Investments is consistent with the derivative activity during the period November 29, 2013 through October 31, 2014.
The Effect of Derivative Instruments on the Statement of Operations for the period November 29, 2013 (commencement of operations) through October 31, 2014:
| Risk Exposure Category | ||||||||||||||||||||||||||||
| Interest Rate Contracts | Foreign Exchange Contracts | Credit Contracts | Equity Contracts | Commodity Contracts | Other Contracts | Total | ||||||||||||||||||||||
| Realized Gain (Loss) on Derivatives Recognized as a Result of Operations: | ||||||||||||||||||||||||||||
| Net realized loss on purchased option contracts | $ | (115 | ) | $ | (39 | ) | $ | — | $ | (683 | ) | $ | — | $ | — | $ | (837 | ) | ||||||||||
| Net realized gain (loss) on futures contracts | 1,481 | — | — | (3,927 | ) | 3 | — | (2,443 | ) | |||||||||||||||||||
| Net realized gain on written option contracts | 19 | — | — | — | — | — | 19 | |||||||||||||||||||||
| Net realized loss on swap contracts | (868 | ) | — | (180 | ) | (2,064 | ) | — | — | (3,112 | ) | |||||||||||||||||
| Net realized gain on foreign currency contracts | — | 1,747 | — | — | — | — | 1,747 | |||||||||||||||||||||
| Total | $ | 517 | $ | 1,708 | $ | (180 | ) | $ | (6,674 | ) | $ | 3 | $ | — | $ | (4,626 | ) | |||||||||||
| Net Change in Unrealized Appreciation (Depreciation) on Derivatives Recognized as a Result of Operations: | ||||||||||||||||||||||||||||
| Net change in unrealized depreciation of purchased option contracts | $ | — | $ | (24 | ) | $ | — | $ | (151 | ) | $ | — | $ | — | $ | (175 | ) | |||||||||||
| Net change in unrealized appreciation (depreciation) of futures contracts | 113 | — | — | (839 | ) | — | — | (726 | ) | |||||||||||||||||||
| Net change in unrealized appreciation of written option contracts | — | 75 | — | 89 | — | — | 164 | |||||||||||||||||||||
| Net change in unrealized depreciation of swap contracts | — | — | (27 | ) | (915 | ) | — | — | (942 | ) | ||||||||||||||||||
| Net change in unrealized appreciation of foreign currency contracts | — | 2,439 | — | — | — | — | 2,439 | |||||||||||||||||||||
| Total | $ | 113 | $ | 2,490 | $ | (27 | ) | $ | (1,816 | ) | $ | — | $ | — | $ | 760 | ||||||||||||
Balance Sheet Offsetting Information - The following discloses both gross information and net information about instruments and transactions eligible for offset in the financial statements, and instruments and transactions that are subject to a master netting arrangement, as well as amounts related to margin, reflected as financial collateral (including cash collateral), held at clearing brokers,
| 34 |
| Hartford Real Total Return Fund |
| Notes to Financial Statements – (continued) |
| October 31, 2014 |
| (000’s Omitted) |
counterparties and the Fund’s custodian. The master netting arrangements allow the clearing brokers to net any collateral held in or on behalf of the Fund, or liabilities or payment obligations of the clearing brokers to the Fund, against any liabilities or payment obligations of the Fund to the clearing brokers. The Fund is required to deposit financial collateral (including cash collateral) at the FCM's custodian on behalf of clearing brokers and counterparties to continually meet the original and maintenance requirements established by the clearing brokers and counterparties. Such requirements are specific to the respective clearing broker or counterparty. Certain master netting arrangements may not be enforceable in the bankruptcy proceedings of a counterparty.
| Offsetting of Financial Assets and Derivative Assets as of October 31, 2014: | ||||||||||||||||||||
| Gross
Amounts* of Assets Presented in Statement of Assets and Liabilities | Financial Instruments with Allowable Netting | Non-cash Collateral Received | Cash
Collateral Received | Net
Amount (not less than $0) | ||||||||||||||||
| Description | ||||||||||||||||||||
| OTC purchased option and OTC swap contracts at market value | $ | 121 | $ | (97 | ) | $ | — | $ | — | † | $ | 24 | ||||||||
| Futures contracts - variation margin receivable | 946 | (946 | ) | — | — | — | ||||||||||||||
| Unrealized appreciation on foreign currency contracts | 3,556 | (913 | ) | — | — | 2,643 | ||||||||||||||
| Total subject to a master netting or similar arrangement | $ | 4,623 | $ | (1,956 | ) | $ | — | $ | — | $ | 2,667 | |||||||||
* Gross amounts are presented here as there are no amounts that are netted within the Statement of Assets and Liabilities.
† An additional $53 of cash collateral was recevied by the Fund related to derivative liabilities.
| Offsetting of Financial Liabilities and Derivative Liabilities as of October 31, 2014: | ||||||||||||||||||||
| Gross
Amounts* of Liabilities Presented in Statement of Assets and Liabilities | Financial Instruments with Allowable Netting | Non-cash Collateral Pledged | Cash
Collateral Pledged | Net
Amount (not less than $0) | ||||||||||||||||
| Description | ||||||||||||||||||||
| OTC written option and OTC swap contracts at market value | $ | 1,102 | $ | (97 | ) | $ | — | $ | (260 | ) | $ | 745 | ||||||||
| Futures contracts - variation margin payable | 1,154 | (946 | ) | (7,050 | ) | — | — | |||||||||||||
| Swaps contracts - variation margin payable | 12 | — | — | (139 | ) | — | ||||||||||||||
| Unrealized depreciation on foreign currency contracts | 1,118 | (913 | ) | — | — | 205 | ||||||||||||||
| Total subject to a master netting or similar arrangement | $ | 3,386 | $ | (1,956 | ) | $ | (7,050 | ) | $ | (399 | ) | $ | 950 | |||||||
* Gross amounts are presented here as there are no amounts that are netted within the Statement of Assets and Liabilities.
Certain derivatives held by the Fund, as of October 31, 2014, are not subject to a master netting arrangement and are excluded from the table above.
Principal Risks:
Credit risk depends largely on the perceived financial health of bond issuers. In general, the credit rating is inversely related to the credit risk of the issuer. Higher rated bonds generally are deemed to have less credit risk, while lower or unrated bonds are deemed to have higher risk of default. The share price, yield and total return of a fund that holds securities with higher credit risk may be more volatile than those of a fund that holds bonds with lower credit risk. Similar to credit risk, the Fund may be exposed to counterparty risk, or the risk that an institution or other entity with which the Fund has unsettled or open transactions will default.
The Fund’s investments expose the Fund to various risks including, but not limited to, interest rate, prepayment, extension, foreign currency and equity risks. Interest rate risk is the risk that fixed income securities will decline in value because of changes in interest rates. As nominal interest rates rise, the values of certain fixed income securities held by the Fund are likely to decrease. A nominal interest rate can be described as the sum of a real interest rate and an expected inflation rate. Fixed income securities with longer durations tend to be more sensitive to changes in interest rates, usually making them more volatile than securities with shorter durations. Duration is useful primarily as a measure of the sensitivity of a fixed income security’s market price to interest rate (i.e.,
| 35 |
| Hartford Real Total Return Fund |
| Notes to Financial Statements – (continued) |
| October 31, 2014 |
| (000’s Omitted) |
yield) movements. Rising interest rates may cause prepayments to occur at a slower than expected rate, thereby effectively lengthening the maturity of the security and making the security more sensitive to interest rate changes. Prepayment and extension risk are major risks of mortgage backed securities and certain asset backed securities. For certain asset backed securities, the actual maturity may be less than the stated maturity shown in the Schedule of Investments, if applicable. As a result, the timing of income recognition relating to these securities may vary based upon the actual maturity.
If the Fund invests directly in foreign currencies or in securities that trade in, and receive revenues in, foreign currencies, or in derivatives that provide exposure to foreign currencies, it will be subject to the risk that those currencies will decline in value relative to the base currency (U.S. dollars) of the Fund, or, in the case of hedging positions, that the Fund’s base currency will decline in value relative to the currency being hedged. Currency rates in foreign countries may fluctuate significantly over short periods of time for a number of reasons, including changes in interest rates, intervention (or the failure to intervene) by U.S. or foreign governments, central banks or supranational entities, such as the International Monetary Fund, or by the imposition of currency controls or other political developments in the United States or abroad. As a result, the Fund’s investments in foreign currency denominated securities may reduce the returns of the Fund. The market values of equity securities, such as common stocks and preferred stocks, or equity related investments, such as futures and options, may decline due to general market conditions which are not specifically related to a particular company, such as real or perceived adverse economic conditions, changes in the general outlook for corporate earnings, changes in interest or currency rates or adverse investor sentiment generally. The market value of equity securities may also decline due to factors which affect a particular industry or industries, such as labor shortages or increased production costs and competitive conditions within an industry. Equity securities and equity related investments generally have greater market price volatility than fixed income securities.
Federal Income Taxes:
Federal Income Taxes – For federal income tax purposes, the Fund intends to continue to qualify as a Regulated Investment Company ("RIC") under Subchapter M of the Internal Revenue Code (“IRC”) by distributing substantially all of its taxable net investment income and net realized capital gains to its shareholders and otherwise complying with the requirements of the IRC. The Fund has distributed substantially all of its income and capital gains in prior years, if applicable, and intends to distribute substantially all of its income and capital gains during the calendar year ending December 31, 2014. Accordingly, no provision for federal income or excise taxes has been made in the accompanying financial statements. Distributions from short-term capital gains are treated as ordinary income distributions for federal income tax purposes.
Net Investment Income (Loss), Net Realized Gains (Losses) and Distributions – Net investment income (loss) and net realized gains (losses) may differ for financial statement and tax purposes primarily because of losses deferred due to wash sale adjustments, foreign currency gains and losses, adjustments related to Passive Foreign Investment Companies ("PFICs"), Real Estate Investment Trusts ("REITs"), RICs, certain derivatives and partnerships. The character of distributions made during the year from net investment income or net realized gains may differ from their ultimate characterization for federal income tax purposes. Also, due to the timing of dividend distributions, the fiscal year in which amounts are distributed may differ from the year that the income or realized gains (losses) were recorded by the Fund.
Components of Distributable Earnings – The Fund’s components of distributable earnings (deficit) on a tax basis at October 31, 2014, are as follows:
| Amount | ||||
| Undistributed Ordinary Income | $ | 30 | ||
| Undistributed Long-Term Capital Gain | 3,494 | |||
| Accumulated Capital Losses | (1,630 | ) | ||
| Unrealized Depreciation* | (4,288 | ) | ||
| Total Accumulated Deficit | $ | (2,394 | ) | |
| * | Differences between book-basis and tax-basis unrealized appreciation (depreciation) may be attributable to the losses deferred due to wash sale adjustments, foreign currency gains and losses, adjustments related to PFICs, REITs, RICs, certain derivatives and partnerships. |
| 36 |
| Hartford Real Total Return Fund |
| Notes to Financial Statements – (continued) |
| October 31, 2014 |
| (000’s Omitted) |
Reclassification of Capital Accounts – The Fund may record reclassifications in its capital accounts. These reclassifications have no impact on the total net assets of the Fund. The reclassifications are a result of permanent differences between U.S. GAAP and tax accounting for such items as foreign currency, PFICs, expiration or utilization of capital loss carryforwards or net operating losses. Adjustments are made to reflect the impact these items have on current and future distributions to shareholders. Therefore, the source of the Fund’s distributions may be shown in the accompanying Statement of Changes in Net Assets as from undistributed net investment income, from accumulated net realized gains on investments or from capital depending on the type of book and tax differences that exist. For the period ended October 31, 2014, the Fund recorded reclassifications to increase (decrease) the accounts listed below:
| Amount | ||||
| Undistributed Net Investment Income (Loss) | $ | (1,819 | ) | |
| Accumulated Net Realized Gain (Loss) | 1,841 | |||
| Capital Stock and Paid-in-Capital | (22 | ) | ||
Capital Loss Carryforward – Under the Regulated Investment Company Modernization Act of 2010 funds are permitted to carry forward capital losses for an unlimited period. Additionally, capital loss carryforwards retain their character as either short-term or long-term capital losses rather than being considered all short-term as permitted under prior regulation.
The Fund had no capital loss carryforward for U.S. federal income tax purposes as of October 31, 2014.
As of October 31, 2014, the Fund elected to defer the following Late-Year Ordinary Losses:
| Amount | ||||
| Ordinary Income | $ | 1,630 | ||
Accounting for Uncertainty in Income Taxes – The Fund has adopted financial reporting rules that require the Fund to analyze all open tax years, as defined by the statute of limitations, for all major jurisdictions. Generally, tax authorities can examine all tax returns filed for the last three years. The Fund does not have an examination in progress.
The Fund is also not aware of any tax positions for which it is reasonably possible that the total amounts of unrecognized tax benefits will significantly change in the next twelve months.
Expenses:
Investment Management Agreement – Hartford Funds Management Company, LLC ("HFMC") serves as the Fund’s investment manager pursuant to an Investment Management Agreement with the Company. HFMC is an indirect wholly owned subsidiary of The Hartford Financial Services Group, Inc. ("The Hartford"). The investment manager has overall investment supervisory responsibility for the Fund. In addition, the investment manager provides administrative personnel, services, equipment, facilities and office space for proper operation of the Fund. HFMC has contracted with Wellington Management Company, LLP ("Wellington Management") under a sub-advisory agreement for the provision of day-to-day investment management services to the Fund in accordance with the Fund’s investment objective and policies. The Fund pays a fee to the investment manager, a portion of which may be used to compensate Wellington Management.
| 37 |
| Hartford Real Total Return Fund |
| Notes to Financial Statements – (continued) |
| October 31, 2014 |
| (000’s Omitted) |
The schedule below reflects the rates of compensation paid to the investment manager for investment management services rendered as of October 31, 2014; the rates are accrued daily and paid monthly:
| Average Daily Net Assets | Annual Fee |
| On first $250 million | 1.200% |
| On next $250 million | 1.150% |
| On next $500 million | 1.100% |
| On next $1.5 billion | 1.050% |
| On next $2.5 billion | 1.020% |
| On next $5 billion billion | 1.010% |
| Over $10 billion | 1.000% |
Accounting Services Agreement – Pursuant to the Fund Accounting Agreement between HFMC and the Company, on behalf of the Fund, HFMC provides accounting services to the Fund and receives monthly compensation based on the Fund’s average daily net assets at the rates set forth below. The Fund’s accounting services fees are accrued daily and paid monthly.
| Average Daily Net Assets | Annual Fee |
| On first $5 billion | 0.025% |
| On next $5 billion | 0.020% |
| Over $10 billion | 0.015% |
Operating Expenses – Allocable expenses incurred by the Company are allocated to each Fund and allocated to classes within the Fund in proportion to the average daily net assets of the Fund and each class, except where allocation of certain expenses is more fairly made directly to the Fund or to specific classes within a Fund. As of October 31, 2014, HFMC contractually limited the total operating expenses of this Fund, exclusive of taxes, interest expense, brokerage commissions, acquired fund fees and expenses and extraordinary expenses, through February 28, 2015 as follows:
| Class A | Class C | Class I | Class R3 | Class R4 | Class R5 | Class Y |
| 1.70% | 2.45% | 1.45% | 2.00% | 1.70% | 1.40% | 1.30% |
Fees Paid Indirectly – The Fund has entered into agreements with State Street Global Markets, LLC and Russell Implementation Services, Inc. to partially recapture non-discounted trade commissions. Such rebates are used to pay a portion of the Fund's expenses. For the period November 29, 2013 (commencement of operations) through October 31, 2014, this amount, if any, is included in the Statement of Operations.
The ratio of expenses to average net assets in the accompanying financial highlights excludes the reduction in expenses related to fees paid indirectly. The annualized expense ratio after waivers for the period listed below reflecting the reduction for fees paid indirectly is as follows:
| Annualized Period Ended October 31, 2014 | ||||
| Class A | 1.64 | %* | ||
| Class C | 2.35 | * | ||
| Class I | 1.34 | * | ||
| Class R3 | 2.00 | * | ||
| Class R4 | 1.70 | * | ||
| Class R5 | 1.40 | * | ||
| Class Y | 1.30 | * | ||
* From November 29, 2013 (commencement of operations) through October 31, 2014.
| 38 |
| Hartford Real Total Return Fund |
| Notes to Financial Statements – (continued) |
| October 31, 2014 |
| (000’s Omitted) |
Distribution and Service Plan for Class A, C, R3 and R4 Shares – Hartford Funds Distributors, LLC ("HFD"), an indirect wholly owned subsidiary of The Hartford, is the principal underwriter and distributor of the Fund. HFD is engaged in distribution activities, which include marketing and distribution of shares through broker/dealers, financing distribution costs and maintaining financial books and records. For the period November 29, 2013 (commencement of operations) through October 31, 2014, HFD received front-end load sales charges of $30 and contingent deferred sales charges of $3 from the Fund.
The Fund has adopted a Distribution and Service Plan in accordance with Rule 12b-1 of the 1940 Act to compensate the distributor (HFD) for activities intended to result in the sale and distribution of Class A, C, R3 and R4 shares and for providing services for shareholders. The Rule 12b-1 plan applicable to Class A shares of the Fund provides for payment of a Rule 12b-1 fee of 0.25% of average daily net assets. Some or all of the fee may be used for shareholder servicing expenses with the remainder used for distribution expenses. Under the Class C Plan, the Fund pays the distributor 1.00% of the average daily net assets of Class C shares outstanding, 0.25% of which is intended as a fee for services provided to existing shareholders with the remainder used for distribution expenses. For Class C shares, some or the entire fee may be remitted to broker/dealers for distribution and/or shareholder account services. Class R3 shares have a distribution fee of 0.50% of average daily net assets and Class R4 shares have a distribution fee of 0.25% of average daily net assets. For Class R3 and R4 shares, some or the entire fee may be remitted to broker/dealers for distribution and/or shareholder account services. The Fund’s 12b-1 fees are accrued daily and paid monthly or at such other intervals as the Board of Directors may determine.
Other Related Party Transactions – Certain officers of the Fund are directors and/or officers of HFMC and/or The Hartford or its subsidiaries. For the period November 29, 2013 (commencement of operations) through October 31, 2014, a portion of the Fund’s Chief Compliance Officer’s compensation was paid by all of the investment companies in the Hartford fund complex. The portion allocated to the Fund, as represented in other expenses on the Statement of Operations, rounds to zero. Hartford Administrative Services Company (“HASCO”), an indirect wholly-owned subsidiary of The Hartford, provides transfer agent services to the Fund. HASCO has contractually agreed to reimburse any portion of the transfer agency fees over 0.30% of average daily net assets per fiscal year for each class. Any transfer agency fee reimbursement is determined before considering the contractual operating expense limitation. For providing such services, HASCO is compensated on a per account basis that varies by account type, except with respect to Class Y, for which it is compensated based on average daily net assets. The amount paid to HASCO and any related contractual reimbursement amounts, if applicable, can be found in the Statement of Operations. These fees are accrued daily and paid monthly.
Administrative services fees are paid to HASCO for third-party recordkeeping services that are payable as a percentage of net assets in the amount of up to 0.20%, 0.15% and 0.10% for Classes R3, R4 and R5 shares, respectively. The total administrative services fees are shown on the Statement of Operations. These fees are accrued daily and paid monthly.
| 39 |
| Hartford Real Total Return Fund |
| Notes to Financial Statements – (continued) |
| October 31, 2014 |
| (000’s Omitted) |
Affiliate Holdings:
As of October 31, 2014, affiliates of The Hartford had ownership of shares in the Fund as follows:
| Percentage of Class | Percentage of Fund |
||||||
| Class A | 17 | % | — | %* | |||
| Class C | 82 | — | * | ||||
| Class I | 73 | — | * | ||||
| Class R3 | 100 | † | — | * | |||
| Class R4 | 100 | † | — | * | |||
| Class R5 | 100 | † | — | * | |||
| Class Y | — | * | — | * | |||
As of October 31, 2014, the Fund's shares were owned in aggregate by affiliated fund of funds. Therefore, the Fund may experience relatively large purchases or redemptions of its shares from these affiliated fund of funds. Affiliated fund of funds owned shares in the Fund as follows:
| Percentage of Fund | ||||
| Class Y | 99 | % | ||
| * | Percentage rounds to zero. |
| † | Percentage rounds to 100%. |
Investment Transactions:
For the period November 29, 2013 (commencement of operations) through October 31, 2014, the cost of purchases and proceeds from sales of investment securities (excluding short-term investments) were as follows:
| Excluding U.S. Government Obligations | U.S. Government Obligations | Total | ||||||||||
| Cost of Purchases | $ | 382,572 | $ | 23,083 | $ | 405,655 | ||||||
| Sales Proceeds | 292,061 | 17,151 | 309,212 | |||||||||
| 40 |
| Hartford Real Total Return Fund |
| Notes to Financial Statements – (continued) |
| October 31, 2014 |
| (000’s Omitted) |
Capital Share Transactions:
The following information is for the period November 29, 2013 (commencement of operations) through October 31, 2014:
| For the Period Ended October 31, 2014 | ||||||||||||||||
| Shares Sold | Shares
Issued for Reinvested Dividends | Shares Redeemed | Net
Increase (Decrease) of Shares | |||||||||||||
| Class A | ||||||||||||||||
| Shares | 65 | — | (6 | ) | 59 | |||||||||||
| Amount | $ | 689 | $ | — | $ | (67 | ) | $ | 622 | |||||||
| Class C | ||||||||||||||||
| Shares | 13 | — | (1 | ) | 12 | |||||||||||
| Amount | $ | 131 | $ | — | $ | (8 | ) | $ | 123 | |||||||
| Class I | ||||||||||||||||
| Shares | 16 | — | (2 | ) | 14 | |||||||||||
| Amount | $ | 158 | $ | — | $ | (21 | ) | $ | 137 | |||||||
| Class R3 | ||||||||||||||||
| Shares | 10 | — | — | 10 | ||||||||||||
| Amount | $ | 100 | $ | — | $ | — | $ | 100 | ||||||||
| Class R4 | ||||||||||||||||
| Shares | 10 | — | — | 10 | ||||||||||||
| Amount | $ | 100 | $ | — | $ | — | $ | 100 | ||||||||
| Class R5 | ||||||||||||||||
| Shares | 10 | — | — | 10 | ||||||||||||
| Amount | $ | 100 | $ | — | $ | — | $ | 100 | ||||||||
| Class Y | ||||||||||||||||
| Shares | 14,398 | — | (3,693 | ) | 10,705 | |||||||||||
| Amount | $ | 149,081 | $ | — | $ | (39,131 | ) | $ | 109,950 | |||||||
| Total | ||||||||||||||||
| Shares | 14,522 | — | (3,702 | ) | 10,820 | |||||||||||
| Amount | $ | 150,359 | $ | — | $ | (39,227 | ) | $ | 111,132 | |||||||
Line of Credit:
The Fund is one of several Hartford Funds that participate in a $500 million committed revolving line of credit facility. The facility is to be used for temporary or emergency purposes. Under the arrangement, the funds are required to own securities having a market value in excess of 300% of the total bank borrowings. The interest rate on borrowings varies depending on the nature of the loan. The facility also requires a fee to be paid based on the amount of the commitment. This commitment fee is allocated to all the funds participating in the line of credit based on the average net assets of the funds. During the period November 29, 2013 (commencement of operations) through October 31, 2014, the Fund did not have any borrowings under this facility.
Pending Legal Proceedings:
On February 25, 2011, Jennifer L. Kasilag, Louis Mellinger, Judith M. Menendez, Jacqueline M. Robinson, and Linda A. Russell filed a derivative lawsuit against Hartford Investment Financial Services, LLC (“HIFSCO”) (now known as HFD) on behalf of six Hartford retail mutual funds in the United States District Court for the District of New Jersey, alleging that HIFSCO received excessive advisory and distribution fees in violation of its statutory fiduciary duty under Section 36(b) of the 1940 Act when serving as investment manager and principal underwriter, respectively, to the Hartford retail mutual funds. Although this action was purportedly filed on behalf of certain of the Hartford Funds, none of the Hartford Funds is itself a defendant to the suit. HIFSCO moved to dismiss and, in September 2011, the motion was granted in part and denied in part, with leave to amend the complaint. In November 2011, plaintiffs filed an amended complaint on behalf of certain Hartford retail mutual funds, The Hartford Global Health Fund (now known as The Hartford Healthcare Fund), The Hartford Conservative Allocation Fund, The Hartford Growth Opportunities Fund, The Hartford Inflation Plus Fund, The Hartford Advisers Fund (now known as The Hartford Balanced Fund), and The Hartford Capital Appreciation Fund. Plaintiffs seek to rescind the investment management agreements and distribution plans between HIFSCO and these funds and to recover the total fees charged thereunder or, in the alternative, to recover any improper compensation HIFSCO received, in addition to lost earnings. HIFSCO filed a partial motion to
| 41 |
| Hartford Real Total Return Fund |
| Notes to Financial Statements – (continued) |
| October 31, 2014 |
| (000’s Omitted) |
dismiss the amended complaint and, in December 2012, the court dismissed without prejudice the claims regarding distribution fees and denied the motion with respect to the advisory fees claims. HIFSCO disputes the allegations and intends to defend vigorously.
In March 2014, the plaintiffs filed a new complaint that added as new plaintiffs The Hartford Floating Rate Fund and The Hartford Small Company Fund and named as a defendant HFMC, which assumed the role as investment manager to the funds as of January 2013. HFMC and HIFSCO dispute the allegations and intend to defend vigorously.
No accrual for litigation relating to this matter has been recorded in the financial statements of the Fund because the Fund is not party to the suit.
Indemnifications:
Under the Company's organizational documents, the Company shall indemnify its officers and directors to the full extent required or permitted under Maryland General Corporation Law and the federal securities laws. In addition, the Company, on behalf of the Fund, may enter into contracts that contain a variety of indemnifications. The Company's maximum exposure under these arrangements is unknown. However, as of the date of these financial statements, the Company has not had prior claims or losses pursuant to these contracts and expects the risk of loss to be remote.
Subsequent Event:
Effective December 1, 2014, pursuant to a sub-transfer agency agreement between HASCO and Boston Financial Data Services, Inc. (“BFDS”), HASCO has delegated certain transfer agent, dividend disbursing agent and shareholder servicing agent functions to BFDS. The costs and expenses of such delegation are borne by HASCO, not by the Fund.
| 42 |
| Hartford Real Total Return Fund |
| Financial Highlights |
| - Selected Per-Share Data - (A) | - Ratios and Supplemental Data - | |||||||||||||||||||||||||||||||||||||||||||||||||||
| Class | Net
Asset Value at Beginning of Period | Net Investment Income (Loss) | Net Realized and Unrealized Gain (Loss) on Invest- ments | Total
from Investment Operations | Dividends from Net Investment Income | Distribu-
tions from Realized Capital Gains | Total Dividends and Distributions | Net
Asset Value at End of Period | Total Return(B) | Net Assets at End of Period (000's) | Ratio
of Expenses to Average Net Assets Before Adjust- ments(C) | Ratio
of Expenses to Average Net Assets After Adjust- ments(C) | Ratio
of Net Investment Income (Loss) to Average Net Assets | |||||||||||||||||||||||||||||||||||||||
| From November 29, 2013 (commencement of operations), through October 31, 2014 | ||||||||||||||||||||||||||||||||||||||||||||||||||||
| A(D) | $ | 10.00 | $ | 0.04 | $ | 0.07 | $ | 0.11 | $ | – | $ | – | $ | – | $ | 10.11 | 1.10 | %(E) | $ | 598 | 1.70 | %(F) | 1.65 | %(F) | 0.42 | %(F) | ||||||||||||||||||||||||||
| C(D) | 10.00 | (0.05 | ) | 0.09 | 0.04 | – | – | – | 10.04 | 0.40 | (E) | 122 | 2.41 | (F) | 2.36 | (F) | (0.56 | )(F) | ||||||||||||||||||||||||||||||||||
| I(D) | 10.00 | 0.17 | (0.02 | ) | 0.15 | – | – | – | 10.15 | 1.50 | (E) | 138 | 1.39 | (F) | 1.34 | (F) | 1.68 | (F) | ||||||||||||||||||||||||||||||||||
| R3(D) | 10.00 | (0.01 | ) | 0.09 | 0.08 | – | – | – | 10.08 | 0.80 | (E) | 101 | 2.05 | (F) | 2.00 | (F) | (0.11 | )(F) | ||||||||||||||||||||||||||||||||||
| R4(D) | 10.00 | 0.02 | 0.08 | 0.10 | – | – | – | 10.10 | 1.00 | (E) | 101 | 1.75 | (F) | 1.70 | (F) | 0.18 | (F) | |||||||||||||||||||||||||||||||||||
| R5(D) | 10.00 | 0.05 | 0.08 | 0.13 | – | – | – | 10.13 | 1.30 | (E) | 101 | 1.45 | (F) | 1.40 | (F) | 0.48 | (F) | |||||||||||||||||||||||||||||||||||
| Y(D) | 10.00 | 0.06 | 0.08 | 0.14 | – | – | – | 10.14 | 1.40 | (E) | 108,553 | 1.35 | (F) | 1.30 | (F) | 0.57 | (F) | |||||||||||||||||||||||||||||||||||
| (A) | Information presented relates to a share outstanding throughout the indicated period. Net investment income (loss) per share amounts are calculated based on average shares outstanding unless otherwise noted. |
| (B) | Assumes initial investment at net asset value at the beginning of each period, reinvestment of all distributions, the complete redemption of the investment at net asset value at the end of each period and no sales charge. Total return would be reduced if sales charges were taken into account. |
| (C) | Adjustments include waivers and reimbursements, if applicable. Ratios do not include fees paid indirectly (see Expenses in the accompanying Notes to Financial Statements). |
| (D) | Commenced operations on November 29, 2013. |
| (E) | Not annualized. |
| (F) | Annualized. |
|
Portfolio Turnover Rate for |
|||
| From November 29, 2013 (commencement of operations) through October 31, 2014 | 305 | %(A) |
| (A) | Not annualized. |
| 43 |
| Report of Independent Registered Public Accounting Firm |
| The Board of Directors and Shareholders of |
| The Hartford Mutual Funds, Inc. |
We have audited the accompanying statement of assets and liabilities, including the schedule of investments, of Hartford Real Total Return Fund (one of the portfolios constituting The Hartford Mutual Funds, Inc. (the Funds)) as of October 31, 2014, and the related statement of operations, the statement of changes in net assets, and the financial highlights for the period from November 29, 2013 (commencement of operations) to October 31, 2014. These financial statements and financial highlights are the responsibility of the Funds’ management. Our responsibility is to express an opinion on these financial statements and financial highlights based on our audit.
We conducted our audit in accordance with the standards of the Public Company Accounting Oversight Board (United States). Those standards require that we plan and perform the audit to obtain reasonable assurance about whether the financial statements and financial highlights are free of material misstatement. We were not engaged to perform an audit of the Funds’ internal control over financial reporting. Our audit included consideration of internal control over financial reporting as a basis for designing audit procedures that are appropriate in the circumstances, but not for the purpose of expressing an opinion on the effectiveness of the Funds’ internal control over financial reporting. Accordingly, we express no such opinion. An audit also includes examining, on a test basis, evidence supporting the amounts and disclosures in the financial statements and financial highlights, assessing the accounting principles used and significant estimates made by management, and evaluating the overall financial statement presentation. Our procedures included confirmation of securities owned as of October 31, 2014, by correspondence with the custodian and brokers or by other appropriate auditing procedures where replies from brokers were not received. We believe that our audit provides a reasonable basis for our opinion.
In our opinion, the financial statements and financial highlights referred to above present fairly, in all material respects, the financial position of Hartford Real Total Return Fund of The Hartford Mutual Funds, Inc. at October 31, 2014, the results of its operations, the changes in its net assets, and the financial highlights for the period from November 29, 2013 (commencement of operations) to October 31, 2014, in conformity with U.S. generally accepted accounting principles.
|
Minneapolis, Minnesota
December 18, 2014
| 44 |
| Hartford Real Total Return Fund |
| Directors and Officers (Unaudited) |
The Board of Directors of the Company (the "Directors") appoints officers who are responsible for the day-to-day operations of the Fund and who execute policies formulated by the Directors. Each Director serves until his or her death, resignation, or retirement or until the next annual meeting of shareholders is held or until his or her successor is elected and qualifies.
Directors and officers who are employed by or who have a financial interest in The Hartford Financial Services Group, Inc. ("The Hartford") are considered “interested” persons of the Fund pursuant to the 1940 Act. Each officer and two of the Company's Directors, as noted in the chart below, are “interested” persons of the Fund. Each Director serves as a director for The Hartford Mutual Funds, Inc., The Hartford Mutual Funds II, Inc., Hartford Series Fund, Inc., and Hartford HLS Series Fund II, Inc., and as a trustee for The Hartford Alternative Strategies Fund, which, as of October 31, 2014, collectively consist of 66 funds. Correspondence may be sent to Directors and officers c/o Hartford Funds, 5 Radnor Corporate Center, Suite 300, 100 Matsonford Road, Radnor, Pennsylvania 19087, except that correspondence to Mr. Annoni, Mr. Dressen and Ms. Quade may be sent to 500 Bielenberg Drive, Suite 500, Woodbury, Minnesota 55125.
The table below sets forth, for each Director and officer, his or her name, year of birth, current position with the Company and date first elected or appointed to The Hartford Mutual Funds, Inc. ("MF") and The Hartford Mutual Funds II, Inc. ("MF2"), principal occupation, and, for Directors, other directorships held. The Fund’s Statement of Additional Information contains further information on the Directors and is available free of charge by calling 1-888-843-7824 or writing to: Hartford Funds, P.O. Box 55022, Boston, MA 02205-5022.
Information on the aggregate remuneration paid to the directors of the Company can be found in the Statement of Operations herein. The Fund pays to The Hartford a portion of the Chief Compliance Officer’s compensation, but does not pay salaries or compensation to any of its other officers or Directors who are employed by The Hartford.
Non-Interested Directors
Hilary E. Ackermann (1956) Director since September 23, 2014
Ms. Ackermann served as Chief Risk Officer at Goldman Sachs Bank USA from October 2008 to November 2011 and serves as a Director of Dynegy, Inc., an independent power company, from October 2012 to present.
Lynn S. Birdsong (1946) Director since 2003, Chairman of the Investment Committee since 2014
Mr. Birdsong is a private investor. Mr. Birdsong currently serves as a Director of the Sovereign High Yield Investment Company (April 2010 to current). Mr. Birdsong currently serves as an Independent Director of Nomura Partners Funds, Inc. (formerly, The Japan Fund) (April 2003 to current). From 2003 to March 2005, Mr. Birdsong was an Independent Director of the Atlantic Whitehall Funds. From 1979 to 2002, Mr. Birdsong was a Managing Director of Zurich Scudder Investments, an investment management firm. During his employment with Scudder, Mr. Birdsong was an Interested Director of The Japan Fund. From January 1981 through December 2013, Mr. Birdsong was a partner in Birdsong Company, an advertising specialty firm.
Robert M. Gavin, Jr. (1940) Director since 2002 (MF) and 1986 (MF2), Chairman of the Board for each since 2004
Dr. Gavin is an educational consultant. Prior to September 1, 2001, he was President of Cranbrook Education Community and prior to July 1996, he was President of Macalester College, St. Paul, Minnesota.
Duane E. Hill (1945) Director since 2001 (MF) and 2002 (MF2), Chairman of the Nominating Committee since 2003
Mr. Hill is a Partner of TSG Ventures L.P., a private equity investment company. Mr. Hill is a former partner of TSG Capital Group, a private equity investment firm that served as sponsor and lead investor in leveraged buyouts of middle market companies.
Sandra S. Jaffee (1941) Director since 2005
Ms. Jaffee is the founder and Chief Executive Officer of a private company, Homeworks Concierge, LLC, which provides residential property management services in Westchester County, New York (January 2012 to present). Ms. Jaffee served as Chairman (2008 to 2009) and Chief Executive Officer of Fortent (formerly Searchspace Group), a leading provider of compliance/regulatory technology to financial institutions from August 2005 to August 2009. From August 2004 to August 2005, Ms. Jaffee served as an Entrepreneur in Residence with Warburg Pincus, a private equity firm. Prior to joining Warburg Pincus, Ms. Jaffee served as Executive Vice President at Citigroup, from September 1995 to July 2004, where she was President and Chief Executive Officer of Citibank’s Global Securities Services (1995 to 2003). Ms. Jaffee currently serves as a member of the Board of Directors of Broadridge Financial Solutions as well as a Trustee of Muhlenberg College.
| 45 |
| Hartford Real Total Return Fund |
| Directors and Officers (Unaudited) – (continued) |
William P. Johnston (1944) Director since 2005, Chairman of the Compliance Committee since 2005
In June 2006, Mr. Johnston was appointed as Senior Advisor to The Carlyle Group, a global private equity and other alternative asset investment firm and currently serves as an Operating Executive. In July 2006, Mr. Johnston was elected to the Board of Directors of MultiPlan, Inc. and served as a Director (July 2006 to August 2010). In August 2007, Mr. Johnston was elected to the Board of Directors of LifeCare Holdings, Inc. and served as a Director (August 2007 to June 2013). In February 2008, Mr. Johnston was elected to the Board of Directors of HCR-ManorCare, Inc. In May 2006, Mr. Johnston was elected to the Supervisory Board of Fresenius Medical Care AG & Co. KGaA, after its acquisition of Renal Care Group, Inc. in March 2006. Mr. Johnston joined Renal Care Group in November 2002 as a member of the Board of Directors and served as Chairman of the Board from March 2003 through March 2006. From 2002 through 2013, Mr. Johnston served as a Board member of the Georgia O’Keefe Museum. From September 1987 to December 2002, Mr. Johnston was with Equitable Securities Corporation (and its successors, SunTrust Equitable Securities and SunTrust Robinson Humphrey) serving in various investment banking and managerial positions, including Managing Director and Head of Investment Banking, Chief Executive Officer and Vice Chairman.
Phillip O. Peterson (1944) Director since 2002 (MF) and 2000 (MF2), Chairman of the Audit Committee since 2002
Mr. Peterson is a mutual fund industry consultant. He was a partner of KPMG LLP (an accounting firm) until July 1999. Mr. Peterson joined William Blair Funds in February 2007 as a member of the Board of Trustees. From February 2012 to February 2014, Mr. Peterson served as a Trustee of Symetra Variable Mutual Funds. From January 2004 to April 2005, Mr. Peterson served as Independent President of the Strong Mutual Funds.
Lemma W. Senbet (1946) Director since 2005
Dr. Senbet is the William E. Mayer Chair Professor of Finance and Founding Director, Center for Financial Policy, at the University of Maryland, Robert H. Smith School of Business. He was chair of the Finance Department of the University of Maryland, Robert H. Smith School of Business from 1998 to 2006. Since June 2013, he has been on leave from the University to serve as Executive Director of African Economic Research Consortium which focuses on economic policy research and training. Previously, he was a chaired professor of finance at the University of Wisconsin-Madison. Also, he was a Director of the Fortis Funds from March 2000 to July 2002. Dr. Senbet served as Director of the American Finance Association and President of the Western Finance Association. In 2006, Dr. Senbet was inducted Fellow of Financial Management Association International for his career-long distinguished scholarship and professional service.
Interested Directors and Officers
James E. Davey (1964) Director since 2012, President and Chief Executive Officer since 2010
Mr. Davey serves as Executive Vice President of Hartford Life Insurance Company (“HLIC”) and The Hartford. Additionally, Mr. Davey serves as Chairman of the Board, Manager and Senior Managing Director of Hartford Funds Distributors, LLC (“HFD”). He also currently serves as Director, Chairman of the Board, President and Senior Managing Director of Hartford Administrative Services Company (“HASCO”). Mr. Davey also serves as Manager, Chairman of the Board and Senior Managing Director for Hartford Funds Management Company, LLC (“HFMC”) and Director, Chairman of the Board and Senior Managing Director for Hartford Funds Management Group, Inc. ("HFMG"). Mr. Davey has served in various positions within The Hartford and its subsidiaries in connection with the operation of the Hartford Funds. Mr. Davey joined The Hartford in 2002.
Lowndes A. Smith* (1939) Director since 1996 (MF) and 2002 (MF2)
Mr. Smith served as Vice Chairman of The Hartford from February 1997 to January 2002, as President and Chief Executive Officer of Hartford Life, Inc. from February 1997 to January 2002, and as President and Chief Operating Officer of The Hartford Life Insurance Companies from January 1989 to January 2002. Mr. Smith serves as a Director of White Mountains Insurance Group Ltd. (October 2003 to current); One Beacon Insurance (October 2006 to current); Symetra Financial (August 2007 to current) and is a Managing Director of Whittington Gray Associates (January 2007 to current).
* Mr. Smith resigned as a Director of MF, MF2, Hartford Series Fund, Inc. and Hartford HLS Series Fund II, Inc. and as a Trustee of The Hartford Alternative Strategies Fund effective September 17, 2014.
Other Officers
Mark A. Annoni (1964) Vice President, Controller and Treasurer since 2012
Mr. Annoni currently serves as the Assistant Vice President of HLIC (February 2004 to present) and Senior Vice President of HFMG (December 2013 to present). Mr. Annoni has served in various positions within The Hartford and its subsidiaries in connection with the operation of the Hartford Funds. Mr. Annoni joined The Hartford in 2001.
| 46 |
| Hartford Real Total Return Fund |
| Directors and Officers (Unaudited) – (continued) |
Michael R. Dressen (1963) AML Compliance Officer since 2011
Mr. Dressen currently serves as Assistant Vice President of HLIC. He also serves as Chief Compliance Officer and AML Compliance Officer of HASCO and as AML Officer of HFD. Mr. Dressen has served in various positions within The Hartford and its subsidiaries in connection with the operation of the Hartford Funds.
Edward P. Macdonald (1967) Vice President, Secretary and Chief Legal Officer since 2005
Mr. Macdonald currently serves as Assistant Secretary, Executive Vice President and Deputy General Counsel of HFD, HASCO, HFMC and HFMG. He also serves as Vice President of HLIC. Mr. Macdonald has served in various positions within The Hartford and its subsidiaries in connection with the operation of the Hartford Funds. Mr. Macdonald joined The Hartford in 2005.
Joseph G. Melcher (1973) Vice President and Chief Compliance Officer since 2013
Mr. Melcher currently serves as Executive Vice President of HFD, HFMG and HASCO. Mr. Melcher also currently serves as Executive Vice President and Chief Compliance Officer of HFMC. Mr. Melcher has served in various positions within The Hartford and its subsidiaries in connection with the operation of the Hartford Funds since joining The Hartford in 2012. Prior to joining The Hartford, Mr. Melcher worked at Touchstone Investments, a member of the Western & Southern Financial Group, where he held the position of Vice President and Chief Compliance Officer from 2010 through 2012 and Assistant Vice President, Compliance from 2005 to 2010.
Vernon J. Meyer (1964) Vice President since 2006
Mr. Meyer currently serves as Senior Vice President of HLIC. He also currently serves as Managing Director and Chief Investment Officer of HFMC and Managing Director of HFMG. Mr. Meyer has served in various positions within The Hartford and its subsidiaries in connection with the operation of the Hartford Funds. Mr. Meyer joined The Hartford in 2004.
Laura S. Quade (1969) Vice President since 2012
Ms. Quade currently serves as Vice President of HASCO, HFD and HFMG. She is the Head of Operations of HASCO and formerly served as Director, Enterprise Operations of HLIC. Ms. Quade has served in various positions within The Hartford and its subsidiaries in connection with the operation of the Hartford Funds. Ms. Quade joined The Hartford in 2001.
Martin A. Swanson** (1962) Vice President since 2010
Mr. Swanson currently serves as Vice President of HLIC. Mr. Swanson also serves as Managing Director, Chief Marketing Officer and Principal of HFD and Managing Director of HFMG. Mr. Swanson has served in various positions within The Hartford and its subsidiaries in connection with the operation of the Hartford Funds.
** Mr. Swanson resigned as an officer effective November 6, 2014.
HOW TO OBTAIN A COPY OF THE FUND’S PROXY VOTING POLICIES AND VOTING RECORDS (UNAUDITED)
A description of the policies and procedures that the Fund uses to determine how to vote proxies relating to portfolio securities and information about how the Fund voted proxies relating to portfolio securities during the most recent twelve-month period ended June 30 are available (1) without charge, upon request, by calling 888-843-7824 and (2) on the SEC’s website at http://www.sec.gov.
QUARTERLY PORTFOLIO HOLDINGS INFORMATION (UNAUDITED)
The Fund files a complete schedule of portfolio holdings with the SEC for the first and third quarters of each fiscal year on Form N-Q. The Fund’s Forms N-Q are available (1) without charge, upon request, by calling 888-843-7824 and (2) on the SEC’s website at http://www.sec.gov. The Form N-Q may be reviewed and copied at the SEC’s Public Reference Room in Washington, DC. Information on the operation of the Public Reference Room may be obtained by calling 1-800-SEC-0330.
| 47 |
| Hartford Real Total Return Fund |
| Federal Tax Information (Unaudited) |
For the fiscal year ended October 31, 2014, there is no further federal tax information required for this Fund.
| 48 |
| Hartford Real Total Return Fund |
| Expense Example (Unaudited) |
Your Fund's Expenses
As a shareholder of the Fund, you incur two types of costs: (1) transaction costs, including sales charges (loads) on purchase payments, if any, and contingent deferred sales charges (CDSC), if any, and (2) ongoing costs, including investment management fees, distribution and/or service (12b-1) fees, if any, and other fund expenses. This example is intended to help you understand your ongoing costs (in dollars) of investing in the Fund and to compare these costs with the ongoing costs of investing in other mutual funds. The example is based on an investment of $1,000 invested at the beginning of the period and held for the entire period of April 30, 2014 through October 31, 2014.
Actual Expenses
The first set of columns of the table below provides information about actual account values and actual expenses. You may use the information in this column, together with the amount you invested, to estimate the expenses that you paid over the period. Simply divide your account value by $1,000 (for example, an $8,600 account value divided by $1,000 = 8.6), then multiply the result by the number in the line under the heading entitled “Expenses Paid During Period” to estimate the expenses you paid on your account during this period.
Hypothetical Example for Comparison Purposes
The second set of columns of the table below provides information about hypothetical account values and hypothetical expenses based on the Fund's actual expense ratio and an assumed rate of return of 5% per year before expenses, which is not the Fund's actual return. The hypothetical account values and expenses may not be used to estimate the actual ending account balance or expenses you paid for the period. You may use this information to compare the ongoing costs of investing in the Fund and other funds. To do so, compare this 5% hypothetical example with the 5% hypothetical examples that appear in the shareholder reports of the other funds.
Please note that the expenses shown in the table are meant to highlight your ongoing costs only and do not reflect any transactional costs, such as sales charges (loads) and CDSC. Therefore, the second set of columns of the table is useful in comparing ongoing costs only, and will not help you determine the relative total costs of owning different funds. In addition, if these transactional costs were included, your costs would be higher. Expenses are equal to the Fund's annualized expense ratios multiplied by average account value over the period, multiplied by 184/365 (to reflect the one-half year period).
| Actual return | Hypothetical (5% return before expenses) | |||||||||||||||||||||||||||||||
| Beginning Account Value April 30, 2014 | Ending
Account Value October 31, 2014 | Expenses
paid during the period April 30, 2014 through October 31, 2014 | Beginning Account Value April 30, 2014 | Ending
Account Value October 31, 2014 | Expenses
paid during the period April 30, 2014 through October 31, 2014 | Annualized expense ratio | Days in the current 1/2 year | Days in the full year | ||||||||||||||||||||||||
| Class A | $ | 1,000.00 | $ | 964.70 | $ | 8.12 | $ | 1,000.00 | $ | 1,016.94 | $ | 8.34 | 1.64 | % | 184 | 365 | ||||||||||||||||
| Class C | $ | 1,000.00 | $ | 960.80 | $ | 11.82 | $ | 1,000.00 | $ | 1,013.15 | $ | 12.14 | 2.39 | 184 | 365 | |||||||||||||||||
| Class I | $ | 1,000.00 | $ | 966.70 | $ | 6.63 | $ | 1,000.00 | $ | 1,018.46 | $ | 6.81 | 1.34 | 184 | 365 | |||||||||||||||||
| Class R3 | $ | 1,000.00 | $ | 962.80 | $ | 9.89 | $ | 1,000.00 | $ | 1,015.12 | $ | 10.16 | 2.00 | 184 | 365 | |||||||||||||||||
| Class R4 | $ | 1,000.00 | $ | 963.70 | $ | 8.41 | $ | 1,000.00 | $ | 1,016.64 | $ | 8.64 | 1.70 | 184 | 365 | |||||||||||||||||
| Class R5 | $ | 1,000.00 | $ | 965.70 | $ | 6.94 | $ | 1,000.00 | $ | 1,018.15 | $ | 7.12 | 1.40 | 184 | 365 | |||||||||||||||||
| Class Y | $ | 1,000.00 | $ | 966.60 | $ | 6.44 | $ | 1,000.00 | $ | 1,018.65 | $ | 6.61 | 1.30 | 184 | 365 | |||||||||||||||||
| 49 |
| Hartford Real Total Return Fund |
| Approval of Investment Management and Investment Sub-Advisory Agreements (Unaudited) |
Section 15(c) of the Investment Company Act of 1940, as amended (the “1940 Act”), requires that each mutual fund’s board of directors, including a majority of those directors who are not “interested persons” of the mutual fund, as defined in the 1940 Act (the “Independent Directors”), annually review and consider the continuation of the mutual fund’s investment advisory and sub-advisory agreements. At its meeting held on August 5-6, 2014, the Board of Directors (the “Board”) of The Hartford Mutual Funds, Inc., including each of the Independent Directors, unanimously voted to approve the continuation of the investment management agreement for Hartford Real Total Return Fund (the “Fund”) with Hartford Funds Management Company, LLC (“HFMC”) and the continuation of the investment sub-advisory agreement between HFMC and the Fund’s sub-adviser, Wellington Management Company, LLP (the “Sub-adviser,” and together with HFMC, the “Advisers”) (collectively, the “Agreements”).
In the months preceding the August 5-6, 2014 meeting, the Board requested, received and reviewed written responses from the Advisers to questions posed to them on behalf of the Independent Directors and supporting materials relating to those questions and responses. The Board considered information furnished to the Board at its meetings throughout the year, as well as information specifically prepared in connection with the annual approval of the Agreements at the Board’s meetings held on June 17-18, 2014 and August 5-6, 2014. Information provided to the Board at its meetings throughout the year included, among other things, reports on Fund performance, legal and compliance matters, sales and marketing activity, shareholder services, and the other services provided to the Fund by the Advisers and their affiliates. The Board also received in-person presentations by Fund officers and representatives of HFMC at the Board’s meetings on June 17-18, 2014 and August 5-6, 2014 concerning the Agreements.
The Independent Directors, advised by independent legal counsel, engaged service providers to assist them with evaluating the Agreements with respect to the Fund. Lipper Inc. (“Lipper”), an independent provider of investment company data, was retained to provide the Board with reports on how the Fund’s contractual management fees, actual management fees, other non-management fees, overall expense ratios and investment performance compared to those of mutual funds with similar investment objectives. The Independent Directors also engaged an independent financial services consultant (the “Consultant”) to assist them in evaluating the Fund’s management fees, sub-advisory fees, other non-management fees, overall expense ratios and investment performance. In addition, the Consultant reviewed the profitability calculations utilized by HFMC in connection with the continuation of the investment management agreement.
In determining whether to continue the Agreements for the Fund, the members of the Board reviewed and evaluated information and factors they believed to be relevant and appropriate in light of the information that the Board deemed necessary and appropriate through the exercise of its reasonable business judgment. While individual members of the Board may have weighed certain factors differently, the Board’s determination to continue the Agreements was based on a comprehensive consideration of all information provided to the Board throughout the year and specifically with respect to the continuation of the Agreements. A more detailed discussion of the factors the Board considered with respect to its approval of the Agreements is provided below.
Nature, Extent and Quality of Services Provided by the Advisers
The Board requested and considered information concerning the nature, extent and quality of the services provided to the Fund by the Advisers. The Board considered, among other things, the terms of the Agreements and the range of services provided by the Advisers. The Board considered the Advisers’ professional personnel who provide services to the Fund, including each Adviser’s ability and experience in attracting and retaining qualified personnel to service the Fund. The Board considered each Adviser’s reputation and overall financial strength, as well as its willingness to consider and implement organizational and operational changes designed to enhance services to the Hartford Funds. In addition, the Board considered the quality of each Adviser’s communications with the Board and responsiveness to Board inquiries and requests made from time to time with respect to the Fund and other Hartford Funds.
The Board also requested and evaluated information concerning each Adviser’s regulatory and compliance environment. In this regard, the Board requested and reviewed information on each Adviser’s compliance policies and procedures, compliance history, and a report from the Fund’s Chief Compliance Officer on each Adviser’s compliance with applicable laws and regulations, including responses to regulatory developments and compliance issues raised by regulators. The Board also noted the Advisers’ support of the Fund’s compliance control structure, particularly the resources devoted by the Advisers in support of the Fund’s obligations pursuant to Rule 38a-1 under the 1940 Act.
With respect to HFMC, the Board noted that, under the Agreements, HFMC is responsible for the management of the Fund, including oversight of fund operations and service providers, and provides administrative and investment advisory services in connection with selecting, monitoring and supervising the Sub-adviser. The Board considered HFMC’s ongoing monitoring of people, process and performance, including its quarterly reviews of each of the Hartford Funds, semi-annual meetings with the leaders of each Fund’s portfolio management team, and oversight of the
| 50 |
| Hartford Real Total Return Fund |
| Approval of Investment Management and Investment Sub-Advisory Agreements (Unaudited) – (continued) |
Hartford Funds’ approximately 66 portfolio managers. The Board recognized that HFMC has demonstrated a record of making changes to the management and/or strategies of the Hartford Funds when warranted. The Board considered HFMC’s oversight of the Sub-adviser’s investment approach and results, process for monitoring best execution of portfolio trades by the Sub-adviser, and approach to risk management with respect to the Fund and the service providers to the Fund. The Board also considered HFMC’s oversight of compliance with the Fund’s objective and policies as well as with applicable laws and regulations, noting that regulatory and other developments had over time led to an increase in the scope of HFMC’s services in this regard.
In addition, the Board considered HFMC’s ongoing commitment to review and rationalize the Hartford Funds product line-up and the expenses that HFMC had incurred in connection with fund combinations in recent years. The Board considered that HFMC or its affiliates are responsible for providing the Fund’s officers.
With respect to the Sub-adviser, which provides certain day-to-day portfolio management services for the Fund, the Board considered the quality of the Fund’s portfolio managers, the Sub-adviser’s other investment personnel, its investment philosophy and process, investment research capabilities and resources, performance record, trade execution capabilities and experience. The Board considered the experience of the Fund’s portfolio managers, the number of accounts managed by the portfolio managers, and the Sub-adviser’s method for compensating the portfolio managers.
Based on these considerations, the Board concluded that it was satisfied with the nature, extent and quality of the services provided to the Fund by HFMC and the Sub-adviser.
Performance of the Fund and the Advisers
The Board considered the investment performance of the Fund. In this regard, the Board reviewed the performance of the Fund since inception and evaluated HFMC’s analysis of the Fund’s performance since inception. The Board considered information and materials provided to the Board by the Advisers concerning Fund performance, as well as information from Lipper comparing the investment performance of the Fund to an appropriate benchmark and universe of peer funds. The Board noted that the Fund’s performance was in the 1st quintile of its performance universe for the period since its inception. The Board also noted that the Fund’s performance was above its benchmark since its inception.
The Board considered the detailed investment analytics reports provided by Hartford Funds’ Investment Advisory Group throughout the year. These reports include, among other things, information on the Fund’s gross and net returns, the Fund’s investment performance relative to an appropriate benchmark and peer group, various statistics concerning the Fund’s portfolio, and a narrative summary of various factors affecting Fund performance. The Board considered the Advisers’ cooperation with the Investment Committee, which assists the Board in evaluating the performance of the Fund at periodic meetings throughout the year. The Board also considered the analysis provided by the Consultant relating to the Fund’s performance track record.
In light of all the considerations noted above, the Board concluded that it had continued confidence in HFMC’s and the Sub-adviser’s overall capabilities to manage the Fund.
Costs of the Services and Profitability of the Advisers
The Board reviewed information regarding HFMC’s cost to provide investment management and related services to the Fund and HFMC’s profitability, both overall and for the Fund, on a pre-tax basis without regard to distribution expenses. The Board also requested and reviewed information about the profitability to HFMC and its affiliates from all services provided to the Fund and all aspects of their relationship with the Fund. The Board also requested and received information relating to the operations and profitability of the Sub-adviser.
The Board considered the Consultant’s review of the profitability calculations used by HFMC in connection with the continuation of the investment management agreement, noting the Consultant’s view that Hartford Funds’ process for calculating and reporting Fund profitability is reasonable. In this regard, the Board noted that the Consultant performed a full review of this process in light of the recent restructuring of the Hartford Funds business and reported that the approach to analyzing Fund profitability, including the use of common expense allocation methodologies, is reasonable, sound and well within common industry practice.
Based on these considerations, the Board concluded that the profits anticipated to be realized by the Advisers and their affiliates from their relationships with the Fund would not be excessive.
| 51 |
| Hartford Real Total Return Fund |
| Approval of Investment Management and Investment Sub-Advisory Agreements (Unaudited) – (continued) |
Comparison of Fees and Services Provided by the Advisers
The Board considered comparative information with respect to the management fees to be paid by the Fund to HFMC and the total expense ratios of the Fund. The Board also considered comparative information with respect to the sub-advisory fees to be paid by HFMC to the Sub-adviser. In this regard, the Board requested and reviewed information from HFMC and the Sub-adviser relating to the management and sub-advisory fees, including the sub-advisory fee schedule for the Fund, and total operating expenses for the Fund. With respect to the sub-advisory fee schedule, the Board considered representations from HFMC and the Sub-adviser that the Sub-adviser’s fees were negotiated at arm’s length on a fund-by-fund basis. The Board also reviewed information from Lipper comparing the Fund’s contractual management fees, actual management fees and overall expense ratios relative to a group of funds selected by Lipper, in consultation with the Consultant, and a broader universe of funds selected by Lipper. The Board considered that the Fund’s contractual management fee was in the 4th quintile of its expense group, while its actual management fee was in the 5th quintile and its total expenses (less 12b-1 and shareholder service fees) were in the 3rd quintile. The Board noted that the Fund has an automatically renewable contractual expense cap on each share class. The expense cap resulted in reimbursement of certain expenses incurred in 2013.
While the Board recognized that comparisons between the Fund and peer funds may be imprecise, given the different service levels and characteristics of mutual funds and the different business models and cost structures of the Advisers, the comparative information provided by Lipper assisted the Board in evaluating the reasonableness of the Fund’s management and sub-advisory fees and total operating expenses. In addition, the Board considered the analysis and recommendations of the Consultant relating to the Fund’s management and sub-advisory fees and total operating expenses.
Based on these considerations, the Board concluded that the Fund’s fees and total operating expenses, in conjunction with the information about quality of services, profitability, economies of scale, and other matters discussed, were reasonable in light of the services provided.
Economies of Scale
The Board requested and considered information regarding the Advisers’ realization of economies of scale with respect to the Fund and whether the fee levels reflect these economies of scale for the benefit of the Fund’s shareholders. The Board reviewed the breakpoints in the management fee schedule for the Fund, which reduce fee rates as Fund assets grow over time. The Board recognized that a fund with assets beyond the highest breakpoint level will continue to benefit from economies of scale because additional assets are charged the lowest breakpoint fee resulting in lower overall effective management fee rates. The Board also considered that expense limitations and fee waivers that reduce the Fund’s expenses at all asset levels can have the same effect as breakpoints in sharing economies of scale with shareholders and provide protection from an increase in expenses if Fund assets decline. The Board recognized that a fee schedule that reaches a lower breakpoint quickly provides shareholders with the benefit of anticipated or potential economies of scale. The Board also considered that HFMC has been active in managing expenses, which has resulted in benefits being realized by shareholders as assets within the Hartford Funds family of funds have grown over time, including through lower transfer agent costs and other operating expenses.
The Board reviewed and evaluated materials from Lipper and the Consultant showing how management fee schedules of peer funds reflect economies of scale for the benefit of shareholders as a peer fund’s assets hypothetically increase over time. Based on information provided by HFMC, Lipper, and the Consultant, the Board recognized that there is no uniform methodology for establishing breakpoints or uniform pattern in asset levels that trigger breakpoints or the amounts of breakpoints triggered.
After considering all of the information available to it, the Board concluded that it was satisfied with the extent to which economies of scale would be shared for the benefit of the Fund’s shareholders based on currently available information and the effective advisory fees and expense ratios for the Fund at its current and reasonably anticipated asset levels. The Board noted, however, that it would continue to monitor future growth in Fund assets and the appropriateness of additional breakpoints.
Other Benefits
The Board considered other benefits to the Advisers and their affiliates from their relationships with the Fund.
The Board noted that HFMC receives fees for fund accounting and related services from the Fund, and the Board considered information on profits to HFMC for such services. The Board also considered that Hartford Administrative Services Company (“HASCO”), the Fund’s transfer agent and an affiliate of HFMC, receives transfer agency compensation from the Fund, and the Board reviewed information on the profitability of
| 52 |
| Hartford Real Total Return Fund |
| Approval of Investment Management and Investment Sub-Advisory Agreements (Unaudited) – (continued) |
the Fund’s transfer agency function to HASCO. The Board considered information provided by HASCO indicating that the transfer agent fees charged by HASCO to the Fund were fair and reasonable based on publicly available information.
The Board also considered that Hartford Funds Distributors, LLC (“HFD”), an affiliate of HFMC, serves as principal underwriter of the Fund. As principal underwriter, HFD receives 12b-1 fees from the Fund and receives all or a portion of the sales charges on sales or redemptions of certain classes of shares. The Board also noted that certain affiliates of HFD distribute shares of the Fund and receive compensation in that connection.
The Board considered benefits to the Sub-adviser from its use of the Fund’s brokerage commissions to obtain soft dollar research, and representations from HFMC and the Sub-adviser that the Sub-adviser would not make any revenue-sharing payments or any other type of distribution payments to HFMC or its affiliates.
The Board considered the benefits to shareholders of being part of the Hartford Funds family of funds, including the right to exchange investments between the same class of funds without a sales charge, the ability to reinvest Fund dividends into other funds in the family, and the ability to combine holdings in the Fund with holdings in other funds to obtain a reduced sales charge. The Board considered HFMC’s efforts to provide investors in the family with a broad range of investment styles and asset classes and its entrepreneurial risk in initiating new funds to expand these opportunities for shareholders.
* * * *
Based upon its review of these various factors, among others, the Board concluded that it is in the best interests of the Fund and its shareholders for the Board to approve the Agreements for an additional year. In reaching this decision, the Board did not assign relative weights to the factors discussed above or deem any one or group of them to be controlling in and of themselves. In connection with their deliberations, the Independent Directors met separately in executive session on several occasions, with independent legal counsel and the Consultant, to review the relevant materials and consider their responsibilities under relevant laws and regulations.
| 53 |
| Hartford Real Total Return Fund |
| Main Risks (Unaudited) |
The main risks of investing in the Fund are described below.
Market, Selection and Strategy Risk: The Fund’s share price may fluctuate due to market risk and/or security selections that may underperform the market or relevant benchmarks. If the sub-adviser's investment strategy does not perform as expected, the Fund could underperform its peers or lose money. There is no guarantee the Fund will achieve its stated objective.
Asset Allocation Strategy Risk: The portfolio managers' asset allocation strategy may not always work as intended, and asset allocation does not guarantee better performance or reduce the risk of investment loss. The investment styles employed by the portfolio managers may not be complimentary, which could adversely affect the performance of the Fund.
Fixed Income Risk: The Fund is subject to interest rate risk (the risk that the value of an investment decreases when interest rates rise), credit risk (the risk that the issuing company of a security is unable to pay interest and principal when due) and call risk (the risk that an investment may be redeemed early).
Inflation Protected Securities Risk: The market for inflation protected securities may be less developed or liquid, and more volatile, than other securities markets.
Structured Securities Risk: Structured securities are typically sold in private placement transactions, and there currently is no active trading market for structured securities, which may make them difficult to value and sell.
Mortgage-Backed Securities Risk: Mortgage-backed securities are subject to interest rate risk, credit risk, prepayment risk, extension risk, and the risk that an investment’s value may be reduced or become worthless if it receives interest or income payments only after other investments in the same pool.
Foreign Investment and Emerging Markets Risk: Investments in foreign securities may be riskier than investments in U.S. securities. Potential risks include the risks of illiquidity, increased price volatility, less government regulation, less extensive and less frequent accounting and other reporting requirements, unfavorable changes in currency exchange rates, and economic and political disruptions. These risks are generally greater for investments in emerging markets.
Derivatives Risk: Investments in derivatives can be volatile. Potential risks include currency risk, leverage risk (the risk that small market movements may result in large changes in the value of an investment), liquidity risk, index risk, pricing risk, and counterparty risk (the risk that the counterparty may be unwilling or unable to honor its obligations).
Active Trading Risk: Actively trading investments may result in higher costs and higher taxable income.
| 54 |
THIS PRIVACY POLICY IS NOT PART OF THIS REPORT
Privacy Policy and Practices of The Hartford Financial Services Group, Inc. and its Affiliates
(herein called “we, our and us”)
This Privacy Policy applies to our United States Operations
|
We value your trust. We are committed to the responsible: a) management; b) use; and c) protection; of Personal Information.
This notice describes how we collect, disclose, and protect Personal Information.
We collect Personal Information to: a) service your Transactions with us; and b) support our business functions.
We may obtain Personal Information from: a) You; b) your Transactions with us; and c) third parties such as a consumer-reporting agency.
Based on the type of product or service You apply for or get from us, Personal Information such as: a) your name; b) your address; c) your income; d) your payment; or e) your credit history; may be gathered from sources such as applications, Transactions, and consumer reports.
To serve You and service our business, we may share certain Personal Information. We will share Personal Information, only as allowed by law, with affiliates such as: a) our insurance companies; b) our employee agents; c) our brokerage firms; and d) our administrators.
As allowed by law, we may share Personal Financial Information with our affiliates to: a) market our products; or b) market our services; to You without providing You with an option to prevent these disclosures.
|
We may also share Personal Information, only as allowed by law, with unaffiliated third parties including: a) independent agents; b) brokerage firms; c) insurance companies; d) administrators; and e) service providers; who help us serve You and service our business.
When allowed by law, we may share certain Personal Financial Information with other unaffiliated third parties who assist us by performing services or functions such as: a) taking surveys; b) marketing our products or services; or c) offering financial products or services under a joint agreement between us and one or more financial institutions.
We, and third parties we partner with, may track some of the pages You visit through the use of: a) cookies; b) pixel tagging; or c) other technologies; and currently do not process or comply with any web browser’s “do not track” signal or similar mechanism that indicates a request to disable online tracking of individual users who visit our websites or use our services.
We will not sell or share your Personal Financial Information with anyone for purposes unrelated to our business functions without offering You the opportunity to: a) “opt-out;” or b) “opt-in;” as required by law.
We only disclose Personal Health Information with: a) your proper written authorization; or b) as otherwise allowed or required by law.
Our employees have access to Personal Information in the course of doing their jobs, such as: a) underwriting policies; b) paying claims; c) developing new products; or d) advising customers of our products and services. |
|
We use manual and electronic security procedures to maintain: a) the confidentiality; and b) the integrity of; Personal Information that we have. We use these procedures to guard against unauthorized access.
Some techniques we use to protect Personal Information include: a) secured files; b) user authentication; c) encryption; d) firewall technology; and e) the use of detection software.
We are responsible for and must: a) identify information to be protected; b) provide an adequate level of protection for that data; c) grant access to protected data only to those people who must use it in the performance of their job-related duties.
Employees who violate our Privacy Policy will be subject to discipline, which may include ending their employment with us.
At the start of our business relationship, we will give You a copy of our current Privacy Policy.
We will also give You a copy of our current Privacy Policy once a year if You maintain a continuing business relationship with us.
We will continue to follow our Privacy Policy regarding Personal Information even when a business relationship no longer exists between us.
|
As used in this Privacy Notice:
Application means your request for our product or service.
Personal Financial Information means financial information such as: a) credit history; b) income; c) financial benefits; or d) policy or claim information.
Personal Health Information means health information such as: a) your medical records; or b) information about your illness, disability or injury.
Personal Information means information that identifies You personally and is not otherwise available to the public. It includes: a) Personal Financial Information; and b) Personal Health Information.
Transaction means your business dealings with us, such as: a) your Application; b) your request for us to pay a claim; and c) your request for us to take an action on your account.
You means an individual who has given us Personal Information in conjunction with: a) asking about; b) applying for; or c) obtaining; a financial product or service from us if the product or service is used mainly for personal, family, or household purposes. |
This Privacy Policy is being provided on behalf of the following affiliates of The Hartford Financial Services Group, Inc.:
1stAGChoice, Inc.; Access CoverageCorp, Inc.; Access CoverageCorp Technologies, Inc.; American Maturity Life Insurance Company; Archway 60 R, LLC; Business Management Group, Inc.; Champlain Life Reinsurance Company; DMS R, LLC; Eloy R, LLC; Ersatz Corporation; First State Insurance Company; Hartford Accident and Indemnity Company; Hartford Administrative Services Company; Hartford Casualty General Agency, Inc.; Hartford Casualty Insurance Company; Hartford-Comprehensive Employee Benefit Service Company; Hartford Equity Sales Company, Inc.; Hartford Fire General Agency, Inc.; Hartford Fire Insurance Company; Hartford Funds Management Company, LLC; Hartford Funds Management Group, Inc.; Hartford HLS Series Fund II, Inc.; Hartford Insurance Company of Illinois; Hartford Insurance Company of the Midwest; Hartford Insurance Company of the Southeast; Hartford Integrated Technologies, Inc.; Hartford International Life Reassurance Corporation; Hartford Funds Distributors, LLC; Hartford Investment Management Company; Hartford Life and Accident Insurance Company; Hartford Life and Annuity Insurance Company; Hartford Life Insurance Company; Hartford Life Private Placement, LLC; Hartford Lloyd’s Corporation; Hartford Lloyd’s Insurance Company; Hartford Mezzanine Investors I, LLC; Hartford Residual Market, L.C.C.; Hartford Retirement Services, LLC; Hartford Securities Distribution Company, Inc.; Hartford Series Fund, Inc.; Hartford Specialty Insurance Services of Texas, LLC; Hartford Strategic Investments, LLC; Hartford Underwriters Insurance Company; Hartford Technology Services Company, L.L.C.; Hartford of Texas General Agency, Inc.; Hartford Underwriters General Agency, Inc.; HARTRE Company, L.C.C.; HL Investment Advisors, LLC; HLA LLC; Horizon Management Group, LLC; HRA Brokerage Services, Inc.; Lanidex Class B, LLC; M-CAP Insurance Agency, LLC; New England Insurance Company; New England Reinsurance Corporation; Nutmeg Insurance Agency, Inc.; Nutmeg Insurance Company; Pacific Insurance Company, Limited; Planco, LLC: Property and Casualty Insurance Company of Hartford; Revere R, LLC; RVR R, LLC; Sentinel Insurance Company, Ltd.; Sunstone R, LLC; Symphony R, LLC; The Evergreen Group Incorporated; The Hartford Alternative Strategies Fund; The Hartford Mutual Funds, Inc.; The Hartford Mutual Funds II, Inc.; Trumbull Flood Management, L.L.C.; Trumbull Insurance Company; Twin City Fire Insurance Company; White River Life Reinsurance Company.
HPP Revised January 2014
HARTFORDFUNDS
hartfordfunds.com
This information is written in connection with the promotion or marketing of the matter(s) addressed in this material.
This report is submitted for the general information of the shareholders of the Fund. It is not authorized for distribution unless preceded or accompanied by a current prospectus for the Fund.
The information cannot be used or relied upon for the purpose of avoiding IRS penalties. These materials are not intended to provide tax, accounting or legal advice. As with all matters of a tax or legal nature, you should consult your own tax or legal counsel for advice.
Investors should carefully consider the investment objectives, risks, charges, and expenses of Hartford Funds before investing. This and other information can be found in the prospectus and summary prospectus, which can be obtained by calling 888-843-7824 (retail) or 800-279-1541 (institutional). Investors should read them carefully before they invest.
Hartford Funds are underwritten and distributed by Hartford Funds Distributors, LLC.
MFAR-RTR14 12/14 115857-1 Printed in U.S.A.
HARTFORDFUNDS
|
THE HARTFORD
SHORT DURATION FUND
2014 Annual Report |
A MESSAGE FROM THE PRESIDENT
Dear Fellow Shareholders:
Thank you for investing in Hartford Funds.
Market Review
U.S. equities (as represented by the S&P 500 Index) rose steadily for the fiscal year ended October 31, 2014, with a return of 17.27% for the period. With the exception of short-lived geopolitical scares early in 2014 and concerns about continuing global growth near the end of the period, stocks generally rose on solid fundamentals and encouraging macroeconomic data during the year.
September 2014 marked the six-year anniversary of the start of the financial crisis. Within weeks of that anniversary, both the S&P 500 Index and the Dow Jones Industrial Average set new all-time highs, closing at 2,018 and 17,391, respectively, on October 31. Although the fallout of the crisis continues to influence investor behavior, stocks have recovered and risen dramatically, up 198% from their low in March 2009. Meanwhile, the domestic economy is notching strong growth, and the unemployment rate has reached its lowest level since August 2008.
While the U.S. economy appears to have stabilized and to have reverted to a solid growth path, the outlook for the global economy appears to have gotten cloudier. The U.S. Federal Reserve has ended quantitative easing, while Europe and Japan are pursuing stimulus options to avoid a double-dip recession and deflation, respectively. Diverging central-bank policies will likely continue to play an important role in market movements going forward as investors wait to see the reactions to their efforts and their impacts on global markets.
How have market movements impacted your portfolio throughout the last year? Are your investments still on track to provide the growth or income you need, and are you comfortable with their progress during times of volatility?
Your financial professional can help you navigate today’s markets with confidence, as well as assist you to achieve your investment goals by providing advice on the best options within our fund family to help you work toward overcoming today’s investing challenges. Meet with your financial advisor regularly to examine your portfolio and your investment strategy, and to determine if you’re still on track to meet your goals.
Thank you again for investing with Hartford Funds.
James Davey
President
Hartford Funds
1 The S&P 500 Index is a market capitalization-weighted price index composed of 500 widely held common stocks.
2 The Dow Jones Industrial Average is an unmanaged, price-weighted index of 30 of the largest, most widely held stocks traded on the NYSE
The Hartford Short Duration Fund
Table of Contents
The views expressed in the Fund’s Manager Discussion under ‘‘Why did the Fund perform this way?’’ and ‘‘What is the outlook?’’ are views of the Fund’s sub-adviser and portfolio management team through the end of the period and are subject to change based on market and other conditions. The Fund’s Manager Discussion is for informational purposes only and does not represent an offer, recommendation or solicitation to buy, hold or sell any security. The specific securities identified and described, if any, do not represent all of the securities purchased or sold and you should not assume that investments in the securities identified and discussed will be profitable.
| The Hartford Short Duration Fund inception 10/31/2002 |
| (sub-advised by Wellington Management Company, LLP) |
| Investment objective – The Fund seeks to provide current income and long-term total return. |
Performance Overview 10/31/04 - 10/31/14
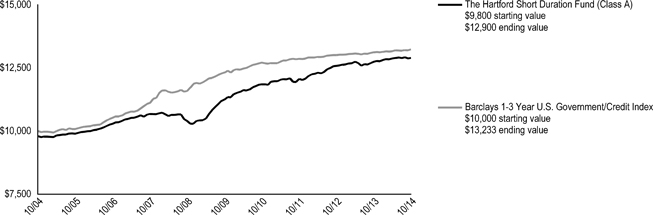
The chart above represents the hypothetical growth of a $10,000 investment in Class A, which includes a sales charge. Growth results in classes other than Class A will vary from what is seen above due to differences in the expenses charged to those share classes.
| Average Annual Total Returns (as of 10/31/14) |
| 1 Year | 5 Years | 10 Years | ||||||||||
| Short Duration A# | 1.23 | % | 2.77 | % | 2.79 | % | ||||||
| Short Duration A## | -0.79 | % | 2.35 | % | 2.58 | % | ||||||
| Short Duration B# | 1.33 | % | 2.68 | % | 2.31 | %* | ||||||
| Short Duration B## | -3.64 | % | 2.32 | % | 2.31 | %* | ||||||
| Short Duration C# | 0.48 | % | 2.01 | % | 2.02 | % | ||||||
| Short Duration C## | -0.51 | % | 2.01 | % | 2.02 | % | ||||||
| Short Duration I# | 1.52 | % | 3.08 | % | 2.94 | % | ||||||
| Short Duration R3# | 0.84 | % | 2.70 | % | 2.89 | % | ||||||
| Short Duration R4# | 1.14 | % | 2.91 | % | 3.00 | % | ||||||
| Short Duration R5# | 1.54 | % | 3.10 | % | 3.09 | % | ||||||
| Short Duration Y# | 1.49 | % | 3.11 | % | 3.10 | % | ||||||
| Barclays 1-3 Year U.S. Government/Credit Index | 0.89 | % | 1.45 | % | 2.84 | % | ||||||
| # | Without sales charge |
| ## | With sales charge |
| * | Class B shares convert to Class A shares after 8 years. The return shown reflects the conversion to Class A shares, which had different operating expenses, for the period after conversion. |
PERFORMANCE DATA QUOTED REPRESENTS PAST PERFORMANCE AND DOES NOT GUARANTEE FUTURE RESULTS. The investment return and principal value of the investment will fluctuate so that investors’ shares, when redeemed, may be worth more or less than their original cost. Current performance may be lower or higher than the performance data quoted. To obtain performance data current to the most recent month-end, please visit our website www.hartfordfunds.com.
The initial investment in Class A shares reflects the maximum sales charge of 2.00% and returns for Class B shares reflect a contingent deferred sales charge of up to 5.00% and declining to zero, depending on the period of time the shares are held. Returns for Class C shares reflect a contingent deferred sales charge of up to 1.00% on shares redeemed within twelve months of purchase.
Total returns presented above were calculated using the Fund’s net asset value available to shareholders for sale or redemption of Fund shares on October 31, 2014, which may exclude investment transactions as of this date. All share class returns assume the reinvestment of all distributions at net asset value and the deduction of all fund expenses.
Effective 9/30/09, Class B shares of the Fund were closed to new investments.
Class I shares commenced operations on 2/26/10. Performance prior to that date is that of the Fund’s Class A shares (excluding sales charges), which had different operating expenses. Class R3, R4 and R5 shares commenced operations on 9/30/11. Performance prior to that date is that of the Fund’s Class Y shares, which had different operating expenses.
Performance information includes performance under the Fund’s previous sub-adviser, Hartford Investment Management Company, using a modified investment strategy. As of March 5, 2012, Hartford Investment Management Company no longer served as the sub-adviser to the Fund.
Barclays 1-3 Year U.S. Government/Credit Index is an unmanaged index comprised of the U.S. Government/Credit component of the U.S. Aggregate Index. The 1-3 Year U.S. Government/Credit Index includes securities in the 1-3 year maturity range in the U.S. Government/Credit Index.
You cannot invest directly in an index.
The chart and table do not reflect the deductions of taxes that a shareholder would pay on Fund distributions or the redemption of Fund shares.
Performance information may reflect historical or current expense waivers/reimbursements from the investment adviser, without which performance would have been lower. For information on current expense waivers/reimbursements, please see the prospectus.
| 2 |
| The Hartford Short Duration Fund |
| Manager Discussion |
| October 31, 2014 (Unaudited) |
| Operating Expenses* | ||||||||
| Net | Gross | |||||||
| Short Duration Class A | 0.85 | % | 0.88 | % | ||||
| Short Duration Class B | 1.60 | % | 1.74 | % | ||||
| Short Duration Class C | 1.60 | % | 1.60 | % | ||||
| Short Duration Class I | 0.57 | % | 0.57 | % | ||||
| Short Duration Class R3 | 1.15 | % | 1.23 | % | ||||
| Short Duration Class R4 | 0.85 | % | 0.92 | % | ||||
| Short Duration Class R5 | 0.55 | % | 0.61 | % | ||||
| Short Duration Class Y | 0.51 | % | 0.51 | % | ||||
| * | As shown in the Fund's current prospectus dated March 1, 2014. Actual expenses may be higher or lower. Please see accompanying Financial Highlights for expense ratios for the year ended October 31, 2014. |
Gross expenses are the Fund's total annual operating expenses shown in the Fund's most recent prospectus. Net expenses are the Fund's total annual operating expenses shown in the Fund's most recent prospectus and reflect contractual expense reimbursements in instances when these reductions reduce the Fund's gross expenses. Contractual reimbursements remain in effect until February 28, 2015, and automatically renew for one-year terms unless terminated.
All investments are subject to risk including the possible loss of principal. For a discussion of the Fund’s risks, please see the Main Risks section of this report. For more detailed information on the risks associated with an investment in the Fund, please see the prospectus.
| Portfolio Manager |
| Timothy E. Smith |
| Senior Vice President and Fixed Income Portfolio Manager |
How did the Fund perform?
The Class A shares of The Hartford Short Duration Fund returned 1.23%, before sales charge, for the twelve-month period ended October 31, 2014, outperforming the Fund’s benchmark, the Barclays 1-3 Year U.S. Government/Credit Index, which returned 0.89% for the same period. The Fund also outperformed the 1.12% average return of the Lipper Short Investment Grade Debt Funds peer group, a group of funds with investment strategies similar to those of the Fund.
Why did the Fund perform this way?
Fixed income markets gained throughout much of the period as expectations of prolonged easy monetary policy by major central banks and a supportive macroeconomic environment kept rates low and suppressed volatility. Early in the period emerging markets dominated headlines as economic and political developments sparked risk aversion across global markets, pushing bond prices higher and yields lower amid a flight to quality. Toward the end of the period, however, persistent geopolitical risks – tensions between Ukraine and Russia and violence in Iraq – and Chinese economic slowdown concerns raised questions about the global growth rate, keeping a lid on risk appetites overall.
The period was also highlighted by a divergence in central bank policies. The European Central Bank (ECB) cut its benchmark lending and deposit rates and announced a host of stimulus measures in an effort to encourage lending and fend off fears of deflation. China’s central bank joined the ECB in boosting liquidity by injecting funds into the nation’s largest banks in an attempt to combat weakening growth. The Bank of Japan pre-emptively announced incremental monetary easing to counter the risk of missing the country’s inflation and growth targets. In contrast, the Bank of England and U.S. Federal Reserve (Fed) leaned toward tighter policies. The Fed ended its quantitative easing program as U.S. data largely suggested the economy was on a sustainable growth path. Second quarter Gross Domestic Product (GDP) rebounded after the first quarter’s steep contraction. The labor market strengthened as the unemployment rate dropped to a six-year low. Housing regained some lost ground after a weak start to the year, though the pace of home price appreciation started to slow after a strong 2013. Inflation pressures were muted overall, alleviating pressure on the Fed to raise rates.
The U.S. Treasury curve flattened as markets contemplated bringing interest rates to normal levels; short-term yields rose while longer term rates declined. Most credit risk sectors posted positive absolute returns and outperformed duration-equivalent government bonds as credit spreads tightened.
Our out-of-benchmark allocation to bank loans and overweight to and security selection within investment grade corporates were the top contributors to benchmark-relative outperformance during the period. Within investment grade credit, our overweight to Financials and overweight to and security selection within Industrials contributed positively during the period. Our out-of-benchmark allocations to Mortgage Backed Securities (MBS), both agency and non-agency, were additive. Exposures to both Commercial Mortgage Backed Securities (CMBS) and Asset Backed Securities (ABS) were also favorable for relative results. Our overweight to the 5-year portion of the yield curve detracted from performance, offset partially by our underweight to the 2-year portion.
Derivatives are not used in a significant manner in this Fund and did not have a material impact on performance during the period.
What is the outlook?
We believe U.S. economic momentum remains positive. U.S. employment, payrolls and consumer confidence continue to improve, although challenges to global growth have increased. On balance, the Fund maintains a moderately pro-cyclical risk posture. We also
| 3 |
| The Hartford Short Duration Fund |
| Manager Discussion – (continued) |
| October 31, 2014 (Unaudited) |
believe the Fed will begin increasing the Federal Funds Rate in mid-2015 and we expect core inflation to rise in 2015. With this in mind, we maintained a short duration posture at the end of the period.
Reflecting our belief that U.S. government securities remain the most liquid sector, we own select U.S. Agency securities maturing inside of 3 years. We maintain a limited agency MBS allocation as the Fed tapers purchases, and we own select prime non-agency MBS as they continue to pay down on attractive valuations and an uneven yet improving housing market. We continue to favor auto, equipment, and credit card ABS due to improving consumer fundamentals supported by an improving labor market, as well as senior tranches of CMBS deals on attractive valuations and long-term fundamentals. We believe the investment grade corporate bond market has strong credit fundamentals, and we continue to favor U.S. financials. We continue to favor bank loans over high yield bonds.
Credit Exposure
as of October 31, 2014
| Credit Rating * | Percentage of Net Assets | |||
| Aaa/ AAA | 17.9 | % | ||
| Aa/ AA | 8.5 | |||
| A | 21.3 | |||
| Baa/ BBB | 30.4 | |||
| Ba/ BB | 13.7 | |||
| B | 8.7 | |||
| Caa/ CCC or Lower | 0.0 | |||
| Not Rated | 0.6 | |||
| Short-Term Instruments | 0.8 | |||
| Other Assets and Liabilities | (1.9 | ) | ||
| Total | 100.0 | % | ||
| * | Credit exposure is the long-term credit ratings for the Fund's holdings, as of the date noted, as provided by Standard and Poor's (S&P) or Moody's Investors Service (Moody's) and typically range from AAA/Aaa (highest) to C/D (lowest). Presentation of S&P and Moody's credit ratings in this report have been selected for informational purposes for shareholders, as well as the Fund's consideration of industry practice. If Moody's and S&P assign different ratings, the lower rating is used. Fixed income securities that are not rated by either agency are listed as "Not Rated." Ratings do not apply to the Fund itself or to the Fund's shares. Ratings may change. |
Diversification by Security Type
as of October 31, 2014
| Category | Percentage of Net Assets | |||
| Fixed Income Securities | ||||
| Asset & Commercial Mortgage Backed Securities | 21.3 | % | ||
| Corporate Bonds | 54.9 | |||
| Municipal Bonds | 0.5 | |||
| Senior Floating Rate Interests | 19.3 | |||
| U.S. Government Agencies | 5.1 | |||
| Total | 101.1 | % | ||
| Short-Term Investments | 0.8 | |||
| Other Assets and Liabilities | (1.9 | ) | ||
| Total | 100.0 | % | ||
| 4 |
| The Hartford Short Duration Fund |
| Schedule of Investments |
| October 31, 2014 |
| (000’s Omitted) |
| Shares or Principal Amount | Market Value ╪ | |||||||
Asset and Commercial Mortgage Backed Securities - 21.3% | ||||||||
| Finance and Insurance - 20.9% | ||||||||
| Accredited Mortgage Loan Trust | ||||||||
| $ | 1,082 | 0.83%, 01/25/2035 Δ | $ | 1,062 | ||||
| Aegis Asset Backed Securities Trust | ||||||||
| 999 | 1.25%, 09/25/2034 Δ | 986 | ||||||
| Ally Master Owner Trust | ||||||||
| 1,280 | 1.00%, 02/15/2018 | 1,283 | ||||||
| 3,900 | 1.43%, 06/17/2019 | 3,900 | ||||||
| 2,695 | 1.54%, 09/15/2019 | 2,695 | ||||||
| American Credit Acceptance Receivables | ||||||||
| 894 | 1.45%, 04/16/2018 ■ | 897 | ||||||
| American Express Credit Account Master Trust | ||||||||
| 2,072 | 0.77%, 05/15/2018 | 2,074 | ||||||
| 455 | 0.98%, 05/15/2019 | 456 | ||||||
| American Tower Trust I | ||||||||
| 3,000 | 1.55%, 03/15/2043 ■‡ | 2,979 | ||||||
| AmeriCredit Automobile Receivables Trust | ||||||||
| 1,290 | 1.60%, 07/08/2019 | 1,285 | ||||||
| 2,000 | 2.72%, 09/09/2019 | 2,045 | ||||||
| Apidos CLO | ||||||||
| 2,250 | 1.33%, 04/15/2025 ■Δ | 2,212 | ||||||
| 1,495 | 1.71%, 04/17/2026 ■Δ | 1,487 | ||||||
| Bayview Commercial Asset Trust | ||||||||
| 4,926 | 3.32%, 01/25/2037 ■► | 1 | ||||||
| 5,274 | 3.51%, 09/25/2037 ■► | 276 | ||||||
| Bear Stearns Commercial Mortgage Securities, Inc. | ||||||||
| 1,749 | 5.41%, 12/11/2040 | 1,802 | ||||||
| Carlyle Global Market Strategies | ||||||||
| 870 | 1.38%, 04/18/2025 ■Δ | 855 | ||||||
| 2,750 | 2.33%, 07/20/2023 ■Δ | 2,689 | ||||||
| CarMax Automotive Owner Trust | ||||||||
| 395 | 1.50%, 08/15/2018 | 400 | ||||||
| CBA Commercial Small Balance Commercial Mortgage | ||||||||
| 4,123 | 5.80%, 01/25/2039 ■► | — | ||||||
| Cent CLO L.P. | ||||||||
| 1,500 | 1.71%, 01/25/2026 ■Δ | 1,493 | ||||||
| CFCRE Commercial Mortgage Trust | ||||||||
| 1,429 | 3.76%, 04/15/2044 ■ | 1,478 | ||||||
| Chesapeake Funding LLC | ||||||||
| 859 | 0.61%, 01/07/2025 ■Δ | 858 | ||||||
| Chrysler Capital Automotive Rec Trust | ||||||||
| 975 | 0.91%, 04/16/2018 ■ | 977 | ||||||
| CIFC Funding Ltd. | ||||||||
| 2,125 | 1.38%, 04/16/2025 ■Δ | 2,085 | ||||||
| 2,180 | 2.34%, 08/14/2024 ■Δ | 2,134 | ||||||
| Citigroup Commercial Mortgage Trust | ||||||||
| 1,445 | 0.69%, 09/10/2045 | 1,445 | ||||||
| Citigroup/Deutsche Bank Commercial Mortgage Trust | ||||||||
| 3,475 | 5.32%, 12/11/2049 | 3,714 | ||||||
| 3,474 | 5.89%, 11/15/2044 ‡ | 3,817 | ||||||
| Commercial Mortgage Pass-Through Certificates | ||||||||
| 778 | 0.67%, 11/15/2045 | 775 | ||||||
| 1,075 | 0.70%, 10/15/2045 | 1,070 | ||||||
| 760 | 0.82%, 08/15/2045 | 759 | ||||||
| 1,527 | 1.30%, 03/10/2047 | 1,524 | ||||||
| 1,053 | 1.34%, 07/10/2045 | 1,061 | ||||||
| 2,341 | 3.16%, 07/10/2046 ■ | 2,374 | ||||||
| Community or Commercial Mortgage Trust | ||||||||
| 1,194 | 1.28%, 08/10/2046 | 1,195 | ||||||
| Connecticut Avenue Securities Series | ||||||||
| 2,408 | 1.10%, 05/25/2024 Δ | 2,369 | ||||||
| 3,987 | 1.35%, 07/25/2024 Δ | 3,947 | ||||||
| Countrywide Asset-Backed Certificates | ||||||||
| 991 | 0.78%, 03/25/2035 Δ | 990 | ||||||
| Credit Acceptance Automotive Loan Trust | ||||||||
| 1,650 | 1.50%, 04/15/2021 ■ | 1,655 | ||||||
| 1,380 | 1.55%, 10/15/2021 ■ | 1,381 | ||||||
| 228 | 2.20%, 09/16/2019 ■ | 229 | ||||||
| Credit Suisse Mortgage Capital Certificates | ||||||||
| 2,934 | 5.47%, 09/15/2039 | 3,115 | ||||||
| DBUBS Mortgage Trust | ||||||||
| 2,946 | 1.55%, 01/01/2021 ■► | 76 | ||||||
| 1,345 | 3.64%, 08/10/2044 | 1,397 | ||||||
| 2,355 | 3.74%, 11/10/2046 ■ | 2,426 | ||||||
| Dryden Senior Loan Fund | ||||||||
| 1,460 | 1.58%, 04/18/2026 ■Δ | 1,443 | ||||||
| First Franklin Mortgage Loan Trust | ||||||||
| 471 | 0.58%, 05/25/2035 Δ | 469 | ||||||
| First Investors Automotive Owner Trust | ||||||||
| 1,270 | 1.23%, 03/15/2019 ■ | 1,275 | ||||||
| Ford Credit Automotive Lease Trust | ||||||||
| 560 | 0.76%, 09/15/2016 | 561 | ||||||
| Ford Credit Automotive Owner Trust | ||||||||
| 2,500 | 2.62%, 10/15/2016 ‡ | 2,531 | ||||||
| Ford Credit Floorplan Master Owner Trust | ||||||||
| 1,070 | 0.70%, 06/15/2020 Δ | 1,076 | ||||||
| 435 | 1.40%, 02/15/2019 | 435 | ||||||
| FREMF Mortgage Trust | ||||||||
| 2,320 | 3.08%, 10/25/2047 ■ | 2,305 | ||||||
| Gramercy Park CLO Ltd. | ||||||||
| 1,700 | 2.13%, 07/17/2023 ■Δ | 1,663 | ||||||
| Granite Master Issuer plc | ||||||||
| 2,825 | 0.24%, 12/20/2054 Δ | 2,802 | ||||||
| 2,718 | 0.30%, 12/20/2054 Δ | 2,698 | ||||||
| GS Mortgage Securities Trust | ||||||||
| 1,032 | 0.66%, 11/10/2045 | 1,027 | ||||||
| 731 | 1.21%, 07/10/2046 | 733 | ||||||
| 1,500 | 5.55%, 04/10/2038 | 1,556 | ||||||
| Hasco HIM Trust | ||||||||
| 50 | 0.00%, 12/26/2035 ■●† | — | ||||||
| Hilton USA Trust | ||||||||
| 1,320 | 1.16%, 11/05/2030 ■Δ | 1,320 | ||||||
| Home Equity Asset Trust | ||||||||
| 2,196 | 0.79%, 11/25/2034 Δ | 2,182 | ||||||
| ING Investment Management CLO Ltd. | ||||||||
| 1,455 | 1.77%, 04/18/2026 ■Δ | 1,448 | ||||||
| 2,000 | 2.08%, 03/14/2022 ■Δ | 1,962 | ||||||
| JP Morgan Chase Commercial Mortgage Securities Corp. | ||||||||
| 393 | 0.71%, 10/15/2045 Δ | 393 | ||||||
| 1,391 | 1.30%, 01/15/2046 | 1,398 | ||||||
| 950 | 3.36%, 11/13/2044 ■ | 988 | ||||||
| 1,307 | 3.85%, 06/15/2043 ■ | 1,320 | ||||||
| 279 | 4.93%, 09/12/2037 | 279 | ||||||
| 2,000 | 5.40%, 12/15/2044 Δ | 2,054 | ||||||
| 1,745 | 6.06%, 04/15/2045 Δ | 1,839 | ||||||
The accompanying notes are an integral part of these financial statements.
| 5 |
| The Hartford Short Duration Fund |
| Schedule of Investments – (continued) |
| October 31, 2014 |
| (000’s Omitted) |
| Shares or Principal Amount | Market Value ╪ | |||||||
Asset and Commercial Mortgage Backed Securities - 21.3% - (continued) | ||||||||
| Finance and Insurance - 20.9% - (continued) | ||||||||
| Limerock CLO | ||||||||
| $ | 2,000 | 1.73%, 04/18/2026 ■Δ | $ | 1,985 | ||||
| Long Beach Asset Holdings Corp. | ||||||||
| 180 | 0.00%, 04/25/2046 ■● | — | ||||||
| M&T Bank Automotive Receivables Trust | ||||||||
| 1,595 | 1.57%, 01/15/2017 ■ | 1,611 | ||||||
| Magnetite CLO Ltd. | ||||||||
| 4,680 | 2.23%, 07/25/2026 ■Δ | 4,541 | ||||||
| Master Credit Card Trust | ||||||||
| 1,365 | 0.78%, 04/21/2017 ■ | 1,366 | ||||||
| Merrill Lynch Mortgage Trust | ||||||||
| 464 | 6.03%, 06/12/2050 Δ | 465 | ||||||
| Merrill Lynch/Countrywide Commercial Mortgage Trust | ||||||||
| 122 | 5.11%, 12/12/2049 | 122 | ||||||
| 637 | 5.38%, 08/12/2048 | 683 | ||||||
| MMAF Equipment Finance LLC | ||||||||
| 2,670 | 1.59%, 02/08/2022 ■‡ | 2,660 | ||||||
| Morgan Stanley ABS Capital I | ||||||||
| 1,395 | 0.91%, 01/25/2035 Δ | 1,374 | ||||||
| Morgan Stanley BAML Trust | ||||||||
| 490 | 0.66%, 11/15/2045 | 488 | ||||||
| Morgan Stanley Capital I | ||||||||
| 1,298 | 3.22%, 07/15/2049 | 1,346 | ||||||
| 1,500 | 3.88%, 09/15/2047 ■ | 1,541 | ||||||
| 2,297 | 4.99%, 08/13/2042 | 2,317 | ||||||
| Morgan Stanley Re-Remic Trust | ||||||||
| 1,730 | 1.00%, 03/29/2051 ■ | 1,732 | ||||||
| Motor plc | ||||||||
| 53 | 1.29%, 02/25/2020 ■ | 53 | ||||||
| National Credit Union Administration | ||||||||
| 385 | 1.60%, 10/29/2020 | 387 | ||||||
| Neuberger Berman CLO XVI Ltd. | ||||||||
| 1,470 | 1.70%, 03/01/2026 ■Δ | 1,457 | ||||||
| New York City Tax Lien | ||||||||
| 319 | 1.19%, 11/10/2026 ■ | 319 | ||||||
| Nissan Automotive Lease Trust | ||||||||
| 770 | 0.75%, 06/15/2016 | 771 | ||||||
| Octagon Investment Partners | ||||||||
| 2,500 | 1.35%, 07/17/2025 ■Δ | 2,451 | ||||||
| OHA Intrepid Leveraged Loan Fund Ltd. | ||||||||
| 999 | 1.15%, 04/20/2021 ■Δ | 999 | ||||||
| Prestige Automotive Receivables Trust | ||||||||
| 920 | 1.52%, 04/15/2020 ■ | 920 | ||||||
| Race Point CLO Ltd. | ||||||||
| 2,500 | 2.38%, 05/24/2023 ■Δ | 2,464 | ||||||
| Renaissance Home Equity Loan Trust | ||||||||
| 108 | 0.00%, 04/25/2037 ■● | — | ||||||
| Residential Asset Securities Corp. | ||||||||
| 48 | 0.38%, 01/25/2036 Δ | 48 | ||||||
| 1,176 | 5.39%, 07/25/2034 | 1,213 | ||||||
| Santander Drive Automotive Receivables Trust | ||||||||
| 1,960 | 3.64%, 05/15/2018 | 2,030 | ||||||
| SBA Tower Trust | ||||||||
| 2,060 | 2.90%, 10/15/2044 ■Δ | 2,065 | ||||||
| Silverstone Master Issuer plc | ||||||||
| 415 | 1.78%, 01/21/2055 ■Δ | 417 | ||||||
| SNAAC Automotive Receivables Trust | ||||||||
| 122 | 1.14%, 07/16/2018 ■ | 122 | ||||||
| Springleaf Funding Trust | ||||||||
| 2,125 | 2.41%, 12/15/2022 ■ | 2,130 | ||||||
| Springleaf Mortgage Loan Trust | ||||||||
| 559 | 1.27%, 06/25/2058 ■ | 557 | ||||||
| Structured Agency Credit Risk Debt Notes | ||||||||
| 1,301 | 1.00%, 04/25/2024 Δ | 1,286 | ||||||
| 604 | 1.15%, 02/25/2024 Δ | 598 | ||||||
| Structured Asset Investment Loan Trust | ||||||||
| 383 | 0.72%, 04/25/2035 Δ | 382 | ||||||
| Structured Asset Securities Corp. | ||||||||
| 1,009 | 0.30%, 02/25/2036 Δ | 995 | ||||||
| Symphony CLO Ltd. | ||||||||
| 4,035 | 1.98%, 01/09/2023 ■Δ | 3,983 | ||||||
| UBS Commercial Mortgage Trust | ||||||||
| 887 | 1.03%, 05/10/2045 | 890 | ||||||
| UBS-Barclays Commercial Mortgage Trust | ||||||||
| 1,683 | 0.73%, 08/10/2049 | 1,670 | ||||||
| Wachovia Bank Commercial Mortgage Trust | ||||||||
| 119 | 4.80%, 10/15/2041 | 119 | ||||||
| 726 | 4.94%, 04/15/2042 | 730 | ||||||
| 2,363 | 5.31%, 11/15/2048 ‡ | 2,523 | ||||||
| 2,387 | 5.45%, 12/15/2044 Δ | 2,462 | ||||||
| 1,500 | 5.48%, 04/15/2047 | 1,527 | ||||||
| Westlake Automobile Receivables Trust | ||||||||
| 766 | 1.12%, 07/15/2015 ■ | 767 | ||||||
| WF-RBS Commercial Mortgage Trust | ||||||||
| 1,747 | 0.67%, 11/15/2045 | 1,744 | ||||||
| World Omni Automotive Receivables Trust | ||||||||
| 1,500 | 2.33%, 09/15/2016 | 1,503 | ||||||
| 171,298 | ||||||||
| Real Estate, Rental and Leasing - 0.1% | ||||||||
| ARI Fleet Lease Trust | ||||||||
| 467 | 0.45%, 01/15/2021 ■Δ | 467 | ||||||
| Transportation Equipment Manufacturing - 0.3% | ||||||||
| GE Equipment Transportation LLC | ||||||||
| 2,500 | 0.92%, 09/25/2017 | 2,508 | ||||||
| Total Asset and Commercial Mortgage Backed Securities | ||||||||
| (Cost $176,658) | $ | 174,273 | ||||||
Corporate Bonds - 54.9% | ||||||||
| Accommodation and Food Services - 0.1% | ||||||||
| Sysco Corp. | ||||||||
| $ | 1,090 | 2.35%, 10/02/2019 | $ | 1,096 | ||||
| Arts, Entertainment and Recreation - 1.6% | ||||||||
| British Sky Broadcasting Group plc | ||||||||
| 1,770 | 2.63%, 09/16/2019 ■ | 1,775 | ||||||
| CBS Corp. | ||||||||
| 3,000 | 2.30%, 08/15/2019 | 2,961 | ||||||
| DirecTV Holdings LLC | ||||||||
| 915 | 1.75%, 01/15/2018 | 911 | ||||||
| 2,681 | 2.40%, 03/15/2017 | 2,746 | ||||||
| Echostar DBS Corp. | ||||||||
| 725 | 7.13%, 02/01/2016 | 771 | ||||||
| Fidelity National Information Services, Inc. | ||||||||
| 750 | 1.45%, 06/05/2017 | 747 | ||||||
The accompanying notes are an integral part of these financial statements.
| 6 |
| The Hartford Short Duration Fund |
| Schedule of Investments – (continued) |
| October 31, 2014 |
| (000’s Omitted) |
| Shares or Principal Amount | Market Value ╪ | |||||||
Corporate Bonds - 54.9% - (continued) | ||||||||
| Arts, Entertainment and Recreation - 1.6% - (continued) | ||||||||
| Time Warner Cable, Inc. | ||||||||
| $ | 2,000 | 5.85%, 05/01/2017 | $ | 2,210 | ||||
| Viacom, Inc. | ||||||||
| 955 | 2.20%, 04/01/2019 | 946 | ||||||
| 13,067 | ||||||||
| Beverage and Tobacco Product Manufacturing - 1.6% | ||||||||
| Anheuser-Busch InBev Worldwide, Inc. | ||||||||
| 3,730 | 1.38%, 07/15/2017 | 3,739 | ||||||
| Constellation Brands, Inc. | ||||||||
| 1,210 | 7.25%, 09/01/2016 | 1,322 | ||||||
| Diageo Capital plc | ||||||||
| 3,275 | 1.50%, 05/11/2017 | 3,294 | ||||||
| Imperial Tobacco Finance plc | ||||||||
| 2,000 | 2.05%, 02/11/2018 ■ | 1,998 | ||||||
| Lorillard Tobacco Co. | ||||||||
| 180 | 2.30%, 08/21/2017 | 182 | ||||||
| Molson Coors Brewing Co. | ||||||||
| 311 | 2.00%, 05/01/2017 | 316 | ||||||
| Pernod-Ricard S.A. | ||||||||
| 1,000 | 2.95%, 01/15/2017 ■ | 1,030 | ||||||
| Reynolds American, Inc. | ||||||||
| 1,300 | 1.05%, 10/30/2015 | 1,302 | ||||||
| 13,183 | ||||||||
| Chemical Manufacturing - 0.5% | ||||||||
| Ecolab, Inc. | ||||||||
| 375 | 1.45%, 12/08/2017 | 374 | ||||||
| Monsanto Co. | ||||||||
| 1,820 | 2.13%, 07/15/2019 | 1,815 | ||||||
| Yara International ASA | ||||||||
| 1,750 | 5.25%, 12/15/2014 ■ | 1,759 | ||||||
| 3,948 | ||||||||
| Computer and Electronic Product Manufacturing - 0.6% | ||||||||
| Hewlett-Packard Co. | ||||||||
| 2,000 | 1.17%, 01/14/2019 Δ | 1,993 | ||||||
| 1,090 | 2.75%, 01/14/2019 | 1,096 | ||||||
| Thermo Fisher Scientific, Inc. | ||||||||
| 1,225 | 1.30%, 02/01/2017 | 1,224 | ||||||
| YMobile Corp. | ||||||||
| 500 | 8.25%, 04/01/2018 ■ | 527 | ||||||
| 4,840 | ||||||||
| Electrical Equipment, Appliance Manufacturing - 0.3% | ||||||||
| Whirlpool Corp. | ||||||||
| 1,235 | 1.35%, 03/01/2017 | 1,231 | ||||||
| 1,400 | 2.40%, 03/01/2019 | 1,400 | ||||||
| 2,631 | ||||||||
| Fabricated Metal Product Manufacturing - 0.2% | ||||||||
| Masco Corp. | ||||||||
| 1,450 | 4.80%, 06/15/2015 | 1,477 | ||||||
| Finance and Insurance - 32.3% | ||||||||
| Abbey National Treasury Services plc | ||||||||
| 2,300 | 3.05%, 08/23/2018 | 2,392 | ||||||
| ABN Amro Bank N.V. | ||||||||
| 1,500 | 1.38%, 01/22/2016 ■ | 1,510 | ||||||
| 1,429 | 4.25%, 02/02/2017 ■ | 1,516 | ||||||
| AerCap Ireland Capital Ltd. | ||||||||
| 1,665 | 2.75%, 05/15/2017 ■ | 1,644 | ||||||
| American Express Credit Corp. | ||||||||
| 3,225 | 1.13%, 06/05/2017 | 3,209 | ||||||
| 2,000 | 2.25%, 08/15/2019 | 2,000 | ||||||
| American Honda Finance Corp. | ||||||||
| 675 | 1.60%, 02/16/2018 ■ | 675 | ||||||
| American International Group, Inc. | ||||||||
| 4,000 | 2.30%, 07/16/2019 | 4,021 | ||||||
| Banco Santander Brasil S.A. | ||||||||
| 980 | 4.25%, 01/14/2016 ■ | 1,007 | ||||||
| Bank of America Corp. | ||||||||
| 2,200 | 1.30%, 03/22/2018 Δ | 2,232 | ||||||
| 2,500 | 1.70%, 08/25/2017 | 2,500 | ||||||
| 4,375 | 2.00%, 01/11/2018 | 4,386 | ||||||
| 2,500 | 2.65%, 04/01/2019 | 2,523 | ||||||
| Bank of Montreal | ||||||||
| 1,500 | 2.38%, 01/25/2019 | 1,516 | ||||||
| Bank of New York Mellon Corp. | ||||||||
| 1,500 | 1.97%, 06/20/2017 Δ | 1,529 | ||||||
| 1,750 | 2.20%, 05/15/2019 | 1,756 | ||||||
| 1,500 | 2.30%, 09/11/2019 | 1,502 | ||||||
| Bank of Nova Scotia | ||||||||
| 1,000 | 1.30%, 07/21/2017 | 999 | ||||||
| 1,500 | 1.38%, 12/18/2017 | 1,497 | ||||||
| Bank of Tokyo-Mitsubishi UFJ Ltd. | ||||||||
| 3,250 | 2.35%, 09/08/2019 ■ | 3,232 | ||||||
| Barclays Bank plc | ||||||||
| 2,500 | 6.05%, 12/04/2017 ■ | 2,770 | ||||||
| BB&T Corp. | ||||||||
| 2,000 | 0.90%, 02/01/2019 Δ | 2,017 | ||||||
| 1,245 | 1.09%, 06/15/2018 Δ | 1,263 | ||||||
| 815 | 1.60%, 08/15/2017 | 818 | ||||||
| BNP Paribas | ||||||||
| 1,650 | 2.38%, 09/14/2017 | 1,682 | ||||||
| 2,000 | 2.70%, 08/20/2018 | 2,043 | ||||||
| BP Capital Markets plc | ||||||||
| 1,750 | 0.87%, 09/26/2018 Δ | 1,761 | ||||||
| 2,250 | 1.85%, 05/05/2017 | 2,281 | ||||||
| BPCE S.A. | ||||||||
| 3,500 | 1.08%, 02/10/2017 Δ | 3,531 | ||||||
| 3,040 | 2.50%, 12/10/2018 - 07/15/2019 | 3,049 | ||||||
| Capital One Bank | ||||||||
| 2,500 | 2.30%, 06/05/2019 | 2,486 | ||||||
| Capital One Financial Corp. | ||||||||
| 1,190 | 2.45%, 04/24/2019 | 1,193 | ||||||
| Caterpillar Financial Services Corp. | ||||||||
| 3,000 | 2.10%, 06/09/2019 | 3,009 | ||||||
| CIGNA Corp. | ||||||||
| 503 | 2.75%, 11/15/2016 | 519 | ||||||
| CIT Group, Inc. | ||||||||
| 2,500 | 4.25%, 08/15/2017 | 2,569 | ||||||
| 1,250 | 5.00%, 05/15/2017 | 1,309 | ||||||
| Citigroup, Inc. | ||||||||
| 157 | 1.25%, 01/15/2016 | 158 | ||||||
| 3,600 | 1.55%, 08/14/2017 | 3,591 | ||||||
| 965 | 2.50%, 07/29/2019 | 968 | ||||||
| 3,000 | 2.55%, 04/08/2019 | 3,031 | ||||||
| 2,000 | 5.50%, 02/15/2017 | 2,174 | ||||||
| CNA Financial Corp. | ||||||||
| 2,000 | 6.50%, 08/15/2016 | 2,187 | ||||||
| CNH Capital LLC | ||||||||
| 1,750 | 3.88%, 11/01/2015 | 1,772 | ||||||
| Compass Bank | ||||||||
| 1,555 | 2.75%, 09/29/2019 | 1,566 | ||||||
The accompanying notes are an integral part of these financial statements.
| 7 |
| The Hartford Short Duration Fund |
| Schedule of Investments – (continued) |
| October 31, 2014 |
| (000’s Omitted) |
| Shares or Principal Amount | Market Value ╪ | |||||||
Corporate Bonds - 54.9% - (continued) | ||||||||
| Finance and Insurance - 32.3% - (continued) | ||||||||
| Corporacion Andina De Fomento | ||||||||
| $ | 1,500 | 3.75%, 01/15/2016 | $ | 1,552 | ||||
| Credit Suisse New York | ||||||||
| 850 | 1.38%, 05/26/2017 | 848 | ||||||
| 2,250 | 2.30%, 05/28/2019 | 2,245 | ||||||
| Deutsche Bank AG London | ||||||||
| 2,000 | 1.35%, 05/30/2017 | 1,988 | ||||||
| DNB Bank ASA | ||||||||
| 2,000 | 3.20%, 04/03/2017 ■ | 2,090 | ||||||
| Federal National Mortgage Association | ||||||||
| 10,000 | 1.00%, 09/27/2017 ‡ | 9,993 | ||||||
| Fifth Third Bancorp | ||||||||
| 4,250 | 2.38%, 04/25/2019 ‡ | 4,274 | ||||||
| Ford Motor Credit Co. LLC | ||||||||
| 2,000 | 1.72%, 12/06/2017 | 1,988 | ||||||
| 3,500 | 2.38%, 01/16/2018 | 3,534 | ||||||
| General Electric Capital Corp. | ||||||||
| 3,000 | 2.30%, 04/27/2017 | 3,080 | ||||||
| 1,250 | 2.90%, 01/09/2017 | 1,302 | ||||||
| Goldman Sachs Group, Inc. | ||||||||
| 4,000 | 1.33%, 11/15/2018 Δ | 4,041 | ||||||
| 4,000 | 2.38%, 01/22/2018 | 4,037 | ||||||
| 1,000 | 2.55%, 10/23/2019 | 994 | ||||||
| 1,279 | 3.63%, 02/07/2016 | 1,320 | ||||||
| Harley-Davidson Financial Services, Inc. | ||||||||
| 840 | 2.40%, 09/15/2019 ■ | 841 | ||||||
| Health Care REIT, Inc. | ||||||||
| 1,010 | 2.25%, 03/15/2018 | 1,022 | ||||||
| 688 | 3.63%, 03/15/2016 | 713 | ||||||
| Host Hotels & Resorts L.P. | ||||||||
| 1,250 | 6.00%, 11/01/2020 | 1,333 | ||||||
| HSBC Bank plc | ||||||||
| 1,775 | 0.87%, 05/15/2018 ■Δ | 1,790 | ||||||
| HSBC USA, Inc. | ||||||||
| 3,590 | 1.63%, 01/16/2018 | 3,588 | ||||||
| Humana, Inc. | ||||||||
| 690 | 2.63%, 10/01/2019 | 691 | ||||||
| Huntington National Bank | ||||||||
| 1,785 | 2.20%, 04/01/2019 | 1,782 | ||||||
| Hyundai Capital America | ||||||||
| 2,500 | 2.13%, 10/02/2017 ■ | 2,527 | ||||||
| ING Bank N.V. | ||||||||
| 2,395 | 2.50%, 10/01/2019 ■ | 2,409 | ||||||
| Intesa Sanpaolo S.p.A. | ||||||||
| 1,500 | 3.13%, 01/15/2016 | 1,532 | ||||||
| 2,000 | 3.88%, 01/15/2019 | 2,082 | ||||||
| JP Morgan Chase & Co. | ||||||||
| 3,000 | 1.35%, 02/15/2017 | 3,004 | ||||||
| 1,100 | 1.63%, 05/15/2018 | 1,088 | ||||||
| 3,000 | 1.80%, 01/25/2018 | 2,999 | ||||||
| 1,500 | 2.00%, 08/15/2017 | 1,518 | ||||||
| Key Bank NA | ||||||||
| 1,000 | 1.65%, 02/01/2018 | 998 | ||||||
| Lloyds Bank plc | ||||||||
| 980 | 2.30%, 11/27/2018 | 987 | ||||||
| 820 | 4.20%, 03/28/2017 | 874 | ||||||
| Macquarie Group Ltd. | ||||||||
| 2,500 | 3.00%, 12/03/2018 ■ | 2,574 | ||||||
| Manufacturers & Traders Trust Co. | ||||||||
| 2,500 | 2.25%, 07/25/2019 | 2,499 | ||||||
| 1,045 | 5.59%, 12/28/2020 | 1,088 | ||||||
| Marsh & McLennan Cos., Inc. | ||||||||
| 985 | 2.35%, 09/10/2019 | 989 | ||||||
| 770 | 2.55%, 10/15/2018 | 787 | ||||||
| Merrill Lynch & Co., Inc. | ||||||||
| 2,000 | 6.05%, 05/16/2016 | 2,141 | ||||||
| MetLife Global Funding I | ||||||||
| 1,480 | 1.50%, 01/10/2018 ■ | 1,472 | ||||||
| Morgan Stanley | ||||||||
| 2,000 | 1.08%, 01/24/2019 Δ | 2,014 | ||||||
| 1,750 | 5.63%, 09/23/2019 | 1,982 | ||||||
| 1,500 | 5.95%, 12/28/2017 | 1,686 | ||||||
| 1,500 | 6.63%, 04/01/2018 | 1,718 | ||||||
| Navient Corp. | ||||||||
| 750 | 3.88%, 09/10/2015 | 757 | ||||||
| Nissan Motor Acceptance Corp. | ||||||||
| 2,500 | 2.35%, 03/04/2019 ■ | 2,509 | ||||||
| PNC Bank NA | ||||||||
| 3,500 | 2.25%, 07/02/2019 | 3,506 | ||||||
| Principal Financial Group, Inc. | ||||||||
| 365 | 1.85%, 11/15/2017 | 367 | ||||||
| Principal Life Global Funding II | ||||||||
| 1,700 | 1.13%, 02/24/2017 ■ | 1,697 | ||||||
| Prudential Financial, Inc. | ||||||||
| 2,000 | 1.01%, 08/15/2018 Δ | 2,018 | ||||||
| 1,500 | 2.35%, 08/15/2019 | 1,499 | ||||||
| QBE Insurance Group Ltd. | ||||||||
| 390 | 2.40%, 05/01/2018 ■ | 390 | ||||||
| Royal Bank of Canada | ||||||||
| 1,500 | 1.50%, 01/16/2018 | 1,496 | ||||||
| Royal Bank of Scotland Group plc | ||||||||
| 2,000 | 1.88%, 03/31/2017 | 2,006 | ||||||
| Santander Holdings USA, Inc. | ||||||||
| 715 | 3.00%, 09/24/2015 | 727 | ||||||
| 738 | 4.63%, 04/19/2016 | 776 | ||||||
| SBA Tower Trust | ||||||||
| 1,300 | 2.24%, 04/15/2043 ■ | 1,289 | ||||||
| 1,310 | 2.93%, 12/15/2017 ■ | 1,328 | ||||||
| Scentre Group | ||||||||
| 1,870 | 2.38%, 11/05/2019 ■☼ | 1,862 | ||||||
| Simon Property Group, Inc. | ||||||||
| 1,965 | 1.50%, 02/01/2018 ■ | 1,953 | ||||||
| Skandinaviska Enskilda Banken AB | ||||||||
| 1,250 | 1.75%, 03/19/2018 ■ | 1,248 | ||||||
| 1,545 | 2.38%, 11/20/2018 ■ | 1,567 | ||||||
| Societe Generale | ||||||||
| 2,395 | 2.63%, 10/01/2018 | 2,434 | ||||||
| Standard Chartered plc | ||||||||
| 3,000 | 2.40%, 09/08/2019 ■ | 2,995 | ||||||
| SunTrust Banks, Inc. | ||||||||
| 1,750 | 2.50%, 05/01/2019 | 1,763 | ||||||
| Svenska Handelsbanken AB | ||||||||
| 2,000 | 2.25%, 06/17/2019 | 2,012 | ||||||
| Swedbank AB | ||||||||
| 1,800 | 1.75%, 03/12/2018 ■ | 1,799 | ||||||
| Synchrony Financial | ||||||||
| 2,255 | 3.00%, 08/15/2019 | 2,280 | ||||||
The accompanying notes are an integral part of these financial statements.
| 8 |
| The Hartford Short Duration Fund |
| Schedule of Investments – (continued) |
| October 31, 2014 |
| (000’s Omitted) |
| Shares or Principal Amount | Market Value ╪ | |||||||
Corporate Bonds - 54.9% - (continued) | ||||||||
| Finance and Insurance - 32.3% - (continued) | ||||||||
| TIAA Asset Management Finance LLC | ||||||||
| $ | 861 | 2.95%, 11/01/2019 ■ | $ | 863 | ||||
| Toronto-Dominion Bank | ||||||||
| 2,000 | 1.13%, 05/02/2017 | 1,997 | ||||||
| Total System Services, Inc. | ||||||||
| 2,075 | 2.38%, 06/01/2018 | 2,067 | ||||||
| Toyota Motor Credit Corp. | ||||||||
| 900 | 1.25%, 10/05/2017 | 899 | ||||||
| 1,500 | 2.00%, 10/24/2018 | 1,514 | ||||||
| 2,000 | 2.13%, 07/18/2019 | 2,002 | ||||||
| TSMC Global Ltd. | ||||||||
| 3,450 | 1.63%, 04/03/2018 ■ | 3,429 | ||||||
| U.S. Bancorp | ||||||||
| 2,250 | 1.65%, 05/15/2017 | 2,276 | ||||||
| UBS AG Stamford CT | ||||||||
| 3,250 | 5.88%, 12/20/2017 | 3,661 | ||||||
| Union Bank NA | ||||||||
| 2,000 | 5.95%, 05/11/2016 | 2,144 | ||||||
| Ventas Realty L.P. | ||||||||
| 570 | 1.25%, 04/17/2017 | 569 | ||||||
| 1,750 | 1.55%, 09/26/2016 | 1,764 | ||||||
| 3,000 | 2.00%, 02/15/2018 | 3,013 | ||||||
| Voya Financial, Inc. | ||||||||
| 2,250 | 2.90%, 02/15/2018 | 2,313 | ||||||
| Wellpoint, Inc. | ||||||||
| 4,000 | 2.25%, 08/15/2019 | 3,961 | ||||||
| 1,000 | 2.38%, 02/15/2017 | 1,025 | ||||||
| Wells Fargo & Co. | ||||||||
| 1,000 | 1.15%, 06/02/2017 | 997 | ||||||
| 2,035 | 1.50%, 01/16/2018 | 2,031 | ||||||
| 1,000 | 2.10%, 05/08/2017 | 1,021 | ||||||
| 2,000 | 2.13%, 04/22/2019 | 2,000 | ||||||
| Western Union Co. | ||||||||
| 430 | 2.38%, 12/10/2015 | 436 | ||||||
| Xstrata Finance Canada Ltd. | ||||||||
| 1,000 | 2.85%, 11/10/2014 ■ | 1,001 | ||||||
| 264,668 | ||||||||
| Food Manufacturing - 0.7% | ||||||||
| ConAgra Foods, Inc. | ||||||||
| 345 | 1.90%, 01/25/2018 | 343 | ||||||
| Mondelez International, Inc. | ||||||||
| 3,000 | 0.76%, 02/01/2019 Δ | 3,004 | ||||||
| Tyson Foods, Inc. | ||||||||
| 1,195 | 2.65%, 08/15/2019 | 1,206 | ||||||
| Wrigley Jr., William Co. | ||||||||
| 720 | 1.40%, 10/21/2016 ■ | 724 | ||||||
| 5,277 | ||||||||
| Furniture and Related Product Manufacturing - 0.0% | ||||||||
| Newell Rubbermaid, Inc. | ||||||||
| 355 | 2.05%, 12/01/2017 | 356 | ||||||
| Health Care and Social Assistance - 2.9% | ||||||||
| AbbVie, Inc. | ||||||||
| 2,000 | 1.75%, 11/06/2017 | 2,006 | ||||||
| Actavis Funding SCS | ||||||||
| 490 | 2.45%, 06/15/2019 ■ | 475 | ||||||
| Aetna, Inc. | ||||||||
| 2,135 | 1.50%, 11/15/2017 | 2,132 | ||||||
| Bayer Finance LLC | ||||||||
| 1,300 | 2.38%, 10/08/2019 ■ | 1,302 | ||||||
| Cardinal Health, Inc. | ||||||||
| 370 | 1.70%, 03/15/2018 | 368 | ||||||
| Catholic Health Initiatives | ||||||||
| 195 | 1.60%, 11/01/2017 | 195 | ||||||
| CVS Caremark Corp. | ||||||||
| 1,980 | 1.20%, 12/05/2016 | 1,983 | ||||||
| 2,350 | 2.25%, 08/12/2019 | 2,340 | ||||||
| Dignity Health | ||||||||
| 1,810 | 2.64%, 11/01/2019 | 1,825 | ||||||
| Express Scripts Holding Co. | ||||||||
| 2,115 | 2.25%, 06/15/2019 | 2,103 | ||||||
| 2,000 | 2.65%, 02/15/2017 | 2,057 | ||||||
| Laboratory Corp. of America Holdings | ||||||||
| 1,411 | 2.20%, 08/23/2017 | 1,432 | ||||||
| Mylan, Inc. | ||||||||
| 2,500 | 1.35%, 11/29/2016 | 2,506 | ||||||
| 2,000 | 6.00%, 11/15/2018 ■ | 2,060 | ||||||
| Perrigo Co., Ltd. | ||||||||
| 800 | 1.30%, 11/08/2016 | 798 | ||||||
| 23,582 | ||||||||
| Information - 2.5% | ||||||||
| Affiliated Computer Services, Inc. | ||||||||
| 1,000 | 5.20%, 06/01/2015 | 1,025 | ||||||
| America Movil S.A.B. de C.V. | ||||||||
| 1,200 | 2.38%, 09/08/2016 | 1,229 | ||||||
| British Telecommunications plc | ||||||||
| 1,785 | 1.25%, 02/14/2017 | 1,781 | ||||||
| 1,430 | 1.63%, 06/28/2016 | 1,445 | ||||||
| Columbus International, Inc. | ||||||||
| 400 | 7.38%, 03/30/2021 ■ | 424 | ||||||
| Deutsche Telekom International Finance B.V. | ||||||||
| 3,000 | 3.13%, 04/11/2016 ■ | 3,094 | ||||||
| Nara Cable Funding Ltd. | ||||||||
| 1,250 | 8.88%, 12/01/2018 ■ | 1,311 | ||||||
| Oracle Corp. | ||||||||
| 3,000 | 2.25%, 10/08/2019 | 3,006 | ||||||
| Thomson Reuters Corp. | ||||||||
| 2,500 | 1.30%, 02/23/2017 | 2,499 | ||||||
| Verizon Communications, Inc. | ||||||||
| 2,350 | 1.35%, 06/09/2017 | 2,346 | ||||||
| 2,355 | 3.65%, 09/14/2018 | 2,490 | ||||||
| Videotron Ltd. | ||||||||
| 123 | 9.13%, 04/15/2018 | 127 | ||||||
| 20,777 | ||||||||
| Machinery Manufacturing - 0.3% | ||||||||
| Hutchison Whampoa International Ltd. | ||||||||
| 2,500 | 1.63%, 10/31/2017 ■ | 2,496 | ||||||
| Mining - 1.3% | ||||||||
| Freeport-McMoRan Copper & Gold, Inc. | ||||||||
| 1,015 | 2.38%, 03/15/2018 | 1,021 | ||||||
| Glencore Funding LLC | ||||||||
| 3,000 | 1.40%, 05/27/2016 ■Δ | 3,017 | ||||||
| 891 | 3.13%, 04/29/2019 ■ | 899 | ||||||
| Rio Tinto Finance USA Ltd. | ||||||||
| 2,050 | 2.00%, 03/22/2017 | 2,079 | ||||||
| Teck Resources Ltd. | ||||||||
| 1,500 | 2.50%, 02/01/2018 | 1,496 | ||||||
The accompanying notes are an integral part of these financial statements.
| 9 |
| The Hartford Short Duration Fund |
| Schedule of Investments – (continued) |
| October 31, 2014 |
| (000’s Omitted) |
| Shares or Principal Amount | Market Value ╪ | |||||||
Corporate Bonds - 54.9% - (continued) | ||||||||
| Mining - 1.3% - (continued) | ||||||||
| Vale Overseas Ltd. | ||||||||
| $ | 1,720 | 6.25%, 01/23/2017 | $ | 1,884 | ||||
| 10,396 | ||||||||
| Miscellaneous Manufacturing - 0.2% | ||||||||
| Textron, Inc. | ||||||||
| 1,500 | 4.63%, 09/21/2016 | 1,595 | ||||||
| Motor Vehicle and Parts Manufacturing - 2.1% | ||||||||
| Chrysler Group LLC | ||||||||
| 2,690 | 8.00%, 06/15/2019 | 2,882 | ||||||
| Daimler Finance NA LLC | ||||||||
| 2,000 | 1.88%, 01/11/2018 ■ | 2,007 | ||||||
| 2,500 | 2.25%, 09/03/2019 ■ | 2,495 | ||||||
| General Motors Financial Co., Inc. | ||||||||
| 3,500 | 2.63%, 07/10/2017 | 3,549 | ||||||
| General Motors, Inc. | ||||||||
| 2,500 | 3.50%, 10/02/2018 | 2,575 | ||||||
| Johnson Controls, Inc. | ||||||||
| 1,200 | 1.40%, 11/02/2017 | 1,194 | ||||||
| TRW Automotive, Inc. | ||||||||
| 1,980 | 7.25%, 03/15/2017 ■ | 2,178 | ||||||
| 16,880 | ||||||||
| Petroleum and Coal Products Manufacturing - 1.2% | ||||||||
| Enbridge, Inc. | ||||||||
| 2,250 | 0.68%, 06/02/2017 Δ | 2,251 | ||||||
| Hess Corp. | ||||||||
| 1,150 | 1.30%, 06/15/2017 | 1,143 | ||||||
| Petrobras Global Finance Co. | ||||||||
| 1,250 | 2.00%, 05/20/2016 | 1,246 | ||||||
| Petrobras International Finance Co. | ||||||||
| 1,100 | 3.88%, 01/27/2016 | 1,122 | ||||||
| 1,000 | 6.13%, 10/06/2016 | 1,070 | ||||||
| Schlumberger Norge AS | ||||||||
| 925 | 1.25%, 08/01/2017 ■ | 924 | ||||||
| Total Capital Canada Ltd. | ||||||||
| 685 | 1.45%, 01/15/2018 | 682 | ||||||
| Total Capital International S.A. | ||||||||
| 1,155 | 1.55%, 06/28/2017 | 1,163 | ||||||
| Transocean, Inc. | ||||||||
| 565 | 2.50%, 10/15/2017 | 558 | ||||||
| 10,159 | ||||||||
| Pipeline Transportation - 0.3% | ||||||||
| Enterprise Products Operating LLC | ||||||||
| 235 | 1.25%, 08/13/2015 | 236 | ||||||
| 1,195 | 2.55%, 10/15/2019 | 1,195 | ||||||
| Kinder Morgan Energy Partners L.P. | ||||||||
| 790 | 3.50%, 03/01/2016 | 814 | ||||||
| 2,245 | ||||||||
| Plastics and Rubber Products Manufacturing - 0.5% | ||||||||
| Continental Rubber of America Corp. | ||||||||
| 4,000 | 4.50%, 09/15/2019 ■ | 4,184 | ||||||
| Primary Metal Manufacturing - 0.0% | ||||||||
| ArcelorMittal | ||||||||
| 280 | 4.25%, 03/01/2016 | 286 | ||||||
| Real Estate, Rental and Leasing - 2.3% | ||||||||
| Air Lease Corp. | ||||||||
| 2,705 | 2.13%, 01/15/2018 | 2,675 | ||||||
| Enterprise Rent-a-Car Finance Corp. | ||||||||
| 1,050 | 1.40%, 04/15/2016 ■ | 1,057 | ||||||
| ERAC USA Finance Co. | ||||||||
| 1,870 | 2.35%, 10/15/2019 ■ | 1,857 | ||||||
| ERP Operating L.P. | ||||||||
| 2,580 | 2.38%, 07/01/2019 | 2,580 | ||||||
| GATX Corp. | ||||||||
| 1,145 | 1.25%, 03/04/2017 | 1,140 | ||||||
| International Lease Finance Corp. | ||||||||
| 1,750 | 6.75%, 09/01/2016 ■ | 1,855 | ||||||
| Kennedy-Wilson, Inc. | ||||||||
| 2,000 | 8.75%, 04/01/2019 | 2,125 | ||||||
| Ryder System, Inc. | ||||||||
| 1,075 | 2.45%, 09/03/2019 | 1,076 | ||||||
| United Rentals North America, Inc. | ||||||||
| 2,095 | 5.75%, 07/15/2018 | 2,194 | ||||||
| WEA Finance, LLC / Westfiled UK & Europe Finance plc | ||||||||
| 2,480 | 2.70%, 09/17/2019 ■ | 2,496 | ||||||
| 19,055 | ||||||||
| Retail Trade - 1.0% | ||||||||
| Amazon.com, Inc. | ||||||||
| 1,385 | 1.20%, 11/29/2017 | 1,373 | ||||||
| Building Materials Corp. | ||||||||
| 1,500 | 6.88%, 08/15/2018 ■ | 1,558 | ||||||
| Eaton Corp. | ||||||||
| 2,000 | 1.50%, 11/02/2017 | 1,996 | ||||||
| Kroger (The) Co. | ||||||||
| 1,750 | 0.76%, 10/17/2016 Δ | 1,753 | ||||||
| 1,250 | 7.00%, 05/01/2018 | 1,442 | ||||||
| 8,122 | ||||||||
| Toy Manufacturing - 0.2% | ||||||||
| Mattel, Inc. | ||||||||
| 2,000 | 2.35%, 05/06/2019 | 1,987 | ||||||
| Truck Transportation - 0.4% | ||||||||
| Penske Truck Leasing Co. | ||||||||
| 3,050 | 2.50%, 03/15/2016 - 06/15/2019 ■ | 3,061 | ||||||
| 45 | 2.88%, 07/17/2018 ■ | 46 | ||||||
| 3,107 | ||||||||
| Utilities - 1.0% | ||||||||
| Ameren Illinois Co. | ||||||||
| 1,000 | 9.75%, 11/15/2018 | 1,294 | ||||||
| American Electric Power Co., Inc. | ||||||||
| 500 | 1.65%, 12/15/2017 | 501 | ||||||
| Commonwealth Edison Co. | ||||||||
| 2,400 | 6.95%, 07/15/2018 | 2,792 | ||||||
| Dominion Resources, Inc. | ||||||||
| 2,500 | 1.05%, 11/01/2016 | 2,500 | ||||||
| Duke Energy Corp. | ||||||||
| 790 | 1.63%, 08/15/2017 | 795 | ||||||
| 7,882 | ||||||||
| Water Transportation - 0.4% | ||||||||
| A.P. Moeller-Maersk A/S | ||||||||
| 3,450 | 2.55%, 09/22/2019 ■ | 3,479 | ||||||
| Wholesale Trade - 0.4% | ||||||||
| Arrow Electronics, Inc. | ||||||||
| 630 | 3.00%, 03/01/2018 | 650 | ||||||
The accompanying notes are an integral part of these financial statements.
| 10 |
| The Hartford Short Duration Fund |
| Schedule of Investments – (continued) |
| October 31, 2014 |
| (000’s Omitted) |
| Shares or Principal Amount | Market Value ╪ | |||||||
Corporate Bonds - 54.9% - (continued) | ||||||||
| Wholesale Trade - 0.4% - (continued) | ||||||||
| SABMiller Holdings, Inc. | ||||||||
| $ | 2,500 | 0.93%, 08/01/2018 ■Δ | $ | 2,519 | ||||
| 3,169 | ||||||||
| Total Corporate Bonds | ||||||||
| (Cost $446,612) | $ | 449,944 | ||||||
Municipal Bonds - 0.5% | ||||||||
| General Obligations - 0.3% | ||||||||
| Illinois State GO | ||||||||
| $ | 2,200 | 4.96%, 03/01/2016 | $ | 2,306 | ||||
| 265 | 5.88%, 03/01/2019 | 294 | ||||||
| 2,600 | ||||||||
| Miscellaneous - 0.0% | ||||||||
| New Jersey State Econ DA Lease Rev | ||||||||
| 365 | 2.44%, 02/15/2018 ○ | 337 | ||||||
| Waste Disposal - 0.2% | ||||||||
| Gloucester County, NJ, Import Auth | ||||||||
| 1,300 | 2.50%, 12/01/2029 Δ | 1,348 | ||||||
| Total Municipal Bonds | ||||||||
| (Cost $4,221) | $ | 4,285 | ||||||
Senior Floating Rate Interests ♦ - 19.3% | ||||||||
| Accommodation and Food Services - 0.2% | ||||||||
| Four Seasons Holdings, Inc. | ||||||||
| $ | 292 | 3.50%, 06/29/2020 | $ | 289 | ||||
| Hilton Worldwide Holdings, Inc. | ||||||||
| 1,680 | 3.50%, 10/26/2020 | 1,662 | ||||||
| 1,951 | ||||||||
| Administrative, Support, Waste Management and Remediation Services - 0.6% | ||||||||
| Acosta Holdco, Inc. | ||||||||
| 1,715 | 5.00%, 09/26/2021 | 1,715 | ||||||
| ADS Waste Holdings, Inc. | ||||||||
| 550 | 3.75%, 10/09/2019 | 538 | ||||||
| AECOM Technology Corp. | ||||||||
| 710 | 3.75%, 10/15/2021 | 709 | ||||||
| Filtration Group, Inc. | ||||||||
| 298 | 4.50%, 11/20/2020 | 297 | ||||||
| TransUnion LLC | ||||||||
| 1,419 | 4.00%, 04/09/2021 | 1,401 | ||||||
| 4,660 | ||||||||
| Agriculture, Forestry, Fishing and Hunting - 0.1% | ||||||||
| U.S. Ecology, Inc. | ||||||||
| 843 | 3.75%, 06/17/2021 | 838 | ||||||
| Air Transportation - 0.6% | ||||||||
| American Airlines, Inc. | ||||||||
| 1,000 | 4.25%, 10/10/2021 | 995 | ||||||
| AMR Corp. | ||||||||
| 1,602 | 3.75%, 06/27/2019 | 1,579 | ||||||
| AWAS Finance Luxembourg S.A. | ||||||||
| 262 | 3.50%, 06/10/2016 | 260 | ||||||
| Delta Air Lines, Inc. | ||||||||
| 285 | 3.25%, 10/18/2018 | 278 | ||||||
| Delta Air Lines, Inc., Term Loan | ||||||||
| 1,514 | 3.25%, 04/20/2017 | 1,502 | ||||||
| 4,614 | ||||||||
| Apparel Manufacturing - 0.2% | ||||||||
| PVH Corp. | ||||||||
| 1,410 | 3.25%, 02/13/2020 | 1,410 | ||||||
| Arts, Entertainment and Recreation - 1.8% | ||||||||
| Aristocrat Leisure Ltd. | ||||||||
| 1,360 | 4.75%, 10/20/2021 | 1,349 | ||||||
| Cedar Fair L.P. | ||||||||
| 511 | 3.25%, 03/06/2020 | 508 | ||||||
| Formula One Holdings | ||||||||
| 2,981 | 4.75%, 07/30/2021 | 2,956 | ||||||
| MGM Resorts International | ||||||||
| 1,906 | 3.50%, 12/20/2019 | 1,882 | ||||||
| Numericable | ||||||||
| 820 | 4.50%, 05/21/2020 | 821 | ||||||
| Penn National Gaming, Inc. | ||||||||
| 1,082 | 3.25%, 10/30/2020 | 1,063 | ||||||
| Scientific Games International, Inc. | ||||||||
| 1,035 | 6.00%, 10/01/2021 | 1,013 | ||||||
| Seminole (The) Tribe of Florida, Inc. | ||||||||
| 488 | 3.00%, 04/29/2020 | 486 | ||||||
| Station Casinos LLC | ||||||||
| 897 | 4.25%, 03/02/2020 | 886 | ||||||
| Tribune Co. | ||||||||
| 1,955 | 4.00%, 12/27/2020 | 1,937 | ||||||
| Univision Communications, Inc. | ||||||||
| 2,271 | 4.00%, 03/01/2020 | 2,246 | ||||||
| 15,147 | ||||||||
| Beverage and Tobacco Product Manufacturing - 0.1% | ||||||||
| DE Master Blenders 1753 N.V. | ||||||||
| 800 | 3.50%, 07/23/2021 | 792 | ||||||
| Chemical Manufacturing - 0.6% | ||||||||
| Cytec Industries, Inc. | ||||||||
| 37 | 4.50%, 10/03/2019 | 37 | ||||||
| Exopack LLC | ||||||||
| 447 | 5.25%, 05/08/2019 | 448 | ||||||
| Huntsman International LLC | ||||||||
| 2,015 | 3.75%, 08/12/2021 | 1,987 | ||||||
| Ineos US Finance LLC | ||||||||
| 1,225 | 3.75%, 05/04/2018 | 1,209 | ||||||
| Minerals Technologies, Inc. | ||||||||
| 699 | 4.00%, 05/07/2021 | 696 | ||||||
| Monarch, Inc. | ||||||||
| 72 | 4.50%, 10/03/2019 | 71 | ||||||
| Solenis International L.P. | ||||||||
| 575 | 4.25%, 07/31/2021 | 566 | ||||||
| 5,014 | ||||||||
| Computer and Electronic Product Manufacturing - 0.9% | ||||||||
| Avago Technologies Ltd. | ||||||||
| 1,342 | 3.75%, 05/06/2021 | 1,337 | ||||||
| Bally Technologies, Inc. | ||||||||
| 369 | 4.25%, 11/25/2020 | 367 | ||||||
| CDW LLC | ||||||||
| 1,041 | 3.25%, 04/29/2020 | 1,017 | ||||||
| Freescale Semiconductor, Inc. | ||||||||
| 1,843 | 4.25%, 02/28/2020 | 1,816 | ||||||
| 376 | 5.00%, 01/15/2021 | 375 | ||||||
| Sensata Technologies B.V. | ||||||||
| 2,000 | 3.50%, 10/14/2021 ☼ | 1,992 | ||||||
The accompanying notes are an integral part of these financial statements.
| 11 |
| The Hartford Short Duration Fund |
| Schedule of Investments – (continued) |
| October 31, 2014 |
| (000’s Omitted) |
| Shares or Principal Amount | Market Value ╪ | |||||||
Senior Floating Rate Interests ♦ - 19.3% - (continued) | ||||||||
| Computer and Electronic Product Manufacturing - 0.9% - (continued) | ||||||||
| Vantiv LLC | ||||||||
| $ | 953 | 3.75%, 06/13/2021 | $ | 945 | ||||
| 7,849 | ||||||||
| Educational Services - 0.1% | ||||||||
| Bright Horizons Family Solutions, Inc. | ||||||||
| 506 | 3.75%, 01/30/2020 | 499 | ||||||
| Finance and Insurance - 1.1% | ||||||||
| Asurion LLC | ||||||||
| 2,038 | 5.00%, 05/24/2019 | 2,039 | ||||||
| Chrysler Group LLC | ||||||||
| 622 | 3.25%, 12/31/2018 | 615 | ||||||
| 2,174 | 3.50%, 05/24/2017 | 2,161 | ||||||
| EFS Cogen Holdings I LLC | ||||||||
| 316 | 3.75%, 12/17/2020 | 313 | ||||||
| Hub International Ltd. | ||||||||
| 1,762 | 4.25%, 10/02/2020 | 1,738 | ||||||
| RPI Finance Trust | ||||||||
| 1,533 | 3.25%, 11/09/2018 | 1,524 | ||||||
| Santander Asset Management S.A. | ||||||||
| 1,062 | 4.25%, 12/17/2020 | 1,057 | ||||||
| 9,447 | ||||||||
| Food Manufacturing - 0.7% | ||||||||
| Burger King Co. | ||||||||
| 960 | 4.50%, 10/27/2021 | 959 | ||||||
| Darling International, Inc. | ||||||||
| 965 | 3.25%, 01/06/2021 | 962 | ||||||
| H.J. Heinz Co. | ||||||||
| 1,363 | 3.50%, 06/05/2020 | 1,354 | ||||||
| JBS USA LLC | ||||||||
| 1,470 | 3.75%, 09/18/2020 | 1,444 | ||||||
| U.S. Foodservice, Inc. | ||||||||
| 805 | 4.50%, 03/31/2019 | 802 | ||||||
| 5,521 | ||||||||
| Food Services - 0.1% | ||||||||
| ARAMARK Corp. | ||||||||
| 62 | 3.66%, 07/26/2016 | 61 | ||||||
| Pinnacle Foods Group LLC | ||||||||
| 1,188 | 3.25%, 04/29/2020 | 1,165 | ||||||
| 1,226 | ||||||||
| Furniture and Related Product Manufacturing - 0.1% | ||||||||
| AOT Bedding Super Holdings LLC | ||||||||
| 1,144 | 4.25%, 10/01/2019 | 1,132 | ||||||
| Health Care and Social Assistance - 2.0% | ||||||||
| Alere, Inc. | ||||||||
| 1,702 | 4.25%, 06/30/2017 | 1,696 | ||||||
| Alkermes, Inc. | ||||||||
| 2,947 | 3.50%, 09/25/2019 | 2,899 | ||||||
| American Renal Holdings, Inc. | ||||||||
| 1,236 | 4.50%, 08/20/2019 | 1,212 | ||||||
| AmSurg Corp. | ||||||||
| 1,087 | 3.75%, 07/16/2021 | 1,079 | ||||||
| Community Health Systems, Inc. | ||||||||
| 471 | 4.25%, 01/27/2021 | 472 | ||||||
| DaVita HealthCare Partners, Inc. | ||||||||
| 1,506 | 3.50%, 06/24/2021 | 1,493 | ||||||
| Grifols Worldwide Operations USA, Inc. | ||||||||
| 995 | 3.15%, 02/27/2021 | 982 | ||||||
| HCA, Inc. | ||||||||
| 996 | 2.90%, 03/31/2017 | 991 | ||||||
| 291 | 2.98%, 05/01/2018 | 290 | ||||||
| Immucor, Inc. | ||||||||
| 1,598 | 5.00%, 08/19/2018 | 1,594 | ||||||
| IMS Health, Inc. | ||||||||
| 1,664 | 3.50%, 03/17/2021 | 1,642 | ||||||
| Ortho-Clinical Diagnostics, Inc. | ||||||||
| 868 | 4.75%, 06/30/2021 | 858 | ||||||
| Salix Pharmaceuticals Ltd. | ||||||||
| 780 | 4.25%, 01/02/2020 | 779 | ||||||
| Surgery Center Holdings, Inc. | ||||||||
| 400 | 5.25%, 07/24/2020 ☼ | 399 | ||||||
| 16,386 | ||||||||
| Health Care Providers and Services - 0.1% | ||||||||
| Multiplan, Inc. | ||||||||
| 572 | 4.00%, 03/31/2021 | 563 | ||||||
| Information - 3.0% | ||||||||
| Activision Blizzard, Inc. | ||||||||
| 1,695 | 3.25%, 10/12/2020 | 1,694 | ||||||
| Cabovisao-Televisao Por Cabo S.A. | ||||||||
| 1,012 | 5.50%, 07/02/2019 | 1,017 | ||||||
| Charter Communications Operating LLC | ||||||||
| 1,408 | 3.00%, 07/01/2020 - 01/03/2021 | 1,382 | ||||||
| 1,220 | 4.25%, 09/10/2021 | 1,228 | ||||||
| Crown Castle International Corp. | ||||||||
| 596 | 3.00%, 01/31/2021 | 590 | ||||||
| CSC Holdings, Inc. | ||||||||
| 126 | 2.65%, 04/17/2020 | 123 | ||||||
| Emdeon, Inc. | ||||||||
| 1,573 | 3.75%, 11/02/2018 | 1,557 | ||||||
| First Data Corp. | ||||||||
| 515 | 3.65%, 09/24/2018 | 510 | ||||||
| Gray Television, Inc. | ||||||||
| 514 | 3.75%, 06/13/2021 | 507 | ||||||
| Intelsat Jackson Holdings S.A. | ||||||||
| 2,128 | 3.75%, 06/30/2019 | 2,110 | ||||||
| Kronos, Inc. | ||||||||
| 1,030 | 4.50%, 10/30/2019 | 1,025 | ||||||
| La Quinta Intermediate Holdings | ||||||||
| 910 | 4.00%, 04/14/2021 | 903 | ||||||
| Lawson Software, Inc. | ||||||||
| 791 | 3.75%, 06/03/2020 | 780 | ||||||
| Level 3 Communications, Inc. | ||||||||
| 1,739 | 4.00%, 08/01/2019 - 01/15/2020 | 1,729 | ||||||
| Level 3 Financing, Inc. | ||||||||
| 1,255 | 4.50%, 01/31/2022 ☼ | 1,260 | ||||||
| MISYS plc | ||||||||
| 1,720 | 5.00%, 12/12/2018 | 1,720 | ||||||
| Syniverse Holdings, Inc. | ||||||||
| 2,051 | 4.00%, 04/23/2019 | 2,015 | ||||||
| Telesat Canada | ||||||||
| 1,604 | 3.50%, 03/28/2019 | 1,586 | ||||||
| Virgin Media Finance plc | ||||||||
| 2,025 | 3.50%, 06/07/2020 | 1,995 | ||||||
| Ziggo B.V. | ||||||||
| 520 | 2.75%, 01/15/2022 ☼Б | 506 | ||||||
| 305 | 3.25%, 01/15/2022 | 297 | ||||||
| 24,534 | ||||||||
The accompanying notes are an integral part of these financial statements.
| 12 |
| The Hartford Short Duration Fund |
| Schedule of Investments – (continued) |
| October 31, 2014 |
| (000’s Omitted) |
| Shares or Principal Amount | Market Value ╪ | |||||||
Senior Floating Rate Interests ♦ - 19.3% - (continued) | ||||||||
| Media - 0.2% | ||||||||
| Media General, Inc. | ||||||||
| $ | 1,315 | 4.25%, 07/31/2020 | $ | 1,304 | ||||
| Mining - 0.6% | ||||||||
| BWAY Holding Co. | ||||||||
| 1,372 | 5.50%, 08/14/2020 | 1,377 | ||||||
| Fortescue Metals Group Ltd. | ||||||||
| 3,445 | 3.75%, 06/30/2019 | 3,357 | ||||||
| 4,734 | ||||||||
| Miscellaneous Manufacturing - 0.5% | ||||||||
| DigitalGlobe, Inc. | ||||||||
| 1,024 | 3.75%, 01/31/2020 | 1,018 | ||||||
| Hamilton Sundstrand Corp. | ||||||||
| 950 | 4.00%, 12/13/2019 | 933 | ||||||
| Reynolds Group Holdings, Inc. | ||||||||
| 899 | 4.00%, 11/30/2018 | 893 | ||||||
| TransDigm Group, Inc. | ||||||||
| 1,321 | 3.75%, 02/28/2020 - 06/04/2021 | 1,298 | ||||||
| 4,142 | ||||||||
| Other Services - 0.6% | ||||||||
| Gardner Denver, Inc. | ||||||||
| 1,980 | 4.25%, 07/30/2020 | 1,951 | ||||||
| Husky Injection Molding Systems Ltd. | ||||||||
| 254 | 4.25%, 06/30/2021 | 249 | ||||||
| Rexnord LLC | ||||||||
| 2,635 | 4.00%, 08/21/2020 | 2,596 | ||||||
| 4,796 | ||||||||
| Petroleum and Coal Products Manufacturing - 1.1% | ||||||||
| American Energy-Marcellus LLC | ||||||||
| 820 | 5.25%, 08/04/2020 | 797 | ||||||
| Crosby Worldwide Ltd. | ||||||||
| 2,015 | 4.00%, 11/23/2020 | 1,928 | ||||||
| Everest Acquisition LLC | ||||||||
| 490 | 3.50%, 05/24/2018 | 477 | ||||||
| Fieldwood Energy LLC | ||||||||
| 663 | 3.88%, 09/28/2018 | 648 | ||||||
| MEG Energy Corp. | ||||||||
| 1,719 | 3.75%, 03/31/2020 | 1,688 | ||||||
| Pacific Drilling S.A. | ||||||||
| 281 | 4.50%, 06/03/2018 | 269 | ||||||
| Paragon Offshore Finance Co. | ||||||||
| 1,245 | 3.75%, 07/16/2021 | 1,165 | ||||||
| Seadrill Ltd. | ||||||||
| 1,224 | 4.00%, 02/21/2021 | 1,155 | ||||||
| Seventy Seven Energy, Inc. | ||||||||
| 574 | 3.75%, 06/25/2021 | 559 | ||||||
| 8,686 | ||||||||
| Plastics and Rubber Products Manufacturing - 0.6% | ||||||||
| Berry Plastics Group, Inc. | ||||||||
| 3,103 | 3.50%, 02/08/2020 | 3,035 | ||||||
| Entegris, Inc. | ||||||||
| 986 | 3.50%, 04/30/2021 | 981 | ||||||
| Goodyear (The) Tire & Rubber Co. | ||||||||
| 1,000 | 4.75%, 04/30/2019 | 1,002 | ||||||
| 5,018 | ||||||||
| Primary Metal Manufacturing - 0.3% | ||||||||
| Novelis, Inc. | ||||||||
| 2,841 | 3.75%, 03/10/2017 | 2,809 | ||||||
| Professional, Scientific and Technical Services - 0.1% | ||||||||
| Advantage Sales & Marketing, Inc. | ||||||||
| 1,305 | 4.25%, 07/23/2021 | 1,293 | ||||||
| Real Estate, Rental and Leasing - 0.2% | ||||||||
| Fly Leasing Ltd. | ||||||||
| 544 | 4.50%, 08/09/2019 | 543 | ||||||
| International Lease Finance Corp. | ||||||||
| 685 | 3.50%, 03/06/2021 | 681 | ||||||
| Realogy Group LLC | ||||||||
| 167 | 3.75%, 03/05/2020 | 166 | ||||||
| 1,390 | ||||||||
| Retail Trade - 1.6% | ||||||||
| 99 Cents Only Stores | ||||||||
| 431 | 4.50%, 01/11/2019 | 427 | ||||||
| Albertson's LLC | ||||||||
| 2,015 | 4.50%, 08/25/2021 | 2,015 | ||||||
| American Builders & Contractors Supply Co., Inc. | ||||||||
| 233 | 3.50%, 04/16/2020 | 227 | ||||||
| Armstrong World Industries, Inc. | ||||||||
| 1,428 | 3.50%, 03/15/2020 | 1,413 | ||||||
| BJ's Wholesale Club, Inc. | ||||||||
| 1,985 | 4.50%, 09/26/2019 | 1,963 | ||||||
| Metaldyne Performance Group, Inc. | ||||||||
| 985 | 4.50%, 10/20/2021 ☼ | 985 | ||||||
| Michaels Stores, Inc. | ||||||||
| 433 | 3.75%, 01/28/2020 | 425 | ||||||
| 795 | 4.00%, 01/28/2020 | 785 | ||||||
| Neiman Marcus (The) Group, Inc. | ||||||||
| 2,193 | 4.25%, 10/25/2020 | 2,163 | ||||||
| Quikrete (The) Companies, Inc. | ||||||||
| 1,009 | 4.00%, 09/28/2020 | 998 | ||||||
| Rite Aid Corp. | ||||||||
| 1,083 | 3.50%, 02/21/2020 | 1,070 | ||||||
| Southwire Co. | ||||||||
| 806 | 3.25%, 02/10/2021 | 783 | ||||||
| 13,254 | ||||||||
| Truck Transportation - 0.1% | ||||||||
| Swift Transportation Co., Inc. | ||||||||
| 572 | 3.75%, 06/09/2021 | 566 | ||||||
| Utilities - 0.9% | ||||||||
| Calpine Corp. | ||||||||
| 1,201 | 4.00%, 10/09/2019 | 1,189 | ||||||
| Energy Transfer Equity L.P. | ||||||||
| 2,007 | 3.25%, 12/02/2019 | 1,965 | ||||||
| NRG Energy, Inc. | ||||||||
| 2,349 | 2.75%, 07/01/2018 | 2,306 | ||||||
| Sandy Creek Energy Associates L.P. | ||||||||
| 1,436 | 5.00%, 11/09/2020 | 1,428 | ||||||
| Star West Generation LLC | ||||||||
| 415 | 4.25%, 03/13/2020 | 410 | ||||||
| 7,298 | ||||||||
| Wholesale Trade - 0.2% | ||||||||
| Gates Global LLC | ||||||||
| 1,520 | 4.25%, 07/05/2021 | 1,501 | ||||||
| Total Senior Floating Rate Interests | ||||||||
| (Cost $159,531) | $ | 158,374 | ||||||
The accompanying notes are an integral part of these financial statements.
| 13 |
| The Hartford Short Duration Fund |
| Schedule of Investments – (continued) |
| October 31, 2014 |
| (000’s Omitted) |
| Shares or Principal Amount | Market Value ╪ | |||||||
| U.S. Government Agencies - 5.1% | ||||||||
| FHLMC - 1.2% | ||||||||
| $ | 5,750 | 0.88%, 10/14/2016 | $ | 5,786 | ||||
| 12,498 | 1.82%, 07/25/2021 ► | 1,136 | ||||||
| 14,030 | 2.15%, 08/25/2018 ► | 904 | ||||||
| 2,292 | 3.50%, 04/01/2027 | 2,428 | ||||||
| 10,254 | ||||||||
| FNMA - 3.7% | ||||||||
| 14,000 | 3.00%, 11/15/2029 ☼,Ð | 14,519 | ||||||
| 14,665 | 3.50%, 12/01/2026 - 11/15/2029 ☼,Ð | 15,511 | ||||||
| 30,030 | ||||||||
| GNMA - 0.2% | ||||||||
| 636 | 5.00%, 08/20/2039 | 687 | ||||||
| 501 | 6.50%, 05/16/2031 | 562 | ||||||
| 1,249 | ||||||||
| Total U.S. Government Agencies | ||||||||
| (Cost $40,942) | $ | 41,533 | ||||||
| Total Long-Term Investments | ||||||||
| (Cost $827,964) | $ | 828,409 | ||||||
| Short-Term Investments - 0.8% | ||||||||
| Repurchase Agreements - 0.8% | ||||||||
| Bank of America Merrill Lynch TriParty Repurchase Agreement (maturing on 11/03/2014 in the amount of $19, collateralized by U.S. Treasury Note 1.50%, 2019, value of $19) | ||||||||
| $ | 19 | 0.08%, 10/31/2014 | $ | 19 | ||||
| Bank of America Merrill Lynch TriParty Repurchase Agreement (maturing on 11/03/2014 in the amount of $314, collateralized by GNMA 1.63% - 7.00%, 2031 - 2054, value of $320) | ||||||||
| 314 | 0.09%, 10/31/2014 | 314 | ||||||
| Bank of Montreal TriParty Repurchase Agreement (maturing on 11/03/2014 in the amount of $84, collateralized by U.S. Treasury Bond 2.88% - 5.25%, 2029 - 2043, U.S. Treasury Note 0.38% - 4.50%, 2015 - 2022, value of $86) | ||||||||
| 84 | 0.08%, 10/31/2014 | 84 | ||||||
| Bank of Montreal TriParty Repurchase Agreement (maturing on 11/03/2014 in the amount of $286, collateralized by FHLMC 2.00% - 5.50%, 2022 - 2034, FNMA 2.00% - 4.50%, 2024 - 2039, GNMA 3.00%, 2043, U.S. Treasury Note 4.63%, 2017, value of $292) | ||||||||
| 286 | 0.10%, 10/31/2014 | 286 | ||||||
| Barclays Capital TriParty Repurchase Agreement (maturing on 11/03/2014 in the amount of $1,078, collateralized by U.S. Treasury Bond 4.50% - 6.25%, 2023 - 2036, U.S. Treasury Note 1.63% - 2.13%, 2015 - 2019, value of $1,099) | ||||||||
| 1,078 | 0.08%, 10/31/2014 | 1,078 | ||||||
| Citigroup Global Markets, Inc. TriParty Repurchase Agreement (maturing on 11/03/2014 in the amount of $1,239, collateralized by U.S. Treasury Bill 0.02%, 2015, U.S. Treasury Bond 3.88% - 11.25%, 2015 - 2040, U.S. Treasury Note 2.00% - 3.38%, 2019 - 2021, value of $1,264) | ||||||||||||
| 1,239 | 0.09%, 10/31/2014 | 1,239 | ||||||||||
| Deutsche Bank Securities TriParty Repurchase Agreement (maturing on 11/03/2014 in the amount of $72, collateralized by U.S. Treasury Note 0.88%, 2017, value of $73) | ||||||||||||
| 72 | 0.13%, 10/31/2014 | 72 | ||||||||||
| RBS Securities, Inc. TriParty Repurchase Agreement (maturing on 11/03/2014 in the amount of $105, collateralized by U.S. Treasury Bond 3.63% - 5.00%, 2037 - 2043, U.S. Treasury Note 2.13%, 2020, value of $107) | ||||||||||||
| 105 | 0.07%, 10/31/2014 | 105 | ||||||||||
| Societe Generale TriParty Repurchase Agreement (maturing on 11/03/2014 in the amount of $1,109, collateralized by U.S. Treasury Bill 0.02%, 2015, U.S. Treasury Bond 3.75% - 11.25%, 2015 - 2043, U.S. Treasury Note 1.38% - 4.25%, 2015 - 2022, value of $1,131) | ||||||||||||
| 1,109 | 0.08%, 10/31/2014 | 1,109 | ||||||||||
| TD Securities TriParty Repurchase Agreement (maturing on 11/03/2014 in the amount of $2,149, collateralized by FHLMC 3.00% - 4.00%, 2026 - 2044, FNMA 2.50% - 5.00%, 2025 - 2044, U.S. Treasury Bond 3.50% - 6.50%, 2026 - 2041, U.S. Treasury Note 1.75% - 2.88%, 2018 - 2019, value of $2,192) | ||||||||||||
| 2,149 | 0.10%, 10/31/2014 | 2,149 | ||||||||||
| 6,455 | ||||||||||||
| Total Short-Term Investments | ||||||||||||
| (Cost $6,455) | $ | 6,455 | ||||||||||
| Total Investments | ||||||||||||
| (Cost $834,419) ▲ | 101.9 | % | $ | 834,864 | ||||||||
| Other Assets and Liabilities | (1.9 | )% | (15,479 | ) | ||||||||
| Total Net Assets | 100.0 | % | $ | 819,385 |
The accompanying notes are an integral part of these financial statements.
| 14 |
| The Hartford Short Duration Fund |
| Schedule of Investments – (continued) |
| October 31, 2014 |
| (000’s Omitted) |
| Note: | Percentage of investments as shown is the ratio of the total market value to total net assets. |
The Fund may refer to any one or more of the industry classifications used by one or more widely recognized market indices, ratings group indices and/or as defined by Fund management. Industry classifications may not be identical across all security types.
For Fund compliance purposes, the Fund may not use the same classification system shown in this report as these classifications are used for reporting ease.
| ▲ | At October 31, 2014, the cost of securities for federal income tax purposes was $834,419 and the aggregate gross unrealized appreciation and depreciation based on that cost were: |
| Unrealized Appreciation | $ | 5,425 | ||
| Unrealized Depreciation | (4,980 | ) | ||
| Net Unrealized Appreciation | $ | 445 |
| † | These securities are valued in good faith at fair value as determined under policies and procedures established by and under the supervision of the Board of Directors. At October 31, 2014, the aggregate fair value and percentage of net assets of these securities rounds to zero. |
| ● | Non-income producing. For long-term debt securities, items identified are in default as to payment of interest and/or principal. |
| Δ | Variable rate securities; the rate reported is the coupon rate in effect at October 31, 2014. |
| ○ | The interest rate disclosed for these securities represents the effective yield on the date of the acquisition. |
| ► | Securities disclosed are interest-only strips. |
| ♦ | Senior floating rate interests generally pay interest rates which are periodically adjusted by reference to a base short-term, floating lending rate plus a premium. The base lending rates are primarily the LIBOR, and secondarily the prime rate offered by one or more major United States banks (the "Prime Rate") and the certificate of deposit rate or other base lending rates used by commercial lenders. Senior floating rate interests often require prepayments from excess cash flows or permit the borrower to repay at its election. The rate at which the borrower repays cannot be predicted with accuracy. As a result, the actual remaining maturity may be substantially less than the stated maturities shown. Unless otherwise noted, the interest rate disclosed for these securities represents the average coupon as of October 31, 2014. |
| Б | This security, or a portion of this security, has unfunded loan commitments. As of October 31, 2014, the aggregate value of the unfunded commitment was $339, which rounds to zero percent of total net assets. |
| ■ | Securities issued within terms of a private placement memorandum, exempt from registration under Rule 144A under the Securities Act of 1933, as amended, and may be sold only to qualified institutional buyers. Unless otherwise indicated, these holdings are determined to be liquid. At October 31, 2014, the aggregate value of these securities was $179,487, which represents 21.9% of total net assets. |
| ☼ | This security, or a portion of this security, was purchased on a when-issued or delayed-delivery basis. The cost of these securities was $27,284 at October 31, 2014. |
| ‡ | This security, or a portion of this security, has been segregated to cover funding requirements on investment transactions settling in the future. |
| Ð | Represents or includes a TBA transaction. |
| Cash pledged and received as collateral in connection with derivatives at October 31, 2014: |
| Pledged | Received | |||||||
| Futures contracts | $ | 873 | $ | – | ||||
| Total | $ | 873 | $ | – | ||||
The accompanying notes are an integral part of these financial statements.
| 15 |
| The Hartford Short Duration Fund |
| Schedule of Investments – (continued) |
| October 31, 2014 |
| (000’s Omitted) |
| Futures Contracts Outstanding at October 31, 2014 | ||||||||||||||||||||||||||||||
| Number of | Expiration | Notional | Market | Unrealized
Appreciation/(Depreciation) | Variation Margin | |||||||||||||||||||||||||
| Description | Contracts* | Date | Amount | Value ╪ | Asset | Liability | Asset | Liability | ||||||||||||||||||||||
| Long position contracts: | ||||||||||||||||||||||||||||||
| U.S. Treasury 2-Year Note Future | 574 | 12/31/2014 | $ | 125,647 | $ | 126,029 | $ | 382 | $ | – | $ | – | $ | (36 | ) | |||||||||||||||
| Short position contracts: | ||||||||||||||||||||||||||||||
| U.S. Treasury 10-Year Note Future | 82 | 12/19/2014 | $ | 10,297 | $ | 10,362 | $ | – | $ | (65 | ) | $ | 22 | $ | – | |||||||||||||||
| U.S. Treasury 5-Year Note Future | 978 | 12/31/2014 | 116,083 | 116,802 | – | (719 | ) | 160 | – | |||||||||||||||||||||
| U.S. Treasury Long Bond Future | 14 | 12/19/2014 | 1,947 | 1,975 | – | (28 | ) | 7 | – | |||||||||||||||||||||
| Total | $ | – | $ | (812 | ) | $ | 189 | $ | – | |||||||||||||||||||||
| Total futures contracts | $ | 382 | $ | (812 | ) | $ | 189 | $ | (36 | ) | ||||||||||||||||||||
* The number of contracts does not omit 000's.
| ╪ | See Significant Accounting Policies of accompanying Notes to Financial Statements regarding valuation of securities. |
| GLOSSARY: (abbreviations used in preceding Schedule of Investments) | |
| Municipal Bond Abbreviations: | |
| DA | Development Authority |
| GO | General Obligation |
| Rev | Revenue |
| Other Abbreviations: | |
| CLO | Collateralized Loan Obligation |
| FHLMC | Federal Home Loan Mortgage Corp. |
| FNMA | Federal National Mortgage Association |
| GNMA | Government National Mortgage Association |
| LIBOR | London Interbank Offered Rate |
| REIT | Real Estate Investment Trust |
| TBA | To Be Announced |
The accompanying notes are an integral part of these financial statements.
| 16 |
| The Hartford Short Duration Fund |
| Schedule of Investments – (continued) |
| October 31, 2014 |
| (000’s Omitted) |
Investment Valuation Hierarchy Level Summary
October 31, 2014
| Total | Level 1 ♦ | Level 2 ♦ | Level 3 | |||||||||||||
| Assets: | ||||||||||||||||
| Asset and Commercial Mortgage Backed Securities | $ | 174,273 | $ | – | $ | 159,557 | $ | 14,716 | ||||||||
| Corporate Bonds | 449,944 | – | 449,944 | – | ||||||||||||
| Municipal Bonds | 4,285 | – | 4,285 | – | ||||||||||||
| Senior Floating Rate Interests | 158,374 | – | 158,374 | – | ||||||||||||
| U.S. Government Agencies | 41,533 | – | 41,533 | – | ||||||||||||
| Short-Term Investments | 6,455 | – | 6,455 | – | ||||||||||||
| Total | $ | 834,864 | $ | – | $ | 820,148 | $ | 14,716 | ||||||||
| Futures * | $ | 382 | $ | 382 | $ | – | $ | – | ||||||||
| Total | $ | 382 | $ | 382 | $ | – | $ | – | ||||||||
| Liabilities: | ||||||||||||||||
| Futures * | $ | 812 | $ | 812 | $ | – | $ | – | ||||||||
| Total | $ | 812 | $ | 812 | $ | – | $ | – | ||||||||
| ♦ | For the year ended October 31, 2014, there were no transfers between Level 1 and Level 2. |
| * | Derivative instruments (excluding purchased and written options, if applicable) are valued at the unrealized appreciation/depreciation on the investments. |
Following is a reconciliation of Level 3 assets for which significant unobservable inputs were used to determine fair value:
| Balance
as of October 31, 2013 | Realized
Gain (Loss) | Change
in Unrealized Appreciation (Depreciation) | Net
Amortization | Purchases | Sales | Transfers Into Level 3 * | Transfers
Out of Level 3 * | Balance
as of October 31, 2014 | ||||||||||||||||||||||||||||
| Assets: | ||||||||||||||||||||||||||||||||||||
| Asset & Commercial Mortgage Backed Securities | $ | 18,258 | $ | 4 | $ | (234 | )† | $ | (43 | ) | $ | 8,453 | $ | (4,595 | ) | $ | — | $ | (7,127 | ) | $ | 14,716 | ||||||||||||||
| Corporate Bonds | 1,025 | — | — | — | — | — | — | (1,025 | ) | — | ||||||||||||||||||||||||||
| Total | $ | 19,283 | $ | 4 | $ | (234 | ) | $ | (43 | ) | $ | 8,453 | $ | (4,595 | ) | $ | — | $ | (8,152 | ) | $ | 14,716 | ||||||||||||||
| * | Investments are transferred into and out of Level 3 for a variety of reasons including, but not limited to: |
| 1) | Investments where trading has been halted (transfer into Level 3) or investments where trading has resumed (transfer out of Level 3). |
| 2) | Broker quoted investments (transfer into Level 3) or quoted prices in active markets (transfer out of Level 3). |
| 3) | Investments that have certain restrictions on trading (transfer into Level 3) or investments where trading restrictions have expired (transfer out of Level 3). |
| † | Change in unrealized appreciation (depreciation) in the current period relating to assets still held at October 31, 2014 was $(148). |
| Note: | For purposes of reporting transfers between different hierarchy levels, both transfers in and out of each level, as applicable, are shown as if they occurred at the beginning of the period. |
The accompanying notes are an integral part of these financial statements.
| 17 |
| The Hartford Short Duration Fund |
| Statement of Assets and Liabilities |
| October 31, 2014 |
| (000’s Omitted) |
| Assets: | ||||
| Investments in securities, at market value (cost $834,419) | $ | 834,864 | ||
| Cash | 873 | * | ||
| Receivables: | ||||
| Investment securities sold | 2,081 | |||
| Fund shares sold | 9,289 | |||
| Interest | 3,803 | |||
| Variation margin on financial derivative instruments | 189 | |||
| Other assets | 150 | |||
| Total assets | 851,249 | |||
| Liabilities: | ||||
| Bank overdraft | 804 | |||
| Payables: | ||||
| Investment securities purchased | 27,284 | |||
| Fund shares redeemed | 3,263 | |||
| Investment management fees | 68 | |||
| Dividends | 235 | |||
| Administrative fees | — | |||
| Distribution fees | 50 | |||
| Variation margin on financial derivative instruments | 36 | |||
| Accrued expenses | 124 | |||
| Total liabilities | 31,864 | |||
| Net assets | $ | 819,385 | ||
| Summary of Net Assets: | ||||
| Capital stock and paid-in-capital | $ | 816,739 | ||
| Undistributed net investment income | 186 | |||
| Accumulated net realized gain | 2,445 | |||
| Unrealized appreciation of investments | 15 | |||
| Net assets | $ | 819,385 | ||
| Shares authorized | 650,000 | |||
| Par value | $ | 0.001 | ||
| Class A: Net asset value per share/Maximum offering price per share | $9.91/$10.11 | |||
| Shares outstanding | 47,370 | |||
| Net assets | $ | 469,415 | ||
| Class B: Net asset value per share | $ | 9.96 | ||
| Shares outstanding | 654 | |||
| Net assets | $ | 6,510 | ||
| Class C: Net asset value per share | $ | 9.91 | ||
| Shares outstanding | 12,936 | |||
| Net assets | $ | 128,158 | ||
| Class I: Net asset value per share | $ | 9.93 | ||
| Shares outstanding | 20,970 | |||
| Net assets | $ | 208,183 | ||
| Class R3: Net asset value per share | $ | 9.88 | ||
| Shares outstanding | 89 | |||
| Net assets | $ | 879 | ||
| Class R4: Net asset value per share | $ | 9.89 | ||
| Shares outstanding | 101 | |||
| Net assets | $ | 997 | ||
| Class R5: Net asset value per share | $ | 9.89 | ||
| Shares outstanding | 11 | |||
| Net assets | $ | 109 | ||
| Class Y: Net asset value per share | $ | 9.88 | ||
| Shares outstanding | 519 | |||
| Net assets | $ | 5,134 |
* Cash of $873 was pledged as collateral for open financial derivative instruments at October 31, 2014.
The accompanying notes are an integral part of these financial statements.
| 18 |
| The Hartford Short Duration Fund |
| Statement of Operations |
| For the Year Ended October 31, 2014 |
| (000’s Omitted) |
| Investment Income: | ||||
| Interest | $ | 17,385 | ||
| Total investment income | 17,385 | |||
| Expenses: | ||||
| Investment management fees | 3,205 | |||
| Administrative services fees | ||||
| Class R3 | 1 | |||
| Class R4 | 1 | |||
| Class R5 | — | |||
| Transfer agent fees | ||||
| Class A | 756 | |||
| Class B | 21 | |||
| Class C | 131 | |||
| Class I | 73 | |||
| Class R3 | — | |||
| Class R4 | — | |||
| Class R5 | — | |||
| Class Y | — | |||
| Distribution fees | ||||
| Class A | 1,142 | |||
| Class B | 20 | |||
| Class C | 1,281 | |||
| Class R3 | 4 | |||
| Class R4 | 2 | |||
| Custodian fees | 11 | |||
| Accounting services fees | 148 | |||
| Registration and filing fees | 182 | |||
| Board of Directors' fees | 20 | |||
| Audit fees | 16 | |||
| Other expenses | 102 | |||
| Total expenses (before waivers and fees paid indirectly) | 7,116 | |||
| Expense waivers | (307 | ) | ||
| Custodian fee offset | — | |||
| Total waivers and fees paid indirectly | (307 | ) | ||
| Total expenses, net | 6,809 | |||
| Net Investment Income | 10,576 | |||
| Net Realized Gain on Investments, Other Financial Instruments and Foreign Currency Transactions: | ||||
| Net realized gain on investments | 3,450 | |||
| Net realized loss on futures contracts | (1,703 | ) | ||
| Net realized gain on foreign currency contracts | 1 | |||
| Net realized loss on other foreign currency transactions | (1 | ) | ||
| Net Realized Gain on Investments, Other Financial Instruments and Foreign Currency Transactions | 1,747 | |||
| Net Changes in Unrealized Depreciation of Investments and Other Financial Instruments: | ||||
| Net unrealized depreciation of investments | (5,004 | ) | ||
| Net unrealized appreciation of futures contracts | 396 | |||
| Net Changes in Unrealized Depreciation of Investments and Other Financial Instruments | (4,608 | ) | ||
| Net Loss on Investments, Other Financial Instruments and Foreign Currency Transactions | (2,861 | ) | ||
| Net Increase in Net Assets Resulting from Operations | $ | 7,715 |
The accompanying notes are an integral part of these financial statements.
| 19 |
| The Hartford Short Duration Fund |
| Statement of Changes in Net Assets |
| (000’s Omitted) |
| For the Year Ended October 31, 2014 | For the Year Ended October 31, 2013 | |||||||
| Operations: | ||||||||
| Net investment income | $ | 10,576 | $ | 8,973 | ||||
| Net realized gain on investments, other financial instruments and foreign currency transactions | 1,747 | 3,938 | ||||||
| Net unrealized depreciation of investments and other financial instruments | (4,608 | ) | (6,075 | ) | ||||
| Net Increase in Net Assets Resulting from Operations | 7,715 | 6,836 | ||||||
| Distributions to Shareholders: | ||||||||
| From net investment income | ||||||||
| Class A | (6,942 | ) | (5,207 | ) | ||||
| Class B | (123 | ) | (127 | ) | ||||
| Class C | (994 | ) | (1,310 | ) | ||||
| Class I | (2,477 | ) | (2,333 | ) | ||||
| Class R3 | (9 | ) | (4 | ) | ||||
| Class R4 | (15 | ) | (15 | ) | ||||
| Class R5 | (2 | ) | (2 | ) | ||||
| Class Y | (94 | ) | (118 | ) | ||||
| Total from net investment income | (10,656 | ) | (9,116 | ) | ||||
| From net realized gain on investments | ||||||||
| Class A | (1,823 | ) | (517 | ) | ||||
| Class B | (37 | ) | (15 | ) | ||||
| Class C | (534 | ) | (252 | ) | ||||
| Class I | (433 | ) | (228 | ) | ||||
| Class R3 | (3 | ) | (1 | ) | ||||
| Class R4 | (4 | ) | (1 | ) | ||||
| Class R5 | — | — | ||||||
| Class Y | (12 | ) | (9 | ) | ||||
| Total from net realized gain on investments | (2,846 | ) | (1,023 | ) | ||||
| Total distributions | (13,502 | ) | (10,139 | ) | ||||
| Capital Share Transactions: | ||||||||
| Class A | 21,445 | 172,859 | ||||||
| Class B | (3,023 | ) | 1,665 | |||||
| Class C | (4,514 | ) | (1,942 | ) | ||||
| Class I | 103,717 | (10,845 | ) | |||||
| Class R3 | 358 | 270 | ||||||
| Class R4 | 76 | 153 | ||||||
| Class R5 | (2 | ) | 7 | |||||
| Class Y | 2,165 | (1,903 | ) | |||||
| Net increase from capital share transactions | 120,222 | 160,264 | ||||||
| Net Increase in Net Assets | 114,435 | 156,961 | ||||||
| Net Assets: | ||||||||
| Beginning of period | 704,950 | 547,989 | ||||||
| End of period | $ | 819,385 | $ | 704,950 | ||||
| Undistributed (distributions in excess of) net investment income | $ | 186 | $ | 117 | ||||
The accompanying notes are an integral part of these financial statements.
| 20 |
| The Hartford Short Duration Fund |
| Notes to Financial Statements |
| October 31, 2014 |
| (000’s Omitted) |
Organization:
The Hartford Mutual Funds, Inc. (“Company”) is an open-end management investment company comprised of forty-two portfolios. Financial statements for The Hartford Short Duration Fund (the "Fund"), a series of the Company, are included in this report.
The Company is organized under the laws of the State of Maryland and is registered with the Securities and Exchange Commission (“SEC”) under the Investment Company Act of 1940, as amended (“1940 Act”). The Fund is a diversified open-end management investment company. The Fund is an investment company and applies specialized accounting and reporting under Accounting Standards Codification Topic 946, Financial Services - Investment Companies.
Class A shares are sold with a front-end sales charge of up to 2.00%. Class B shares were sold with a contingent deferred sales charge which is assessed on the lesser of the per share net asset value (“NAV”) of the shares at the time of redemption or the original purchase price, and declines from up to 5.00% to zero depending on the period of time the shares are held (see note below regarding the closing of Class B shares). Class C shares are sold with a contingent deferred sales charge of up to 1.00% on shares redeemed within twelve months of purchase. Class I shares are sold without sales charges to certain eligible investors primarily through advisory fee-based wrap programs. Class R3, R4 and R5 shares, which are offered to employer-sponsored retirement plans, and Class Y shares, which are sold to certain eligible institutional investors, are sold without a sales charge. All classes of shares have identical voting, redemption, dividend, liquidation and other rights and the same terms and conditions, with the exceptions that each class may have different expenses, which may affect performance, and that Class B shares automatically convert to Class A shares after 8 years.
No new or additional investments are allowed in Class B shares of the Fund (including investments through any systematic investment plan). Existing shareholders of Class B shares may continue to hold their Class B shares, exchange their Class B shares for Class B shares of another Hartford Fund (as permitted by existing exchange privileges), or redeem their Class B shares as described in the Fund’s prospectus. Reinstatement privileges with respect to Class B shares are set forth in the Fund's prospectus. For investors electing to reinvest capital gains and dividends, any such capital gains or dividends on Class B shares will continue to be reinvested in Class B shares of the Fund. All Class B share attributes, including the 12b-1 fee, contingent deferred sales charge schedule, and conversion to Class A shares, remain unchanged.
Significant Accounting Policies:
The following is a summary of significant accounting policies of the Fund in the preparation of its financial statements, which are in accordance with United States generally accepted accounting principles (“U.S. GAAP”). The preparation of financial statements in accordance with U.S. GAAP may require management to make estimates and assumptions that affect the reported amounts of assets and liabilities and disclosure of contingent assets and liabilities at the date of the financial statements and the reported amounts of increases and decreases in net assets from operations during the reporting period. Actual results could differ from those estimates.
Determination of Net Asset Value – The NAV of each class of the Fund's shares is determined as of the close of regular trading (normally 4:00 p.m. Eastern Time) (the “NYSE Close”) on each day that the New York Stock Exchange (the “Exchange”) is open (“Valuation Date”). Information that becomes known to the Fund after the NAV has been calculated on a particular day will not generally be used to retroactively adjust the NAV determined earlier that day.
Investment Valuation and Fair Value Measurements – For purposes of calculating the NAV, portfolio investments and other assets held by the Fund's portfolio for which market quotes are readily available are valued at market value. Market value is generally determined on the basis of last reported sales prices or official close price. If no sales are reported, market value is based on quotes obtained from a quotation reporting system, established market makers, or independent pricing services. If market prices are not readily available or are deemed unreliable, the Fund will use the fair value of the investment as determined in good faith under policies and procedures established by and under the supervision of the Company's Board of Directors. Market quotes are considered not readily available where there is an absence of current or reliable market-based data (e.g., trade information or indicative market quotes), including where events occur after the close of the relevant market, but prior to the NYSE Close, that materially affect the values of the Fund's portfolio investments or assets. In addition, market quotes are considered not readily available when, due to extraordinary circumstances, the exchanges or markets on which the investments trade do not open for trading for the entire day and
| 21 |
| The Hartford Short Duration Fund |
| Notes to Financial Statements – (continued) |
| October 31, 2014 |
| (000’s Omitted) |
no other market prices are available. There can be no assurance that the Fund could obtain the fair market value assigned to an investment if the Fund were to sell the investment at approximately the time at which the Fund determines its NAV.
Fixed income investments (other than short-term obligations), non-exchange traded derivatives and centrally cleared swaps held by the Fund are normally valued on the basis of quotes obtained from independent pricing services or brokers and dealers in accordance with procedures established by the Company's Board of Directors. Prices obtained from independent pricing services use information provided by market makers or estimates of market values through accepted market modeling, trading and pricing conventions. Inputs to the models may include, but are not limited to, prepayment speeds, pricing spread, yield, trade information, dealer quotes, market color, cash flow models and the investment’s terms and conditions. Generally, the Fund may use fair valuation in regard to fixed income investments when the Fund holds defaulted or distressed investments or investments in a company in which a reorganization is pending. Senior floating rate interests generally trade in over-the-counter (“OTC”) markets and are priced through an independent pricing service utilizing independent market quotations from loan dealers or financial institutions. A composite bid price is used, which is an average of the dealer marks and dealer runs. Short-term investments maturing in 60 days or less are generally valued at amortized cost, if their original term to maturity was 60 days or less, or by amortizing their value on the 61st day prior to maturity, if the original term to maturity exceeded 60 days, which approximates fair value.
Exchange traded options, futures and options on futures are valued at the settlement price or last trade price determined by the relevant exchange as of the NYSE Close. If the last trade price for exchange traded options does not fall between the bid and ask prices, the value will be the mean of the bid and ask prices as of the NYSE Close. If a last trade price is not available, the value will be the mean of the bid and ask prices as of the NYSE Close. If a mean of the bid and ask prices cannot be calculated for the day, the value will be the bid price as of the NYSE Close. In the case of OTC options and such instruments that do not trade on an exchange, values may be supplied by a pricing service using a formula or other objective method that may take into consideration the style, direction, expiration, strike price, notional value and volatility or other special adjustments.
Investments valued in currencies other than U.S. dollars are converted to U.S. dollars using exchange rates obtained from independent pricing services for calculation of the NAV. As a result, the NAV of the Fund’s shares may be affected by changes in the value of currencies in relation to the U.S. dollar. The value of investments traded in markets outside the United States or denominated in currencies other than the U.S. dollar may be affected significantly on a day that the NYSE is closed and the market value may change on days when an investor is not able to purchase, redeem or exchange shares of the Fund.
Foreign currency contracts represent agreements to exchange currencies on specific future dates at predetermined rates. Foreign currency contracts are valued using foreign currency exchange rates and forward rates as provided by an independent pricing service on the Valuation Date.
Financial instruments for which prices are not available from an independent pricing service may be valued using market quotations obtained from one or more dealers that make markets in the respective financial instrument in accordance with procedures established by the Company's Board of Directors.
U.S. GAAP defines fair value as the price that the Fund would receive to sell an asset or pay to transfer a liability in an orderly transaction between market participants. The U.S. GAAP fair value measurement standards require disclosure of a fair value hierarchy for each major category of assets and liabilities. Various inputs are used in determining the fair value of the Fund’s investments. These inputs are summarized into three broad hierarchy levels. This hierarchy is based on whether the valuation inputs are observable or unobservable. These levels are:
Level 1 – Quoted prices in active markets for identical investments. Level 1 may include exchange traded instruments, such as domestic equities, some foreign equities, options, futures, mutual funds, exchange traded funds, rights and warrants.
Level 2 – Observable inputs other than Level 1 prices, such as quoted prices for similar investments; quoted prices in markets that are not active; or other inputs that are observable or can be corroborated by observable market data. Level 2 may include debt investments that are traded less frequently than exchange traded instruments and which are valued using independent pricing services; foreign equities, which are principally traded on certain foreign markets and are adjusted daily pursuant to a fair value pricing service in order to reflect an adjustment for the factors occurring after the close of certain foreign markets but
| 22 |
| The Hartford Short Duration Fund |
| Notes to Financial Statements – (continued) |
| October 31, 2014 |
| (000’s Omitted) |
before the NYSE Close; senior floating rate interests, which are valued using an aggregate of dealer bids; short-term investments, which are valued at amortized cost; and swaps, which are valued based upon the terms of each swap contract.
Level 3 – Significant unobservable inputs that are supported by limited or no market activity. Level 3 may include financial instruments whose values are determined using indicative market quotes or require significant management judgment or estimation. These unobservable valuation inputs may include estimates for current yields, maturity/duration, prepayment speed, and indicative market quotes for comparable investments along with other assumptions relating to credit quality, collateral value, complexity of the investment structure, general market conditions and liquidity. This category may include investments where trading has been halted or there are certain restrictions on trading. While these investments are priced using unobservable inputs, the valuation of these investments reflects the best available data and management believes the prices are a reasonable representation of exit price.
The Board of Directors of the Company generally reviews and approves the “Procedures for Valuation of Portfolio Securities” at least once a year. These procedures define how investments are to be valued, including the formation and activities of a Valuation Committee. The Valuation Committee is responsible for determining in good faith the fair value of investments when the value cannot be obtained from primary pricing services or alternative sources or if the valuation of an investment as provided by the primary pricing service or alternative source is believed not to reflect the investment’s fair value as of the Valuation Date. Voting members of the Valuation Committee include the Fund's Treasurer or designee and a Vice President of the investment manager or designee. An Assistant Vice President of the Fund with legal expertise or designee is also included on the Valuation Committee as a non-voting advisory member. In addition, the Fund’s Chief Compliance Officer shall designate a member of the compliance group to attend Valuation Committee meetings as a non-voting resource, to monitor for and provide guidance with respect to compliance with these procedures. Two members of the Valuation Committee or their designees, representing different departments, shall constitute a quorum for purposes of permitting the Valuation Committee to take action. The Valuation Committee will consider all relevant factors in determining an investment’s fair value, and may seek the advice of the Fund’s sub-adviser, knowledgeable brokers, and legal counsel in making such determination. The Valuation Committee reports to the Audit Committee of the Company's Board of Directors. The Audit Committee receives quarterly written reports which include details of all fair-valued investments, including the reason for the fair valuation, and an indication, when possible, of the accuracy of the valuation by disclosing the next available reliable public price quotation or the disposition price of such investments (the “look-back” test). The Board of Directors then must consider for ratification all of the fair value determinations made during the previous quarter.
Valuation levels are not necessarily indicative of the risk associated with investing in such investments. Individual investments within any of the above mentioned asset classes may be assigned a different hierarchical level than those presented above, as individual circumstances dictate.
For additional information, refer to the Investment Valuation Hierarchy Level Summary and the Level 3 roll-forward reconciliation, if applicable, which follow the Schedule of Investments.
Investment Transactions and Investment Income – Investment transactions are recorded as of the trade date (the date the order to buy or sell is executed) for financial reporting purposes. Investments purchased or sold on a when-issued or delayed-delivery basis may be settled a month or more after the trade date. Realized gains and losses are determined on the basis of identified cost.
Trade date for senior floating rate interests purchased in the primary loan market is considered the date on which the loan allocations are determined. Trade date for senior floating rate interests purchased in the secondary loan market is the date on which the transaction is entered into.
Interest income, including amortization of premium, accretion of discounts and additional principal received in-kind in lieu of cash, is accrued on a daily basis. Paydown gains and losses on mortgage related and other asset backed securities are included in interest income in the Statement of Operations, as applicable.
| 23 |
| The Hartford Short Duration Fund |
| Notes to Financial Statements – (continued) |
| October 31, 2014 |
| (000’s Omitted) |
Foreign Currency Transactions – Assets and liabilities denominated in currencies other than U.S. dollars are translated into U.S. dollars at the exchange rates in effect on the valuation date. Purchases and sales of investments, income and expenses are translated into U.S. dollars at the exchange rates on the dates of such transactions.
The Fund does not isolate that portion of portfolio investment valuation resulting from fluctuations in the foreign currency exchange rates from the fluctuations arising from changes in the market prices of investments held. Exchange rate fluctuations are included with the net realized and unrealized gain or loss on investments in the accompanying financial statements.
Net realized foreign exchange gains or losses arise from sales of foreign currencies and the difference between asset and liability amounts initially stated in foreign currencies and the U.S. dollar value of the amounts actually received or paid. Net unrealized foreign exchange gains or losses arise from changes in the value of other assets and liabilities at the end of the reporting period, resulting from changes in the exchange rates.
Joint Trading Account – The Fund may invest cash balances into a joint trading account that may be invested in one or more repurchase agreements.
Fund Share Valuation and Dividend Distributions to Shareholders – Orders for the Fund’s shares are executed in accordance with the investment instructions of the shareholders. The NAV of the Fund’s shares is determined as of the close of business on each business day of the Exchange. The NAV is determined separately for each class of shares of the Fund by dividing the Fund’s net assets attributable to that class by the number of shares of the class outstanding. Each class of shares offered by the Fund has equal rights as to assets and voting privileges (except that shareholders of a class have exclusive voting rights regarding any matter relating solely to that class of shares). Income and non-class specific expenses are allocated daily to each class on the basis of the relative net assets of the class. Realized and unrealized gains and losses are allocated daily based on the relative net assets of each class of shares of the Fund.
Orders for the purchase of the Fund’s shares received prior to the close of the Exchange on any day the Exchange is open for business are priced at the NAV determined as of the close of the Exchange. Orders received after the close of the Exchange, or on a day on which the Exchange and/or the Fund is not open for business, are priced at the next determined NAV.
Dividends are declared pursuant to a policy adopted by the Company's Board of Directors based upon the investment performance of the Fund. Normally, dividends from net investment income are declared daily and paid monthly. Dividends from realized gains, if any, are paid at least once a year.
Net investment income, dividends and distributions from net realized gains and capital are determined in accordance with federal income tax regulations, which may differ from U.S. GAAP with respect to character and timing (see Federal Income Taxes: Distributions and Components of Distributable Earnings and Reclassification of Capital Accounts).
Securities and Other Investments:
Repurchase Agreements – A repurchase agreement is an agreement by which a counterparty agrees to sell an investment and agrees to repurchase the investment sold from the buyer at a mutually agreed upon time and price. During the period of the repurchase agreement, the counterparty will deposit cash and or securities in a third party custodial account to serve as collateral. At the time the Fund enters into a repurchase agreement, the value of the underlying collateral, including accrued interest, will be equal to or exceed the value of the repurchase agreement. Repurchase agreements expose the Fund to counterparty risk - that is, the risk that the counterparty will not fulfill its obligations. To minimize counterparty risk, the investments that serve to collateralize the repurchase agreement are held by the Fund’s custodian in book entry or physical form in the custodial account of the Fund or in a third party custodial account. Repurchase agreements are valued at cost plus accrued interest, which approximates fair value. Repurchase agreements have master netting arrangements which allow the Fund to offset amounts owed to a counterparty with amounts owed by the counterparty, including any collateral. Upon an event of default under a master repurchase agreement, the non-defaulting party may close out all transactions traded under such agreement and net amounts owed under each transaction to one net amount payable by one party to the other. Absent an event of default, the master repurchase agreement does not result in an offset of reported amounts of assets and liabilities in the Statement of Assets and Liabilities across transactions between the Fund and the
| 24 |
| The Hartford Short Duration Fund |
| Notes to Financial Statements – (continued) |
| October 31, 2014 |
| (000’s Omitted) |
applicable counterparty. The Fund, as shown on the Schedule of Investments, had outstanding repurchase agreements and related collateral as of October 31, 2014.
Illiquid and Restricted Investments – The Fund is permitted to invest up to 15% of its net assets in illiquid investments. Illiquid investments are those that may not be sold or disposed of in the ordinary course of business within seven days, at approximately the price used to determine the Fund’s NAV. The Fund may not be able to sell illiquid investments when its sub-adviser considers it desirable to do so or may have to sell such investments at a price that is lower than the price that could be obtained if the investments were more liquid. A sale of illiquid investments may require more time and may result in higher dealer discounts and other selling expenses than does the sale of those that are liquid. Illiquid investments also may be more difficult to value due to the unavailability of reliable market quotations for such investments, and an investment in them may have an adverse impact on the Fund’s NAV. The Fund may also purchase certain restricted investments that can only be resold to certain qualified investors and may be determined to be liquid pursuant to policies and guidelines established by the Company's Board of Directors. The Fund, as shown on the Schedule of Investments, had illiquid or restricted investments as of October 31, 2014.
Investments Purchased on a When-Issued or Delayed-Delivery Basis – Delivery and payment for investments that have been purchased by the Fund on a forward commitment, or when-issued or delayed-delivery basis, take place beyond the customary settlement period. The Fund may dispose of or renegotiate a delayed-delivery transaction after it is entered into, and may sell delayed-delivery investments before they are delivered, which may result in a realized gain or loss. During this period, such investments are subject to market fluctuations, and the Fund identifies investments segregated in its records with a value at least equal to the amount of the commitment. The Fund, as shown on the Schedule of Investments, had when-issued or delayed-delivery investments as of October 31, 2014.
In connection with the Fund’s ability to purchase investments on a when-issued or forward commitment basis, the Fund may enter into to-be announced (“TBA”) commitments. TBA commitments are forward agreements for the purchase or sale of mortgage backed securities for a fixed price, with payment and delivery on an agreed-upon future settlement date. The specific securities to be delivered are not identified at the trade date; however, delivered securities must meet specified terms, including issuer, rate and mortgage terms. Although the Fund may enter into TBA commitments with the intention of acquiring or delivering securities for its portfolio, the Fund can extend the settlement date, roll the transaction, or dispose of a commitment prior to settlement if deemed appropriate to do so. If the TBA commitment is closed through the acquisition of an offsetting TBA commitment, the Fund realizes a gain or loss. In a TBA roll transaction, the Fund generally purchases or sells the initial TBA commitment prior to the agreed upon settlement date and enters into a new TBA commitment for future delivery or receipt of the mortgage backed securities. TBA commitments involve a risk of loss if the value of the security to be purchased or sold declines or increases, respectively, prior to settlement date.
The Fund may enter into “dollar rolls” in which the Fund sells securities and contracts with the same counterparty to repurchase substantially similar securities (for example, same issuer, coupon and maturity) on a specified future date at an agreed upon price. The Fund gives up the right to receive interest paid on the investments sold. The Fund would benefit to the extent of any differences between the price received for the security and the lower forward price for the future purchase. Dollar rolls involve the risk that the market value of the securities that the Fund is required to purchase may decline below the agreed upon repurchase price of those securities. The Fund records dollar roll transactions as purchases and sales and realizes gains and losses on these transactions. These transactions are excluded from the Fund’s portfolio turnover rate. The Fund, as shown on the Schedule of Investments, had open TBA commitments as of October 31, 2014, which may be a part of dollar roll transactions.
Senior Floating Rate Interests – The Fund may invest in senior floating rate interests. Senior floating rate interests hold the most senior position in the capital structure of a business entity (the “Borrower”), are typically secured by specific collateral and have a claim on the assets and/or stock of the Borrower that is senior to the assets held by subordinated debtholders and stockholders of the Borrower. Senior floating rate interests are typically structured and administered by a financial institution that acts as the agent of the lenders participating in the senior floating rate interest. The Fund may invest in multiple series or tranches of a senior floating rate interest, which may have varying terms and carry different associated risks. The Fund may also enter into unfunded loan commitments, which are contractual obligations for future funding. Unfunded loan commitments may include revolving credit facilities, which may obligate the Fund to supply additional cash to the borrower on demand, representing a potential financial obligation by the Fund in the future. The Fund may receive a commitment fee based on the undrawn portion of the underlying line of credit portion of a
| 25 |
| The Hartford Short Duration Fund |
| Notes to Financial Statements – (continued) |
| October 31, 2014 |
| (000’s Omitted) |
senior floating rate interest. In certain circumstances, the Fund may receive various fees upon the restructure of a senior floating rate interest by a borrower. Fees earned/paid are recorded as a component of income or realized gain/loss in the Statement of Operations.
Senior floating rate interests are typically rated below-investment-grade, which suggests the risk of default is higher, and generally pay higher interest rates than investment-grade debt securities. A default could lead to non-payment of income or principal, which would result in a reduction of investment income to the Fund, and there can be no assurance that the liquidation of any collateral would satisfy the Borrower’s obligation in the event of non-payment of scheduled interest or principal payments, or that such collateral could be readily liquidated. The Fund, as shown on the Schedule of Investments, had senior floating rate interests as of October 31, 2014.
Mortgage Related and Other Asset Backed Securities – The Fund may invest in mortgage related and other asset backed securities. These securities include mortgage pass-through securities, collateralized mortgage obligations, commercial mortgage backed securities, stripped mortgage backed securities, asset backed securities, collateralized debt obligations and other securities that directly or indirectly represent a participation in, or are secured by and payable from, mortgage loans on real property. Mortgage related securities are created from pools of residential or commercial mortgage loans, including mortgage loans made by savings and loan institutions, mortgage bankers, commercial banks and other similar financial institutions. Asset backed securities are created from many types of assets, including auto loans, credit card receivables, home equity loans, and student loans. These securities provide a monthly payment that consists of both interest and principal payments. Interest payments may be determined by fixed or adjustable rates. The rate of pre-payments on underlying mortgages will affect the price and volatility of a mortgage related security, and may have the effect of shortening or extending the effective duration of the security relative to what was anticipated at the time of purchase. The timely payment of principal and interest of certain mortgage related securities is guaranteed by the full faith and credit of the United States Government. Mortgage related and other asset backed securities created and guaranteed by non-governmental issuers, including government-sponsored corporations, may be supported by various forms of insurance or guarantees, but there can be no assurance that the private insurers or guarantors can meet their obligations under the insurance policies or guarantee arrangements. The Fund, as shown on the Schedule of Investments, had outstanding mortgage related and other asset backed securities as of October 31, 2014.
Financial Derivative Instruments:
The following disclosures contain information on how and why the Fund uses derivative instruments, the credit-risk-related contingent features in certain derivative instruments and how derivative instruments affect the Fund’s financial position and results of operations. The location and fair value amounts of these instruments on the Statement of Assets and Liabilities and the realized gains and losses and changes in unrealized gains and losses on the Statement of Operations, each categorized by type of derivative contract, are included in the following Additional Derivative Instrument Information footnote. The derivative instruments outstanding as of year-end are disclosed in the notes to the Schedule of Investments, if applicable. The amounts of realized gains and losses and changes in unrealized gains and losses on derivative instruments during the year are disclosed in the Statement of Operations.
Foreign Currency Contracts – The Fund may enter into foreign currency contracts that obligate the Fund to purchase or sell currencies at specified future dates. Foreign currency contracts are used to hedge the currency exposure associated with some or all of the Fund’s investments and/or as part of an investment strategy. Foreign currency contracts are marked to market daily and the change in value is recorded by the Fund as an unrealized gain or loss. The Fund will record a realized gain or loss when the foreign currency contract is settled.
Foreign currency contracts involve elements of market risk in excess of the amounts reflected in the Statement of Assets and Liabilities. In addition, risks may arise upon entering into these contracts from the potential inability of the counterparties to meet the terms of the contracts and from unanticipated movements in the value of the foreign currencies relative to the U.S. dollar. The Fund had no outstanding foreign currency contracts as of October 31, 2014.
Futures Contracts – The Fund may enter into futures contracts. A futures contract is an agreement between two parties to buy or sell an asset at a set price on a future date. The Fund uses futures contracts to manage or obtain exposure to the investment markets, commodities, or movements in interest rates and currency values. The primary risks associated with the use of futures contracts are the imperfect correlation between the change in market value of the investments held by the Fund and the prices of futures contracts
| 26 |
| The Hartford Short Duration Fund |
| Notes to Financial Statements – (continued) |
| October 31, 2014 |
| (000’s Omitted) |
and the possibility of an illiquid market. Upon entering into a futures contract, the Fund is required to deposit with a futures commission merchant (“FCM”) an amount of cash or U.S. Government or Agency Obligations in accordance with the initial margin requirements of the broker or exchange. Futures contracts are marked to market daily at the most recent settlement price reported by an exchange on which, over time, they are traded most extensively, and an appropriate payable or receivable for the change in value (“variation margin”) is recorded by the Fund. Gains or losses are recognized but not considered realized until the contracts expire or are closed. Futures contracts involve, to varying degrees, risk of loss in excess of the variation margin disclosed on the Statement of Assets and Liabilities; however, the Fund seeks to reduce this risk through the use of an FCM. The Fund, as shown on the Schedule of Investments, had outstanding futures contracts as of October 31, 2014.
Additional Derivative Instrument Information:
| Fair Value of Derivative Instruments on the Statement of Assets and Liabilities as of October 31, 2014: | ||||||||||||||||||||||||||||
| Risk Exposure Category | ||||||||||||||||||||||||||||
| Interest
Rate Contracts | Foreign
Exchange Contracts | Credit
Contracts | Equity
Contracts | Commodity
Contracts | Other
Contracts | Total | ||||||||||||||||||||||
| Assets: | ||||||||||||||||||||||||||||
| Variation margin receivable * | $ | 189 | $ | — | $ | — | $ | — | $ | — | $ | — | $ | 189 | ||||||||||||||
| Total | $ | 189 | $ | — | $ | — | $ | — | $ | — | $ | — | $ | 189 | ||||||||||||||
| Liabilities: | ||||||||||||||||||||||||||||
| Variation margin payable * | $ | 36 | $ | — | $ | — | $ | — | $ | — | $ | — | $ | 36 | ||||||||||||||
| Total | $ | 36 | $ | — | $ | — | $ | — | $ | — | $ | — | $ | 36 | ||||||||||||||
* Only current day's variation margin is reported within the Statement of Assets and Liabilities. The variation margin is included in the open futures net cumulative depreciation of $(430) as reported in the Schedule of Investments.
The ratio of futures market value to net assets at October 31, 2014 was 23.77%, compared to the twelve-month average ratio of 14.54% during the year ended October 31, 2014.
| The Effect of Derivative Instruments on the Statement of Operations for the year ended October 31, 2014: | ||||||||||||||||||||||||||||
| Risk Exposure Category | ||||||||||||||||||||||||||||
| Interest
Rate Contracts | Foreign
Exchange Contracts | Credit
Contracts | Equity
Contracts | Commodity
Contracts | Other
Contracts | Total | ||||||||||||||||||||||
| Realized Gain (Loss) on Derivatives Recognized as a Result of Operations: | ||||||||||||||||||||||||||||
| Net realized loss on futures contracts | $ | (1,703 | ) | $ | — | $ | — | $ | — | $ | — | $ | — | $ | (1,703 | ) | ||||||||||||
| Net realized gain on foreign currency contracts | — | 1 | — | — | — | — | 1 | |||||||||||||||||||||
| Total | $ | (1,703 | ) | $ | 1 | $ | — | $ | — | $ | — | $ | — | $ | (1,702 | ) | ||||||||||||
| Net Change in Unrealized Appreciation (Depreciation) on Derivatives Recognized as a Result of Operations: | ||||||||||||||||||||||||||||
| Net change in unrealized appreciation of futures contracts | $ | 396 | $ | — | $ | — | $ | — | $ | — | $ | — | $ | 396 | ||||||||||||||
| Total | $ | 396 | $ | — | $ | — | $ | — | $ | — | $ | — | $ | 396 | ||||||||||||||
Balance Sheet Offsetting Information - The following discloses both gross information and net information about instruments and transactions eligible for offset in the financial statements, and instruments and transactions that are subject to a master netting arrangement, as well as amounts related to margin, reflected as financial collateral (including cash collateral), held at clearing brokers, counterparties and the Fund’s custodian. The master netting arrangements allow the clearing brokers to net any collateral held in or on behalf of the Fund, or liabilities or payment obligations of the clearing brokers to the Fund, against any liabilities or payment obligations of the Fund to the clearing brokers. The Fund is required to deposit financial collateral (including cash collateral) at the FCM's custodian on behalf of clearing brokers and counterparties to continually meet the original and maintenance requirements established by the clearing brokers and counterparties. Such requirements are specific to the respective clearing broker or counterparty. Certain master netting arrangements may not be enforceable in the bankruptcy proceedings of a counterparty.
| 27 |
| The Hartford Short Duration Fund |
| Notes to Financial Statements – (continued) |
| October 31, 2014 |
| (000’s Omitted) |
| Offsetting of Financial Assets and Derivative Assets as of October 31, 2014: |
| Gross
Amounts* of Assets Presented in Statement of Assets and Liabilities | Financial
Instruments with Allowable Netting | Non-cash
Collateral Received | Cash
Collateral Received | Net
Amount (not less than $0) | ||||||||||||||||
| Description | ||||||||||||||||||||
| Futures contracts - variation margin receivable | $ | 189 | $ | (36 | ) | $ | — | $ | — | $ | 153 | |||||||||
| Total subject to a master netting or similar arrangement | $ | 189 | $ | (36 | ) | $ | — | $ | — | $ | 153 | |||||||||
* Gross amounts are presented here as there are no amounts that are netted within the Statement of Assets and Liabilities.
| Offsetting of Financial Liabilities and Derivative Liabilities as of October 31, 2014: |
| Gross
Amounts* of Liabilities Presented in Statement of Assets and Liabilities | Financial
Instruments with Allowable Netting | Non-cash
Collateral Pledged | Cash
Collateral Pledged | Net
Amount (not less than $0) | ||||||||||||||||
| Description | ||||||||||||||||||||
| Futures contracts - variation margin payable | $ | 36 | $ | (36 | ) | $ | — | $ | (873 | ) | $ | — | ||||||||
| Total subject to a master netting or similar arrangement | $ | 36 | $ | (36 | ) | $ | — | $ | (873 | ) | $ | — | ||||||||
* Gross amounts are presented here as there are no amounts that are netted within the Statement of Assets and Liabilities.
Principal Risks:
Credit risk depends largely on the perceived financial health of bond issuers. In general, the credit rating is inversely related to the credit risk of the issuer. Higher rated bonds generally are deemed to have less credit risk, while lower or unrated bonds are deemed to have higher risk of default. The share price, yield and total return of a fund that holds securities with higher credit risk may be more volatile than those of a fund that holds bonds with lower credit risk. Similar to credit risk, the Fund may be exposed to counterparty risk, or the risk that an institution or other entity with which the Fund has unsettled or open transactions will default.
The Fund’s investments expose the Fund to various risks including, but not limited to, interest rate, prepayment, extension and foreign currency risks. Interest rate risk is the risk that fixed income securities will decline in value because of changes in interest rates. As nominal interest rates rise, the values of certain fixed income securities held by the Fund are likely to decrease. A nominal interest rate can be described as the sum of a real interest rate and an expected inflation rate. Fixed income securities with longer durations tend to be more sensitive to changes in interest rates, usually making them more volatile than securities with shorter durations. Duration is useful primarily as a measure of the sensitivity of a fixed income security’s market price to interest rate (i.e., yield) movements. Senior floating rate interests and securities subject to prepayment and extension risk generally offer less potential for gains when interest rates decline. Rising interest rates may cause prepayments to occur at a slower than expected rate, thereby effectively lengthening the maturity of the security and making the security more sensitive to interest rate changes. Prepayment and extension risk are major risks of mortgage backed securities, senior floating rate interests and certain asset backed securities. For certain asset backed securities, the actual maturity may be less than the stated maturity shown in the Schedule of Investments, if applicable. As a result, the timing of income recognition relating to these securities may vary based upon the actual maturity.
If the Fund invests directly in foreign currencies or in securities that trade in, and receive revenues in, foreign currencies, or in derivatives that provide exposure to foreign currencies, it will be subject to the risk that those currencies will decline in value relative to the base currency (U.S. dollars) of the Fund, or, in the case of hedging positions, that the Fund’s base currency will decline in value relative to the currency being hedged. Currency rates in foreign countries may fluctuate significantly over short periods of time for a number of reasons, including changes in interest rates, intervention (or the failure to intervene) by U.S. or foreign governments, central banks or supranational entities, such as the International Monetary Fund, or by the imposition of currency controls or other political developments in the United States or abroad. As a result, the Fund’s investments in foreign currency denominated securities
| 28 |
| The Hartford Short Duration Fund |
| Notes to Financial Statements – (continued) |
| October 31, 2014 |
| (000’s Omitted) |
may reduce the returns of the Fund. The market values of equity securities, such as common stocks and preferred stocks, or equity related investments, such as futures and options, may decline due to general market conditions which are not specifically related to a particular company, such as real or perceived adverse economic conditions, changes in the general outlook for corporate earnings, changes in interest or currency rates or adverse investor sentiment generally. The market value of equity securities may also decline due to factors which affect a particular industry or industries, such as labor shortages or increased production costs and competitive conditions within an industry. Equity securities and equity related investments generally have greater market price volatility than fixed income securities.
Federal Income Taxes:
Federal Income Taxes – For federal income tax purposes, the Fund intends to continue to qualify as a Regulated Investment Company ("RIC") under Subchapter M of the Internal Revenue Code (“IRC”) by distributing substantially all of its taxable net investment income and net realized capital gains to its shareholders and otherwise complying with the requirements of the IRC. The Fund has distributed substantially all of its income and capital gains in prior years, if applicable, and intends to distribute substantially all of its income and capital gains during the calendar year ending December 31, 2014. Accordingly, no provision for federal income or excise taxes has been made in the accompanying financial statements. Distributions from short-term capital gains are treated as ordinary income distributions for federal income tax purposes.
Net Investment Income (Loss), Net Realized Gains (Losses) and Distributions – Net investment income (loss) and net realized gains (losses) may differ for financial statement and tax purposes primarily because of losses deferred due to wash sale adjustments, foreign currency gains and losses, adjustments related to Passive Foreign Investment Companies ("PFICs"), Real Estate Investment Trusts ("REITs"), RICs, certain derivatives and partnerships. The character of distributions made during the year from net investment income or net realized gains may differ from their ultimate characterization for federal income tax purposes. Also, due to the timing of dividend distributions, the fiscal year in which amounts are distributed may differ from the year that the income or realized gains (losses) were recorded by the Fund.
Distributions and Components of Distributable Earnings – The tax character of distributions paid by the Fund for the periods indicated is as follows (as adjusted for dividends payable, if applicable):
| For the Year Ended October 31, 2014 | For the Year Ended October 31, 2013 | |||||||
| Ordinary Income | $ | 10,686 | $ | 9,147 | ||||
| Long-Term Capital Gains ‡ | 2,643 | 1,023 | ||||||
| ‡ | The Fund designates these distributions as long-term capital gain dividends pursuant to IRC Sec. 852(b)(3)(C). |
As of October 31, 2014, the Fund’s components of distributable earnings (deficit) on a tax basis are as follows:
| Amount | ||||
| Undistributed Ordinary Income | $ | 1,113 | ||
| Undistributed Long-Term Capital Gain | 1,331 | |||
| Unrealized Appreciation* | 445 | |||
| Total Accumulated Earnings | $ | 2,889 | ||
| * | Differences between book-basis and tax-basis unrealized appreciation (depreciation) may be attributable to the losses deferred due to wash sale adjustments, foreign currency gains and losses, adjustments related to PFICs, REITs, RICs, certain derivatives and partnerships. |
Reclassification of Capital Accounts – The Fund may record reclassifications in its capital accounts. These reclassifications have no impact on the total net assets of the Fund. The reclassifications are a result of permanent differences between U.S. GAAP and tax accounting for such items as foreign currency, PFICs, expiration or utilization of capital loss carryforwards or net operating losses. Adjustments are made to reflect the impact these items have on current and future distributions to shareholders. Therefore, the source of the Fund’s distributions may be shown in the accompanying Statement of Changes in Net Assets as from undistributed net
| 29 |
| The Hartford Short Duration Fund |
| Notes to Financial Statements – (continued) |
| October 31, 2014 |
| (000’s Omitted) |
investment income, from accumulated net realized gains on investments or from capital depending on the type of book and tax differences that exist. For the year ended October 31, 2014, the Fund recorded reclassifications to increase (decrease) the accounts listed below:
| Amount | ||||
| Undistributed Net Investment Income (Loss) | $ | 149 | ||
| Accumulated Net Realized Gain (Loss) | (149 | ) | ||
Capital Loss Carryforward – On December 22, 2010, the Regulated Investment Company Modernization Act of 2010 (the “Act”) was enacted, which made changes to the capital loss carryforward rules. The changes are effective for taxable years beginning after the date of enactment. Under the Act, funds are permitted to carry forward capital losses for an unlimited period. Additionally, capital loss carryforwards retain their character as either short-term or long-term capital losses rather than being considered all short-term as permitted under prior regulation.
The Fund had no capital loss carryforward for U.S. federal income tax purposes as of October 31, 2014.
Accounting for Uncertainty in Income Taxes – The Fund has adopted financial reporting rules that require the Fund to analyze all open tax years, as defined by the statute of limitations, for all major jurisdictions. Generally, tax authorities can examine all tax returns filed for the last three years. The Fund does not have an examination in progress.
The Fund has reviewed all open tax years and major jurisdictions and concluded that these financial reporting rules had no effect on the Fund’s financial position or results of operations. There is no tax liability resulting from unrecognized tax benefits relating to uncertain income tax positions taken or expected to be taken on the tax return for the fiscal year ended October 31, 2014. The Fund is also not aware of any tax positions for which it is reasonably possible that the total amounts of unrecognized tax benefits will significantly change in the next twelve months.
Expenses:
Investment Management Agreement – Hartford Funds Management Company, LLC ("HFMC") serves as the Fund’s investment manager pursuant to an Investment Management Agreement with the Company. HFMC is an indirect wholly owned subsidiary of The Hartford Financial Services Group, Inc. ("The Hartford"). The investment manager has overall investment supervisory responsibility for the Fund. In addition, the investment manager provides administrative personnel, services, equipment, facilities and office space for proper operation of the Fund. HFMC has contracted with Wellington Management Company, LLP ("Wellington Management") under a sub-advisory agreement for the provision of day-to-day investment management services to the Fund in accordance with the Fund’s investment objective and policies. The Fund pays a fee to the investment manager, a portion of which may be used to compensate Wellington Management.
The schedule below reflects the rates of compensation paid to the investment manager for investment management services rendered as of October 31, 2014; the rates are accrued daily and paid monthly:
| Average Daily Net Assets | Annual Fee |
| On first $500 million | 0.450% |
| On next $500 million | 0.400% |
| On next $1.5 billion | 0.395% |
| On next $2.5 billion | 0.390% |
| On next $5 billion | 0.380% |
| Over $10 billion | 0.370% |
| 30 |
| The Hartford Short Duration Fund |
| Notes to Financial Statements – (continued) |
| October 31, 2014 |
| (000’s Omitted) |
Accounting Services Agreement – Pursuant to the Fund Accounting Agreement between HFMC and the Company, on behalf of the Fund, HFMC provides accounting services to the Fund and receives monthly compensation based on the Fund’s average daily net assets at the rates set forth below. The Fund’s accounting services fees are accrued daily and paid monthly.
| Average Daily Net Assets | Annual Fee |
| On first $5 billion | 0.020% |
| On next $5 billion | 0.015% |
| Over $10 billion | 0.010% |
Operating Expenses – Allocable expenses incurred by the Company are allocated to each Fund and allocated to classes within the Fund in proportion to the average daily net assets of the Fund and each class, except where allocation of certain expenses is more fairly made directly to the Fund or to specific classes within a Fund. As of October 31, 2014, HFMC contractually limited the total operating expenses of this Fund, exclusive of taxes, interest expense, brokerage commissions, acquired fund fees and expenses and extraordinary expenses, through February 28, 2015 as follows:
| Class A | Class B* | Class C | Class I | Class R3 | Class R4 | Class R5 | Class Y |
| 0.85% | 1.60% | 1.60% | 0.60% | 1.15% | 0.85% | 0.55% | 0.55% |
* The reduction in amounts charged in connection with Class B Distribution and Service Plan (12b-1) fees that took effect July 1, 2011, in order to comply with applicable FINRA rules, caused the limit on net operating expenses attributable to Class B shares to be, effectively, 0.85%.
Fees Paid Indirectly – The Fund's custodian bank has agreed to reduce its fees when the Fund maintains cash on deposit in a non-interest-bearing custody account. For the year ended October 31, 2014, this amount, if any, is included in the Statement of Operations.
The ratio of expenses to average net assets in the accompanying financial highlights excludes the reduction in expenses related to fees paid indirectly. The annualized expense ratio after waivers for the period listed below reflecting the reduction for fees paid indirectly is as follows:
| Year Ended October 31, 2014 | ||||
| Class A | 0.85 | % | ||
| Class B | 0.85 | |||
| Class C | 1.60 | |||
| Class I | 0.55 | |||
| Class R3 | 1.15 | |||
| Class R4 | 0.85 | |||
| Class R5 | 0.55 | |||
| Class Y | 0.50 | |||
Distribution and Service Plan for Class A, B, C, R3 and R4 Shares – Hartford Funds Distributors, LLC ("HFD"), an indirect wholly owned subsidiary of The Hartford, is the principal underwriter and distributor of the Fund. HFD is engaged in distribution activities, which include marketing and distribution of shares through broker/dealers, financing distribution costs and maintaining financial books and records. For the year ended October 31, 2014, HFD received front-end load sales charges of $523 and contingent deferred sales charges of $82 from the Fund.
The Fund has adopted a Distribution and Service Plan in accordance with Rule 12b-1 of the 1940 Act to compensate the distributor (HFD) for activities intended to result in the sale and distribution of Class A, B, C, R3 and R4 shares and for providing services for shareholders. The Rule 12b-1 plan applicable to Class A shares of the Fund provides for payment of a Rule 12b-1 fee of 0.25% of average daily net assets. Some or all of the fee may be used for shareholder servicing expenses with the remainder used for
| 31 |
| The Hartford Short Duration Fund |
| Notes to Financial Statements – (continued) |
| October 31, 2014 |
| (000’s Omitted) |
distribution expenses. Under the Class B Plan, the Fund pays the distributor 1.00% of the average daily net assets of Class B shares that are outstanding for 8 years or less, 0.25% of which is a fee for services provided to existing shareholders with the remainder used for distribution expenses. Effective January 1, 2011, there was a reduction in the amount charged in connection with the Class B shares’ Rule 12b-1 fee from 1.00% to 0.25% in accordance with applicable FINRA rules, although it is possible that such fees may be charged in the future. Some or the entire Rule 12b-1 fee for Class B shares may be remitted to broker/dealers for distribution and/or shareholder account services. After eight years, Class B shares convert to Class A shares. Upon conversion to Class A shares, the Class A plan described above will apply to those shares. Under the Class C Plan, the Fund pays the distributor 1.00% of the average daily net assets of Class C shares outstanding, 0.25% of which is intended as a fee for services provided to existing shareholders with the remainder used for distribution expenses. For Class C shares, some or the entire fee may be remitted to broker/dealers for distribution and/or shareholder account services. Class R3 shares have a distribution fee of 0.50% of average daily net assets and Class R4 shares have a distribution fee of 0.25% of average daily net assets. For Class R3 and R4 shares, some or the entire fee may be remitted to broker/dealers for distribution and/or shareholder account services. The Fund’s 12b-1 fees are accrued daily and paid monthly or at such other intervals as the Board of Directors may determine.
Other Related Party Transactions – Certain officers of the Fund are directors and/or officers of HFMC and/or The Hartford or its subsidiaries. For the year ended October 31, 2014, a portion of the Fund’s Chief Compliance Officer’s compensation was paid by all of the investment companies in the Hartford fund complex. The portion allocated to the Fund, as represented in other expenses on the Statement of Operations, was in the amount of $1. Hartford Administrative Services Company (“HASCO”), an indirect wholly-owned subsidiary of The Hartford, provides transfer agent services to the Fund. HASCO has contractually agreed to reimburse any portion of the transfer agency fees over 0.30% of average daily net assets per fiscal year for each class. Any transfer agency fee reimbursement is determined before considering the contractual operating expense limitation. For providing such services, HASCO is compensated on a per account basis that varies by account type, except with respect to Class Y, for which it is compensated based on average daily net assets. The amount paid to HASCO and any related contractual reimbursement amounts, if applicable, can be found in the Statement of Operations. These fees are accrued daily and paid monthly.
Administrative services fees are paid to HASCO for third-party recordkeeping services that are payable as a percentage of net assets in the amount of up to 0.20%, 0.15% and 0.10% for Classes R3, R4 and R5 shares, respectively. The total administrative services fees are shown on the Statement of Operations. These fees are accrued daily and paid monthly.
Affiliate Holdings:
As of October 31, 2014, affiliates of The Hartford had ownership of shares in the Fund as follows:
| Percentage of Class | Percentage of Fund | |||||||
| Class R5 | 100 | %* | — | %† | ||||
| * | Percentage rounds to 100%. | |
| † | Percentage rounds to zero. |
Investment Transactions:
For the year ended October 31, 2014, the cost of purchases and proceeds from sales of investment securities (excluding short-term investments) were as follows:
| Excluding U.S. Government Obligations | U.S. Government Obligations | Total | ||||||||||
| Cost of Purchases | $ | 780,628 | $ | — | $ | 780,628 | ||||||
| Sales Proceeds | 662,929 | — | 662,929 | |||||||||
| 32 |
| The Hartford Short Duration Fund |
| Notes to Financial Statements – (continued) |
| October 31, 2014 |
| (000’s Omitted) |
Capital Share Transactions:
The following information is for the year ended October 31, 2014, and the year ended October 31, 2013:
| For the Year Ended October 31, 2014 | For the Year Ended October 31, 2013 | |||||||||||||||||||||||||||||||
| Shares Sold | Shares Issued for Reinvested Dividends | Shares Redeemed | Net Increase (Decrease) of Shares | Shares Sold | Shares Issued for Reinvested Dividends | Shares Redeemed | Net Increase (Decrease) of Shares | |||||||||||||||||||||||||
| Class A | ||||||||||||||||||||||||||||||||
| Shares | 22,353 | 822 | (21,019 | ) | 2,156 | 33,854 | 536 | (17,025 | ) | 17,365 | ||||||||||||||||||||||
| Amount | $ | 222,484 | $ | 8,166 | $ | (209,205 | ) | $ | 21,445 | $ | 337,611 | $ | 5,356 | $ | (170,108 | ) | $ | 172,859 | ||||||||||||||
| Class B | ||||||||||||||||||||||||||||||||
| Shares | 177 | 15 | (495 | ) | (303 | ) | 579 | 12 | (426 | ) | 165 | |||||||||||||||||||||
| Amount | $ | 1,773 | $ | 152 | $ | (4,948 | ) | $ | (3,023 | ) | $ | 5,773 | $ | 127 | $ | (4,235 | ) | $ | 1,665 | |||||||||||||
| Class C | ||||||||||||||||||||||||||||||||
| Shares | 7,164 | 142 | (7,758 | ) | (452 | ) | 9,368 | 142 | (9,704 | ) | (194 | ) | ||||||||||||||||||||
| Amount | $ | 71,245 | $ | 1,417 | $ | (77,176 | ) | $ | (4,514 | ) | $ | 93,508 | $ | 1,419 | $ | (96,869 | ) | $ | (1,942 | ) | ||||||||||||
| Class I | ||||||||||||||||||||||||||||||||
| Shares | 20,451 | 188 | (10,249 | ) | 10,390 | 12,262 | 208 | (13,553 | ) | (1,083 | ) | |||||||||||||||||||||
| Amount | $ | 204,004 | $ | 1,864 | $ | (102,151 | ) | $ | 103,717 | $ | 122,913 | $ | 2,088 | $ | (135,846 | ) | $ | (10,845 | ) | |||||||||||||
| Class R3 | ||||||||||||||||||||||||||||||||
| Shares | 49 | 1 | (14 | ) | 36 | 32 | — | (5 | ) | 27 | ||||||||||||||||||||||
| Amount | $ | 484 | $ | 10 | $ | (136 | ) | $ | 358 | $ | 320 | $ | 5 | $ | (55 | ) | $ | 270 | ||||||||||||||
| Class R4 | ||||||||||||||||||||||||||||||||
| Shares | 37 | 2 | (31 | ) | 8 | 64 | 1 | (50 | ) | 15 | ||||||||||||||||||||||
| Amount | $ | 371 | $ | 16 | $ | (311 | ) | $ | 76 | $ | 642 | $ | 14 | $ | (503 | ) | $ | 153 | ||||||||||||||
| Class R5 | ||||||||||||||||||||||||||||||||
| Shares | — | — | — | — | — | — | — | — | ||||||||||||||||||||||||
| Amount | $ | — | $ | 2 | $ | (4 | ) | $ | (2 | ) | $ | 5 | $ | 2 | $ | — | $ | 7 | ||||||||||||||
| Class Y | ||||||||||||||||||||||||||||||||
| Shares | 679 | 11 | (472 | ) | 218 | 558 | 13 | (765 | ) | (194 | ) | |||||||||||||||||||||
| Amount | $ | 6,748 | $ | 106 | $ | (4,689 | ) | $ | 2,165 | $ | 5,563 | $ | 127 | $ | (7,593 | ) | $ | (1,903 | ) | |||||||||||||
| Total | ||||||||||||||||||||||||||||||||
| Shares | 50,910 | 1,181 | (40,038 | ) | 12,053 | 56,717 | 912 | (41,528 | ) | 16,101 | ||||||||||||||||||||||
| Amount | $ | 507,109 | $ | 11,733 | $ | (398,620 | ) | $ | 120,222 | $ | 566,335 | $ | 9,138 | $ | (415,209 | ) | $ | 160,264 | ||||||||||||||
The following reflects the conversion of Class B shares into Class A shares (reflected as Class A shares sold) for the year ended October 31, 2014, and the year ended October 31, 2013:
| Shares | Dollars | |||||||
| For the Year Ended October 31, 2014 | 86 | $ | 852 | |||||
| For the Year Ended October 31, 2013 | 31 | $ | 312 | |||||
Line of Credit:
The Fund is one of several Hartford Funds that participate in a $500 million committed revolving line of credit facility. The facility is to be used for temporary or emergency purposes. Under the arrangement, the funds are required to own securities having a market value in excess of 300% of the total bank borrowings. The interest rate on borrowings varies depending on the nature of the loan. The facility also requires a fee to be paid based on the amount of the commitment. This commitment fee is allocated to all the funds participating in the line of credit based on the average net assets of the funds. During the year ended October 31, 2014, the Fund did not have any borrowings under this facility.
Pending Legal Proceedings:
On February 25, 2011, Jennifer L. Kasilag, Louis Mellinger, Judith M. Menendez, Jacqueline M. Robinson, and Linda A. Russell filed a derivative lawsuit against Hartford Investment Financial Services, LLC (“HIFSCO”) (now known as HFD) on behalf of six Hartford retail mutual funds in the United States District Court for the District of New Jersey, alleging that HIFSCO received excessive advisory and distribution fees in violation of its statutory fiduciary duty under Section 36(b) of the 1940 Act when serving as investment manager and principal underwriter, respectively, to the Hartford retail mutual funds. Although this action was purportedly filed on behalf of certain of the
| 33 |
| The Hartford Short Duration Fund |
| Notes to Financial Statements – (continued) |
| October 31, 2014 |
| (000’s Omitted) |
Hartford Funds, none of the Hartford Funds is itself a defendant to the suit. HIFSCO moved to dismiss and, in September 2011, the motion was granted in part and denied in part, with leave to amend the complaint. In November 2011, plaintiffs filed an amended complaint on behalf of certain Hartford retail mutual funds, The Hartford Global Health Fund (now known as The Hartford Healthcare Fund), The Hartford Conservative Allocation Fund, The Hartford Growth Opportunities Fund, The Hartford Inflation Plus Fund, The Hartford Advisers Fund (now known as The Hartford Balanced Fund), and The Hartford Capital Appreciation Fund. Plaintiffs seek to rescind the investment management agreements and distribution plans between HIFSCO and these funds and to recover the total fees charged thereunder or, in the alternative, to recover any improper compensation HIFSCO received, in addition to lost earnings. HIFSCO filed a partial motion to dismiss the amended complaint and, in December 2012, the court dismissed without prejudice the claims regarding distribution fees and denied the motion with respect to the advisory fees claims. HIFSCO disputes the allegations and intends to defend vigorously.
In March 2014, the plaintiffs filed a new complaint that added as new plaintiffs The Hartford Floating Rate Fund and The Hartford Small Company Fund and named as a defendant HFMC, which assumed the role as investment manager to the funds as of January 2013. HFMC and HIFSCO dispute the allegations and intend to defend vigorously.
No accrual for litigation relating to this matter has been recorded in the financial statements of the Fund because the Fund is not party to the suit.
Indemnifications:
Under the Company's organizational documents, the Company shall indemnify its officers and directors to the full extent required or permitted under Maryland General Corporation Law and the federal securities laws. In addition, the Company, on behalf of the Fund, may enter into contracts that contain a variety of indemnifications. The Company's maximum exposure under these arrangements is unknown. However, as of the date of these financial statements, the Company has not had prior claims or losses pursuant to these contracts and expects the risk of loss to be remote.
Subsequent Event:
Effective December 1, 2014, pursuant to a sub-transfer agency agreement between HASCO and Boston Financial Data Services, Inc. (“BFDS”), HASCO has delegated certain transfer agent, dividend disbursing agent and shareholder servicing agent functions to BFDS. The costs and expenses of such delegation are borne by HASCO, not by the Fund.
| 34 |
| The Hartford Short Duration Fund |
| Financial Highlights |
| - Selected Per-Share Data - (A) | - Ratios and Supplemental Data - | |||||||||||||||||||||||||||||||||||||||||||||||||||
| Class | Net Asset Value at Beginning of Period | Net Investment Income (Loss) | Net Realized and Unrealized Gain (Loss) on Invest- ments | Total from Investment Operations | Dividends from Net Investment Income | Distribu- tions from Realized Capital Gains | Total Dividends and Distributions | Net
Asset Value at End of Period | Total Return(B) | Net
Assets at End of Period (000's) | Ratio of Expenses to Average Net Assets Before Adjust- ments(C) | Ratio of Expenses to Average Net Assets After Adjust- ments(C) | Ratio of Net Investment Income (Loss) to Average Net Assets | |||||||||||||||||||||||||||||||||||||||
| For the Year Ended October 31, 2014 | ||||||||||||||||||||||||||||||||||||||||||||||||||||
| A | $ | 9.98 | $ | 0.15 | $ | (0.03 | ) | $ | 0.12 | $ | (0.15 | ) | $ | (0.04 | ) | $ | (0.19 | ) | $ | 9.91 | 1.23 | % | $ | 469,415 | 0.91 | % | 0.85 | % | 1.50 | % | ||||||||||||||||||||||
| B | 10.02 | 0.15 | (0.02 | ) | 0.13 | (0.15 | ) | (0.04 | ) | (0.19 | ) | 9.96 | 1.33 | 6,510 | 1.01 | 0.85 | 1.51 | |||||||||||||||||||||||||||||||||||
| C | 9.98 | 0.08 | (0.03 | ) | 0.05 | (0.08 | ) | (0.04 | ) | (0.12 | ) | 9.91 | 0.48 | 128,158 | 1.60 | 1.60 | 0.76 | |||||||||||||||||||||||||||||||||||
| I | 10.00 | 0.18 | (0.03 | ) | 0.15 | (0.18 | ) | (0.04 | ) | (0.22 | ) | 9.93 | 1.52 | 208,183 | 0.55 | 0.55 | 1.79 | |||||||||||||||||||||||||||||||||||
| R3 | 9.96 | 0.12 | (0.04 | ) | 0.08 | (0.12 | ) | (0.04 | ) | (0.16 | ) | 9.88 | 0.84 | 879 | 1.23 | 1.15 | 1.20 | |||||||||||||||||||||||||||||||||||
| R4 | 9.97 | 0.15 | (0.04 | ) | 0.11 | (0.15 | ) | (0.04 | ) | (0.19 | ) | 9.89 | 1.14 | 997 | 0.92 | 0.85 | 1.50 | |||||||||||||||||||||||||||||||||||
| R5 | 9.96 | 0.18 | (0.03 | ) | 0.15 | (0.18 | ) | (0.04 | ) | (0.22 | ) | 9.89 | 1.54 | 109 | 0.61 | 0.55 | 1.80 | |||||||||||||||||||||||||||||||||||
| Y | 9.96 | 0.18 | (0.03 | ) | 0.15 | (0.19 | ) | (0.04 | ) | (0.23 | ) | 9.88 | 1.49 | 5,134 | 0.50 | 0.50 | 1.83 | |||||||||||||||||||||||||||||||||||
| For the Year Ended October 31, 2013 | ||||||||||||||||||||||||||||||||||||||||||||||||||||
| A | $ | 10.05 | $ | 0.17 | $ | (0.05 | ) | $ | 0.12 | $ | (0.17 | ) | $ | (0.02 | ) | $ | (0.19 | ) | $ | 9.98 | 1.20 | % | $ | 451,357 | 0.88 | % | 0.85 | % | 1.66 | % | ||||||||||||||||||||||
| B | 10.05 | 0.17 | (0.01 | ) | 0.16 | (0.17 | ) | (0.02 | ) | (0.19 | ) | 10.02 | 1.60 | 9,589 | 0.99 | 0.85 | 1.67 | |||||||||||||||||||||||||||||||||||
| C | 10.05 | 0.09 | (0.05 | ) | 0.04 | (0.09 | ) | (0.02 | ) | (0.11 | ) | 9.98 | 0.44 | 133,623 | 1.60 | 1.60 | 0.93 | |||||||||||||||||||||||||||||||||||
| I | 10.07 | 0.20 | (0.05 | ) | 0.15 | (0.20 | ) | (0.02 | ) | (0.22 | ) | 10.00 | 1.48 | 105,812 | 0.57 | 0.57 | 1.96 | |||||||||||||||||||||||||||||||||||
| R3 | 10.03 | 0.13 | (0.04 | ) | 0.09 | (0.14 | ) | (0.02 | ) | (0.16 | ) | 9.96 | 0.90 | 527 | 1.23 | 1.15 | 1.35 | |||||||||||||||||||||||||||||||||||
| R4 | 10.04 | 0.17 | (0.05 | ) | 0.12 | (0.17 | ) | (0.02 | ) | (0.19 | ) | 9.97 | 1.20 | 928 | 0.92 | 0.85 | 1.69 | |||||||||||||||||||||||||||||||||||
| R5 | 10.03 | 0.20 | (0.05 | ) | 0.15 | (0.20 | ) | (0.02 | ) | (0.22 | ) | 9.96 | 1.51 | 112 | 0.61 | 0.55 | 1.98 | |||||||||||||||||||||||||||||||||||
| Y | 10.03 | 0.20 | (0.05 | ) | 0.15 | (0.20 | ) | (0.02 | ) | (0.22 | ) | 9.96 | 1.55 | 3,002 | 0.51 | 0.51 | 2.03 | |||||||||||||||||||||||||||||||||||
| For the Year Ended October 31, 2012 | ||||||||||||||||||||||||||||||||||||||||||||||||||||
| A | $ | 9.83 | $ | 0.20 | $ | 0.23 | $ | 0.43 | $ | (0.21 | ) | $ | – | $ | (0.21 | ) | $ | 10.05 | 4.37 | % | $ | 279,952 | 0.86 | % | 0.85 | % | 2.03 | % | ||||||||||||||||||||||||
| B | 9.82 | 0.20 | 0.24 | 0.44 | (0.21 | ) | – | (0.21 | ) | 10.05 | 4.48 | 7,959 | 0.97 | 0.85 | 2.04 | |||||||||||||||||||||||||||||||||||||
| C | 9.83 | 0.13 | 0.22 | 0.35 | (0.13 | ) | – | (0.13 | ) | 10.05 | 3.60 | 136,515 | 1.60 | 1.60 | 1.28 | |||||||||||||||||||||||||||||||||||||
| I | 9.84 | 0.23 | 0.23 | 0.46 | (0.23 | ) | – | (0.23 | ) | 10.07 | 4.75 | 117,449 | 0.58 | 0.58 | 2.30 | |||||||||||||||||||||||||||||||||||||
| R3 | 9.81 | 0.17 | 0.23 | 0.40 | (0.18 | ) | – | (0.18 | ) | 10.03 | 4.07 | 258 | 1.23 | 1.15 | 1.72 | |||||||||||||||||||||||||||||||||||||
| R4 | 9.81 | 0.20 | 0.24 | 0.44 | (0.21 | ) | – | (0.21 | ) | 10.04 | 4.48 | 783 | 0.93 | 0.85 | 2.02 | |||||||||||||||||||||||||||||||||||||
| R5 | 9.81 | 0.23 | 0.23 | 0.46 | (0.24 | ) | – | (0.24 | ) | 10.03 | 4.69 | 106 | 0.62 | 0.55 | 2.33 | |||||||||||||||||||||||||||||||||||||
| Y | 9.80 | 0.23 | 0.24 | 0.47 | (0.24 | ) | – | (0.24 | ) | 10.03 | 4.84 | 4,967 | 0.50 | 0.50 | 2.34 | |||||||||||||||||||||||||||||||||||||
| For the Year Ended October 31, 2011 (D) | ||||||||||||||||||||||||||||||||||||||||||||||||||||
| A | $ | 9.87 | $ | 0.21 | $ | (0.04 | ) | $ | 0.17 | $ | (0.21 | ) | $ | – | $ | (0.21 | ) | $ | 9.83 | 1.77 | % | $ | 279,232 | 0.86 | % | 0.85 | % | 2.13 | % | |||||||||||||||||||||||
| B | 9.87 | 0.20 | (0.05 | ) | 0.15 | (0.20 | ) | – | (0.20 | ) | 9.82 | 1.54 | 9,558 | 1.09 | 0.98 | 2.01 | ||||||||||||||||||||||||||||||||||||
| C | 9.87 | 0.14 | (0.04 | ) | 0.10 | (0.14 | ) | – | (0.14 | ) | 9.83 | 1.02 | 140,933 | 1.59 | 1.59 | 1.39 | ||||||||||||||||||||||||||||||||||||
| I | 9.89 | 0.24 | (0.05 | ) | 0.19 | (0.24 | ) | – | (0.24 | ) | 9.84 | 1.97 | 88,321 | 0.56 | 0.56 | 2.41 | ||||||||||||||||||||||||||||||||||||
| R3(E) | 9.73 | 0.01 | 0.08 | 0.09 | (0.01 | ) | – | (0.01 | ) | 9.81 | 0.96 | (F) | 101 | 1.27 | (G) | 1.15 | (G) | 1.70 | (G) | |||||||||||||||||||||||||||||||||
| R4(E) | 9.73 | 0.02 | 0.08 | 0.10 | (0.02 | ) | – | (0.02 | ) | 9.81 | 0.98 | (F) | 101 | 0.97 | (G) | 0.85 | (G) | 1.99 | (G) | |||||||||||||||||||||||||||||||||
| R5(E) | 9.73 | 0.02 | 0.08 | 0.10 | (0.02 | ) | – | (0.02 | ) | 9.81 | 1.01 | (F) | 101 | 0.67 | (G) | 0.55 | (G) | 2.28 | (G) | |||||||||||||||||||||||||||||||||
| Y | 9.85 | 0.24 | (0.04 | ) | 0.20 | (0.25 | ) | – | (0.25 | ) | 9.80 | 2.02 | 230,175 | 0.51 | 0.51 | 2.48 | ||||||||||||||||||||||||||||||||||||
See Portfolio Turnover information on the next page.
| 35 |
| The Hartford Short Duration Fund |
| Financial Highlights – (continued) |
| - Selected Per-Share Data - (A) | - Ratios and Supplemental Data - | |||||||||||||||||||||||||||||||||||||||||||||||||||
Class | Net Asset | Net | Net | Total from | Dividends | Distribu- | Total | Net Asset | Total | Net Assets | Ratio of | Ratio of | Ratio of | |||||||||||||||||||||||||||||||||||||||
| For the Year Ended October 31, 2010 (D) | ||||||||||||||||||||||||||||||||||||||||||||||||||||
| A | $ | 9.62 | $ | 0.25 | $ | 0.26 | $ | 0.51 | $ | (0.26 | ) | $ | – | $ | (0.26 | ) | $ | 9.87 | 5.33 | % | $ | 208,313 | 0.87 | % | 0.87 | % | 2.55 | % | ||||||||||||||||||||||||
| B | 9.62 | 0.18 | 0.25 | 0.43 | (0.18 | ) | – | (0.18 | ) | 9.87 | 4.51 | 10,799 | 1.73 | 1.65 | 1.80 | |||||||||||||||||||||||||||||||||||||
| C | 9.62 | 0.18 | 0.26 | 0.44 | (0.19 | ) | – | (0.19 | ) | 9.87 | 4.56 | 105,060 | 1.60 | 1.60 | 1.79 | |||||||||||||||||||||||||||||||||||||
| I(H) | 9.74 | 0.18 | 0.15 | 0.33 | (0.18 | ) | – | (0.18 | ) | 9.89 | 3.42 | (F) | 26,765 | 0.58 | (G) | 0.58 | (G) | 2.49 | (G) | |||||||||||||||||||||||||||||||||
| Y | 9.60 | 0.29 | 0.25 | 0.54 | (0.29 | ) | – | (0.29 | ) | 9.85 | 5.71 | 139,394 | 0.52 | 0.52 | 2.90 | |||||||||||||||||||||||||||||||||||||
| (A) | Information presented relates to a share outstanding throughout the indicated period. Net investment income (loss) per share amounts are calculated based on average shares outstanding unless otherwise noted. |
| (B) | Assumes initial investment at net asset value at the beginning of each period, reinvestment of all distributions, the complete redemption of the investment at net asset value at the end of each period and no sales charge. Total return would be reduced if sales charges were taken into account. |
| (C) | Adjustments include waivers and reimbursements, if applicable. Ratios do not include fees paid indirectly (see Expenses in the accompanying Notes to Financial Statements). |
| (D) | Net investment income (loss) per share amounts have been calculated using the SEC method. |
| (E) | Commenced operations on September 30, 2011. |
| (F) | Not annualized. |
| (G) | Annualized. |
| (H) | Commenced operations on February 26, 2010. |
| Portfolio Turnover Rate for All Share Classes | ||||
| For the Year Ended October 31, 2014 | 50 | % | ||
| For the Year Ended October 31, 2013 | 51 | |||
| For the Year Ended October 31, 2012 | 61 | |||
| For the Year Ended October 31, 2011 | 55 | |||
| For the Year Ended October 31, 2010 | 66 | |||
| 36 |
| Report of Independent Registered Public Accounting Firm |
| The Board of Directors and Shareholders of |
| The Hartford Mutual Funds, Inc. |
We have audited the accompanying statement of assets and liabilities, including the schedule of investments, of The Hartford Short Duration Fund (one of the portfolios constituting The Hartford Mutual Funds, Inc. (the Funds)) as of October 31, 2014, and the related statement of operations for the year then ended, the statements of changes in net assets for each of the two years in the period then ended, and the financial highlights for the periods indicated therein. These financial statements and financial highlights are the responsibility of the Funds’ management. Our responsibility is to express an opinion on these financial statements and financial highlights based on our audits.
We conducted our audits in accordance with the standards of the Public Company Accounting Oversight Board (United States). Those standards require that we plan and perform the audit to obtain reasonable assurance about whether the financial statements and financial highlights are free of material misstatement. We were not engaged to perform an audit of the Funds’ internal control over financial reporting. Our audits included consideration of internal control over financial reporting as a basis for designing audit procedures that are appropriate in the circumstances, but not for the purpose of expressing an opinion on the effectiveness of the Funds’ internal control over financial reporting. Accordingly, we express no such opinion. An audit also includes examining, on a test basis, evidence supporting the amounts and disclosures in the financial statements and financial highlights, assessing the accounting principles used and significant estimates made by management, and evaluating the overall financial statement presentation. Our procedures included confirmation of securities owned as of October 31, 2014, by correspondence with the custodian, agent banks and brokers or by other appropriate auditing procedures where replies from agent banks and brokers were not received. We believe that our audits provide a reasonable basis for our opinion.
In our opinion, the financial statements and financial highlights referred to above present fairly, in all material respects, the financial position of The Hartford Short Duration Fund of The Hartford Mutual Funds, Inc. at October 31, 2014, the results of its operations for the year then ended, the changes in its net assets for each of the two years in the period then ended, and the financial highlights for the periods indicated therein, in conformity with U.S. generally accepted accounting principles.
| Minneapolis, Minnesota | |
| December 18, 2014 |
| 37 |
| The Hartford Short Duration Fund |
| Directors and Officers (Unaudited) |
The Board of Directors of the Company (the "Directors") appoints officers who are responsible for the day-to-day operations of the Fund and who execute policies formulated by the Directors. Each Director serves until his or her death, resignation, or retirement or until the next annual meeting of shareholders is held or until his or her successor is elected and qualifies.
Directors and officers who are employed by or who have a financial interest in The Hartford Financial Services Group, Inc. ("The Hartford") are considered “interested” persons of the Fund pursuant to the 1940 Act. Each officer and two of the Company's Directors, as noted in the chart below, are “interested” persons of the Fund. Each Director serves as a director for The Hartford Mutual Funds, Inc., The Hartford Mutual Funds II, Inc., Hartford Series Fund, Inc., and Hartford HLS Series Fund II, Inc., and as a trustee for The Hartford Alternative Strategies Fund, which, as of October 31, 2014, collectively consist of 66 funds. Correspondence may be sent to Directors and officers c/o Hartford Funds, 5 Radnor Corporate Center, Suite 300, 100 Matsonford Road, Radnor, Pennsylvania 19087, except that correspondence to Mr. Annoni, Mr. Dressen and Ms. Quade may be sent to 500 Bielenberg Drive, Suite 500, Woodbury, Minnesota 55125.
The table below sets forth, for each Director and officer, his or her name, year of birth, current position with the Company and date first elected or appointed to The Hartford Mutual Funds, Inc. ("MF") and The Hartford Mutual Funds II, Inc. ("MF2"), principal occupation, and, for Directors, other directorships held. The Fund’s Statement of Additional Information contains further information on the Directors and is available free of charge by calling 1-888-843-7824 or writing to: Hartford Funds, P.O. Box 55022, Boston, MA 02205-5022.
Information on the aggregate remuneration paid to the directors of the Company can be found in the Statement of Operations herein. The Fund pays to The Hartford a portion of the Chief Compliance Officer’s compensation, but does not pay salaries or compensation to any of its other officers or Directors who are employed by The Hartford.
Non-Interested Directors
Hilary E. Ackermann (1956) Director since September 23, 2014
Ms. Ackermann served as Chief Risk Officer at Goldman Sachs Bank USA from October 2008 to November 2011 and serves as a Director of Dynegy, Inc., an independent power company, from October 2012 to present.
Lynn S. Birdsong (1946) Director since 2003, Chairman of the Investment Committee since 2014
Mr. Birdsong is a private investor. Mr. Birdsong currently serves as a Director of the Sovereign High Yield Investment Company (April 2010 to current). Mr. Birdsong currently serves as an Independent Director of Nomura Partners Funds, Inc. (formerly, The Japan Fund) (April 2003 to current). From 2003 to March 2005, Mr. Birdsong was an Independent Director of the Atlantic Whitehall Funds. From 1979 to 2002, Mr. Birdsong was a Managing Director of Zurich Scudder Investments, an investment management firm. During his employment with Scudder, Mr. Birdsong was an Interested Director of The Japan Fund. From January 1981 through December 2013, Mr. Birdsong was a partner in Birdsong Company, an advertising specialty firm.
Robert M. Gavin, Jr. (1940) Director since 2002 (MF) and 1986 (MF2), Chairman of the Board for each since 2004
Dr. Gavin is an educational consultant. Prior to September 1, 2001, he was President of Cranbrook Education Community and prior to July 1996, he was President of Macalester College, St. Paul, Minnesota.
Duane E. Hill (1945) Director since 2001 (MF) and 2002 (MF2), Chairman of the Nominating Committee since 2003
Mr. Hill is a Partner of TSG Ventures L.P., a private equity investment company. Mr. Hill is a former partner of TSG Capital Group, a private equity investment firm that served as sponsor and lead investor in leveraged buyouts of middle market companies.
Sandra S. Jaffee (1941) Director since 2005
Ms. Jaffee is the founder and Chief Executive Officer of a private company, Homeworks Concierge, LLC, which provides residential property management services in Westchester County, New York (January 2012 to present). Ms. Jaffee served as Chairman (2008 to 2009) and Chief Executive Officer of Fortent (formerly Searchspace Group), a leading provider of compliance/regulatory technology to financial institutions from August 2005 to August 2009. From August 2004 to August 2005, Ms. Jaffee served as an Entrepreneur in Residence with Warburg Pincus, a private equity firm. Prior to joining Warburg Pincus, Ms. Jaffee served as Executive Vice President at Citigroup, from September 1995 to July 2004, where she was President and Chief Executive Officer of Citibank’s Global Securities Services (1995 to 2003). Ms. Jaffee currently serves as a member of the Board of Directors of Broadridge Financial Solutions as well as a Trustee of Muhlenberg College.
| 38 |
| The Hartford Short Duration Fund |
| Directors and Officers (Unaudited) – (continued) |
William P. Johnston (1944) Director since 2005, Chairman of the Compliance Committee since 2005
In June 2006, Mr. Johnston was appointed as Senior Advisor to The Carlyle Group, a global private equity and other alternative asset investment firm and currently serves as an Operating Executive. In July 2006, Mr. Johnston was elected to the Board of Directors of MultiPlan, Inc. and served as a Director (July 2006 to August 2010). In August 2007, Mr. Johnston was elected to the Board of Directors of LifeCare Holdings, Inc. and served as a Director (August 2007 to June 2013). In February 2008, Mr. Johnston was elected to the Board of Directors of HCR-ManorCare, Inc. In May 2006, Mr. Johnston was elected to the Supervisory Board of Fresenius Medical Care AG & Co. KGaA, after its acquisition of Renal Care Group, Inc. in March 2006. Mr. Johnston joined Renal Care Group in November 2002 as a member of the Board of Directors and served as Chairman of the Board from March 2003 through March 2006. From 2002 through 2013, Mr. Johnston served as a Board member of the Georgia O’Keefe Museum. From September 1987 to December 2002, Mr. Johnston was with Equitable Securities Corporation (and its successors, SunTrust Equitable Securities and SunTrust Robinson Humphrey) serving in various investment banking and managerial positions, including Managing Director and Head of Investment Banking, Chief Executive Officer and Vice Chairman.
Phillip O. Peterson (1944) Director since 2002 (MF) and 2000 (MF2), Chairman of the Audit Committee since 2002
Mr. Peterson is a mutual fund industry consultant. He was a partner of KPMG LLP (an accounting firm) until July 1999. Mr. Peterson joined William Blair Funds in February 2007 as a member of the Board of Trustees. From February 2012 to February 2014, Mr. Peterson served as a Trustee of Symetra Variable Mutual Funds. From January 2004 to April 2005, Mr. Peterson served as Independent President of the Strong Mutual Funds.
Lemma W. Senbet (1946) Director since 2005
Dr. Senbet is the William E. Mayer Chair Professor of Finance and Founding Director, Center for Financial Policy, at the University of Maryland, Robert H. Smith School of Business. He was chair of the Finance Department of the University of Maryland, Robert H. Smith School of Business from 1998 to 2006. Since June 2013, he has been on leave from the University to serve as Executive Director of African Economic Research Consortium which focuses on economic policy research and training. Previously, he was a chaired professor of finance at the University of Wisconsin-Madison. Also, he was a Director of the Fortis Funds from March 2000 to July 2002. Dr. Senbet served as Director of the American Finance Association and President of the Western Finance Association. In 2006, Dr. Senbet was inducted Fellow of Financial Management Association International for his career-long distinguished scholarship and professional service.
Interested Directors and Officers
James E. Davey (1964) Director since 2012, President and Chief Executive Officer since 2010
Mr. Davey serves as Executive Vice President of Hartford Life Insurance Company (“HLIC”) and The Hartford. Additionally, Mr. Davey serves as Chairman of the Board, Manager and Senior Managing Director of Hartford Funds Distributors, LLC (“HFD”). He also currently serves as Director, Chairman of the Board, President and Senior Managing Director of Hartford Administrative Services Company (“HASCO”). Mr. Davey also serves as Manager, Chairman of the Board and Senior Managing Director for Hartford Funds Management Company, LLC (“HFMC”) and Director, Chairman of the Board and Senior Managing Director for Hartford Funds Management Group, Inc. ("HFMG"). Mr. Davey has served in various positions within The Hartford and its subsidiaries in connection with the operation of the Hartford Funds. Mr. Davey joined The Hartford in 2002.
Lowndes A. Smith* (1939) Director since 1996 (MF) and 2002 (MF2)
Mr. Smith served as Vice Chairman of The Hartford from February 1997 to January 2002, as President and Chief Executive Officer of Hartford Life, Inc. from February 1997 to January 2002, and as President and Chief Operating Officer of The Hartford Life Insurance Companies from January 1989 to January 2002. Mr. Smith serves as a Director of White Mountains Insurance Group Ltd. (October 2003 to current); One Beacon Insurance (October 2006 to current); Symetra Financial (August 2007 to current) and is a Managing Director of Whittington Gray Associates (January 2007 to current).
* Mr. Smith resigned as a Director of MF, MF2, Hartford Series Fund, Inc. and Hartford HLS Series Fund II, Inc. and as a Trustee of The Hartford Alternative Strategies Fund effective September 17, 2014.
Other Officers
Mark A. Annoni (1964) Vice President, Controller and Treasurer since 2012
Mr. Annoni currently serves as the Assistant Vice President of HLIC (February 2004 to present) and Senior Vice President of HFMG (December 2013 to present). Mr. Annoni has served in various positions within The Hartford and its subsidiaries in connection with the operation of the Hartford Funds. Mr. Annoni joined The Hartford in 2001.
| 39 |
| The Hartford Short Duration Fund |
| Directors and Officers (Unaudited) – (continued) |
Michael R. Dressen (1963) AML Compliance Officer since 2011
Mr. Dressen currently serves as Assistant Vice President of HLIC. He also serves as Chief Compliance Officer and AML Compliance Officer of HASCO and as AML Officer of HFD. Mr. Dressen has served in various positions within The Hartford and its subsidiaries in connection with the operation of the Hartford Funds.
Edward P. Macdonald (1967) Vice President, Secretary and Chief Legal Officer since 2005
Mr. Macdonald currently serves as Assistant Secretary, Executive Vice President and Deputy General Counsel of HFD, HASCO, HFMC and HFMG. He also serves as Vice President of HLIC. Mr. Macdonald has served in various positions within The Hartford and its subsidiaries in connection with the operation of the Hartford Funds. Mr. Macdonald joined The Hartford in 2005.
Joseph G. Melcher (1973) Vice President and Chief Compliance Officer since 2013
Mr. Melcher currently serves as Executive Vice President of HFD, HFMG and HASCO. Mr. Melcher also currently serves as Executive Vice President and Chief Compliance Officer of HFMC. Mr. Melcher has served in various positions within The Hartford and its subsidiaries in connection with the operation of the Hartford Funds since joining The Hartford in 2012. Prior to joining The Hartford, Mr. Melcher worked at Touchstone Investments, a member of the Western & Southern Financial Group, where he held the position of Vice President and Chief Compliance Officer from 2010 through 2012 and Assistant Vice President, Compliance from 2005 to 2010.
Vernon J. Meyer (1964) Vice President since 2006
Mr. Meyer currently serves as Senior Vice President of HLIC. He also currently serves as Managing Director and Chief Investment Officer of HFMC and Managing Director of HFMG. Mr. Meyer has served in various positions within The Hartford and its subsidiaries in connection with the operation of the Hartford Funds. Mr. Meyer joined The Hartford in 2004.
Laura S. Quade (1969) Vice President since 2012
Ms. Quade currently serves as Vice President of HASCO, HFD and HFMG. She is the Head of Operations of HASCO and formerly served as Director, Enterprise Operations of HLIC. Ms. Quade has served in various positions within The Hartford and its subsidiaries in connection with the operation of the Hartford Funds. Ms. Quade joined The Hartford in 2001.
Martin A. Swanson** (1962) Vice President since 2010
Mr. Swanson currently serves as Vice President of HLIC. Mr. Swanson also serves as Managing Director, Chief Marketing Officer and Principal of HFD and Managing Director of HFMG. Mr. Swanson has served in various positions within The Hartford and its subsidiaries in connection with the operation of the Hartford Funds.
** Mr. Swanson resigned as an officer effective November 6, 2014.
HOW TO OBTAIN A COPY OF THE FUND’S PROXY VOTING POLICIES AND VOTING RECORDS (UNAUDITED)
A description of the policies and procedures that the Fund uses to determine how to vote proxies relating to portfolio securities and information about how the Fund voted proxies relating to portfolio securities during the most recent twelve-month period ended June 30 are available (1) without charge, upon request, by calling 888-843-7824 and (2) on the SEC’s website at http://www.sec.gov.
QUARTERLY PORTFOLIO HOLDINGS INFORMATION (UNAUDITED)
The Fund files a complete schedule of portfolio holdings with the SEC for the first and third quarters of each fiscal year on Form N-Q. The Fund’s Forms N-Q are available (1) without charge, upon request, by calling 888-843-7824 and (2) on the SEC’s website at http://www.sec.gov. The Form N-Q may be reviewed and copied at the SEC’s Public Reference Room in Washington, DC. Information on the operation of the Public Reference Room may be obtained by calling 1-800-SEC-0330.
| 40 |
| The Hartford Short Duration Fund |
| Federal Tax Information (Unaudited) |
For the fiscal year ended October 31, 2014, there is no further federal tax information required for this Fund.
| 41 |
| The Hartford Short Duration Fund |
| Expense Example (Unaudited) |
Your Fund's Expenses
As a shareholder of the Fund, you incur two types of costs: (1) transaction costs, including sales charges (loads) on purchase payments, if any, and contingent deferred sales charges (CDSC), if any, and (2) ongoing costs, including investment management fees, distribution and/or service (12b-1) fees, if any, and other fund expenses. This example is intended to help you understand your ongoing costs (in dollars) of investing in the Fund and to compare these costs with the ongoing costs of investing in other mutual funds. The example is based on an investment of $1,000 invested at the beginning of the period and held for the entire period of April 30, 2014 through October 31, 2014.
Actual Expenses
The first set of columns of the table below provides information about actual account values and actual expenses. You may use the information in this column, together with the amount you invested, to estimate the expenses that you paid over the period. Simply divide your account value by $1,000 (for example, an $8,600 account value divided by $1,000 = 8.6), then multiply the result by the number in the line under the heading entitled “Expenses Paid During Period” to estimate the expenses you paid on your account during this period.
Hypothetical Example for Comparison Purposes
The second set of columns of the table below provides information about hypothetical account values and hypothetical expenses based on the Fund's actual expense ratio and an assumed rate of return of 5% per year before expenses, which is not the Fund's actual return. The hypothetical account values and expenses may not be used to estimate the actual ending account balance or expenses you paid for the period. You may use this information to compare the ongoing costs of investing in the Fund and other funds. To do so, compare this 5% hypothetical example with the 5% hypothetical examples that appear in the shareholder reports of the other funds.
Please note that the expenses shown in the table are meant to highlight your ongoing costs only and do not reflect any transactional costs, such as sales charges (loads) and CDSC. Therefore, the second set of columns of the table is useful in comparing ongoing costs only, and will not help you determine the relative total costs of owning different funds. In addition, if these transactional costs were included, your costs would be higher. Expenses are equal to the Fund's annualized expense ratios multiplied by average account value over the period, multiplied by 184/365 (to reflect the one-half year period).
| Actual return | Hypothetical (5% return before expenses) | |||||||||||||||||||||||||||||||||||
Beginning | Ending Account | Expenses
paid during the period April 30, 2014 through October 31, 2014 | Beginning | Ending
Account | Expenses
paid | Annualized | Days | Days | ||||||||||||||||||||||||||||
| Class A | $ | 1,000.00 | $ | 1,002.30 | $ | 4.29 | $ | 1,000.00 | $ | 1,020.92 | $ | 4.33 | 0.85 | % | 184 | 365 | ||||||||||||||||||||
| Class B | $ | 1,000.00 | $ | 1,003.30 | $ | 4.29 | $ | 1,000.00 | $ | 1,020.92 | $ | 4.33 | 0.85 | 184 | 365 | |||||||||||||||||||||
| Class C | $ | 1,000.00 | $ | 999.60 | $ | 8.06 | $ | 1,000.00 | $ | 1,017.14 | $ | 8.13 | 1.60 | 184 | 365 | |||||||||||||||||||||
| Class I | $ | 1,000.00 | $ | 1,003.80 | $ | 2.75 | $ | 1,000.00 | $ | 1,022.46 | $ | 2.78 | 0.55 | 184 | 365 | |||||||||||||||||||||
| Class R3 | $ | 1,000.00 | $ | 1,000.90 | $ | 5.80 | $ | 1,000.00 | $ | 1,019.41 | $ | 5.85 | 1.15 | 184 | 365 | |||||||||||||||||||||
| Class R4 | $ | 1,000.00 | $ | 1,002.40 | $ | 4.29 | $ | 1,000.00 | $ | 1,020.92 | $ | 4.33 | 0.85 | 184 | 365 | |||||||||||||||||||||
| Class R5 | $ | 1,000.00 | $ | 1,004.90 | $ | 2.78 | $ | 1,000.00 | $ | 1,022.43 | $ | 2.80 | 0.55 | 184 | 365 | |||||||||||||||||||||
| Class Y | $ | 1,000.00 | $ | 1,004.10 | $ | 2.52 | $ | 1,000.00 | $ | 1,022.69 | $ | 2.55 | 0.50 | 184 | 365 | |||||||||||||||||||||
| 42 |
| The Hartford Short Duration Fund |
| Approval of Investment Management and Investment Sub-Advisory Agreements (Unaudited) |
Section 15(c) of the Investment Company Act of 1940, as amended (the “1940 Act”), requires that each mutual fund’s board of directors, including a majority of those directors who are not “interested persons” of the mutual fund, as defined in the 1940 Act (the “Independent Directors”), annually review and consider the continuation of the mutual fund’s investment advisory and sub-advisory agreements. At its meeting held on August 5-6, 2014, the Board of Directors (the “Board”) of The Hartford Mutual Funds, Inc., including each of the Independent Directors, unanimously voted to approve the continuation of the investment management agreement for The Hartford Short Duration Fund (the “Fund”) with Hartford Funds Management Company, LLC (“HFMC”) and the continuation of the investment sub-advisory agreement between HFMC and the Fund’s sub-adviser, Wellington Management Company, LLP (the “Sub-adviser,” and together with HFMC, the “Advisers”) (collectively, the “Agreements”).
In the months preceding the August 5-6, 2014 meeting, the Board requested, received and reviewed written responses from the Advisers to questions posed to them on behalf of the Independent Directors and supporting materials relating to those questions and responses. The Board considered information furnished to the Board at its meetings throughout the year, as well as information specifically prepared in connection with the annual approval of the Agreements at the Board’s meetings held on June 17-18, 2014 and August 5-6, 2014. Information provided to the Board at its meetings throughout the year included, among other things, reports on Fund performance, legal and compliance matters, sales and marketing activity, shareholder services, and the other services provided to the Fund by the Advisers and their affiliates. The Board also received in-person presentations by Fund officers and representatives of HFMC at the Board’s meetings on June 17-18, 2014 and August 5-6, 2014 concerning the Agreements.
The Independent Directors, advised by independent legal counsel, engaged service providers to assist them with evaluating the Agreements with respect to the Fund. Lipper Inc. (“Lipper”), an independent provider of investment company data, was retained to provide the Board with reports on how the Fund’s contractual management fees, actual management fees, other non-management fees, overall expense ratios and investment performance compared to those of mutual funds with similar investment objectives. The Independent Directors also engaged an independent financial services consultant (the “Consultant”) to assist them in evaluating the Fund’s management fees, sub-advisory fees, other non-management fees, overall expense ratios and investment performance. In addition, the Consultant reviewed the profitability calculations utilized by HFMC in connection with the continuation of the investment management agreement.
In determining whether to continue the Agreements for the Fund, the members of the Board reviewed and evaluated information and factors they believed to be relevant and appropriate in light of the information that the Board deemed necessary and appropriate through the exercise of its reasonable business judgment. While individual members of the Board may have weighed certain factors differently, the Board’s determination to continue the Agreements was based on a comprehensive consideration of all information provided to the Board throughout the year and specifically with respect to the continuation of the Agreements. A more detailed discussion of the factors the Board considered with respect to its approval of the Agreements is provided below.
Nature, Extent and Quality of Services Provided by the Advisers
The Board requested and considered information concerning the nature, extent and quality of the services provided to the Fund by the Advisers. The Board considered, among other things, the terms of the Agreements and the range of services provided by the Advisers. The Board considered the Advisers’ professional personnel who provide services to the Fund, including each Adviser’s ability and experience in attracting and retaining qualified personnel to service the Fund. The Board considered each Adviser’s reputation and overall financial strength, as well as its willingness to consider and implement organizational and operational changes designed to enhance services to the Hartford Funds. In addition, the Board considered the quality of each Adviser’s communications with the Board and responsiveness to Board inquiries and requests made from time to time with respect to the Fund and other Hartford Funds.
The Board also requested and evaluated information concerning each Adviser’s regulatory and compliance environment. In this regard, the Board requested and reviewed information on each Adviser’s compliance policies and procedures, compliance history, and a report from the Fund’s Chief Compliance Officer on each Adviser’s compliance with applicable laws and regulations, including responses to regulatory developments and compliance issues raised by regulators. The Board also noted the Advisers’ support of the Fund’s compliance control structure, particularly the resources devoted by the Advisers in support of the Fund’s obligations pursuant to Rule 38a-1 under the 1940 Act.
With respect to HFMC, the Board noted that, under the Agreements, HFMC is responsible for the management of the Fund, including oversight of fund operations and service providers, and provides administrative and investment advisory services in connection with selecting, monitoring and supervising the Sub-adviser. The Board considered HFMC’s ongoing monitoring of people, process and performance, including its quarterly reviews of each of the Hartford Funds, semi-annual meetings with the leaders of each Fund’s portfolio management team, and oversight of the Hartford Funds’ approximately 66 portfolio managers. The Board recognized that HFMC has demonstrated a record of making changes to the
| 43 |
| The Hartford Short Duration Fund |
| Approval of Investment Management and Investment Sub-Advisory Agreements (Unaudited) - (continued) |
management and/or strategies of the Hartford Funds when warranted. The Board considered HFMC’s oversight of the Sub-adviser’s investment approach and results, process for monitoring best execution of portfolio trades by the Sub-adviser, and approach to risk management with respect to the Fund and the service providers to the Fund. The Board also considered HFMC’s oversight of compliance with the Fund’s objective and policies as well as with applicable laws and regulations, noting that regulatory and other developments had over time led to an increase in the scope of HFMC’s services in this regard.
In addition, the Board considered HFMC’s ongoing commitment to review and rationalize the Hartford Funds product line-up and the expenses that HFMC had incurred in connection with fund combinations in recent years. The Board considered that HFMC or its affiliates are responsible for providing the Fund’s officers.
With respect to the Sub-adviser, which provides certain day-to-day portfolio management services for the Fund, the Board considered the quality of the Fund’s portfolio manager, the Sub-adviser’s other investment personnel, its investment philosophy and process, investment research capabilities and resources, performance record, trade execution capabilities and experience. The Board considered the experience of the Fund’s portfolio manager, the number of accounts managed by the portfolio manager, and the Sub-adviser’s method for compensating the portfolio manager.
Based on these considerations, the Board concluded that it was satisfied with the nature, extent and quality of the services provided to the Fund by HFMC and the Sub-adviser.
Performance of the Fund and the Advisers
The Board considered the investment performance of the Fund. In this regard, the Board reviewed the performance of the Fund over different time periods presented in the materials and evaluated HFMC’s analysis of the Fund’s performance for these time periods. The Board considered information and materials provided to the Board by the Advisers concerning Fund performance, as well as information from Lipper comparing the investment performance of the Fund to an appropriate benchmark and universe of peer funds. The Board noted that the Fund’s performance was in the 2nd quintile of its performance universe for the 1- and 5-year periods and the 1st quintile for the 3-year period. The Board also noted that the Fund’s performance was above its benchmark for the 1-, 3- and 5-year periods.
The Board considered the detailed investment analytics reports provided by Hartford Funds’ Investment Advisory Group throughout the year. These reports include, among other things, information on the Fund’s gross and net returns, the Fund’s investment performance relative to an appropriate benchmark and peer group, various statistics concerning the Fund’s portfolio, and a narrative summary of various factors affecting Fund performance. The Board considered the Advisers’ cooperation with the Investment Committee, which assists the Board in evaluating the performance of the Fund at periodic meetings throughout the year. The Board also considered the analysis provided by the Consultant relating to the Fund’s performance track record.
In light of all the considerations noted above, the Board concluded that it had continued confidence in HFMC’s and the Sub-adviser’s overall capabilities to manage the Fund.
Costs of the Services and Profitability of the Advisers
The Board reviewed information regarding HFMC’s cost to provide investment management and related services to the Fund and HFMC’s profitability, both overall and for the Fund, on a pre-tax basis without regard to distribution expenses. The Board also requested and reviewed information about the profitability to HFMC and its affiliates from all services provided to the Fund and all aspects of their relationship with the Fund. The Board also requested and received information relating to the operations and profitability of the Sub-adviser.
The Board considered the Consultant’s review of the profitability calculations used by HFMC in connection with the continuation of the investment management agreement, noting the Consultant’s view that Hartford Funds’ process for calculating and reporting Fund profitability is reasonable. In this regard, the Board noted that the Consultant performed a full review of this process in light of the recent restructuring of the Hartford Funds business and reported that the approach to analyzing Fund profitability, including the use of common expense allocation methodologies, is reasonable, sound and well within common industry practice.
Based on these considerations, the Board concluded that the profits anticipated to be realized by the Advisers and their affiliates from their relationships with the Fund would not be excessive.
| 44 |
| The Hartford Short Duration Fund |
| Approval of Investment Management and Investment Sub-Advisory Agreements (Unaudited) - (continued) |
Comparison of Fees and Services Provided by the Advisers
The Board considered comparative information with respect to the management fees to be paid by the Fund to HFMC and the total expense ratios of the Fund. The Board also considered comparative information with respect to the sub-advisory fees to be paid by HFMC to the Sub-adviser. In this regard, the Board requested and reviewed information from HFMC and the Sub-adviser relating to the management and sub-advisory fees, including the sub-advisory fee schedule for the Fund, and total operating expenses for the Fund. With respect to the sub-advisory fee schedule, the Board considered representations from HFMC and the Sub-adviser that the Sub-adviser’s fees were negotiated at arm’s length on a fund-by-fund basis. The Board also reviewed information from Lipper comparing the Fund’s contractual management fees, actual management fees and overall expense ratios relative to a group of funds selected by Lipper, in consultation with the Consultant, and a broader universe of funds selected by Lipper. The Board considered that the Fund’s contractual management fee and actual management fee were in the 2nd quintile of its expense group, while its total expenses (less 12b-1 and shareholder service fees) were in the 3rd quintile. The Board noted that the Fund has an automatically renewable contractual expense cap on each share class as well as a permanent expense cap on certain share classes. These arrangements resulted in reimbursement of certain expenses incurred in 2013.
While the Board recognized that comparisons between the Fund and peer funds may be imprecise, given the different service levels and characteristics of mutual funds and the different business models and cost structures of the Advisers, the comparative information provided by Lipper assisted the Board in evaluating the reasonableness of the Fund’s management and sub-advisory fees and total operating expenses. In addition, the Board considered the analysis and recommendations of the Consultant relating to the Fund’s management and sub-advisory fees and total operating expenses.
Based on these considerations, the Board concluded that the Fund’s fees and total operating expenses, in conjunction with the information about quality of services, profitability, economies of scale, and other matters discussed, were reasonable in light of the services provided.
Economies of Scale
The Board requested and considered information regarding the Advisers’ realization of economies of scale with respect to the Fund and whether the fee levels reflect these economies of scale for the benefit of the Fund’s shareholders. The Board reviewed the breakpoints in the management fee schedule for the Fund, which reduce fee rates as Fund assets grow over time. The Board recognized that a fund with assets beyond the highest breakpoint level will continue to benefit from economies of scale because additional assets are charged the lowest breakpoint fee resulting in lower overall effective management fee rates. The Board also considered that expense limitations and fee waivers that reduce the Fund’s expenses at all asset levels can have the same effect as breakpoints in sharing economies of scale with shareholders and provide protection from an increase in expenses if Fund assets decline. The Board recognized that a fee schedule that reaches a lower breakpoint quickly provides shareholders with the benefit of anticipated or potential economies of scale. The Board also considered that HFMC has been active in managing expenses, which has resulted in benefits being realized by shareholders as assets within the Hartford Funds family of funds have grown over time, including through lower transfer agent costs and other operating expenses.
The Board reviewed and evaluated materials from Lipper and the Consultant showing how management fee schedules of peer funds reflect economies of scale for the benefit of shareholders as a peer fund’s assets hypothetically increase over time. Based on information provided by HFMC, Lipper, and the Consultant, the Board recognized that there is no uniform methodology for establishing breakpoints or uniform pattern in asset levels that trigger breakpoints or the amounts of breakpoints triggered.
After considering all of the information available to it, the Board concluded that it was satisfied with the extent to which economies of scale would be shared for the benefit of the Fund’s shareholders based on currently available information and the effective advisory fees and expense ratios for the Fund at its current and reasonably anticipated asset levels. The Board noted, however, that it would continue to monitor future growth in Fund assets and the appropriateness of additional breakpoints.
Other Benefits
The Board considered other benefits to the Advisers and their affiliates from their relationships with the Fund.
The Board noted that HFMC receives fees for fund accounting and related services from the Fund, and the Board considered information on profits to HFMC for such services. The Board also considered that Hartford Administrative Services Company (“HASCO”), the Fund’s transfer agent and an affiliate of HFMC, receives transfer agency compensation from the Fund, and the Board reviewed information on the profitability of
| 45 |
| The Hartford Short Duration Fund |
| Approval of Investment Management and Investment Sub-Advisory Agreements (Unaudited) - (continued) |
the Fund’s transfer agency function to HASCO. The Board considered information provided by HASCO indicating that the transfer agent fees charged by HASCO to the Fund were fair and reasonable based on publicly available information.
The Board also considered that Hartford Funds Distributors, LLC (“HFD”), an affiliate of HFMC, serves as principal underwriter of the Fund. As principal underwriter, HFD receives 12b-1 fees from the Fund and receives all or a portion of the sales charges on sales or redemptions of certain classes of shares. The Board also noted that certain affiliates of HFD distribute shares of the Fund and receive compensation in that connection.
The Board considered the benefits, if any, to the Sub-adviser from any use of the Fund’s brokerage commissions to obtain soft dollar research, and representations from HFMC and the Sub-adviser that the Sub-adviser would not make any revenue-sharing payments or any other type of distribution payments to HFMC or its affiliates.
The Board considered the benefits to shareholders of being part of the Hartford Funds family of funds, including the right to exchange investments between the same class of funds without a sales charge, the ability to reinvest Fund dividends into other funds in the family, and the ability to combine holdings in the Fund with holdings in other funds to obtain a reduced sales charge. The Board considered HFMC’s efforts to provide investors in the family with a broad range of investment styles and asset classes and its entrepreneurial risk in initiating new funds to expand these opportunities for shareholders.
* * * *
Based upon its review of these various factors, among others, the Board concluded that it is in the best interests of the Fund and its shareholders for the Board to approve the Agreements for an additional year. In reaching this decision, the Board did not assign relative weights to the factors discussed above or deem any one or group of them to be controlling in and of themselves. In connection with their deliberations, the Independent Directors met separately in executive session on several occasions, with independent legal counsel and the Consultant, to review the relevant materials and consider their responsibilities under relevant laws and regulations.
| 46 |
| The Hartford Short Duration Fund |
| Main Risks (Unaudited) |
The main risks of investing in the Fund are described below.
Market, Selection and Strategy Risk: The Fund’s share price may fluctuate due to market risk and/or security selections that may underperform the market or relevant benchmarks. If the sub-adviser's investment strategy does not perform as expected, the Fund could underperform its peers or lose money. There is no guarantee the Fund will achieve its stated objective.
Fixed Income Risk: The Fund is subject to interest rate risk (the risk that the value of an investment decreases when interest rates rise), credit risk (the risk that the issuing company of a security is unable to pay interest and principal when due) and call risk (the risk that an investment may be redeemed early). These risks also apply to the Fund’s investments in U.S. government securities, which may not be guaranteed by the U.S. government.
Junk Bond Risk: Investments in junk bonds involve greater risk of price volatility, illiquidity, and default than higher-rated debt securities.
Loan Risk: The Fund’s investments in loans may at times become difficult to value and highly illiquid; they are subject to credit risk such as nonpayment of principal or interest, and risks of bankruptcy and insolvency.
Mortgage-Backed Securities Risk: Mortgage-backed securities are subject to interest rate risk, credit risk, prepayment risk, extension risk, and the risk that an investment’s value may be reduced or become worthless if it receives interest or income payments only after other investments in the same pool.
Foreign Investment Risk: Investments in foreign securities may be riskier than investments in U.S. securities. Potential risks include the risks of illiquidity, increased price volatility, less government regulation, less extensive and less frequent accounting and other reporting requirements, unfavorable changes in currency exchange rates, and economic and political disruptions.
Derivatives Risk: Investments in derivatives can be volatile. Potential risks include currency risk, leverage risk (the risk that small market movements may result in large changes in the value of an investment), liquidity risk, index risk, pricing risk, and counterparty risk (the risk that the counterparty may be unwilling or unable to honor its obligations).
Active Trading Risk: Actively trading investments may result in higher costs and higher taxable income.
| 47 |
THIS PRIVACY POLICY IS NOT PART OF THIS REPORT
Privacy Policy and Practices of The Hartford Financial Services Group, Inc. and its Affiliates
(herein called “we, our and us”)
This Privacy Policy applies to our United States Operations
|
We value your trust. We are committed to the responsible: a) management; b) use; and c) protection; of Personal Information.
This notice describes how we collect, disclose, and protect Personal Information.
We collect Personal Information to: a) service your Transactions with us; and b) support our business functions.
We may obtain Personal Information from: a) You; b) your Transactions with us; and c) third parties such as a consumer-reporting agency.
Based on the type of product or service You apply for or get from us, Personal Information such as: a) your name; b) your address; c) your income; d) your payment; or e) your credit history; may be gathered from sources such as applications, Transactions, and consumer reports.
To serve You and service our business, we may share certain Personal Information. We will share Personal Information, only as allowed by law, with affiliates such as: a) our insurance companies; b) our employee agents; c) our brokerage firms; and d) our administrators.
As allowed by law, we may share Personal Financial Information with our affiliates to: a) market our products; or b) market our services; to You without providing You with an option to prevent these disclosures.
|
We may also share Personal Information, only as allowed by law, with unaffiliated third parties including: a) independent agents; b) brokerage firms; c) insurance companies; d) administrators; and e) service providers; who help us serve You and service our business.
When allowed by law, we may share certain Personal Financial Information with other unaffiliated third parties who assist us by performing services or functions such as: a) taking surveys; b) marketing our products or services; or c) offering financial products or services under a joint agreement between us and one or more financial institutions.
We, and third parties we partner with, may track some of the pages You visit through the use of: a) cookies; b) pixel tagging; or c) other technologies; and currently do not process or comply with any web browser’s “do not track” signal or similar mechanism that indicates a request to disable online tracking of individual users who visit our websites or use our services.
We will not sell or share your Personal Financial Information with anyone for purposes unrelated to our business functions without offering You the opportunity to: a) “opt-out;” or b) “opt-in;” as required by law.
We only disclose Personal Health Information with: a) your proper written authorization; or b) as otherwise allowed or required by law.
Our employees have access to Personal Information in the course of doing their jobs, such as: a) underwriting policies; b) paying claims; c) developing new products; or d) advising customers of our products and services. |
|
We use manual and electronic security procedures to maintain: a) the confidentiality; and b) the integrity of; Personal Information that we have. We use these procedures to guard against unauthorized access.
Some techniques we use to protect Personal Information include: a) secured files; b) user authentication; c) encryption; d) firewall technology; and e) the use of detection software.
We are responsible for and must: a) identify information to be protected; b) provide an adequate level of protection for that data; c) grant access to protected data only to those people who must use it in the performance of their job-related duties.
Employees who violate our Privacy Policy will be subject to discipline, which may include ending their employment with us.
At the start of our business relationship, we will give You a copy of our current Privacy Policy.
We will also give You a copy of our current Privacy Policy once a year if You maintain a continuing business relationship with us.
We will continue to follow our Privacy Policy regarding Personal Information even when a business relationship no longer exists between us.
|
As used in this Privacy Notice:
Application means your request for our product or service.
Personal Financial Information means financial information such as: a) credit history; b) income; c) financial benefits; or d) policy or claim information.
Personal Health Information means health information such as: a) your medical records; or b) information about your illness, disability or injury.
Personal Information means information that identifies You personally and is not otherwise available to the public. It includes: a) Personal Financial Information; and b) Personal Health Information.
Transaction means your business dealings with us, such as: a) your Application; b) your request for us to pay a claim; and c) your request for us to take an action on your account.
You means an individual who has given us Personal Information in conjunction with: a) asking about; b) applying for; or c) obtaining; a financial product or service from us if the product or service is used mainly for personal, family, or household purposes. |
This Privacy Policy is being provided on behalf of the following affiliates of The Hartford Financial Services Group, Inc.:
1stAGChoice, Inc.; Access CoverageCorp, Inc.; Access CoverageCorp Technologies, Inc.; American Maturity Life Insurance Company; Archway 60 R, LLC; Business Management Group, Inc.; Champlain Life Reinsurance Company; DMS R, LLC; Eloy R, LLC; Ersatz Corporation; First State Insurance Company; Hartford Accident and Indemnity Company; Hartford Administrative Services Company; Hartford Casualty General Agency, Inc.; Hartford Casualty Insurance Company; Hartford-Comprehensive Employee Benefit Service Company; Hartford Equity Sales Company, Inc.; Hartford Fire General Agency, Inc.; Hartford Fire Insurance Company; Hartford Funds Management Company, LLC; Hartford Funds Management Group, Inc.; Hartford HLS Series Fund II, Inc.; Hartford Insurance Company of Illinois; Hartford Insurance Company of the Midwest; Hartford Insurance Company of the Southeast; Hartford Integrated Technologies, Inc.; Hartford International Life Reassurance Corporation; Hartford Funds Distributors, LLC; Hartford Investment Management Company; Hartford Life and Accident Insurance Company; Hartford Life and Annuity Insurance Company; Hartford Life Insurance Company; Hartford Life Private Placement, LLC; Hartford Lloyd’s Corporation; Hartford Lloyd’s Insurance Company; Hartford Mezzanine Investors I, LLC; Hartford Residual Market, L.C.C.; Hartford Retirement Services, LLC; Hartford Securities Distribution Company, Inc.; Hartford Series Fund, Inc.; Hartford Specialty Insurance Services of Texas, LLC; Hartford Strategic Investments, LLC; Hartford Underwriters Insurance Company; Hartford Technology Services Company, L.L.C.; Hartford of Texas General Agency, Inc.; Hartford Underwriters General Agency, Inc.; HARTRE Company, L.C.C.; HL Investment Advisors, LLC; HLA LLC; Horizon Management Group, LLC; HRA Brokerage Services, Inc.; Lanidex Class B, LLC; M-CAP Insurance Agency, LLC; New England Insurance Company; New England Reinsurance Corporation; Nutmeg Insurance Agency, Inc.; Nutmeg Insurance Company; Pacific Insurance Company, Limited; Planco, LLC: Property and Casualty Insurance Company of Hartford; Revere R, LLC; RVR R, LLC; Sentinel Insurance Company, Ltd.; Sunstone R, LLC; Symphony R, LLC; The Evergreen Group Incorporated; The Hartford Alternative Strategies Fund; The Hartford Mutual Funds, Inc.; The Hartford Mutual Funds II, Inc.; Trumbull Flood Management, L.L.C.; Trumbull Insurance Company; Twin City Fire Insurance Company; White River Life Reinsurance Company.
HPP Revised January 2014
HARTFORDFUNDS
hartfordfunds.com
This information is written in connection with the promotion or marketing of the matter(s) addressed in this material.
This report is submitted for the general information of the shareholders of the Fund. It is not authorized for distribution unless preceded or accompanied by a current prospectus for the Fund.
The information cannot be used or relied upon for the purpose of avoiding IRS penalties. These materials are not intended to provide tax, accounting or legal advice. As with all matters of a tax or legal nature, you should consult your own tax or legal counsel for advice.
Investors should carefully consider the investment objectives, risks, charges, and expenses of Hartford Funds before investing. This and other information can be found in the prospectus and summary prospectus, which can be obtained by calling 888-843-7824 (retail) or 800-279-1541 (institutional). Investors should read them carefully before they invest.
Hartford Funds are underwritten and distributed by Hartford Funds Distributors, LLC.
MFAR-SD14 12/14 113997-3 Printed in U.S.A.
HARTFORDFUNDS
|
THE HARTFORD
SMALL COMPANY FUND
2014 Annual Report |
A MESSAGE FROM THE PRESIDENT
Dear Fellow Shareholders:
Thank you for investing in Hartford Funds.
Market Review
U.S. equities (as represented by the S&P 500 Index) rose steadily for the fiscal year ended October 31, 2014, with a return of 17.27% for the period. With the exception of short-lived geopolitical scares early in 2014 and concerns about continuing global growth near the end of the period, stocks generally rose on solid fundamentals and encouraging macroeconomic data during the year.
September 2014 marked the six-year anniversary of the start of the financial crisis. Within weeks of that anniversary, both the S&P 500 Index and the Dow Jones Industrial Average set new all-time highs, closing at 2,018 and 17,391, respectively, on October 31. Although the fallout of the crisis continues to influence investor behavior, stocks have recovered and risen dramatically, up 198% from their low in March 2009. Meanwhile, the domestic economy is notching strong growth, and the unemployment rate has reached its lowest level since August 2008.
While the U.S. economy appears to have stabilized and to have reverted to a solid growth path, the outlook for the global economy appears to have gotten cloudier. The U.S. Federal Reserve has ended quantitative easing, while Europe and Japan are pursuing stimulus options to avoid a double-dip recession and deflation, respectively. Diverging central-bank policies will likely continue to play an important role in market movements going forward as investors wait to see the reactions to their efforts and their impacts on global markets.
How have market movements impacted your portfolio throughout the last year? Are your investments still on track to provide the growth or income you need, and are you comfortable with their progress during times of volatility?
Your financial professional can help you navigate today’s markets with confidence, as well as assist you to achieve your investment goals by providing advice on the best options within our fund family to help you work toward overcoming today’s investing challenges. Meet with your financial advisor regularly to examine your portfolio and your investment strategy, and to determine if you’re still on track to meet your goals.
Thank you again for investing with Hartford Funds.
James Davey
President
Hartford Funds
1 The S&P 500 Index is a market capitalization-weighted price index composed of 500 widely held common stocks.
2 The Dow Jones Industrial Average is an unmanaged, price-weighted index of 30 of the largest, most widely held stocks traded on the NYSE
The Hartford Small Company Fund
Table of Contents
The views expressed in the Fund’s Manager Discussion under ‘‘Why did the Fund perform this way?’’ and ‘‘What is the outlook?’’ are views of the Fund’s sub-adviser and portfolio management team through the end of the period and are subject to change based on market and other conditions. The Fund’s Manager Discussion is for informational purposes only and does not represent an offer, recommendation or solicitation to buy, hold or sell any security. The specific securities identified and described, if any, do not represent all of the securities purchased or sold and you should not assume that investments in the securities identified and discussed will be profitable.
| The Hartford Small Company Fund inception 07/22/1996 |
| (sub-advised by Wellington Management Company, LLP) |
| Investment objective – The Fund seeks growth of capital. |
Performance Overview 10/31/04 - 10/31/14
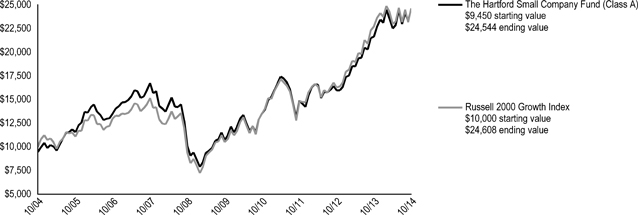
The chart above represents the hypothetical growth of a $10,000 investment in Class A, which includes a sales charge. Growth results in classes other than Class A will vary from what is seen above due to differences in the expenses charged to those share classes.
Average Annual Total Returns (as of 10/31/14)
| 1 Year | 5 Years | 10 Years | ||||||||||
| Small Company A# | 13.49 | % | 17.97 | % | 10.02 | % | ||||||
| Small Company A## | 7.25 | % | 16.64 | % | 9.39 | % | ||||||
| Small Company B# | 12.61 | % | 17.06 | % | 9.42 | %* | ||||||
| Small Company B## | 7.71 | % | 16.85 | % | 9.42 | %* | ||||||
| Small Company C# | 12.70 | % | 17.13 | % | 9.21 | % | ||||||
| Small Company C## | 11.72 | % | 17.13 | % | 9.21 | % | ||||||
| Small Company I# | 13.78 | % | 18.27 | % | 10.25 | % | ||||||
| Small Company R3# | 13.27 | % | 17.76 | % | 9.94 | % | ||||||
| Small Company R4# | 13.62 | % | 18.12 | % | 10.22 | % | ||||||
| Small Company R5# | 13.95 | % | 18.46 | % | 10.47 | % | ||||||
| Small Company Y# | 14.08 | % | 18.59 | % | 10.57 | % | ||||||
| Russell 2000 Growth Index | 8.26 | % | 18.61 | % | 9.42 | % | ||||||
| # | Without sales charge |
| ## | With sales charge |
| * | Class B shares convert to Class A shares after 8 years. The return shown reflects the conversion to Class A shares, which had different operating expenses, for the period after conversion. |
PERFORMANCE DATA QUOTED REPRESENTS PAST PERFORMANCE AND DOES NOT GUARANTEE FUTURE RESULTS. The investment return and principal value of the investment will fluctuate so that investors’ shares, when redeemed, may be worth more or less than their original cost. Current performance may be lower or higher than the performance data quoted. To obtain performance data current to the most recent month-end, please visit our website www.hartfordfunds.com.
The initial investment in Class A shares reflects the maximum sales charge of 5.50% and returns for Class B shares reflect a contingent deferred sales charge of up to 5.00% and declining to zero, depending on the period of time the shares are held. Returns for Class C shares reflect a contingent deferred sales charge of up to 1.00% on shares redeemed within twelve months of purchase.
Total returns presented above were calculated using the Fund’s net asset value available to shareholders for sale or redemption of Fund shares on October 31, 2014, which may exclude investment transactions as of this date. All share class returns assume the reinvestment of all distributions at net asset value and the deduction of all fund expenses.
Effective 9/30/09, Class B shares of the Fund were closed to new investments.
Performance information includes performance under the Fund’s previous sub-adviser, Hartford Investment Management Company. As of July 21, 2010, Hartford Investment Management Company no longer served as the sub-adviser to the Fund.
Class I shares commenced operations on 8/31/06. Performance prior to that date is that of the Fund's Class A shares (excluding sales charges), which had different operating expenses. Class R3, R4 and R5 shares commenced operations on 12/22/06. Performance prior to that date is that of the Fund's Class Y shares which had different operating expenses.
Russell 2000 Growth Index is an unmanaged index of those Russell 2000 Index growth companies with higher price-to-book ratios and higher forecasted growth values. The Russell 2000 Index is a broad-based unmanaged index comprised of 2,000 of the smallest U.S.-domiciled company common stocks (on the basis of capitalization) that are traded in the United States on the New York Stock Exchange, NYSE MKT LLC and Nasdaq.
You cannot invest directly in an index.
The chart and table do not reflect the deductions of taxes that a shareholder would pay on Fund distributions or the redemption of Fund shares.
Performance information may reflect historical or current expense waivers/reimbursements from the investment adviser, without which performance would have been lower. For information on current expense waivers/reimbursements, please see the prospectus.
| 2 |
| The Hartford Small Company Fund |
| Manager Discussion |
| October 31, 2014 (Unaudited) |
Operating Expenses*
| Net | Gross | |||||||
| Small Company Class A | 1.39 | % | 1.39 | % | ||||
| Small Company Class B | 2.15 | % | 2.35 | % | ||||
| Small Company Class C | 2.09 | % | 2.09 | % | ||||
| Small Company Class I | 1.14 | % | 1.14 | % | ||||
| Small Company Class R3 | 1.55 | % | 1.56 | % | ||||
| Small Company Class R4 | 1.25 | % | 1.26 | % | ||||
| Small Company Class R5 | 0.95 | % | 0.99 | % | ||||
| Small Company Class Y | 0.86 | % | 0.86 | % | ||||
| * | As shown in the Fund's prospectus dated March 1, 2014. Actual expenses may be higher or lower. Please see accompanying Financial Highlights for expense ratios for the year ended October 31, 2014. |
Gross expenses are the Fund's total annual operating expenses shown in the Fund's prospectus dated March 1, 2014. Net expenses are the Fund's total annual operating expenses shown in the Fund's prospectus dated March 1, 2014 and reflect contractual expense reimbursements in instances when these reductions reduce the Fund's gross expenses. Contractual reimbursements remain in effect until February 28, 2015, and automatically renew for one-year terms unless terminated.
The Fund filed an updated prospectus, dated November 7, 2014, with the U.S. Securities and Exchange Commission that became effective on that date. However, the information in this annual report is as of October 31, 2014 and does not reflect any changes made to the total annual fund operating expense table in the November 7, 2014 prospectus.
All investments are subject to risk including the possible loss of principal. For a discussion of the Fund’s risks, please see the Main Risks section of this report. For more detailed information on the risks associated with an investment in the Fund, please see the prospectus.
| Portfolio Managers | ||
| Steven C. Angeli, CFA | Stephen Mortimer | Mario E. Abularach, CFA |
| Senior Vice President and Equity Portfolio Manager | Senior Vice President and Equity Portfolio Manager | Senior Vice President and Equity Research Analyst |
| Mammen Chally, CFA | Jamie A. Rome, CFA | |
| Vice President and Equity Portfolio Manager | Senior Vice President and Equity Portfolio Manager |
How did the Fund perform?
The Class A shares of The Hartford Small Company Fund returned 13.49%, before sales charge, for the twelve-month period ended October 31, 2014, outperforming the Fund’s benchmark, the Russell 2000 Growth Index, which returned 8.26% for the same period. The Fund also outperformed the 5.67% average return of the Lipper Small Cap Growth Funds peer group, a group of funds with investment strategies similar to those of the Fund.
Why did the Fund perform this way?
U.S. equities surged during the period, despite bouts of significant volatility. After finishing their best year since 1997, U.S. stocks began 2014 with their worst month in nearly two years. Worries about an economic slowdown in China and general angst surrounding emerging markets overshadowed a fairly benign domestic environment. However, robust merger and acquisition activity and an uncontested increase in the debt ceiling from Congress helped stoke investors' risk appetites in February. The rally continued in May amid renewed signs of life in the housing market and the best payroll gain in more than two years. However, a pullback in July ended a streak of five consecutive monthly gains. Fear gripped the market as heightened geopolitical risks, a potential Portuguese banking crisis, and worries of U.S. Federal Reserve (Fed) tightening took center stage. Stocks rebounded in August as investors were emboldened by encouraging economic data, headlined by better-than-expected gross domestic product (GDP) growth and signs that the housing recovery still had legs. In September, U.S. equities retreated for just the third month this year. Despite solid manufacturing and consumer confidence readings, the reality of quantitative easing ending, and the prospect of higher federal funds rates in mid-2015 contributed to increased risk aversion levels. Stocks finished a volatile October at an all-time high on the heels of a positive earnings season and generally solid economic data.
Small cap stocks (+8%) underperformed both mid cap stocks (+12%) and large cap stocks (+17%) during the period, as measured by the Russell 2000, S&P MidCap 400, and S&P 500 Indices respectively. Small cap Growth (+8%) stocks performed in line with Small cap Value (+8%) stocks during the period, as measured by the Russell 2000 Growth and Russell 2000 Value Indices, respectively. Seven out of ten sectors in the Russell 2000 Growth Index had positive returns during the period. The Healthcare (+22%), Consumer Staples (+14%), and Information Technology (+9%) sectors performed best, while Energy (-13%), Consumer Discretionary (-2%), and Utilities (0%) lagged the broader index.
During the period, security selection was the primary driver of the Fund’s benchmark-relative outperformance. Selection was favorable in all ten sectors and strongest in the Consumer Discretionary, Industrials, and Healthcare sectors. Sector allocation, which is the result of bottom-up stock selection, had a neutral impact on relative returns; an underweight to Energy contributed to relative results but was offset by an underweight to Healthcare, which had a negative impact on relative results.
| 3 |
| The Hartford Small Company Fund |
| Manager Discussion – (continued) |
| October 31, 2014 (Unaudited) |
Top contributors to relative and absolute performance during the period included Mobileye NV (Information Technology), Athlon Energy (Energy), and WhiteWave Foods (Consumer Discretionary). Shares of Mobileye NV, a designer and developer of software and related technologies for camera-based advanced driver assistance systems, rose during the period following the IPO. Shares of Athlon Energy, a U.S.-based independent exploration and production company, rose during the period due to solid results and favorable investor response to drilling activity. Shares of WhiteWave Foods, a producer of branded plant-based foods and beverages throughout North America and Europe, climbed after the company announced strong quarterly results based on a 36% increase in net sales; as a result of strong, positive stock price movement, the Fund had exited the position by the end of the period.
Stocks that detracted most from relative returns during the period included Intermune (Healthcare), Puma Biotechnology (Healthcare), and Bloomin’ Brands (Consumer Discretionary). Shares of Intermune, a U.S.-based biotechnology company, rose during the period after the company was acquired by rival Roche. Not owning the strong-performing benchmark constituent detracted from results. Shares of Puma Biotechnology rose sharply during the period after the company announced positive top line results from its experimental drug that can block the return of breast cancer in women with a type of early-stage disease. The Fund’s relative underweight position in this strong performing name detracted from returns. Shares of casual dining company Bloomin’ Brands fell during the period after the company lowered earnings guidance. Rosetta Resources (Energy) and Academy CoInvest (Consumer Discretionary) also detracted from absolute returns during the period.
Derivatives are not used in a significant manner in this Fund and did not have a material impact on performance during the period.
What is the outlook?
We believe the global cycle continues to advance at a moderate pace with a mix of stronger growth in the U.S. and more sluggish activity in Europe, Japan, and China. We believe the U.S. economy is on track for a self-sustaining expansion. After three years of fiscal consolidation, it appears that this policy drag is starting to fade, which we believe should support growth. Meanwhile, investment spending appears to be picking up. We believe that wage trends and inflation have been quite muted in the U.S., yet below the surface it appears that U.S. firms are having a tougher time finding qualified labor, suggesting that wages may rise in 2015 with an improving labor market.
We view a balanced portfolio as a means to hedge against risk associated with unpredictable events and economic outcomes. As a residual of our bottom-up, stock-by-stock investment decisions, the Fund ended the period overweight in the Industrials and Information Technology sectors relative to the Russell 2000 Growth Index. The Fund ended the period most underweight Consumer Staples, Healthcare, and Materials.
Diversification by Sector
as of October 31, 2014
| Sector | Percentage of Net Assets | |||
| Equity Securities | ||||
| Consumer Discretionary | 15.7 | % | ||
| Consumer Staples | 1.2 | |||
| Energy | 2.6 | |||
| Financials | 9.6 | |||
| Health Care | 20.0 | |||
| Industrials | 22.3 | |||
| Information Technology | 24.8 | |||
| Materials | 1.7 | |||
| Services | 0.2 | |||
| Utilities | 0.1 | |||
| Total | 98.2 | % | ||
| Short-Term Investments | 1.3 | |||
| Other Assets and Liabilities | 0.5 | |||
| Total | 100.0 | % | ||
A sector may be comprised of several industries. For Fund compliance purposes, the Fund may not use the same classification system and these sector classifications are used for reporting ease.
| 4 |
| The Hartford Small Company Fund |
| Schedule of Investments |
| October 31, 2014 |
| (000’s Omitted) |
| Shares or Principal Amount | Market Value ╪ | |||||||
| Common Stocks - 96.3% | ||||||||
| Automobiles and Components - 1.5% | ||||||||
| 27 | Dana Holding Corp. | $ | 557 | |||||
| 155 | Gentherm, Inc. ● | 6,449 | ||||||
| 8 | Standard Motor Products, Inc. | 308 | ||||||
| 123 | Tenneco Automotive, Inc. ● | 6,451 | ||||||
| 1 | Tesla Motors, Inc. ● | 136 | ||||||
| 13,901 | ||||||||
| Banks - 1.6% | ||||||||
| 6 | Bank of Marin Bancorp | 285 | ||||||
| 22 | Blue Hills Bancorp, Inc. ● | 291 | ||||||
| 23 | Clifton Bancorp, Inc. | 297 | ||||||
| 49 | EverBank Financial Corp. | 933 | ||||||
| 28 | First Merchants Corp. | 624 | ||||||
| 29 | Flushing Financial Corp. | 584 | ||||||
| 12 | Great Western Bancorp, Inc. ● | 237 | ||||||
| 17 | Heritage Financial Corp. | 306 | ||||||
| 13 | Home Loan Servicing Solutions Ltd. | 248 | ||||||
| 50 | MGIC Investment Corp. ● | 447 | ||||||
| 218 | PacWest Bancorp | 9,305 | ||||||
| 13 | Trico Bancshares | 337 | ||||||
| 17 | Wintrust Financial Corp. | 810 | ||||||
| 4 | WSFS Financial Corp. | 303 | ||||||
| 15,007 | ||||||||
| Capital Goods - 14.9% | ||||||||
| 10 | A.O. Smith Corp. | 528 | ||||||
| 22 | AAON, Inc. | 433 | ||||||
| 91 | Acuity Brands, Inc. | 12,753 | ||||||
| 344 | AECOM Technology Corp. ● | 11,185 | ||||||
| 330 | Altra Industrial Motion Corp. | 10,387 | ||||||
| 201 | Applied Industrial Technologies, Inc. | 9,788 | ||||||
| 129 | Astronics Corp. ● | 6,679 | ||||||
| 2 | Astronics Corp. Class B | 120 | ||||||
| 13 | AZZ, Inc. | 587 | ||||||
| 15 | CAI International, Inc. ● | 308 | ||||||
| 2 | Carlisle Cos., Inc. | 176 | ||||||
| 11 | Chart Industries, Inc. ● | 511 | ||||||
| 2 | Crane Co. | 151 | ||||||
| 327 | DigitalGlobe, Inc. ● | 9,345 | ||||||
| 6 | EMCOR Group, Inc. | 268 | ||||||
| 5 | Esterline Technologies Corp. ● | 528 | ||||||
| 192 | Generac Holdings, Inc. ● | 8,724 | ||||||
| 7 | H & E Equipment Services, Inc. | 261 | ||||||
| 452 | HD Supply Holdings, Inc. ● | 13,050 | ||||||
| 10 | Heico Corp. | 556 | ||||||
| 13 | Insteel Industries, Inc. | 299 | ||||||
| 8 | Lennox International, Inc. | 741 | ||||||
| 16 | Luxfer Holdings plc | 249 | ||||||
| 10 | Lydall, Inc. ● | 304 | ||||||
| 52 | Masonite International Corp. ● | 2,832 | ||||||
| 93 | Moog, Inc. Class A ● | 7,091 | ||||||
| 340 | Orbital Sciences Corp. ● | 8,933 | ||||||
| 7 | Polypore International, Inc. ● | 297 | ||||||
| 8 | Sun Hydraulics Corp. | 306 | ||||||
| 99 | Teledyne Technologies, Inc. ● | 10,307 | ||||||
| 8 | Textainer Group Holdings Ltd. | 279 | ||||||
| 23 | Titan International, Inc. | 242 | ||||||
| 9 | Toro Co. | 581 | ||||||
| 180 | Watts Water Technologies, Inc. | 10,913 | ||||||
| 107 | WESCO International, Inc. ● | 8,810 | ||||||
| 138,522 | ||||||||
| Commercial and Professional Services - 3.2% | ||||||||
| 121 | Clean Harbors, Inc. ● | 5,997 | ||||||
| 16 | Deluxe Corp. | 949 | ||||||
| 9 | Exponent, Inc. | 749 | ||||||
| 9 | Gategroup Holding AG | 195 | ||||||
| 18 | GP Strategies Corp. ● | 609 | ||||||
| 19 | On Assignment, Inc. ● | 543 | ||||||
| 190 | Trinet Group, Inc. ● | 5,697 | ||||||
| 329 | TrueBlue, Inc. ● | 8,126 | ||||||
| 117 | Wageworks, Inc. ● | 6,695 | ||||||
| 29,560 | ||||||||
| Consumer Durables and Apparel - 3.8% | ||||||||
| 15 | Arctic Cat, Inc. | 489 | ||||||
| 9 | iRobot Corp. ● | 315 | ||||||
| 153 | Kate Spade & Co. ● | 4,147 | ||||||
| 15 | LGI Homes, Inc. ● | 293 | ||||||
| 13 | M/I Schottenstein Homes, Inc. ● | 290 | ||||||
| 25 | New Home (The) Co., Inc. ● | 376 | ||||||
| 2,101 | Samsonite International S.A. | 6,981 | ||||||
| 148 | Skechers USA, Inc. Class A ● | 8,077 | ||||||
| 691 | Standard-Pacific Corp. ● | 5,111 | ||||||
| 23 | Steven Madden Ltd. ● | 728 | ||||||
| 18 | Taylor Morrison Home Corp. ● | 308 | ||||||
| 245 | Vince Holding Corp. ● | 8,575 | ||||||
| 35,690 | ||||||||
| Consumer Services - 4.4% | ||||||||
| 309 | Bloomin' Brands, Inc. ● | 5,844 | ||||||
| 11 | Brinker International, Inc. | 605 | ||||||
| 39 | Buffalo Wild Wings, Inc. ● | 5,893 | ||||||
| 14 | Dave & Buster's Entertainment, Inc. ● | 268 | ||||||
| 34 | Del Frisco's Restaurant Group, Inc. ● | 784 | ||||||
| 423 | Diamond Resorts International, Inc. ● | 10,983 | ||||||
| 38 | Ignite Restaurant Group, Inc. ● | 261 | ||||||
| 11 | Marriott Vacations Worldwide Corp. | 783 | ||||||
| 5 | Multimedia Games Holding Co., Inc. ● | 188 | ||||||
| 59 | Panera Bread Co. Class A ● | 9,466 | ||||||
| 88 | Red Robin Gourmet Burgers, Inc. ● | 4,851 | ||||||
| 14 | Sotheby's Holdings | 546 | ||||||
| 40,472 | ||||||||
| Diversified Financials - 4.4% | ||||||||
| 9 | Alaris Royalty Corp. | 276 | ||||||
| 9 | Evercore Partners, Inc. | 492 | ||||||
| 119 | Financial Engines, Inc. | 4,763 | ||||||
| 292 | HFF, Inc. | 9,198 | ||||||
| 9 | Marcus & Millichap, Inc. ● | 268 | ||||||
| 375 | Platform Specialty Products Corp. ● | 9,761 | ||||||
| 83 | Platform Specialty Products Corp. PIPE ⌂●† | 2,008 | ||||||
| 5 | Portfolio Recovery Associates, Inc. ● | 285 | ||||||
| 20 | Regional Management Corp. ● | 233 | ||||||
| 36 | Virtus Investment Partners, Inc. | 6,537 | ||||||
| 339 | Wisdomtree Investment, Inc. ● | 5,007 | ||||||
| 219 | WL Ross Holding Corp. ● | 2,347 | ||||||
| 41,175 | ||||||||
| Energy - 2.6% | ||||||||
| 156 | BPZ Resources, Inc. ● | 194 | ||||||
| 10 | C&J Energy Services, Inc. ● | 187 | ||||||
| 111 | Diamondback Energy, Inc. ● | 7,602 | ||||||
| 14 | Forum Energy Technologies, Inc. ● | 380 | ||||||
| 20 | Jones Energy, Inc. ● | 250 | ||||||
| 102 | Karoon Gas Australia Ltd. ● | 266 | ||||||
| 9 | Parsley Energy, Inc. ● | 158 | ||||||
The accompanying notes are an integral part of these financial statements.
| 5 |
| The Hartford Small Company Fund |
| Schedule of Investments – (continued) |
| October 31, 2014 |
| (000’s Omitted) |
| Shares or Principal Amount | Market Value ╪ | |||||||
| Common Stocks - 96.3% - (continued) | ||||||||
| Energy - 2.6% - (continued) | ||||||||
| 12 | PBF Energy, Inc. | $ | 324 | |||||
| 133 | Rice Energy, Inc. ● | 3,504 | ||||||
| 12 | Rosetta Resources, Inc. ● | 463 | ||||||
| 407 | RSP Permian, Inc. ● | 9,964 | ||||||
| 47 | Superior Drilling Products I ● | 259 | ||||||
| 22 | Synergy Resources Corp. ● | 273 | ||||||
| 23,824 | ||||||||
| Food and Staples Retailing - 0.3% | ||||||||
| 14 | Casey's General Stores, Inc. | 1,127 | ||||||
| 9 | Diplomat Pharmacy, Inc. ● | 198 | ||||||
| 25 | Natural Grocers by Vitamin Cottage, Inc. ● | 451 | ||||||
| 7 | PriceSmart, Inc. | 584 | ||||||
| 2,360 | ||||||||
| Food, Beverage and Tobacco - 0.2% | ||||||||
| 15 | Darling Ingredients, Inc. ● | 259 | ||||||
| 79 | Sunopta, Inc. ● | 1,121 | ||||||
| 11 | TreeHouse Foods, Inc. ● | 926 | ||||||
| 2,306 | ||||||||
| Health Care Equipment and Services - 9.3% | ||||||||
| 168 | Acadia Healthcare Co., Inc. ● | 10,438 | ||||||
| 2 | Atrion Corp. | 541 | ||||||
| 16 | CareTrust REIT, Inc. ● | 243 | ||||||
| 14 | Corvel Corp. ● | 484 | ||||||
| 10 | Cyberonics, Inc. ● | 508 | ||||||
| 258 | Dexcom, Inc. ● | 11,579 | ||||||
| 8 | Ensign Group, Inc. | 312 | ||||||
| 261 | Envision Healthcare Holdings ● | 9,108 | ||||||
| 235 | Examworks Group, Inc. ● | 9,124 | ||||||
| 50 | Globus Medical, Inc. ● | 1,106 | ||||||
| 6 | Greatbatch, Inc. ● | 285 | ||||||
| 25 | HealthSouth Corp. | 1,021 | ||||||
| 113 | Heartware International, Inc. ● | 8,719 | ||||||
| 9 | ICU Medical, Inc. ● | 622 | ||||||
| 250 | Insulet Corp. ● | 10,788 | ||||||
| 4 | MEDNAX, Inc. ● | 271 | ||||||
| 9 | Natus Medical, Inc. ● | 313 | ||||||
| 19 | Omnicell, Inc. ● | 598 | ||||||
| 110 | Team Health Holdings ● | 6,875 | ||||||
| 19 | U.S. Physical Therapy, Inc. | 826 | ||||||
| 31 | Vascular Solutions, Inc. ● | 908 | ||||||
| 391 | Veeva Systems, Inc. ● | 11,648 | ||||||
| 9 | Wellcare Health Plans, Inc. ● | 596 | ||||||
| 86,913 | ||||||||
| Household and Personal Products - 0.7% | ||||||||
| 22 | Prestige Brands Holdings, Inc. ● | 793 | ||||||
| 68 | Spectrum Brands Holdings, Inc. | 6,125 | ||||||
| 6,918 | ||||||||
| Insurance - 0.7% | ||||||||
| 17 | Amerisafe, Inc. | 693 | ||||||
| 227 | Assured Guaranty Ltd. | 5,248 | ||||||
| 5 | Phoenix Cos., Inc. ● | 276 | ||||||
| 6,217 | ||||||||
| Materials - 1.7% | ||||||||
| 14 | Advanced Emissions Solutions, Inc. ● | 291 | ||||||
| 10 | Cabot Corp. | 487 | ||||||
| 79 | Graphic Packaging Holding Co. ● | 961 | ||||||
| 3 | Haynes International, Inc. | 157 | ||||||
| 651 | Headwaters, Inc. ● | 8,271 | ||||||
| 102 | KapStone Paper & Packaging Corp. ● | 3,127 | ||||||
| 18 | Myers Industries, Inc. | 275 | ||||||
| 32 | New Gold, Inc. ● | 113 | ||||||
| 55 | Omnova Solutions, Inc. ● | 388 | ||||||
| 32 | Orion Engineered Carbons S. A. ● | 480 | ||||||
| 9 | Philbro Animal Health Corp.-A | 244 | ||||||
| 24 | PolyOne Corp. | 881 | ||||||
| 12 | Silgan Holdings, Inc. | 571 | ||||||
| 16,246 | ||||||||
| Media - 2.0% | ||||||||
| 13 | DreamWorks Animation SKG, Inc. ● | 292 | ||||||
| 366 | Imax Corp. ● | 10,780 | ||||||
| 95 | Shutterstock, Inc. ● | 7,354 | ||||||
| 97 | Speed Commerce, Inc. ● | 288 | ||||||
| 18,714 | ||||||||
| Pharmaceuticals, Biotechnology and Life Sciences - 10.7% | ||||||||
| 13 | Acorda Therapeutics, Inc. ● | 457 | ||||||
| 123 | Aerie Pharmaceuticals, Inc. ● | 3,101 | ||||||
| 12 | Agios Pharmaceuticals, Inc. ● | 977 | ||||||
| 14 | Albany Molecular Research, Inc. ● | 330 | ||||||
| 16 | Alkermes plc ● | 825 | ||||||
| 76 | Alnylam Pharmaceuticals, Inc. ● | 7,074 | ||||||
| 239 | Anacor Pharmaceuticals, Inc. ● | 7,041 | ||||||
| 75 | Arena Pharmaceuticals, Inc. ● | 325 | ||||||
| 384 | BioCryst Pharmaceuticals, Inc. ● | 4,498 | ||||||
| 31 | Bruker Corp. ● | 644 | ||||||
| 34 | Cara Therapeutics, Inc. ● | 305 | ||||||
| 137 | Cepheid, Inc. ● | 7,236 | ||||||
| 87 | Covance, Inc. ● | 6,975 | ||||||
| 100 | Cubist Pharmaceuticals, Inc. ● | 7,242 | ||||||
| 25 | Durata Therapeutics, Inc. ● | 602 | ||||||
| 139 | Exelixis, Inc. ● | 236 | ||||||
| 19 | Five Prime Therapeutics, Inc. ● | 249 | ||||||
| 18 | Glycomimetics, Inc. ● | 128 | ||||||
| 109 | Hyperion Therapeutics, Inc. ● | 2,659 | ||||||
| 21 | Immunogen, Inc. ● | 198 | ||||||
| 120 | Intersect ENT, Inc. ● | 2,284 | ||||||
| 284 | Ironwood Pharmaceuticals, Inc. ● | 3,985 | ||||||
| 167 | Medicines Co. ● | 4,241 | ||||||
| 227 | NPS Pharmaceuticals, Inc. ● | 6,228 | ||||||
| 15 | PAREXEL International Corp. ● | 791 | ||||||
| 216 | Portola Pharmaceuticals, Inc. ● | 6,155 | ||||||
| 124 | PTC Therapeutics, Inc. ● | 5,088 | ||||||
| 3 | Puma Biotechnology, Inc. ● | 787 | ||||||
| 51 | Salix Pharmaceuticals Ltd. ● | 7,286 | ||||||
| 143 | Seattle Genetics, Inc. ● | 5,229 | ||||||
| 186 | Tesaro, Inc. ● | 5,186 | ||||||
| 8 | Ultragenyx Pharmaceutical, Inc. ● | 372 | ||||||
| 80 | Xenoport, Inc. ● | 543 | ||||||
| 11 | Zafgen, Inc. ● | 230 | ||||||
| 99,507 | ||||||||
| Real Estate - 2.7% | ||||||||
| 12 | Altisource Residential Corp. | 284 | ||||||
| 34 | Arbor Realty Trust | 229 | ||||||
| 25 | Armada Hoffler Properties, Inc. | 239 | ||||||
| 13 | Coresite Realty Corp. REIT | 496 | ||||||
| 182 | Douglas Emmett, Inc. REIT | 5,107 | ||||||
| 352 | Kennedy-Wilson Holdings, Inc. | 9,544 | ||||||
| 21 | Medical Properties Trust, Inc. REIT | 279 | ||||||
| 124 | Pebblebrook Hotel Trust REIT | 5,294 | ||||||
| 20 | Ramco-Gershenson Properties Trust REIT | 348 | ||||||
| 12 | Stag Industrial, Inc. REIT | 295 | ||||||
The accompanying notes are an integral part of these financial statements.
| 6 |
| The Hartford Small Company Fund |
| Schedule of Investments – (continued) |
| October 31, 2014 |
| (000’s Omitted) |
| Shares or Principal Amount | Market Value ╪ | |||||||
| Common Stocks - 96.3% - (continued) | ||||||||
| Real Estate - 2.7% - (continued) | ||||||||
| 25 | Summit Hotel Properties, Inc. REIT | $ | 292 | |||||
| 42 | Sunstone Hotel Investors, Inc. REIT | 648 | ||||||
| 21 | Zillow, Inc. ● | 2,281 | ||||||
| 25,336 | ||||||||
| Retailing - 3.7% | ||||||||
| 3,137 | Allstar Co. ⌂●† | 2,662 | ||||||
| 16 | Core-Mark Holding Co., Inc. | 942 | ||||||
| 11 | Destination Maternity Corp. | 162 | ||||||
| 19 | DSW, Inc. | 566 | ||||||
| 21 | Express, Inc. ● | 314 | ||||||
| 10 | Finish Line (The), Inc. | 265 | ||||||
| 16 | Five Below, Inc. ● | 643 | ||||||
| 133 | HSN, Inc. | 8,769 | ||||||
| 49 | Pier 1 Imports, Inc. | 632 | ||||||
| 16 | Shoe Carnival, Inc. | 291 | ||||||
| 66 | Tory Burch LLC ⌂●† | 4,296 | ||||||
| 271 | Tuesday Morning Corp. ● | 5,522 | ||||||
| 7 | Wayfair, Inc. ● | 186 | ||||||
| 240 | Zulily, Inc. ● | 8,714 | ||||||
| 33,964 | ||||||||
| Semiconductors and Semiconductor Equipment - 3.0% | ||||||||
| 36 | Exar Corp. ● | 340 | ||||||
| 183 | Freescale Semiconductor Holdings Ltd. ● | 3,643 | ||||||
| 20 | Inphi Corp. ● | 312 | ||||||
| 18 | Integrated Silicon Solution, Inc. | 250 | ||||||
| 23 | Nanometrics, Inc. ● | 317 | ||||||
| 136 | Power Integrations, Inc. | 6,863 | ||||||
| 26 | Rambus, Inc. ● | 302 | ||||||
| 13 | SunEdison Semiconductor Ltd. ● | 260 | ||||||
| 394 | SunEdison, Inc. ● | 7,682 | ||||||
| 235 | SunPower Corp. ● | 7,493 | ||||||
| 17 | Ultratech Stepper, Inc. ● | 329 | ||||||
| 27,791 | ||||||||
| Software and Services - 15.9% | ||||||||
| 20 | Aspen Technology, Inc. ● | 721 | ||||||
| 22 | Bankrate, Inc. ● | 238 | ||||||
| 7 | CACI International, Inc. Class A ● | 592 | ||||||
| 46 | Carbonite, Inc. ● | 506 | ||||||
| 12 | Cass Information Systems, Inc. | 594 | ||||||
| 304 | Constant Contact, Inc. ● | 10,760 | ||||||
| 43 | CoStar Group, Inc. ● | 6,933 | ||||||
| 11 | CSG Systems International, Inc. | 282 | ||||||
| 9 | Cvent, Inc. ● | 244 | ||||||
| 123 | DealerTrack Technologies, Inc. ● | 5,769 | ||||||
| 107 | Demandware, Inc. ● | 6,442 | ||||||
| 6 | Digimarc Corp. | 172 | ||||||
| 21 | Digital River, Inc. ● | 545 | ||||||
| 32 | Ellie Mae, Inc. ● | 1,219 | ||||||
| 98 | Envestnet, Inc. ● | 4,349 | ||||||
| 16 | ePlus, Inc. ● | 959 | ||||||
| 10 | Everyday Health, Inc. ● | 138 | ||||||
| 31 | Exlservice Holdings, Inc. ● | 867 | ||||||
| 13 | Fair Isaac, Inc. | 796 | ||||||
| 65 | Five9, Inc. ● | 286 | ||||||
| 166 | Fleetmatics Group Ltd. ● | 6,165 | ||||||
| 35 | Global Cash Access, Inc. ● | 255 | ||||||
| 186 | Heartland Payment Systems, Inc. | 9,593 | ||||||
| 77 | Hubspot, Inc. ● | 2,748 | ||||||
| 21 | j2 Global, Inc. | 1,150 | ||||||
| 34 | Kofax Ltd. ● | 218 | ||||||
| 27 | Manhattan Associates, Inc. ● | 1,073 | ||||||
| 47 | Marchex, Inc. | 181 | ||||||
| 233 | Marketo, Inc. ● | 7,529 | ||||||
| 124 | MAXIMUS, Inc. | 5,998 | ||||||
| 42 | Model N, Inc. ● | 408 | ||||||
| 14 | Netscout Systems, Inc. ● | 509 | ||||||
| 16 | Nuance Communications, Inc. ● | 242 | ||||||
| 142 | PTC, Inc. ● | 5,406 | ||||||
| 14 | Qualys, Inc. ● | 446 | ||||||
| 39 | Sapient Corp. ● | 670 | ||||||
| 16 | SeaChange International, Inc. ● | 111 | ||||||
| 9 | Solera Holdings, Inc. | 484 | ||||||
| 26 | Tangoe, Inc. ● | 388 | ||||||
| 8 | Textura Corp. ● | 213 | ||||||
| 111 | Tyler Corp. ● | 12,469 | ||||||
| 206 | Verint Systems, Inc. ● | 11,859 | ||||||
| 249 | Virtusa Corp. ● | 10,194 | ||||||
| 13 | WebMD Health Corp. ● | 564 | ||||||
| 92 | WEX, Inc. ● | 10,469 | ||||||
| 397 | WNS Holdings Ltd. ADR ● | 8,020 | ||||||
| 135 | Xoom Corp. ● | 2,039 | ||||||
| 105 | Yelp, Inc. ● | 6,300 | ||||||
| 2 | Zendesk, Inc. ● | 55 | ||||||
| 64 | Zix Corp. ● | 211 | ||||||
| 148,379 | ||||||||
| Technology Hardware and Equipment - 5.1% | ||||||||
| 27 | Aruba Networks, Inc. ● | 579 | ||||||
| 30 | Calix, Inc. ● | 327 | ||||||
| 21 | CDW Corp. of Delaware | 656 | ||||||
| 247 | Cognex Corp. ● | 9,786 | ||||||
| 8 | FEI Co. | 698 | ||||||
| 40 | Mitel Networks Corp. ● | 374 | ||||||
| 472 | Mobileye N.V. ⌂●† | 23,336 | ||||||
| 197 | Nimble Storage, Inc. ● | 5,392 | ||||||
| 81 | ParkerVision, Inc. ● | 106 | ||||||
| 169 | Ubiquiti Networks, Inc. | 6,054 | ||||||
| 47,308 | ||||||||
| Telecommunication Services - 0.0% | ||||||||
| 10 | Shenandoah Telecommunications Co. | 296 | ||||||
| Transportation - 3.8% | ||||||||
| 36 | Celadon Group, Inc. | 703 | ||||||
| 163 | Landstar System, Inc. | 12,046 | ||||||
| 17 | Marten Transport Ltd. | 328 | ||||||
| 126 | Old Dominion Freight Line, Inc. ● | 9,149 | ||||||
| 5 | Park-Ohio Holdings Corp. | 270 | ||||||
| 20 | Spirit Airlines, Inc. ● | 1,433 | ||||||
| 440 | Swift Transportation Co. ● | 10,864 | ||||||
| 668 | Telogis, Inc. ⌂●† | 541 | ||||||
| 35,334 | ||||||||
| Utilities - 0.1% | ||||||||
| 5 | ALLETE, Inc. | 259 | ||||||
| 8 | Pattern Energy Group, Inc. | 217 | ||||||
| 15 | Spark Energy, Inc. ● | 246 | ||||||
| 722 | ||||||||
| Total Common Stocks | ||||||||
| ( Cost $761,809) | $ | 896,462 | ||||||
The accompanying notes are an integral part of these financial statements.
| 7 |
| The Hartford Small Company Fund |
| Schedule of Investments – (continued) |
| October 31, 2014 |
| (000’s Omitted) |
| Shares or Principal Amount | Market Value ╪ | |||||||||||
| Preferred Stocks - 1.7% | ||||||||||||
| Consumer Durables and Apparel - 0.3% | ||||||||||||
| 106 | Cloudera, Inc. ⌂●† | $ | 2,589 | |||||||||
| Pharmaceuticals, Biotechnology and Life Sciences - 0.0% | ||||||||||||
| 93 | Sancilio & Co., Inc. ⌂●† | 316 | ||||||||||
| Software and Services - 0.6% | ||||||||||||
| 870 | Apigee Corp. ⌂●† | 2,863 | ||||||||||
| 129 | Nutanix, Inc. ⌂●† | 1,558 | ||||||||||
| 98 | Veracode, Inc. ⌂●† | 1,629 | ||||||||||
| 6,050 | ||||||||||||
| Technology Hardware and Equipment - 0.2% | ||||||||||||
| 123 | Pure Storage, Inc. ⌂●† | 1,741 | ||||||||||
| Telecommunication Services - 0.2% | ||||||||||||
| 83 | DocuSign, Inc. ⌂●† | 1,406 | ||||||||||
| 1,406 | ||||||||||||
| Transportation - 0.4% | ||||||||||||
| 909 | Telogis, Inc. ⌂●† | 3,883 | ||||||||||
| Total Preferred Stocks | ||||||||||||
| (Cost $12,999) | $ | 15,985 | ||||||||||
| Exchange Traded Funds - 0.2% | ||||||||||||
| Other Investment Pools and Funds - 0.2% | ||||||||||||
| 12 | iShares Russell 2000 Growth ETF | $ | 1,708 | |||||||||
| Total Exchange Traded Funds | ||||||||||||
| (Cost $1,666) | $ | 1,708 | ||||||||||
| Total Long-Term Investments | ||||||||||||
| (Cost $776,474) | $ | 914,155 | ||||||||||
| Short-Term Investments - 1.3% | ||||||||||||
| Repurchase Agreements - 1.3% | ||||||||||||
| Bank of America Merrill Lynch TriParty Repurchase Agreement (maturing on 11/03/2014 in the amount of $34, collateralized by U.S. Treasury Note 1.50%, 2019, value of $35) |
||||||||||||
| $ | 34 | 0.08%, 10/31/2014 | $ | 34 | ||||||||
| Bank of America Merrill Lynch TriParty Repurchase Agreement (maturing on 11/03/2014 in the amount of $578, collateralized by GNMA 1.63% - 7.00%, 2031 - 2054, value of $589) |
||||||||||||
| 577 | 0.09%, 10/31/2014 | 577 | ||||||||||
| Bank of Montreal TriParty Repurchase Agreement (maturing on 11/03/2014 in the amount of $155, collateralized by U.S. Treasury Bond 2.88% - 5.25%, 2029 - 2043, U.S. Treasury Note 0.38% - 4.50%, 2015 - 2022, value of $158) |
||||||||||||
| 155 | 0.08%, 10/31/2014 | 155 | ||||||||||
| Bank of Montreal TriParty Repurchase Agreement (maturing on 11/03/2014 in the amount of $526, collateralized by FHLMC 2.00% - 5.50%, 2022 - 2034, FNMA 2.00% - 4.50%, 2024 - 2039, GNMA 3.00%, 2043, U.S. Treasury Note 4.63%, 2017, value of $536) |
||||||||||||
| 526 | 0.10%, 10/31/2014 | 526 | ||||||||||
| Barclays Capital TriParty Repurchase Agreement (maturing on 11/03/2014 in the amount of $1,982, collateralized by U.S. Treasury Bond 4.50% - 6.25%, 2023 - 2036, U.S. Treasury Note 1.63% - 2.13%, 2015 - 2019, value of $2,021) |
||||||||||||
| 1,982 | 0.08%, 10/31/2014 | 1,982 | ||||||||||
| Citigroup Global Markets, Inc. TriParty Repurchase Agreement (maturing on 11/03/2014 in the amount of $2,278, collateralized by U.S. Treasury Bill 0.02%, 2015, U.S. Treasury Bond 3.88% - 11.25%, 2015 - 2040, U.S. Treasury Note 2.00% - 3.38%, 2019 - 2021, value of $2,323) |
||||||||||||
| 2,278 | 0.09%, 10/31/2014 | 2,278 | ||||||||||
| Deutsche Bank Securities TriParty Repurchase Agreement (maturing on 11/03/2014 in the amount of $131, collateralized by U.S. Treasury Note 0.88%, 2017, value of $134) |
||||||||||||
| 131 | 0.13%, 10/31/2014 | 131 | ||||||||||
| RBS Securities, Inc. TriParty Repurchase Agreement (maturing on 11/03/2014 in the amount of $194, collateralized by U.S. Treasury Bond 3.63% - 5.00%, 2037 - 2043, U.S. Treasury Note 2.13%, 2020, value of $197) |
||||||||||||
| 194 | 0.07%, 10/31/2014 | 194 | ||||||||||
| Societe Generale TriParty Repurchase Agreement (maturing on 11/03/2014 in the amount of $2,039, collateralized by U.S. Treasury Bill 0.02%, 2015, U.S. Treasury Bond 3.75% - 11.25%, 2015 - 2043, U.S. Treasury Note 1.38% - 4.25%, 2015 - 2022, value of $2,080) |
||||||||||||
| 2,039 | 0.08%, 10/31/2014 | 2,039 | ||||||||||
| TD Securities TriParty Repurchase Agreement (maturing on 11/03/2014 in the amount of $3,952, collateralized by FHLMC 3.00% - 4.00%, 2026 - 2044, FNMA 2.50% - 5.00%, 2025 - 2044, U.S. Treasury Bond 3.50% - 6.50%, 2026 - 2041, U.S. Treasury Note 1.75% - 2.88%, 2018 - 2019, value of $4,031) |
||||||||||||
| 3,952 | 0.10%, 10/31/2014 | 3,952 | ||||||||||
| 11,868 | ||||||||||||
| Total Short-Term Investments | ||||||||||||
| (Cost $11,868) | $ | 11,868 | ||||||||||
| Total Investments | ||||||||||||
| (Cost $788,342) ▲ | 99.5 | % | $ | 926,023 | ||||||||
| Other Assets and Liabilities | 0.5 | % | 4,534 | |||||||||
| Total Net Assets | 100.0 | % | $ | 930,557 | ||||||||
The accompanying notes are an integral part of these financial statements.
| 8 |
| The Hartford Small Company Fund |
| Schedule of Investments – (continued) |
| October 31, 2014 |
| (000’s Omitted) |
| Note: | Percentage of investments as shown is the ratio of the total market value to total net assets. |
Prices of foreign equities that are principally traded on certain foreign markets may be adjusted daily pursuant to a fair value pricing service approved by the Board of Directors in order to reflect an adjustment for factors occurring after the close of certain foreign markets but before the close of the New York Stock Exchange.
The Fund may refer to any one or more of the industry classifications used by one or more widely recognized market indices, ratings group indices and/or as defined by Fund management. Industry classifications may not be identical across all security types.
Other than the industry classifications "Other Investment Pools and Funds" and "Exchange Traded Funds," equity industry classifications used in this report are the Global Industry Classification Standard, which was developed by and is the exclusive property and service mark of MSCI, Inc. and Standard & Poor’s.
For Fund compliance purposes, the Fund may not use the same classification system shown in this report as these classifications are used for reporting ease.
| ▲ | At October 31, 2014, the cost of securities for federal income tax purposes was $790,997 and the aggregate gross unrealized appreciation and depreciation based on that cost were: |
| Unrealized Appreciation | $ | 162,828 | ||
| Unrealized Depreciation | (27,802 | ) | ||
| Net Unrealized Appreciation | $ | 135,026 |
| † | These securities were valued in good faith at fair value as determined under policies and procedures established by and under the supervision of the Board of Directors. At October 31, 2014, the aggregate fair value of these securities was $48,828, which represents 5.2% of total net assets. This amount excludes securities that are principally traded in certain foreign markets and whose prices are adjusted pursuant to a third party pricing service methodology approved by the Board of Directors. |
| ● | Non-income producing. |
| ⌂ | The following securities are considered illiquid. Illiquid securities are often purchased in private placement transactions, are often not registered under the Securities Act of 1933, as amended, and may have contractual restrictions on resale. A security may also be considered illiquid if the security lacks a readily available market or if its valuation has not changed for a certain period of time. |
| Period Acquired | Shares/ Par | Security | Cost Basis | |||||||
| 08/2011 | 3,137 | Allstar Co. | $ | 1,364 | ||||||
| 04/2014 | 870 | Apigee Corp. Preferred | $ | 2,532 | ||||||
| 02/2014 | 106 | Cloudera, Inc. Preferred | $ | 1,545 | ||||||
| 02/2014 | 83 | DocuSign, Inc. Preferred | $ | 1,094 | ||||||
| 08/2013 | 472 | Mobileye N.V. | $ | 3,293 | ||||||
| 08/2014 | 129 | Nutanix, Inc. Preferred | $ | 1,730 | ||||||
| 10/2014 | 83 | Platform Specialty Products Corp. PIPE | $ | 2,136 | ||||||
| 04/2014 | 123 | Pure Storage, Inc. Preferred | $ | 1,934 | ||||||
| 05/2014 | 93 | Sancilio & Co., Inc. Preferred | $ | 351 | ||||||
| 09/2013 | 668 | Telogis, Inc. | $ | 1,323 | ||||||
| 09/2013 | 909 | Telogis, Inc. Preferred | $ | 2,002 | ||||||
| 11/2013 | 66 | Tory Burch LLC | $ | 5,138 | ||||||
| 08/2014 | 98 | Veracode, Inc. Preferred | $ | 1,810 | ||||||
At October 31, 2014, the aggregate value of these securities was $48,828, which represents 5.2% of total net assets.
| ╪ | See Significant Accounting Policies of accompanying Notes to Financial Statements regarding valuation of securities. |
| GLOSSARY: (abbreviations used in preceding Schedule of Investments) | |
| Other Abbreviations: | |
| ADR | American Depositary Receipt |
| ETF | Exchange Traded Fund |
| FHLMC | Federal Home Loan Mortgage Corp. |
| FNMA | Federal National Mortgage Association |
| GNMA | Government National Mortgage Association |
| PIPE | Private Investment in Public Equity |
| REIT | Real Estate Investment Trust |
The accompanying notes are an integral part of these financial statements.
| 9 |
| The Hartford Small Company Fund |
| Schedule of Investments – (continued) |
| October 31, 2014 |
| (000’s Omitted) |
Investment Valuation Hierarchy Level Summary
October 31, 2014
| Total | Level 1 ♦ | Level 2 ♦ | Level 3 | |||||||||||||
| Assets: | ||||||||||||||||
| Common Stocks ‡ | $ | 896,462 | $ | 856,177 | $ | 7,442 | $ | 32,843 | ||||||||
| Exchange Traded Funds | 1,708 | 1,708 | – | – | ||||||||||||
| Preferred Stocks | 15,985 | – | – | 15,985 | ||||||||||||
| Short-Term Investments | 11,868 | – | 11,868 | – | ||||||||||||
| Total | $ | 926,023 | $ | 857,885 | $ | 19,310 | $ | 48,828 | ||||||||
| ♦ | For the year ended October 31, 2014, there were no transfers between Level 1 and Level 2. |
| ‡ | The Fund has all or primarily all of the equity securities categorized in a particular level. Refer to the Schedule of Investments for further industry breakout. |
Following is a reconciliation of Level 3 assets for which significant unobservable inputs were used to determine fair value:
Balance
as | Realized | Change in | Net | Purchases | Sales | Transfers | Transfers | Balance
as | ||||||||||||||||||||||||||||
| Assets: | ||||||||||||||||||||||||||||||||||||
| Common Stocks | $ | 9,923 | $ | 522 | $ | 16,259 | † | $ | — | $ | 7,345 | $ | (1,566 | ) | $ | 360 | $ | — | $ | 32,843 | ||||||||||||||||
| Preferred Stocks | 1,801 | — | 3,186 | ‡ | — | 10,998 | — | — | — | 15,985 | ||||||||||||||||||||||||||
| Total | $ | 11,724 | $ | 522 | $ | 19,445 | $ | — | $ | 18,343 | $ | (1,566 | ) | $ | 360 | $ | — | $ | 48,828 | |||||||||||||||||
| * | Investments are transferred into and out of Level 3 for a variety of reasons including, but not limited to: |
1) Investments where trading has been halted (transfer into Level 3) or investments where trading has resumed (transfer out of Level 3).
2) Broker quoted investments (transfer into Level 3) or quoted prices in active markets (transfer out of Level 3).
3) Investments that have certain restrictions on trading (transfer into Level 3) or investments where trading restrictions have expired (transfer out of Level 3).
| † | Change in unrealized appreciation (depreciation) in the current period relating to assets still held at October 31, 2014 was $16,137. |
| ‡ | Change in unrealized appreciation (depreciation) in the current period relating to assets still held at October 31, 2014 was $3,186. |
| Note: | For purposes of reporting transfers between different hierarchy levels, both transfers in and out of each level, as applicable, are shown as if they occurred at the beginning of the period. |
The accompanying notes are an integral part of these financial statements.
| 10 |
| The Hartford Small Company Fund |
| Statement of Assets and Liabilities |
| October 31, 2014 |
| (000’s Omitted) |
| Assets: | ||||
| Investments in securities, at market value (cost $788,342) | $ | 926,023 | ||
| Cash | 1 | |||
| Foreign currency on deposit with custodian (cost $—) | — | |||
| Receivables: | ||||
| Investment securities sold | 15,387 | |||
| Fund shares sold | 3,133 | |||
| Dividends and interest | 46 | |||
| Other assets | 65 | |||
| Total assets | 944,655 | |||
| Liabilities: | ||||
| Payables: | ||||
| Investment securities purchased | 12,787 | |||
| Fund shares redeemed | 972 | |||
| Investment management fees | 137 | |||
| Administrative fees | 4 | |||
| Distribution fees | 34 | |||
| Accrued expenses | 164 | |||
| Total liabilities | 14,098 | |||
| Net assets | $ | 930,557 | ||
| Summary of Net Assets: | ||||
| Capital stock and paid-in-capital | $ | 650,305 | ||
| Distributions in excess of net investment income | (6 | ) | ||
| Accumulated net realized gain | 142,577 | |||
| Unrealized appreciation of investments and the translation of assets and liabilities denominated in foreign currency | 137,681 | |||
| Net assets | $ | 930,557 | ||
| Shares authorized | 500,000 | |||
| Par value | $ | 0.001 | ||
| Class A: Net asset value per share/Maximum offering price per share | $24.83/$26.28 | |||
| Shares outstanding | 14,297 | |||
| Net assets | $ | 355,056 | ||
| Class B: Net asset value per share | $ | 20.40 | ||
| Shares outstanding | 232 | |||
| Net assets | $ | 4,730 | ||
| Class C: Net asset value per share | $ | 20.36 | ||
| Shares outstanding | 1,884 | |||
| Net assets | $ | 38,351 | ||
| Class I: Net asset value per share | $ | 25.51 | ||
| Shares outstanding | 2,369 | |||
| Net assets | $ | 60,425 | ||
| Class R3: Net asset value per share | $ | 26.39 | ||
| Shares outstanding | 2,278 | |||
| Net assets | $ | 60,124 | ||
| Class R4: Net asset value per share | $ | 27.21 | ||
| Shares outstanding | 2,438 | |||
| Net assets | $ | 66,353 | ||
| Class R5: Net asset value per share | $ | 27.95 | ||
| Shares outstanding | 271 | |||
| Net assets | $ | 7,585 | ||
| Class Y: Net asset value per share | $ | 28.27 | ||
| Shares outstanding | 11,955 | |||
| Net assets | $ | 337,933 |
The accompanying notes are an integral part of these financial statements.
| 11 |
| The Hartford Small Company Fund |
| Statement of Operations |
| For the Year Ended October 31, 2014 |
| (000’s Omitted) |
| Investment Income: | ||||
| Dividends | $ | 3,058 | ||
| Interest | 6 | |||
| Less: Foreign tax withheld | (20 | ) | ||
| Total investment income | 3,044 | |||
| Expenses: | ||||
| Investment management fees | 7,228 | |||
| Administrative services fees | ||||
| Class R3 | 117 | |||
| Class R4 | 104 | |||
| Class R5 | 8 | |||
| Transfer agent fees | ||||
| Class A | 857 | |||
| Class B | 24 | |||
| Class C | 79 | |||
| Class I | 119 | |||
| Class R3 | 3 | |||
| Class R4 | 1 | |||
| Class R5 | 2 | |||
| Class Y | 6 | |||
| Distribution fees | ||||
| Class A | 861 | |||
| Class B | 55 | |||
| Class C | 388 | |||
| Class R3 | 293 | |||
| Class R4 | 174 | |||
| Custodian fees | 10 | |||
| Accounting services fees | 128 | |||
| Registration and filing fees | 129 | |||
| Board of Directors' fees | 25 | |||
| Audit fees | 17 | |||
| Other expenses | 188 | |||
| Total expenses (before waivers and fees paid indirectly) | 10,816 | |||
| Expense waivers | (2 | ) | ||
| Transfer agent fee waivers | (8 | ) | ||
| Commission recapture | (56 | ) | ||
| Total waivers and fees paid indirectly | (66 | ) | ||
| Total expenses, net | 10,750 | |||
| Net Investment Loss | (7,706 | ) | ||
| Net Realized Gain on Investments, Other Financial Instruments and Foreign Currency Transactions: | ||||
| Net realized gain on investments | 152,483 | |||
| Net realized gain on futures contracts | 33 | |||
| Net realized gain on foreign currency contracts | 48 | |||
| Net realized loss on other foreign currency transactions | (47 | ) | ||
| Net Realized Gain on Investments, Other Financial Instruments and Foreign Currency Transactions | 152,517 | |||
| Net Changes in Unrealized Depreciation of Investments and Foreign Currency Transactions: | ||||
| Net unrealized depreciation of investments | (30,164 | ) | ||
| Net unrealized appreciation of translation of other assets and liabilities in foreign currencies | — | |||
| Net Changes in Unrealized Depreciation of Investments and Foreign Currency Transactions | (30,164 | ) | ||
| Net Gain on Investments, Other Financial Instruments and Foreign Currency Transactions | 122,353 | |||
| Net Increase in Net Assets Resulting from Operations | $ | 114,647 |
The accompanying notes are an integral part of these financial statements.
| 12 |
| The Hartford Small Company Fund |
| Statement of Changes in Net Assets |
| (000’s Omitted) |
| For the Year Ended October 31, 2014 | For the Year Ended October 31, 2013 | |||||||
| Operations: | ||||||||
| Net investment loss | $ | (7,706 | ) | $ | (4,225 | ) | ||
| Net realized gain on investments, other financial instruments and foreign currency transactions | 152,517 | 106,691 | ||||||
| Net unrealized appreciation (depreciation) of investments and foreign currency transactions | (30,164 | ) | 126,191 | |||||
| Net Increase in Net Assets Resulting from Operations | 114,647 | 228,657 | ||||||
| Distributions to Shareholders: | ||||||||
| From net realized gain on investments | ||||||||
| Class A | (36,374 | ) | (18,096 | ) | ||||
| Class B | (767 | ) | (460 | ) | ||||
| Class C | (5,032 | ) | (2,518 | ) | ||||
| Class I | (4,447 | ) | (1,663 | ) | ||||
| Class R3 | (6,039 | ) | (3,069 | ) | ||||
| Class R4 | (6,817 | ) | (3,508 | ) | ||||
| Class R5 | (867 | ) | (540 | ) | ||||
| Class Y | (32,103 | ) | (15,031 | ) | ||||
| Total distributions | (92,446 | ) | (44,885 | ) | ||||
| Capital Share Transactions: | ||||||||
| Class A | 28,171 | (16,681 | ) | |||||
| Class B | (1,234 | ) | (1,224 | ) | ||||
| Class C | 325 | (1,349 | ) | |||||
| Class I | 20,218 | 6,921 | ||||||
| Class R3 | 1,124 | (2,403 | ) | |||||
| Class R4 | (2,840 | ) | (3,360 | ) | ||||
| Class R5 | (933 | ) | (2,337 | ) | ||||
| Class Y | 6,213 | 6,509 | ||||||
| Net increase (decrease) from capital share transactions | 51,044 | (13,924 | ) | |||||
| Net Increase in Net Assets | 73,245 | 169,848 | ||||||
| Net Assets: | ||||||||
| Beginning of period | 857,312 | 687,464 | ||||||
| End of period | $ | 930,557 | $ | 857,312 | ||||
| Undistributed (distributions in excess of) net investment income | $ | (6 | ) | $ | (112 | ) | ||
The accompanying notes are an integral part of these financial statements.
| 13 |
| The Hartford Small Company Fund |
| Notes to Financial Statements |
| October 31, 2014 |
| (000’s Omitted) |
Organization:
The Hartford Mutual Funds, Inc. (“Company”) is an open-end management investment company comprised of forty-two portfolios. Financial statements for The Hartford Small Company Fund (the "Fund"), a series of the Company, are included in this report.
The Company is organized under the laws of the State of Maryland and is registered with the Securities and Exchange Commission (“SEC”) under the Investment Company Act of 1940, as amended (“1940 Act”). The Fund's portfolio managers are Steven C. Angeli (87%), Mammen Chally (10%) and Jamie A. Rome (3%). The portfolio management team also includes Mario E. Abularach and Stephen Mortimer. The Fund is a diversified open-end management investment company.
Class A shares are sold with a front-end sales charge of up to 5.50%. Class B shares were sold with a contingent deferred sales charge which is assessed on the lesser of the per share net asset value (“NAV”) of the shares at the time of redemption or the original purchase price, and declines from up to 5.00% to zero depending on the period of time the shares are held (see note below regarding the closing of Class B shares). Class C shares are sold with a contingent deferred sales charge of up to 1.00% on shares redeemed within twelve months of purchase. Class I shares are sold without sales charges to certain eligible investors primarily through advisory fee-based wrap programs. Class R3, R4 and R5 shares, which are offered to employer-sponsored retirement plans, and Class Y shares, which are sold to certain eligible institutional investors, are sold without a sales charge. All classes of shares have identical voting, redemption, dividend, liquidation and other rights and the same terms and conditions, with the exceptions that each class may have different expenses, which may affect performance, and that Class B shares automatically convert to Class A shares after 8 years.
No new or additional investments are allowed in Class B shares of the Fund (including investments through any systematic investment plan). Existing shareholders of Class B shares may continue to hold their Class B shares, exchange their Class B shares for Class B shares of another Hartford Fund (as permitted by existing exchange privileges), or redeem their Class B shares as described in the Fund’s prospectus. Reinstatement privileges with respect to Class B shares are set forth in the Fund's prospectus. For investors electing to reinvest capital gains and dividends, any such capital gains or dividends on Class B shares will continue to be reinvested in Class B shares of the Fund. All Class B share attributes, including the 12b-1 fee, contingent deferred sales charge schedule, and conversion to Class A shares, remain unchanged.
Significant Accounting Policies:
The following is a summary of significant accounting policies of the Fund in the preparation of its financial statements, which are in accordance with United States generally accepted accounting principles (“U.S. GAAP”). The preparation of financial statements in accordance with U.S. GAAP may require management to make estimates and assumptions that affect the reported amounts of assets and liabilities and disclosure of contingent assets and liabilities at the date of the financial statements and the reported amounts of increases and decreases in net assets from operations during the reporting period. Actual results could differ from those estimates.
Determination of Net Asset Value – The NAV of each class of the Fund's shares is determined as of the close of regular trading (normally 4:00 p.m. Eastern Time) (the “NYSE Close”) on each day that the New York Stock Exchange (the “Exchange”) is open (“Valuation Date”). Information that becomes known to the Fund after the NAV has been calculated on a particular day will not generally be used to retroactively adjust the NAV determined earlier that day.
Investment Valuation and Fair Value Measurements – For purposes of calculating the NAV, portfolio investments and other assets held by the Fund's portfolio for which market quotes are readily available are valued at market value. Market value is generally determined on the basis of last reported sales prices or official close price. If no sales are reported, market value is based on quotes obtained from a quotation reporting system, established market makers, or independent pricing services. If market prices are not readily available or are deemed unreliable, the Fund will use the fair value of the investment as determined in good faith under policies and procedures established by and under the supervision of the Company's Board of Directors. Market quotes are considered not readily available where there is an absence of current or reliable market-based data (e.g., trade information or indicative market quotes), including where events occur after the close of the relevant market, but prior to the NYSE Close, that materially affect the values of the Fund's portfolio investments or assets. In addition, market quotes are considered not readily available when, due to extraordinary circumstances, the exchanges or markets on which the investments trade do not open for trading for the entire day and no other market prices are available. In addition, prices of foreign equities that are principally traded on certain foreign markets may
| 14 |
| The Hartford Small Company Fund |
| Notes to Financial Statements – (continued) |
| October 31, 2014 |
| (000’s Omitted) |
be adjusted daily pursuant to a fair value pricing service approved by the Board of Directors in order to reflect an adjustment for the factors occurring after the close of certain foreign markets but before the NYSE Close. Investments that are primarily traded on foreign markets may trade on days that are not business days of the Fund. The value of the foreign investments in which the Fund invests may change on days when a shareholder will not be able to purchase or redeem shares of the Fund. Fair value pricing is subjective in nature and the use of fair value pricing by the Fund may cause the NAV of its shares to differ significantly from the NAV that would have been calculated using market prices at the close of the exchange on which a portfolio investment is primarily traded. There can be no assurance that the Fund could obtain the fair market value assigned to an investment if the Fund were to sell the investment at approximately the time at which the Fund determines its NAV.
Exchange traded options, futures and options on futures are valued at the settlement price or last trade price determined by the relevant exchange as of the NYSE Close. If the last trade price for exchange traded options does not fall between the bid and ask prices, the value will be the mean of the bid and ask prices as of the NYSE Close. If a last trade price is not available, the value will be the mean of the bid and ask prices as of the NYSE Close. If a mean of the bid and ask prices cannot be calculated for the day, the value will be the bid price as of the NYSE Close. In the case of over-the-counter ("OTC") options and such instruments that do not trade on an exchange, values may be supplied by a pricing service using a formula or other objective method that may take into consideration the style, direction, expiration, strike price, notional value and volatility or other special adjustments.
Investments valued in currencies other than U.S. dollars are converted to U.S. dollars using exchange rates obtained from independent pricing services for calculation of the NAV. As a result, the NAV of the Fund’s shares may be affected by changes in the value of currencies in relation to the U.S. dollar. The value of investments traded in markets outside the United States or denominated in currencies other than the U.S. dollar may be affected significantly on a day that the NYSE is closed and the market value may change on days when an investor is not able to purchase, redeem or exchange shares of the Fund.
Foreign currency contracts represent agreements to exchange currencies on specific future dates at predetermined rates. Foreign currency contracts are valued using foreign currency exchange rates and forward rates as provided by an independent pricing service on the Valuation Date.
Financial instruments for which prices are not available from an independent pricing service may be valued using market quotations obtained from one or more dealers that make markets in the respective financial instrument in accordance with procedures established by the Company's Board of Directors.
U.S. GAAP defines fair value as the price that the Fund would receive to sell an asset or pay to transfer a liability in an orderly transaction between market participants. The U.S. GAAP fair value measurement standards require disclosure of a fair value hierarchy for each major category of assets and liabilities. Various inputs are used in determining the fair value of the Fund’s investments. These inputs are summarized into three broad hierarchy levels. This hierarchy is based on whether the valuation inputs are observable or unobservable. These levels are:
Level 1 – Quoted prices in active markets for identical investments. Level 1 may include exchange traded instruments, such as domestic equities, some foreign equities, options, futures, mutual funds, exchange traded funds, rights and warrants.
Level 2 – Observable inputs other than Level 1 prices, such as quoted prices for similar investments; quoted prices in markets that are not active; or other inputs that are observable or can be corroborated by observable market data. Level 2 may include debt investments that are traded less frequently than exchange traded instruments and which are valued using independent pricing services; foreign equities, which are principally traded on certain foreign markets and are adjusted daily pursuant to a fair value pricing service in order to reflect an adjustment for the factors occurring after the close of certain foreign markets but before the NYSE Close; senior floating rate interests, which are valued using an aggregate of dealer bids; short-term investments, which are valued at amortized cost; and swaps, which are valued based upon the terms of each swap contract.
Level 3 – Significant unobservable inputs that are supported by limited or no market activity. Level 3 may include financial instruments whose values are determined using indicative market quotes or require significant management judgment or estimation. These unobservable valuation inputs may include estimates for current yields, maturity/duration, prepayment speed, and indicative market quotes for comparable investments along with other assumptions relating to credit quality, collateral value,
| 15 |
| The Hartford Small Company Fund |
| Notes to Financial Statements – (continued) |
| October 31, 2014 |
| (000’s Omitted) |
complexity of the investment structure, general market conditions and liquidity. This category may include investments where trading has been halted or there are certain restrictions on trading. While these investments are priced using unobservable inputs, the valuation of these investments reflects the best available data and management believes the prices are a reasonable representation of exit price. For more information on specific valuation techniques and unobservable inputs, please see the following table titled "Quantitative Information about Level 3 Fair Value Measurements."
The Board of Directors of the Company generally reviews and approves the “Procedures for Valuation of Portfolio Securities” at least once a year. These procedures define how investments are to be valued, including the formation and activities of a Valuation Committee. The Valuation Committee is responsible for determining in good faith the fair value of investments when the value cannot be obtained from primary pricing services or alternative sources or if the valuation of an investment as provided by the primary pricing service or alternative source is believed not to reflect the investment’s fair value as of the Valuation Date. Voting members of the Valuation Committee include the Fund’s Treasurer or designee and a Vice President of the investment manager or designee. An Assistant Vice President of the Fund with legal expertise or designee is also included on the Valuation Committee as a non-voting advisory member. In addition, the Fund’s Chief Compliance Officer shall designate a member of the compliance group to attend Valuation Committee meetings as a non-voting resource, to monitor for and provide guidance with respect to compliance with these procedures. Two members of the Valuation Committee or their designees, representing different departments, shall constitute a quorum for purposes of permitting the Valuation Committee to take action. The Valuation Committee will consider all relevant factors in determining an investment’s fair value, and may seek the advice of the Fund’s sub-adviser, knowledgeable brokers, and legal counsel in making such determination. The Valuation Committee reports to the Audit Committee of the Company’s Board of Directors. The Audit Committee receives quarterly written reports which include details of all fair-valued investments, including the reason for the fair valuation, and an indication, when possible, of the accuracy of the valuation by disclosing the next available reliable public price quotation or the disposition price of such investments (the “look-back” test). The Board of Directors then must consider for ratification all of the fair value determinations made during the previous quarter.
Valuation levels are not necessarily indicative of the risk associated with investing in such investments. Individual investments within any of the above mentioned asset classes may be assigned a different hierarchical level than those presented above, as individual circumstances dictate.
For additional information, refer to the Investment Valuation Hierarchy Level Summary and the Level 3 roll-forward reconciliation, if applicable, which follow the Schedule of Investments.
| 16 |
| The Hartford Small Company Fund |
| Notes to Financial Statements – (continued) |
| October 31, 2014 |
| (000’s Omitted) |
Quantitative Information about Level 3 Fair Value Measurements:
| Security Type/Valuation Technique | Unobservable Input * | Input
Value(s) Range (Weighted Average) ‡ | Fair
Value at October 31, 2014 | |||||
| Assets: | ||||||||
| Common Stocks | ||||||||
| Intrinsic value Δ | Parity to underlying security | $24.06 - $49.47 ($47.45) | 25,344 | |||||
| Model Δ | Enterprise Value/Last Twelve Months EBITDA | 6.31x to 8.23x | 2,662 | |||||
| Model Δ | Enterprise Value/Estimated 2014 EBITDA | 11.42x to 18.73x | 4,296 | |||||
| Model Δ | Enterprise Value/Estimated 2014 Revenue ♠ | 1.60x to 5.40x | 541 | |||||
| Preferred Stocks | ||||||||
| Cost Δ | Recent trade price | $3.40 - $16.62 ($13.65) | 5,244 | |||||
| Date | 4/16/2014 - 8/26/2014 | |||||||
| Model Δ | Enterprise Value/Estimated 2014 Revenue ♠ | 1.60x to 5.40x | 3,883 | |||||
| Model Δ | Enterprise Value/Estimated 2014 Revenue | 8.20x to 14.30x | 2,863 | |||||
| Model Δ | Enterprise Value/Estimated 2015 Revenue | 6.18x to 14.52x | 1,406 | |||||
| Model Δ | Enterprise Value/Estimated 2016 Revenue | 6.50x to 10.40x | 2,589 | |||||
| Total | $ | 48,828 | ||||||
| * | Significant changes to any unobservable inputs may result in a significant change to the fair value. |
| ‡ | Unless otherwise noted, inputs were weighted based on the fair value of the investments included in the range. |
| Δ | Includes illiquidity discount of 10%. |
| ♠ | The Option Pricing Method ("OPM") is used to allocate enterprise values between multiple tiers of equity. The use of the OPM represents a change in methodology from prior year for this investment. Inputs for the OPM include: |
Volatility - 50.0%
Term to Liquidity Event - 1.0 years
Risk-free rate - 0.11%
Investment Transactions and Investment Income – Investment transactions are recorded as of the trade date (the date the order to buy or sell is executed) for financial reporting purposes. Investments purchased or sold on a when-issued or delayed-delivery basis may be settled a month or more after the trade date. Realized gains and losses are determined on the basis of identified cost.
Dividend income from domestic securities is accrued on the ex-dividend date. In general, dividend income from foreign securities is recorded on the ex-date; however, dividend notifications in certain foreign jurisdictions may not be available in a timely manner and as a result, the Fund will record the dividend as soon as the relevant details (i.e., rate per share, payment date, shareholders of record, etc.) are publicly available. Interest income, including amortization of premium, accretion of discounts and additional principal received in-kind in lieu of cash, is accrued on a daily basis.
Foreign Currency Transactions – Assets and liabilities denominated in currencies other than U.S. dollars are translated into U.S. dollars at the exchange rates in effect on the valuation date. Purchases and sales of investments, income and expenses are translated into U.S. dollars at the exchange rates on the dates of such transactions.
The Fund does not isolate that portion of portfolio investment valuation resulting from fluctuations in the foreign currency exchange rates from the fluctuations arising from changes in the market prices of investments held. Exchange rate fluctuations are included with the net realized and unrealized gain or loss on investments in the accompanying financial statements.
Net realized foreign exchange gains or losses arise from sales of foreign currencies and the difference between asset and liability amounts initially stated in foreign currencies and the U.S. dollar value of the amounts actually received or paid. Net unrealized foreign exchange gains or losses arise from changes in the value of other assets and liabilities at the end of the reporting period, resulting from changes in the exchange rates.
Joint Trading Account – The Fund may invest cash balances into a joint trading account that may be invested in one or more repurchase agreements.
Fund Share Valuation and Dividend Distributions to Shareholders – Orders for the Fund’s shares are executed in accordance with the investment instructions of the shareholders. The NAV of the Fund’s shares is determined as of the close of business on each business day of the Exchange. The NAV is determined separately for each class of shares of the Fund by dividing the Fund’s net
| 17 |
| The Hartford Small Company Fund |
| Notes to Financial Statements – (continued) |
| October 31, 2014 |
| (000’s Omitted) |
assets attributable to that class by the number of shares of the class outstanding. Each class of shares offered by the Fund has equal rights as to assets and voting privileges (except that shareholders of a class have exclusive voting rights regarding any matter relating solely to that class of shares). Income and non-class specific expenses are allocated daily to each class on the basis of the relative net assets of the class. Realized and unrealized gains and losses are allocated daily based on the relative net assets of each class of shares of the Fund.
Orders for the purchase of the Fund’s shares received prior to the close of the Exchange on any day the Exchange is open for business are priced at the NAV determined as of the close of the Exchange. Orders received after the close of the Exchange, or on a day on which the Exchange and/or the Fund is not open for business, are priced at the next determined NAV.
Dividends are declared pursuant to a policy adopted by the Company's Board of Directors based upon the investment performance of the Fund. The policy of the Fund is to pay dividends from net investment income and realized gains, if any, at least once a year.
Net investment income, dividends and distributions from net realized gains and capital are determined in accordance with federal income tax regulations, which may differ from U.S. GAAP with respect to character and timing (see Federal Income Taxes: Distributions and Components of Distributable Earnings and Reclassification of Capital Accounts).
Securities and Other Investments:
Repurchase Agreements – A repurchase agreement is an agreement by which a counterparty agrees to sell an investment and agrees to repurchase the investment sold from the buyer at a mutually agreed upon time and price. During the period of the repurchase agreement, the counterparty will deposit cash and or securities in a third party custodial account to serve as collateral. At the time the Fund enters into a repurchase agreement, the value of the underlying collateral, including accrued interest, will be equal to or exceed the value of the repurchase agreement. Repurchase agreements expose the Fund to counterparty risk - that is, the risk that the counterparty will not fulfill its obligations. To minimize counterparty risk, the investments that serve to collateralize the repurchase agreement are held by the Fund’s custodian in book entry or physical form in the custodial account of the Fund or in a third party custodial account. Repurchase agreements are valued at cost plus accrued interest, which approximates fair value. Repurchase agreements have master netting arrangements which allow the Fund to offset amounts owed to a counterparty with amounts owed by the counterparty, including any collateral. Upon an event of default under a master repurchase agreement, the non-defaulting party may close out all transactions traded under such agreement and net amounts owed under each transaction to one net amount payable by one party to the other. Absent an event of default, the master repurchase agreement does not result in an offset of reported amounts of assets and liabilities in the Statement of Assets and Liabilities across transactions between the Fund and the applicable counterparty. The Fund, as shown on the Schedule of Investments, had outstanding repurchase agreements and related collateral as of October 31, 2014.
Illiquid and Restricted Investments – The Fund is permitted to invest up to 15% of its net assets in illiquid investments. Illiquid investments are those that may not be sold or disposed of in the ordinary course of business within seven days, at approximately the price used to determine the Fund’s NAV. The Fund may not be able to sell illiquid investments when its sub-adviser considers it desirable to do so or may have to sell such investments at a price that is lower than the price that could be obtained if the investments were more liquid. A sale of illiquid investments may require more time and may result in higher dealer discounts and other selling expenses than does the sale of those that are liquid. Illiquid investments also may be more difficult to value due to the unavailability of reliable market quotations for such investments, and an investment in them may have an adverse impact on the Fund’s NAV. The Fund may also purchase certain restricted investments that can only be resold to certain qualified investors and may be determined to be liquid pursuant to policies and guidelines established by the Company's Board of Directors. The Fund, as shown on the Schedule of Investments, had illiquid or restricted investments as of October 31, 2014.
Investments Purchased on a When-Issued or Delayed-Delivery Basis – Delivery and payment for investments that have been purchased by the Fund on a forward commitment, or when-issued or delayed-delivery basis, take place beyond the customary settlement period. The Fund may dispose of or renegotiate a delayed-delivery transaction after it is entered into, and may sell delayed-delivery investments before they are delivered, which may result in a realized gain or loss. During this period, such investments are subject to market fluctuations, and the Fund identifies investments segregated in its records with a value at least equal to the amount of the commitment. The Fund had no when-issued or delayed-delivery investments as of October 31, 2014.
| 18 |
| The Hartford Small Company Fund |
| Notes to Financial Statements – (continued) |
| October 31, 2014 |
| (000’s Omitted) |
Financial Derivative Instruments:
The following disclosures contain information on how and why the Fund uses derivative instruments, the credit-risk-related contingent features in certain derivative instruments and how derivative instruments affect the Fund’s financial position and results of operations. The location and fair value amounts of these instruments on the Statement of Assets and Liabilities and the realized gains and losses and changes in unrealized gains and losses on the Statement of Operations, each categorized by type of derivative contract, are included in the following Additional Derivative Instrument Information footnote. The derivative instruments outstanding as of year-end are disclosed in the notes to the Schedule of Investments, if applicable. The amounts of realized gains and losses and changes in unrealized gains and losses on derivative instruments during the year are disclosed in the Statement of Operations.
Foreign Currency Contracts – The Fund may enter into foreign currency contracts that obligate the Fund to purchase or sell currencies at specified future dates. Foreign currency contracts are used to hedge the currency exposure associated with some or all of the Fund’s investments and/or as part of an investment strategy. Foreign currency contracts are marked to market daily and the change in value is recorded by the Fund as an unrealized gain or loss. The Fund will record a realized gain or loss when the foreign currency contract is settled.
Foreign currency contracts involve elements of market risk in excess of the amounts reflected in the Statement of Assets and Liabilities. In addition, risks may arise upon entering into these contracts from the potential inability of the counterparties to meet the terms of the contracts and from unanticipated movements in the value of the foreign currencies relative to the U.S. dollar. The Fund had no outstanding foreign currency contracts as of October 31, 2014.
Futures Contracts – The Fund may enter into futures contracts. A futures contract is an agreement between two parties to buy or sell an asset at a set price on a future date. The Fund uses futures contracts to manage or obtain exposure to the investment markets, commodities, or movements in interest rates and currency values. The primary risks associated with the use of futures contracts are the imperfect correlation between the change in market value of the investments held by the Fund and the prices of futures contracts and the possibility of an illiquid market. Upon entering into a futures contract, the Fund is required to deposit with a futures commission merchant (“FCM”) an amount of cash or U.S. Government or Agency Obligations in accordance with the initial margin requirements of the broker or exchange. Futures contracts are marked to market daily at the most recent settlement price reported by an exchange on which, over time, they are traded most extensively, and an appropriate payable or receivable for the change in value (“variation margin”) is recorded by the Fund. Gains or losses are recognized but not considered realized until the contracts expire or are closed. Futures contracts involve, to varying degrees, risk of loss in excess of the variation margin disclosed on the Statement of Assets and Liabilities; however, the Fund seeks to reduce this risk through the use of an FCM. The Fund had no outstanding futures contracts as of October 31, 2014.
Additional Derivative Instrument Information:
The volume of derivative activity was minimal during the year ended October 31, 2014.
The Effect of Derivative Instruments on the Statement of Operations for the year ended October 31, 2014:
| Risk Exposure Category | ||||||||||||||||||||||||||||
Interest
Rate | Foreign | Credit | Equity | Commodity | Other | Total | ||||||||||||||||||||||
| Realized Gain on Derivatives Recognized as a Result of Operations: | ||||||||||||||||||||||||||||
| Net realized gain on futures contracts | $ | — | $ | — | $ | — | $ | 33 | $ | — | $ | — | $ | 33 | ||||||||||||||
| Net realized gain on foreign currency contracts | — | 48 | — | — | — | — | 48 | |||||||||||||||||||||
| Total | $ | — | $ | 48 | $ | — | $ | 33 | $ | — | $ | — | $ | 81 | ||||||||||||||
| 19 |
| The Hartford Small Company Fund |
| Notes to Financial Statements – (continued) |
| October 31, 2014 |
| (000’s Omitted) |
Principal Risks:
The Fund may be exposed to counterparty risk, or the risk that an institution or other entity with which the Fund has unsettled or open transactions will default.
If the Fund invests directly in foreign currencies or in securities that trade in, and receive revenues in, foreign currencies, or in derivatives that provide exposure to foreign currencies, it will be subject to the risk that those currencies will decline in value relative to the base currency (U.S. dollars) of the Fund, or, in the case of hedging positions, that the Fund’s base currency will decline in value relative to the currency being hedged. Currency rates in foreign countries may fluctuate significantly over short periods of time for a number of reasons, including changes in interest rates, intervention (or the failure to intervene) by U.S. or foreign governments, central banks or supranational entities, such as the International Monetary Fund, or by the imposition of currency controls or other political developments in the United States or abroad. As a result, the Fund’s investments in foreign currency denominated securities may reduce the returns of the Fund. The market values of equity securities, such as common stocks and preferred stocks, or equity related investments, such as futures and options, may decline due to general market conditions which are not specifically related to a particular company, such as real or perceived adverse economic conditions, changes in the general outlook for corporate earnings, changes in interest or currency rates or adverse investor sentiment generally. The market value of equity securities may also decline due to factors which affect a particular industry or industries, such as labor shortages or increased production costs and competitive conditions within an industry. Equity securities and equity related investments generally have greater market price volatility than fixed income securities.
Federal Income Taxes:
Federal Income Taxes – For federal income tax purposes, the Fund intends to continue to qualify as a Regulated Investment Company ("RIC") under Subchapter M of the Internal Revenue Code (“IRC”) by distributing substantially all of its taxable net investment income and net realized capital gains to its shareholders and otherwise complying with the requirements of the IRC. The Fund has distributed substantially all of its income and capital gains in prior years, if applicable, and intends to distribute substantially all of its income and capital gains during the calendar year ending December 31, 2014. Accordingly, no provision for federal income or excise taxes has been made in the accompanying financial statements. Distributions from short-term capital gains are treated as ordinary income distributions for federal income tax purposes.
Net Investment Income (Loss), Net Realized Gains (Losses) and Distributions – Net investment income (loss) and net realized gains (losses) may differ for financial statement and tax purposes primarily because of losses deferred due to wash sale adjustments, foreign currency gains and losses, adjustments related to Passive Foreign Investment Companies ("PFICs"), Real Estate Investment Trusts ("REITs"), RICs, certain derivatives and partnerships. The character of distributions made during the year from net investment income or net realized gains may differ from their ultimate characterization for federal income tax purposes. Also, due to the timing of dividend distributions, the fiscal year in which amounts are distributed may differ from the year that the income or realized gains (losses) were recorded by the Fund.
Distributions and Components of Distributable Earnings – The tax character of distributions paid by the Fund for the periods indicated is as follows (as adjusted for dividends payable, if applicable):
| For the Year Ended October 31, 2014 | For the Year Ended October 31, 2013 | |||||||
| Ordinary Income | $ | 33,924 | $ | — | ||||
| Long-Term Capital Gains ‡ | 58,522 | 44,885 | ||||||
| ‡ | The Fund designates these distributions as long-term capital gain dividends pursuant to IRC Sec. 852(b)(3)(C). |
| 20 |
| The Hartford Small Company Fund |
| Notes to Financial Statements – (continued) |
| October 31, 2014 |
| (000’s Omitted) |
As of October 31, 2014, the Fund’s components of distributable earnings (deficit) on a tax basis are as follows:
| Amount | ||||
| Undistributed Ordinary Income | $ | 31,735 | ||
| Undistributed Long-Term Capital Gain | 113,491 | |||
| Unrealized Appreciation* | 135,026 | |||
| Total Accumulated Earnings | $ | 280,252 | ||
| * | Differences between book-basis and tax-basis unrealized appreciation (depreciation) may be attributable to the losses deferred due to wash sale adjustments, foreign currency gains and losses, adjustments related to PFICs, REITs, RICs, certain derivatives and partnerships. |
Reclassification of Capital Accounts – The Fund may record reclassifications in its capital accounts. These reclassifications have no impact on the total net assets of the Fund. The reclassifications are a result of permanent differences between U.S. GAAP and tax accounting for such items as foreign currency, PFICs, expiration or utilization of capital loss carryforwards or net operating losses. Adjustments are made to reflect the impact these items have on current and future distributions to shareholders. Therefore, the source of the Fund’s distributions may be shown in the accompanying Statement of Changes in Net Assets as from undistributed net investment income, from accumulated net realized gains on investments or from capital depending on the type of book and tax differences that exist. For the year ended October 31, 2014, the Fund recorded reclassifications to increase (decrease) the accounts listed below:
| Amount | ||||
| Undistributed Net Investment Income (Loss) | $ | 7,812 | ||
| Accumulated Net Realized Gain (Loss) | (7,812 | ) | ||
Capital Loss Carryforward – On December 22, 2010, the Regulated Investment Company Modernization Act of 2010 (the “Act”) was enacted, which made changes to the capital loss carryforward rules. The changes are effective for taxable years beginning after the date of enactment. Under the Act, funds are permitted to carry forward capital losses for an unlimited period. Additionally, capital loss carryforwards retain their character as either short-term or long-term capital losses rather than being considered all short-term as permitted under prior regulation.
The Fund had no capital loss carryforward for U.S. federal income tax purposes as of October 31, 2014.
Accounting for Uncertainty in Income Taxes – The Fund has adopted financial reporting rules that require the Fund to analyze all open tax years, as defined by the statute of limitations, for all major jurisdictions. Generally, tax authorities can examine all tax returns filed for the last three years. The Fund does not have an examination in progress.
The Fund has reviewed all open tax years and major jurisdictions and concluded that these financial reporting rules had no effect on the Fund’s financial position or results of operations. There is no tax liability resulting from unrecognized tax benefits relating to uncertain income tax positions taken or expected to be taken on the tax return for the fiscal year ended October 31, 2014. The Fund is also not aware of any tax positions for which it is reasonably possible that the total amounts of unrecognized tax benefits will significantly change in the next twelve months.
Expenses:
Investment Management Agreement – Hartford Funds Management Company, LLC ("HFMC") serves as the Fund’s investment manager pursuant to an Investment Management Agreement with the Company. HFMC is an indirect wholly owned subsidiary of The Hartford Financial Services Group, Inc. ("The Hartford"). The investment manager has overall investment supervisory responsibility for the Fund. In addition, the investment manager provides administrative personnel, services, equipment, facilities and office space for proper operation of the Fund. HFMC has contracted with Wellington Management Company, LLP ("Wellington Management") under a sub-advisory agreement for the provision of day-to-day investment management services to the Fund in accordance with the Fund’s
| 21 |
| The Hartford Small Company Fund |
| Notes to Financial Statements – (continued) |
| October 31, 2014 |
| (000’s Omitted) |
investment objective and policies. The Fund pays a fee to the investment manager, a portion of which may be used to compensate Wellington Management.
The schedule below reflects the rates of compensation paid to the investment manager for investment management services rendered as of October 31, 2014; the rates are accrued daily and paid monthly:
| Average Daily Net Assets | Annual Fee |
| On first $250 million | 0.8500% |
| On next $250 million | 0.8000% |
| On next $500 million | 0.7500% |
| On next $500 million | 0.7000% |
| On next $3.5 billion | 0.6500% |
| On next $5 billion | 0.6300% |
| Over $10 billion | 0.6200% |
Accounting Services Agreement – Pursuant to the Fund Accounting Agreement between HFMC and the Company, on behalf of the Fund, HFMC provides accounting services to the Fund and receives monthly compensation based on the Fund’s average daily net assets at the rates set forth below. The Fund’s accounting services fees are accrued daily and paid monthly.
| Average Daily Net Assets | Annual Fee |
| On first $5 billion | 0.014% |
| On next $5 billion | 0.012% |
| Over $10 billion | 0.010% |
Operating Expenses – Allocable expenses incurred by the Company are allocated to each Fund and allocated to classes within the Fund in proportion to the average daily net assets of the Fund and each class, except where allocation of certain expenses is more fairly made directly to the Fund or to specific classes within a Fund. As of October 31, 2014, HFMC contractually limited the total operating expenses of this Fund, exclusive of taxes, interest expense, brokerage commissions, acquired fund fees and expenses and extraordinary expenses, through February 28, 2015 as follows:
| Class A | Class B | Class C | Class I | Class R3 | Class R4 | Class R5 | Class Y |
| 1.40% | 2.15% | 2.15% | 1.15% | 1.55% | 1.25% | 0.95% | 0.90% |
Fees Paid Indirectly – The Fund has entered into agreements with State Street Global Markets, LLC and Russell Implementation Services, Inc. to partially recapture non-discounted trade commissions. Such rebates are used to pay a portion of the Fund's expenses. For the year ended October 31, 2014, this amount, if any, is included in the Statement of Operations.
The ratio of expenses to average net assets in the accompanying financial highlights excludes the reduction in expenses related to fees paid indirectly. The annualized expense ratio after waivers for the period listed below reflecting the reduction for fees paid indirectly is as follows:
| Year Ended October 31, 2014 | ||||
| Class A | 1.34 | % | ||
| Class B | 2.14 | |||
| Class C | 2.04 | |||
| Class I | 1.10 | |||
| Class R3 | 1.54 | |||
| Class R4 | 1.24 | |||
| Class R5 | 0.94 | |||
| Class Y | 0.84 | |||
| 22 |
| The Hartford Small Company Fund |
| Notes to Financial Statements – (continued) |
| October 31, 2014 |
| (000’s Omitted) |
Distribution and Service Plan for Class A, B, C, R3 and R4 Shares – Hartford Funds Distributors, LLC ("HFD"), an indirect wholly owned subsidiary of The Hartford, is the principal underwriter and distributor of the Fund. HFD is engaged in distribution activities, which include marketing and distribution of shares through broker/dealers, financing distribution costs and maintaining financial books and records. For the year ended October 31, 2014, HFD received front-end load sales charges of $950 and contingent deferred sales charges of $6 from the Fund.
The Fund has adopted a Distribution and Service Plan in accordance with Rule 12b-1 of the 1940 Act to compensate the distributor (HFD) for activities intended to result in the sale and distribution of Class A, B, C, R3 and R4 shares and for providing services for shareholders. The Rule 12b-1 plan applicable to Class A shares of the Fund provides for payment of a Rule 12b-1 fee of 0.25% of average daily net assets. Some or all of the fee may be used for shareholder servicing expenses with the remainder used for distribution expenses. Under the Class B Plan, the Fund pays the distributor 1.00% of the average daily net assets of Class B shares that are outstanding for 8 years or less, 0.25% of which is a fee for services provided to existing shareholders with the remainder used for distribution expenses. Some or the entire Rule 12b-1 fee for Class B shares may be remitted to broker/dealers for distribution and/or shareholder account services. After eight years, Class B shares convert to Class A shares. Upon conversion to Class A shares, the Class A plan described above will apply to those shares. Under the Class C Plan, the Fund pays the distributor 1.00% of the average daily net assets of Class C shares outstanding, 0.25% of which is intended as a fee for services provided to existing shareholders with the remainder used for distribution expenses. For Class C shares, some or the entire fee may be remitted to broker/dealers for distribution and/or shareholder account services. Class R3 shares have a distribution fee of 0.50% of average daily net assets and Class R4 shares have a distribution fee of 0.25% of average daily net assets. For Class R3 and R4 shares, some or the entire fee may be remitted to broker/dealers for distribution and/or shareholder account services. The Fund’s 12b-1 fees are accrued daily and paid monthly or at such other intervals as the Board of Directors may determine.
Other Related Party Transactions – Certain officers of the Fund are directors and/or officers of HFMC and/or The Hartford or its subsidiaries. For the year ended October 31, 2014, a portion of the Fund’s Chief Compliance Officer’s compensation was paid by all of the investment companies in the Hartford fund complex. The portion allocated to the Fund, as represented in other expenses on the Statement of Operations, was in the amount of $2. Hartford Administrative Services Company (“HASCO”), an indirect wholly-owned subsidiary of The Hartford, provides transfer agent services to the Fund. HASCO has contractually agreed to reimburse any portion of the transfer agency fees over 0.30% of average daily net assets per fiscal year for each class. Any transfer agency fee reimbursement is determined before considering the contractual operating expense limitation. For providing such services, HASCO is compensated on a per account basis that varies by account type, except with respect to Class Y, for which it is compensated based on average daily net assets. The amount paid to HASCO and any related contractual reimbursement amounts, if applicable, can be found in the Statement of Operations. These fees are accrued daily and paid monthly.
Administrative services fees are paid to HASCO for third-party recordkeeping services that are payable as a percentage of net assets in the amount of up to 0.20%, 0.15% and 0.10% for Classes R3, R4 and R5 shares, respectively. The total administrative services fees are shown on the Statement of Operations. These fees are accrued daily and paid monthly.
Affiliate Holdings:
As of October 31, 2014, the Fund's shares were owned in aggregate by affiliated fund of funds. Therefore, the Fund may experience relatively large purchases or redemptions of its shares from these affiliated fund of funds. Affiliated fund of funds owned shares in the Fund as follows:
| Percentage of Fund | ||||
| Class Y | 8 | % | ||
| 23 |
| The Hartford Small Company Fund |
| Notes to Financial Statements – (continued) |
| October 31, 2014 |
| (000’s Omitted) |
Investment Transactions:
For the year ended October 31, 2014, the cost of purchases and proceeds from sales of investment securities (excluding short-term investments) were as follows:
| Excluding U.S. Government Obligations | U.S. Government Obligations | Total | ||||||||||
| Cost of Purchases | $ | 828,168 | $ | — | $ | 828,168 | ||||||
| Sales Proceeds | 879,976 | — | 879,976 | |||||||||
Capital Share Transactions:
The following information is for the year ended October 31, 2014, and the year ended October 31, 2013:
For the Year Ended October 31, 2014 | For the Year Ended October 31, 2013 | |||||||||||||||||||||||||||||||
Shares Sold | Shares
Issued | Shares | Net Increase (Decrease) of Shares | Shares Sold | Shares
Issued | Shares | Net Increase (Decrease) of Shares | |||||||||||||||||||||||||
| Class A | ||||||||||||||||||||||||||||||||
| Shares | 2,562 | 1,602 | (2,911 | ) | 1,253 | 2,412 | 1,011 | (4,132 | ) | (709 | ) | |||||||||||||||||||||
| Amount | $ | 61,338 | $ | 35,948 | $ | (69,115 | ) | $ | 28,171 | $ | 51,670 | $ | 17,866 | $ | (86,217 | ) | $ | (16,681 | ) | |||||||||||||
| Class B | ||||||||||||||||||||||||||||||||
| Shares | 11 | 39 | (109 | ) | (59 | ) | 12 | 28 | (103 | ) | (63 | ) | ||||||||||||||||||||
| Amount | $ | 215 | $ | 721 | $ | (2,170 | ) | $ | (1,234 | ) | $ | 222 | $ | 424 | $ | (1,870 | ) | $ | (1,224 | ) | ||||||||||||
| Class C | ||||||||||||||||||||||||||||||||
| Shares | 172 | 256 | (394 | ) | 34 | 213 | 156 | (433 | ) | (64 | ) | |||||||||||||||||||||
| Amount | $ | 3,366 | $ | 4,748 | $ | (7,789 | ) | $ | 325 | $ | 3,984 | $ | 2,343 | $ | (7,676 | ) | $ | (1,349 | ) | |||||||||||||
| Class I | ||||||||||||||||||||||||||||||||
| Shares | 1,149 | 186 | (509 | ) | 826 | 841 | 88 | (612 | ) | 317 | ||||||||||||||||||||||
| Amount | $ | 28,254 | $ | 4,275 | $ | (12,311 | ) | $ | 20,218 | $ | 18,360 | $ | 1,581 | $ | (13,020 | ) | $ | 6,921 | ||||||||||||||
| Class R3 | ||||||||||||||||||||||||||||||||
| Shares | 471 | 252 | (662 | ) | 61 | 497 | 163 | (780 | ) | (120 | ) | |||||||||||||||||||||
| Amount | $ | 11,863 | $ | 6,020 | $ | (16,759 | ) | $ | 1,124 | $ | 11,428 | $ | 3,058 | $ | (16,889 | ) | $ | (2,403 | ) | |||||||||||||
| Class R4 | ||||||||||||||||||||||||||||||||
| Shares | 513 | 276 | (882 | ) | (93 | ) | 589 | 183 | (915 | ) | (143 | ) | ||||||||||||||||||||
| Amount | $ | 13,324 | $ | 6,790 | $ | (22,954 | ) | $ | (2,840 | ) | $ | 13,848 | $ | 3,498 | $ | (20,706 | ) | $ | (3,360 | ) | ||||||||||||
| Class R5 | ||||||||||||||||||||||||||||||||
| Shares | 61 | 35 | (131 | ) | (35 | ) | 108 | 28 | (244 | ) | (108 | ) | ||||||||||||||||||||
| Amount | $ | 1,671 | $ | 867 | $ | (3,471 | ) | $ | (933 | ) | $ | 2,506 | $ | 540 | $ | (5,383 | ) | $ | (2,337 | ) | ||||||||||||
| Class Y | ||||||||||||||||||||||||||||||||
| Shares | 3,390 | 1,245 | (4,325 | ) | 310 | 1,893 | 764 | (2,295 | ) | 362 | ||||||||||||||||||||||
| Amount | $ | 92,151 | $ | 31,660 | $ | (117,598 | ) | $ | 6,213 | $ | 46,274 | $ | 15,029 | $ | (54,794 | ) | $ | 6,509 | ||||||||||||||
| Total | ||||||||||||||||||||||||||||||||
| Shares | 8,329 | 3,891 | (9,923 | ) | 2,297 | 6,565 | 2,421 | (9,514 | ) | (528 | ) | |||||||||||||||||||||
| Amount | $ | 212,182 | $ | 91,029 | $ | (252,167 | ) | $ | 51,044 | $ | 148,292 | $ | 44,339 | $ | (206,555 | ) | $ | (13,924 | ) | |||||||||||||
The following reflects the conversion of Class B shares into Class A shares (reflected as Class A shares sold) for the year ended October 31, 2014, and the year ended October 31, 2013:
| Shares | Dollars | |||||||
| For the Year Ended October 31, 2014 | 21 | $ | 510 | |||||
| For the Year Ended October 31, 2013 | 22 | $ | 465 | |||||
Line of Credit:
The Fund is one of several Hartford Funds that participate in a $500 million committed revolving line of credit facility. The facility is to be used for temporary or emergency purposes. Under the arrangement, the funds are required to own securities having a market value in
| 24 |
| The Hartford Small Company Fund |
| Notes to Financial Statements – (continued) |
| October 31, 2014 |
| (000’s Omitted) |
excess of 300% of the total bank borrowings. The interest rate on borrowings varies depending on the nature of the loan. The facility also requires a fee to be paid based on the amount of the commitment. This commitment fee is allocated to all the funds participating in the line of credit based on the average net assets of the funds. During the year ended October 31, 2014, the Fund did not have any borrowings under this facility.
Pending Legal Proceedings:
On February 25, 2011, Jennifer L. Kasilag, Louis Mellinger, Judith M. Menendez, Jacqueline M. Robinson, and Linda A. Russell filed a derivative lawsuit against Hartford Investment Financial Services, LLC (“HIFSCO”) (now known as HFD) on behalf of six Hartford retail mutual funds in the United States District Court for the District of New Jersey, alleging that HIFSCO received excessive advisory and distribution fees in violation of its statutory fiduciary duty under Section 36(b) of the 1940 Act when serving as investment manager and principal underwriter, respectively, to the Hartford retail mutual funds. Although this action was purportedly filed on behalf of certain of the Hartford Funds, none of the Hartford Funds is itself a defendant to the suit. HIFSCO moved to dismiss and, in September 2011, the motion was granted in part and denied in part, with leave to amend the complaint. In November 2011, plaintiffs filed an amended complaint on behalf of certain Hartford retail mutual funds, The Hartford Global Health Fund (now known as The Hartford Healthcare Fund), The Hartford Conservative Allocation Fund, The Hartford Growth Opportunities Fund, The Hartford Inflation Plus Fund, The Hartford Advisers Fund (now known as The Hartford Balanced Fund), and The Hartford Capital Appreciation Fund. Plaintiffs seek to rescind the investment management agreements and distribution plans between HIFSCO and these funds and to recover the total fees charged thereunder or, in the alternative, to recover any improper compensation HIFSCO received, in addition to lost earnings. HIFSCO filed a partial motion to dismiss the amended complaint and, in December 2012, the court dismissed without prejudice the claims regarding distribution fees and denied the motion with respect to the advisory fees claims. HIFSCO disputes the allegations and intends to defend vigorously.
In March 2014, the plaintiffs filed a new complaint that added as new plaintiffs The Hartford Floating Rate Fund and The Hartford Small Company Fund and named as a defendant HFMC, which assumed the role as investment manager to the funds as of January 2013. HFMC and HIFSCO dispute the allegations and intend to defend vigorously.
No accrual for litigation relating to this matter has been recorded in the financial statements of the Fund because the Fund is not party to the suit.
Indemnifications:
Under the Company's organizational documents, the Company shall indemnify its officers and directors to the full extent required or permitted under Maryland General Corporation Law and the federal securities laws. In addition, the Company, on behalf of the Fund, may enter into contracts that contain a variety of indemnifications. The Company's maximum exposure under these arrangements is unknown. However, as of the date of these financial statements, the Company has not had prior claims or losses pursuant to these contracts and expects the risk of loss to be remote.
Subsequent Events:
At the August 5-6, 2014 meeting, the Board of Directors approved the creation of Class R6 shares for the Fund. Class R6 shares launched on November 7, 2014. In connection with the launch of the Class R6 shares, an updated prospectus, dated November 7, 2014, and Statement of Additional Information, dated March 1, 2014, as amended November 7, 2014, for the Fund were filed with the U.S. Securities and Exchange Commission.
Effective December 1, 2014, pursuant to a sub-transfer agency agreement between HASCO and Boston Financial Data Services, Inc. (“BFDS”), HASCO has delegated certain transfer agent, dividend disbursing agent and shareholder servicing agent functions to BFDS. The costs and expenses of such delegation are borne by HASCO, not by the Fund.
| 25 |
| The Hartford Small Company Fund |
| Financial Highlights |
| - Selected Per-Share Data - (A) | - Ratios and Supplemental Data - | |||||||||||||||||||||||||||||||||||||||||||||||||||
Class | Net Asset | Net | Net | Total from | Dividends | Distribu- | Total | Net
Asset | Total | Net
Assets | Ratio of | Ratio of | Ratio of | |||||||||||||||||||||||||||||||||||||||
| For the Year Ended October 31, 2014 | ||||||||||||||||||||||||||||||||||||||||||||||||||||
| A | $ | 24.58 | $ | (0.24 | ) | $ | 3.26 | $ | 3.02 | $ | – | $ | (2.77 | ) | $ | (2.77 | ) | $ | 24.83 | 13.49 | % | $ | 355,056 | 1.34 | % | 1.34 | % | (1.01 | )% | |||||||||||||||||||||||
| B | 20.82 | (0.36 | ) | 2.71 | 2.35 | – | (2.77 | ) | (2.77 | ) | 20.40 | 12.61 | 4,730 | 2.29 | 2.15 | (1.80 | ) | |||||||||||||||||||||||||||||||||||
| C | 20.77 | (0.34 | ) | 2.70 | 2.36 | – | (2.77 | ) | (2.77 | ) | 20.36 | 12.70 | 38,351 | 2.05 | 2.05 | (1.71 | ) | |||||||||||||||||||||||||||||||||||
| I | 25.12 | (0.19 | ) | 3.35 | 3.16 | – | (2.77 | ) | (2.77 | ) | 25.51 | 13.78 | 60,425 | 1.10 | 1.10 | (0.77 | ) | |||||||||||||||||||||||||||||||||||
| R3 | 26.00 | (0.31 | ) | 3.47 | 3.16 | – | (2.77 | ) | (2.77 | ) | 26.39 | 13.27 | 60,124 | 1.55 | 1.55 | (1.21 | ) | |||||||||||||||||||||||||||||||||||
| R4 | 26.65 | (0.24 | ) | 3.57 | 3.33 | – | (2.77 | ) | (2.77 | ) | 27.21 | 13.62 | 66,353 | 1.25 | 1.25 | (0.91 | ) | |||||||||||||||||||||||||||||||||||
| R5 | 27.23 | (0.16 | ) | 3.65 | 3.49 | – | (2.77 | ) | (2.77 | ) | 27.95 | 13.95 | 7,585 | 0.97 | 0.95 | (0.61 | ) | |||||||||||||||||||||||||||||||||||
| Y | 27.48 | (0.14 | ) | 3.70 | 3.56 | – | (2.77 | ) | (2.77 | ) | 28.27 | 14.08 | 337,933 | 0.85 | 0.85 | (0.51 | ) | |||||||||||||||||||||||||||||||||||
| For the Year Ended October 31, 2013 | ||||||||||||||||||||||||||||||||||||||||||||||||||||
| A | $ | 19.52 | $ | (0.16 | ) | $ | 6.56 | $ | 6.40 | $ | – | $ | (1.34 | ) | $ | (1.34 | ) | $ | 24.58 | 35.44 | % | $ | 320,630 | 1.39 | % | 1.39 | % | (0.73 | )% | |||||||||||||||||||||||
| B | 16.87 | (0.27 | ) | 5.56 | 5.29 | – | (1.34 | ) | (1.34 | ) | 20.82 | 34.34 | 6,062 | 2.35 | 2.15 | (1.47 | ) | |||||||||||||||||||||||||||||||||||
| C | 16.82 | (0.26 | ) | 5.55 | 5.29 | – | (1.34 | ) | (1.34 | ) | 20.77 | 34.45 | 38,428 | 2.09 | 2.09 | (1.43 | ) | |||||||||||||||||||||||||||||||||||
| I | 19.87 | (0.11 | ) | 6.70 | 6.59 | – | (1.34 | ) | (1.34 | ) | 25.12 | 35.79 | 38,749 | 1.14 | 1.14 | (0.52 | ) | |||||||||||||||||||||||||||||||||||
| R3 | 20.61 | (0.20 | ) | 6.93 | 6.73 | – | (1.34 | ) | (1.34 | ) | 26.00 | 35.15 | 57,652 | 1.56 | 1.55 | (0.88 | ) | |||||||||||||||||||||||||||||||||||
| R4 | 21.03 | (0.14 | ) | 7.10 | 6.96 | – | (1.34 | ) | (1.34 | ) | 26.65 | 35.56 | 67,467 | 1.26 | 1.25 | (0.59 | ) | |||||||||||||||||||||||||||||||||||
| R5 | 21.39 | (0.06 | ) | 7.24 | 7.18 | – | (1.34 | ) | (1.34 | ) | 27.23 | 36.02 | 8,321 | 0.99 | 0.95 | (0.25 | ) | |||||||||||||||||||||||||||||||||||
| Y | 21.56 | (0.05 | ) | 7.31 | 7.26 | – | (1.34 | ) | (1.34 | ) | 27.48 | 36.12 | 320,003 | 0.86 | 0.86 | (0.20 | ) | |||||||||||||||||||||||||||||||||||
| For the Year Ended October 31, 2012 (D) | ||||||||||||||||||||||||||||||||||||||||||||||||||||
| A | $ | 19.23 | $ | (0.18 | ) | $ | 1.46 | $ | 1.28 | $ | – | $ | (0.99 | ) | $ | (0.99 | ) | $ | 19.52 | 7.44 | % | $ | 268,501 | 1.41 | % | 1.40 | % | (0.85 | )% | |||||||||||||||||||||||
| B | 16.88 | (0.35 | ) | 1.33 | 0.98 | – | (0.99 | ) | (0.99 | ) | 16.87 | 6.65 | 5,972 | 2.37 | 2.15 | (1.60 | ) | |||||||||||||||||||||||||||||||||||
| C | 16.83 | (0.29 | ) | 1.27 | 0.98 | – | (0.99 | ) | (0.99 | ) | 16.82 | 6.67 | 32,182 | 2.12 | 2.12 | (1.57 | ) | |||||||||||||||||||||||||||||||||||
| I | 19.51 | (0.11 | ) | 1.46 | 1.35 | – | (0.99 | ) | (0.99 | ) | 19.87 | 7.70 | 24,366 | 1.14 | 1.14 | (0.58 | ) | |||||||||||||||||||||||||||||||||||
| R3 | 20.27 | (0.20 | ) | 1.53 | 1.33 | – | (0.99 | ) | (0.99 | ) | 20.61 | 7.30 | 48,148 | 1.58 | 1.55 | (0.99 | ) | |||||||||||||||||||||||||||||||||||
| R4 | 20.60 | (0.13 | ) | 1.55 | 1.42 | – | (0.99 | ) | (0.99 | ) | 21.03 | 7.63 | 56,217 | 1.27 | 1.25 | (0.68 | ) | |||||||||||||||||||||||||||||||||||
| R5 | 20.88 | (0.11 | ) | 1.61 | 1.50 | – | (0.99 | ) | (0.99 | ) | 21.39 | 7.93 | 8,859 | 1.00 | 0.95 | (0.41 | ) | |||||||||||||||||||||||||||||||||||
| Y | 21.02 | (0.06 | ) | 1.59 | 1.53 | – | (0.99 | ) | (0.99 | ) | 21.56 | 8.02 | 243,219 | 0.87 | 0.87 | (0.30 | ) | |||||||||||||||||||||||||||||||||||
| For the Year Ended October 31, 2011 | ||||||||||||||||||||||||||||||||||||||||||||||||||||
| A | $ | 17.48 | $ | (0.15 | ) | $ | 1.90 | $ | 1.75 | $ | – | $ | – | $ | – | $ | 19.23 | 10.01 | % | $ | 296,062 | 1.37 | % | 1.37 | % | (0.77 | )% | |||||||||||||||||||||||||
| B | 15.46 | (0.27 | ) | 1.69 | 1.42 | – | – | – | 16.88 | 9.18 | 9,192 | 2.30 | 2.15 | (1.55 | ) | |||||||||||||||||||||||||||||||||||||
| C | 15.41 | (0.26 | ) | 1.68 | 1.42 | – | – | – | 16.83 | 9.21 | 36,465 | 2.10 | 2.10 | (1.50 | ) | |||||||||||||||||||||||||||||||||||||
| I | 17.68 | (0.10 | ) | 1.93 | 1.83 | – | – | – | 19.51 | 10.35 | 19,056 | 1.08 | 1.08 | (0.49 | ) | |||||||||||||||||||||||||||||||||||||
| R3 | 18.45 | (0.20 | ) | 2.02 | 1.82 | – | – | – | 20.27 | 9.86 | 46,392 | 1.57 | 1.55 | (0.96 | ) | |||||||||||||||||||||||||||||||||||||
| R4 | 18.70 | (0.14 | ) | 2.04 | 1.90 | – | – | – | 20.60 | 10.16 | 51,387 | 1.26 | 1.25 | (0.66 | ) | |||||||||||||||||||||||||||||||||||||
| R5 | 18.90 | (0.08 | ) | 2.06 | 1.98 | – | – | – | 20.88 | 10.48 | 9,867 | 0.99 | 0.95 | (0.35 | ) | |||||||||||||||||||||||||||||||||||||
| Y | 19.01 | (0.06 | ) | 2.07 | 2.01 | – | – | – | 21.02 | 10.57 | 235,036 | 0.86 | 0.86 | (0.26 | ) | |||||||||||||||||||||||||||||||||||||
See Portfolio Turnover information on the next page.
| 26 |
| The Hartford Small Company Fund |
| Financial Highlights – (continued) |
| - Selected Per-Share Data - (A) | - Ratios and Supplemental Data - | |||||||||||||||||||||||||||||||||||||||||||||||||||
| Class | Net Asset Value at Beginning of Period | Net Investment Income (Loss) | Net Realized and Unrealized Gain (Loss) on Invest- ments | Total from Investment Operations | Dividends from Net Investment Income | Distribu- tions from Realized Capital Gains | Total Dividends and Distributions | Net Asset Value at End of Period | Total Return(B) | Net Assets at End of Period (000's) | Ratio of Expenses to Average Net Assets Before Adjust- ments(C) | Ratio of Expenses to Average Net Assets After Adjust- ments(C) | Ratio of Net Investment Income (Loss) to Average Net Assets | |||||||||||||||||||||||||||||||||||||||
| For the Year Ended October 31, 2010 | ||||||||||||||||||||||||||||||||||||||||||||||||||||
| A | $ | 13.90 | $ | (0.13 | ) | $ | 3.71 | $ | 3.58 | $ | – | $ | – | $ | – | $ | 17.48 | 25.76 | % | $ | 289,558 | 1.41 | % | 1.40 | % | (0.80 | )% | |||||||||||||||||||||||||
| B | 12.39 | (0.22 | ) | 3.29 | 3.07 | – | – | – | 15.46 | 24.78 | 12,384 | 2.36 | 2.15 | (1.54 | ) | |||||||||||||||||||||||||||||||||||||
| C | 12.34 | (0.22 | ) | 3.29 | 3.07 | – | – | – | 15.41 | 24.88 | 40,018 | 2.16 | 2.15 | (1.55 | ) | |||||||||||||||||||||||||||||||||||||
| I | 14.03 | (0.09 | ) | 3.74 | 3.65 | – | – | – | 17.68 | 26.02 | 13,283 | 1.17 | 1.15 | (0.54 | ) | |||||||||||||||||||||||||||||||||||||
| R3 | 14.70 | (0.16 | ) | 3.91 | 3.75 | – | – | – | 18.45 | 25.51 | 35,873 | 1.59 | 1.57 | (1.00 | ) | |||||||||||||||||||||||||||||||||||||
| R4 | 14.85 | (0.11 | ) | 3.96 | 3.85 | – | – | – | 18.70 | 25.93 | 45,096 | 1.28 | 1.26 | (0.67 | ) | |||||||||||||||||||||||||||||||||||||
| R5 | 14.97 | (0.07 | ) | 4.00 | 3.93 | – | – | – | 18.90 | 26.25 | 11,706 | 1.02 | 1.02 | (0.41 | ) | |||||||||||||||||||||||||||||||||||||
| Y | 15.03 | (0.05 | ) | 4.03 | 3.98 | – | – | – | 19.01 | 26.48 | 273,558 | 0.87 | 0.87 | (0.28 | ) | |||||||||||||||||||||||||||||||||||||
| (A) | Information presented relates to a share outstanding throughout the indicated period. Net investment income (loss) per share amounts are calculated based on average shares outstanding unless otherwise noted. |
| (B) | Assumes initial investment at net asset value at the beginning of each period, reinvestment of all distributions, the complete redemption of the investment at net asset value at the end of each period and no sales charge. Total return would be reduced if sales charges were taken into account. |
| (C) | Adjustments include waivers and reimbursements, if applicable. Ratios do not include fees paid indirectly (see Expenses in the accompanying Notes to Financial Statements). |
| (D) | Net investment income (loss) per share amounts have been calculated using the SEC method. |
| Portfolio Turnover Rate for All Share Classes | ||||
| For the Year Ended October 31, 2014 | 92 | % | ||
| For the Year Ended October 31, 2013 | 106 | |||
| For the Year Ended October 31, 2012 | 124 | |||
| For the Year Ended October 31, 2011 | 111 | |||
| For the Year Ended October 31, 2010 | 181 | |||
| 27 |
| Report of Independent Registered Public Accounting Firm |
| The Board of Directors and Shareholders of |
| The Hartford Mutual Funds, Inc. |
We have audited the accompanying statement of assets and liabilities, including the schedule of investments, of The Hartford Small Company Fund (one of the portfolios constituting The Hartford Mutual Funds, Inc. (the Funds)) as of October 31, 2014, and the related statement of operations for the year then ended, the statements of changes in net assets for each of the two years in the period then ended, and the financial highlights for each of the five years in the period then ended. These financial statements and financial highlights are the responsibility of the Funds’ management. Our responsibility is to express an opinion on these financial statements and financial highlights based on our audits.
We conducted our audits in accordance with the standards of the Public Company Accounting Oversight Board (United States). Those standards require that we plan and perform the audit to obtain reasonable assurance about whether the financial statements and financial highlights are free of material misstatement. We were not engaged to perform an audit of the Funds’ internal control over financial reporting. Our audits included consideration of internal control over financial reporting as a basis for designing audit procedures that are appropriate in the circumstances, but not for the purpose of expressing an opinion on the effectiveness of the Funds’ internal control over financial reporting. Accordingly, we express no such opinion. An audit also includes examining, on a test basis, evidence supporting the amounts and disclosures in the financial statements and financial highlights, assessing the accounting principles used and significant estimates made by management, and evaluating the overall financial statement presentation. Our procedures included confirmation of securities owned as of October 31, 2014, by correspondence with the custodian and brokers or by other appropriate auditing procedures where replies from brokers were not received. We believe that our audits provide a reasonable basis for our opinion.
In our opinion, the financial statements and financial highlights referred to above present fairly, in all material respects, the financial position of The Hartford Small Company Fund of The Hartford Mutual Funds, Inc. at October 31, 2014, the results of its operations for the year then ended, the changes in its net assets for each of the two years in the period then ended, and the financial highlights for each of the five years in the period then ended, in conformity with U.S. generally accepted accounting principles.
|
Minneapolis, Minnesota
December 18, 2014
| 28 |
| The Hartford Small Company Fund |
| Directors and Officers (Unaudited) |
The Board of Directors of the Company (the "Directors") appoints officers who are responsible for the day-to-day operations of the Fund and who execute policies formulated by the Directors. Each Director serves until his or her death, resignation, or retirement or until the next annual meeting of shareholders is held or until his or her successor is elected and qualifies.
Directors and officers who are employed by or who have a financial interest in The Hartford Financial Services Group, Inc. ("The Hartford") are considered “interested” persons of the Fund pursuant to the 1940 Act. Each officer and two of the Company's Directors, as noted in the chart below, are “interested” persons of the Fund. Each Director serves as a director for The Hartford Mutual Funds, Inc., The Hartford Mutual Funds II, Inc., Hartford Series Fund, Inc., and Hartford HLS Series Fund II, Inc., and as a trustee for The Hartford Alternative Strategies Fund, which, as of October 31, 2014, collectively consist of 66 funds. Correspondence may be sent to Directors and officers c/o Hartford Funds, 5 Radnor Corporate Center, Suite 300, 100 Matsonford Road, Radnor, Pennsylvania 19087, except that correspondence to Mr. Annoni, Mr. Dressen and Ms. Quade may be sent to 500 Bielenberg Drive, Suite 500, Woodbury, Minnesota 55125.
The table below sets forth, for each Director and officer, his or her name, year of birth, current position with the Company and date first elected or appointed to The Hartford Mutual Funds, Inc. ("MF") and The Hartford Mutual Funds II, Inc. ("MF2"), principal occupation, and, for Directors, other directorships held. The Fund’s Statement of Additional Information contains further information on the Directors and is available free of charge by calling 1-888-843-7824 or writing to: Hartford Funds, P.O. Box 55022, Boston, MA 02205-5022.
Information on the aggregate remuneration paid to the directors of the Company can be found in the Statement of Operations herein. The Fund pays to The Hartford a portion of the Chief Compliance Officer’s compensation, but does not pay salaries or compensation to any of its other officers or Directors who are employed by The Hartford.
Non-Interested Directors
Hilary E. Ackermann (1956) Director since September 23, 2014
Ms. Ackermann served as Chief Risk Officer at Goldman Sachs Bank USA from October 2008 to November 2011 and serves as a Director of Dynegy, Inc., an independent power company, from October 2012 to present.
Lynn S. Birdsong (1946) Director since 2003, Chairman of the Investment Committee since 2014
Mr. Birdsong is a private investor. Mr. Birdsong currently serves as a Director of the Sovereign High Yield Investment Company (April 2010 to current). Mr. Birdsong currently serves as an Independent Director of Nomura Partners Funds, Inc. (formerly, The Japan Fund) (April 2003 to current). From 2003 to March 2005, Mr. Birdsong was an Independent Director of the Atlantic Whitehall Funds. From 1979 to 2002, Mr. Birdsong was a Managing Director of Zurich Scudder Investments, an investment management firm. During his employment with Scudder, Mr. Birdsong was an Interested Director of The Japan Fund. From January 1981 through December 2013, Mr. Birdsong was a partner in Birdsong Company, an advertising specialty firm.
Robert M. Gavin, Jr. (1940) Director since 2002 (MF) and 1986 (MF2), Chairman of the Board for each since 2004
Dr. Gavin is an educational consultant. Prior to September 1, 2001, he was President of Cranbrook Education Community and prior to July 1996, he was President of Macalester College, St. Paul, Minnesota.
Duane E. Hill (1945) Director since 2001 (MF) and 2002 (MF2), Chairman of the Nominating Committee since 2003
Mr. Hill is a Partner of TSG Ventures L.P., a private equity investment company. Mr. Hill is a former partner of TSG Capital Group, a private equity investment firm that served as sponsor and lead investor in leveraged buyouts of middle market companies.
Sandra S. Jaffee (1941) Director since 2005
Ms. Jaffee is the founder and Chief Executive Officer of a private company, Homeworks Concierge, LLC, which provides residential property management services in Westchester County, New York (January 2012 to present). Ms. Jaffee served as Chairman (2008 to 2009) and Chief Executive Officer of Fortent (formerly Searchspace Group), a leading provider of compliance/regulatory technology to financial institutions from August 2005 to August 2009. From August 2004 to August 2005, Ms. Jaffee served as an Entrepreneur in Residence with Warburg Pincus, a private equity firm. Prior to joining Warburg Pincus, Ms. Jaffee served as Executive Vice President at Citigroup, from September 1995 to July 2004, where she was President and Chief Executive Officer of Citibank’s Global Securities Services (1995 to 2003). Ms. Jaffee currently serves as a member of the Board of Directors of Broadridge Financial Solutions as well as a Trustee of Muhlenberg College.
| 29 |
| The Hartford Small Company Fund |
| Directors and Officers (Unaudited) – (continued) |
William P. Johnston (1944) Director since 2005, Chairman of the Compliance Committee since 2005
In June 2006, Mr. Johnston was appointed as Senior Advisor to The Carlyle Group, a global private equity and other alternative asset investment firm and currently serves as an Operating Executive. In July 2006, Mr. Johnston was elected to the Board of Directors of MultiPlan, Inc. and served as a Director (July 2006 to August 2010). In August 2007, Mr. Johnston was elected to the Board of Directors of LifeCare Holdings, Inc. and served as a Director (August 2007 to June 2013). In February 2008, Mr. Johnston was elected to the Board of Directors of HCR-ManorCare, Inc. In May 2006, Mr. Johnston was elected to the Supervisory Board of Fresenius Medical Care AG & Co. KGaA, after its acquisition of Renal Care Group, Inc. in March 2006. Mr. Johnston joined Renal Care Group in November 2002 as a member of the Board of Directors and served as Chairman of the Board from March 2003 through March 2006. From 2002 through 2013, Mr. Johnston served as a Board member of the Georgia O’Keefe Museum. From September 1987 to December 2002, Mr. Johnston was with Equitable Securities Corporation (and its successors, SunTrust Equitable Securities and SunTrust Robinson Humphrey) serving in various investment banking and managerial positions, including Managing Director and Head of Investment Banking, Chief Executive Officer and Vice Chairman.
Phillip O. Peterson (1944) Director since 2002 (MF) and 2000 (MF2), Chairman of the Audit Committee since 2002
Mr. Peterson is a mutual fund industry consultant. He was a partner of KPMG LLP (an accounting firm) until July 1999. Mr. Peterson joined William Blair Funds in February 2007 as a member of the Board of Trustees. From February 2012 to February 2014, Mr. Peterson served as a Trustee of Symetra Variable Mutual Funds. From January 2004 to April 2005, Mr. Peterson served as Independent President of the Strong Mutual Funds.
Lemma W. Senbet (1946) Director since 2005
Dr. Senbet is the William E. Mayer Chair Professor of Finance and Founding Director, Center for Financial Policy, at the University of Maryland, Robert H. Smith School of Business. He was chair of the Finance Department of the University of Maryland, Robert H. Smith School of Business from 1998 to 2006. Since June 2013, he has been on leave from the University to serve as Executive Director of African Economic Research Consortium which focuses on economic policy research and training. Previously, he was a chaired professor of finance at the University of Wisconsin-Madison. Also, he was a Director of the Fortis Funds from March 2000 to July 2002. Dr. Senbet served as Director of the American Finance Association and President of the Western Finance Association. In 2006, Dr. Senbet was inducted Fellow of Financial Management Association International for his career-long distinguished scholarship and professional service.
Interested Directors and Officers
James E. Davey (1964) Director since 2012, President and Chief Executive Officer since 2010
Mr. Davey serves as Executive Vice President of Hartford Life Insurance Company (“HLIC”) and The Hartford. Additionally, Mr. Davey serves as Chairman of the Board, Manager and Senior Managing Director of Hartford Funds Distributors, LLC (“HFD”). He also currently serves as Director, Chairman of the Board, President and Senior Managing Director of Hartford Administrative Services Company (“HASCO”). Mr. Davey also serves as Manager, Chairman of the Board and Senior Managing Director for Hartford Funds Management Company, LLC (“HFMC”) and Director, Chairman of the Board and Senior Managing Director for Hartford Funds Management Group, Inc. ("HFMG"). Mr. Davey has served in various positions within The Hartford and its subsidiaries in connection with the operation of the Hartford Funds. Mr. Davey joined The Hartford in 2002.
Lowndes A. Smith* (1939) Director since 1996 (MF) and 2002 (MF2)
Mr. Smith served as Vice Chairman of The Hartford from February 1997 to January 2002, as President and Chief Executive Officer of Hartford Life, Inc. from February 1997 to January 2002, and as President and Chief Operating Officer of The Hartford Life Insurance Companies from January 1989 to January 2002. Mr. Smith serves as a Director of White Mountains Insurance Group Ltd. (October 2003 to current); One Beacon Insurance (October 2006 to current); Symetra Financial (August 2007 to current) and is a Managing Director of Whittington Gray Associates (January 2007 to current).
* Mr. Smith resigned as a Director of MF, MF2, Hartford Series Fund, Inc. and Hartford HLS Series Fund II, Inc. and as a Trustee of The Hartford Alternative Strategies Fund effective September 17, 2014.
Other Officers
Mark A. Annoni (1964) Vice President, Controller and Treasurer since 2012
Mr. Annoni currently serves as the Assistant Vice President of HLIC (February 2004 to present) and Senior Vice President of HFMG (December 2013 to present). Mr. Annoni has served in various positions within The Hartford and its subsidiaries in connection with the operation of the Hartford Funds. Mr. Annoni joined The Hartford in 2001.
| 30 |
| The Hartford Small Company Fund |
| Directors and Officers (Unaudited) – (continued) |
Michael R. Dressen (1963) AML Compliance Officer since 2011
Mr. Dressen currently serves as Assistant Vice President of HLIC. He also serves as Chief Compliance Officer and AML Compliance Officer of HASCO and as AML Officer of HFD. Mr. Dressen has served in various positions within The Hartford and its subsidiaries in connection with the operation of the Hartford Funds.
Edward P. Macdonald (1967) Vice President, Secretary and Chief Legal Officer since 2005
Mr. Macdonald currently serves as Assistant Secretary, Executive Vice President and Deputy General Counsel of HFD, HASCO, HFMC and HFMG. He also serves as Vice President of HLIC. Mr. Macdonald has served in various positions within The Hartford and its subsidiaries in connection with the operation of the Hartford Funds. Mr. Macdonald joined The Hartford in 2005.
Joseph G. Melcher (1973) Vice President and Chief Compliance Officer since 2013
Mr. Melcher currently serves as Executive Vice President of HFD, HFMG and HASCO. Mr. Melcher also currently serves as Executive Vice President and Chief Compliance Officer of HFMC. Mr. Melcher has served in various positions within The Hartford and its subsidiaries in connection with the operation of the Hartford Funds since joining The Hartford in 2012. Prior to joining The Hartford, Mr. Melcher worked at Touchstone Investments, a member of the Western & Southern Financial Group, where he held the position of Vice President and Chief Compliance Officer from 2010 through 2012 and Assistant Vice President, Compliance from 2005 to 2010.
Vernon J. Meyer (1964) Vice President since 2006
Mr. Meyer currently serves as Senior Vice President of HLIC. He also currently serves as Managing Director and Chief Investment Officer of HFMC and Managing Director of HFMG. Mr. Meyer has served in various positions within The Hartford and its subsidiaries in connection with the operation of the Hartford Funds. Mr. Meyer joined The Hartford in 2004.
Laura S. Quade (1969) Vice President since 2012
Ms. Quade currently serves as Vice President of HASCO, HFD and HFMG. She is the Head of Operations of HASCO and formerly served as Director, Enterprise Operations of HLIC. Ms. Quade has served in various positions within The Hartford and its subsidiaries in connection with the operation of the Hartford Funds. Ms. Quade joined The Hartford in 2001.
Martin A. Swanson** (1962) Vice President since 2010
Mr. Swanson currently serves as Vice President of HLIC. Mr. Swanson also serves as Managing Director, Chief Marketing Officer and Principal of HFD and Managing Director of HFMG. Mr. Swanson has served in various positions within The Hartford and its subsidiaries in connection with the operation of the Hartford Funds.
** Mr. Swanson resigned as an officer effective November 6, 2014.
HOW TO OBTAIN A COPY OF THE FUND’S PROXY VOTING POLICIES AND VOTING RECORDS (UNAUDITED)
A description of the policies and procedures that the Fund uses to determine how to vote proxies relating to portfolio securities and information about how the Fund voted proxies relating to portfolio securities during the most recent twelve-month period ended June 30 are available (1) without charge, upon request, by calling 888-843-7824 and (2) on the SEC’s website at http://www.sec.gov.
QUARTERLY PORTFOLIO HOLDINGS INFORMATION (UNAUDITED)
The Fund files a complete schedule of portfolio holdings with the SEC for the first and third quarters of each fiscal year on Form N-Q. The Fund’s Forms N-Q are available (1) without charge, upon request, by calling 888-843-7824 and (2) on the SEC’s website at http://www.sec.gov. The Form N-Q may be reviewed and copied at the SEC’s Public Reference Room in Washington, DC. Information on the operation of the Public Reference Room may be obtained by calling 1-800-SEC-0330.
| 31 |
| The Hartford Small Company Fund |
| Federal Tax Information (Unaudited) |
For the fiscal year ended October 31, 2014, there is no further federal tax information required for this Fund.
| 32 |
| The Hartford Small Company Fund |
| Expense Example (Unaudited) |
Your Fund's Expenses
As a shareholder of the Fund, you incur two types of costs: (1) transaction costs, including sales charges (loads) on purchase payments, if any, and contingent deferred sales charges (CDSC), if any, and (2) ongoing costs, including investment management fees, distribution and/or service (12b-1) fees, if any, and other fund expenses. This example is intended to help you understand your ongoing costs (in dollars) of investing in the Fund and to compare these costs with the ongoing costs of investing in other mutual funds. The example is based on an investment of $1,000 invested at the beginning of the period and held for the entire period of April 30, 2014 through October 31, 2014.
Actual Expenses
The first set of columns of the table below provides information about actual account values and actual expenses. You may use the information in this column, together with the amount you invested, to estimate the expenses that you paid over the period. Simply divide your account value by $1,000 (for example, an $8,600 account value divided by $1,000 = 8.6), then multiply the result by the number in the line under the heading entitled “Expenses Paid During Period” to estimate the expenses you paid on your account during this period.
Hypothetical Example for Comparison Purposes
The second set of columns of the table below provides information about hypothetical account values and hypothetical expenses based on the Fund's actual expense ratio and an assumed rate of return of 5% per year before expenses, which is not the Fund's actual return. The hypothetical account values and expenses may not be used to estimate the actual ending account balance or expenses you paid for the period. You may use this information to compare the ongoing costs of investing in the Fund and other funds. To do so, compare this 5% hypothetical example with the 5% hypothetical examples that appear in the shareholder reports of the other funds.
Please note that the expenses shown in the table are meant to highlight your ongoing costs only and do not reflect any transactional costs, such as sales charges (loads) and CDSC. Therefore, the second set of columns of the table is useful in comparing ongoing costs only, and will not help you determine the relative total costs of owning different funds. In addition, if these transactional costs were included, your costs would be higher. Expenses are equal to the Fund's annualized expense ratios multiplied by average account value over the period, multiplied by 184/365 (to reflect the one-half year period).
| Actual return | Hypothetical (5% return before expenses) | |||||||||||||||||||||||||||||||
| Beginning Account Value April 30, 2014 | Ending Account Value October 31, 2014 | Expenses paid during the period April 30, 2014 through October 31, 2014 | Beginning Account Value April 30, 2014 | Ending Account Value October 31, 2014 | Expenses paid during the period April 30, 2014 through October 31, 2014 | Annualized expense ratio | Days in the current 1/2 year | Days in the full year | ||||||||||||||||||||||||
| Class A | $ | 1,000.00 | $ | 1,090.50 | $ | 7.14 | $ | 1,000.00 | $ | 1,018.38 | $ | 6.89 | 1.35 | % | 184 | 365 | ||||||||||||||||
| Class B | $ | 1,000.00 | $ | 1,086.30 | $ | 11.29 | $ | 1,000.00 | $ | 1,014.38 | $ | 10.90 | 2.15 | 184 | 365 | |||||||||||||||||
| Class C | $ | 1,000.00 | $ | 1,086.40 | $ | 10.82 | $ | 1,000.00 | $ | 1,014.83 | $ | 10.45 | 2.06 | 184 | 365 | |||||||||||||||||
| Class I | $ | 1,000.00 | $ | 1,092.00 | $ | 5.89 | $ | 1,000.00 | $ | 1,019.57 | $ | 5.69 | 1.12 | 184 | 365 | |||||||||||||||||
| Class R3 | $ | 1,000.00 | $ | 1,089.10 | $ | 8.16 | $ | 1,000.00 | $ | 1,017.39 | $ | 7.88 | 1.55 | 184 | 365 | |||||||||||||||||
| Class R4 | $ | 1,000.00 | $ | 1,091.00 | $ | 6.61 | $ | 1,000.00 | $ | 1,018.88 | $ | 6.38 | 1.25 | 184 | 365 | |||||||||||||||||
| Class R5 | $ | 1,000.00 | $ | 1,092.70 | $ | 5.01 | $ | 1,000.00 | $ | 1,020.41 | $ | 4.84 | 0.95 | 184 | 365 | |||||||||||||||||
| Class Y | $ | 1,000.00 | $ | 1,093.20 | $ | 4.50 | $ | 1,000.00 | $ | 1,020.90 | $ | 4.35 | 0.85 | 184 | 365 | |||||||||||||||||
| 33 |
| The Hartford Small Company Fund |
| Approval of Investment Management and Investment Sub-Advisory Agreements (Unaudited) |
Section 15(c) of the Investment Company Act of 1940, as amended (the “1940 Act”), requires that each mutual fund’s board of directors, including a majority of those directors who are not “interested persons” of the mutual fund, as defined in the 1940 Act (the “Independent Directors”), annually review and consider the continuation of the mutual fund’s investment advisory and sub-advisory agreements. At its meeting held on August 5-6, 2014, the Board of Directors (the “Board”) of The Hartford Mutual Funds, Inc., including each of the Independent Directors, unanimously voted to approve the continuation of the investment management agreement for The Hartford Small Company Fund (the “Fund”) with Hartford Funds Management Company, LLC (“HFMC”) and the continuation of the investment sub-advisory agreement between HFMC and the Fund’s sub-adviser, Wellington Management Company, LLP (the “Sub-adviser,” and together with HFMC, the “Advisers”) (collectively, the “Agreements”).
In the months preceding the August 5-6, 2014 meeting, the Board requested, received and reviewed written responses from the Advisers to questions posed to them on behalf of the Independent Directors and supporting materials relating to those questions and responses. The Board considered information furnished to the Board at its meetings throughout the year, as well as information specifically prepared in connection with the annual approval of the Agreements at the Board’s meetings held on June 17-18, 2014 and August 5-6, 2014. Information provided to the Board at its meetings throughout the year included, among other things, reports on Fund performance, legal and compliance matters, sales and marketing activity, shareholder services, and the other services provided to the Fund by the Advisers and their affiliates. The Board also received in-person presentations by Fund officers and representatives of HFMC at the Board’s meetings on June 17-18, 2014 and August 5-6, 2014 concerning the Agreements.
The Independent Directors, advised by independent legal counsel, engaged service providers to assist them with evaluating the Agreements with respect to the Fund. Lipper Inc. (“Lipper”), an independent provider of investment company data, was retained to provide the Board with reports on how the Fund’s contractual management fees, actual management fees, other non-management fees, overall expense ratios and investment performance compared to those of mutual funds with similar investment objectives. The Independent Directors also engaged an independent financial services consultant (the “Consultant”) to assist them in evaluating the Fund’s management fees, sub-advisory fees, other non-management fees, overall expense ratios and investment performance. In addition, the Consultant reviewed the profitability calculations utilized by HFMC in connection with the continuation of the investment management agreement.
In determining whether to continue the Agreements for the Fund, the members of the Board reviewed and evaluated information and factors they believed to be relevant and appropriate in light of the information that the Board deemed necessary and appropriate through the exercise of its reasonable business judgment. While individual members of the Board may have weighed certain factors differently, the Board’s determination to continue the Agreements was based on a comprehensive consideration of all information provided to the Board throughout the year and specifically with respect to the continuation of the Agreements. A more detailed discussion of the factors the Board considered with respect to its approval of the Agreements is provided below.
Nature, Extent and Quality of Services Provided by the Advisers
The Board requested and considered information concerning the nature, extent and quality of the services provided to the Fund by the Advisers. The Board considered, among other things, the terms of the Agreements and the range of services provided by the Advisers. The Board considered the Advisers’ professional personnel who provide services to the Fund, including each Adviser’s ability and experience in attracting and retaining qualified personnel to service the Fund. The Board considered each Adviser’s reputation and overall financial strength, as well as its willingness to consider and implement organizational and operational changes designed to enhance services to the Hartford Funds. In addition, the Board considered the quality of each Adviser’s communications with the Board and responsiveness to Board inquiries and requests made from time to time with respect to the Fund and other Hartford Funds.
The Board also requested and evaluated information concerning each Adviser’s regulatory and compliance environment. In this regard, the Board requested and reviewed information on each Adviser’s compliance policies and procedures, compliance history, and a report from the Fund’s Chief Compliance Officer on each Adviser’s compliance with applicable laws and regulations, including responses to regulatory developments and compliance issues raised by regulators. The Board also noted the Advisers’ support of the Fund’s compliance control structure, particularly the resources devoted by the Advisers in support of the Fund’s obligations pursuant to Rule 38a-1 under the 1940 Act.
With respect to HFMC, the Board noted that, under the Agreements, HFMC is responsible for the management of the Fund, including oversight of fund operations and service providers, and provides administrative and investment advisory services in connection with selecting, monitoring and supervising the Sub-adviser. The Board considered HFMC’s ongoing monitoring of people, process and performance, including its quarterly reviews of each of the Hartford Funds, semi-annual meetings with the leaders of each Fund’s portfolio management team, and oversight of the Hartford Funds’ approximately 66 portfolio managers. The Board recognized that HFMC has demonstrated a record of making changes to the
| 34 |
| The Hartford Small Company Fund |
| Approval of Investment Management and Investment Sub-Advisory Agreements (Unaudited) – (continued) |
management and/or strategies of the Hartford Funds when warranted. The Board considered HFMC’s oversight of the Sub-adviser’s investment approach and results, process for monitoring best execution of portfolio trades by the Sub-adviser, and approach to risk management with respect to the Fund and the service providers to the Fund. The Board also considered HFMC’s oversight of compliance with the Fund’s objective and policies as well as with applicable laws and regulations, noting that regulatory and other developments had over time led to an increase in the scope of HFMC’s services in this regard.
In addition, the Board considered HFMC’s ongoing commitment to review and rationalize the Hartford Funds product line-up and the expenses that HFMC had incurred in connection with fund combinations in recent years. The Board considered that HFMC or its affiliates are responsible for providing the Fund’s officers.
With respect to the Sub-adviser, which provides certain day-to-day portfolio management services for the Fund, the Board considered the quality of the Fund’s portfolio managers, the Sub-adviser’s other investment personnel, its investment philosophy and process, investment research capabilities and resources, performance record, trade execution capabilities and experience. The Board considered the experience of the Fund’s portfolio managers, the number of accounts managed by the portfolio managers, and the Sub-adviser’s method for compensating the portfolio managers.
Based on these considerations, the Board concluded that it was satisfied with the nature, extent and quality of the services provided to the Fund by HFMC and the Sub-adviser.
Performance of the Fund and the Advisers
The Board considered the investment performance of the Fund. In this regard, the Board reviewed the performance of the Fund over different time periods presented in the materials and evaluated HFMC’s analysis of the Fund’s performance for these time periods. The Board considered information and materials provided to the Board by the Advisers concerning Fund performance, as well as information from Lipper comparing the investment performance of the Fund to an appropriate benchmark and universe of peer funds. The Board noted that the Fund’s performance was in the 3rd quintile of its performance universe for the 1-year period and the 4th quintile for the 3- and 5-year periods. The Board also noted that the Fund’s performance was above its benchmark for the 1-year period and in line with its benchmark for the 3- and 5-year periods.
The Board considered the detailed investment analytics reports provided by Hartford Funds’ Investment Advisory Group throughout the year. These reports include, among other things, information on the Fund’s gross and net returns, the Fund’s investment performance relative to an appropriate benchmark and peer group, various statistics concerning the Fund’s portfolio, and a narrative summary of various factors affecting Fund performance. The Board considered the Advisers’ cooperation with the Investment Committee, which assists the Board in evaluating the performance of the Fund at periodic meetings throughout the year. The Board also considered the analysis provided by the Consultant relating to the Fund’s performance track record.
In light of all the considerations noted above, the Board concluded that it had continued confidence in HFMC’s and the Sub-adviser’s overall capabilities to manage the Fund.
Costs of the Services and Profitability of the Advisers
The Board reviewed information regarding HFMC’s cost to provide investment management and related services to the Fund and HFMC’s profitability, both overall and for the Fund, on a pre-tax basis without regard to distribution expenses. The Board also requested and reviewed information about the profitability to HFMC and its affiliates from all services provided to the Fund and all aspects of their relationship with the Fund. The Board also requested and received information relating to the operations and profitability of the Sub-adviser.
The Board considered the Consultant’s review of the profitability calculations used by HFMC in connection with the continuation of the investment management agreement, noting the Consultant’s view that Hartford Funds’ process for calculating and reporting Fund profitability is reasonable. In this regard, the Board noted that the Consultant performed a full review of this process in light of the recent restructuring of the Hartford Funds business and reported that the approach to analyzing Fund profitability, including the use of common expense allocation methodologies, is reasonable, sound and well within common industry practice.
Based on these considerations, the Board concluded that the profits anticipated to be realized by the Advisers and their affiliates from their relationships with the Fund would not be excessive.
| 35 |
| The Hartford Small Company Fund |
| Approval of Investment Management and Investment Sub-Advisory Agreements (Unaudited) – (continued) |
Comparison of Fees and Services Provided by the Advisers
The Board considered comparative information with respect to the management fees to be paid by the Fund to HFMC and the total expense ratios of the Fund. The Board also considered comparative information with respect to the sub-advisory fees to be paid by HFMC to the Sub-adviser. In this regard, the Board requested and reviewed information from HFMC and the Sub-adviser relating to the management and sub-advisory fees, including the sub-advisory fee schedule for the Fund, and total operating expenses for the Fund. With respect to the sub-advisory fee schedule, the Board considered representations from HFMC and the Sub-adviser that the Sub-adviser’s fees were negotiated at arm’s length on a fund-by-fund basis and that certain factors were identified by HFMC as having had a potential impact on the negotiation of the Fund’s sub-advisory fee levels. The Board also reviewed information from Lipper comparing the Fund’s contractual management fees, actual management fees and overall expense ratios relative to a group of funds selected by Lipper, in consultation with the Consultant, and a broader universe of funds selected by Lipper. The Board considered that the Fund’s contractual management fee was in the 4th quintile of its expense group, while its actual management fee was in the 3rd quintile and its total expenses (less 12b-1 and shareholder service fees) were in the 5th quintile. The Board noted that the Fund has an automatically renewable contractual expense cap on each share class. The expense cap resulted in reimbursement of certain expenses incurred in 2013.
While the Board recognized that comparisons between the Fund and peer funds may be imprecise, given the different service levels and characteristics of mutual funds and the different business models and cost structures of the Advisers, the comparative information provided by Lipper assisted the Board in evaluating the reasonableness of the Fund’s management and sub-advisory fees and total operating expenses. In addition, the Board considered the analysis and recommendations of the Consultant relating to the Fund’s management and sub-advisory fees and total operating expenses.
Based on these considerations, the Board concluded that the Fund’s fees and total operating expenses, in conjunction with the information about quality of services, profitability, economies of scale, and other matters discussed, were reasonable in light of the services provided.
Economies of Scale
The Board requested and considered information regarding the Advisers’ realization of economies of scale with respect to the Fund and whether the fee levels reflect these economies of scale for the benefit of the Fund’s shareholders. The Board reviewed the breakpoints in the management fee schedule for the Fund, which reduce fee rates as Fund assets grow over time. The Board recognized that a fund with assets beyond the highest breakpoint level will continue to benefit from economies of scale because additional assets are charged the lowest breakpoint fee resulting in lower overall effective management fee rates. The Board also considered that expense limitations and fee waivers that reduce the Fund’s expenses at all asset levels can have the same effect as breakpoints in sharing economies of scale with shareholders and provide protection from an increase in expenses if Fund assets decline. The Board recognized that a fee schedule that reaches a lower breakpoint quickly provides shareholders with the benefit of anticipated or potential economies of scale. The Board also considered that HFMC has been active in managing expenses, which has resulted in benefits being realized by shareholders as assets within the Hartford Funds family of funds have grown over time, including through lower transfer agent costs and other operating expenses.
The Board reviewed and evaluated materials from Lipper and the Consultant showing how management fee schedules of peer funds reflect economies of scale for the benefit of shareholders as a peer fund’s assets hypothetically increase over time. Based on information provided by HFMC, Lipper, and the Consultant, the Board recognized that there is no uniform methodology for establishing breakpoints or uniform pattern in asset levels that trigger breakpoints or the amounts of breakpoints triggered.
After considering all of the information available to it, the Board concluded that it was satisfied with the extent to which economies of scale would be shared for the benefit of the Fund’s shareholders based on currently available information and the effective advisory fees and expense ratios for the Fund at its current and reasonably anticipated asset levels. The Board noted, however, that it would continue to monitor future growth in Fund assets and the appropriateness of additional breakpoints.
Other Benefits
The Board considered other benefits to the Advisers and their affiliates from their relationships with the Fund.
The Board noted that HFMC receives fees for fund accounting and related services from the Fund, and the Board considered information on profits to HFMC for such services. The Board also considered that Hartford Administrative Services Company (“HASCO”), the Fund’s transfer agent and an affiliate of HFMC, receives transfer agency compensation from the Fund, and the Board reviewed information on the profitability of
| 36 |
| The Hartford Small Company Fund |
| Approval of Investment Management and Investment Sub-Advisory Agreements (Unaudited) – (continued) |
the Fund’s transfer agency function to HASCO. The Board considered information provided by HASCO indicating that the transfer agent fees charged by HASCO to the Fund were fair and reasonable based on publicly available information.
The Board also considered that Hartford Funds Distributors, LLC (“HFD”), an affiliate of HFMC, serves as principal underwriter of the Fund. As principal underwriter, HFD receives 12b-1 fees from the Fund and receives all or a portion of the sales charges on sales or redemptions of certain classes of shares. The Board also noted that certain affiliates of HFD distribute shares of the Fund and receive compensation in that connection.
The Board considered benefits to the Sub-adviser from its use of the Fund’s brokerage commissions to obtain soft dollar research, and representations from HFMC and the Sub-adviser that the Sub-adviser would not make any revenue-sharing payments or any other type of distribution payments to HFMC or its affiliates.
The Board considered the benefits to shareholders of being part of the Hartford Funds family of funds, including the right to exchange investments between the same class of funds without a sales charge, the ability to reinvest Fund dividends into other funds in the family, and the ability to combine holdings in the Fund with holdings in other funds to obtain a reduced sales charge. The Board considered HFMC’s efforts to provide investors in the family with a broad range of investment styles and asset classes and its entrepreneurial risk in initiating new funds to expand these opportunities for shareholders.
* * * *
Based upon its review of these various factors, among others, the Board concluded that it is in the best interests of the Fund and its shareholders for the Board to approve the Agreements for an additional year. In reaching this decision, the Board did not assign relative weights to the factors discussed above or deem any one or group of them to be controlling in and of themselves. In connection with their deliberations, the Independent Directors met separately in executive session on several occasions, with independent legal counsel and the Consultant, to review the relevant materials and consider their responsibilities under relevant laws and regulations.
| 37 |
| The Hartford Small Company Fund |
| Main Risks (Unaudited) |
The main risks of investing in the Fund are described below.
Market, Selection and Strategy Risk: The Fund’s share price may fluctuate due to market risk and/or security selections that may underperform the market or relevant benchmarks. If the sub-adviser's investment strategy does not perform as expected, the Fund could underperform its peers or lose money. There is no guarantee the Fund will achieve its stated objective.
Small-Cap Stock Risk: Small-cap stocks are generally more volatile and risky and may be less liquid than large-cap stocks because they may have limited operating histories, narrow product lines, and focus on niche markets.
Foreign Investment Risk: Investments in foreign securities may be riskier than investments in U.S. securities. Potential risks include the risks of illiquidity, increased price volatility, less government regulation, less extensive and less frequent accounting and other reporting requirements, unfavorable changes in currency exchange rates, and economic and political disruptions.
Active Trading Risk: Actively trading investments may result in higher costs and higher taxable income.
| 38 |
THIS PRIVACY POLICY IS NOT PART OF THIS REPORT
Privacy Policy and Practices of The Hartford Financial Services Group, Inc. and its Affiliates
(herein called “we, our and us”)
This Privacy Policy applies to our United States Operations
|
We value your trust. We are committed to the responsible: a) management; b) use; and c) protection; of Personal Information.
This notice describes how we collect, disclose, and protect Personal Information.
We collect Personal Information to: a) service your Transactions with us; and b) support our business functions.
We may obtain Personal Information from: a) You; b) your Transactions with us; and c) third parties such as a consumer-reporting agency.
Based on the type of product or service You apply for or get from us, Personal Information such as: a) your name; b) your address; c) your income; d) your payment; or e) your credit history; may be gathered from sources such as applications, Transactions, and consumer reports.
To serve You and service our business, we may share certain Personal Information. We will share Personal Information, only as allowed by law, with affiliates such as: a) our insurance companies; b) our employee agents; c) our brokerage firms; and d) our administrators.
As allowed by law, we may share Personal Financial Information with our affiliates to: a) market our products; or b) market our services; to You without providing You with an option to prevent these disclosures.
|
We may also share Personal Information, only as allowed by law, with unaffiliated third parties including: a) independent agents; b) brokerage firms; c) insurance companies; d) administrators; and e) service providers; who help us serve You and service our business.
When allowed by law, we may share certain Personal Financial Information with other unaffiliated third parties who assist us by performing services or functions such as: a) taking surveys; b) marketing our products or services; or c) offering financial products or services under a joint agreement between us and one or more financial institutions.
We, and third parties we partner with, may track some of the pages You visit through the use of: a) cookies; b) pixel tagging; or c) other technologies; and currently do not process or comply with any web browser’s “do not track” signal or similar mechanism that indicates a request to disable online tracking of individual users who visit our websites or use our services.
We will not sell or share your Personal Financial Information with anyone for purposes unrelated to our business functions without offering You the opportunity to: a) “opt-out;” or b) “opt-in;” as required by law.
We only disclose Personal Health Information with: a) your proper written authorization; or b) as otherwise allowed or required by law.
Our employees have access to Personal Information in the course of doing their jobs, such as: a) underwriting policies; b) paying claims; c) developing new products; or d) advising customers of our products and services.
|
|
We use manual and electronic security procedures to maintain: a) the confidentiality; and b) the integrity of; Personal Information that we have. We use these procedures to guard against unauthorized access.
Some techniques we use to protect Personal Information include: a) secured files; b) user authentication; c) encryption; d) firewall technology; and e) the use of detection software.
We are responsible for and must: a) identify information to be protected; b) provide an adequate level of protection for that data; c) grant access to protected data only to those people who must use it in the performance of their job-related duties.
Employees who violate our Privacy Policy will be subject to discipline, which may include ending their employment with us.
At the start of our business relationship, we will give You a copy of our current Privacy Policy.
We will also give You a copy of our current Privacy Policy once a year if You maintain a continuing business relationship with us.
We will continue to follow our Privacy Policy regarding Personal Information even when a business relationship no longer exists between us.
|
As used in this Privacy Notice:
Application means your request for our product or service.
Personal Financial Information means financial information such as: a) credit history; b) income; c) financial benefits; or d) policy or claim information.
Personal Health Information means health information such as: a) your medical records; or b) information about your illness, disability or injury.
Personal Information means information that identifies You personally and is not otherwise available to the public. It includes: a) Personal Financial Information; and b) Personal Health Information.
Transaction means your business dealings with us, such as: a) your Application; b) your request for us to pay a claim; and c) your request for us to take an action on your account.
You means an individual who has given us Personal Information in conjunction with: a) asking about; b) applying for; or c) obtaining; a financial product or service from us if the product or service is used mainly for personal, family, or household purposes.
|
This Privacy Policy is being provided on behalf of the following affiliates of The Hartford Financial Services Group, Inc.:
1stAGChoice, Inc.; Access CoverageCorp, Inc.; Access CoverageCorp Technologies, Inc.; American Maturity Life Insurance Company; Archway 60 R, LLC; Business Management Group, Inc.; Champlain Life Reinsurance Company; DMS R, LLC; Eloy R, LLC; Ersatz Corporation; First State Insurance Company; Hartford Accident and Indemnity Company; Hartford Administrative Services Company; Hartford Casualty General Agency, Inc.; Hartford Casualty Insurance Company; Hartford-Comprehensive Employee Benefit Service Company; Hartford Equity Sales Company, Inc.; Hartford Fire General Agency, Inc.; Hartford Fire Insurance Company; Hartford Funds Management Company, LLC; Hartford Funds Management Group, Inc.; Hartford HLS Series Fund II, Inc.; Hartford Insurance Company of Illinois; Hartford Insurance Company of the Midwest; Hartford Insurance Company of the Southeast; Hartford Integrated Technologies, Inc.; Hartford International Life Reassurance Corporation; Hartford Funds Distributors, LLC; Hartford Investment Management Company; Hartford Life and Accident Insurance Company; Hartford Life and Annuity Insurance Company; Hartford Life Insurance Company; Hartford Life Private Placement, LLC; Hartford Lloyd’s Corporation; Hartford Lloyd’s Insurance Company; Hartford Mezzanine Investors I, LLC; Hartford Residual Market, L.C.C.; Hartford Retirement Services, LLC; Hartford Securities Distribution Company, Inc.; Hartford Series Fund, Inc.; Hartford Specialty Insurance Services of Texas, LLC; Hartford Strategic Investments, LLC; Hartford Underwriters Insurance Company; Hartford Technology Services Company, L.L.C.; Hartford of Texas General Agency, Inc.; Hartford Underwriters General Agency, Inc.; HARTRE Company, L.C.C.; HL Investment Advisors, LLC; HLA LLC; Horizon Management Group, LLC; HRA Brokerage Services, Inc.; Lanidex Class B, LLC; M-CAP Insurance Agency, LLC; New England Insurance Company; New England Reinsurance Corporation; Nutmeg Insurance Agency, Inc.; Nutmeg Insurance Company; Pacific Insurance Company, Limited; Planco, LLC: Property and Casualty Insurance Company of Hartford; Revere R, LLC; RVR R, LLC; Sentinel Insurance Company, Ltd.; Sunstone R, LLC; Symphony R, LLC; The Evergreen Group Incorporated; The Hartford Alternative Strategies Fund; The Hartford Mutual Funds, Inc.; The Hartford Mutual Funds II, Inc.; Trumbull Flood Management, L.L.C.; Trumbull Insurance Company; Twin City Fire Insurance Company; White River Life Reinsurance Company.
HPP Revised January 2014
HARTFORDFUNDS
hartfordfunds.com
This information is written in connection with the promotion or marketing of the matter(s) addressed in this material.
This report is submitted for the general information of the shareholders of the Fund. It is not authorized for distribution unless preceded or accompanied by a current prospectus for the Fund.
The information cannot be used or relied upon for the purpose of avoiding IRS penalties. These materials are not intended to provide tax, accounting or legal advice. As with all matters of a tax or legal nature, you should consult your own tax or legal counsel for advice.
Investors should carefully consider the investment objectives, risks, charges, and expenses of Hartford Funds before investing. This and other information can be found in the prospectus and summary prospectus, which can be obtained by calling 888-843-7824 (retail) or 800-279-1541 (institutional). Investors should read them carefully before they invest.
Hartford Funds are underwritten and distributed by Hartford Funds Distributors, LLC.
MFAR-SC14 12/14 114000-3 Printed in U.S.A.
HARTFORDFUNDS
|
THE HARTFORD
SMALL/MID CAP EQUITY FUND
2014 Annual Report |
A MESSAGE FROM THE PRESIDENT
Dear Fellow Shareholders:
Thank you for investing in Hartford Funds.
Market Review
U.S. equities (as represented by the S&P 500 Index) rose steadily for the fiscal year ended October 31, 2014, with a return of 17.27% for the period. With the exception of short-lived geopolitical scares early in 2014 and concerns about continuing global growth near the end of the period, stocks generally rose on solid fundamentals and encouraging macroeconomic data during the year.
September 2014 marked the six-year anniversary of the start of the financial crisis. Within weeks of that anniversary, both the S&P 500 Index and the Dow Jones Industrial Average set new all-time highs, closing at 2,018 and 17,391, respectively, on October 31. Although the fallout of the crisis continues to influence investor behavior, stocks have recovered and risen dramatically, up 198% from their low in March 2009. Meanwhile, the domestic economy is notching strong growth, and the unemployment rate has reached its lowest level since August 2008.
While the U.S. economy appears to have stabilized and to have reverted to a solid growth path, the outlook for the global economy appears to have gotten cloudier. The U.S. Federal Reserve has ended quantitative easing, while Europe and Japan are pursuing stimulus options to avoid a double-dip recession and deflation, respectively. Diverging central-bank policies will likely continue to play an important role in market movements going forward as investors wait to see the reactions to their efforts and their impacts on global markets.
How have market movements impacted your portfolio throughout the last year? Are your investments still on track to provide the growth or income you need, and are you comfortable with their progress during times of volatility?
Your financial professional can help you navigate today’s markets with confidence, as well as assist you to achieve your investment goals by providing advice on the best options within our fund family to help you work toward overcoming today’s investing challenges. Meet with your financial advisor regularly to examine your portfolio and your investment strategy, and to determine if you’re still on track to meet your goals.
Thank you again for investing with Hartford Funds.
James Davey
President
Hartford Funds
1 The S&P 500 Index is a market capitalization-weighted price index composed of 500 widely held common stocks.
2 The Dow Jones Industrial Average is an unmanaged, price-weighted index of 30 of the largest, most widely held stocks traded on the NYSE
The Hartford Small/Mid Cap Equity Fund
Table of Contents
The views expressed in the Fund’s Manager Discussion under ‘‘Why did the Fund perform this way?’’ and ‘‘What is the outlook?’’ are views of the Fund’s sub-adviser and portfolio management team through the end of the period and are subject to change based on market and other conditions. The Fund’s Manager Discussion is for informational purposes only and does not represent an offer, recommendation or solicitation to buy, hold or sell any security. The specific securities identified and described, if any, do not represent all of the securities purchased or sold and you should not assume that investments in the securities identified and discussed will be profitable.
| The Hartford Small/Mid Cap Equity Fund inception 01/01/2005 |
| (sub-advised by Wellington Management Company, LLP) |
| Investment objective – The Fund seeks long-term capital appreciation. |
Performance Overview 1/01/05 - 10/31/14
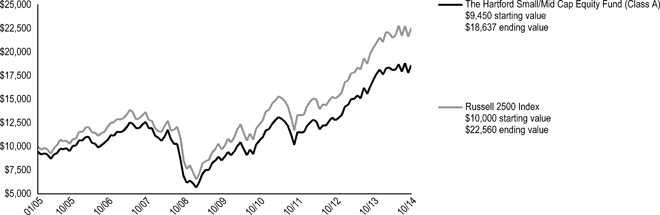
The chart above represents the hypothetical growth of a $10,000 investment in Class A, which includes a sales charge. Growth results in classes other than Class A will vary from what is seen above due to differences in the expenses charged to those share classes.
Average Annual Total Returns (as of 10/31/14)
| 1 Year | 5 Years | Since Inception▲ | ||||||||||
| Small/Mid Cap Equity A# | 9.22 | % | 16.91 | % | 7.15 | % | ||||||
| Small/Mid Cap Equity A## | 3.22 | % | 15.59 | % | 6.54 | % | ||||||
| Small/Mid Cap Equity B# | 8.39 | % | 16.05 | % | 6.62 | %* | ||||||
| Small/Mid Cap Equity B## | 3.72 | % | 15.83 | % | 6.62 | %* | ||||||
| Small/Mid Cap Equity C# | 8.39 | % | 16.06 | % | 6.39 | % | ||||||
| Small/Mid Cap Equity C## | 7.46 | % | 16.06 | % | 6.39 | % | ||||||
| Small/Mid Cap Equity R3# | 8.99 | % | 16.96 | % | 7.37 | % | ||||||
| Small/Mid Cap Equity R4# | 9.31 | % | 17.17 | % | 7.47 | % | ||||||
| Small/Mid Cap Equity R5# | 9.62 | % | 17.40 | % | 7.57 | % | ||||||
| Small/Mid Cap Equity Y# | 9.75 | % | 17.41 | % | 7.58 | % | ||||||
| Russell 2500 Index | 10.23 | % | 18.40 | % | 8.63 | % | ||||||
| ▲ | Inception: 01/01/2005 |
| # | Without sales charge |
| ## | With sales charge |
| * | Class B shares convert to Class A shares after 8 years. The return shown reflects the conversion to Class A shares, which had different operating expenses, for the period after conversion. |
PERFORMANCE DATA QUOTED REPRESENTS PAST PERFORMANCE AND DOES NOT GUARANTEE FUTURE RESULTS. The investment return and principal value of the investment will fluctuate so that investors’ shares, when redeemed, may be worth more or less than their original cost. Current performance may be lower or higher than the performance data quoted. To obtain performance data current to the most recent month-end, please visit our website www.hartfordfunds.com.
The initial investment in Class A shares reflects the maximum sales charge of 5.50% and returns for Class B shares reflect a contingent deferred sales charge of up to 5.00% and declining to zero, depending on the period of time the shares are held. Returns for Class C shares reflect a contingent deferred sales charge of up to 1.00% on shares redeemed within twelve months of purchase.
Total returns presented above were calculated using the Fund’s net asset value available to shareholders for sale or redemption of Fund shares on October 31, 2014, which may exclude investment transactions as of this date. All share class returns assume the reinvestment of all distributions at net asset value and the deduction of all fund expenses.
Effective 9/30/09, Class B shares of the Fund were closed to new investments.
Class R3, R4 and R5 shares commenced operations on 9/30/11. Performance prior to that date is that of the Fund’s Class Y shares, which had different operating expenses.
Includes the Fund’s performance when it invested, prior to 2/1/10, at least 80% of its assets in common stocks of mid-capitalization companies.
Performance information includes performance under the Fund’s previous sub-adviser, Hartford Investment Management Company. As of June 4, 2012, Hartford Investment Management Company no longer served as the sub-adviser to the Fund.
Russell 2500 Index measures the performance of the small to mid-cap segment of the U.S. equity universe, commonly referred to as “smid” cap. The Russell 2500 Index is a subset of the Russell 3000 Index and includes approximately 2500 of the smallest securities based on a combination of their market capitalization and current index membership.
You cannot invest directly in an index.
The chart and table do not reflect the deductions of taxes that a shareholder would pay on Fund distributions or the redemption of Fund shares.
Performance information may reflect historical or current expense waivers/reimbursements from the investment adviser, without which performance would have been lower. For information on current expense waivers/reimbursements, please see the prospectus.
| 2 |
| The Hartford Small/Mid Cap Equity Fund |
| Manager Discussion |
| October 31, 2014 (Unaudited) |
Operating Expenses*
| Net | Gross | |||||||
| Small/Mid Cap Equity Class A | 1.30 | % | 1.43 | % | ||||
| Small/Mid Cap Equity Class B | 2.05 | % | 2.35 | % | ||||
| Small/Mid Cap Equity Class C | 2.05 | % | 2.18 | % | ||||
| Small/Mid Cap Equity Class R3 | 1.50 | % | 1.68 | % | ||||
| Small/Mid Cap Equity Class R4 | 1.20 | % | 1.34 | % | ||||
| Small/Mid Cap Equity Class R5 | 0.90 | % | 1.04 | % | ||||
| Small/Mid Cap Equity Class Y | 0.85 | % | 0.93 | % | ||||
* As shown in the Fund's current prospectus dated March 1, 2014. Actual expenses may be higher or lower. Please see accompanying Financial Highlights for expense ratios for the year ended October 31, 2014.
Gross expenses are the Fund's total annual operating expenses shown in the Fund's most recent prospectus. Net expenses are the Fund's total annual operating expenses shown in the Fund's most recent prospectus and reflect contractual expense reimbursements in instances when these reductions reduce the Fund's gross expenses. Contractual reimbursements remain in effect until February 28, 2015, and automatically renew for one-year terms unless terminated.
All investments are subject to risk including the possible loss of principal. For a discussion of the Fund’s risks, please see the Main Risks section of this report. For more detailed information on the risks associated with an investment in the Fund, please see the prospectus.
|
Portfolio Manager David J. Elliott, CFA Vice President, Co-Director, Quantitative Investments and Portfolio Manager | |
How did the Fund perform?
The Class A shares of The Hartford Small/Mid Cap Equity Fund returned 9.22%, before sales charge, for the twelve-month period ended October 31, 2014, underperforming the Fund’s benchmark, the Russell 2500 Index, which returned 10.23% for the same period. The Fund also underperformed the 11.40% average return of the Lipper Mid-Cap Core Funds peer group, a group of funds with investment strategies similar to those of the Fund.
Why did the Fund perform this way?
U.S. equities surged during the period, despite bouts of significant volatility. After finishing their best year since 1997, U.S. stocks began 2014 with their worst month in nearly two years. Worries about an economic slowdown in China and general angst surrounding emerging markets overshadowed a fairly benign domestic environment. However, robust merger and acquisition activity and an uncontested increase in the debt ceiling from Congress helped stoke investors' risk appetites in February. The rally continued in May amid renewed signs of life in the housing market and the best payroll gain in more than two years. However, a pullback in July ended a streak of five consecutive monthly gains. Fear gripped the market as heightened geopolitical risks, a potential Portuguese banking crisis, and worries of U.S. Federal Reserve (Fed) tightening took center stage. Stocks rebounded in August as investors were emboldened by encouraging economic data, headlined by better-than-expected gross domestic product (GDP) growth and signs that the housing recovery still had legs. In September, U.S. equities retreated for just the third month this year. Despite solid manufacturing and consumer confidence readings, the reality of quantitative easing ending and the prospect of higher federal funds rates in mid-2015 contributed to increased risk aversion levels. Stocks finished a volatile October at an all-time high on the heels of a positive earnings season and generally solid economic data. Returns varied noticeably by market-cap, as small- and mid-cap stocks underperformed large-cap stocks.
Nine of the ten sectors in the Russell 2500 Index posted positive returns during the period. Strong performers included the Healthcare (+24.5%), Telecommunication Services (+22.1%), and Utilities (+19.0%) sectors, while the Energy (-12.0%), Consumer Staples (+5.3%) and Consumer Discretionary (+6.1%) sectors lagged on a relative basis.
Weak stock selection in the Materials, Industrials, and Consumer Discretionary sectors more than offset stronger stock selection in the Information Technology, Energy, and Utilities sectors. Overall sector positioning, a fallout of our bottom up stock selection process, contributed to relative returns during the period due primarily to an overweight to the Healthcare sector and underweights to the Industrials and Financials sectors. The Fund’s modest cash position detracted from relative performance in an upward-trending market.
The largest detractors from absolute and benchmark-relative performance were Barrett Business Services (Industrials), Taser International (Industrials), and Nu Skin Enterprises (Consumer Discretionary). Shares of Barrett Business Services, a Washington-based company that provides outsourced workers' compensation coverage and other personnel services to businesses, fell as the company reported higher-than-expected workers’ compensation reserve charges; an announcement the market viewed negatively. Shares of Taser International, a U.S.-based company engaged in the development, manufacture and sale of electronic control devices, underperformed after the company announced continued capital expenditures in video technology that remains in the nascent stages of product development. Shares of Nu Skin Enterprises, a global direct selling company that develops anti-aging products, declined during the period, as broad weakness across emerging markets, highlighted by a prolonged slowdown in Nu Skin’s China business, weighed on revenues.
| 3 |
| The Hartford Small/Mid Cap Equity Fund |
| Manager Discussion – (continued) |
| October 31, 2014 (Unaudited) |
The largest contributors to relative and absolute performance during the period were Alaska Air Group (Industrials), Pilgrim’s Pride (Consumer Staples), and United Therapeutics (Healthcare). Alaska Air Group, an airline holding company, rose during the period as sales increased during the period due to increased capacity and travel routes. Shares of Pilgrim’s Pride, a U.S.-based chicken producer, rose during the period after the company posted better-than-expected earnings results. Shares of United Therapeutics, a U.S.-based biotechnology company, rose during the period after the company reported better-than-expected quarterly earnings, driven primarily by the company’s product launch which was well received by the market.
Derivatives are not used in a significant manner in this Fund and did not have a material impact on performance during the period.
What is the outlook?
The Fund seeks to add value by utilizing Wellington Management’s proprietary quantitative research and investment tools in a highly disciplined framework. The Fund focuses on stock selection as the key driver of returns and uses quantitative portfolio optimization techniques to minimize unintended and uncompensated risks. Based on individual stock decisions, the Fund ended the period most overweight the Consumer Discretionary, Healthcare, and Telecommunication Services sectors and most underweight the Industrials, Utilities, and Information Technology sectors relative to the Russell 2500 Index.
Diversification by Sector
as of October 31, 2014
| Sector | Percentage of Net Assets | |||
| Equity Securities | ||||
| Consumer Discretionary | 16.0 | % | ||
| Consumer Staples | 2.3 | |||
| Energy | 4.8 | |||
| Financials | 23.1 | |||
| Health Care | 13.2 | |||
| Industrials | 14.0 | |||
| Information Technology | 14.6 | |||
| Materials | 5.8 | |||
| Services | 1.1 | |||
| Utilities | 3.8 | |||
| Total | 98.7 | % | ||
| Short-Term Investments | 1.2 | |||
| Other Assets and Liabilities | 0.1 | |||
| Total | 100.0 | % | ||
A sector may be comprised of several industries. For Fund compliance purposes, the Fund may not use the same classification system and these sector classifications are used for reporting ease.
| 4 |
| The Hartford Small/Mid Cap Equity Fund |
| Schedule of Investments |
| October 31, 2014 |
| (000’s Omitted) |
| Shares or Principal Amount | Market Value ╪ | |||||||
| Common Stocks - 98.7% | ||||||||
| Automobiles and Components - 0.8% | ||||||||
| 3 | Lear Corp. | $ | 250 | |||||
| 8 | Superior Industries International, Inc. | 154 | ||||||
| 2 | Visteon Corp. ● | 197 | ||||||
| 601 | ||||||||
| Banks - 3.8% | ||||||||
| 5 | Banco Latinoamericano de Comercio Exterior S.A. ADR | 151 | ||||||
| 40 | Fifth Third Bancorp | 802 | ||||||
| 7 | Hanmi Financial Corp. | 148 | ||||||
| 10 | Home Loan Servicing Solutions Ltd. | 185 | ||||||
| 46 | Huntington Bancshares, Inc. | 453 | ||||||
| 10 | MainSource Financial Group, Inc. | 181 | ||||||
| 9 | Oriental Financial Group, Inc. | 143 | ||||||
| 6 | Popular, Inc. ● | 188 | ||||||
| 6 | Radian Group, Inc. | 99 | ||||||
| 44 | Regions Financial Corp. | 432 | ||||||
| 2,782 | ||||||||
| Capital Goods - 6.9% | ||||||||
| 7 | AAON, Inc. | 140 | ||||||
| 6 | AGCO Corp. | 284 | ||||||
| 6 | Altra Industrial Motion Corp. | 173 | ||||||
| 4 | American Railcar Industries, Inc. | 257 | ||||||
| 5 | American Woodmark Corp. ● | 209 | ||||||
| 5 | Argan, Inc. | 188 | ||||||
| 6 | Brady Corp. Class A | 131 | ||||||
| 1 | Esterline Technologies Corp. ● | 152 | ||||||
| 2 | Generac Holdings, Inc. ● | 86 | ||||||
| 2 | Huntington Ingalls Industries, Inc. | 243 | ||||||
| 2 | Hyster-Yale Materials Handling, Inc. | 133 | ||||||
| 20 | Meritor, Inc. ● | 228 | ||||||
| 2 | Moog, Inc. Class A ● | 168 | ||||||
| 6 | Proto Laboratories, Inc. ● | 386 | ||||||
| 4 | Quanta Services, Inc. ● | 126 | ||||||
| 4 | Regal-Beloit Corp. | 312 | ||||||
| 9 | Taser International, Inc. ● | 177 | ||||||
| 3 | Timken Co. | 146 | ||||||
| 8 | Trex Co., Inc. ● | 361 | ||||||
| 7 | Trinity Industries, Inc. | 243 | ||||||
| 3 | United Rentals, Inc. ● | 319 | ||||||
| 2 | Valmont Industries, Inc. | 218 | ||||||
| 4 | Wabco Holdings, Inc. ● | 341 | ||||||
| 5,021 | ||||||||
| Commercial and Professional Services - 4.2% | ||||||||
| 7 | Avery Dennison Corp. | 342 | ||||||
| 6 | Barrett Business Services, Inc. | 133 | ||||||
| 8 | Brink's Co. | 170 | ||||||
| 5 | Deluxe Corp. | 316 | ||||||
| 4 | Dun & Bradstreet Corp. | 430 | ||||||
| 10 | Enernoc, Inc. ● | 148 | ||||||
| 5 | Korn/Ferry International ● | 134 | ||||||
| 13 | Pitney Bowes, Inc. | 324 | ||||||
| 7 | Quad Graphics, Inc. | 159 | ||||||
| 5 | Quintiles Transnational Holdings ● | 316 | ||||||
| 18 | R.R. Donnelley & Sons Co. | 311 | ||||||
| 9 | RPX Corp. ● | 122 | ||||||
| 2 | UniFirst Corp. | 167 | ||||||
| 3,072 | ||||||||
| Consumer Durables and Apparel - 4.0% | ||||||||
| 6 | CSS Industries, Inc. | 172 | ||||||
| 3 | Deckers Outdoor Corp. ● | 245 | ||||||
| 3 | Fossil Group, Inc. ● | 254 | ||||||
| 2 | Hanesbrands, Inc. | 243 | ||||||
| 2 | Harman International Industries, Inc. | 226 | ||||||
| 13 | Nautilus Group, Inc. ● | 175 | ||||||
| 1 | NVR, Inc. ● | 712 | ||||||
| 2 | Polaris Industries, Inc. | 269 | ||||||
| 70 | Quiksilver, Inc. ● | 122 | ||||||
| 4 | Skechers USA, Inc. Class A ● | 236 | ||||||
| 4 | Steven Madden Ltd. ● | 135 | ||||||
| 4 | Vince Holding Corp. ● | 147 | ||||||
| 2,936 | ||||||||
| Consumer Services - 4.6% | ||||||||
| 5 | American Public Education, Inc. ● | 145 | ||||||
| 6 | Apollo Education Group, Inc. ● | 169 | ||||||
| 11 | Bridgepoint Education, Inc. ● | 143 | ||||||
| 8 | Brinker International, Inc. | 440 | ||||||
| 1 | Buffalo Wild Wings, Inc. ● | 172 | ||||||
| 2 | Capella Education Co. | 120 | ||||||
| 4 | Cheesecake Factory, Inc. | 193 | ||||||
| 3 | DeVry Education Group, Inc. | 131 | ||||||
| 5 | Domino's Pizza, Inc. | 438 | ||||||
| 14 | International Speedway Corp. Class A | 429 | ||||||
| 8 | K12, Inc. ● | 103 | ||||||
| 3 | Marriott Vacations Worldwide Corp. | 173 | ||||||
| 3 | Outerwall, Inc. ● | 177 | ||||||
| 2 | Panera Bread Co. Class A ● | 307 | ||||||
| 2 | Strayer Education, Inc. ● | 176 | ||||||
| 3,316 | ||||||||
| Diversified Financials - 2.4% | ||||||||
| 30 | Apollo Investment Corp. | 245 | ||||||
| 15 | EZCORP, Inc. ● | 173 | ||||||
| 12 | Janus Capital Group, Inc. | 181 | ||||||
| 5 | Marcus & Millichap, Inc. ● | 146 | ||||||
| 6 | Nelnet, Inc. | 266 | ||||||
| 25 | New Mountain Finance Corp. | 370 | ||||||
| 6 | RCS Capital Corp-Class A | 105 | ||||||
| 7 | Solar Capital Ltd. | 125 | ||||||
| 2 | World Acceptance Corp. ● | 115 | ||||||
| 1,726 | ||||||||
| Energy - 4.8% | ||||||||
| 25 | Abraxas Petroleum Corp. ● | 105 | ||||||
| 3 | Carrizo Oil & Gas, Inc. ● | 156 | ||||||
| 1 | Clayton Williams Energy, Inc. ● | 108 | ||||||
| 1 | Core Laboratories N.V. | 154 | ||||||
| 3 | CVR Energy, Inc. | 160 | ||||||
| 5 | Helmerich & Payne, Inc. | 417 | ||||||
| 5 | HollyFrontier Corp. | 209 | ||||||
| 6 | Matrix Service Co. ● | 150 | ||||||
| 8 | Nabors Industries Ltd. | 134 | ||||||
| 4 | Newfield Exploration Co. ● | 134 | ||||||
| 2 | Oil States International, Inc. ● | 93 | ||||||
| 5 | Patterson-UTI Energy, Inc. | 124 | ||||||
| 9 | Pioneer Energy Services Corp. ● | 79 | ||||||
| 1 | REX American Resources Corp. ● | 102 | ||||||
| 7 | RPC, Inc. | 116 | ||||||
| 2 | SM Energy Co. | 118 | ||||||
| 3 | Unit Corp. ● | 126 | ||||||
| 31 | Vaalco Energy, Inc. ● | 232 | ||||||
| 11 | Valero Energy Corp. | 567 | ||||||
The accompanying notes are an integral part of these financial statements.
| 5 |
| The Hartford Small/Mid Cap Equity Fund |
| Schedule of Investments – (continued) |
| October 31, 2014 |
| (000’s Omitted) |
| Shares or Principal Amount | Market Value ╪ | |||||||
| Common Stocks - 98.7% - (continued) | ||||||||
| Energy - 4.8% - (continued) | ||||||||
| 10 | WPX Energy, Inc. ● | $ | 199 | |||||
| 3,483 | ||||||||
| Food and Staples Retailing - 0.5% | ||||||||
| 3 | Andersons (The), Inc. | 166 | ||||||
| 38 | Rite Aid Corp. ● | 197 | ||||||
| 363 | ||||||||
| Food, Beverage and Tobacco - 1.3% | ||||||||
| 1 | Ingredion, Inc. | 77 | ||||||
| 1 | Keurig Green Mountain, Inc. | 122 | ||||||
| 18 | Pilgrim's Pride Corp. ● | 497 | ||||||
| 6 | Universal Corp. | 258 | ||||||
| 954 | ||||||||
| Health Care Equipment and Services - 4.9% | ||||||||
| 4 | Aetna, Inc. | 297 | ||||||
| 5 | Anika Therapeutics, Inc. ● | 209 | ||||||
| 4 | Centene Corp. ● | 343 | ||||||
| 2 | Chemed Corp. | 165 | ||||||
| 3 | Computer Programs & Systems, Inc. | 183 | ||||||
| 4 | Ensign Group, Inc. | 163 | ||||||
| 4 | Globus Medical, Inc. ● | 78 | ||||||
| 5 | Health Net, Inc. ● | 252 | ||||||
| 2 | Hill-Rom Holdings, Inc. | 89 | ||||||
| 3 | ICU Medical, Inc. ● | 198 | ||||||
| 3 | Magellan Health, Inc. ● | 157 | ||||||
| 4 | MEDNAX, Inc. ● | 231 | ||||||
| 4 | Orthofix International N.V. ● | 129 | ||||||
| 5 | PharMerica Corp. ● | 146 | ||||||
| 21 | Quality Systems, Inc. | 310 | ||||||
| 15 | Select Medical Holdings Corp. | 213 | ||||||
| 6 | SurModics, Inc. ● | 126 | ||||||
| 5 | VCA, Inc. ● | 246 | ||||||
| 3,535 | ||||||||
| Household and Personal Products - 0.5% | ||||||||
| 3 | Herbalife Ltd. | 168 | ||||||
| 2 | Usana Health Sciences, Inc. ● | 228 | ||||||
| 396 | ||||||||
| Insurance - 5.8% | ||||||||
| — | Alleghany Corp. ● | 169 | ||||||
| 3 | AmTrust Financial Services, Inc. | 153 | ||||||
| 5 | Argo Group International Holdings Ltd. | 273 | ||||||
| 7 | Assurant, Inc. | 471 | ||||||
| 6 | Endurance Specialty Holdings Ltd. | 324 | ||||||
| 3 | Everest Re Group Ltd. | 502 | ||||||
| 4 | FBL Financial Group Class A | 213 | ||||||
| 5 | Federated National Holding Co. | 151 | ||||||
| 18 | Genworth Financial, Inc. ● | 250 | ||||||
| 11 | Greenlight Capital Re Ltd. Class A ● | 354 | ||||||
| 18 | MBIA, Inc. ● | 178 | ||||||
| 7 | Montpelier Re Holdings Ltd. | 245 | ||||||
| 2 | Phoenix Cos., Inc. ● | 137 | ||||||
| 19 | Symetra Financial Corp. | 455 | ||||||
| 9 | United Insurance Holdings Corp. | 180 | ||||||
| 4 | Validus Holdings Ltd. | 147 | ||||||
| 4,202 | ||||||||
| Materials - 5.8% | ||||||||
| 8 | Albemarle Corp. | 485 | ||||||
| 4 | Clearwater Paper Corp. ● | 283 | ||||||
| 8 | Commercial Metals Co. | 131 | ||||||
| 5 | Domtar Corp. | 222 | ||||||
| 8 | Flotek Industries, Inc. ● | 177 | ||||||
| 26 | Gold Resource Corp. | 100 | ||||||
| 11 | Graphic Packaging Holding Co. ● | 138 | ||||||
| 9 | Huntsman Corp. | 225 | ||||||
| 21 | Kronos Worldwide, Inc. | 282 | ||||||
| 8 | Olin Corp. | 201 | ||||||
| 6 | PolyOne Corp. | 211 | ||||||
| 4 | Reliance Steel & Aluminum | 236 | ||||||
| 18 | Resolute Forest Products ● | 325 | ||||||
| 8 | Sonoco Products Co. | 339 | ||||||
| 7 | Steel Dynamics, Inc. | 168 | ||||||
| 3 | Stepan Co. | 124 | ||||||
| 16 | Stillwater Mining Co. ● | 208 | ||||||
| 5 | United States Steel Corp. | 208 | ||||||
| 4 | US Silica Holdings, Inc. | 198 | ||||||
| 4,261 | ||||||||
| Media - 0.5% | ||||||||
| 12 | Global Sources Ltd. ● | 91 | ||||||
| 4 | Scholastic Corp. | 143 | ||||||
| 3 | Starz ● | 105 | ||||||
| 339 | ||||||||
| Pharmaceuticals, Biotechnology and Life Sciences - 8.3% | ||||||||
| 14 | Achillion Pharmaceuticals, Inc. ● | 166 | ||||||
| 19 | Affymetrix, Inc. ● | 171 | ||||||
| 8 | Anacor Pharmaceuticals, Inc. ● | 241 | ||||||
| 24 | Arena Pharmaceuticals, Inc. ● | 104 | ||||||
| 3 | Bio-Rad Laboratories, Inc. Class A ● | 350 | ||||||
| 12 | Bruker Corp. ● | 251 | ||||||
| 7 | Cambrex Corp. ● | 148 | ||||||
| 6 | Charles River Laboratories International, Inc. ● | 385 | ||||||
| 14 | DepoMed, Inc. ● | 213 | ||||||
| 9 | Emergent Biosolutions, Inc. ● | 199 | ||||||
| 6 | Hyperion Therapeutics, Inc. ● | 136 | ||||||
| 3 | Impax Laboratories, Inc. ● | 84 | ||||||
| 1 | Intercept Pharmaceuticals, Inc. ● | 207 | ||||||
| 4 | Lannet, Inc. ● | 216 | ||||||
| 3 | Ligand Pharmaceuticals, Inc. Class B ● | 160 | ||||||
| 10 | Myriad Genetics, Inc. ● | 384 | ||||||
| 15 | Nektar Therapeutics ● | 212 | ||||||
| 23 | Northwest Biotherapeutics, Inc. ● | 122 | ||||||
| 12 | Omeros Corp. ● | 192 | ||||||
| 4 | Ophthotech Corp. ● | 150 | ||||||
| 22 | Pacific Biosciences of California ● | 142 | ||||||
| 4 | PAREXEL International Corp. ● | 234 | ||||||
| 61 | PDL Biopharma, Inc. | 520 | ||||||
| 18 | Pozen, Inc. | 163 | ||||||
| 13 | Sciclone Pharmaceuticals, Inc. ● | 100 | ||||||
| 3 | Techne Corp. | 282 | ||||||
| 4 | United Therapeutics Corp. ● | 550 | ||||||
| 6,082 | ||||||||
| Real Estate - 11.1% | ||||||||
| 8 | AG Mortgage Investment Trust, Inc. REIT | 151 | ||||||
| 7 | Altisource Residential Corp. | 153 | ||||||
| 17 | American Capital Mortgage Investment Corp. REIT | 323 | ||||||
| 24 | Brandywine Realty Trust REIT | 370 | ||||||
| 26 | Capstead Mortgage Corp. REIT | 333 | ||||||
| 7 | CBL & Associates Properties, Inc. REIT | 140 | ||||||
| 33 | Chambers Street Properties | 269 | ||||||
| 7 | Equity Commonwealth | 198 | ||||||
| 10 | Equity Lifestyle Properties, Inc. REIT | 471 | ||||||
| 12 | First Potomac Realty Trust REIT | 144 | ||||||
The accompanying notes are an integral part of these financial statements.
| 6 |
| The Hartford Small/Mid Cap Equity Fund |
| Schedule of Investments – (continued) |
| October 31, 2014 |
| (000’s Omitted) |
| Shares or Principal Amount | Market Value ╪ | |||||||
| Common Stocks - 98.7% - (continued) | ||||||||
| Real Estate - 11.1% - (continued) | ||||||||
| 14 | Franklin Street Properties Corp. REIT | $ | 173 | |||||
| 11 | Government Properties Income Trust REIT | 260 | ||||||
| 8 | Hatteras Financial Corp. REIT | 147 | ||||||
| 10 | Hospitality Properties Trust REIT | 293 | ||||||
| 3 | Jones Lang LaSalle, Inc. | 419 | ||||||
| 30 | Mack-Cali Realty Corp. REIT | 556 | ||||||
| 18 | MFA Mortgage Investments, Inc. REIT | 149 | ||||||
| 12 | New Residential Investment Corp. ● | 144 | ||||||
| 11 | NorthStar Realty Finance Corp. | 204 | ||||||
| 11 | Pennsylvania REIT | 238 | ||||||
| 47 | Piedmont Office Realty Trust, Inc. | 912 | ||||||
| 9 | Ramco-Gershenson Properties Trust REIT | 161 | ||||||
| 50 | Resource Capital Corp. REIT | 267 | ||||||
| 51 | Retail Properties of America, Inc. | 803 | ||||||
| 5 | Sabra Healthcare REIT, Inc. | 140 | ||||||
| 6 | Select Income REIT | 137 | ||||||
| 9 | St. Joe Co. ● | 165 | ||||||
| 26 | Two Harbors Investment Corp. REIT | 265 | ||||||
| 10 | Western Asset Mortgage Capital Corp. REIT | 143 | ||||||
| 8,128 | ||||||||
| Retailing - 6.1% | ||||||||
| 4 | Abercrombie & Fitch Co. Class A | 131 | ||||||
| 6 | ANN, Inc. ● | 219 | ||||||
| 7 | Big Lots, Inc. | 319 | ||||||
| 6 | Buckle (The), Inc. | 291 | ||||||
| 5 | Cato Corp. | 182 | ||||||
| 8 | Chico's FAS, Inc. | 118 | ||||||
| 3 | Children's Place, Inc. | 128 | ||||||
| 4 | Dillard's, Inc. | 465 | ||||||
| 9 | Finish Line (The), Inc. | 233 | ||||||
| 6 | Foot Locker, Inc. | 358 | ||||||
| 15 | Francescas Holding Corp. ● | 181 | ||||||
| 19 | Nutrisystem, Inc. | 325 | ||||||
| 14 | Overstock.com, Inc. ● | 331 | ||||||
| 8 | Select Comfort Corp. ● | 203 | ||||||
| 3 | Ulta Salon, Cosmetics & Fragrances, Inc. ● | 314 | ||||||
| 7 | Urban Outfitters, Inc. ● | 215 | ||||||
| 7 | Williams-Sonoma, Inc. | 423 | ||||||
| 4,436 | ||||||||
| Semiconductors and Semiconductor Equipment - 2.5% | ||||||||
| 3 | Ambarella, Inc. ● | 111 | ||||||
| 27 | Amkor Technology, Inc. ● | 182 | ||||||
| 8 | Cirrus Logic, Inc. ● | 145 | ||||||
| 10 | Integrated Device Technology, Inc. ● | 167 | ||||||
| 11 | Kulicke & Soffa Industries, Inc. ● | 155 | ||||||
| 20 | ON Semiconductor Corp. ● | 165 | ||||||
| 17 | RF Micro Devices, Inc. ● | 215 | ||||||
| 26 | Silicon Image, Inc. ● | 139 | ||||||
| 8 | Skyworks Solutions, Inc. | 437 | ||||||
| 2 | Synaptics, Inc. ● | 130 | ||||||
| 1,846 | ||||||||
| Software and Services - 8.5% | ||||||||
| 30 | Angie's List, Inc. ● | 211 | ||||||
| 10 | Aspen Technology, Inc. ● | 362 | ||||||
| 17 | AVG Technologies N.V. ● | 301 | ||||||
| 4 | Booz Allen Hamilton Holding Corp. | 103 | ||||||
| 21 | CA, Inc. | 610 | ||||||
| 12 | Carbonite, Inc. ● | 127 | ||||||
| 2 | Constant Contact, Inc. ● | 81 | ||||||
| 15 | Convergys Corp. | 292 | ||||||
| 5 | CSG Systems International, Inc. | 130 | ||||||
| 6 | CyrusOne, Inc. | 153 | ||||||
| 16 | Digital River, Inc. ● | 399 | ||||||
| 2 | DST Systems, Inc. | 231 | ||||||
| 20 | Global Cash Access, Inc. ● | 144 | ||||||
| 10 | Liquidity Services, Inc. ● | 125 | ||||||
| 6 | Logmein, Inc. ● | 264 | ||||||
| 8 | Mentor Graphics Corp. | 161 | ||||||
| 7 | Netscout Systems, Inc. ● | 240 | ||||||
| 6 | Pegasystems, Inc. | 134 | ||||||
| 6 | PTC, Inc. ● | 229 | ||||||
| 7 | Rovi Corp. ● | 155 | ||||||
| 2 | SS&C Technologies Holdings, Inc. ● | 82 | ||||||
| 20 | Synopsys, Inc. ● | 811 | ||||||
| 10 | Take-Two Interactive Software, Inc. ● | 262 | ||||||
| 12 | VASCO Data Security International, Inc. ● | 314 | ||||||
| 7 | VeriFone Systems, Inc. ● | 261 | ||||||
| 6,182 | ||||||||
| Technology Hardware and Equipment - 3.6% | ||||||||
| 6 | Arris Group, Inc. ● | 171 | ||||||
| 4 | Arrow Electronics, Inc. ● | 228 | ||||||
| 7 | Avnet, Inc. | 298 | ||||||
| 3 | Benchmark Electronics, Inc. ● | 74 | ||||||
| 47 | Brocade Communications Systems, Inc. | 510 | ||||||
| 9 | Clearfield, Inc. ● | 138 | ||||||
| 3 | Comtech Telecommunications Corp. | 121 | ||||||
| 4 | Echostar Corp. ● | 201 | ||||||
| 7 | Ingram Micro, Inc. ● | 183 | ||||||
| 6 | Lexmark International, Inc. | 263 | ||||||
| 3 | Palo Alto Networks, Inc. ● | 285 | ||||||
| 41 | Sonus Networks, Inc. ● | 143 | ||||||
| 2,615 | ||||||||
| Telecommunication Services - 1.1% | ||||||||
| 31 | Frontier Communications Co. | 203 | ||||||
| 11 | Inteliquent, Inc. | 182 | ||||||
| 9 | Spok Holdings, Inc. | 152 | ||||||
| 11 | Telephone & Data Systems, Inc. | 292 | ||||||
| 829 | ||||||||
| Transportation - 2.9% | ||||||||
| 21 | Alaska Air Group, Inc. | 1,102 | ||||||
| 4 | ArcBest Corp. | 135 | ||||||
| 6 | Avis Budget Group, Inc. ● | 323 | ||||||
| 2 | Spirit Airlines, Inc. ● | 161 | ||||||
| 10 | Swift Transportation Co. ● | 257 | ||||||
| 6 | Werner Enterprises, Inc. | 163 | ||||||
| 2,141 | ||||||||
| Utilities - 3.8% | ||||||||
| 60 | Atlantic Power Corp. | 133 | ||||||
| 2 | El Paso Electric Co. | 80 | ||||||
| 6 | Empire District Electric Co. | 168 | ||||||
| 17 | Great Plains Energy, Inc. | 452 | ||||||
| 6 | New Jersey Resources Corp. | 357 | ||||||
| 10 | Pinnacle West Capital Corp. | 602 | ||||||
The accompanying notes are an integral part of these financial statements.
| 7 |
| The Hartford Small/Mid Cap Equity Fund |
| Schedule of Investments – (continued) |
| October 31, 2014 |
| (000’s Omitted) |
| Shares or Principal Amount | Market Value ╪ | |||||||||||
| Common Stocks - 98.7% - (continued) | ||||||||||||
| Utilities - 3.8% - (continued) | ||||||||||||
| 25 | Westar Energy, Inc. | $ | 960 | |||||||||
| 2,752 | ||||||||||||
| Total Common Stocks | ||||||||||||
| ( Cost $63,567) | $ | 71,998 | ||||||||||
| Total Long-Term Investments | ||||||||||||
| (Cost $63,567) | $ | 71,998 | ||||||||||
| Short-Term Investments - 1.2% | ||||||||||||
| Repurchase Agreements - 1.2% | ||||||||||||
| Bank of America Merrill Lynch TriParty Repurchase Agreement (maturing on 11/03/2014 in the amount of $3, collateralized by U.S. Treasury Note 1.50%, 2019, value of $3) |
||||||||||||
| $ | 2 | 0.08%, 10/31/2014 | $ | 2 | ||||||||
| Bank of America Merrill Lynch TriParty Repurchase Agreement (maturing on 11/03/2014 in the amount of $44, collateralized by GNMA 1.63% - 7.00%, 2031 - 2054, value of $45) |
||||||||||||
| 44 | 0.09%, 10/31/2014 | 44 | ||||||||||
| Bank of Montreal TriParty Repurchase Agreement (maturing on 11/03/2014 in the amount of $12, collateralized by U.S. Treasury Bond 2.88% - 5.25%, 2029 - 2043, U.S. Treasury Note 0.38% - 4.50%, 2015 - 2022, value of $12) |
||||||||||||
| 12 | 0.08%, 10/31/2014 | 12 | ||||||||||
| Bank of Montreal TriParty Repurchase Agreement (maturing on 11/03/2014 in the amount of $40, collateralized by FHLMC 2.00% - 5.50%, 2022 - 2034, FNMA 2.00% - 4.50%, 2024 - 2039, GNMA 3.00%, 2043, U.S. Treasury Note 4.63%, 2017, value of $41) |
||||||||||||
| 40 | 0.10%, 10/31/2014 | 40 | ||||||||||
| Barclays Capital TriParty Repurchase Agreement (maturing on 11/03/2014 in the amount of $150, collateralized by U.S. Treasury Bond 4.50% - 6.25%, 2023 - 2036, U.S. Treasury Note 1.63% - 2.13%, 2015 - 2019, value of $153) |
||||||||||||
| 150 | 0.08%, 10/31/2014 | 150 | ||||||||||
| Citigroup Global Markets, Inc. TriParty Repurchase Agreement (maturing on 11/03/2014 in the amount of $173, collateralized by U.S. Treasury Bill 0.02%, 2015, U.S. Treasury Bond 3.88% - 11.25%, 2015 - 2040, U.S. Treasury Note 2.00% - 3.38%, 2019 - 2021, value of $176) |
||||||||||||
| 173 | 0.09%, 10/31/2014 | 173 | ||||||||||
| Deutsche Bank Securities TriParty Repurchase Agreement (maturing on 11/03/2014 in the amount of $10, collateralized by U.S. Treasury Note 0.88%, 2017, value of $10) |
||||||||||||
| 10 | 0.13%, 10/31/2014 | 10 | ||||||||||
| RBS Securities, Inc. TriParty Repurchase Agreement (maturing on 11/03/2014 in the amount of $15, collateralized by U.S. Treasury Bond 3.63% - 5.00%, 2037 - 2043, U.S. Treasury Note 2.13%, 2020, value of $15) |
||||||||||||
| 15 | 0.07%, 10/31/2014 | 15 | ||||||||||
| Societe Generale TriParty Repurchase Agreement (maturing on 11/03/2014 in the amount of $155, collateralized by U.S. Treasury Bill 0.02%, 2015, U.S. Treasury Bond 3.75% - 11.25%, 2015 - 2043, U.S. Treasury Note 1.38% - 4.25%, 2015 - 2022, value of $158) |
||||||||||||
| 155 | 0.08%, 10/31/2014 | 155 | ||||||||||
| TD Securities TriParty Repurchase Agreement (maturing on 11/03/2014 in the amount of $300, collateralized by FHLMC 3.00% - 4.00%, 2026 - 2044, FNMA 2.50% - 5.00%, 2025 - 2044, U.S. Treasury Bond 3.50% - 6.50%, 2026 - 2041, U.S. Treasury Note 1.75% - 2.88%, 2018 - 2019, value of $306) |
||||||||||||
| 300 | 0.10%, 10/31/2014 | 300 | ||||||||||
| 901 | ||||||||||||
| Total Short-Term Investments | ||||||||||||
| (Cost $901) | $ | 901 | ||||||||||
| Total Investments | ||||||||||||
| (Cost $64,468) ▲ | 99.9 | % | $ | 72,899 | ||||||||
| Other Assets and Liabilities | 0.1 | % | 99 | |||||||||
| Total Net Assets | 100.0 | % | $ | 72,998 | ||||||||
The accompanying notes are an integral part of these financial statements.
| 8 |
| The Hartford Small/Mid Cap Equity Fund |
| Schedule of Investments – (continued) |
| October 31, 2014 |
| (000’s Omitted) |
Note: Percentage of investments as shown is the ratio of the total market value to total net assets.
Equity industry classifications used in this report are the Global Industry Classification Standard, which was developed by and is the exclusive property and service mark of MSCI, Inc. and Standard & Poor’s.
For Fund compliance purposes, the Fund may not use the same classification system shown in this report as these classifications are used for reporting ease.
| ▲ | At October 31, 2014, the cost of securities for federal income tax purposes was $64,502 and the aggregate gross unrealized appreciation and depreciation based on that cost were: |
| Unrealized Appreciation | $ | 11,337 | ||
| Unrealized Depreciation | (2,940 | ) | ||
| Net Unrealized Appreciation | $ | 8,397 |
| ● | Non-income producing. |
| ╪ | See Significant Accounting Policies of accompanying Notes to Financial Statements regarding valuation of securities. |
| GLOSSARY: (abbreviations used in preceding Schedule of Investments) | |
| Other Abbreviations: | |
| ADR | American Depositary Receipt |
| FHLMC | Federal Home Loan Mortgage Corp. |
| FNMA | Federal National Mortgage Association |
| GNMA | Government National Mortgage Association |
| REIT | Real Estate Investment Trust |
The accompanying notes are an integral part of these financial statements.
| 9 |
| The Hartford Small/Mid Cap Equity Fund |
| Schedule of Investments – (continued) |
| October 31, 2014 |
| (000’s Omitted) |
Investment Valuation Hierarchy Level Summary
October 31, 2014
| Total | Level 1 ♦ | Level 2 ♦ | Level 3 | |||||||||||||
| Assets: | ||||||||||||||||
| Common Stocks ‡ | $ | 71,998 | $ | 71,998 | $ | – | $ | – | ||||||||
| Short-Term Investments | 901 | – | 901 | – | ||||||||||||
| Total | $ | 72,899 | $ | 71,998 | $ | 901 | $ | – | ||||||||
| ♦ | For the year ended October 31, 2014, there were no transfers between Level 1 and Level 2. |
| ‡ | The Fund has all or primarily all of the equity securities categorized in a particular level. Refer to the Schedule of Investments for further industry breakout. |
| Note: | For purposes of reporting transfers between different hierarchy levels, both transfers in and out of each level, as applicable, are shown as if they occurred at the beginning of the period. |
The accompanying notes are an integral part of these financial statements.
| 10 |
| The Hartford Small/Mid Cap Equity Fund |
| Statement of Assets and Liabilities |
| October 31, 2014 |
| (000’s Omitted) |
| Assets: | ||||
| Investments in securities, at market value (cost $64,468) | $ | 72,899 | ||
| Cash | — | |||
| Receivables: | ||||
| Fund shares sold | 138 | |||
| Dividends and interest | 37 | |||
| Other assets | 46 | |||
| Total assets | 73,120 | |||
| Liabilities: | ||||
| Payables: | ||||
| Fund shares redeemed | 77 | |||
| Investment management fees | 10 | |||
| Administrative fees | — | |||
| Distribution fees | 6 | |||
| Accrued expenses | 29 | |||
| Total liabilities | 122 | |||
| Net assets | $ | 72,998 | ||
| Summary of Net Assets: | ||||
| Capital stock and paid-in-capital | $ | 62,991 | ||
| Undistributed net investment income | 349 | |||
| Accumulated net realized gain | 1,227 | |||
| Unrealized appreciation of investments | 8,431 | |||
| Net assets | $ | 72,998 | ||
| Shares authorized | 950,000 | |||
| Par value | $ | 0.001 | ||
| Class A: Net asset value per share/Maximum offering price per share | $13.89/$14.70 | |||
| Shares outstanding | 3,940 | |||
| Net assets | $ | 54,722 | ||
| Class B: Net asset value per share | $ | 13.12 | ||
| Shares outstanding | 238 | |||
| Net assets | $ | 3,119 | ||
| Class C: Net asset value per share | $ | 12.96 | ||
| Shares outstanding | 1,050 | |||
| Net assets | $ | 13,603 | ||
| Class R3: Net asset value per share | $ | 14.21 | ||
| Shares outstanding | 41 | |||
| Net assets | $ | 587 | ||
| Class R4: Net asset value per share | $ | 14.26 | ||
| Shares outstanding | 36 | |||
| Net assets | $ | 516 | ||
| Class R5: Net asset value per share | $ | 14.32 | ||
| Shares outstanding | 14 | |||
| Net assets | $ | 204 | ||
| Class Y: Net asset value per share | $ | 14.31 | ||
| Shares outstanding | 17 | |||
| Net assets | $ | 247 |
The accompanying notes are an integral part of these financial statements.
| 11 |
| The Hartford Small/Mid Cap Equity Fund |
| Statement of Operations |
| For the Year Ended October 31, 2014 |
| (000’s Omitted) |
| Investment Income: | ||||
| Dividends | $ | 1,480 | ||
| Interest | — | |||
| Less: Foreign tax withheld | (3 | ) | ||
| Total investment income | 1,477 | |||
| Expenses: | ||||
| Investment management fees | 541 | |||
| Administrative services fees | ||||
| Class R3 | 1 | |||
| Class R4 | 1 | |||
| Class R5 | — | |||
| Transfer agent fees | ||||
| Class A | 109 | |||
| Class B | 14 | |||
| Class C | 27 | |||
| Class R3 | — | |||
| Class R4 | — | |||
| Class Y | — | |||
| Distribution fees | ||||
| Class A | 134 | |||
| Class B | 37 | |||
| Class C | 134 | |||
| Class R3 | 3 | |||
| Class R4 | 1 | |||
| Custodian fees | — | |||
| Accounting services fees | 10 | |||
| Registration and filing fees | 100 | |||
| Board of Directors' fees | 3 | |||
| Audit fees | 11 | |||
| Other expenses | 22 | |||
| Total expenses (before waivers) | 1,148 | |||
| Expense waivers | (81 | ) | ||
| Transfer agent fee waivers | (3 | ) | ||
| Total waivers | (84 | ) | ||
| Total expenses, net | 1,064 | |||
| Net Investment Income | 413 | |||
| Net Realized Gain on Investments and Foreign Currency Transactions: | ||||
| Net realized gain on investments | 8,712 | |||
| Net realized gain on foreign currency contracts | — | |||
| Net realized gain on other foreign currency transactions | — | |||
| Net Realized Gain on Investments and Foreign Currency Transactions | 8,712 | |||
| Net Changes in Unrealized Depreciation of Investments: | ||||
| Net unrealized depreciation of investments | (2,924 | ) | ||
| Net Changes in Unrealized Depreciation of Investments | (2,924 | ) | ||
| Net Gain on Investments and Foreign Currency Transactions | 5,788 | |||
| Net Increase in Net Assets Resulting from Operations | $ | 6,201 |
The accompanying notes are an integral part of these financial statements.
| 12 |
| The Hartford Small/Mid Cap Equity Fund |
| Statement of Changes in Net Assets |
| (000’s Omitted) |
| For the Year Ended October 31, 2014 | For the Year Ended October 31, 2013 | |||||||
| Operations: | ||||||||
| Net investment income | $ | 413 | $ | 978 | ||||
| Net realized gain on investments and foreign currency transactions | 8,712 | 13,648 | ||||||
| Net unrealized appreciation (depreciation) of investments | (2,924 | ) | 5,667 | |||||
| Net Increase in Net Assets Resulting from Operations | 6,201 | 20,293 | ||||||
| Distributions to Shareholders: | ||||||||
| From net investment income | ||||||||
| Class A | (567 | ) | (456 | ) | ||||
| Class B | (12 | ) | (19 | ) | ||||
| Class C | (67 | ) | (45 | ) | ||||
| Class R3 | (7 | ) | (1 | ) | ||||
| Class R4 | (2 | ) | (4 | ) | ||||
| Class R5 | (3 | ) | (2 | ) | ||||
| Class Y | (3 | ) | (328 | ) | ||||
| Total from net investment income | (661 | ) | (855 | ) | ||||
| From net realized gain on investments | ||||||||
| Class A | (6,823 | ) | — | |||||
| Class B | (586 | ) | — | |||||
| Class C | (1,750 | ) | — | |||||
| Class R3 | (77 | ) | — | |||||
| Class R4 | (22 | ) | — | |||||
| Class R5 | (21 | ) | — | |||||
| Class Y | (29 | ) | — | |||||
| Total from net realized gain on investments | (9,308 | ) | — | |||||
| Total distributions | (9,969 | ) | (855 | ) | ||||
| Capital Share Transactions: | ||||||||
| Class A | 6,005 | (2,281 | ) | |||||
| Class B | (949 | ) | (1,283 | ) | ||||
| Class C | 2,052 | (213 | ) | |||||
| Class R3 | 32 | 385 | ||||||
| Class R4 | 343 | (145 | ) | |||||
| Class R5 | 42 | 2 | ||||||
| Class Y | 33 | (22,752 | ) | |||||
| Net increase (decrease) from capital share transactions | 7,558 | (26,287 | ) | |||||
| Net Increase (Decrease) in Net Assets | 3,790 | (6,849 | ) | |||||
| Net Assets: | ||||||||
| Beginning of period | 69,208 | 76,057 | ||||||
| End of period | $ | 72,998 | $ | 69,208 | ||||
| Undistributed (distributions in excess of) net investment income | $ | 349 | $ | 572 | ||||
The accompanying notes are an integral part of these financial statements.
| 13 |
| The Hartford Small/Mid Cap Equity Fund |
| Notes to Financial Statements |
| October 31, 2014 |
| (000’s Omitted) |
Organization:
The Hartford Mutual Funds, Inc. (“Company”) is an open-end management investment company comprised of forty-two portfolios. Financial statements for The Hartford Small/Mid Cap Equity Fund (the "Fund"), a series of the Company, are included in this report.
The Company is organized under the laws of the State of Maryland and is registered with the Securities and Exchange Commission (“SEC”) under the Investment Company Act of 1940, as amended (“1940 Act”). The Fund is a diversified open-end management investment company. The Fund is an investment company and applies specialized accounting and reporting under Accounting Standards Codification Topic 946, Financial Services - Investment Companies.
Class A shares are sold with a front-end sales charge of up to 5.50%. Class B shares were sold with a contingent deferred sales charge which is assessed on the lesser of the per share net asset value (“NAV”) of the shares at the time of redemption or the original purchase price, and declines from up to 5.00% to zero depending on the period of time the shares are held (see note below regarding the closing of Class B shares). Class C shares are sold with a contingent deferred sales charge of up to 1.00% on shares redeemed within twelve months of purchase. Class R3, R4 and R5 shares, which are offered to employer-sponsored retirement plans, and Class Y shares, which are sold to certain eligible institutional investors, are sold without a sales charge. All classes of shares have identical voting, redemption, dividend, liquidation and other rights and the same terms and conditions, with the exceptions that each class may have different expenses, which may affect performance, and that Class B shares automatically convert to Class A shares after 8 years.
No new or additional investments are allowed in Class B shares of the Fund (including investments through any systematic investment plan). Existing shareholders of Class B shares may continue to hold their Class B shares, exchange their Class B shares for Class B shares of another Hartford Fund (as permitted by existing exchange privileges), or redeem their Class B shares as described in the Fund’s prospectus. Reinstatement privileges with respect to Class B shares are set forth in the Fund's prospectus. For investors electing to reinvest capital gains and dividends, any such capital gains or dividends on Class B shares will continue to be reinvested in Class B shares of the Fund. All Class B share attributes, including the 12b-1 fee, contingent deferred sales charge schedule, and conversion to Class A shares, remain unchanged.
Significant Accounting Policies:
The following is a summary of significant accounting policies of the Fund in the preparation of its financial statements, which are in accordance with United States generally accepted accounting principles (“U.S. GAAP”). The preparation of financial statements in accordance with U.S. GAAP may require management to make estimates and assumptions that affect the reported amounts of assets and liabilities and disclosure of contingent assets and liabilities at the date of the financial statements and the reported amounts of increases and decreases in net assets from operations during the reporting period. Actual results could differ from those estimates.
Determination of Net Asset Value – The NAV of each class of the Fund's shares is determined as of the close of regular trading (normally 4:00 p.m. Eastern Time) (the “NYSE Close”) on each day that the New York Stock Exchange (the “Exchange”) is open (“Valuation Date”). Information that becomes known to the Fund after the NAV has been calculated on a particular day will not generally be used to retroactively adjust the NAV determined earlier that day.
Investment Valuation and Fair Value Measurements – For purposes of calculating the NAV, portfolio investments and other assets held by the Fund's portfolio for which market quotes are readily available are valued at market value. Market value is generally determined on the basis of last reported sales prices or official close price. If no sales are reported, market value is based on quotes obtained from a quotation reporting system, established market makers, or independent pricing services. If market prices are not readily available or are deemed unreliable, the Fund will use the fair value of the investment as determined in good faith under policies and procedures established by and under the supervision of the Company's Board of Directors. Market quotes are considered not readily available where there is an absence of current or reliable market-based data (e.g., trade information or indicative market quotes), including where events occur after the close of the relevant market, but prior to the NYSE Close, that materially affect the values of the Fund's portfolio investments or assets. In addition, market quotes are considered not readily available when, due to extraordinary circumstances, the exchanges or markets on which the investments trade do not open for trading for the entire day and no other market prices are available. There can be no assurance that the Fund could obtain the fair market value assigned to an investment if the Fund were to sell the investment at approximately the time at which the Fund determines its NAV.
| 14 |
| The Hartford Small/Mid Cap Equity Fund |
| Notes to Financial Statements – (continued) |
| October 31, 2014 |
| (000’s Omitted) |
Foreign currency contracts represent agreements to exchange currencies on specific future dates at predetermined rates. Foreign currency contracts are valued using foreign currency exchange rates and forward rates as provided by an independent pricing service on the Valuation Date.
Financial instruments for which prices are not available from an independent pricing service may be valued using market quotations obtained from one or more dealers that make markets in the respective financial instrument in accordance with procedures established by the Company's Board of Directors.
U.S. GAAP defines fair value as the price that the Fund would receive to sell an asset or pay to transfer a liability in an orderly transaction between market participants. The U.S. GAAP fair value measurement standards require disclosure of a fair value hierarchy for each major category of assets and liabilities. Various inputs are used in determining the fair value of the Fund’s investments. These inputs are summarized into three broad hierarchy levels. This hierarchy is based on whether the valuation inputs are observable or unobservable. These levels are:
Level 1 – Quoted prices in active markets for identical investments. Level 1 may include exchange traded instruments, such as domestic equities, some foreign equities, options, futures, mutual funds, exchange traded funds, rights and warrants.
Level 2 – Observable inputs other than Level 1 prices, such as quoted prices for similar investments; quoted prices in markets that are not active; or other inputs that are observable or can be corroborated by observable market data. Level 2 may include debt investments that are traded less frequently than exchange traded instruments and which are valued using independent pricing services; foreign equities, which are principally traded on certain foreign markets and are adjusted daily pursuant to a fair value pricing service in order to reflect an adjustment for the factors occurring after the close of certain foreign markets but before the NYSE Close; senior floating rate interests, which are valued using an aggregate of dealer bids; short-term investments, which are valued at amortized cost; and swaps, which are valued based upon the terms of each swap contract.
Level 3 – Significant unobservable inputs that are supported by limited or no market activity. Level 3 may include financial instruments whose values are determined using indicative market quotes or require significant management judgment or estimation. These unobservable valuation inputs may include estimates for current yields, maturity/duration, prepayment speed, and indicative market quotes for comparable investments along with other assumptions relating to credit quality, collateral value, complexity of the investment structure, general market conditions and liquidity. This category may include investments where trading has been halted or there are certain restrictions on trading. While these investments are priced using unobservable inputs, the valuation of these investments reflects the best available data and management believes the prices are a reasonable representation of exit price.
The Board of Directors of the Company generally reviews and approves the “Procedures for Valuation of Portfolio Securities” at least once a year. These procedures define how investments are to be valued, including the formation and activities of a Valuation Committee. The Valuation Committee is responsible for determining in good faith the fair value of investments when the value cannot be obtained from primary pricing services or alternative sources or if the valuation of an investment as provided by the primary pricing service or alternative source is believed not to reflect the investment’s fair value as of the Valuation Date. Voting members of the Valuation Committee include the Fund's Treasurer or designee and a Vice President of the investment manager or designee. An Assistant Vice President of the Fund with legal expertise or designee is also included on the Valuation Committee as a non-voting advisory member. In addition, the Fund’s Chief Compliance Officer shall designate a member of the compliance group to attend Valuation Committee meetings as a non-voting resource, to monitor for and provide guidance with respect to compliance with these procedures. Two members of the Valuation Committee or their designees, representing different departments, shall constitute a quorum for purposes of permitting the Valuation Committee to take action. The Valuation Committee will consider all relevant factors in determining an investment’s fair value, and may seek the advice of the Fund’s sub-adviser, knowledgeable brokers, and legal counsel in making such determination. The Valuation Committee reports to the Audit Committee of the Company's Board of Directors. The Audit Committee receives quarterly written reports which include details of all fair-valued investments, including the reason for the fair valuation, and an indication, when possible, of the accuracy of the valuation by disclosing the next available reliable public price quotation or the disposition price of such investments (the “look-back” test). The Board of Directors then must consider for ratification all of the fair value determinations made during the previous quarter.
| 15 |
| The Hartford Small/Mid Cap Equity Fund |
| Notes to Financial Statements – (continued) |
| October 31, 2014 |
| (000’s Omitted) |
Valuation levels are not necessarily indicative of the risk associated with investing in such investments. Individual investments within any of the above mentioned asset classes may be assigned a different hierarchical level than those presented above, as individual circumstances dictate.
For additional information, refer to the Investment Valuation Hierarchy Level Summary which follows the Schedule of Investments.
Investment Transactions and Investment Income – Investment transactions are recorded as of the trade date (the date the order to buy or sell is executed) for financial reporting purposes. Investments purchased or sold on a when-issued or delayed-delivery basis may be settled a month or more after the trade date. Realized gains and losses are determined on the basis of identified cost.
Dividend income from domestic securities is accrued on the ex-dividend date. Interest income, including amortization of premium, accretion of discounts and additional principal received in-kind in lieu of cash, is accrued on a daily basis.
Foreign Currency Transactions – Assets and liabilities denominated in currencies other than U.S. dollars are translated into U.S. dollars at the exchange rates in effect on the valuation date. Purchases and sales of investments, income and expenses are translated into U.S. dollars at the exchange rates on the dates of such transactions.
The Fund does not isolate that portion of portfolio investment valuation resulting from fluctuations in the foreign currency exchange rates from the fluctuations arising from changes in the market prices of investments held. Exchange rate fluctuations are included with the net realized and unrealized gain or loss on investments in the accompanying financial statements.
Net realized foreign exchange gains or losses arise from sales of foreign currencies and the difference between asset and liability amounts initially stated in foreign currencies and the U.S. dollar value of the amounts actually received or paid. Net unrealized foreign exchange gains or losses arise from changes in the value of other assets and liabilities at the end of the reporting period, resulting from changes in the exchange rates.
Joint Trading Account – The Fund may invest cash balances into a joint trading account that may be invested in one or more repurchase agreements.
Fund Share Valuation and Dividend Distributions to Shareholders – Orders for the Fund’s shares are executed in accordance with the investment instructions of the shareholders. The NAV of the Fund’s shares is determined as of the close of business on each business day of the Exchange. The NAV is determined separately for each class of shares of the Fund by dividing the Fund’s net assets attributable to that class by the number of shares of the class outstanding. Each class of shares offered by the Fund has equal rights as to assets and voting privileges (except that shareholders of a class have exclusive voting rights regarding any matter relating solely to that class of shares). Income and non-class specific expenses are allocated daily to each class on the basis of the relative net assets of the class. Realized and unrealized gains and losses are allocated daily based on the relative net assets of each class of shares of the Fund.
Orders for the purchase of the Fund’s shares received prior to the close of the Exchange on any day the Exchange is open for business are priced at the NAV determined as of the close of the Exchange. Orders received after the close of the Exchange, or on a day on which the Exchange and/or the Fund is not open for business, are priced at the next determined NAV.
Dividends are declared pursuant to a policy adopted by the Company's Board of Directors based upon the investment performance of the Fund. The policy of the Fund is to pay dividends from net investment income and realized gains, if any, at least once a year.
Net investment income, dividends and distributions from net realized gains and capital are determined in accordance with federal income tax regulations, which may differ from U.S. GAAP with respect to character and timing (see Federal Income Taxes: Distributions and Components of Distributable Earnings and Reclassification of Capital Accounts).
| 16 |
| The Hartford Small/Mid Cap Equity Fund |
| Notes to Financial Statements – (continued) |
| October 31, 2014 |
| (000’s Omitted) |
Securities and Other Investments:
Repurchase Agreements – A repurchase agreement is an agreement by which a counterparty agrees to sell an investment and agrees to repurchase the investment sold from the buyer at a mutually agreed upon time and price. During the period of the repurchase agreement, the counterparty will deposit cash and or securities in a third party custodial account to serve as collateral. At the time the Fund enters into a repurchase agreement, the value of the underlying collateral, including accrued interest, will be equal to or exceed the value of the repurchase agreement. Repurchase agreements expose the Fund to counterparty risk - that is, the risk that the counterparty will not fulfill its obligations. To minimize counterparty risk, the investments that serve to collateralize the repurchase agreement are held by the Fund’s custodian in book entry or physical form in the custodial account of the Fund or in a third party custodial account. Repurchase agreements are valued at cost plus accrued interest, which approximates fair value. Repurchase agreements have master netting arrangements which allow the Fund to offset amounts owed to a counterparty with amounts owed by the counterparty, including any collateral. Upon an event of default under a master repurchase agreement, the non-defaulting party may close out all transactions traded under such agreement and net amounts owed under each transaction to one net amount payable by one party to the other. Absent an event of default, the master repurchase agreement does not result in an offset of reported amounts of assets and liabilities in the Statement of Assets and Liabilities across transactions between the Fund and the applicable counterparty. The Fund, as shown on the Schedule of Investments, had outstanding repurchase agreements and related collateral as of October 31, 2014.
Financial Derivative Instruments:
The following disclosures contain information on how and why the Fund uses derivative instruments, the credit-risk-related contingent features in certain derivative instruments and how derivative instruments affect the Fund’s financial position and results of operations. The location and fair value amounts of these instruments on the Statement of Assets and Liabilities and the realized gains and losses and changes in unrealized gains and losses on the Statement of Operations, each categorized by type of derivative contract, are included in the following Additional Derivative Instrument Information footnote. The derivative instruments outstanding as of year-end are disclosed in the notes to the Schedule of Investments, if applicable. The amounts of realized gains and losses and changes in unrealized gains and losses on derivative instruments during the year are disclosed in the Statement of Operations.
Foreign Currency Contracts – The Fund may enter into foreign currency contracts that obligate the Fund to purchase or sell currencies at specified future dates. Foreign currency contracts are used to hedge the currency exposure associated with some or all of the Fund’s investments and/or as part of an investment strategy. Foreign currency contracts are marked to market daily and the change in value is recorded by the Fund as an unrealized gain or loss. The Fund will record a realized gain or loss when the foreign currency contract is settled.
Foreign currency contracts involve elements of market risk in excess of the amounts reflected in the Statement of Assets and Liabilities. In addition, risks may arise upon entering into these contracts from the potential inability of the counterparties to meet the terms of the contracts and from unanticipated movements in the value of the foreign currencies relative to the U.S. dollar. The Fund had no outstanding foreign currency contracts as of October 31, 2014.
Additional Derivative Instrument Information:
The volume of derivative activity was minimal during the year ended October 31, 2014.
The Effect of Derivative Instruments on the Statement of Operations for the year ended October 31, 2014:
| Risk Exposure Category | ||||||||||||||||||||||||||||
Interest Rate | Foreign | Credit | Equity | Commodity | Other | Total | ||||||||||||||||||||||
| Realized Gain on Derivatives Recognized as a Result of Operations: | ||||||||||||||||||||||||||||
| Net realized gain on foreign currency contracts | $ | — | $ | — | $ | — | $ | — | $ | — | $ | — | $ | — | ||||||||||||||
| Total | $ | — | $ | — | $ | — | $ | — | $ | — | $ | — | $ | — | ||||||||||||||
| 17 |
| The Hartford Small/Mid Cap Equity Fund |
| Notes to Financial Statements – (continued) |
| October 31, 2014 |
| (000’s Omitted) |
Principal Risks:
The Fund may be exposed to counterparty risk, or the risk that an institution or other entity with which the Fund has unsettled or open transactions will default.
If the Fund invests directly in foreign currencies or in securities that trade in, and receive revenues in, foreign currencies, or in derivatives that provide exposure to foreign currencies, it will be subject to the risk that those currencies will decline in value relative to the base currency (U.S. dollars) of the Fund, or, in the case of hedging positions, that the Fund’s base currency will decline in value relative to the currency being hedged. Currency rates in foreign countries may fluctuate significantly over short periods of time for a number of reasons, including changes in interest rates, intervention (or the failure to intervene) by U.S. or foreign governments, central banks or supranational entities, such as the International Monetary Fund, or by the imposition of currency controls or other political developments in the United States or abroad. As a result, the Fund’s investments in foreign currency denominated securities may reduce the returns of the Fund. The market values of equity securities, such as common stocks and preferred stocks, or equity related investments, such as futures and options, may decline due to general market conditions which are not specifically related to a particular company, such as real or perceived adverse economic conditions, changes in the general outlook for corporate earnings, changes in interest or currency rates or adverse investor sentiment generally. The market value of equity securities may also decline due to factors which affect a particular industry or industries, such as labor shortages or increased production costs and competitive conditions within an industry. Equity securities and equity related investments generally have greater market price volatility than fixed income securities.
Federal Income Taxes:
Federal Income Taxes – For federal income tax purposes, the Fund intends to continue to qualify as a Regulated Investment Company ("RIC") under Subchapter M of the Internal Revenue Code (“IRC”) by distributing substantially all of its taxable net investment income and net realized capital gains to its shareholders and otherwise complying with the requirements of the IRC. The Fund has distributed substantially all of its income and capital gains in prior years, if applicable, and intends to distribute substantially all of its income and capital gains during the calendar year ending December 31, 2014. Accordingly, no provision for federal income or excise taxes has been made in the accompanying financial statements. Distributions from short-term capital gains are treated as ordinary income distributions for federal income tax purposes.
Net Investment Income (Loss), Net Realized Gains (Losses) and Distributions – Net investment income (loss) and net realized gains (losses) may differ for financial statement and tax purposes primarily because of losses deferred due to wash sale adjustments, foreign currency gains and losses, adjustments related to Passive Foreign Investment Companies ("PFICs"), Real Estate Investment Trusts ("REITs"), RICs, certain derivatives and partnerships. The character of distributions made during the year from net investment income or net realized gains may differ from their ultimate characterization for federal income tax purposes. Also, due to the timing of dividend distributions, the fiscal year in which amounts are distributed may differ from the year that the income or realized gains (losses) were recorded by the Fund.
Distributions and Components of Distributable Earnings – The tax character of distributions paid by the Fund for the periods indicated is as follows (as adjusted for dividends payable, if applicable):
| For the Year Ended October 31, 2014 | For the Year Ended October 31, 2013 | |||||||
| Ordinary Income | $ | 4,288 | $ | 855 | ||||
| Long-Term Capital Gains ‡ | 5,681 | — | ||||||
| ‡ | The Fund designates these distributions as long-term capital gain dividends pursuant to IRC Sec. 852(b)(3)(C). |
| 18 |
| The Hartford Small/Mid Cap Equity Fund |
| Notes to Financial Statements – (continued) |
| October 31, 2014 |
| (000’s Omitted) |
As of October 31, 2014, the Fund’s components of distributable earnings (deficit) on a tax basis are as follows:
| Amount | ||||
| Undistributed Ordinary Income | $ | 765 | ||
| Undistributed Long-Term Capital Gain | 6,428 | |||
| Accumulated Capital and Other Losses* | (5,583 | ) | ||
| Unrealized Appreciation† | 8,397 | |||
| Total Accumulated Earnings | $ | 10,007 | ||
| * | The Fund has capital loss carryforwards that are identified in the Capital Loss Carryforward note that follows. |
| † | Differences between book-basis and tax-basis unrealized appreciation (depreciation) may be attributable to the losses deferred due to wash sale adjustments, foreign currency gains and losses, adjustments related to PFICs, REITs, RICs, certain derivatives and partnerships. |
Reclassification of Capital Accounts – The Fund may record reclassifications in its capital accounts. These reclassifications have no impact on the total net assets of the Fund. The reclassifications are a result of permanent differences between U.S. GAAP and tax accounting for such items as foreign currency, PFICs, expiration or utilization of capital loss carryforwards or net operating losses. Adjustments are made to reflect the impact these items have on current and future distributions to shareholders. Therefore, the source of the Fund’s distributions may be shown in the accompanying Statement of Changes in Net Assets as from undistributed net investment income, from accumulated net realized gains on investments or from capital depending on the type of book and tax differences that exist. For the year ended October 31, 2014, the Fund recorded reclassifications to increase (decrease) the accounts listed below:
| Amount | ||||
| Undistributed Net Investment Income (Loss) | $ | 25 | ||
| Accumulated Net Realized Gain (Loss) | (25 | ) | ||
Capital Loss Carryforward – On December 22, 2010, the Regulated Investment Company Modernization Act of 2010 (the “Act”) was enacted, which made changes to the capital loss carryforward rules. The changes are effective for taxable years beginning after the date of enactment. Under the Act, funds are permitted to carry forward capital losses for an unlimited period. However, any losses incurred during those future taxable years will be required to be utilized prior to the losses incurred in pre-enactment taxable years, which carry an expiration date. As a result of this ordering rule, pre-enactment capital loss carryforwards may be more likely to expire unused. Additionally, post-enactment capital loss carryforwards retain their character as either short-term or long-term capital losses rather than being considered all short-term as permitted under prior regulation.
At October 31, 2014 (tax year end), the Fund had capital loss carryforwards for U.S. federal income tax purposes as follows:
| Year of Expiration | Amount | |||
| 2017 | $ | 5,583 | ||
| Total | $ | 5,583 | ||
As a result of mergers in the Fund, certain provisions in the IRC may limit the future utilization of capital losses. During the year ended October 31, 2014, the Fund utilized $1,862 of prior year capital loss carryforwards.
Accounting for Uncertainty in Income Taxes – The Fund has adopted financial reporting rules that require the Fund to analyze all open tax years, as defined by the statute of limitations, for all major jurisdictions. Generally, tax authorities can examine all tax returns filed for the last three years. The Fund does not have an examination in progress.
The Fund has reviewed all open tax years and major jurisdictions and concluded that these financial reporting rules had no effect on the Fund’s financial position or results of operations. There is no tax liability resulting from unrecognized tax benefits relating to uncertain income tax positions taken or expected to be taken on the tax return for the fiscal year ended October 31, 2014. The Fund
| 19 |
| The Hartford Small/Mid Cap Equity Fund |
| Notes to Financial Statements – (continued) |
| October 31, 2014 |
| (000’s Omitted) |
is also not aware of any tax positions for which it is reasonably possible that the total amounts of unrecognized tax benefits will significantly change in the next twelve months.
Expenses:
Investment Management Agreement – Hartford Funds Management Company, LLC ("HFMC") serves as the Fund’s investment manager pursuant to an Investment Management Agreement with the Company. HFMC is an indirect wholly owned subsidiary of The Hartford Financial Services Group, Inc. ("The Hartford"). The investment manager has overall investment supervisory responsibility for the Fund. In addition, the investment manager provides administrative personnel, services, equipment, facilities and office space for proper operation of the Fund. HFMC has contracted with Wellington Management Company, LLP ("Wellington Management") under a sub-advisory agreement for the provision of day-to-day investment management services to the Fund in accordance with the Fund’s investment objective and policies. The Fund pays a fee to the investment manager, a portion of which may be used to compensate Wellington Management.
The schedule below reflects the rates of compensation paid to the investment manager for investment management services rendered as of October 31, 2014; the rates are accrued daily and paid monthly:
| Average Daily Net Assets | Annual Fee |
| On first $500 million | 0.75% |
| On next $500 million | 0.70% |
| On next $2 billion | 0.65% |
| On next $2 billion | 0.64% |
| On next $5 billion | 0.63% |
| Over $10 billion | 0.62% |
Accounting Services Agreement – Pursuant to the Fund Accounting Agreement between HFMC and the Company, on behalf of the Fund, HFMC provides accounting services to the Fund and receives monthly compensation based on the Fund’s average daily net assets at the rates set forth below. The Fund’s accounting services fees are accrued daily and paid monthly.
| Average Daily Net Assets | Annual Fee |
| On first $5 billion | 0.014% |
| On next $5 billion | 0.012% |
| Over $10 billion | 0.010% |
Operating Expenses – Allocable expenses incurred by the Company are allocated to each Fund and allocated to classes within the Fund in proportion to the average daily net assets of the Fund and each class, except where allocation of certain expenses is more fairly made directly to the Fund or to specific classes within a Fund. As of October 31, 2014, HFMC contractually limited the total operating expenses of this Fund, exclusive of taxes, interest expense, brokerage commissions, acquired fund fees and expenses and extraordinary expenses, through February 28, 2015 as follows:
| Class A | Class B | Class C | Class R3 | Class R4 | Class R5 | Class Y |
| 1.30% | 2.05% | 2.05% | 1.50% | 1.20% | 0.90% | 0.85% |
Distribution and Service Plan for Class A, B, C, R3 and R4 Shares – Hartford Funds Distributors, LLC ("HFD"), an indirect wholly owned subsidiary of The Hartford, is the principal underwriter and distributor of the Fund. HFD is engaged in distribution activities, which include marketing and distribution of shares through broker/dealers, financing distribution costs and maintaining financial books and records. For the year ended October 31, 2014, HFD received front-end load sales charges of $113 and contingent deferred sales charges of $2 from the Fund.
The Fund has adopted a Distribution and Service Plan in accordance with Rule 12b-1 of the 1940 Act to compensate the distributor (HFD) for activities intended to result in the sale and distribution of Class A, B, C, R3 and R4 shares and for providing services for
| 20 |
| The Hartford Small/Mid Cap Equity Fund |
| Notes to Financial Statements – (continued) |
| October 31, 2014 |
| (000’s Omitted) |
shareholders. The Rule 12b-1 plan applicable to Class A shares of the Fund provides for payment of a Rule 12b-1 fee of 0.25% of average daily net assets. Some or all of the fee may be used for shareholder servicing expenses with the remainder used for distribution expenses. Under the Class B Plan, the Fund pays the distributor 1.00% of the average daily net assets of Class B shares that are outstanding for 8 years or less, 0.25% of which is a fee for services provided to existing shareholders with the remainder used for distribution expenses. Some or the entire Rule 12b-1 fee for Class B shares may be remitted to broker/dealers for distribution and/or shareholder account services. After eight years, Class B shares convert to Class A shares. Upon conversion to Class A shares, the Class A plan described above will apply to those shares. Under the Class C Plan, the Fund pays the distributor 1.00% of the average daily net assets of Class C shares outstanding, 0.25% of which is intended as a fee for services provided to existing shareholders with the remainder used for distribution expenses. For Class C shares, some or the entire fee may be remitted to broker/dealers for distribution and/or shareholder account services. Class R3 shares have a distribution fee of 0.50% of average daily net assets and Class R4 shares have a distribution fee of 0.25% of average daily net assets. For Class R3 and R4 shares, some or the entire fee may be remitted to broker/dealers for distribution and/or shareholder account services. The Fund’s 12b-1 fees are accrued daily and paid monthly or at such other intervals as the Board of Directors may determine.
Other Related Party Transactions – Certain officers of the Fund are directors and/or officers of HFMC and/or The Hartford or its subsidiaries. For the year ended October 31, 2014, a portion of the Fund’s Chief Compliance Officer’s compensation was paid by all of the investment companies in the Hartford fund complex. The portion allocated to the Fund, as represented in other expenses on the Statement of Operations, rounds to zero. Hartford Administrative Services Company (“HASCO”), an indirect wholly-owned subsidiary of The Hartford, provides transfer agent services to the Fund. HASCO has contractually agreed to reimburse any portion of the transfer agency fees over 0.30% of average daily net assets per fiscal year for each class. Any transfer agency fee reimbursement is determined before considering the contractual operating expense limitation. For providing such services, HASCO is compensated on a per account basis that varies by account type, except with respect to Class Y, for which it is compensated based on average daily net assets. The amount paid to HASCO and any related contractual reimbursement amounts, if applicable, can be found in the Statement of Operations. These fees are accrued daily and paid monthly.
Administrative services fees are paid to HASCO for third-party recordkeeping services that are payable as a percentage of net assets in the amount of up to 0.20%, 0.15% and 0.10% for Classes R3, R4 and R5 shares, respectively. The total administrative services fees are shown on the Statement of Operations. These fees are accrued daily and paid monthly.
Affiliate Holdings:
As of October 31, 2014, affiliates of The Hartford had ownership of shares in the Fund as follows:
| Percentage of Class | Percentage of Fund | |||||||
| Class R4 | 36 | % | — | %* | ||||
| Class R5 | 91 | — | * | |||||
| Class Y | 99 | — | * | |||||
| * | Percentage rounds to zero. |
Investment Transactions:
For the year ended October 31, 2014, the cost of purchases and proceeds from sales of investment securities (excluding short-term investments) were as follows:
| Excluding U.S. Government Obligations | U.S. Government Obligations | Total | ||||||||||
| Cost of Purchases | $ | 82,738 | $ | — | $ | 82,738 | ||||||
| Sales Proceeds | 84,603 | — | 84,603 | |||||||||
| 21 |
| The Hartford Small/Mid Cap Equity Fund |
| Notes to Financial Statements – (continued) |
| October 31, 2014 |
| (000’s Omitted) |
Capital Share Transactions:
The following information is for the year ended October 31, 2014, and the year ended October 31, 2013:
For the Year Ended October 31, 2014 | For the Year Ended October 31, 2013 | |||||||||||||||||||||||||||||||
Shares Sold | Shares Issued | Shares | Net Increase (Decrease) of Shares | Shares Sold | Shares Issued | Shares | Net Increase (Decrease) of Shares | |||||||||||||||||||||||||
| Class A | ||||||||||||||||||||||||||||||||
| Shares | 630 | 550 | (719 | ) | 461 | 833 | 38 | (1,072 | ) | (201 | ) | |||||||||||||||||||||
| Amount | $ | 8,587 | $ | 7,187 | $ | (9,769 | ) | $ | 6,005 | $ | 10,872 | $ | 440 | $ | (13,593 | ) | $ | (2,281 | ) | |||||||||||||
| Class B | ||||||||||||||||||||||||||||||||
| Shares | 5 | 46 | (121 | ) | (70 | ) | 11 | 1 | (115 | ) | (103 | ) | ||||||||||||||||||||
| Amount | $ | 53 | $ | 574 | $ | (1,576 | ) | $ | (949 | ) | $ | 134 | $ | 18 | $ | (1,435 | ) | $ | (1,283 | ) | ||||||||||||
| Class C | ||||||||||||||||||||||||||||||||
| Shares | 194 | 141 | (168 | ) | 167 | 139 | 4 | (168 | ) | (25 | ) | |||||||||||||||||||||
| Amount | $ | 2,481 | $ | 1,719 | $ | (2,148 | ) | $ | 2,052 | $ | 1,757 | $ | 43 | $ | (2,013 | ) | $ | (213 | ) | |||||||||||||
| Class R3 | ||||||||||||||||||||||||||||||||
| Shares | 15 | 6 | (20 | ) | 1 | 29 | — | (2 | ) | 27 | ||||||||||||||||||||||
| Amount | $ | 226 | $ | 82 | $ | (276 | ) | $ | 32 | $ | 417 | $ | 1 | $ | (33 | ) | $ | 385 | ||||||||||||||
| Class R4 | ||||||||||||||||||||||||||||||||
| Shares | 24 | 2 | (1 | ) | 25 | 1 | — | (13 | ) | (12 | ) | |||||||||||||||||||||
| Amount | $ | 329 | $ | 24 | $ | (10 | ) | $ | 343 | $ | 8 | $ | 3 | $ | (156 | ) | $ | (145 | ) | |||||||||||||
| Class R5 | ||||||||||||||||||||||||||||||||
| Shares | 1 | 2 | — | 3 | — | — | — | — | ||||||||||||||||||||||||
| Amount | $ | 18 | $ | 24 | $ | — | $ | 42 | $ | — | $ | 2 | $ | — | $ | 2 | ||||||||||||||||
| Class Y | ||||||||||||||||||||||||||||||||
| Shares | — | 2 | — | 2 | 166 | 28 | (1,938 | ) | (1,744 | ) | ||||||||||||||||||||||
| Amount | $ | 1 | $ | 32 | $ | — | $ | 33 | $ | 2,079 | $ | 328 | $ | (25,159 | ) | $ | (22,752 | ) | ||||||||||||||
| Total | ||||||||||||||||||||||||||||||||
| Shares | 869 | 749 | (1,029 | ) | 589 | 1,179 | 71 | (3,308 | ) | (2,058 | ) | |||||||||||||||||||||
| Amount | $ | 11,695 | $ | 9,642 | $ | (13,779 | ) | $ | 7,558 | $ | 15,267 | $ | 835 | $ | (42,389 | ) | $ | (26,287 | ) | |||||||||||||
The following reflects the conversion of Class B shares into Class A shares (reflected as Class A shares sold) for the year ended October 31, 2014, and the year ended October 31, 2013:
| Shares | Dollars | |||||||
| For the Year Ended October 31, 2014 | 41 | $ | 562 | |||||
| For the Year Ended October 31, 2013 | 38 | $ | 507 | |||||
Line of Credit:
The Fund is one of several Hartford Funds that participate in a $500 million committed revolving line of credit facility. The facility is to be used for temporary or emergency purposes. Under the arrangement, the funds are required to own securities having a market value in excess of 300% of the total bank borrowings. The interest rate on borrowings varies depending on the nature of the loan. The facility also requires a fee to be paid based on the amount of the commitment. This commitment fee is allocated to all the funds participating in the line of credit based on the average net assets of the funds. During the year ended October 31, 2014, the Fund did not have any borrowings under this facility.
Pending Legal Proceedings:
On February 25, 2011, Jennifer L. Kasilag, Louis Mellinger, Judith M. Menendez, Jacqueline M. Robinson, and Linda A. Russell filed a derivative lawsuit against Hartford Investment Financial Services, LLC (“HIFSCO”) (now known as HFD) on behalf of six Hartford retail mutual funds in the United States District Court for the District of New Jersey, alleging that HIFSCO received excessive advisory and distribution fees in violation of its statutory fiduciary duty under Section 36(b) of the 1940 Act when serving as investment manager and principal underwriter, respectively, to the Hartford retail mutual funds. Although this action was purportedly filed on behalf of certain of the Hartford Funds, none of the Hartford Funds is itself a defendant to the suit. HIFSCO moved to dismiss and, in September 2011, the motion was granted in part and denied in part, with leave to amend the complaint. In November 2011, plaintiffs filed an amended complaint on
| 22 |
| The Hartford Small/Mid Cap Equity Fund |
| Notes to Financial Statements – (continued) |
| October 31, 2014 |
| (000’s Omitted) |
behalf of certain Hartford retail mutual funds, The Hartford Global Health Fund (now known as The Hartford Healthcare Fund), The Hartford Conservative Allocation Fund, The Hartford Growth Opportunities Fund, The Hartford Inflation Plus Fund, The Hartford Advisers Fund (now known as The Hartford Balanced Fund), and The Hartford Capital Appreciation Fund. Plaintiffs seek to rescind the investment management agreements and distribution plans between HIFSCO and these funds and to recover the total fees charged thereunder or, in the alternative, to recover any improper compensation HIFSCO received, in addition to lost earnings. HIFSCO filed a partial motion to dismiss the amended complaint and, in December 2012, the court dismissed without prejudice the claims regarding distribution fees and denied the motion with respect to the advisory fees claims. HIFSCO disputes the allegations and intends to defend vigorously.
In March 2014, the plaintiffs filed a new complaint that added as new plaintiffs The Hartford Floating Rate Fund and The Hartford Small Company Fund and named as a defendant HFMC, which assumed the role as investment manager to the funds as of January 2013. HFMC and HIFSCO dispute the allegations and intend to defend vigorously.
No accrual for litigation relating to this matter has been recorded in the financial statements of the Fund because the Fund is not party to the suit.
Indemnifications:
Under the Company's organizational documents, the Company shall indemnify its officers and directors to the full extent required or permitted under Maryland General Corporation Law and the federal securities laws. In addition, the Company, on behalf of the Fund, may enter into contracts that contain a variety of indemnifications. The Company's maximum exposure under these arrangements is unknown. However, as of the date of these financial statements, the Company has not had prior claims or losses pursuant to these contracts and expects the risk of loss to be remote.
Subsequent Event:
Effective December 1, 2014, pursuant to a sub-transfer agency agreement between HASCO and Boston Financial Data Services, Inc. (“BFDS”), HASCO has delegated certain transfer agent, dividend disbursing agent and shareholder servicing agent functions to BFDS. The costs and expenses of such delegation are borne by HASCO, not by the Fund.
| 23 |
| The Hartford Small/Mid Cap Equity Fund |
| Financial Highlights |
| - Selected Per-Share Data - (A) | - Ratios and Supplemental Data - | |||||||||||||||||||||||||||||||||||||||||||||||||||
| Class | Net Asset Value at Beginning of Period | Net Investment Income (Loss) | Net Realized and Unrealized Gain (Loss) on Invest- ments | Total from Investment Operations | Dividends from Net Investment Income | Distribu- tions from Realized Capital Gains | Total Dividends and Distributions | Net Asset Value at End of Period | Total Return(B) | Net Assets at End of Period (000's) | Ratio of Expenses to Average Net Assets Before Adjust- ments(C) | Ratio of Expenses to Average Net Assets After Adjust- ments(C) | Ratio of Net Investment Income (Loss) to Average Net Assets | |||||||||||||||||||||||||||||||||||||||
| For the Year Ended October 31, 2014 | ||||||||||||||||||||||||||||||||||||||||||||||||||||
| A | $ | 14.77 | $ | 0.10 | $ | 1.11 | $ | 1.21 | $ | (0.14 | ) | $ | (1.95 | ) | $ | (2.09 | ) | $ | 13.89 | 9.22 | % | $ | 54,722 | 1.41 | % | 1.30 | % | 0.75 | % | |||||||||||||||||||||||
| B | 14.06 | – | 1.05 | 1.05 | (0.04 | ) | (1.95 | ) | (1.99 | ) | 13.12 | 8.39 | 3,119 | 2.32 | 2.05 | 0.01 | ||||||||||||||||||||||||||||||||||||
| C | 13.94 | – | 1.03 | 1.03 | (0.06 | ) | (1.95 | ) | (2.01 | ) | 12.96 | 8.39 | 13,603 | 2.16 | 2.05 | – | ||||||||||||||||||||||||||||||||||||
| R3 | 15.10 | 0.07 | 1.14 | 1.21 | (0.15 | ) | (1.95 | ) | (2.10 | ) | 14.21 | 8.99 | 587 | 1.70 | 1.50 | 0.53 | ||||||||||||||||||||||||||||||||||||
| R4 | 15.10 | 0.11 | 1.14 | 1.25 | (0.14 | ) | (1.95 | ) | (2.09 | ) | 14.26 | 9.31 | 516 | 1.37 | 1.20 | 0.81 | ||||||||||||||||||||||||||||||||||||
| R5 | 15.16 | 0.16 | 1.14 | 1.30 | (0.19 | ) | (1.95 | ) | (2.14 | ) | 14.32 | 9.62 | 204 | 1.05 | 0.90 | 1.14 | ||||||||||||||||||||||||||||||||||||
| Y | 15.14 | 0.17 | 1.14 | 1.31 | (0.19 | ) | (1.95 | ) | (2.14 | ) | 14.31 | 9.75 | 247 | 0.96 | 0.85 | 1.20 | ||||||||||||||||||||||||||||||||||||
| For the Year Ended October 31, 2013 | ||||||||||||||||||||||||||||||||||||||||||||||||||||
| A | $ | 11.21 | $ | 0.19 | $ | 3.50 | $ | 3.69 | $ | (0.13 | ) | $ | – | $ | (0.13 | ) | $ | 14.77 | 33.23 | % | $ | 51,393 | 1.43 | % | 1.30 | % | 1.48 | % | ||||||||||||||||||||||||
| B | 10.68 | 0.09 | 3.34 | 3.43 | (0.05 | ) | – | (0.05 | ) | 14.06 | 32.21 | 4,337 | 2.35 | 2.05 | 0.77 | |||||||||||||||||||||||||||||||||||||
| C | 10.60 | 0.09 | 3.30 | 3.39 | (0.05 | ) | – | (0.05 | ) | 13.94 | 32.12 | 12,315 | 2.18 | 2.05 | 0.73 | |||||||||||||||||||||||||||||||||||||
| R3 | 11.47 | 0.14 | 3.61 | 3.75 | (0.12 | ) | – | (0.12 | ) | 15.10 | 32.93 | 598 | 1.68 | 1.50 | 1.05 | |||||||||||||||||||||||||||||||||||||
| R4 | 11.48 | 0.23 | 3.55 | 3.78 | (0.16 | ) | – | (0.16 | ) | 15.10 | 33.25 | 172 | 1.34 | 1.20 | 1.75 | |||||||||||||||||||||||||||||||||||||
| R5 | 11.51 | 0.25 | 3.58 | 3.83 | (0.18 | ) | – | (0.18 | ) | 15.16 | 33.71 | 169 | 1.04 | 0.90 | 1.87 | |||||||||||||||||||||||||||||||||||||
| Y | 11.51 | 0.29 | 3.53 | 3.82 | (0.19 | ) | – | (0.19 | ) | 15.14 | 33.59 | 224 | 0.93 | 0.85 | 2.33 | |||||||||||||||||||||||||||||||||||||
| For the Year Ended October 31, 2012 (D) | ||||||||||||||||||||||||||||||||||||||||||||||||||||
| A | $ | 10.10 | $ | 0.08 | $ | 1.03 | $ | 1.11 | $ | – | $ | – | $ | – | $ | 11.21 | 10.99 | % | $ | 41,266 | 1.44 | % | 1.30 | % | 0.69 | % | ||||||||||||||||||||||||||
| B | 9.69 | (0.01 | ) | 1.00 | 0.99 | – | – | – | 10.68 | 10.22 | 4,391 | 2.38 | 2.05 | (0.06 | ) | |||||||||||||||||||||||||||||||||||||
| C | 9.62 | (0.01 | ) | 0.99 | 0.98 | – | – | – | 10.60 | 10.19 | 9,624 | 2.21 | 2.05 | (0.06 | ) | |||||||||||||||||||||||||||||||||||||
| R3 | 10.35 | 0.05 | 1.07 | 1.12 | – | – | – | 11.47 | 10.82 | 144 | 1.65 | 1.50 | 0.52 | |||||||||||||||||||||||||||||||||||||||
| R4 | 10.36 | 0.09 | 1.06 | 1.15 | (0.03 | ) | – | (0.03 | ) | 11.48 | 11.11 | 262 | 1.35 | 1.20 | 0.90 | |||||||||||||||||||||||||||||||||||||
| R5 | 10.36 | 0.12 | 1.07 | 1.19 | (0.04 | ) | – | (0.04 | ) | 11.51 | 11.48 | 127 | 1.03 | 0.90 | 1.11 | |||||||||||||||||||||||||||||||||||||
| Y | 10.36 | 0.23 | 0.96 | 1.19 | (0.04 | ) | – | (0.04 | ) | 11.51 | 11.49 | 20,243 | 0.90 | 0.85 | 1.01 | |||||||||||||||||||||||||||||||||||||
| For the Year Ended October 31, 2011 | ||||||||||||||||||||||||||||||||||||||||||||||||||||
| A | $ | 9.37 | $ | 0.03 | $ | 0.73 | $ | 0.76 | $ | (0.03 | ) | $ | – | $ | (0.03 | ) | $ | 10.10 | 8.09 | % | $ | 44,655 | 1.36 | % | 1.30 | % | 0.27 | % | ||||||||||||||||||||||||
| B | 9.04 | (0.05 | ) | 0.70 | 0.65 | – | – | – | 9.69 | 7.19 | 4,821 | 2.31 | 2.05 | (0.47 | ) | |||||||||||||||||||||||||||||||||||||
| C | 8.97 | (0.05 | ) | 0.70 | 0.65 | – | – | – | 9.62 | 7.25 | 9,702 | 2.13 | 2.05 | (0.48 | ) | |||||||||||||||||||||||||||||||||||||
| R3(E) | 9.13 | – | 1.22 | 1.22 | – | – | – | 10.35 | 13.36 | (F) | 113 | 1.61 | (G) | 1.50 | (G) | ( 0.40 | )(G) | |||||||||||||||||||||||||||||||||||
| R4(E) | 9.13 | – | 1.23 | 1.23 | – | – | – | 10.36 | 13.47 | (F) | 113 | 1.31 | (G) | 1.20 | (G) | ( 0.12 | )(G) | |||||||||||||||||||||||||||||||||||
| R5(E) | 9.13 | – | 1.23 | 1.23 | – | – | – | 10.36 | 13.47 | (F) | 114 | 1.01 | (G) | 0.90 | (G) | 0.17 | (G) | |||||||||||||||||||||||||||||||||||
| Y | 9.60 | 0.07 | 0.76 | 0.83 | (0.07 | ) | – | (0.07 | ) | 10.36 | 8.61 | 88,130 | 0.87 | 0.85 | 0.68 | |||||||||||||||||||||||||||||||||||||
See Portfolio Turnover information on the next page.
| 24 |
| The Hartford Small/Mid Cap Equity Fund |
| Financial Highlights – (continued) |
| - Selected Per-Share Data - (A) | - Ratios and Supplemental Data - | |||||||||||||||||||||||||||||||||||||||||||||||||||
| Class | Net Asset Value at Beginning of Period | Net Investment Income (Loss) | Net Realized and Unrealized Gain (Loss) on Invest- ments | Total from Investment Operations | Dividends from Net Investment Income | Distribu- tions from Realized Capital Gains | Total Dividends and Distributions | Net Asset Value at End of Period | Total Return(B) | Net Assets at End of Period (000's) | Ratio of Expenses to Average Net Assets Before Adjust- ments(C) | Ratio of Expenses to Average Net Assets After Adjust- ments(C) | Ratio of Net Investment Income (Loss) to Average Net Assets | |||||||||||||||||||||||||||||||||||||||
| For the Year Ended October 31, 2010 | ||||||||||||||||||||||||||||||||||||||||||||||||||||
| A | $ | 7.49 | $ | 0.02 | $ | 1.86 | $ | 1.88 | $ | – | $ | – | $ | – | $ | 9.37 | 25.10 | % | $ | 46,068 | 1.45 | % | 1.31 | % | 0.19 | % | ||||||||||||||||||||||||||
| B | 7.27 | (0.05 | ) | 1.82 | 1.77 | – | – | – | 9.04 | 24.35 | 5,420 | 2.39 | 2.06 | (0.55 | ) | |||||||||||||||||||||||||||||||||||||
| C | 7.21 | (0.04 | ) | 1.80 | 1.76 | – | – | – | 8.97 | 24.41 | 10,025 | 2.22 | 2.06 | (0.56 | ) | |||||||||||||||||||||||||||||||||||||
| Y | 7.64 | 0.05 | 1.91 | 1.96 | – | – | – | 9.60 | 25.65 | 42,540 | 0.89 | 0.87 | 0.65 | |||||||||||||||||||||||||||||||||||||||
| (A) | Information presented relates to a share outstanding throughout the indicated period. Net investment income (loss) per share amounts are calculated based on average shares outstanding unless otherwise noted. |
| (B) | Assumes initial investment at net asset value at the beginning of each period, reinvestment of all distributions, the complete redemption of the investment at net asset value at the end of each period and no sales charge. Total return would be reduced if sales charges were taken into account. |
| (C) | Adjustments include waivers and reimbursements, if applicable. |
| (D) | Net investment income (loss) per share amounts have been calculated using the SEC method. |
| (E) | Commenced operations on September 30, 2011. |
| (F) | Not annualized. |
| (G) | Annualized. |
| Portfolio Turnover Rate for All Share Classes | ||||
| For the Year Ended October 31, 2014 | 116 | % | ||
| For the Year Ended October 31, 2013 | 140 | |||
| For the Year Ended October 31, 2012 | 121 | |||
| For the Year Ended October 31, 2011 | 202 | |||
| For the Year Ended October 31, 2010 | 399 | (A) | ||
| (A) | During the year ended October 31, 2010, the Fund incurred $45.6 million in purchases associated with the transition of assets from The Hartford Select MidCap Value Fund, which merged into the Fund on February 19, 2010. These purchases are excluded from the portfolio turnover calculation. |
| 25 |
| Report of Independent Registered Public Accounting Firm |
| The Board of Directors and Shareholders of |
| The Hartford Mutual Funds, Inc. |
We have audited the accompanying statement of assets and liabilities, including the schedule of investments, of The Hartford Small/Mid Cap Equity Fund (one of the portfolios constituting The Hartford Mutual Funds, Inc. (the Funds)) as of October 31, 2014, and the related statement of operations for the year then ended, the statements of changes in net assets for each of the two years in the period then ended, and the financial highlights for the periods indicated therein. These financial statements and financial highlights are the responsibility of the Funds’ management. Our responsibility is to express an opinion on these financial statements and financial highlights based on our audits.
We conducted our audits in accordance with the standards of the Public Company Accounting Oversight Board (United States). Those standards require that we plan and perform the audit to obtain reasonable assurance about whether the financial statements and financial highlights are free of material misstatement. We were not engaged to perform an audit of the Funds’ internal control over financial reporting. Our audits included consideration of internal control over financial reporting as a basis for designing audit procedures that are appropriate in the circumstances, but not for the purpose of expressing an opinion on the effectiveness of the Funds’ internal control over financial reporting. Accordingly, we express no such opinion. An audit also includes examining, on a test basis, evidence supporting the amounts and disclosures in the financial statements and financial highlights, assessing the accounting principles used and significant estimates made by management, and evaluating the overall financial statement presentation. Our procedures included confirmation of securities owned as of October 31, 2014, by correspondence with the custodian. We believe that our audits provide a reasonable basis for our opinion.
In our opinion, the financial statements and financial highlights referred to above present fairly, in all material respects, the financial position of The Hartford Small/Mid Cap Equity Fund of The Hartford Mutual Funds, Inc. at October 31, 2014, the results of its operations for the year then ended, the changes in its net assets for each of the two years in the period then ended, and the financial highlights for the periods indicated therein, in conformity with U.S. generally accepted accounting principles.
|
Minneapolis, Minnesota
December 18, 2014
| 26 |
| The Hartford Small/Mid Cap Equity Fund |
| Directors and Officers (Unaudited) |
The Board of Directors of the Company (the "Directors") appoints officers who are responsible for the day-to-day operations of the Fund and who execute policies formulated by the Directors. Each Director serves until his or her death, resignation, or retirement or until the next annual meeting of shareholders is held or until his or her successor is elected and qualifies.
Directors and officers who are employed by or who have a financial interest in The Hartford Financial Services Group, Inc. ("The Hartford") are considered “interested” persons of the Fund pursuant to the 1940 Act. Each officer and two of the Company's Directors, as noted in the chart below, are “interested” persons of the Fund. Each Director serves as a director for The Hartford Mutual Funds, Inc., The Hartford Mutual Funds II, Inc., Hartford Series Fund, Inc., and Hartford HLS Series Fund II, Inc., and as a trustee for The Hartford Alternative Strategies Fund, which, as of October 31, 2014, collectively consist of 66 funds. Correspondence may be sent to Directors and officers c/o Hartford Funds, 5 Radnor Corporate Center, Suite 300, 100 Matsonford Road, Radnor, Pennsylvania 19087, except that correspondence to Mr. Annoni, Mr. Dressen and Ms. Quade may be sent to 500 Bielenberg Drive, Suite 500, Woodbury, Minnesota 55125.
The table below sets forth, for each Director and officer, his or her name, year of birth, current position with the Company and date first elected or appointed to The Hartford Mutual Funds, Inc. ("MF") and The Hartford Mutual Funds II, Inc. ("MF2"), principal occupation, and, for Directors, other directorships held. The Fund’s Statement of Additional Information contains further information on the Directors and is available free of charge by calling 1-888-843-7824 or writing to: Hartford Funds, P.O. Box 55022, Boston, MA 02205-5022.
Information on the aggregate remuneration paid to the directors of the Company can be found in the Statement of Operations herein. The Fund pays to The Hartford a portion of the Chief Compliance Officer’s compensation, but does not pay salaries or compensation to any of its other officers or Directors who are employed by The Hartford.
Non-Interested Directors
Hilary E. Ackermann (1956) Director since September 23, 2014
Ms. Ackermann served as Chief Risk Officer at Goldman Sachs Bank USA from October 2008 to November 2011 and serves as a Director of Dynegy, Inc., an independent power company, from October 2012 to present.
Lynn S. Birdsong (1946) Director since 2003, Chairman of the Investment Committee since 2014
Mr. Birdsong is a private investor. Mr. Birdsong currently serves as a Director of the Sovereign High Yield Investment Company (April 2010 to current). Mr. Birdsong currently serves as an Independent Director of Nomura Partners Funds, Inc. (formerly, The Japan Fund) (April 2003 to current). From 2003 to March 2005, Mr. Birdsong was an Independent Director of the Atlantic Whitehall Funds. From 1979 to 2002, Mr. Birdsong was a Managing Director of Zurich Scudder Investments, an investment management firm. During his employment with Scudder, Mr. Birdsong was an Interested Director of The Japan Fund. From January 1981 through December 2013, Mr. Birdsong was a partner in Birdsong Company, an advertising specialty firm.
Robert M. Gavin, Jr. (1940) Director since 2002 (MF) and 1986 (MF2), Chairman of the Board for each since 2004
Dr. Gavin is an educational consultant. Prior to September 1, 2001, he was President of Cranbrook Education Community and prior to July 1996, he was President of Macalester College, St. Paul, Minnesota.
Duane E. Hill (1945) Director since 2001 (MF) and 2002 (MF2), Chairman of the Nominating Committee since 2003
Mr. Hill is a Partner of TSG Ventures L.P., a private equity investment company. Mr. Hill is a former partner of TSG Capital Group, a private equity investment firm that served as sponsor and lead investor in leveraged buyouts of middle market companies.
Sandra S. Jaffee (1941) Director since 2005
Ms. Jaffee is the founder and Chief Executive Officer of a private company, Homeworks Concierge, LLC, which provides residential property management services in Westchester County, New York (January 2012 to present). Ms. Jaffee served as Chairman (2008 to 2009) and Chief Executive Officer of Fortent (formerly Searchspace Group), a leading provider of compliance/regulatory technology to financial institutions from August 2005 to August 2009. From August 2004 to August 2005, Ms. Jaffee served as an Entrepreneur in Residence with Warburg Pincus, a private equity firm. Prior to joining Warburg Pincus, Ms. Jaffee served as Executive Vice President at Citigroup, from September 1995 to July 2004, where she was President and Chief Executive Officer of Citibank’s Global Securities Services (1995 to 2003). Ms. Jaffee currently serves as a member of the Board of Directors of Broadridge Financial Solutions as well as a Trustee of Muhlenberg College.
| 27 |
| The Hartford Small/Mid Cap Equity Fund |
| Directors and Officers (Unaudited) – (continued) |
William P. Johnston (1944) Director since 2005, Chairman of the Compliance Committee since 2005
In June 2006, Mr. Johnston was appointed as Senior Advisor to The Carlyle Group, a global private equity and other alternative asset investment firm and currently serves as an Operating Executive. In July 2006, Mr. Johnston was elected to the Board of Directors of MultiPlan, Inc. and served as a Director (July 2006 to August 2010). In August 2007, Mr. Johnston was elected to the Board of Directors of LifeCare Holdings, Inc. and served as a Director (August 2007 to June 2013). In February 2008, Mr. Johnston was elected to the Board of Directors of HCR-ManorCare, Inc. In May 2006, Mr. Johnston was elected to the Supervisory Board of Fresenius Medical Care AG & Co. KGaA, after its acquisition of Renal Care Group, Inc. in March 2006. Mr. Johnston joined Renal Care Group in November 2002 as a member of the Board of Directors and served as Chairman of the Board from March 2003 through March 2006. From 2002 through 2013, Mr. Johnston served as a Board member of the Georgia O’Keefe Museum. From September 1987 to December 2002, Mr. Johnston was with Equitable Securities Corporation (and its successors, SunTrust Equitable Securities and SunTrust Robinson Humphrey) serving in various investment banking and managerial positions, including Managing Director and Head of Investment Banking, Chief Executive Officer and Vice Chairman.
Phillip O. Peterson (1944) Director since 2002 (MF) and 2000 (MF2), Chairman of the Audit Committee since 2002
Mr. Peterson is a mutual fund industry consultant. He was a partner of KPMG LLP (an accounting firm) until July 1999. Mr. Peterson joined William Blair Funds in February 2007 as a member of the Board of Trustees. From February 2012 to February 2014, Mr. Peterson served as a Trustee of Symetra Variable Mutual Funds. From January 2004 to April 2005, Mr. Peterson served as Independent President of the Strong Mutual Funds.
Lemma W. Senbet (1946) Director since 2005
Dr. Senbet is the William E. Mayer Chair Professor of Finance and Founding Director, Center for Financial Policy, at the University of Maryland, Robert H. Smith School of Business. He was chair of the Finance Department of the University of Maryland, Robert H. Smith School of Business from 1998 to 2006. Since June 2013, he has been on leave from the University to serve as Executive Director of African Economic Research Consortium which focuses on economic policy research and training. Previously, he was a chaired professor of finance at the University of Wisconsin-Madison. Also, he was a Director of the Fortis Funds from March 2000 to July 2002. Dr. Senbet served as Director of the American Finance Association and President of the Western Finance Association. In 2006, Dr. Senbet was inducted Fellow of Financial Management Association International for his career-long distinguished scholarship and professional service.
Interested Directors and Officers
James E. Davey (1964) Director since 2012, President and Chief Executive Officer since 2010
Mr. Davey serves as Executive Vice President of Hartford Life Insurance Company (“HLIC”) and The Hartford. Additionally, Mr. Davey serves as Chairman of the Board, Manager and Senior Managing Director of Hartford Funds Distributors, LLC (“HFD”). He also currently serves as Director, Chairman of the Board, President and Senior Managing Director of Hartford Administrative Services Company (“HASCO”). Mr. Davey also serves as Manager, Chairman of the Board and Senior Managing Director for Hartford Funds Management Company, LLC (“HFMC”) and Director, Chairman of the Board and Senior Managing Director for Hartford Funds Management Group, Inc. ("HFMG"). Mr. Davey has served in various positions within The Hartford and its subsidiaries in connection with the operation of the Hartford Funds. Mr. Davey joined The Hartford in 2002.
Lowndes A. Smith* (1939) Director since 1996 (MF) and 2002 (MF2)
Mr. Smith served as Vice Chairman of The Hartford from February 1997 to January 2002, as President and Chief Executive Officer of Hartford Life, Inc. from February 1997 to January 2002, and as President and Chief Operating Officer of The Hartford Life Insurance Companies from January 1989 to January 2002. Mr. Smith serves as a Director of White Mountains Insurance Group Ltd. (October 2003 to current); One Beacon Insurance (October 2006 to current); Symetra Financial (August 2007 to current) and is a Managing Director of Whittington Gray Associates (January 2007 to current).
* Mr. Smith resigned as a Director of MF, MF2, Hartford Series Fund, Inc. and Hartford HLS Series Fund II, Inc. and as a Trustee of The Hartford Alternative Strategies Fund effective September 17, 2014.
Other Officers
Mark A. Annoni (1964) Vice President, Controller and Treasurer since 2012
Mr. Annoni currently serves as the Assistant Vice President of HLIC (February 2004 to present) and Senior Vice President of HFMG (December 2013 to present). Mr. Annoni has served in various positions within The Hartford and its subsidiaries in connection with the operation of the Hartford Funds. Mr. Annoni joined The Hartford in 2001.
| 28 |
| The Hartford Small/Mid Cap Equity Fund |
| Directors and Officers (Unaudited) – (continued) |
Michael R. Dressen (1963) AML Compliance Officer since 2011
Mr. Dressen currently serves as Assistant Vice President of HLIC. He also serves as Chief Compliance Officer and AML Compliance Officer of HASCO and as AML Officer of HFD. Mr. Dressen has served in various positions within The Hartford and its subsidiaries in connection with the operation of the Hartford Funds.
Edward P. Macdonald (1967) Vice President, Secretary and Chief Legal Officer since 2005
Mr. Macdonald currently serves as Assistant Secretary, Executive Vice President and Deputy General Counsel of HFD, HASCO, HFMC and HFMG. He also serves as Vice President of HLIC. Mr. Macdonald has served in various positions within The Hartford and its subsidiaries in connection with the operation of the Hartford Funds. Mr. Macdonald joined The Hartford in 2005.
Joseph G. Melcher (1973) Vice President and Chief Compliance Officer since 2013
Mr. Melcher currently serves as Executive Vice President of HFD, HFMG and HASCO. Mr. Melcher also currently serves as Executive Vice President and Chief Compliance Officer of HFMC. Mr. Melcher has served in various positions within The Hartford and its subsidiaries in connection with the operation of the Hartford Funds since joining The Hartford in 2012. Prior to joining The Hartford, Mr. Melcher worked at Touchstone Investments, a member of the Western & Southern Financial Group, where he held the position of Vice President and Chief Compliance Officer from 2010 through 2012 and Assistant Vice President, Compliance from 2005 to 2010.
Vernon J. Meyer (1964) Vice President since 2006
Mr. Meyer currently serves as Senior Vice President of HLIC. He also currently serves as Managing Director and Chief Investment Officer of HFMC and Managing Director of HFMG. Mr. Meyer has served in various positions within The Hartford and its subsidiaries in connection with the operation of the Hartford Funds. Mr. Meyer joined The Hartford in 2004.
Laura S. Quade (1969) Vice President since 2012
Ms. Quade currently serves as Vice President of HASCO, HFD and HFMG. She is the Head of Operations of HASCO and formerly served as Director, Enterprise Operations of HLIC. Ms. Quade has served in various positions within The Hartford and its subsidiaries in connection with the operation of the Hartford Funds. Ms. Quade joined The Hartford in 2001.
Martin A. Swanson** (1962) Vice President since 2010
Mr. Swanson currently serves as Vice President of HLIC. Mr. Swanson also serves as Managing Director, Chief Marketing Officer and Principal of HFD and Managing Director of HFMG. Mr. Swanson has served in various positions within The Hartford and its subsidiaries in connection with the operation of the Hartford Funds.
** Mr. Swanson resigned as an officer effective November 6, 2014.
HOW TO OBTAIN A COPY OF THE FUND’S PROXY VOTING POLICIES AND VOTING RECORDS (UNAUDITED)
A description of the policies and procedures that the Fund uses to determine how to vote proxies relating to portfolio securities and information about how the Fund voted proxies relating to portfolio securities during the most recent twelve-month period ended June 30 are available (1) without charge, upon request, by calling 888-843-7824 and (2) on the SEC’s website at http://www.sec.gov.
QUARTERLY PORTFOLIO HOLDINGS INFORMATION (UNAUDITED)
The Fund files a complete schedule of portfolio holdings with the SEC for the first and third quarters of each fiscal year on Form N-Q. The Fund’s Forms N-Q are available (1) without charge, upon request, by calling 888-843-7824 and (2) on the SEC’s website at http://www.sec.gov. The Form N-Q may be reviewed and copied at the SEC’s Public Reference Room in Washington, DC. Information on the operation of the Public Reference Room may be obtained by calling 1-800-SEC-0330.
| 29 |
| The Hartford Small/Mid Cap Equity Fund |
| Federal Tax Information (Unaudited) |
For the fiscal year ended October 31, 2014, there is no further federal tax information required for this Fund.
| 30 |
| The Hartford Small/Mid Cap Equity Fund |
| Expense Example (Unaudited) |
Your Fund's Expenses
As a shareholder of the Fund, you incur two types of costs: (1) transaction costs, including sales charges (loads) on purchase payments, if any, and contingent deferred sales charges (CDSC), if any, and (2) ongoing costs, including investment management fees, distribution and/or service (12b-1) fees, if any, and other fund expenses. This example is intended to help you understand your ongoing costs (in dollars) of investing in the Fund and to compare these costs with the ongoing costs of investing in other mutual funds. The example is based on an investment of $1,000 invested at the beginning of the period and held for the entire period of April 30, 2014 through October 31, 2014.
Actual Expenses
The first set of columns of the table below provides information about actual account values and actual expenses. You may use the information in this column, together with the amount you invested, to estimate the expenses that you paid over the period. Simply divide your account value by $1,000 (for example, an $8,600 account value divided by $1,000 = 8.6), then multiply the result by the number in the line under the heading entitled “Expenses Paid During Period” to estimate the expenses you paid on your account during this period.
Hypothetical Example for Comparison Purposes
The second set of columns of the table below provides information about hypothetical account values and hypothetical expenses based on the Fund's actual expense ratio and an assumed rate of return of 5% per year before expenses, which is not the Fund's actual return. The hypothetical account values and expenses may not be used to estimate the actual ending account balance or expenses you paid for the period. You may use this information to compare the ongoing costs of investing in the Fund and other funds. To do so, compare this 5% hypothetical example with the 5% hypothetical examples that appear in the shareholder reports of the other funds.
Please note that the expenses shown in the table are meant to highlight your ongoing costs only and do not reflect any transactional costs, such as sales charges (loads) and CDSC. Therefore, the second set of columns of the table is useful in comparing ongoing costs only, and will not help you determine the relative total costs of owning different funds. In addition, if these transactional costs were included, your costs would be higher. Expenses are equal to the Fund's annualized expense ratios multiplied by average account value over the period, multiplied by 184/365 (to reflect the one-half year period).
| Actual return | Hypothetical (5% return before expenses) | |||||||||||||||||||||||||||||||||
| Beginning Account Value April 30, 2014 |
Ending Account Value October 31, 2014 |
Expenses paid during the period April 30, 2014 through October 31, 2014 |
Beginning Account Value April 30, 2014 |
Ending Account Value October 31, 2014 |
Expenses paid during the period April 30, 2014 through October 31, 2014 |
Annualized expense ratio |
Days in the current 1/2 year |
Days in the full year |
||||||||||||||||||||||||||
| Class A | $ | 1,000.00 | $ | 1,028.90 | $ | 6.65 | $ | 1,000.00 | $ | 1,018.65 | $ | 6.62 | 1.30 | % | 184 | 365 | ||||||||||||||||||
| Class B | $ | 1,000.00 | $ | 1,025.00 | $ | 10.46 | $ | 1,000.00 | $ | 1,014.87 | $ | 10.41 | 2.05 | 184 | 365 | |||||||||||||||||||
| Class C | $ | 1,000.00 | $ | 1,024.50 | $ | 10.46 | $ | 1,000.00 | $ | 1,014.87 | $ | 10.41 | 2.05 | 184 | 365 | |||||||||||||||||||
| Class R3 | $ | 1,000.00 | $ | 1,027.50 | $ | 7.67 | $ | 1,000.00 | $ | 1,017.64 | $ | 7.63 | 1.50 | 184 | 365 | |||||||||||||||||||
| Class R4 | $ | 1,000.00 | $ | 1,028.90 | $ | 6.14 | $ | 1,000.00 | $ | 1,019.15 | $ | 6.11 | 1.20 | 184 | 365 | |||||||||||||||||||
| Class R5 | $ | 1,000.00 | $ | 1,030.20 | $ | 4.61 | $ | 1,000.00 | $ | 1,020.67 | $ | 4.59 | 0.90 | 184 | 365 | |||||||||||||||||||
| Class Y | $ | 1,000.00 | $ | 1,031.00 | $ | 4.35 | $ | 1,000.00 | $ | 1,020.92 | $ | 4.33 | 0.85 | 184 | 365 | |||||||||||||||||||
| 31 |
| The Hartford Small/Mid Cap Equity Fund |
| Approval of Investment Management and Investment Sub-Advisory Agreements (Unaudited) |
Section 15(c) of the Investment Company Act of 1940, as amended (the “1940 Act”), requires that each mutual fund’s board of directors, including a majority of those directors who are not “interested persons” of the mutual fund, as defined in the 1940 Act (the “Independent Directors”), annually review and consider the continuation of the mutual fund’s investment advisory and sub-advisory agreements. At its meeting held on August 5-6, 2014, the Board of Directors (the “Board”) of The Hartford Mutual Funds, Inc., including each of the Independent Directors, unanimously voted to approve the continuation of the investment management agreement for The Hartford Small/Mid Cap Equity Fund (the “Fund”) with Hartford Funds Management Company, LLC (“HFMC”) and the continuation of the investment sub-advisory agreement between HFMC and the Fund’s sub-adviser, Wellington Management Company, LLP (the “Sub-adviser,” and together with HFMC, the “Advisers”) (collectively, the “Agreements”).
In the months preceding the August 5-6, 2014 meeting, the Board requested, received and reviewed written responses from the Advisers to questions posed to them on behalf of the Independent Directors and supporting materials relating to those questions and responses. The Board considered information furnished to the Board at its meetings throughout the year, as well as information specifically prepared in connection with the annual approval of the Agreements at the Board’s meetings held on June 17-18, 2014 and August 5-6, 2014. Information provided to the Board at its meetings throughout the year included, among other things, reports on Fund performance, legal and compliance matters, sales and marketing activity, shareholder services, and the other services provided to the Fund by the Advisers and their affiliates. The Board also received in-person presentations by Fund officers and representatives of HFMC at the Board’s meetings on June 17-18, 2014 and August 5-6, 2014 concerning the Agreements.
The Independent Directors, advised by independent legal counsel, engaged service providers to assist them with evaluating the Agreements with respect to the Fund. Lipper Inc. (“Lipper”), an independent provider of investment company data, was retained to provide the Board with reports on how the Fund’s contractual management fees, actual management fees, other non-management fees, overall expense ratios and investment performance compared to those of mutual funds with similar investment objectives. The Independent Directors also engaged an independent financial services consultant (the “Consultant”) to assist them in evaluating the Fund’s management fees, sub-advisory fees, other non-management fees, overall expense ratios and investment performance. In addition, the Consultant reviewed the profitability calculations utilized by HFMC in connection with the continuation of the investment management agreement.
In determining whether to continue the Agreements for the Fund, the members of the Board reviewed and evaluated information and factors they believed to be relevant and appropriate in light of the information that the Board deemed necessary and appropriate through the exercise of its reasonable business judgment. While individual members of the Board may have weighed certain factors differently, the Board’s determination to continue the Agreements was based on a comprehensive consideration of all information provided to the Board throughout the year and specifically with respect to the continuation of the Agreements. A more detailed discussion of the factors the Board considered with respect to its approval of the Agreements is provided below.
Nature, Extent and Quality of Services Provided by the Advisers
The Board requested and considered information concerning the nature, extent and quality of the services provided to the Fund by the Advisers. The Board considered, among other things, the terms of the Agreements and the range of services provided by the Advisers. The Board considered the Advisers’ professional personnel who provide services to the Fund, including each Adviser’s ability and experience in attracting and retaining qualified personnel to service the Fund. The Board considered each Adviser’s reputation and overall financial strength, as well as its willingness to consider and implement organizational and operational changes designed to enhance services to the Hartford Funds. In addition, the Board considered the quality of each Adviser’s communications with the Board and responsiveness to Board inquiries and requests made from time to time with respect to the Fund and other Hartford Funds.
The Board also requested and evaluated information concerning each Adviser’s regulatory and compliance environment. In this regard, the Board requested and reviewed information on each Adviser’s compliance policies and procedures, compliance history, and a report from the Fund’s Chief Compliance Officer on each Adviser’s compliance with applicable laws and regulations, including responses to regulatory developments and compliance issues raised by regulators. The Board also noted the Advisers’ support of the Fund’s compliance control structure, particularly the resources devoted by the Advisers in support of the Fund’s obligations pursuant to Rule 38a-1 under the 1940 Act.
With respect to HFMC, the Board noted that, under the Agreements, HFMC is responsible for the management of the Fund, including oversight of fund operations and service providers, and provides administrative and investment advisory services in connection with selecting, monitoring and supervising the Sub-adviser. The Board considered HFMC’s ongoing monitoring of people, process and performance, including its quarterly reviews of each of the Hartford Funds, semi-annual meetings with the leaders of each Fund’s portfolio management team, and oversight of the Hartford Funds’ approximately 66 portfolio managers. The Board recognized that HFMC has demonstrated a record of making changes to the
| 32 |
| The Hartford Small/Mid Cap Equity Fund |
| Approval of Investment Management and Investment Sub-Advisory Agreements (Unaudited) – (continued) |
management and/or strategies of the Hartford Funds when warranted. The Board considered HFMC’s oversight of the Sub-adviser’s investment approach and results, process for monitoring best execution of portfolio trades by the Sub-adviser, and approach to risk management with respect to the Fund and the service providers to the Fund. The Board also considered HFMC’s oversight of compliance with the Fund’s objective and policies as well as with applicable laws and regulations, noting that regulatory and other developments had over time led to an increase in the scope of HFMC’s services in this regard.
In addition, the Board considered HFMC’s ongoing commitment to review and rationalize the Hartford Funds product line-up and the expenses that HFMC had incurred in connection with fund combinations in recent years. The Board considered that HFMC or its affiliates are responsible for providing the Fund’s officers.
With respect to the Sub-adviser, which provides certain day-to-day portfolio management services for the Fund, the Board considered the quality of the Fund’s portfolio manager, the Sub-adviser’s other investment personnel, its investment philosophy and process, investment research capabilities and resources, performance record, trade execution capabilities and experience. The Board considered the experience of the Fund’s portfolio manager, the number of accounts managed by the portfolio manager, and the Sub-adviser’s method for compensating the portfolio manager.
Based on these considerations, the Board concluded that it was satisfied with the nature, extent and quality of the services provided to the Fund by HFMC and the Sub-adviser.
Performance of the Fund and the Advisers
The Board considered the investment performance of the Fund. In this regard, the Board reviewed the performance of the Fund over different time periods presented in the materials and evaluated HFMC’s analysis of the Fund’s performance for these time periods. The Board considered information and materials provided to the Board by the Advisers concerning Fund performance, as well as information from Lipper comparing the investment performance of the Fund to an appropriate benchmark and universe of peer funds. The Board noted that the Fund’s performance was in the 3rd quintile of its performance universe for the 1- and 3-year periods and the 2nd quintile for the 5-year period. The Board also noted that the Fund’s performance was in line with its benchmark for the 1-, 3- and 5-year periods.
The Board considered the detailed investment analytics reports provided by Hartford Funds’ Investment Advisory Group throughout the year. These reports include, among other things, information on the Fund’s gross and net returns, the Fund’s investment performance relative to an appropriate benchmark and peer group, various statistics concerning the Fund’s portfolio, and a narrative summary of various factors affecting Fund performance. The Board considered the Advisers’ cooperation with the Investment Committee, which assists the Board in evaluating the performance of the Fund at periodic meetings throughout the year. The Board also considered the analysis provided by the Consultant relating to the Fund’s performance track record.
In light of all the considerations noted above, the Board concluded that it had continued confidence in HFMC’s and the Sub-adviser’s overall capabilities to manage the Fund.
Costs of the Services and Profitability of the Advisers
The Board reviewed information regarding HFMC’s cost to provide investment management and related services to the Fund and HFMC’s profitability, both overall and for the Fund, on a pre-tax basis without regard to distribution expenses. The Board also requested and reviewed information about the profitability to HFMC and its affiliates from all services provided to the Fund and all aspects of their relationship with the Fund. The Board also requested and received information relating to the operations and profitability of the Sub-adviser.
The Board considered the Consultant’s review of the profitability calculations used by HFMC in connection with the continuation of the investment management agreement, noting the Consultant’s view that Hartford Funds’ process for calculating and reporting Fund profitability is reasonable. In this regard, the Board noted that the Consultant performed a full review of this process in light of the recent restructuring of the Hartford Funds business and reported that the approach to analyzing Fund profitability, including the use of common expense allocation methodologies, is reasonable, sound and well within common industry practice.
Based on these considerations, the Board concluded that the profits anticipated to be realized by the Advisers and their affiliates from their relationships with the Fund would not be excessive.
| 33 |
| The Hartford Small/Mid Cap Equity Fund |
| Approval of Investment Management and Investment Sub-Advisory Agreements (Unaudited) – (continued) |
Comparison of Fees and Services Provided by the Advisers
The Board considered comparative information with respect to the management fees to be paid by the Fund to HFMC and the total expense ratios of the Fund. The Board also considered comparative information with respect to the sub-advisory fees to be paid by HFMC to the Sub-adviser. In this regard, the Board requested and reviewed information from HFMC and the Sub-adviser relating to the management and sub-advisory fees, including the sub-advisory fee schedule for the Fund, and total operating expenses for the Fund. With respect to the sub-advisory fee schedule, the Board considered representations from HFMC and the Sub-adviser that the Sub-adviser’s fees were negotiated at arm’s length on a fund-by-fund basis. The Board also reviewed information from Lipper comparing the Fund’s contractual management fees, actual management fees and overall expense ratios relative to a group of funds selected by Lipper, in consultation with the Consultant, and a broader universe of funds selected by Lipper. The Board considered that the Fund’s contractual management fee and actual management fee were in the 1st quintile of its expense group, while its total expenses (less 12b-1 and shareholder service fees) were in the 3rd quintile. The Board noted that the Fund has an automatically renewable contractual expense cap on each share class. The expense cap resulted in reimbursement of certain expenses incurred in 2013.
While the Board recognized that comparisons between the Fund and peer funds may be imprecise, given the different service levels and characteristics of mutual funds and the different business models and cost structures of the Advisers, the comparative information provided by Lipper assisted the Board in evaluating the reasonableness of the Fund’s management and sub-advisory fees and total operating expenses. In addition, the Board considered the analysis and recommendations of the Consultant relating to the Fund’s management and sub-advisory fees and total operating expenses.
Based on these considerations, the Board concluded that the Fund’s fees and total operating expenses, in conjunction with the information about quality of services, profitability, economies of scale, and other matters discussed, were reasonable in light of the services provided.
Economies of Scale
The Board requested and considered information regarding the Advisers’ realization of economies of scale with respect to the Fund and whether the fee levels reflect these economies of scale for the benefit of the Fund’s shareholders. The Board reviewed the breakpoints in the management fee schedule for the Fund, which reduce fee rates as Fund assets grow over time. The Board recognized that a fund with assets beyond the highest breakpoint level will continue to benefit from economies of scale because additional assets are charged the lowest breakpoint fee resulting in lower overall effective management fee rates. The Board also considered that expense limitations and fee waivers that reduce the Fund’s expenses at all asset levels can have the same effect as breakpoints in sharing economies of scale with shareholders and provide protection from an increase in expenses if Fund assets decline. The Board recognized that a fee schedule that reaches a lower breakpoint quickly provides shareholders with the benefit of anticipated or potential economies of scale, although the Board noted that the Fund’s current low asset levels have kept the Fund from fully realizing this benefit. The Board also considered that HFMC has been active in managing expenses, which has resulted in benefits being realized by shareholders as assets within the Hartford Funds family of funds have grown over time, including through lower transfer agent costs and other operating expenses.
The Board reviewed and evaluated materials from Lipper and the Consultant showing how management fee schedules of peer funds reflect economies of scale for the benefit of shareholders as a peer fund’s assets hypothetically increase over time. Based on information provided by HFMC, Lipper, and the Consultant, the Board recognized that there is no uniform methodology for establishing breakpoints or uniform pattern in asset levels that trigger breakpoints or the amounts of breakpoints triggered.
After considering all of the information available to it, the Board concluded that it was satisfied with the extent to which economies of scale would be shared for the benefit of the Fund’s shareholders based on currently available information and the effective advisory fees and expense ratios for the Fund at its current and reasonably anticipated asset levels. The Board noted, however, that it would continue to monitor future growth in Fund assets and the appropriateness of additional breakpoints.
Other Benefits
The Board considered other benefits to the Advisers and their affiliates from their relationships with the Fund.
The Board noted that HFMC receives fees for fund accounting and related services from the Fund, and the Board considered information on profits to HFMC for such services. The Board also considered that Hartford Administrative Services Company (“HASCO”), the Fund’s transfer agent and an affiliate of HFMC, receives transfer agency compensation from the Fund, and the Board reviewed information on the profitability of
| 34 |
| The Hartford Small/Mid Cap Equity Fund |
| Approval of Investment Management and Investment Sub-Advisory Agreements (Unaudited) – (continued) |
the Fund’s transfer agency function to HASCO. The Board considered information provided by HASCO indicating that the transfer agent fees charged by HASCO to the Fund were fair and reasonable based on publicly available information.
The Board also considered that Hartford Funds Distributors, LLC (“HFD”), an affiliate of HFMC, serves as principal underwriter of the Fund. As principal underwriter, HFD receives 12b-1 fees from the Fund and receives all or a portion of the sales charges on sales or redemptions of certain classes of shares. The Board also noted that certain affiliates of HFD distribute shares of the Fund and receive compensation in that connection.
The Board considered benefits to the Sub-adviser from its use of the Fund’s brokerage commissions to obtain soft dollar research, and representations from HFMC and the Sub-adviser that the Sub-adviser would not make any revenue-sharing payments or any other type of distribution payments to HFMC or its affiliates.
The Board considered the benefits to shareholders of being part of the Hartford Funds family of funds, including the right to exchange investments between the same class of funds without a sales charge, the ability to reinvest Fund dividends into other funds in the family, and the ability to combine holdings in the Fund with holdings in other funds to obtain a reduced sales charge. The Board considered HFMC’s efforts to provide investors in the family with a broad range of investment styles and asset classes and its entrepreneurial risk in initiating new funds to expand these opportunities for shareholders.
* * * *
Based upon its review of these various factors, among others, the Board concluded that it is in the best interests of the Fund and its shareholders for the Board to approve the Agreements for an additional year. In reaching this decision, the Board did not assign relative weights to the factors discussed above or deem any one or group of them to be controlling in and of themselves. In connection with their deliberations, the Independent Directors met separately in executive session on several occasions, with independent legal counsel and the Consultant, to review the relevant materials and consider their responsibilities under relevant laws and regulations.
| 35 |
| The Hartford Small/Mid Cap Equity Fund |
| Main Risks (Unaudited) |
The main risks of investing in the Fund are described below.
Market, Selection and Strategy Risk: The Fund’s share price may fluctuate due to market risk and/or security selections that may underperform the market or relevant benchmarks. If the sub-adviser's investment strategy does not perform as expected, the Fund could underperform its peers or lose money. There is no guarantee the Fund will achieve its stated objective.
Small/Mid-Cap Stock Risk: Small- and mid-cap stocks are generally more volatile and risky and may be less liquid than large-cap stocks because they may have limited operating histories, narrow product lines, and focus on niche markets.
Quantitative Analysis Risk: The Fund uses quantitative analysis in its securities selection; securities selected by this method may perform differently from the broader stock market.
Foreign Investment Risk: Investments in foreign securities may be riskier than investments in U.S. securities. Potential risks include the risks of illiquidity, increased price volatility, less government regulation, less extensive and less frequent accounting and other reporting requirements, unfavorable changes in currency exchange rates, and economic and political disruptions.
Active Trading Risk: Actively trading investments may result in higher costs and higher taxable income.
| 36 |
THIS PRIVACY POLICY IS NOT PART OF THIS REPORT
Privacy Policy and Practices of The Hartford Financial Services Group, Inc. and its Affiliates
(herein called “we, our and us”)
This Privacy Policy applies to our United States Operations
|
We value your trust. We are committed to the responsible: a) management; b) use; and c) protection; of Personal Information.
This notice describes how we collect, disclose, and protect Personal Information.
We collect Personal Information to: a) service your Transactions with us; and b) support our business functions.
We may obtain Personal Information from: a) You; b) your Transactions with us; and c) third parties such as a consumer-reporting agency.
Based on the type of product or service You apply for or get from us, Personal Information such as: a) your name; b) your address; c) your income; d) your payment; or e) your credit history; may be gathered from sources such as applications, Transactions, and consumer reports.
To serve You and service our business, we may share certain Personal Information. We will share Personal Information, only as allowed by law, with affiliates such as: a) our insurance companies; b) our employee agents; c) our brokerage firms; and d) our administrators.
As allowed by law, we may share Personal Financial Information with our affiliates to: a) market our products; or b) market our services; to You without providing You with an option to prevent these disclosures.
|
We may also share Personal Information, only as allowed by law, with unaffiliated third parties including: a) independent agents; b) brokerage firms; c) insurance companies; d) administrators; and e) service providers; who help us serve You and service our business.
When allowed by law, we may share certain Personal Financial Information with other unaffiliated third parties who assist us by performing services or functions such as: a) taking surveys; b) marketing our products or services; or c) offering financial products or services under a joint agreement between us and one or more financial institutions.
We, and third parties we partner with, may track some of the pages You visit through the use of: a) cookies; b) pixel tagging; or c) other technologies; and currently do not process or comply with any web browser’s “do not track” signal or similar mechanism that indicates a request to disable online tracking of individual users who visit our websites or use our services.
We will not sell or share your Personal Financial Information with anyone for purposes unrelated to our business functions without offering You the opportunity to: a) “opt-out;” or b) “opt-in;” as required by law.
We only disclose Personal Health Information with: a) your proper written authorization; or b) as otherwise allowed or required by law.
Our employees have access to Personal Information in the course of doing their jobs, such as: a) underwriting policies; b) paying claims; c) developing new products; or d) advising customers of our products and services.
|
|
We use manual and electronic security procedures to maintain: a) the confidentiality; and b) the integrity of; Personal Information that we have. We use these procedures to guard against unauthorized access.
Some techniques we use to protect Personal Information include: a) secured files; b) user authentication; c) encryption; d) firewall technology; and e) the use of detection software.
We are responsible for and must: a) identify information to be protected; b) provide an adequate level of protection for that data; c) grant access to protected data only to those people who must use it in the performance of their job-related duties.
Employees who violate our Privacy Policy will be subject to discipline, which may include ending their employment with us.
At the start of our business relationship, we will give You a copy of our current Privacy Policy.
We will also give You a copy of our current Privacy Policy once a year if You maintain a continuing business relationship with us.
We will continue to follow our Privacy Policy regarding Personal Information even when a business relationship no longer exists between us.
|
As used in this Privacy Notice:
Application means your request for our product or service.
Personal Financial Information means financial information such as: a) credit history; b) income; c) financial benefits; or d) policy or claim information.
Personal Health Information means health information such as: a) your medical records; or b) information about your illness, disability or injury.
Personal Information means information that identifies You personally and is not otherwise available to the public. It includes: a) Personal Financial Information; and b) Personal Health Information.
Transaction means your business dealings with us, such as: a) your Application; b) your request for us to pay a claim; and c) your request for us to take an action on your account.
You means an individual who has given us Personal Information in conjunction with: a) asking about; b) applying for; or c) obtaining; a financial product or service from us if the product or service is used mainly for personal, family, or household purposes.
|
This Privacy Policy is being provided on behalf of the following affiliates of The Hartford Financial Services Group, Inc.:
1stAGChoice, Inc.; Access CoverageCorp, Inc.; Access CoverageCorp Technologies, Inc.; American Maturity Life Insurance Company; Archway 60 R, LLC; Business Management Group, Inc.; Champlain Life Reinsurance Company; DMS R, LLC; Eloy R, LLC; Ersatz Corporation; First State Insurance Company; Hartford Accident and Indemnity Company; Hartford Administrative Services Company; Hartford Casualty General Agency, Inc.; Hartford Casualty Insurance Company; Hartford-Comprehensive Employee Benefit Service Company; Hartford Equity Sales Company, Inc.; Hartford Fire General Agency, Inc.; Hartford Fire Insurance Company; Hartford Funds Management Company, LLC; Hartford Funds Management Group, Inc.; Hartford HLS Series Fund II, Inc.; Hartford Insurance Company of Illinois; Hartford Insurance Company of the Midwest; Hartford Insurance Company of the Southeast; Hartford Integrated Technologies, Inc.; Hartford International Life Reassurance Corporation; Hartford Funds Distributors, LLC; Hartford Investment Management Company; Hartford Life and Accident Insurance Company; Hartford Life and Annuity Insurance Company; Hartford Life Insurance Company; Hartford Life Private Placement, LLC; Hartford Lloyd’s Corporation; Hartford Lloyd’s Insurance Company; Hartford Mezzanine Investors I, LLC; Hartford Residual Market, L.C.C.; Hartford Retirement Services, LLC; Hartford Securities Distribution Company, Inc.; Hartford Series Fund, Inc.; Hartford Specialty Insurance Services of Texas, LLC; Hartford Strategic Investments, LLC; Hartford Underwriters Insurance Company; Hartford Technology Services Company, L.L.C.; Hartford of Texas General Agency, Inc.; Hartford Underwriters General Agency, Inc.; HARTRE Company, L.C.C.; HL Investment Advisors, LLC; HLA LLC; Horizon Management Group, LLC; HRA Brokerage Services, Inc.; Lanidex Class B, LLC; M-CAP Insurance Agency, LLC; New England Insurance Company; New England Reinsurance Corporation; Nutmeg Insurance Agency, Inc.; Nutmeg Insurance Company; Pacific Insurance Company, Limited; Planco, LLC: Property and Casualty Insurance Company of Hartford; Revere R, LLC; RVR R, LLC; Sentinel Insurance Company, Ltd.; Sunstone R, LLC; Symphony R, LLC; The Evergreen Group Incorporated; The Hartford Alternative Strategies Fund; The Hartford Mutual Funds, Inc.; The Hartford Mutual Funds II, Inc.; Trumbull Flood Management, L.L.C.; Trumbull Insurance Company; Twin City Fire Insurance Company; White River Life Reinsurance Company.
HPP Revised January 2014
HARTFORDFUNDS
hartfordfunds.com
This information is written in connection with the promotion or marketing of the matter(s) addressed in this material.
This report is submitted for the general information of the shareholders of the Fund. It is not authorized for distribution unless preceded or accompanied by a current prospectus for the Fund.
The information cannot be used or relied upon for the purpose of avoiding IRS penalties. These materials are not intended to provide tax, accounting or legal advice. As with all matters of a tax or legal nature, you should consult your own tax or legal counsel for advice.
Investors should carefully consider the investment objectives, risks, charges, and expenses of Hartford Funds before investing. This and other information can be found in the prospectus and summary prospectus, which can be obtained by calling 888-843-7824 (retail) or 800-279-1541 (institutional). Investors should read them carefully before they invest.
Hartford Funds are underwritten and distributed by Hartford Funds Distributors, LLC.
MFAR-SMC14 12/14 113999-3 Printed in U.S.A.
HARTFORDFUNDS
|
THE HARTFORD
STRATEGIC INCOME FUND
2014 Annual Report |
A MESSAGE FROM THE PRESIDENT
Dear Fellow Shareholders:
Thank you for investing in Hartford Funds.
Market Review
U.S. equities (as represented by the S&P 500 Index) rose steadily for the fiscal year ended October 31, 2014, with a return of 17.27% for the period. With the exception of short-lived geopolitical scares early in 2014 and concerns about continuing global growth near the end of the period, stocks generally rose on solid fundamentals and encouraging macroeconomic data during the year.
September 2014 marked the six-year anniversary of the start of the financial crisis. Within weeks of that anniversary, both the S&P 500 Index and the Dow Jones Industrial Average set new all-time highs, closing at 2,018 and 17,391, respectively, on October 31. Although the fallout of the crisis continues to influence investor behavior, stocks have recovered and risen dramatically, up 198% from their low in March 2009. Meanwhile, the domestic economy is notching strong growth, and the unemployment rate has reached its lowest level since August 2008.
While the U.S. economy appears to have stabilized and to have reverted to a solid growth path, the outlook for the global economy appears to have gotten cloudier. The U.S. Federal Reserve has ended quantitative easing, while Europe and Japan are pursuing stimulus options to avoid a double-dip recession and deflation, respectively. Diverging central-bank policies will likely continue to play an important role in market movements going forward as investors wait to see the reactions to their efforts and their impacts on global markets.
How have market movements impacted your portfolio throughout the last year? Are your investments still on track to provide the growth or income you need, and are you comfortable with their progress during times of volatility?
Your financial professional can help you navigate today’s markets with confidence, as well as assist you to achieve your investment goals by providing advice on the best options within our fund family to help you work toward overcoming today’s investing challenges. Meet with your financial advisor regularly to examine your portfolio and your investment strategy, and to determine if you’re still on track to meet your goals.
Thank you again for investing with Hartford Funds.
James Davey
President
Hartford Funds
1 The S&P 500 Index is a market capitalization-weighted price index composed of 500 widely held common stocks.
2 The Dow Jones Industrial Average is an unmanaged, price-weighted index of 30 of the largest, most widely held stocks traded on the NYSE
The Hartford Strategic Income Fund
Table of Contents
The views expressed in the Fund’s Manager Discussion under ‘‘Why did the Fund perform this way?’’ and ‘‘What is the outlook?’’ are views of the Fund’s sub-adviser and portfolio management team through the end of the period and are subject to change based on market and other conditions. The Fund’s Manager Discussion is for informational purposes only and does not represent an offer, recommendation or solicitation to buy, hold or sell any security. The specific securities identified and described, if any, do not represent all of the securities purchased or sold and you should not assume that investments in the securities identified and discussed will be profitable.
The Hartford Strategic Income Fund inception 05/31/2007
(sub-advised by Wellington Management Company, LLP)
Investment objective – The Fund seeks to provide current income and long-term total return.
Performance Overview 5/31/07 - 10/31/14

The chart above represents the hypothetical growth of a $10,000 investment in Class A, which includes a sales charge. Growth results in classes other than Class A will vary from what is seen above due to differences in the expenses charged to those share classes.
Average Annual Total Returns (as of 10/31/14)
| 1 Year | 5 Years | Since Inception▲ | ||||||||||
| Strategic Income A# | 5.06 | % | 6.82 | % | 5.08 | % | ||||||
| Strategic Income A## | 0.33 | % | 5.84 | % | 4.43 | % | ||||||
| Strategic Income B# | 4.25 | % | 6.00 | % | 4.25 | % | ||||||
| Strategic Income B## | -0.75 | % | 5.68 | % | 4.25 | % | ||||||
| Strategic Income C# | 4.26 | % | 6.05 | % | 4.32 | % | ||||||
| Strategic Income C## | 3.26 | % | 6.05 | % | 4.32 | % | ||||||
| Strategic Income I# | 5.32 | % | 7.11 | % | 5.38 | % | ||||||
| Strategic Income R3# | 4.64 | % | 6.75 | % | 5.54 | % | ||||||
| Strategic Income R4# | 5.06 | % | 6.96 | % | 5.69 | % | ||||||
| Strategic Income R5# | 5.38 | % | 7.16 | % | 5.82 | % | ||||||
| Strategic Income Y# | 5.55 | % | 7.20 | % | 5.85 | % | ||||||
| Barclays U.S. Aggregate Bond Index | 4.14 | % | 4.22 | % | 5.16 | % | ||||||
| ▲ | Inception: 05/31/2007 |
| # | Without sales charge |
| ## | With sales charge |
PERFORMANCE DATA QUOTED REPRESENTS PAST PERFORMANCE AND DOES NOT GUARANTEE FUTURE RESULTS. The investment return and principal value of the investment will fluctuate so that investors’ shares, when redeemed, may be worth more or less than their original cost. Current performance may be lower or higher than the performance data quoted. To obtain performance data current to the most recent month-end, please visit our website www.hartfordfunds.com.
The initial investment in Class A shares reflects the maximum sales charge of 4.50% and returns for Class B shares reflect a contingent deferred sales charge of up to 5.00% and declining to zero, depending on the period of time the shares are held. Returns for Class C shares reflect a contingent deferred sales charge of up to 1.00% on shares redeemed within twelve months of purchase.
Total returns presented above were calculated using the Fund’s net asset value available to shareholders for sale or redemption of Fund shares on October 31, 2014, which may exclude investment transactions as of this date. All share class returns assume the reinvestment of all distributions at net asset value and the deduction of all fund expenses.
Effective 9/30/09, Class B shares of the Fund were closed to new investments.
Class Y shares commenced operations on 8/31/07. Class R3, R4 and R5 shares commenced operations on 9/30/11. Performance prior to that date is that of the Fund’s Class Y shares which had different operating expenses. Accordingly, the “Since Inception” performance shown for Class Y, R3, R4 and R5 is since the commencement of operations of Class Y shares, 8/31/07.
Performance information includes performance under the Fund’s previous sub-adviser, Hartford Investment Management Company. As of April 2, 2012, Hartford Investment Management Company no longer served as the sub-adviser to the Fund.
Barclays U.S. Aggregate Bond Index is an unmanaged index and is composed of securities from the Barclays Government/Credit Bond Index, Mortgage-Backed Securities Index, Asset-Backed Securities Index and Commercial Mortgage-Backed Securities Index.
You cannot invest directly in an index.
The chart and table do not reflect the deductions of taxes that a shareholder would pay on Fund distributions or the redemption of Fund shares.
Performance information may reflect historical or current expense waivers/reimbursements from the investment adviser, without which performance would have been lower. For information on current expense waivers/reimbursements, please see the prospectus.
| 2 |
| The Hartford Strategic Income Fund |
| Manager Discussion |
| October 31, 2014 (Unaudited) |
Operating Expenses*
| Net | Gross | |||||||
| Strategic Income Class A | 0.95 | % | 0.99 | % | ||||
| Strategic Income Class B | 1.70 | % | 1.79 | % | ||||
| Strategic Income Class C | 1.69 | % | 1.69 | % | ||||
| Strategic Income Class I | 0.70 | % | 0.70 | % | ||||
| Strategic Income Class R3 | 1.25 | % | 1.39 | % | ||||
| Strategic Income Class R4 | 0.95 | % | 1.03 | % | ||||
| Strategic Income Class R5 | 0.65 | % | 0.71 | % | ||||
| Strategic Income Class Y | 0.60 | % | 0.61 | % | ||||
| * | As shown in the Fund's prospectus dated March 1, 2014. Actual expenses may be higher or lower. Please see accompanying Financial Highlights for expense ratios for the year ended October 31, 2014. |
Gross expenses are the Fund's total annual operating expenses shown in the Fund's prospectus dated March 1, 2014. Net expenses are the Fund's total annual operating expenses shown in the Fund's prospectus dated March 1, 2014 and reflect contractual expense reimbursements in instances when these reductions reduce the Fund's gross expenses. Contractual reimbursements remain in effect until February 28, 2015, and automatically renew for one-year terms unless terminated.
The Fund filed an updated prospectus, dated November 7, 2014, with the U.S. Securities and Exchange Commission that became effective on that date. However, the information in this annual report is as of October 31, 2014 and does not reflect any changes made to the total annual fund operating expense table in the November 7, 2014 prospectus.
All investments are subject to risk including the possible loss of principal. For a discussion of the Fund’s risks, please see the Main Risks section of this report. For more detailed information on the risks associated with an investment in the Fund, please see the prospectus.
| Portfolio Managers | ||
| Campe Goodman, CFA | Lucius T. Hill, III | Joseph F. Marvan, CFA |
| Senior Vice President and Fixed Income Portfolio Manager | Senior Vice President and Fixed Income Portfolio Manager | Senior Vice President and Fixed Income Portfolio Manager |
How did the Fund perform?
The Class A shares of The Hartford Strategic Income Fund returned 5.06%, before sales charge, for the twelve-month period ended October 31, 2014, outperforming the Fund’s benchmark, the Barclays U.S. Aggregate Bond Index, which returned 4.14% for the same period. The Fund also outperformed the 4.45% average return of the Lipper Multi-Sector Income Funds peer group, a group of funds that seek current income by allocating assets among several different fixed income securities sectors (with no more than 65% in any one sector except for defensive purposes), including U.S. government and foreign governments, with a significant portion of assets in securities rated below investment-grade.
Why did the Fund perform this way?
Fixed income markets gained throughout much of the period as expectations of prolonged easy monetary policy by major central banks and a supportive macroeconomic environment kept rates low and suppressed volatility. Early in the period emerging markets dominated headlines as economic and political developments sparked risk aversion across global markets, pushing bond prices higher and yields lower amid a flight to quality. Toward the end of the period, persistent geopolitical risks – tensions between Ukraine and Russia and violence in Iraq – and Chinese economic slowdown concerns raised questions about the global growth rate, keeping a lid on risk appetites overall.
The period was also highlighted by a divergence in central bank policies. The European Central Bank (ECB) cut its benchmark lending and deposit rates and announced a host of stimulus measures in an effort to encourage lending and fend off fears of deflation. China’s central bank joined the ECB in boosting liquidity by injecting funds into the nation’s largest banks in an attempt to combat weakening growth. The Bank of Japan pre-emptively announced incremental monetary easing to counter market fears that a change from a historical inflationary environment would be delayed. In contrast, the Bank of England and U.S. Federal Reserve (Fed) leaned toward tighter policies. The Fed ended its quantitative easing program as U.S. data largely suggested the economy was on a sustainable growth path. Second quarter gross domestic product (GDP) rebounded after the first quarter’s steep contraction. The labor market strengthened as the unemployment rate dropped to a six-year low. Housing regained some lost ground after a weak start to the year, though the pace of home price appreciation started to slow after a strong 2013. Inflation pressures were muted overall, allowing the Fed to maintain an accommodative stance.
The U.S. Treasury curve flattened as markets contemplated bringing interest rates to normal levels; short-term yields rose while longer term rates declined. Most credit sectors posted positive absolute returns and outperformed duration-equivalent government bonds as credit spreads tightened.
During the period, we continued to position the Fund with an overweight to credit sectors, including high yield credit, bank loans, and emerging market debt. Security selection within high yield credit, specifically industrials, and an out-of-benchmark allocation to bank loans represented the top contributors to benchmark-relative outperformance as higher yielding securities embraced the Fed’s forward guidance that continued to be accommodating and improving U.S. economic data. We tactically managed exposures to investment grade credit and high yield through credit default swap index exposure which contributed positively to performance overall.
| 3 |
| The Hartford Strategic Income Fund |
| Manager Discussion – (continued) |
| October 31, 2014 (Unaudited) |
The Fund’s allocation to bank loans, emphasizing the high and middle quality portions of the market, was based on strong credit fundamentals and reasonable valuations. The bank loan sector generated strong performance for the period and contributed significantly to benchmark-relative results. Mortgage Backed Securities (MBS) exposure, particularly an allocation to non-agency MBS, and Commercial Mortgage Backed Securities (CMBS) also contributed to the Fund’s relative performance. The Fund’s overweight to emerging markets debt also contributed significantly to relative results over the period. Positive relative results were partially offset by an allocation to developed non-U.S. dollar denominated debt, which detracted from relative results as the dollar strengthened over the period. Additionally, security selection within taxable municipals and an underweight to investment grade industrials detracted from relative returns over the period. Finally, an overweight to the 5-year portion of the yield curve detracted from relative performance, as 5-year U.S. Treasury rates rose over the twelve-month period.
What is the outlook?
At the end of the period, we maintained a moderately pro-cyclical risk posture as we see continued positive U.S. economic momentum, underpinned by still supportive monetary policy, improved investment spending, and much less fiscal drag compared to 2013. We continue to maintain a favorable outlook on global high yield based on low default expectations and positive corporate fundamentals. Within bank loans, we believe that overall credit fundamentals remain strong despite some lower-quality first-time issuers entering the market. We expect short-term interest rates to move higher as the Fed shifts to tighter U.S. monetary policy.
At the end of the period, we maintained underweights to the front-end and long-end of the yield curve and maintained a structural emphasis on higher income-producing sectors such as bank loans, emerging market debt, non-agency MBS, CMBS, and high yield.
Credit Exposure
as of October 31, 2014
| Credit Rating * | Percentage of Net Assets | |||
| Aaa/ AAA | 11.0 | % | ||
| Aa/ AA | 3.3 | |||
| A | 0.8 | |||
| Baa/ BBB | 24.7 | |||
| Ba/ BB | 23.1 | |||
| B | 19.2 | |||
| Caa/ CCC or Lower | 13.2 | |||
| Not Rated | 6.4 | |||
| Non-Debt Securities and Other Short-Term Instruments | 8.1 | |||
| Other Assets and Liabilities | (9.8 | ) | ||
| Total | 100.0 | % | ||
| * | Credit exposure is the long-term credit ratings for the Fund's holdings, as of the date noted, as provided by Standard and Poor's (S&P) or Moody's Investors Service (Moody's) and typically range from AAA/Aaa (highest) to C/D (lowest). Presentation of S&P and Moody's credit ratings in this report have been selected for informational purposes for shareholders, as well as the Fund's consideration of industry practice. If Moody's and S&P assign different ratings, the lower rating is used. Fixed income securities that are not rated by either agency are listed as "Not Rated." Ratings do not apply to the Fund itself or to the Fund's shares. Ratings may change. |
Diversification by Security Type
as of October 31, 2014
| Category | Percentage of Net Assets | |||
| Equity Securities | ||||
| Common Stocks | 0.1 | % | ||
| Preferred Stocks | 0.1 | |||
| Total | 0.2 | % | ||
| Fixed Income Securities | ||||
| Asset & Commercial Mortgage Backed Securities | 14.1 | % | ||
| Corporate Bonds | 21.5 | |||
| Foreign Government Obligations | 30.4 | |||
| Municipal Bonds | 0.8 | |||
| Senior Floating Rate Interests | 23.4 | |||
| U.S. Government Agencies | 10.4 | |||
| U.S. Government Securities | 1.0 | |||
| Total | 101.6 | % | ||
| Short-Term Investments | 8.0 | |||
| Purchased Options | 0.0 | |||
| Other Assets and Liabilities | (9.8 | ) | ||
| Total | 100.0 | % | ||
| 4 |
| The Hartford Strategic Income Fund |
| Schedule of Investments |
| October 31, 2014 |
| (000’s Omitted) |
| Shares or Principal Amount ╬ | Market Value ╪ | |||||||
| Asset and Commercial Mortgage Backed Securities - 14.1% | ||||||||
| Finance and Insurance - 14.1% | ||||||||
| American Home Mortgage Assets Trust | ||||||||
| $ | 467 | 0.28%, 03/25/2047 ‡Δ | $ | 380 | ||||
| 844 | 1.06%, 10/25/2046 ‡Δ | 615 | ||||||
| Banc of America Funding Corp. | ||||||||
| 671 | 0.35%, 10/20/2036 ‡Δ | 478 | ||||||
| 225 | 5.85%, 01/25/2037 ‡ | 182 | ||||||
| Banc of America Mortgage Securities | ||||||||
| 413 | 2.69%, 09/25/2035 Δ | 390 | ||||||
| BCAP LLC Trust | ||||||||
| 800 | 0.32%, 01/25/2037 ‡Δ | 602 | ||||||
| 794 | 0.33%, 03/25/2037 ‡Δ | 641 | ||||||
| 664 | 0.36%, 05/25/2047 ‡Δ | 492 | ||||||
| Bear Stearns Adjustable Rate Mortgage Trust | ||||||||
| 950 | 2.43%, 10/25/2035 ‡Δ | 935 | ||||||
| Bear Stearns Alt-A Trust | ||||||||
| 277 | 0.47%, 08/25/2036 Δ | 209 | ||||||
| Cent CLO L.P. | ||||||||
| 1,235 | 1.71%, 08/01/2024 ■Δ | 1,231 | ||||||
| Chase Mortgage Finance Corp. | ||||||||
| 1,050 | 5.50%, 11/25/2035 ‡ | 1,037 | ||||||
| Commercial Mortgage Trust | ||||||||
| 2,685 | 4.50%, 03/10/2046 ■‡Δ | 1,801 | ||||||
| Countrywide Alternative Loan Trust | ||||||||
| 768 | 0.47%, 11/25/2035 ‡Δ | 619 | ||||||
| 1,789 | 5.75%, 05/25/2036 | 1,523 | ||||||
| Countrywide Home Loans, Inc. | ||||||||
| 1,291 | 2.58%, 09/25/2047 Δ | 1,149 | ||||||
| 1,304 | 5.75%, 08/25/2037 | 1,248 | ||||||
| Deutsche Alt-A Securities, Inc. Mortgage | ||||||||
| 855 | 0.27%, 08/25/2036 Δ | 664 | ||||||
| 437 | 0.30%, 03/25/2037 ‡Δ | 298 | ||||||
| Downey S & L Association Mortgage Loan Trust | ||||||||
| 386 | 1.04%, 03/19/2046 ‡Δ | 298 | ||||||
| First Franklin Mortgage Loan Trust | ||||||||
| 1,155 | 0.39%, 04/25/2036 ‡Δ | 747 | ||||||
| First Horizon Alternative Mortgage Securities | ||||||||
| 2,194 | 2.21%, 04/25/2036 ‡Δ | 1,833 | ||||||
| 1,957 | 2.24%, 09/25/2035 ‡Δ | 1,709 | ||||||
| First Horizon Mortgage Pass-Through Trust | ||||||||
| 174 | 2.56%, 08/25/2037 Δ | 144 | ||||||
| GMAC Mortgage Corp. Loan Trust | ||||||||
| 1,137 | 2.93%, 09/19/2035 Δ | 1,063 | ||||||
| 154 | 2.95%, 04/19/2036 Δ | 136 | ||||||
| GS Mortgage Securities Trust | ||||||||
| 465 | 3.67%, 04/10/2047 ■Δ | 319 | ||||||
| 1,795 | 5.02%, 11/10/2045 ■‡Δ | 1,762 | ||||||
| GSAA Home Equity Trust | ||||||||
| 938 | 0.22%, 12/25/2046 ╦Δ | 533 | ||||||
| 1,993 | 0.23%, 02/25/2037 ‡Δ | 1,085 | ||||||
| 1,115 | 0.32%, 03/25/2047 ΔΘ | 583 | ||||||
| 652 | 5.88%, 09/25/2036 ‡ | 367 | ||||||
| GSAMP Trust | ||||||||
| 2,162 | 0.24%, 01/25/2037 ╦Δ | 1,293 | ||||||
| GSR Mortgage Loan Trust | ||||||||
| 172 | 2.67%, 10/25/2035 Δ | 152 | ||||||
| 1,676 | 2.74%, 01/25/2036 Δ | 1,552 | ||||||
| 1,312 | 2.78%, 04/25/2035 ╦Δ | 1,274 | ||||||
| Harborview Mortgage Loan Trust | ||||||||
| 1,553 | 0.38%, 05/19/2047 ╦Δ | 608 | ||||||
| 4,313 | 0.40%, 12/19/2036 ╦Δ | 3,052 | ||||||
| 951 | 0.49%, 09/19/2035 ╦Δ | 733 | ||||||
| Hilton USA Trust | ||||||||
| 1,395 | 3.91%, 11/05/2030 ■╦Δ | 1,395 | ||||||
| Home Equity Loan Trust | ||||||||
| 562 | 2.45%, 11/25/2035 ╦Δ | 528 | ||||||
| IMPAC Commercial Mortgage Backed Trust | ||||||||
| 119 | 1.65%, 02/25/2036 Δ | 116 | ||||||
| IMPAC Secured Assets Trust | ||||||||
| 2,309 | 0.43%, 08/25/2036 ╦Δ | 1,761 | ||||||
| IndyMac Index Mortgage Loan Trust | ||||||||
| 569 | 0.43%, 07/25/2035 ╦Δ | 485 | ||||||
| 352 | 0.44%, 01/25/2036 ╦Δ | 243 | ||||||
| 1,949 | 0.55%, 07/25/2046 ╦Δ | 957 | ||||||
| JP Morgan Chase Commercial Mortgage Securities Corp. | ||||||||
| 206 | 2.75%, 10/15/2045 ■ | 156 | ||||||
| 485 | 4.57%, 12/15/2047 ■╦Δ | 412 | ||||||
| JP Morgan Mortgage Trust | ||||||||
| 391 | 2.54%, 09/25/2035 Δ | 376 | ||||||
| 499 | 2.56%, 08/25/2036 ╦Δ | 436 | ||||||
| 624 | 2.71%, 05/25/2036 ╦Δ | 567 | ||||||
| Lehman XS Trust | ||||||||
| 555 | 0.36%, 07/25/2046 Δ | 440 | ||||||
| 215 | 0.39%, 06/25/2047 Δ | 144 | ||||||
| 112 | 1.00%, 09/25/2047 Δ | 91 | ||||||
| Merrill Lynch Mortgage Investors Trust | ||||||||
| 449 | 2.52%, 07/25/2035 ╦Δ | 372 | ||||||
| Morgan Stanley ABS Capital I | ||||||||
| 1,201 | 0.30%, 06/25/2036 ╦Δ | 923 | ||||||
| Morgan Stanley BAML Trust | ||||||||
| 390 | 4.50%, 08/15/2045 ■ | 297 | ||||||
| Morgan Stanley Mortgage Loan Trust | ||||||||
| 1,280 | 0.32%, 05/25/2036 - 11/25/2036 ╦Δ | 610 | ||||||
| RBSGC Mortage Pass Through Certificates | ||||||||
| 695 | 6.25%, 01/25/2037 ╦ | 651 | ||||||
| Residential Accredit Loans, Inc. | ||||||||
| 274 | 0.92%, 09/25/2046 Δ | 184 | ||||||
| 2,470 | 1.41%, 11/25/2037 ╦Δ | 1,572 | ||||||
| Residential Asset Securitization Trust | ||||||||
| 870 | 0.60%, 03/25/2035 Δ | 672 | ||||||
| Residential Funding Mortgage Securities, Inc. | ||||||||
| 135 | 3.05%, 04/25/2037 Δ | 118 | ||||||
| Sequoia Mortgage Trust | ||||||||
| 295 | 0.43%, 01/20/2035 ╦Δ | 282 | ||||||
| 73 | 2.52%, 07/20/2037 Δ | 59 | ||||||
| Soundview Home Equity Loan Trust, Inc. | ||||||||
| 1,566 | 0.39%, 07/25/2036 ╦Δ | 912 | ||||||
| SpringCastle America Funding LLC | ||||||||
| 1,550 | 2.70%, 05/25/2023 ■ | 1,551 | ||||||
| Springleaf Mortgage Loan Trust | ||||||||
| 1,035 | 3.52%, 12/25/2065 ■ | 1,056 | ||||||
| Structured Adjustable Rate Mortgage Loan Trust | ||||||||
| 2,189 | 2.48%, 02/25/2036 Δ | 1,749 | ||||||
| Structured Agency Credit Risk Debt Notes | ||||||||
| 280 | 4.90%, 10/25/2024 Δ | 281 | ||||||
| Structured Asset Mortgage Investments, Inc. | ||||||||
| 1,707 | 0.38%, 02/25/2036 ╦Δ | 1,391 | ||||||
| UBS-Barclays Commercial Mortgage Trust | ||||||||
| 240 | 4.23%, 03/10/2046 ■Δ | 200 | ||||||
The accompanying notes are an integral part of these financial statements.
| 5 |
| The Hartford Strategic Income Fund |
| Schedule of Investments – (continued) |
| October 31, 2014 |
| (000’s Omitted) |
| Shares or Principal Amount ╬ | Market Value ╪ | |||||||
| Asset and Commercial Mortgage Backed Securities - 14.1% - (continued) | ||||||||
| Finance and Insurance - 14.1% - (continued) | ||||||||
| VNO Mortgage Trust | ||||||||
| $ | 710 | 4.08%, 12/13/2029 ■Δ | $ | 717 | ||||
| Wells Fargo Alternative Loan Trust | ||||||||
| 249 | 2.60%, 12/28/2037 Δ | 200 | ||||||
| 260 | 6.25%, 11/25/2037 | 246 | ||||||
| Wells Fargo Mortgage Backed Securities Trust | ||||||||
| 446 | 2.49%, 09/25/2036 ╦Δ | 414 | ||||||
| 1,387 | 2.61%, 04/25/2036 Δ | 1,353 | ||||||
| 158 | 5.21%, 10/25/2035 ╦Δ | 157 | ||||||
| WF-RBS Commercial Mortgage Trust | ||||||||
| 1,750 | 4.96%, 11/15/2045 ■╦Δ | 1,534 | ||||||
| 366 | 5.00%, 06/15/2044 - 04/15/2045 ■╦ | 307 | ||||||
| 59,652 | ||||||||
| Total Asset and Commercial Mortgage Backed Securities | ||||||||
| (Cost $56,108) | $ | 59,652 | ||||||
| Corporate Bonds - 21.5% | ||||||||
| Accommodation and Food Services - 0.1% | ||||||||
| Choice Hotels International, Inc. | ||||||||
| $ | 420 | 5.75%, 07/01/2022 ‡ | $ | 453 | ||||
| Administrative, Support, Waste Management and Remediation Services - 0.3% | ||||||||
| ADT (The) Corp. | ||||||||
| 875 | 6.25%, 10/15/2021 | 919 | ||||||
| Clean Harbors, Inc. | ||||||||
| 60 | 5.13%, 06/01/2021 ‡ | 61 | ||||||
| 121 | 5.25%, 08/01/2020 ‡ | 124 | ||||||
| Equinix, Inc. | ||||||||
| 45 | 4.88%, 04/01/2020 ‡ | 46 | ||||||
| 135 | 5.38%, 04/01/2023 ‡ | 139 | ||||||
| 1,289 | ||||||||
| Arts, Entertainment and Recreation - 0.7% | ||||||||
| CCO Holdings LLC | ||||||||
| 30 | 5.13%, 02/15/2023 ‡ | 30 | ||||||
| 335 | 5.25%, 09/30/2022 ‡ | 337 | ||||||
| 70 | 5.75%, 09/01/2023 ‡ | 72 | ||||||
| Gannett Co., Inc. | ||||||||
| 200 | 4.88%, 09/15/2021 ■ | 201 | ||||||
| 1,100 | 5.13%, 10/15/2019 - 07/15/2020 ╦ | 1,143 | ||||||
| Grupo Televisa S.A.B. | ||||||||
| 365 | 5.00%, 05/13/2045 ╦ | 363 | ||||||
| NBC Universal Enterprise | ||||||||
| 440 | 5.25%, 12/19/2049 ■╦ | 458 | ||||||
| Numericable Group S.A. | ||||||||
| 235 | 4.88%, 05/15/2019 ■ | 235 | ||||||
| 2,839 | ||||||||
| Chemical Manufacturing - 0.2% | ||||||||
| Eagle Spinco, Inc. | ||||||||
| 400 | 4.63%, 02/15/2021 | 388 | ||||||
| NOVA Chemicals Corp. | ||||||||
| 560 | 5.00%, 05/01/2025 ■ | 578 | ||||||
| 966 | ||||||||
| Construction - 0.2% | ||||||||
| Lennar Corp. | ||||||||
| 600 | 4.50%, 06/15/2019 ╦ | 611 | ||||||
| Ryland Group, Inc. | ||||||||
| 231 | 5.38%, 10/01/2022 | 226 | ||||||
| 837 | ||||||||
| Electrical Equipment and Appliance Manufacturing - 0.0% | ||||||||
| Sensata Technologies B.V. | ||||||||
| 35 | 5.63%, 11/01/2024 ■ | 37 | ||||||
| Finance and Insurance - 10.3% | ||||||||
| AerCap Ireland Capital Ltd. | ||||||||
| 700 | 4.50%, 05/15/2021 ■‡ | 707 | ||||||
| AXA S.A. | ||||||||
| 1,330 | 6.46%, 12/14/2018 ■‡♠Δ | 1,389 | ||||||
| Banco Bilbao Vizcaya Argentaria S.A. | ||||||||
| EUR | 2,200 | 7.00%, 12/29/2049 § | 2,828 | |||||
| 1,200 | 9.00%, 05/09/2018 §♠ | 1,297 | ||||||
| Banco do Brasil | ||||||||
| 1,050 | 6.25%, 04/15/2024 §♠ | 824 | ||||||
| Banco Santander S.A. | ||||||||
| EUR | 3,000 | 6.25%, 03/12/2049 - 09/11/2049 ╦§ | 3,678 | |||||
| Bank of Ireland | ||||||||
| EUR | 775 | 10.00%, 07/30/2016 § | 1,049 | |||||
| Barclays Bank plc | ||||||||
| EUR | 925 | 8.00%, 12/15/2049 | 1,203 | |||||
| 1,050 | 8.25%, 12/15/2018 ♠β | 1,084 | ||||||
| CIT Group, Inc. | ||||||||
| 1,017 | 5.50%, 02/15/2019 ■‡ | 1,085 | ||||||
| Citigroup, Inc. | ||||||||
| 310 | 6.68%, 09/13/2043 ‡ | 394 | ||||||
| CNH Industrial Capital LLC | ||||||||
| 30 | 3.38%, 07/15/2019 ■ | 29 | ||||||
| Credit Agricole S.A. | ||||||||
| EUR | 1,050 | 6.50%, 06/23/2049 § | 1,338 | |||||
| 435 | 6.63%, 09/23/2019 ■♠Δ | 425 | ||||||
| Credit Suisse Group AG | ||||||||
| EUR | 475 | 5.75%, 09/18/2025 § | 662 | |||||
| 990 | 6.25%, 12/18/2024 ■♠Δ | 963 | ||||||
| 675 | 7.88%, 02/24/2041 § | 720 | ||||||
| Development Bank of Kazakhstan JSC | ||||||||
| 525 | 4.13%, 12/10/2022 ╦§ | 497 | ||||||
| HSBC Holdings plc | ||||||||
| 450 | 5.25%, 03/14/2044 ╦ | 489 | ||||||
| 675 | 5.63%, 01/17/2020 ╦♠ | 686 | ||||||
| 600 | 6.38%, 09/17/2024 ╦♠ | 612 | ||||||
| JP Morgan Chase & Co. | ||||||||
| 2,345 | 5.63%, 08/16/2043 ╦ | 2,677 | ||||||
| KBC Groep N.V. | ||||||||
| EUR | 575 | 5.63%, 03/19/2019 §♠ | 706 | |||||
| Lloyds Banking Group plc | ||||||||
| EUR | 1,825 | 6.38%, 06/27/2049 § | 2,361 | |||||
| GBP | 750 | 7.00%, 12/29/2049 § | 1,198 | |||||
| Mapfre S.A. | ||||||||
| EUR | 1,450 | 5.92%, 07/24/2037 | 1,931 | |||||
| Minerva Luxembourg S.A. | ||||||||
| 560 | 7.75%, 01/31/2023 ■╦ | 585 | ||||||
| Nationwide Building Society | ||||||||
| GBP | 1,525 | 6.88%, 03/11/2049 § | 2,385 | |||||
| Navient Corp. | ||||||||
| 340 | 5.50%, 01/15/2019 ╦ | 352 | ||||||
| 400 | 7.25%, 01/25/2022 | 447 | ||||||
| 490 | 8.45%, 06/15/2018 ╦ | 560 | ||||||
The accompanying notes are an integral part of these financial statements.
| 6 |
| The Hartford Strategic Income Fund |
| Schedule of Investments – (continued) |
| October 31, 2014 |
| (000’s Omitted) |
| Shares or Principal Amount ╬ | Market Value ╪ | |||||||
| Corporate Bonds - 21.5% - (continued) | ||||||||
| Finance and Insurance - 10.3% - (continued) | ||||||||
| SBA Tower Trust | ||||||||
| $ | 1,355 | 3.60%, 04/15/2043 ■╦ | $ | 1,364 | ||||
| Societe Generale | ||||||||
| 785 | 6.00%, 01/27/2020 ■♠ | 740 | ||||||
| EUR | 650 | 6.75%, 04/07/2049 § | 818 | |||||
| 2,350 | 8.25%, 11/29/2018 ╦§♠ | 2,483 | ||||||
| UniCredit S.p.A. | ||||||||
| 500 | 8.00%, 06/03/2024 §♠ | 501 | ||||||
| Vnesheconombank Via VEB Finance plc | ||||||||
| 300 | 5.94%, 11/21/2023 § | 283 | ||||||
| VTB Capital S.A. | ||||||||
| 1,525 | 6.88%, 05/29/2018 ╦§ | 1,556 | ||||||
| Yasar Holdings | ||||||||
| 930 | 8.88%, 05/06/2020 ■☼ | 930 | ||||||
| 43,836 | ||||||||
| Food Manufacturing - 0.7% | ||||||||
| ESAL GmbH | ||||||||
| 825 | 6.25%, 02/05/2023 § | 841 | ||||||
| Grupo Bimbo S.A.B. de C.V. | ||||||||
| 2,125 | 4.88%, 06/27/2044 ■ | 2,084 | ||||||
| 2,925 | ||||||||
| Health Care and Social Assistance - 0.7% | ||||||||
| Community Health Systems, Inc. | ||||||||
| 405 | 5.13%, 08/01/2021 ‡ | 423 | ||||||
| HCA, Inc. | ||||||||
| 305 | 4.75%, 05/01/2023 ╦ | 310 | ||||||
| 500 | 6.50%, 02/15/2020 ╦ | 558 | ||||||
| Tenet Healthcare Corp. | ||||||||
| 1,380 | 6.00%, 10/01/2020 ╦ | 1,484 | ||||||
| Wellcare Health Plans, Inc. | ||||||||
| 175 | 5.75%, 11/15/2020 ╦ | 180 | ||||||
| 2,955 | ||||||||
| Information - 2.1% | ||||||||
| Activision Blizzard, Inc. | ||||||||
| 1,390 | 5.63%, 09/15/2021 ■‡ | 1,478 | ||||||
| Audatex North America, Inc. | ||||||||
| 585 | 6.00%, 06/15/2021 ■‡ | 619 | ||||||
| DISH DBS Corp. | ||||||||
| 350 | 6.75%, 06/01/2021 ‡ | 388 | ||||||
| 425 | 7.88%, 09/01/2019 ‡ | 494 | ||||||
| MTS International Funding Ltd. | ||||||||
| 1,040 | 5.00%, 05/30/2023 ■╦ | 932 | ||||||
| Sprint Communications, Inc. | ||||||||
| 799 | 7.00%, 03/01/2020 ■╦ | 891 | ||||||
| 451 | 9.00%, 11/15/2018 ■╦ | 531 | ||||||
| T-Mobile USA, Inc. | ||||||||
| 315 | 5.25%, 09/01/2018 ╦ | 327 | ||||||
| 85 | 6.13%, 01/15/2022 | 88 | ||||||
| 400 | 6.46%, 04/28/2019 ╦ | 417 | ||||||
| 160 | 6.63%, 04/28/2021 ╦ | 169 | ||||||
| 195 | 6.73%, 04/28/2022 ╦ | 206 | ||||||
| Videotron Ltd. | ||||||||
| 750 | 5.38%, 06/15/2024 ■ | 772 | ||||||
| VimpelCom Holdings B.V. | ||||||||
| 1,285 | 5.95%, 02/13/2023 ■╦ | 1,181 | ||||||
| Wind Acquisition Finance S.A. | ||||||||
| 350 | 4.75%, 07/15/2020 ■ | 342 | ||||||
| 8,835 | ||||||||
| Machinery Manufacturing - 0.1% | ||||||||
| Case New Holland Industrial, Inc. | ||||||||
| 585 | 7.88%, 12/01/2017 ‡ | 657 | ||||||
| Mining - 0.9% | ||||||||
| ABJA Investment Co. Pte Ltd. | ||||||||
| 2,035 | 5.95%, 07/31/2024 § | 2,068 | ||||||
| FMG Resources Aug 2006 | ||||||||
| 396 | 6.88%, 04/01/2022 ■‡ | 409 | ||||||
| Peabody Energy Corp. | ||||||||
| 40 | 6.00%, 11/15/2018 | 39 | ||||||
| 860 | 6.50%, 09/15/2020 ╦ | 819 | ||||||
| Steel Dynamics, Inc. | ||||||||
| 145 | 5.13%, 10/01/2021 ■ | 150 | ||||||
| 155 | 5.50%, 10/01/2024 ■ | 164 | ||||||
| 3,649 | ||||||||
| Motor Vehicle and Parts Manufacturing - 0.1% | ||||||||
| General Motors Co. | ||||||||
| 360 | 6.25%, 10/02/2043 ╦ | 428 | ||||||
| Nonmetallic Mineral Product Manufacturing - 0.5% | ||||||||
| Grupo Cementos Chihuahua | ||||||||
| 1,180 | 8.13%, 02/08/2020 ■ | 1,288 | ||||||
| Union Andina de Cementos SAA | ||||||||
| 710 | 5.88%, 10/30/2021 ■ | 721 | ||||||
| 2,009 | ||||||||
| Other Services - 0.1% | ||||||||
| Cardtronics, Inc. | ||||||||
| 315 | 5.13%, 08/01/2022 ■‡ | 313 | ||||||
| Paper Manufacturing - 0.2% | ||||||||
| Clearwater Paper Corp. | ||||||||
| 315 | 5.38%, 02/01/2025 ■‡ | 319 | ||||||
| Graphic Packaging International | ||||||||
| 390 | 4.88%, 11/15/2022 ☼ | 392 | ||||||
| 711 | ||||||||
| Petroleum and Coal Products Manufacturing - 1.5% | ||||||||
| California Resources Corp. | ||||||||
| 50 | 5.00%, 01/15/2020 ■ | 51 | ||||||
| 125 | 5.50%, 09/15/2021 ■ | 127 | ||||||
| 85 | 6.00%, 11/15/2024 ■ | 87 | ||||||
| Concho Resources, Inc. | ||||||||
| 115 | 6.50%, 01/15/2022 | 124 | ||||||
| Denbury Resources, Inc. | ||||||||
| 765 | 5.50%, 05/01/2022 ‡ | 753 | ||||||
| EDC Finance Ltd. | ||||||||
| 1,115 | 4.88%, 04/17/2020 ■ | 1,009 | ||||||
| Harvest Operations Corp. | ||||||||
| 181 | 6.88%, 10/01/2017 ╦ | 185 | ||||||
| KazMunayGas National Co. JSC | ||||||||
| 980 | 11.75%, 01/23/2015 ╦§ | 1,000 | ||||||
| MEG Energy Corp. | ||||||||
| 375 | 7.00%, 03/31/2024 ■ | 377 | ||||||
| Pertamina Persero PT | ||||||||
| 900 | 5.63%, 05/20/2043 ╦§ | 862 | ||||||
| Tesoro Corp. | ||||||||
| 455 | 5.13%, 04/01/2024 | 456 | ||||||
| Tesoro Logistics L.P. | ||||||||
| 230 | 5.50%, 10/15/2019 ■ | 237 | ||||||
| 350 | 6.25%, 10/15/2022 ■ | 362 | ||||||
The accompanying notes are an integral part of these financial statements.
| 7 |
| The Hartford Strategic Income Fund |
| Schedule of Investments – (continued) |
| October 31, 2014 |
| (000’s Omitted) |
| Shares or Principal Amount ╬ | Market Value ╪ | |||||||
| Corporate Bonds - 21.5% - (continued) | ||||||||
| Petroleum and Coal Products Manufacturing - 1.5% - (continued) | ||||||||
| WPX Energy, Inc. | ||||||||
| $ | 260 | 5.25%, 09/15/2024 ☼ | $ | 254 | ||||
| 425 | 6.00%, 01/15/2022 | 445 | ||||||
| 6,329 | ||||||||
| Pipeline Transportation - 0.9% | ||||||||
| El Paso Corp. | ||||||||
| 305 | 7.00%, 06/15/2017 ‡ | 339 | ||||||
| Energy Transfer Equity L.P. | ||||||||
| 2,125 | 5.95%, 10/01/2043 ‡ | 2,348 | ||||||
| 1,005 | 7.50%, 10/15/2020 ‡ | 1,156 | ||||||
| Kinder Morgan Finance Co. | ||||||||
| 10 | 6.00%, 01/15/2018 ■ | 11 | ||||||
| Southern Star Central Corp. | ||||||||
| 70 | 5.13%, 07/15/2022 ■ | 71 | ||||||
| 3,925 | ||||||||
| Primary Metal Manufacturing - 0.2% | ||||||||
| ArcelorMittal | ||||||||
| 515 | 5.75%, 08/05/2020 | 547 | ||||||
| United States Steel Corp. | ||||||||
| 260 | 7.38%, 04/01/2020 ╦ | 291 | ||||||
| 838 | ||||||||
| Rail Transportation - 0.1% | ||||||||
| Kazakhstan Temir Zholy Finance B.V. | ||||||||
| 385 | 6.95%, 07/10/2042 ╦§ | 429 | ||||||
| Real Estate, Rental and Leasing - 0.1% | ||||||||
| International Lease Finance Corp. | ||||||||
| 490 | 5.88%, 04/01/2019 - 08/15/2022 ╦ | 529 | ||||||
| 529 | ||||||||
| Retail Trade - 0.9% | ||||||||
| Arcelik AS | ||||||||
| 995 | 5.00%, 04/03/2023 ■ | 940 | ||||||
| Building Materials Corp. | ||||||||
| 440 | 5.38%, 11/15/2024 ■☼ | 441 | ||||||
| 174 | 6.75%, 05/01/2021 ■‡ | 187 | ||||||
| 141 | 7.50%, 03/15/2020 ■‡ | 149 | ||||||
| Group 1 Automotive, Inc. | ||||||||
| 285 | 5.00%, 06/01/2022 ■ | 282 | ||||||
| Sally Holdings LLC | ||||||||
| 80 | 5.75%, 06/01/2022 | 85 | ||||||
| Sotheby's | ||||||||
| 820 | 5.25%, 10/01/2022 ■╦ | 804 | ||||||
| William Carter Co. | ||||||||
| 950 | 5.25%, 08/15/2021 ╦ | 979 | ||||||
| 3,867 | ||||||||
| Transportation Equipment Manufacturing - 0.1% | ||||||||
| Huntington Ingalls Industries, Inc. | ||||||||
| 405 | 7.13%, 03/15/2021 ╦ | 435 | ||||||
| Utilities - 0.5% | ||||||||
| AES (The) Corp. | ||||||||
| 1,100 | 8.00%, 06/01/2020 ‡ | 1,277 | ||||||
| Dolphin Subsidiary II, Inc. | ||||||||
| 265 | 7.25%, 10/15/2021 ‡ | 282 | ||||||
| NRG Energy, Inc. | ||||||||
| 375 | 6.25%, 07/15/2022 | 392 | ||||||
| 1,951 | ||||||||
| Total Corporate Bonds | ||||||||
| (Cost $91,556) | $ | 91,042 | ||||||
| Foreign Government Obligations - 30.4% | ||||||||
| Angola - 0.2% | ||||||||
| Angola (Republic of) | ||||||||
| $ | 775 | 7.00%, 08/16/2019 § | $ | 828 | ||||
| Argentina - 0.5% | ||||||||
| Argentina (Republic of) | ||||||||
| 415 | 0.00%, 04/17/2017 ● | 368 | ||||||
| 2,175 | 8.75%, 06/02/2017 | 1,914 | ||||||
| 2,282 | ||||||||
| Armenia - 0.2% | ||||||||
| Armenia (Republic of) | ||||||||
| 800 | 6.00%, 09/30/2020 § | 836 | ||||||
| Austria - 0.1% | ||||||||
| Austria (Republic of) | ||||||||
| EUR | 180 | 1.75%, 10/20/2023 ■ | $ | 242 | ||||
| EUR | 225 | 1.95%, 06/18/2019 ■ | 305 | |||||
| 547 | ||||||||
| Azerbaijan - 0.3% | ||||||||
| Azerbaijan (Republic of) | ||||||||
| 1,140 | 4.75%, 03/13/2023 § | 1,132 | ||||||
| Belgium - 0.2% | ||||||||
| Belgium (Kingdom of) | ||||||||
| EUR | 515 | 1.25%, 06/22/2018 § | 672 | |||||
| EUR | 250 | 2.60%, 06/22/2024 ■ | 356 | |||||
| 1,028 | ||||||||
| Brazil - 2.9% | ||||||||
| Brazil (Federative Republic of) | ||||||||
| 1,540 | 5.00%, 01/27/2045 ‡ | 1,509 | ||||||
| 571 | 5.63%, 01/07/2041 ‡ | 618 | ||||||
| 400 | 5.88%, 01/15/2019 ‡ | 452 | ||||||
| 721 | 8.00%, 01/15/2018 ‡ | 798 | ||||||
| 2,195 | 8.25%, 01/20/2034 ‡ | 3,040 | ||||||
| BRL | 9,190 | 9.70%, 09/01/2020 ○ | 2,382 | |||||
| 800 | 11.00%, 08/17/2040 ‡ | 864 | ||||||
| 1,295 | 12.25%, 03/06/2030 ‡ | 2,428 | ||||||
| 12,091 | ||||||||
| Colombia - 1.8% | ||||||||
| Colombia (Republic of) | ||||||||
| 1,350 | 4.38%, 07/12/2021 ‡ | 1,440 | ||||||
| 565 | 5.63%, 02/26/2044 ‡ | 631 | ||||||
| 1,055 | 6.13%, 01/18/2041 ‡ | 1,266 | ||||||
| 1,245 | 7.38%, 09/18/2037 ‡ | 1,677 | ||||||
| 430 | 8.13%, 05/21/2024 ‡ | 573 | ||||||
| 1,295 | 11.75%, 02/25/2020 ‡ | 1,842 | ||||||
| 7,429 | ||||||||
| Costa Rica - 0.2% | ||||||||
| Costa Rica (Republic of) | ||||||||
| 1,175 | 5.63%, 04/30/2043 § | 1,028 | ||||||
The accompanying notes are an integral part of these financial statements.
| 8 |
| The Hartford Strategic Income Fund |
| Schedule of Investments – (continued) |
| October 31, 2014 |
| (000’s Omitted) |
| Shares or Principal Amount ╬ | Market Value ╪ | |||||||
| Foreign Government Obligations - 30.4% - (continued) | ||||||||
| Denmark - 0.1% | ||||||||
| Denmark (Kingdom of) | ||||||||
| DKK | 1,745 | 4.00%, 11/15/2019 | $ | 350 | ||||
| Dominican Republic - 0.2% | ||||||||
| Dominican (Republic of) | ||||||||
| DOP | 30,000 | 11.50%, 05/10/2024 ■ | 699 | |||||
| Finland - 0.1% | ||||||||
| Finland (Republic of) | ||||||||
| EUR | 150 | 1.13%, 09/15/2018 ■ | 196 | |||||
| EUR | 90 | 1.50%, 04/15/2023 ■ | 119 | |||||
| 315 | ||||||||
| France - 0.6% | ||||||||
| France (Government of) | ||||||||
| EUR | 1,850 | 1.00%, 11/25/2018 ╦ | 2,398 | |||||
| Hungary - 0.8% | ||||||||
| Hungary (Republic of) | ||||||||
| 784 | 5.38%, 02/21/2023 | 843 | ||||||
| 296 | 5.75%, 11/22/2023 | 326 | ||||||
| 360 | 6.25%, 01/29/2020 | 404 | ||||||
| 444 | 6.38%, 03/29/2021 | 504 | ||||||
| 966 | 7.63%, 03/29/2041 | 1,248 | ||||||
| 3,325 | ||||||||
| Iceland - 0.1% | ||||||||
| Iceland (Republic of) | ||||||||
| 250 | 5.88%, 05/11/2022 § | 282 | ||||||
| Indonesia - 2.5% | ||||||||
| Indonesia (Republic of) | ||||||||
| 1,440 | 4.88%, 05/05/2021 ╦§ | 1,539 | ||||||
| 710 | 6.63%, 02/17/2037 § | 829 | ||||||
| 965 | 6.75%, 01/15/2044 § | 1,183 | ||||||
| 2,155 | 6.88%, 01/17/2018 ╦§ | 2,433 | ||||||
| 1,800 | 7.75%, 01/17/2038 ╦§ | 2,369 | ||||||
| IDR | 14,400,000 | 8.38%, 03/15/2024 | 1,217 | |||||
| 860 | 8.50%, 10/12/2035 § | 1,200 | ||||||
| 10,770 | ||||||||
| Ireland - 0.1% | ||||||||
| Ireland (Republic of) | ||||||||
| EUR | 80 | 3.40%, 03/18/2024 § | 115 | |||||
| EUR | 230 | 4.50%, 10/18/2018 | 333 | |||||
| 448 | ||||||||
| Italy - 0.5% | ||||||||
| Italy (Republic of) | ||||||||
| EUR | 1,650 | 1.50%, 08/01/2019 ╦ | 2,097 | |||||
| Japan - 0.8% | ||||||||
| Japan (Government of) | ||||||||
| JPY | 306,750 | 0.30%, 03/20/2017 - 09/20/2018 ╦ | 2,751 | |||||
| JPY | 50,000 | 1.10%, 03/20/2021 | 471 | |||||
| 3,222 | ||||||||
| Latvia - 0.5% | ||||||||
| Latvia (Republic of) | ||||||||
| 1,900 | 5.25%, 02/22/2017 - 06/16/2021 § | 2,100 | ||||||
| 2,100 | ||||||||
| Lithuania - 0.6% | ||||||||
| Lithuania (Republic of) | ||||||||
| 1,305 | 6.13%, 03/09/2021 ╦§ | 1,520 | ||||||
| 725 | 6.75%, 01/15/2015 § | 733 | ||||||
| 150 | 7.38%, 02/11/2020 § | 182 | ||||||
| 2,435 | ||||||||
| Malaysia - 0.1% | ||||||||
| Malaysia (Government of) | ||||||||
| MYR | 1,620 | 4.26%, 09/15/2016 | 499 | |||||
| Mexico - 2.6% | ||||||||
| Mexico (United Mexican States) | ||||||||
| 580 | 3.50%, 01/21/2021 | 596 | ||||||
| MXN | 25,247 | 4.00%, 06/13/2019 ◄╦ | 2,071 | |||||
| 3,126 | 4.75%, 03/08/2044 ╦ | 3,174 | ||||||
| 2,272 | 5.75%, 10/12/2110 ╦ | 2,406 | ||||||
| 1,290 | 6.05%, 01/11/2040 ╦ | 1,558 | ||||||
| MXN | 2,238 | 6.50%, 06/09/2022 ╦ | 174 | |||||
| 830 | 6.75%, 09/27/2034 | 1,072 | ||||||
| MXN | 1,749 | 8.00%, 06/11/2020 | 147 | |||||
| 11,198 | ||||||||
| Netherlands - 0.3% | ||||||||
| Netherlands (Government of) | ||||||||
| EUR | 700 | 1.25%, 01/15/2019 ■ | 919 | |||||
| EUR | 195 | 2.00%, 07/15/2024 | 267 | |||||
| 1,186 | ||||||||
| Nigeria - 0.5% | ||||||||
| Nigeria (Republic of) | ||||||||
| NGN | 330,000 | 13.05%, 08/16/2016 | 2,020 | |||||
| Norway - 0.0% | ||||||||
| Norway (Kingdom of) | ||||||||
| NOK | 955 | 3.75%, 05/25/2021 | 160 | |||||
| Panama - 0.3% | ||||||||
| Panama (Republic of) | ||||||||
| 870 | 8.88%, 09/30/2027 | 1,246 | ||||||
| Peru - 0.5% | ||||||||
| Peru (Republic of) | ||||||||
| 1,450 | 8.75%, 11/21/2033 ╦ | 2,229 | ||||||
| Philippines - 1.2% | ||||||||
| Philippines (Republic of) | ||||||||
| 580 | 5.50%, 03/30/2026 | 677 | ||||||
| 945 | 6.38%, 01/15/2032 | 1,210 | ||||||
| 2,035 | 10.63%, 03/16/2025 ╦ | 3,220 | ||||||
| 5,107 | ||||||||
| Poland - 0.1% | ||||||||
| Poland (Republic of) | ||||||||
| PLN | 205 | 4.00%, 10/25/2023 | 68 | |||||
| PLN | 1,100 | 5.25%, 10/25/2017 | 359 | |||||
| 427 | ||||||||
| Romania - 0.7% | ||||||||
| Romania (Republic of) | ||||||||
| 610 | 4.38%, 08/22/2023 ╦§ | 635 | ||||||
| 1,116 | 6.13%, 01/22/2044 ╦§ | 1,307 | ||||||
| 1,026 | 6.75%, 02/07/2022 § | 1,229 | ||||||
| 3,171 | ||||||||
The accompanying notes are an integral part of these financial statements.
| 9 |
| The Hartford Strategic Income Fund |
| Schedule of Investments – (continued) |
| October 31, 2014 |
| (000’s Omitted) |
| Shares or Principal Amount ╬ | Market Value ╪ | |||||||
| Foreign Government Obligations - 30.4% - (continued) | ||||||||
| Russia - 4.0% | ||||||||
| Russia (Federation of) | ||||||||
| $ | 1,400 | 3.25%, 04/04/2017 ╦§ | $ | 1,404 | ||||
| 3,400 | 3.63%, 04/29/2015 ╦§ | 3,413 | ||||||
| 3,000 | 4.88%, 09/16/2023 ╦§ | 3,005 | ||||||
| 1,900 | 5.00%, 04/29/2020 ╦§ | 1,957 | ||||||
| RUB | 47,200 | 7.50%, 02/27/2019 Δ | 1,006 | |||||
| 3,452 | 7.50%, 03/31/2030 ╦§ | 3,916 | ||||||
| 1,450 | 12.75%, 06/24/2028 ╦§ | 2,389 | ||||||
| 17,090 | ||||||||
| Singapore - 0.1% | ||||||||
| Singapore (Republic of) | ||||||||
| SGD | 400 | 3.75%, 09/01/2016 | 330 | |||||
| Slovenia - 0.1% | ||||||||
| Slovenia (Republic of) | ||||||||
| 385 | 5.85%, 05/10/2023 | 432 | ||||||
| South Africa - 0.4% | ||||||||
| South Africa (Republic of) | ||||||||
| ZAR | 18,175 | 7.75%, 02/28/2023 | 1,654 | |||||
| ZAR | 790 | 8.00%, 01/31/2030 | 70 | |||||
| 1,724 | ||||||||
| Spain - 0.6% | ||||||||
| Spain (Kingdom of) | ||||||||
| EUR | 50 | 2.75%, 10/31/2024 ■ | 66 | |||||
| EUR | 1,215 | 4.50%, 01/31/2018 ╦ | 1,702 | |||||
| EUR | 560 | 5.50%, 04/30/2021 | 883 | |||||
| 2,651 | ||||||||
| Sweden - 0.1% | ||||||||
| Sweden (Kingdom of) | ||||||||
| SEK | 2,615 | 3.75%, 08/12/2017 | 390 | |||||
| Switzerland - 0.1% | ||||||||
| Switzerland (Government of) | ||||||||
| CHF | 50 | 2.00%, 05/25/2022 § | 59 | |||||
| CHF | 145 | 3.00%, 01/08/2018 § | 165 | |||||
| 224 | ||||||||
| Turkey - 2.9% | ||||||||
| Turkey (Republic of) | ||||||||
| 2,020 | 5.13%, 03/25/2022 ╦ | 2,147 | ||||||
| 2,184 | 6.00%, 01/14/2041 ╦ | 2,420 | ||||||
| 2,472 | 6.75%, 04/03/2018 - 05/30/2040 ╦ | 2,872 | ||||||
| 1,100 | 7.00%, 09/26/2016 | 1,203 | ||||||
| 640 | 7.25%, 03/15/2015 | 654 | ||||||
| 670 | 7.38%, 02/05/2025 | 828 | ||||||
| 1,785 | 7.50%, 07/14/2017 ╦ | 2,008 | ||||||
| 12,132 | ||||||||
| Ukraine - 0.7% | ||||||||
| Ukraine (Government of) | ||||||||
| 3,280 | 6.25%, 06/17/2016 § | 2,919 | ||||||
| United Kingdom - 0.3% | ||||||||
| United Kingdom (Government of) | ||||||||
| GBP | 220 | 1.00%, 09/07/2017 § | 352 | |||||
| GBP | 250 | 1.25%, 07/22/2018 § | 399 | |||||
| GBP | 100 | 1.75%, 07/22/2019 § | 162 | |||||
| GBP | 255 | 2.00%, 01/22/2016 § | 415 | |||||
| 1,328 | ||||||||
| Uruguay - 0.5% | ||||||||
| Uruguay (Republic of) | ||||||||
| 460 | 4.13%, 11/20/2045 | 401 | ||||||
| UYU | 36,534 | 4.25%, 04/05/2027 ◄╦ | 1,620 | |||||
| 2,021 | ||||||||
| Venezuela - 1.0% | ||||||||
| Venezuela (Republic of) | ||||||||
| 2,225 | 7.00%, 03/31/2038 § | 1,279 | ||||||
| 1,195 | 8.25%, 10/13/2024 § | 722 | ||||||
| 2,355 | 11.95%, 08/05/2031 ╦§ | 1,713 | ||||||
| 805 | 12.75%, 08/23/2022 ╦§ | 640 | ||||||
| 4,354 | ||||||||
| Total Foreign Government Obligations | ||||||||
| (Cost $129,454) | $ | 128,480 | ||||||
| Municipal Bonds - 0.8% | ||||||||
| Higher Education (Univ., Dorms, etc.) - 0.2% | ||||||||
| University of California | ||||||||
| $ | 835 | 4.60%, 05/15/2031 ╦ | $ | 905 | ||||
| Miscellaneous - 0.6% | ||||||||
| Puerto Rico Government Employees Retirement System | ||||||||
| 1,250 | 6.15%, 07/01/2038 ‡ | 619 | ||||||
| 1,300 | 6.20%, 07/01/2039 ‡ | 643 | ||||||
| 2,365 | 6.30%, 07/01/2043 ‡ | 1,159 | ||||||
| 485 | 6.55%, 07/01/2058 ‡ | 237 | ||||||
| 2,658 | ||||||||
| Total Municipal Bonds | ||||||||
| (Cost $3,798) | $ | 3,563 | ||||||
| Senior Floating Rate Interests ♦ - 23.4% | ||||||||
| Accommodation and Food Services - 0.1% | ||||||||
| Four Seasons Holdings, Inc. | ||||||||
| $ | 307 | 3.50%, 06/29/2020 | $ | 304 | ||||
| 275 | 6.25%, 12/28/2020 | 276 | ||||||
| 580 | ||||||||
| Administrative, Support, Waste Management and Remediation Services - 0.6% | ||||||||
| Acosta Holdco, Inc. | ||||||||
| 600 | 5.00%, 09/26/2021 | 600 | ||||||
| ADS Waste Holdings, Inc. | ||||||||
| 427 | 3.75%, 10/09/2019 | 418 | ||||||
| Audio Visual Services Group, Inc. | ||||||||
| 254 | 4.50%, 01/25/2021 | 252 | ||||||
| Brickman Group Holdings, Inc. | ||||||||
| 253 | 4.00%, 12/18/2020 | 248 | ||||||
| Filtration Group, Inc. | ||||||||
| 248 | 4.50%, 11/20/2020 | 247 | ||||||
| 105 | 8.25%, 11/22/2021 | 105 | ||||||
| PRA Holdings, Inc. | ||||||||
| 794 | 4.50%, 09/23/2020 | 783 | ||||||
| 2,653 | ||||||||
| Agriculture, Construction, Mining and Machinery - 0.2% | ||||||||
| Signode Industrial Group US, Inc. | ||||||||
| 885 | 4.00%, 05/01/2021 | 868 | ||||||
The accompanying notes are an integral part of these financial statements.
| 10 |
| The Hartford Strategic Income Fund |
| Schedule of Investments – (continued) |
| October 31, 2014 |
| (000’s Omitted) |
| Shares or Principal Amount ╬ | Market Value ╪ | |||||||
| Senior Floating Rate Interests ♦ - 23.4% - (continued) | ||||||||
| Air Transportation - 0.4% | ||||||||
| Delta Air Lines, Inc. | ||||||||
| $ | 1,579 | 3.25%, 04/20/2017 - 10/18/2018 | $ | 1,557 | ||||
| 1,557 | ||||||||
| Apparel Manufacturing - 0.5% | ||||||||
| Bauer Performance Sports Ltd. | ||||||||
| 242 | 4.00%, 04/15/2021 | 240 | ||||||
| J. Crew Group, Inc. | ||||||||
| 975 | 4.00%, 03/05/2021 | 941 | ||||||
| Kate Spade & Co. | ||||||||
| 918 | 4.00%, 04/09/2021 | 891 | ||||||
| 2,072 | ||||||||
| Arts, Entertainment and Recreation - 2.8% | ||||||||
| 24 Hour Fitness Worldwide, Inc. | ||||||||
| 648 | 4.75%, 05/28/2021 | 647 | ||||||
| Aristocrat Leisure Ltd. | ||||||||
| 725 | 4.75%, 10/20/2021 | 719 | ||||||
| Caesars Entertainment Operating Co., Inc. | ||||||||
| 361 | 5.99%, 03/01/2017 | 321 | ||||||
| 965 | 6.99%, 03/01/2017 | 864 | ||||||
| Caesars Growth Property Holdings LLC | ||||||||
| 459 | 6.25%, 05/08/2021 | 433 | ||||||
| Formula One Holdings | ||||||||
| 1,416 | 4.75%, 07/30/2021 | 1,404 | ||||||
| 535 | 7.75%, 07/29/2022 | 533 | ||||||
| Hoyts Group Holdings LLC | ||||||||
| 751 | 4.00%, 05/29/2020 | 739 | ||||||
| ION Media Networks, Inc. | ||||||||
| 471 | 5.00%, 12/18/2020 | 470 | ||||||
| MGM Resorts International | ||||||||
| 904 | 3.50%, 12/20/2019 | 893 | ||||||
| Numericable, Term Loan B | ||||||||
| 295 | 4.50%, 05/21/2020 | 295 | ||||||
| Numericable, Term Loan B2 | ||||||||
| 255 | 4.50%, 05/21/2020 | 256 | ||||||
| Salem Communications Corp. | ||||||||
| 156 | 4.50%, 03/13/2020 | 154 | ||||||
| Scientific Games International, Inc. | ||||||||
| 360 | 6.00%, 10/01/2021 | 352 | ||||||
| Templar Energy | ||||||||
| 605 | 8.50%, 11/25/2020 | 545 | ||||||
| Town Sports International Holdings, Inc. | ||||||||
| 412 | 4.50%, 11/15/2020 | 335 | ||||||
| Tribune Co. | ||||||||
| 1,088 | 4.00%, 12/27/2020 | 1,078 | ||||||
| Univision Communications, Inc., Term Loan C3 | ||||||||
| 746 | 4.00%, 03/01/2020 | 738 | ||||||
| Univision Communications, Inc., Term Loan C4 | ||||||||
| 630 | 4.00%, 03/01/2020 | 623 | ||||||
| XO Communications LLC | ||||||||
| 383 | 4.25%, 03/20/2021 | 379 | ||||||
| 11,778 | ||||||||
| Chemical Manufacturing - 1.2% | ||||||||
| Arysta LifeScience Corp. | ||||||||
| 785 | 4.50%, 05/29/2020 | 781 | ||||||
| Cytec Industries, Inc. | ||||||||
| 34 | 4.50%, 10/03/2019 | 33 | ||||||
| Ferro Corp. | ||||||||
| 340 | 4.00%, 07/30/2021 | 335 | ||||||
| Ineos US Finance LLC | ||||||||
| 700 | 3.75%, 05/04/2018 | 691 | ||||||
| MacDermid, Inc. | ||||||||
| 632 | 4.00%, 06/07/2020 | 618 | ||||||
| Minerals Technologies, Inc. | ||||||||
| 558 | 4.00%, 05/07/2021 | 555 | ||||||
| Monarch, Inc. | ||||||||
| 65 | 4.50%, 10/03/2019 | 65 | ||||||
| Pinnacle Operating Corp. | ||||||||
| 892 | 4.75%, 11/15/2018 | 885 | ||||||
| PQ Corp. | ||||||||
| 614 | 4.00%, 08/07/2017 | 607 | ||||||
| Solenis International L.P. | ||||||||
| 280 | 4.25%, 07/31/2021 | 276 | ||||||
| 4,846 | ||||||||
| Computer and Electronic Product Manufacturing - 1.0% | ||||||||
| Avago Technologies Ltd. | ||||||||
| 908 | 3.75%, 05/06/2021 | 904 | ||||||
| CDW LLC | ||||||||
| 842 | 3.25%, 04/29/2020 ☼ | 822 | ||||||
| Ceridian LLC | ||||||||
| 321 | 4.12%, 05/09/2017 | 320 | ||||||
| 334 | 4.50%, 05/09/2017 | 332 | ||||||
| Freescale Semiconductor, Inc. | ||||||||
| 980 | 4.25%, 02/28/2020 | 966 | ||||||
| NXP Semiconductors Netherlands B.V. | ||||||||
| 506 | 3.25%, 01/11/2020 | 500 | ||||||
| Vantiv LLC | ||||||||
| 284 | 3.75%, 06/13/2021 | 282 | ||||||
| 4,126 | ||||||||
| Construction - 0.2% | ||||||||
| Brand Energy & Infrastructure Services, Inc. | ||||||||
| 819 | 4.75%, 11/26/2020 | 813 | ||||||
| Finance and Insurance - 1.7% | ||||||||
| Asurion LLC | ||||||||
| 817 | 5.00%, 05/24/2019 | 818 | ||||||
| 980 | 8.50%, 03/03/2021 | 995 | ||||||
| Chrysler Group LLC | ||||||||
| 1,213 | 3.50%, 05/24/2017 | 1,206 | ||||||
| Cooper Gay Swett & Crawford Ltd. | ||||||||
| 336 | 5.00%, 04/16/2020 | 302 | ||||||
| Evertec LLC | ||||||||
| 400 | 3.50%, 04/17/2020 | 393 | ||||||
| ION Trading Technologies Ltd. | ||||||||
| 525 | 7.25%, 06/10/2022 | 516 | ||||||
| National Financial Partners Corp. | ||||||||
| 663 | 4.50%, 07/01/2020 | 657 | ||||||
| Santander Asset Management S.A. | ||||||||
| 993 | 4.25%, 12/17/2020 | 988 | ||||||
| Sedgwick CMS Holdings, Inc. | ||||||||
| 375 | 6.75%, 02/28/2022 | 364 | ||||||
| USI Insurance Services LLC | ||||||||
| 413 | 4.25%, 12/27/2019 | 408 | ||||||
| Walter Investment Management Corp. | ||||||||
| 723 | 4.75%, 12/18/2020 | 679 | ||||||
| 7,326 | ||||||||
| Food Manufacturing - 0.7% | ||||||||
| Burger King Co. | ||||||||
| 510 | 4.50%, 10/27/2021 | 510 | ||||||
| H.J. Heinz Co. | ||||||||
| 602 | 3.50%, 06/05/2020 | 598 | ||||||
The accompanying notes are an integral part of these financial statements.
| 11 |
| The Hartford Strategic Income Fund |
| Schedule of Investments – (continued) |
| October 31, 2014 |
| (000’s Omitted) |
| Shares or Principal Amount ╬ | Market Value ╪ | |||||||
| Senior Floating Rate Interests ♦ - 23.4% - (continued) | ||||||||
| Food Manufacturing - 0.7% - (continued) | ||||||||
| Hearthside Food Solutions | ||||||||
| $ | 374 | 4.50%, 06/02/2021 | $ | 372 | ||||
| Hostess Brands, Inc. | ||||||||
| 184 | 6.75%, 04/09/2020 | 187 | ||||||
| U.S. Foodservice, Inc. | ||||||||
| 1,252 | 4.50%, 03/31/2019 | 1,247 | ||||||
| 2,914 | ||||||||
| Food Services - 0.0% | ||||||||
| Arby's Restaurant Group, Inc. | ||||||||
| 194 | 4.75%, 11/15/2020 | 193 | ||||||
| Furniture and Related Product Manufacturing - 0.2% | ||||||||
| Wilsonart International Holdings LLC | ||||||||
| 796 | 4.00%, 10/31/2019 | 783 | ||||||
| Health Care and Social Assistance - 1.8% | ||||||||
| Alkermes, Inc. | ||||||||
| 436 | 3.50%, 09/25/2019 | 429 | ||||||
| American Renal Holdings, Inc. | ||||||||
| 520 | 8.50%, 03/20/2020 | 510 | ||||||
| Catalent Pharma Solutions, Inc. | ||||||||
| 38 | 6.50%, 12/31/2017 | 38 | ||||||
| Community Health Systems, Inc. | ||||||||
| 759 | 4.25%, 01/27/2021 | 760 | ||||||
| DaVita HealthCare Partners, Inc. | ||||||||
| 569 | 3.50%, 06/24/2021 | 563 | ||||||
| HCA, Inc. | ||||||||
| 592 | 2.98%, 05/01/2018 | 589 | ||||||
| Healogics, Inc. | ||||||||
| 180 | 5.25%, 07/01/2021 | 179 | ||||||
| Ikaria Acquisition, Inc. | ||||||||
| 113 | 5.00%, 02/12/2021 | 113 | ||||||
| One Call Medical, Inc. | ||||||||
| 263 | 5.00%, 11/27/2020 | 262 | ||||||
| Ortho-Clinical Diagnostics, Inc. | ||||||||
| 858 | 4.75%, 06/30/2021 | 848 | ||||||
| Salix Pharmaceuticals Ltd. | ||||||||
| 655 | 4.25%, 01/02/2020 | 654 | ||||||
| STHI Holding Corp. | ||||||||
| 245 | 4.50%, 08/06/2021 | 243 | ||||||
| Surgery Center Holdings, Inc. | ||||||||
| 265 | 5.25%, 07/24/2020 ☼ | 265 | ||||||
| Truven Health Analytics, Inc. | ||||||||
| 478 | 4.50%, 06/06/2019 | 468 | ||||||
| US Renal Care, Inc. | ||||||||
| 1,170 | 4.25%, 07/03/2019 | 1,161 | ||||||
| 616 | 10.25%, 01/03/2020 | 617 | ||||||
| 7,699 | ||||||||
| Health Care Providers and Services - 0.1% | ||||||||
| Medpace Holdings, Inc. | ||||||||
| 557 | 4.75%, 04/01/2021 | 554 | ||||||
| Information - 3.5% | ||||||||
| Cabovisao-Televisao Por Cabo S.A. | ||||||||
| 1,418 | 5.50%, 07/02/2019 | 1,425 | ||||||
| Charter Communications Operating LLC | ||||||||
| 631 | 3.00%, 01/03/2021 | 620 | ||||||
| 350 | 4.25%, 09/10/2021 | 352 | ||||||
| Crown Castle International Corp. | ||||||||
| 439 | 3.00%, 01/31/2021 | 435 | ||||||
| Eagle Parent, Inc. | ||||||||
| 709 | 4.00%, 05/16/2018 | 702 | ||||||
| First Data Corp. | ||||||||
| 1,500 | 3.65%, 03/23/2018 - 09/24/2018 | 1,485 | ||||||
| Gray Television, Inc. | ||||||||
| 170 | 3.75%, 06/13/2021 | 167 | ||||||
| Intelsat Jackson Holdings S.A. | ||||||||
| 796 | 3.75%, 06/30/2019 | 789 | ||||||
| Kronos, Inc. | ||||||||
| 1,437 | 4.50%, 10/30/2019 | 1,429 | ||||||
| 669 | 9.75%, 04/30/2020 | 686 | ||||||
| La Quinta Intermediate Holdings | ||||||||
| 517 | 4.00%, 04/14/2021 | 513 | ||||||
| Lawson Software, Inc. | ||||||||
| 874 | 3.75%, 06/03/2020 | 862 | ||||||
| Level 3 Communications, Inc. | ||||||||
| 660 | 4.00%, 08/01/2019 | 656 | ||||||
| Level 3 Financing, Inc. | ||||||||
| 625 | 4.50%, 01/31/2022 ☼ | 627 | ||||||
| MISYS plc | ||||||||
| 882 | 5.00%, 12/12/2018 | 882 | ||||||
| Syniverse Holdings, Inc. | ||||||||
| 883 | 4.00%, 04/23/2019 | 868 | ||||||
| Verint Systems, Inc. | ||||||||
| 251 | 3.50%, 09/06/2019 | 248 | ||||||
| Virgin Media Finance plc | ||||||||
| 775 | 3.50%, 06/07/2020 | 764 | ||||||
| West Corp. | ||||||||
| 608 | 3.25%, 06/30/2018 | 598 | ||||||
| Zayo Group LLC | ||||||||
| 832 | 4.00%, 07/02/2019 | 823 | ||||||
| 14,931 | ||||||||
| Media - 0.3% | ||||||||
| Entravision Communications Corp. | ||||||||
| 1,007 | 3.50%, 05/31/2020 | 976 | ||||||
| Media General, Inc. | ||||||||
| 227 | 4.25%, 07/31/2020 | 225 | ||||||
| 1,201 | ||||||||
| Mining - 0.8% | ||||||||
| American Rock Salt Holdings LLC | ||||||||
| 998 | 4.75%, 05/20/2021 | 987 | ||||||
| Arch Coal, Inc. | ||||||||
| 1,197 | 6.25%, 05/16/2018 | 1,055 | ||||||
| BWAY Holding Co. | ||||||||
| 359 | 5.50%, 08/14/2020 | 360 | ||||||
| Fortescue Metals Group Ltd. | ||||||||
| 1,027 | 3.75%, 06/30/2019 | 1,001 | ||||||
| 3,403 | ||||||||
| Miscellaneous Manufacturing - 0.6% | ||||||||
| DigitalGlobe, Inc. | ||||||||
| 335 | 3.75%, 01/31/2020 | 333 | ||||||
| Reynolds Group Holdings, Inc. | ||||||||
| 1,024 | 4.00%, 11/30/2018 | 1,017 | ||||||
| Sequa Corp. | ||||||||
| 257 | 5.25%, 06/19/2017 | 244 | ||||||
| TransDigm Group, Inc. | ||||||||
| 823 | 3.75%, 02/28/2020 | 809 | ||||||
| 2,403 | ||||||||
The accompanying notes are an integral part of these financial statements.
| 12 |
| The Hartford Strategic Income Fund |
| Schedule of Investments – (continued) |
| October 31, 2014 |
| (000’s Omitted) |
| Shares or Principal Amount ╬ | Market Value ╪ | |||||||
| Senior Floating Rate Interests ♦ - 23.4% - (continued) | ||||||||
| Motor Vehicle and Parts Manufacturing - 0.3% | ||||||||
| Navistar, Inc. | ||||||||
| $ | 206 | 5.75%, 08/17/2017 | $ | 207 | ||||
| SRAM LLC | ||||||||
| 813 | 4.01%, 04/10/2020 | 797 | ||||||
| 1,004 | ||||||||
| Nonmetallic Mineral Product Manufacturing - 0.0% | ||||||||
| Ardagh Holdings USA, Inc. | ||||||||
| 134 | 4.00%, 12/17/2019 | 133 | ||||||
| Other Services - 0.4% | ||||||||
| Alliance Laundry Systems LLC | ||||||||
| 458 | 4.25%, 12/10/2018 | 452 | ||||||
| Husky Injection Molding Systems Ltd. | ||||||||
| 110 | 4.25%, 06/30/2021 | 108 | ||||||
| Husky International Ltd. | ||||||||
| 190 | 7.25%, 06/30/2022 | 186 | ||||||
| Rexnord LLC | ||||||||
| 827 | 4.00%, 08/21/2020 | 814 | ||||||
| 1,560 | ||||||||
| Petroleum and Coal Products Manufacturing - 1.1% | ||||||||
| American Energy-Marcellus LLC | ||||||||
| 270 | 5.25%, 08/04/2020 | 263 | ||||||
| Callon Petroleum Co. | ||||||||
| 270 | 8.50%, 10/08/2021 ☼ | 266 | ||||||
| Chief Exploration & Development | ||||||||
| 415 | 7.50%, 05/16/2021 | 398 | ||||||
| Crosby Worldwide Ltd. | ||||||||
| 908 | 4.00%, 11/23/2020 | 869 | ||||||
| Drillships Ocean Ventures, Inc. | ||||||||
| 274 | 5.50%, 07/25/2021 | 263 | ||||||
| Everest Acquisition LLC | ||||||||
| 527 | 3.50%, 05/24/2018 | 513 | ||||||
| Paragon Offshore Finance Co. | ||||||||
| 295 | 3.75%, 07/16/2021 | 276 | ||||||
| Seadrill Ltd. | ||||||||
| 1,004 | 4.00%, 02/21/2021 | 947 | ||||||
| Shelf Drilling International Holdings Ltd. | ||||||||
| 305 | 10.00%, 10/08/2018 | 300 | ||||||
| Western Refining, Inc. | ||||||||
| 531 | 4.25%, 11/12/2020 | 526 | ||||||
| 4,621 | ||||||||
| Pipeline Transportation - 0.1% | ||||||||
| NGPL Pipeco LLC | ||||||||
| 538 | 6.75%, 09/15/2017 | 537 | ||||||
| Plastics and Rubber Products Manufacturing - 0.4% | ||||||||
| Consolidated Container Co. | ||||||||
| 622 | 5.00%, 07/03/2019 | 614 | ||||||
| Goodyear (The) Tire & Rubber Co. | ||||||||
| 900 | 4.75%, 04/30/2019 | 902 | ||||||
| 1,516 | ||||||||
| Primary Metal Manufacturing - 0.3% | ||||||||
| Novelis, Inc. | ||||||||
| 682 | 3.75%, 03/10/2017 | 674 | ||||||
| WireCo WorldGroup, Inc. | ||||||||
| 553 | 6.00%, 02/15/2017 | 554 | ||||||
| 1,228 | ||||||||
| Professional, Scientific and Technical Services - 0.7% | ||||||||
| Advantage Sales & Marketing, Inc. | ||||||||
| 460 | 4.25%, 07/23/2021 | 456 | ||||||
| AlixPartners LLP | ||||||||
| 582 | 4.00%, 07/10/2020 | 572 | ||||||
| 236 | 9.00%, 07/10/2021 | 239 | ||||||
| Getty Images, Inc. | ||||||||
| 531 | 4.75%, 10/18/2019 | 500 | ||||||
| MoneyGram International, Inc. | ||||||||
| 478 | 4.25%, 03/27/2020 | 462 | ||||||
| Paradigm Ltd. | ||||||||
| 634 | 4.75%, 07/30/2019 | 618 | ||||||
| 2,847 | ||||||||
| Real Estate, Rental and Leasing - 0.6% | ||||||||
| DTZ U.S. Borrower LLC | ||||||||
| 295 | 5.00%, 10/23/2021 - 10/28/2021 ☼ | 295 | ||||||
| 265 | 8.25%, 10/28/2022 ☼ | 266 | ||||||
| Fly Leasing Ltd. | ||||||||
| 794 | 4.50%, 08/09/2019 | 793 | ||||||
| Neff Corp. | ||||||||
| 465 | 7.25%, 06/09/2021 | 466 | ||||||
| Realogy Corp., Extended Credit Linked Deposit | ||||||||
| 22 | 4.41%, 10/10/2016 | 22 | ||||||
| Realogy Group LLC | ||||||||
| 731 | 3.75%, 03/05/2020 | 724 | ||||||
| 2,566 | ||||||||
| Retail Trade - 1.5% | ||||||||
| Albertson's LLC | ||||||||
| 1,045 | 4.50%, 08/25/2021 ☼ | 1,045 | ||||||
| Amscan Holdings, Inc. | ||||||||
| 539 | 4.00%, 07/27/2019 | 528 | ||||||
| BJ's Wholesale Club, Inc. | ||||||||
| 539 | 4.50%, 09/26/2019 | 533 | ||||||
| FleetPride, Inc. | ||||||||
| 786 | 5.25%, 11/19/2019 | 769 | ||||||
| Mauser-Werke GmbH | ||||||||
| 230 | 4.50%, 07/31/2021 | 226 | ||||||
| Metaldyne Performance Group, Inc. | ||||||||
| 495 | 4.50%, 10/20/2021 ☼ | 495 | ||||||
| Michaels Stores, Inc. | ||||||||
| 517 | 3.75%, 01/28/2020 | 508 | ||||||
| 205 | 4.00%, 01/28/2020 | 202 | ||||||
| Neiman Marcus (The) Group, Inc. | ||||||||
| 1,063 | 4.25%, 10/25/2020 | 1,049 | ||||||
| Rite Aid Corp. | ||||||||
| 745 | 4.88%, 06/21/2021 | 743 | ||||||
| 325 | 5.75%, 08/21/2020 | 327 | ||||||
| 6,425 | ||||||||
| Truck Transportation - 0.2% | ||||||||
| Nexeo Solutions LLC | ||||||||
| 745 | 5.00%, 09/09/2017 | 735 | ||||||
| Swift Transportation Co., Inc. | ||||||||
| 214 | 3.75%, 06/09/2021 | 212 | ||||||
| 947 | ||||||||
| Utilities - 0.9% | ||||||||
| Calpine Corp. | ||||||||
| 599 | 4.00%, 10/09/2019 | 593 | ||||||
| Energy Future Holdings | ||||||||
| 235 | 4.25%, 06/19/2016 | 234 | ||||||
| NRG Energy, Inc. | ||||||||
| 605 | 2.75%, 07/01/2018 | 594 | ||||||
The accompanying notes are an integral part of these financial statements.
| 13 |
| The Hartford Strategic Income Fund |
| Schedule of Investments – (continued) |
| October 31, 2014 |
| (000’s Omitted) |
| Shares or Principal Amount ╬ | Market Value ╪ | |||||||
| Senior Floating Rate Interests ♦ - 23.4% - (continued) | ||||||||
| Utilities - 0.9% - (continued) | ||||||||
| PowerTeam Services LLC, Delayed Draw Term Loan | ||||||||
| $ | 16 | 4.25%, 05/06/2020 | $ | 15 | ||||
| PowerTeam Services LLC, Term Loan 1 | ||||||||
| 294 | 4.25%, 05/06/2020 | 287 | ||||||
| Sandy Creek Energy Associates L.P. | ||||||||
| 756 | 5.00%, 11/09/2020 | 752 | ||||||
| Star West Generation LLC | ||||||||
| 521 | 4.25%, 03/13/2020 | 516 | ||||||
| Texas Competitive Electric Holdings Co. LLC | ||||||||
| 564 | 3.75%, 05/05/2016 | 567 | ||||||
| 500 | 4.65%, 10/10/2017 Ψ | 364 | ||||||
| 3,922 | ||||||||
| Wholesale Trade - 0.2% | ||||||||
| Gates Global LLC | ||||||||
| 960 | 4.25%, 07/05/2021 | 948 | ||||||
| Total Senior Floating Rate Interests | ||||||||
| (Cost $99,918) | $ | 98,954 | ||||||
| U.S. Government Agencies - 10.4% | ||||||||
| FHLMC - 2.4% | ||||||||
| $ | 5,874 | 0.53%, 10/25/2020 ► | $ | 86 | ||||
| 6,400 | 4.00%, 11/15/2044 ☼,Ð | 6,789 | ||||||
| 1,500 | 4.50%, 11/15/2044 ☼,Ð | 1,625 | ||||||
| 1,400 | 5.00%, 11/15/2044 ☼,Ð | 1,547 | ||||||
| 100 | 5.50%, 12/15/2044 ☼,Ð | 111 | ||||||
| 10,158 | ||||||||
| FNMA - 7.3% | ||||||||
| 2,030 | 2.50%, 11/15/2029 ☼,Ð | 2,060 | ||||||
| 8,269 | 3.00%, 11/15/2029 - 11/15/2044 ☼,Ð | 8,307 | ||||||
| 12,200 | 3.50%, 11/15/2029 - 12/15/2044 ☼,Ð | 12,639 | ||||||
| 1,000 | 4.00%, 11/15/2029 ☼,Ð | 1,062 | ||||||
| 6,100 | 4.50%, 11/15/2044 ☼,Ð | 6,611 | ||||||
| 300 | 5.00%, 11/15/2044 ☼,Ð | 332 | ||||||
| 500 | 5.50%, 06/25/2042 ► | 87 | ||||||
| 31,098 | ||||||||
| GNMA - 0.7% | ||||||||
| 500 | 3.00%, 11/15/2044 ☼,Ð | 509 | ||||||
| 1,700 | 4.00%, 11/15/2044 ☼,Ð | 1,818 | ||||||
| 400 | 5.00%, 12/15/2044 ☼,Ð | 441 | ||||||
| 100 | 6.00%, 11/15/2044 ☼,Ð | 113 | ||||||
| 2,881 | ||||||||
| Total U.S. Government Agencies | ||||||||
| (Cost $44,051) | $ | 44,137 | ||||||
| U.S. Government Securities - 1.0% | ||||||||
| U.S. Treasury Securities - 1.0% | ||||||||
| U.S. Treasury Bonds - 0.4% | ||||||||
| $ | 1,335 | 3.75%, 11/15/2043 □Є | $ | 1,515 | ||||
| 50 | 5.38%, 02/15/2031 □Є | 67 | ||||||
| 1,582 | ||||||||
| U.S. Treasury Notes - 0.6% | ||||||||
| 550 | 0.38%, 04/15/2015 Є | 551 | ||||||
| 900 | 0.88%, 01/31/2018 Є | 894 | ||||||
| 80 | 1.88%, 09/30/2017 □Є | 82 | ||||||
| 910 | 2.13%, 08/15/2021 □ | 916 | ||||||
| 2,443 | ||||||||
| 4,025 | ||||||||
| Total U.S. Government Securities | ||||||||
| (Cost $3,875) | $ | 4,025 | ||||||
| Common Stocks - 0.1% | ||||||||
| Energy - 0.1% | ||||||||
| 83,644 | KCA Deutag ⌂●† | $ | 408 | |||||
| Total Common Stocks | ||||||||
| (Cost $1,134) | $ | 408 | ||||||
| Preferred Stocks - 0.1% | ||||||||
| Diversified Financials - 0.1% | ||||||||
| — | Citigroup Capital XIII | $ | 1 | |||||
| 20 | GMAC Capital Trust I β | 535 | ||||||
| 536 | ||||||||
| Total Preferred Stocks | ||||||||
| (Cost $515) | $ | 536 | ||||||
| Total Long-Term Investments Excluding Purchased Options | ||||||||
| (Cost $430,409) | $ | 430,797 | ||||||
| Short-Term Investments - 8.0% | ||||||||
| Repurchase Agreements - 8.0% | ||||||||
| Bank of America Merrill Lynch TriParty Repurchase Agreement (maturing on 11/03/2014 in the amount of $97, collateralized by U.S. Treasury Note 1.50%, 2019, value of $99) | ||||||||
| $ | 97 | 0.08%, 10/31/2014 | $ | 97 | ||||
| Bank of America Merrill Lynch TriParty Repurchase Agreement (maturing on 11/03/2014 in the amount of $1,648, collateralized by GNMA 1.63% - 7.00%, 2031 - 2054, value of $1,681) | ||||||||
| 1,648 | 0.09%, 10/31/2014 | 1,648 | ||||||
| Bank of Montreal TriParty Repurchase Agreement (maturing on 11/03/2014 in the amount of $443, collateralized by U.S. Treasury Bond 2.88% - 5.25%, 2029 - 2043, U.S. Treasury Note 0.38% - 4.50%, 2015 - 2022, value of $452) | ||||||||
| 443 | 0.08%, 10/31/2014 | 443 | ||||||
| Bank of Montreal TriParty Repurchase Agreement (maturing on 11/03/2014 in the amount of $1,501, collateralized by FHLMC 2.00% - 5.50%, 2022 - 2034, FNMA 2.00% - 4.50%, 2024 - 2039, GNMA 3.00%, 2043, U.S. Treasury Note 4.63%, 2017, value of $1,531) | ||||||||
| 1,501 | 0.10%, 10/31/2014 | 1,501 | ||||||
The accompanying notes are an integral part of these financial statements.
| 14 |
| The Hartford Strategic Income Fund |
| Schedule of Investments – (continued) |
| October 31, 2014 |
| (000’s Omitted) |
| Shares or Principal Amount ╬ | Market Value ╪ | ||||||||||
| Short-Term Investments - 8.0% - (continued) | |||||||||||
| Repurchase Agreements - 8.0% - (continued) | |||||||||||
| Barclays Capital TriParty Repurchase Agreement (maturing on 11/03/2014 in the amount of $5,655, collateralized by U.S. Treasury Bond 4.50% - 6.25%, 2023 - 2036, U.S. Treasury Note 1.63% - 2.13%, 2015 - 2019, value of $5,768) | |||||||||||
| $ | 5,655 | 0.08%, 10/31/2014 | $ | 5,655 | |||||||
| Citigroup Global Markets, Inc. TriParty Repurchase Agreement (maturing on 11/03/2014 in the amount of $6,500, collateralized by U.S. Treasury Bill 0.02%, 2015, U.S. Treasury Bond 3.88% - 11.25%, 2015 - 2040, U.S. Treasury Note 2.00% - 3.38%, 2019 - 2021, value of $6,630) | |||||||||||
| 6,500 | 0.09%, 10/31/2014 | 6,500 | |||||||||
| Deutsche Bank Securities TriParty Repurchase Agreement (maturing on 11/03/2014 in the amount of $375, collateralized by U.S. Treasury Note 0.88%, 2017, value of $383) | |||||||||||
| 375 | 0.13%, 10/31/2014 | 375 | |||||||||
| RBS Securities, Inc. TriParty Repurchase Agreement (maturing on 11/03/2014 in the amount of $552, collateralized by U.S. Treasury Bond 3.63% - 5.00%, 2037 - 2043, U.S. Treasury Note 2.13%, 2020, value of $563) | |||||||||||
| 552 | 0.07%, 10/31/2014 | 552 | |||||||||
| Societe Generale TriParty Repurchase Agreement (maturing on 11/03/2014 in the amount of $5,818, collateralized by U.S. Treasury Bill 0.02%, 2015, U.S. Treasury Bond 3.75% - 11.25%, 2015 - 2043, U.S. Treasury Note 1.38% - 4.25%, 2015 - 2022, value of $5,935) | |||||||||||
| 5,818 | 0.08%, 10/31/2014 | 5,818 | |||||||||
| TD Securities TriParty Repurchase Agreement (maturing on 11/03/2014 in the amount of $11,275, collateralized by FHLMC 3.00% - 4.00%, 2026 - 2044, FNMA 2.50% - 5.00%, 2025 - 2044, U.S. Treasury Bond 3.50% - 6.50%, 2026 - 2041, U.S. Treasury Note 1.75% - 2.88%, 2018 - 2019, value of $11,501) | |||||||||||
| 11,275 | 0.10%, 10/31/2014 | 11,275 | |||||||||
| 33,864 | |||||||||||
| Total Short-Term Investments | |||||||||||
| (Cost $33,864) | $ | 33,864 | |||||||||
| Total Investments Excluding Purchased Options | |||||||||||
| (Cost $464,273) | 109.8 | % | $ | 464,661 | |||||||
| Total Purchased Options | |||||||||||
| (Cost $375) | — | % | 201 | ||||||||
| Total Investments | |||||||||||
| (Cost $464,648) ▲ | 109.8 | % | $ | 464,862 | |||||||
| Other Assets and Liabilities | (9.8 | )% | (41,734 | ) | |||||||
| Total Net Assets | 100.0 | % | $ | 423,128 | |||||||
The accompanying notes are an integral part of these financial statements.
| 15 |
| The Hartford Strategic Income Fund |
| Schedule of Investments – (continued) |
| October 31, 2014 |
| (000’s Omitted) |
Note: Percentage of investments as shown is the ratio of the total market value to total net assets.
The Fund may refer to any one or more of the industry classifications used by one or more widely recognized market indices, ratings group indices and/or as defined by Fund management. Industry classifications may not be identical across all security types.
Equity industry classifications used in this report are the Global Industry Classification Standard, which was developed by and is the exclusive property and service mark of MSCI, Inc. and Standard & Poor’s.
For Fund compliance purposes, the Fund may not use the same classification system shown in this report as these classifications are used for reporting ease.
| ▲ | At October 31, 2014, the cost of securities for federal income tax purposes was $464,784 and the aggregate gross unrealized appreciation and depreciation based on that cost were: |
| Unrealized Appreciation | $ | 10,137 | ||
| Unrealized Depreciation | (10,059 | ) | ||
| Net Unrealized Appreciation | $ | 78 |
| ╬ | All principal amounts are in U.S. dollars unless otherwise indicated. |
| † | These securities are valued in good faith at fair value as determined under policies and procedures established by and under the supervision of the Board of Directors. At October 31, 2014, the aggregate fair value of these securities was $408, which represents 0.1% of total net assets. |
| ● | Non-income producing. For long-term debt securities, items identified are in default as to payment of interest and/or principal. |
| Ψ | The issuer is in bankruptcy. However, the investment held by the Fund is current with respect to interest payments. |
| Δ | Variable rate securities; the rate reported is the coupon rate in effect at October 31, 2014. |
| ○ | The interest rate disclosed for these securities represents the effective yield on the date of the acquisition. |
| ► | Securities disclosed are interest-only strips. |
| ◄ | The principal amount for this security is adjusted for inflation and the interest payments equal a fixed percentage of the inflation-adjusted principal amount. |
| ♦ | Senior floating rate interests generally pay interest rates which are periodically adjusted by reference to a base short-term, floating lending rate plus a premium. The base lending rates are primarily the LIBOR, and secondarily the prime rate offered by one or more major United States banks (the "Prime Rate") and the certificate of deposit rate or other base lending rates used by commercial lenders. Senior floating rate interests often require prepayments from excess cash flows or permit the borrower to repay at its election. The rate at which the borrower repays cannot be predicted with accuracy. As a result, the actual remaining maturity may be substantially less than the stated maturities shown. Unless otherwise noted, the interest rate disclosed for these securities represents the average coupon as of October 31, 2014. |
| ■ | Securities issued within terms of a private placement memorandum, exempt from registration under Rule 144A under the Securities Act of 1933, as amended, and may be sold only to qualified institutional buyers. Unless otherwise indicated, these holdings are determined to be liquid. At October 31, 2014, the aggregate value of these securities was $42,695, which represents 10.1% of total net assets. |
| § | These securities were sold to the Fund under Regulation S, rules governing offers and sales made outside the United States without registration under the Securities Act of 1933, as amended. The Fund may only be able to resell these securities in the United States if an exemption from registration under the federal and state securities laws is available, or the Fund may only be able to sell these securities outside of the United States (such as on a foreign exchange) to a non-U.S. person. Unless otherwise indicated, these holdings are determined to be liquid. At October 31, 2014, the aggregate value of these securities was $77,445, which represents 18.3% of total net assets. |
| ⌂ | The following securities are considered illiquid. Illiquid securities are often purchased in private placement transactions, are often not registered under the Securities Act of 1933, as amended, and may have contractual restrictions on resale. A security may also be considered illiquid if the security lacks a readily available market or if its valuation has not changed for a certain period of time. |
| Period Acquired | Shares/ Par | Security | Cost Basis | |||||||
| 03/2011 | 83,644 | KCA Deutag | $ | 1,134 | ||||||
At October 31, 2014, the aggregate value of these securities was $408, which represents 0.1% of total net assets.
| β | Convertible security. |
| ♠ | Perpetual maturity security. Maturity date shown is the next call date or final legal maturity date, whichever comes first. |
The accompanying notes are an integral part of these financial statements.
| 16 |
| The Hartford Strategic Income Fund |
| Schedule of Investments – (continued) |
| October 31, 2014 |
| (000’s Omitted) |
| Ð | Represents or includes a TBA transaction. |
| ☼ | This security, or a portion of this security, was purchased on a when-issued or delayed-delivery basis. The cost of these securities was $48,669 at October 31, 2014. |
| ‡ | This security, or a portion of this security, has been segregated to cover funding requirements on investment transactions settling in the future. |
| ╦ | This security, or a portion of this security, has been pledged as collateral in connection with OTC swap contracts. |
| Є | This security, or a portion of this security, has been pledged as collateral in connection with centrally cleared swap contracts. |
| Θ | This security, or a portion of this security, has been pledged as collateral in connection with OTC option and/or swaption contracts. |
| □ | This security, or a portion of this security, has been pledged as collateral in connection with futures contracts. |
Cash and securities pledged and received as collateral in connection with derivatives at October 31, 2014:
| Pledged ‡ | Received * | |||||||
| OTC option and/or OTC swap contracts | $ | 260 | $ | 3,494 | ||||
| Centrally cleared swaps contracts | 1,077 | – | ||||||
| Total | $ | 1,337 | $ | 3,494 | ||||
| ‡ | As previously noted, certain securities, or a portion of these securities, are pledged as collateral in connection with certain derivative instruments. These securities are held by the Fund but are not represented in the table above. |
| * | Securities valued at $1,879, held on behalf of the Fund at the custodian bank, were designated by broker(s) as collateral in connection with OTC option and/or OTC swap contracts. Since the broker retains legal title to the securities, the securities are not considered an asset of the Fund. |
OTC Option Contracts Outstanding at October 31, 2014
| Description | Counter
- party | Risk Exposure Category | Exercise
Price/ FX Rate/ Rate | Expiration Date | Number
of Contracts * | Market Value ╪ | Premiums Paid by Fund | Unrealized Appreciation (Depreciation) | ||||||||||||||||
| Purchased Option contracts: | ||||||||||||||||||||||||
| Calls | ||||||||||||||||||||||||
| BRL Call/USD Put | JPM | FX | 2.43 BRL per USD | 09/28/15 | BRL | 2,600,000 | $ | 11 | $ | 19 | $ | (8 | ) | |||||||||||
| INR Call/USD Put | BOA | FX | 62.55 INR per USD | 01/16/15 | INR | 160,000,000 | 43 | 41 | 2 | |||||||||||||||
| MXN Call/USD Put | JPM | FX | 13.61 MXN per USD | 01/15/15 | MXN | 33,854,670 | 43 | 50 | (7 | ) | ||||||||||||||
| RUB Call/USD Put | GSC | FX | 36.97 RUB per USD | 09/02/15 | RUB | 39,000,000 | 2 | 14 | (12 | ) | ||||||||||||||
| TRY Call/USD Put | JPM | FX | 2.31 TRY per USD | 01/19/15 | TRY | 5,700,000 | 78 | 54 | 24 | |||||||||||||||
| Total Calls | 241,154,670 | $ | 177 | $ | 178 | $ | (1 | ) | ||||||||||||||||
| Total purchased option contracts | 241,154,670 | $ | 177 | $ | 178 | $ | (1 | ) | ||||||||||||||||
* The number of contracts does not omit 000's.
The accompanying notes are an integral part of these financial statements.
| 17 |
| The Hartford Strategic Income Fund |
| Schedule of Investments – (continued) |
| October 31, 2014 |
| (000’s Omitted) |
| OTC Swaption Contracts Outstanding at October 31, 2014 | |||||||||||||||||||||||||
| Description | Counter
- party | Risk Exposure Category | Exercise
Price/ FX Rate/ Rate |
Expiration Date | Number
of Contracts * | Market Value ╪ | Premiums Received/ Paid by Fund Δ | Unrealized Appreciation (Depreciation) | |||||||||||||||||
| Purchased swaption contracts: | |||||||||||||||||||||||||
| Puts | |||||||||||||||||||||||||
| Interest Rate Swaption USD | JPM | IR | 3.50 | % | 04/29/15 | USD | 11,210,000 | $ | 24 | $ | 197 | $ | (173 | ) | |||||||||||
| Written swaption contracts: | |||||||||||||||||||||||||
| Calls | |||||||||||||||||||||||||
| Credit Default Swaption ITRAXX.XOV.22 | JPM | CR | 3.75 | % | 11/19/14 | EUR | 23,205,000 | $ | 387 | $ | 392 | $ | 5 | ||||||||||||
| Puts | |||||||||||||||||||||||||
| Credit Default Swaption ITRAXX.XOV.22 | JPM | CR | 3.75 | % | 11/19/14 | EUR | 23,205,000 | $ | 180 | $ | 281 | $ | 101 | ||||||||||||
| Total written swaption contracts | 46,410,000 | $ | 567 | $ | 673 | $ | 106 | ||||||||||||||||||
* The number of contracts does not omit 000's.
Δ For purchased swaptions, premiums are paid by the Fund, for written swaptions, premiums are received.
Futures Contracts Outstanding at October 31, 2014
| Number of | Expiration | Notional | Market | Unrealized Appreciation/(Depreciation) | Variation Margin | |||||||||||||||||||||||
| Description | Contracts* | Date | Amount | Value ╪ | Asset | Liability | Asset | Liability | ||||||||||||||||||||
| Long position contracts: | ||||||||||||||||||||||||||||
| Australian 10-Year Bond Future | 5 | 12/15/2014 | $ | 538 | $ | 540 | $ | 2 | $ | – | $ | 2 | $ | – | ||||||||||||||
| Australian 3-Year Bond Future | 10 | 12/15/2014 | 966 | 966 | – | – | 1 | – | ||||||||||||||||||||
| Canadian Government 10-Year Bond Future | 4 | 12/18/2014 | 484 | 486 | 2 | – | – | – | ||||||||||||||||||||
| Euro-BOBL Future | 2 | 12/08/2014 | 321 | 321 | – | – | – | – | ||||||||||||||||||||
| Euro-BTP Future | 9 | 12/08/2014 | 1,468 | 1,470 | 2 | – | 11 | – | ||||||||||||||||||||
| Euro-BUND Future | 4 | 12/08/2014 | 756 | 757 | 1 | – | – | – | ||||||||||||||||||||
| Euro-OAT Future | 8 | 12/08/2014 | 1,437 | 1,452 | 15 | – | 5 | – | ||||||||||||||||||||
| Euro-Schatz Future | 21 | 12/08/2014 | 2,921 | 2,920 | – | (1 | ) | – | – | |||||||||||||||||||
| Japan 10-Year Bond Future | 4 | 12/11/2014 | 5,187 | 5,218 | 31 | – | – | – | ||||||||||||||||||||
| Japan 10-Year Mini Bond Future | 6 | 12/10/2014 | 778 | 783 | 5 | – | 1 | – | ||||||||||||||||||||
| U.S. Treasury 10-Year Note Future | 281 | 12/19/2014 | 35,634 | 35,507 | – | (127 | ) | 61 | (209 | ) | ||||||||||||||||||
| U.S. Treasury 5-Year Note Future | 247 | 12/31/2014 | 29,528 | 29,499 | – | (29 | ) | – | (41 | ) | ||||||||||||||||||
| Total | $ | 58 | $ | (157 | ) | $ | 81 | $ | (250 | ) | ||||||||||||||||||
| Short position contracts: | ||||||||||||||||||||||||||||
| 90-Day Eurodollar Future | 3 | 12/15/2014 | $ | 748 | $ | 748 | $ | – | $ | – | $ | – | $ | – | ||||||||||||||
| 90-Day Eurodollar Future | 127 | 12/14/2015 | 31,502 | 31,485 | 17 | – | 20 | (6 | ) | |||||||||||||||||||
| Long Gilt Future | 1 | 12/29/2014 | 184 | 184 | – | – | – | – | ||||||||||||||||||||
| U.S. Treasury 2-Year Note Future | 1 | 12/31/2014 | 219 | 219 | – | – | – | – | ||||||||||||||||||||
| U.S. Treasury 5-Year Note Future | 317 | 12/31/2014 | 37,850 | 37,859 | – | (9 | ) | 4 | (13 | ) | ||||||||||||||||||
| U.S. Treasury CME Ultra Long Term Bond Future | 74 | 12/19/2014 | 11,606 | 11,604 | 2 | – | 42 | – | ||||||||||||||||||||
| U.S. Treasury Long Bond Future | 15 | 12/19/2014 | 2,131 | 2,116 | 15 | – | 7 | – | ||||||||||||||||||||
| Total | $ | 34 | $ | (9 | ) | $ | 73 | $ | (19 | ) | ||||||||||||||||||
| Total futures contracts | $ | 92 | $ | (166 | ) | $ | 154 | $ | (269 | ) | ||||||||||||||||||
* The number of contracts does not omit 000's.
The accompanying notes are an integral part of these financial statements.
| 18 |
| The Hartford Strategic Income Fund |
| Schedule of Investments – (continued) |
| October 31, 2014 |
| (000’s Omitted) |
OTC Credit Default Swap Contracts Outstanding at October 31, 2014
| Counter- | Notional | (Pay)/ Receive
Fixed Rate/ Implied |
Expiration | Upfront Premiums |
Upfront Premiums |
Market | Unrealized
Appreciation/ (Depreciation) |
||||||||||||||||||||||||
| Reference Entity | party | Amount (a) | Credit Spread (b) | Date | Paid | Received | Value ╪ | Asset | Liability | ||||||||||||||||||||||
| Credit default swaps on indices: | |||||||||||||||||||||||||||||||
| Buy protection: | |||||||||||||||||||||||||||||||
| ABX.HE.AA.06-1 | BCLY | USD | 399 | (0.32 | )% | 07/25/45 | $ | 191 | $ | – | $ | 86 | $ | – | $ | (105 | ) | ||||||||||||||
| ABX.HE.AA.06-1 | JPM | USD | 1,286 | (0.32 | )% | 07/25/45 | 338 | – | 274 | – | (64 | ) | |||||||||||||||||||
| ABX.HE.AAA.06-1 | BCLY | USD | 51 | (0.18 | )% | 07/25/45 | 6 | – | 1 | – | (5 | ) | |||||||||||||||||||
| ABX.HE.AAA.06-1 | GSC | USD | 231 | (0.18 | )% | 07/25/45 | 20 | – | 5 | – | (15 | ) | |||||||||||||||||||
| ABX.HE.AAA.06-1 | JPM | USD | 93 | (0.18 | )% | 07/25/45 | 3 | – | 3 | – | – | ||||||||||||||||||||
| ABX.HE.AAA.06-1 | JPM | USD | 237 | (0.18 | )% | 07/25/45 | 5 | – | 6 | 1 | – | ||||||||||||||||||||
| ABX.HE.AAA.06-1 | MSC | USD | 85 | (0.18 | )% | 07/25/45 | 9 | – | 2 | – | (7 | ) | |||||||||||||||||||
| ABX.HE.AAA.06-1 | MSC | USD | 55 | (0.18 | )% | 07/25/45 | 1 | – | 1 | – | – | ||||||||||||||||||||
| ABX.HE.AAA.06-2 | BOA | USD | 1,450 | (0.11 | )% | 05/25/46 | 304 | – | 290 | – | (14 | ) | |||||||||||||||||||
| ABX.HE.AAA.06-2 | DEUT | USD | 530 | (0.11 | )% | 05/25/46 | 124 | – | 106 | – | (18 | ) | |||||||||||||||||||
| ABX.HE.AAA.06-2 | MSC | USD | 698 | (0.11 | )% | 05/25/46 | 136 | – | 140 | 4 | – | ||||||||||||||||||||
| ABX.HE.AAA.07-1 | CSI | USD | 1,333 | (0.09 | )% | 08/25/37 | 389 | – | 346 | – | (43 | ) | |||||||||||||||||||
| ABX.HE.AAA.07-1 | GSC | USD | 467 | (0.09 | )% | 08/25/37 | 118 | – | 121 | 3 | – | ||||||||||||||||||||
| ABX.HE.AAA.07-1 | MSC | USD | 1,430 | (0.09 | )% | 08/25/37 | 352 | – | 371 | 19 | – | ||||||||||||||||||||
| ABX.HE.PENAAA.06-2 | BOA | USD | 8 | (0.11 | )% | 05/25/46 | 2 | – | 1 | – | (1 | ) | |||||||||||||||||||
| ABX.HE.PENAAA.06-2 | CSI | USD | 1,278 | (0.11 | )% | 05/25/46 | 385 | – | 179 | – | (206 | ) | |||||||||||||||||||
| ABX.HE.PENAAA.06-2 | JPM | USD | 455 | (0.11 | )% | 05/25/46 | 88 | – | 64 | – | (24 | ) | |||||||||||||||||||
| ABX.HE.PENAAA.06-2 | JPM | USD | 358 | (0.11 | )% | 05/25/46 | 49 | – | 50 | 1 | – | ||||||||||||||||||||
| ABX.HE.PENAAA.07-1 | BCLY | USD | 973 | (0.09 | )% | 08/25/37 | 421 | – | 224 | – | (197 | ) | |||||||||||||||||||
| CMBX.NA.A.7 | JPM | USD | 755 | (2.00 | )% | 01/17/47 | – | (16 | ) | (2 | ) | 14 | – | ||||||||||||||||||
| CMBX.NA.AA.1 | JPM | USD | 885 | (0.25 | )% | 10/12/52 | 175 | – | 129 | – | (46 | ) | |||||||||||||||||||
| CMBX.NA.AA.2 | BOA | USD | 1,591 | (0.15 | )% | 03/15/49 | 604 | – | 516 | – | (88 | ) | |||||||||||||||||||
| CMBX.NA.AA.2 | CSI | USD | 1,041 | (0.15 | )% | 03/15/49 | 324 | – | 337 | 13 | – | ||||||||||||||||||||
| CMBX.NA.AA.2 | JPM | USD | 1,405 | (0.15 | )% | 03/15/49 | 528 | – | 455 | – | (73 | ) | |||||||||||||||||||
| CMBX.NA.AA.2 | MSC | USD | 119 | (0.15 | )% | 03/15/49 | 48 | – | 39 | – | (9 | ) | |||||||||||||||||||
| CMBX.NA.AA.7 | CSI | USD | 2,055 | (1.50 | )% | 01/17/47 | 10 | – | 6 | – | (4 | ) | |||||||||||||||||||
| CMBX.NA.AA.7 | CSI | USD | 820 | (1.50 | )% | 01/17/47 | – | (8 | ) | 2 | 10 | – | |||||||||||||||||||
| CMBX.NA.AA.7 | MSC | USD | 870 | (1.50 | )% | 01/17/47 | – | (9 | ) | 2 | 11 | – | |||||||||||||||||||
| CMBX.NA.AJ.1 | JPM | USD | 735 | (0.84 | )% | 10/12/52 | 52 | – | 18 | – | (34 | ) | |||||||||||||||||||
| CMBX.NA.AJ.1 | MSC | USD | 390 | (0.84 | )% | 10/12/52 | 28 | – | 10 | – | (18 | ) | |||||||||||||||||||
| CMBX.NA.AJ.2 | DEUT | USD | 1,062 | (1.09 | )% | 03/15/49 | 97 | – | 91 | – | (6 | ) | |||||||||||||||||||
| CMBX.NA.AJ.4 | CSI | USD | 264 | (0.96 | )% | 02/17/51 | 52 | – | 51 | – | (1 | ) | |||||||||||||||||||
| CMBX.NA.AJ.4 | CSI | USD | 1,947 | (0.96 | )% | 02/17/51 | 363 | – | 379 | 16 | – | ||||||||||||||||||||
| CMBX.NA.AJ.4 | DEUT | USD | 891 | (0.96 | )% | 02/17/51 | 174 | – | 173 | – | (1 | ) | |||||||||||||||||||
| CMBX.NA.AJ.4 | GSC | USD | 1,449 | (0.96 | )% | 02/17/51 | 253 | – | 283 | 30 | – | ||||||||||||||||||||
| CMBX.NA.AJ.4 | MSC | USD | 369 | (0.96 | )% | 02/17/51 | 65 | – | 72 | 7 | – | ||||||||||||||||||||
| CMBX.NA.AJ.4 | MSC | USD | 1,688 | (0.96 | )% | 02/17/51 | 525 | – | 329 | – | (196 | ) | |||||||||||||||||||
| CMBX.NA.AM.2 | CSI | USD | 1,545 | (0.50 | )% | 03/15/49 | 94 | – | 19 | – | (75 | ) | |||||||||||||||||||
| CMBX.NA.AM.2 | MSC | USD | 2,945 | (0.50 | )% | 03/15/49 | 146 | – | 37 | – | (109 | ) | |||||||||||||||||||
| CMBX.NA.AM.4 | MSC | USD | 675 | (0.50 | )% | 02/17/51 | 96 | – | 27 | – | (69 | ) | |||||||||||||||||||
| CMBX.NA.AS.6 | CSI | USD | 1,700 | (1.00 | )% | 05/11/63 | 23 | – | 15 | – | (8 | ) | |||||||||||||||||||
| CMBX.NA.AS.7 | CSI | USD | 1,080 | (1.00 | )% | 01/17/47 | 26 | – | 17 | – | (9 | ) | |||||||||||||||||||
| CMBX.NA.AS.7 | GSC | USD | 725 | (1.00 | )% | 01/17/47 | 17 | – | 11 | – | (6 | ) | |||||||||||||||||||
| Total | $ | 6,641 | $ | (33 | ) | $ | 5,286 | $ | 129 | $ | (1,451 | ) | |||||||||||||||||||
The accompanying notes are an integral part of these financial statements.
| 19 |
| The Hartford Strategic Income Fund |
| Schedule of Investments – (continued) |
| October 31, 2014 |
| (000’s Omitted) |
OTC Credit Default Swap Contracts Outstanding at October 31, 2014 - (continued)
| Counter- | Notional | (Pay)/ Receive
Fixed Rate/ Implied |
Expiration | Upfront Premiums |
Upfront Premiums |
Market | Unrealized Appreciation/ (Depreciation) |
|||||||||||||||||||||||||
| Reference Entity | party | Amount (a) | Credit Spread (b) | Date | Paid | Received | Value ╪ | Asset | Liability | |||||||||||||||||||||||
| Credit default swaps on indices: - (continued) | ||||||||||||||||||||||||||||||||
| Sell protection: | ||||||||||||||||||||||||||||||||
| CDX.EM.22 | GSC | USD | 5,160 | 1.00 | % | 12/20/19 | $ | – | $ | (379 | ) | $ | (333 | ) | $ | 46 | $ | – | ||||||||||||||
| CDX.EM.22 | MSC | USD | 1,270 | 1.00 | % | 12/20/19 | – | (93 | ) | (82 | ) | 11 | – | |||||||||||||||||||
| CMBX.NA.A.2 | BOA | USD | 429 | 0.25 | % | 03/15/49 | – | (250 | ) | (278 | ) | – | (28 | ) | ||||||||||||||||||
| CMBX.NA.AAA.6 | BOA | USD | 825 | 0.50 | % | 05/11/63 | – | (22 | ) | (16 | ) | 6 | – | |||||||||||||||||||
| CMBX.NA.AAA.6 | CSI | USD | 5,100 | 0.50 | % | 05/11/63 | – | (116 | ) | (100 | ) | 16 | – | |||||||||||||||||||
| CMBX.NA.AAA.6 | DEUT | USD | 41,065 | 0.50 | % | 05/11/63 | – | (1,961 | ) | (802 | ) | 1,159 | – | |||||||||||||||||||
| CMBX.NA.AAA.6 | GSC | USD | 14,515 | 0.50 | % | 05/11/63 | – | (287 | ) | (283 | ) | 4 | – | |||||||||||||||||||
| CMBX.NA.AAA.6 | JPM | USD | 4,995 | 0.50 | % | 05/11/63 | – | (164 | ) | (97 | ) | 67 | – | |||||||||||||||||||
| CMBX.NA.BB.6 | BCLY | USD | 415 | 5.00 | % | 05/11/63 | 2 | – | (1 | ) | – | (3 | ) | |||||||||||||||||||
| CMBX.NA.BB.6 | BOA | USD | 1,340 | 5.00 | % | 05/11/63 | – | (13 | ) | (2 | ) | 11 | – | |||||||||||||||||||
| CMBX.NA.BB.6 | CSI | USD | 215 | 5.00 | % | 05/11/63 | – | – | – | – | – | |||||||||||||||||||||
| CMBX.NA.BB.6 | CSI | USD | 963 | 5.00 | % | 05/11/63 | 3 | – | (1 | ) | – | (4 | ) | |||||||||||||||||||
| CMBX.NA.BB.6 | CSI | USD | 1,240 | 5.00 | % | 05/11/63 | – | (7 | ) | (3 | ) | 4 | – | |||||||||||||||||||
| CMBX.NA.BB.6 | MSC | USD | 3,355 | 5.00 | % | 05/11/63 | – | (215 | ) | (5 | ) | 210 | – | |||||||||||||||||||
| CMBX.NA.BB.7 | BCLY | USD | 190 | 5.00 | % | 01/17/47 | – | (6 | ) | (5 | ) | 1 | – | |||||||||||||||||||
| CMBX.NA.BB.7 | BOA | USD | 730 | 5.00 | % | 01/17/47 | – | (20 | ) | (18 | ) | 2 | – | |||||||||||||||||||
| CMBX.NA.BB.7 | CSI | USD | 1,970 | 5.00 | % | 01/17/47 | – | (84 | ) | (47 | ) | 37 | – | |||||||||||||||||||
| CMBX.NA.BB.7 | CSI | USD | 270 | 5.00 | % | 01/17/47 | 2 | – | (7 | ) | – | (9 | ) | |||||||||||||||||||
| CMBX.NA.BB.7 | DEUT | USD | 480 | 5.00 | % | 01/17/47 | – | (14 | ) | (12 | ) | 2 | – | |||||||||||||||||||
| CMBX.NA.BB.7 | GSC | USD | 1,135 | 5.00 | % | 01/17/47 | – | (69 | ) | (28 | ) | 41 | – | |||||||||||||||||||
| CMBX.NA.BBB-.7 | CSI | USD | 925 | 3.00 | % | 01/17/47 | – | (56 | ) | (18 | ) | 38 | – | |||||||||||||||||||
| PrimeX.ARM.2 | MSC | USD | 148 | 4.58 | % | 06/25/36 | – | (10 | ) | 5 | 15 | – | ||||||||||||||||||||
| PrimeX.ARM.2 | MSC | USD | 1,348 | 4.58 | % | 12/25/37 | 44 | – | 41 | – | (3 | ) | ||||||||||||||||||||
| PrimeX.FRM.1 | JPM | USD | 190 | 4.42 | % | 07/25/36 | 19 | – | 19 | – | – | |||||||||||||||||||||
| Total | $ | 70 | $ | (3,766 | ) | $ | (2,073 | ) | $ | 1,670 | $ | (47 | ) | |||||||||||||||||||
| Total traded indices | $ | 6,711 | $ | (3,799 | ) | $ | 3,213 | $ | 1,799 | $ | (1,498 | ) | ||||||||||||||||||||
| Credit default swaps on single-name issues: | ||||||||||||||||||||||||||||||||
| Sell protection: | ||||||||||||||||||||||||||||||||
| Bank of America Corp. | GSC | USD | 7,600 | 1.00% / 0.41 | % | 09/20/17 | $ | – | $ | (529 | ) | $ | 129 | $ | 658 | $ | – | |||||||||||||||
| Citigroup, Inc. | GSC | USD | 7,225 | 1.00% / 0.41 | % | 09/20/17 | – | (471 | ) | 122 | 593 | – | ||||||||||||||||||||
| Goldman Sachs Group, Inc. | UBS | USD | 3,625 | 1.00% / 0.49 | % | 09/20/17 | – | (267 | ) | 54 | 321 | – | ||||||||||||||||||||
| Morgan Stanley | BCLY | USD | 3,625 | 1.00% / 0.48 | % | 09/20/17 | – | (406 | ) | 55 | 461 | – | ||||||||||||||||||||
| Total | $ | – | $ | (1,673 | ) | $ | 360 | $ | 2,033 | $ | – | |||||||||||||||||||||
| $ | 6,711 | $ | (5,472 | ) | $ | 3,573 | $ | 3,832 | $ | (1,498 | ) | |||||||||||||||||||||
| (a) | The maximum potential amount the Fund could be required to pay as a seller of credit protection or receive as a buyer of credit protection if a credit event occurs as defined under the terms of that particular swap agreement. |
| (b) | Implied credit spreads, utilized in determining the market value of credit default swap agreements on corporate issues, U.S. municipal issues or sovereign government issues as of period end serve as an indicator of the current status of the payment/performance risk and represent the likelihood of risk of default for the credit derivative. The implied credit spread of a particular entity reflects the cost of buying/selling protection and may include upfront payments required to be made to enter into the agreement. Wider credit spreads represent a deterioration of the reference entity's credit soundness and a greater likelihood or risk of default or other credit event occurring as defined under the terms of the agreement. The percentage shown is the implied credit spread on October 31, 2014. For credit default swap agreements on indices, the quoted market prices and resulting values serve as the indicator of the current status of the payment/performance risk. |
The accompanying notes are an integral part of these financial statements.
| 20 |
| The Hartford Strategic Income Fund |
| Schedule of Investments – (continued) |
| October 31, 2014 |
| (000’s Omitted) |
Centrally Cleared Credit Default Swap Contracts Outstanding at October 31, 2014
| Clearing | Notional | (Pay)/
Receive Fixed | Expiration | Market | Unrealized Appreciation/ (Depreciation) | Variation Margin | ||||||||||||||||||||||||||||||
| Reference Entity | House (a) | Amount (b) | Rate | Date | Cost Basis | Value ╪ | Asset | Liability | Asset | Liability | ||||||||||||||||||||||||||
| Credit default swaps on indices: | ||||||||||||||||||||||||||||||||||||
| Buy protection: | ||||||||||||||||||||||||||||||||||||
| CDX.NA.IG.23 | CME | USD | 16,580 | (1.00 | )% | 12/20/19 | $ | (254 | ) | $ | (292 | ) | $ | – | $ | (38 | ) | $ | – | $ | (13 | ) | ||||||||||||||
| ITRAXX.EUR.22 | ICE | EUR | 13,070 | (1.00 | )% | 12/20/19 | (257 | ) | (287 | ) | – | (30 | ) | – | (23 | ) | ||||||||||||||||||||
| ITRAXX.XOV.22 | ICE | EUR | 10,512 | (5.00 | )% | 12/20/19 | (826 | ) | (847 | ) | – | (21 | ) | 6 | (60 | ) | ||||||||||||||||||||
| Total | $ | (1,337 | ) | $ | (1,426 | ) | $ | – | $ | (89 | ) | $ | 6 | $ | (96 | ) | ||||||||||||||||||||
| Sell protection: | ||||||||||||||||||||||||||||||||||||
| CDX.NA.HY.22 | CME | USD | 28,017 | 5.00 | % | 06/20/19 | $ | 1,953 | $ | 2,099 | $ | 146 | $ | – | $ | 94 | $ | – | ||||||||||||||||||
| CDX.NA.HY.23 | CME | USD | 13,835 | 5.00 | % | 12/20/19 | 908 | 967 | 59 | – | 55 | – | ||||||||||||||||||||||||
| Total | $ | 2,861 | $ | 3,066 | $ | 205 | $ | – | $ | 149 | $ | – | ||||||||||||||||||||||||
| Total traded indices | $ | 1,524 | $ | 1,640 | $ | 205 | $ | (89 | ) | $ | 155 | $ | (96 | ) | ||||||||||||||||||||||
| (a) | The FCM to the contracts is GSC. |
| (b) | The maximum potential amount the Fund could be required to pay as a seller of credit protection or receive as a buyer of credit protection if a credit event occurs as defined under the terms of that particular swap agreement. |
OTC Interest Rate Swap Contracts Outstanding at October 31, 2014
| Payments made | Payments received | Notional | Expiration | Upfront Premiums | Upfront Premiums | Market | Unrealized Appreciation/(Depreciation) | |||||||||||||||||||||||
| Counterparty | by Fund | by Fund | Amount | Date | Paid | Received | Value ╪ | Asset | Liability | |||||||||||||||||||||
| DEUT | KRW CD KSDA | 2.36% Fixed | KRW | 56,365 | 12/17/19 | $ | – | $ | – | $ | – | $ | – | $ | – | |||||||||||||||
| DEUT | KRW CD KSDA | 2.41% Fixed | KRW | 116,825 | 12/17/19 | – | – | 1 | 1 | – | ||||||||||||||||||||
| DEUT | KRW CD KSDA | 2.51% Fixed | KRW | 37,115 | 12/17/19 | – | – | – | – | – | ||||||||||||||||||||
| DEUT | KRW CD KSDA | 2.76% Fixed | KRW | 19,930 | 12/17/24 | 1 | – | 1 | – | – | ||||||||||||||||||||
| DEUT | KRW CD KSDA | 2.85% Fixed | KRW | 49,640 | 12/17/24 | – | – | 2 | 2 | – | ||||||||||||||||||||
| JPM | KRW CD KSDA | 2.21% Fixed | KRW | 42,275 | 12/17/19 | – | – | – | – | – | ||||||||||||||||||||
| JPM | KRW CD KSDA | 2.39% Fixed | KRW | 93,940 | 12/17/19 | – | – | 1 | 1 | – | ||||||||||||||||||||
| JPM | KRW CD KSDA | 2.51% Fixed | KRW | 36,700 | 12/17/19 | – | – | – | – | – | ||||||||||||||||||||
| JPM | KRW CD KSDA | 2.60% Fixed | KRW | 149,485 | 12/17/19 | – | – | 3 | 3 | – | ||||||||||||||||||||
| Total | $ | 1 | $ | – | $ | 8 | $ | 7 | $ | – | ||||||||||||||||||||
Centrally Cleared Interest Rate Swap Contracts Outstanding at October 31, 2014
| Clearing | Payments made | Payments received | Notional | Expiration | Upfront Premiums Paid | Market | Unrealized Appreciation/ (Depreciation) | Variation Margin | ||||||||||||||||||||||||||
| House (a) | by Fund | by Fund | Amount | Date | (Received) | Value ╪ | Asset | Liability | Asset | Liability | ||||||||||||||||||||||||
| LCH | 6M GBP LIBOR | 2.13% Fixed | GBP | 165 | 12/21/18 | $ | – | $ | – | $ | – | $ | – | $ | – | $ | – | |||||||||||||||||
| LCH | 6M GBP LIBOR | 2.45% Fixed | GBP | 2,300 | 12/21/18 | 15 | 19 | 4 | – | – | (3 | ) | ||||||||||||||||||||||
| Total | $ | 15 | $ | 19 | $ | 4 | $ | – | $ | – | $ | (3 | ) | |||||||||||||||||||||
| (a) | The FCM to the contracts is GSC. |
The accompanying notes are an integral part of these financial statements.
| 21 |
| The Hartford Strategic Income Fund |
| Schedule of Investments – (continued) |
| October 31, 2014 |
| (000’s Omitted) |
OTC Total Return Swap Contracts Outstanding at October 31, 2014
| Notional | Payments received | Expiration | Upfront Premiums | Upfront Premiums | Market | Unrealized Appreciation/(Depreciation) | ||||||||||||||||||||||||||
| Reference Entity | Counterparty | Amount | (paid) by Fund | Date | Paid | Received | Value ╪ | Asset | Liability | |||||||||||||||||||||||
| JPM CORP EMBI † | JPM | USD | 12,625 | 3M LIBOR - 1.00% | 12/24/14 | $ | – | $ | – | $ | (40 | ) | $ | – | $ | (40 | ) | |||||||||||||||
| † | These securities were valued in good faith at fair value as determined under policies and procedures established by and under the supervision of the Company's Board of Directors. At October 31, 2014, the aggregate market value of these securities was $(40), which rounds to zero percent of total net assets. |
TBA Sale Commitments Outstanding at October 31, 2014
| Description | Principal Amount | Maturity Date | Market Value ╪ | Unrealized Appreciation/ Depreciation | ||||||||||
| FHLMC, 3.50% | $ | 1,700 | 11/15/2044 | $ | 1,755 | $ | (14 | ) | ||||||
| FNMA, 5.50% | 400 | 11/15/2044 | 447 | (1 | ) | |||||||||
| GNMA, 3.00% | 700 | 11/15/2044 | 713 | 3 | ||||||||||
| GNMA, 3.50% | 3,850 | 11/15/2044 | 4,024 | 10 | ||||||||||
| GNMA, 4.50% | 2,100 | 11/15/2044 | 2,292 | (12 | ) | |||||||||
| Total | $ | 9,231 | $ | (14 | ) | |||||||||
At October 31, 2014, the aggregate market value of these securities represents 2.2% of total net assets.
The accompanying notes are an integral part of these financial statements.
| 22 |
| The Hartford Strategic Income Fund |
| Schedule of Investments – (continued) |
| October 31, 2014 |
| (000’s Omitted) |
Foreign Currency Contracts Outstanding at October 31, 2014
| Unrealized Appreciation/(Depreciation) | ||||||||||||||||||||||
| Currency | Buy / Sell | Delivery Date | Counterparty | Contract Amount | Market Value ╪ | Asset | Liability | |||||||||||||||
| AUD | Buy | 11/28/2014 | BOA | $ | 40 | $ | 40 | $ | – | $ | – | |||||||||||
| AUD | Buy | 11/28/2014 | JPM | 31 | 31 | – | – | |||||||||||||||
| AUD | Buy | 11/28/2014 | JPM | 31 | 31 | – | – | |||||||||||||||
| AUD | Buy | 11/28/2014 | NAB | 908 | 913 | 5 | – | |||||||||||||||
| AUD | Sell | 11/28/2014 | CBA | 20 | 20 | – | – | |||||||||||||||
| AUD | Sell | 11/28/2014 | NAB | 199 | 200 | – | (1 | ) | ||||||||||||||
| CAD | Buy | 11/28/2014 | RBC | 1,105 | 1,098 | – | (7 | ) | ||||||||||||||
| CHF | Buy | 11/28/2014 | HSBC | 16 | 16 | – | – | |||||||||||||||
| CHF | Sell | 11/28/2014 | HSBC | 57 | 56 | 1 | – | |||||||||||||||
| DKK | Sell | 11/28/2014 | GSC | 21 | 21 | – | – | |||||||||||||||
| EUR | Buy | 11/28/2014 | CBA | 989 | 975 | – | (14 | ) | ||||||||||||||
| EUR | Buy | 11/28/2014 | CSFB | 6 | 6 | – | – | |||||||||||||||
| EUR | Buy | 11/28/2014 | HSBC | 15 | 15 | – | – | |||||||||||||||
| EUR | Buy | 12/17/2014 | HSBC | 1,239 | 1,239 | – | – | |||||||||||||||
| EUR | Buy | 11/28/2014 | JPM | 8,539 | 8,449 | – | (90 | ) | ||||||||||||||
| EUR | Buy | 12/17/2014 | TDS | 1,329 | 1,305 | – | (24 | ) | ||||||||||||||
| EUR | Sell | 12/17/2014 | BCLY | 728 | 722 | 6 | – | |||||||||||||||
| EUR | Sell | 11/28/2014 | BNP | 107 | 107 | – | – | |||||||||||||||
| EUR | Sell | 09/18/2015 | CBK | 847 | 823 | 24 | – | |||||||||||||||
| EUR | Sell | 12/17/2014 | CSFB | 511 | 505 | 6 | – | |||||||||||||||
| EUR | Sell | 12/17/2014 | DEUT | 3,616 | 3,501 | 115 | – | |||||||||||||||
| EUR | Sell | 11/04/2014 | HSBC | 1,238 | 1,238 | – | – | |||||||||||||||
| EUR | Sell | 11/28/2014 | HSBC | 649 | 642 | 7 | – | |||||||||||||||
| EUR | Sell | 11/28/2014 | JPM | 13,670 | 13,526 | 144 | – | |||||||||||||||
| GBP | Buy | 11/28/2014 | CBK | 1,414 | 1,412 | – | (2 | ) | ||||||||||||||
| GBP | Buy | 11/28/2014 | SSG | 40 | 40 | – | – | |||||||||||||||
| GBP | Sell | 11/28/2014 | BOA | 19 | 19 | – | – | |||||||||||||||
| GBP | Sell | 11/28/2014 | CBK | 3,743 | 3,738 | 5 | – | |||||||||||||||
| GBP | Sell | 11/28/2014 | HSBC | 32 | 32 | – | – | |||||||||||||||
| JPY | Buy | 11/28/2014 | BNP | 54 | 54 | – | – | |||||||||||||||
| JPY | Buy | 11/28/2014 | GSC | 76 | 73 | – | (3 | ) | ||||||||||||||
| JPY | Buy | 12/17/2014 | JPM | 327 | 310 | – | (17 | ) | ||||||||||||||
| JPY | Buy | 11/28/2014 | RBS | 9,903 | 9,521 | – | (382 | ) | ||||||||||||||
| JPY | Sell | 12/17/2014 | GSC | 318 | 310 | 8 | – | |||||||||||||||
| JPY | Sell | 11/28/2014 | JPM | 59 | 59 | – | – | |||||||||||||||
| KRW | Sell | 11/28/2014 | BCLY | 20 | 20 | – | – | |||||||||||||||
| KRW | Sell | 11/28/2014 | HSBC | 266 | 263 | 3 | – | |||||||||||||||
| MXN | Buy | 11/28/2014 | MSC | 90 | 91 | 1 | – | |||||||||||||||
| MXN | Sell | 11/28/2014 | MSC | 62 | 62 | – | – | |||||||||||||||
| MYR | Sell | 11/28/2014 | HSBC | 246 | 245 | 1 | – | |||||||||||||||
| NOK | Buy | 11/28/2014 | JPM | 21 | 21 | – | – | |||||||||||||||
| NOK | Sell | 11/28/2014 | CBK | 22 | 21 | 1 | – | |||||||||||||||
| NZD | Buy | 11/28/2014 | JPM | 39 | 39 | – | – | |||||||||||||||
| NZD | Sell | 11/28/2014 | BOA | 19 | 19 | – | – | |||||||||||||||
| NZD | Sell | 11/28/2014 | JPM | 63 | 63 | – | – | |||||||||||||||
| NZD | Sell | 11/28/2014 | MSC | 19 | 19 | – | – | |||||||||||||||
| NZD | Sell | 11/28/2014 | WEST | 287 | 284 | 3 | – | |||||||||||||||
| PLN | Sell | 11/28/2014 | HSBC | 41 | 41 | – | – | |||||||||||||||
| RSD | Buy | 09/18/2015 | CBK | 786 | 770 | – | (16 | ) | ||||||||||||||
| SEK | Buy | 11/28/2014 | CSFB | 42 | 41 | – | (1 | ) | ||||||||||||||
| SEK | Sell | 11/28/2014 | CSFB | 132 | 130 | 2 | – | |||||||||||||||
| SEK | Sell | 11/28/2014 | SSG | 42 | 41 | 1 | – | |||||||||||||||
| SEK | Sell | 11/28/2014 | UBS | 1 | 1 | – | – | |||||||||||||||
| SGD | Sell | 11/28/2014 | HSBC | 205 | 203 | 2 | – | |||||||||||||||
| ZAR | Buy | 11/28/2014 | CBK | 95 | 94 | – | (1 | ) | ||||||||||||||
| Total | $ | 335 | $ | (558 | ) | |||||||||||||||||
| ╪ | See Significant Accounting Policies of accompanying Notes to Financial Statements regarding valuation of securities. |
The accompanying notes are an integral part of these financial statements.
| 23 |
| The Hartford Strategic Income Fund |
| Schedule of Investments – (continued) |
| October 31, 2014 |
| (000’s Omitted) |
| GLOSSARY: (abbreviations used in preceding Schedule of Investments) | |
| Counterparty Abbreviations: | |
| BCLY | Barclays |
| BNP | BNP Paribas Securities Services |
| BOA | Banc of America Securities LLC |
| CBA | Commonwealth Bank of Australia |
| CBK | Citibank NA |
| CME | Chicago Mercantile Exchange |
| CSFB | Credit Suisse First Boston Corp. |
| CSI | Credit Suisse International |
| DEUT | Deutsche Bank Securities, Inc. |
| FCM | Futures Commission Merchant |
| GSC | Goldman Sachs & Co. |
| HSBC | HSBC Bank USA |
| ICE | Intercontinental Exchange |
| JPM | JP Morgan Chase & Co. |
| LCH | LCH Clearnet |
| MSC | Morgan Stanley |
| NAB | National Australia Bank Limited |
| RBC | RBC Dominion Securities, Inc. |
| RBS | RBS Greenwich Capital |
| SSG | State Street Global Markets LLC |
| TDS | TD Securities, Inc. |
| UBS | UBS AG |
| WEST | Westpac International |
| Currency Abbreviations: | |
| AUD | Australian Dollar |
| BRL | Brazilian Real |
| CAD | Canadian Dollar |
| CHF | Swiss Franc |
| DKK | Danish Krone |
| DOP | Dominican Peso |
| EUR | EURO |
| GBP | British Pound |
| IDR | Indonesian New Rupiah |
| INR | Indian Rupee |
| JPY | Japanese Yen |
| KRW | South Korean Won |
| MXN | Mexican New Peso |
| MYR | Malaysian Ringgit |
| NGN | Nigerian Naira |
| NOK | Norwegian Krone |
| NZD | New Zealand Dollar |
| PLN | Polish New Zloty |
| RSD | Serbian Dinar |
| RUB | Russian New Ruble |
| SEK | Swedish Krona |
| SGD | Singapore Dollar |
| TRY | Turkish New Lira |
| USD | U.S. Dollar |
| UYU | Uruguayan Peso |
| ZAR | South African Rand |
| Index Abbreviations: | |
| ABX.HE | Markit Asset Backed Security Home Equity |
| ABX.HE.PEN | Markit Asset Backed Security Home Equity Penultimate |
| CDX.EM | Credit Derivatives Emerging Markets |
| CDX.NA.HY | Credit Derivatives North American High Yield |
| CDX.NA.IG | Credit Derivatives North American Investment Grade |
| CMBX.NA | Markit Commercial Mortgage Backed North American |
| EMBI | Emerging Markets Bond Index |
| ITRAXX.EUR | Markit iTraxx - Europe |
| ITRAXX.XOV | Markit iTraxx Index - Europe Crossover |
| PrimeX.ARM | Markit PrimeX Adjustable Rate Mortgage Backed Security |
| PrimeX.FRM | Markit PrimeX Fixed Rate Mortgage Backed Security |
| Other Abbreviations: | |
| CD | Certificate of Deposit |
| CLO | Collateralized Loan Obligation |
| CR | Credit |
| FHLMC | Federal Home Loan Mortgage Corp. |
| FNMA | Federal National Mortgage Association |
| FX | Foreign Exchange |
| GNMA | Government National Mortgage Association |
| IR | Interest Rate |
| KSDA | Korea Securities Dealers Association |
| LIBOR | London Interbank Offered Rate |
| OTC | Over-the-Counter |
| TBA | To Be Announced |
The accompanying notes are an integral part of these financial statements.
| 24 |
| The Hartford Strategic Income Fund |
| Schedule of Investments – (continued) |
| October 31, 2014 |
| (000’s Omitted) |
Investment Valuation Hierarchy Level Summary
October 31, 2014
| Total | Level 1 ♦ | Level 2 ♦ | Level 3 | |||||||||||||
| Assets: | ||||||||||||||||
| Asset and Commercial Mortgage Backed Securities | $ | 59,652 | $ | – | $ | 42,528 | $ | 17,124 | ||||||||
| Common Stocks ‡ | 408 | – | – | 408 | ||||||||||||
| Corporate Bonds | 91,042 | – | 90,112 | 930 | ||||||||||||
| Foreign Government Obligations | 128,480 | – | 128,480 | – | ||||||||||||
| Municipal Bonds | 3,563 | – | 3,563 | – | ||||||||||||
| Preferred Stocks | 536 | 536 | – | – | ||||||||||||
| Senior Floating Rate Interests | 98,954 | – | 98,954 | – | ||||||||||||
| U.S. Government Agencies | 44,137 | – | 44,137 | – | ||||||||||||
| U.S. Government Securities | 4,025 | – | 4,025 | – | ||||||||||||
| Short-Term Investments | 33,864 | – | 33,864 | – | ||||||||||||
| Purchased Options | 201 | – | 201 | – | ||||||||||||
| Total | $ | 464,862 | $ | 536 | $ | 445,864 | $ | 18,462 | ||||||||
| Foreign Currency Contracts * | $ | 335 | $ | – | $ | 335 | $ | – | ||||||||
| Futures * | 92 | 92 | – | – | ||||||||||||
| Swaps - Credit Default * | 4,037 | – | 4,037 | – | ||||||||||||
| Swaps - Interest Rate * | 11 | – | 11 | – | ||||||||||||
| Total | $ | 4,475 | $ | 92 | $ | 4,383 | $ | – | ||||||||
| Liabilities: | ||||||||||||||||
| TBA Sale Commitments | $ | 9,231 | $ | – | $ | 9,231 | $ | – | ||||||||
| Written Options | 567 | – | 567 | – | ||||||||||||
| Total | $ | 9,798 | $ | – | $ | 9,798 | $ | – | ||||||||
| Foreign Currency Contracts * | $ | 558 | $ | – | $ | 558 | $ | – | ||||||||
| Futures * | 166 | 166 | – | – | ||||||||||||
| Swaps - Credit Default * | 1,587 | – | 1,587 | – | ||||||||||||
| Swaps - Interest Rate * | – | – | – | – | ||||||||||||
| Swaps - Total Return * | 40 | – | – | 40 | ||||||||||||
| Total | $ | 2,351 | $ | 166 | $ | 2,145 | $ | 40 | ||||||||
| ♦ | For the year ended October 31, 2014, investments valued at $557 were transferred from Level 1 to Level 2, and there were no transfers from Level 2 to Level 1. Investments are transferred between Level 1 and Level 2 for a variety of reasons including, but not limited to: |
| 1) | Foreign equities for which a fair value price is more representative of exit value than the local market close (transfer into Level 2). Foreign equities for which the local market close is more representative of exit value (transfer into Level 1). |
| 2) | U.S. Treasury securities that no longer represent the most recent issue (transfer into Level 2). |
| 3) | Equity investments with no observable trading but a bid or mean price is used (transfer into Level 2). Equity investments using observable quoted prices in an active market (transfer into Level 1). |
| ‡ | The Fund has all or primarily all of the equity securities categorized in a particular level. Refer to the Schedule of Investments for further industry breakout. |
| * | Derivative instruments (excluding purchased and written options, if applicable) are valued at the unrealized appreciation/depreciation on the investments. |
The accompanying notes are an integral part of these financial statements.
| 25 |
| The Hartford Strategic Income Fund |
| Schedule of Investments – (continued) |
| October 31, 2014 |
| (000’s Omitted) |
Following is a reconciliation of Level 3 assets for which significant unobservable inputs were used to determine fair value:
| Balance
as of October 31, 2013 | Realized Gain (Loss) | Change
in Unrealized Appreciation (Depreciation) | Net Amortization | Purchases | Sales | Transfers Into Level 3 * | Transfers Out of Level 3 * | Balance
as of October 31, 2014 | ||||||||||||||||||||||||||||
| Assets: | ||||||||||||||||||||||||||||||||||||
| Asset & Commercial Mortgage Backed Securities | $ | 23,507 | $ | 1,455 | $ | (353 | )† | $ | 1,284 | $ | 5,726 | $ | (14,155 | ) | $ | — | $ | (340 | ) | $ | 17,124 | |||||||||||||||
| Common Stocks | 580 | — | (172 | )‡ | — | — | — | — | — | 408 | ||||||||||||||||||||||||||
| Corporate Bonds | — | — | — | § | — | 930 | — | — | — | 930 | ||||||||||||||||||||||||||
| U.S. Government Agencies | 204 | — | — | — | — | — | — | (204 | ) | — | ||||||||||||||||||||||||||
| Total | $ | 24,291 | $ | 1,455 | $ | (525 | ) | $ | 1,284 | $ | 6,656 | $ | (14,155 | ) | $ | — | $ | (544 | ) | $ | 18,462 | |||||||||||||||
| Liabilities: | ||||||||||||||||||||||||||||||||||||
| Swaps** | $ | — | $ | — | $ | 40 | †† | $ | — | $ | — | $ | — | $ | — | $ | — | $ | 40 | |||||||||||||||||
| Total | $ | — | $ | — | $ | 40 | $ | — | $ | — | $ | — | $ | — | $ | — | $ | 40 | ||||||||||||||||||
| * | Investments are transferred into and out of Level 3 for a variety of reasons including, but not limited to: |
| 1) | Investments where trading has been halted (transfer into Level 3) or investments where trading has resumed (transfer out of Level 3). |
| 2) | Broker quoted investments (transfer into Level 3) or quoted prices in active markets (transfer out of Level 3). |
| 3) | Investments that have certain restrictions on trading (transfer into Level 3) or investments where trading restrictions have expired (transfer out of Level 3). |
| † | Change in unrealized appreciation (depreciation) in the current period relating to assets still held at October 31, 2014 was $87. |
| ‡ | Change in unrealized appreciation (depreciation) in the current period relating to assets still held at October 31, 2014 was $(172). |
| § | Change in unrealized appreciation (depreciation) in the current period relating to assets still held at October 31, 2014 was zero. |
| ** | Derivative instruments not reflected in the Schedule of Investments are valued at the unrealized appreciation/ depreciation on the investment. |
| †† | Change in unrealized appreciation (depreciation) in the current period relating to assets still held at October 31, 2014 was $(40). |
| Note: | For purposes of reporting transfers between different hierarchy levels, both transfers in and out of each level, as applicable, are shown as if they occurred at the beginning of the period. |
The accompanying notes are an integral part of these financial statements.
| 26 |
| The Hartford Strategic Income Fund |
| Statement of Assets and Liabilities |
| October 31, 2014 |
| (000’s Omitted) |
| Assets: | ||||
| Investments in securities, at market value (cost $464,648) | $ | 464,862 | ||
| Cash | 2,362 | * | ||
| Foreign currency on deposit with custodian (cost $1) | 1 | |||
| Unrealized appreciation on foreign currency contracts | 335 | |||
| Unrealized appreciation on OTC swap contracts | 3,839 | |||
| Receivables: | ||||
| Investment securities sold | 13,687 | |||
| Fund shares sold | 852 | |||
| Dividends and interest | 3,591 | |||
| Variation margin on financial derivative instruments | 309 | |||
| OTC swap premiums paid | 6,712 | |||
| Other assets | 71 | |||
| Total assets | 496,621 | |||
| Liabilities: | ||||
| Unrealized depreciation on foreign currency contracts | 558 | |||
| Unrealized depreciation on OTC swap contracts | 1,538 | |||
| TBA sale commitments, at market value (proceeds $9,217) | 9,231 | |||
| Payables: | ||||
| Investment securities purchased | 53,395 | |||
| Fund shares redeemed | 547 | |||
| Investment management fees | 45 | |||
| Dividends | — | |||
| Administrative fees | — | |||
| Distribution fees | 29 | |||
| Collateral received from broker | 1,616 | |||
| Variation margin on financial derivative instruments | 368 | |||
| Accrued expenses | 72 | |||
| OTC swap premiums received | 5,472 | |||
| Written option contracts (proceeds $673) | 567 | |||
| Other liabilities | 55 | |||
| Total liabilities | 73,493 | |||
| Net assets | $ | 423,128 | ||
| Summary of Net Assets: | ||||
| Capital stock and paid-in-capital | $ | 411,820 | ||
| Distributions in excess of net investment income | (435 | ) | ||
| Accumulated net realized gain | 9,347 | |||
| Unrealized appreciation of investments and the translation of assets and liabilities denominated in foreign currency | 2,396 | |||
| Net assets | $ | 423,128 |
* Cash of $1,337 was pledged as collateral for open financial derivative instruments at October 31, 2014.
The accompanying notes are an integral part of these financial statements.
| 27 |
| The Hartford Strategic Income Fund |
| Statement of Assets and Liabilities – (continued) |
| October 31, 2014 |
| (000’s Omitted) |
| Shares authorized | 900,000 | |||
| Par value | $ | 0.001 | ||
| Class A: Net asset value per share/Maximum offering price per share | $9.30/$9.74 | |||
| Shares outstanding | 15,499 | |||
| Net assets | $ | 144,172 | ||
| Class B: Net asset value per share | $ | 9.30 | ||
| Shares outstanding | 684 | |||
| Net assets | $ | 6,367 | ||
| Class C: Net asset value per share | $ | 9.32 | ||
| Shares outstanding | 11,794 | |||
| Net assets | $ | 109,960 | ||
| Class I: Net asset value per share | $ | 9.33 | ||
| Shares outstanding | 5,230 | |||
| Net assets | $ | 48,809 | ||
| Class R3: Net asset value per share | $ | 9.29 | ||
| Shares outstanding | 23 | |||
| Net assets | $ | 213 | ||
| Class R4: Net asset value per share | $ | 9.30 | ||
| Shares outstanding | 14 | |||
| Net assets | $ | 131 | ||
| Class R5: Net asset value per share | $ | 9.30 | ||
| Shares outstanding | 13 | |||
| Net assets | $ | 120 | ||
| Class Y: Net asset value per share | $ | 9.30 | ||
| Shares outstanding | 12,194 | |||
| Net assets | $ | 113,356 |
The accompanying notes are an integral part of these financial statements.
| 28 |
| The Hartford Strategic Income Fund |
| Statement of Operations |
| For the Year Ended October 31, 2014 |
| (000’s Omitted) |
| Investment Income: | ||||
| Dividends | $ | 41 | ||
| Interest | 23,742 | |||
| Less: Foreign tax withheld | (44 | ) | ||
| Total investment income | 23,739 | |||
| Expenses: | ||||
| Investment management fees | 2,707 | |||
| Administrative services fees | ||||
| Class R3 | — | |||
| Class R4 | — | |||
| Class R5 | — | |||
| Transfer agent fees | ||||
| Class A | 196 | |||
| Class B | 15 | |||
| Class C | 106 | |||
| Class I | 37 | |||
| Class R3 | — | |||
| Class R4 | — | |||
| Class Y | 3 | |||
| Distribution fees | ||||
| Class A | 368 | |||
| Class B | 77 | |||
| Class C | 1,158 | |||
| Class R3 | 1 | |||
| Class R4 | — | |||
| Custodian fees | 45 | |||
| Accounting services fees | 99 | |||
| Registration and filing fees | 123 | |||
| Board of Directors' fees | 14 | |||
| Audit fees | 15 | |||
| Other expenses | 88 | |||
| Total expenses (before waivers and fees paid indirectly) | 5,052 | |||
| Expense waivers | (167 | ) | ||
| Custodian fee offset | — | |||
| Total waivers and fees paid indirectly | (167 | ) | ||
| Total expenses, net | 4,885 | |||
| Net Investment Income | 18,854 | |||
| Net Realized Gain on Investments, Other Financial Instruments and Foreign Currency Transactions: | ||||
| Net realized gain on investments | 7,024 | |||
| Less: Foreign taxes paid on realized capital gains | (12 | ) | ||
| Net realized loss on purchased option contracts | (434 | ) | ||
| Net realized loss on TBA sale transactions | (830 | ) | ||
| Net realized gain on futures contracts | 3,318 | |||
| Net realized gain on written option contracts | 7 | |||
| Net realized gain on swap contracts | 2,666 | |||
| Net realized loss on foreign currency contracts | (257 | ) | ||
| Net realized loss on other foreign currency transactions | (149 | ) | ||
| Net Realized Gain on Investments, Other Financial Instruments and Foreign Currency Transactions | 11,333 | |||
| Net Changes in Unrealized Depreciation of Investments, Other Financial Instruments and Foreign Currency Transactions: | ||||
| Net unrealized depreciation of investments | (2,285 | ) | ||
| Net unrealized depreciation of purchased option contracts | (183 | ) | ||
| Net unrealized appreciation of TBA sale commitments | 108 | |||
| Net unrealized depreciation of futures contracts | (821 | ) | ||
| Net unrealized appreciation of written option contracts | 100 | |||
| Net unrealized appreciation of swap contracts | 77 | |||
| Net unrealized depreciation of foreign currency contracts | (505 | ) | ||
| Net unrealized depreciation of translation of other assets and liabilities in foreign currencies | (45 | ) | ||
| Net Changes in Unrealized Depreciation of Investments, Other Financial Instruments and Foreign Currency Transactions | (3,554 | ) | ||
| Net Gain on Investments, Other Financial Instruments and Foreign Currency Transactions | 7,779 | |||
| Net Increase in Net Assets Resulting from Operations | $ | 26,633 |
The accompanying notes are an integral part of these financial statements.
| 29 |
| The Hartford Strategic Income Fund |
| Statement of Changes in Net Assets |
| (000’s Omitted) |
| For the Year Ended October 31, 2014 | For the Year Ended October 31, 2013 | |||||||
| Operations: | ||||||||
| Net investment income | $ | 18,854 | $ | 24,632 | ||||
| Net realized gain (loss) on investments, other financial instruments and foreign currency transactions | 11,333 | (2,650 | ) | |||||
| Net unrealized depreciation of investments, other financial instruments and foreign currency transactions | (3,554 | ) | (13,636 | ) | ||||
| Net Increase (Decrease) in Net Assets Resulting from Operations | 26,633 | (8,346 | ) | |||||
| Distributions to Shareholders: | ||||||||
| From net investment income | ||||||||
| Class A | (5,833 | ) | (7,682 | ) | ||||
| Class B | (244 | ) | (342 | ) | ||||
| Class C | (3,714 | ) | (5,382 | ) | ||||
| Class I | (1,868 | ) | (3,158 | ) | ||||
| Class R3 | (8 | ) | (7 | ) | ||||
| Class R4 | (5 | ) | (5 | ) | ||||
| Class R5 | (5 | ) | (5 | ) | ||||
| Class Y | (7,645 | ) | (8,236 | ) | ||||
| Total from net investment income | (19,322 | ) | (24,817 | ) | ||||
| From net realized gain on investments | ||||||||
| Class A | — | (6,363 | ) | |||||
| Class B | — | (353 | ) | |||||
| Class C | — | (5,982 | ) | |||||
| Class I | — | (2,850 | ) | |||||
| Class R3 | — | (4 | ) | |||||
| Class R4 | — | (4 | ) | |||||
| Class R5 | — | (3 | ) | |||||
| Class Y | — | (4,823 | ) | |||||
| Total from net realized gain on investments | — | (20,382 | ) | |||||
| Total distributions | (19,322 | ) | (45,199 | ) | ||||
| Capital Share Transactions: | ||||||||
| Class A | (18,130 | ) | (47,299 | ) | ||||
| Class B | (2,953 | ) | (2,613 | ) | ||||
| Class C | (20,638 | ) | (68,997 | ) | ||||
| Class I | (2,517 | ) | (48,675 | ) | ||||
| Class R3 | (30 | ) | 108 | |||||
| Class R4 | (12 | ) | 18 | |||||
| Class R5 | 5 | 8 | ||||||
| Class Y | (105,576 | ) | 52,059 | |||||
| Net decrease from capital share transactions | (149,851 | ) | (115,391 | ) | ||||
| Net Decrease in Net Assets | (142,540 | ) | (152,244 | ) | ||||
| Net Assets: | ||||||||
| Beginning of period | 565,668 | 717,912 | ||||||
| End of period | $ | 423,128 | $ | 565,668 | ||||
| Undistributed (distributions in excess of) net investment income | $ | (435 | ) | $ | 199 | |||
The accompanying notes are an integral part of these financial statements.
| 30 |
| The Hartford Strategic Income Fund |
| Notes to Financial Statements |
| October 31, 2014 |
| (000’s Omitted) |
Organization:
The Hartford Mutual Funds, Inc. (“Company”) is an open-end management investment company comprised of forty-two portfolios. Financial statements for The Hartford Strategic Income Fund (the "Fund"), a series of the Company, are included in this report.
The Company is organized under the laws of the State of Maryland and is registered with the Securities and Exchange Commission (“SEC”) under the Investment Company Act of 1940, as amended (“1940 Act”). The Fund is a diversified open-end management investment company. The Fund is an investment company and applies specialized accounting and reporting under Accounting Standards Codification Topic 946, Financial Services - Investment Companies.
Class A shares are sold with a front-end sales charge of up to 4.50%. Class B shares were sold with a contingent deferred sales charge which is assessed on the lesser of the per share net asset value (“NAV”) of the shares at the time of redemption or the original purchase price, and declines from up to 5.00% to zero depending on the period of time the shares are held (see note below regarding the closing of Class B shares). Class C shares are sold with a contingent deferred sales charge of up to 1.00% on shares redeemed within twelve months of purchase. Class I shares are sold without sales charges to certain eligible investors primarily through advisory fee-based wrap programs. Class R3, R4 and R5 shares, which are offered to employer-sponsored retirement plans, and Class Y shares, which are sold to certain eligible institutional investors, are sold without a sales charge. All classes of shares have identical voting, redemption, dividend, liquidation and other rights and the same terms and conditions, with the exceptions that each class may have different expenses, which may affect performance, and that Class B shares automatically convert to Class A shares after 8 years.
No new or additional investments are allowed in Class B shares of the Fund (including investments through any systematic investment plan). Existing shareholders of Class B shares may continue to hold their Class B shares, exchange their Class B shares for Class B shares of another Hartford Fund (as permitted by existing exchange privileges), or redeem their Class B shares as described in the Fund’s prospectus. Reinstatement privileges with respect to Class B shares are set forth in the Fund's prospectus. For investors electing to reinvest capital gains and dividends, any such capital gains or dividends on Class B shares will continue to be reinvested in Class B shares of the Fund. All Class B share attributes, including the 12b-1 fee, contingent deferred sales charge schedule, and conversion to Class A shares, remain unchanged.
Significant Accounting Policies:
The following is a summary of significant accounting policies of the Fund in the preparation of its financial statements, which are in accordance with United States generally accepted accounting principles (“U.S. GAAP”). The preparation of financial statements in accordance with U.S. GAAP may require management to make estimates and assumptions that affect the reported amounts of assets and liabilities and disclosure of contingent assets and liabilities at the date of the financial statements and the reported amounts of increases and decreases in net assets from operations during the reporting period. Actual results could differ from those estimates.
Determination of Net Asset Value – The NAV of each class of the Fund's shares is determined as of the close of regular trading (normally 4:00 p.m. Eastern Time) (the “NYSE Close”) on each day that the New York Stock Exchange (the “Exchange”) is open (“Valuation Date”). Information that becomes known to the Fund after the NAV has been calculated on a particular day will not generally be used to retroactively adjust the NAV determined earlier that day.
Investment Valuation and Fair Value Measurements – For purposes of calculating the NAV, portfolio investments and other assets held by the Fund's portfolio for which market quotes are readily available are valued at market value. Market value is generally determined on the basis of last reported sales prices or official close price. If no sales are reported, market value is based on quotes obtained from a quotation reporting system, established market makers, or independent pricing services. If market prices are not readily available or are deemed unreliable, the Fund will use the fair value of the investment as determined in good faith under policies and procedures established by and under the supervision of the Company's Board of Directors. Market quotes are considered not readily available where there is an absence of current or reliable market-based data (e.g., trade information or indicative market quotes), including where events occur after the close of the relevant market, but prior to the NYSE Close, that materially affect the values of the Fund's portfolio investments or assets. In addition, market quotes are considered not readily available when, due to extraordinary circumstances, the exchanges or markets on which the investments trade do not open for trading for the entire day and
| 31 |
| The Hartford Strategic Income Fund |
| Notes to Financial Statements – (continued) |
| October 31, 2014 |
| (000’s Omitted) |
no other market prices are available. There can be no assurance that the Fund could obtain the fair market value assigned to an investment if the Fund were to sell the investment at approximately the time at which the Fund determines its NAV.
Fixed income investments (other than short-term obligations), non-exchange traded derivatives and centrally cleared swaps held by the Fund are normally valued on the basis of quotes obtained from independent pricing services or brokers and dealers in accordance with procedures established by the Company's Board of Directors. Prices obtained from independent pricing services use information provided by market makers or estimates of market values through accepted market modeling, trading and pricing conventions. Inputs to the models may include, but are not limited to, prepayment speeds, pricing spread, yield, trade information, dealer quotes, market color, cash flow models and the investment’s terms and conditions. Generally, the Fund may use fair valuation in regard to fixed income investments when the Fund holds defaulted or distressed investments or investments in a company in which a reorganization is pending. Senior floating rate interests generally trade in over-the-counter (“OTC”) markets and are priced through an independent pricing service utilizing independent market quotations from loan dealers or financial institutions. A composite bid price is used, which is an average of the dealer marks and dealer runs. Short-term investments maturing in 60 days or less are generally valued at amortized cost, if their original term to maturity was 60 days or less, or by amortizing their value on the 61st day prior to maturity, if the original term to maturity exceeded 60 days, which approximates fair value.
Exchange traded options, futures and options on futures are valued at the settlement price or last trade price determined by the relevant exchange as of the NYSE Close. If the last trade price for exchange traded options does not fall between the bid and ask prices, the value will be the mean of the bid and ask prices as of the NYSE Close. If a last trade price is not available, the value will be the mean of the bid and ask prices as of the NYSE Close. If a mean of the bid and ask prices cannot be calculated for the day, the value will be the bid price as of the NYSE Close. In the case of OTC options and such instruments that do not trade on an exchange, values may be supplied by a pricing service using a formula or other objective method that may take into consideration the style, direction, expiration, strike price, notional value and volatility or other special adjustments.
Investments valued in currencies other than U.S. dollars are converted to U.S. dollars using exchange rates obtained from independent pricing services for calculation of the NAV. As a result, the NAV of the Fund’s shares may be affected by changes in the value of currencies in relation to the U.S. dollar. The value of investments traded in markets outside the United States or denominated in currencies other than the U.S. dollar may be affected significantly on a day that the NYSE is closed and the market value may change on days when an investor is not able to purchase, redeem or exchange shares of the Fund.
Foreign currency contracts represent agreements to exchange currencies on specific future dates at predetermined rates. Foreign currency contracts are valued using foreign currency exchange rates and forward rates as provided by an independent pricing service on the Valuation Date.
Investments in open-end mutual funds are valued at the respective NAV of each open-end mutual fund on the Valuation Date.
Financial instruments for which prices are not available from an independent pricing service may be valued using market quotations obtained from one or more dealers that make markets in the respective financial instrument in accordance with procedures established by the Company's Board of Directors.
U.S. GAAP defines fair value as the price that the Fund would receive to sell an asset or pay to transfer a liability in an orderly transaction between market participants. The U.S. GAAP fair value measurement standards require disclosure of a fair value hierarchy for each major category of assets and liabilities. Various inputs are used in determining the fair value of the Fund’s investments. These inputs are summarized into three broad hierarchy levels. This hierarchy is based on whether the valuation inputs are observable or unobservable. These levels are:
Level 1 – Quoted prices in active markets for identical investments. Level 1 may include exchange traded instruments, such as domestic equities, some foreign equities, options, futures, mutual funds, exchange traded funds, rights and warrants.
Level 2 – Observable inputs other than Level 1 prices, such as quoted prices for similar investments; quoted prices in markets that are not active; or other inputs that are observable or can be corroborated by observable market data. Level 2 may include debt investments that are traded less frequently than exchange traded instruments and which are valued using independent
| 32 |
| The Hartford Strategic Income Fund |
| Notes to Financial Statements – (continued) |
| October 31, 2014 |
| (000’s Omitted) |
pricing services; foreign equities, which are principally traded on certain foreign markets and are adjusted daily pursuant to a fair value pricing service in order to reflect an adjustment for the factors occurring after the close of certain foreign markets but before the NYSE Close; senior floating rate interests, which are valued using an aggregate of dealer bids; short-term investments, which are valued at amortized cost; and swaps, which are valued based upon the terms of each swap contract.
Level 3 – Significant unobservable inputs that are supported by limited or no market activity. Level 3 may include financial instruments whose values are determined using indicative market quotes or require significant management judgment or estimation. These unobservable valuation inputs may include estimates for current yields, maturity/duration, prepayment speed, and indicative market quotes for comparable investments along with other assumptions relating to credit quality, collateral value, complexity of the investment structure, general market conditions and liquidity. This category may include investments where trading has been halted or there are certain restrictions on trading. While these investments are priced using unobservable inputs, the valuation of these investments reflects the best available data and management believes the prices are a reasonable representation of exit price. For more information on specific valuation techniques and unobservable inputs, please see the following table titled "Quantitative Information about Level 3 Fair Value Measurements."
The Board of Directors of the Company generally reviews and approves the “Procedures for Valuation of Portfolio Securities” at least once a year. These procedures define how investments are to be valued, including the formation and activities of a Valuation Committee. The Valuation Committee is responsible for determining in good faith the fair value of investments when the value cannot be obtained from primary pricing services or alternative sources or if the valuation of an investment as provided by the primary pricing service or alternative source is believed not to reflect the investment’s fair value as of the Valuation Date. Voting members of the Valuation Committee include the Fund’s Treasurer or designee and a Vice President of the investment manager or designee. An Assistant Vice President of the Fund with legal expertise or designee is also included on the Valuation Committee as a non-voting advisory member. In addition, the Fund’s Chief Compliance Officer shall designate a member of the compliance group to attend Valuation Committee meetings as a non-voting resource, to monitor for and provide guidance with respect to compliance with these procedures. Two members of the Valuation Committee or their designees, representing different departments, shall constitute a quorum for purposes of permitting the Valuation Committee to take action. The Valuation Committee will consider all relevant factors in determining an investment’s fair value, and may seek the advice of the Fund’s sub-adviser, knowledgeable brokers, and legal counsel in making such determination. The Valuation Committee reports to the Audit Committee of the Company’s Board of Directors. The Audit Committee receives quarterly written reports which include details of all fair-valued investments, including the reason for the fair valuation, and an indication, when possible, of the accuracy of the valuation by disclosing the next available reliable public price quotation or the disposition price of such investments (the “look-back” test). The Board of Directors then must consider for ratification all of the fair value determinations made during the previous quarter.
Valuation levels are not necessarily indicative of the risk associated with investing in such investments. Individual investments within any of the above mentioned asset classes may be assigned a different hierarchical level than those presented above, as individual circumstances dictate.
For additional information, refer to the Investment Valuation Hierarchy Level Summary and the Level 3 roll-forward reconciliation, if applicable, which follow the Schedule of Investments.
| 33 |
| The Hartford Strategic Income Fund |
| Notes to Financial Statements – (continued) |
| October 31, 2014 |
| (000’s Omitted) |
Quantitative Information about Level 3 Fair Value Measurements:
| Security Type/Valuation Technique | Unobservable Input * | Input
Value(s) Range (Weighted Average) ‡ | Fair
Value at October 31, 2014 | |||||
| Assets: | ||||||||
| Asset and Commercial Mortgage Backed Securities | ||||||||
| Cost | Recent trade price | $100.44 | $ | 281 | ||||
| Date | 10/24/2014 | |||||||
| Discounted cash flow | Internal rate of return | 3.08% - 6.87% (4.50%) | 14,723 | |||||
| Life expectancy (in months) | 24 - 273 (139) | |||||||
| Independent pricing service | Prior day valuation | $67.09 - $68.63 ($67.32) | 2,120 | |||||
| Common Stocks | ||||||||
| Model Δ | Enterprise Value/Estimated 2014 EBITDA | 5.85x to 7.18x for Platform Services, 4.93x to 5.15x for Land Drilling, 5.20x to 6.86 x MODU, 6.19x to 8.42x Bentec | 408 | |||||
| Corporate Bonds | ||||||||
| Cost | Recent trade price | $100.00 | 930 | |||||
| Date | 10/30/2014 | |||||||
| Total | $ | 18,462 | ||||||
| Liabilities: | ||||||||
| Swap Contracts: ▲ | ||||||||
| Independent pricing service | Prior day valuation | ($0.31) | $ | 40 | ||||
| Total | $ | 40 | ||||||
| * | Significant changes to any unobservable inputs may result in a significant change to the fair value. |
| ‡ | Unless otherwise noted, inputs were weighted based on the fair value of the investments included in the range. |
| Δ | Includes illiquidity discount of 10%. |
| ▲ | Derivative instruments are valued at the unrealized appreciation/depreciation on the investments. |
Investment Transactions and Investment Income – Investment transactions are recorded as of the trade date (the date the order to buy or sell is executed) for financial reporting purposes. Investments purchased or sold on a when-issued or delayed-delivery basis may be settled a month or more after the trade date. Realized gains and losses are determined on the basis of identified cost.
Trade date for senior floating rate interests purchased in the primary loan market is considered the date on which the loan allocations are determined. Trade date for senior floating rate interests purchased in the secondary loan market is the date on which the transaction is entered into.
Dividend income from domestic securities is accrued on the ex-dividend date. Interest income, including amortization of premium, accretion of discounts and additional principal received in-kind in lieu of cash, is accrued on a daily basis. Paydown gains and losses on mortgage related and other asset backed securities are included in interest income in the Statement of Operations, as applicable.
Taxes – The Fund may be subject to taxes imposed on realized gains on securities of certain foreign countries in which the Fund invests. The amount of foreign tax expense is included on the accompanying Statement of Operations as a reduction to net realized gain on investments in these securities.
Foreign Currency Transactions – Assets and liabilities denominated in currencies other than U.S. dollars are translated into U.S. dollars at the exchange rates in effect on the valuation date. Purchases and sales of investments, income and expenses are translated into U.S. dollars at the exchange rates on the dates of such transactions.
The Fund does not isolate that portion of portfolio investment valuation resulting from fluctuations in the foreign currency exchange rates from the fluctuations arising from changes in the market prices of investments held. Exchange rate fluctuations are included with the net realized and unrealized gain or loss on investments in the accompanying financial statements.
Net realized foreign exchange gains or losses arise from sales of foreign currencies and the difference between asset and liability amounts initially stated in foreign currencies and the U.S. dollar value of the amounts actually received or paid. Net unrealized foreign exchange gains or losses arise from changes in the value of other assets and liabilities at the end of the reporting period, resulting from changes in the exchange rates.
| 34 |
| The Hartford Strategic Income Fund |
| Notes to Financial Statements – (continued) |
| October 31, 2014 |
| (000’s Omitted) |
Joint Trading Account – The Fund may invest cash balances into a joint trading account that may be invested in one or more repurchase agreements.
Fund Share Valuation and Dividend Distributions to Shareholders – Orders for the Fund’s shares are executed in accordance with the investment instructions of the shareholders. The NAV of the Fund’s shares is determined as of the close of business on each business day of the Exchange. The NAV is determined separately for each class of shares of the Fund by dividing the Fund’s net assets attributable to that class by the number of shares of the class outstanding. Each class of shares offered by the Fund has equal rights as to assets and voting privileges (except that shareholders of a class have exclusive voting rights regarding any matter relating solely to that class of shares). Income and non-class specific expenses are allocated daily to each class on the basis of the relative net assets of the class. Realized and unrealized gains and losses are allocated daily based on the relative net assets of each class of shares of the Fund.
Orders for the purchase of the Fund’s shares received prior to the close of the Exchange on any day the Exchange is open for business are priced at the NAV determined as of the close of the Exchange. Orders received after the close of the Exchange, or on a day on which the Exchange and/or the Fund is not open for business, are priced at the next determined NAV.
Dividends are declared pursuant to a policy adopted by the Company's Board of Directors based upon the investment performance of the Fund. Normally, dividends from net investment income are declared and paid monthly. Dividends from realized gains, if any, are paid at least once a year.
Net investment income, dividends and distributions from net realized gains and capital are determined in accordance with federal income tax regulations, which may differ from U.S. GAAP with respect to character and timing (see Federal Income Taxes: Distributions and Components of Distributable Earnings and Reclassification of Capital Accounts).
Securities and Other Investments:
Repurchase Agreements – A repurchase agreement is an agreement by which a counterparty agrees to sell an investment and agrees to repurchase the investment sold from the buyer at a mutually agreed upon time and price. During the period of the repurchase agreement, the counterparty will deposit cash and or securities in a third party custodial account to serve as collateral. At the time the Fund enters into a repurchase agreement, the value of the underlying collateral, including accrued interest, will be equal to or exceed the value of the repurchase agreement. Repurchase agreements expose the Fund to counterparty risk - that is, the risk that the counterparty will not fulfill its obligations. To minimize counterparty risk, the investments that serve to collateralize the repurchase agreement are held by the Fund’s custodian in book entry or physical form in the custodial account of the Fund or in a third party custodial account. Repurchase agreements are valued at cost plus accrued interest, which approximates fair value. Repurchase agreements have master netting arrangements which allow the Fund to offset amounts owed to a counterparty with amounts owed by the counterparty, including any collateral. Upon an event of default under a master repurchase agreement, the non-defaulting party may close out all transactions traded under such agreement and net amounts owed under each transaction to one net amount payable by one party to the other. Absent an event of default, the master repurchase agreement does not result in an offset of reported amounts of assets and liabilities in the Statement of Assets and Liabilities across transactions between the Fund and the applicable counterparty. The Fund, as shown on the Schedule of Investments, had outstanding repurchase agreements and related collateral as of October 31, 2014.
Illiquid and Restricted Investments – The Fund is permitted to invest up to 15% of its net assets in illiquid investments. Illiquid investments are those that may not be sold or disposed of in the ordinary course of business within seven days, at approximately the price used to determine the Fund’s NAV. The Fund may not be able to sell illiquid investments when its sub-adviser considers it desirable to do so or may have to sell such investments at a price that is lower than the price that could be obtained if the investments were more liquid. A sale of illiquid investments may require more time and may result in higher dealer discounts and other selling expenses than does the sale of those that are liquid. Illiquid investments also may be more difficult to value due to the unavailability of reliable market quotations for such investments, and an investment in them may have an adverse impact on the Fund’s NAV. The Fund may also purchase certain restricted investments that can only be resold to certain qualified investors and may be determined to be liquid pursuant to policies and guidelines established by the Company's Board of Directors. The Fund, as shown on the Schedule of Investments, had illiquid or restricted investments as of October 31, 2014.
| 35 |
| The Hartford Strategic Income Fund |
| Notes to Financial Statements – (continued) |
| October 31, 2014 |
| (000’s Omitted) |
Investments Purchased on a When-Issued or Delayed-Delivery Basis – Delivery and payment for investments that have been purchased by the Fund on a forward commitment, or when-issued or delayed-delivery basis, take place beyond the customary settlement period. The Fund may dispose of or renegotiate a delayed-delivery transaction after it is entered into, and may sell delayed-delivery investments before they are delivered, which may result in a realized gain or loss. During this period, such investments are subject to market fluctuations, and the Fund identifies investments segregated in its records with a value at least equal to the amount of the commitment. The Fund, as shown on the Schedule of Investments, had when-issued or delayed-delivery investments as of October 31, 2014.
In connection with the Fund’s ability to purchase investments on a when-issued or forward commitment basis, the Fund may enter into to-be announced (“TBA”) commitments. TBA commitments are forward agreements for the purchase or sale of mortgage backed securities for a fixed price, with payment and delivery on an agreed-upon future settlement date. The specific securities to be delivered are not identified at the trade date; however, delivered securities must meet specified terms, including issuer, rate and mortgage terms. Although the Fund may enter into TBA commitments with the intention of acquiring or delivering securities for its portfolio, the Fund can extend the settlement date, roll the transaction, or dispose of a commitment prior to settlement if deemed appropriate to do so. If the TBA commitment is closed through the acquisition of an offsetting TBA commitment, the Fund realizes a gain or loss. In a TBA roll transaction, the Fund generally purchases or sells the initial TBA commitment prior to the agreed upon settlement date and enters into a new TBA commitment for future delivery or receipt of the mortgage backed securities. TBA commitments involve a risk of loss if the value of the security to be purchased or sold declines or increases, respectively, prior to settlement date.
The Fund may enter into “dollar rolls” in which the Fund sells securities and contracts with the same counterparty to repurchase substantially similar securities (for example, same issuer, coupon and maturity) on a specified future date at an agreed upon price. The Fund gives up the right to receive interest paid on the investments sold. The Fund would benefit to the extent of any differences between the price received for the security and the lower forward price for the future purchase. Dollar rolls involve the risk that the market value of the securities that the Fund is required to purchase may decline below the agreed upon repurchase price of those securities. The Fund records dollar roll transactions as purchases and sales and realizes gains and losses on these transactions. These transactions are excluded from the Fund’s portfolio turnover rate. The Fund, as shown on the Schedule of Investments, had open TBA commitments as of October 31, 2014, which may be a part of dollar roll transactions.
Senior Floating Rate Interests – The Fund may invest in senior floating rate interests. Senior floating rate interests hold the most senior position in the capital structure of a business entity (the “Borrower”), are typically secured by specific collateral and have a claim on the assets and/or stock of the Borrower that is senior to the assets held by subordinated debtholders and stockholders of the Borrower. Senior floating rate interests are typically structured and administered by a financial institution that acts as the agent of the lenders participating in the senior floating rate interest. The Fund may invest in multiple series or tranches of a senior floating rate interest, which may have varying terms and carry different associated risks. The Fund may also enter into unfunded loan commitments, which are contractual obligations for future funding. Unfunded loan commitments may include revolving credit facilities, which may obligate the Fund to supply additional cash to the borrower on demand, representing a potential financial obligation by the Fund in the future. The Fund may receive a commitment fee based on the undrawn portion of the underlying line of credit portion of a senior floating rate interest. In certain circumstances, the Fund may receive various fees upon the restructure of a senior floating rate interest by a borrower. Fees earned/paid are recorded as a component of income or realized gain/loss in the Statement of Operations.
Senior floating rate interests are typically rated below-investment-grade, which suggests the risk of default is higher, and generally pay higher interest rates than investment-grade debt securities. A default could lead to non-payment of income or principal, which would result in a reduction of investment income to the Fund, and there can be no assurance that the liquidation of any collateral would satisfy the Borrower’s obligation in the event of non-payment of scheduled interest or principal payments, or that such collateral could be readily liquidated. The Fund, as shown on the Schedule of Investments, had senior floating rate interests as of October 31, 2014.
Mortgage Related and Other Asset Backed Securities – The Fund may invest in mortgage related and other asset backed securities. These securities include mortgage pass-through securities, collateralized mortgage obligations, commercial mortgage backed securities, stripped mortgage backed securities, asset backed securities, collateralized debt obligations and other securities that directly or indirectly represent a participation in, or are secured by and payable from, mortgage loans on real property. Mortgage
| 36 |
| The Hartford Strategic Income Fund |
| Notes to Financial Statements – (continued) |
| October 31, 2014 |
| (000’s Omitted) |
related securities are created from pools of residential or commercial mortgage loans, including mortgage loans made by savings and loan institutions, mortgage bankers, commercial banks and other similar financial institutions. Asset backed securities are created from many types of assets, including auto loans, credit card receivables, home equity loans, and student loans. These securities provide a monthly payment that consists of both interest and principal payments. Interest payments may be determined by fixed or adjustable rates. The rate of pre-payments on underlying mortgages will affect the price and volatility of a mortgage related security, and may have the effect of shortening or extending the effective duration of the security relative to what was anticipated at the time of purchase. The timely payment of principal and interest of certain mortgage related securities is guaranteed by the full faith and credit of the United States Government. Mortgage related and other asset backed securities created and guaranteed by non-governmental issuers, including government-sponsored corporations, may be supported by various forms of insurance or guarantees, but there can be no assurance that the private insurers or guarantors can meet their obligations under the insurance policies or guarantee arrangements. The Fund, as shown on the Schedule of Investments, had outstanding mortgage related and other asset backed securities as of October 31, 2014.
Financial Derivative Instruments:
The following disclosures contain information on how and why the Fund uses derivative instruments, the credit-risk-related contingent features in certain derivative instruments and how derivative instruments affect the Fund’s financial position and results of operations. The location and fair value amounts of these instruments on the Statement of Assets and Liabilities and the realized gains and losses and changes in unrealized gains and losses on the Statement of Operations, each categorized by type of derivative contract, are included in the following Additional Derivative Instrument Information footnote. The derivative instruments outstanding as of year-end are disclosed in the notes to the Schedule of Investments, if applicable. The amounts of realized gains and losses and changes in unrealized gains and losses on derivative instruments during the year are disclosed in the Statement of Operations.
Foreign Currency Contracts – The Fund may enter into foreign currency contracts that obligate the Fund to purchase or sell currencies at specified future dates. Foreign currency contracts are used to hedge the currency exposure associated with some or all of the Fund’s investments and/or as part of an investment strategy. Foreign currency contracts are marked to market daily and the change in value is recorded by the Fund as an unrealized gain or loss. The Fund will record a realized gain or loss when the foreign currency contract is settled.
Foreign currency contracts involve elements of market risk in excess of the amounts reflected in the Statement of Assets and Liabilities. In addition, risks may arise upon entering into these contracts from the potential inability of the counterparties to meet the terms of the contracts and from unanticipated movements in the value of the foreign currencies relative to the U.S. dollar. The Fund, as shown on the Schedule of Investments, had outstanding foreign currency contracts as of October 31, 2014.
Futures Contracts – The Fund may enter into futures contracts. A futures contract is an agreement between two parties to buy or sell an asset at a set price on a future date. The Fund uses futures contracts to manage or obtain exposure to the investment markets, commodities, or movements in interest rates and currency values. The primary risks associated with the use of futures contracts are the imperfect correlation between the change in market value of the investments held by the Fund and the prices of futures contracts and the possibility of an illiquid market. Upon entering into a futures contract, the Fund is required to deposit with a futures commission merchant (“FCM”) an amount of cash or U.S. Government or Agency Obligations in accordance with the initial margin requirements of the broker or exchange. Futures contracts are marked to market daily at the most recent settlement price reported by an exchange on which, over time, they are traded most extensively, and an appropriate payable or receivable for the change in value (“variation margin”) is recorded by the Fund. Gains or losses are recognized but not considered realized until the contracts expire or are closed. Futures contracts involve, to varying degrees, risk of loss in excess of the variation margin disclosed on the Statement of Assets and Liabilities; however, the Fund seeks to reduce this risk through the use of an FCM. The Fund, as shown on the Schedule of Investments, had outstanding futures contracts as of October 31, 2014.
Options Contracts – An option contract is a contract sold by one party to another party that offers the buyer the right, but not the obligation, to buy (call) or sell (put) an investment or other financial asset at an agreed-upon price during a specific period of time or on a specific date. Options contracts are either privately negotiated in the over-the-counter market ("OTC options") or executed in a registered exchange ("exchange traded options"). The Fund may write (sell) covered call and put options on futures, swaps (“swaptions”), securities, commodities or currencies. “Covered” means that so long as the Fund is obligated as the writer of an option,
| 37 |
| The Hartford Strategic Income Fund |
| Notes to Financial Statements – (continued) |
| October 31, 2014 |
| (000’s Omitted) |
it will own either the underlying investments or currency or an option to purchase the same underlying investments or currency having an expiration date of the covered option and an exercise price equal to or less than the exercise price of the covered option, or will pledge cash or other liquid investments having a value equal to or greater than the fluctuating market value of the option investment or currency. Writing put options increases the Fund’s exposure to the underlying instrument. Writing call options decreases the Fund’s exposure to the underlying instrument. Premiums received from writing options that expire are treated as realized gains. Premiums received from writing options that are exercised or closed are added to the proceeds or offset amounts paid on the underlying futures, swap, investment or currency transaction to determine the realized gain or loss. The Fund as a writer of an option has no control over whether the underlying instrument may be sold (call) or purchased (put) and as a result bears the market risk of an unfavorable change in the price of the instrument underlying the written option. There is the risk the Fund may not be able to enter into a closing transaction because of an illiquid market. The Fund may also purchase put and call options. Purchasing call options increases the Fund’s exposure to the underlying instrument. Purchasing put options decreases the Fund’s exposure to the underlying instrument. The Fund pays a premium, which is included on the Fund’s Statement of Assets and Liabilities as an investment and is subsequently marked to market to reflect the current value of the option. Premiums paid for purchasing options that expire are treated as realized losses. Certain options may be purchased with premiums to be determined on a future date. The premiums for these options are based upon implied volatility parameters at specified terms. The risk associated with purchasing put and call options is generally limited to the premium paid. Premiums paid for purchasing options that are exercised or closed are added to the amounts paid or offset against the proceeds on the underlying investment transaction to determine the realized gain or loss. Entering into over-the-counter options also exposes the Fund to counterparty risk. Counterparty risk is the possibility that the counterparty to the agreements may default on its obligation to perform or disagree as to the meaning of the contractual terms in the agreements.
The Fund, as shown on the Schedule of Investments, had outstanding purchased and written option contracts as of October 31, 2014. Transactions involving written option contracts during the year ended October 31, 2014, are summarized below:
| Options Contract Activity During the Year Ended October 31, 2014: | ||||||||
| Call Options Written During the Year | Number of Contracts* | Premium Amounts | ||||||
| Beginning of the period | 337,000 | $ | 7 | |||||
| Written | 23,205,000 | 392 | ||||||
| Expired | (337,000 | ) | (7 | ) | ||||
| Closed | — | — | ||||||
| Exercised | — | — | ||||||
| End of period | 23,205,000 | $ | 392 | |||||
| Put Options Written During the Year | Number of Contracts* | Premium Amounts | ||||||
| Beginning of the period | — | $ | — | |||||
| Written | 23,205,000 | 281 | ||||||
| Expired | — | — | ||||||
| Closed | — | — | ||||||
| Exercised | — | — | ||||||
| End of period | 23,205,000 | $ | 281 | |||||
* The number of contracts does not omit 000's.
Swap Contracts – The Fund may invest in swap contracts. Swap contracts are agreements to exchange or swap investment cash flows, assets, foreign currencies or market-linked returns at specified, future intervals. Swap contracts are either privately negotiated in the over-the-counter market (“OTC swaps”) or cleared in a central clearing house (“centrally cleared swaps”). The Fund may enter into credit default, total return, cross-currency, interest rate, inflation and other forms of swap contracts to manage its exposure to credit, currency, interest rate, commodity and inflation risk. Swap contracts are also used to gain exposure to certain markets. In connection with these contracts, investments or cash may be identified as collateral or margin in accordance with the terms of the respective swap contracts and/or master netting arrangement to provide assets of value and recourse in the event of default or bankruptcy/insolvency.
Swaps are valued based on custom valuations furnished by an independent pricing service. Swaps for which prices are not available from an independent pricing service are valued in accordance with procedures established by the Company's Board of Directors. Changes in market value, if any, are reflected as a component of net changes in unrealized appreciation or depreciation on the Statement of Operations. Daily changes in valuation of centrally cleared swaps, if any, are recorded as a receivable or payable for the
| 38 |
| The Hartford Strategic Income Fund |
| Notes to Financial Statements – (continued) |
| October 31, 2014 |
| (000’s Omitted) |
change in value (“variation margin”) on the Statement of Assets and Liabilities. Realized gains or losses on centrally cleared swaps are recorded upon the termination of the swap. OTC swap payments received or paid at the beginning of the measurement period are reflected as such on the Statement of Assets and Liabilities and represent premiums paid or received upon entering into the swap contract to compensate for differences between the stated terms of the swap contract and prevailing market conditions (credit spreads, currency exchange rates, interest rates and other relevant factors). These upfront premiums are recorded as realized gains or losses on the Statement of Operations upon termination or maturity of the swap. A liquidation payment received or made at the termination or maturity of the swap is recorded as a realized gain or loss on the Statement of Operations. Net periodic payments received or paid by the Fund are included as part of realized gains or losses on the Statement of Operations.
Entering into these contracts involves, to varying degrees, elements of liquidation, counterparty, credit and market risk in excess of the amounts recognized on the Statement of Assets and Liabilities. Such risks involve the possibility that there will be no liquid market for these contracts, that the counterparty to the contracts may default on its obligation to perform or disagree as to the meaning of contractual terms in the contracts, and that there may be unfavorable changes in market conditions (credit spreads, currency exchange rates, interest rates and other relevant factors).
The Fund’s maximum risk of loss from counterparty risk for OTC swaps is the net value of the discounted cash flows to be received from the counterparty over the contract’s remaining life, and current market value, to the extent that amount is positive. The risk is mitigated by having a master netting arrangement between the Fund and the counterparty, which allows for the netting of payments made or received (although such amounts are presented on a gross basis within the Statement of Assets and Liabilities, as applicable) as well as the posting of collateral to the Fund to cover the Fund’s exposure to the counterparty. In a centrally cleared swap, while the Fund enters into an agreement with a clearing broker to execute contracts with a counterparty, the performance of the swap is guaranteed by the central clearinghouse, which reduces the Fund’s exposure to counterparty risk. The Fund is still exposed to the counterparty risk through the clearing broker and clearinghouse. The clearinghouse attempts to minimize this risk to its participants through the use of mandatory margin requirements, daily cash settlements and other procedures. Likewise, the clearing broker reduces its risk through margin requirements and required segregation of customer balances.
Credit Default Swap Contracts – The credit default swap market allows the Fund to manage its exposure to the market or certain sectors of the market, to reduce its risk exposure to defaults of corporate and sovereign issuers, or to create exposure to corporate or sovereign issuers to which it is not otherwise exposed. Certain credit default swaps involve the exchange of a fixed rate premium for protection against the loss in value of an underlying investment or index in the event of a credit event, such as payment default or bankruptcy.
Under a credit default swap contract, one party acts as guarantor by receiving the fixed periodic payment in exchange for the commitment to purchase the underlying investment at par if the defined credit event occurs. Upon the occurrence of a defined credit event, the difference between the value of the reference obligation and the swap’s notional amount is recorded as realized gain or loss on swap transactions in the Statement of Operations. A “buyer” of credit protection agrees to pay a counterparty to assume the credit risk of an issuer upon the occurrence of certain events. The “seller” of the protection receives periodic payments and agrees to assume the credit risk of an issuer upon the occurrence of certain events. Although specified events are contract specific, credit events are generally defined as bankruptcy, failure to pay, restructuring, obligation acceleration, obligation default or repudiation/moratorium. A “seller’s” exposure is limited to the total notional amount of the credit default swap contract. These potential amounts would be partially offset by any recovery values of the respective referenced obligations or upfront payments received upon entering into the contract.
Implied credit spreads, represented in absolute terms, utilized in determining the market value of credit default swap contracts on corporate issues, sovereign government issues or U.S. municipal issues as of year-end are disclosed in the notes to the Schedule of Investments, as applicable, and serve as an indicator of the current status of the payment/performance risk and represent the likelihood or risk of default for the credit derivative. The implied credit spread of a particular referenced entity reflects the cost of buying/selling protection and there may also be upfront payments required to be made to enter into the contract. Wider credit spreads represent a deterioration of the referenced entity’s credit soundness and a greater likelihood or risk of default or other credit event occurring as defined under the terms of the contract. For credit default swap contracts on credit indices, the quoted market prices and resulting values serve as the indicator of the current status of the payment/performance risk. Increasing market values, in absolute terms when compared to the notional amount of the swap, represent a deterioration of the referenced equity’s credit soundness and a
| 39 |
| The Hartford Strategic Income Fund |
| Notes to Financial Statements – (continued) |
| October 31, 2014 |
| (000’s Omitted) |
greater likelihood or risk of default or other credit event occurring as defined under the terms of the contract. The Fund, as shown on the Schedule of Investments, had outstanding credit default swap contracts as of October 31, 2014.
Interest Rate Swap Contracts – The Fund is subject to interest rate risk exposure in the normal course of pursuing its investment objectives. Because the Fund holds fixed rate bonds, the value of these bonds may decrease if interest rates rise. To hedge against this risk and to maintain its ability to generate income at prevailing market rates, the Fund may enter into interest rate swap contracts. In a typical interest rate swap, one party agrees to make regular payments equal to a floating interest rate, based on a specified interest rate or benchmark (e.g. London Interbank Offered Rate (“LIBOR”)), multiplied by a notional amount, in return for payments equal to a fixed rate multiplied by the same amount, for a specific period of time. The net interest received or paid on interest rate swap contracts is recorded as a realized gain or loss. Interest rate swaps are marked to market daily and the change, if any, is recorded as an unrealized gain or loss in the Statement of Operations. When the interest rate swap contract is terminated early, the Fund records a realized gain or loss equal to the difference between the current market value and the upfront premium or cost.
If an interest rate swap contract provides for payments in different currencies, the parties might agree to exchange the notional amount as well. Interest rate swaps may also depend on other prices or rates, such as the value of an index. The risks of interest rate swaps include changes in market conditions which will affect the value of the contract or the cash flows and the possible inability of the counterparty to fulfill its obligations under the contract. The Fund’s maximum risk of loss from counterparty credit risk is the discounted net value of the cash flows to be received from the counterparty over the contract’s remaining life, to the extent that amount is positive. The Fund, as shown on the Schedule of Investments, had outstanding interest rate swap contracts as of October 31, 2014.
Spreadlock Swap Contracts – The Fund may invest in spreadlock swap contracts. These contracts involve commitments to pay or receive a settlement amount calculated as the spread difference between two interest rate curves and a fixed spread at a specific forward date determined at the beginning of the contract. Settlement amounts paid or received are recorded as a realized gain or loss on the Statement of Operations at the determination date. The Fund had no outstanding spreadlock swap contracts as of October 31, 2014.
Total Return Swap Contracts – The Fund may invest in total return swap contracts. An investment in a total return swap allows the Fund to gain or mitigate exposure to underlying referenced securities, indices or commodities. Total return swap contracts on commodities involve commitments where cash flows are exchanged based on the price of a commodity and based on a fixed or variable rate. One party would receive payments based on the price appreciation or depreciation of a commodity index, a portion of the index, or a single commodity in exchange for paying to or receiving from the counterparty seller an agreed-upon rate, which can be fixed or variable. A variable rate may be correlated to a base rate, such as the LIBOR, and is adjusted each reset period, which are defined at the beginning of the contract. Therefore, if interest rates increase over the term of the swap contract, the party paying the rate may be required to pay a higher rate at each swap reset date.
Total return swap contracts on indices involve commitments to pay interest in exchange for a market-linked return. One party pays out the total return of a specific reference asset, which may be an equity, index, or bond, and in return receives a regular stream of payments. To the extent the total return of the security or index underlying the transaction exceeds or falls short of the offsetting interest rate obligation, the Fund will receive a payment from or make a payment to the counterparty.
Variance swap contracts involve two parties agreeing to exchange cash flows based on the measured variance (or square of volatility) of a specified underlying asset. One party agrees to exchange a fixed rate or strike price payment for the floating rate or realized price variance on the underlying asset with respect to the notional amount. At inception, the strike price is generally chosen such that the fair value of the swap is zero. At the maturity date, a net cash flow is exchanged, where the payoff amount is equivalent to the difference between the realized price variance of the underlying asset and the strike price multiplied by the notional amount. This type of agreement is essentially a forward contract on the future realized price variance of the underlying asset. The Fund, as shown on the Schedule of investments, had outstanding total return swap contracts as of October 31, 2014.
| 40 |
| The Hartford Strategic Income Fund |
| Notes to Financial Statements – (continued) |
| October 31, 2014 |
| (000’s Omitted) |
Additional Derivative Instrument Information:
Fair Value of Derivative Instruments on the Statement of Assets and Liabilities as of October 31, 2014:
| Risk Exposure Category | ||||||||||||||||||||||||||||
| Interest
Rate Contracts | Foreign Exchange Contracts | Credit Contracts | Equity Contracts | Commodity Contracts | Other Contracts | Total | ||||||||||||||||||||||
| Assets: | ||||||||||||||||||||||||||||
| Investments in securities, at value (purchased option contracts), market value | $ | 24 | $ | 177 | $ | — | $ | — | $ | — | $ | — | $ | 201 | ||||||||||||||
| Unrealized appreciation on foreign currency contracts | — | 335 | — | — | — | — | 335 | |||||||||||||||||||||
| Unrealized appreciation on OTC swap contracts | 7 | — | 3,832 | — | — | — | 3,839 | |||||||||||||||||||||
| Variation margin receivable * | 154 | — | 155 | — | — | — | 309 | |||||||||||||||||||||
| Total | $ | 185 | $ | 512 | $ | 3,987 | $ | — | $ | — | $ | — | $ | 4,684 | ||||||||||||||
| Liabilities: | ||||||||||||||||||||||||||||
| Unrealized depreciation on foreign currency contracts | $ | — | $ | 558 | $ | — | $ | — | $ | — | $ | — | $ | 558 | ||||||||||||||
| Unrealized depreciation on OTC swap contracts | — | — | 1,498 | 40 | — | — | 1,538 | |||||||||||||||||||||
| Variation margin payable * | 272 | — | 96 | — | — | — | 368 | |||||||||||||||||||||
| Written option contracts, market value | — | — | 567 | — | — | — | 567 | |||||||||||||||||||||
| Total | $ | 272 | $ | 558 | $ | 2,161 | $ | 40 | $ | — | $ | — | $ | 3,031 | ||||||||||||||
* Only current day's variation margin is reported within the Statement of Assets and Liabilities. The variation margin is included in the open futures net cumulative depreciation of $(74) and open centrally cleared swaps net cumulative appreciation of $120 as reported in the Schedule of Investments.
The volume of derivatives that is presented in the Schedule of Investments is consistent with the derivative activity during the year ended October 31, 2014.
|
The Effect of Derivative Instruments on the Statement of Operations for the year ended October 31, 2014: |
| Risk Exposure Category | ||||||||||||||||||||||||||||
| Interest
Rate Contracts | Foreign Exchange Contracts | Credit Contracts | Equity Contracts | Commodity Contracts | Other Contracts | Total | ||||||||||||||||||||||
| Realized Gain (Loss) on Derivatives Recognized as a Result of Operations: | ||||||||||||||||||||||||||||
| Net realized loss on purchased option contracts | $ | (414 | ) | $ | (20 | ) | $ | — | $ | — | $ | — | $ | — | $ | (434 | ) | |||||||||||
| Net realized gain on futures contracts | 3,318 | — | — | — | — | — | 3,318 | |||||||||||||||||||||
| Net realized gain on written option contracts | — | 7 | — | — | — | — | 7 | |||||||||||||||||||||
| Net realized gain (loss) on swap contracts | (1,511 | ) | — | 4,963 | (786 | ) | — | — | 2,666 | |||||||||||||||||||
| Net realized loss on foreign currency contracts | — | (257 | ) | — | — | — | — | (257 | ) | |||||||||||||||||||
| Total | $ | 1,393 | $ | (270 | ) | $ | 4,963 | $ | (786 | ) | $ | — | $ | — | $ | 5,300 | ||||||||||||
| Net Change in Unrealized Appreciation (Depreciation) on Derivatives Recognized as a Result of Operations: | ||||||||||||||||||||||||||||
| Net change in unrealized appreciation (depreciation) of purchased option contracts | $ | (189 | ) | $ | 6 | $ | — | $ | — | $ | — | $ | — | $ | (183 | ) | ||||||||||||
| Net change in unrealized depreciation of futures contracts | (821 | ) | — | — | — | — | — | (821 | ) | |||||||||||||||||||
| Net change in unrealized appreciation (depreciation) of written option contracts | — | (6 | ) | 106 | — | — | — | 100 | ||||||||||||||||||||
| Net change in unrealized appreciation (depreciation) of swap contracts | 523 | — | (406 | ) | (40 | ) | — | — | 77 | |||||||||||||||||||
| Net change in unrealized depreciation of foreign currency contracts | — | (505 | ) | — | — | — | — | (505 | ) | |||||||||||||||||||
| Total | $ | (487 | ) | $ | (505 | ) | $ | (300 | ) | $ | (40 | ) | $ | — | $ | — | $ | (1,332 | ) | |||||||||
| 41 |
| The Hartford Strategic Income Fund |
| Notes to Financial Statements – (continued) |
| October 31, 2014 |
| (000’s Omitted) |
Balance Sheet Offsetting Information - The following discloses both gross information and net information about instruments and transactions eligible for offset in the financial statements, and instruments and transactions that are subject to a master netting arrangement, as well as amounts related to margin, reflected as financial collateral (including cash collateral), held at clearing brokers, counterparties and the Fund’s custodian. The master netting arrangements allow the clearing brokers to net any collateral held in or on behalf of the Fund, or liabilities or payment obligations of the clearing brokers to the Fund, against any liabilities or payment obligations of the Fund to the clearing brokers. The Fund is required to deposit financial collateral (including cash collateral) at the FCM's custodian on behalf of clearing brokers and counterparties to continually meet the original and maintenance requirements established by the clearing brokers and counterparties. Such requirements are specific to the respective clearing broker or counterparty. Certain master netting arrangements may not be enforceable in the bankruptcy proceedings of a counterparty.
Offsetting of Financial Assets and Derivative Assets as of October 31, 2014:
| Gross
Amounts* of Assets Presented in Statement of Assets and Liabilities | Financial Instruments with Allowable Netting | Non-cash Collateral Received | Cash
Collateral Received | Net
Amount (not less than $0) | ||||||||||||||||
| Description | ||||||||||||||||||||
| OTC purchased option and OTC swap contracts at market value | $ | 5,922 | $ | (2,307 | ) | $ | (1,834 | ) | $ | (1,469 | )† | $ | 312 | |||||||
| Futures contracts - variation margin receivable | 154 | (154 | ) | — | — | — | ||||||||||||||
| Swap contracts - variation margin receivable | 155 | (99 | ) | — | — | 56 | ||||||||||||||
| Unrealized appreciation on foreign currency contracts | 335 | (131 | ) | — | — | 204 | ||||||||||||||
| Total subject to a master netting or similar arrangement | $ | 6,566 | $ | (2,691 | ) | $ | (1,834 | ) | $ | (1,469 | ) | $ | 572 | |||||||
* Gross amounts are presented here as there are no amounts that are netted within the Statement of Assets and Liabilities.
† An additional $45 of non-cash collateral and $146 of cash collateral was received by the Fund related to derivative assets.
Offsetting of Financial Liabilities and Derivative Liabilities as of October 31, 2014:
| Gross
Amounts* of Liabilities Presented in Statement of Assets and Liabilities | Financial Instruments with Allowable Netting | Non-cash Collateral Pledged | Cash
Collateral Pledged | Net
Amount (not less than $0) | ||||||||||||||||
| Description | ||||||||||||||||||||
| OTC written option and OTC swap contracts at market value | $ | 2,747 | $ | (2,307 | ) | $ | — | $ | (260 | ) | $ | 180 | ||||||||
| Futures contracts - variation margin payable | 269 | (154 | ) | (1,799 | ) | — | — | |||||||||||||
| Swaps contracts - variation margin payable | 99 | (99 | ) | (1,496 | ) | (1,077 | ) | — | ||||||||||||
| Unrealized depreciation on foreign currency contracts | 558 | (131 | ) | — | — | 427 | ||||||||||||||
| Total subject to a master netting or similar arrangement | $ | 3,673 | $ | (2,691 | ) | $ | (3,295 | ) | $ | (1,337 | ) | $ | 607 | |||||||
* Gross amounts are presented here as there are no amounts that are netted within the Statement of Assets and Liabilities.
Certain derivatives held by the Fund, as of October 31, 2014, are not subject to a master netting arrangement and are excluded from the table above.
Principal Risks:
Credit risk depends largely on the perceived financial health of bond issuers. In general, the credit rating is inversely related to the credit risk of the issuer. Higher rated bonds generally are deemed to have less credit risk, while lower or unrated bonds are deemed to have higher risk of default. The share price, yield and total return of a fund that holds securities with higher credit risk may be more volatile than those of a fund that holds bonds with lower credit risk. Similar to credit risk, the Fund may be exposed to counterparty risk, or the risk that an institution or other entity with which the Fund has unsettled or open transactions will default.
The Fund’s investments expose the Fund to various risks including, but not limited to, interest rate, prepayment, extension, foreign currency and equity risks. Interest rate risk is the risk that fixed income securities will decline in value because of changes in interest
| 42 |
| The Hartford Strategic Income Fund |
| Notes to Financial Statements – (continued) |
| October 31, 2014 |
| (000’s Omitted) |
rates. As nominal interest rates rise, the values of certain fixed income securities held by the Fund are likely to decrease. A nominal interest rate can be described as the sum of a real interest rate and an expected inflation rate. Fixed income securities with longer durations tend to be more sensitive to changes in interest rates, usually making them more volatile than securities with shorter durations. Duration is useful primarily as a measure of the sensitivity of a fixed income security’s market price to interest rate (i.e., yield) movements. Senior floating rate interests and securities subject to prepayment and extension risk generally offer less potential for gains when interest rates decline. Rising interest rates may cause prepayments to occur at a slower than expected rate, thereby effectively lengthening the maturity of the security and making the security more sensitive to interest rate changes. Prepayment and extension risk are major risks of mortgage backed securities, senior floating rate interests and certain asset backed securities. For certain asset backed securities, the actual maturity may be less than the stated maturity shown in the Schedule of Investments, if applicable. As a result, the timing of income recognition relating to these securities may vary based upon the actual maturity.
If the Fund invests directly in foreign currencies or in securities that trade in, and receive revenues in, foreign currencies, or in derivatives that provide exposure to foreign currencies, it will be subject to the risk that those currencies will decline in value relative to the base currency (U.S. dollars) of the Fund, or, in the case of hedging positions, that the Fund’s base currency will decline in value relative to the currency being hedged. Currency rates in foreign countries may fluctuate significantly over short periods of time for a number of reasons, including changes in interest rates, intervention (or the failure to intervene) by U.S. or foreign governments, central banks or supranational entities, such as the International Monetary Fund, or by the imposition of currency controls or other political developments in the United States or abroad. As a result, the Fund’s investments in foreign currency denominated securities may reduce the returns of the Fund. The market values of equity securities, such as common stocks and preferred stocks, or equity related investments, such as futures and options, may decline due to general market conditions which are not specifically related to a particular company, such as real or perceived adverse economic conditions, changes in the general outlook for corporate earnings, changes in interest or currency rates or adverse investor sentiment generally. The market value of equity securities may also decline due to factors which affect a particular industry or industries, such as labor shortages or increased production costs and competitive conditions within an industry. Equity securities and equity related investments generally have greater market price volatility than fixed income securities.
Federal Income Taxes:
Federal Income Taxes – For federal income tax purposes, the Fund intends to continue to qualify as a Regulated Investment Company ("RIC") under Subchapter M of the Internal Revenue Code (“IRC”) by distributing substantially all of its taxable net investment income and net realized capital gains to its shareholders and otherwise complying with the requirements of the IRC. The Fund has distributed substantially all of its income and capital gains in prior years, if applicable, and intends to distribute substantially all of its income and capital gains during the calendar year ending December 31, 2014. Accordingly, no provision for federal income or excise taxes has been made in the accompanying financial statements. Distributions from short-term capital gains are treated as ordinary income distributions for federal income tax purposes.
Net Investment Income (Loss), Net Realized Gains (Losses) and Distributions – Net investment income (loss) and net realized gains (losses) may differ for financial statement and tax purposes primarily because of losses deferred due to wash sale adjustments, foreign currency gains and losses, adjustments related to Passive Foreign Investment Companies ("PFICs"), Real Estate Investment Trusts ("REITs"), RICs, certain derivatives and partnerships. The character of distributions made during the year from net investment income or net realized gains may differ from their ultimate characterization for federal income tax purposes. Also, due to the timing of dividend distributions, the fiscal year in which amounts are distributed may differ from the year that the income or realized gains (losses) were recorded by the Fund.
| 43 |
| The Hartford Strategic Income Fund |
| Notes to Financial Statements – (continued) |
| October 31, 2014 |
| (000’s Omitted) |
Distributions and Components of Distributable Earnings – The tax character of distributions paid by the Fund for the periods indicated is as follows (as adjusted for dividends payable, if applicable):
| For the Year Ended October 31, 2014 | For the Year Ended October 31, 2013 | |||||||
| Ordinary Income | $ | 19,322 | $ | 38,153 | ||||
| Long-Term Capital Gains ‡ | — | 7,186 | ||||||
| ‡ | The Fund designates these distributions as long-term capital gain dividends pursuant to IRC Sec. 852(b)(3)(C). |
As of October 31, 2014, the Fund’s components of distributable earnings (deficit) on a tax basis are as follows:
| Amount | ||||
| Undistributed Ordinary Income | $ | 4,056 | ||
| Undistributed Long-Term Capital Gain | 5,095 | |||
| Unrealized Appreciation* | 2,280 | |||
| Total Accumulated Earnings | $ | 11,431 | ||
| * | Differences between book-basis and tax-basis unrealized appreciation (depreciation) may be attributable to the losses deferred due to wash sale adjustments, foreign currency gains and losses, adjustments related to PFICs, REITs, RICs, certain derivatives and partnerships. |
Reclassification of Capital Accounts – The Fund may record reclassifications in its capital accounts. These reclassifications have no impact on the total net assets of the Fund. The reclassifications are a result of permanent differences between U.S. GAAP and tax accounting for such items as foreign currency, PFICs, expiration or utilization of capital loss carryforwards or net operating losses. Adjustments are made to reflect the impact these items have on current and future distributions to shareholders. Therefore, the source of the Fund’s distributions may be shown in the accompanying Statement of Changes in Net Assets as from undistributed net investment income, from accumulated net realized gains on investments or from capital depending on the type of book and tax differences that exist. For the year ended October 31, 2014, the Fund recorded reclassifications to increase (decrease) the accounts listed below:
| Amount | ||||
| Undistributed Net Investment Income (Loss) | $ | (166 | ) | |
| Accumulated Net Realized Gain (Loss) | 166 | |||
Capital Loss Carryforward – On December 22, 2010, the Regulated Investment Company Modernization Act of 2010 (the “Act”) was enacted, which made changes to the capital loss carryforward rules. The changes are effective for taxable years beginning after the date of enactment. Under the Act, funds are permitted to carry forward capital losses for an unlimited period. Additionally, capital loss carryforwards retain their character as either short-term or long-term capital losses rather than being considered all short-term as permitted under prior regulation.
The Fund had no capital loss carryforward for U.S. federal income tax purposes as of October 31, 2014.
During the year ended October 31, 2014, the Fund utilized $1,392 of prior year short term capital loss carryforwards.
Accounting for Uncertainty in Income Taxes – The Fund has adopted financial reporting rules that require the Fund to analyze all open tax years, as defined by the statute of limitations, for all major jurisdictions. Generally, tax authorities can examine all tax returns filed for the last three years. The Fund does not have an examination in progress.
The Fund has reviewed all open tax years and major jurisdictions and concluded that these financial reporting rules had no effect on the Fund’s financial position or results of operations. There is no tax liability resulting from unrecognized tax benefits relating to uncertain income tax positions taken or expected to be taken on the tax return for the fiscal year ended October 31, 2014. The Fund
| 44 |
| The Hartford Strategic Income Fund |
| Notes to Financial Statements – (continued) |
| October 31, 2014 |
| (000’s Omitted) |
is also not aware of any tax positions for which it is reasonably possible that the total amounts of unrecognized tax benefits will significantly change in the next twelve months.
Expenses:
Investment Management Agreement – Hartford Funds Management Company, LLC ("HFMC") serves as the Fund’s investment manager pursuant to an Investment Management Agreement with the Company. HFMC is an indirect wholly owned subsidiary of The Hartford Financial Services Group, Inc. ("The Hartford"). The investment manager has overall investment supervisory responsibility for the Fund. In addition, the investment manager provides administrative personnel, services, equipment, facilities and office space for proper operation of the Fund. HFMC has contracted with Wellington Management Company, LLP ("Wellington Management") under a sub-advisory agreement for the provision of day-to-day investment management services to the Fund in accordance with the Fund’s investment objective and policies. The Fund pays a fee to the investment manager, a portion of which may be used to compensate Wellington Management.
The schedule below reflects the rates of compensation paid to the investment manager for investment management services rendered as of October 31, 2014; the rates are accrued daily and paid monthly:
| Average Daily Net Assets | Annual Fee |
| On first $500 million | 0.550% |
| On next $500 million | 0.500% |
| On next $1.5 billion | 0.475% |
| On next $2.5 billion | 0.465% |
| On next $5 billion | 0.455% |
| Over $10 billion | 0.445% |
Accounting Services Agreement – Pursuant to the Fund Accounting Agreement between HFMC and the Company, on behalf of the Fund, HFMC provides accounting services to the Fund and receives monthly compensation based on the Fund’s average daily net assets at the rates set forth below. The Fund’s accounting services fees are accrued daily and paid monthly.
| Average Daily Net Assets | Annual Fee |
| On first $5 billion | 0.020% |
| On next $5 billion | 0.015% |
| Over $10 billion | 0.010% |
Operating Expenses – Allocable expenses incurred by the Company are allocated to each Fund and allocated to classes within the Fund in proportion to the average daily net assets of the Fund and each class, except where allocation of certain expenses is more fairly made directly to the Fund or to specific classes within a Fund. As of October 31, 2014, HFMC contractually limited the total operating expenses of this Fund, exclusive of taxes, interest expense, brokerage commissions, acquired fund fees and expenses and extraordinary expenses, through February 28, 2015 as follows:
| Class A | Class B | Class C | Class I | Class R3 | Class R4 | Class R5 | Class Y |
| 0.95% | 1.70% | 1.70% | 0.70% | 1.25% | 0.95% | 0.65% | 0.60% |
Fees Paid Indirectly – The Fund's custodian bank has agreed to reduce its fees when the Fund maintains cash on deposit in a non-interest-bearing custody account. For the year ended October 31, 2014, this amount, if any, is included in the Statement of Operations.
| 45 |
| The Hartford Strategic Income Fund |
| Notes to Financial Statements – (continued) |
| October 31, 2014 |
| (000’s Omitted) |
The ratio of expenses to average net assets in the accompanying financial highlights excludes the reduction in expenses related to fees paid indirectly. The annualized expense ratio after waivers for the period listed below reflecting the reduction for fees paid indirectly is as follows:
| Year Ended October 31, 2014 | ||||
| Class A | 0.95 | % | ||
| Class B | 1.70 | |||
| Class C | 1.69 | |||
| Class I | 0.68 | |||
| Class R3 | 1.25 | |||
| Class R4 | 0.95 | |||
| Class R5 | 0.65 | |||
| Class Y | 0.60 | |||
Distribution and Service Plan for Class A, B, C, R3 and R4 Shares – Hartford Funds Distributors, LLC ("HFD"), an indirect wholly owned subsidiary of The Hartford, is the principal underwriter and distributor of the Fund. HFD is engaged in distribution activities, which include marketing and distribution of shares through broker/dealers, financing distribution costs and maintaining financial books and records. For the year ended October 31, 2014, HFD received front-end load sales charges of $330 and contingent deferred sales charges of $11 from the Fund.
The Fund has adopted a Distribution and Service Plan in accordance with Rule 12b-1 of the 1940 Act to compensate the distributor (HFD) for activities intended to result in the sale and distribution of Class A, B, C, R3 and R4 shares and for providing services for shareholders. The Rule 12b-1 plan applicable to Class A shares of the Fund provides for payment of a Rule 12b-1 fee of 0.25% of average daily net assets. Some or all of the fee may be used for shareholder servicing expenses with the remainder used for distribution expenses. Under the Class B Plan, the Fund pays the distributor 1.00% of the average daily net assets of Class B shares that are outstanding for 8 years or less, 0.25% of which is a fee for services provided to existing shareholders with the remainder used for distribution expenses. Some or the entire Rule 12b-1 fee for Class B shares may be remitted to broker/dealers for distribution and/or shareholder account services. After eight years, Class B shares convert to Class A shares. Upon conversion to Class A shares, the Class A plan described above will apply to those shares. Under the Class C Plan, the Fund pays the distributor 1.00% of the average daily net assets of Class C shares outstanding, 0.25% of which is intended as a fee for services provided to existing shareholders with the remainder used for distribution expenses. For Class C shares, some or the entire fee may be remitted to broker/dealers for distribution and/or shareholder account services. Class R3 shares have a distribution fee of 0.50% of average daily net assets and Class R4 shares have a distribution fee of 0.25% of average daily net assets. For Class R3 and R4 shares, some or the entire fee may be remitted to broker/dealers for distribution and/or shareholder account services. The Fund’s 12b-1 fees are accrued daily and paid monthly or at such other intervals as the Board of Directors may determine.
Other Related Party Transactions – Certain officers of the Fund are directors and/or officers of HFMC and/or The Hartford or its subsidiaries. For the year ended October 31, 2014, a portion of the Fund’s Chief Compliance Officer’s compensation was paid by all of the investment companies in the Hartford fund complex. The portion allocated to the Fund, as represented in other expenses on the Statement of Operations, was in the amount of $1. Hartford Administrative Services Company (“HASCO”), an indirect wholly-owned subsidiary of The Hartford, provides transfer agent services to the Fund. HASCO has contractually agreed to reimburse any portion of the transfer agency fees over 0.30% of average daily net assets per fiscal year for each class. Any transfer agency fee reimbursement is determined before considering the contractual operating expense limitation. For providing such services, HASCO is compensated on a per account basis that varies by account type, except with respect to Class Y, for which it is compensated based on average daily net assets. The amount paid to HASCO and any related contractual reimbursement amounts, if applicable, can be found in the Statement of Operations. These fees are accrued daily and paid monthly.
Administrative services fees are paid to HASCO for third-party recordkeeping services that are payable as a percentage of net assets in the amount of up to 0.20%, 0.15% and 0.10% for Classes R3, R4 and R5 shares, respectively. The total administrative services fees are shown on the Statement of Operations. These fees are accrued daily and paid monthly.
| 46 |
| The Hartford Strategic Income Fund |
| Notes to Financial Statements – (continued) |
| October 31, 2014 |
| (000’s Omitted) |
Affiliate Holdings:
As of October 31, 2014, affiliates of The Hartford had ownership of shares in the Fund as follows:
| Percentage of Class | Percentage of Fund | |||||||
| Class R4 | 67 | % | — | %* | ||||
| Class R5 | 100 | % | — | %* | ||||
| Class Y | — | %* | — | %* | ||||
As of October 31, 2014, the Fund's shares were owned in aggregate by affiliated fund of funds. Therefore, the Fund may experience relatively large purchases or redemptions of its shares from these affiliated fund of funds. Affiliated fund of funds owned shares in the Fund as follows:
| Percentage of Fund | ||||
| Class Y | 11 | % | ||
| * | Percentage rounds to zero. |
Investment Transactions:
For the year ended October 31, 2014, the cost of purchases and proceeds from sales of investment securities (excluding short-term investments) were as follows:
| Excluding U.S. Government Obligations | U.S. Government Obligations | Total | ||||||||||
| Cost of Purchases | $ | 1,686,473 | $ | 36,532 | $ | 1,723,005 | ||||||
| Sales Proceeds | 1,857,596 | 36,989 | 1,894,585 | |||||||||
| 47 |
| The Hartford Strategic Income Fund |
| Notes to Financial Statements – (continued) |
| October 31, 2014 |
| (000’s Omitted) |
Capital Share Transactions:
The following information is for the year ended October 31, 2014, and the year ended October 31, 2013:
| For the Year Ended October 31, 2014 | For the Year Ended October 31, 2013 | |||||||||||||||||||||||||||||||
| Shares Sold | Shares
Issued for Reinvested Dividends | Shares
Redeemed | Net
Increase (Decrease) of Shares | Shares Sold | Shares
Issued for Reinvested Dividends | Shares Redeemed | Net
Increase (Decrease) of Shares | |||||||||||||||||||||||||
| Class A | ||||||||||||||||||||||||||||||||
| Shares | 3,354 | 609 | (5,931 | ) | (1,968 | ) | 3,879 | 1,449 | (10,535 | ) | (5,207 | ) | ||||||||||||||||||||
| Amount | $ | 31,282 | $ | 5,658 | $ | (55,070 | ) | $ | (18,130 | ) | $ | 36,360 | $ | 13,521 | $ | (97,180 | ) | $ | (47,299 | ) | ||||||||||||
| Class B | ||||||||||||||||||||||||||||||||
| Shares | 25 | 24 | (367 | ) | (318 | ) | 105 | 68 | (456 | ) | (283 | ) | ||||||||||||||||||||
| Amount | $ | 227 | $ | 225 | $ | (3,405 | ) | $ | (2,953 | ) | $ | 992 | $ | 631 | $ | (4,236 | ) | $ | (2,613 | ) | ||||||||||||
| Class C | ||||||||||||||||||||||||||||||||
| Shares | 1,126 | 368 | (3,728 | ) | (2,234 | ) | 1,857 | 1,100 | (10,469 | ) | (7,512 | ) | ||||||||||||||||||||
| Amount | $ | 10,530 | $ | 3,425 | $ | (34,593 | ) | $ | (20,638 | ) | $ | 17,476 | $ | 10,292 | $ | (96,765 | ) | $ | (68,997 | ) | ||||||||||||
| Class I | ||||||||||||||||||||||||||||||||
| Shares | 2,636 | 149 | (3,070 | ) | (285 | ) | 2,031 | 503 | (7,789 | ) | (5,255 | ) | ||||||||||||||||||||
| Amount | $ | 24,785 | $ | 1,386 | $ | (28,688 | ) | $ | (2,517 | ) | $ | 19,107 | $ | 4,721 | $ | (72,503 | ) | $ | (48,675 | ) | ||||||||||||
| Class R3 | ||||||||||||||||||||||||||||||||
| Shares | 10 | 1 | (14 | ) | (3 | ) | 11 | 1 | (1 | ) | 11 | |||||||||||||||||||||
| Amount | $ | 88 | $ | 8 | $ | (126 | ) | $ | (30 | ) | $ | 108 | $ | 11 | $ | (11 | ) | $ | 108 | |||||||||||||
| Class R4 | ||||||||||||||||||||||||||||||||
| Shares | 1 | 1 | (4 | ) | (2 | ) | 1 | 1 | — | 2 | ||||||||||||||||||||||
| Amount | $ | 16 | $ | 5 | $ | (33 | ) | $ | (12 | ) | $ | 14 | $ | 9 | $ | (5 | ) | $ | 18 | |||||||||||||
| Class R5 | ||||||||||||||||||||||||||||||||
| Shares | — | 1 | — | 1 | — | — | — | — | ||||||||||||||||||||||||
| Amount | $ | — | $ | 5 | $ | — | $ | 5 | $ | — | $ | 8 | $ | — | $ | 8 | ||||||||||||||||
| Class Y | ||||||||||||||||||||||||||||||||
| Shares | 7,243 | 826 | (19,187 | ) | (11,118 | ) | 14,239 | 1,407 | (9,992 | ) | 5,654 | |||||||||||||||||||||
| Amount | $ | 66,921 | $ | 7,645 | $ | (180,142 | ) | $ | (105,576 | ) | $ | 132,191 | $ | 13,059 | $ | (93,191 | ) | $ | 52,059 | |||||||||||||
| Total | ||||||||||||||||||||||||||||||||
| Shares | 14,395 | 1,979 | (32,301 | ) | (15,927 | ) | 22,123 | 4,529 | (39,242 | ) | (12,590 | ) | ||||||||||||||||||||
| Amount | $ | 133,849 | $ | 18,357 | $ | (302,057 | ) | $ | (149,851 | ) | $ | 206,248 | $ | 42,252 | $ | (363,891 | ) | $ | (115,391 | ) | ||||||||||||
The following reflects the conversion of Class B shares into Class A shares (reflected as Class A shares sold) for the year ended October 31, 2014, and the year ended October 31, 2013:
| Shares | Dollars | |||||||
| For the Year Ended October 31, 2014 | 18 | $ | 166 | |||||
| For the Year Ended October 31, 2013 | 31 | $ | 283 | |||||
Line of Credit:
The Fund is one of several Hartford Funds that participate in a $500 million committed revolving line of credit facility. The facility is to be used for temporary or emergency purposes. Under the arrangement, the funds are required to own securities having a market value in excess of 300% of the total bank borrowings. The interest rate on borrowings varies depending on the nature of the loan. The facility also requires a fee to be paid based on the amount of the commitment. This commitment fee is allocated to all the funds participating in the line of credit based on the average net assets of the funds. During the year ended October 31, 2014, the Fund did not have any borrowings under this facility.
Pending Legal Proceedings:
On February 25, 2011, Jennifer L. Kasilag, Louis Mellinger, Judith M. Menendez, Jacqueline M. Robinson, and Linda A. Russell filed a derivative lawsuit against Hartford Investment Financial Services, LLC (“HIFSCO”) (now known as HFD) on behalf of six Hartford retail mutual funds in the United States District Court for the District of New Jersey, alleging that HIFSCO received excessive advisory and distribution fees in violation of its statutory fiduciary duty under Section 36(b) of the 1940 Act when serving as investment manager and principal underwriter, respectively, to the Hartford retail mutual funds. Although this action was purportedly filed on behalf of certain of the
| 48 |
| The Hartford Strategic Income Fund |
| Notes to Financial Statements – (continued) |
| October 31, 2014 |
| (000’s Omitted) |
Hartford Funds, none of the Hartford Funds is itself a defendant to the suit. HIFSCO moved to dismiss and, in September 2011, the motion was granted in part and denied in part, with leave to amend the complaint. In November 2011, plaintiffs filed an amended complaint on behalf of certain Hartford retail mutual funds, The Hartford Global Health Fund (now known as The Hartford Healthcare Fund), The Hartford Conservative Allocation Fund, The Hartford Growth Opportunities Fund, The Hartford Inflation Plus Fund, The Hartford Advisers Fund (now known as The Hartford Balanced Fund), and The Hartford Capital Appreciation Fund. Plaintiffs seek to rescind the investment management agreements and distribution plans between HIFSCO and these funds and to recover the total fees charged thereunder or, in the alternative, to recover any improper compensation HIFSCO received, in addition to lost earnings. HIFSCO filed a partial motion to dismiss the amended complaint and, in December 2012, the court dismissed without prejudice the claims regarding distribution fees and denied the motion with respect to the advisory fees claims. HIFSCO disputes the allegations and intends to defend vigorously.
In March 2014, the plaintiffs filed a new complaint that added as new plaintiffs The Hartford Floating Rate Fund and The Hartford Small Company Fund and named as a defendant HFMC, which assumed the role as investment manager to the funds as of January 2013. HFMC and HIFSCO dispute the allegations and intend to defend vigorously.
No accrual for litigation relating to this matter has been recorded in the financial statements of the Fund because the Fund is not party to the suit.
Indemnifications:
Under the Company's organizational documents, the Company shall indemnify its officers and directors to the full extent required or permitted under Maryland General Corporation Law and the federal securities laws. In addition, the Company, on behalf of the Fund, may enter into contracts that contain a variety of indemnifications. The Company's maximum exposure under these arrangements is unknown. However, as of the date of these financial statements, the Company has not had prior claims or losses pursuant to these contracts and expects the risk of loss to be remote.
Subsequent Events:
At the August 5-6, 2014 meeting, the Board of Directors approved the creation of Class R6 shares for the Fund. Class R6 shares launched on November 7, 2014. In connection with the launch of the Class R6 shares, an updated prospectus, dated November 7, 2014, and Statement of Additional Information, dated March 1, 2014, as amended November 7, 2014, for the Fund were filed with the U.S. Securities and Exchange Commission.
Effective December 1, 2014, pursuant to a sub-transfer agency agreement between HASCO and Boston Financial Data Services, Inc. (“BFDS”), HASCO has delegated certain transfer agent, dividend disbursing agent and shareholder servicing agent functions to BFDS. The costs and expenses of such delegation are borne by HASCO, not by the Fund.
| 49 |
| The Hartford Strategic Income Fund |
| Financial Highlights |
| - Selected Per-Share Data - (A) | - Ratios and Supplemental Data - | |||||||||||||||||||||||||||||||||||||||||||||||||||
| Class | Net
Asset Value at Beginning of Period | Net
Investment Income (Loss) | Net
Realized and Unrealized Gain (Loss) on Invest- ments | Total
from Investment Operations | Dividends
from Net Investment Income | Distribu- tions from Realized Capital Gains | Total
Dividends and Distributions | Net
Asset Value at End of Period | Total
Return(B) | Net
Assets at End of Period (000's) | Ratio
of Expenses to Average Net Assets Before Adjust- ments(C) | Ratio
of Expenses to Average Net Assets After Adjust- ments(C) | Ratio
of Net Investment Income (Loss) to Average Net Assets | |||||||||||||||||||||||||||||||||||||||
| For the Year Ended October 31, 2014 | ||||||||||||||||||||||||||||||||||||||||||||||||||||
| A | $ | 9.21 | $ | 0.36 | $ | 0.10 | $ | 0.46 | $ | (0.37 | ) | $ | – | $ | (0.37 | ) | $ | 9.30 | 5.06 | % | $ | 144,172 | 1.01 | % | 0.95 | % | 3.82 | % | ||||||||||||||||||||||||
| B | 9.21 | 0.29 | 0.10 | 0.39 | (0.30 | ) | – | (0.30 | ) | 9.30 | 4.25 | 6,367 | 1.82 | 1.70 | 3.10 | |||||||||||||||||||||||||||||||||||||
| C | 9.23 | 0.29 | 0.10 | 0.39 | (0.30 | ) | – | (0.30 | ) | 9.32 | 4.26 | 109,960 | 1.72 | 1.69 | 3.08 | |||||||||||||||||||||||||||||||||||||
| I | 9.24 | 0.38 | 0.10 | 0.48 | (0.39 | ) | – | (0.39 | ) | 9.33 | 5.32 | 48,809 | 0.71 | 0.68 | 4.09 | |||||||||||||||||||||||||||||||||||||
| R3 | 9.21 | 0.33 | 0.09 | 0.42 | (0.34 | ) | – | (0.34 | ) | 9.29 | 4.64 | 213 | 1.40 | 1.25 | 3.54 | |||||||||||||||||||||||||||||||||||||
| R4 | 9.21 | 0.36 | 0.10 | 0.46 | (0.37 | ) | – | (0.37 | ) | 9.30 | 5.06 | 131 | 1.05 | 0.95 | 3.83 | |||||||||||||||||||||||||||||||||||||
| R5 | 9.21 | 0.38 | 0.11 | 0.49 | (0.40 | ) | – | (0.40 | ) | 9.30 | 5.38 | 120 | 0.73 | 0.65 | 4.10 | |||||||||||||||||||||||||||||||||||||
| Y | 9.20 | 0.39 | 0.11 | 0.50 | (0.40 | ) | – | (0.40 | ) | 9.30 | 5.55 | 113,356 | 0.63 | 0.60 | 4.25 | |||||||||||||||||||||||||||||||||||||
| For the Year Ended October 31, 2013 | ||||||||||||||||||||||||||||||||||||||||||||||||||||
| A | $ | 9.70 | $ | 0.36 | $ | (0.21 | ) | $ | 0.15 | $ | (0.36 | ) | $ | (0.28 | ) | $ | (0.64 | ) | $ | 9.21 | 1.67 | % | $ | 160,916 | 0.99 | % | 0.95 | % | 3.83 | % | ||||||||||||||||||||||
| B | 9.70 | 0.29 | (0.21 | ) | 0.08 | (0.29 | ) | (0.28 | ) | (0.57 | ) | 9.21 | 0.91 | 9,233 | 1.79 | 1.70 | 3.09 | |||||||||||||||||||||||||||||||||||
| C | 9.72 | 0.29 | (0.21 | ) | 0.08 | (0.29 | ) | (0.28 | ) | (0.57 | ) | 9.23 | 0.90 | 129,507 | 1.69 | 1.68 | 3.07 | |||||||||||||||||||||||||||||||||||
| I | 9.73 | 0.37 | (0.19 | ) | 0.18 | (0.39 | ) | (0.28 | ) | (0.67 | ) | 9.24 | 1.93 | 50,963 | 0.70 | 0.69 | 4.00 | |||||||||||||||||||||||||||||||||||
| R3 | 9.70 | 0.35 | (0.22 | ) | 0.13 | (0.34 | ) | (0.28 | ) | (0.62 | ) | 9.21 | 1.40 | 242 | 1.39 | 1.25 | 3.74 | |||||||||||||||||||||||||||||||||||
| R4 | 9.70 | 0.36 | (0.21 | ) | 0.15 | (0.36 | ) | (0.28 | ) | (0.64 | ) | 9.21 | 1.68 | 143 | 1.03 | 0.95 | 3.91 | |||||||||||||||||||||||||||||||||||
| R5 | 9.70 | 0.39 | (0.21 | ) | 0.18 | (0.39 | ) | (0.28 | ) | (0.67 | ) | 9.21 | 1.98 | 114 | 0.71 | 0.65 | 4.20 | |||||||||||||||||||||||||||||||||||
| Y | 9.69 | 0.40 | (0.21 | ) | 0.19 | (0.40 | ) | (0.28 | ) | (0.68 | ) | 9.20 | 2.04 | 214,550 | 0.61 | 0.60 | 4.30 | |||||||||||||||||||||||||||||||||||
| For the Year Ended October 31, 2012 | ||||||||||||||||||||||||||||||||||||||||||||||||||||
| A | $ | 9.20 | $ | 0.37 | $ | 0.51 | $ | 0.88 | $ | (0.35 | ) | $ | (0.03 | ) | $ | (0.38 | ) | $ | 9.70 | 9.80 | % | $ | 219,909 | 0.98 | % | 0.96 | % | 3.90 | % | |||||||||||||||||||||||
| B | 9.20 | 0.30 | 0.51 | 0.81 | (0.28 | ) | (0.03 | ) | (0.31 | ) | 9.70 | 8.96 | 12,461 | 1.78 | 1.72 | 3.17 | ||||||||||||||||||||||||||||||||||||
| C | 9.21 | 0.30 | 0.52 | 0.82 | (0.28 | ) | (0.03 | ) | (0.31 | ) | 9.72 | 9.11 | 209,271 | 1.69 | 1.69 | 3.17 | ||||||||||||||||||||||||||||||||||||
| I | 9.22 | 0.39 | 0.53 | 0.92 | (0.38 | ) | (0.03 | ) | (0.41 | ) | 9.73 | 10.18 | 104,759 | 0.70 | 0.70 | 4.11 | ||||||||||||||||||||||||||||||||||||
| R3 | 9.20 | 0.33 | 0.52 | 0.85 | (0.32 | ) | (0.03 | ) | (0.35 | ) | 9.70 | 9.47 | 141 | 1.34 | 1.27 | 3.56 | ||||||||||||||||||||||||||||||||||||
| R4 | 9.20 | 0.36 | 0.52 | 0.88 | (0.35 | ) | (0.03 | ) | (0.38 | ) | 9.70 | 9.79 | 132 | 1.02 | 0.97 | 3.88 | ||||||||||||||||||||||||||||||||||||
| R5 | 9.20 | 0.39 | 0.52 | 0.91 | (0.38 | ) | (0.03 | ) | (0.41 | ) | 9.70 | 10.12 | 112 | 0.71 | 0.67 | 4.20 | ||||||||||||||||||||||||||||||||||||
| Y | 9.20 | 0.36 | 0.54 | 0.90 | (0.38 | ) | (0.03 | ) | (0.41 | ) | 9.69 | 10.08 | 171,127 | 0.60 | 0.60 | 3.82 | ||||||||||||||||||||||||||||||||||||
| For the Year Ended October 31, 2011 (D) | ||||||||||||||||||||||||||||||||||||||||||||||||||||
| A | $ | 9.22 | $ | 0.48 | $ | (0.01 | ) | $ | 0.47 | $ | (0.49 | ) | $ | – | $ | (0.49 | ) | $ | 9.20 | 5.20 | % | $ | 191,353 | 0.98 | % | 0.98 | % | 5.27 | % | |||||||||||||||||||||||
| B | 9.21 | 0.41 | – | 0.41 | (0.42 | ) | – | (0.42 | ) | 9.20 | 4.51 | 13,259 | 1.78 | 1.75 | 4.52 | |||||||||||||||||||||||||||||||||||||
| C | 9.23 | 0.42 | (0.02 | ) | 0.40 | (0.42 | ) | – | (0.42 | ) | 9.21 | 4.43 | 183,209 | 1.71 | 1.71 | 4.50 | ||||||||||||||||||||||||||||||||||||
| I | 9.24 | 0.51 | (0.02 | ) | 0.49 | (0.51 | ) | – | (0.51 | ) | 9.22 | 5.47 | 70,365 | 0.71 | 0.71 | 5.47 | ||||||||||||||||||||||||||||||||||||
| R3(E) | 9.10 | 0.04 | 0.08 | 0.12 | (0.02 | ) | – | (0.02 | ) | 9.20 | 1.34 | (F) | 101 | 1.33 | (G) | 1.30 | (G) | 5.14 | (G) | |||||||||||||||||||||||||||||||||
| R4(E) | 9.10 | 0.04 | 0.09 | 0.13 | (0.03 | ) | – | (0.03 | ) | 9.20 | 1.37 | (F) | 101 | 1.03 | (G) | 1.00 | (G) | 5.43 | (G) | |||||||||||||||||||||||||||||||||
| R5(E) | 9.10 | 0.04 | 0.09 | 0.13 | (0.03 | ) | – | (0.03 | ) | 9.20 | 1.40 | (F) | 101 | 0.73 | (G) | 0.70 | (G) | 5.72 | (G) | |||||||||||||||||||||||||||||||||
| Y | 9.21 | 0.51 | – | 0.51 | (0.52 | ) | – | (0.52 | ) | 9.20 | 5.69 | 6,885 | 0.63 | 0.63 | 5.50 | |||||||||||||||||||||||||||||||||||||
See Portfolio Turnover information on the next page.
| 50 |
| The Hartford Strategic Income Fund |
| Financial Highlights – (continued) |
| - Selected Per-Share Data - (A) | - Ratios and Supplemental Data - | |||||||||||||||||||||||||||||||||||||||||||||||||||
| Class | Net
Asset Value at Beginning of Period | Net
Investment Income (Loss) | Net
Realized and Unrealized Gain (Loss) on Invest- ments | Total
from Investment Operations | Dividends
from Net Investment Income | Distribu- tions from Realized Capital Gains | Total
Dividends and Distributions | Net
Asset Value at End of Period | Total
Return(B) | Net
Assets at End of Period (000's) | Ratio
of Expenses to Average Net Assets Before Adjust- ments(C) | Ratio
of Expenses to Average Net Assets After Adjust- ments(C) | Ratio
of Net Investment Income (Loss) to Average Net Assets | |||||||||||||||||||||||||||||||||||||||
| For the Year Ended October 31, 2010 (D) | ||||||||||||||||||||||||||||||||||||||||||||||||||||
| A | $ | 8.69 | $ | 0.56 | $ | 0.51 | $ | 1.07 | $ | (0.54 | ) | $ | – | $ | (0.54 | ) | $ | 9.22 | 12.74 | % | $ | 196,945 | 0.97 | % | 0.97 | % | 6.26 | % | ||||||||||||||||||||||||
| B | 8.69 | 0.49 | 0.50 | 0.99 | (0.47 | ) | – | (0.47 | ) | 9.21 | 11.72 | 15,110 | 1.77 | 1.77 | 5.48 | |||||||||||||||||||||||||||||||||||||
| C | 8.70 | 0.49 | 0.52 | 1.01 | (0.48 | ) | – | (0.48 | ) | 9.23 | 11.89 | 155,499 | 1.70 | 1.70 | 5.53 | |||||||||||||||||||||||||||||||||||||
| I | 8.71 | 0.58 | 0.51 | 1.09 | (0.56 | ) | – | (0.56 | ) | 9.24 | 12.98 | 60,203 | 0.71 | 0.71 | 6.53 | |||||||||||||||||||||||||||||||||||||
| Y | 8.69 | 0.60 | 0.49 | 1.09 | (0.57 | ) | – | (0.57 | ) | 9.21 | 12.99 | 8,272 | 0.62 | 0.62 | 6.70 | |||||||||||||||||||||||||||||||||||||
| (A) | Information presented relates to a share outstanding throughout the indicated period. Net investment income (loss) per share amounts are calculated based on average shares outstanding unless otherwise noted. |
| (B) | Assumes initial investment at net asset value at the beginning of each period, reinvestment of all distributions, the complete redemption of the investment at net asset value at the end of each period and no sales charge. Total return would be reduced if sales charges were taken into account. |
| (C) | Adjustments include waivers and reimbursements, if applicable. Ratios do not include fees paid indirectly (see Expenses in the accompanying Notes to Financial Statements). |
| (D) | Net investment income (loss) per share amounts have been calculated using the SEC method. |
| (E) | Commenced operations on September 30, 2011. |
| (F) | Not annualized. |
| (G) | Annualized. |
| Portfolio Turnover Rate for All Share Classes | ||||
| For the Year Ended October 31, 2014 | 71 | % | ||
| For the Year Ended October 31, 2013 | 55 | |||
| For the Year Ended October 31, 2012 | 121 | |||
| For the Year Ended October 31, 2011 | 156 | |||
| For the Year Ended October 31, 2010 | 158 | |||
| 51 |
| Report of Independent Registered Public Accounting Firm |
| The Board of Directors and Shareholders of |
| The Hartford Mutual Funds, Inc. |
We have audited the accompanying statement of assets and liabilities, including the schedule of investments, of The Hartford Strategic Income Fund (one of the portfolios constituting The Hartford Mutual Funds, Inc. (the Funds)) as of October 31, 2014, and the related statement of operations for the year then ended, the statements of changes in net assets for each of the two years in the period then ended, and the financial highlights for the periods indicated therein. These financial statements and financial highlights are the responsibility of the Funds’ management. Our responsibility is to express an opinion on these financial statements and financial highlights based on our audits.
We conducted our audits in accordance with the standards of the Public Company Accounting Oversight Board (United States). Those standards require that we plan and perform the audit to obtain reasonable assurance about whether the financial statements and financial highlights are free of material misstatement. We were not engaged to perform an audit of the Funds’ internal control over financial reporting. Our audits included consideration of internal control over financial reporting as a basis for designing audit procedures that are appropriate in the circumstances, but not for the purpose of expressing an opinion on the effectiveness of the Funds’ internal control over financial reporting. Accordingly, we express no such opinion. An audit also includes examining, on a test basis, evidence supporting the amounts and disclosures in the financial statements and financial highlights, assessing the accounting principles used and significant estimates made by management, and evaluating the overall financial statement presentation. Our procedures included confirmation of securities owned as of October 31, 2014, by correspondence with the custodian, agent banks and brokers or by other appropriate auditing procedures where replies from agent banks and brokers were not received. We believe that our audits provide a reasonable basis for our opinion.
In our opinion, the financial statements and financial highlights referred to above present fairly, in all material respects, the financial position of The Hartford Strategic Income Fund of The Hartford Mutual Funds, Inc. at October 31, 2014, the results of its operations for the year then ended, the changes in its net assets for each of the two years in the period then ended, and the financial highlights for the periods indicated therein, in conformity with U.S. generally accepted accounting principles.
|
Minneapolis, Minnesota
December 18, 2014
| 52 |
| The Hartford Strategic Income Fund |
| Directors and Officers (Unaudited) |
The Board of Directors of the Company (the "Directors") appoints officers who are responsible for the day-to-day operations of the Fund and who execute policies formulated by the Directors. Each Director serves until his or her death, resignation, or retirement or until the next annual meeting of shareholders is held or until his or her successor is elected and qualifies.
Directors and officers who are employed by or who have a financial interest in The Hartford Financial Services Group, Inc. ("The Hartford") are considered “interested” persons of the Fund pursuant to the 1940 Act. Each officer and two of the Company's Directors, as noted in the chart below, are “interested” persons of the Fund. Each Director serves as a director for The Hartford Mutual Funds, Inc., The Hartford Mutual Funds II, Inc., Hartford Series Fund, Inc., and Hartford HLS Series Fund II, Inc., and as a trustee for The Hartford Alternative Strategies Fund, which, as of October 31, 2014, collectively consist of 66 funds. Correspondence may be sent to Directors and officers c/o Hartford Funds, 5 Radnor Corporate Center, Suite 300, 100 Matsonford Road, Radnor, Pennsylvania 19087, except that correspondence to Mr. Annoni, Mr. Dressen and Ms. Quade may be sent to 500 Bielenberg Drive, Suite 500, Woodbury, Minnesota 55125.
The table below sets forth, for each Director and officer, his or her name, year of birth, current position with the Company and date first elected or appointed to The Hartford Mutual Funds, Inc. ("MF") and The Hartford Mutual Funds II, Inc. ("MF2"), principal occupation, and, for Directors, other directorships held. The Fund’s Statement of Additional Information contains further information on the Directors and is available free of charge by calling 1-888-843-7824 or writing to: Hartford Funds, P.O. Box 55022, Boston, MA 02205-5022.
Information on the aggregate remuneration paid to the directors of the Company can be found in the Statement of Operations herein. The Fund pays to The Hartford a portion of the Chief Compliance Officer’s compensation, but does not pay salaries or compensation to any of its other officers or Directors who are employed by The Hartford.
Non-Interested Directors
Hilary E. Ackermann (1956) Director since September 23, 2014
Ms. Ackermann served as Chief Risk Officer at Goldman Sachs Bank USA from October 2008 to November 2011 and serves as a Director of Dynegy, Inc., an independent power company, from October 2012 to present.
Lynn S. Birdsong (1946) Director since 2003, Chairman of the Investment Committee since 2014
Mr. Birdsong is a private investor. Mr. Birdsong currently serves as a Director of the Sovereign High Yield Investment Company (April 2010 to current). Mr. Birdsong currently serves as an Independent Director of Nomura Partners Funds, Inc. (formerly, The Japan Fund) (April 2003 to current). From 2003 to March 2005, Mr. Birdsong was an Independent Director of the Atlantic Whitehall Funds. From 1979 to 2002, Mr. Birdsong was a Managing Director of Zurich Scudder Investments, an investment management firm. During his employment with Scudder, Mr. Birdsong was an Interested Director of The Japan Fund. From January 1981 through December 2013, Mr. Birdsong was a partner in Birdsong Company, an advertising specialty firm.
Robert M. Gavin, Jr. (1940) Director since 2002 (MF) and 1986 (MF2), Chairman of the Board for each since 2004
Dr. Gavin is an educational consultant. Prior to September 1, 2001, he was President of Cranbrook Education Community and prior to July 1996, he was President of Macalester College, St. Paul, Minnesota.
Duane E. Hill (1945) Director since 2001 (MF) and 2002 (MF2), Chairman of the Nominating Committee since 2003
Mr. Hill is a Partner of TSG Ventures L.P., a private equity investment company. Mr. Hill is a former partner of TSG Capital Group, a private equity investment firm that served as sponsor and lead investor in leveraged buyouts of middle market companies.
Sandra S. Jaffee (1941) Director since 2005
Ms. Jaffee is the founder and Chief Executive Officer of a private company, Homeworks Concierge, LLC, which provides residential property management services in Westchester County, New York (January 2012 to present). Ms. Jaffee served as Chairman (2008 to 2009) and Chief Executive Officer of Fortent (formerly Searchspace Group), a leading provider of compliance/regulatory technology to financial institutions from August 2005 to August 2009. From August 2004 to August 2005, Ms. Jaffee served as an Entrepreneur in Residence with Warburg Pincus, a private equity firm. Prior to joining Warburg Pincus, Ms. Jaffee served as Executive Vice President at Citigroup, from September 1995 to July 2004, where she was President and Chief Executive Officer of Citibank’s Global Securities Services (1995 to 2003). Ms. Jaffee currently serves as a member of the Board of Directors of Broadridge Financial Solutions as well as a Trustee of Muhlenberg College.
| 53 |
| The Hartford Strategic Income Fund |
| Directors and Officers (Unaudited) – (continued) |
William P. Johnston (1944) Director since 2005, Chairman of the Compliance Committee since 2005
In June 2006, Mr. Johnston was appointed as Senior Advisor to The Carlyle Group, a global private equity and other alternative asset investment firm and currently serves as an Operating Executive. In July 2006, Mr. Johnston was elected to the Board of Directors of MultiPlan, Inc. and served as a Director (July 2006 to August 2010). In August 2007, Mr. Johnston was elected to the Board of Directors of LifeCare Holdings, Inc. and served as a Director (August 2007 to June 2013). In February 2008, Mr. Johnston was elected to the Board of Directors of HCR-ManorCare, Inc. In May 2006, Mr. Johnston was elected to the Supervisory Board of Fresenius Medical Care AG & Co. KGaA, after its acquisition of Renal Care Group, Inc. in March 2006. Mr. Johnston joined Renal Care Group in November 2002 as a member of the Board of Directors and served as Chairman of the Board from March 2003 through March 2006. From 2002 through 2013, Mr. Johnston served as a Board member of the Georgia O’Keefe Museum. From September 1987 to December 2002, Mr. Johnston was with Equitable Securities Corporation (and its successors, SunTrust Equitable Securities and SunTrust Robinson Humphrey) serving in various investment banking and managerial positions, including Managing Director and Head of Investment Banking, Chief Executive Officer and Vice Chairman.
Phillip O. Peterson (1944) Director since 2002 (MF) and 2000 (MF2), Chairman of the Audit Committee since 2002
Mr. Peterson is a mutual fund industry consultant. He was a partner of KPMG LLP (an accounting firm) until July 1999. Mr. Peterson joined William Blair Funds in February 2007 as a member of the Board of Trustees. From February 2012 to February 2014, Mr. Peterson served as a Trustee of Symetra Variable Mutual Funds. From January 2004 to April 2005, Mr. Peterson served as Independent President of the Strong Mutual Funds.
Lemma W. Senbet (1946) Director since 2005
Dr. Senbet is the William E. Mayer Chair Professor of Finance and Founding Director, Center for Financial Policy, at the University of Maryland, Robert H. Smith School of Business. He was chair of the Finance Department of the University of Maryland, Robert H. Smith School of Business from 1998 to 2006. Since June 2013, he has been on leave from the University to serve as Executive Director of African Economic Research Consortium which focuses on economic policy research and training. Previously, he was a chaired professor of finance at the University of Wisconsin-Madison. Also, he was a Director of the Fortis Funds from March 2000 to July 2002. Dr. Senbet served as Director of the American Finance Association and President of the Western Finance Association. In 2006, Dr. Senbet was inducted Fellow of Financial Management Association International for his career-long distinguished scholarship and professional service.
Interested Directors and Officers
James E. Davey (1964) Director since 2012, President and Chief Executive Officer since 2010
Mr. Davey serves as Executive Vice President of Hartford Life Insurance Company (“HLIC”) and The Hartford. Additionally, Mr. Davey serves as Chairman of the Board, Manager and Senior Managing Director of Hartford Funds Distributors, LLC (“HFD”). He also currently serves as Director, Chairman of the Board, President and Senior Managing Director of Hartford Administrative Services Company (“HASCO”). Mr. Davey also serves as Manager, Chairman of the Board and Senior Managing Director for Hartford Funds Management Company, LLC (“HFMC”) and Director, Chairman of the Board and Senior Managing Director for Hartford Funds Management Group, Inc. ("HFMG"). Mr. Davey has served in various positions within The Hartford and its subsidiaries in connection with the operation of the Hartford Funds. Mr. Davey joined The Hartford in 2002.
Lowndes A. Smith* (1939) Director since 1996 (MF) and 2002 (MF2)
Mr. Smith served as Vice Chairman of The Hartford from February 1997 to January 2002, as President and Chief Executive Officer of Hartford Life, Inc. from February 1997 to January 2002, and as President and Chief Operating Officer of The Hartford Life Insurance Companies from January 1989 to January 2002. Mr. Smith serves as a Director of White Mountains Insurance Group Ltd. (October 2003 to current); One Beacon Insurance (October 2006 to current); Symetra Financial (August 2007 to current) and is a Managing Director of Whittington Gray Associates (January 2007 to current).
* Mr. Smith resigned as a Director of MF, MF2, Hartford Series Fund, Inc. and Hartford HLS Series Fund II, Inc. and as a Trustee of The Hartford Alternative Strategies Fund effective September 17, 2014.
Other Officers
Mark A. Annoni (1964) Vice President, Controller and Treasurer since 2012
Mr. Annoni currently serves as the Assistant Vice President of HLIC (February 2004 to present) and Senior Vice President of HFMG (December 2013 to present). Mr. Annoni has served in various positions within The Hartford and its subsidiaries in connection with the operation of the Hartford Funds. Mr. Annoni joined The Hartford in 2001.
| 54 |
| The Hartford Strategic Income Fund |
| Directors and Officers (Unaudited) – (continued) |
Michael R. Dressen (1963) AML Compliance Officer since 2011
Mr. Dressen currently serves as Assistant Vice President of HLIC. He also serves as Chief Compliance Officer and AML Compliance Officer of HASCO and as AML Officer of HFD. Mr. Dressen has served in various positions within The Hartford and its subsidiaries in connection with the operation of the Hartford Funds.
Edward P. Macdonald (1967) Vice President, Secretary and Chief Legal Officer since 2005
Mr. Macdonald currently serves as Assistant Secretary, Executive Vice President and Deputy General Counsel of HFD, HASCO, HFMC and HFMG. He also serves as Vice President of HLIC. Mr. Macdonald has served in various positions within The Hartford and its subsidiaries in connection with the operation of the Hartford Funds. Mr. Macdonald joined The Hartford in 2005.
Joseph G. Melcher (1973) Vice President and Chief Compliance Officer since 2013
Mr. Melcher currently serves as Executive Vice President of HFD, HFMG and HASCO. Mr. Melcher also currently serves as Executive Vice President and Chief Compliance Officer of HFMC. Mr. Melcher has served in various positions within The Hartford and its subsidiaries in connection with the operation of the Hartford Funds since joining The Hartford in 2012. Prior to joining The Hartford, Mr. Melcher worked at Touchstone Investments, a member of the Western & Southern Financial Group, where he held the position of Vice President and Chief Compliance Officer from 2010 through 2012 and Assistant Vice President, Compliance from 2005 to 2010.
Vernon J. Meyer (1964) Vice President since 2006
Mr. Meyer currently serves as Senior Vice President of HLIC. He also currently serves as Managing Director and Chief Investment Officer of HFMC and Managing Director of HFMG. Mr. Meyer has served in various positions within The Hartford and its subsidiaries in connection with the operation of the Hartford Funds. Mr. Meyer joined The Hartford in 2004.
Laura S. Quade (1969) Vice President since 2012
Ms. Quade currently serves as Vice President of HASCO, HFD and HFMG. She is the Head of Operations of HASCO and formerly served as Director, Enterprise Operations of HLIC. Ms. Quade has served in various positions within The Hartford and its subsidiaries in connection with the operation of the Hartford Funds. Ms. Quade joined The Hartford in 2001.
Martin A. Swanson** (1962) Vice President since 2010
Mr. Swanson currently serves as Vice President of HLIC. Mr. Swanson also serves as Managing Director, Chief Marketing Officer and Principal of HFD and Managing Director of HFMG. Mr. Swanson has served in various positions within The Hartford and its subsidiaries in connection with the operation of the Hartford Funds.
** Mr. Swanson resigned as an officer effective November 6, 2014.
HOW TO OBTAIN A COPY OF THE FUND’S PROXY VOTING POLICIES AND VOTING RECORDS (UNAUDITED)
A description of the policies and procedures that the Fund uses to determine how to vote proxies relating to portfolio securities and information about how the Fund voted proxies relating to portfolio securities during the most recent twelve-month period ended June 30 are available (1) without charge, upon request, by calling 888-843-7824 and (2) on the SEC’s website at http://www.sec.gov.
QUARTERLY PORTFOLIO HOLDINGS INFORMATION (UNAUDITED)
The Fund files a complete schedule of portfolio holdings with the SEC for the first and third quarters of each fiscal year on Form N-Q. The Fund’s Forms N-Q are available (1) without charge, upon request, by calling 888-843-7824 and (2) on the SEC’s website at http://www.sec.gov. The Form N-Q may be reviewed and copied at the SEC’s Public Reference Room in Washington, DC. Information on the operation of the Public Reference Room may be obtained by calling 1-800-SEC-0330.
| 55 |
| The Hartford Strategic Income Fund |
| Federal Tax Information (Unaudited) |
For the fiscal year ended October 31, 2014, there is no further federal tax information required for this Fund.
| 56 |
| The Hartford Strategic Income Fund |
| Expense Example (Unaudited) |
Your Fund's Expenses
As a shareholder of the Fund, you incur two types of costs: (1) transaction costs, including sales charges (loads) on purchase payments, if any, and contingent deferred sales charges (CDSC), if any, and (2) ongoing costs, including investment management fees, distribution and/or service (12b-1) fees, if any, and other fund expenses. This example is intended to help you understand your ongoing costs (in dollars) of investing in the Fund and to compare these costs with the ongoing costs of investing in other mutual funds. The example is based on an investment of $1,000 invested at the beginning of the period and held for the entire period of April 30, 2014 through October 31, 2014.
Actual Expenses
The first set of columns of the table below provides information about actual account values and actual expenses. You may use the information in this column, together with the amount you invested, to estimate the expenses that you paid over the period. Simply divide your account value by $1,000 (for example, an $8,600 account value divided by $1,000 = 8.6), then multiply the result by the number in the line under the heading entitled “Expenses Paid During Period” to estimate the expenses you paid on your account during this period.
Hypothetical Example for Comparison Purposes
The second set of columns of the table below provides information about hypothetical account values and hypothetical expenses based on the Fund's actual expense ratio and an assumed rate of return of 5% per year before expenses, which is not the Fund's actual return. The hypothetical account values and expenses may not be used to estimate the actual ending account balance or expenses you paid for the period. You may use this information to compare the ongoing costs of investing in the Fund and other funds. To do so, compare this 5% hypothetical example with the 5% hypothetical examples that appear in the shareholder reports of the other funds.
Please note that the expenses shown in the table are meant to highlight your ongoing costs only and do not reflect any transactional costs, such as sales charges (loads) and CDSC. Therefore, the second set of columns of the table is useful in comparing ongoing costs only, and will not help you determine the relative total costs of owning different funds. In addition, if these transactional costs were included, your costs would be higher. Expenses are equal to the Fund's annualized expense ratios multiplied by average account value over the period, multiplied by 184/365 (to reflect the one-half year period).
| Actual return | Hypothetical (5% return before expenses) | |||||||||||||||||||||||||||||||||
| Beginning Account Value April 30, 2014 |
Ending
Account Value October 31, 2014 |
Expenses
paid during the period April 30, 2014 through October 31, 2014 |
Beginning Account Value April 30, 2014 |
Ending
Account Value October 31, 2014 |
Expenses
paid during the period April 30, 2014 through October 31, 2014 |
Annualized expense ratio |
Days in the current 1/2 year |
Days in the full year |
||||||||||||||||||||||||||
| Class A | $ | 1,000.00 | $ | 1,019.30 | $ | 4.85 | $ | 1,000.00 | $ | 1,020.40 | $ | 4.85 | 0.95 | % | 184 | 365 | ||||||||||||||||||
| Class B | $ | 1,000.00 | $ | 1,015.40 | $ | 8.65 | $ | 1,000.00 | $ | 1,016.62 | $ | 8.65 | 1.70 | 184 | 365 | |||||||||||||||||||
| Class C | $ | 1,000.00 | $ | 1,015.50 | $ | 8.59 | $ | 1,000.00 | $ | 1,016.69 | $ | 8.59 | 1.69 | 184 | 365 | |||||||||||||||||||
| Class I | $ | 1,000.00 | $ | 1,020.60 | $ | 3.46 | $ | 1,000.00 | $ | 1,021.78 | $ | 3.47 | 0.68 | 184 | 365 | |||||||||||||||||||
| Class R3 | $ | 1,000.00 | $ | 1,017.80 | $ | 6.37 | $ | 1,000.00 | $ | 1,018.89 | $ | 6.38 | 1.25 | 184 | 365 | |||||||||||||||||||
| Class R4 | $ | 1,000.00 | $ | 1,019.30 | $ | 4.85 | $ | 1,000.00 | $ | 1,020.40 | $ | 4.85 | 0.95 | 184 | 365 | |||||||||||||||||||
| Class R5 | $ | 1,000.00 | $ | 1,020.90 | $ | 3.32 | $ | 1,000.00 | $ | 1,021.92 | $ | 3.33 | 0.65 | 184 | 365 | |||||||||||||||||||
| Class Y | $ | 1,000.00 | $ | 1,022.20 | $ | 3.07 | $ | 1,000.00 | $ | 1,022.17 | $ | 3.07 | 0.60 | 184 | 365 | |||||||||||||||||||
| 57 |
| The Hartford Strategic Income Fund |
| Approval of Investment Management and Investment Sub-Advisory Agreements (Unaudited) |
Section 15(c) of the Investment Company Act of 1940, as amended (the “1940 Act”), requires that each mutual fund’s board of directors, including a majority of those directors who are not “interested persons” of the mutual fund, as defined in the 1940 Act (the “Independent Directors”), annually review and consider the continuation of the mutual fund’s investment advisory and sub-advisory agreements. At its meeting held on August 5-6, 2014, the Board of Directors (the “Board”) of The Hartford Mutual Funds, Inc., including each of the Independent Directors, unanimously voted to approve the continuation of the investment management agreement for The Hartford Strategic Income Fund (the “Fund”) with Hartford Funds Management Company, LLC (“HFMC”) and the continuation of the investment sub-advisory agreement between HFMC and the Fund’s sub-adviser, Wellington Management Company, LLP (the “Sub-adviser,” and together with HFMC, the “Advisers”) (collectively, the “Agreements”).
In the months preceding the August 5-6, 2014 meeting, the Board requested, received and reviewed written responses from the Advisers to questions posed to them on behalf of the Independent Directors and supporting materials relating to those questions and responses. The Board considered information furnished to the Board at its meetings throughout the year, as well as information specifically prepared in connection with the annual approval of the Agreements at the Board’s meetings held on June 17-18, 2014 and August 5-6, 2014. Information provided to the Board at its meetings throughout the year included, among other things, reports on Fund performance, legal and compliance matters, sales and marketing activity, shareholder services, and the other services provided to the Fund by the Advisers and their affiliates. The Board also received in-person presentations by Fund officers and representatives of HFMC at the Board’s meetings on June 17-18, 2014 and August 5-6, 2014 concerning the Agreements.
The Independent Directors, advised by independent legal counsel, engaged service providers to assist them with evaluating the Agreements with respect to the Fund. Lipper Inc. (“Lipper”), an independent provider of investment company data, was retained to provide the Board with reports on how the Fund’s contractual management fees, actual management fees, other non-management fees, overall expense ratios and investment performance compared to those of mutual funds with similar investment objectives. The Independent Directors also engaged an independent financial services consultant (the “Consultant”) to assist them in evaluating the Fund’s management fees, sub-advisory fees, other non-management fees, overall expense ratios and investment performance. In addition, the Consultant reviewed the profitability calculations utilized by HFMC in connection with the continuation of the investment management agreement.
In determining whether to continue the Agreements for the Fund, the members of the Board reviewed and evaluated information and factors they believed to be relevant and appropriate in light of the information that the Board deemed necessary and appropriate through the exercise of its reasonable business judgment. While individual members of the Board may have weighed certain factors differently, the Board’s determination to continue the Agreements was based on a comprehensive consideration of all information provided to the Board throughout the year and specifically with respect to the continuation of the Agreements. A more detailed discussion of the factors the Board considered with respect to its approval of the Agreements is provided below.
Nature, Extent and Quality of Services Provided by the Advisers
The Board requested and considered information concerning the nature, extent and quality of the services provided to the Fund by the Advisers. The Board considered, among other things, the terms of the Agreements and the range of services provided by the Advisers. The Board considered the Advisers’ professional personnel who provide services to the Fund, including each Adviser’s ability and experience in attracting and retaining qualified personnel to service the Fund. The Board considered each Adviser’s reputation and overall financial strength, as well as its willingness to consider and implement organizational and operational changes designed to enhance services to the Hartford Funds. In addition, the Board considered the quality of each Adviser’s communications with the Board and responsiveness to Board inquiries and requests made from time to time with respect to the Fund and other Hartford Funds.
The Board also requested and evaluated information concerning each Adviser’s regulatory and compliance environment. In this regard, the Board requested and reviewed information on each Adviser’s compliance policies and procedures, compliance history, and a report from the Fund’s Chief Compliance Officer on each Adviser’s compliance with applicable laws and regulations, including responses to regulatory developments and compliance issues raised by regulators. The Board also noted the Advisers’ support of the Fund’s compliance control structure, particularly the resources devoted by the Advisers in support of the Fund’s obligations pursuant to Rule 38a-1 under the 1940 Act.
With respect to HFMC, the Board noted that, under the Agreements, HFMC is responsible for the management of the Fund, including oversight of fund operations and service providers, and provides administrative and investment advisory services in connection with selecting, monitoring and supervising the Sub-adviser. The Board considered HFMC’s ongoing monitoring of people, process and performance, including its quarterly reviews of each of the Hartford Funds, semi-annual meetings with the leaders of each Fund’s portfolio management team, and oversight of the Hartford Funds’ approximately 66 portfolio managers. The Board recognized that HFMC has demonstrated a record of making changes to the
| 58 |
| The Hartford Strategic Income Fund |
| Approval of Investment Management and Investment Sub-Advisory Agreements (Unaudited) – (continued) |
management and/or strategies of the Hartford Funds when warranted. The Board considered HFMC’s oversight of the Sub-adviser’s investment approach and results, process for monitoring best execution of portfolio trades by the Sub-adviser, and approach to risk management with respect to the Fund and the service providers to the Fund. The Board also considered HFMC’s oversight of compliance with the Fund’s objective and policies as well as with applicable laws and regulations, noting that regulatory and other developments had over time led to an increase in the scope of HFMC’s services in this regard.
In addition, the Board considered HFMC’s ongoing commitment to review and rationalize the Hartford Funds product line-up and the expenses that HFMC had incurred in connection with fund combinations in recent years. The Board considered that HFMC or its affiliates are responsible for providing the Fund’s officers.
With respect to the Sub-adviser, which provides certain day-to-day portfolio management services for the Fund, the Board considered the quality of the Fund’s portfolio managers, the Sub-adviser’s other investment personnel, its investment philosophy and process, investment research capabilities and resources, performance record, trade execution capabilities and experience. The Board considered the experience of the Fund’s portfolio managers, the number of accounts managed by the portfolio managers, and the Sub-adviser’s method for compensating the portfolio managers.
Based on these considerations, the Board concluded that it was satisfied with the nature, extent and quality of the services provided to the Fund by HFMC and the Sub-adviser.
Performance of the Fund and the Advisers
The Board considered the investment performance of the Fund. In this regard, the Board reviewed the performance of the Fund over different time periods presented in the materials and evaluated HFMC’s analysis of the Fund’s performance for these time periods. The Board considered information and materials provided to the Board by the Advisers concerning Fund performance, as well as information from Lipper comparing the investment performance of the Fund to an appropriate benchmark and universe of peer funds. The Board noted that the Fund’s performance was in the 2nd quintile of its performance universe for the 1-year period, the 3rd quintile for the 3-year period and the 4th quintile for the 5-year period. The Board also noted that the Fund’s performance was above its benchmark for the 1-, 3- and 5-year periods.
The Board considered the detailed investment analytics reports provided by Hartford Funds’ Investment Advisory Group throughout the year. These reports include, among other things, information on the Fund’s gross and net returns, the Fund’s investment performance relative to an appropriate benchmark and peer group, various statistics concerning the Fund’s portfolio, and a narrative summary of various factors affecting Fund performance. The Board considered the Advisers’ cooperation with the Investment Committee, which assists the Board in evaluating the performance of the Fund at periodic meetings throughout the year. The Board also considered the analysis provided by the Consultant relating to the Fund’s performance track record.
In light of all the considerations noted above, the Board concluded that it had continued confidence in HFMC’s and the Sub-adviser’s overall capabilities to manage the Fund.
Costs of the Services and Profitability of the Advisers
The Board reviewed information regarding HFMC’s cost to provide investment management and related services to the Fund and HFMC’s profitability, both overall and for the Fund, on a pre-tax basis without regard to distribution expenses. The Board also requested and reviewed information about the profitability to HFMC and its affiliates from all services provided to the Fund and all aspects of their relationship with the Fund. The Board also requested and received information relating to the operations and profitability of the Sub-adviser.
The Board considered the Consultant’s review of the profitability calculations used by HFMC in connection with the continuation of the investment management agreement, noting the Consultant’s view that Hartford Funds’ process for calculating and reporting Fund profitability is reasonable. In this regard, the Board noted that the Consultant performed a full review of this process in light of the recent restructuring of the Hartford Funds business and reported that the approach to analyzing Fund profitability, including the use of common expense allocation methodologies, is reasonable, sound and well within common industry practice.
Based on these considerations, the Board concluded that the profits anticipated to be realized by the Advisers and their affiliates from their relationships with the Fund would not be excessive.
| 59 |
| The Hartford Strategic Income Fund |
| Approval of Investment Management and Investment Sub-Advisory Agreements (Unaudited) – (continued) |
Comparison of Fees and Services Provided by the Advisers
The Board considered comparative information with respect to the management fees to be paid by the Fund to HFMC and the total expense ratios of the Fund. The Board also considered comparative information with respect to the sub-advisory fees to be paid by HFMC to the Sub-adviser. In this regard, the Board requested and reviewed information from HFMC and the Sub-adviser relating to the management and sub-advisory fees, including the sub-advisory fee schedule for the Fund, and total operating expenses for the Fund. With respect to the sub-advisory fee schedule, the Board considered representations from HFMC and the Sub-adviser that the Sub-adviser’s fees were negotiated at arm’s length on a fund-by-fund basis. The Board also reviewed information from Lipper comparing the Fund’s contractual management fees, actual management fees and overall expense ratios relative to a group of funds selected by Lipper, in consultation with the Consultant, and a broader universe of funds selected by Lipper. The Board considered that the Fund’s contractual management fee, actual management fee and total expenses (less 12b-1 and shareholder service fees) were in the 2nd quintile of its expense group. The Board noted that the Fund has an automatically renewable contractual expense cap on each share class. The expense cap resulted in reimbursement of certain expenses incurred in 2013.
While the Board recognized that comparisons between the Fund and peer funds may be imprecise, given the different service levels and characteristics of mutual funds and the different business models and cost structures of the Advisers, the comparative information provided by Lipper assisted the Board in evaluating the reasonableness of the Fund’s management and sub-advisory fees and total operating expenses. In addition, the Board considered the analysis and recommendations of the Consultant relating to the Fund’s management and sub-advisory fees and total operating expenses.
Based on these considerations, the Board concluded that the Fund’s fees and total operating expenses, in conjunction with the information about quality of services, profitability, economies of scale, and other matters discussed, were reasonable in light of the services provided.
Economies of Scale
The Board requested and considered information regarding the Advisers’ realization of economies of scale with respect to the Fund and whether the fee levels reflect these economies of scale for the benefit of the Fund’s shareholders. The Board reviewed the breakpoints in the management fee schedule for the Fund, which reduce fee rates as Fund assets grow over time. The Board recognized that a fund with assets beyond the highest breakpoint level will continue to benefit from economies of scale because additional assets are charged the lowest breakpoint fee resulting in lower overall effective management fee rates. The Board also considered that expense limitations and fee waivers that reduce the Fund’s expenses at all asset levels can have the same effect as breakpoints in sharing economies of scale with shareholders and provide protection from an increase in expenses if Fund assets decline. The Board recognized that a fee schedule that reaches a lower breakpoint quickly provides shareholders with the benefit of anticipated or potential economies of scale. The Board also considered that HFMC has been active in managing expenses, which has resulted in benefits being realized by shareholders as assets within the Hartford Funds family of funds have grown over time, including through lower transfer agent costs and other operating expenses.
The Board reviewed and evaluated materials from Lipper and the Consultant showing how management fee schedules of peer funds reflect economies of scale for the benefit of shareholders as a peer fund’s assets hypothetically increase over time. Based on information provided by HFMC, Lipper, and the Consultant, the Board recognized that there is no uniform methodology for establishing breakpoints or uniform pattern in asset levels that trigger breakpoints or the amounts of breakpoints triggered.
After considering all of the information available to it, the Board concluded that it was satisfied with the extent to which economies of scale would be shared for the benefit of the Fund’s shareholders based on currently available information and the effective advisory fees and expense ratios for the Fund at its current and reasonably anticipated asset levels. The Board noted, however, that it would continue to monitor future growth in Fund assets and the appropriateness of additional breakpoints.
Other Benefits
The Board considered other benefits to the Advisers and their affiliates from their relationships with the Fund.
The Board noted that HFMC receives fees for fund accounting and related services from the Fund, and the Board considered information on profits to HFMC for such services. The Board also considered that Hartford Administrative Services Company (“HASCO”), the Fund’s transfer agent and an affiliate of HFMC, receives transfer agency compensation from the Fund, and the Board reviewed information on the profitability of
| 60 |
| The Hartford Strategic Income Fund |
| Approval of Investment Management and Investment Sub-Advisory Agreements (Unaudited) – (continued) |
the Fund’s transfer agency function to HASCO. The Board considered information provided by HASCO indicating that the transfer agent fees charged by HASCO to the Fund were fair and reasonable based on publicly available information.
The Board also considered that Hartford Funds Distributors, LLC (“HFD”), an affiliate of HFMC, serves as principal underwriter of the Fund. As principal underwriter, HFD receives 12b-1 fees from the Fund and receives all or a portion of the sales charges on sales or redemptions of certain classes of shares. The Board also noted that certain affiliates of HFD distribute shares of the Fund and receive compensation in that connection.
The Board considered the benefits, if any, to the Sub-adviser from any use of the Fund’s brokerage commissions to obtain soft dollar research, and representations from HFMC and the Sub-adviser that the Sub-adviser would not make any revenue-sharing payments or any other type of distribution payments to HFMC or its affiliates.
The Board considered the benefits to shareholders of being part of the Hartford Funds family of funds, including the right to exchange investments between the same class of funds without a sales charge, the ability to reinvest Fund dividends into other funds in the family, and the ability to combine holdings in the Fund with holdings in other funds to obtain a reduced sales charge. The Board considered HFMC’s efforts to provide investors in the family with a broad range of investment styles and asset classes and its entrepreneurial risk in initiating new funds to expand these opportunities for shareholders.
* * * *
Based upon its review of these various factors, among others, the Board concluded that it is in the best interests of the Fund and its shareholders for the Board to approve the Agreements for an additional year. In reaching this decision, the Board did not assign relative weights to the factors discussed above or deem any one or group of them to be controlling in and of themselves. In connection with their deliberations, the Independent Directors met separately in executive session on several occasions, with independent legal counsel and the Consultant, to review the relevant materials and consider their responsibilities under relevant laws and regulations.
| 61 |
| The Hartford Strategic Income Fund |
| Main Risks (Unaudited) |
The main risks of investing in the Fund are described below.
Market, Selection and Strategy Risk: The Fund’s share price may fluctuate due to market risk and/or security selections that may underperform the market or relevant benchmarks. If the sub-adviser's investment strategy does not perform as expected, the Fund could underperform its peers or lose money. There is no guarantee the Fund will achieve its stated objective.
Fixed Income Risk: The Fund is subject to interest rate risk (the risk that the value of an investment decreases when interest rates rise), credit risk (the risk that the issuing company of a security is unable to pay interest and principal when due), liquidity risk (the risk that an investment may be difficult to sell at an advantageous time or price) and call risk (the risk that an investment may be redeemed early). These risks also apply to the Fund’s investments in U.S. government securities, which may not be guaranteed by the U.S. government.
Junk Bond Risk: Investments in junk bonds involve greater risk of price volatility, illiquidity, and default than higher-rated debt securities.
Loan Risk: The Fund’s investments in loans may at times become difficult to value and highly illiquid; they are subject to credit risk such as nonpayment of principal or interest, and risks of bankruptcy and insolvency.
Mortgage-Backed Securities Risk: Mortgage-backed securities are subject to interest rate risk, credit risk, prepayment risk, extension risk, and the risk that an investment’s value may be reduced or become worthless if it receives interest or income payments only after other investments in the same pool. The Fund may purchase mortgage-backed securities in the “to be announced’ (“TBA”) market. This subjects the Fund to counterparty risk and the risk that the security the Fund buys will lose value prior to its delivery.
Foreign Investment, Emerging Markets and Sovereign Debt Risk: Investments in foreign securities may be riskier than investments in U.S. securities. Potential risks include the risks of illiquidity, increased price volatility, less government regulation, less extensive and less frequent accounting and other reporting requirements, unfavorable changes in currency exchange rates, and economic and political disruptions. These risks are generally greater for investments in emerging markets. Sovereign debt investments are subject to credit risk and the risk of default.
Derivatives Risk: Investments in derivatives can be volatile. Potential risks include currency risk, leverage risk (the risk that small market movements may result in large changes in the value of an investment), liquidity risk, index risk, pricing risk, and counterparty risk (the risk that the counterparty may be unwilling or unable to honor its obligations).
Active Trading Risk: Actively trading investments may result in higher costs and higher taxable income.
| 62 |
THIS PRIVACY POLICY IS NOT PART OF THIS REPORT
Privacy Policy and Practices of The Hartford Financial Services Group, Inc. and its Affiliates
(herein called “we, our and us”)
This Privacy Policy applies to our United States Operations
|
We value your trust. We are committed to the responsible: a) management; b) use; and c) protection; of Personal Information.
This notice describes how we collect, disclose, and protect Personal Information.
We collect Personal Information to: a) service your Transactions with us; and b) support our business functions.
We may obtain Personal Information from: a) You; b) your Transactions with us; and c) third parties such as a consumer-reporting agency.
Based on the type of product or service You apply for or get from us, Personal Information such as: a) your name; b) your address; c) your income; d) your payment; or e) your credit history; may be gathered from sources such as applications, Transactions, and consumer reports.
To serve You and service our business, we may share certain Personal Information. We will share Personal Information, only as allowed by law, with affiliates such as: a) our insurance companies; b) our employee agents; c) our brokerage firms; and d) our administrators.
As allowed by law, we may share Personal Financial Information with our affiliates to: a) market our products; or b) market our services; to You without providing You with an option to prevent these disclosures.
|
We may also share Personal Information, only as allowed by law, with unaffiliated third parties including: a) independent agents; b) brokerage firms; c) insurance companies; d) administrators; and e) service providers; who help us serve You and service our business.
When allowed by law, we may share certain Personal Financial Information with other unaffiliated third parties who assist us by performing services or functions such as: a) taking surveys; b) marketing our products or services; or c) offering financial products or services under a joint agreement between us and one or more financial institutions.
We, and third parties we partner with, may track some of the pages You visit through the use of: a) cookies; b) pixel tagging; or c) other technologies; and currently do not process or comply with any web browser’s “do not track” signal or similar mechanism that indicates a request to disable online tracking of individual users who visit our websites or use our services.
We will not sell or share your Personal Financial Information with anyone for purposes unrelated to our business functions without offering You the opportunity to: a) “opt-out;” or b) “opt-in;” as required by law.
We only disclose Personal Health Information with: a) your proper written authorization; or b) as otherwise allowed or required by law.
Our employees have access to Personal Information in the course of doing their jobs, such as: a) underwriting policies; b) paying claims; c) developing new products; or d) advising customers of our products and services.
|
|
We use manual and electronic security procedures to maintain: a) the confidentiality; and b) the integrity of; Personal Information that we have. We use these procedures to guard against unauthorized access.
Some techniques we use to protect Personal Information include: a) secured files; b) user authentication; c) encryption; d) firewall technology; and e) the use of detection software.
We are responsible for and must: a) identify information to be protected; b) provide an adequate level of protection for that data; c) grant access to protected data only to those people who must use it in the performance of their job-related duties.
Employees who violate our Privacy Policy will be subject to discipline, which may include ending their employment with us.
At the start of our business relationship, we will give You a copy of our current Privacy Policy.
We will also give You a copy of our current Privacy Policy once a year if You maintain a continuing business relationship with us.
We will continue to follow our Privacy Policy regarding Personal Information even when a business relationship no longer exists between us.
|
As used in this Privacy Notice:
Application means your request for our product or service.
Personal Financial Information means financial information such as: a) credit history; b) income; c) financial benefits; or d) policy or claim information.
Personal Health Information means health information such as: a) your medical records; or b) information about your illness, disability or injury.
Personal Information means information that identifies You personally and is not otherwise available to the public. It includes: a) Personal Financial Information; and b) Personal Health Information.
Transaction means your business dealings with us, such as: a) your Application; b) your request for us to pay a claim; and c) your request for us to take an action on your account.
You means an individual who has given us Personal Information in conjunction with: a) asking about; b) applying for; or c) obtaining; a financial product or service from us if the product or service is used mainly for personal, family, or household purposes.
|
This Privacy Policy is being provided on behalf of the following affiliates of The Hartford Financial Services Group, Inc.:
1stAGChoice, Inc.; Access CoverageCorp, Inc.; Access CoverageCorp Technologies, Inc.; American Maturity Life Insurance Company; Archway 60 R, LLC; Business Management Group, Inc.; Champlain Life Reinsurance Company; DMS R, LLC; Eloy R, LLC; Ersatz Corporation; First State Insurance Company; Hartford Accident and Indemnity Company; Hartford Administrative Services Company; Hartford Casualty General Agency, Inc.; Hartford Casualty Insurance Company; Hartford-Comprehensive Employee Benefit Service Company; Hartford Equity Sales Company, Inc.; Hartford Fire General Agency, Inc.; Hartford Fire Insurance Company; Hartford Funds Management Company, LLC; Hartford Funds Management Group, Inc.; Hartford HLS Series Fund II, Inc.; Hartford Insurance Company of Illinois; Hartford Insurance Company of the Midwest; Hartford Insurance Company of the Southeast; Hartford Integrated Technologies, Inc.; Hartford International Life Reassurance Corporation; Hartford Funds Distributors, LLC; Hartford Investment Management Company; Hartford Life and Accident Insurance Company; Hartford Life and Annuity Insurance Company; Hartford Life Insurance Company; Hartford Life Private Placement, LLC; Hartford Lloyd’s Corporation; Hartford Lloyd’s Insurance Company; Hartford Mezzanine Investors I, LLC; Hartford Residual Market, L.C.C.; Hartford Retirement Services, LLC; Hartford Securities Distribution Company, Inc.; Hartford Series Fund, Inc.; Hartford Specialty Insurance Services of Texas, LLC; Hartford Strategic Investments, LLC; Hartford Underwriters Insurance Company; Hartford Technology Services Company, L.L.C.; Hartford of Texas General Agency, Inc.; Hartford Underwriters General Agency, Inc.; HARTRE Company, L.C.C.; HL Investment Advisors, LLC; HLA LLC; Horizon Management Group, LLC; HRA Brokerage Services, Inc.; Lanidex Class B, LLC; M-CAP Insurance Agency, LLC; New England Insurance Company; New England Reinsurance Corporation; Nutmeg Insurance Agency, Inc.; Nutmeg Insurance Company; Pacific Insurance Company, Limited; Planco, LLC: Property and Casualty Insurance Company of Hartford; Revere R, LLC; RVR R, LLC; Sentinel Insurance Company, Ltd.; Sunstone R, LLC; Symphony R, LLC; The Evergreen Group Incorporated; The Hartford Alternative Strategies Fund; The Hartford Mutual Funds, Inc.; The Hartford Mutual Funds II, Inc.; Trumbull Flood Management, L.L.C.; Trumbull Insurance Company; Twin City Fire Insurance Company; White River Life Reinsurance Company.
HPP Revised January 2014
HARTFORDFUNDS
hartfordfunds.com
This information is written in connection with the promotion or marketing of the matter(s) addressed in this material.
This report is submitted for the general information of the shareholders of the Fund. It is not authorized for distribution unless preceded or accompanied by a current prospectus for the Fund.
The information cannot be used or relied upon for the purpose of avoiding IRS penalties. These materials are not intended to provide tax, accounting or legal advice. As with all matters of a tax or legal nature, you should consult your own tax or legal counsel for advice.
Investors should carefully consider the investment objectives, risks, charges, and expenses of Hartford Funds before investing. This and other information can be found in the prospectus and summary prospectus, which can be obtained by calling 888-843-7824 (retail) or 800-279-1541 (institutional). Investors should read them carefully before they invest.
Hartford Funds are underwritten and distributed by Hartford Funds Distributors, LLC.
MFAR-SI14 12/14 114001-3 Printed in U.S.A.
HARTFORDFUNDS
|
THE HARTFORD
TOTAL RETURN BOND FUND
2014 Annual Report |
A MESSAGE FROM THE PRESIDENT
Dear Fellow Shareholders:
Thank you for investing in Hartford Funds.
Market Review
U.S. equities (as represented by the S&P 500 Index) rose steadily for the fiscal year ended October 31, 2014, with a return of 17.27% for the period. With the exception of short-lived geopolitical scares early in 2014 and concerns about continuing global growth near the end of the period, stocks generally rose on solid fundamentals and encouraging macroeconomic data during the year.
September 2014 marked the six-year anniversary of the start of the financial crisis. Within weeks of that anniversary, both the S&P 500 Index and the Dow Jones Industrial Average set new all-time highs, closing at 2,018 and 17,391, respectively, on October 31. Although the fallout of the crisis continues to influence investor behavior, stocks have recovered and risen dramatically, up 198% from their low in March 2009. Meanwhile, the domestic economy is notching strong growth, and the unemployment rate has reached its lowest level since August 2008.
While the U.S. economy appears to have stabilized and to have reverted to a solid growth path, the outlook for the global economy appears to have gotten cloudier. The U.S. Federal Reserve has ended quantitative easing, while Europe and Japan are pursuing stimulus options to avoid a double-dip recession and deflation, respectively. Diverging central-bank policies will likely continue to play an important role in market movements going forward as investors wait to see the reactions to their efforts and their impacts on global markets.
How have market movements impacted your portfolio throughout the last year? Are your investments still on track to provide the growth or income you need, and are you comfortable with their progress during times of volatility?
Your financial professional can help you navigate today’s markets with confidence, as well as assist you to achieve your investment goals by providing advice on the best options within our fund family to help you work toward overcoming today’s investing challenges. Meet with your financial advisor regularly to examine your portfolio and your investment strategy, and to determine if you’re still on track to meet your goals.
Thank you again for investing with Hartford Funds.
James Davey
President
Hartford Funds
1 The S&P 500 Index is a market capitalization-weighted price index composed of 500 widely held common stocks.
2 The Dow Jones Industrial Average is an unmanaged, price-weighted index of 30 of the largest, most widely held stocks traded on the NYSE
The Hartford Total Return Bond Fund
Table of Contents
The views expressed in the Fund’s Manager Discussion under ‘‘Why did the Fund perform this way?’’ and ‘‘What is the outlook?’’ are views of the Fund’s sub-adviser and portfolio management team through the end of the period and are subject to change based on market and other conditions. The Fund’s Manager Discussion is for informational purposes only and does not represent an offer, recommendation or solicitation to buy, hold or sell any security. The specific securities identified and described, if any, do not represent all of the securities purchased or sold and you should not assume that investments in the securities identified and discussed will be profitable.
| The Hartford Total Return Bond Fund inception 07/22/1996 |
| (sub-advised by Wellington Management Company, LLP) |
| Investment objective – The Fund seeks a competitive total return, with income as a secondary objective. |
Performance Overview 10/31/04 - 10/31/14

The chart above represents the hypothetical growth of a $10,000 investment in Class A, which includes a sales charge. Growth results in classes other than Class A will vary from what is seen above due to differences in the expenses charged to those share classes.
Average Annual Total Returns (as of 10/31/14)
| 1 Year | 5 Years | 10 Years | ||||||||||
| Total Return Bond A# | 4.46 | % | 4.64 | % | 3.96 | % | ||||||
| Total Return Bond A## | -0.24 | % | 3.68 | % | 3.48 | % | ||||||
| Total Return Bond B# | 3.72 | % | 3.86 | % | 3.34 | %* | ||||||
| Total Return Bond B## | -1.28 | % | 3.51 | % | 3.34 | %* | ||||||
| Total Return Bond C# | 3.68 | % | 3.85 | % | 3.19 | % | ||||||
| Total Return Bond C## | 2.68 | % | 3.85 | % | 3.19 | % | ||||||
| Total Return Bond I# | 4.75 | % | 4.92 | % | 4.21 | % | ||||||
| Total Return Bond R3# | 4.16 | % | 4.33 | % | 3.85 | % | ||||||
| Total Return Bond R4# | 4.48 | % | 4.63 | % | 4.06 | % | ||||||
| Total Return Bond R5# | 4.79 | % | 4.94 | % | 4.30 | % | ||||||
| Total Return Bond Y# | 4.89 | % | 5.05 | % | 4.38 | % | ||||||
| Barclays U.S. Aggregate Bond Index | 4.14 | % | 4.22 | % | 4.64 | % | ||||||
| # | Without sales charge |
| ## | With sales charge |
| * | Class B shares convert to Class A shares after 8 years. The return shown reflects the conversion to Class A shares, which had different operating expenses, for the period after conversion. |
PERFORMANCE DATA QUOTED REPRESENTS PAST PERFORMANCE AND DOES NOT GUARANTEE FUTURE RESULTS. The investment return and principal value of the investment will fluctuate so that investors’ shares, when redeemed, may be worth more or less than their original cost. Current performance may be lower or higher than the performance data quoted. To obtain performance data current to the most recent month-end, please visit our website www.hartfordfunds.com.
The initial investment in Class A shares reflects the maximum sales charge of 4.50% and returns for Class B shares reflect a contingent deferred sales charge of up to 5.00% and declining to zero, depending on the period of time the shares are held. Returns for Class C shares reflect a contingent deferred sales charge of up to 1.00% on shares redeemed within twelve months of purchase.
Total returns presented above were calculated using the Fund’s net asset value available to shareholders for sale or redemption of Fund shares on October 31, 2014, which may exclude investment transactions as of this date. All share class returns assume the reinvestment of all distributions at net asset value and the deduction of all fund expenses.
Effective 9/30/09, Class B shares of the Fund were closed to new investments.
Class I shares commenced operations on 8/31/06. Performance prior to that date is that of the Fund's Class A shares (excluding sales charges), which had different operating expenses. Class R3, R4 and R5 shares commenced operations on 12/22/06. Performance prior to that date is that of the Fund's Class Y shares, which had different operating expenses.
Performance information includes performance under the Fund’s previous sub-adviser, Hartford Investment Management Company. As of March 5, 2012, Hartford Investment Management Company no longer served as the sub-adviser to the Fund.
Barclays U.S. Aggregate Bond Index is an unmanaged index and is composed of securities from the Barclays Government/Credit Bond Index, Mortgage-Backed Securities Index, Asset-Backed Securities Index and Commercial Mortgage-Backed Securities Index.
You cannot invest directly in an index.
The chart and table do not reflect the deductions of taxes that a shareholder would pay on Fund distributions or the redemption of Fund shares.
Performance information may reflect historical or current expense waivers/reimbursements from the investment adviser, without which performance would have been lower. For information on current expense waivers/reimbursements, please see the prospectus.
| 2 |
| The Hartford Total Return Bond Fund |
| Manager Discussion |
| October 31, 2014 (Unaudited) |
Operating Expenses*
| Net | Gross | |||||||
| Total Return Bond Class A | 0.87 | % | 0.99 | % | ||||
| Total Return Bond Class B | 1.62 | % | 1.88 | % | ||||
| Total Return Bond Class C | 1.58 | % | 1.70 | % | ||||
| Total Return Bond Class I | 0.56 | % | 0.68 | % | ||||
| Total Return Bond Class R3 | 1.16 | % | 1.28 | % | ||||
| Total Return Bond Class R4 | 0.84 | % | 0.96 | % | ||||
| Total Return Bond Class R5 | 0.55 | % | 0.67 | % | ||||
| Total Return Bond Class Y | 0.43 | % | 0.55 | % | ||||
| * | As shown in the Fund's prospectus dated March 1, 2014, as supplemented October 1, 2014. Actual expenses may be higher or lower. Please see accompanying Financial Highlights for expense ratios for the year ended October 31, 2014. |
Gross expenses are the Fund's total annual operating expenses shown in the Fund's prospectus dated March 1, 2014, as supplemented October 1, 2014. Net expenses are the Fund's total annual operating expenses shown in the Fund's prospectus dated March 1, 2014, as supplemented October 1, 2014, and reflect contractual expense reimbursements in instances when these reductions reduce the Fund's gross expenses. Certain contractual waivers/reimbursements remain in effect until February 28, 2015, and automatically renew for one-year terms unless terminated. Other contractual waivers/reimbursements remain in effect until February 29, 2016 and automatically renew for one-year terms unless terminated.
The Fund filed an updated prospectus, dated November 7, 2014, with the U.S. Securities and Exchange Commission that became effective on that date. However, the information in this annual report is as of October 31, 2014 and does not reflect any changes made to the total annual fund operating expense table in the November 7, 2014 prospectus. The net expense ratios shown in the November 7, 2014 prospectus are 0.87%, 1.62%, 1.59%, 0.57%, 1.17%, 0.85%, 0.56% and 0.44% for Class A, Class B, Class C, Class I, Class R3, Class R4, Class R5 and Class Y, respectively, and reflect contractual expense reimbursements in place until February 29, 2016. The gross expense ratios shown in the November 7, 2014 prospectus are 0.88%, 1.77%, 1.59%, 0.57%, 1.17%, 0.85%, 0.56% and 0.44% for Class A, Class B, Class C, Class I, Class R3, Class R4, Class R5 and Class Y, respectively.
All investments are subject to risk including the possible loss of principal. For a discussion of the Fund’s risks, please see the Main Risks section of this report. For more detailed information on the risks associated with an investment in the Fund, please see the prospectus.
| Portfolio Managers | ||
| Joseph F. Marvan, CFA | Lucius T. Hill, III | Campe Goodman, CFA |
| Senior Vice President and Fixed Income Portfolio Manager | Senior Vice President and Fixed Income Portfolio Manager | Senior Vice President and Fixed Income Portfolio Manager |
How did the Fund perform?
The Class A shares of The Hartford Total Return Bond Fund returned 4.46%, before sales charge, for the twelve-month period ended October 31, 2014, outperforming the Fund’s benchmark, the Barclays U.S. Aggregate Bond Index, which returned 4.14% for the same period. The Fund also outperformed the 4.19% average return of the Lipper Core Bond Funds peer group, a group of funds with investment strategies similar to those of the Fund.
Why did the Fund perform this way?
Fixed income markets gained throughout much of the period as expectations of prolonged easy monetary policy by major central banks and a supportive macroeconomic environment kept rates low and suppressed volatility. Early in the period emerging markets dominated headlines as economic and political developments sparked risk aversion across global markets, pushing bond prices higher and yields lower amid a flight to quality. Toward the end of the period, however, persistent geopolitical risks – tensions between Ukraine and Russia and violence in Iraq – and Chinese economic slowdown concerns raised questions about the global growth rate, keeping a lid on risk appetites overall.
The period was also highlighted by a divergence in central bank policies. The European Central Bank (ECB) cut its benchmark lending and deposit rates and announced a host of stimulus measures in an effort to encourage lending and fend off fears of deflation. China’s central bank joined the ECB in boosting liquidity by injecting funds into the nation’s largest banks in an attempt to combat weakening growth. The Bank of Japan pre-emptively announced incremental monetary easing to counter the risk of missing the country’s inflation and growth targets. In contrast, the Bank of England and U.S. Federal Reserve (Fed) leaned toward tighter policies. The Fed ended its quantitative easing program as U.S. data largely suggested the economy was on a sustainable growth path. Second quarter gross domestic product (GDP) rebounded after the first quarter’s steep contraction. The labor market strengthened as the unemployment rate dropped to a six-year low. Housing regained some lost ground after a weak start to the year, though the pace of home price appreciation started to slow after a strong 2013. Inflation pressures were muted overall, alleviating pressure on the Fed to raise rates.
The U.S. Treasury curve flattened as markets contemplated bringing interest rates to normal levels; short-term yields rose while longer term rates declined. Most credit risk sectors posted positive absolute returns and outperformed duration-equivalent government bonds as credit spreads tightened.
| 3 |
| The Hartford Total Return Bond Fund |
| Manager Discussion – (continued) |
| October 31, 2014 (Unaudited) |
The primary drivers of the Fund’s relative outperformance versus the benchmark were an out-of-benchmark allocation to non-agency mortgage backed securities (MBS) and an overweight to commercial mortgage backed securities (CMBS). Positioning within investment grade credit, particularly an overweight to Financials, was another strong contributor to outperformance during the period. An allocation to bank loans was also additive to relative results as was duration and yield curve positioning. On the other hand, an out-of-benchmark allocation to TIPS detracted, especially toward the end of the period, as inflation expectations fell.
Derivatives used in the portfolio during this period primarily consisted of currency forwards, bond futures, and investment grade and high yield credit default swap (CDS) index positions that were used as a source of liquidity and to manage overall portfolio risk. In isolation, derivative positions modestly detracted from relative results.
What is the outlook?
We are positive on U.S. economic growth over the next year based on supportive monetary policy and diminishing fiscal drag, along with companies’ improving confidence and willingness to invest. Accordingly, our risk stance is pro-cyclical and we favor credit generally. We ended the period with an overweight to high quality CMBS and an allocation to senior tranches of collateralized loan obligations within the Asset Backed Securities sector. We continued to hold an out-of-benchmark allocation to non-agency MBS. We also favored upper-tier high-yield bonds, bank loans, and European bank contingent convertible securities. We held a modest allocation to unhedged local currency emerging market debt. We maintained underweights to agency MBS pass-throughs and investment grade credit, though we continued to favor U.S. financials and communications issuers. Additionally, we positioned the Fund with a short duration posture at the end of the period.
Credit Exposure
as of October 31, 2014
| Credit Rating * | Percentage of Net Assets | |||
| Aaa/ AAA | 45.9 | % | ||
| Aa/ AA | 13.0 | |||
| A | 5.3 | |||
| Baa/ BBB | 14.8 | |||
| Ba/ BB | 8.2 | |||
| B | 4.7 | |||
| Caa/ CCC or Lower | 5.4 | |||
| Not Rated | 2.9 | |||
| Non-Debt Securities and Other Short-Term Instruments | 22.9 | |||
| Other Assets and Liabilities | (23.1 | ) | ||
| Total | 100.0 | % | ||
| * | Credit exposure is the long-term credit ratings for the Fund's holdings, as of the date noted, as provided by Standard and Poor's (S&P) or Moody's Investors Service (Moody's) and typically range from AAA/Aaa (highest) to C/D (lowest). Presentation of S&P and Moody's credit ratings in this report have been selected for informational purposes for shareholders, as well as the Fund's consideration of industry practice. If Moody's and S&P assign different ratings, the lower rating is used. Fixed income securities that are not rated by either agency are listed as "Not Rated." Ratings do not apply to the Fund itself or to the Fund's shares. Ratings may change. |
Diversification by Security Type
as of October 31, 2014
| Category | Percentage of Net Assets | |||
| Equity Securities | ||||
| Preferred Stocks | 0.1 | % | ||
| Total | 0.1 | % | ||
| Fixed Income Securities | ||||
| Asset & Commercial Mortgage Backed Securities | 28.2 | % | ||
| Corporate Bonds | 24.4 | |||
| Foreign Government Obligations | 2.1 | |||
| Municipal Bonds | 0.9 | |||
| Senior Floating Rate Interests | 5.0 | |||
| U.S. Government Agencies | 31.9 | |||
| U.S. Government Securities | 7.7 | |||
| Total | 100.2 | % | ||
| Short-Term Investments | 22.8 | |||
| Purchased Options | 0.0 | |||
| Other Assets and Liabilities | (23.1 | ) | ||
| Total | 100.0 | % | ||
| 4 |
| The Hartford Total Return Bond Fund |
| Schedule of Investments |
| October 31, 2014 |
| (000’s Omitted) |
| Shares or Principal Amount ╬ | Market Value ╪ | |||||||
| Asset and Commercial Mortgage Backed Securities - 28.2% | ||||||||
| Finance and Insurance - 28.2% | ||||||||
| Adjustable Rate Mortgage Trust | ||||||||
| $ | 2,299 | 0.42%, 11/25/2035 Δ | $ | 2,118 | ||||
| American Home Mortgage Assets Trust | ||||||||
| 1,045 | 1.06%, 10/25/2046 Δ | 762 | ||||||
| American Money Management Corp. | ||||||||
| 4,200 | 1.68%, 07/27/2026 ■‡Δ | 4,159 | ||||||
| Apidos CLO | ||||||||
| 2,935 | 1.68%, 01/19/2025 ■‡Δ | 2,919 | ||||||
| 4,775 | 1.71%, 04/17/2026 ■‡Δ | 4,749 | ||||||
| Ares CLO Ltd. | ||||||||
| 4,013 | 1.02%, 04/20/2023 ■‡Δ | 3,988 | ||||||
| 4,460 | 1.76%, 04/17/2026 ■‡Δ | 4,439 | ||||||
| Atlas Senior Loan Fund Ltd. | ||||||||
| 3,775 | 1.78%, 10/15/2026 ■‡Δ | 3,773 | ||||||
| 1,905 | 1.81%, 07/16/2026 ■╦Δ | 1,896 | ||||||
| Atrium CDO Corp. | ||||||||
| 1,740 | 1.99%, 11/16/2022 ■Δ | 1,698 | ||||||
| 3,420 | 2.38%, 10/23/2025 ■Δ | 3,387 | ||||||
| Avalon IV Capital Ltd. | ||||||||
| 1,755 | 2.08%, 04/17/2023 ■Δ | 1,721 | ||||||
| Avery Point CLO Ltd. | ||||||||
| 4,375 | 1.75%, 04/25/2026 ■Δ | 4,359 | ||||||
| Babson CLO Ltd. | ||||||||
| 1,030 | 1.72%, 07/12/2025 ■╦Δ | 1,025 | ||||||
| Banc of America Commercial Mortgage, Inc. | ||||||||
| 1,528 | 5.35%, 09/10/2047 ╦Δ | 1,568 | ||||||
| 3,351 | 5.44%, 11/10/2042 Δ | 3,358 | ||||||
| 273 | 5.75%, 02/10/2051 Δ | 300 | ||||||
| Banc of America Funding Corp. | ||||||||
| 241 | 0.39%, 02/20/2047 Δ | 207 | ||||||
| 2,918 | 0.46%, 05/20/2047 Δ | 2,380 | ||||||
| 3,560 | 5.77%, 05/25/2037 | 3,004 | ||||||
| 164 | 5.85%, 01/25/2037 | 133 | ||||||
| BCAP LLC Trust | ||||||||
| 601 | 0.32%, 01/25/2037 Δ | 453 | ||||||
| 1,615 | 0.33%, 03/25/2037 Δ | 1,303 | ||||||
| Bear Stearns Adjustable Rate Mortgage Trust | ||||||||
| 1,165 | 2.26%, 08/25/2035 Δ | 1,169 | ||||||
| 2,016 | 2.43%, 10/25/2035 Δ | 1,985 | ||||||
| Bear Stearns Alt-A Trust | ||||||||
| 300 | 0.47%, 08/25/2036 Δ | 227 | ||||||
| 1,711 | 0.53%, 05/25/2036 Δ | 1,252 | ||||||
| 3,713 | 0.65%, 01/25/2036 Δ | 2,942 | ||||||
| Bear Stearns Commercial Mortgage Securities, Inc. | ||||||||
| 1,330 | 5.29%, 10/12/2042 ╦Δ | 1,352 | ||||||
| 1,298 | 5.33%, 02/11/2044 ╦ | 1,395 | ||||||
| 3,842 | 5.41%, 12/11/2040 | 3,959 | ||||||
| 490 | 5.47%, 01/12/2045 | 528 | ||||||
| 1,096 | 5.54%, 10/12/2041 ╦ | 1,170 | ||||||
| 3,491 | 5.69%, 06/11/2050 | 3,818 | ||||||
| 3,005 | 5.90%, 06/11/2040 ‡Δ | 3,305 | ||||||
| Cal Funding II Ltd. | ||||||||
| 740 | 3.47%, 10/25/2027 ■ | 736 | ||||||
| Cent CLO L.P. | ||||||||
| 3,995 | 1.71%, 01/25/2026 ■‡Δ | 3,976 | ||||||
| 2,865 | 1.72%, 07/27/2026 ■‡Δ | 2,842 | ||||||
| CHL Mortgage Pass-Through Trust | ||||||||
| 1,394 | 0.49%, 03/25/2035 Δ | 1,200 | ||||||
| 751 | 2.42%, 06/20/2035 Δ | 721 | ||||||
| CIFC Funding Ltd. | ||||||||
| 8,920 | 1.73%, 04/18/2025 - 05/24/2026 ■‡Δ | 8,853 | ||||||
| 3,545 | 2.34%, 08/14/2024 ■Δ | 3,470 | ||||||
| Citigroup Commercial Mortgage Trust | ||||||||
| 2,100 | 4.02%, 03/10/2047 ╦ | 2,231 | ||||||
| 2,780 | 6.34%, 12/10/2049 ‡Δ | 3,080 | ||||||
| Citigroup/Deutsche Bank Commercial Mortgage Trust | ||||||||
| 2,350 | 5.30%, 01/15/2046 ‡Δ | 2,441 | ||||||
| 5,185 | 5.32%, 12/11/2049 ‡ | 5,542 | ||||||
| Commercial Mortgage Loan Trust | ||||||||
| 5,467 | 6.24%, 12/10/2049 ‡Δ | 5,924 | ||||||
| Commercial Mortgage Pass-Through Certificates | ||||||||
| 10,854 | 2.60%, 07/10/2046 ■► | 473 | ||||||
| 1,160 | 2.85%, 10/15/2045 ╦ | 1,148 | ||||||
| 3,380 | 3.96%, 02/10/2047 - 03/10/2047 ╦ | 3,576 | ||||||
| 1,425 | 4.02%, 07/10/2045 | 1,520 | ||||||
| 2,350 | 4.05%, 04/10/2047 | 2,503 | ||||||
| 1,362 | 5.95%, 06/10/2046 Δ | 1,440 | ||||||
| Commercial Mortgage Trust | ||||||||
| 3,050 | 3.42%, 03/10/2031 ■ | 3,105 | ||||||
| 1,105 | 4.50%, 03/10/2046 ■Δ | 741 | ||||||
| Community or Commercial Mortgage Trust | ||||||||
| 805 | 3.21%, 03/10/2046 ╦ | 814 | ||||||
| 1,155 | 3.69%, 08/10/2047 ╦ | 1,189 | ||||||
| 1,630 | 4.01%, 04/10/2047 ╦ | 1,730 | ||||||
| 2,060 | 4.38%, 07/10/2045 Δ | 2,242 | ||||||
| Countrywide Alternative Loan Trust | ||||||||
| 2,913 | 0.42%, 01/25/2036 Δ | 2,588 | ||||||
| 1,544 | 0.47%, 11/25/2035 Δ | 1,245 | ||||||
| 277 | 0.65%, 12/25/2035 Δ | 200 | ||||||
| 3,293 | 5.75%, 05/25/2036 | 2,802 | ||||||
| 276 | 6.00%, 12/25/2036 | 218 | ||||||
| 785 | 6.50%, 08/25/2037 | 568 | ||||||
| Countrywide Home Loans, Inc. | ||||||||
| 2,737 | 2.58%, 09/25/2047 Δ | 2,436 | ||||||
| 1,045 | 2.73%, 04/20/2036 Δ | 730 | ||||||
| 1,569 | 4.87%, 11/20/2035 Δ | 1,407 | ||||||
| 2,240 | 5.75%, 08/25/2037 | 2,144 | ||||||
| CPS Automotive Trust | ||||||||
| 1,042 | 1.54%, 07/16/2018 ■ | 1,046 | ||||||
| 690 | 1.82%, 12/16/2019 ■ | 697 | ||||||
| 124 | 5.01%, 06/17/2019 ■ | 127 | ||||||
| Credit Acceptance Automotive Loan Trust | ||||||||
| 2,380 | 1.21%, 10/15/2020 ■ | 2,380 | ||||||
| 1,595 | 1.50%, 04/15/2021 ■ | 1,600 | ||||||
| 2,075 | 1.55%, 10/15/2021 ■ | 2,077 | ||||||
| 4,100 | 1.88%, 03/15/2022 ■ | 4,096 | ||||||
| 805 | 2.21%, 09/15/2020 ■ | 812 | ||||||
| 2,240 | 3.12%, 03/16/2020 ■ | 2,257 | ||||||
| Credit Suisse Commercial Mortgage Trust | ||||||||
| 80 | 5.97%, 02/15/2041 Δ | 89 | ||||||
| CS First Boston Mortgage Securities Corp. | ||||||||
| 1,375 | 4.77%, 07/15/2037 | 1,394 | ||||||
| 2,790 | 4.88%, 04/15/2037 | 2,811 | ||||||
| 1,960 | 5.50%, 06/25/2035 | 1,871 | ||||||
| CW Capital Cobalt Ltd. | ||||||||
| 1,658 | 5.22%, 08/15/2048 | 1,758 | ||||||
The accompanying notes are an integral part of these financial statements.
| 5 |
| The Hartford Total Return Bond Fund |
| Schedule of Investments – (continued) |
| October 31, 2014 |
| (000’s Omitted) |
| Shares or Principal Amount ╬ | Market Value ╪ | |||||||
| Asset and Commercial Mortgage Backed Securities - 28.2% - (continued) | ||||||||
| Finance and Insurance - 28.2% - (continued) | ||||||||
| DBUBS Mortgage Trust | ||||||||
| $ | 11,125 | 1.55%, 01/01/2021 ■► | $ | 287 | ||||
| Downey S & L Association Mortgage Loan Trust | ||||||||
| 1,148 | 1.04%, 03/19/2046 Δ | 888 | ||||||
| Dryden Senior Loan Fund | ||||||||
| 4,695 | 1.58%, 04/18/2026 ■‡Δ | 4,641 | ||||||
| 4,800 | 1.70%, 07/15/2026 ■Δ | 4,772 | ||||||
| First Franklin Mortgage Loan Trust | ||||||||
| 2,250 | 0.39%, 04/25/2036 Δ | 1,456 | ||||||
| First Horizon Alternative Mortgage Securities | ||||||||
| 5,515 | 2.21%, 04/25/2036 Δ | 4,608 | ||||||
| 2,921 | 2.24%, 09/25/2035 Δ | 2,551 | ||||||
| First Investors Automotive Owner Trust | ||||||||
| 1,175 | 1.49%, 01/15/2020 ■ | 1,180 | ||||||
| 605 | 1.81%, 10/15/2018 ■ | 610 | ||||||
| Flagship Credit Automotive Trust | ||||||||
| 1,021 | 1.21%, 04/15/2019 ■ | 1,019 | ||||||
| Flatiron CLO Ltd. | ||||||||
| 1,015 | 2.13%, 07/17/2026 ■Δ | 997 | ||||||
| Ford Credit Floorplan Master Owner Trust | ||||||||
| 695 | 1.40%, 02/15/2019 ╦ | 695 | ||||||
| Four Times Square Trust | ||||||||
| 1,710 | 5.40%, 12/13/2028 ■╦ | 1,943 | ||||||
| FREMF Mortgage Trust | ||||||||
| 2,495 | 3.08%, 10/25/2047 ■ | 2,479 | ||||||
| 2,710 | 5.41%, 09/25/2043 ■Δ | 3,001 | ||||||
| GE Business Loan Trust | ||||||||
| 944 | 1.15%, 05/15/2034 ■Δ | 743 | ||||||
| GE Capital Commercial Mortgage Corp. | ||||||||
| 950 | 5.49%, 11/10/2045 ╦Δ | 971 | ||||||
| GM Financial Automobile Leasing Trust | ||||||||
| 650 | 1.96%, 03/20/2018 ■ | 652 | ||||||
| GMAC Commercial Mortgage Securities, Inc. | ||||||||
| 1,927 | 5.24%, 11/10/2045 Δ | 1,984 | ||||||
| GMAC Mortgage Corp. Loan Trust | ||||||||
| 1,565 | 2.93%, 09/19/2035 Δ | 1,463 | ||||||
| 225 | 2.95%, 04/19/2036 Δ | 198 | ||||||
| Gramercy Park CLO Ltd. | ||||||||
| 4,250 | 1.53%, 07/17/2023 ■‡Δ | 4,236 | ||||||
| Greenwich Capital Commercial Funding Corp. | ||||||||
| 4,155 | 5.74%, 12/10/2049 | 4,547 | ||||||
| 966 | 6.01%, 07/10/2038 ╦Δ | 1,023 | ||||||
| GS Mortgage Securities Trust | ||||||||
| 27,465 | 0.37%, 07/10/2046 ► | 328 | ||||||
| 5,265 | 1.86%, 08/10/2044 ■► | 321 | ||||||
| 2,010 | 2.95%, 11/05/2034 ■╦ | 1,991 | ||||||
| 695 | 3.67%, 04/10/2047 ■Δ | 477 | ||||||
| 1,920 | 3.68%, 04/12/2047 ╦Δ | 2,008 | ||||||
| 4,075 | 3.86%, 06/10/2047 ‡ | 4,269 | ||||||
| 2,090 | 4.00%, 04/10/2047 ╦Δ | 2,214 | ||||||
| 1,310 | 5.03%, 04/10/2047 ■Δ | 1,235 | ||||||
| GSAA Home Equity Trust | ||||||||
| 7,393 | 0.23%, 02/25/2037 Δ | 4,024 | ||||||
| 1,360 | 0.24%, 12/25/2036 Δ | 677 | ||||||
| 2,090 | 0.25%, 03/25/2037 Δ | 1,084 | ||||||
| 693 | 0.45%, 03/25/2036 Δ | 489 | ||||||
| 1,904 | 5.98%, 06/25/2036 | 1,119 | ||||||
| GSR Mortgage Loan Trust | ||||||||
| 343 | 0.65%, 11/25/2035 Δ | 254 | ||||||
| 5,126 | 2.74%, 01/25/2036 Δ | 4,744 | ||||||
| Harborview Mortgage Loan Trust | ||||||||
| 1,976 | 0.35%, 01/19/2038 Δ | 1,669 | ||||||
| 3,436 | 0.38%, 05/19/2047 Δ | 1,345 | ||||||
| 2,658 | 0.40%, 12/19/2036 Δ | 1,880 | ||||||
| 1,146 | 0.51%, 01/19/2035 Δ | 802 | ||||||
| Hilton USA Trust | ||||||||
| 3,260 | 2.66%, 11/05/2030 ■‡ | 3,279 | ||||||
| 510 | 2.91%, 11/05/2030 ■Δ | 510 | ||||||
| IndyMac Index Mortgage Loan Trust | ||||||||
| 673 | 0.39%, 07/25/2035 Δ | 598 | ||||||
| 1,644 | 0.43%, 07/25/2035 Δ | 1,402 | ||||||
| 299 | 0.44%, 01/25/2036 Δ | 206 | ||||||
| 4,216 | 0.55%, 07/25/2046 Δ | 2,070 | ||||||
| 1,109 | 2.46%, 01/25/2036 Δ | 1,033 | ||||||
| 720 | 2.47%, 08/25/2035 Δ | 577 | ||||||
| 58 | 2.60%, 12/25/2036 Δ | 51 | ||||||
| ING Investment Management CLO Ltd. | ||||||||
| 2,300 | 1.43%, 03/14/2022 ■╦Δ | 2,284 | ||||||
| 4,690 | 1.77%, 04/18/2026 ■‡Δ | 4,668 | ||||||
| 1,565 | 2.08%, 03/14/2022 ■Δ | 1,535 | ||||||
| JP Morgan Chase Commercial Mortgage Securities Corp. | ||||||||
| 3,558 | 1.65%, 02/12/2051 Δ | 3,568 | ||||||
| 811 | 2.75%, 10/15/2045 ■ | 614 | ||||||
| 2,260 | 2.83%, 10/15/2045 | 2,240 | ||||||
| 1,305 | 3.91%, 05/05/2030 ■Δ | 1,363 | ||||||
| 2,740 | 4.17%, 12/15/2046 ‡ | 2,949 | ||||||
| 730 | 4.57%, 12/15/2047 ■Δ | 621 | ||||||
| 625 | 4.82%, 10/15/2045 ■Δ | 620 | ||||||
| 4,667 | 5.34%, 05/15/2047 ‡ | 4,987 | ||||||
| 3,575 | 5.40%, 12/15/2044 ‡Δ | 3,672 | ||||||
| 2,917 | 5.42%, 01/12/2043 ‡Δ | 3,010 | ||||||
| 1,752 | 5.72%, 02/15/2051 ╦ | 1,909 | ||||||
| 4,193 | 5.89%, 02/12/2049 ‡Δ | 4,559 | ||||||
| 1,110 | 6.06%, 04/15/2045 ╦Δ | 1,170 | ||||||
| JP Morgan Mortgage Trust | ||||||||
| 1,320 | 2.54%, 09/25/2035 Δ | 1,270 | ||||||
| 317 | 2.55%, 04/25/2037 Δ | 284 | ||||||
| 236 | 2.71%, 05/25/2036 Δ | 210 | ||||||
| JPMBB Commercial Mortgage Securities Trust | ||||||||
| 15,488 | 0.89%, 09/15/2047 ► | 817 | ||||||
| 1,650 | 3.77%, 08/15/2047 ╦ | 1,718 | ||||||
| 1,665 | 3.80%, 09/15/2047 ╦ | 1,735 | ||||||
| 2,085 | 4.00%, 04/15/2047 | 2,212 | ||||||
| 1,250 | 4.20%, 01/15/2047 ╦ | 1,348 | ||||||
| LB-UBS Commercial Mortgage Trust | ||||||||
| 348 | 5.43%, 02/15/2040 | 377 | ||||||
| 4,897 | 5.86%, 07/15/2040 ‡ | 5,192 | ||||||
| 880 | 6.32%, 04/15/2041 ╦Δ | 981 | ||||||
| LCM Ltd. | ||||||||
| 615 | 2.13%, 04/15/2022 ■Δ | 603 | ||||||
| Lehman Brothers Small Balance Commercial | ||||||||
| 190 | 5.52%, 09/25/2030 ■Δ | 190 | ||||||
| Lehman XS Trust | ||||||||
| 1,178 | 0.36%, 07/25/2046 Δ | 934 | ||||||
| 991 | 1.00%, 09/25/2047 Δ | 810 | ||||||
| Limerock CLO | ||||||||
| 4,765 | 1.73%, 04/18/2026 ■‡Δ | 4,730 | ||||||
| Luminent Mortgage Trust | ||||||||
| 2,421 | 0.35%, 02/25/2046 Δ | 1,780 | ||||||
The accompanying notes are an integral part of these financial statements.
| 6 |
| The Hartford Total Return Bond Fund |
| Schedule of Investments – (continued) |
| October 31, 2014 |
| (000’s Omitted) |
| Shares or Principal Amount ╬ | Market Value ╪ | |||||||
| Asset and Commercial Mortgage Backed Securities - 28.2% - (continued) | ||||||||
| Finance and Insurance - 28.2% - (continued) | ||||||||
| Madison Park Funding Ltd. | ||||||||
| $ | 7,325 | 1.68%, 01/19/2025 - 07/20/2026 ■‡Δ | $ | 7,291 | ||||
| Magnetite CLO Ltd. | ||||||||
| 3,890 | 1.70%, 07/25/2026 ■‡Δ | 3,856 | ||||||
| 2,895 | 1.71%, 04/15/2026 ■‡Δ | 2,879 | ||||||
| 3,115 | 2.23%, 07/25/2026 ■‡Δ | 3,023 | ||||||
| Merrill Lynch Mortgage Investors Trust | ||||||||
| 690 | 2.52%, 07/25/2035 Δ | 573 | ||||||
| 918 | 2.75%, 03/25/2036 Δ | 627 | ||||||
| 935 | 5.14%, 07/12/2038 | 959 | ||||||
| Merrill Lynch/Countrywide Commercial Mortgage Trust | ||||||||
| 3,292 | 5.38%, 08/12/2048 ‡ | 3,526 | ||||||
| 1,040 | 5.42%, 08/12/2048 | 1,093 | ||||||
| 2,185 | 5.70%, 09/12/2049 | 2,385 | ||||||
| 2,921 | 5.81%, 06/12/2050 ‡Δ | 3,181 | ||||||
| Morgan Stanley ABS Capital I | ||||||||
| 2,179 | 0.30%, 06/25/2036 Δ | 1,678 | ||||||
| Morgan Stanley BAML Trust | ||||||||
| 5,310 | 3.74%, 08/15/2047 ‡Δ | 5,510 | ||||||
| 1,645 | 3.89%, 06/15/2047 Θ | 1,730 | ||||||
| 775 | 4.06%, 02/15/2047 ╦ | 826 | ||||||
| 775 | 4.50%, 08/15/2045 ■ | 591 | ||||||
| Morgan Stanley Capital I | ||||||||
| 42,572 | 1.08%, 09/15/2047 ■► | 733 | ||||||
| 2,596 | 4.99%, 08/13/2042 | 2,619 | ||||||
| 693 | 5.38%, 11/14/2042 ╦Δ | 708 | ||||||
| 425 | 5.55%, 10/12/2052 ■Δ | 431 | ||||||
| 3,450 | 5.69%, 04/15/2049 ‡Δ | 3,746 | ||||||
| Morgan Stanley Capital Investments | ||||||||
| 2,074 | 5.81%, 12/12/2049 | 2,270 | ||||||
| Morgan Stanley Mortgage Loan Trust | ||||||||
| 3,361 | 0.32%, 05/25/2036 - 11/25/2036 Δ | 1,686 | ||||||
| 1,158 | 2.59%, 05/25/2036 Δ | 841 | ||||||
| Morgan Stanley Re-Remic Trust | ||||||||
| 2,972 | 5.99%, 08/12/2045 - 08/15/2045 ■╦Δ | 3,223 | ||||||
| National Credit Union Administration | ||||||||
| 526 | 1.84%, 10/07/2020 Δ | 530 | ||||||
| Neuberger Berman CLO XVI Ltd. | ||||||||
| 3,510 | 1.70%, 03/01/2026 ■‡Δ | 3,479 | ||||||
| Neuberger Berman CLO XVII Ltd. | ||||||||
| 3,795 | 1.70%, 08/04/2025 ■‡Δ | 3,762 | ||||||
| Oak Hill Credit Partners | ||||||||
| 1,395 | 1.72%, 07/20/2026 ■╦Δ | 1,386 | ||||||
| Octagon Investment Partners | ||||||||
| 2,385 | 1.35%, 07/17/2025 ■╦Δ | 2,338 | ||||||
| OZLM Funding Ltd. | ||||||||
| 4,595 | 1.73%, 04/17/2026 ■‡Δ | 4,573 | ||||||
| Prestige Automotive Receivables Trust | ||||||||
| 1,685 | 2.49%, 04/16/2018 ■ | 1,711 | ||||||
| RBSGC Mortage Pass Through Certificates | ||||||||
| 3,864 | 6.25%, 01/25/2037 | 3,622 | ||||||
| Residential Accredit Loans, Inc. | ||||||||
| 276 | 0.37%, 02/25/2046 Δ | 132 | ||||||
| 407 | 0.92%, 09/25/2046 Δ | 273 | ||||||
| 3,996 | 1.41%, 11/25/2037 Δ | 2,542 | ||||||
| Residential Asset Securitization Trust | ||||||||
| 1,043 | 0.60%, 03/25/2035 Δ | 805 | ||||||
| Residential Funding Mortgage Securities, Inc. | ||||||||
| 202 | 3.05%, 04/25/2037 Δ | 176 | ||||||
| Santander Drive Automotive Receivables Trust | ||||||||
| 980 | 1.82%, 05/15/2019 | 983 | ||||||
| 715 | 2.25%, 06/17/2019 | 720 | ||||||
| SBA Tower Trust | ||||||||
| 2,710 | 2.90%, 10/15/2044 ■Δ | 2,717 | ||||||
| Seneca Park CLO Ltd. | ||||||||
| 3,320 | 1.70%, 07/17/2026 ■‡Δ | 3,315 | ||||||
| Sequoia Mortgage Trust | ||||||||
| 420 | 2.52%, 07/20/2037 Δ | 342 | ||||||
| Shackleton CLO Ltd. | ||||||||
| 3,430 | 1.72%, 07/17/2026 ■‡Δ | 3,410 | ||||||
| Soundview Home Equity Loan Trust, Inc. | ||||||||
| 3,500 | 0.33%, 07/25/2037 Δ | 2,191 | ||||||
| 830 | 0.39%, 07/25/2036 Δ | 484 | ||||||
| SpringCastle America Funding LLC | ||||||||
| 4,410 | 2.70%, 05/25/2023 ■ | 4,413 | ||||||
| Springleaf Funding Trust | ||||||||
| 4,030 | 2.41%, 12/15/2022 ■ | 4,039 | ||||||
| Springleaf Mortgage Loan Trust | ||||||||
| 275 | 2.31%, 06/25/2058 ■ | 269 | ||||||
| 2,860 | 3.52%, 12/25/2065 ■ | 2,918 | ||||||
| Structured Adjustable Rate Mortgage Loan Trust | ||||||||
| 694 | 0.45%, 09/25/2034 Δ | 612 | ||||||
| Structured Agency Credit Risk Debt Notes | ||||||||
| 885 | 4.90%, 10/25/2024 Δ | 889 | ||||||
| Symphony CLO Ltd. | ||||||||
| 3,950 | 1.71%, 07/14/2026 ■‡Δ | 3,927 | ||||||
| 4,090 | 1.98%, 01/09/2023 ■Δ | 4,037 | ||||||
| Thacher Park CLO | ||||||||
| 2,740 | 1.70%, 10/20/2026 ■‡Δ | 2,740 | ||||||
| UBS-Barclays Commercial Mortgage Trust | ||||||||
| 2,380 | 3.18%, 03/10/2046 ‡Δ | 2,389 | ||||||
| 4,120 | 3.24%, 04/10/2046 ‡ | 4,155 | ||||||
| 485 | 4.23%, 03/10/2046 ■Δ | 404 | ||||||
| Voya CLO Ltd. | ||||||||
| 1,500 | 1.68%, 07/17/2026 ■╦Δ | 1,493 | ||||||
| Wachovia Bank Commercial Mortgage Trust | ||||||||
| 1,025 | 5.55%, 03/15/2042 ■Δ | 1,026 | ||||||
| WaMu Mortgage Pass-Through Certificates | ||||||||
| 849 | 1.10%, 07/25/2046 Δ | 722 | ||||||
| Wells Fargo Alternative Loan Trust | ||||||||
| 1,611 | 6.25%, 11/25/2037 | 1,520 | ||||||
| Wells Fargo Commercial Mortgage Trust | ||||||||
| 2,900 | 2.92%, 10/15/2045 ‡ | 2,893 | ||||||
| 1,660 | 3.82%, 08/15/2050 ╦ | 1,731 | ||||||
| 60 | 4.94%, 10/15/2045 ■Δ | 60 | ||||||
| Wells Fargo Mortgage Backed Securities Trust | ||||||||
| 796 | 5.21%, 10/25/2035 Δ | 788 | ||||||
| Westlake Automobile Receivables Trust | ||||||||
| 390 | 0.97%, 10/16/2017 ■ | 390 | ||||||
| 4,275 | 1.58%, 04/15/2020 ■ | 4,281 | ||||||
| WF-RBS Commercial Mortgage Trust | ||||||||
| 1,180 | 2.92%, 08/15/2047 ╦ | 1,217 | ||||||
| 3,315 | 3.68%, 08/15/2047 ‡ | 3,424 | ||||||
| 2,570 | 4.00%, 05/15/2047 ‡ | 2,723 | ||||||
| 4,030 | 4.05%, 03/15/2047 ‡ | 4,282 | ||||||
| 1,625 | 4.10%, 03/15/2047 ╦ | 1,736 | ||||||
| 3,585 | 4.90%, 06/15/2044 ■‡ | 4,025 | ||||||
| 746 | 5.00%, 06/15/2044 - 04/15/2045 ■ | 627 | ||||||
The accompanying notes are an integral part of these financial statements.
| 7 |
| The Hartford Total Return Bond Fund |
| Schedule of Investments – (continued) |
| October 31, 2014 |
| (000’s Omitted) |
| Shares or Principal Amount ╬ | Market Value ╪ | |||||||
| Asset and Commercial Mortgage Backed Securities - 28.2% - (continued) | ||||||||
| Finance and Insurance - 28.2% - (continued) | ||||||||
| WF-RBS Commercial Mortgage Trust - (continued) | ||||||||
| $ | 960 | 5.75%, 04/15/2045 ■Δ | $ | 1,016 | ||||
| 488,433 | ||||||||
| Total Asset and Commercial Mortgage Backed Securities | ||||||||
| (Cost $480,869) | $ | 488,433 | ||||||
| Corporate Bonds - 24.4% | ||||||||
| Accommodation and Food Services - 0.1% | ||||||||
| Sysco Corp. | ||||||||
| $ | 2,250 | 2.35%, 10/02/2019 ╦ | $ | 2,263 | ||||
| Administrative, Support, Waste Management and Remediation Services - 0.1% | ||||||||
| Clean Harbors, Inc. | ||||||||
| 150 | 5.13%, 06/01/2021 | 152 | ||||||
| 605 | 5.25%, 08/01/2020 | 622 | ||||||
| Equinix, Inc. | ||||||||
| 605 | 4.88%, 04/01/2020 | 619 | ||||||
| 120 | 5.38%, 04/01/2023 | 124 | ||||||
| 1,517 | ||||||||
| Agriculture, Forestry, Fishing and Hunting - 0.0% | ||||||||
| Weyerhaeuser Co. | ||||||||
| 200 | 7.38%, 10/01/2019 | 242 | ||||||
| Arts, Entertainment and Recreation - 1.5% | ||||||||
| British Sky Broadcasting Group plc | ||||||||
| 2,590 | 2.63%, 09/16/2019 ■‡ | 2,597 | ||||||
| CCO Holdings LLC | ||||||||
| 35 | 5.13%, 02/15/2023 | 35 | ||||||
| 30 | 5.25%, 09/30/2022 | 30 | ||||||
| 170 | 5.75%, 09/01/2023 | 174 | ||||||
| Comcast Corp. | ||||||||
| 120 | 4.75%, 03/01/2044 ╦ | 129 | ||||||
| 425 | 5.70%, 07/01/2019 ╦ | 491 | ||||||
| DirecTV Holdings LLC | ||||||||
| 1,420 | 5.00%, 03/01/2021 | 1,564 | ||||||
| Gannett Co., Inc. | ||||||||
| 1,670 | 5.13%, 10/15/2019 | 1,737 | ||||||
| GLP Capital L.P./Financing II, Inc. | ||||||||
| 250 | 4.88%, 11/01/2020 | 260 | ||||||
| Grupo Televisa S.A.B. | ||||||||
| 570 | 5.00%, 05/13/2045 | 567 | ||||||
| NBC Universal Media LLC | ||||||||
| 1,379 | 5.95%, 04/01/2041 ╦ | 1,700 | ||||||
| News America, Inc. | ||||||||
| 2,400 | 6.15%, 03/01/2037 ‡ | 2,930 | ||||||
| 750 | 6.20%, 12/15/2034 ╦ | 936 | ||||||
| Numericable Group S.A. | ||||||||
| 280 | 4.88%, 05/15/2019 ■ | 279 | ||||||
| Time Warner Cable, Inc. | ||||||||
| 300 | 5.88%, 11/15/2040 | 353 | ||||||
| Time Warner Entertainment Co., L.P. | ||||||||
| 3,270 | 8.38%, 03/15/2023 - 07/15/2033 ‡ | 4,848 | ||||||
| Time Warner, Inc. | ||||||||
| 2,250 | 2.10%, 06/01/2019 ╦ | 2,217 | ||||||
| 1,065 | 3.40%, 06/15/2022 ╦ | 1,075 | ||||||
| 500 | 4.75%, 03/29/2021 ╦ | 550 | ||||||
| 1,650 | 6.10%, 07/15/2040 ╦ | 1,954 | ||||||
| 1,100 | 6.50%, 11/15/2036 ╦ | 1,354 | ||||||
| 25,780 | ||||||||
| Beverage and Tobacco Product Manufacturing - 0.2% | ||||||||
| Altria Group, Inc. | ||||||||
| 534 | 10.20%, 02/06/2039 ╦ | 915 | ||||||
| Anheuser-Busch InBev Worldwide, Inc. | ||||||||
| 2,000 | 0.80%, 07/15/2015 ╦ | 2,006 | ||||||
| 2,921 | ||||||||
| Chemical Manufacturing - 0.3% | ||||||||
| CF Industries Holdings, Inc. | ||||||||
| 3,165 | 5.15%, 03/15/2034 | 3,370 | ||||||
| Dow Chemical Co. | ||||||||
| 1,500 | 8.55%, 05/15/2019 | 1,889 | ||||||
| Monsanto Co. | ||||||||
| 180 | 2.75%, 07/15/2021 | 178 | ||||||
| 5,437 | ||||||||
| Computer and Electronic Product Manufacturing - 0.1% | ||||||||
| EMC Corp. | ||||||||
| 415 | 1.88%, 06/01/2018 | 413 | ||||||
| Hewlett-Packard Co. | ||||||||
| 380 | 1.17%, 01/14/2019 Δ | 379 | ||||||
| Semiconductor Manufacturing International | ||||||||
| 250 | 4.13%, 10/07/2019 ■ | 251 | ||||||
| 1,043 | ||||||||
| Construction - 0.1% | ||||||||
| Lennar Corp. | ||||||||
| 910 | 4.50%, 06/15/2019 | 926 | ||||||
| Ryland Group, Inc. | ||||||||
| 850 | 5.38%, 10/01/2022 | 833 | ||||||
| 1,759 | ||||||||
| Finance and Insurance - 12.3% | ||||||||
| Abbey National Treasury Services plc | ||||||||
| 525 | 2.35%, 09/10/2019 | 522 | ||||||
| American International Group, Inc. | ||||||||
| 480 | 4.50%, 07/16/2044 ╦ | 487 | ||||||
| 335 | 8.18%, 05/15/2058 | 455 | ||||||
| American Tower Corp. | ||||||||
| 250 | 4.50%, 01/15/2018 | 267 | ||||||
| 960 | 5.00%, 02/15/2024 | 1,010 | ||||||
| 325 | 7.00%, 10/15/2017 | 368 | ||||||
| Aquarius Invest. plc Swiss Reinsurance Co., Ltd. | ||||||||
| 400 | 6.38%, 09/01/2024 § | 417 | ||||||
| AXA S.A. | ||||||||
| 220 | 6.46%, 12/14/2018 §♠ | 230 | ||||||
| Banco Bilbao Vizcaya Argentaria S.A. | ||||||||
| EUR | 3,400 | 7.00%, 12/29/2049 § | 4,370 | |||||
| 2,000 | 9.00%, 05/09/2018 §♠ | 2,162 | ||||||
| Banco do Brasil | ||||||||
| 2,175 | 6.25%, 04/15/2024 §♠ | 1,707 | ||||||
| Banco Santander S.A. | ||||||||
| EUR | 4,600 | 6.25%, 03/12/2049 § | 5,642 | |||||
The accompanying notes are an integral part of these financial statements.
| 8 |
| The Hartford Total Return Bond Fund |
| Schedule of Investments – (continued) |
| October 31, 2014 |
| (000’s Omitted) |
| Shares or Principal Amount ╬ | Market Value ╪ | |||||||
| Corporate Bonds - 24.4% - (continued) | ||||||||
| Finance and Insurance - 12.3% - (continued) | ||||||||
| Bank of America Corp. | ||||||||
| $ | 2,280 | 4.00%, 04/01/2024 | $ | 2,356 | ||||
| 1,320 | 4.10%, 07/24/2023 | 1,378 | ||||||
| 1,105 | 4.20%, 08/26/2024 | 1,113 | ||||||
| 240 | 4.88%, 04/01/2044 | 257 | ||||||
| 795 | 5.13%, 06/17/2019 ♠ | 771 | ||||||
| 700 | 7.63%, 06/01/2019 | 849 | ||||||
| Bank of Ireland | ||||||||
| EUR | 1,660 | 10.00%, 07/30/2016 § | 2,247 | |||||
| Bankia S.A. | ||||||||
| EUR | 200 | 4.00%, 05/22/2024 §Δ | 246 | |||||
| Barclays Bank plc | ||||||||
| 7,450 | 6.05%, 12/04/2017 ■‡ | 8,254 | ||||||
| EUR | 500 | 6.50%, 06/15/2049 | 612 | |||||
| 600 | 7.75%, 04/10/2023 | 658 | ||||||
| EUR | 900 | 8.00%, 12/15/2049 | 1,170 | |||||
| 1,605 | 8.25%, 12/15/2018 ♠β | 1,657 | ||||||
| BBVA International PFD Uniperson | ||||||||
| 250 | 5.92%, 04/18/2017 ♠ | 255 | ||||||
| Bear Stearns & Co., Inc. | ||||||||
| 1,905 | 5.55%, 01/22/2017 ╦ | 2,072 | ||||||
| BP Capital Markets plc | ||||||||
| 1,240 | 2.52%, 01/15/2020 | 1,245 | ||||||
| BPCE S.A. | ||||||||
| 250 | 0.84%, 06/23/2017 ╦Δ | 250 | ||||||
| 2,380 | 2.50%, 12/10/2018 ‡ | 2,393 | ||||||
| 550 | 4.50%, 03/15/2025 ■ | 534 | ||||||
| 2,780 | 5.15%, 07/21/2024 ■ | 2,861 | ||||||
| 1,900 | 5.70%, 10/22/2023 ■╦ | 2,041 | ||||||
| Brandywine Operating Partnership L.P. | ||||||||
| 2,650 | 3.95%, 02/15/2023 | 2,663 | ||||||
| Capital One Financial Corp. | ||||||||
| 1,750 | 6.15%, 09/01/2016 | 1,904 | ||||||
| CIT Group, Inc. | ||||||||
| 40 | 5.00%, 05/15/2017 | 42 | ||||||
| 1,044 | 5.50%, 02/15/2019 ■ | 1,114 | ||||||
| 485 | 6.63%, 04/01/2018 ■ | 531 | ||||||
| Citigroup, Inc. | ||||||||
| 1,350 | 1.70%, 07/25/2016 | 1,364 | ||||||
| 975 | 2.50%, 09/26/2018 | 987 | ||||||
| 205 | 5.30%, 05/06/2044 | 218 | ||||||
| 1,835 | 6.13%, 08/25/2036 | 2,161 | ||||||
| 4,025 | 6.68%, 09/13/2043 ‡ | 5,118 | ||||||
| 683 | 8.50%, 05/22/2019 | 857 | ||||||
| CNH Industrial Capital LLC | ||||||||
| 675 | 3.38%, 07/15/2019 ■ | 656 | ||||||
| Credit Agricole S.A. | ||||||||
| EUR | 1,440 | 6.50%, 06/23/2049 § | 1,836 | |||||
| 400 | 6.63%, 09/23/2019 §♠ | 390 | ||||||
| 845 | 6.63%, 09/23/2019 ■♠Δ | 824 | ||||||
| Credit Suisse Group AG | ||||||||
| EUR | 1,010 | 5.75%, 09/18/2025 § | 1,408 | |||||
| 955 | 6.25%, 12/18/2024 ■♠Δ | 929 | ||||||
| 800 | 7.88%, 02/24/2041 § | 854 | ||||||
| Credit Suisse New York | ||||||||
| 320 | 3.00%, 10/29/2021 | 317 | ||||||
| Development Bank of Kazakhstan JSC | ||||||||
| 900 | 4.13%, 12/10/2022 § | 852 | ||||||
| Fifth Third Bancorp | ||||||||
| 375 | 4.90%, 09/30/2019 ♠ | 369 | ||||||
| General Electric Capital Corp. | ||||||||
| 2,300 | 5.30%, 02/11/2021 ‡ | 2,612 | ||||||
| 210 | 5.88%, 01/14/2038 | 258 | ||||||
| 1,700 | 6.25%, 12/15/2022 ╦♠ | 1,859 | ||||||
| Goldman Sachs Group, Inc. | ||||||||
| 100 | 3.85%, 07/08/2024 | 101 | ||||||
| 200 | 4.80%, 07/08/2044 | 207 | ||||||
| 2,696 | 6.00%, 06/15/2020 ‡ | 3,100 | ||||||
| 1,700 | 6.45%, 05/01/2036 | 2,005 | ||||||
| 3,585 | 6.75%, 10/01/2037 ‡ | 4,395 | ||||||
| HCP, Inc. | ||||||||
| 1,605 | 4.25%, 11/15/2023 ╦ | 1,665 | ||||||
| Health Care REIT, Inc. | ||||||||
| 2,950 | 4.50%, 01/15/2024 ‡ | 3,064 | ||||||
| HSBC Holdings plc | ||||||||
| 800 | 5.25%, 03/14/2044 ╦ | 869 | ||||||
| 1,250 | 5.63%, 01/17/2020 ♠ | 1,270 | ||||||
| 700 | 6.50%, 09/15/2037 ╦ | 871 | ||||||
| 3,400 | 6.80%, 06/01/2038 ‡ | 4,382 | ||||||
| JP Morgan Chase & Co. | ||||||||
| 755 | 3.38%, 05/01/2023 ╦ | 737 | ||||||
| 2,800 | 4.35%, 08/15/2021 ‡ | 3,007 | ||||||
| 500 | 4.63%, 05/10/2021 ╦ | 548 | ||||||
| 510 | 5.00%, 07/01/2019 ♠ | 502 | ||||||
| 4,305 | 5.63%, 08/16/2043 ‡ | 4,914 | ||||||
| 2,745 | 6.00%, 01/15/2018 ‡ | 3,094 | ||||||
| KBC Groep N.V. | ||||||||
| EUR | 630 | 5.63%, 03/19/2019 §♠ | 774 | |||||
| Kimco Realty Corp. | ||||||||
| 2,975 | 3.13%, 06/01/2023 ‡ | 2,897 | ||||||
| Liberty Property L.P. | ||||||||
| 950 | 3.38%, 06/15/2023 ╦ | 926 | ||||||
| 860 | 4.13%, 06/15/2022 ╦ | 894 | ||||||
| Lloyds Banking Group plc | ||||||||
| EUR | 2,860 | 6.38%, 06/27/2049 § | 3,700 | |||||
| GBP | 640 | 7.00%, 12/29/2049 § | 1,022 | |||||
| Mapfre S.A. | ||||||||
| EUR | 250 | 5.92%, 07/24/2037 | 333 | |||||
| Marsh & McLennan Cos., Inc. | ||||||||
| 635 | 2.55%, 10/15/2018 ╦ | 649 | ||||||
| 1,535 | 3.50%, 03/10/2025 ╦ | 1,536 | ||||||
| Massachusetts Mutual Life Insurance Co. | ||||||||
| 1,497 | 8.88%, 06/01/2039 ■╦ | 2,348 | ||||||
| Merrill Lynch & Co., Inc. | ||||||||
| 1,316 | 5.70%, 05/02/2017 | 1,435 | ||||||
| 8,120 | 6.05%, 05/16/2016 ‡ | 8,693 | ||||||
| 2,235 | 7.75%, 05/14/2038 | 3,091 | ||||||
| MetLife, Inc. | ||||||||
| 480 | 4.37%, 09/15/2023 ╦ | 518 | ||||||
| Minerva Luxembourg S.A. | ||||||||
| 750 | 7.75%, 01/31/2023 ■ | 784 | ||||||
| Morgan Stanley | ||||||||
| 1,975 | 2.13%, 04/25/2018 | 1,980 | ||||||
| 1,175 | 2.50%, 01/24/2019 | 1,183 | ||||||
| 1,660 | 4.35%, 09/08/2026 | 1,665 | ||||||
| 2,275 | 4.88%, 11/01/2022 | 2,423 | ||||||
| 505 | 7.30%, 05/13/2019 | 603 | ||||||
| Nationwide Building Society | ||||||||
| GBP | 2,480 | 6.88%, 03/11/2049 § | 3,878 | |||||
The accompanying notes are an integral part of these financial statements.
| 9 |
| The Hartford Total Return Bond Fund |
| Schedule of Investments – (continued) |
| October 31, 2014 |
| (000’s Omitted) |
| Shares or Principal Amount ╬ | Market Value ╪ | |||||||
| Corporate Bonds - 24.4% - (continued) | ||||||||
| Finance and Insurance - 12.3% - (continued) | ||||||||
| Nationwide Mutual Insurance Co. | ||||||||
| $ | 2,455 | 9.38%, 08/15/2039 ■‡ | $ | 3,784 | ||||
| Navient Corp. | ||||||||
| 630 | 5.50%, 01/15/2019 | 653 | ||||||
| 395 | 7.25%, 01/25/2022 | 441 | ||||||
| 945 | 8.45%, 06/15/2018 | 1,080 | ||||||
| NN Group N.V. | ||||||||
| EUR | 300 | 4.63%, 04/08/2044 § | 391 | |||||
| Pacific Life Insurance Co. | ||||||||
| 325 | 9.25%, 06/15/2039 ■ | 510 | ||||||
| PNC Bank NA | ||||||||
| 813 | 6.88%, 04/01/2018 ╦ | 942 | ||||||
| Prudential Financial, Inc. | ||||||||
| 650 | 4.60%, 05/15/2044 | 658 | ||||||
| Realty Income Corp. | ||||||||
| 1,865 | 3.25%, 10/15/2022 ╦ | 1,832 | ||||||
| Royal Bank of Scotland Group plc | ||||||||
| 2,530 | 5.13%, 05/28/2024 | 2,563 | ||||||
| 1,665 | 6.13%, 12/15/2022 | 1,802 | ||||||
| 850 | 9.50%, 03/16/2022 § | 972 | ||||||
| Santander U.S. Debt S.A. | ||||||||
| 3,400 | 3.72%, 01/20/2015 ■‡ | 3,421 | ||||||
| SBA Tower Trust | ||||||||
| 2,400 | 2.93%, 12/15/2017 ■‡ | 2,432 | ||||||
| 3,435 | 3.60%, 04/15/2043 ■ | 3,457 | ||||||
| Societe Generale | ||||||||
| 1,160 | 6.00%, 01/27/2020 ■♠ | 1,093 | ||||||
| EUR | 1,545 | 6.75%, 04/07/2049 § | 1,944 | |||||
| 200 | 7.88%, 12/18/2023 §♠ | 200 | ||||||
| 3,740 | 8.25%, 11/29/2018 §♠ | 3,952 | ||||||
| Standard Chartered plc | ||||||||
| 250 | 0.57%, 09/08/2017 ■Δ | 250 | ||||||
| 975 | 4.00%, 07/12/2022 § | 1,001 | ||||||
| State Street Corp. | ||||||||
| 905 | 4.96%, 03/15/2018 | 987 | ||||||
| Sumitomo Mitsui Financial Group, Inc. | ||||||||
| 2,945 | 4.44%, 04/02/2024 ■‡ | 3,066 | ||||||
| Teachers Insurance & Annuity Association of America | ||||||||
| 1,866 | 6.85%, 12/16/2039 ■‡ | 2,467 | ||||||
| TSMC Global Ltd. | ||||||||
| 790 | 1.63%, 04/03/2018 ■╦ | 785 | ||||||
| UBS AG Stamford CT | ||||||||
| 680 | 7.63%, 08/17/2022 | 803 | ||||||
| UDR, Inc. | ||||||||
| 785 | 3.70%, 10/01/2020 ╦ | 813 | ||||||
| UniCredit S.p.A. | ||||||||
| 720 | 8.00%, 06/03/2024 §♠ | 722 | ||||||
| UNIQA Insurance Group AG | ||||||||
| EUR | 300 | 6.88%, 07/31/2043 § | 431 | |||||
| Ventas Realty L.P. | ||||||||
| 1,520 | 2.70%, 04/01/2020 ╦ | 1,508 | ||||||
| 1,875 | 3.25%, 08/15/2022 ╦ | 1,838 | ||||||
| Wells Fargo & Co. | ||||||||
| 1,450 | 3.30%, 09/09/2024 ╦ | 1,446 | ||||||
| 1,740 | 3.45%, 02/13/2023 ╦ | 1,738 | ||||||
| 2,850 | 4.10%, 06/03/2026 ‡ | 2,891 | ||||||
| 1,975 | 4.13%, 08/15/2023 ╦ | 2,060 | ||||||
| 170 | 4.65%, 11/04/2044 ☼ | 169 | ||||||
| 74 | 5.38%, 11/02/2043 ╦ | 83 | ||||||
| Yasar Holdings | ||||||||
| 1,250 | 8.88%, 05/06/2020 ■☼ | 1,250 | ||||||
| 213,477 | ||||||||
| Food Manufacturing - 0.4% | ||||||||
| Cargill, Inc. | ||||||||
| 400 | 3.25%, 11/15/2021 ■ | 411 | ||||||
| ESAL GmbH | ||||||||
| 1,725 | 6.25%, 02/05/2023 § | 1,759 | ||||||
| Grupo Bimbo S.A.B. de C.V. | ||||||||
| 4,250 | 4.88%, 06/27/2044 ■ | 4,168 | ||||||
| 6,338 | ||||||||
| Health Care and Social Assistance - 0.6% | ||||||||
| Community Health Systems, Inc. | ||||||||
| 350 | 5.13%, 08/01/2021 | 366 | ||||||
| CVS Caremark Corp. | ||||||||
| 3,117 | 8.35%, 07/10/2031 ■‡ | 4,215 | ||||||
| Dignity Health | ||||||||
| 475 | 2.64%, 11/01/2019 ╦ | 479 | ||||||
| 135 | 5.27%, 11/01/2064 ╦ | 136 | ||||||
| HCA Holdings, Inc. | ||||||||
| 1,336 | 7.50%, 11/15/2095 | 1,283 | ||||||
| HCA, Inc. | ||||||||
| 1,485 | 6.50%, 02/15/2020 | 1,658 | ||||||
| Mylan, Inc. | ||||||||
| 480 | 6.00%, 11/15/2018 ■ | 494 | ||||||
| Tenet Healthcare Corp. | ||||||||
| 1,575 | 6.00%, 10/01/2020 | 1,693 | ||||||
| Watson Pharmaceuticals, Inc. | ||||||||
| 560 | 4.63%, 10/01/2042 | 510 | ||||||
| Wellcare Health Plans, Inc. | ||||||||
| 295 | 5.75%, 11/15/2020 | 304 | ||||||
| 11,138 | ||||||||
| Information - 2.2% | ||||||||
| Activision Blizzard, Inc. | ||||||||
| 1,735 | 5.63%, 09/15/2021 ■ | 1,846 | ||||||
| AT&T, Inc. | ||||||||
| 1,665 | 4.80%, 06/15/2044 ╦ | 1,681 | ||||||
| Audatex North America, Inc. | ||||||||
| 795 | 6.00%, 06/15/2021 ■ | 841 | ||||||
| CCOH Safari LLC | ||||||||
| 1,040 | 5.75%, 12/01/2024 ☼ | 1,046 | ||||||
| Cox Communications, Inc. | ||||||||
| 20 | 2.95%, 06/30/2023 ■ | 19 | ||||||
| DISH DBS Corp. | ||||||||
| 1,200 | 7.88%, 09/01/2019 | 1,393 | ||||||
| First Data Corp. | ||||||||
| 162 | 6.75%, 11/01/2020 ■ | 173 | ||||||
| 400 | 12.63%, 01/15/2021 | 483 | ||||||
| Inmarsat Finance plc | ||||||||
| 385 | 4.88%, 05/15/2022 ■ | 385 | ||||||
| Sprint Communications, Inc. | ||||||||
| 1,435 | 7.00%, 03/01/2020 ■ | 1,601 | ||||||
| 547 | 9.00%, 11/15/2018 ■ | 643 | ||||||
| T-Mobile USA, Inc. | ||||||||
| 1,035 | 6.46%, 04/28/2019 | 1,079 | ||||||
| 425 | 6.63%, 04/28/2021 | 448 | ||||||
| Unitymedia Hessen GmbH & Co. | ||||||||
| 1,655 | 7.50%, 03/15/2019 ■ | 1,742 | ||||||
The accompanying notes are an integral part of these financial statements.
| 10 |
| The Hartford Total Return Bond Fund |
| Schedule of Investments – (continued) |
| October 31, 2014 |
| (000’s Omitted) |
| Shares or Principal Amount ╬ | Market Value ╪ | |||||||
| Corporate Bonds - 24.4% - (continued) | ||||||||
| Information - 2.2% - (continued) | ||||||||
| Verizon Communications, Inc. | ||||||||
| $ | 2,656 | 2.63%, 02/21/2020 ■‡ | $ | 2,642 | ||||
| 2,450 | 3.50%, 11/01/2024 ‡ | 2,411 | ||||||
| 2,610 | 4.40%, 11/01/2034 ‡ | 2,549 | ||||||
| 1,520 | 5.01%, 08/21/2054 ■╦ | 1,547 | ||||||
| 4,065 | 5.15%, 09/15/2023 ‡ | 4,552 | ||||||
| 2,030 | 6.40%, 02/15/2038 ‡ | 2,482 | ||||||
| 5,228 | 6.55%, 09/15/2043 ‡ | 6,590 | ||||||
| VimpelCom Holdings B.V. | ||||||||
| 1,810 | 5.95%, 02/13/2023 ■ | 1,663 | ||||||
| Wind Acquisition Finance S.A. | ||||||||
| 540 | 4.75%, 07/15/2020 ■ | 528 | ||||||
| 38,344 | ||||||||
| Machinery Manufacturing - 0.3% | ||||||||
| Case New Holland Industrial, Inc. | ||||||||
| 995 | 7.88%, 12/01/2017 | 1,117 | ||||||
| Hutchison Whampoa International Ltd. | ||||||||
| 525 | 1.63%, 10/31/2017 ■ | 524 | ||||||
| 4,025 | 2.00%, 11/08/2017 ■‡ | 4,052 | ||||||
| 5,693 | ||||||||
| Mining - 0.5% | ||||||||
| ABJA Investment Co. Pte Ltd. | ||||||||
| 3,355 | 5.95%, 07/31/2024 § | 3,410 | ||||||
| Barrick North America Finance LLC | ||||||||
| 500 | 4.40%, 05/30/2021 | 513 | ||||||
| FMG Resources Aug 2006 | ||||||||
| 645 | 6.88%, 04/01/2022 ■ | 666 | ||||||
| Freeport-McMoRan Copper & Gold, Inc. | ||||||||
| 350 | 5.45%, 03/15/2043 | 358 | ||||||
| Glencore Funding LLC | ||||||||
| 1,835 | 1.70%, 05/27/2016 ■ | 1,847 | ||||||
| Newmont Mining Corp. | ||||||||
| 175 | 4.88%, 03/15/2042 | 146 | ||||||
| Peabody Energy Corp. | ||||||||
| 1,030 | 6.50%, 09/15/2020 | 981 | ||||||
| Steel Dynamics, Inc. | ||||||||
| 300 | 5.13%, 10/01/2021 ■ | 310 | ||||||
| 325 | 5.50%, 10/01/2024 ■ | 344 | ||||||
| 8,575 | ||||||||
| Miscellaneous Manufacturing - 0.0% | ||||||||
| Triumph Group, Inc. | ||||||||
| 485 | 5.25%, 06/01/2022 | 491 | ||||||
| Motor Vehicle and Parts Manufacturing - 0.6% | ||||||||
| Chrysler Group LLC | ||||||||
| 900 | 8.00%, 06/15/2019 | 964 | ||||||
| General Motors Co. | ||||||||
| 1,725 | 6.25%, 10/02/2043 | 2,053 | ||||||
| General Motors Financial Co., Inc. | ||||||||
| 3,400 | 3.50%, 07/10/2019 | 3,504 | ||||||
| 3,640 | 4.75%, 08/15/2017 | 3,886 | ||||||
| TRW Automotive, Inc. | ||||||||
| 425 | 7.25%, 03/15/2017 ■ | 468 | ||||||
| 10,875 | ||||||||
| Nonmetallic Mineral Product Manufacturing - 0.1% | ||||||||
| Union Andina de Cementos SAA | ||||||||
| 1,805 | 5.88%, 10/30/2021 ■ | 1,832 | ||||||
| Other Services - 0.0% | ||||||||
| Cardtronics, Inc. | ||||||||
| 695 | 5.13%, 08/01/2022 ■ | 692 | ||||||
| Paper Manufacturing - 0.1% | ||||||||
| Clearwater Paper Corp. | ||||||||
| 700 | 5.38%, 02/01/2025 ■ | 709 | ||||||
| Graphic Packaging International | ||||||||
| 535 | 4.88%, 11/15/2022 ☼ | 537 | ||||||
| 1,246 | ||||||||
| Petroleum and Coal Products Manufacturing - 2.0% | ||||||||
| Anadarko Petroleum Corp. | ||||||||
| 1,345 | 6.38%, 09/15/2017 | 1,519 | ||||||
| California Resources Corp. | ||||||||
| 555 | 5.00%, 01/15/2020 ■ | 563 | ||||||
| 260 | 5.50%, 09/15/2021 ■ | 265 | ||||||
| 180 | 6.00%, 11/15/2024 ■ | 184 | ||||||
| Cenovus Energy, Inc. | ||||||||
| 2,350 | 5.20%, 09/15/2043 | 2,511 | ||||||
| CNPC General Capital | ||||||||
| 3,700 | 1.45%, 04/16/2016 ■‡ | 3,699 | ||||||
| Denbury Resources, Inc. | ||||||||
| 350 | 5.50%, 05/01/2022 | 345 | ||||||
| EDC Finance Ltd. | ||||||||
| 1,405 | 4.88%, 04/17/2020 ■ | 1,272 | ||||||
| Enable Midstream Partners L.P. | ||||||||
| 80 | 5.00%, 05/15/2044 ■ | 81 | ||||||
| Harvest Operations Corp. | ||||||||
| 736 | 6.88%, 10/01/2017 | 751 | ||||||
| Kosmos Energy Ltd. | ||||||||
| 375 | 7.88%, 08/01/2021 § | 345 | ||||||
| Lukoil International Finance B.V. | ||||||||
| 3,300 | 3.42%, 04/24/2018 ■ | 3,147 | ||||||
| Nexen, Inc. | ||||||||
| 485 | 7.50%, 07/30/2039 ╦ | 681 | ||||||
| Pemex Project Funding Master Trust | ||||||||
| 2,350 | 6.63%, 06/15/2035 ‡ | 2,773 | ||||||
| Pertamina Persero PT | ||||||||
| 1,825 | 5.63%, 05/20/2043 § | 1,747 | ||||||
| Petrobras Global Finance Co. | ||||||||
| 1,775 | 3.00%, 01/15/2019 ╦ | 1,730 | ||||||
| Petrobras International Finance Co. | ||||||||
| 340 | 5.38%, 01/27/2021 ╦ | 348 | ||||||
| Pioneer Natural Resources Co. | ||||||||
| 290 | 6.65%, 03/15/2017 | 321 | ||||||
| Plains Exploration & Production Co. | ||||||||
| 1,150 | 6.63%, 05/01/2021 | 1,258 | ||||||
| 713 | 6.88%, 02/15/2023 | 806 | ||||||
| Tesoro Corp. | ||||||||
| 105 | 5.13%, 04/01/2024 | 105 | ||||||
| Tesoro Logistics L.P. | ||||||||
| 320 | 5.50%, 10/15/2019 ■ | 329 | ||||||
| 480 | 6.25%, 10/15/2022 ■ | 497 | ||||||
| Transocean, Inc. | ||||||||
| 225 | 6.38%, 12/15/2021 | 236 | ||||||
| 625 | 6.50%, 11/15/2020 | 643 | ||||||
| Tullow Oil plc | ||||||||
| 275 | 6.00%, 11/01/2020 ■ | 257 | ||||||
| Valero Energy Corp. | ||||||||
| 1,911 | 9.38%, 03/15/2019 ‡ | 2,438 | ||||||
The accompanying notes are an integral part of these financial statements.
| 11 |
| The Hartford Total Return Bond Fund |
| Schedule of Investments – (continued) |
| October 31, 2014 |
| (000’s Omitted) |
| Shares or Principal Amount ╬ | Market Value ╪ | |||||||
| Corporate Bonds - 24.4% - (continued) | ||||||||
| Petroleum and Coal Products Manufacturing - 2.0% - (continued) | ||||||||
| Williams Partners L.P. | ||||||||
| $ | 2,925 | 3.90%, 01/15/2025 ‡ | $ | 2,902 | ||||
| 2,200 | 4.30%, 03/04/2024 ╦ | 2,277 | ||||||
| WPX Energy, Inc. | ||||||||
| 635 | 5.25%, 09/15/2024 | 619 | ||||||
| 34,649 | ||||||||
| Pipeline Transportation - 0.7% | ||||||||
| El Paso Corp. | ||||||||
| 900 | 7.00%, 06/15/2017 | 1,001 | ||||||
| Energy Transfer Equity L.P. | ||||||||
| 3,975 | 5.95%, 10/01/2043 | 4,392 | ||||||
| 1,840 | 6.50%, 02/01/2042 | 2,127 | ||||||
| 1,138 | 7.50%, 10/15/2020 | 1,309 | ||||||
| Kinder Morgan Energy Partners L.P. | ||||||||
| 2,070 | 5.50%, 03/01/2044 | 2,073 | ||||||
| Kinder Morgan Finance Co. | ||||||||
| 720 | 6.00%, 01/15/2018 ■ | 790 | ||||||
| Southern Star Central Corp. | ||||||||
| 75 | 5.13%, 07/15/2022 ■ | 76 | ||||||
| 11,768 | ||||||||
| Plastics and Rubber Products Manufacturing - 0.0% | ||||||||
| Continental Rubber of America Corp. | ||||||||
| 475 | 4.50%, 09/15/2019 ■ | 497 | ||||||
| Primary Metal Manufacturing - 0.0% | ||||||||
| United States Steel Corp. | ||||||||
| 550 | 7.38%, 04/01/2020 | 616 | ||||||
| Printing and Related Support Activities - 0.1% | ||||||||
| Deluxe Corp. | ||||||||
| 760 | 7.00%, 03/15/2019 | 798 | ||||||
| Rail Transportation - 0.1% | ||||||||
| Canadian Pacific Railway Co. | ||||||||
| 725 | 9.45%, 08/01/2021 | 989 | ||||||
| Real Estate, Rental and Leasing - 0.8% | ||||||||
| Air Lease Corp. | ||||||||
| 500 | 2.13%, 01/15/2018 | 494 | ||||||
| Duke Realty L.P. | ||||||||
| 1,625 | 3.63%, 04/15/2023 | 1,602 | ||||||
| ERAC USA Finance Co. | ||||||||
| 115 | 2.35%, 10/15/2019 ■ | 114 | ||||||
| International Lease Finance Corp. | ||||||||
| 2,105 | 5.88%, 04/01/2019 | 2,268 | ||||||
| 1,025 | 6.75%, 09/01/2016 ■ | 1,087 | ||||||
| Kennedy-Wilson, Inc. | ||||||||
| 905 | 8.75%, 04/01/2019 | 962 | ||||||
| ProLogis L.P. | ||||||||
| 6,400 | 3.35%, 02/01/2021 ‡ | 6,467 | ||||||
| Ryder System, Inc. | ||||||||
| 1,095 | 2.55%, 06/01/2019 ╦ | 1,101 | ||||||
| 14,095 | ||||||||
| Retail Trade - 0.4% | ||||||||
| Arcelik AS | ||||||||
| 1,265 | 5.00%, 04/03/2023 ■ | 1,195 | ||||||
| Building Materials Corp. | ||||||||
| 190 | 5.38%, 11/15/2024 ■☼ | 190 | ||||||
| 831 | 7.50%, 03/15/2020 ■ | 880 | ||||||
| Group 1 Automotive, Inc. | ||||||||
| 640 | 5.00%, 06/01/2022 ■ | 634 | ||||||
| Home Depot, Inc. | ||||||||
| 260 | 4.20%, 04/01/2043 | 266 | ||||||
| Jaguar Land Rover plc | ||||||||
| 450 | 8.13%, 05/15/2021 ■ | 495 | ||||||
| Sotheby's | ||||||||
| 910 | 5.25%, 10/01/2022 ■ | 892 | ||||||
| Wal-Mart Stores, Inc. | ||||||||
| 1,485 | 4.30%, 04/22/2044 ╦ | 1,548 | ||||||
| William Carter Co. | ||||||||
| 1,375 | 5.25%, 08/15/2021 | 1,416 | ||||||
| 7,516 | ||||||||
| Truck Transportation - 0.2% | ||||||||
| Penske Truck Leasing Co. | ||||||||
| 565 | 2.50%, 06/15/2019 ■ | 563 | ||||||
| 1,150 | 2.88%, 07/17/2018 ■ | 1,171 | ||||||
| 915 | 4.88%, 07/11/2022 ■ | 990 | ||||||
| 2,724 | ||||||||
| Utilities - 0.6% | ||||||||
| AES (The) Corp. | ||||||||
| 195 | 5.50%, 03/15/2024 | 200 | ||||||
| 212 | 9.75%, 04/15/2016 | 234 | ||||||
| Appalachian Power Co. | ||||||||
| 95 | 4.40%, 05/15/2044 ╦ | 96 | ||||||
| Berkshire Hathaway Energy Co. | ||||||||
| 3,385 | 8.48%, 09/15/2028 ‡ | 4,986 | ||||||
| CenterPoint Energy, Inc. | ||||||||
| 1,700 | 6.85%, 06/01/2015 ╦ | 1,759 | ||||||
| Dolphin Subsidiary II, Inc. | ||||||||
| 295 | 7.25%, 10/15/2021 | 313 | ||||||
| EDP Finance B.V. | ||||||||
| 360 | 5.25%, 01/14/2021 ■ | 374 | ||||||
| Pacific Gas & Electric Co. | ||||||||
| 725 | 3.75%, 02/15/2024 ╦ | 752 | ||||||
| 675 | 8.25%, 10/15/2018 ╦ | 823 | ||||||
| 9,537 | ||||||||
| Total Corporate Bonds | ||||||||
| (Cost $408,361) | $ | 422,852 | ||||||
| Foreign Government Obligations - 2.1% | ||||||||
| Angola - 0.1% | ||||||||
| Angola (Republic of) | ||||||||
| $ | 1,625 | 7.00%, 08/16/2019 § | $ | 1,737 | ||||
| Armenia - 0.1% | ||||||||
| Armenia (Republic of) | ||||||||
| 1,700 | 6.00%, 09/30/2020 § | 1,777 | ||||||
| Azerbaijan - 0.1% | ||||||||
| Azerbaijan (Republic of) | ||||||||
| 1,745 | 4.75%, 03/13/2023 § | 1,733 | ||||||
| Brazil - 0.4% | ||||||||
| Brazil (Federative Republic of) | ||||||||
| 2,300 | 4.88%, 01/22/2021 | 2,478 | ||||||
| BRL | 18,750 | 9.70%, 09/01/2020 ○ | 4,859 | |||||
| 7,337 | ||||||||
The accompanying notes are an integral part of these financial statements.
| 12 |
| The Hartford Total Return Bond Fund |
| Schedule of Investments – (continued) |
| October 31, 2014 |
| (000’s Omitted) |
| Shares or Principal Amount ╬ | Market Value ╪ | |||||||
| Foreign Government Obligations - 2.1% - (continued) | ||||||||
| Costa Rica - 0.1% | ||||||||
| Costa Rica (Republic of) | ||||||||
| $ | 2,000 | 5.63%, 04/30/2043 § | $ | 1,750 | ||||
| Dominican Republic - 0.2% | ||||||||
| Dominican (Republic of) | ||||||||
| DOP | 120,000 | 11.50%, 05/10/2024 ■ | 2,794 | |||||
| Indonesia - 0.1% | ||||||||
| Indonesia (Republic of) | ||||||||
| IDR | 29,000,000 | 8.38%, 03/15/2024 | 2,451 | |||||
| Latvia - 0.0% | ||||||||
| Latvia (Republic of) | ||||||||
| 400 | 2.75%, 01/12/2020 § | 395 | ||||||
| Mexico - 0.3% | ||||||||
| Mexico (United Mexican States) | ||||||||
| MXN | 41,760 | 4.00%, 06/13/2019 ◄‡ | 3,426 | |||||
| 2,524 | 4.75%, 03/08/2044 ‡ | 2,563 | ||||||
| 5,989 | ||||||||
| Russia - 0.2% | ||||||||
| Russia (Federation of) | ||||||||
| 500 | 3.63%, 04/29/2015 § | 502 | ||||||
| RUB | 96,950 | 7.50%, 02/27/2019 Δ | 2,067 | |||||
| 2,569 | ||||||||
| South Africa - 0.2% | ||||||||
| South Africa (Republic of) | ||||||||
| ZAR | 36,200 | 7.75%, 02/28/2023 | 3,294 | |||||
| Uruguay - 0.2% | ||||||||
| Uruguay (Republic of) | ||||||||
| UYU | 74,364 | 4.25%, 04/05/2027 ◄‡ | 3,297 | |||||
| Venezuela - 0.1% | ||||||||
| Venezuela (Republic of) | ||||||||
| 3,050 | 7.00%, 03/31/2038 § | 1,754 | ||||||
| Total Foreign Government Obligations | ||||||||
| (Cost $37,744) | $ | 36,877 | ||||||
| Municipal Bonds - 0.9% | ||||||||
| General Obligations - 0.4% | ||||||||
| California State GO | ||||||||
| $ | 1,300 | 7.50%, 04/01/2034 ╦ | $ | 1,875 | ||||
| California State GO, Taxable | ||||||||
| 3,625 | 7.55%, 04/01/2039 ‡ | 5,444 | ||||||
| Illinois State GO | ||||||||
| 230 | 5.88%, 03/01/2019 | 255 | ||||||
| 7,574 | ||||||||
| Higher Education (Univ., Dorms, etc.) - 0.2% | ||||||||
| Massachusetts State Development Fin Agency Rev | ||||||||
| 130 | 5.35%, 12/01/2028 | 145 | ||||||
| University of California | ||||||||
| 2,365 | 4.60%, 05/15/2031 ‡ | 2,563 | ||||||
| 2,708 | ||||||||
| Miscellaneous - 0.2% | ||||||||
| Puerto Rico Government Employees Retirement System | ||||||||
| 950 | 6.15%, 07/01/2038 | 470 | ||||||
| 750 | 6.20%, 07/01/2039 | 371 | ||||||
| 3,350 | 6.30%, 07/01/2043 | 1,642 | ||||||
| 975 | 6.55%, 07/01/2058 | 476 | ||||||
| 2,959 | ||||||||
| Utilities - Electric - 0.1% | ||||||||
| Municipal Elec Auth Georgia | ||||||||
| 1,285 | 6.64%, 04/01/2057 ╦ | 1,636 | ||||||
| Total Municipal Bonds | ||||||||
| (Cost $13,903) | $ | 14,877 | ||||||
| Senior Floating Rate Interests ♦ - 5.0% | ||||||||
| Administrative, Support, Waste Management and Remediation Services - 0.1% | ||||||||
| Acosta Holdco, Inc. | ||||||||
| $ | 485 | 5.00%, 09/26/2021 | $ | 485 | ||||
| Audio Visual Services Group, Inc. | ||||||||
| 537 | 4.50%, 01/25/2021 | 533 | ||||||
| ServiceMaster (The) Co. | ||||||||
| 424 | 4.25%, 07/01/2021 | 420 | ||||||
| 1,438 | ||||||||
| Agriculture, Construction, Mining and Machinery - 0.0% | ||||||||
| Signode Industrial Group US, Inc. | ||||||||
| 644 | 4.00%, 05/01/2021 | 632 | ||||||
| Air Transportation - 0.0% | ||||||||
| Delta Air Lines, Inc. | ||||||||
| 447 | 3.25%, 10/18/2018 | 437 | ||||||
| Arts, Entertainment and Recreation - 0.5% | ||||||||
| 24 Hour Fitness Worldwide, Inc. | ||||||||
| 808 | 4.75%, 05/28/2021 | 806 | ||||||
| Aristocrat Leisure Ltd. | ||||||||
| 585 | 4.75%, 10/20/2021 | 580 | ||||||
| Caesars Entertainment Operating Co., Inc. | ||||||||
| 296 | 5.99%, 03/01/2017 | 263 | ||||||
| 1,801 | 6.99%, 03/01/2017 | 1,612 | ||||||
| Caesars Growth Property Holdings LLC | ||||||||
| 334 | 6.25%, 05/08/2021 | 315 | ||||||
| Formula One Holdings | ||||||||
| 850 | 4.75%, 07/30/2021 | 843 | ||||||
| 355 | 7.75%, 07/29/2022 | 353 | ||||||
| MGM Resorts International | ||||||||
| 614 | 3.50%, 12/20/2019 | 606 | ||||||
| Numericable | ||||||||
| 550 | 4.50%, 05/21/2020 | 551 | ||||||
| Scientific Games International, Inc. | ||||||||
| 270 | 6.00%, 10/01/2021 | 264 | ||||||
| Station Casinos LLC | ||||||||
| 183 | 4.25%, 03/02/2020 | 181 | ||||||
| Templar Energy | ||||||||
| 350 | 8.50%, 11/25/2020 | 315 | ||||||
| Tribune Co. | ||||||||
| 1,180 | 4.00%, 12/27/2020 ☼ | 1,170 | ||||||
| 7,859 | ||||||||
The accompanying notes are an integral part of these financial statements.
| 13 |
| The Hartford Total Return Bond Fund |
| Schedule of Investments – (continued) |
| October 31, 2014 |
| (000’s Omitted) |
| Shares or Principal Amount ╬ | Market Value ╪ | |||||||
| Senior Floating Rate Interests ♦ - 5.0% - (continued) | ||||||||
| Chemical Manufacturing - 0.2% | ||||||||
| Cytec Industries, Inc. | ||||||||
| $ | 106 | 4.50%, 10/03/2019 | $ | 106 | ||||
| Ferro Corp. | ||||||||
| 350 | 4.00%, 07/30/2021 | 345 | ||||||
| Huntsman International LLC, Extended Term Loan B | ||||||||
| 346 | 2.68%, 04/19/2017 | 342 | ||||||
| Ineos US Finance LLC | ||||||||
| 1,767 | 3.75%, 05/04/2018 | 1,742 | ||||||
| Minerals Technologies, Inc. | ||||||||
| 435 | 4.00%, 05/07/2021 | 433 | ||||||
| Monarch, Inc. | ||||||||
| 205 | 4.50%, 10/03/2019 | 203 | ||||||
| Pinnacle Operating Corp. | ||||||||
| 392 | 4.75%, 11/15/2018 | 389 | ||||||
| Univar, Inc. | ||||||||
| 189 | 5.00%, 06/30/2017 | 187 | ||||||
| 3,747 | ||||||||
| Computer and Electronic Product Manufacturing - 0.2% | ||||||||
| Avago Technologies Ltd. | ||||||||
| 653 | 3.75%, 05/06/2021 | 651 | ||||||
| CDW LLC | ||||||||
| 1,521 | 3.25%, 04/29/2020 ☼ | 1,486 | ||||||
| Freescale Semiconductor, Inc. | ||||||||
| 448 | 4.25%, 02/28/2020 | 442 | ||||||
| 595 | 5.00%, 01/15/2021 | 594 | ||||||
| NXP Semiconductors Netherlands B.V. | ||||||||
| 707 | 3.25%, 01/11/2020 | 699 | ||||||
| 3,872 | ||||||||
| Finance and Insurance - 0.5% | ||||||||
| Asurion LLC | ||||||||
| 493 | 5.00%, 05/24/2019 | 493 | ||||||
| 715 | 8.50%, 03/03/2021 | 726 | ||||||
| Chrysler Group LLC | ||||||||
| 1,085 | 3.25%, 12/31/2018 | 1,073 | ||||||
| 1,372 | 3.50%, 05/24/2017 | 1,364 | ||||||
| Cooper Gay Swett & Crawford Ltd. | ||||||||
| 360 | 5.00%, 04/16/2020 | 324 | ||||||
| Evertec LLC | ||||||||
| 943 | 3.50%, 04/17/2020 | 926 | ||||||
| Interactive Data Corp. | ||||||||
| 390 | 4.75%, 05/02/2021 | 390 | ||||||
| National Financial Partners Corp. | ||||||||
| 164 | 4.50%, 07/01/2020 | 163 | ||||||
| Sedgwick CMS Holdings, Inc. | ||||||||
| 1,740 | 3.75%, 03/01/2021 | 1,689 | ||||||
| 580 | 6.75%, 02/28/2022 | 563 | ||||||
| USI Insurance Services LLC | ||||||||
| 890 | 4.25%, 12/27/2019 | 880 | ||||||
| Walter Investment Management Corp. | ||||||||
| 745 | 4.75%, 12/18/2020 | 700 | ||||||
| 9,291 | ||||||||
| Food Manufacturing - 0.2% | ||||||||
| Burger King Co. | ||||||||
| 415 | 4.50%, 10/27/2021 | 414 | ||||||
| H.J. Heinz Co. | ||||||||
| 2,252 | 3.50%, 06/05/2020 | 2,237 | ||||||
| Hearthside Food Solutions | ||||||||
| 289 | 4.50%, 06/02/2021 | 287 | ||||||
| Hostess Brands, Inc. | ||||||||
| 159 | 6.75%, 04/09/2020 | 162 | ||||||
| Roundy's Supermarkets, Inc. | ||||||||
| 264 | 5.75%, 03/03/2021 | 234 | ||||||
| U.S. Foodservice, Inc. | ||||||||
| 456 | 4.50%, 03/31/2019 | 455 | ||||||
| 3,789 | ||||||||
| Food Services - 0.1% | ||||||||
| ARAMARK Corp. | ||||||||
| 1,114 | 3.25%, 02/24/2021 | 1,097 | ||||||
| Furniture and Related Product Manufacturing - 0.0% | ||||||||
| Tempur Sealy International, Inc. | ||||||||
| 362 | 3.50%, 03/18/2020 | 357 | ||||||
| Wilsonart International Holdings LLC | ||||||||
| 314 | 4.00%, 10/31/2019 | 309 | ||||||
| 666 | ||||||||
| Health Care and Social Assistance - 0.4% | ||||||||
| American Renal Holdings, Inc. | ||||||||
| 511 | 4.50%, 08/20/2019 | 501 | ||||||
| AmSurg Corp. | ||||||||
| 449 | 3.75%, 07/16/2021 | 445 | ||||||
| Community Health Systems, Inc. | ||||||||
| 605 | 4.25%, 01/27/2021 | 606 | ||||||
| DaVita HealthCare Partners, Inc. | ||||||||
| 873 | 3.50%, 06/24/2021 | 865 | ||||||
| HCA, Inc. | ||||||||
| 965 | 2.98%, 05/01/2018 | 960 | ||||||
| Healogics, Inc. | ||||||||
| 190 | 5.25%, 07/01/2021 | 189 | ||||||
| Ikaria Acquisition, Inc. | ||||||||
| 235 | 5.00%, 02/12/2021 | 235 | ||||||
| IMS Health, Inc. | ||||||||
| 459 | 3.50%, 03/17/2021 | 453 | ||||||
| Jazz Pharmaceuticals, Inc. | ||||||||
| 427 | 3.25%, 06/12/2018 | 423 | ||||||
| Mallinckrodt International Finance S.A. | ||||||||
| 672 | 3.50%, 03/19/2021 | 665 | ||||||
| One Call Medical, Inc. | ||||||||
| 831 | 5.00%, 11/27/2020 | 827 | ||||||
| Ortho-Clinical Diagnostics, Inc. | ||||||||
| 868 | 4.75%, 06/30/2021 | 858 | ||||||
| STHI Holding Corp. | ||||||||
| 160 | 4.50%, 08/06/2021 | 159 | ||||||
| Surgery Center Holdings, Inc. | ||||||||
| 260 | 5.25%, 07/24/2020 ☼ | 259 | ||||||
| 7,445 | ||||||||
| Information - 0.8% | ||||||||
| Charter Communications Operating LLC | ||||||||
| 1,852 | 3.00%, 07/01/2020 - 01/03/2021 | 1,817 | ||||||
| 260 | 4.25%, 09/10/2021 | 262 | ||||||
| Eagle Parent, Inc. | ||||||||
| 191 | 4.00%, 05/16/2018 | 189 | ||||||
| First Data Corp. | ||||||||
| 2,555 | 3.65%, 03/23/2018 | 2,530 | ||||||
| 380 | 4.15%, 03/24/2021 | 377 | ||||||
| Hyland Software, Inc. | ||||||||
| 155 | 4.75%, 02/19/2021 | 155 | ||||||
The accompanying notes are an integral part of these financial statements.
| 14 |
| The Hartford Total Return Bond Fund |
| Schedule of Investments – (continued) |
| October 31, 2014 |
| (000’s Omitted) |
| Shares or Principal Amount ╬ | Market Value ╪ | |||||||
| Senior Floating Rate Interests ♦ - 5.0% - (continued) | ||||||||
| Information - 0.8% - (continued) | ||||||||
| Kronos, Inc. | ||||||||
| $ | 1,232 | 4.50%, 10/30/2019 | $ | 1,226 | ||||
| 315 | 9.75%, 04/30/2020 | 323 | ||||||
| La Quinta Intermediate Holdings | ||||||||
| 582 | 4.00%, 04/14/2021 | 577 | ||||||
| Lawson Software, Inc. | ||||||||
| 1,022 | 3.75%, 06/03/2020 | 1,008 | ||||||
| Level 3 Financing, Inc. | ||||||||
| 1,090 | 4.50%, 01/31/2022 ☼ | 1,094 | ||||||
| Syniverse Holdings, Inc. | ||||||||
| 456 | 4.00%, 04/23/2019 | 447 | ||||||
| Verint Systems, Inc. | ||||||||
| 721 | 3.50%, 09/06/2019 | 715 | ||||||
| Virgin Media Finance plc | ||||||||
| 1,470 | 3.50%, 06/07/2020 | 1,448 | ||||||
| Zayo Group LLC | ||||||||
| 975 | 4.00%, 07/02/2019 | 966 | ||||||
| Ziggo B.V. | ||||||||
| 819 | 2.75%, 01/15/2022 ☼ | 797 | ||||||
| 481 | 3.25%, 01/15/2022 | 468 | ||||||
| 14,399 | ||||||||
| Mining - 0.3% | ||||||||
| American Rock Salt Holdings LLC | ||||||||
| 978 | 4.75%, 05/20/2021 | 968 | ||||||
| Arch Coal, Inc. | ||||||||
| 1,834 | 6.25%, 05/16/2018 | 1,616 | ||||||
| BWAY Holding Co. | ||||||||
| 684 | 5.50%, 08/14/2020 ☼ | 687 | ||||||
| Fortescue Metals Group Ltd. | ||||||||
| 1,098 | 3.75%, 06/30/2019 | 1,070 | ||||||
| 4,341 | ||||||||
| Miscellaneous Manufacturing - 0.1% | ||||||||
| DigitalGlobe, Inc. | ||||||||
| 360 | 3.75%, 01/31/2020 | 357 | ||||||
| Hamilton Sundstrand Corp. | ||||||||
| 330 | 4.00%, 12/13/2019 | 324 | ||||||
| Reynolds Group Holdings, Inc. | ||||||||
| 757 | 4.00%, 11/30/2018 | 752 | ||||||
| 1,433 | ||||||||
| Motor Vehicle and Parts Manufacturing - 0.1% | ||||||||
| Tower Automotive Holdings USA LLC | ||||||||
| 1,102 | 4.00%, 04/23/2020 | 1,086 | ||||||
| Nonmetallic Mineral Product Manufacturing - 0.0% | ||||||||
| Ardagh Holdings USA, Inc. | ||||||||
| 209 | 4.00%, 12/17/2019 | 207 | ||||||
| Other Services - 0.1% | ||||||||
| Apex Tool Group LLC | ||||||||
| 601 | 4.50%, 01/31/2020 | 569 | ||||||
| Husky Injection Molding Systems Ltd. | ||||||||
| 154 | 4.25%, 06/30/2021 | 152 | ||||||
| Rexnord LLC | ||||||||
| 866 | 4.00%, 08/21/2020 | 854 | ||||||
| 1,575 | ||||||||
| Petroleum and Coal Products Manufacturing - 0.1% | ||||||||
| American Energy-Marcellus LLC | ||||||||
| 325 | 5.25%, 08/04/2020 | 316 | ||||||
| Chief Exploration & Development | ||||||||
| 330 | 7.50%, 05/16/2021 | 317 | ||||||
| Drillships Ocean Ventures, Inc. | ||||||||
| 259 | 5.50%, 07/25/2021 | 249 | ||||||
| Fieldwood Energy LLC | ||||||||
| 655 | 3.88%, 09/28/2018 | 640 | ||||||
| Seadrill Ltd. | ||||||||
| 1,123 | 4.00%, 02/21/2021 | 1,059 | ||||||
| 2,581 | ||||||||
| Pipeline Transportation - 0.1% | ||||||||
| EP Energy LLC | ||||||||
| 645 | 4.50%, 04/30/2019 | 641 | ||||||
| Philadelphia Energy Solutions LLC | ||||||||
| 364 | 6.25%, 04/04/2018 | 344 | ||||||
| 985 | ||||||||
| Plastics and Rubber Products Manufacturing - 0.1% | ||||||||
| Berry Plastics Group, Inc. | ||||||||
| 1,527 | 3.50%, 02/08/2020 | 1,493 | ||||||
| Consolidated Container Co. | ||||||||
| 510 | 5.00%, 07/03/2019 | 503 | ||||||
| 1,996 | ||||||||
| Primary Metal Manufacturing - 0.1% | ||||||||
| Novelis, Inc. | ||||||||
| 1,764 | 3.75%, 03/10/2017 | 1,744 | ||||||
| Professional, Scientific and Technical Services - 0.1% | ||||||||
| Advantage Sales & Marketing, Inc. | ||||||||
| 440 | 4.25%, 07/23/2021 | 436 | ||||||
| MoneyGram International, Inc. | ||||||||
| 1,002 | 4.25%, 03/27/2020 | 968 | ||||||
| 1,404 | ||||||||
| Real Estate, Rental and Leasing - 0.2% | ||||||||
| DTZ U.S. Borrower LLC | ||||||||
| 620 | 5.00%, 10/23/2021 - 10/28/2021 ☼ | 620 | ||||||
| 235 | 8.25%, 10/28/2022 ☼ | 235 | ||||||
| International Lease Finance Corp. | ||||||||
| 325 | 3.50%, 03/06/2021 | 323 | ||||||
| Neff Corp. | ||||||||
| 380 | 7.25%, 06/09/2021 | 381 | ||||||
| SBA Senior Finance II LLC | ||||||||
| 1,835 | 3.25%, 03/24/2021 | 1,802 | ||||||
| 3,361 | ||||||||
| Retail Trade - 0.4% | ||||||||
| Affinia Group, Inc. | ||||||||
| 252 | 4.75%, 04/27/2020 | 252 | ||||||
| Albertson's LLC | ||||||||
| 675 | 4.50%, 08/25/2021 ☼ | 675 | ||||||
| American Builders & Contractors Supply Co., Inc. | ||||||||
| 421 | 3.50%, 04/16/2020 | 411 | ||||||
| Cooper-Standard Automotive, Inc. | ||||||||
| 339 | 4.00%, 04/04/2021 | 335 | ||||||
| Lands' End, Inc. | ||||||||
| 343 | 4.25%, 04/04/2021 | 335 | ||||||
| Mauser-Werke GmbH | ||||||||
| 220 | 4.50%, 07/31/2021 | 216 | ||||||
| Metaldyne Performance Group, Inc. | ||||||||
| 430 | 4.50%, 10/20/2021 ☼ | 430 | ||||||
| Michaels Stores, Inc. | ||||||||
| 453 | 3.75%, 01/28/2020 | 445 | ||||||
| 605 | 4.00%, 01/28/2020 | 597 | ||||||
The accompanying notes are an integral part of these financial statements.
| 15 |
| The Hartford Total Return Bond Fund |
| Schedule of Investments – (continued) |
| October 31, 2014 |
| (000’s Omitted) |
| Shares or Principal Amount ╬ | Market Value ╪ | |||||||
| Senior Floating Rate Interests ♦ - 5.0% - (continued) | ||||||||
| Retail Trade - 0.4% - (continued) | ||||||||
| Neiman Marcus (The) Group, Inc. | ||||||||
| $ | 684 | 4.25%, 10/25/2020 | $ | 675 | ||||
| Rite Aid Corp. | ||||||||
| 115 | 5.75%, 08/21/2020 | 115 | ||||||
| Weight Watchers International, Inc. | ||||||||
| 2,620 | 4.00%, 04/02/2020 | 1,998 | ||||||
| 6,484 | ||||||||
| Truck Transportation - 0.0% | ||||||||
| Nexeo Solutions LLC | ||||||||
| 289 | 5.00%, 09/09/2017 | 285 | ||||||
| Utilities - 0.2% | ||||||||
| Calpine Corp. | ||||||||
| 1,017 | 3.25%, 01/31/2022 | 991 | ||||||
| Energy Future Holdings | ||||||||
| 280 | 4.25%, 06/19/2016 | 279 | ||||||
| Star West Generation LLC | ||||||||
| 1,331 | 4.25%, 03/13/2020 | 1,317 | ||||||
| Texas Competitive Electric Holdings Co. LLC | ||||||||
| 350 | 4.65%, 10/10/2017 Ψ | 255 | ||||||
| 2,842 | ||||||||
| Wholesale Trade - 0.1% | ||||||||
| Gates Global LLC | ||||||||
| 960 | 4.25%, 07/05/2021 | 948 | ||||||
| Total Senior Floating Rate Interests | ||||||||
| (Cost $87,680) | $ | 85,944 | ||||||
| U.S. Government Agencies - 31.9% | ||||||||
| FHLMC - 8.0% | ||||||||
| $ | 30,078 | 0.53%, 10/25/2020 ► | $ | 438 | ||||
| 13,870 | 2.15%, 08/25/2018 ► | 894 | ||||||
| 42,952 | 3.00%, 08/01/2029 - 11/15/2044 ☼,Ð | 43,402 | ||||||
| 10,157 | 3.50%, 11/15/2029 - 08/01/2034 ☼,Ð | 10,660 | ||||||
| 31,570 | 4.00%, 08/01/2025 - 11/15/2044 ☼,Ð | 33,584 | ||||||
| 31,400 | 4.50%, 11/15/2044 ☼,Ð | 34,010 | ||||||
| 11,032 | 5.50%, 11/01/2037 - 06/01/2041 | 12,314 | ||||||
| 2,976 | 6.00%, 01/01/2023 - 11/15/2044 ☼,Ð | 3,371 | ||||||
| 138,673 | ||||||||
| FNMA - 17.6% | ||||||||
| 3,161 | 2.14%, 11/01/2022 | 3,086 | ||||||
| 4,521 | 2.15%, 10/01/2022 | 4,410 | ||||||
| 2,165 | 2.20%, 12/01/2022 | 2,122 | ||||||
| 1,271 | 2.28%, 11/01/2022 | 1,247 | ||||||
| 58 | 2.29%, 10/01/2022 | 57 | ||||||
| 1,075 | 2.34%, 11/01/2022 | 1,059 | ||||||
| 990 | 2.40%, 10/01/2022 | 979 | ||||||
| 844 | 2.42%, 11/01/2022 | 835 | ||||||
| 60 | 2.44%, 01/01/2023 | 59 | ||||||
| 48 | 2.45%, 08/01/2022 | 48 | ||||||
| 866 | 2.47%, 11/01/2022 | 860 | ||||||
| 18,190 | 2.50%, 11/15/2029 - 11/15/2044 ☼,Ð | 17,985 | ||||||
| 58 | 2.66%, 09/01/2022 | 58 | ||||||
| 510 | 2.76%, 05/01/2021 | 522 | ||||||
| 81 | 2.78%, 04/01/2022 | 83 | ||||||
| 350 | 2.94%, 06/01/2022 | 360 | ||||||
| 81 | 2.98%, 01/01/2022 | 84 | ||||||
| 70,400 | 3.00%, 11/15/2029 - 11/15/2044 ☼,Ð | 71,605 | ||||||
| 1,965 | 3.10%, 09/01/2024 | 2,010 | ||||||
| 58 | 3.20%, 04/01/2022 | 60 | ||||||
| 1,465 | 3.21%, 05/01/2023 | 1,516 | ||||||
| 497 | 3.26%, 05/01/2024 | 515 | ||||||
| 255 | 3.34%, 04/01/2024 | 266 | ||||||
| 1,971 | 3.42%, 04/01/2024 | 2,070 | ||||||
| 100 | 3.45%, 01/01/2024 | 105 | ||||||
| 104 | 3.47%, 01/01/2024 | 109 | ||||||
| 73,800 | 3.50%, 11/15/2044 - 12/15/2044 ☼,Ð | 76,260 | ||||||
| 256 | 3.67%, 08/01/2023 | 274 | ||||||
| 70 | 3.70%, 10/01/2023 | 75 | ||||||
| 95 | 3.76%, 03/01/2024 | 102 | ||||||
| 210 | 3.86%, 11/01/2023 - 12/01/2025 | 227 | ||||||
| 242 | 3.87%, 10/01/2025 | 261 | ||||||
| 314 | 3.89%, 05/01/2030 | 331 | ||||||
| 325 | 3.93%, 10/01/2023 | 354 | ||||||
| 139 | 3.96%, 05/01/2034 | 148 | ||||||
| 85 | 3.97%, 05/01/2029 | 91 | ||||||
| 29,140 | 4.00%, 06/01/2025 - 11/15/2044 ☼,Ð | 30,965 | ||||||
| 1,259 | 4.02%, 11/01/2028 | 1,349 | ||||||
| 206 | 4.06%, 10/01/2028 | 224 | ||||||
| 43,797 | 4.50%, 08/01/2024 - 11/15/2044 ☼,Ð | 47,469 | ||||||
| 11,942 | 5.00%, 04/01/2018 - 11/15/2044 ☼,Ð | 13,131 | ||||||
| 2,922 | 5.50%, 06/25/2042 ► | 508 | ||||||
| 13,252 | 5.50%, 01/01/2017 - 11/01/2037 | 14,812 | ||||||
| 4,400 | 6.00%, 05/01/2016 - 10/01/2038 | 4,984 | ||||||
| 58 | 7.00%, 10/01/2037 | 67 | ||||||
| 68 | 7.50%, 12/01/2029 - 09/01/2031 | 80 | ||||||
| 303,822 | ||||||||
| GNMA - 6.3% | ||||||||
| 11,000 | 3.00%, 11/15/2044 ☼,Ð | 11,206 | ||||||
| 22,020 | 3.50%, 05/15/2042 - 11/15/2044 ☼,Ð | 23,064 | ||||||
| 26,162 | 4.00%, 09/20/2040 - 11/15/2044 ☼,Ð | 27,998 | ||||||
| 11,858 | 4.50%, 07/15/2033 - 11/15/2044 ☼,Ð | 12,947 | ||||||
| 11,700 | 5.00%, 06/15/2041 - 12/15/2044 ☼,Ð | 12,953 | ||||||
| 5,520 | 5.50%, 05/15/2033 - 11/15/2044 ☼,Ð | 6,163 | ||||||
| 12,176 | 6.00%, 02/15/2029 - 11/15/2044 ☼,Ð | 13,824 | ||||||
| 732 | 6.50%, 09/15/2028 - 07/15/2032 | 841 | ||||||
| 108,996 | ||||||||
| Total U.S. Government Agencies | ||||||||
| (Cost $548,478) | $ | 551,491 | ||||||
| U.S. Government Securities - 7.7% | ||||||||
| U.S. Treasury Securities - 7.7% | ||||||||
| U.S. Treasury Bonds - 3.5% | ||||||||
| $ | 22,875 | 3.13%, 08/15/2044 Є | $ | 23,157 | ||||
| 16,540 | 3.38%, 05/15/2044 Є | 17,547 | ||||||
| 18,090 | 3.63%, 08/15/2043 - 02/15/2044 ‡ | 20,074 | ||||||
| 60,778 | ||||||||
| U.S. Treasury Notes - 4.2% | ||||||||
| 1,300 | 0.50%, 09/30/2016 ╦ | 1,301 | ||||||
| 47,965 | 0.88%, 04/30/2017 Є | 48,122 | ||||||
| 1,030 | 1.00%, 09/15/2017 ╦ | 1,033 | ||||||
| 16,000 | 1.50%, 12/31/2018 ‡ | 16,048 | ||||||
| 1,600 | 2.38%, 08/15/2024 ╦ | 1,606 | ||||||
| 4,700 | 3.13%, 04/30/2017 □Є | 4,977 | ||||||
| 100 | 4.25%, 11/15/2014 ╦ | 100 | ||||||
| 73,187 | ||||||||
| 133,965 | ||||||||
| Total U.S. Government Securities | ||||||||
| (Cost $130,989) | $ | 133,965 | ||||||
The accompanying notes are an integral part of these financial statements.
| 16 |
| The Hartford Total Return Bond Fund |
| Schedule of Investments – (continued) |
| October 31, 2014 |
| (000’s Omitted) |
| Shares or Principal Amount ╬ | Market Value ╪ | |||||||
| Preferred Stocks - 0.1% | ||||||||
| Banks - 0.0% | ||||||||
| 85 | Federal Home Loan Mortgage Corp. | $ | 362 | |||||
| — | U.S. Bancorp | 383 | ||||||
| 745 | ||||||||
| Diversified Financials - 0.1% | ||||||||
| 20 | Citigroup Capital XIII | 536 | ||||||
| 10 | Discover Financial Services | 265 | ||||||
| 801 | ||||||||
| Insurance - 0.0% | ||||||||
| 11 | Allstate (The) Corp. | 270 | ||||||
| Total Preferred Stocks | ||||||||
| (Cost $3,562) | $ | 1,816 | ||||||
| Total Long-Term Investments Excluding Purchased Options | ||||||||
| (Cost $1,711,586) | $ | 1,736,255 | ||||||
| Short-Term Investments - 22.8% | ||||||||
| Other Direct Federal Obligations - 9.1% | ||||||||
| FHLB | ||||||||
| $ | 159,000 | 0.07%, 04/22/2015 - 04/29/2015 | $ | 158,934 | ||||
| 158,934 | ||||||||
| Repurchase Agreements - 1.6% | ||||||||
| Bank of America Merrill Lynch TriParty Repurchase Agreement (maturing on 11/03/2014 in the amount of $77, collateralized by U.S. Treasury Note 1.50%, 2019, value of $78) | ||||||||
| 77 | 0.08%, 10/31/2014 | 77 | ||||||
| Bank of America Merrill Lynch TriParty Repurchase Agreement (maturing on 11/03/2014 in the amount of $1,309, collateralized by GNMA 1.63% - 7.00%, 2031 - 2054, value of $1,335) | ||||||||
| 1,309 | 0.09%, 10/31/2014 | 1,309 | ||||||
| Bank of Montreal TriParty Repurchase Agreement (maturing on 11/03/2014 in the amount of $352, collateralized by U.S. Treasury Bond 2.88% - 5.25%, 2029 - 2043, U.S. Treasury Note 0.38% - 4.50%, 2015 - 2022, value of $359) | ||||||||
| 352 | 0.08%, 10/31/2014 | 352 | ||||||
| Bank of Montreal TriParty Repurchase Agreement (maturing on 11/03/2014 in the amount of $1,192, collateralized by FHLMC 2.00% - 5.50%, 2022 - 2034, FNMA 2.00% - 4.50%, 2024 - 2039, GNMA 3.00%, 2043, U.S. Treasury Note 4.63%, 2017, value of $1,216) | ||||||||
| 1,192 | 0.10%, 10/31/2014 | 1,192 | ||||||
| Barclays Capital TriParty Repurchase Agreement (maturing on 11/03/2014 in the amount of $4,492, collateralized by U.S. Treasury Bond 4.50% - 6.25%, 2023 - 2036, U.S. Treasury Note 1.63% - 2.13%, 2015 - 2019, value of $4,582) | ||||||||
| 4,492 | 0.08%, 10/31/2014 | 4,492 | ||||||
| Citigroup Global Markets, Inc. TriParty Repurchase Agreement (maturing on 11/03/2014 in the amount of $5,164, collateralized by U.S. Treasury Bill 0.02%, 2015, U.S. Treasury Bond 3.88% - 11.25%, 2015 - 2040, U.S. Treasury Note 2.00% - 3.38%, 2019 - 2021, value of $5,267) | ||||||||
| 5,164 | 0.09%, 10/31/2014 | 5,164 | ||||||
| Deutsche Bank Securities TriParty Repurchase Agreement (maturing on 11/03/2014 in the amount of $298, collateralized by U.S. Treasury Note 0.88%, 2017, value of $304) | ||||||||
| 298 | 0.13%, 10/31/2014 | 298 | ||||||
| RBS Securities, Inc. TriParty Repurchase Agreement (maturing on 11/03/2014 in the amount of $439, collateralized by U.S. Treasury Bond 3.63% - 5.00%, 2037 - 2043, U.S. Treasury Note 2.13%, 2020, value of $448) | ||||||||
| 439 | 0.07%, 10/31/2014 | 439 | ||||||
| Societe Generale TriParty Repurchase Agreement (maturing on 11/03/2014 in the amount of $4,622, collateralized by U.S. Treasury Bill 0.02%, 2015, U.S. Treasury Bond 3.75% - 11.25%, 2015 - 2043, U.S. Treasury Note 1.38% - 4.25%, 2015 - 2022, value of $4,715) | ||||||||
| 4,622 | 0.08%, 10/31/2014 | 4,622 | ||||||
| TD Securities TriParty Repurchase Agreement (maturing on 11/03/2014 in the amount of $8,957, collateralized by FHLMC 3.00% - 4.00%, 2026 - 2044, FNMA 2.50% - 5.00%, 2025 - 2044, U.S. Treasury Bond 3.50% - 6.50%, 2026 - 2041, U.S. Treasury Note 1.75% - 2.88%, 2018 - 2019, value of $9,136) | ||||||||
| 8,957 | 0.10%, 10/31/2014 | 8,957 | ||||||
| 26,902 | ||||||||
The accompanying notes are an integral part of these financial statements.
| 17 |
| The Hartford Total Return Bond Fund |
| Schedule of Investments – (continued) |
| October 31, 2014 |
| (000’s Omitted) |
| Shares or Principal Amount ╬ | Market Value ╪ | |||||||||||
| Short-Term Investments - 22.8% - (continued) | ||||||||||||
| U.S. Government Agencies - 12.1% | ||||||||||||
| FHLMC | ||||||||||||
| $ | 210,000 | 0.02%, 11/26/2014 ○ | $ | 209,998 | ||||||||
| Total Short-Term Investments | ||||||||||||
| (Cost $395,878) | $ | 395,834 | ||||||||||
| Total Investments Excluding Purchased Options | ||||||||||||
| (Cost $2,107,464) | 123.1 | % | $ | 2,132,089 | ||||||||
| Total Purchased Options | ||||||||||||
| (Cost $741) | — | % | 326 | |||||||||
| Total Investments | ||||||||||||
| (Cost $2,108,205) ▲ | 123.1 | % | $ | 2,132,415 | ||||||||
| Other Assets and Liabilities | (23.1 | )% | (401,041 | ) | ||||||||
| Total Net Assets | 100.0 | % | $ | 1,731,374 | ||||||||
The accompanying notes are an integral part of these financial statements.
| 18 |
| The Hartford Total Return Bond Fund |
| Schedule of Investments – (continued) |
| October 31, 2014 |
| (000’s Omitted) |
| Note: | Percentage of investments as shown is the ratio of the total market value to total net assets. |
The Fund may refer to any one or more of the industry classifications used by one or more widely recognized market indices, ratings group indices and/or as defined by Fund management. Industry classifications may not be identical across all security types.
Equity industry classifications used in this report are the Global Industry Classification Standard, which was developed by and is the exclusive property and service mark of MSCI, Inc. and Standard & Poor’s.
For Fund compliance purposes, the Fund may not use the same classification system shown in this report as these classifications are used for reporting ease.
| ▲ | At October 31, 2014, the cost of securities for federal income tax purposes was $2,110,211 and the aggregate gross unrealized appreciation and depreciation based on that cost were: |
| Unrealized Appreciation | $ | 39,312 | ||
| Unrealized Depreciation | (17,108 | ) | ||
| Net Unrealized Appreciation | $ | 22,204 |
| ╬ | All principal amounts are in U.S. dollars unless otherwise indicated. |
| Ψ | The issuer is in bankruptcy. However, the investment held by the Fund is current with respect to interest payments. |
| Δ | Variable rate securities; the rate reported is the coupon rate in effect at October 31, 2014. |
| ○ | The interest rate disclosed for these securities represents the effective yield on the date of the acquisition. |
| ► | Securities disclosed are interest-only strips. |
| ◄ | The principal amount for this security is adjusted for inflation and the interest payments equal a fixed percentage of the inflation-adjusted principal amount. |
| ♦ | Senior floating rate interests generally pay interest rates which are periodically adjusted by reference to a base short-term, floating lending rate plus a premium. The base lending rates are primarily the LIBOR, and secondarily the prime rate offered by one or more major United States banks (the "Prime Rate") and the certificate of deposit rate or other base lending rates used by commercial lenders. Senior floating rate interests often require prepayments from excess cash flows or permit the borrower to repay at its election. The rate at which the borrower repays cannot be predicted with accuracy. As a result, the actual remaining maturity may be substantially less than the stated maturities shown. Unless otherwise noted, the interest rate disclosed for these securities represents the average coupon as of October 31, 2014. |
| ■ | Securities issued within terms of a private placement memorandum, exempt from registration under Rule 144A under the Securities Act of 1933, as amended, and may be sold only to qualified institutional buyers. Unless otherwise indicated, these holdings are determined to be liquid. At October 31, 2014, the aggregate value of these securities was $317,301, which represents 18.3% of total net assets. |
| § | These securities were sold to the Fund under Regulation S, rules governing offers and sales made outside the United States without registration under the Securities Act of 1933, as amended. The Fund may only be able to resell these securities in the United States if an exemption from registration under the federal and state securities laws is available, or the Fund may only be able to sell these securities outside of the United States (such as on a foreign exchange) to a non-U.S. person. Unless otherwise indicated, these holdings are determined to be liquid. At October 31, 2014, the aggregate value of these securities was $58,257, which represents 3.4% of total net assets. |
| β | Convertible security. |
| ♠ | Perpetual maturity security. Maturity date shown is the next call date or final legal maturity date, whichever comes first. |
| Ð | Represents or includes a TBA transaction. |
| ☼ | This security, or a portion of this security, was purchased on a when-issued or delayed-delivery basis. The cost of these securities was $380,559 at October 31, 2014. |
| ‡ | This security, or a portion of this security, has been segregated to cover funding requirements on investment transactions settling in the future. |
| ╦ | This security, or a portion of this security, has been pledged as collateral in connection with OTC swap contracts. |
| Є | This security, or a portion of this security, has been pledged as collateral in connection with centrally cleared swap contracts. |
| Θ | This security, or a portion of this security, has been pledged as collateral in connection with OTC option and/or swaption contracts. |
| □ | This security, or a portion of this security, has been pledged as collateral in connection with futures contracts. |
The accompanying notes are an integral part of these financial statements.
| 19 |
| The Hartford Total Return Bond Fund |
| Schedule of Investments – (continued) |
| October 31, 2014 |
| (000’s Omitted) |
Cash and securities pledged and received as collateral in connection with derivatives at October 31, 2014:
| Pledged ‡ | Received * | |||||||
| OTC option and/or OTC swap contracts | $ | – | $ | 8,173 | ||||
| Total | $ | – | $ | 8,173 | ||||
| ‡ | As previously noted, certain securities , or a portion of these securities, are pledged as collateral in connection with certain derivative instruments. These securities are held by the Fund but are not represented in the table above. |
| * | Securities valued at $4,234, held on behalf of the Fund at the custodian bank, were designated by broker(s) as collateral in connection with OTC option and/or OTC swap contracts. Since the broker retains legal title to the securities, the securities are not considered an asset of the Fund. |
OTC Option Contracts Outstanding at October 31, 2014
| Description | Counter
- party | Risk Exposure Category | Exercise
Price/ FX Rate/ Rate | Expiration Date | Number
of Contracts * | Market Value ╪ | Premiums Paid by Fund | Unrealized Appreciation (Depreciation) | ||||||||||||||||||||||
| Purchased Option contracts: | ||||||||||||||||||||||||||||||
| Calls | ||||||||||||||||||||||||||||||
| BRL Call/USD Put | JPM | FX | 2.43 BRL per USD | 09/28/15 | BRL | 10,500,000 | $ | 43 | $ | 75 | $ | (32 | ) | |||||||||||||||||
| INR Call/USD Put | BOA | FX | 62.55 INR per USD | 01/16/15 | INR | 210,000,000 | 56 | 54 | 2 | |||||||||||||||||||||
| MXN Call/USD Put | JPM | FX | 13.61 MXN per USD | 01/15/15 | MXN | 46,973,453 | 60 | 69 | (9 | ) | ||||||||||||||||||||
| RUB Call/USD Put | GSC | FX | 36.97 RUB per USD | 09/02/15 | RUB | 159,000,000 | 7 | 58 | (51 | ) | ||||||||||||||||||||
| TRY Call/USD Put | JPM | FX | 2.31 TRY per USD | 01/19/15 | TRY | 8,000,000 | 110 | 78 | 32 | |||||||||||||||||||||
| Total Calls | 434,473,453 | $ | 276 | $ | 334 | $ | (58 | ) | ||||||||||||||||||||||
| Total purchased option contracts | 434,473,453 | $ | 276 | $ | 334 | $ | (58 | ) | ||||||||||||||||||||||
| * | The number of contracts does not omit 000's. |
OTC Swaption Contracts Outstanding at October 31, 2014
| Description | Counter
- party | Risk
Exposure Category | Exercise
Price/ FX Rate/ Rate | Expiration
Date | Number
of Contracts * | Market
Value ╪ | Premiums
Received/ Paid by Fund Δ | Unrealized
Appreciation (Depreciation) | ||||||||||||||||||||||
| Purchased swaption contracts: | ||||||||||||||||||||||||||||||
| Puts | ||||||||||||||||||||||||||||||
| Credit Default Swaption CDX.NA.IG.22 | BNP | CR | 0.73 | % | 11/19/14 | USD | 2,085,000 | $ | – | $ | 3 | $ | (3 | ) | ||||||||||||||||
| Interest Rate Swaption USD | JPM | IR | 3.50 | % | 04/29/15 | USD | 22,975,000 | 50 | 404 | (354 | ) | |||||||||||||||||||
| Total Puts | 25,060,000 | $ | 50 | $ | 407 | $ | (357 | ) | ||||||||||||||||||||||
| Total purchased swaption contracts | 25,060,000 | $ | 50 | $ | 407 | $ | (357 | ) | ||||||||||||||||||||||
| Written swaption contracts: | ||||||||||||||||||||||||||||||
| Calls | ||||||||||||||||||||||||||||||
| Credit Default Swaption CDX.NA.IG.22 | BNP | CR | 0.60 | % | 11/19/14 | USD | 2,085,000 | $ | 1 | $ | 1 | $ | – | |||||||||||||||||
| Credit Default Swaption CDX.NA.IG.23 | CBK | CR | 0.70 | % | 11/19/14 | USD | 88,575,000 | 281 | 239 | (42 | ) | |||||||||||||||||||
| Credit Default Swaption CDX.NA.IG.23 | BNP | CR | 0.70 | % | 11/19/14 | USD | 2,610,000 | 8 | 6 | (2 | ) | |||||||||||||||||||
| Credit Default Swaption CDX.NA.IG.23 | MSC | CR | 0.70 | % | 11/19/14 | USD | 42,044,000 | 133 | 94 | (39 | ) | |||||||||||||||||||
| Interest Rate Swaption USD | BNP | IR | 3.44 | % | 10/23/24 | USD | 5,050,000 | 616 | 633 | 17 | ||||||||||||||||||||
| Total Calls | 140,364,000 | $ | 1,039 | $ | 973 | $ | (66 | ) | ||||||||||||||||||||||
| Puts | ||||||||||||||||||||||||||||||
| Credit Default Swaption CDX.NA.IG.23 | CBK | CR | 0.70 | % | 11/19/14 | USD | 88,580,000 | $ | 51 | $ | 97 | $ | 46 | |||||||||||||||||
| Credit Default Swaption CDX.NA.IG.23 | BNP | CR | 0.70 | % | 11/19/14 | USD | 2,610,000 | 2 | 4 | 2 | ||||||||||||||||||||
| Credit Default Swaption CDX.NA.IG.23 | MSC | CR | 0.70 | % | 11/19/14 | USD | 42,039,000 | 25 | 64 | 39 | ||||||||||||||||||||
| Interest Rate Swaption USD | BNP | IR | 3.44 | % | 10/23/24 | USD | 5,050,000 | 603 | 633 | 30 | ||||||||||||||||||||
| Total Puts | 138,279,000 | $ | 681 | $ | 798 | $ | 117 | |||||||||||||||||||||||
| Total written swaption contracts | 278,643,000 | $ | 1,720 | $ | 1,771 | $ | 51 | |||||||||||||||||||||||
| * | The number of contracts does not omit 000's. |
| Δ | For purchased swaptions, premiums are paid by the Fund, for written swaptions, premiums are received. |
The accompanying notes are an integral part of these financial statements.
| 20 |
| The Hartford Total Return Bond Fund |
| Schedule of Investments – (continued) |
| October 31, 2014 |
| (000’s Omitted) |
Futures Contracts Outstanding at October 31, 2014
| Number of | Expiration | Notional | Market | Unrealized Appreciation/(Depreciation) | Variation Margin | |||||||||||||||||||||||||
| Description | Contracts* | Date | Amount | Value ╪ | Asset | Liability | Asset | Liability | ||||||||||||||||||||||
| Long position contracts: | ||||||||||||||||||||||||||||||
| U.S. Treasury 2-Year Note Future | 48 | 12/31/2014 | $ | 10,510 | $ | 10,539 | $ | 29 | $ | – | $ | – | $ | (3 | ) | |||||||||||||||
| U.S. Treasury 5-Year Note Future | 2,441 | 12/31/2014 | 291,529 | 291,528 | – | (1 | ) | 140 | (701 | ) | ||||||||||||||||||||
| U.S. Treasury Long Bond Future | 150 | 12/19/2014 | 20,969 | 21,164 | 195 | – | – | (70 | ) | |||||||||||||||||||||
| Total | $ | 224 | $ | (1 | ) | $ | 140 | $ | (774 | ) | ||||||||||||||||||||
| Short position contracts: | ||||||||||||||||||||||||||||||
| 90-Day Eurodollar Future | 351 | 12/14/2015 | $ | 87,065 | $ | 87,017 | $ | 48 | $ | – | $ | 57 | $ | (17 | ) | |||||||||||||||
| Euro-BOBL Future | 1 | 12/08/2014 | 159 | 160 | – | (1 | ) | – | – | |||||||||||||||||||||
| Euro-BUND Future | 5 | 12/08/2014 | 933 | 946 | – | (13 | ) | – | – | |||||||||||||||||||||
| U.S. Treasury 10-Year Note Future | 1,056 | 12/19/2014 | 133,775 | 133,436 | 339 | – | 168 | (57 | ) | |||||||||||||||||||||
| U.S. Treasury CME Ultra Long Term Bond Future | 2 | 12/19/2014 | 314 | 314 | – | – | – | (6 | ) | |||||||||||||||||||||
| Total | $ | 387 | $ | (14 | ) | $ | 225 | $ | (80 | ) | ||||||||||||||||||||
| Total futures contracts | $ | 611 | $ | (15 | ) | $ | 365 | $ | (854 | ) | ||||||||||||||||||||
| * | The number of contracts does not omit 000's. |
OTC Credit Default Swap Contracts Outstanding at October 31, 2014
| Counter- | Notional | (Pay)/ Receive Fixed Rate/ Implied | Expiration | Upfront Premiums | Upfront Premiums | Market | Unrealized Appreciation/ (Depreciation) | |||||||||||||||||||||||||||
| Reference Entity | party | Amount (a) | Credit Spread (b) | Date | Paid | Received | Value ╪ | Asset | Liability | |||||||||||||||||||||||||
| Credit default swaps on indices: | ||||||||||||||||||||||||||||||||||
| Buy protection: | ||||||||||||||||||||||||||||||||||
| ABX.HE.AA.06-1 | BCLY | USD | 1,964 | (0.32 | )% | 07/25/45 | $ | 715 | $ | – | $ | 417 | $ | – | $ | (298 | ) | |||||||||||||||||
| ABX.HE.AAA.06-1 | BCLY | USD | 260 | (0.18 | )% | 07/25/45 | 27 | – | 6 | – | (21 | ) | ||||||||||||||||||||||
| ABX.HE.AAA.06-1 | CSI | USD | 91 | (0.18 | )% | 07/25/45 | 1 | – | 2 | 1 | – | |||||||||||||||||||||||
| ABX.HE.AAA.06-1 | GSC | USD | 171 | (0.18 | )% | 07/25/45 | 15 | – | 4 | – | (11 | ) | ||||||||||||||||||||||
| ABX.HE.AAA.06-1 | JPM | USD | 13 | (0.18 | )% | 07/25/45 | – | – | – | – | – | |||||||||||||||||||||||
| ABX.HE.AAA.06-1 | MSC | USD | 20 | (0.18 | )% | 07/25/45 | 1 | – | 1 | – | – | |||||||||||||||||||||||
| ABX.HE.AAA.06-2 | BOA | USD | 3,137 | (0.11 | )% | 05/25/46 | 658 | – | 627 | – | (31 | ) | ||||||||||||||||||||||
| ABX.HE.AAA.06-2 | CSI | USD | 82 | (0.11 | )% | 05/25/46 | 16 | – | 16 | – | – | |||||||||||||||||||||||
| ABX.HE.AAA.06-2 | CSI | USD | 1,056 | (0.11 | )% | 05/25/46 | 249 | – | 211 | – | (38 | ) | ||||||||||||||||||||||
| ABX.HE.AAA.06-2 | DEUT | USD | 381 | (0.11 | )% | 05/25/46 | 89 | – | 76 | – | (13 | ) | ||||||||||||||||||||||
| ABX.HE.AAA.06-2 | JPM | USD | 626 | (0.11 | )% | 05/25/46 | 127 | – | 125 | – | (2 | ) | ||||||||||||||||||||||
| ABX.HE.AAA.06-2 | MSC | USD | 897 | (0.11 | )% | 05/25/46 | 183 | – | 180 | – | (3 | ) | ||||||||||||||||||||||
| ABX.HE.AAA.07 | JPM | USD | 67 | (0.09 | )% | 08/25/37 | 18 | – | 18 | – | – | |||||||||||||||||||||||
| ABX.HE.AAA.07 | MSC | USD | 454 | (0.09 | )% | 08/25/37 | 118 | – | 118 | – | – | |||||||||||||||||||||||
| ABX.HE.AAA.07-1 | CSI | USD | 1,997 | (0.09 | )% | 08/25/37 | 583 | – | 519 | – | (64 | ) | ||||||||||||||||||||||
| ABX.HE.AAA.07-1 | GSC | USD | 1,131 | (0.09 | )% | 08/25/37 | 286 | – | 294 | 8 | – | |||||||||||||||||||||||
| ABX.HE.AAA.07-1 | JPM | USD | 67 | (0.09 | )% | 08/25/37 | 20 | – | 18 | – | (2 | ) | ||||||||||||||||||||||
| ABX.HE.AAA.07-1 | MSC | USD | 1,228 | (0.09 | )% | 08/25/37 | 303 | – | 319 | 16 | – | |||||||||||||||||||||||
| ABX.HE.PENAAA.06-2 | BCLY | USD | 125 | (0.11 | )% | 05/25/46 | 21 | – | 18 | – | (3 | ) | ||||||||||||||||||||||
| ABX.HE.PENAAA.06-2 | GSC | USD | 2,023 | (0.11 | )% | 05/25/46 | 506 | – | 283 | – | (223 | ) | ||||||||||||||||||||||
| ABX.HE.PENAAA.06-2 | JPM | USD | 336 | (0.11 | )% | 05/25/46 | 46 | – | 47 | 1 | – | |||||||||||||||||||||||
| ABX.HE.PENAAA.06-2 | JPM | USD | 2,172 | (0.11 | )% | 05/25/46 | 542 | – | 304 | – | (238 | ) | ||||||||||||||||||||||
| ABX.HE.PENAAA.06-2 | MSC | USD | 1,060 | (0.11 | )% | 05/25/46 | 257 | – | 148 | – | (109 | ) | ||||||||||||||||||||||
| ABX.HE.PENAAA.07-1 | GSC | USD | 1,041 | (0.09 | )% | 08/25/37 | 433 | – | 240 | – | (193 | ) | ||||||||||||||||||||||
| CMBX.NA.A.7 | JPM | USD | 35 | (2.00 | )% | 01/17/47 | 1 | – | – | – | (1 | ) | ||||||||||||||||||||||
| CMBX.NA.A.7 | JPM | USD | 1,520 | (2.00 | )% | 01/17/47 | – | (32 | ) | (3 | ) | 29 | – | |||||||||||||||||||||
| CMBX.NA.AA.1 | UBS | USD | 1,765 | (0.25 | )% | 10/12/52 | 379 | – | 257 | – | (122 | ) | ||||||||||||||||||||||
| CMBX.NA.AA.2 | BOA | USD | 3,483 | (0.15 | )% | 03/15/49 | 1,321 | – | 1,128 | – | (193 | ) | ||||||||||||||||||||||
| CMBX.NA.AA.2 | CSI | USD | 1,500 | (0.15 | )% | 03/15/49 | 468 | – | 486 | 18 | – | |||||||||||||||||||||||
| CMBX.NA.AA.2 | CSI | USD | 158 | (0.15 | )% | 03/15/49 | 51 | – | 51 | – | – | |||||||||||||||||||||||
| CMBX.NA.AA.2 | GSC | USD | 607 | (0.15 | )% | 03/15/49 | 212 | – | 197 | – | (15 | ) | ||||||||||||||||||||||
| CMBX.NA.AA.2 | MSC | USD | 67 | (0.15 | )% | 03/15/49 | 23 | – | 22 | – | (1 | ) | ||||||||||||||||||||||
| CMBX.NA.AA.7 | BOA | USD | 350 | (1.50 | )% | 01/17/47 | – | (4 | ) | 1 | 5 | – | ||||||||||||||||||||||
The accompanying notes are an integral part of these financial statements.
| 21 |
| The Hartford Total Return Bond Fund |
| Schedule of Investments – (continued) |
| October 31, 2014 |
| (000’s Omitted) |
OTC Credit Default Swap Contracts Outstanding at October 31, 2014 - (continued)
| Counter- | Notional | (Pay)/ Receive Fixed Rate/ Implied | Expiration | Upfront Premiums | Upfront Premiums | Market | Unrealized
Appreciation/ (Depreciation) | |||||||||||||||||||||||||
| Reference Entity | party | Amount (a) | Credit Spread (b) | Date | Paid | Received | Value ╪ | Asset | Liability | |||||||||||||||||||||||
| Credit default swaps on indices: - (continued) | ||||||||||||||||||||||||||||||||
| Buy protection: - (continued) | ||||||||||||||||||||||||||||||||
| CMBX.NA.AA.7 | CSI | USD | 3,770 | (1.50 | )% | 01/17/47 | $ | 19 | $ | – | $ | 10 | $ | – | $ | (9 | ) | |||||||||||||||
| CMBX.NA.AA.7 | CSI | USD | 2,065 | (1.50 | )% | 01/17/47 | – | (20 | ) | 6 | 26 | – | ||||||||||||||||||||
| CMBX.NA.AA.7 | MSC | USD | 1,565 | (1.50 | )% | 01/17/47 | – | (16 | ) | 4 | 20 | – | ||||||||||||||||||||
| CMBX.NA.AJ.1 | DEUT | USD | 165 | (0.84 | )% | 10/12/52 | 4 | – | 4 | – | – | |||||||||||||||||||||
| CMBX.NA.AJ.1 | DEUT | USD | 655 | (0.84 | )% | 10/12/52 | 45 | – | 16 | – | (29 | ) | ||||||||||||||||||||
| CMBX.NA.AJ.1 | JPM | USD | 340 | (0.84 | )% | 10/12/52 | 18 | – | 8 | – | (10 | ) | ||||||||||||||||||||
| CMBX.NA.AJ.1 | MSC | USD | 1,170 | (0.84 | )% | 10/12/52 | 82 | – | 29 | – | (53 | ) | ||||||||||||||||||||
| CMBX.NA.AJ.2 | DEUT | USD | 2,045 | (1.09 | )% | 03/15/49 | 186 | – | 175 | – | (11 | ) | ||||||||||||||||||||
| CMBX.NA.AJ.2 | DEUT | USD | 159 | (1.09 | )% | 03/15/49 | 13 | – | 14 | 1 | – | |||||||||||||||||||||
| CMBX.NA.AJ.2 | GSC | USD | 3,827 | (1.09 | )% | 03/15/49 | 289 | – | 327 | 38 | – | |||||||||||||||||||||
| CMBX.NA.AJ.4 | CBK | USD | 1,021 | (0.96 | )% | 02/17/51 | 194 | – | 199 | 5 | – | |||||||||||||||||||||
| CMBX.NA.AJ.4 | CSI | USD | 548 | (0.96 | )% | 02/17/51 | 110 | – | 107 | – | (3 | ) | ||||||||||||||||||||
| CMBX.NA.AJ.4 | CSI | USD | 2,331 | (0.96 | )% | 02/17/51 | 430 | – | 453 | 23 | – | |||||||||||||||||||||
| CMBX.NA.AJ.4 | DEUT | USD | 1,285 | (0.96 | )% | 02/17/51 | 251 | – | 250 | – | (1 | ) | ||||||||||||||||||||
| CMBX.NA.AJ.4 | GSC | USD | 3,172 | (0.96 | )% | 02/17/51 | 557 | – | 617 | 60 | – | |||||||||||||||||||||
| CMBX.NA.AJ.4 | JPM | USD | 349 | (0.96 | )% | 02/17/51 | 73 | – | 67 | – | (6 | ) | ||||||||||||||||||||
| CMBX.NA.AJ.4 | JPM | USD | 383 | (0.96 | )% | 02/17/51 | 73 | – | 75 | 2 | – | |||||||||||||||||||||
| CMBX.NA.AJ.4 | MSC | USD | 3,367 | (0.96 | )% | 02/17/51 | 1,033 | – | 654 | – | (379 | ) | ||||||||||||||||||||
| CMBX.NA.AJ.4 | MSC | USD | 1,579 | (0.96 | )% | 02/17/51 | 282 | – | 307 | 25 | – | |||||||||||||||||||||
| CMBX.NA.AM.2 | CSI | USD | 3,645 | (0.50 | )% | 03/15/49 | 224 | – | 46 | – | (178 | ) | ||||||||||||||||||||
| CMBX.NA.AM.2 | DEUT | USD | 3,645 | (0.50 | )% | 03/15/49 | 210 | – | 46 | – | (164 | ) | ||||||||||||||||||||
| CMBX.NA.AM.2 | JPM | USD | 1,310 | (0.50 | )% | 03/15/49 | 25 | – | 16 | – | (9 | ) | ||||||||||||||||||||
| CMBX.NA.AM.2 | MSC | USD | 705 | (0.50 | )% | 03/15/49 | 35 | – | 9 | – | (26 | ) | ||||||||||||||||||||
| CMBX.NA.AM.4 | BOA | USD | 890 | (0.50 | )% | 02/17/51 | 107 | – | 36 | – | (71 | ) | ||||||||||||||||||||
| CMBX.NA.AM.4 | CSI | USD | 510 | (0.50 | )% | 02/17/51 | 59 | – | 21 | – | (38 | ) | ||||||||||||||||||||
| CMBX.NA.AM.4 | GSC | USD | 475 | (0.50 | )% | 02/17/51 | 59 | – | 19 | – | (40 | ) | ||||||||||||||||||||
| CMBX.NA.AM.4 | JPM | USD | 200 | (0.50 | )% | 02/17/51 | 11 | – | 9 | – | (2 | ) | ||||||||||||||||||||
| CMBX.NA.AM.4 | MSC | USD | 2,155 | (0.50 | )% | 02/17/51 | 369 | – | 88 | – | (281 | ) | ||||||||||||||||||||
| CMBX.NA.AS.6 | CSI | USD | 245 | (1.00 | )% | 05/11/63 | 1 | – | 2 | 1 | – | |||||||||||||||||||||
| CMBX.NA.AS.6 | CSI | USD | 3,270 | (1.00 | )% | 05/11/63 | 44 | – | 29 | – | (15 | ) | ||||||||||||||||||||
| CMBX.NA.AS.7 | CBK | USD | 1,445 | (1.00 | )% | 01/17/47 | 34 | – | 23 | – | (11 | ) | ||||||||||||||||||||
| CMBX.NA.AS.7 | CSI | USD | 120 | (1.00 | )% | 01/17/47 | 1 | – | 2 | 1 | – | |||||||||||||||||||||
| CMBX.NA.AS.7 | CSI | USD | 1,610 | (1.00 | )% | 01/17/47 | 38 | – | 26 | – | (12 | ) | ||||||||||||||||||||
| Total | $ | 12,545 | $ | (72 | ) | $ | 9,824 | $ | 280 | $ | (2,929 | ) | ||||||||||||||||||||
| Sell protection: | ||||||||||||||||||||||||||||||||
| CMBX.NA.A.2 | BOA | USD | 867 | 0.25 | % | 03/15/49 | $ | – | $ | (503 | ) | $ | (560 | ) | $ | – | $ | (57 | ) | |||||||||||||
| CMBX.NA.A.2 | DEUT | USD | 28 | 0.25 | % | 03/15/49 | – | (17 | ) | (18 | ) | – | (1 | ) | ||||||||||||||||||
| CMBX.NA.AAA.6 | BOA | USD | 3,720 | 0.50 | % | 05/11/63 | – | (94 | ) | (73 | ) | 21 | – | |||||||||||||||||||
| CMBX.NA.AAA.6 | CSI | USD | 11,275 | 0.50 | % | 05/11/63 | – | (281 | ) | (221 | ) | 60 | – | |||||||||||||||||||
| CMBX.NA.AAA.6 | CSI | USD | 1,840 | 0.50 | % | 05/11/63 | – | (36 | ) | (36 | ) | – | – | |||||||||||||||||||
| CMBX.NA.AAA.6 | CSI | USD | 740 | 5.00 | % | 05/11/63 | – | (22 | ) | (1 | ) | 21 | – | |||||||||||||||||||
| CMBX.NA.AAA.6 | DEUT | USD | 2,430 | 0.50 | % | 05/11/63 | – | (38 | ) | (48 | ) | – | (10 | ) | ||||||||||||||||||
| CMBX.NA.AAA.6 | DEUT | USD | 5,435 | 0.50 | % | 05/11/63 | – | (132 | ) | (106 | ) | 26 | – | |||||||||||||||||||
| CMBX.NA.AAA.6 | GSC | USD | 1,210 | 0.50 | % | 05/11/63 | – | (27 | ) | (24 | ) | 3 | – | |||||||||||||||||||
| CMBX.NA.AAA.6 | MSC | USD | 1,390 | 0.50 | % | 05/11/63 | – | (37 | ) | (27 | ) | 10 | – | |||||||||||||||||||
| CMBX.NA.AAA.6 | UBS | USD | 10,000 | 0.50 | % | 05/11/63 | – | (256 | ) | (195 | ) | 61 | – | |||||||||||||||||||
| CMBX.NA.AAA.7 | BOA | USD | 2,375 | 0.50 | % | 01/17/47 | – | (58 | ) | (69 | ) | – | (11 | ) | ||||||||||||||||||
| CMBX.NA.AAA.7 | CSI | USD | 2,430 | 0.50 | % | 01/17/47 | – | (67 | ) | (71 | ) | – | (4 | ) | ||||||||||||||||||
| CMBX.NA.BB.6 | BCLY | USD | 785 | 5.00 | % | 05/11/63 | 6 | – | (1 | ) | – | (7 | ) | |||||||||||||||||||
| CMBX.NA.BB.6 | BOA | USD | 1,945 | 5.00 | % | 05/11/63 | – | (19 | ) | (3 | ) | 16 | – | |||||||||||||||||||
| CMBX.NA.BB.6 | CBK | USD | 1,515 | 5.00 | % | 05/11/63 | – | (11 | ) | (2 | ) | 9 | – | |||||||||||||||||||
| CMBX.NA.BB.6 | CSI | USD | 415 | 5.00 | % | 05/11/63 | – | – | – | – | – | |||||||||||||||||||||
| CMBX.NA.BB.6 | CSI | USD | 5,175 | 5.00 | % | 05/11/63 | 50 | – | (8 | ) | – | (58 | ) | |||||||||||||||||||
| CMBX.NA.BB.6 | CSI | USD | 3,855 | 5.00 | % | 05/11/63 | – | (37 | ) | (8 | ) | 29 | – | |||||||||||||||||||
| CMBX.NA.BB.6 | GSC | USD | 1,010 | 5.00 | % | 05/11/63 | 7 | – | (1 | ) | – | (8 | ) | |||||||||||||||||||
| CMBX.NA.BB.6 | UBS | USD | 605 | 5.00 | % | 05/11/63 | 16 | – | (1 | ) | – | (17 | ) | |||||||||||||||||||
The accompanying notes are an integral part of these financial statements.
| 22 |
| The Hartford Total Return Bond Fund |
| Schedule of Investments – (continued) |
| October 31, 2014 |
| (000’s Omitted) |
OTC Credit Default Swap Contracts Outstanding at October 31, 2014 - (continued)
| Counter- | Notional | (Pay)/ Receive Fixed Rate/ Implied | Expiration | Upfront Premiums | Upfront Premiums | Market | Unrealized
Appreciation/ (Depreciation) | |||||||||||||||||||||||||
| Reference Entity | party | Amount (a) | Credit Spread (b) | Date | Paid | Received | Value ╪ | Asset | Liability | |||||||||||||||||||||||
| Credit default swaps on indices: - (continued) | ||||||||||||||||||||||||||||||||
| Sell protection: - (continued) | ||||||||||||||||||||||||||||||||
| CMBX.NA.BB.7 | BCLY | USD | 360 | 5.00% | 01/17/47 | $ | – | $ | (11 | ) | $ | (9 | ) | $ | 2 | $ | – | |||||||||||||||
| CMBX.NA.BB.7 | BOA | USD | 2,085 | 5.00% | 01/17/47 | – | (79 | ) | (51 | ) | 28 | – | ||||||||||||||||||||
| CMBX.NA.BB.7 | CBK | USD | 385 | 5.00% | 01/17/47 | – | (12 | ) | (9 | ) | 3 | – | ||||||||||||||||||||
| CMBX.NA.BB.7 | CSI | USD | 705 | 5.00% | 01/17/47 | 7 | – | (17 | ) | – | (24 | ) | ||||||||||||||||||||
| CMBX.NA.BB.7 | CSI | USD | 2,650 | 5.00% | 01/17/47 | – | (139 | ) | (64 | ) | 75 | – | ||||||||||||||||||||
| CMBX.NA.BB.7 | DEUT | USD | 1,125 | 5.00% | 01/17/47 | – | (37 | ) | (28 | ) | 9 | – | ||||||||||||||||||||
| CMBX.NA.BB.7 | DEUT | USD | 575 | 5.00% | 01/17/47 | – | (6 | ) | (14 | ) | – | (8 | ) | |||||||||||||||||||
| CMBX.NA.BB.7 | GSC | USD | 1,625 | 5.00% | 01/17/47 | – | (98 | ) | (39 | ) | 59 | – | ||||||||||||||||||||
| CMBX.NA.BBB-.7 | CSI | USD | 1,160 | 3.00% | 01/17/47 | – | (20 | ) | (23 | ) | – | (3 | ) | |||||||||||||||||||
| CMBX.NA.BBB-.7 | CSI | USD | 1,080 | 3.00% | 01/17/47 | – | (64 | ) | (21 | ) | 43 | – | ||||||||||||||||||||
| CMBX.NA.BBB-.7 | UBS | USD | 840 | 3.00% | 01/17/47 | – | (45 | ) | (16 | ) | 29 | – | ||||||||||||||||||||
| PrimeX.ARM.2 | JPM | USD | 69 | 4.58% | 12/25/37 | 2 | – | 2 | – | – | ||||||||||||||||||||||
| PrimeX.ARM.2 | JPM | USD | 309 | 4.58% | 12/25/37 | 10 | – | 10 | – | – | ||||||||||||||||||||||
| PrimeX.ARM.2 | MSC | USD | 2,592 | 4.58% | 06/25/36 | – | (190 | ) | 80 | 270 | – | |||||||||||||||||||||
| PrimeX.ARM.2 | MSC | USD | 128 | 4.58% | 12/25/37 | 4 | – | 4 | – | – | ||||||||||||||||||||||
| PrimeX.FRM.1 | JPM | USD | 395 | 4.42% | 07/25/36 | 41 | – | 41 | – | – | ||||||||||||||||||||||
| Total | $ | 143 | $ | (2,336 | ) | $ | (1,627 | ) | $ | 774 | $ | (208 | ) | |||||||||||||||||||
| Total traded indices | $ | 12,688 | $ | (2,408 | ) | $ | 8,197 | $ | 1,054 | $ | (3,137 | ) | ||||||||||||||||||||
| Credit default swaps on single-name issues: | ||||||||||||||||||||||||||||||||
| Buy protection: | ||||||||||||||||||||||||||||||||
| ConAgra Foods, Inc. | GSC | USD | 1,275 | (1.00)% / (0.53) % | 12/20/19 | $ | – | $ | (21 | ) | $ | (30 | ) | $ | – | $ | (9 | ) | ||||||||||||||
| Sell protection: | ||||||||||||||||||||||||||||||||
| Illinois State GO | GSC | USD | 1,050 | 1.00% / 1.11% | 06/20/17 | $ | 4 | $ | – | $ | (3 | ) | $ | – | $ | (7 | ) | |||||||||||||||
| International Lease Finance Corp. | BCLY | USD | 415 | 5.00% / 2.15% | 12/20/19 | 53 | – | 55 | 2 | – | ||||||||||||||||||||||
| Total | $ | 57 | $ | – | $ | 52 | $ | 2 | $ | (7 | ) | |||||||||||||||||||||
| Total single-name issues | $ | 57 | $ | (21 | ) | $ | 22 | $ | 2 | $ | (16 | ) | ||||||||||||||||||||
| $ | 12,745 | $ | (2,429 | ) | $ | 8,219 | $ | 1,056 | $ | (3,153 | ) | |||||||||||||||||||||
| (a) | The maximum potential amount the Fund could be required to pay as a seller of credit protection or receive as a buyer of credit protection if a credit event occurs as defined under the terms of that particular swap agreement. |
| (b) | Implied credit spreads, utilized in determining the market value of credit default swap agreements on corporate issues, U.S. municipal issues or sovereign government issues as of period end serve as an indicator of the current status of the payment/performance risk and represent the likelihood of risk of default for the credit derivative. The implied credit spread of a particular entity reflects the cost of buying/selling protection and may include upfront payments required to be made to enter into the agreement. Wider credit spreads represent a deterioration of the reference entity's credit soundness and a greater likelihood or risk of default or other credit event occurring as defined under the terms of the agreement. The percentage shown is the implied credit spread on October 31, 2014. For credit default swap agreements on indices, the quoted market prices and resulting values serve as the indicator of the current status of the payment/performance risk. |
The accompanying notes are an integral part of these financial statements.
| 23 |
| The Hartford Total Return Bond Fund |
| Schedule of Investments – (continued) |
| October 31, 2014 |
| (000’s Omitted) |
Centrally Cleared Credit Default Swap Contracts Outstanding at October 31, 2014
| Clearing | Notional | (Pay)/ Receive Fixed | Expiration | Market | Unrealized
Appreciation/ (Depreciation) | Variation Margin | |||||||||||||||||||||||||||||||
| Reference Entity | House (a) | Amount (b) | Rate | Date | Cost Basis | Value ╪ | Asset | Liability | Asset | Liability | |||||||||||||||||||||||||||
| Credit default swaps on indices: | |||||||||||||||||||||||||||||||||||||
| Buy protection: | |||||||||||||||||||||||||||||||||||||
| CDX.NA.HY.22 | CME | USD | 37,739 | (5.00 | )% | 06/20/19 | $ | (2,531 | ) | $ | (2,828 | ) | $ | – | $ | (297 | ) | $ | – | $ | (127 | ) | |||||||||||||||
| CDX.NA.HY.23 | CME | USD | 35,015 | (5.00 | )% | 12/20/19 | (1,610 | ) | (2,446 | ) | – | (836 | ) | – | (138 | ) | |||||||||||||||||||||
| CDX.NA.IG.23 | CME | USD | 8,066 | (1.00 | )% | 12/20/19 | (97 | ) | (142 | ) | – | (45 | ) | 12 | (18 | ) | |||||||||||||||||||||
| ITRAXX.EUR.22 | ICE | EUR | 25,165 | (1.00 | )% | 12/20/19 | (494 | ) | (553 | ) | – | (59 | ) | – | (45 | ) | |||||||||||||||||||||
| ITRAXX.XOV.22 | ICE | EUR | 22,525 | (5.00 | )% | 12/20/19 | (1,750 | ) | (1,815 | ) | – | (65 | ) | – | (115 | ) | |||||||||||||||||||||
| Total | $ | (6,482 | ) | $ | (7,784 | ) | $ | – | $ | (1,302 | ) | $ | 12 | $ | (443 | ) | |||||||||||||||||||||
| (a) | The FCM to the contracts is GSC. |
| (b) | The maximum potential amount the Fund could be required to pay as a seller of credit protection or receive as a buyer of credit protection if a credit event occurs as defined under the terms of that particular swap agreement. |
Centrally Cleared Interest Rate Swap Contracts Outstanding at October 31, 2014
| Clearing | Payments made | Payments received | Notional | Expiration | Upfront Premiums Paid | Market | Unrealized
Appreciation/ (Depreciation) | Variation Margin | ||||||||||||||||||||||||||||
| House (a) | by Fund | by Fund | Amount | Date | (Received) | Value ╪ | Asset | Liability | Asset | Liability | ||||||||||||||||||||||||||
| LCH | 0.43% Fixed | 6M EURIBOR | EUR | 250 | 09/17/17 | $ | – | $ | (1 | ) | $ | – | $ | (1 | ) | $ | – | $ | – | |||||||||||||||||
| (a) | The FCM to the contracts is GSC. |
| TBA Sale Commitments Outstanding at October 31, 2014 | ||||||||||||||
| Description | Principal Amount | Maturity Date | Market Value ╪ | Unrealized Appreciation/ Depreciation | ||||||||||
| FHLMC, 3.00% | $ | 13,000 | 11/15/2044 | $ | 13,010 | $ | (75 | ) | ||||||
| FHLMC, 3.50% | 9,000 | 11/15/2044 | 9,290 | (73 | ) | |||||||||
| FHLMC, 5.00% | 1,900 | 11/15/2044 | 2,099 | (1 | ) | |||||||||
| FHLMC, 5.50% | 11,000 | 12/15/2044 | 12,256 | (26 | ) | |||||||||
| FNMA, 3.00% | 22,590 | 11/15/2029 | 23,428 | (46 | ) | |||||||||
| FNMA, 3.50% | 19,100 | 11/15/2029 | 20,180 | 35 | ||||||||||
| FNMA, 5.50% | 10,400 | 11/15/2044 | 11,614 | (28 | ) | |||||||||
| FNMA, 6.00% | 2,600 | 11/15/2044 | 2,943 | (4 | ) | |||||||||
| GNMA, 3.50% | 12,900 | 11/15/2044 | 13,496 | 59 | ||||||||||
| GNMA, 4.50% | 8,650 | 11/15/2044 | 9,439 | (42 | ) | |||||||||
| Total | $ | 117,755 | $ | (201 | ) | |||||||||
At October 31, 2014, the aggregate market value of these securities represents 6.8% of total net assets.
| Foreign Currency Contracts Outstanding at October 31, 2014 | ||||||||||||||||||||||
| Unrealized Appreciation/(Depreciation) | ||||||||||||||||||||||
| Currency | Buy / Sell | Delivery Date | Counterparty | Contract Amount | Market Value ╪ | Asset | Liability | |||||||||||||||
| EUR | Buy | 12/17/2014 | CSFB | $ | 270 | $ | 267 | $ | – | $ | (3 | ) | ||||||||||
| EUR | Buy | 12/17/2014 | DEUT | 806 | 790 | – | (16 | ) | ||||||||||||||
| EUR | Buy | 12/17/2014 | HSBC | 1,662 | 1,662 | – | – | |||||||||||||||
| EUR | Buy | 12/17/2014 | TDS | 5,428 | 5,331 | – | (97 | ) | ||||||||||||||
| EUR | Sell | 12/17/2014 | BCLY | 983 | 975 | 8 | – | |||||||||||||||
| EUR | Sell | 09/18/2015 | CBK | 1,714 | 1,665 | 49 | – | |||||||||||||||
| EUR | Sell | 12/17/2014 | CSFB | 681 | 673 | 8 | – | |||||||||||||||
The accompanying notes are an integral part of these financial statements.
| 24 |
| The Hartford Total Return Bond Fund |
| Schedule of Investments – (continued) |
| October 31, 2014 |
| (000’s Omitted) |
| Foreign Currency Contracts Outstanding at October 31, 2014 - (continued) | ||||||||||||||||||||||
| Unrealized Appreciation/(Depreciation) | ||||||||||||||||||||||
| Currency | Buy / Sell | Delivery Date | Counterparty | Contract Amount | Market Value ╪ | Asset | Liability | |||||||||||||||
| EUR | Sell | 12/17/2014 | DEUT | $ | 8,075 | $ | 7,818 | $ | 257 | $ | – | |||||||||||
| EUR | Sell | 11/04/2014 | HSBC | 1,662 | 1,662 | – | – | |||||||||||||||
| EUR | Sell | 12/17/2014 | HSBC | 270 | 262 | 8 | – | |||||||||||||||
| EUR | Sell | 11/28/2014 | JPM | 23,701 | 23,451 | 250 | – | |||||||||||||||
| GBP | Buy | 12/17/2014 | RBC | 418 | 411 | – | (7 | ) | ||||||||||||||
| GBP | Sell | 11/28/2014 | CBK | 5,366 | 5,358 | 8 | – | |||||||||||||||
| JPY | Buy | 12/17/2014 | JPM | 1,378 | 1,308 | – | (70 | ) | ||||||||||||||
| JPY | Sell | 12/17/2014 | GSC | 1,342 | 1,308 | 34 | – | |||||||||||||||
| NGN | Buy | 10/08/2015 | BNP | 2,734 | 2,688 | – | (46 | ) | ||||||||||||||
| RSD | Buy | 09/18/2015 | CBK | 1,582 | 1,549 | – | (33 | ) | ||||||||||||||
| TRY | Buy | 03/31/2015 | BOA | 2,889 | 2,987 | 98 | – | |||||||||||||||
| Total | $ | 720 | $ | (272 | ) | |||||||||||||||||
| ╪ | See Significant Accounting Policies of accompanying Notes to Financial Statements regarding valuation of securities. |
The accompanying notes are an integral part of these financial statements.
| 25 |
| The Hartford Total Return Bond Fund |
| Schedule of Investments – (continued) |
| October 31, 2014 |
| (000’s Omitted) |
| GLOSSARY: (abbreviations used in preceding Schedule of Investments) | ||
| Counterparty Abbreviations: | ||
| BCLY | Barclays | |
| BNP | BNP Paribas Securities Services | |
| BOA | Banc of America Securities LLC | |
| CBK | Citibank NA | |
| CME | Chicago Mercantile Exchange | |
| CSFB | Credit Suisse First Boston Corp. | |
| CSI | Credit Suisse International | |
| DEUT | Deutsche Bank Securities, Inc. | |
| FCM | Futures Commission Merchant | |
| GSC | Goldman Sachs & Co. | |
| HSBC | HSBC Bank USA | |
| ICE | Intercontinental Exchange | |
| JPM | JP Morgan Chase & Co. | |
| LCH | LCH Clearnet | |
| MSC | Morgan Stanley | |
| RBC | RBC Dominion Securities, Inc. | |
| TDS | TD Securities, Inc. | |
| UBS | UBS AG | |
| Currency Abbreviations: | ||
| BRL | Brazilian Real | |
| DOP | Dominican Peso | |
| EUR | EURO | |
| GBP | British Pound | |
| IDR | Indonesian New Rupiah | |
| INR | Indian Rupee | |
| JPY | Japanese Yen | |
| MXN | Mexican New Peso | |
| NGN | Nigerian Naira | |
| RSD | Serbian Dinar | |
| RUB | Russian New Ruble | |
| TRY | Turkish New Lira | |
| USD | U.S. Dollar | |
| UYU | Uruguayan Peso | |
| ZAR | South African Rand | |
| Index Abbreviations: | ||
| ABX.HE | Markit Asset Backed Security Home Equity | |
| ABX.HE.PEN | Markit Asset Backed Security Home Equity Penultimate | |
| CDX.NA.HY | Credit Derivatives North American High Yield | |
| CDX.NA.IG | Credit Derivatives North American Investment Grade | |
| CMBX.NA | Markit Commercial Mortgage Backed North American | |
| ITRAXX.EUR | Markit iTraxx - Europe | |
| ITRAXX.XOV | Markit iTraxx Index - Europe Crossover | |
| PrimeX.ARM | Markit PrimeX Adjustable Rate Mortgage Backed Security | |
| PrimeX.FRM | Markit PrimeX Fixed Rate Mortgage Backed Security | |
| Municipal Bond Abbreviations: | ||
| GO | General Obligation | |
| Rev | Revenue | |
| Other Abbreviations: | ||
| CLO | Collateralized Loan Obligation | |
| CR | Credit | |
| EURIBOR | Euro Interbank Offered Rate | |
| FHLB | Federal Home Loan Bank | |
| FHLMC | Federal Home Loan Mortgage Corp. | |
| FNMA | Federal National Mortgage Association | |
| FX | Foreign Exchange | |
| GNMA | Government National Mortgage Association | |
| IR | Interest Rate | |
| LIBOR | London Interbank Offered Rate | |
| OTC | Over-the-Counter | |
| REIT | Real Estate Investment Trust | |
| TBA | To Be Announced | |
The accompanying notes are an integral part of these financial statements.
| 26 |
| The Hartford Total Return Bond Fund |
| Schedule of Investments – (continued) |
| October 31, 2014 |
| (000’s Omitted) |
| Investment Valuation Hierarchy Level Summary |
| October 31, 2014 |
| Total | Level 1 ♦ | Level 2 ♦ | Level 3 | |||||||||||||
| Assets: | ||||||||||||||||
| Asset and Commercial Mortgage Backed Securities | $ | 488,433 | $ | – | $ | 441,271 | $ | 47,162 | ||||||||
| Corporate Bonds | 422,852 | – | 421,602 | 1,250 | ||||||||||||
| Foreign Government Obligations | 36,877 | – | 36,877 | – | ||||||||||||
| Municipal Bonds | 14,877 | – | 14,877 | – | ||||||||||||
| Preferred Stocks | 1,816 | 1,433 | 383 | – | ||||||||||||
| Senior Floating Rate Interests | 85,944 | – | 85,944 | – | ||||||||||||
| U.S. Government Agencies | 551,491 | – | 551,491 | – | ||||||||||||
| U.S. Government Securities | 133,965 | 24,763 | 109,202 | – | ||||||||||||
| Short-Term Investments | 395,834 | – | 395,834 | – | ||||||||||||
| Purchased Options | 326 | – | 326 | – | ||||||||||||
| Total | $ | 2,132,415 | $ | 26,196 | $ | 2,057,807 | $ | 48,412 | ||||||||
| Foreign Currency Contracts * | $ | 720 | $ | – | $ | 720 | $ | – | ||||||||
| Futures * | 611 | 611 | – | – | ||||||||||||
| Swaps - Credit Default * | 1,056 | – | 1,056 | – | ||||||||||||
| Total | $ | 2,387 | $ | 611 | $ | 1,776 | $ | – | ||||||||
| Liabilities: | ||||||||||||||||
| TBA Sale Commitments | $ | 117,755 | $ | – | $ | 117,755 | $ | – | ||||||||
| Written Options | 1,720 | – | 1,720 | – | ||||||||||||
| Total | $ | 119,475 | $ | – | $ | 119,475 | $ | – | ||||||||
| Foreign Currency Contracts * | $ | 272 | $ | – | $ | 272 | $ | – | ||||||||
| Futures * | 15 | 15 | – | – | ||||||||||||
| Swaps - Credit Default * | 4,455 | – | 4,455 | – | ||||||||||||
| Swaps - Interest Rate * | 1 | – | 1 | – | ||||||||||||
| Total | $ | 4,743 | $ | 15 | $ | 4,728 | $ | – | ||||||||
| ♦ | For the year ended October 31, 2014, investments valued at $27,730 were transferred from Level 1 to Level 2, and there were no transfers from Level 2 to Level 1. Investments are transferred between Level 1 and Level 2 for a variety of reasons including, but not limited to: |
| 1) | Foreign equities for which a fair value price is more representative of exit value than the local market close (transfer into Level 2). Foreign equities for which the local market close is more representative of exit value (transfer into Level 1). |
| 2) | U.S. Treasury securities that no longer represent the most recent issue (transfer into Level 2). |
| 3) | Equity investments with no observable trading but a bid or mean price is used (transfer into Level 2). Equity investments using observable quoted prices in an active market (transfer into Level 1). |
| * | Derivative instruments (excluding purchased and written options, if applicable) are valued at the unrealized appreciation/depreciation on the investments. |
The accompanying notes are an integral part of these financial statements.
| 27 |
| The Hartford Total Return Bond Fund |
| Schedule of Investments – (continued) |
| October 31, 2014 |
| (000’s Omitted) |
Following is a reconciliation of Level 3 assets for which significant unobservable inputs were used to determine fair value:
| Balance
as of October 31, 2013 | Realized
Gain (Loss) | Change
in Unrealized Appreciation (Depreciation) | Net Amortization | Purchases | Sales | Transfers
Into Level 3 * | Transfers
Out of Level 3 * | Balance
as of October 31, 2014 | ||||||||||||||||||||||||||||
| Assets: | ||||||||||||||||||||||||||||||||||||
| Asset & Commercial Mortgage Backed Securities | $ | 44,890 | $ | 1,962 | $ | 1,063 | † | $ | 2,017 | $ | 19,468 | $ | (19,795 | ) | $ | 607 | $ | (3,050 | ) | $ | 47,162 | |||||||||||||||
| Corporate Bonds | 2,538 | 58 | 62 | ‡ | — | 1,250 | (2,658 | ) | — | — | 1,250 | |||||||||||||||||||||||||
| U.S. Government Agencies | 1,301 | — | — | — | — | — | — | (1,301 | ) | — | ||||||||||||||||||||||||||
| Total | $ | 48,729 | $ | 2,020 | $ | 1,125 | $ | 2,017 | $ | 20,718 | $ | (22,453 | ) | $ | 607 | $ | (4,351 | ) | $ | 48,412 | ||||||||||||||||
| Swaps§ | $ | 39 | $ | — | $ | — | $ | — | $ | — | $ | — | $ | — | $ | (39 | ) | $ | — | |||||||||||||||||
| Total | $ | 39 | $ | — | $ | — | $ | — | $ | — | $ | — | $ | — | $ | (39 | ) | $ | — | |||||||||||||||||
| * | Investments are transferred into and out of Level 3 for a variety of reasons including, but not limited to: |
| 1) | Investments where trading has been halted (transfer into Level 3) or investments where trading has resumed (transfer out of Level 3). |
| 2) | Broker quoted investments (transfer into Level 3) or quoted prices in active markets (transfer out of Level 3). |
| 3) | Investments that have certain restrictions on trading (transfer into Level 3) or investments where trading restrictions have expired (transfer out of Level 3). |
| † | Change in unrealized appreciation (depreciation) in the current period relating to assets still held at October 31, 2014 was $1,297. |
| ‡ | Change in unrealized appreciation (depreciation) in the current period relating to assets still held at October 31, 2014 was zero. |
| § | Derivative instruments not reflected in the Schedule of Investments are valued at the unrealized appreciation/ depreciation on the investment. |
| Note: | For purposes of reporting transfers between different hierarchy levels, both transfers in and out of each level, as applicable, are shown as if they occurred at the beginning of the period. |
The accompanying notes are an integral part of these financial statements.
| 28 |
| The Hartford Total Return Bond Fund |
| Statement of Assets and Liabilities |
| October 31, 2014 |
| (000’s Omitted) |
| Assets: | ||||
| Investments in securities, at market value (cost $2,108,205) | $ | 2,132,415 | ||
| Cash | 758 | |||
| Foreign currency on deposit with custodian (cost $—) | — | |||
| Unrealized appreciation on foreign currency contracts | 720 | |||
| Unrealized appreciation on OTC swap contracts | 1,056 | |||
| Receivables: | ||||
| Investment securities sold | 298,986 | |||
| Fund shares sold | 3,098 | |||
| Dividends and interest | 8,602 | |||
| Variation margin on financial derivative instruments | 377 | |||
| OTC swap premiums paid | 12,745 | |||
| Other assets | 278 | |||
| Total assets | 2,459,035 | |||
| Liabilities: | ||||
| Unrealized depreciation on foreign currency contracts | 272 | |||
| Unrealized depreciation on OTC swap contracts | 3,153 | |||
| TBA sale commitments, at market value (proceeds $117,554) | 117,755 | |||
| Payables: | ||||
| Investment securities purchased | 594,940 | |||
| Fund shares redeemed | 1,618 | |||
| Investment management fees | 168 | |||
| Dividends | 38 | |||
| Administrative fees | 1 | |||
| Distribution fees | 47 | |||
| Collateral received from broker | 3,939 | |||
| Variation margin on financial derivative instruments | 1,297 | |||
| Accrued expenses | 206 | |||
| OTC swap premiums received | 2,429 | |||
| Written option contracts (proceeds $1,771) | 1,720 | |||
| Other liabilities | 78 | |||
| Total liabilities | 727,661 | |||
| Net assets | $ | 1,731,374 | ||
| Summary of Net Assets: | ||||
| Capital stock and paid-in-capital | $ | 1,674,048 | ||
| Undistributed net investment income | 1,028 | |||
| Accumulated net realized gain | 34,643 | |||
| Unrealized appreciation of investments and the translation of assets and liabilities denominated in foreign currency | 21,655 | |||
| Net assets | $ | 1,731,374 |
The accompanying notes are an integral part of these financial statements.
| 29 |
| The Hartford Total Return Bond Fund |
| Statement of Assets and Liabilities – (continued) |
| October 31, 2014 |
| (000’s Omitted) |
| Shares authorized | 850,000 | |||
| Par value | $ | 0.001 | ||
| Class A: Net asset value per share/Maximum offering price per share | $10.71/$11.21 | |||
| Shares outstanding | 56,256 | |||
| Net assets | $ | 602,306 | ||
| Class B: Net asset value per share | $ | 10.63 | ||
| Shares outstanding | 1,819 | |||
| Net assets | $ | 19,329 | ||
| Class C: Net asset value per share | $ | 10.72 | ||
| Shares outstanding | 6,578 | |||
| Net assets | $ | 70,539 | ||
| Class I: Net asset value per share | $ | 10.72 | ||
| Shares outstanding | 1,095 | |||
| Net assets | $ | 11,737 | ||
| Class R3: Net asset value per share | $ | 10.90 | ||
| Shares outstanding | 630 | |||
| Net assets | $ | 6,868 | ||
| Class R4: Net asset value per share | $ | 10.88 | ||
| Shares outstanding | 1,501 | |||
| Net assets | $ | 16,342 | ||
| Class R5: Net asset value per share | $ | 10.88 | ||
| Shares outstanding | 90 | |||
| Net assets | $ | 978 | ||
| Class Y: Net asset value per share | $ | 10.87 | ||
| Shares outstanding | 92,259 | |||
| Net assets | $ | 1,003,275 |
The accompanying notes are an integral part of these financial statements.
| 30 |
| The Hartford Total Return Bond Fund |
| Statement of Operations |
| For the Year Ended October 31, 2014 |
| (000’s Omitted) |
| Investment Income: | ||||
| Dividends | $ | 230 | ||
| Interest | 52,018 | |||
| Less: Foreign tax withheld | (9 | ) | ||
| Total investment income | 52,239 | |||
| Expenses: | ||||
| Investment management fees | 8,336 | |||
| Administrative services fees | ||||
| Class R3 | 14 | |||
| Class R4 | 23 | |||
| Class R5 | 1 | |||
| Transfer agent fees | ||||
| Class A | 1,129 | |||
| Class B | 94 | |||
| Class C | 115 | |||
| Class I | 8 | |||
| Class R3 | 2 | |||
| Class R4 | 1 | |||
| Class R5 | — | |||
| Class Y | 15 | |||
| Distribution fees | ||||
| Class A | 1,451 | |||
| Class B | 254 | |||
| Class C | 719 | |||
| Class R3 | 35 | |||
| Class R4 | 39 | |||
| Custodian fees | 48 | |||
| Accounting services fees | 330 | |||
| Registration and filing fees | 143 | |||
| Board of Directors' fees | 43 | |||
| Audit fees | 19 | |||
| Other expenses | 231 | |||
| Total expenses (before waivers and fees paid indirectly) | 13,050 | |||
| Expense waivers | (311 | ) | ||
| Management fee waivers | (778 | ) | ||
| Transfer agent fee waivers | (18 | ) | ||
| Custodian fee offset | — | |||
| Total waivers and fees paid indirectly | (1,107 | ) | ||
| Total expenses, net | 11,943 | |||
| Net Investment Income | 40,296 | |||
| Net Realized Gain on Investments, Other Financial Instruments and Foreign Currency Transactions: | ||||
| Net realized gain on investments | 50,219 | |||
| Less: Foreign taxes paid on realized capital gains | (22 | ) | ||
| Net realized gain on purchased option contracts | 625 | |||
| Net realized loss on TBA sale transactions | (7,686 | ) | ||
| Net realized loss on futures contracts | (3,587 | ) | ||
| Net realized gain on written option contracts | 29 | |||
| Net realized loss on swap contracts | (5,166 | ) | ||
| Net realized gain on foreign currency contracts | 461 | |||
| Net realized loss on other foreign currency transactions | (96 | ) | ||
| Net Realized Gain on Investments, Other Financial Instruments and Foreign Currency Transactions | 34,777 | |||
| Net Changes in Unrealized Depreciation of Investments, Other Financial Instruments and Foreign Currency Transactions: | ||||
| Net unrealized depreciation of investments | (2,612 | ) | ||
| Net unrealized depreciation of purchased option contracts | (554 | ) | ||
| Net unrealized appreciation of TBA sale commitments | 1,014 | |||
| Net unrealized appreciation of futures contracts | 1,526 | |||
| Net unrealized appreciation of written option contracts | 51 | |||
| Net unrealized appreciation of swap contracts | 181 | |||
| Net unrealized appreciation of foreign currency contracts | 415 | |||
| Net unrealized depreciation of translation of other assets and liabilities in foreign currencies | (41 | ) | ||
| Net Changes in Unrealized Depreciation of Investments, Other Financial Instruments and Foreign Currency Transactions | (20 | ) | ||
| Net Gain on Investments, Other Financial Instruments and Foreign Currency Transactions | 34,757 | |||
| Net Increase in Net Assets Resulting from Operations | $ | 75,053 |
The accompanying notes are an integral part of these financial statements.
| 31 |
| The Hartford Total Return Bond Fund |
| Statement of Changes in Net Assets |
| (000’s Omitted) |
| For the Year Ended October 31, 2014 | For the Year Ended October 31, 2013 | |||||||
| Operations: | ||||||||
| Net investment income | $ | 40,296 | $ | 40,033 | ||||
| Net realized gain on investments, other financial instruments and foreign currency transactions | 34,777 | 4,534 | ||||||
| Net unrealized depreciation of investments, other financial instruments and foreign currency transactions | (20 | ) | (59,376 | ) | ||||
| Net Increase (Decrease) in Net Assets Resulting from Operations | 75,053 | (14,809 | ) | |||||
| Distributions to Shareholders: | ||||||||
| From net investment income | ||||||||
| Class A | (12,751 | ) | (16,233 | ) | ||||
| Class B | (374 | ) | (681 | ) | ||||
| Class C | (1,041 | ) | (1,601 | ) | ||||
| Class I | (164 | ) | (265 | ) | ||||
| Class R3 | (129 | ) | (187 | ) | ||||
| Class R4 | (334 | ) | (448 | ) | ||||
| Class R5 | (18 | ) | (22 | ) | ||||
| Class Y | (24,020 | ) | (25,350 | ) | ||||
| Total from net investment income | (38,831 | ) | (44,787 | ) | ||||
| From net realized gain on investments | ||||||||
| Class A | — | (20,739 | ) | |||||
| Class B | — | (1,382 | ) | |||||
| Class C | — | (3,099 | ) | |||||
| Class I | — | (464 | ) | |||||
| Class R3 | — | (289 | ) | |||||
| Class R4 | — | (621 | ) | |||||
| Class R5 | — | (29 | ) | |||||
| Class Y | — | (27,439 | ) | |||||
| Total from net realized gain on investments | — | (54,062 | ) | |||||
| Total distributions | (38,831 | ) | (98,849 | ) | ||||
| Capital Share Transactions: | ||||||||
| Class A | 3,081 | (65,339 | ) | |||||
| Class B | (12,494 | ) | (12,994 | ) | ||||
| Class C | (9,035 | ) | (20,796 | ) | ||||
| Class I | 4,842 | (3,565 | ) | |||||
| Class R3 | (945 | ) | (1,703 | ) | ||||
| Class R4 | 270 | (4,958 | ) | |||||
| Class R5 | 299 | (300 | ) | |||||
| Class Y | 98,559 | (11,551 | ) | |||||
| Net increase (decrease) from capital share transactions | 84,577 | (121,206 | ) | |||||
| Net Increase (Decrease) in Net Assets | 120,799 | (234,864 | ) | |||||
| Net Assets: | ||||||||
| Beginning of period | 1,610,575 | 1,845,439 | ||||||
| End of period | $ | 1,731,374 | $ | 1,610,575 | ||||
| Undistributed (distributions in excess of) net investment income | $ | 1,028 | $ | 730 | ||||
The accompanying notes are an integral part of these financial statements.
| 32 |
| The Hartford Total Return Bond Fund |
| Notes to Financial Statements |
| October 31, 2014 |
| (000’s Omitted) |
Organization:
The Hartford Mutual Funds, Inc. (“Company”) is an open-end management investment company comprised of forty-two portfolios. Financial statements for The Hartford Total Return Bond Fund (the "Fund"), a series of the Company, are included in this report.
The Company is organized under the laws of the State of Maryland and is registered with the Securities and Exchange Commission (“SEC”) under the Investment Company Act of 1940, as amended (“1940 Act”). The Fund is a diversified open-end management investment company. The Fund is an investment company and applies specialized accounting and reporting under Accounting Standards Codification Topic 946, Financial Services - Investment Companies.
Class A shares are sold with a front-end sales charge of up to 4.50%. Class B shares were sold with a contingent deferred sales charge which is assessed on the lesser of the per share net asset value (“NAV”) of the shares at the time of redemption or the original purchase price, and declines from up to 5.00% to zero depending on the period of time the shares are held (see note below regarding the closing of Class B shares). Class C shares are sold with a contingent deferred sales charge of up to 1.00% on shares redeemed within twelve months of purchase. Class I shares are sold without sales charges to certain eligible investors primarily through advisory fee-based wrap programs. Class R3, R4 and R5 shares, which are offered to employer-sponsored retirement plans, and Class Y shares, which are sold to certain eligible institutional investors, are sold without a sales charge. All classes of shares have identical voting, redemption, dividend, liquidation and other rights and the same terms and conditions, with the exceptions that each class may have different expenses, which may affect performance, and that Class B shares automatically convert to Class A shares after 8 years.
No new or additional investments are allowed in Class B shares of the Fund (including investments through any systematic investment plan). Existing shareholders of Class B shares may continue to hold their Class B shares, exchange their Class B shares for Class B shares of another Hartford Fund (as permitted by existing exchange privileges), or redeem their Class B shares as described in the Fund’s prospectus. Reinstatement privileges with respect to Class B shares are set forth in the Fund's prospectus. For investors electing to reinvest capital gains and dividends, any such capital gains or dividends on Class B shares will continue to be reinvested in Class B shares of the Fund. All Class B share attributes, including the 12b-1 fee, contingent deferred sales charge schedule, and conversion to Class A shares, remain unchanged.
Significant Accounting Policies:
The following is a summary of significant accounting policies of the Fund in the preparation of its financial statements, which are in accordance with United States generally accepted accounting principles (“U.S. GAAP”). The preparation of financial statements in accordance with U.S. GAAP may require management to make estimates and assumptions that affect the reported amounts of assets and liabilities and disclosure of contingent assets and liabilities at the date of the financial statements and the reported amounts of increases and decreases in net assets from operations during the reporting period. Actual results could differ from those estimates.
Determination of Net Asset Value – The NAV of each class of the Fund's shares is determined as of the close of regular trading (normally 4:00 p.m. Eastern Time) (the “NYSE Close”) on each day that the New York Stock Exchange (the “Exchange”) is open (“Valuation Date”). Information that becomes known to the Fund after the NAV has been calculated on a particular day will not generally be used to retroactively adjust the NAV determined earlier that day.
Investment Valuation and Fair Value Measurements – For purposes of calculating the NAV, portfolio investments and other assets held by the Fund's portfolio for which market quotes are readily available are valued at market value. Market value is generally determined on the basis of last reported sales prices or official close price. If no sales are reported, market value is based on quotes obtained from a quotation reporting system, established market makers, or independent pricing services. If market prices are not readily available or are deemed unreliable, the Fund will use the fair value of the investment as determined in good faith under policies and procedures established by and under the supervision of the Company's Board of Directors. Market quotes are considered not readily available where there is an absence of current or reliable market-based data (e.g., trade information or indicative market quotes), including where events occur after the close of the relevant market, but prior to the NYSE Close, that materially affect the values of the Fund's portfolio investments or assets. In addition, market quotes are considered not readily available when, due to extraordinary circumstances, the exchanges or markets on which the investments trade do not open for trading for the entire day and
| 33 |
| The Hartford Total Return Bond Fund |
| Notes to Financial Statements – (continued) |
| October 31, 2014 |
| (000’s Omitted) |
no other market prices are available. There can be no assurance that the Fund could obtain the fair market value assigned to an investment if the Fund were to sell the investment at approximately the time at which the Fund determines its NAV.
Fixed income investments (other than short-term obligations), non-exchange traded derivatives and centrally cleared swaps held by the Fund are normally valued on the basis of quotes obtained from independent pricing services or brokers and dealers in accordance with procedures established by the Company's Board of Directors. Prices obtained from independent pricing services use information provided by market makers or estimates of market values through accepted market modeling, trading and pricing conventions. Inputs to the models may include, but are not limited to, prepayment speeds, pricing spread, yield, trade information, dealer quotes, market color, cash flow models and the investment’s terms and conditions. Generally, the Fund may use fair valuation in regard to fixed income investments when the Fund holds defaulted or distressed investments or investments in a company in which a reorganization is pending. Senior floating rate interests generally trade in over-the-counter (“OTC”) markets and are priced through an independent pricing service utilizing independent market quotations from loan dealers or financial institutions. A composite bid price is used, which is an average of the dealer marks and dealer runs. Short-term investments maturing in 60 days or less are generally valued at amortized cost, if their original term to maturity was 60 days or less, or by amortizing their value on the 61st day prior to maturity, if the original term to maturity exceeded 60 days, which approximates fair value.
Exchange traded options, futures and options on futures are valued at the settlement price or last trade price determined by the relevant exchange as of the NYSE Close. If the last trade price for exchange traded options does not fall between the bid and ask prices, the value will be the mean of the bid and ask prices as of the NYSE Close. If a last trade price is not available, the value will be the mean of the bid and ask prices as of the NYSE Close. If a mean of the bid and ask prices cannot be calculated for the day, the value will be the bid price as of the NYSE Close. In the case of OTC options and such instruments that do not trade on an exchange, values may be supplied by a pricing service using a formula or other objective method that may take into consideration the style, direction, expiration, strike price, notional value and volatility or other special adjustments.
Investments valued in currencies other than U.S. dollars are converted to U.S. dollars using exchange rates obtained from independent pricing services for calculation of the NAV. As a result, the NAV of the Fund’s shares may be affected by changes in the value of currencies in relation to the U.S. dollar. The value of investments traded in markets outside the United States or denominated in currencies other than the U.S. dollar may be affected significantly on a day that the NYSE is closed and the market value may change on days when an investor is not able to purchase, redeem or exchange shares of the Fund.
Foreign currency contracts represent agreements to exchange currencies on specific future dates at predetermined rates. Foreign currency contracts are valued using foreign currency exchange rates and forward rates as provided by an independent pricing service on the Valuation Date.
Investments in open-end mutual funds are valued at the respective NAV of each open-end mutual fund on the Valuation Date.
Financial instruments for which prices are not available from an independent pricing service may be valued using market quotations obtained from one or more dealers that make markets in the respective financial instrument in accordance with procedures established by the Company's Board of Directors.
U.S. GAAP defines fair value as the price that the Fund would receive to sell an asset or pay to transfer a liability in an orderly transaction between market participants. The U.S. GAAP fair value measurement standards require disclosure of a fair value hierarchy for each major category of assets and liabilities. Various inputs are used in determining the fair value of the Fund’s investments. These inputs are summarized into three broad hierarchy levels. This hierarchy is based on whether the valuation inputs are observable or unobservable. These levels are:
Level 1 – Quoted prices in active markets for identical investments. Level 1 may include exchange traded instruments, such as domestic equities, some foreign equities, options, futures, mutual funds, exchange traded funds, rights and warrants.
Level 2 – Observable inputs other than Level 1 prices, such as quoted prices for similar investments; quoted prices in markets that are not active; or other inputs that are observable or can be corroborated by observable market data. Level 2 may include debt investments that are traded less frequently than exchange traded instruments and which are valued using independent
| 34 |
| The Hartford Total Return Bond Fund |
| Notes to Financial Statements – (continued) |
| October 31, 2014 |
| (000’s Omitted) |
pricing services; foreign equities, which are principally traded on certain foreign markets and are adjusted daily pursuant to a fair value pricing service in order to reflect an adjustment for the factors occurring after the close of certain foreign markets but before the NYSE Close; senior floating rate interests, which are valued using an aggregate of dealer bids; short-term investments, which are valued at amortized cost; and swaps, which are valued based upon the terms of each swap contract.
Level 3 – Significant unobservable inputs that are supported by limited or no market activity. Level 3 may include financial instruments whose values are determined using indicative market quotes or require significant management judgment or estimation. These unobservable valuation inputs may include estimates for current yields, maturity/duration, prepayment speed, and indicative market quotes for comparable investments along with other assumptions relating to credit quality, collateral value, complexity of the investment structure, general market conditions and liquidity. This category may include investments where trading has been halted or there are certain restrictions on trading. While these investments are priced using unobservable inputs, the valuation of these investments reflects the best available data and management believes the prices are a reasonable representation of exit price. For more information on specific valuation techniques and unobservable inputs, please see the following table titled "Quantitative Information about Level 3 Fair Value Measurements."
The Board of Directors of the Company generally reviews and approves the “Procedures for Valuation of Portfolio Securities” at least once a year. These procedures define how investments are to be valued, including the formation and activities of a Valuation Committee. The Valuation Committee is responsible for determining in good faith the fair value of investments when the value cannot be obtained from primary pricing services or alternative sources or if the valuation of an investment as provided by the primary pricing service or alternative source is believed not to reflect the investment’s fair value as of the Valuation Date. Voting members of the Valuation Committee include the Fund’s Treasurer or designee and a Vice President of the investment manager or designee. An Assistant Vice President of the Fund with legal expertise or designee is also included on the Valuation Committee as a non-voting advisory member. In addition, the Fund’s Chief Compliance Officer shall designate a member of the compliance group to attend Valuation Committee meetings as a non-voting resource, to monitor for and provide guidance with respect to compliance with these procedures. Two members of the Valuation Committee or their designees, representing different departments, shall constitute a quorum for purposes of permitting the Valuation Committee to take action. The Valuation Committee will consider all relevant factors in determining an investment’s fair value, and may seek the advice of the Fund’s sub-adviser, knowledgeable brokers, and legal counsel in making such determination. The Valuation Committee reports to the Audit Committee of the Company’s Board of Directors. The Audit Committee receives quarterly written reports which include details of all fair-valued investments, including the reason for the fair valuation, and an indication, when possible, of the accuracy of the valuation by disclosing the next available reliable public price quotation or the disposition price of such investments (the “look-back” test). The Board of Directors then must consider for ratification all of the fair value determinations made during the previous quarter.
Valuation levels are not necessarily indicative of the risk associated with investing in such investments. Individual investments within any of the above mentioned asset classes may be assigned a different hierarchical level than those presented above, as individual circumstances dictate.
For additional information, refer to the Investment Valuation Hierarchy Level Summary and the Level 3 roll-forward reconciliation, if applicable, which follow the Schedule of Investments.
| 35 |
| The Hartford Total Return Bond Fund |
| Notes to Financial Statements – (continued) |
| October 31, 2014 |
| (000’s Omitted) |
Quantitative Information about Level 3 Fair Value Measurements:
| Security Type/Valuation Technique | Unobservable Input * | Input
Value(s) Range (Weighted Average) ‡ | Fair
Value at October 31, 2014 | |||||
| Assets: | ||||||||
| Asset and Commercial Mortgage Backed Securities | ||||||||
| Cost | Recent trade price | $100.44 | $ | 889 | ||||
| Date | 10/24/2014 | |||||||
| Discounted cash flow | Internal rate of return | 2.79% - 6.87% (4.43%) | 38,028 | |||||
| Life expectancy (in months) | 24 - 309 (142) | |||||||
| Independent pricing service | Prior day valuation | $67.09 - $100.12 ($72.07) | 1,408 | |||||
| Indicative market quotations | Broker quote † | $99.91 - $100.22 ($100.09) | 6,837 | |||||
| Corporate Bonds | ||||||||
| Cost | Recent trade price | $100.00 | 1,250 | |||||
| Date | 10/30/2014 | |||||||
| Total | $ | 48,412 | ||||||
| * | Significant changes to any unobservable inputs may result in a significant change to the fair value. |
| ‡ | Unless otherwise noted, inputs were weighted based on the fair value of the investments included in the range. |
| † | The broker quote represents the best available estimate of fair value per share as of October 31, 2014. |
Investment Transactions and Investment Income – Investment transactions are recorded as of the trade date (the date the order to buy or sell is executed) for financial reporting purposes. Investments purchased or sold on a when-issued or delayed-delivery basis may be settled a month or more after the trade date. Realized gains and losses are determined on the basis of identified cost.
Trade date for senior floating rate interests purchased in the primary loan market is considered the date on which the loan allocations are determined. Trade date for senior floating rate interests purchased in the secondary loan market is the date on which the transaction is entered into.
Dividend income from domestic securities is accrued on the ex-dividend date. Interest income, including amortization of premium, accretion of discounts and additional principal received in-kind in lieu of cash, is accrued on a daily basis. Paydown gains and losses on mortgage related and other asset backed securities are included in interest income in the Statement of Operations, as applicable.
Taxes – The Fund may be subject to taxes imposed on realized gains on securities of certain foreign countries in which the Fund invests. The amount of foreign tax expense is included on the accompanying Statement of Operations as a reduction to net realized gain on investments in these securities.
Foreign Currency Transactions – Assets and liabilities denominated in currencies other than U.S. dollars are translated into U.S. dollars at the exchange rates in effect on the valuation date. Purchases and sales of investments, income and expenses are translated into U.S. dollars at the exchange rates on the dates of such transactions.
The Fund does not isolate that portion of portfolio investment valuation resulting from fluctuations in the foreign currency exchange rates from the fluctuations arising from changes in the market prices of investments held. Exchange rate fluctuations are included with the net realized and unrealized gain or loss on investments in the accompanying financial statements.
Net realized foreign exchange gains or losses arise from sales of foreign currencies and the difference between asset and liability amounts initially stated in foreign currencies and the U.S. dollar value of the amounts actually received or paid. Net unrealized foreign exchange gains or losses arise from changes in the value of other assets and liabilities at the end of the reporting period, resulting from changes in the exchange rates.
Joint Trading Account – The Fund may invest cash balances into a joint trading account that may be invested in one or more repurchase agreements.
Fund Share Valuation and Dividend Distributions to Shareholders – Orders for the Fund’s shares are executed in accordance with the investment instructions of the shareholders. The NAV of the Fund’s shares is determined as of the close of business on each business day of the Exchange. The NAV is determined separately for each class of shares of the Fund by dividing the Fund’s net
| 36 |
| The Hartford Total Return Bond Fund |
| Notes to Financial Statements – (continued) |
| October 31, 2014 |
| (000’s Omitted) |
assets attributable to that class by the number of shares of the class outstanding. Each class of shares offered by the Fund has equal rights as to assets and voting privileges (except that shareholders of a class have exclusive voting rights regarding any matter relating solely to that class of shares). Income and non-class specific expenses are allocated daily to each class on the basis of the relative net assets of the class. Realized and unrealized gains and losses are allocated daily based on the relative net assets of each class of shares of the Fund.
Orders for the purchase of the Fund’s shares received prior to the close of the Exchange on any day the Exchange is open for business are priced at the NAV determined as of the close of the Exchange. Orders received after the close of the Exchange, or on a day on which the Exchange and/or the Fund is not open for business, are priced at the next determined NAV.
Dividends are declared pursuant to a policy adopted by the Company's Board of Directors based upon the investment performance of the Fund. Normally, dividends from net investment income are declared daily and paid monthly. Dividends from realized gains, if any, are paid at least once a year.
Net investment income, dividends and distributions from net realized gains and capital are determined in accordance with federal income tax regulations, which may differ from U.S. GAAP with respect to character and timing (see Federal Income Taxes: Distributions and Components of Distributable Earnings and Reclassification of Capital Accounts).
Securities and Other Investments:
Repurchase Agreements – A repurchase agreement is an agreement by which a counterparty agrees to sell an investment and agrees to repurchase the investment sold from the buyer at a mutually agreed upon time and price. During the period of the repurchase agreement, the counterparty will deposit cash and or securities in a third party custodial account to serve as collateral. At the time the Fund enters into a repurchase agreement, the value of the underlying collateral, including accrued interest, will be equal to or exceed the value of the repurchase agreement. Repurchase agreements expose the Fund to counterparty risk - that is, the risk that the counterparty will not fulfill its obligations. To minimize counterparty risk, the investments that serve to collateralize the repurchase agreement are held by the Fund’s custodian in book entry or physical form in the custodial account of the Fund or in a third party custodial account. Repurchase agreements are valued at cost plus accrued interest, which approximates fair value. Repurchase agreements have master netting arrangements which allow the Fund to offset amounts owed to a counterparty with amounts owed by the counterparty, including any collateral. Upon an event of default under a master repurchase agreement, the non-defaulting party may close out all transactions traded under such agreement and net amounts owed under each transaction to one net amount payable by one party to the other. Absent an event of default, the master repurchase agreement does not result in an offset of reported amounts of assets and liabilities in the Statement of Assets and Liabilities across transactions between the Fund and the applicable counterparty. The Fund, as shown on the Schedule of Investments, had outstanding repurchase agreements and related collateral as of October 31, 2014.
Illiquid and Restricted Investments – The Fund is permitted to invest up to 15% of its net assets in illiquid investments. Illiquid investments are those that may not be sold or disposed of in the ordinary course of business within seven days, at approximately the price used to determine the Fund’s NAV. The Fund may not be able to sell illiquid investments when its sub-adviser considers it desirable to do so or may have to sell such investments at a price that is lower than the price that could be obtained if the investments were more liquid. A sale of illiquid investments may require more time and may result in higher dealer discounts and other selling expenses than does the sale of those that are liquid. Illiquid investments also may be more difficult to value due to the unavailability of reliable market quotations for such investments, and an investment in them may have an adverse impact on the Fund’s NAV. The Fund may also purchase certain restricted investments that can only be resold to certain qualified investors and may be determined to be liquid pursuant to policies and guidelines established by the Company's Board of Directors. The Fund, as shown on the Schedule of Investments, had illiquid or restricted investments as of October 31, 2014.
Investments Purchased on a When-Issued or Delayed-Delivery Basis – Delivery and payment for investments that have been purchased by the Fund on a forward commitment, or when-issued or delayed-delivery basis, take place beyond the customary settlement period. The Fund may dispose of or renegotiate a delayed-delivery transaction after it is entered into, and may sell delayed-delivery investments before they are delivered, which may result in a realized gain or loss. During this period, such investments are subject to market fluctuations, and the Fund identifies investments segregated in its records with a value at least
| 37 |
| The Hartford Total Return Bond Fund |
| Notes to Financial Statements – (continued) |
| October 31, 2014 |
| (000’s Omitted) |
equal to the amount of the commitment. The Fund, as shown on the Schedule of Investments, had when-issued or delayed-delivery investments as of October 31, 2014.
In connection with the Fund’s ability to purchase investments on a when-issued or forward commitment basis, the Fund may enter into to-be announced (“TBA”) commitments. TBA commitments are forward agreements for the purchase or sale of mortgage backed securities for a fixed price, with payment and delivery on an agreed-upon future settlement date. The specific securities to be delivered are not identified at the trade date; however, delivered securities must meet specified terms, including issuer, rate and mortgage terms. Although the Fund may enter into TBA commitments with the intention of acquiring or delivering securities for its portfolio, the Fund can extend the settlement date, roll the transaction, or dispose of a commitment prior to settlement if deemed appropriate to do so. If the TBA commitment is closed through the acquisition of an offsetting TBA commitment, the Fund realizes a gain or loss. In a TBA roll transaction, the Fund generally purchases or sells the initial TBA commitment prior to the agreed upon settlement date and enters into a new TBA commitment for future delivery or receipt of the mortgage backed securities. TBA commitments involve a risk of loss if the value of the security to be purchased or sold declines or increases, respectively, prior to settlement date.
The Fund may enter into “dollar rolls” in which the Fund sells securities and contracts with the same counterparty to repurchase substantially similar securities (for example, same issuer, coupon and maturity) on a specified future date at an agreed upon price. The Fund gives up the right to receive interest paid on the investments sold. The Fund would benefit to the extent of any differences between the price received for the security and the lower forward price for the future purchase. Dollar rolls involve the risk that the market value of the securities that the Fund is required to purchase may decline below the agreed upon repurchase price of those securities. The Fund records dollar roll transactions as purchases and sales and realizes gains and losses on these transactions. These transactions are excluded from the Fund’s portfolio turnover rate. The Fund, as shown on the Schedule of Investments, had open TBA commitments as of October 31, 2014, which may be a part of dollar roll transactions.
Senior Floating Rate Interests – The Fund may invest in senior floating rate interests. Senior floating rate interests hold the most senior position in the capital structure of a business entity (the “Borrower”), are typically secured by specific collateral and have a claim on the assets and/or stock of the Borrower that is senior to the assets held by subordinated debtholders and stockholders of the Borrower. Senior floating rate interests are typically structured and administered by a financial institution that acts as the agent of the lenders participating in the senior floating rate interest. The Fund may invest in multiple series or tranches of a senior floating rate interest, which may have varying terms and carry different associated risks. The Fund may also enter into unfunded loan commitments, which are contractual obligations for future funding. Unfunded loan commitments may include revolving credit facilities, which may obligate the Fund to supply additional cash to the borrower on demand, representing a potential financial obligation by the Fund in the future. The Fund may receive a commitment fee based on the undrawn portion of the underlying line of credit portion of a senior floating rate interest. In certain circumstances, the Fund may receive various fees upon the restructure of a senior floating rate interest by a borrower. Fees earned/paid are recorded as a component of income or realized gain/loss in the Statement of Operations.
Senior floating rate interests are typically rated below-investment-grade, which suggests the risk of default is higher, and generally pay higher interest rates than investment-grade debt securities. A default could lead to non-payment of income or principal, which would result in a reduction of investment income to the Fund, and there can be no assurance that the liquidation of any collateral would satisfy the Borrower’s obligation in the event of non-payment of scheduled interest or principal payments, or that such collateral could be readily liquidated. The Fund, as shown on the Schedule of Investments, had senior floating rate interests as of October 31, 2014.
Mortgage Related and Other Asset Backed Securities – The Fund may invest in mortgage related and other asset backed securities. These securities include mortgage pass-through securities, collateralized mortgage obligations, commercial mortgage backed securities, stripped mortgage backed securities, asset backed securities, collateralized debt obligations and other securities that directly or indirectly represent a participation in, or are secured by and payable from, mortgage loans on real property. Mortgage related securities are created from pools of residential or commercial mortgage loans, including mortgage loans made by savings and loan institutions, mortgage bankers, commercial banks and other similar financial institutions. Asset backed securities are created from many types of assets, including auto loans, credit card receivables, home equity loans, and student loans. These securities provide a monthly payment that consists of both interest and principal payments. Interest payments may be determined by fixed or adjustable rates. The rate of pre-payments on underlying mortgages will affect the price and volatility of a mortgage related security,
| 38 |
| The Hartford Total Return Bond Fund |
| Notes to Financial Statements – (continued) |
| October 31, 2014 |
| (000’s Omitted) |
and may have the effect of shortening or extending the effective duration of the security relative to what was anticipated at the time of purchase. The timely payment of principal and interest of certain mortgage related securities is guaranteed by the full faith and credit of the United States Government. Mortgage related and other asset backed securities created and guaranteed by non-governmental issuers, including government-sponsored corporations, may be supported by various forms of insurance or guarantees, but there can be no assurance that the private insurers or guarantors can meet their obligations under the insurance policies or guarantee arrangements. The Fund, as shown on the Schedule of Investments, had outstanding mortgage related and other asset backed securities as of October 31, 2014.
Inflation Indexed Bonds – The Fund may invest in inflation indexed bonds. Inflation indexed bonds are fixed income investments whose principal value is periodically adjusted to the rate of inflation. The interest rate on these bonds is generally fixed at issuance at a rate lower than typical bonds. Over the life of an inflation indexed bond, however, interest will be paid based on a principal value, which is adjusted for inflation. Any increase or decrease in the principal amount of an inflation indexed bond will be included as interest income on the Statement of Operations, even though investors do not receive the principal amount until maturity. The Fund, as shown on the Schedule of Investments, had inflation indexed bonds as of October 31, 2014.
Financial Derivative Instruments:
The following disclosures contain information on how and why the Fund uses derivative instruments, the credit-risk-related contingent features in certain derivative instruments and how derivative instruments affect the Fund’s financial position and results of operations. The location and fair value amounts of these instruments on the Statement of Assets and Liabilities and the realized gains and losses and changes in unrealized gains and losses on the Statement of Operations, each categorized by type of derivative contract, are included in the following Additional Derivative Instrument Information footnote. The derivative instruments outstanding as of year-end are disclosed in the notes to the Schedule of Investments, if applicable. The amounts of realized gains and losses and changes in unrealized gains and losses on derivative instruments during the year are disclosed in the Statement of Operations.
Foreign Currency Contracts – The Fund may enter into foreign currency contracts that obligate the Fund to purchase or sell currencies at specified future dates. Foreign currency contracts are used to hedge the currency exposure associated with some or all of the Fund’s investments and/or as part of an investment strategy. Foreign currency contracts are marked to market daily and the change in value is recorded by the Fund as an unrealized gain or loss. The Fund will record a realized gain or loss when the foreign currency contract is settled.
Foreign currency contracts involve elements of market risk in excess of the amounts reflected in the Statement of Assets and Liabilities. In addition, risks may arise upon entering into these contracts from the potential inability of the counterparties to meet the terms of the contracts and from unanticipated movements in the value of the foreign currencies relative to the U.S. dollar. The Fund, as shown on the Schedule of Investments, had outstanding foreign currency contracts as of October 31, 2014.
Futures Contracts – The Fund may enter into futures contracts. A futures contract is an agreement between two parties to buy or sell an asset at a set price on a future date. The Fund uses futures contracts to manage or obtain exposure to the investment markets, commodities, or movements in interest rates and currency values. The primary risks associated with the use of futures contracts are the imperfect correlation between the change in market value of the investments held by the Fund and the prices of futures contracts and the possibility of an illiquid market. Upon entering into a futures contract, the Fund is required to deposit with a futures commission merchant (“FCM”) an amount of cash or U.S. Government or Agency Obligations in accordance with the initial margin requirements of the broker or exchange. Futures contracts are marked to market daily at the most recent settlement price reported by an exchange on which, over time, they are traded most extensively, and an appropriate payable or receivable for the change in value (“variation margin”) is recorded by the Fund. Gains or losses are recognized but not considered realized until the contracts expire or are closed. Futures contracts involve, to varying degrees, risk of loss in excess of the variation margin disclosed on the Statement of Assets and Liabilities; however, the Fund seeks to reduce this risk through the use of an FCM. The Fund, as shown on the Schedule of Investments, had outstanding futures contracts as of October 31, 2014.
Options Contracts – An option contract is a contract sold by one party to another party that offers the buyer the right, but not the obligation, to buy (call) or sell (put) an investment or other financial asset at an agreed-upon price during a specific period of time or on a specific date. Options contracts are either privately negotiated in the over-the-counter market ("OTC options") or executed in
| 39 |
| The Hartford Total Return Bond Fund |
| Notes to Financial Statements – (continued) |
| October 31, 2014 |
| (000’s Omitted) |
a registered exchange ("exchange traded options"). The Fund may write (sell) covered call and put options on futures, swaps (“swaptions”), securities, commodities or currencies. “Covered” means that so long as the Fund is obligated as the writer of an option, it will own either the underlying investments or currency or an option to purchase the same underlying investments or currency having an expiration date of the covered option and an exercise price equal to or less than the exercise price of the covered option, or will pledge cash or other liquid investments having a value equal to or greater than the fluctuating market value of the option investment or currency. Writing put options increases the Fund’s exposure to the underlying instrument. Writing call options decreases the Fund’s exposure to the underlying instrument. Premiums received from writing options that expire are treated as realized gains. Premiums received from writing options that are exercised or closed are added to the proceeds or offset amounts paid on the underlying futures, swap, investment or currency transaction to determine the realized gain or loss. The Fund as a writer of an option has no control over whether the underlying instrument may be sold (call) or purchased (put) and as a result bears the market risk of an unfavorable change in the price of the instrument underlying the written option. There is the risk the Fund may not be able to enter into a closing transaction because of an illiquid market. The Fund may also purchase put and call options. Purchasing call options increases the Fund’s exposure to the underlying instrument. Purchasing put options decreases the Fund’s exposure to the underlying instrument. The Fund pays a premium, which is included on the Fund’s Statement of Assets and Liabilities as an investment and is subsequently marked to market to reflect the current value of the option. Premiums paid for purchasing options that expire are treated as realized losses. Certain options may be purchased with premiums to be determined on a future date. The premiums for these options are based upon implied volatility parameters at specified terms. The risk associated with purchasing put and call options is generally limited to the premium paid. Premiums paid for purchasing options that are exercised or closed are added to the amounts paid or offset against the proceeds on the underlying investment transaction to determine the realized gain or loss. Entering into over-the-counter options also exposes the Fund to counterparty risk. Counterparty risk is the possibility that the counterparty to the agreements may default on its obligation to perform or disagree as to the meaning of the contractual terms in the agreements.
The Fund, as shown on the Schedule of Investments, had outstanding purchased and written option contracts as of October 31, 2014. Transactions involving written option contracts during the year ended October 31, 2014, are summarized below:
| Options Contract Activity During the Year Ended October 31, 2014: | ||||||||
| Call Options Written During the Year | Number of Contracts* | Premium Amounts | ||||||
| Beginning of the period | — | $ | — | |||||
| Written | 145,414,434 | 2,295 | ||||||
| Expired | — | — | ||||||
| Closed | (5,050,434 | ) | (1,322 | ) | ||||
| Exercised | — | — | ||||||
| End of period | 140,364,000 | $ | 973 | |||||
| Put Options Written During the Year | Number of Contracts* | Premium Amounts | ||||||
| Beginning of the period | — | $ | — | |||||
| Written | 145,414,415 | 2,103 | ||||||
| Expired | — | — | ||||||
| Closed | (7,135,415 | ) | (1,305 | ) | ||||
| Exercised | — | — | ||||||
| End of period | 138,279,000 | $ | 798 | |||||
* The number of contracts does not omit 000's.
Swap Contracts – The Fund may invest in swap contracts. Swap contracts are agreements to exchange or swap investment cash flows, assets, foreign currencies or market-linked returns at specified, future intervals. Swap contracts are either privately negotiated in the over-the-counter market (“OTC swaps”) or cleared in a central clearing house (“centrally cleared swaps”). The Fund may enter into credit default, total return, cross-currency, interest rate, inflation and other forms of swap contracts to manage its exposure to credit, currency, interest rate, commodity and inflation risk. Swap contracts are also used to gain exposure to certain markets. In connection with these contracts, investments or cash may be identified as collateral or margin in accordance with the terms of the respective swap contracts and/or master netting arrangement to provide assets of value and recourse in the event of default or bankruptcy/insolvency.
Swaps are valued based on custom valuations furnished by an independent pricing service. Swaps for which prices are not available from an independent pricing service are valued in accordance with procedures established by the Company's Board of Directors.
| 40 |
| The Hartford Total Return Bond Fund |
| Notes to Financial Statements – (continued) |
| October 31, 2014 |
| (000’s Omitted) |
Changes in market value, if any, are reflected as a component of net changes in unrealized appreciation or depreciation on the Statement of Operations. Daily changes in valuation of centrally cleared swaps, if any, are recorded as a receivable or payable for the change in value (“variation margin”) on the Statement of Assets and Liabilities. Realized gains or losses on centrally cleared swaps are recorded upon the termination of the swap. OTC swap payments received or paid at the beginning of the measurement period are reflected as such on the Statement of Assets and Liabilities and represent premiums paid or received upon entering into the swap contract to compensate for differences between the stated terms of the swap contract and prevailing market conditions (credit spreads, currency exchange rates, interest rates and other relevant factors). These upfront premiums are recorded as realized gains or losses on the Statement of Operations upon termination or maturity of the swap. A liquidation payment received or made at the termination or maturity of the swap is recorded as a realized gain or loss on the Statement of Operations. Net periodic payments received or paid by the Fund are included as part of realized gains or losses on the Statement of Operations.
Entering into these contracts involves, to varying degrees, elements of liquidation, counterparty, credit and market risk in excess of the amounts recognized on the Statement of Assets and Liabilities. Such risks involve the possibility that there will be no liquid market for these contracts, that the counterparty to the contracts may default on its obligation to perform or disagree as to the meaning of contractual terms in the contracts, and that there may be unfavorable changes in market conditions (credit spreads, currency exchange rates, interest rates and other relevant factors).
The Fund’s maximum risk of loss from counterparty risk for OTC swaps is the net value of the discounted cash flows to be received from the counterparty over the contract’s remaining life, and current market value, to the extent that amount is positive. The risk is mitigated by having a master netting arrangement between the Fund and the counterparty, which allows for the netting of payments made or received (although such amounts are presented on a gross basis within the Statement of Assets and Liabilities, as applicable) as well as the posting of collateral to the Fund to cover the Fund’s exposure to the counterparty. In a centrally cleared swap, while the Fund enters into an agreement with a clearing broker to execute contracts with a counterparty, the performance of the swap is guaranteed by the central clearinghouse, which reduces the Fund’s exposure to counterparty risk. The Fund is still exposed to the counterparty risk through the clearing broker and clearinghouse. The clearinghouse attempts to minimize this risk to its participants through the use of mandatory margin requirements, daily cash settlements and other procedures. Likewise, the clearing broker reduces its risk through margin requirements and required segregation of customer balances.
Credit Default Swap Contracts – The credit default swap market allows the Fund to manage its exposure to the market or certain sectors of the market, to reduce its risk exposure to defaults of corporate and sovereign issuers, or to create exposure to corporate or sovereign issuers to which it is not otherwise exposed. Certain credit default swaps involve the exchange of a fixed rate premium for protection against the loss in value of an underlying investment or index in the event of a credit event, such as payment default or bankruptcy.
Under a credit default swap contract, one party acts as guarantor by receiving the fixed periodic payment in exchange for the commitment to purchase the underlying investment at par if the defined credit event occurs. Upon the occurrence of a defined credit event, the difference between the value of the reference obligation and the swap’s notional amount is recorded as realized gain or loss on swap transactions in the Statement of Operations. A “buyer” of credit protection agrees to pay a counterparty to assume the credit risk of an issuer upon the occurrence of certain events. The “seller” of the protection receives periodic payments and agrees to assume the credit risk of an issuer upon the occurrence of certain events. Although specified events are contract specific, credit events are generally defined as bankruptcy, failure to pay, restructuring, obligation acceleration, obligation default or repudiation/moratorium. A “seller’s” exposure is limited to the total notional amount of the credit default swap contract. These potential amounts would be partially offset by any recovery values of the respective referenced obligations or upfront payments received upon entering into the contract.
Implied credit spreads, represented in absolute terms, utilized in determining the market value of credit default swap contracts on corporate issues, sovereign government issues or U.S. municipal issues as of year-end are disclosed in the notes to the Schedule of Investments, as applicable, and serve as an indicator of the current status of the payment/performance risk and represent the likelihood or risk of default for the credit derivative. The implied credit spread of a particular referenced entity reflects the cost of buying/selling protection and there may also be upfront payments required to be made to enter into the contract. Wider credit spreads represent a deterioration of the referenced entity’s credit soundness and a greater likelihood or risk of default or other credit event occurring as defined under the terms of the contract. For credit default swap contracts on credit indices, the quoted market prices and
| 41 |
| The Hartford Total Return Bond Fund |
| Notes to Financial Statements – (continued) |
| October 31, 2014 |
| (000’s Omitted) |
resulting values serve as the indicator of the current status of the payment/performance risk. Increasing market values, in absolute terms when compared to the notional amount of the swap, represent a deterioration of the referenced equity’s credit soundness and a greater likelihood or risk of default or other credit event occurring as defined under the terms of the contract. The Fund, as shown on the Schedule of Investments, had outstanding credit default swap contracts as of October 31, 2014.
Interest Rate Swap Contracts – The Fund is subject to interest rate risk exposure in the normal course of pursuing its investment objectives. Because the Fund holds fixed rate bonds, the value of these bonds may decrease if interest rates rise. To hedge against this risk and to maintain its ability to generate income at prevailing market rates, the Fund may enter into interest rate swap contracts. In a typical interest rate swap, one party agrees to make regular payments equal to a floating interest rate, based on a specified interest rate or benchmark (e.g. London Interbank Offered Rate (“LIBOR”)), multiplied by a notional amount, in return for payments equal to a fixed rate multiplied by the same amount, for a specific period of time. The net interest received or paid on interest rate swap contracts is recorded as a realized gain or loss. Interest rate swaps are marked to market daily and the change, if any, is recorded as an unrealized gain or loss in the Statement of Operations. When the interest rate swap contract is terminated early, the Fund records a realized gain or loss equal to the difference between the current market value and the upfront premium or cost.
If an interest rate swap contract provides for payments in different currencies, the parties might agree to exchange the notional amount as well. Interest rate swaps may also depend on other prices or rates, such as the value of an index. The risks of interest rate swaps include changes in market conditions which will affect the value of the contract or the cash flows and the possible inability of the counterparty to fulfill its obligations under the contract. The Fund’s maximum risk of loss from counterparty credit risk is the discounted net value of the cash flows to be received from the counterparty over the contract’s remaining life, to the extent that amount is positive. The Fund, as shown on the Schedule of Investments, had outstanding interest rate swap contracts as of October 31, 2014.
Spreadlock Swap Contracts – The Fund may invest in spreadlock swap contracts. These contracts involve commitments to pay or receive a settlement amount calculated as the spread difference between two interest rate curves and a fixed spread at a specific forward date determined at the beginning of the contract. Settlement amounts paid or received are recorded as a realized gain or loss on the Statement of Operations at the determination date. The Fund had no outstanding spreadlock swap contracts as of October 31, 2014.
Additional Derivative Instrument Information:
Fair Value of Derivative Instruments on the Statement of Assets and Liabilities as of October 31, 2014:
| Risk Exposure Category | ||||||||||||||||||||||||||||
| Interest Rate Contracts | Foreign Exchange Contracts | Credit Contracts | Equity Contracts | Commodity Contracts | Other Contracts | Total | ||||||||||||||||||||||
| Assets: | ||||||||||||||||||||||||||||
| Investments in securities, at value (purchased option contracts), market value | $ | 50 | $ | 276 | $ | — | $ | — | $ | — | $ | — | $ | 326 | ||||||||||||||
| Unrealized appreciation on foreign currency contracts | — | 720 | — | — | — | — | 720 | |||||||||||||||||||||
| Unrealized appreciation on OTC swap contracts | — | — | 1,056 | — | — | — | 1,056 | |||||||||||||||||||||
| Variation margin receivable * | 365 | — | 12 | — | — | — | 377 | |||||||||||||||||||||
| Total | $ | 415 | $ | 996 | $ | 1,068 | $ | — | $ | — | $ | — | $ | 2,479 | ||||||||||||||
| Liabilities: | ||||||||||||||||||||||||||||
| Unrealized depreciation on foreign currency contracts | $ | — | $ | 272 | $ | — | $ | — | $ | — | $ | — | $ | 272 | ||||||||||||||
| Unrealized depreciation on OTC swap contracts | — | — | 3,153 | — | — | — | 3,153 | |||||||||||||||||||||
| Variation margin payable * | 854 | — | 443 | — | — | — | 1,297 | |||||||||||||||||||||
| Written option contracts, market value | 1,219 | — | 501 | — | — | — | 1,720 | |||||||||||||||||||||
| Total | $ | 2,073 | $ | 272 | $ | 4,097 | $ | — | $ | — | $ | — | $ | 6,442 | ||||||||||||||
* Only current day's variation margin is reported within the Statement of Assets and Liabilities. The variation margin is included in the open futures net cumulative appreciation of $596 and open centrally cleared swaps net cumulative depreciation of $(1,303) as reported in the Schedule of Investments.
| 42 |
| The Hartford Total Return Bond Fund |
| Notes to Financial Statements – (continued) |
| October 31, 2014 |
| (000’s Omitted) |
The volume of derivatives that is presented in the Schedule of Investments is consistent with the derivative activity during the year ended October 31, 2014.
The Effect of Derivative Instruments on the Statement of Operations for the year ended October 31, 2014:
| Risk Exposure Category | ||||||||||||||||||||||||||||
| Interest Rate Contracts | Foreign Exchange Contracts | Credit Contracts | Equity Contracts | Commodity Contracts | Other Contracts | Total | ||||||||||||||||||||||
| Realized Gain (Loss) on Derivatives Recognized as a Result of Operations: | ||||||||||||||||||||||||||||
| Net realized gain on purchased option contracts | $ | 625 | $ | — | $ | — | $ | — | $ | — | $ | — | $ | 625 | ||||||||||||||
| Net realized loss on futures contracts | (3,587 | ) | — | — | — | — | — | (3,587 | ) | |||||||||||||||||||
| Net realized gain on written option contracts | 28 | — | 1 | — | — | — | 29 | |||||||||||||||||||||
| Net realized loss on swap contracts | (386 | ) | — | (4,780 | ) | — | — | — | (5,166 | ) | ||||||||||||||||||
| Net realized gain on foreign currency contracts | — | 461 | — | — | — | — | 461 | |||||||||||||||||||||
| Total | $ | (3,320 | ) | $ | 461 | $ | (4,779 | ) | $ | — | $ | — | $ | — | $ | (7,638 | ) | |||||||||||
| Net Change in Unrealized Appreciation (Depreciation) on Derivatives Recognized as a Result of Operations: | ||||||||||||||||||||||||||||
| Net change in unrealized depreciation of purchased option contracts | $ | (493 | ) | $ | (58 | ) | $ | (3 | ) | $ | — | $ | — | $ | — | $ | (554 | ) | ||||||||||
| Net change in unrealized appreciation of futures contracts | 1,526 | — | — | — | — | — | 1,526 | |||||||||||||||||||||
| Net change in unrealized appreciation of written option contracts | 47 | — | 4 | — | — | — | 51 | |||||||||||||||||||||
| Net change in unrealized appreciation (depreciation) of swap contracts | 817 | — | (636 | ) | — | — | — | 181 | ||||||||||||||||||||
| Net change in unrealized appreciation of foreign currency contracts | — | 415 | — | — | — | — | 415 | |||||||||||||||||||||
| Total | $ | 1,897 | $ | 357 | $ | (635 | ) | $ | — | $ | — | $ | — | $ | 1,619 | |||||||||||||
Balance Sheet Offsetting Information - The following discloses both gross information and net information about instruments and transactions eligible for offset in the financial statements, and instruments and transactions that are subject to a master netting arrangement, as well as amounts related to margin, reflected as financial collateral (including cash collateral), held at clearing brokers, counterparties and the Fund’s custodian. The master netting arrangements allow the clearing brokers to net any collateral held in or on behalf of the Fund, or liabilities or payment obligations of the clearing brokers to the Fund, against any liabilities or payment obligations of the Fund to the clearing brokers. The Fund is required to deposit financial collateral (including cash collateral) at the FCM's custodian on behalf of clearing brokers and counterparties to continually meet the original and maintenance requirements established by the clearing brokers and counterparties. Such requirements are specific to the respective clearing broker or counterparty. Certain master netting arrangements may not be enforceable in the bankruptcy proceedings of a counterparty.
Offsetting of Financial Assets and Derivative Assets as of October 31, 2014:
| Gross Amounts* of Assets Presented in Statement of Assets and Liabilities | Financial Instruments with Allowable Netting | Non-cash Collateral Received | Cash Collateral Received | Net Amount (not less than $0) | ||||||||||||||||
| Description | ||||||||||||||||||||
| OTC purchased option and OTC swap contracts at market value | $ | 10,345 | $ | (2,169 | ) | $ | (3,807 | )† | $ | (3,888 | )† | $ | 481 | |||||||
| Futures contracts - variation margin receivable | 365 | (365 | ) | — | — | — | ||||||||||||||
| Swap contracts - variation margin receivable | 12 | (12 | ) | — | — | — | ||||||||||||||
| Unrealized appreciation on foreign currency contracts | 720 | (122 | ) | — | — | 598 | ||||||||||||||
| Total subject to a master netting or similar arrangement | $ | 11,442 | $ | (2,668 | ) | $ | (3,807 | ) | $ | (3,888 | ) | $ | 1,079 | |||||||
* Gross amounts are presented here as there are no amounts that are netted within the Statement of Assets and Liabilities.
† An additional $427 of non-cash collateral and $51 of cash collateral was received by the Fund related to dervative assets.
| 43 |
| The Hartford Total Return Bond Fund |
| Notes to Financial Statements – (continued) |
| October 31, 2014 |
| (000’s Omitted) |
Offsetting of Financial Liabilities and Derivative Liabilities as of October 31, 2014:
| Gross Amounts* of Liabilities Presented in Statement of Assets and Liabilities | Financial Instruments with Allowable Netting | Non-cash Collateral Pledged | Cash Collateral Pledged | Net Amount (not less than $0) | ||||||||||||||||
| Description | ||||||||||||||||||||
| OTC written option and OTC swap contracts at market value | $ | 3,520 | $ | (2,169 | ) | $ | — | $ | — | $ | 1,351 | |||||||||
| Futures contracts - variation margin payable | 854 | (365 | ) | (4,627 | ) | — | — | |||||||||||||
| Swaps contracts - variation margin payable | 443 | (12 | ) | (4,992 | ) | — | — | |||||||||||||
| Unrealized depreciation on foreign currency contracts | 272 | (122 | ) | — | — | 150 | ||||||||||||||
| Total subject to a master netting or similar arrangement | $ | 5,089 | $ | (2,668 | ) | $ | (9,619 | ) | $ | — | $ | 1,501 | ||||||||
* Gross amounts are presented here as there are no amounts that are netted within the Statement of Assets and Liabilities.
Certain derivatives held by the Fund, as of October 31, 2014, are not subject to a master netting arrangement and are excluded from the table above.
Principal Risks:
Credit risk depends largely on the perceived financial health of bond issuers. In general, the credit rating is inversely related to the credit risk of the issuer. Higher rated bonds generally are deemed to have less credit risk, while lower or unrated bonds are deemed to have higher risk of default. The share price, yield and total return of a fund that holds securities with higher credit risk may be more volatile than those of a fund that holds bonds with lower credit risk. Similar to credit risk, the Fund may be exposed to counterparty risk, or the risk that an institution or other entity with which the Fund has unsettled or open transactions will default.
The Fund’s investments expose the Fund to various risks including, but not limited to, interest rate, prepayment, extension, foreign currency and equity risks. Interest rate risk is the risk that fixed income securities will decline in value because of changes in interest rates. As nominal interest rates rise, the values of certain fixed income securities held by the Fund are likely to decrease. A nominal interest rate can be described as the sum of a real interest rate and an expected inflation rate. Fixed income securities with longer durations tend to be more sensitive to changes in interest rates, usually making them more volatile than securities with shorter durations. Duration is useful primarily as a measure of the sensitivity of a fixed income security’s market price to interest rate (i.e., yield) movements. Senior floating rate interests and securities subject to prepayment and extension risk generally offer less potential for gains when interest rates decline. Rising interest rates may cause prepayments to occur at a slower than expected rate, thereby effectively lengthening the maturity of the security and making the security more sensitive to interest rate changes. Prepayment and extension risk are major risks of mortgage backed securities, senior floating rate interests and certain asset backed securities. For certain asset backed securities, the actual maturity may be less than the stated maturity shown in the Schedule of Investments, if applicable. As a result, the timing of income recognition relating to these securities may vary based upon the actual maturity.
If the Fund invests directly in foreign currencies or in securities that trade in, and receive revenues in, foreign currencies, or in derivatives that provide exposure to foreign currencies, it will be subject to the risk that those currencies will decline in value relative to the base currency (U.S. dollars) of the Fund, or, in the case of hedging positions, that the Fund’s base currency will decline in value relative to the currency being hedged. Currency rates in foreign countries may fluctuate significantly over short periods of time for a number of reasons, including changes in interest rates, intervention (or the failure to intervene) by U.S. or foreign governments, central banks or supranational entities, such as the International Monetary Fund, or by the imposition of currency controls or other political developments in the United States or abroad. As a result, the Fund’s investments in foreign currency denominated securities may reduce the returns of the Fund. The market values of equity securities, such as common stocks and preferred stocks, or equity related investments, such as futures and options, may decline due to general market conditions which are not specifically related to a particular company, such as real or perceived adverse economic conditions, changes in the general outlook for corporate earnings, changes in interest or currency rates or adverse investor sentiment generally. The market value of equity securities may also decline due to factors which affect a particular industry or industries, such as labor shortages or increased production costs and competitive conditions within an industry. Equity securities and equity related investments generally have greater market price volatility than fixed income securities.
| 44 |
| The Hartford Total Return Bond Fund |
| Notes to Financial Statements – (continued) |
| October 31, 2014 |
| (000’s Omitted) |
Federal Income Taxes:
Federal Income Taxes – For federal income tax purposes, the Fund intends to continue to qualify as a Regulated Investment Company ("RIC") under Subchapter M of the Internal Revenue Code (“IRC”) by distributing substantially all of its taxable net investment income and net realized capital gains to its shareholders and otherwise complying with the requirements of the IRC. The Fund has distributed substantially all of its income and capital gains in prior years, if applicable, and intends to distribute substantially all of its income and capital gains during the calendar year ending December 31, 2014. Accordingly, no provision for federal income or excise taxes has been made in the accompanying financial statements. Distributions from short-term capital gains are treated as ordinary income distributions for federal income tax purposes.
Net Investment Income (Loss), Net Realized Gains (Losses) and Distributions – Net investment income (loss) and net realized gains (losses) may differ for financial statement and tax purposes primarily because of losses deferred due to wash sale adjustments, foreign currency gains and losses, adjustments related to Passive Foreign Investment Companies ("PFICs"), Real Estate Investment Trusts ("REITs"), RICs, certain derivatives and partnerships. The character of distributions made during the year from net investment income or net realized gains may differ from their ultimate characterization for federal income tax purposes. Also, due to the timing of dividend distributions, the fiscal year in which amounts are distributed may differ from the year that the income or realized gains (losses) were recorded by the Fund.
Distributions and Components of Distributable Earnings – The tax character of distributions paid by the Fund for the periods indicated is as follows (as adjusted for dividends payable, if applicable):
| For the Year Ended October 31, 2014 | For the Year Ended October 31, 2013 | |||||||
| Ordinary Income | $ | 38,832 | $ | 75,709 | ||||
| Long-Term Capital Gains ‡ | — | 23,171 | ||||||
| ‡ | The Fund designates these distributions as long-term capital gain dividends pursuant to IRC Sec. 852(b)(3)(C). |
As of October 31, 2014, the Fund’s components of distributable earnings (deficit) on a tax basis are as follows:
| Amount | ||||
| Undistributed Ordinary Income | $ | 25,981 | ||
| Undistributed Long-Term Capital Gain | 11,948 | |||
| Unrealized Appreciation* | 18,111 | |||
| Total Accumulated Earnings | $ | 56,040 | ||
| * | Differences between book-basis and tax-basis unrealized appreciation (depreciation) may be attributable to the losses deferred due to wash sale adjustments, foreign currency gains and losses, adjustments related to PFICs, REITs, RICs, certain derivatives and partnerships. |
Reclassification of Capital Accounts – The Fund may record reclassifications in its capital accounts. These reclassifications have no impact on the total net assets of the Fund. The reclassifications are a result of permanent differences between U.S. GAAP and tax accounting for such items as foreign currency, PFICs, expiration or utilization of capital loss carryforwards or net operating losses. Adjustments are made to reflect the impact these items have on current and future distributions to shareholders. Therefore, the source of the Fund’s distributions may be shown in the accompanying Statement of Changes in Net Assets as from undistributed net investment income, from accumulated net realized gains on investments or from capital depending on the type of book and tax differences that exist. For the year ended October 31, 2014, the Fund recorded reclassifications to increase (decrease) the accounts listed below:
| Amount | ||||
| Undistributed Net Investment Income (Loss) | $ | (1,167 | ) | |
| Accumulated Net Realized Gain (Loss) | 1,167 | |||
| 45 |
| The Hartford Total Return Bond Fund |
| Notes to Financial Statements – (continued) |
| October 31, 2014 |
| (000’s Omitted) |
Capital Loss Carryforward – On December 22, 2010, the Regulated Investment Company Modernization Act of 2010 (the “Act”) was enacted, which made changes to the capital loss carryforward rules. The changes are effective for taxable years beginning after the date of enactment. Under the Act, funds are permitted to carry forward capital losses for an unlimited period. Additionally, capital loss carryforwards retain their character as either short-term or long-term capital losses rather than being considered all short-term as permitted under prior regulation.
The Fund had no capital loss carryforward for U.S. federal income tax purposes as of October 31, 2014.
During the year ended October 31, 2014, the Fund utilized $1,613 of prior year short term capital loss carryforwards.
Accounting for Uncertainty in Income Taxes – The Fund has adopted financial reporting rules that require the Fund to analyze all open tax years, as defined by the statute of limitations, for all major jurisdictions. Generally, tax authorities can examine all tax returns filed for the last three years. The Fund does not have an examination in progress.
The Fund has reviewed all open tax years and major jurisdictions and concluded that these financial reporting rules had no effect on the Fund’s financial position or results of operations. There is no tax liability resulting from unrecognized tax benefits relating to uncertain income tax positions taken or expected to be taken on the tax return for the fiscal year ended October 31, 2014. The Fund is also not aware of any tax positions for which it is reasonably possible that the total amounts of unrecognized tax benefits will significantly change in the next twelve months.
Expenses:
Investment Management Agreement – Hartford Funds Management Company, LLC ("HFMC") serves as the Fund’s investment manager pursuant to an Investment Management Agreement with the Company. HFMC is an indirect wholly owned subsidiary of The Hartford Financial Services Group, Inc. ("The Hartford"). The investment manager has overall investment supervisory responsibility for the Fund. In addition, the investment manager provides administrative personnel, services, equipment, facilities and office space for proper operation of the Fund. HFMC has contracted with Wellington Management Company, LLP ("Wellington Management") under a sub-advisory agreement for the provision of day-to-day investment management services to the Fund in accordance with the Fund’s investment objective and policies. The Fund pays a fee to the investment manager, a portion of which may be used to compensate Wellington Management.
The schedule below reflects the rates of compensation paid to the investment manager for investment management services rendered as of October 31, 2014; the rates are accrued daily and paid monthly:
| Average Daily Net Assets | Annual Fee |
| On first $500 million | 0.550% |
| On next $500 million | 0.500% |
| On next $1.5 billion | 0.475% |
| On next $2.5 billion | 0.465% |
| On next $5 billion | 0.455% |
| Over $10 billion | 0.445% |
Effective November 1, 2013, HFMC voluntarily agreed to waive investment management fees of 0.04% of average daily net assets until September 30, 2014. Effective October 1, 2014, HFMC contractually agreed to waive investment management fees of 0.12% of average daily net assets through February 29, 2016. These amounts are deducted from expenses and are reported as expense waivers on the accompanying Statement of Operations, as applicable.
| 46 |
| The Hartford Total Return Bond Fund |
| Notes to Financial Statements – (continued) |
| October 31, 2014 |
| (000’s Omitted) |
Accounting Services Agreement – Pursuant to the Fund Accounting Agreement between HFMC and the Company, on behalf of the Fund, HFMC provides accounting services to the Fund and receives monthly compensation based on the Fund’s average daily net assets at the rates set forth below. The Fund’s accounting services fees are accrued daily and paid monthly.
| Average Daily Net Assets | Annual Fee |
| On first $5 billion | 0.020% |
| On next $5 billion | 0.015% |
| Over $10 billion | 0.010% |
Operating Expenses – Allocable expenses incurred by the Company are allocated to each Fund and allocated to classes within the Fund in proportion to the average daily net assets of the Fund and each class, except where allocation of certain expenses is more fairly made directly to the Fund or to specific classes within a Fund. For the period October 1, 2014 through October 31, 2014, HFMC contractually limited the total operating expenses of this Fund, exclusive of taxes, interest expense, brokerage commissions, acquired fund fees and expenses and extraordinary expenses as follows:
| Class A | Class B | Class C | Class I | Class R3 | Class R4 | Class R5 | Class Y |
| 0.87% | 1.62% | 1.62% | 0.62% | 1.17% | 0.87% | 0.57% | 0.52% |
Effective November 1, 2013 through September 30, 2014, the investment manager voluntarily agreed to limit the total operating expenses of the Fund, exclusive of taxes, interest expense, brokerage commissions, acquired fund fees and expenses and extraordinary expenses as follows:
| Class A | Class B | Class C | Class I | Class R3 | Class R4 | Class R5 | Class Y |
| 0.91% | 1.66% | 1.66% | 0.66% | 1.21% | 0.91% | 0.61% | 0.56% |
Fees Paid Indirectly – The Fund's custodian bank has agreed to reduce its fees when the Fund maintains cash on deposit in a non-interest-bearing custody account. For the year ended October 31, 2014, this amount, if any, is included in the Statement of Operations.
The ratio of expenses to average net assets in the accompanying financial highlights excludes the reduction in expenses related to fees paid indirectly. The annualized expense ratio after waivers for the period listed below reflecting the reduction for fees paid indirectly is as follows:
| Year Ended October 31, 2014 | ||||
| Class A | 0.91 | % | ||
| Class B | 1.65 | |||
| Class C | 1.65 | |||
| Class I | 0.62 | |||
| Class R3 | 1.21 | |||
| Class R4 | 0.90 | |||
| Class R5 | 0.60 | |||
| Class Y | 0.51 | |||
Distribution and Service Plan for Class A, B, C, R3 and R4 Shares – Hartford Funds Distributors, LLC ("HFD"), an indirect wholly owned subsidiary of The Hartford, is the principal underwriter and distributor of the Fund. HFD is engaged in distribution activities, which include marketing and distribution of shares through broker/dealers, financing distribution costs and maintaining financial books and records. For the year ended October 31, 2014, HFD received front-end load sales charges of $2,079 and contingent deferred sales charges of $28 from the Fund.
| 47 |
| The Hartford Total Return Bond Fund |
| Notes to Financial Statements – (continued) |
| October 31, 2014 |
| (000’s Omitted) |
The Fund has adopted a Distribution and Service Plan in accordance with Rule 12b-1 of the 1940 Act to compensate the distributor (HFD) for activities intended to result in the sale and distribution of Class A, B, C, R3 and R4 shares and for providing services for shareholders. The Rule 12b-1 plan applicable to Class A shares of the Fund provides for payment of a Rule 12b-1 fee of 0.25% of average daily net assets. Some or all of the fee may be used for shareholder servicing expenses with the remainder used for distribution expenses. Under the Class B Plan, the Fund pays the distributor 1.00% of the average daily net assets of Class B shares that are outstanding for 8 years or less, 0.25% of which is a fee for services provided to existing shareholders with the remainder used for distribution expenses. Some or the entire Rule 12b-1 fee for Class B shares may be remitted to broker/dealers for distribution and/or shareholder account services. After eight years, Class B shares convert to Class A shares. Upon conversion to Class A shares, the Class A plan described above will apply to those shares. Under the Class C Plan, the Fund pays the distributor 1.00% of the average daily net assets of Class C shares outstanding, 0.25% of which is intended as a fee for services provided to existing shareholders with the remainder used for distribution expenses. For Class C shares, some or the entire fee may be remitted to broker/dealers for distribution and/or shareholder account services. Class R3 shares have a distribution fee of 0.50% of average daily net assets and Class R4 shares have a distribution fee of 0.25% of average daily net assets. For Class R3 and R4 shares, some or the entire fee may be remitted to broker/dealers for distribution and/or shareholder account services. The Fund’s 12b-1 fees are accrued daily and paid monthly or at such other intervals as the Board of Directors may determine.
Other Related Party Transactions – Certain officers of the Fund are directors and/or officers of HFMC and/or The Hartford or its subsidiaries. For the year ended October 31, 2014, a portion of the Fund’s Chief Compliance Officer’s compensation was paid by all of the investment companies in the Hartford fund complex. The portion allocated to the Fund, as represented in other expenses on the Statement of Operations, was in the amount of $3. Hartford Administrative Services Company (“HASCO”), an indirect wholly-owned subsidiary of The Hartford, provides transfer agent services to the Fund. HASCO has contractually agreed to reimburse any portion of the transfer agency fees over 0.30% of average daily net assets per fiscal year for each class. Any transfer agency fee reimbursement is determined before considering the contractual operating expense limitation. For providing such services, HASCO is compensated on a per account basis that varies by account type, except with respect to Class Y, for which it is compensated based on average daily net assets. The amount paid to HASCO and any related contractual reimbursement amounts, if applicable, can be found in the Statement of Operations. These fees are accrued daily and paid monthly.
Administrative services fees are paid to HASCO for third-party recordkeeping services that are payable as a percentage of net assets in the amount of up to 0.20%, 0.15% and 0.10% for Classes R3, R4 and R5 shares, respectively. The total administrative services fees are shown on the Statement of Operations. These fees are accrued daily and paid monthly.
Affiliate Holdings:
As of October 31, 2014, the Fund's shares were owned in aggregate by affiliated fund of funds. Therefore, the Fund may experience relatively large purchases or redemptions of its shares from these affiliated fund of funds. Affiliated fund of funds owned shares in the Fund as follows:
| Percentage of Fund | ||||
| Class Y | 41 | % | ||
Investment Transactions:
For the year ended October 31, 2014, the cost of purchases and proceeds from sales of investment securities (excluding short-term investments) were as follows:
| Excluding U.S. Government Obligations | U.S. Government Obligations | Total | ||||||||||
| Cost of Purchases | $ | 11,948,249 | $ | 587,516 | $ | 12,535,765 | ||||||
| Sales Proceeds | 11,989,934 | 800,206 | 12,790,140 | |||||||||
| 48 |
| The Hartford Total Return Bond Fund |
| Notes to Financial Statements – (continued) |
| October 31, 2014 |
| (000’s Omitted) |
Capital Share Transactions:
The following information is for the year ended October 31, 2014, and the year ended October 31, 2013:
| For the Year Ended October 31, 2014 | For the Year Ended October 31, 2013 | |||||||||||||||||||||||||||||||
| Shares Sold | Shares Issued for Reinvested Dividends | Shares Redeemed | Net Increase (Decrease) of Shares | Shares Sold | Shares Issued for Reinvested Dividends | Shares Redeemed | Net Increase (Decrease) of Shares | |||||||||||||||||||||||||
| Class A | ||||||||||||||||||||||||||||||||
| Shares | 10,782 | 1,188 | (11,729 | ) | 241 | 10,834 | 3,384 | (20,586 | ) | (6,368 | ) | |||||||||||||||||||||
| Amount | $ | 114,511 | $ | 12,625 | $ | (124,055 | ) | $ | 3,081 | $ | 116,655 | $ | 36,313 | $ | (218,307 | ) | $ | (65,339 | ) | |||||||||||||
| Class B | ||||||||||||||||||||||||||||||||
| Shares | 70 | 34 | (1,292 | ) | (1,188 | ) | 154 | 183 | (1,573 | ) | (1,236 | ) | ||||||||||||||||||||
| Amount | $ | 742 | $ | 360 | $ | (13,596 | ) | $ | (12,494 | ) | $ | 1,650 | $ | 1,955 | $ | (16,599 | ) | $ | (12,994 | ) | ||||||||||||
| Class C | ||||||||||||||||||||||||||||||||
| Shares | 902 | 92 | (1,854 | ) | (860 | ) | 1,231 | 404 | (3,618 | ) | (1,983 | ) | ||||||||||||||||||||
| Amount | $ | 9,618 | $ | 981 | $ | (19,634 | ) | $ | (9,035 | ) | $ | 13,305 | $ | 4,343 | $ | (38,444 | ) | $ | (20,796 | ) | ||||||||||||
| Class I | ||||||||||||||||||||||||||||||||
| Shares | 802 | 14 | (367 | ) | 449 | 739 | 63 | (1,156 | ) | (354 | ) | |||||||||||||||||||||
| Amount | $ | 8,577 | $ | 152 | $ | (3,887 | ) | $ | 4,842 | $ | 8,114 | $ | 673 | $ | (12,352 | ) | $ | (3,565 | ) | |||||||||||||
| Class R3 | ||||||||||||||||||||||||||||||||
| Shares | 145 | 12 | (245 | ) | (88 | ) | 152 | 44 | (354 | ) | (158 | ) | ||||||||||||||||||||
| Amount | $ | 1,561 | $ | 129 | $ | (2,635 | ) | $ | (945 | ) | $ | 1,648 | $ | 475 | $ | (3,826 | ) | $ | (1,703 | ) | ||||||||||||
| Class R4 | ||||||||||||||||||||||||||||||||
| Shares | 374 | 31 | (381 | ) | 24 | 199 | 98 | (756 | ) | (459 | ) | |||||||||||||||||||||
| Amount | $ | 4,053 | $ | 334 | $ | (4,117 | ) | $ | 270 | $ | 2,168 | $ | 1,067 | $ | (8,193 | ) | $ | (4,958 | ) | |||||||||||||
| Class R5 | ||||||||||||||||||||||||||||||||
| Shares | 47 | 2 | (21 | ) | 28 | 24 | 5 | (57 | ) | (28 | ) | |||||||||||||||||||||
| Amount | $ | 504 | $ | 18 | $ | (223 | ) | $ | 299 | $ | 274 | $ | 51 | $ | (625 | ) | $ | (300 | ) | |||||||||||||
| Class Y | ||||||||||||||||||||||||||||||||
| Shares | 27,295 | 2,213 | (20,357 | ) | 9,151 | 17,825 | 4,832 | (23,686 | ) | (1,029 | ) | |||||||||||||||||||||
| Amount | $ | 294,471 | $ | 23,873 | $ | (219,785 | ) | $ | 98,559 | $ | 193,493 | $ | 52,568 | $ | (257,612 | ) | $ | (11,551 | ) | |||||||||||||
| Total | ||||||||||||||||||||||||||||||||
| Shares | 40,417 | 3,586 | (36,246 | ) | 7,757 | 31,158 | 9,013 | (51,786 | ) | (11,615 | ) | |||||||||||||||||||||
| Amount | $ | 434,037 | $ | 38,472 | $ | (387,932 | ) | $ | 84,577 | $ | 337,307 | $ | 97,445 | $ | (555,958 | ) | $ | (121,206 | ) | |||||||||||||
The following reflects the conversion of Class B shares into Class A shares (reflected as Class A shares sold) for the year ended October 31, 2014, and the year ended October 31, 2013:
| Shares | Dollars | |||||||
| For the Year Ended October 31, 2014 | 194 | $ | 2,060 | |||||
| For the Year Ended October 31, 2013 | 147 | $ | 1,574 | |||||
Line of Credit:
The Fund is one of several Hartford Funds that participate in a $500 million committed revolving line of credit facility. The facility is to be used for temporary or emergency purposes. Under the arrangement, the funds are required to own securities having a market value in excess of 300% of the total bank borrowings. The interest rate on borrowings varies depending on the nature of the loan. The facility also requires a fee to be paid based on the amount of the commitment. This commitment fee is allocated to all the funds participating in the line of credit based on the average net assets of the funds. During the year ended October 31, 2014, the Fund did not have any borrowings under this facility.
Pending Legal Proceedings:
On February 25, 2011, Jennifer L. Kasilag, Louis Mellinger, Judith M. Menendez, Jacqueline M. Robinson, and Linda A. Russell filed a derivative lawsuit against Hartford Investment Financial Services, LLC (“HIFSCO”) (now known as HFD) on behalf of six Hartford retail mutual funds in the United States District Court for the District of New Jersey, alleging that HIFSCO received excessive advisory and distribution fees in violation of its statutory fiduciary duty under Section 36(b) of the 1940 Act when serving as investment manager and principal underwriter, respectively, to the Hartford retail mutual funds. Although this action was purportedly filed on behalf of certain of the
| 49 |
| The Hartford Total Return Bond Fund |
| Notes to Financial Statements – (continued) |
| October 31, 2014 |
| (000’s Omitted) |
Hartford Funds, none of the Hartford Funds is itself a defendant to the suit. HIFSCO moved to dismiss and, in September 2011, the motion was granted in part and denied in part, with leave to amend the complaint. In November 2011, plaintiffs filed an amended complaint on behalf of certain Hartford retail mutual funds, The Hartford Global Health Fund (now known as The Hartford Healthcare Fund), The Hartford Conservative Allocation Fund, The Hartford Growth Opportunities Fund, The Hartford Inflation Plus Fund, The Hartford Advisers Fund (now known as The Hartford Balanced Fund), and The Hartford Capital Appreciation Fund. Plaintiffs seek to rescind the investment management agreements and distribution plans between HIFSCO and these funds and to recover the total fees charged thereunder or, in the alternative, to recover any improper compensation HIFSCO received, in addition to lost earnings. HIFSCO filed a partial motion to dismiss the amended complaint and, in December 2012, the court dismissed without prejudice the claims regarding distribution fees and denied the motion with respect to the advisory fees claims. HIFSCO disputes the allegations and intends to defend vigorously.
In March 2014, the plaintiffs filed a new complaint that added as new plaintiffs The Hartford Floating Rate Fund and The Hartford Small Company Fund and named as a defendant HFMC, which assumed the role as investment manager to the funds as of January 2013. HFMC and HIFSCO dispute the allegations and intend to defend vigorously.
No accrual for litigation relating to this matter has been recorded in the financial statements of the Fund because the Fund is not party to the suit.
Indemnifications:
Under the Company's organizational documents, the Company shall indemnify its officers and directors to the full extent required or permitted under Maryland General Corporation Law and the federal securities laws. In addition, the Company, on behalf of the Fund, may enter into contracts that contain a variety of indemnifications. The Company's maximum exposure under these arrangements is unknown. However, as of the date of these financial statements, the Company has not had prior claims or losses pursuant to these contracts and expects the risk of loss to be remote.
Subsequent Events:
At the August 5-6, 2014 meeting, the Board of Directors approved the creation of Class R6 shares for the Fund. Class R6 shares launched on November 7, 2014. In connection with the launch of the Class R6 shares, an updated prospectus, dated November 7, 2014, and Statement of Additional Information, dated March 1, 2014, as amended November 7, 2014, for the Fund were filed with the U.S. Securities and Exchange Commission.
The Board of Directors at their November 5-6, 2014 meeting approved a new advisory fee schedule for the Fund. Effective November 7, 2014, the schedule below reflects the rates of compensation for investment management services rendered; the rates are accrued daily and paid monthly:
| Average Daily Net Assets | Annual Fee |
| On first $500 million | 0.430% |
| On next $500 million | 0.380% |
| On next $4 billion | 0.370% |
| On next $5 billion | 0.360% |
| Over $10 billion | 0.350% |
At the November 5-6, 2014 meeting, the Board of Directors also approved the termination of the 0.12% contractual management fee waiver that took effect on October 1, 2014.
Effective December 1, 2014, pursuant to a sub-transfer agency agreement between HASCO and Boston Financial Data Services, Inc. (“BFDS”), HASCO has delegated certain transfer agent, dividend disbursing agent and shareholder servicing agent functions to BFDS. The costs and expenses of such delegation are borne by HASCO, not by the Fund.
| 50 |
| The Hartford Total Return Bond Fund |
| Financial Highlights |
| - Selected Per-Share Data - (A) | - Ratios and Supplemental Data - | |||||||||||||||||||||||||||||||||||||||||||||||||||
| Class | Net
Asset Value at Beginning of Period | Net Investment Income (Loss) | Net Realized and Unrealized Gain (Loss) on Invest- ments | Total
from Investment Operations | Dividends from Net Investment Income | Distribu- tions from Realized Capital Gains | Total Dividends and Distributions | Net Asset Value at End of Period | Total Return(B) | Net Assets at End of Period (000's) | Ratio
of Expenses to Average Net Assets Before Adjust- ments(C) | Ratio
of Expenses to Average Net Assets After Adjust- ments(C) | Ratio
of Net Investment Income (Loss) to Average Net Assets | |||||||||||||||||||||||||||||||||||||||
| For the Year Ended October 31, 2014 | ||||||||||||||||||||||||||||||||||||||||||||||||||||
| A | $ | 10.48 | $ | 0.24 | $ | 0.22 | $ | 0.46 | $ | (0.23 | ) | $ | – | $ | (0.23 | ) | $ | 10.71 | 4.46 | % | $ | 602,306 | 1.00 | % | 0.91 | % | 2.26 | % | ||||||||||||||||||||||||
| B | 10.40 | 0.16 | 0.22 | 0.38 | (0.15 | ) | – | (0.15 | ) | 10.63 | 3.72 | 19,329 | 1.93 | 1.65 | 1.52 | |||||||||||||||||||||||||||||||||||||
| C | 10.49 | 0.16 | 0.22 | 0.38 | (0.15 | ) | – | (0.15 | ) | 10.72 | 3.68 | 70,539 | 1.72 | 1.65 | 1.51 | |||||||||||||||||||||||||||||||||||||
| I | 10.49 | 0.27 | 0.22 | 0.49 | (0.26 | ) | – | (0.26 | ) | 10.72 | 4.75 | 11,737 | 0.67 | 0.62 | 2.51 | |||||||||||||||||||||||||||||||||||||
| R3 | 10.66 | 0.21 | 0.23 | 0.44 | (0.20 | ) | – | (0.20 | ) | 10.90 | 4.16 | 6,868 | 1.28 | 1.21 | 1.96 | |||||||||||||||||||||||||||||||||||||
| R4 | 10.64 | 0.24 | 0.23 | 0.47 | (0.23 | ) | – | (0.23 | ) | 10.88 | 4.48 | 16,342 | 0.96 | 0.90 | 2.26 | |||||||||||||||||||||||||||||||||||||
| R5 | 10.64 | 0.27 | 0.24 | 0.51 | (0.27 | ) | – | (0.27 | ) | 10.88 | 4.79 | 978 | 0.67 | 0.60 | 2.55 | |||||||||||||||||||||||||||||||||||||
| Y | 10.63 | 0.29 | 0.22 | 0.51 | (0.27 | ) | – | (0.27 | ) | 10.87 | 4.89 | 1,003,275 | 0.56 | 0.51 | 2.66 | |||||||||||||||||||||||||||||||||||||
| For the Year Ended October 31, 2013 | ||||||||||||||||||||||||||||||||||||||||||||||||||||
| A | $ | 11.16 | $ | 0.23 | $ | (0.32 | ) | $ | (0.09 | ) | $ | (0.26 | ) | $ | (0.33 | ) | $ | (0.59 | ) | $ | 10.48 | (0.83 | )% | $ | 586,762 | 0.99 | % | 0.95 | % | 2.15 | % | |||||||||||||||||||||
| B | 11.08 | 0.15 | (0.32 | ) | (0.17 | ) | (0.18 | ) | (0.33 | ) | (0.51 | ) | 10.40 | (1.58 | ) | 31,258 | 1.88 | 1.70 | 1.39 | |||||||||||||||||||||||||||||||||
| C | 11.18 | 0.15 | (0.33 | ) | (0.18 | ) | (0.18 | ) | (0.33 | ) | (0.51 | ) | 10.49 | (1.66 | ) | 78,034 | 1.70 | 1.70 | 1.40 | |||||||||||||||||||||||||||||||||
| I | 11.17 | 0.26 | (0.32 | ) | (0.06 | ) | (0.29 | ) | (0.33 | ) | (0.62 | ) | 10.49 | (0.55 | ) | 6,771 | 0.68 | 0.68 | 2.42 | |||||||||||||||||||||||||||||||||
| R3 | 11.35 | 0.20 | (0.33 | ) | (0.13 | ) | (0.23 | ) | (0.33 | ) | (0.56 | ) | 10.66 | (1.21 | ) | 7,655 | 1.28 | 1.25 | 1.85 | |||||||||||||||||||||||||||||||||
| R4 | 11.33 | 0.23 | (0.33 | ) | (0.10 | ) | (0.26 | ) | (0.33 | ) | (0.59 | ) | 10.64 | (0.92 | ) | 15,725 | 0.96 | 0.95 | 2.15 | |||||||||||||||||||||||||||||||||
| R5 | 11.33 | 0.26 | (0.33 | ) | (0.07 | ) | (0.29 | ) | (0.33 | ) | (0.62 | ) | 10.64 | (0.61 | ) | 664 | 0.67 | 0.65 | 2.44 | |||||||||||||||||||||||||||||||||
| Y | 11.32 | 0.28 | (0.34 | ) | (0.06 | ) | (0.30 | ) | (0.33 | ) | (0.63 | ) | 10.63 | (0.52 | ) | 883,706 | 0.55 | 0.55 | 2.55 | |||||||||||||||||||||||||||||||||
| For the Year Ended October 31, 2012 (D) | ||||||||||||||||||||||||||||||||||||||||||||||||||||
| A | $ | 10.76 | $ | 0.29 | $ | 0.50 | $ | 0.79 | $ | (0.34 | ) | $ | (0.05 | ) | $ | (0.39 | ) | $ | 11.16 | 7.50 | % | $ | 696,383 | 0.98 | % | 0.89 | % | 2.64 | % | |||||||||||||||||||||||
| B | 10.69 | 0.20 | 0.50 | 0.70 | (0.26 | ) | (0.05 | ) | (0.31 | ) | 11.08 | 6.66 | 47,026 | 1.85 | 1.64 | 1.90 | ||||||||||||||||||||||||||||||||||||
| C | 10.78 | 0.21 | 0.50 | 0.71 | (0.26 | ) | (0.05 | ) | (0.31 | ) | 11.18 | 6.70 | 105,330 | 1.69 | 1.63 | 1.90 | ||||||||||||||||||||||||||||||||||||
| I | 10.77 | 0.31 | 0.51 | 0.82 | (0.37 | ) | (0.05 | ) | (0.42 | ) | 11.17 | 7.78 | 11,177 | 0.68 | 0.62 | 2.92 | ||||||||||||||||||||||||||||||||||||
| R3 | 10.94 | 0.26 | 0.51 | 0.77 | (0.31 | ) | (0.05 | ) | (0.36 | ) | 11.35 | 7.14 | 9,944 | 1.27 | 1.19 | 2.35 | ||||||||||||||||||||||||||||||||||||
| R4 | 10.92 | 0.29 | 0.51 | 0.80 | (0.34 | ) | (0.05 | ) | (0.39 | ) | 11.33 | 7.47 | 21,940 | 0.95 | 0.89 | 2.65 | ||||||||||||||||||||||||||||||||||||
| R5 | 10.92 | 0.32 | 0.51 | 0.83 | (0.37 | ) | (0.05 | ) | (0.42 | ) | 11.33 | 7.79 | 1,018 | 0.66 | 0.59 | 2.94 | ||||||||||||||||||||||||||||||||||||
| Y | 10.91 | 0.33 | 0.51 | 0.84 | (0.38 | ) | (0.05 | ) | (0.43 | ) | 11.32 | 7.91 | 952,621 | 0.55 | 0.49 | 3.04 | ||||||||||||||||||||||||||||||||||||
| For the Year Ended October 31, 2011 (D) | ||||||||||||||||||||||||||||||||||||||||||||||||||||
| A | $ | 10.70 | $ | 0.33 | $ | 0.06 | $ | 0.39 | $ | (0.33 | ) | $ | – | $ | (0.33 | ) | $ | 10.76 | 3.78 | % | $ | 673,310 | 0.98 | % | 0.95 | % | 3.16 | % | ||||||||||||||||||||||||
| B | 10.63 | 0.25 | 0.07 | 0.32 | (0.26 | ) | – | (0.26 | ) | 10.69 | 3.03 | 54,934 | 1.85 | 1.70 | 2.41 | |||||||||||||||||||||||||||||||||||||
| C | 10.71 | 0.26 | 0.07 | 0.33 | (0.26 | ) | – | (0.26 | ) | 10.78 | 3.10 | 104,382 | 1.69 | 1.69 | 2.42 | |||||||||||||||||||||||||||||||||||||
| I | 10.70 | 0.37 | 0.06 | 0.43 | (0.36 | ) | – | (0.36 | ) | 10.77 | 4.15 | 11,973 | 0.68 | 0.68 | 3.45 | |||||||||||||||||||||||||||||||||||||
| R3 | 10.87 | 0.31 | 0.06 | 0.37 | (0.30 | ) | – | (0.30 | ) | 10.94 | 3.49 | 11,922 | 1.26 | 1.25 | 2.85 | |||||||||||||||||||||||||||||||||||||
| R4 | 10.85 | 0.34 | 0.06 | 0.40 | (0.33 | ) | – | (0.33 | ) | 10.92 | 3.81 | 25,330 | 0.95 | 0.95 | 3.16 | |||||||||||||||||||||||||||||||||||||
| R5 | 10.85 | 0.37 | 0.07 | 0.44 | (0.37 | ) | – | (0.37 | ) | 10.92 | 4.12 | 990 | 0.66 | 0.65 | 3.46 | |||||||||||||||||||||||||||||||||||||
| Y | 10.84 | 0.38 | 0.07 | 0.45 | (0.38 | ) | – | (0.38 | ) | 10.91 | 4.23 | 952,265 | 0.54 | 0.54 | 3.56 | |||||||||||||||||||||||||||||||||||||
See Portfolio Turnover information on the next page.
| 51 |
| The Hartford Total Return Bond Fund |
| Financial Highlights – (continued) |
| - Selected Per-Share Data - (A) | - Ratios and Supplemental Data - | |||||||||||||||||||||||||||||||||||||||||||||||||||
| Class | Net
Asset Value at Beginning of Period | Net Investment Income (Loss) | Net Realized and Unrealized Gain (Loss) on Invest- ments | Total
from Investment Operations | Dividends from Net Investment Income | Distribu- tions from Realized Capital Gains | Total Dividends and Distributions | Net Asset Value at End of Period | Total Return(B) | Net Assets at End of Period (000's) | Ratio
of Expenses to Average Net Assets Before Adjust- ments(C) | Ratio
of Expenses to Average Net Assets After Adjust- ments(C) | Ratio
of Net Investment Income (Loss) to Average Net Assets | |||||||||||||||||||||||||||||||||||||||
| For the Year Ended October 31, 2010 (D) | ||||||||||||||||||||||||||||||||||||||||||||||||||||
| A | $ | 10.21 | $ | 0.35 | $ | 0.51 | $ | 0.86 | $ | (0.37 | ) | $ | – | $ | (0.37 | ) | $ | 10.70 | 8.57 | % | $ | 835,450 | 0.99 | %(E) | 0.98 | %(E) | 3.38 | %(E) | ||||||||||||||||||||||||
| B | 10.15 | 0.27 | 0.50 | 0.77 | (0.29 | ) | – | (0.29 | ) | 10.63 | 7.72 | 70,845 | 1.87 | (E) | 1.74 | (E) | 2.62 | (E) | ||||||||||||||||||||||||||||||||||
| C | 10.23 | 0.28 | 0.49 | 0.77 | (0.29 | ) | – | (0.29 | ) | 10.71 | 7.68 | 118,462 | 1.71 | (E) | 1.70 | (E) | 2.66 | (E) | ||||||||||||||||||||||||||||||||||
| I | 10.22 | 0.37 | 0.51 | 0.88 | (0.40 | ) | – | (0.40 | ) | 10.70 | 8.73 | 9,395 | 0.74 | (E) | 0.73 | (E) | 3.62 | (E) | ||||||||||||||||||||||||||||||||||
| R3 | 10.36 | 0.33 | 0.52 | 0.85 | (0.34 | ) | – | (0.34 | ) | 10.87 | 8.36 | 8,571 | 1.29 | (E) | 1.24 | (E) | 3.12 | (E) | ||||||||||||||||||||||||||||||||||
| R4 | 10.35 | 0.36 | 0.51 | 0.87 | (0.37 | ) | – | (0.37 | ) | 10.85 | 8.57 | 25,652 | 0.97 | (E) | 0.96 | (E) | 3.40 | (E) | ||||||||||||||||||||||||||||||||||
| R5 | 10.35 | 0.39 | 0.51 | 0.90 | (0.40 | ) | – | (0.40 | ) | 10.85 | 8.87 | 655 | 0.69 | (E) | 0.67 | (E) | 3.69 | (E) | ||||||||||||||||||||||||||||||||||
| Y | 10.34 | 0.40 | 0.51 | 0.91 | (0.41 | ) | – | (0.41 | ) | 10.84 | 9.00 | 994,424 | 0.57 | (E) | 0.56 | (E) | 3.80 | (E) | ||||||||||||||||||||||||||||||||||
| (A) | Information presented relates to a share outstanding throughout the indicated period. Net investment income (loss) per share amounts are calculated based on average shares outstanding unless otherwise noted. |
| (B) | Assumes initial investment at net asset value at the beginning of each period, reinvestment of all distributions, the complete redemption of the investment at net asset value at the end of each period and no sales charge. Total return would be reduced if sales charges were taken into account. |
| (C) | Adjustments include waivers and reimbursements, if applicable. Ratios do not include fees paid indirectly (see Expenses in the accompanying Notes to Financial Statements). |
| (D) | Net investment income (loss) per share amounts have been calculated using the SEC method. |
| (E) | Ratios do not include expenses of the Underlying Funds. |
| Portfolio Turnover Rate for All Share Classes | ||||
| For the Year Ended October 31, 2014 | 84 | % | ||
| For the Year Ended October 31, 2013 | 106 | |||
| For the Year Ended October 31, 2012 | 77 | |||
| For the Year Ended October 31, 2011 | 131 | |||
| For the Year Ended October 31, 2010 | 201 | |||
| 52 |
| Report of Independent Registered Public Accounting Firm |
|
The Board of Directors and Shareholders of The Hartford Mutual Funds, Inc. |
We have audited the accompanying statement of assets and liabilities, including the schedule of investments, of The Hartford Total Return Bond Fund (one of the portfolios constituting The Hartford Mutual Funds, Inc. (the Funds)) as of October 31, 2014, and the related statement of operations for the year then ended, the statements of changes in net assets for each of the two years in the period then ended, and the financial highlights for each of the five years in the period then ended. These financial statements and financial highlights are the responsibility of the Funds’ management. Our responsibility is to express an opinion on these financial statements and financial highlights based on our audits.
We conducted our audits in accordance with the standards of the Public Company Accounting Oversight Board (United States). Those standards require that we plan and perform the audit to obtain reasonable assurance about whether the financial statements and financial highlights are free of material misstatement. We were not engaged to perform an audit of the Funds’ internal control over financial reporting. Our audits included consideration of internal control over financial reporting as a basis for designing audit procedures that are appropriate in the circumstances, but not for the purpose of expressing an opinion on the effectiveness of the Funds’ internal control over financial reporting. Accordingly, we express no such opinion. An audit also includes examining, on a test basis, evidence supporting the amounts and disclosures in the financial statements and financial highlights, assessing the accounting principles used and significant estimates made by management, and evaluating the overall financial statement presentation. Our procedures included confirmation of securities owned as of October 31, 2014, by correspondence with the custodian, agent banks and brokers or by other appropriate auditing procedures where replies from agent banks and brokers were not received. We believe that our audits provide a reasonable basis for our opinion.
In our opinion, the financial statements and financial highlights referred to above present fairly, in all material respects, the financial position of The Hartford Total Return Bond Fund of The Hartford Mutual Funds, Inc. at October 31, 2014, the results of its operations for the year then ended, the changes in its net assets for each of the two years in the period then ended, and the financial highlights for each of the five years in the period then ended, in conformity with U.S. generally accepted accounting principles.
| |
Minneapolis, Minnesota
December 18, 2014
| 53 |
| The Hartford Total Return Bond Fund |
| Directors and Officers (Unaudited) |
The Board of Directors of the Company (the "Directors") appoints officers who are responsible for the day-to-day operations of the Fund and who execute policies formulated by the Directors. Each Director serves until his or her death, resignation, or retirement or until the next annual meeting of shareholders is held or until his or her successor is elected and qualifies.
Directors and officers who are employed by or who have a financial interest in The Hartford Financial Services Group, Inc. ("The Hartford") are considered “interested” persons of the Fund pursuant to the 1940 Act. Each officer and two of the Company's Directors, as noted in the chart below, are “interested” persons of the Fund. Each Director serves as a director for The Hartford Mutual Funds, Inc., The Hartford Mutual Funds II, Inc., Hartford Series Fund, Inc., and Hartford HLS Series Fund II, Inc., and as a trustee for The Hartford Alternative Strategies Fund, which, as of October 31, 2014, collectively consist of 66 funds. Correspondence may be sent to Directors and officers c/o Hartford Funds, 5 Radnor Corporate Center, Suite 300, 100 Matsonford Road, Radnor, Pennsylvania 19087, except that correspondence to Mr. Annoni, Mr. Dressen and Ms. Quade may be sent to 500 Bielenberg Drive, Suite 500, Woodbury, Minnesota 55125.
The table below sets forth, for each Director and officer, his or her name, year of birth, current position with the Company and date first elected or appointed to The Hartford Mutual Funds, Inc. ("MF") and The Hartford Mutual Funds II, Inc. ("MF2"), principal occupation, and, for Directors, other directorships held. The Fund’s Statement of Additional Information contains further information on the Directors and is available free of charge by calling 1-888-843-7824 or writing to: Hartford Funds, P.O. Box 55022, Boston, MA 02205-5022.
Information on the aggregate remuneration paid to the directors of the Company can be found in the Statement of Operations herein. The Fund pays to The Hartford a portion of the Chief Compliance Officer’s compensation, but does not pay salaries or compensation to any of its other officers or Directors who are employed by The Hartford.
Non-Interested Directors
Hilary E. Ackermann (1956) Director since September 23, 2014
Ms. Ackermann served as Chief Risk Officer at Goldman Sachs Bank USA from October 2008 to November 2011 and serves as a Director of Dynegy, Inc., an independent power company, from October 2012 to present.
Lynn S. Birdsong (1946) Director since 2003, Chairman of the Investment Committee since 2014
Mr. Birdsong is a private investor. Mr. Birdsong currently serves as a Director of the Sovereign High Yield Investment Company (April 2010 to current). Mr. Birdsong currently serves as an Independent Director of Nomura Partners Funds, Inc. (formerly, The Japan Fund) (April 2003 to current). From 2003 to March 2005, Mr. Birdsong was an Independent Director of the Atlantic Whitehall Funds. From 1979 to 2002, Mr. Birdsong was a Managing Director of Zurich Scudder Investments, an investment management firm. During his employment with Scudder, Mr. Birdsong was an Interested Director of The Japan Fund. From January 1981 through December 2013, Mr. Birdsong was a partner in Birdsong Company, an advertising specialty firm.
Robert M. Gavin, Jr. (1940) Director since 2002 (MF) and 1986 (MF2), Chairman of the Board for each since 2004
Dr. Gavin is an educational consultant. Prior to September 1, 2001, he was President of Cranbrook Education Community and prior to July 1996, he was President of Macalester College, St. Paul, Minnesota.
Duane E. Hill (1945) Director since 2001 (MF) and 2002 (MF2), Chairman of the Nominating Committee since 2003
Mr. Hill is a Partner of TSG Ventures L.P., a private equity investment company. Mr. Hill is a former partner of TSG Capital Group, a private equity investment firm that served as sponsor and lead investor in leveraged buyouts of middle market companies.
Sandra S. Jaffee (1941) Director since 2005
Ms. Jaffee is the founder and Chief Executive Officer of a private company, Homeworks Concierge, LLC, which provides residential property management services in Westchester County, New York (January 2012 to present). Ms. Jaffee served as Chairman (2008 to 2009) and Chief Executive Officer of Fortent (formerly Searchspace Group), a leading provider of compliance/regulatory technology to financial institutions from August 2005 to August 2009. From August 2004 to August 2005, Ms. Jaffee served as an Entrepreneur in Residence with Warburg Pincus, a private equity firm. Prior to joining Warburg Pincus, Ms. Jaffee served as Executive Vice President at Citigroup, from September 1995 to July 2004, where she was President and Chief Executive Officer of Citibank’s Global Securities Services (1995 to 2003). Ms. Jaffee currently serves as a member of the Board of Directors of Broadridge Financial Solutions as well as a Trustee of Muhlenberg College.
| 54 |
| The Hartford Total Return Bond Fund |
| Directors and Officers (Unaudited) – (continued) |
William P. Johnston (1944) Director since 2005, Chairman of the Compliance Committee since 2005
In June 2006, Mr. Johnston was appointed as Senior Advisor to The Carlyle Group, a global private equity and other alternative asset investment firm and currently serves as an Operating Executive. In July 2006, Mr. Johnston was elected to the Board of Directors of MultiPlan, Inc. and served as a Director (July 2006 to August 2010). In August 2007, Mr. Johnston was elected to the Board of Directors of LifeCare Holdings, Inc. and served as a Director (August 2007 to June 2013). In February 2008, Mr. Johnston was elected to the Board of Directors of HCR-ManorCare, Inc. In May 2006, Mr. Johnston was elected to the Supervisory Board of Fresenius Medical Care AG & Co. KGaA, after its acquisition of Renal Care Group, Inc. in March 2006. Mr. Johnston joined Renal Care Group in November 2002 as a member of the Board of Directors and served as Chairman of the Board from March 2003 through March 2006. From 2002 through 2013, Mr. Johnston served as a Board member of the Georgia O’Keefe Museum. From September 1987 to December 2002, Mr. Johnston was with Equitable Securities Corporation (and its successors, SunTrust Equitable Securities and SunTrust Robinson Humphrey) serving in various investment banking and managerial positions, including Managing Director and Head of Investment Banking, Chief Executive Officer and Vice Chairman.
Phillip O. Peterson (1944) Director since 2002 (MF) and 2000 (MF2), Chairman of the Audit Committee since 2002
Mr. Peterson is a mutual fund industry consultant. He was a partner of KPMG LLP (an accounting firm) until July 1999. Mr. Peterson joined William Blair Funds in February 2007 as a member of the Board of Trustees. From February 2012 to February 2014, Mr. Peterson served as a Trustee of Symetra Variable Mutual Funds. From January 2004 to April 2005, Mr. Peterson served as Independent President of the Strong Mutual Funds.
Lemma W. Senbet (1946) Director since 2005
Dr. Senbet is the William E. Mayer Chair Professor of Finance and Founding Director, Center for Financial Policy, at the University of Maryland, Robert H. Smith School of Business. He was chair of the Finance Department of the University of Maryland, Robert H. Smith School of Business from 1998 to 2006. Since June 2013, he has been on leave from the University to serve as Executive Director of African Economic Research Consortium which focuses on economic policy research and training. Previously, he was a chaired professor of finance at the University of Wisconsin-Madison. Also, he was a Director of the Fortis Funds from March 2000 to July 2002. Dr. Senbet served as Director of the American Finance Association and President of the Western Finance Association. In 2006, Dr. Senbet was inducted Fellow of Financial Management Association International for his career-long distinguished scholarship and professional service.
Interested Directors and Officers
James E. Davey (1964) Director since 2012, President and Chief Executive Officer since 2010
Mr. Davey serves as Executive Vice President of Hartford Life Insurance Company (“HLIC”) and The Hartford. Additionally, Mr. Davey serves as Chairman of the Board, Manager and Senior Managing Director of Hartford Funds Distributors, LLC (“HFD”). He also currently serves as Director, Chairman of the Board, President and Senior Managing Director of Hartford Administrative Services Company (“HASCO”). Mr. Davey also serves as Manager, Chairman of the Board and Senior Managing Director for Hartford Funds Management Company, LLC (“HFMC”) and Director, Chairman of the Board and Senior Managing Director for Hartford Funds Management Group, Inc. ("HFMG"). Mr. Davey has served in various positions within The Hartford and its subsidiaries in connection with the operation of the Hartford Funds. Mr. Davey joined The Hartford in 2002.
Lowndes A. Smith* (1939) Director since 1996 (MF) and 2002 (MF2)
Mr. Smith served as Vice Chairman of The Hartford from February 1997 to January 2002, as President and Chief Executive Officer of Hartford Life, Inc. from February 1997 to January 2002, and as President and Chief Operating Officer of The Hartford Life Insurance Companies from January 1989 to January 2002. Mr. Smith serves as a Director of White Mountains Insurance Group Ltd. (October 2003 to current); One Beacon Insurance (October 2006 to current); Symetra Financial (August 2007 to current) and is a Managing Director of Whittington Gray Associates (January 2007 to current).
* Mr. Smith resigned as a Director of MF, MF2, Hartford Series Fund, Inc. and Hartford HLS Series Fund II, Inc. and as a Trustee of The Hartford Alternative Strategies Fund effective September 17, 2014.
Other Officers
Mark A. Annoni (1964) Vice President, Controller and Treasurer since 2012
Mr. Annoni currently serves as the Assistant Vice President of HLIC (February 2004 to present) and Senior Vice President of HFMG (December 2013 to present). Mr. Annoni has served in various positions within The Hartford and its subsidiaries in connection with the operation of the Hartford Funds. Mr. Annoni joined The Hartford in 2001.
| 55 |
| The Hartford Total Return Bond Fund |
| Directors and Officers (Unaudited) – (continued) |
Michael R. Dressen (1963) AML Compliance Officer since 2011
Mr. Dressen currently serves as Assistant Vice President of HLIC. He also serves as Chief Compliance Officer and AML Compliance Officer of HASCO and as AML Officer of HFD. Mr. Dressen has served in various positions within The Hartford and its subsidiaries in connection with the operation of the Hartford Funds.
Edward P. Macdonald (1967) Vice President, Secretary and Chief Legal Officer since 2005
Mr. Macdonald currently serves as Assistant Secretary, Executive Vice President and Deputy General Counsel of HFD, HASCO, HFMC and HFMG. He also serves as Vice President of HLIC. Mr. Macdonald has served in various positions within The Hartford and its subsidiaries in connection with the operation of the Hartford Funds. Mr. Macdonald joined The Hartford in 2005.
Joseph G. Melcher (1973) Vice President and Chief Compliance Officer since 2013
Mr. Melcher currently serves as Executive Vice President of HFD, HFMG and HASCO. Mr. Melcher also currently serves as Executive Vice President and Chief Compliance Officer of HFMC. Mr. Melcher has served in various positions within The Hartford and its subsidiaries in connection with the operation of the Hartford Funds since joining The Hartford in 2012. Prior to joining The Hartford, Mr. Melcher worked at Touchstone Investments, a member of the Western & Southern Financial Group, where he held the position of Vice President and Chief Compliance Officer from 2010 through 2012 and Assistant Vice President, Compliance from 2005 to 2010.
Vernon J. Meyer (1964) Vice President since 2006
Mr. Meyer currently serves as Senior Vice President of HLIC. He also currently serves as Managing Director and Chief Investment Officer of HFMC and Managing Director of HFMG. Mr. Meyer has served in various positions within The Hartford and its subsidiaries in connection with the operation of the Hartford Funds. Mr. Meyer joined The Hartford in 2004.
Laura S. Quade (1969) Vice President since 2012
Ms. Quade currently serves as Vice President of HASCO, HFD and HFMG. She is the Head of Operations of HASCO and formerly served as Director, Enterprise Operations of HLIC. Ms. Quade has served in various positions within The Hartford and its subsidiaries in connection with the operation of the Hartford Funds. Ms. Quade joined The Hartford in 2001.
Martin A. Swanson** (1962) Vice President since 2010
Mr. Swanson currently serves as Vice President of HLIC. Mr. Swanson also serves as Managing Director, Chief Marketing Officer and Principal of HFD and Managing Director of HFMG. Mr. Swanson has served in various positions within The Hartford and its subsidiaries in connection with the operation of the Hartford Funds.
** Mr. Swanson resigned as an officer effective November 6, 2014.
HOW TO OBTAIN A COPY OF THE FUND’S PROXY VOTING POLICIES AND VOTING RECORDS (UNAUDITED)
A description of the policies and procedures that the Fund uses to determine how to vote proxies relating to portfolio securities and information about how the Fund voted proxies relating to portfolio securities during the most recent twelve-month period ended June 30 are available (1) without charge, upon request, by calling 888-843-7824 and (2) on the SEC’s website at http://www.sec.gov.
QUARTERLY PORTFOLIO HOLDINGS INFORMATION (UNAUDITED)
The Fund files a complete schedule of portfolio holdings with the SEC for the first and third quarters of each fiscal year on Form N-Q. The Fund’s Forms N-Q are available (1) without charge, upon request, by calling 888-843-7824 and (2) on the SEC’s website at http://www.sec.gov. The Form N-Q may be reviewed and copied at the SEC’s Public Reference Room in Washington, DC. Information on the operation of the Public Reference Room may be obtained by calling 1-800-SEC-0330.
| 56 |
| The Hartford Total Return Bond Fund |
| Federal Tax Information (Unaudited) |
For the fiscal year ended October 31, 2014, there is no further federal tax information required for this Fund.
| 57 |
| The Hartford Total Return Bond Fund |
| Expense Example (Unaudited) |
Your Fund's Expenses
As a shareholder of the Fund, you incur two types of costs: (1) transaction costs, including sales charges (loads) on purchase payments, if any, and contingent deferred sales charges (CDSC), if any, and (2) ongoing costs, including investment management fees, distribution and/or service (12b-1) fees, if any, and other fund expenses. This example is intended to help you understand your ongoing costs (in dollars) of investing in the Fund and to compare these costs with the ongoing costs of investing in other mutual funds. The example is based on an investment of $1,000 invested at the beginning of the period and held for the entire period of April 30, 2014 through October 31, 2014.
Actual Expenses
The first set of columns of the table below provides information about actual account values and actual expenses. You may use the information in this column, together with the amount you invested, to estimate the expenses that you paid over the period. Simply divide your account value by $1,000 (for example, an $8,600 account value divided by $1,000 = 8.6), then multiply the result by the number in the line under the heading entitled “Expenses Paid During Period” to estimate the expenses you paid on your account during this period.
Hypothetical Example for Comparison Purposes
The second set of columns of the table below provides information about hypothetical account values and hypothetical expenses based on the Fund's actual expense ratio and an assumed rate of return of 5% per year before expenses, which is not the Fund's actual return. The hypothetical account values and expenses may not be used to estimate the actual ending account balance or expenses you paid for the period. You may use this information to compare the ongoing costs of investing in the Fund and other funds. To do so, compare this 5% hypothetical example with the 5% hypothetical examples that appear in the shareholder reports of the other funds.
Please note that the expenses shown in the table are meant to highlight your ongoing costs only and do not reflect any transactional costs, such as sales charges (loads) and CDSC. Therefore, the second set of columns of the table is useful in comparing ongoing costs only, and will not help you determine the relative total costs of owning different funds. In addition, if these transactional costs were included, your costs would be higher. Expenses are equal to the Fund's annualized expense ratios multiplied by average account value over the period, multiplied by 184/365 (to reflect the one-half year period).
| Actual return | Hypothetical (5% return before expenses) | |||||||||||||||||||||||||||||||||||
| Beginning Account Value April 30, 2014 | Ending
Account Value October 31, 2014 | Expenses
paid during the period April 30, 2014 through October 31, 2014 | Beginning Account Value April 30, 2014 | Ending
Account Value October 31, 2014 | Expenses
paid during the period April 30, 2014 through October 31, 2014 | Annualized expense ratio | Days in the current 1/2 year | Days in the full year | ||||||||||||||||||||||||||||
| Class A | $ | 1,000.00 | $ | 1,020.20 | $ | 4.60 | $ | 1,000.00 | $ | 1,020.65 | $ | 4.60 | 0.90 | % | 184 | 365 | ||||||||||||||||||||
| Class B | $ | 1,000.00 | $ | 1,016.60 | $ | 8.36 | $ | 1,000.00 | $ | 1,016.92 | $ | 8.36 | 1.64 | 184 | 365 | |||||||||||||||||||||
| Class C | $ | 1,000.00 | $ | 1,015.40 | $ | 8.37 | $ | 1,000.00 | $ | 1,016.90 | $ | 8.38 | 1.65 | 184 | 365 | |||||||||||||||||||||
| Class I | $ | 1,000.00 | $ | 1,021.60 | $ | 3.11 | $ | 1,000.00 | $ | 1,022.12 | $ | 3.11 | 0.61 | 184 | 365 | |||||||||||||||||||||
| Class R3 | $ | 1,000.00 | $ | 1,017.30 | $ | 6.11 | $ | 1,000.00 | $ | 1,019.15 | $ | 6.11 | 1.20 | 184 | 365 | |||||||||||||||||||||
| Class R4 | $ | 1,000.00 | $ | 1,018.90 | $ | 4.57 | $ | 1,000.00 | $ | 1,020.68 | $ | 4.57 | 0.90 | 184 | 365 | |||||||||||||||||||||
| Class R5 | $ | 1,000.00 | $ | 1,021.40 | $ | 3.05 | $ | 1,000.00 | $ | 1,022.19 | $ | 3.05 | 0.60 | 184 | 365 | |||||||||||||||||||||
| Class Y | $ | 1,000.00 | $ | 1,020.90 | $ | 2.55 | $ | 1,000.00 | $ | 1,022.69 | $ | 2.55 | 0.50 | 184 | 365 | |||||||||||||||||||||
| 58 |
| The Hartford Total Return Bond Fund |
| Approval of Investment Management and Investment Sub-Advisory Agreements (Unaudited) |
Section 15(c) of the Investment Company Act of 1940, as amended (the “1940 Act”), requires that each mutual fund’s board of directors, including a majority of those directors who are not “interested persons” of the mutual fund, as defined in the 1940 Act (the “Independent Directors”), annually review and consider the continuation of the mutual fund’s investment advisory and sub-advisory agreements. At its meeting held on August 5-6, 2014, the Board of Directors (the “Board”) of The Hartford Mutual Funds, Inc., including each of the Independent Directors, unanimously voted to approve the continuation of the investment management agreement for The Hartford Total Return Bond Fund (the “Fund”) with Hartford Funds Management Company, LLC (“HFMC”) and the continuation of the investment sub-advisory agreement between HFMC and the Fund’s sub-adviser, Wellington Management Company, LLP (the “Sub-adviser,” and together with HFMC, the “Advisers”) (collectively, the “Agreements”).
In the months preceding the August 5-6, 2014 meeting, the Board requested, received and reviewed written responses from the Advisers to questions posed to them on behalf of the Independent Directors and supporting materials relating to those questions and responses. The Board considered information furnished to the Board at its meetings throughout the year, as well as information specifically prepared in connection with the annual approval of the Agreements at the Board’s meetings held on June 17-18, 2014 and August 5-6, 2014. Information provided to the Board at its meetings throughout the year included, among other things, reports on Fund performance, legal and compliance matters, sales and marketing activity, shareholder services, and the other services provided to the Fund by the Advisers and their affiliates. The Board also received in-person presentations by Fund officers and representatives of HFMC at the Board’s meetings on June 17-18, 2014 and August 5-6, 2014 concerning the Agreements.
The Independent Directors, advised by independent legal counsel, engaged service providers to assist them with evaluating the Agreements with respect to the Fund. Lipper Inc. (“Lipper”), an independent provider of investment company data, was retained to provide the Board with reports on how the Fund’s contractual management fees, actual management fees, other non-management fees, overall expense ratios and investment performance compared to those of mutual funds with similar investment objectives. The Independent Directors also engaged an independent financial services consultant (the “Consultant”) to assist them in evaluating the Fund’s management fees, sub-advisory fees, other non-management fees, overall expense ratios and investment performance. In addition, the Consultant reviewed the profitability calculations utilized by HFMC in connection with the continuation of the investment management agreement.
In determining whether to continue the Agreements for the Fund, the members of the Board reviewed and evaluated information and factors they believed to be relevant and appropriate in light of the information that the Board deemed necessary and appropriate through the exercise of its reasonable business judgment. While individual members of the Board may have weighed certain factors differently, the Board’s determination to continue the Agreements was based on a comprehensive consideration of all information provided to the Board throughout the year and specifically with respect to the continuation of the Agreements. A more detailed discussion of the factors the Board considered with respect to its approval of the Agreements is provided below.
Nature, Extent and Quality of Services Provided by the Advisers
The Board requested and considered information concerning the nature, extent and quality of the services provided to the Fund by the Advisers. The Board considered, among other things, the terms of the Agreements and the range of services provided by the Advisers. The Board considered the Advisers’ professional personnel who provide services to the Fund, including each Adviser’s ability and experience in attracting and retaining qualified personnel to service the Fund. The Board considered each Adviser’s reputation and overall financial strength, as well as its willingness to consider and implement organizational and operational changes designed to enhance services to the Hartford Funds. In addition, the Board considered the quality of each Adviser’s communications with the Board and responsiveness to Board inquiries and requests made from time to time with respect to the Fund and other Hartford Funds.
The Board also requested and evaluated information concerning each Adviser’s regulatory and compliance environment. In this regard, the Board requested and reviewed information on each Adviser’s compliance policies and procedures, compliance history, and a report from the Fund’s Chief Compliance Officer on each Adviser’s compliance with applicable laws and regulations, including responses to regulatory developments and compliance issues raised by regulators. The Board also noted the Advisers’ support of the Fund’s compliance control structure, particularly the resources devoted by the Advisers in support of the Fund’s obligations pursuant to Rule 38a-1 under the 1940 Act.
With respect to HFMC, the Board noted that, under the Agreements, HFMC is responsible for the management of the Fund, including oversight of fund operations and service providers, and provides administrative and investment advisory services in connection with selecting, monitoring and supervising the Sub-adviser. The Board considered HFMC’s ongoing monitoring of people, process and performance, including its quarterly reviews of each of the Hartford Funds, semi-annual meetings with the leaders of each Fund’s portfolio management team, and oversight of the Hartford Funds’ approximately 66 portfolio managers. The Board recognized that HFMC has demonstrated a record of making changes to the
| 59 |
| The Hartford Total Return Bond Fund |
| Approval of Investment Management and Investment Sub-Advisory Agreements (Unaudited) – (continued) |
management and/or strategies of the Hartford Funds when warranted. The Board considered HFMC’s oversight of the Sub-adviser’s investment approach and results, process for monitoring best execution of portfolio trades by the Sub-adviser, and approach to risk management with respect to the Fund and the service providers to the Fund. The Board also considered HFMC’s oversight of compliance with the Fund’s objective and policies as well as with applicable laws and regulations, noting that regulatory and other developments had over time led to an increase in the scope of HFMC’s services in this regard.
In addition, the Board considered HFMC’s ongoing commitment to review and rationalize the Hartford Funds product line-up and the expenses that HFMC had incurred in connection with fund combinations in recent years. The Board considered that HFMC or its affiliates are responsible for providing the Fund’s officers.
With respect to the Sub-adviser, which provides certain day-to-day portfolio management services for the Fund, the Board considered the quality of the Fund’s portfolio managers, the Sub-adviser’s other investment personnel, its investment philosophy and process, investment research capabilities and resources, performance record, trade execution capabilities and experience. The Board considered the experience of the Fund’s portfolio managers, the number of accounts managed by the portfolio managers, and the Sub-adviser’s method for compensating the portfolio managers.
Based on these considerations, the Board concluded that it was satisfied with the nature, extent and quality of the services provided to the Fund by HFMC and the Sub-adviser.
Performance of the Fund and the Advisers
The Board considered the investment performance of the Fund. In this regard, the Board reviewed the performance of the Fund over different time periods presented in the materials and evaluated HFMC’s analysis of the Fund’s performance for these time periods. The Board considered information and materials provided to the Board by the Advisers concerning Fund performance, as well as information from Lipper comparing the investment performance of the Fund to an appropriate benchmark and universe of peer funds. The Board noted that the Fund’s performance was in the 3rd quintile of its performance universe for the 1- and 5-year periods and the 2nd quintile for the 3-year period. The Board also noted that the Fund’s performance was above its benchmark for the 1-, 3- and 5-year periods.
The Board considered the detailed investment analytics reports provided by Hartford Funds’ Investment Advisory Group throughout the year. These reports include, among other things, information on the Fund’s gross and net returns, the Fund’s investment performance relative to an appropriate benchmark and peer group, various statistics concerning the Fund’s portfolio, and a narrative summary of various factors affecting Fund performance. The Board considered the Advisers’ cooperation with the Investment Committee, which assists the Board in evaluating the performance of the Fund at periodic meetings throughout the year. The Board also considered the analysis provided by the Consultant relating to the Fund’s performance track record.
In light of all the considerations noted above, the Board concluded that it had continued confidence in HFMC’s and the Sub-adviser’s overall capabilities to manage the Fund.
Costs of the Services and Profitability of the Advisers
The Board reviewed information regarding HFMC’s cost to provide investment management and related services to the Fund and HFMC’s profitability, both overall and for the Fund, on a pre-tax basis without regard to distribution expenses. The Board also requested and reviewed information about the profitability to HFMC and its affiliates from all services provided to the Fund and all aspects of their relationship with the Fund. The Board also requested and received information relating to the operations and profitability of the Sub-adviser.
The Board considered the Consultant’s review of the profitability calculations used by HFMC in connection with the continuation of the investment management agreement, noting the Consultant’s view that Hartford Funds’ process for calculating and reporting Fund profitability is reasonable. In this regard, the Board noted that the Consultant performed a full review of this process in light of the recent restructuring of the Hartford Funds business and reported that the approach to analyzing Fund profitability, including the use of common expense allocation methodologies, is reasonable, sound and well within common industry practice.
Based on these considerations, the Board concluded that the profits anticipated to be realized by the Advisers and their affiliates from their relationships with the Fund would not be excessive.
| 60 |
| The Hartford Total Return Bond Fund |
| Approval of Investment Management and Investment Sub-Advisory Agreements (Unaudited) – (continued) |
Comparison of Fees and Services Provided by the Advisers
The Board considered comparative information with respect to the management fees to be paid by the Fund to HFMC and the total expense ratios of the Fund. The Board also considered comparative information with respect to the sub-advisory fees to be paid by HFMC to the Sub-adviser. In this regard, the Board requested and reviewed information from HFMC and the Sub-adviser relating to the management and sub-advisory fees, including the sub-advisory fee schedule for the Fund, and total operating expenses for the Fund. With respect to the sub-advisory fee schedule, the Board considered representations from HFMC and the Sub-adviser that the Sub-adviser’s fees were negotiated at arm’s length on a fund-by-fund basis. The Board also reviewed information from Lipper comparing the Fund’s contractual management fees, actual management fees and overall expense ratios relative to a group of funds selected by Lipper, in consultation with the Consultant, and a broader universe of funds selected by Lipper. The Board considered that the Fund’s contractual management fee and total expenses (less 12b-1 and shareholder service fees) were in the 5th quintile of its expense group, while its actual management fee was in the 4th quintile. The Board noted that the Fund has an automatically renewable contractual expense cap and a permanent expense cap on each share class. These arrangements resulted in reimbursement of certain expenses incurred in 2013. The Board also noted that in response to a request from the Board, HFMC had agreed to waive 0.08% of its contractual management fee for the Fund and lower the Fund’s annual renewable expense cap for each share class by 0.08% from November 1, 2014 to October 31, 2015.
While the Board recognized that comparisons between the Fund and peer funds may be imprecise, given the different service levels and characteristics of mutual funds and the different business models and cost structures of the Advisers, the comparative information provided by Lipper assisted the Board in evaluating the reasonableness of the Fund’s management and sub-advisory fees and total operating expenses. In addition, the Board considered the analysis and recommendations of the Consultant relating to the Fund’s management and sub-advisory fees and total operating expenses.
Based on these considerations, the Board concluded that the Fund’s fees and total operating expenses, in conjunction with the information about quality of services, profitability, economies of scale, and other matters discussed, were reasonable in light of the services provided.
Economies of Scale
The Board requested and considered information regarding the Advisers’ realization of economies of scale with respect to the Fund and whether the fee levels reflect these economies of scale for the benefit of the Fund’s shareholders. The Board reviewed the breakpoints in the management fee schedule for the Fund, which reduce fee rates as Fund assets grow over time. The Board recognized that a fund with assets beyond the highest breakpoint level will continue to benefit from economies of scale because additional assets are charged the lowest breakpoint fee resulting in lower overall effective management fee rates. The Board also considered that expense limitations and fee waivers that reduce the Fund’s expenses at all asset levels can have the same effect as breakpoints in sharing economies of scale with shareholders and provide protection from an increase in expenses if Fund assets decline. The Board recognized that a fee schedule that reaches a lower breakpoint quickly provides shareholders with the benefit of anticipated or potential economies of scale. The Board also considered that HFMC has been active in managing expenses, which has resulted in benefits being realized by shareholders as assets within the Hartford Funds family of funds have grown over time, including through lower transfer agent costs and other operating expenses.
The Board reviewed and evaluated materials from Lipper and the Consultant showing how management fee schedules of peer funds reflect economies of scale for the benefit of shareholders as a peer fund’s assets hypothetically increase over time. Based on information provided by HFMC, Lipper, and the Consultant, the Board recognized that there is no uniform methodology for establishing breakpoints or uniform pattern in asset levels that trigger breakpoints or the amounts of breakpoints triggered.
After considering all of the information available to it, the Board concluded that it was satisfied with the extent to which economies of scale would be shared for the benefit of the Fund’s shareholders based on currently available information and the effective advisory fees and expense ratios for the Fund at its current and reasonably anticipated asset levels. The Board noted, however, that it would continue to monitor future growth in Fund assets and the appropriateness of additional breakpoints.
Other Benefits
The Board considered other benefits to the Advisers and their affiliates from their relationships with the Fund.
The Board noted that HFMC receives fees for fund accounting and related services from the Fund, and the Board considered information on profits to HFMC for such services. The Board also considered that Hartford Administrative Services Company (“HASCO”), the Fund’s transfer
| 61 |
| The Hartford Total Return Bond Fund |
| Approval of Investment Management and Investment Sub-Advisory Agreements (Unaudited) – (continued) |
agent and an affiliate of HFMC, receives transfer agency compensation from the Fund, and the Board reviewed information on the profitability of the Fund’s transfer agency function to HASCO. The Board considered information provided by HASCO indicating that the transfer agent fees charged by HASCO to the Fund were fair and reasonable based on publicly available information.
The Board also considered that Hartford Funds Distributors, LLC (“HFD”), an affiliate of HFMC, serves as principal underwriter of the Fund. As principal underwriter, HFD receives 12b-1 fees from the Fund and receives all or a portion of the sales charges on sales or redemptions of certain classes of shares. The Board also noted that certain affiliates of HFD distribute shares of the Fund and receive compensation in that connection.
The Board considered the benefits, if any, to the Sub-adviser from any use of the Fund’s brokerage commissions to obtain soft dollar research, and representations from HFMC and the Sub-adviser that the Sub-adviser would not make any revenue-sharing payments or any other type of distribution payments to HFMC or its affiliates.
The Board considered the benefits to shareholders of being part of the Hartford Funds family of funds, including the right to exchange investments between the same class of funds without a sales charge, the ability to reinvest Fund dividends into other funds in the family, and the ability to combine holdings in the Fund with holdings in other funds to obtain a reduced sales charge. The Board considered HFMC’s efforts to provide investors in the family with a broad range of investment styles and asset classes and its entrepreneurial risk in initiating new funds to expand these opportunities for shareholders.
* * * *
Based upon its review of these various factors, among others, the Board concluded that it is in the best interests of the Fund and its shareholders for the Board to approve the Agreements for an additional year. In reaching this decision, the Board did not assign relative weights to the factors discussed above or deem any one or group of them to be controlling in and of themselves. In connection with their deliberations, the Independent Directors met separately in executive session on several occasions, with independent legal counsel and the Consultant, to review the relevant materials and consider their responsibilities under relevant laws and regulations.
| 62 |
| The Hartford Total Return Bond Fund |
| Main Risks (Unaudited) |
The main risks of investing in the Fund are described below.
Market, Selection and Strategy Risk: The Fund’s share price may fluctuate due to market risk and/or security selections that may underperform the market or relevant benchmarks. If the sub-adviser's investment strategy does not perform as expected, the Fund could underperform its peers or lose money. There is no guarantee the Fund will achieve its stated objective.
Fixed Income Risk: The Fund is subject to interest rate risk (the risk that the value of an investment decreases when interest rates rise), credit risk (the risk that the issuing company of a security is unable to pay interest and principal when due), liquidity risk (the risk that an investment may be difficult to sell at an advantageous time or price) and call risk (the risk that an investment may be redeemed early). These risks also apply to the Fund’s investments in U.S. government securities, which may not be guaranteed by the U.S. government.
Mortgage-Backed Securities Risk: Mortgage-backed securities are subject to interest rate risk, credit risk, prepayment risk, extension risk, and the risk that an investment’s value may be reduced or become worthless if it receives interest or income payments only after other investments in the same pool. The Fund may purchase mortgage-backed securities in the "to be announced" (TBA) market. This subjects the Fund to counterparty risk and the risk that the security the Fund buys will lose value prior to its delivery.
Foreign Investment and Emerging Markets Risk: Investments in foreign securities may be riskier than investments in U.S. securities. Potential risks include the risks of illiquidity, increased price volatility, less government regulation, less extensive and less frequent accounting and other reporting requirements, unfavorable changes in currency exchange rates, and economic and political disruptions. These risks are generally greater for investments in emerging markets.
Derivatives Risk: Investments in derivatives can be volatile. Potential risks include currency risk, leverage risk (the risk that small market movements may result in large changes in the value of an investment), liquidity risk, index risk, pricing risk, and counterparty risk (the risk that the counterparty may be unwilling or unable to honor its obligations).
Active Trading Risk: Actively trading investments may result in higher costs and higher taxable income.
| 63 |
THIS PRIVACY POLICY IS NOT PART OF THIS REPORT
Privacy Policy and Practices of The Hartford Financial Services Group, Inc. and its Affiliates
(herein called “we, our and us”)
This Privacy Policy applies to our United States Operations
|
We value your trust. We are committed to the responsible: a) management; b) use; and c) protection; of Personal Information.
This notice describes how we collect, disclose, and protect Personal Information.
We collect Personal Information to: a) service your Transactions with us; and b) support our business functions.
We may obtain Personal Information from: a) You; b) your Transactions with us; and c) third parties such as a consumer-reporting agency.
Based on the type of product or service You apply for or get from us, Personal Information such as: a) your name; b) your address; c) your income; d) your payment; or e) your credit history; may be gathered from sources such as applications, Transactions, and consumer reports.
To serve You and service our business, we may share certain Personal Information. We will share Personal Information, only as allowed by law, with affiliates such as: a) our insurance companies; b) our employee agents; c) our brokerage firms; and d) our administrators.
As allowed by law, we may share Personal Financial Information with our affiliates to: a) market our products; or b) market our services; to You without providing You with an option to prevent these disclosures. |
We may also share Personal Information, only as allowed by law, with unaffiliated third parties including: a) independent agents; b) brokerage firms; c) insurance companies; d) administrators; and e) service providers; who help us serve You and service our business.
When allowed by law, we may share certain Personal Financial Information with other unaffiliated third parties who assist us by performing services or functions such as: a) taking surveys; b) marketing our products or services; or c) offering financial products or services under a joint agreement between us and one or more financial institutions.
We, and third parties we partner with, may track some of the pages You visit through the use of: a) cookies; b) pixel tagging; or c) other technologies; and currently do not process or comply with any web browser’s “do not track” signal or similar mechanism that indicates a request to disable online tracking of individual users who visit our websites or use our services.
We will not sell or share your Personal Financial Information with anyone for purposes unrelated to our business functions without offering You the opportunity to: a) “opt-out;” or b) “opt-in;” as required by law.
We only disclose Personal Health Information with: a) your proper written authorization; or b) as otherwise allowed or required by law.
Our employees have access to Personal Information in the course of doing their jobs, such as: a) underwriting policies; b) paying claims; c) developing new products; or d) advising customers of our products and services. |
|
We use manual and electronic security procedures to maintain: a) the confidentiality; and b) the integrity of; Personal Information that we have. We use these procedures to guard against unauthorized access.
Some techniques we use to protect Personal Information include: a) secured files; b) user authentication; c) encryption; d) firewall technology; and e) the use of detection software.
We are responsible for and must: a) identify information to be protected; b) provide an adequate level of protection for that data; c) grant access to protected data only to those people who must use it in the performance of their job-related duties.
Employees who violate our Privacy Policy will be subject to discipline, which may include ending their employment with us.
At the start of our business relationship, we will give You a copy of our current Privacy Policy.
We will also give You a copy of our current Privacy Policy once a year if You maintain a continuing business relationship with us.
We will continue to follow our Privacy Policy regarding Personal Information even when a business relationship no longer exists between us.
|
As used in this Privacy Notice:
Application means your request for our product or service.
Personal Financial Information means financial information such as: a) credit history; b) income; c) financial benefits; or d) policy or claim information.
Personal Health Information means health information such as: a) your medical records; or b) information about your illness, disability or injury.
Personal Information means information that identifies You personally and is not otherwise available to the public. It includes: a) Personal Financial Information; and b) Personal Health Information.
Transaction means your business dealings with us, such as: a) your Application; b) your request for us to pay a claim; and c) your request for us to take an action on your account.
You means an individual who has given us Personal Information in conjunction with: a) asking about; b) applying for; or c) obtaining; a financial product or service from us if the product or service is used mainly for personal, family, or household purposes.
|
This Privacy Policy is being provided on behalf of the following affiliates of The Hartford Financial Services Group, Inc.:
1stAGChoice, Inc.; Access CoverageCorp, Inc.; Access CoverageCorp Technologies, Inc.; American Maturity Life Insurance Company; Archway 60 R, LLC; Business Management Group, Inc.; Champlain Life Reinsurance Company; DMS R, LLC; Eloy R, LLC; Ersatz Corporation; First State Insurance Company; Hartford Accident and Indemnity Company; Hartford Administrative Services Company; Hartford Casualty General Agency, Inc.; Hartford Casualty Insurance Company; Hartford-Comprehensive Employee Benefit Service Company; Hartford Equity Sales Company, Inc.; Hartford Fire General Agency, Inc.; Hartford Fire Insurance Company; Hartford Funds Management Company, LLC; Hartford Funds Management Group, Inc.; Hartford HLS Series Fund II, Inc.; Hartford Insurance Company of Illinois; Hartford Insurance Company of the Midwest; Hartford Insurance Company of the Southeast; Hartford Integrated Technologies, Inc.; Hartford International Life Reassurance Corporation; Hartford Funds Distributors, LLC; Hartford Investment Management Company; Hartford Life and Accident Insurance Company; Hartford Life and Annuity Insurance Company; Hartford Life Insurance Company; Hartford Life Private Placement, LLC; Hartford Lloyd’s Corporation; Hartford Lloyd’s Insurance Company; Hartford Mezzanine Investors I, LLC; Hartford Residual Market, L.C.C.; Hartford Retirement Services, LLC; Hartford Securities Distribution Company, Inc.; Hartford Series Fund, Inc.; Hartford Specialty Insurance Services of Texas, LLC; Hartford Strategic Investments, LLC; Hartford Underwriters Insurance Company; Hartford Technology Services Company, L.L.C.; Hartford of Texas General Agency, Inc.; Hartford Underwriters General Agency, Inc.; HARTRE Company, L.C.C.; HL Investment Advisors, LLC; HLA LLC; Horizon Management Group, LLC; HRA Brokerage Services, Inc.; Lanidex Class B, LLC; M-CAP Insurance Agency, LLC; New England Insurance Company; New England Reinsurance Corporation; Nutmeg Insurance Agency, Inc.; Nutmeg Insurance Company; Pacific Insurance Company, Limited; Planco, LLC: Property and Casualty Insurance Company of Hartford; Revere R, LLC; RVR R, LLC; Sentinel Insurance Company, Ltd.; Sunstone R, LLC; Symphony R, LLC; The Evergreen Group Incorporated; The Hartford Alternative Strategies Fund; The Hartford Mutual Funds, Inc.; The Hartford Mutual Funds II, Inc.; Trumbull Flood Management, L.L.C.; Trumbull Insurance Company; Twin City Fire Insurance Company; White River Life Reinsurance Company.
HPP Revised January 2014
HARTFORDFUNDS
hartfordfunds.com
This information is written in connection with the promotion or marketing of the matter(s) addressed in this material.
This report is submitted for the general information of the shareholders of the Fund. It is not authorized for distribution unless preceded or accompanied by a current prospectus for the Fund.
The information cannot be used or relied upon for the purpose of avoiding IRS penalties. These materials are not intended to provide tax, accounting or legal advice. As with all matters of a tax or legal nature, you should consult your own tax or legal counsel for advice.
Investors should carefully consider the investment objectives, risks, charges, and expenses of Hartford Funds before investing. This and other information can be found in the prospectus and summary prospectus, which can be obtained by calling 888-843-7824 (retail) or 800-279-1541 (institutional). Investors should read them carefully before they invest.
Hartford Funds are underwritten and distributed by Hartford Funds Distributors, LLC.
MFAR-TRB14 12/14 114011-3 Printed in U.S.A.
HARTFORDFUNDS
|
THE HARTFORD
UNCONSTRAINED BOND FUND
2014 Annual Report |
A MESSAGE FROM THE PRESIDENT
Dear Fellow Shareholders:
Thank you for investing in Hartford Funds.
Market Review
U.S. equities (as represented by the S&P 500 Index) rose steadily for the fiscal year ended October 31, 2014, with a return of 17.27% for the period. With the exception of short-lived geopolitical scares early in 2014 and concerns about continuing global growth near the end of the period, stocks generally rose on solid fundamentals and encouraging macroeconomic data during the year.
September 2014 marked the six-year anniversary of the start of the financial crisis. Within weeks of that anniversary, both the S&P 500 Index and the Dow Jones Industrial Average set new all-time highs, closing at 2,018 and 17,391, respectively, on October 31. Although the fallout of the crisis continues to influence investor behavior, stocks have recovered and risen dramatically, up 198% from their low in March 2009. Meanwhile, the domestic economy is notching strong growth, and the unemployment rate has reached its lowest level since August 2008.
While the U.S. economy appears to have stabilized and to have reverted to a solid growth path, the outlook for the global economy appears to have gotten cloudier. The U.S. Federal Reserve has ended quantitative easing, while Europe and Japan are pursuing stimulus options to avoid a double-dip recession and deflation, respectively. Diverging central-bank policies will likely continue to play an important role in market movements going forward as investors wait to see the reactions to their efforts and their impacts on global markets.
How have market movements impacted your portfolio throughout the last year? Are your investments still on track to provide the growth or income you need, and are you comfortable with their progress during times of volatility?
Your financial professional can help you navigate today’s markets with confidence, as well as assist you to achieve your investment goals by providing advice on the best options within our fund family to help you work toward overcoming today’s investing challenges. Meet with your financial advisor regularly to examine your portfolio and your investment strategy, and to determine if you’re still on track to meet your goals.
Thank you again for investing with Hartford Funds.
James Davey
President
Hartford Funds
1 The S&P 500 Index is a market capitalization-weighted price index composed of 500 widely held common stocks.
2 The Dow Jones Industrial Average is an unmanaged, price-weighted index of 30 of the largest, most widely held stocks traded on the NYSE
The Hartford Unconstrained Bond Fund
Table of Contents
The views expressed in the Fund’s Manager Discussion under ‘‘Why did the Fund perform this way?’’ and ‘‘What is the outlook?’’ are views of the Fund’s sub-adviser and portfolio management team through the end of the period and are subject to change based on market and other conditions. The Fund’s Manager Discussion is for informational purposes only and does not represent an offer, recommendation or solicitation to buy, hold or sell any security. The specific securities identified and described, if any, do not represent all of the securities purchased or sold and you should not assume that investments in the securities identified and discussed will be profitable.
| The Hartford Unconstrained Bond Fund inception 10/31/2002 |
| (sub-advised by Wellington Management Company, LLP) |
| Investment objective – The Fund seeks to maximize long-term total return. |
Performance Overview 10/31/04 - 10/31/14
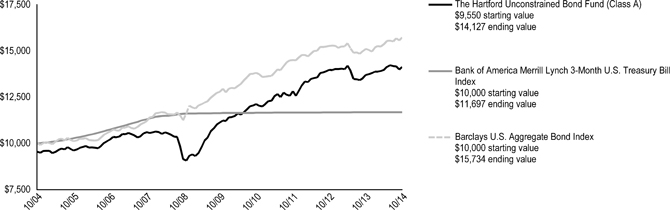
The chart above represents the hypothetical growth of a $10,000 investment in Class A, which includes a sales charge. Growth results in classes other than Class A will vary from what is seen above due to differences in the expenses charged to those share classes.
| Average Annual Total Returns (as of 10/31/14) |
| 1 Year | 5 Years | 10 Years | ||||||||||
| Unconstrained Bond A# | 3.16 | % | 4.85 | % | 3.99 | % | ||||||
| Unconstrained Bond A## | -1.48 | % | 3.89 | % | 3.52 | % | ||||||
| Unconstrained Bond B# | 2.30 | % | 4.07 | % | 3.37 | %* | ||||||
| Unconstrained Bond B## | -2.70 | % | 3.73 | % | 3.37 | %* | ||||||
| Unconstrained Bond C# | 2.29 | % | 4.09 | % | 3.22 | % | ||||||
| Unconstrained Bond C## | 1.29 | % | 4.09 | % | 3.22 | % | ||||||
| Unconstrained Bond I# | 3.32 | % | 4.98 | % | 4.06 | % | ||||||
| Unconstrained Bond R3# | 2.76 | % | 4.81 | % | 4.10 | % | ||||||
| Unconstrained Bond R4# | 3.07 | % | 5.01 | % | 4.20 | % | ||||||
| Unconstrained Bond R5# | 3.37 | % | 5.20 | % | 4.29 | % | ||||||
| Unconstrained Bond Y# | 3.48 | % | 5.19 | % | 4.28 | % | ||||||
| Bank of America Merrill Lynch 3-Month U.S. Treasury Bill Index | 0.05 | % | 0.09 | % | 1.58 | % | ||||||
| Barclays U.S. Aggregate Bond Index | 4.14 | % | 4.22 | % | 4.64 | % | ||||||
| # | Without sales charge |
| ## | With sales charge |
| * | Class B shares convert to Class A shares after 8 years. The return shown reflects the conversion to Class A shares, which had different operating expenses, for the period after conversion. |
PERFORMANCE DATA QUOTED REPRESENTS PAST PERFORMANCE AND DOES NOT GUARANTEE FUTURE RESULTS. The investment return and principal value of the investment will fluctuate so that investors’ shares, when redeemed, may be worth more or less than their original cost. Current performance may be lower or higher than the performance data quoted. To obtain performance data current to the most recent month-end, please visit our website www.hartfordfunds.com.
The initial investment in Class A shares reflects the maximum sales charge of 4.50% and returns for Class B shares reflect a contingent deferred sales charge of up to 5.00% and declining to zero, depending on the period of time the shares are held. Returns for Class C shares reflect a contingent deferred sales charge of up to 1.00% on shares redeemed within twelve months of purchase.
Total returns presented above were calculated using the Fund’s net asset value available to shareholders for sale or redemption of Fund shares on October 31, 2014, which may exclude investment transactions as of this date. All share class returns assume the reinvestment of all distributions at net asset value and the deduction of all fund expenses.
Effective 9/30/09, Class B shares of the Fund were closed to new investments.
Class I shares commenced operations on 5/25/12. Performance prior to that date is that of the Fund’s Class A shares (excluding sales charges), which had different operating expenses. Class R3, R4 and R5 shares commenced operations on 9/30/11. Performance prior to that date is that of the Fund’s Class Y shares, which had different operating expenses.
Performance information includes performance under the Fund’s previous sub-adviser, Hartford Investment Management Company, using a different investment strategy and in pursuit of a different investment goal. As of April 23, 2012, Hartford Investment Management Company no longer served as the sub-adviser to the Fund.
Bank of America Merrill Lynch 3-Month U.S. Treasury Bill Index is an unmanaged index that tracks the performance of U.S. dollar denominated U.S. Treasury bills publicly issued in the U.S. domestic markets with maturities of 90 days or less that assumes reinvestment of all income.
Barclays U.S. Aggregate Bond Index is an unmanaged index and is composed of securities from the Barclays Government/Credit Bond Index, Mortgage-Backed Securities Index, Asset-Backed Securities Index and Commercial Mortgage-Backed Securities Index.
You cannot invest directly in an index.
The chart and table do not reflect the deductions of taxes that a shareholder would pay on Fund distributions or the redemption of Fund shares.
Performance information may reflect historical or current expense waivers/reimbursements from the investment adviser, without which performance would have been lower. For information on current expense waivers/reimbursements, please see the prospectus.
| 2 |
| The Hartford Unconstrained Bond Fund |
| Manager Discussion |
| October 31, 2014 (Unaudited) |
| Operating Expenses* | ||||||||
| Net | Gross | |||||||
| Unconstrained Bond Class A | 0.99 | % | 1.13 | % | ||||
| Unconstrained Bond Class B | 1.74 | % | 2.01 | % | ||||
| Unconstrained Bond Class C | 1.74 | % | 1.82 | % | ||||
| Unconstrained Bond Class I | 0.74 | % | 0.76 | % | ||||
| Unconstrained Bond Class R3 | 1.29 | % | 1.44 | % | ||||
| Unconstrained Bond Class R4 | 0.99 | % | 1.11 | % | ||||
| Unconstrained Bond Class R5 | 0.69 | % | 0.82 | % | ||||
| Unconstrained Bond Class Y | 0.69 | % | 0.71 | % | ||||
| * | As shown in the Fund's current prospectus dated March 1, 2014. Actual expenses may be higher or lower. Please see accompanying Financial Highlights for expense ratios for the year ended October 31, 2014. |
Gross expenses are the Fund's total annual operating expenses shown in the Fund's most recent prospectus. Net expenses are the Fund's total annual operating expenses shown in the Fund's most recent prospectus and reflect contractual expense reimbursements in instances when these reductions reduce the Fund's gross expenses. Contractual reimbursements remain in effect until February 28, 2015, and automatically renew for one-year terms unless terminated.
All investments are subject to risk including the possible loss of principal. For a discussion of the Fund’s risks, please see the Main Risks section of this report. For more detailed information on the risks associated with an investment in the Fund, please see the prospectus.
| Portfolio Managers | ||||
| Campe Goodman, CFA | Lucius T. Hill III | Joseph F. Marvan, CFA | ||
| Senior Vice President and Fixed Income Portfolio Manager | Senior Vice President and Fixed Income Portfolio Manager | Senior Vice President and Fixed Income Portfolio Manager |
How did the Fund perform?
The Class A shares of The Hartford Unconstrained Bond Fund returned 3.16%, before sales charge, for the twelve-month period ended October 31, 2014, underperforming the Fund’s benchmark, the Barclays U.S. Aggregate Bond Index, which returned 4.14% for the same period. The Fund outperformed the Bank of America Merrill Lynch 3-Month U.S. Treasury Bill Index, the Fund’s other benchmark, which returned 0.05% for the same period. The Fund outperformed the 2.49% average return of the Lipper Alternative Credit Focus Funds peer group, a group of funds that invest in a wide-range of credit-structured vehicles by using either fundamental credit research analysis or quantitative credit portfolio modeling trying to benefit from any changes in credit quality, credit spreads, and market liquidity.
Why did the Fund perform this way?
Fixed income markets gained throughout much of the period as expectations of prolonged easy monetary policy by major central banks and a supportive macroeconomic environment kept rates low and suppressed volatility. Early in the period emerging markets dominated headlines as economic and political developments sparked risk aversion across global markets, pushing bond prices higher and yields lower amid a flight to quality. Toward the end of the period, however, persistent geopolitical risks – tensions between Ukraine and Russia and violence in Iraq – and Chinese economic slowdown concerns raised questions about the global growth rate, keeping a lid on risk appetites overall.
The period was also highlighted by a divergence in central bank policies. The European Central Bank (ECB) cut its benchmark lending and deposit rates and announced a host of stimulus measures in an effort to encourage lending and fend off fears of deflation. China’s central bank joined the ECB in boosting liquidity by injecting funds into the nation’s largest banks in an attempt to combat weakening growth. The Bank of Japan pre-emptively announced incremental monetary easing to counter the risk of missing the country’s inflation and growth targets. In contrast, the Bank of England and U.S. Federal Reserve (Fed) leaned toward tighter policies. The Fed ended its quantitative easing program as U.S. data largely suggested the economy was on a sustainable growth path. Second quarter Gross Domestic Product (GDP) rebounded after the first quarter’s steep contraction. The labor market strengthened as the unemployment rate dropped to a six-year low. Housing regained some lost ground after a weak start to the year, though the pace of home price appreciation started to slow after a strong 2013. Inflation pressures were muted overall, alleviating pressure on the Fed to raise rates.
The Fund’s low strategic duration posture relative to the Barclays U.S. Aggregate Bond Index detracted from performance, as did an allocation to high yield bonds. During the period, the Fund was underweight investment grade credit in favor of allocations to lower tier credit sectors. Emerging market debt exposure, obtained via index total return swaps, also detracted from relative results. These factors were somewhat offset by allocations to bank loans and non-agency Residential Mortgage-Backed Securities and an overweight to Commercial Mortgage-Backed Securities which contributed to results during the period.
Within high yield, positive results from an allocation to BB-rated issuers were more than offset by the negative impact of high yield credit default swap index positions, which were used as a source of liquidity and to manage overall portfolio risk.
What is the outlook?
We are positive on U.S. economic growth over the next year based on supportive monetary policy and diminishing fiscal drag, along with companies’ improving confidence and willingness to invest.
| 3 |
| The Hartford Unconstrained Bond Fund |
| Manager Discussion – (continued) |
| October 31, 2014 (Unaudited) |
Additionally, the deceleration in global growth and decline in energy prices could, in our view, give the Fed more latitude in prolonging the start of the rate hiking cycle. At the end of the period we maintained a moderately pro-cyclical risk posture, favoring credit in general.
We continue to favor bank loans based on positive corporate fundamentals, expectations for a continued benign default environment, and attractive valuations. We also hold European bank contingent convertibles (CoCos) where the market’s lack of familiarity and the regulatory environment create an investment opportunity. Within high yield, we remain focused on BB-rated issuers. We also continue to find value in the securitized sectors like non-agency Residential Mortgage-Backed Securities, and senior tranches of Commercial Mortgage-Backed Securities and collateralized loans obligations. At the end of the period, we also held a modest allocation to unhedged local currency emerging market debt.
At the end of the period, we have tactically positioned the portfolio with a low strategic duration posture.
| Credit Exposure | ||||
| as of October 31, 2014 | ||||
| Credit Rating * | Percentage of Net Assets | |||
| Aaa/ AAA | 48.7 | % | ||
| Aa/ AA | 17.5 | |||
| A | 1.9 | |||
| Baa/ BBB | 6.6 | |||
| Ba/ BB | 15.6 | |||
| B | 15.5 | |||
| Caa/ CCC or Lower | 10.9 | |||
| Not Rated | 5.5 | |||
| Non-Debt Securities and Other Short-Term Instruments | 11.1 | |||
| Other Assets and Liabilities | (33.3 | ) | ||
| Total | 100.0 | % | ||
| * | Credit exposure is the long-term credit ratings for the Fund's holdings, as of the date noted, as provided by Standard and Poor's (S&P) or Moody's Investors Service (Moody's) and typically range from AAA/Aaa (highest) to C/D (lowest). Presentation of S&P and Moody's credit ratings in this report have been selected for informational purposes for shareholders, as well as the Fund's consideration of industry practice. If Moody's and S&P assign different ratings, the lower rating is used. Fixed income securities that are not rated by either agency are listed as "Not Rated." Ratings do not apply to the Fund itself or to the Fund's shares. Ratings may change. |
| Diversification by Security Type | ||||
| as of October 31, 2014 | ||||
| Category | Percentage of Net Assets | |||
| Equity Securities | ||||
| Preferred Stocks | 0.0 | % | ||
| Total | 0.0 | % | ||
| Fixed Income Securities | ||||
| Asset & Commercial Mortgage Backed Securities | 28.0 | % | ||
| Corporate Bonds | 17.5 | |||
| Foreign Government Obligations | 3.7 | |||
| Municipal Bonds | 0.8 | |||
| Senior Floating Rate Interests | 17.6 | |||
| U.S. Government Agencies | 40.4 | |||
| U.S. Government Securities | 14.2 | |||
| Total | 122.2 | % | ||
| Short-Term Investments | 11.1 | |||
| Purchased Options | 0.0 | |||
| Other Assets and Liabilities | (33.3 | ) | ||
| Total | 100.0 | % | ||
| 4 |
| The Hartford Unconstrained Bond Fund |
| Schedule of Investments |
| October 31, 2014 |
| (000’s Omitted) |
| Shares or Principal Amount ╬ | Market Value ╪ | |||||||
Asset and Commercial Mortgage Backed Securities - 28.0% | ||||||||
| Finance and Insurance - 28.0% | ||||||||
| Adjustable Rate Mortgage Trust | ||||||||
| $ | 89 | 0.42%, 11/25/2035 Δ | $ | 82 | ||||
| American Home Mortgage Assets Trust | ||||||||
| 91 | 0.28%, 03/25/2047 ‡Δ | 74 | ||||||
| 190 | 1.06%, 10/25/2046 ‡Δ | 139 | ||||||
| Asset Backed Funding Certificates | ||||||||
| 73 | 0.37%, 01/25/2037 ‡Δ | 46 | ||||||
| Atlas Senior Loan Fund Ltd. | ||||||||
| 395 | 1.78%, 10/15/2026 ■ΔΘ | 395 | ||||||
| Banc of America Commercial Mortgage, Inc. | ||||||||
| 536 | 5.44%, 11/10/2042 Δ | 537 | ||||||
| Banc of America Funding Corp. | ||||||||
| 153 | 0.35%, 10/20/2036 ‡Δ | 109 | ||||||
| 56 | 5.85%, 01/25/2037 ‡ | 45 | ||||||
| Banc of America Mortgage Securities | ||||||||
| 117 | 2.69%, 09/25/2035 Δ | 110 | ||||||
| BCAP LLC Trust | ||||||||
| 179 | 0.32%, 01/25/2037 ‡Δ | 135 | ||||||
| 227 | 0.33%, 03/25/2037 ‡Δ | 183 | ||||||
| 152 | 0.36%, 05/25/2047 ‡Δ | 113 | ||||||
| Bear Stearns Adjustable Rate Mortgage Trust | ||||||||
| 58 | 2.37%, 02/25/2036 ‡Δ | 57 | ||||||
| Bear Stearns Alt-A Trust | ||||||||
| 426 | 0.47%, 08/25/2036 ‡Δ | 322 | ||||||
| 285 | 0.65%, 01/25/2036 ‡Δ | 226 | ||||||
| Bear Stearns Commercial Mortgage Securities, Inc. | ||||||||
| 100 | 5.29%, 10/12/2042 ‡Δ | 100 | ||||||
| 148 | 5.33%, 02/11/2044 ‡ | 159 | ||||||
| 457 | 5.41%, 12/11/2040 | 471 | ||||||
| 300 | 5.69%, 06/11/2050 | 328 | ||||||
| 235 | 5.90%, 06/11/2040 ‡Δ | 259 | ||||||
| Carlyle Global Market Strategies | ||||||||
| 390 | 1.53%, 07/20/2023 ■‡Δ | 389 | ||||||
| Cent CLO L.P. | ||||||||
| 500 | 1.71%, 08/01/2024 ■Δ | 498 | ||||||
| CFCRE Commercial Mortgage Trust | ||||||||
| 195 | 3.83%, 12/15/2047 ‡ | 207 | ||||||
| Chase Mortgage Finance Corp. | ||||||||
| 350 | 5.50%, 11/25/2035 ‡ | 346 | ||||||
| CHL Mortgage Pass-Through Trust | ||||||||
| 21 | 0.49%, 03/25/2035 Δ | 18 | ||||||
| CIFC Funding Ltd. | ||||||||
| 205 | 1.38%, 08/14/2024 ■‡Δ | 204 | ||||||
| 395 | 1.73%, 05/24/2026 ■‡Δ | 392 | ||||||
| Citigroup Commercial Mortgage Trust | ||||||||
| 375 | 6.34%, 12/10/2049 ‡Δ | 416 | ||||||
| Citigroup/Deutsche Bank Commercial Mortgage Trust | ||||||||
| 125 | 5.32%, 12/11/2049 ‡ | 134 | ||||||
| Commercial Mortgage Loan Trust | ||||||||
| 570 | 6.24%, 12/10/2049 ‡Δ | 618 | ||||||
| Commercial Mortgage Pass-Through Certificates | ||||||||
| 1,693 | 2.60%, 07/10/2046 ■► | 74 | ||||||
| 20 | 2.85%, 10/15/2045 ‡ | 20 | ||||||
| 280 | 3.96%, 02/10/2047 - 03/10/2047 ‡ | 296 | ||||||
| 210 | 4.02%, 07/10/2045 | 224 | ||||||
| 135 | 5.95%, 06/10/2046 Δ | 143 | ||||||
| Commercial Mortgage Trust | ||||||||
| 595 | 4.50%, 03/10/2046 ■‡Δ | 399 | ||||||
| Community or Commercial Mortgage Trust | ||||||||
| 140 | 3.21%, 03/10/2046 ‡ | 141 | ||||||
| 135 | 3.69%, 08/10/2047 ‡ | 139 | ||||||
| 260 | 4.38%, 07/10/2045 Δ | 283 | ||||||
| Countrywide Alternative Loan Trust | ||||||||
| 169 | 0.47%, 11/25/2035 ‡Δ | 136 | ||||||
| 109 | 0.65%, 12/25/2035 ‡Δ | 78 | ||||||
| 418 | 5.75%, 05/25/2036 | 356 | ||||||
| Countrywide Home Loans, Inc. | ||||||||
| 296 | 2.58%, 09/25/2047 Δ | 264 | ||||||
| 112 | 5.75%, 08/25/2037 | 107 | ||||||
| CS First Boston Mortgage Securities Corp. | ||||||||
| 170 | 4.77%, 07/15/2037 ‡ | 172 | ||||||
| 375 | 4.88%, 04/15/2037 ‡ | 378 | ||||||
| CW Capital Cobalt Ltd. | ||||||||
| 235 | 5.22%, 08/15/2048 | 249 | ||||||
| Deutsche Alt-A Securities, Inc. Mortgage | ||||||||
| 196 | 0.27%, 08/25/2036 ‡Δ | 152 | ||||||
| 100 | 0.30%, 03/25/2037 ‡Δ | 69 | ||||||
| Downey S & L Assoc Mortgage Loan Trust | ||||||||
| 146 | 1.04%, 03/19/2046 ‡Δ | 113 | ||||||
| Equity One ABS, Inc. | ||||||||
| 21 | 5.46%, 12/25/2033 ‡ | 14 | ||||||
| First Horizon Alternative Mortgage Securities | ||||||||
| 465 | 2.21%, 04/25/2036 ╦Δ | 389 | ||||||
| 487 | 2.24%, 09/25/2035 ╦Δ | 425 | ||||||
| First Horizon Mortgage Pass-Through Trust | ||||||||
| 246 | 2.56%, 08/25/2037 Δ | 203 | ||||||
| GE Capital Commercial Mortgage Corp. | ||||||||
| 190 | 5.49%, 11/10/2045 ╦Δ | 194 | ||||||
| GMAC Commercial Mortgage Securities, Inc. | ||||||||
| 167 | 5.24%, 11/10/2045 Δ | 172 | ||||||
| GMAC Mortgage Corp. Loan Trust | ||||||||
| 125 | 2.93%, 09/19/2035 Δ | 117 | ||||||
| 31 | 2.95%, 04/19/2036 ╦Δ | 28 | ||||||
| Gramercy Park CLO Ltd. | ||||||||
| 340 | 1.53%, 07/17/2023 ■Δ | 339 | ||||||
| Greenwich Capital Commercial Funding Corp. | ||||||||
| 420 | 5.74%, 12/10/2049 | 460 | ||||||
| 270 | 6.01%, 07/10/2038 ‡Δ | 286 | ||||||
| GS Mortgage Securities Trust | ||||||||
| 3,149 | 0.37%, 07/10/2046 ► | 38 | ||||||
| 632 | 1.86%, 08/10/2044 ■► | 39 | ||||||
| 100 | 3.67%, 04/10/2047 ■Δ | 69 | ||||||
| 245 | 3.68%, 04/12/2047 ‡Δ | 256 | ||||||
| 395 | 5.02%, 11/10/2045 ■‡Δ | 387 | ||||||
| 175 | 5.03%, 04/10/2047 ■Δ | 165 | ||||||
| GSAA Home Equity Trust | ||||||||
| 24 | 0.20%, 12/25/2046 ‡Δ | 16 | ||||||
| 485 | 0.23%, 02/25/2037 ‡Δ | 264 | ||||||
| 34 | 0.32%, 03/25/2047 ‡Δ | 18 | ||||||
| 184 | 0.39%, 11/25/2036 ‡Δ | 108 | ||||||
| 35 | 0.45%, 03/25/2036 Δ | 24 | ||||||
| 196 | 0.47%, 04/25/2047 ‡Δ | 126 | ||||||
| 403 | 5.98%, 06/25/2036 ‡ | 237 | ||||||
| GSAMP Trust | ||||||||
| 176 | 0.24%, 01/25/2037 ‡Δ | 105 | ||||||
| GSR Mortgage Loan Trust | ||||||||
| 115 | 2.67%, 10/25/2035 Δ | 102 | ||||||
| 481 | 2.74%, 01/25/2036 Δ | 445 | ||||||
The accompanying notes are an integral part of these financial statements.
| 5 |
| The Hartford Unconstrained Bond Fund |
| Schedule of Investments – (continued) |
| October 31, 2014 |
| (000’s Omitted) |
| Shares or Principal Amount ╬ | Market Value ╪ | |||||||
Asset and Commercial Mortgage Backed Securities - 28.0% - (continued) | ||||||||
| Finance and Insurance - 28.0% - (continued) | ||||||||
| GSR Mortgage Loan Trust - (continued) | ||||||||
| $ | 404 | 2.78%, 04/25/2035 ‡Δ | $ | 392 | ||||
| Harborview Mortgage Loan Trust | ||||||||
| 234 | 0.35%, 01/19/2038 ‡Δ | 197 | ||||||
| 332 | 0.38%, 05/19/2047 ‡Δ | 130 | ||||||
| 990 | 0.40%, 12/19/2036 ‡Δ | 700 | ||||||
| 210 | 0.49%, 09/19/2035 ‡Δ | 162 | ||||||
| 14 | 0.51%, 01/19/2035 Δ | 10 | ||||||
| 405 | 2.74%, 01/19/2035 ‡Δ | 390 | ||||||
| Hilton USA Trust | ||||||||
| 100 | 2.91%, 11/05/2030 ■‡Δ | 100 | ||||||
| 315 | 3.91%, 11/05/2030 ■‡Δ | 315 | ||||||
| Home Equity Loan Trust | ||||||||
| 162 | 2.45%, 11/25/2035 ‡Δ | 152 | ||||||
| IndyMac Index Mortgage Loan Trust | ||||||||
| 5 | 0.39%, 07/25/2035 Δ | 4 | ||||||
| 127 | 0.43%, 07/25/2035 ‡Δ | 108 | ||||||
| 82 | 0.44%, 01/25/2036 ‡Δ | 57 | ||||||
| 471 | 0.55%, 07/25/2046 ‡Δ | 231 | ||||||
| JP Morgan Chase Commercial Mortgage Securities Corp. | ||||||||
| 466 | 1.65%, 02/12/2051 ‡Δ | 467 | ||||||
| 105 | 2.75%, 10/15/2045 ■ | 80 | ||||||
| 200 | 2.83%, 10/15/2045 | 198 | ||||||
| 111 | 4.57%, 12/15/2047 ■‡Δ | 94 | ||||||
| 100 | 4.82%, 10/15/2045 ■Δ | 99 | ||||||
| 300 | 5.40%, 12/15/2044 ‡Δ | 308 | ||||||
| 194 | 5.72%, 02/15/2051 ‡ | 212 | ||||||
| 490 | 5.89%, 02/12/2049 ‡Δ | 533 | ||||||
| 195 | 6.06%, 04/15/2045 ‡Δ | 206 | ||||||
| JP Morgan Mortgage Trust | ||||||||
| 111 | 2.54%, 09/25/2035 Δ | 106 | ||||||
| 136 | 2.55%, 04/25/2037 ‡Δ | 122 | ||||||
| 466 | 2.71%, 05/25/2036 ‡Δ | 422 | ||||||
| JPMBB Commercial Mortgage Securities Trust | ||||||||
| 1,779 | 0.89%, 09/15/2047 ► | 94 | ||||||
| LB-UBS Commercial Mortgage Trust | ||||||||
| 263 | 5.43%, 02/15/2040 | 285 | ||||||
| 367 | 5.86%, 07/15/2040 ‡ | 389 | ||||||
| 139 | 5.87%, 09/15/2045 | 154 | ||||||
| 60 | 6.32%, 04/15/2041 ‡Δ | 67 | ||||||
| Lehman XS Trust | ||||||||
| 122 | 0.36%, 07/25/2046 ‡Δ | 96 | ||||||
| Long Beach Asset Holdings Corp. | ||||||||
| 45 | 0.00%, 04/25/2046 ■● | — | ||||||
| Luminent Mortgage Trust | ||||||||
| 91 | 0.35%, 02/25/2046 ‡Δ | 67 | ||||||
| 40 | 0.39%, 04/25/2036 Δ | 26 | ||||||
| Magnetite CLO Ltd. | ||||||||
| 480 | 1.70%, 07/25/2026 ■Δ | 476 | ||||||
| Merrill Lynch Mortgage Investors Trust | ||||||||
| 106 | 2.52%, 07/25/2035 ‡Δ | 88 | ||||||
| 100 | 5.14%, 07/12/2038 ‡ | 103 | ||||||
| Merrill Lynch/Countrywide Commercial Mortgage Trust | ||||||||
| 285 | 5.38%, 08/12/2048 ‡ | 305 | ||||||
| 130 | 5.42%, 08/12/2048 ‡ | 137 | ||||||
| Morgan Stanley ABS Capital I | ||||||||
| 274 | 0.30%, 06/25/2036 ‡Δ | 210 | ||||||
| Morgan Stanley BAML Trust | ||||||||
| 115 | 3.74%, 08/15/2047 ‡ | 119 | ||||||
| 105 | 4.50%, 08/15/2045 ■‡ | 80 | ||||||
| Morgan Stanley Capital I | ||||||||
| 237 | 4.99%, 08/13/2042 | 239 | ||||||
| 88 | 5.38%, 11/14/2042 ‡Δ | 90 | ||||||
| 50 | 5.55%, 10/12/2052 ■‡Δ | 51 | ||||||
| 273 | 5.69%, 04/15/2049 ‡Δ | 297 | ||||||
| Morgan Stanley Capital Investments | ||||||||
| 154 | 5.81%, 12/12/2049 | 169 | ||||||
| Morgan Stanley Mortgage Loan Trust | ||||||||
| 548 | 0.32%, 05/25/2036 - 11/25/2036 ‡Δ | 259 | ||||||
| 88 | 2.59%, 05/25/2036 Δ | 64 | ||||||
| Morgan Stanley Re-Remic Trust | ||||||||
| 311 | 5.99%, 08/12/2045 ■‡Δ | 338 | ||||||
| Nationstar Home Equity Loan Trust | ||||||||
| 22 | 0.00%, 03/25/2037 ■●† | — | ||||||
| Neuberger Berman CLO XVII Ltd. | ||||||||
| 400 | 1.70%, 08/04/2025 ■Δ | 397 | ||||||
| RBSGC Mortage Pass Through Certificates | ||||||||
| 135 | 6.25%, 01/25/2037 | 127 | ||||||
| Residential Accredit Loans, Inc. | ||||||||
| 61 | 0.92%, 09/25/2046 ‡Δ | 41 | ||||||
| 553 | 1.41%, 11/25/2037 ‡Δ | 352 | ||||||
| Residential Asset Securitization Trust | ||||||||
| 90 | 0.60%, 03/25/2035 Δ | 70 | ||||||
| Residential Funding Mortgage Securities, Inc. | ||||||||
| 14 | 3.05%, 04/25/2037 ‡Δ | 12 | ||||||
| Securitized Asset Backed Receivables LLC | ||||||||
| 287 | 0.24%, 07/25/2036 ‡Δ | 138 | ||||||
| Sequoia Mortgage Trust | ||||||||
| 97 | 2.52%, 07/20/2037 Δ | 79 | ||||||
| Soundview Home Equity Loan Trust, Inc. | ||||||||
| 685 | 0.39%, 07/25/2036 ‡Δ | 399 | ||||||
| SpringCastle America Funding LLC | ||||||||
| 420 | 2.70%, 05/25/2023 ■ | 420 | ||||||
| Springleaf Mortgage Loan Trust | ||||||||
| 240 | 3.52%, 12/25/2065 ■ | 245 | ||||||
| Structured Adjustable Rate Mortgage Loan Trust | ||||||||
| 627 | 2.48%, 02/25/2036 Δ | 501 | ||||||
| Structured Asset Mortgage Investments, Inc. | ||||||||
| 393 | 0.38%, 02/25/2036 ‡Δ | 320 | ||||||
| Symphony CLO XV Ltd. | ||||||||
| 395 | 1.65%, 10/17/2026 ■☼Δ | 392 | ||||||
| UBS-Barclays Commercial Mortgage Trust | ||||||||
| 230 | 2.97%, 04/10/2046 ‡ | 228 | ||||||
| 70 | 3.18%, 03/10/2046 ‡Δ | 70 | ||||||
| 65 | 4.23%, 03/10/2046 ■‡Δ | 54 | ||||||
| VNO Mortgage Trust | ||||||||
| 160 | 4.08%, 12/13/2029 ■Δ | 161 | ||||||
| Wachovia Bank Commercial Mortgage Trust | ||||||||
| 95 | 4.94%, 04/15/2042 ‡ | 96 | ||||||
| 125 | 5.55%, 03/15/2042 ■‡Δ | 125 | ||||||
| Wells Fargo Alternative Loan Trust | ||||||||
| 56 | 2.60%, 12/28/2037 Δ | 45 | ||||||
| Wells Fargo Commercial Mortgage Trust | ||||||||
| 199 | 2.92%, 10/15/2045 ‡ | 198 | ||||||
| Wells Fargo Mortgage Backed Securities Trust | ||||||||
| 237 | 2.61%, 04/25/2036 Δ | 231 | ||||||
The accompanying notes are an integral part of these financial statements.
| 6 |
| The Hartford Unconstrained Bond Fund |
| Schedule of Investments – (continued) |
| October 31, 2014 |
| (000’s Omitted) |
| Shares or Principal Amount ╬ | Market Value ╪ | |||||||
Asset and Commercial Mortgage Backed Securities - 28.0% - (continued) | ||||||||
| Finance and Insurance - 28.0% - (continued) | ||||||||
| WF-RBS Commercial Mortgage Trust | ||||||||
| $ | 4,733 | 2.17%, 11/15/2044 ■► | $ | 435 | ||||
| 140 | 2.92%, 08/15/2047 ‡ | 144 | ||||||
| 25 | 4.90%, 06/15/2044 ■‡ | 28 | ||||||
| 375 | 4.96%, 11/15/2045 ■‡Δ | 329 | ||||||
| 100 | 5.00%, 06/15/2044 - 04/15/2045 ■‡ | 84 | ||||||
| 65 | 5.75%, 04/15/2045 ■‡Δ | 69 | ||||||
| 31,719 | ||||||||
| Total Asset and Commercial Mortgage Backed Securities | ||||||||
| (Cost $30,661) | $ | 31,719 | ||||||
Corporate Bonds - 17.5% | ||||||||
| Administrative, Support, Waste Management and Remediation Services - 0.2% | ||||||||
| ADT (The) Corp. | ||||||||
| $ | 155 | 6.25%, 10/15/2021 ‡ | $ | 163 | ||||
| Clean Harbors, Inc. | ||||||||
| 95 | 5.25%, 08/01/2020 ‡ | 97 | ||||||
| 260 | ||||||||
| Apparel Manufacturing - 0.1% | ||||||||
| Hanesbrands, Inc. | ||||||||
| 90 | 6.38%, 12/15/2020 ‡ | 95 | ||||||
| Arts, Entertainment and Recreation - 0.3% | ||||||||
| CCO Holdings LLC | ||||||||
| 100 | 5.25%, 09/30/2022 ‡ | 101 | ||||||
| 10 | 5.75%, 09/01/2023 ‡ | 10 | ||||||
| Gannett Co., Inc. | ||||||||
| 135 | 5.13%, 10/15/2019 - 07/15/2020 ╦ | 140 | ||||||
| NCR Corp. | ||||||||
| 80 | 4.63%, 02/15/2021 ‡ | 79 | ||||||
| 5 | 5.00%, 07/15/2022 ‡ | 5 | ||||||
| 335 | ||||||||
| Chemical Manufacturing - 0.2% | ||||||||
| Eagle Spinco, Inc. | ||||||||
| 75 | 4.63%, 02/15/2021 | 73 | ||||||
| NOVA Chemicals Corp. | ||||||||
| 100 | 5.00%, 05/01/2025 ■‡ | 103 | ||||||
| 176 | ||||||||
| Construction - 0.1% | ||||||||
| Lennar Corp. | ||||||||
| 75 | 4.50%, 06/15/2019 ‡ | 76 | ||||||
| Ryland Group, Inc. | ||||||||
| 42 | 5.38%, 10/01/2022 | 41 | ||||||
| 117 | ||||||||
| Electrical Equipment, Appliance Manufacturing - 0.0% | ||||||||
| Sensata Technologies B.V. | ||||||||
| 5 | 5.63%, 11/01/2024 ■ | 5 | ||||||
| Finance and Insurance - 9.4% | ||||||||
| AXA S.A. | ||||||||
| 295 | 6.46%, 12/14/2018 ■‡♠Δ | 308 | ||||||
| Banco Bilbao Vizcaya Argentaria S.A. | ||||||||
| EUR | 600 | 7.00%, 12/29/2049 § | 771 | |||||
| 400 | 9.00%, 05/09/2018 §♠ | 433 | ||||||
| Banco do Brasil | ||||||||
| 245 | 6.25%, 04/15/2024 §♠ | 192 | ||||||
| Banco Santander S.A. | ||||||||
| EUR | 900 | 6.25%, 03/12/2049 ╦§ | 1,104 | |||||
| Bank of Ireland | ||||||||
| EUR | 100 | 10.00%, 07/30/2016 § | 135 | |||||
| Barclays Bank plc | ||||||||
| 200 | 7.75%, 04/10/2023 | 219 | ||||||
| EUR | 200 | 8.00%, 12/15/2049 | 260 | |||||
| 200 | 8.25%, 12/15/2018 ♠β | 207 | ||||||
| CIT Group, Inc. | ||||||||
| 80 | 5.25%, 03/15/2018 ‡ | 84 | ||||||
| 104 | 5.50%, 02/15/2019 ■‡ | 111 | ||||||
| Citigroup, Inc. | ||||||||
| 190 | 6.68%, 09/13/2043 ‡ | 242 | ||||||
| Credit Agricole S.A. | ||||||||
| EUR | 225 | 6.50%, 06/23/2049 § | 287 | |||||
| 200 | 8.13%, 09/19/2033 ■ | 226 | ||||||
| Credit Suisse Group AG | ||||||||
| EUR | 200 | 5.75%, 09/18/2025 § | 279 | |||||
| 100 | 7.88%, 02/24/2041 § | 107 | ||||||
| Development Bank of Kazakhstan JSC | ||||||||
| 200 | 4.13%, 12/10/2022 § | 189 | ||||||
| HSBC Holdings plc | ||||||||
| 375 | 5.63%, 01/17/2020 ‡♠ | 381 | ||||||
| JP Morgan Chase & Co. | ||||||||
| 720 | 5.63%, 08/16/2043 ‡ | 822 | ||||||
| KBC Groep N.V. | ||||||||
| EUR | 125 | 5.63%, 03/19/2019 §♠ | 154 | |||||
| Lloyds Banking Group plc | ||||||||
| EUR | 375 | 6.38%, 06/27/2049 § | 485 | |||||
| GBP | 200 | 7.00%, 12/29/2049 § | 320 | |||||
| Mapfre S.A. | ||||||||
| EUR | 300 | 5.92%, 07/24/2037 | 399 | |||||
| Nationwide Building Society | ||||||||
| GBP | 350 | 6.88%, 03/11/2049 § | 547 | |||||
| Navient Corp. | ||||||||
| 150 | 5.50%, 01/15/2019 ‡ | 155 | ||||||
| 95 | 8.45%, 06/15/2018 ‡ | 109 | ||||||
| Royal Bank of Scotland Group plc | ||||||||
| 80 | 6.13%, 12/15/2022 ‡ | 87 | ||||||
| SBA Tower Trust | ||||||||
| 310 | 3.60%, 04/15/2043 ■‡ | 312 | ||||||
| Societe Generale | ||||||||
| 200 | 6.00%, 01/27/2020 ■‡♠ | 188 | ||||||
| EUR | 275 | 6.75%, 04/07/2049 § | 346 | |||||
| 475 | 8.25%, 11/29/2018 ╦§♠ | 502 | ||||||
| SoftBank Corp. | ||||||||
| 200 | 4.50%, 04/15/2020 ■‡ | 202 | ||||||
| UniCredit S.p.A. | ||||||||
| 200 | 8.00%, 06/03/2024 §♠ | 201 | ||||||
| Wtfrd on Piedmnt | ||||||||
| 275 | 3.30%, 11/01/2026 ☼Δ | 282 | ||||||
| 10,646 | ||||||||
| Food Manufacturing - 0.6% | ||||||||
| ESAL GmbH | ||||||||
| 225 | 6.25%, 02/05/2023 § | 230 | ||||||
| Grupo Bimbo S.A.B. de C.V. | ||||||||
| 445 | 4.88%, 06/27/2044 ■ | 436 | ||||||
| 666 | ||||||||
The accompanying notes are an integral part of these financial statements.
| 7 |
| The Hartford Unconstrained Bond Fund |
| Schedule of Investments – (continued) |
| October 31, 2014 |
| (000’s Omitted) |
| Shares or Principal Amount ╬ | Market Value ╪ | |||||||
Corporate Bonds - 17.5% - (continued) | ||||||||
| Health Care and Social Assistance - 0.4% | ||||||||
| Community Health Systems, Inc. | ||||||||
| $ | 60 | 5.13%, 08/01/2021 ‡ | $ | 63 | ||||
| HCA, Inc. | ||||||||
| 185 | 6.50%, 02/15/2020 ‡ | 206 | ||||||
| Tenet Healthcare Corp. | ||||||||
| 145 | 6.00%, 10/01/2020 ‡ | 156 | ||||||
| Wellcare Health Plans, Inc. | ||||||||
| 20 | 5.75%, 11/15/2020 ‡ | 21 | ||||||
| 446 | ||||||||
| Information - 2.1% | ||||||||
| Activision Blizzard, Inc. | ||||||||
| 140 | 5.63%, 09/15/2021 ■‡ | 149 | ||||||
| Audatex North America, Inc. | ||||||||
| 95 | 6.00%, 06/15/2021 ■‡ | 101 | ||||||
| DISH DBS Corp. | ||||||||
| 121 | 5.88%, 07/15/2022 ‡ | 128 | ||||||
| 70 | 6.75%, 06/01/2021 ‡ | 78 | ||||||
| MetroPCS Wireless, Inc. | ||||||||
| 125 | 6.63%, 11/15/2020 ‡ | 132 | ||||||
| MTS International Funding Ltd. | ||||||||
| 240 | 5.00%, 05/30/2023 ■‡ | 215 | ||||||
| Rogers Communications, Inc. | ||||||||
| 475 | 8.75%, 05/01/2032 ‡ | 680 | ||||||
| Sprint Communications, Inc. | ||||||||
| 147 | 7.00%, 03/01/2020 ■‡ | 164 | ||||||
| 53 | 9.00%, 11/15/2018 ■‡ | 62 | ||||||
| Sprint Corp. | ||||||||
| 75 | 7.13%, 06/15/2024 ■ | 77 | ||||||
| T-Mobile USA, Inc. | ||||||||
| 125 | 6.46%, 04/28/2019 ‡ | 130 | ||||||
| 100 | 6.84%, 04/28/2023 ‡ | 106 | ||||||
| Videotron Ltd. | ||||||||
| 125 | 5.38%, 06/15/2024 ■ | 129 | ||||||
| VimpelCom Holdings B.V. | ||||||||
| 285 | 5.95%, 02/13/2023 ■‡ | 262 | ||||||
| 2,413 | ||||||||
| Machinery Manufacturing - 0.1% | ||||||||
| Case New Holland Industrial, Inc. | ||||||||
| 100 | 7.88%, 12/01/2017 ‡ | 112 | ||||||
| Mining - 0.6% | ||||||||
| ABJA Investment Co. Pte Ltd. | ||||||||
| 420 | 5.95%, 07/31/2024 § | 427 | ||||||
| FMG Resources Aug 2006 | ||||||||
| 90 | 6.88%, 04/01/2022 ■╦ | 93 | ||||||
| Peabody Energy Corp. | ||||||||
| 15 | 6.00%, 11/15/2018 | 14 | ||||||
| 90 | 6.50%, 09/15/2020 ‡ | 86 | ||||||
| Steel Dynamics, Inc. | ||||||||
| 15 | 5.13%, 10/01/2021 ■ | 16 | ||||||
| 20 | 5.50%, 10/01/2024 ■ | 21 | ||||||
| 657 | ||||||||
| Miscellaneous Manufacturing - 0.0% | ||||||||
| Triumph Group, Inc. | ||||||||
| 50 | 5.25%, 06/01/2022 | 51 | ||||||
| Motor Vehicle and Parts Manufacturing - 0.1% | ||||||||
| General Motors Co. | ||||||||
| 90 | 6.25%, 10/02/2043 ╦ | 107 | ||||||
| Nonmetallic Mineral Product Manufacturing - 0.2% | ||||||||
| Grupo Cementos Chihuahua | ||||||||
| 260 | 8.13%, 02/08/2020 ■ | 284 | ||||||
| Other Services - 0.0% | ||||||||
| Cardtronics, Inc. | ||||||||
| 50 | 5.13%, 08/01/2022 ■ | 50 | ||||||
| Paper Manufacturing - 0.1% | ||||||||
| Clearwater Paper Corp. | ||||||||
| 50 | 5.38%, 02/01/2025 ■ | 51 | ||||||
| Graphic Packaging International | ||||||||
| 70 | 4.88%, 11/15/2022 ☼ | 70 | ||||||
| 121 | ||||||||
| Petroleum and Coal Products Manufacturing - 0.9% | ||||||||
| California Resources Corp. | ||||||||
| 10 | 5.00%, 01/15/2020 ■ | 10 | ||||||
| 20 | 5.50%, 09/15/2021 ■ | 21 | ||||||
| 15 | 6.00%, 11/15/2024 ■ | 15 | ||||||
| Concho Resources, Inc. | ||||||||
| 25 | 6.50%, 01/15/2022 | 27 | ||||||
| Denbury Resources, Inc. | ||||||||
| 95 | 5.50%, 05/01/2022 ‡ | 94 | ||||||
| EDC Finance Ltd. | ||||||||
| 250 | 4.88%, 04/17/2020 ■ | 226 | ||||||
| Harvest Operations Corp. | ||||||||
| 21 | 6.88%, 10/01/2017 ‡ | 21 | ||||||
| MEG Energy Corp. | ||||||||
| 75 | 7.00%, 03/31/2024 ■ | 75 | ||||||
| Pertamina Persero PT | ||||||||
| 250 | 5.63%, 05/20/2043 § | 239 | ||||||
| Tesoro Corp. | ||||||||
| 75 | 5.13%, 04/01/2024 ‡ | 75 | ||||||
| Tesoro Logistics L.P. | ||||||||
| 45 | 5.50%, 10/15/2019 ■ | 46 | ||||||
| 65 | 6.25%, 10/15/2022 ■ | 68 | ||||||
| WPX Energy, Inc. | ||||||||
| 35 | 5.25%, 09/15/2024 ☼ | 34 | ||||||
| 60 | 6.00%, 01/15/2022 ‡ | 63 | ||||||
| 1,014 | ||||||||
| Pipeline Transportation - 0.9% | ||||||||
| El Paso Corp. | ||||||||
| 65 | 7.00%, 06/15/2017 ‡ | 72 | ||||||
| 45 | 7.80%, 08/01/2031 ‡ | 56 | ||||||
| Energy Transfer Equity L.P. | ||||||||
| 650 | 5.95%, 10/01/2043 ‡ | 718 | ||||||
| 130 | 7.50%, 10/15/2020 ‡ | 150 | ||||||
| Kinder Morgan Finance Co. | ||||||||
| 5 | 6.00%, 01/15/2018 ■‡ | 5 | ||||||
| Southern Star Central Corp. | ||||||||
| 15 | 5.13%, 07/15/2022 ■‡ | 15 | ||||||
| 1,016 | ||||||||
| Primary Metal Manufacturing - 0.1% | ||||||||
| ArcelorMittal | ||||||||
| 90 | 5.75%, 08/05/2020 ‡ | 96 | ||||||
| United States Steel Corp. | ||||||||
| 35 | 7.38%, 04/01/2020 | 39 | ||||||
| 135 | ||||||||
The accompanying notes are an integral part of these financial statements.
| 8 |
| The Hartford Unconstrained Bond Fund |
| Schedule of Investments – (continued) |
| October 31, 2014 |
| (000’s Omitted) |
| Shares or Principal Amount ╬ | Market Value ╪ | |||||||
Corporate Bonds - 17.5% - (continued) | ||||||||
| Real Estate, Rental and Leasing - 0.1% | ||||||||
| International Lease Finance Corp. | ||||||||
| $ | 140 | 5.88%, 04/01/2019 ‡ | $ | 151 | ||||
| Retail Trade - 0.6% | ||||||||
| Arcelik AS | ||||||||
| 230 | 5.00%, 04/03/2023 ■ | 217 | ||||||
| Building Materials Corp. | ||||||||
| 45 | 5.38%, 11/15/2024 ■☼ | 45 | ||||||
| 75 | 6.75%, 05/01/2021 ■‡ | 80 | ||||||
| 15 | 7.50%, 03/15/2020 ■‡ | 16 | ||||||
| Group 1 Automotive, Inc. | ||||||||
| 45 | 5.00%, 06/01/2022 ■ | 45 | ||||||
| Sotheby's | ||||||||
| 100 | 5.25%, 10/01/2022 ■‡ | 98 | ||||||
| William Carter Co. | ||||||||
| 170 | 5.25%, 08/15/2021 ‡ | 175 | ||||||
| 676 | ||||||||
| Transportation Equipment Manufacturing - 0.1% | ||||||||
| Huntington Ingalls Industries, Inc. | ||||||||
| 65 | 7.13%, 03/15/2021 ‡ | 70 | ||||||
| Utilities - 0.3% | ||||||||
| AES (The) Corp. | ||||||||
| 190 | 8.00%, 06/01/2020 ‡ | 221 | ||||||
| NRG Energy, Inc. | ||||||||
| 75 | 6.25%, 07/15/2022 | 78 | ||||||
| 299 | ||||||||
| Total Corporate Bonds | ||||||||
| (Cost $19,953) | $ | 19,902 | ||||||
Foreign Government Obligations - 3.7% | ||||||||
| Angola - 0.2% | ||||||||
| Angola (Republic of) | ||||||||
| $ | 250 | 7.00%, 08/16/2019 § | $ | 267 | ||||
| Armenia - 0.2% | ||||||||
| Armenia (Republic of) | ||||||||
| 200 | 6.00%, 09/30/2020 § | 209 | ||||||
| Azerbaijan - 0.3% | ||||||||
| Azerbaijan (Republic of) | ||||||||
| 350 | 4.75%, 03/13/2023 § | 348 | ||||||
| Brazil - 0.5% | ||||||||
| Brazil (Republic of) | ||||||||
| BRL | 2,080 | 9.70%, 09/01/2020 ○ | 539 | |||||
| Costa Rica - 0.2% | ||||||||
| Costa Rica (Republic of) | ||||||||
| 250 | 5.63%, 04/30/2043 § | 219 | ||||||
| Dominican Republic - 0.2% | ||||||||
| Dominican (Republic of) | ||||||||
| DOP | 10,000 | 11.50%, 05/10/2024 ■ | 233 | |||||
| Indonesia - 0.3% | ||||||||
| Indonesia (Republic of) | ||||||||
| IDR | 4,000,000 | 8.38%, 03/15/2024 ╦ | 338 | |||||
| Mexico - 0.3% | ||||||||
| Mexico (United Mexican States) | ||||||||
| MXN | 4,073 | 4.00%, 06/13/2019 ◄‡ | 334 | |||||
| Nigeria - 0.4% | ||||||||
| Nigeria (Federal Republic of) | ||||||||
| NGN | 5,900 | 16.00%, 06/29/2019 | 40 | |||||
| Nigeria (Republic of) | ||||||||
| NGN | 60,000 | 13.05%, 08/16/2016 | 367 | |||||
| 407 | ||||||||
| Russia - 0.2% | ||||||||
| Russia (Federation of) | ||||||||
| RUB | 13,125 | 7.50%, 02/27/2019 ‡Δ | 280 | |||||
| South Africa - 0.4% | ||||||||
| South Africa (Republic of) | ||||||||
| ZAR | 5,000 | 7.75%, 02/28/2023 | 455 | |||||
| Uruguay - 0.3% | ||||||||
| Uruguay (Republic of) | ||||||||
| UYU | 7,468 | 4.25%, 04/05/2027 ◄‡ | 331 | |||||
| Venezuela - 0.2% | ||||||||
| Venezuela (Republic of) | ||||||||
| 400 | 7.00%, 03/31/2038 § | 230 | ||||||
| Total Foreign Government Obligations | ||||||||
| (Cost $4,332) | $ | 4,190 | ||||||
Municipal Bonds - 0.8% | ||||||||
| Higher Education (Univ., Dorms, etc.) - 0.2% | ||||||||
| University of California | ||||||||
| $ | 190 | 4.60%, 05/15/2031 ‡ | $ | 206 | ||||
| Miscellaneous - 0.6% | ||||||||
| Puerto Rico Government Employees Retirement System | ||||||||
| 330 | 6.15%, 07/01/2038 ‡ | 163 | ||||||
| 350 | 6.20%, 07/01/2039 ‡ | 173 | ||||||
| 530 | 6.30%, 07/01/2043 ‡ | 260 | ||||||
| 120 | 6.55%, 07/01/2058 ‡ | 59 | ||||||
| 655 | ||||||||
| Total Municipal Bonds | ||||||||
| (Cost $917) | $ | 861 | ||||||
Senior Floating Rate Interests ♦ - 17.6% | ||||||||
| Administrative, Support, Waste Management and Remediation Services - 0.3% | ||||||||
| Acosta Holdco, Inc. | ||||||||
| $ | 130 | 5.00%, 09/26/2021 | $ | 130 | ||||
| PRA Holdings, Inc. | ||||||||
| 198 | 4.50%, 09/23/2020 ╦ | 196 | ||||||
| 326 | ||||||||
| Agriculture, Construction, Mining and Machinery - 0.2% | ||||||||
| Signode Industrial Group US, Inc. | ||||||||
| 185 | 4.00%, 05/01/2021 | 181 | ||||||
The accompanying notes are an integral part of these financial statements.
| 9 |
| The Hartford Unconstrained Bond Fund |
| Schedule of Investments – (continued) |
| October 31, 2014 |
| (000’s Omitted) |
| Shares or Principal Amount ╬ | Market Value ╪ | |||||||
Senior Floating Rate Interests ♦ - 17.6% - (continued) | ||||||||
| Air Transportation - 0.2% | ||||||||
| Delta Air Lines, Inc., Term Loan | ||||||||
| $ | 217 | 3.25%, 04/20/2017 ╦ | $ | 215 | ||||
| Arts, Entertainment and Recreation - 2.1% | ||||||||
| 24 Hour Fitness Worldwide, Inc. | ||||||||
| 115 | 4.75%, 05/28/2021 | 114 | ||||||
| Aristocrat Leisure Ltd. | ||||||||
| 135 | 4.75%, 10/20/2021 | 134 | ||||||
| Caesars Entertainment Operating Co., Inc. | ||||||||
| 131 | 5.99%, 03/01/2017 | 116 | ||||||
| 356 | 6.99%, 03/01/2017 | 319 | ||||||
| Caesars Growth Property Holdings LLC | ||||||||
| 100 | 6.25%, 05/08/2021 | 94 | ||||||
| Formula One Holdings | ||||||||
| 200 | 4.75%, 07/30/2021 | 198 | ||||||
| 130 | 7.75%, 07/29/2022 | 130 | ||||||
| ION Media Networks, Inc. | ||||||||
| 99 | 5.00%, 12/18/2020 ╦ | 99 | ||||||
| Numericable | ||||||||
| 300 | 4.50%, 05/21/2020 | 300 | ||||||
| Salem Communications Corp. | ||||||||
| 199 | 4.50%, 03/13/2020 ╦ | 196 | ||||||
| Scientific Games International, Inc. | ||||||||
| 135 | 6.00%, 10/01/2021 | 132 | ||||||
| Templar Energy | ||||||||
| 100 | 8.50%, 11/25/2020 | 90 | ||||||
| Tribune Co. | ||||||||
| 200 | 4.00%, 12/27/2020 ☼ | 198 | ||||||
| Univision Communications, Inc. | ||||||||
| 300 | 4.00%, 03/01/2020 ╦ | 297 | ||||||
| 2,417 | ||||||||
| Chemical Manufacturing - 0.8% | ||||||||
| Arysta LifeScience Corp. | ||||||||
| 123 | 4.50%, 05/29/2020 ╦ | 123 | ||||||
| Cytec Industries, Inc. | ||||||||
| 39 | 4.50%, 10/03/2019 | 39 | ||||||
| Ineos US Finance LLC | ||||||||
| 214 | 3.75%, 05/04/2018 ╦ | 211 | ||||||
| Minerals Technologies, Inc. | ||||||||
| 142 | 4.00%, 05/07/2021 | 141 | ||||||
| Monarch, Inc. | ||||||||
| 75 | 4.50%, 10/03/2019 | 74 | ||||||
| Pinnacle Operating Corp. | ||||||||
| 172 | 4.75%, 11/15/2018 ╦ | 170 | ||||||
| PQ Corp. | ||||||||
| 201 | 4.00%, 08/07/2017 | 199 | ||||||
| 957 | ||||||||
| Computer and Electronic Product Manufacturing - 1.1% | ||||||||
| Avago Technologies Ltd. | ||||||||
| 200 | 3.75%, 05/06/2021 | 199 | ||||||
| CDW LLC | ||||||||
| 342 | 3.25%, 04/29/2020 ╦ | 334 | ||||||
| Ceridian LLC | ||||||||
| 118 | 4.12%, 05/09/2017 | 118 | ||||||
| 123 | 4.50%, 05/09/2017 | 122 | ||||||
| Freescale Semiconductor, Inc. | ||||||||
| 493 | 4.25%, 02/28/2020 ╦ | 485 | ||||||
| 1,258 | ||||||||
| Finance and Insurance - 1.5% | ||||||||
| Asurion LLC | ||||||||
| 241 | 5.00%, 05/24/2019 ╦ | 242 | ||||||
| 205 | 8.50%, 03/03/2021 ╦ | 208 | ||||||
| Cooper Gay Swett & Crawford Ltd. | ||||||||
| 99 | 5.00%, 04/16/2020 | 89 | ||||||
| Evertec LLC | ||||||||
| 109 | 3.50%, 04/17/2020 ╦ | 107 | ||||||
| Interactive Data Corp. | ||||||||
| 115 | 4.75%, 05/02/2021 | 115 | ||||||
| ION Trading Technologies Ltd. | ||||||||
| 150 | 7.25%, 06/10/2022 | 147 | ||||||
| National Financial Partners Corp. | ||||||||
| 99 | 4.50%, 07/01/2020 | 98 | ||||||
| Sedgwick CMS Holdings, Inc. | ||||||||
| 423 | 3.75%, 03/01/2021 ╦ | 410 | ||||||
| 140 | 6.75%, 02/28/2022 ╦ | 136 | ||||||
| Walter Investment Management Corp. | ||||||||
| 159 | 4.75%, 12/18/2020 | 149 | ||||||
| 1,701 | ||||||||
| Food Manufacturing - 0.6% | ||||||||
| Burger King Co. | ||||||||
| 100 | 4.50%, 10/27/2021 | 100 | ||||||
| H.J. Heinz Co. | ||||||||
| 418 | 3.50%, 06/05/2020 ╦ | 415 | ||||||
| U.S. Foodservice, Inc. | ||||||||
| 222 | 4.50%, 03/31/2019 ╦ | 221 | ||||||
| 736 | ||||||||
| Health Care and Social Assistance - 1.1% | ||||||||
| Alkermes, Inc. | ||||||||
| 98 | 3.50%, 09/25/2019 ╦ | 96 | ||||||
| American Renal Holdings, Inc. | ||||||||
| 105 | 8.50%, 03/20/2020 ╦ | 103 | ||||||
| Catalent Pharma Solutions, Inc. | ||||||||
| 122 | 4.50%, 05/20/2021 | 122 | ||||||
| Community Health Systems, Inc. | ||||||||
| 149 | 4.25%, 01/27/2021 ╦ | 149 | ||||||
| DaVita HealthCare Partners, Inc. | ||||||||
| 120 | 3.50%, 06/24/2021 | 118 | ||||||
| Ortho-Clinical Diagnostics, Inc. | ||||||||
| 140 | 4.75%, 06/30/2021 | 138 | ||||||
| Salix Pharmaceuticals Ltd. | ||||||||
| 135 | 4.25%, 01/02/2020 ╦ | 135 | ||||||
| Truven Health Analytics, Inc. | ||||||||
| 98 | 4.50%, 06/06/2019 ╦ | 96 | ||||||
| US Renal Care, Inc. | ||||||||
| 196 | 4.25%, 07/03/2019 ╦ | 195 | ||||||
| 135 | 10.25%, 01/03/2020 ╦ | 135 | ||||||
| 1,287 | ||||||||
| Health Care Providers and Services - 0.1% | ||||||||
| Medpace Holdings, Inc. | ||||||||
| 129 | 4.75%, 04/01/2021 | 128 | ||||||
| Information - 2.9% | ||||||||
| Cabovisao-Televisao Por Cabo S.A. | ||||||||
| 159 | 5.50%, 07/02/2019 | 160 | ||||||
| Charter Communications Operating LLC | ||||||||
| 100 | 4.25%, 09/10/2021 | 101 | ||||||
| Eagle Parent, Inc. | ||||||||
| 236 | 4.00%, 05/16/2018 ╦ | 234 | ||||||
The accompanying notes are an integral part of these financial statements.
| 10 |
| The Hartford Unconstrained Bond Fund |
| Schedule of Investments – (continued) |
| October 31, 2014 |
| (000’s Omitted) |
| Shares or Principal Amount ╬ | Market Value ╪ | |||||||
Senior Floating Rate Interests ♦ - 17.6% - (continued) | ||||||||
| Information - 2.9% - (continued) | ||||||||
| First Data Corp. | ||||||||
| $ | 750 | 3.65%, 03/23/2018 | $ | 742 | ||||
| Intelsat Jackson Holdings S.A. | ||||||||
| 191 | 3.75%, 06/30/2019 ╦ | 190 | ||||||
| Kronos, Inc. | ||||||||
| 447 | 4.50%, 10/30/2019 ╦ | 444 | ||||||
| 130 | 9.75%, 04/30/2020 ╦ | 133 | ||||||
| La Quinta Intermediate Holdings | ||||||||
| 102 | 4.00%, 04/14/2021 ╦ | 101 | ||||||
| Lawson Software, Inc. | ||||||||
| 197 | 3.75%, 06/03/2020 ╦ | 194 | ||||||
| Level 3 Communications, Inc. | ||||||||
| 320 | 4.00%, 08/01/2019 ╦ | 318 | ||||||
| MISYS plc | ||||||||
| 289 | 5.00%, 12/12/2018 ╦ | 289 | ||||||
| Novell, Inc. | ||||||||
| 270 | 7.25%, 11/22/2017 ╦ | 270 | ||||||
| West Corp. | ||||||||
| 116 | 3.25%, 06/30/2018 ╦ | 114 | ||||||
| 3,290 | ||||||||
| Media - 0.1% | ||||||||
| Entravision Communications Corp. | ||||||||
| 96 | 3.50%, 05/31/2020 ╦ | 94 | ||||||
| Mining - 0.8% | ||||||||
| American Rock Salt Holdings LLC | ||||||||
| 219 | 4.75%, 05/20/2021 | 217 | ||||||
| Arch Coal, Inc. | ||||||||
| 279 | 6.25%, 05/16/2018 | 246 | ||||||
| BWAY Holding Co. | ||||||||
| 135 | 5.50%, 08/14/2020 | 135 | ||||||
| Fortescue Metals Group Ltd. | ||||||||
| 299 | 3.75%, 06/30/2019 ╦ | 291 | ||||||
| 889 | ||||||||
| Miscellaneous Manufacturing - 0.6% | ||||||||
| DigitalGlobe, Inc. | ||||||||
| 320 | 3.75%, 01/31/2020 ╦ | 318 | ||||||
| Reynolds Group Holdings, Inc. | ||||||||
| 324 | 4.00%, 11/30/2018 ╦ | 322 | ||||||
| 640 | ||||||||
| Motor Vehicle and Parts Manufacturing - 0.3% | ||||||||
| Navistar, Inc. | ||||||||
| 81 | 5.75%, 08/17/2017 | 81 | ||||||
| SRAM LLC | ||||||||
| 290 | 4.01%, 04/10/2020 ╦ | 284 | ||||||
| 365 | ||||||||
| Other Services - 0.3% | ||||||||
| Alliance Laundry Systems LLC | ||||||||
| 97 | 4.25%, 12/10/2018 ╦ | 96 | ||||||
| Rexnord LLC | ||||||||
| 193 | 4.00%, 08/21/2020 ╦ | 190 | ||||||
| 286 | ||||||||
| Petroleum and Coal Products Manufacturing - 0.4% | ||||||||
| Chief Exploration & Development | ||||||||
| 100 | 7.50%, 05/16/2021 | 96 | ||||||
| Samson Investment Co. | ||||||||
| 100 | 5.00%, 09/25/2018 | 92 | ||||||
| Seadrill Ltd. | ||||||||
| 229 | 4.00%, 02/21/2021 ╦ | 216 | ||||||
| Shelf Drilling International Holdings Ltd. | ||||||||
| 100 | 10.00%, 10/08/2018 ╦ | 98 | ||||||
| 502 | ||||||||
| Pipeline Transportation - 0.6% | ||||||||
| EMG Utica LLC | ||||||||
| 130 | 4.75%, 03/27/2020 ╦ | 129 | ||||||
| EP Energy LLC | ||||||||
| 143 | 4.50%, 04/30/2019 ╦ | 141 | ||||||
| NGPL Pipeco LLC | ||||||||
| 286 | 6.75%, 09/15/2017 ╦ | 285 | ||||||
| Philadelphia Energy Solutions LLC | ||||||||
| 99 | 6.25%, 04/04/2018 | 93 | ||||||
| 648 | ||||||||
| Plastics and Rubber Products Manufacturing - 0.5% | ||||||||
| Consolidated Container Co. | ||||||||
| 279 | 5.00%, 07/03/2019 ╦ | 276 | ||||||
| Goodyear (The) Tire & Rubber Co. | ||||||||
| 250 | 4.75%, 04/30/2019 ╦ | 250 | ||||||
| 526 | ||||||||
| Primary Metal Manufacturing - 0.3% | ||||||||
| Novelis, Inc. | ||||||||
| 157 | 3.75%, 03/10/2017 ╦ | 155 | ||||||
| WireCo WorldGroup, Inc. | ||||||||
| 141 | 6.00%, 02/15/2017 ╦ | 141 | ||||||
| 296 | ||||||||
| Professional, Scientific and Technical Services - 0.8% | ||||||||
| Advantage Sales & Marketing, Inc. | ||||||||
| 100 | 4.25%, 07/23/2021 | 99 | ||||||
| AlixPartners LLP | ||||||||
| 196 | 4.00%, 07/10/2020 ╦ | 193 | ||||||
| 105 | 9.00%, 07/10/2021 ╦ | 106 | ||||||
| Getty Images, Inc. | ||||||||
| 128 | 4.75%, 10/18/2019 ╦ | 120 | ||||||
| MoneyGram International, Inc. | ||||||||
| 214 | 4.25%, 03/27/2020 ╦ | 207 | ||||||
| Paradigm Ltd. | ||||||||
| 219 | 4.75%, 07/30/2019 ╦ | 214 | ||||||
| 939 | ||||||||
| Real Estate, Rental and Leasing - 0.3% | ||||||||
| Fly Leasing Ltd. | ||||||||
| 239 | 4.50%, 08/09/2019 ╦ | 239 | ||||||
| Realogy Corp., Extended Credit Linked Deposit | ||||||||
| 4 | 4.41%, 10/10/2016 | 4 | ||||||
| Realogy Group LLC | ||||||||
| 137 | 3.75%, 03/05/2020 ╦ | 136 | ||||||
| 379 | ||||||||
| Retail Trade - 1.0% | ||||||||
| Albertson's LLC | ||||||||
| 180 | 4.50%, 08/25/2021 | 180 | ||||||
| Amscan Holdings, Inc. | ||||||||
| 191 | 4.00%, 07/27/2019 ╦ | 187 | ||||||
| FleetPride, Inc. | ||||||||
| 157 | 5.25%, 11/19/2019 ╦ | 154 | ||||||
| Metaldyne Performance Group, Inc. | ||||||||
| 100 | 4.50%, 10/20/2021 ☼ | 100 | ||||||
| Michaels Stores, Inc. | ||||||||
| 113 | 3.75%, 01/28/2020 ╦ | 111 | ||||||
| Neiman Marcus (The) Group, Inc. | ||||||||
| 154 | 4.25%, 10/25/2020 ╦ | 152 | ||||||
The accompanying notes are an integral part of these financial statements.
| 11 |
| The Hartford Unconstrained Bond Fund |
| Schedule of Investments – (continued) |
| October 31, 2014 |
| (000’s Omitted) |
| Shares or Principal Amount ╬ | Market Value ╪ | |||||||
Senior Floating Rate Interests ♦ - 17.6% - (continued) | ||||||||
| Retail Trade - 1.0% - (continued) | ||||||||
| Weight Watchers International, Inc. | ||||||||
| $ | 328 | 4.00%, 04/02/2020 ╦ | $ | 250 | ||||
| 1,134 | ||||||||
| Truck Transportation - 0.2% | ||||||||
| Nexeo Solutions LLC | ||||||||
| 206 | 5.00%, 09/09/2017 ╦ | 203 | ||||||
| Utilities - 0.3% | ||||||||
| Calpine Corp. | ||||||||
| 104 | 4.00%, 10/09/2019 ╦ | 103 | ||||||
| PowerTeam Services LLC | ||||||||
| 92 | 4.25%, 05/06/2020 | 90 | ||||||
| Texas Competitive Electric Holdings Co. LLC | ||||||||
| 85 | 3.75%, 05/05/2016 | 85 | ||||||
| 100 | 4.65%, 10/10/2017 Ψ | 73 | ||||||
| 351 | ||||||||
| Wholesale Trade - 0.2% | ||||||||
| Gates Global LLC | ||||||||
| 190 | 4.25%, 07/05/2021 | 188 | ||||||
| Total Senior Floating Rate Interests | ||||||||
| (Cost $20,181) | $ | 19,936 | ||||||
U.S. Government Agencies - 40.4% | ||||||||
| FHLMC - 10.5% | ||||||||
| $ | 3,693 | 3.00%, 08/01/2029 - 11/15/2044 ╦☼,Ð | $ | 3,725 | ||||
| 994 | 3.50%, 11/15/2029 - 08/01/2034 ╦☼,Ð | 1,043 | ||||||
| 1,981 | 4.00%, 08/01/2042 - 11/15/2044 ☼,Ð | 2,103 | ||||||
| 2,800 | 4.50%, 11/15/2044 ☼,Ð | 3,033 | ||||||
| 100 | 5.00%, 11/15/2044 ☼,Ð | 110 | ||||||
| 1,672 | 5.50%, 12/01/2037 - 01/01/2039 ╦ | 1,867 | ||||||
| 11,881 | ||||||||
| FNMA - 21.6% | ||||||||
| 578 | 2.14%, 11/01/2022 ╦ | 565 | ||||||
| 429 | 2.15%, 10/01/2022 ╦ | 419 | ||||||
| 197 | 2.20%, 12/01/2022 ╦ | 193 | ||||||
| 116 | 2.28%, 11/01/2022 ╦ | 114 | ||||||
| 10 | 2.29%, 10/01/2022 ╦ | 9 | ||||||
| 102 | 2.34%, 11/01/2022 ╦ | 100 | ||||||
| 91 | 2.40%, 10/01/2022 ╦ | 90 | ||||||
| 77 | 2.42%, 11/01/2022 ╦ | 76 | ||||||
| 5 | 2.44%, 01/01/2023 ╦ | 5 | ||||||
| 82 | 2.47%, 11/01/2022 ╦ | 82 | ||||||
| 750 | 2.50%, 11/15/2029 ☼,Ð | 761 | ||||||
| 5 | 2.66%, 09/01/2022 ╦ | 5 | ||||||
| 55 | 2.76%, 05/01/2021 ╦ | 56 | ||||||
| 10 | 2.78%, 04/01/2022 ╦ | 10 | ||||||
| 10 | 2.98%, 01/01/2022 ╦ | 10 | ||||||
| 5,885 | 3.00%, 11/15/2029 - 11/15/2044 ☼,Ð | 5,989 | ||||||
| 5 | 3.20%, 04/01/2022 ╦ | 5 | ||||||
| 50 | 3.21%, 05/01/2023 ╦ | 52 | ||||||
| 50 | 3.26%, 05/01/2024 ╦ | 51 | ||||||
| 25 | 3.34%, 04/01/2024 ╦ | 26 | ||||||
| 10 | 3.45%, 01/01/2024 ╦ | 11 | ||||||
| 10 | 3.47%, 01/01/2024 ╦ | 10 | ||||||
| 5,400 | 3.50%, 11/15/2044 - 12/15/2044 ☼,Ð | 5,579 | ||||||
| 25 | 3.67%, 08/01/2023 ╦ | 26 | ||||||
| 5 | 3.70%, 10/01/2023 ╦ | 5 | ||||||
| 10 | 3.76%, 03/01/2024 ╦ | 11 | ||||||
| 20 | 3.86%, 11/01/2023 - 12/01/2025 ╦ | 22 | ||||||
| 25 | 3.87%, 10/01/2025 ╦ | 27 | ||||||
| 35 | 3.89%, 05/01/2030 ╦ | 37 | ||||||
| 35 | 3.93%, 10/01/2023 ╦ | 38 | ||||||
| 10 | 3.96%, 05/01/2034 ╦ | 11 | ||||||
| 10 | 3.97%, 05/01/2029 ╦ | 11 | ||||||
| 3,472 | 4.00%, 11/15/2029 - 11/15/2044 ☼,Ð | 3,686 | ||||||
| 148 | 4.02%, 11/01/2028 ╦ | 159 | ||||||
| 20 | 4.06%, 10/01/2028 ╦ | 21 | ||||||
| 3,700 | 4.50%, 11/15/2044 ☼,Ð | 4,010 | ||||||
| 600 | 5.00%, 11/15/2044 ☼,Ð | 664 | ||||||
| 1,000 | 5.50%, 11/15/2044 ☼,Ð | 1,117 | ||||||
| 336 | 5.50%, 06/25/2042 ► | 58 | ||||||
| 311 | 6.00%, 09/01/2039 ╦ | 352 | ||||||
| 24,473 | ||||||||
| GNMA - 8.3% | ||||||||
| 1,100 | 3.00%, 11/15/2044 ☼,Ð | 1,121 | ||||||
| 2,100 | 3.50%, 11/15/2044 ☼,Ð | 2,193 | ||||||
| 2,300 | 4.00%, 11/15/2044 ☼,Ð | 2,459 | ||||||
| 1,153 | 4.50%, 09/20/2041 - 11/15/2044 ╦☼,Ð | 1,261 | ||||||
| 1,100 | 5.00%, 06/15/2041 - 12/15/2044 ╦☼,Ð | 1,218 | ||||||
| 1,030 | 6.00%, 08/15/2032 - 11/15/2044 ╦☼,Ð | 1,173 | ||||||
| 9,425 | ||||||||
| Total U.S. Government Agencies | ||||||||
| (Cost $45,725) | $ | 45,779 | ||||||
| U.S. Government Securities - 14.2% | ||||||||
| U.S. Treasury Securities - 14.2% | ||||||||
| U.S. Treasury Bonds - 0.7% | ||||||||
| $ | 60 | 1.38%, 02/15/2044 ◄‡ | $ | 67 | ||||
| 103 | 2.88%, 05/15/2043 ‡ | 99 | ||||||
| 70 | 3.13%, 02/15/2042 ‡ | 71 | ||||||
| 89 | 3.50%, 02/15/2039 ‡ | 97 | ||||||
| 50 | 4.25%, 11/15/2040 ‡ | 62 | ||||||
| 53 | 5.38%, 02/15/2031 ‡ | 72 | ||||||
| 300 | 7.25%, 05/15/2016 ‡ | 332 | ||||||
| 800 | ||||||||
| U.S. Treasury Notes - 13.5% | ||||||||
| 1,245 | 0.13%, 04/15/2019 - 07/15/2024 ◄‡ | 1,264 | ||||||
| 135 | 0.38%, 07/15/2023 ◄‡ | 138 | ||||||
| 350 | 0.50%, 09/30/2016 ‡ | 350 | ||||||
| 240 | 0.63%, 04/30/2018 ‡ | 235 | ||||||
| 310 | 0.63%, 07/15/2021 - 01/15/2024 ◄‡ | 324 | ||||||
| 250 | 0.75%, 03/31/2018 ‡ | 247 | ||||||
| 375 | 0.88%, 07/31/2019 ‡ | 363 | ||||||
| 2,975 | 1.00%, 09/15/2017 - 05/31/2018 ‡Є | 2,954 | ||||||
| 200 | 1.13%, 01/15/2021 ◄‡ | 230 | ||||||
| 175 | 1.25%, 07/15/2020 ◄‡ | 204 | ||||||
| 215 | 1.38%, 02/28/2019 ‡ | 214 | ||||||
| 125 | 1.38%, 01/15/2020 ◄‡ | 147 | ||||||
| 140 | 2.00%, 02/15/2022 ‡ | 139 | ||||||
| 260 | 2.13%, 01/15/2019 ◄‡ | 315 | ||||||
| 150 | 2.38%, 08/15/2024 ‡ | 151 | ||||||
| 5,080 | 2.50%, 04/30/2015 - 05/15/2024 ‡Є | 5,140 | ||||||
| 325 | 2.75%, 02/15/2019 ‡ | 342 | ||||||
The accompanying notes are an integral part of these financial statements.
| 12 |
| The Hartford Unconstrained Bond Fund |
| Schedule of Investments – (continued) |
| October 31, 2014 |
| (000’s Omitted) |
| Shares or Principal Amount ╬ | Market Value ╪ | |||||||||||
| U.S. Government Securities - 14.2% - (continued) | ||||||||||||
| U.S. Treasury Securities - 14.2% - (continued) | ||||||||||||
| U.S. Treasury Notes - 13.5% - (continued) | ||||||||||||
| $ | 2,065 | 3.25%, 03/31/2017 □Є | $ | 2,190 | ||||||||
| 325 | 4.63%, 11/15/2016 ‡ | 352 | ||||||||||
| 15,299 | ||||||||||||
| 16,099 | ||||||||||||
| Total U.S. Government Securities | ||||||||||||
| (Cost $16,109) | $ | 16,099 | ||||||||||
| Preferred Stocks - 0.0% | ||||||||||||
| Diversified Financials - 0.0% | ||||||||||||
| — | Citigroup Capital XIII | $ | 1 | |||||||||
| 2 | GMAC Capital Trust I β | 57 | ||||||||||
| 58 | ||||||||||||
| Total Preferred Stocks | ||||||||||||
| (Cost $55) | $ | 58 | ||||||||||
| Total Long-Term Investments Excluding Purchased Options | ||||||||||||
| (Cost $137,933) | $ | 138,544 | ||||||||||
| Short-Term Investments - 11.1% | ||||||||||||
| Repurchase Agreements - 11.1% | ||||||||||||
| Bank of America Merrill Lynch TriParty Repurchase Agreement (maturing on 11/03/2014 in the amount of $36, collateralized by U.S. Treasury Note 1.50%, 2019, value of $37) | ||||||||||||
| $ | 36 | 0.08%, 10/31/2014 ╦ | $ | 36 | ||||||||
| Bank of America Merrill Lynch TriParty Repurchase Agreement (maturing on 11/03/2014 in the amount of $613, collateralized by GNMA 1.63% - 7.00%, 2031 - 2054, value of $625) | ||||||||||||
| 613 | 0.09%, 10/31/2014 ╦ | 613 | ||||||||||
| Bank of Montreal TriParty Repurchase Agreement (maturing on 11/03/2014 in the amount of $165, collateralized by U.S. Treasury Bond 2.88% - 5.25%, 2029 - 2043, U.S. Treasury Note 0.38% - 4.50%, 2015 - 2022, value of $168) | ||||||||||||
| 165 | 0.08%, 10/31/2014 ╦ | 165 | ||||||||||
| Bank of Montreal TriParty Repurchase Agreement (maturing on 11/03/2014 in the amount of $558, collateralized by FHLMC 2.00% - 5.50%, 2022 - 2034, FNMA 2.00% - 4.50%, 2024 - 2039, GNMA 3.00%, 2043, U.S. Treasury Note 4.63%, 2017, value of $570) | ||||||||||||
| 558 | 0.10%, 10/31/2014 ╦ | 558 | ||||||||||
| Barclays Capital TriParty Repurchase Agreement (maturing on 11/03/2014 in the amount of $2,104, collateralized by U.S. Treasury Bond 4.50% - 6.25%, 2023 - 2036, U.S. Treasury Note 1.63% - 2.13%, 2015 - 2019, value of $2,146) | ||||||||||||
| 2,104 | 0.08%, 10/31/2014 ╦ | 2,104 | ||||||||||
| Citigroup Global Markets, Inc. TriParty Repurchase Agreement (maturing on 11/03/2014 in the amount of $2,419, collateralized by U.S. Treasury Bill 0.02%, 2015, U.S. Treasury Bond 3.88% - 11.25%, 2015 - 2040, U.S. Treasury Note 2.00% - 3.38%, 2019 - 2021, value of $2,467) | ||||||||||||
| 2,419 | 0.09%, 10/31/2014 ╦ | 2,419 | ||||||||||
| Deutsche Bank Securities TriParty Repurchase Agreement (maturing on 11/03/2014 in the amount of $140, collateralized by U.S. Treasury Note 0.88%, 2017, value of $142) | ||||||||||||
| 140 | 0.13%, 10/31/2014 ╦ | 140 | ||||||||||
| RBS Securities, Inc. TriParty Repurchase Agreement (maturing on 11/03/2014 in the amount of $206, collateralized by U.S. Treasury Bond 3.63% - 5.00%, 2037 - 2043, U.S. Treasury Note 2.13%, 2020, value of $210) | ||||||||||||
| 205 | 0.07%, 10/31/2014 | 205 | ||||||||||
| Societe Generale TriParty Repurchase Agreement (maturing on 11/03/2014 in the amount of $2,165, collateralized by U.S. Treasury Bill 0.02%, 2015, U.S. Treasury Bond 3.75% - 11.25%, 2015 - 2043, U.S. Treasury Note 1.38% - 4.25%, 2015 - 2022, value of $2,208) | ||||||||||||
| 2,165 | 0.08%, 10/31/2014 | 2,165 | ||||||||||
| TD Securities TriParty Repurchase Agreement (maturing on 11/03/2014 in the amount of $4,196, collateralized by FHLMC 3.00% - 4.00%, 2026 - 2044, FNMA 2.50% - 5.00%, 2025 - 2044, U.S. Treasury Bond 3.50% - 6.50%, 2026 - 2041, U.S. Treasury Note 1.75% - 2.88%, 2018 - 2019, value of $4,280) | ||||||||||||
| 4,196 | 0.10%, 10/31/2014 | 4,196 | ||||||||||
| 12,601 | ||||||||||||
| Total Short-Term Investments | ||||||||||||
| (Cost $12,601) | $ | 12,601 | ||||||||||
| Total Investments Excluding Purchased Options | ||||||||||||
| (Cost $150,534) | 133.3 | % | $ | 151,145 | ||||||||
| Total Purchased Options | ||||||||||||
| (Cost $90) | — | % | 38 | |||||||||
| Total Investments | ||||||||||||
| (Cost $150,624) ▲ | 133.3 | % | $ | 151,183 | ||||||||
| Other Assets and Liabilities | (33.3 | )% | (37,786 | ) | ||||||||
| Total Net Assets | 100.0 | % | $ | 113,397 | ||||||||
The accompanying notes are an integral part of these financial statements.
| 13 |
| The Hartford Unconstrained Bond Fund |
| Schedule of Investments – (continued) |
| October 31, 2014 |
| (000’s Omitted) |
| Note: | Percentage of investments as shown is the ratio of the total market value to total net assets. |
The Fund may refer to any one or more of the industry classifications used by one or more widely recognized market indices, ratings group indices and/or as defined by Fund management. Industry classifications may not be identical across all security types.
Equity industry classifications used in this report are the Global Industry Classification Standard, which was developed by and is the exclusive property and service mark of MSCI, Inc. and Standard & Poor’s.
For Fund compliance purposes, the Fund may not use the same classification system shown in this report as these classifications are used for reporting ease.
| ▲ | At October 31, 2014, the cost of securities for federal income tax purposes was $150,636 and the aggregate gross unrealized appreciation and depreciation based on that cost were: |
| Unrealized Appreciation | $ | 2,315 | ||
| Unrealized Depreciation | (1,768 | ) | ||
| Net Unrealized Appreciation | $ | 547 |
| ╬ | All principal amounts are in U.S. dollars unless otherwise indicated. |
| † | These securities are valued in good faith at fair value as determined under policies and procedures established by and under the supervision of the Board of Directors. At October 31, 2014, the aggregate fair value and percentage of net assets of these securities rounds to zero. |
| ● | Non-income producing. For long-term debt securities, items identified are in default as to payment of interest and/or principal. |
| Ψ | The issuer is in bankruptcy. However, the investment held by the Fund is current with respect to interest payments. |
| Δ | Variable rate securities; the rate reported is the coupon rate in effect at October 31, 2014. |
| ○ | The interest rate disclosed for these securities represents the effective yield on the date of the acquisition. |
| ► | Securities disclosed are interest-only strips. |
| ◄ | The principal amount for this security is adjusted for inflation and the interest payments equal a fixed percentage of the inflation-adjusted principal amount. |
| ♦ | Senior floating rate interests generally pay interest rates which are periodically adjusted by reference to a base short-term, floating lending rate plus a premium. The base lending rates are primarily the LIBOR, and secondarily the prime rate offered by one or more major United States banks (the "Prime Rate") and the certificate of deposit rate or other base lending rates used by commercial lenders. Senior floating rate interests often require prepayments from excess cash flows or permit the borrower to repay at its election. The rate at which the borrower repays cannot be predicted with accuracy. As a result, the actual remaining maturity may be substantially less than the stated maturities shown. Unless otherwise noted, the interest rate disclosed for these securities represents the average coupon as of October 31, 2014. |
| ■ | Securities issued within terms of a private placement memorandum, exempt from registration under Rule 144A under the Securities Act of 1933, as amended, and may be sold only to qualified institutional buyers. Unless otherwise indicated, these holdings are determined to be liquid. At October 31, 2014, the aggregate value of these securities was $12,502, which represents 11.0% of total net assets. |
| § | These securities were sold to the Fund under Regulation S, rules governing offers and sales made outside the United States without registration under the Securities Act of 1933, as amended. The Fund may only be able to resell these securities in the United States if an exemption from registration under the federal and state securities laws is available, or the Fund may only be able to sell these securities outside of the United States (such as on a foreign exchange) to a non-U.S. person. Unless otherwise indicated, these holdings are determined to be liquid. At October 31, 2014, the aggregate value of these securities was $8,221, which represents 7.2% of total net assets. |
| β | Convertible security. |
| ♠ | Perpetual maturity security. Maturity date shown is the next call date or final legal maturity date, whichever comes first. |
| Ð | Represents or includes a TBA transaction. |
| ☼ | This security, or a portion of this security, was purchased on a when-issued or delayed-delivery basis. The cost of these securities was $35,595 at October 31, 2014. |
| ‡ | This security, or a portion of this security, has been segregated to cover funding requirements on investment transactions settling in the future. |
| Є | This security, or a portion of this security, has been pledged as collateral in connection with centrally cleared swap contracts. |
| ╦ | This security, or a portion of this security, has been pledged as collateral in connection with OTC swap contracts. |
The accompanying notes are an integral part of these financial statements.
| 14 |
| The Hartford Unconstrained Bond Fund |
| Schedule of Investments – (continued) |
| October 31, 2014 |
| (000’s Omitted) |
| Θ | This security, or a portion of this security, has been pledged as collateral in connection with OTC option and/or swaption contracts. |
| □ | This security, or a portion of this security, has been pledged as collateral in connection with futures contracts. |
Cash and securities pledged and received as collateral in connection with derivatives at October 31, 2014:
| Pledged ‡ | Received * | |||||||
| OTC option and/or OTC swap contracts | $ | – | $ | 1,160 | ||||
| Total | $ | – | $ | 1,160 | ||||
| ‡ | As previously noted, certain securities, or a portion of these securities, are pledged as collateral in connection with certain derivative instruments. These securities are held by the Fund but are not represented in the table above. |
| * | Securities valued at $265, held on behalf of the Fund at the custodian bank, were designated by broker(s) as collateral in connection with OTC option and/or OTC swap contracts Since the broker retains legal title to the securities, the securities are not considered an asset of the Fund. |
OTC Option Contracts Outstanding at October 31, 2014
| Description | Counter
- party | Risk Exposure Category | Exercise
Price/ FX Rate/ Rate | Expiration Date | Number
of Contracts * | Market Value ╪ | Premiums Received/ Paid by Fund Δ | Unrealized Appreciation (Depreciation) | ||||||||||||||||||||||
| Purchased Option contracts: | ||||||||||||||||||||||||||||||
| Calls | ||||||||||||||||||||||||||||||
| BRL Call/USD Put | JPM | FX | 2.43 BRL per USD | 09/28/15 | BRL | 70,000 | $ | – | $ | – | $ | – | ||||||||||||||||||
| INR Call/USD Put | BOA | FX | 62.55 INR per USD | 01/16/15 | INR | 30,000,000 | 8 | 8 | – | |||||||||||||||||||||
| MXN Call/USD Put | JPM | FX | 13.61 MXN per USD | 01/15/15 | MXN | 6,055,844 | 8 | 9 | (1 | ) | ||||||||||||||||||||
| RUB Call/USD Put | GSC | FX | 36.97 RUB per USD | 09/02/15 | RUB | 11,000,000 | 1 | 5 | (4 | ) | ||||||||||||||||||||
| TRY Call/USD Put | JPM | FX | 2.31 USD per TRY | 01/19/15 | TRY | 1,000,000 | 14 | 10 | 4 | |||||||||||||||||||||
| Total Calls | 48,125,844 | $ | 31 | $ | 32 | $ | (1 | ) | ||||||||||||||||||||||
| Total purchased option contracts | 48,125,844 | $ | 31 | $ | 32 | $ | (1 | ) | ||||||||||||||||||||||
| Written option contracts: | ||||||||||||||||||||||||||||||
| Calls | ||||||||||||||||||||||||||||||
| GBP Call/USD Put | DEUT | FX | 1.62 USD per GBP | 12/08/14 | GBP | 305,000 | $ | 1 | $ | 7 | $ | 6 | ||||||||||||||||||
| Puts | ||||||||||||||||||||||||||||||
| GBP Put/USD Call | DEUT | FX | 1.62 USD per GBP | 12/08/14 | GBP | 305,000 | $ | 7 | $ | 8 | $ | 1 | ||||||||||||||||||
| Total written option contracts | 610,000 | $ | 8 | $ | 15 | $ | 7 | |||||||||||||||||||||||
| * | The number of contracts does not omit 000's. |
| Δ | For purchased options, premiums are paid by the Fund, for written options, premiums are received. |
The accompanying notes are an integral part of these financial statements.
| 15 |
| The Hartford Unconstrained Bond Fund |
| Schedule of Investments – (continued) |
| October 31, 2014 |
| (000’s Omitted) |
OTC Swaption Contracts Outstanding at October 31, 2014
| Description | Counter
- party | Risk Exposure Category | Exercise
Price/ FX Rate/ Rate | Expiration Date | Number
of Contracts * | Market Value ╪ | Premiums Received/ Paid by Fund Δ | Unrealized Appreciation (Depreciation) | ||||||||||||||||||||||
| Purchased swaption contracts: | ||||||||||||||||||||||||||||||
| Puts | ||||||||||||||||||||||||||||||
| Interest Rate Swaption USD | JPM | IR | 3.50 | % | 04/29/15 | USD | 3,340,000 | $ | 7 | $ | 58 | $ | (51 | ) | ||||||||||||||||
| Written swaption contracts: | ||||||||||||||||||||||||||||||
| Calls | ||||||||||||||||||||||||||||||
| Credit Default Swaption ITRAXX.XOV.22 | JPM | CR | 3.75 | % | 11/19/14 | EUR | 6,220,000 | $ | 104 | $ | 105 | $ | 1 | |||||||||||||||||
| Interest Rate Swaption USD | BNP | IR | 3.44 | % | 10/23/24 | USD | 350,000 | 43 | 44 | 1 | ||||||||||||||||||||
| Total Calls | 6,570,000 | $ | 147 | $ | 149 | $ | 2 | |||||||||||||||||||||||
| Puts | ||||||||||||||||||||||||||||||
| Credit Default Swaption ITRAXX.XOV.22 | JPM | CR | 3.75 | % | 11/19/14 | EUR | 6,220,000 | $ | 48 | $ | 75 | $ | 27 | |||||||||||||||||
| Interest Rate Swaption USD | BNP | IR | 3.44 | % | 10/23/24 | USD | 350,000 | 42 | 44 | 2 | ||||||||||||||||||||
| Total Puts | 6,570,000 | $ | 90 | $ | 119 | $ | 29 | |||||||||||||||||||||||
| Total written swaption contracts | 13,140,000 | $ | 237 | $ | 268 | $ | 31 | |||||||||||||||||||||||
| * | The number of contracts does not omit 000's. |
| Δ | For purchased swaptions, premiums are paid by the Fund, for written swaptions, premiums are received. |
Futures Contracts Outstanding at October 31, 2014
| Number of | Expiration | Notional | Market | Unrealized Appreciation/(Depreciation) | Variation Margin | |||||||||||||||||||||||
| Description | Contracts* | Date | Amount | Value ╪ | Asset | Liability | Asset | Liability | ||||||||||||||||||||
| Short position contracts: | ||||||||||||||||||||||||||||
| 90-Day Eurodollar Future | 45 | 12/14/2015 | $ | 11,162 | $ | 11,156 | $ | 6 | $ | – | $ | 7 | $ | (2 | ) | |||||||||||||
| U.S. Treasury 10-Year Note Future | 144 | 12/19/2014 | 18,249 | 18,196 | 53 | – | 21 | (6 | ) | |||||||||||||||||||
| U.S. Treasury 2-Year Note Future | 2 | 12/31/2014 | 438 | 439 | – | (1 | ) | – | – | |||||||||||||||||||
| U.S. Treasury 5-Year Note Future | 108 | 12/31/2014 | 12,896 | 12,899 | – | (3 | ) | – | (4 | ) | ||||||||||||||||||
| U.S. Treasury CME Ultra Long Term Bond Future | 19 | 12/19/2014 | 2,981 | 2,979 | 2 | – | 10 | – | ||||||||||||||||||||
| U.S. Treasury Long Bond Future | 23 | 12/19/2014 | 3,234 | 3,245 | – | (11 | ) | 11 | – | |||||||||||||||||||
| Total | $ | 61 | $ | (15 | ) | $ | 49 | $ | (12 | ) | ||||||||||||||||||
* The number of contracts does not omit 000's.
OTC Credit Default Swap Contracts Outstanding at October 31, 2014
| Counter- | Notional | (Pay)/
Receive Fixed Rate/ Implied | Expiration | Upfront Premiums | Upfront Premiums | Market | Unrealized
Appreciation/ (Depreciation) | |||||||||||||||||||||||||
| Reference Entity | party | Amount (a) | Credit Spread (b) | Date | Paid | Received | Value ╪ | Asset | Liability | |||||||||||||||||||||||
| Credit default swaps on indices: | ||||||||||||||||||||||||||||||||
| Buy protection: | ||||||||||||||||||||||||||||||||
| ABX.HE.AA.06-1 | JPM | USD | 214 | (0.32 | )% | 07/25/45 | $ | 56 | $ | – | $ | 45 | $ | – | $ | (11 | ) | |||||||||||||||
| ABX.HE.AAA.06-1 | BCLY | USD | 10 | (0.18 | )% | 07/25/45 | 1 | – | – | – | (1 | ) | ||||||||||||||||||||
| ABX.HE.AAA.06-1 | BOA | USD | 17 | (0.18 | )% | 07/25/45 | – | – | – | – | – | |||||||||||||||||||||
| ABX.HE.AAA.06-1 | GSC | USD | 30 | (0.18 | )% | 07/25/45 | 3 | – | 1 | – | (2 | ) | ||||||||||||||||||||
| ABX.HE.AAA.06-1 | JPM | USD | 58 | (0.18 | )% | 07/25/45 | 1 | – | 1 | – | – | |||||||||||||||||||||
| ABX.HE.AAA.06-1 | JPM | USD | 10 | (0.18 | )% | 07/25/45 | – | – | – | – | – | |||||||||||||||||||||
| ABX.HE.AAA.06-1 | MSC | USD | 10 | (0.18 | )% | 07/25/45 | – | – | – | – | – | |||||||||||||||||||||
| ABX.HE.AAA.06-1 | MSC | USD | 40 | (0.18 | )% | 07/25/45 | 2 | – | 1 | – | (1 | ) | ||||||||||||||||||||
| ABX.HE.AAA.06-2 | BOA | USD | 562 | (0.11 | )% | 05/25/46 | 117 | – | 112 | – | (5 | ) | ||||||||||||||||||||
| ABX.HE.AAA.06-2 | CSI | USD | 59 | (0.11 | )% | 05/25/46 | 14 | – | 12 | – | (2 | ) | ||||||||||||||||||||
| ABX.HE.AAA.07 | MSC | USD | 101 | (0.09 | )% | 08/25/37 | 26 | – | 26 | – | – | |||||||||||||||||||||
| ABX.HE.AAA.07-1 | CSI | USD | 299 | (0.09 | )% | 08/25/37 | 87 | – | 78 | – | (9 | ) | ||||||||||||||||||||
| ABX.HE.AAA.07-1 | GSC | USD | 118 | (0.09 | )% | 08/25/37 | 30 | – | 31 | 1 | – | |||||||||||||||||||||
| ABX.HE.AAA.07-1 | MSC | USD | 484 | (0.09 | )% | 08/25/37 | 120 | – | 126 | 6 | – | |||||||||||||||||||||
| ABX.HE.PENAAA.06-2 | BCLY | USD | 34 | (0.11 | )% | 05/25/46 | 10 | – | 5 | – | (5 | ) | ||||||||||||||||||||
The accompanying notes are an integral part of these financial statements.
| 16 |
| The Hartford Unconstrained Bond Fund |
| Schedule of Investments – (continued) |
| October 31, 2014 |
| (000’s Omitted) |
OTC Credit Default Swap Contracts Outstanding at October 31, 2014 - (continued)
| Counter- | Notional | (Pay)/
Receive Fixed Rate/ Implied | Expiration | Upfront Premiums | Upfront Premiums | Market | Unrealized
Appreciation/ (Depreciation) | |||||||||||||||||||||||||
| Reference Entity | party | Amount (a) | Credit Spread (b) | Date | Paid | Received | Value ╪ | Asset | Liability | |||||||||||||||||||||||
| Credit default swaps on indices: - (continued) | ||||||||||||||||||||||||||||||||
| Buy protection: - (continued) | ||||||||||||||||||||||||||||||||
| ABX.HE.PENAAA.06-2 | GSC | USD | 188 | (0.11 | )% | 05/25/46 | $ | 47 | $ | – | $ | 26 | $ | – | $ | (21 | ) | |||||||||||||||
| ABX.HE.PENAAA.06-2 | JPM | USD | 60 | (0.11 | )% | 05/25/46 | 9 | – | 9 | – | – | |||||||||||||||||||||
| ABX.HE.PENAAA.06-2 | JPM | USD | 255 | (0.11 | )% | 05/25/46 | 63 | – | 36 | – | (27 | ) | ||||||||||||||||||||
| ABX.HE.PENAAA.06-2 | MSC | USD | 204 | (0.11 | )% | 05/25/46 | 45 | – | 29 | – | (16 | ) | ||||||||||||||||||||
| ABX.HE.PENAAA.07-1 | BCLY | USD | 283 | (0.09 | )% | 08/25/37 | 124 | – | 65 | – | (59 | ) | ||||||||||||||||||||
| CDX.EM.21 | GSC | USD | 1,157 | (5.00 | )% | 06/20/19 | – | (106 | ) | (119 | ) | – | (13 | ) | ||||||||||||||||||
| CMBX.NA.A.7 | JPM | USD | 205 | (2.00 | )% | 01/17/47 | – | (4 | ) | – | 4 | – | ||||||||||||||||||||
| CMBX.NA.AA.1 | JPM | USD | 245 | (0.25 | )% | 10/12/52 | 49 | – | 36 | – | (13 | ) | ||||||||||||||||||||
| CMBX.NA.AA.2 | BOA | USD | 406 | (0.15 | )% | 03/15/49 | 153 | – | 131 | – | (22 | ) | ||||||||||||||||||||
| CMBX.NA.AA.2 | CSI | USD | 229 | (0.15 | )% | 03/15/49 | 71 | – | 74 | 3 | – | |||||||||||||||||||||
| CMBX.NA.AA.2 | JPM | USD | 277 | (0.15 | )% | 03/15/49 | 104 | – | 90 | – | (14 | ) | ||||||||||||||||||||
| CMBX.NA.AA.2 | MSC | USD | 129 | (0.15 | )% | 03/15/49 | 52 | – | 42 | – | (10 | ) | ||||||||||||||||||||
| CMBX.NA.AA.7 | CSI | USD | 520 | (1.50 | )% | 01/17/47 | 1 | – | 1 | – | – | |||||||||||||||||||||
| CMBX.NA.AA.7 | CSI | USD | 255 | (1.50 | )% | 01/17/47 | – | (2 | ) | 1 | 3 | – | ||||||||||||||||||||
| CMBX.NA.AA.7 | MSC | USD | 225 | (1.50 | )% | 01/17/47 | – | (3 | ) | – | 3 | – | ||||||||||||||||||||
| CMBX.NA.AJ.1 | JPM | USD | 155 | (0.84 | )% | 10/12/52 | 11 | – | 4 | – | (7 | ) | ||||||||||||||||||||
| CMBX.NA.AJ.1 | MSC | USD | 140 | (0.84 | )% | 10/12/52 | 10 | – | 4 | – | (6 | ) | ||||||||||||||||||||
| CMBX.NA.AJ.2 | DEUT | USD | 308 | (1.09 | )% | 03/15/49 | 28 | – | 26 | – | (2 | ) | ||||||||||||||||||||
| CMBX.NA.AJ.2 | GSC | USD | 99 | (1.09 | )% | 03/15/49 | 8 | – | 9 | 1 | – | |||||||||||||||||||||
| CMBX.NA.AJ.4 | CSI | USD | 70 | (0.96 | )% | 02/17/51 | 14 | – | 14 | – | – | |||||||||||||||||||||
| CMBX.NA.AJ.4 | CSI | USD | 468 | (0.96 | )% | 02/17/51 | 87 | – | 91 | 4 | – | |||||||||||||||||||||
| CMBX.NA.AJ.4 | DEUT | USD | 199 | (0.96 | )% | 02/17/51 | 39 | – | 39 | – | – | |||||||||||||||||||||
| CMBX.NA.AJ.4 | GSC | USD | 458 | (0.96 | )% | 02/17/51 | 80 | – | 89 | 9 | – | |||||||||||||||||||||
| CMBX.NA.AJ.4 | MSC | USD | 453 | (0.96 | )% | 02/17/51 | 137 | – | 88 | – | (49 | ) | ||||||||||||||||||||
| CMBX.NA.AJ.4 | MSC | USD | 164 | (0.96 | )% | 02/17/51 | 29 | – | 32 | 3 | – | |||||||||||||||||||||
| CMBX.NA.AM.2 | CSI | USD | 425 | (0.50 | )% | 03/15/49 | 26 | – | 5 | – | (21 | ) | ||||||||||||||||||||
| CMBX.NA.AM.2 | DEUT | USD | 170 | (0.50 | )% | 03/15/49 | 10 | – | 2 | – | (8 | ) | ||||||||||||||||||||
| CMBX.NA.AM.2 | JPM | USD | 35 | (0.50 | )% | 03/15/49 | 1 | – | – | – | (1 | ) | ||||||||||||||||||||
| CMBX.NA.AM.2 | MSC | USD | 575 | (0.50 | )% | 03/15/49 | 28 | – | 7 | – | (21 | ) | ||||||||||||||||||||
| CMBX.NA.AM.4 | BOA | USD | 125 | (0.50 | )% | 02/17/51 | 15 | – | 5 | – | (10 | ) | ||||||||||||||||||||
| CMBX.NA.AM.4 | CSI | USD | 25 | (0.50 | )% | 02/17/51 | 3 | – | 1 | – | (2 | ) | ||||||||||||||||||||
| CMBX.NA.AM.4 | GSC | USD | 225 | (0.50 | )% | 02/17/51 | 34 | – | 10 | – | (24 | ) | ||||||||||||||||||||
| CMBX.NA.AM.4 | JPM | USD | 20 | (0.50 | )% | 02/17/51 | 2 | – | 1 | – | (1 | ) | ||||||||||||||||||||
| CMBX.NA.AM.4 | MSC | USD | 140 | (0.50 | )% | 02/17/51 | 17 | – | 6 | – | (11 | ) | ||||||||||||||||||||
| CMBX.NA.AS.6 | CSI | USD | 455 | (1.00 | )% | 05/11/63 | 6 | – | 4 | – | (2 | ) | ||||||||||||||||||||
| CMBX.NA.AS.7 | CSI | USD | 240 | (1.00 | )% | 01/17/47 | 6 | – | 4 | – | (2 | ) | ||||||||||||||||||||
| CMBX.NA.AS.7 | GSC | USD | 195 | (1.00 | )% | 01/17/47 | 5 | – | 3 | – | (2 | ) | ||||||||||||||||||||
| Total | $ | 1,781 | $ | (115 | ) | $ | 1,303 | $ | 37 | $ | (400 | ) | ||||||||||||||||||||
| Sell protection: | ||||||||||||||||||||||||||||||||
| CMBX.NA.A.2 | BOA | USD | 118 | 0.25 | % | 03/15/49 | $ | – | $ | (68 | ) | $ | (76 | ) | $ | – | $ | (8 | ) | |||||||||||||
| CMBX.NA.AAA.6 | BOA | USD | 510 | 0.50 | % | 05/11/63 | – | (14 | ) | (10 | ) | 4 | – | |||||||||||||||||||
| CMBX.NA.AAA.6 | CSI | USD | 1,665 | 0.50 | % | 05/11/63 | – | (40 | ) | (33 | ) | 7 | – | |||||||||||||||||||
| CMBX.NA.AAA.6 | DEUT | USD | 965 | 0.50 | % | 05/11/63 | – | (24 | ) | (19 | ) | 5 | – | |||||||||||||||||||
| CMBX.NA.AAA.6 | DEUT | USD | 305 | 0.50 | % | 05/11/63 | – | (5 | ) | (6 | ) | – | (1 | ) | ||||||||||||||||||
| CMBX.NA.AAA.6 | GSC | USD | 2,075 | 0.50 | % | 05/11/63 | – | (42 | ) | (41 | ) | 1 | – | |||||||||||||||||||
| CMBX.NA.AAA.6 | JPM | USD | 975 | 0.50 | % | 05/11/63 | – | (32 | ) | (19 | ) | 13 | – | |||||||||||||||||||
| CMBX.NA.AAA.6 | MSC | USD | 165 | 0.50 | % | 05/11/63 | – | (4 | ) | (3 | ) | 1 | – | |||||||||||||||||||
| CMBX.NA.AAA.6 | UBS | USD | 4,710 | 0.50 | % | 05/11/63 | – | (184 | ) | (92 | ) | 92 | – | |||||||||||||||||||
| CMBX.NA.AAA.7 | BOA | USD | 290 | 0.50 | % | 01/17/47 | – | (7 | ) | (8 | ) | – | (1 | ) | ||||||||||||||||||
| CMBX.NA.AAA.7 | CSI | USD | 295 | 0.50 | % | 01/17/47 | – | (8 | ) | (8 | ) | – | – | |||||||||||||||||||
| CMBX.NA.BB.6 | BCLY | USD | 104 | 5.00 | % | 05/11/63 | 1 | – | – | – | (1 | ) | ||||||||||||||||||||
| CMBX.NA.BB.6 | BOA | USD | 380 | 5.00 | % | 05/11/63 | – | (4 | ) | (1 | ) | 3 | – | |||||||||||||||||||
| CMBX.NA.BB.6 | CSI | USD | 65 | 5.00 | % | 05/11/63 | – | – | – | – | – | |||||||||||||||||||||
| CMBX.NA.BB.6 | CSI | USD | 580 | 5.00 | % | 05/11/63 | 6 | – | (1 | ) | – | (7 | ) | |||||||||||||||||||
| CMBX.NA.BB.6 | CSI | USD | 330 | 5.00 | % | 05/11/63 | – | (2 | ) | (1 | ) | 1 | – | |||||||||||||||||||
| CMBX.NA.BB.6 | MSC | USD | 655 | 5.00 | % | 05/11/63 | – | (42 | ) | (1 | ) | 41 | – | |||||||||||||||||||
The accompanying notes are an integral part of these financial statements.
| 17 |
| The Hartford Unconstrained Bond Fund |
| Schedule of Investments – (continued) |
| October 31, 2014 |
| (000’s Omitted) |
OTC Credit Default Swap Contracts Outstanding at October 31, 2014 - (continued)
| Counter- | Notional | (Pay)/
Receive Fixed Rate/ Implied | Expiration | Upfront Premiums | Upfront Premiums | Market | Unrealized
Appreciation/ (Depreciation) | |||||||||||||||||||||||||
| Reference Entity | party | Amount (a) | Credit Spread (b) | Date | Paid | Received | Value ╪ | Asset | Liability | |||||||||||||||||||||||
| Credit default swaps on indices: - (continued) | ||||||||||||||||||||||||||||||||
| Sell protection: - (continued) | ||||||||||||||||||||||||||||||||
| CMBX.NA.BB.7 | BCLY | USD | 30 | 5.00% | 01/17/47 | $ | – | $ | (1 | ) | $ | (1 | ) | $ | – | $ | – | |||||||||||||||
| CMBX.NA.BB.7 | BOA | USD | 355 | 5.00% | 01/17/47 | – | (12 | ) | (8 | ) | 4 | – | ||||||||||||||||||||
| CMBX.NA.BB.7 | CSI | USD | 75 | 5.00% | 01/17/47 | 1 | – | (2 | ) | – | (3 | ) | ||||||||||||||||||||
| CMBX.NA.BB.7 | CSI | USD | 460 | 5.00% | 01/17/47 | – | (20 | ) | (11 | ) | 9 | – | ||||||||||||||||||||
| CMBX.NA.BB.7 | DEUT | USD | 250 | 5.00% | 01/17/47 | – | (6 | ) | (6 | ) | – | – | ||||||||||||||||||||
| CMBX.NA.BB.7 | MSC | USD | 80 | 5.00% | 01/17/47 | – | (1 | ) | (2 | ) | – | (1 | ) | |||||||||||||||||||
| CMBX.NA.BBB-.7 | CSI | USD | 145 | 3.00% | 01/17/47 | – | (3 | ) | (3 | ) | – | – | ||||||||||||||||||||
| CMBX.NA.BBB-.7 | CSI | USD | 109 | 3.00% | 01/17/47 | – | (6 | ) | (2 | ) | 4 | – | ||||||||||||||||||||
| CMBX.NA.BBB-.7 | UBS | USD | 135 | 3.00% | 01/17/47 | – | (8 | ) | (3 | ) | 5 | – | ||||||||||||||||||||
| PrimeX.ARM.2 | MSC | USD | 355 | 4.58% | 12/25/37 | – | (28 | ) | 11 | 39 | – | |||||||||||||||||||||
| PrimeX.ARM.2 | MSC | USD | 44 | 4.58% | 12/25/37 | 1 | – | 1 | – | – | ||||||||||||||||||||||
| PrimeX.FRM.1 | JPM | USD | 50 | 4.42% | 07/25/36 | 5 | – | 5 | – | – | ||||||||||||||||||||||
| Total | $ | 14 | $ | (561 | ) | $ | (340 | ) | $ | 229 | $ | (22 | ) | |||||||||||||||||||
| Total traded indices | $ | 1,795 | $ | (676 | ) | $ | 963 | $ | 266 | $ | (422 | ) | ||||||||||||||||||||
| Credit default swaps on single-name issues: | ||||||||||||||||||||||||||||||||
| Sell protection: | ||||||||||||||||||||||||||||||||
| Bank of America Corp. | CSI | USD | 945 | 1.00% / 0.43% | 12/20/17 | $ | – | $ | (20 | ) | $ | 17 | $ | 37 | $ | – | ||||||||||||||||
| Bank of America Corp. | GSC | USD | 2,200 | 1.00% / 0.41% | 09/20/17 | – | (153 | ) | 37 | 190 | – | |||||||||||||||||||||
| Citigroup, Inc. | GSC | USD | 2,350 | 1.00% / 0.41% | 09/20/17 | – | (153 | ) | 40 | 193 | – | |||||||||||||||||||||
| Citigroup, Inc. | GSC | USD | 785 | 1.00% / 0.43% | 12/20/17 | – | (14 | ) | 14 | 28 | – | |||||||||||||||||||||
| Goldman Sachs Group, Inc. | CSI | USD | 495 | 1.00% / 0.51% | 12/20/17 | – | (15 | ) | 8 | 23 | – | |||||||||||||||||||||
| Goldman Sachs Group, Inc. | UBS | USD | 1,100 | 1.00% / 0.49% | 09/20/17 | – | (81 | ) | 16 | 97 | – | |||||||||||||||||||||
| Morgan Stanley | BCLY | USD | 1,100 | 1.00% / 0.48% | 09/20/17 | – | (123 | ) | 17 | 140 | – | |||||||||||||||||||||
| Morgan Stanley | GSC | USD | 520 | 1.00% / 0.50% | 12/20/17 | – | (27 | ) | 8 | 35 | – | |||||||||||||||||||||
| Total | $ | – | $ | (586 | ) | $ | 157 | $ | 743 | $ | – | |||||||||||||||||||||
| $ | 1,795 | $ | (1,262 | ) | $ | 1,120 | $ | 1,009 | $ | (422 | ) | |||||||||||||||||||||
| (a) | The maximum potential amount the Fund could be required to pay as a seller of credit protection or receive as a buyer of credit protection if a credit event occurs as defined under the terms of that particular swap agreement. |
| (b) | Implied credit spreads, utilized in determining the market value of credit default swap agreements on corporate issues, U.S. municipal issues or sovereign government issues as of period end serve as an indicator of the current status of the payment/performance risk and represent the likelihood of risk of default for the credit derivative. The implied credit spread of a particular entity reflects the cost of buying/selling protection and may include upfront payments required to be made to enter into the agreement. Wider credit spreads represent a deterioration of the reference entity's credit soundness and a greater likelihood or risk of default or other credit event occurring as defined under the terms of the agreement. The percentage shown is the implied credit spread on October 31, 2014. For credit default swap agreements on indices, the quoted market prices and resulting values serve as the indicator of the current status of the payment/performance risk. |
Centrally Cleared Credit Default Swap Contracts Outstanding at October 31, 2014
| Clearing | Notional | (Pay)/ Receive Fixed | Expiration | Market | Unrealized Appreciation/ (Depreciation) | Variation Margin | ||||||||||||||||||||||||||||||
| Reference Entity | House (a) | Amount (b) | Rate | Date | Cost Basis | Value ╪ | Asset | Liability | Asset | Liability | ||||||||||||||||||||||||||
| Credit default swaps on indices: | ||||||||||||||||||||||||||||||||||||
| Buy protection: | ||||||||||||||||||||||||||||||||||||
| CDX.NA.HY.22 | CME | USD | 4,643 | (5.00 | )% | 06/20/19 | $ | (311 | ) | $ | (348 | ) | $ | – | $ | (37 | ) | $ | – | $ | (16 | ) | ||||||||||||||
| CDX.NA.HY.23 | CME | USD | 4,675 | (5.00 | )% | 12/20/19 | (215 | ) | (327 | ) | – | (112 | ) | – | (18 | ) | ||||||||||||||||||||
| CDX.NA.IG.23 | CME | USD | 4,430 | (1.00 | )% | 12/20/19 | (68 | ) | (78 | ) | – | (10 | ) | – | (4 | ) | ||||||||||||||||||||
| ITRAXX.EUR.22 | ICE | EUR | 3,505 | (1.00 | )% | 12/20/19 | (69 | ) | (77 | ) | – | (8 | ) | – | (6 | ) | ||||||||||||||||||||
| ITRAXX.XOV.22 | ICE | EUR | 2,803 | (5.00 | )% | 12/20/19 | (220 | ) | (226 | ) | – | (6 | ) | 2 | (16 | ) | ||||||||||||||||||||
| Total | $ | (883 | ) | $ | (1,056 | ) | $ | – | $ | (173 | ) | $ | 2 | $ | (60 | ) | ||||||||||||||||||||
| (a) | The FCM to the contracts is GSC. |
| (b) | The maximum potential amount the Fund could be required to pay as a seller of credit protection or receive as a buyer of credit protection if a credit event occurs as defined under the terms of that particular swap agreement. |
The accompanying notes are an integral part of these financial statements.
| 18 |
| The Hartford Unconstrained Bond Fund |
| Schedule of Investments – (continued) |
| October 31, 2014 |
| (000’s Omitted) |
OTC Total Return Swap Contracts Outstanding at October 31, 2014
| Notional | Payments received | Expiration | Upfront Premiums | Upfront Premiums | Market | Unrealized Appreciation/(Depreciation) | ||||||||||||||||||||||||
| Reference Entity | Counterparty | Amount | (paid) by Fund | Date | Paid | Received | Value ╪ | Asset | Liability | |||||||||||||||||||||
| JPM CORP EMBI † | JPM | USD | 3,425 | 3M LIBOR - 1.00% | 12/24/14 | $ | – | $ | – | $ | (11 | ) | $ | – | $ | (11 | ) | |||||||||||||
| † | These securities were valued in good faith at fair value as determined under policies and procedures established by and under the supervision of the Company's Board of Directors. At October 31, 2014, the aggregate market value of these securities was $(11), which rounds to zero percent of total net assets. |
TBA Sale Commitments Outstanding at October 31, 2014
| Description | Principal Amount | Maturity Date | Market Value ╪ | Unrealized Appreciation/ Depreciation | ||||||||||
| FHLMC, 3.00% | $ | 1,300 | 11/15/2044 | $ | 1,301 | $ | (7 | ) | ||||||
| FHLMC, 3.50% | 600 | 11/15/2044 | 619 | (5 | ) | |||||||||
| FHLMC, 5.50% | 1,600 | 12/15/2044 | 1,783 | (4 | ) | |||||||||
| FNMA, 3.00% | 1,800 | 11/15/2029 | 1,867 | (4 | ) | |||||||||
| FNMA, 3.50% | 1,800 | 11/15/2029 | 1,902 | 3 | ||||||||||
| GNMA, 3.50% | 1,300 | 11/15/2044 | 1,360 | 6 | ||||||||||
| GNMA, 4.50% | 900 | 11/15/2044 | 982 | (4 | ) | |||||||||
| Total | $ | 9,814 | $ | (15 | ) | |||||||||
At October 31, 2014, the aggregate market value of these securities represents 8.7% of total net assets.
Foreign Currency Contracts Outstanding at October 31, 2014
| Unrealized Appreciation/(Depreciation) | ||||||||||||||||||||||
| Currency | Buy / Sell | Delivery Date | Counterparty | Contract Amount | Market Value ╪ | Asset | Liability | |||||||||||||||
| AUD | Buy | 11/28/2014 | BCLY | $ | 343 | $ | 344 | $ | 1 | $ | – | |||||||||||
| AUD | Buy | 11/28/2014 | BOA | 263 | 263 | – | – | |||||||||||||||
| AUD | Buy | 11/28/2014 | CBA | 262 | 262 | – | – | |||||||||||||||
| AUD | Sell | 11/28/2014 | GSC | 346 | 344 | 2 | – | |||||||||||||||
| CAD | Buy | 11/28/2014 | RBC | 679 | 675 | – | (4 | ) | ||||||||||||||
| CHF | Buy | 11/28/2014 | JPM | 421 | 419 | – | (2 | ) | ||||||||||||||
| CHF | Sell | 11/28/2014 | HSBC | 858 | 851 | 7 | – | |||||||||||||||
| EUR | Buy | 12/17/2014 | HSBC | 212 | 212 | – | – | |||||||||||||||
| EUR | Buy | 12/17/2014 | TDS | 362 | 356 | – | (6 | ) | ||||||||||||||
| EUR | Buy | 11/28/2014 | UBS | 419 | 417 | – | (2 | ) | ||||||||||||||
| EUR | Sell | 12/17/2014 | BCLY | 213 | 211 | 2 | – | |||||||||||||||
| EUR | Sell | 09/18/2015 | CBK | 175 | 170 | 5 | – | |||||||||||||||
| EUR | Sell | 12/17/2014 | DEUT | 858 | 831 | 27 | – | |||||||||||||||
| EUR | Sell | 11/04/2014 | HSBC | 212 | 212 | – | – | |||||||||||||||
| EUR | Sell | 11/28/2014 | JPM | 4,585 | 4,537 | 48 | – | |||||||||||||||
| GBP | Buy | 11/28/2014 | CBK | 487 | 486 | – | (1 | ) | ||||||||||||||
| GBP | Sell | 11/28/2014 | CBK | 871 | 870 | 1 | – | |||||||||||||||
| JPY | Buy | 12/17/2014 | JPM | 209 | 198 | – | (11 | ) | ||||||||||||||
| JPY | Sell | 12/17/2014 | GSC | 203 | 198 | 5 | – | |||||||||||||||
| JPY | Sell | 11/28/2014 | RBS | 512 | 492 | 20 | – | |||||||||||||||
| RSD | Buy | 09/18/2015 | CBK | 161 | 158 | – | (3 | ) | ||||||||||||||
| Total | $ | 118 | $ | (29 | ) | |||||||||||||||||
| ╪ | See Significant Accounting Policies of accompanying Notes to Financial Statements regarding valuation of securities. |
The accompanying notes are an integral part of these financial statements.
| 19 |
| The Hartford Unconstrained Bond Fund |
| Schedule of Investments – (continued) |
| October 31, 2014 |
| (000’s Omitted) |
| GLOSSARY: (abbreviations used in preceding Schedule of Investments) | ||
| Counterparty Abbreviations: | ||
| BCLY | Barclays | |
| BNP | BNP Paribas Securities Services | |
| BOA | Banc of America Securities LLC | |
| CBA | Commonwealth Bank of Australia | |
| CBK | Citibank NA | |
| CME | Chicago Mercantile Exchange | |
| CSI | Credit Suisse International | |
| DEUT | Deutsche Bank Securities, Inc. | |
| FCM | Futures Commission Merchant | |
| GSC | Goldman Sachs & Co. | |
| HSBC | HSBC Bank USA | |
| ICE | Intercontinental Exchange | |
| JPM | JP Morgan Chase & Co. | |
| MSC | Morgan Stanley | |
| RBC | RBC Dominion Securities, Inc. | |
| RBS | RBS Greenwich Capital | |
| TDS | TD Securities, Inc. | |
| UBS | UBS AG | |
| Currency Abbreviations: | ||
| AUD | Australian Dollar | |
| BRL | Brazilian Real | |
| CAD | Canadian Dollar | |
| CHF | Swiss Franc | |
| DOP | Dominican Peso | |
| EUR | EURO | |
| GBP | British Pound | |
| IDR | Indonesian New Rupiah | |
| INR | Indian Rupee | |
| JPY | Japanese Yen | |
| MXN | Mexican New Peso | |
| NGN | Nigerian Naira | |
| RSD | Serbian Dinar | |
| RUB | Russian New Ruble | |
| TRY | Turkish New Lira | |
| USD | U.S. Dollar | |
| UYU | Uruguayan Peso | |
| ZAR | South African Rand | |
| Index Abbreviations: | ||
| ABX.HE | Markit Asset Backed Security Home Equity | |
| ABX.HE.PEN | Markit Asset Backed Security Home Equity Penultimate | |
| CDX.EM | Credit Derivatives Emerging Markets | |
| CDX.NA.HY | Credit Derivatives North American High Yield | |
| CDX.NA.IG | Credit Derivatives North American Investment Grade | |
| CMBX.NA | Markit Commercial Mortgage Backed North American | |
| EMBI | Emerging Markets Bond Index | |
| ITRAXX.EUR | Markit iTraxx - Europe | |
| ITRAXX.XOV | Markit iTraxx Index - Europe Crossover | |
| PrimeX.ARM | Markit PrimeX Adjustable Rate Mortgage Backed Security | |
| PrimeX.FRM | Markit PrimeX Fixed Rate Mortgage Backed Security | |
| Other Abbreviations: | ||
| CLO | Collateralized Loan Obligation | |
| CR | Credit | |
| FHLMC | Federal Home Loan Mortgage Corp. | |
| FNMA | Federal National Mortgage Association | |
| FX | Foreign Exchange | |
| GNMA | Government National Mortgage Association | |
| IR | Interest Rate | |
| LIBOR | London Interbank Offered Rate | |
| OTC | Over-the-Counter | |
| TBA | To Be Announced | |
The accompanying notes are an integral part of these financial statements.
| 20 |
| The Hartford Unconstrained Bond Fund |
| Schedule of Investments – (continued) |
| October 31, 2014 |
| (000’s Omitted) |
Investment Valuation Hierarchy Level Summary
October 31, 2014
| Total | Level 1 ♦ | Level 2 ♦ | Level 3 | |||||||||||||
| Assets: | ||||||||||||||||
| Asset and Commercial Mortgage Backed Securities | $ | 31,719 | $ | – | $ | 26,768 | $ | 4,951 | ||||||||
| Corporate Bonds | 19,902 | – | 19,620 | 282 | ||||||||||||
| Foreign Government Obligations | 4,190 | – | 4,190 | – | ||||||||||||
| Municipal Bonds | 861 | – | 861 | – | ||||||||||||
| Preferred Stocks | 58 | 58 | – | – | ||||||||||||
| Senior Floating Rate Interests | 19,936 | – | 19,936 | – | ||||||||||||
| U.S. Government Agencies | 45,779 | – | 45,779 | – | ||||||||||||
| U.S. Government Securities | 16,099 | 850 | 15,249 | – | ||||||||||||
| Short-Term Investments | 12,601 | – | 12,601 | – | ||||||||||||
| Purchased Options | 38 | – | 38 | – | ||||||||||||
| Total | $ | 151,183 | $ | 908 | $ | 145,042 | $ | 5,233 | ||||||||
| Foreign Currency Contracts * | $ | 118 | $ | – | $ | 118 | $ | – | ||||||||
| Futures * | 61 | 61 | – | – | ||||||||||||
| Swaps - Credit Default * | 1,009 | – | 1,009 | – | ||||||||||||
| Total | $ | 1,188 | $ | 61 | $ | 1,127 | $ | – | ||||||||
| Liabilities: | ||||||||||||||||
| TBA Sale Commitments | $ | 9,814 | $ | – | $ | 9,814 | $ | – | ||||||||
| Written Options | 245 | – | 245 | – | ||||||||||||
| Total | $ | 10,059 | $ | – | $ | 10,059 | $ | – | ||||||||
| Foreign Currency Contracts * | $ | 29 | $ | – | $ | 29 | $ | – | ||||||||
| Futures * | 15 | 15 | – | – | ||||||||||||
| Swaps - Credit Default * | 595 | – | 595 | – | ||||||||||||
| Swaps - Total Return * | 11 | – | – | 11 | ||||||||||||
| Total | $ | 650 | $ | 15 | $ | 624 | $ | 11 | ||||||||
| ♦ | For the year ended October 31, 2014, investments valued at $639 were transferred from Level 1 to Level 2, and there were no transfers from Level 2 to Level 1. Investments are transferred between Level 1 and Level 2 for a variety of reasons including, but not limited to: |
| 1) | Foreign equities for which a fair value price is more representative of exit value than the local market close (transfer into Level 2). Foreign equities for which the local market close is more representative of exit value (transfer into Level 1). |
| 2) | U.S. Treasury securities that no longer represent the most recent issue (transfer into Level 2). |
| 3) | Equity investments with no observable trading but a bid or mean price is used (transfer into Level 2). Equity investments using observable quoted prices in an active market (transfer into Level 1). |
| * | Derivative instruments (excluding purchased and written options, if applicable) are valued at
the unrealized appreciation/depreciation on the investments. |
The accompanying notes are an integral part of these financial statements.
| 21 |
| The Hartford Unconstrained Bond Fund |
| Schedule of Investments – (continued) |
| October 31, 2014 |
| (000’s Omitted) |
Following is a reconciliation of Level 3 assets for which significant unobservable inputs were used to determine fair value:
| Balance
as of October 31, 2013 | Realized Gain (Loss) | Change
in Unrealized Appreciation (Depreciation) | Net Amortization | Purchases | Sales | Transfers Into Level 3 * | Transfers Out of Level 3 * | Balance
as of October 31, 2014 | ||||||||||||||||||||||||||||
| Assets: | ||||||||||||||||||||||||||||||||||||
| Asset & Commercial Mortgage Backed Securities | $ | 5,477 | $ | 279 | $ | 176 | † | $ | 243 | $ | 1,266 | $ | (2,644 | ) | $ | 230 | $ | (76 | ) | $ | 4,951 | |||||||||||||||
| Corporate Bonds | — | — | — ‡ | — | 282 | — | — | — | 282 | |||||||||||||||||||||||||||
| U.S. Government Agencies | 153 | — | — | — | — | — | — | (153 | ) | — | ||||||||||||||||||||||||||
| Total | $ | 5,630 | $ | 279 | $ | 176 | $ | 243 | $ | 1,548 | $ | (2,644 | ) | $ | 230 | $ | (229 | ) | $ | 5,233 | ||||||||||||||||
| Liabilities: | ||||||||||||||||||||||||||||||||||||
| Swaps§ | $ | — | $ | — | $ | 11 | ** | $ | — | $ | — | $ | — | $ | — | $ | — | $ | 11 | |||||||||||||||||
| Total | $ | — | $ | — | $ | 11 | $ | — | $ | — | $ | — | $ | — | $ | — | $ | 11 | ||||||||||||||||||
| * | Investments are transferred into and out of Level 3 for a variety of reasons including, but not limited to: |
1) Investments where trading has been halted (transfer into Level 3) or investments where trading has resumed (transfer out of Level 3).
2) Broker quoted investments (transfer into Level 3) or quoted prices in active markets (transfer out of Level 3).
3) Investments that have certain restrictions on trading (transfer into Level 3) or investments where trading restrictions have expired (transfer out of Level 3).
| † | Change in unrealized appreciation (depreciation) in the current period relating to assets still held at October 31, 2014 was $206. |
| ‡ | Change in unrealized appreciation (depreciation) in the current period relating to assets still held at October 31, 2014 was zero. |
| § | Derivative instruments not reflected in the Schedule of Investments are valued at the unrealized appreciation/ depreciation on the investment. |
| ** | Change in unrealized appreciation (depreciation) in the current period relating to assets still held at October 31, 2014 was $(11). |
| Note: | For purposes of reporting transfers between different hierarchy levels, both transfers in and out of each level, as applicable, are shown as if they occurred at the beginning of the period. |
The accompanying notes are an integral part of these financial statements.
| 22 |
| The Hartford Unconstrained Bond Fund |
| Statement of Assets and Liabilities |
| October 31, 2014 |
| (000’s Omitted) |
| Assets: | ||||
| Investments in securities, at market value (cost $150,624) | $ | 151,183 | ||
| Cash | 430 | |||
| Foreign currency on deposit with custodian (cost $—) | — | |||
| Unrealized appreciation on foreign currency contracts | 118 | |||
| Unrealized appreciation on OTC swap contracts | 1,009 | |||
| Receivables: | ||||
| Investment securities sold | 27,536 | |||
| Fund shares sold | 38 | |||
| Dividends and interest | 637 | |||
| Variation margin on financial derivative instruments | 51 | |||
| OTC swap premiums paid | 1,795 | |||
| Other assets | 75 | |||
| Total assets | 182,872 | |||
| Liabilities: | ||||
| Unrealized depreciation on foreign currency contracts | 29 | |||
| Unrealized depreciation on OTC swap contracts | 433 | |||
| TBA sale commitments, at market value (proceeds $9,799) | 9,814 | |||
| Payables: | ||||
| Investment securities purchased | 56,493 | |||
| Fund shares redeemed | 149 | |||
| Investment management fees | 12 | |||
| Dividends | 8 | |||
| Administrative fees | — | |||
| Distribution fees | 7 | |||
| Collateral received from broker | 895 | |||
| Variation margin on financial derivative instruments | 72 | |||
| Accrued expenses | 40 | |||
| OTC swap premiums received | 1,262 | |||
| Written option contracts (proceeds $283) | 245 | |||
| Other liabilities | 16 | |||
| Total liabilities | 69,475 | |||
| Net assets | $ | 113,397 | ||
| Summary of Net Assets: | ||||
| Capital stock and paid-in-capital | $ | 130,423 | ||
| Undistributed net investment income | 114 | |||
| Accumulated net realized loss | (18,257 | ) | ||
| Unrealized appreciation of investments and the translation of assets and liabilities denominated in foreign currency | 1,117 | |||
| Net assets | $ | 113,397 |
The accompanying notes are an integral part of these financial statements.
| 23 |
| The Hartford Unconstrained Bond Fund |
| Statement of Assets and Liabilities – (continued) |
| October 31, 2014 |
| (000’s Omitted) |
| Shares authorized | 500,000 | |||
| Par value | $ | 0.001 | ||
| Class A: Net asset value per share/Maximum offering price per share | $10.07/$10.54 | |||
| Shares outstanding | 6,973 | |||
| Net assets | $ | 70,192 | ||
| Class B: Net asset value per share | $ | 10.06 | ||
| Shares outstanding | 196 | |||
| Net assets | $ | 1,974 | ||
| Class C: Net asset value per share | $ | 10.09 | ||
| Shares outstanding | 1,573 | |||
| Net assets | $ | 15,869 | ||
| Class I: Net asset value per share | $ | 10.07 | ||
| Shares outstanding | 527 | |||
| Net assets | $ | 5,311 | ||
| Class R3: Net asset value per share | $ | 10.05 | ||
| Shares outstanding | 19 | |||
| Net assets | $ | 193 | ||
| Class R4: Net asset value per share | $ | 10.05 | ||
| Shares outstanding | 16 | |||
| Net assets | $ | 161 | ||
| Class R5: Net asset value per share | $ | 10.05 | ||
| Shares outstanding | 11 | |||
| Net assets | $ | 113 | ||
| Class Y: Net asset value per share | $ | 10.04 | ||
| Shares outstanding | 1,951 | |||
| Net assets | $ | 19,584 |
The accompanying notes are an integral part of these financial statements.
| 24 |
| The Hartford Unconstrained Bond Fund |
| Statement of Operations |
| For the Year Ended October 31, 2014 |
| (000’s Omitted) |
| Investment Income: | ||||
| Dividends | $ | 5 | ||
| Interest | 4,572 | |||
| Less: Foreign tax withheld | (2 | ) | ||
| Total investment income | 4,575 | |||
| Expenses: | ||||
| Investment management fees | 653 | |||
| Administrative services fees | ||||
| Class R3 | 1 | |||
| Class R4 | — | |||
| Class R5 | — | |||
| Transfer agent fees | ||||
| Class A | 146 | |||
| Class B | 9 | |||
| Class C | 22 | |||
| Class I | 1 | |||
| Class R3 | — | |||
| Class R4 | — | |||
| Class R5 | — | |||
| Class Y | — | |||
| Distribution fees | ||||
| Class A | 193 | |||
| Class B | 25 | |||
| Class C | 168 | |||
| Class R3 | 1 | |||
| Class R4 | — | |||
| Custodian fees | 24 | |||
| Accounting services fees | 30 | |||
| Registration and filing fees | 110 | |||
| Board of Directors' fees | 4 | |||
| Audit fees | 12 | |||
| Other expenses | 35 | |||
| Total expenses (before waivers and fees paid indirectly) | 1,434 | |||
| Expense waivers | (172 | ) | ||
| Transfer agent fee waivers | (1 | ) | ||
| Custodian fee offset | — | |||
| Total waivers and fees paid indirectly | (173 | ) | ||
| Total expenses, net | 1,261 | |||
| Net Investment Income | 3,314 | |||
| Net Realized Gain on Investments, Other Financial Instruments and Foreign Currency Transactions: | ||||
| Net realized gain on investments | 3,535 | |||
| Less: Foreign taxes paid on realized capital gains | (3 | ) | ||
| Net realized gain on purchased option contracts | 26 | |||
| Net realized loss on TBA sale transactions | (678 | ) | ||
| Net realized loss on futures contracts | (1,732 | ) | ||
| Net realized gain on written option contracts | 4 | |||
| Net realized loss on swap contracts | (1,371 | ) | ||
| Net realized gain on foreign currency contracts | 488 | |||
| Net realized loss on other foreign currency transactions | (15 | ) | ||
| Net Realized Gain on Investments, Other Financial Instruments and Foreign Currency Transactions | 254 | |||
| Net Changes in Unrealized Appreciation of Investments, Other Financial Instruments and Foreign Currency Transactions: | ||||
| Net unrealized depreciation of investments | (320 | ) | ||
| Net unrealized depreciation of purchased option contracts | (66 | ) | ||
| Net unrealized appreciation of TBA sale commitments | 75 | |||
| Net unrealized appreciation of futures contracts | 106 | |||
| Net unrealized appreciation of written option contracts | 38 | |||
| Net unrealized appreciation of swap contracts | 271 | |||
| Net unrealized depreciation of foreign currency contracts | (90 | ) | ||
| Net unrealized depreciation of translation of other assets and liabilities in foreign currencies | (2 | ) | ||
| Net Changes in Unrealized Appreciation of Investments, Other Financial Instruments and Foreign Currency Transactions | 12 | |||
| Net Gain on Investments, Other Financial Instruments and Foreign Currency Transactions | 266 | |||
| Net Increase in Net Assets Resulting from Operations | $ | 3,580 |
The accompanying notes are an integral part of these financial statements.
| 25 |
| The Hartford Unconstrained Bond Fund |
| Statement of Changes in Net Assets |
| (000’s Omitted) |
| For the Year Ended October 31, 2014 | For the Year Ended October 31, 2013 | |||||||
| Operations: | ||||||||
| Net investment income | $ | 3,314 | $ | 3,398 | ||||
| Net realized gain (loss) on investments, other financial instruments and foreign currency transactions | 254 | (5,343 | ) | |||||
| Net unrealized appreciation (depreciation) of investments, other financial instruments and foreign currency transactions | 12 | (773 | ) | |||||
| Net Increase (Decrease) in Net Assets Resulting from Operations | 3,580 | (2,718 | ) | |||||
| Distributions to Shareholders: | ||||||||
| From net investment income | ||||||||
| Class A | (2,021 | ) | (2,916 | ) | ||||
| Class B | (51 | ) | (89 | ) | ||||
| Class C | (329 | ) | (527 | ) | ||||
| Class I | (66 | ) | (53 | ) | ||||
| Class R3 | (4 | ) | (4 | ) | ||||
| Class R4 | (4 | ) | (3 | ) | ||||
| Class R5 | (4 | ) | (4 | ) | ||||
| Class Y | (545 | ) | (344 | ) | ||||
| Total from net investment income | (3,024 | ) | (3,940 | ) | ||||
| From tax return of capital | ||||||||
| Class A | (333 | ) | — | |||||
| Class B | (8 | ) | — | |||||
| Class C | (54 | ) | — | |||||
| Class I | (11 | ) | — | |||||
| Class R3 | (1 | ) | — | |||||
| Class R4 | (1 | ) | — | |||||
| Class R5 | (1 | ) | — | |||||
| Class Y | (90 | ) | — | |||||
| Total from tax return of capital | (499 | ) | — | |||||
| Total distributions | (3,523 | ) | (3,940 | ) | ||||
| Capital Share Transactions: | ||||||||
| Class A | (14,935 | ) | (30,691 | ) | ||||
| Class B | (1,264 | ) | (1,772 | ) | ||||
| Class C | (2,858 | ) | (9,856 | ) | ||||
| Class I | 3,731 | 554 | ||||||
| Class R3 | 15 | 46 | ||||||
| Class R4 | 31 | 26 | ||||||
| Class R5 | (35 | ) | 45 | |||||
| Class Y | 1,596 | 18,437 | ||||||
| Net decrease from capital share transactions | (13,719 | ) | (23,211 | ) | ||||
| Net Decrease in Net Assets | (13,662 | ) | (29,869 | ) | ||||
| Net Assets: | ||||||||
| Beginning of period | 127,059 | 156,928 | ||||||
| End of period | $ | 113,397 | $ | 127,059 | ||||
| Undistributed (distributions in excess of) net investment income | $ | 114 | $ | 589 | ||||
The accompanying notes are an integral part of these financial statements.
| 26 |
| The Hartford Unconstrained Bond Fund |
| Notes to Financial Statements |
| October 31, 2014 |
| (000’s Omitted) |
Organization:
The Hartford Mutual Funds, Inc. (“Company”) is an open-end management investment company comprised of forty-two portfolios. Financial statements for The Hartford Unconstrained Bond Fund (the "Fund"), a series of the Company, are included in this report.
The Company is organized under the laws of the State of Maryland and is registered with the Securities and Exchange Commission (“SEC”) under the Investment Company Act of 1940, as amended (“1940 Act”). The Fund is a diversified open-end management investment company. The Fund is an investment company and applies specialized accounting and reporting under Accounting Standards Codification Topic 946, Financial Services - Investment Companies.
Class A shares are sold with a front-end sales charge of up to 4.50%. Class B shares were sold with a contingent deferred sales charge which is assessed on the lesser of the per share net asset value (“NAV”) of the shares at the time of redemption or the original purchase price, and declines from up to 5.00% to zero depending on the period of time the shares are held (see note below regarding the closing of Class B shares). Class C shares are sold with a contingent deferred sales charge of up to 1.00% on shares redeemed within twelve months of purchase. Class I shares are sold without sales charges to certain eligible investors primarily through advisory fee-based wrap programs. Class R3, R4 and R5 shares, which are offered to employer-sponsored retirement plans, and Class Y shares, which are sold to certain eligible institutional investors, are sold without a sales charge. All classes of shares have identical voting, redemption, dividend, liquidation and other rights and the same terms and conditions, with the exceptions that each class may have different expenses, which may affect performance, and that Class B shares automatically convert to Class A shares after 8 years.
No new or additional investments are allowed in Class B shares of the Fund (including investments through any systematic investment plan). Existing shareholders of Class B shares may continue to hold their Class B shares, exchange their Class B shares for Class B shares of another Hartford Fund (as permitted by existing exchange privileges), or redeem their Class B shares as described in the Fund’s prospectus. Reinstatement privileges with respect to Class B shares are set forth in the Fund's prospectus. For investors electing to reinvest capital gains and dividends, any such capital gains or dividends on Class B shares will continue to be reinvested in Class B shares of the Fund. All Class B share attributes, including the 12b-1 fee, contingent deferred sales charge schedule, and conversion to Class A shares, remain unchanged.
Significant Accounting Policies:
The following is a summary of significant accounting policies of the Fund in the preparation of its financial statements, which are in accordance with United States generally accepted accounting principles (“U.S. GAAP”). The preparation of financial statements in accordance with U.S. GAAP may require management to make estimates and assumptions that affect the reported amounts of assets and liabilities and disclosure of contingent assets and liabilities at the date of the financial statements and the reported amounts of increases and decreases in net assets from operations during the reporting period. Actual results could differ from those estimates.
Determination of Net Asset Value – The NAV of each class of the Fund's shares is determined as of the close of regular trading (normally 4:00 p.m. Eastern Time) (the “NYSE Close”) on each day that the New York Stock Exchange (the “Exchange”) is open (“Valuation Date”). Information that becomes known to the Fund after the NAV has been calculated on a particular day will not generally be used to retroactively adjust the NAV determined earlier that day.
Investment Valuation and Fair Value Measurements – For purposes of calculating the NAV, portfolio investments and other assets held by the Fund's portfolio for which market quotes are readily available are valued at market value. Market value is generally determined on the basis of last reported sales prices or official close price. If no sales are reported, market value is based on quotes obtained from a quotation reporting system, established market makers, or independent pricing services. If market prices are not readily available or are deemed unreliable, the Fund will use the fair value of the investment as determined in good faith under policies and procedures established by and under the supervision of the Company's Board of Directors. Market quotes are considered not readily available where there is an absence of current or reliable market-based data (e.g., trade information or indicative market quotes), including where events occur after the close of the relevant market, but prior to the NYSE Close, that materially affect the values of the Fund's portfolio investments or assets. In addition, market quotes are considered not readily available when, due to extraordinary circumstances, the exchanges or markets on which the investments trade do not open for trading for the entire day and
| 27 |
| The Hartford Unconstrained Bond Fund |
| Notes to Financial Statements – (continued) |
| October 31, 2014 |
| (000’s Omitted) |
no other market prices are available. There can be no assurance that the Fund could obtain the fair market value assigned to an investment if the Fund were to sell the investment at approximately the time at which the Fund determines its NAV.
Fixed income investments (other than short-term obligations), non-exchange traded derivatives and centrally cleared swaps held by the Fund are normally valued on the basis of quotes obtained from independent pricing services or brokers and dealers in accordance with procedures established by the Company's Board of Directors. Prices obtained from independent pricing services use information provided by market makers or estimates of market values through accepted market modeling, trading and pricing conventions. Inputs to the models may include, but are not limited to, prepayment speeds, pricing spread, yield, trade information, dealer quotes, market color, cash flow models and the investment’s terms and conditions. Generally, the Fund may use fair valuation in regard to fixed income investments when the Fund holds defaulted or distressed investments or investments in a company in which a reorganization is pending. Senior floating rate interests generally trade in over-the-counter (“OTC”) markets and are priced through an independent pricing service utilizing independent market quotations from loan dealers or financial institutions. A composite bid price is used, which is an average of the dealer marks and dealer runs. Short-term investments maturing in 60 days or less are generally valued at amortized cost, if their original term to maturity was 60 days or less, or by amortizing their value on the 61st day prior to maturity, if the original term to maturity exceeded 60 days, which approximates fair value.
Exchange traded options, futures and options on futures are valued at the settlement price or last trade price determined by the relevant exchange as of the NYSE Close. If the last trade price for exchange traded options does not fall between the bid and ask prices, the value will be the mean of the bid and ask prices as of the NYSE Close. If a last trade price is not available, the value will be the mean of the bid and ask prices as of the NYSE Close. If a mean of the bid and ask prices cannot be calculated for the day, the value will be the bid price as of the NYSE Close. In the case of OTC options and such instruments that do not trade on an exchange, values may be supplied by a pricing service using a formula or other objective method that may take into consideration the style, direction, expiration, strike price, notional value and volatility or other special adjustments.
Investments valued in currencies other than U.S. dollars are converted to U.S. dollars using exchange rates obtained from independent pricing services for calculation of the NAV. As a result, the NAV of the Fund’s shares may be affected by changes in the value of currencies in relation to the U.S. dollar. The value of investments traded in markets outside the United States or denominated in currencies other than the U.S. dollar may be affected significantly on a day that the NYSE is closed and the market value may change on days when an investor is not able to purchase, redeem or exchange shares of the Fund.
Foreign currency contracts represent agreements to exchange currencies on specific future dates at predetermined rates. Foreign currency contracts are valued using foreign currency exchange rates and forward rates as provided by an independent pricing service on the Valuation Date.
Investments in open-end mutual funds are valued at the respective NAV of each open-end mutual fund on the Valuation Date.
Financial instruments for which prices are not available from an independent pricing service may be valued using market quotations obtained from one or more dealers that make markets in the respective financial instrument in accordance with procedures established by the Company's Board of Directors.
U.S. GAAP defines fair value as the price that the Fund would receive to sell an asset or pay to transfer a liability in an orderly transaction between market participants. The U.S. GAAP fair value measurement standards require disclosure of a fair value hierarchy for each major category of assets and liabilities. Various inputs are used in determining the fair value of the Fund’s investments. These inputs are summarized into three broad hierarchy levels. This hierarchy is based on whether the valuation inputs are observable or unobservable. These levels are:
Level 1 – Quoted prices in active markets for identical investments. Level 1 may include exchange traded instruments, such as domestic equities, some foreign equities, options, futures, mutual funds, exchange traded funds, rights and warrants.
Level 2 – Observable inputs other than Level 1 prices, such as quoted prices for similar investments; quoted prices in markets that are not active; or other inputs that are observable or can be corroborated by observable market data. Level 2 may include debt investments that are traded less frequently than exchange traded instruments and which are valued using independent
| 28 |
| The Hartford Unconstrained Bond Fund |
| Notes to Financial Statements – (continued) |
| October 31, 2014 |
| (000’s Omitted) |
pricing services; foreign equities, which are principally traded on certain foreign markets and are adjusted daily pursuant to a fair value pricing service in order to reflect an adjustment for the factors occurring after the close of certain foreign markets but before the NYSE Close; senior floating rate interests, which are valued using an aggregate of dealer bids; short-term investments, which are valued at amortized cost; and swaps, which are valued based upon the terms of each swap contract.
Level 3 – Significant unobservable inputs that are supported by limited or no market activity. Level 3 may include financial instruments whose values are determined using indicative market quotes or require significant management judgment or estimation. These unobservable valuation inputs may include estimates for current yields, maturity/duration, prepayment speed, and indicative market quotes for comparable investments along with other assumptions relating to credit quality, collateral value, complexity of the investment structure, general market conditions and liquidity. This category may include investments where trading has been halted or there are certain restrictions on trading. While these investments are priced using unobservable inputs, the valuation of these investments reflects the best available data and management believes the prices are a reasonable representation of exit price. For more information on specific valuation techniques and unobservable inputs, please see the following table titled “Quantitative Information about Level 3 Fair Value Measurements.”
The Board of Directors of the Company generally reviews and approves the “Procedures for Valuation of Portfolio Securities” at least once a year. These procedures define how investments are to be valued, including the formation and activities of a Valuation Committee. The Valuation Committee is responsible for determining in good faith the fair value of investments when the value cannot be obtained from primary pricing services or alternative sources or if the valuation of an investment as provided by the primary pricing service or alternative source is believed not to reflect the investment’s fair value as of the Valuation Date. Voting members of the Valuation Committee include the Fund’s Treasurer or designee and a Vice President of the investment manager or designee. An Assistant Vice President of the Fund with legal expertise or designee is also included on the Valuation Committee as a non-voting advisory member. In addition, the Fund’s Chief Compliance Officer shall designate a member of the compliance group to attend Valuation Committee meetings as a non-voting resource, to monitor for and provide guidance with respect to compliance with these procedures. Two members of the Valuation Committee or their designees, representing different departments, shall constitute a quorum for purposes of permitting the Valuation Committee to take action. The Valuation Committee will consider all relevant factors in determining an investment’s fair value, and may seek the advice of the Fund’s sub-adviser, knowledgeable brokers, and legal counsel in making such determination. The Valuation Committee reports to the Audit Committee of the Company’s Board of Directors. The Audit Committee receives quarterly written reports which include details of all fair-valued investments, including the reason for the fair valuation, and an indication, when possible, of the accuracy of the valuation by disclosing the next available reliable public price quotation or the disposition price of such investments (the “look-back” test). The Board of Directors then must consider for ratification all of the fair value determinations made during the previous quarter.
Valuation levels are not necessarily indicative of the risk associated with investing in such investments. Individual investments within any of the above mentioned asset classes may be assigned a different hierarchical level than those presented above, as individual circumstances dictate.
For additional information, refer to the Investment Valuation Hierarchy Level Summary and the Level 3 roll-forward reconciliation, if applicable, which follow the Schedule of Investments.
| 29 |
| The Hartford Unconstrained Bond Fund |
| Notes to Financial Statements – (continued) |
| October 31, 2014 |
| (000’s Omitted) |
| Quantitative Information about Level 3 Fair Value Measurements: | ||||||||
| Security Type/Valuation Technique | Unobservable Input * | Input
Value(s) Range (Weighted Average) ‡ | Fair
Value at October 31, 2014 | |||||
| Assets: | ||||||||
| Asset and Commercial Mortgage Backed Securities | ||||||||
| Discounted cash flow | Internal rate of return | 3.08% - 6.87% (4.53%) | 4,483 | |||||
| Life expectancy (in months) | 24 - 296 (148) | |||||||
| Independent pricing service | Prior day valuation | $67.09 - $68.63 ($67.31) | 468 | |||||
| Indicative market quotations | Broker quote † | $0.000001 | – | |||||
| Corporate Bonds | ||||||||
| Cost | Recent trade price | $102.45 | 282 | |||||
| Date | 10/14/2014 | |||||||
| Total | $ | 5,233 | ||||||
| Liabilities: | ||||||||
| Swap Contracts: ▲ | ||||||||
| Independent pricing service | Prior day valuation | ($0.31) | 11 | |||||
| Total | $ | 11 | ||||||
| * | Significant changes to any unobservable inputs may result in a significant change to the fair value. |
| ‡ | Unless otherwise noted, inputs were weighted based on the fair value of the investments included in the range. |
| † | The broker quote represents the best available estimate of fair value per share as of October 31, 2014. |
| ▲ | Derivative instruments are valued at the unrealized appreciation/depreciation on the investments. |
Investment Transactions and Investment Income – Investment transactions are recorded as of the trade date (the date the order to buy or sell is executed) for financial reporting purposes. Investments purchased or sold on a when-issued or delayed-delivery basis may be settled a month or more after the trade date. Realized gains and losses are determined on the basis of identified cost.
Trade date for senior floating rate interests purchased in the primary loan market is considered the date on which the loan allocations are determined. Trade date for senior floating rate interests purchased in the secondary loan market is the date on which the transaction is entered into.
Dividend income from domestic securities is accrued on the ex-dividend date. Interest income, including amortization of premium, accretion of discounts and additional principal received in-kind in lieu of cash, is accrued on a daily basis. Paydown gains and losses on mortgage related and other asset backed securities are included in interest income in the Statement of Operations, as applicable.
Taxes – The Fund may be subject to taxes imposed on realized gains on securities of certain foreign countries in which the Fund invests. The amount of foreign tax expense is included on the accompanying Statement of Operations as a reduction to net realized gain on investments in these securities.
Foreign Currency Transactions – Assets and liabilities denominated in currencies other than U.S. dollars are translated into U.S. dollars at the exchange rates in effect on the valuation date. Purchases and sales of investments, income and expenses are translated into U.S. dollars at the exchange rates on the dates of such transactions.
The Fund does not isolate that portion of portfolio investment valuation resulting from fluctuations in the foreign currency exchange rates from the fluctuations arising from changes in the market prices of investments held. Exchange rate fluctuations are included with the net realized and unrealized gain or loss on investments in the accompanying financial statements.
Net realized foreign exchange gains or losses arise from sales of foreign currencies and the difference between asset and liability amounts initially stated in foreign currencies and the U.S. dollar value of the amounts actually received or paid. Net unrealized foreign exchange gains or losses arise from changes in the value of other assets and liabilities at the end of the reporting period, resulting from changes in the exchange rates.
Joint Trading Account – The Fund may invest cash balances into a joint trading account that may be invested in one or more repurchase agreements.
| 30 |
| The Hartford Unconstrained Bond Fund |
| Notes to Financial Statements – (continued) |
| October 31, 2014 |
| (000’s Omitted) |
Fund Share Valuation and Dividend Distributions to Shareholders – Orders for the Fund’s shares are executed in accordance with the investment instructions of the shareholders. The NAV of the Fund’s shares is determined as of the close of business on each business day of the Exchange. The NAV is determined separately for each class of shares of the Fund by dividing the Fund’s net assets attributable to that class by the number of shares of the class outstanding. Each class of shares offered by the Fund has equal rights as to assets and voting privileges (except that shareholders of a class have exclusive voting rights regarding any matter relating solely to that class of shares). Income and non-class specific expenses are allocated daily to each class on the basis of the relative net assets of the class. Realized and unrealized gains and losses are allocated daily based on the relative net assets of each class of shares of the Fund.
Orders for the purchase of the Fund’s shares received prior to the close of the Exchange on any day the Exchange is open for business are priced at the NAV determined as of the close of the Exchange. Orders received after the close of the Exchange, or on a day on which the Exchange and/or the Fund is not open for business, are priced at the next determined NAV.
Dividends are declared pursuant to a policy adopted by the Company's Board of Directors based upon the investment performance of the Fund. Normally, dividends from net investment income are declared daily and paid monthly. Dividends from realized gains, if any, are paid at least once a year.
Net investment income, dividends and distributions from net realized gains and capital are determined in accordance with federal income tax regulations, which may differ from U.S. GAAP with respect to character and timing (see Federal Income Taxes: Distributions and Components of Distributable Earnings and Reclassification of Capital Accounts).
Securities and Other Investments:
Repurchase Agreements – A repurchase agreement is an agreement by which a counterparty agrees to sell an investment and agrees to repurchase the investment sold from the buyer at a mutually agreed upon time and price. During the period of the repurchase agreement, the counterparty will deposit cash and or securities in a third party custodial account to serve as collateral. At the time the Fund enters into a repurchase agreement, the value of the underlying collateral, including accrued interest, will be equal to or exceed the value of the repurchase agreement. Repurchase agreements expose the Fund to counterparty risk - that is, the risk that the counterparty will not fulfill its obligations. To minimize counterparty risk, the investments that serve to collateralize the repurchase agreement are held by the Fund’s custodian in book entry or physical form in the custodial account of the Fund or in a third party custodial account. Repurchase agreements are valued at cost plus accrued interest, which approximates fair value. Repurchase agreements have master netting arrangements which allow the Fund to offset amounts owed to a counterparty with amounts owed by the counterparty, including any collateral. Upon an event of default under a master repurchase agreement, the non-defaulting party may close out all transactions traded under such agreement and net amounts owed under each transaction to one net amount payable by one party to the other. Absent an event of default, the master repurchase agreement does not result in an offset of reported amounts of assets and liabilities in the Statement of Assets and Liabilities across transactions between the Fund and the applicable counterparty. The Fund, as shown on the Schedule of Investments, had outstanding repurchase agreements and related collateral as of October 31, 2014.
Illiquid and Restricted Investments – The Fund is permitted to invest up to 15% of its net assets in illiquid investments. Illiquid investments are those that may not be sold or disposed of in the ordinary course of business within seven days, at approximately the price used to determine the Fund’s NAV. The Fund may not be able to sell illiquid investments when its sub-adviser considers it desirable to do so or may have to sell such investments at a price that is lower than the price that could be obtained if the investments were more liquid. A sale of illiquid investments may require more time and may result in higher dealer discounts and other selling expenses than does the sale of those that are liquid. Illiquid investments also may be more difficult to value due to the unavailability of reliable market quotations for such investments, and an investment in them may have an adverse impact on the Fund’s NAV. The Fund may also purchase certain restricted investments that can only be resold to certain qualified investors and may be determined to be liquid pursuant to policies and guidelines established by the Company's Board of Directors. The Fund, as shown on the Schedule of Investments, had illiquid or restricted investments as of October 31, 2014.
Investments Purchased on a When-Issued or Delayed-Delivery Basis – Delivery and payment for investments that have been purchased by the Fund on a forward commitment, or when-issued or delayed-delivery basis, take place beyond the customary
| 31 |
| The Hartford Unconstrained Bond Fund |
| Notes to Financial Statements – (continued) |
| October 31, 2014 |
| (000’s Omitted) |
settlement period. The Fund may dispose of or renegotiate a delayed-delivery transaction after it is entered into, and may sell delayed-delivery investments before they are delivered, which may result in a realized gain or loss. During this period, such investments are subject to market fluctuations, and the Fund identifies investments segregated in its records with a value at least equal to the amount of the commitment. The Fund, as shown on the Schedule of Investments, had when-issued or delayed-delivery investments as of October 31, 2014.
In connection with the Fund’s ability to purchase investments on a when-issued or forward commitment basis, the Fund may enter into to-be announced (“TBA”) commitments. TBA commitments are forward agreements for the purchase or sale of mortgage backed securities for a fixed price, with payment and delivery on an agreed-upon future settlement date. The specific securities to be delivered are not identified at the trade date; however, delivered securities must meet specified terms, including issuer, rate and mortgage terms. Although the Fund may enter into TBA commitments with the intention of acquiring or delivering securities for its portfolio, the Fund can extend the settlement date, roll the transaction, or dispose of a commitment prior to settlement if deemed appropriate to do so. If the TBA commitment is closed through the acquisition of an offsetting TBA commitment, the Fund realizes a gain or loss. In a TBA roll transaction, the Fund generally purchases or sells the initial TBA commitment prior to the agreed upon settlement date and enters into a new TBA commitment for future delivery or receipt of the mortgage backed securities. TBA commitments involve a risk of loss if the value of the security to be purchased or sold declines or increases, respectively, prior to settlement date.
The Fund may enter into “dollar rolls” in which the Fund sells securities and contracts with the same counterparty to repurchase substantially similar securities (for example, same issuer, coupon and maturity) on a specified future date at an agreed upon price. The Fund gives up the right to receive interest paid on the investments sold. The Fund would benefit to the extent of any differences between the price received for the security and the lower forward price for the future purchase. Dollar rolls involve the risk that the market value of the securities that the Fund is required to purchase may decline below the agreed upon repurchase price of those securities. The Fund records dollar roll transactions as purchases and sales and realizes gains and losses on these transactions. These transactions are excluded from the Fund’s portfolio turnover rate. The Fund, as shown on the Schedule of Investments, had open TBA commitments as of October 31, 2014, which may be a part of dollar roll transactions.
Senior Floating Rate Interests – The Fund may invest in senior floating rate interests. Senior floating rate interests hold the most senior position in the capital structure of a business entity (the “Borrower”), are typically secured by specific collateral and have a claim on the assets and/or stock of the Borrower that is senior to the assets held by subordinated debtholders and stockholders of the Borrower. Senior floating rate interests are typically structured and administered by a financial institution that acts as the agent of the lenders participating in the senior floating rate interest. The Fund may invest in multiple series or tranches of a senior floating rate interest, which may have varying terms and carry different associated risks. The Fund may also enter into unfunded loan commitments, which are contractual obligations for future funding. Unfunded loan commitments may include revolving credit facilities, which may obligate the Fund to supply additional cash to the borrower on demand, representing a potential financial obligation by the Fund in the future. The Fund may receive a commitment fee based on the undrawn portion of the underlying line of credit portion of a senior floating rate interest. In certain circumstances, the Fund may receive various fees upon the restructure of a senior floating rate interest by a borrower. Fees earned/paid are recorded as a component of income or realized gain/loss in the Statement of Operations.
Senior floating rate interests are typically rated below-investment-grade, which suggests the risk of default is higher, and generally pay higher interest rates than investment-grade debt securities. A default could lead to non-payment of income or principal, which would result in a reduction of investment income to the Fund, and there can be no assurance that the liquidation of any collateral would satisfy the Borrower’s obligation in the event of non-payment of scheduled interest or principal payments, or that such collateral could be readily liquidated. The Fund, as shown on the Schedule of Investments, had senior floating rate interests as of October 31, 2014.
Mortgage Related and Other Asset Backed Securities – The Fund may invest in mortgage related and other asset backed securities. These securities include mortgage pass-through securities, collateralized mortgage obligations, commercial mortgage backed securities, stripped mortgage backed securities, asset backed securities, collateralized debt obligations and other securities that directly or indirectly represent a participation in, or are secured by and payable from, mortgage loans on real property. Mortgage related securities are created from pools of residential or commercial mortgage loans, including mortgage loans made by savings and loan institutions, mortgage bankers, commercial banks and other similar financial institutions. Asset backed securities are created
| 32 |
| The Hartford Unconstrained Bond Fund |
| Notes to Financial Statements – (continued) |
| October 31, 2014 |
| (000’s Omitted) |
from many types of assets, including auto loans, credit card receivables, home equity loans, and student loans. These securities provide a monthly payment that consists of both interest and principal payments. Interest payments may be determined by fixed or adjustable rates. The rate of pre-payments on underlying mortgages will affect the price and volatility of a mortgage related security, and may have the effect of shortening or extending the effective duration of the security relative to what was anticipated at the time of purchase. The timely payment of principal and interest of certain mortgage related securities is guaranteed by the full faith and credit of the United States Government. Mortgage related and other asset backed securities created and guaranteed by non-governmental issuers, including government-sponsored corporations, may be supported by various forms of insurance or guarantees, but there can be no assurance that the private insurers or guarantors can meet their obligations under the insurance policies or guarantee arrangements. The Fund, as shown on the Schedule of Investments, had outstanding mortgage related and other asset backed securities as of October 31, 2014.
Inflation Indexed Bonds – The Fund may invest in inflation indexed bonds. Inflation indexed bonds are fixed income investments whose principal value is periodically adjusted to the rate of inflation. The interest rate on these bonds is generally fixed at issuance at a rate lower than typical bonds. Over the life of an inflation indexed bond, however, interest will be paid based on a principal value, which is adjusted for inflation. Any increase or decrease in the principal amount of an inflation indexed bond will be included as interest income on the Statement of Operations, even though investors do not receive the principal amount until maturity. The Fund, as shown on the Schedule of Investments, had inflation indexed bonds as of October 31, 2014.
Financial Derivative Instruments:
The following disclosures contain information on how and why the Fund uses derivative instruments, the credit-risk-related contingent features in certain derivative instruments and how derivative instruments affect the Fund’s financial position and results of operations. The location and fair value amounts of these instruments on the Statement of Assets and Liabilities and the realized gains and losses and changes in unrealized gains and losses on the Statement of Operations, each categorized by type of derivative contract, are included in the following Additional Derivative Instrument Information footnote. The derivative instruments outstanding as of year-end are disclosed in the notes to the Schedule of Investments, if applicable. The amounts of realized gains and losses and changes in unrealized gains and losses on derivative instruments during the year are disclosed in the Statement of Operations.
Foreign Currency Contracts – The Fund may enter into foreign currency contracts that obligate the Fund to purchase or sell currencies at specified future dates. Foreign currency contracts are used to hedge the currency exposure associated with some or all of the Fund’s investments and/or as part of an investment strategy. Foreign currency contracts are marked to market daily and the change in value is recorded by the Fund as an unrealized gain or loss. The Fund will record a realized gain or loss when the foreign currency contract is settled.
Foreign currency contracts involve elements of market risk in excess of the amounts reflected in the Statement of Assets and Liabilities. In addition, risks may arise upon entering into these contracts from the potential inability of the counterparties to meet the terms of the contracts and from unanticipated movements in the value of the foreign currencies relative to the U.S. dollar. The Fund, as shown on the Schedule of Investments, had outstanding foreign currency contracts as of October 31, 2014.
Futures Contracts – The Fund may enter into futures contracts. A futures contract is an agreement between two parties to buy or sell an asset at a set price on a future date. The Fund uses futures contracts to manage or obtain exposure to the investment markets, commodities, or movements in interest rates and currency values. The primary risks associated with the use of futures contracts are the imperfect correlation between the change in market value of the investments held by the Fund and the prices of futures contracts and the possibility of an illiquid market. Upon entering into a futures contract, the Fund is required to deposit with a futures commission merchant (“FCM”) an amount of cash or U.S. Government or Agency Obligations in accordance with the initial margin requirements of the broker or exchange. Futures contracts are marked to market daily at the most recent settlement price reported by an exchange on which, over time, they are traded most extensively, and an appropriate payable or receivable for the change in value (“variation margin”) is recorded by the Fund. Gains or losses are recognized but not considered realized until the contracts expire or are closed. Futures contracts involve, to varying degrees, risk of loss in excess of the variation margin disclosed on the Statement of Assets and Liabilities; however, the Fund seeks to reduce this risk through the use of an FCM. The Fund, as shown on the Schedule of Investments, had outstanding futures contracts as of October 31, 2014.
| 33 |
| The Hartford Unconstrained Bond Fund |
| Notes to Financial Statements – (continued) |
| October 31, 2014 |
| (000’s Omitted) |
Options Contracts – An option contract is a contract sold by one party to another party that offers the buyer the right, but not the obligation, to buy (call) or sell (put) an investment or other financial asset at an agreed-upon price during a specific period of time or on a specific date. Options contracts are either privately negotiated in the over-the-counter market ("OTC options") or executed in a registered exchange ("exchange traded options"). The Fund may write (sell) covered call and put options on futures, swaps (“swaptions”), securities, commodities or currencies. “Covered” means that so long as the Fund is obligated as the writer of an option, it will own either the underlying investments or currency or an option to purchase the same underlying investments or currency having an expiration date of the covered option and an exercise price equal to or less than the exercise price of the covered option, or will pledge cash or other liquid investments having a value equal to or greater than the fluctuating market value of the option investment or currency. Writing put options increases the Fund’s exposure to the underlying instrument. Writing call options decreases the Fund’s exposure to the underlying instrument. Premiums received from writing options that expire are treated as realized gains. Premiums received from writing options that are exercised or closed are added to the proceeds or offset amounts paid on the underlying futures, swap, investment or currency transaction to determine the realized gain or loss. The Fund as a writer of an option has no control over whether the underlying instrument may be sold (call) or purchased (put) and as a result bears the market risk of an unfavorable change in the price of the instrument underlying the written option. There is the risk the Fund may not be able to enter into a closing transaction because of an illiquid market. The Fund may also purchase put and call options. Purchasing call options increases the Fund’s exposure to the underlying instrument. Purchasing put options decreases the Fund’s exposure to the underlying instrument. The Fund pays a premium, which is included on the Fund’s Statement of Assets and Liabilities as an investment and is subsequently marked to market to reflect the current value of the option. Premiums paid for purchasing options that expire are treated as realized losses. Certain options may be purchased with premiums to be determined on a future date. The premiums for these options are based upon implied volatility parameters at specified terms. The risk associated with purchasing put and call options is generally limited to the premium paid. Premiums paid for purchasing options that are exercised or closed are added to the amounts paid or offset against the proceeds on the underlying investment transaction to determine the realized gain or loss. Entering into over-the-counter options also exposes the Fund to counterparty risk. Counterparty risk is the possibility that the counterparty to the agreements may default on its obligation to perform or disagree as to the meaning of the contractual terms in the agreements.
The Fund, as shown on the Schedule of Investments, had outstanding purchased and written option contracts as of October 31, 2014. Transactions involving written option contracts during the year ended October 31, 2014, are summarized below:
| Options Contract Activity During the Year Ended October 31, 2014: | ||||||||
| Call Options Written During the Year | Number of Contracts* | Premium Amounts | ||||||
| Beginning of the period | — | $ | — | |||||
| Written | 7,575,039 | 308 | ||||||
| Expired | — | — | ||||||
| Closed | (700,039 | ) | (152 | ) | ||||
| Exercised | — | — | ||||||
| End of period | 6,875,000 | $ | 156 | |||||
| Put Options Written During the Year | Number of Contracts* | Premium Amounts | ||||||
| Beginning of the period | — | $ | — | |||||
| Written | 7,575,039 | 276 | ||||||
| Expired | — | — | ||||||
| Closed | (700,039 | ) | (149 | ) | ||||
| Exercised | — | — | ||||||
| End of period | 6,875,000 | $ | 127 | |||||
| * The number of contracts does not omit 000's. | ||||||||
Swap Contracts – The Fund may invest in swap contracts. Swap contracts are agreements to exchange or swap investment cash flows, assets, foreign currencies or market-linked returns at specified, future intervals. Swap contracts are either privately negotiated in the over-the-counter market (“OTC swaps”) or cleared in a central clearing house (“centrally cleared swaps”). The Fund may enter into credit default, total return, cross-currency, interest rate, inflation and other forms of swap contracts to manage its exposure to credit, currency, interest rate, commodity and inflation risk. Swap contracts are also used to gain exposure to certain markets. In connection with these contracts, investments or cash may be identified as collateral or margin in accordance with the terms of the respective swap contracts and/or master netting arrangement to provide assets of value and recourse in the event of default or bankruptcy/insolvency.
| 34 |
| The Hartford Unconstrained Bond Fund |
| Notes to Financial Statements – (continued) |
| October 31, 2014 |
| (000’s Omitted) |
Swaps are valued based on custom valuations furnished by an independent pricing service. Swaps for which prices are not available from an independent pricing service are valued in accordance with procedures established by the Company's Board of Directors. Changes in market value, if any, are reflected as a component of net changes in unrealized appreciation or depreciation on the Statement of Operations. Daily changes in valuation of centrally cleared swaps, if any, are recorded as a receivable or payable for the change in value (“variation margin”) on the Statement of Assets and Liabilities. Realized gains or losses on centrally cleared swaps are recorded upon the termination of the swap. OTC swap payments received or paid at the beginning of the measurement period are reflected as such on the Statement of Assets and Liabilities and represent premiums paid or received upon entering into the swap contract to compensate for differences between the stated terms of the swap contract and prevailing market conditions (credit spreads, currency exchange rates, interest rates and other relevant factors). These upfront premiums are recorded as realized gains or losses on the Statement of Operations upon termination or maturity of the swap. A liquidation payment received or made at the termination or maturity of the swap is recorded as a realized gain or loss on the Statement of Operations. Net periodic payments received or paid by the Fund are included as part of realized gains or losses on the Statement of Operations.
Entering into these contracts involves, to varying degrees, elements of liquidation, counterparty, credit and market risk in excess of the amounts recognized on the Statement of Assets and Liabilities. Such risks involve the possibility that there will be no liquid market for these contracts, that the counterparty to the contracts may default on its obligation to perform or disagree as to the meaning of contractual terms in the contracts, and that there may be unfavorable changes in market conditions (credit spreads, currency exchange rates, interest rates and other relevant factors).
The Fund’s maximum risk of loss from counterparty risk for OTC swaps is the net value of the discounted cash flows to be received from the counterparty over the contract’s remaining life, and current market value, to the extent that amount is positive. The risk is mitigated by having a master netting arrangement between the Fund and the counterparty, which allows for the netting of payments made or received (although such amounts are presented on a gross basis within the Statement of Assets and Liabilities, as applicable) as well as the posting of collateral to the Fund to cover the Fund’s exposure to the counterparty. In a centrally cleared swap, while the Fund enters into an agreement with a clearing broker to execute contracts with a counterparty, the performance of the swap is guaranteed by the central clearinghouse, which reduces the Fund’s exposure to counterparty risk. The Fund is still exposed to the counterparty risk through the clearing broker and clearinghouse. The clearinghouse attempts to minimize this risk to its participants through the use of mandatory margin requirements, daily cash settlements and other procedures. Likewise, the clearing broker reduces its risk through margin requirements and required segregation of customer balances.
Credit Default Swap Contracts – The credit default swap market allows the Fund to manage its exposure to the market or certain sectors of the market, to reduce its risk exposure to defaults of corporate and sovereign issuers, or to create exposure to corporate or sovereign issuers to which it is not otherwise exposed. Certain credit default swaps involve the exchange of a fixed rate premium for protection against the loss in value of an underlying investment or index in the event of a credit event, such as payment default or bankruptcy.
Under a credit default swap contract, one party acts as guarantor by receiving the fixed periodic payment in exchange for the commitment to purchase the underlying investment at par if the defined credit event occurs. Upon the occurrence of a defined credit event, the difference between the value of the reference obligation and the swap’s notional amount is recorded as realized gain or loss on swap transactions in the Statement of Operations. A “buyer” of credit protection agrees to pay a counterparty to assume the credit risk of an issuer upon the occurrence of certain events. The “seller” of the protection receives periodic payments and agrees to assume the credit risk of an issuer upon the occurrence of certain events. Although specified events are contract specific, credit events are generally defined as bankruptcy, failure to pay, restructuring, obligation acceleration, obligation default or repudiation/moratorium. A “seller’s” exposure is limited to the total notional amount of the credit default swap contract. These potential amounts would be partially offset by any recovery values of the respective referenced obligations or upfront payments received upon entering into the contract.
Implied credit spreads, represented in absolute terms, utilized in determining the market value of credit default swap contracts on corporate issues, sovereign government issues or U.S. municipal issues as of year-end are disclosed in the notes to the Schedule of Investments, as applicable, and serve as an indicator of the current status of the payment/performance risk and represent the likelihood or risk of default for the credit derivative. The implied credit spread of a particular referenced entity reflects the cost of buying/selling protection and there may also be upfront payments required to be made to enter into the contract. Wider credit spreads
| 35 |
| The Hartford Unconstrained Bond Fund |
| Notes to Financial Statements – (continued) |
| October 31, 2014 |
| (000’s Omitted) |
represent a deterioration of the referenced entity’s credit soundness and a greater likelihood or risk of default or other credit event occurring as defined under the terms of the contract. For credit default swap contracts on credit indices, the quoted market prices and resulting values serve as the indicator of the current status of the payment/performance risk. Increasing market values, in absolute terms when compared to the notional amount of the swap, represent a deterioration of the referenced equity’s credit soundness and a greater likelihood or risk of default or other credit event occurring as defined under the terms of the contract. The Fund, as shown on the Schedule of Investments, had outstanding credit default swap contracts as of October 31, 2014.
Interest Rate Swap Contracts – The Fund is subject to interest rate risk exposure in the normal course of pursuing its investment objectives. Because the Fund holds fixed rate bonds, the value of these bonds may decrease if interest rates rise. To hedge against this risk and to maintain its ability to generate income at prevailing market rates, the Fund may enter into interest rate swap contracts. In a typical interest rate swap, one party agrees to make regular payments equal to a floating interest rate, based on a specified interest rate or benchmark (e.g. London Interbank Offered Rate (“LIBOR”)), multiplied by a notional amount, in return for payments equal to a fixed rate multiplied by the same amount, for a specific period of time. The net interest received or paid on interest rate swap contracts is recorded as a realized gain or loss. Interest rate swaps are marked to market daily and the change, if any, is recorded as an unrealized gain or loss in the Statement of Operations. When the interest rate swap contract is terminated early, the Fund records a realized gain or loss equal to the difference between the current market value and the upfront premium or cost.
If an interest rate swap contract provides for payments in different currencies, the parties might agree to exchange the notional amount as well. Interest rate swaps may also depend on other prices or rates, such as the value of an index. The risks of interest rate swaps include changes in market conditions which will affect the value of the contract or the cash flows and the possible inability of the counterparty to fulfill its obligations under the contract. The Fund’s maximum risk of loss from counterparty credit risk is the discounted net value of the cash flows to be received from the counterparty over the contract’s remaining life, to the extent that amount is positive. The Fund had no outstanding interest rate swap contracts as of October 31, 2014.
Spreadlock Swap Contracts – The Fund may invest in spreadlock swap contracts. These contracts involve commitments to pay or receive a settlement amount calculated as the spread difference between two interest rate curves and a fixed spread at a specific forward date determined at the beginning of the contract. Settlement amounts paid or received are recorded as a realized gain or loss on the Statement of Operations at the determination date. The Fund had no outstanding spreadlock swap contracts as of October 31, 2014.
Total Return Swap Contracts – The Fund may invest in total return swap contracts. An investment in a total return swap allows the Fund to gain or mitigate exposure to underlying referenced securities, indices or commodities. Total return swap contracts involve commitments where cash flows are exchanged based on the price of underlying securities, indices or commodities and based on a fixed or variable rate. One party would receive payments based on the price appreciation or depreciation of a commodity index, a portion of the index, or a single commodity in exchange for paying to or receiving from the counterparty seller an agreed-upon rate, which can be fixed or variable. A variable rate may be correlated to a base rate, such as the LIBOR, and is adjusted each reset period, which are defined at the beginning of the contract. Therefore, if interest rates increase over the term of the swap contract, the party paying the rate may be required to pay a higher rate at each swap reset date.
Total return swap contracts on indices involve commitments to pay interest in exchange for a market-linked return. One party pays out the total return of a specific reference asset, which may be an equity, index, or bond, and in return receives a regular stream of payments. To the extent the total return of the security or index underlying the transaction exceeds or falls short of the offsetting interest rate obligation, the Fund will receive a payment from or make a payment to the counterparty. The Fund, as shown on the Schedule of Investments, had outstanding total return swap contracts as of October 31, 2014.
| 36 |
| The Hartford Unconstrained Bond Fund |
| Notes to Financial Statements – (continued) |
| October 31, 2014 |
| (000’s Omitted) |
Additional Derivative Instrument Information:
Fair Value of Derivative Instruments on the Statement of Assets and Liabilities as of October 31, 2014:
| Risk Exposure Category | ||||||||||||||||||||||||||||
| Interest
Rate Contracts | Foreign Exchange Contracts | Credit Contracts | Equity Contracts | Commodity Contracts | Other Contracts | Total | ||||||||||||||||||||||
| Assets: | ||||||||||||||||||||||||||||
| Investments in securities, at value (purchased option contracts), market value | $ | 7 | $ | 31 | $ | — | $ | — | $ | — | $ | — | $ | 38 | ||||||||||||||
| Unrealized appreciation on foreign currency contracts | — | 118 | — | — | — | — | 118 | |||||||||||||||||||||
| Unrealized appreciation on OTC swap contracts | — | — | 1,009 | — | — | — | 1,009 | |||||||||||||||||||||
| Variation margin receivable * | 49 | — | 2 | — | — | — | 51 | |||||||||||||||||||||
| Total | $ | 56 | $ | 149 | $ | 1,011 | $ | — | $ | — | $ | — | $ | 1,216 | ||||||||||||||
| Liabilities: | ||||||||||||||||||||||||||||
| Unrealized depreciation on foreign currency contracts | $ | — | $ | 29 | $ | — | $ | — | $ | — | $ | — | $ | 29 | ||||||||||||||
| Unrealized depreciation on OTC swap contracts | — | — | 422 | 11 | — | — | 433 | |||||||||||||||||||||
| Variation margin payable * | 12 | — | 60 | — | — | — | 72 | |||||||||||||||||||||
| Written option contracts, market value | 85 | 8 | 152 | — | — | — | 245 | |||||||||||||||||||||
| Total | $ | 97 | $ | 37 | $ | 634 | $ | 11 | $ | — | $ | — | $ | 779 | ||||||||||||||
* Only current day's variation margin is reported within the Statement of Assets and Liabilities. The variation margin is included in the open futures net cumulative appreciation of $46 and open centrally cleared swaps net cumulative depreciation of $(173) as reported in the Schedule of Investments.
The volume of derivatives that is presented in the Schedule of Investments is consistent with the derivative activity during the year ended October 31, 2014.
The Effect of Derivative Instruments on the Statement of Operations for the year ended October 31, 2014:
| Risk Exposure Category | ||||||||||||||||||||||||||||
| Interest Rate Contracts | Foreign Exchange Contracts | Credit Contracts | Equity Contracts | Commodity Contracts | Other Contracts | Total | ||||||||||||||||||||||
| Realized Gain (Loss) on Derivatives Recognized as a Result of Operations: | ||||||||||||||||||||||||||||
| Net realized gain on purchased option contracts | $ | 26 | $ | — | $ | — | $ | — | $ | — | $ | — | $ | 26 | ||||||||||||||
| Net realized loss on futures contracts | (1,732 | ) | — | — | — | — | — | (1,732 | ) | |||||||||||||||||||
| Net realized gain on written option contracts | 4 | — | — | — | — | — | 4 | |||||||||||||||||||||
| Net realized loss on swap contracts | (464 | ) | — | (726 | ) | (181 | ) | — | — | (1,371 | ) | |||||||||||||||||
| Net realized gain on foreign currency contracts | — | 488 | — | — | — | — | 488 | |||||||||||||||||||||
| Total | $ | (2,166 | ) | $ | 488 | $ | (726 | ) | $ | (181 | ) | $ | — | $ | — | $ | (2,585 | ) | ||||||||||
| Net Change in Unrealized Appreciation (Depreciation) on Derivatives Recognized as a Result of Operations: | ||||||||||||||||||||||||||||
| Net change in unrealized depreciation of purchased option contracts | $ | (65 | ) | $ | (1 | ) | $ | — | $ | — | $ | — | $ | — | $ | (66 | ) | |||||||||||
| Net change in unrealized appreciation of futures contracts | 106 | — | — | — | — | — | 106 | |||||||||||||||||||||
| Net change in unrealized appreciation of written option contracts | 3 | 7 | 28 | — | — | — | 38 | |||||||||||||||||||||
| Net change in unrealized appreciation (depreciation) of swap contracts | 157 | — | 125 | (11 | ) | — | — | 271 | ||||||||||||||||||||
| Net change in unrealized depreciation of foreign currency contracts | — | (90 | ) | — | — | — | — | (90 | ) | |||||||||||||||||||
| Total | $ | 201 | $ | (84 | ) | $ | 153 | $ | (11 | ) | $ | — | $ | — | $ | 259 | ||||||||||||
| 37 |
| The Hartford Unconstrained Bond Fund |
| Notes to Financial Statements – (continued) |
| October 31, 2014 |
| (000’s Omitted) |
Balance Sheet Offsetting Information - The following discloses both gross information and net information about instruments and transactions eligible for offset in the financial statements, and instruments and transactions that are subject to a master netting arrangement, as well as amounts related to margin, reflected as financial collateral (including cash collateral), held at clearing brokers, counterparties and the Fund’s custodian. The master netting arrangements allow the clearing brokers to net any collateral held in or on behalf of the Fund, or liabilities or payment obligations of the clearing brokers to the Fund, against any liabilities or payment obligations of the Fund to the clearing brokers. The Fund is required to deposit financial collateral (including cash collateral) at the FCM's custodian on behalf of clearing brokers and counterparties to continually meet the original and maintenance requirements established by the clearing brokers and counterparties. Such requirements are specific to the respective clearing broker or counterparty. Certain master netting arrangements may not be enforceable in the bankruptcy proceedings of a counterparty.
Offsetting of Financial Assets and Derivative Assets as of October 31, 2014:
| Gross
Amounts* of Assets Presented in Statement of Assets and Liabilities | Financial Instruments with Allowable Netting | Non-cash Collateral Received | Cash
Collateral Received | Net
Amount (not less than $0) | ||||||||||||||||
| Description | ||||||||||||||||||||
| OTC purchased option and OTC swap contracts at market value | $ | 1,634 | $ | (568 | ) | $ | (249 | )† | $ | (542 | )† | $ | 275 | |||||||
| Futures contracts - variation margin receivable | 49 | (12 | ) | — | — | 37 | ||||||||||||||
| Swap contracts - variation margin receivable | 2 | (2 | ) | — | — | — | ||||||||||||||
| Unrealized appreciation on foreign currency contracts | 118 | (17 | ) | — | — | 101 | ||||||||||||||
| Total subject to a master netting or similar arrangement | $ | 1,803 | $ | (599 | ) | $ | (249 | ) | $ | (542 | ) | $ | 413 | |||||||
* Gross amounts are presented here as there are no amounts that are netted within the Statement of Assets and Liabilities.
† An additional $16 of non-cash collateral and $353 of cash collateral was received by the Fund related to derivative assets.
Offsetting of Financial Liabilities and Derivative Liabilities as of October 31, 2014:
| Gross
Amounts* of Liabilities Presented in Statement of Assets and Liabilities | Financial Instruments with Allowable Netting | Non-cash Collateral Pledged | Cash
Collateral Pledged | Net
Amount (not less than $0) | ||||||||||||||||
| Description | ||||||||||||||||||||
| OTC written option and OTC swap contracts at market value | $ | 732 | $ | (568 | ) | $ | — | $ | — | $ | 164 | |||||||||
| Futures contracts - variation margin payable | 12 | (12 | ) | (975 | ) | — | — | |||||||||||||
| Swaps contracts - variation margin payable | 60 | (2 | ) | (667 | ) | — | — | |||||||||||||
| Unrealized depreciation on foreign currency contracts | 29 | (17 | ) | — | — | 12 | ||||||||||||||
| Total subject to a master netting or similar arrangement | $ | 833 | $ | (599 | ) | $ | (1,642 | ) | $ | — | $ | 176 | ||||||||
* Gross amounts are presented here as there are no amounts that are netted within the Statement of Assets and Liabilities.
Certain derivatives held by the Fund, as of October 31, 2014, are not subject to a master netting arrangement and are excluded from the table above.
Principal Risks:
Credit risk depends largely on the perceived financial health of bond issuers. In general, the credit rating is inversely related to the credit risk of the issuer. Higher rated bonds generally are deemed to have less credit risk, while lower or unrated bonds are deemed to have higher risk of default. The share price, yield and total return of a fund that holds securities with higher credit risk may be more volatile than those of a fund that holds bonds with lower credit risk. Similar to credit risk, the Fund may be exposed to counterparty risk, or the risk that an institution or other entity with which the Fund has unsettled or open transactions will default.
The Fund’s investments expose the Fund to various risks including, but not limited to, interest rate, prepayment, extension, foreign currency and equity risks. Interest rate risk is the risk that fixed income securities will decline in value because of changes in interest
| 38 |
| The Hartford Unconstrained Bond Fund |
| Notes to Financial Statements – (continued) |
| October 31, 2014 |
| (000’s Omitted) |
rates. As nominal interest rates rise, the values of certain fixed income securities held by the Fund are likely to decrease. A nominal interest rate can be described as the sum of a real interest rate and an expected inflation rate. Fixed income securities with longer durations tend to be more sensitive to changes in interest rates, usually making them more volatile than securities with shorter durations. Duration is useful primarily as a measure of the sensitivity of a fixed income security’s market price to interest rate (i.e., yield) movements. Senior floating rate interests and securities subject to prepayment and extension risk generally offer less potential for gains when interest rates decline. Rising interest rates may cause prepayments to occur at a slower than expected rate, thereby effectively lengthening the maturity of the security and making the security more sensitive to interest rate changes. Prepayment and extension risk are major risks of mortgage backed securities, senior floating rate interests and certain asset backed securities. For certain asset backed securities, the actual maturity may be less than the stated maturity shown in the Schedule of Investments, if applicable. As a result, the timing of income recognition relating to these securities may vary based upon the actual maturity.
If the Fund invests directly in foreign currencies or in securities that trade in, and receive revenues in, foreign currencies, or in derivatives that provide exposure to foreign currencies, it will be subject to the risk that those currencies will decline in value relative to the base currency (U.S. dollars) of the Fund, or, in the case of hedging positions, that the Fund’s base currency will decline in value relative to the currency being hedged. Currency rates in foreign countries may fluctuate significantly over short periods of time for a number of reasons, including changes in interest rates, intervention (or the failure to intervene) by U.S. or foreign governments, central banks or supranational entities, such as the International Monetary Fund, or by the imposition of currency controls or other political developments in the United States or abroad. As a result, the Fund’s investments in foreign currency denominated securities may reduce the returns of the Fund. The market values of equity securities, such as common stocks and preferred stocks, or equity related investments, such as futures and options, may decline due to general market conditions which are not specifically related to a particular company, such as real or perceived adverse economic conditions, changes in the general outlook for corporate earnings, changes in interest or currency rates or adverse investor sentiment generally. The market value of equity securities may also decline due to factors which affect a particular industry or industries, such as labor shortages or increased production costs and competitive conditions within an industry. Equity securities and equity related investments generally have greater market price volatility than fixed income securities.
Federal Income Taxes:
Federal Income Taxes – For federal income tax purposes, the Fund intends to continue to qualify as a Regulated Investment Company ("RIC") under Subchapter M of the Internal Revenue Code (“IRC”) by distributing substantially all of its taxable net investment income and net realized capital gains to its shareholders and otherwise complying with the requirements of the IRC. The Fund has distributed substantially all of its income and capital gains in prior years, if applicable, and intends to distribute substantially all of its income and capital gains during the calendar year ending December 31, 2014. Accordingly, no provision for federal income or excise taxes has been made in the accompanying financial statements. Distributions from short-term capital gains are treated as ordinary income distributions for federal income tax purposes.
Net Investment Income (Loss), Net Realized Gains (Losses) and Distributions – Net investment income (loss) and net realized gains (losses) may differ for financial statement and tax purposes primarily because of losses deferred due to wash sale adjustments, foreign currency gains and losses, adjustments related to Passive Foreign Investment Companies ("PFICs"), Real Estate Investment Trusts ("REITs"), RICs, certain derivatives and partnerships. The character of distributions made during the year from net investment income or net realized gains may differ from their ultimate characterization for federal income tax purposes. Also, due to the timing of dividend distributions, the fiscal year in which amounts are distributed may differ from the year that the income or realized gains (losses) were recorded by the Fund.
Distributions and Components of Distributable Earnings – The tax character of distributions paid by the Fund for the periods indicated is as follows (as adjusted for dividends payable, if applicable):
| For the Year Ended October 31, 2014 | For the Year Ended October 31, 2013 | |||||||
| Ordinary Income | $ | 3,029 | $ | 3,946 | ||||
| Tax Return of Capital | 499 | — | ||||||
| 39 |
| The Hartford Unconstrained Bond Fund |
| Notes to Financial Statements – (continued) |
| October 31, 2014 |
| (000’s Omitted) |
As of October 31, 2014, the Fund’s components of distributable earnings (deficit) on a tax basis are as follows:
| Amount | ||||
| Accumulated Capital and Other Losses* | $ | (18,102 | ) | |
| Unrealized Appreciation† | 914 | |||
| Total Accumulated Deficit | $ | (17,188 | ) | |
| * | The Fund has capital loss carryforwards that are identified in the Capital Loss Carryforward note that follows. |
| † | Differences between book-basis and tax-basis unrealized appreciation (depreciation) may be attributable to the losses deferred due to wash sale adjustments, foreign currency gains and losses, adjustments related to PFICs, REITs, RICs, certain derivatives and partnerships. |
Reclassification of Capital Accounts – The Fund may record reclassifications in its capital accounts. These reclassifications have no impact on the total net assets of the Fund. The reclassifications are a result of permanent differences between U.S. GAAP and tax accounting for such items as foreign currency, PFICs, expiration or utilization of capital loss carryforwards or net operating losses. Adjustments are made to reflect the impact these items have on current and future distributions to shareholders. Therefore, the source of the Fund’s distributions may be shown in the accompanying Statement of Changes in Net Assets as from undistributed net investment income, from accumulated net realized gains on investments or from capital depending on the type of book and tax differences that exist. For the year ended October 31, 2014, the Fund recorded reclassifications to increase (decrease) the accounts listed below:
| Amount | ||||
| Undistributed Net Investment Income (Loss) | $ | (765 | ) | |
| Accumulated Net Realized Gain (Loss) | 767 | |||
| Capital Stock and Paid-in-Capital | (2 | ) | ||
Capital Loss Carryforward – On December 22, 2010, the Regulated Investment Company Modernization Act of 2010 (the “Act”) was enacted, which made changes to the capital loss carryforward rules. The changes are effective for taxable years beginning after the date of enactment. Under the Act, funds are permitted to carry forward capital losses for an unlimited period. However, any losses incurred during those future taxable years will be required to be utilized prior to the losses incurred in pre-enactment taxable years, which carry an expiration date. As a result of this ordering rule, pre-enactment capital loss carryforwards may be more likely to expire unused. Additionally, post-enactment capital loss carryforwards retain their character as either short-term or long-term capital losses rather than being considered all short-term as permitted under prior regulation.
At October 31, 2014 (tax year end), the Fund had capital loss carryforwards for U.S. federal income tax purposes as follows:
| Amount | ||||
| Short-Term Capital Loss Carryforward | $ | 3,646 | ||
| Long-Term Capital Loss Carryforward | 2,283 | |||
| Total | $ | 5,929 | ||
| During the year ended October 31, 2014, the Fund utilized $1,767 of prior year short term capital loss carryforwards. | ||||
Capital loss carryforwards with expiration:
| Year of Expiration | Amount | |||
| 2017 | $ | 12,173 | ||
| Total | $ | 12,173 | ||
| 40 |
| The Hartford Unconstrained Bond Fund |
| Notes to Financial Statements – (continued) |
| October 31, 2014 |
| (000’s Omitted) |
Accounting for Uncertainty in Income Taxes – The Fund has adopted financial reporting rules that require the Fund to analyze all open tax years, as defined by the statute of limitations, for all major jurisdictions. Generally, tax authorities can examine all tax returns filed for the last three years. The Fund does not have an examination in progress.
The Fund has reviewed all open tax years and major jurisdictions and concluded that these financial reporting rules had no effect on the Fund’s financial position or results of operations. There is no tax liability resulting from unrecognized tax benefits relating to uncertain income tax positions taken or expected to be taken on the tax return for the fiscal year ended October 31, 2014. The Fund is also not aware of any tax positions for which it is reasonably possible that the total amounts of unrecognized tax benefits will significantly change in the next twelve months.
Expenses:
Investment Management Agreement – Hartford Funds Management Company, LLC ("HFMC") serves as the Fund’s investment manager pursuant to an Investment Management Agreement with the Company. HFMC is an indirect wholly owned subsidiary of The Hartford Financial Services Group, Inc. ("The Hartford"). The investment manager has overall investment supervisory responsibility for the Fund. In addition, the investment manager provides administrative personnel, services, equipment, facilities and office space for proper operation of the Fund. HFMC has contracted with Wellington Management Company, LLP ("Wellington Management") under a sub-advisory agreement for the provision of day-to-day investment management services to the Fund in accordance with the Fund’s investment objective and policies. The Fund pays a fee to the investment manager, a portion of which may be used to compensate Wellington Management.
The schedule below reflects the rates of compensation paid to the investment manager for investment management services rendered as of October 31, 2014; the rates are accrued daily and paid monthly:
| Average Daily Net Assets | Annual Fee |
| On first $500 million | 0.550% |
| On next $500 million | 0.500% |
| On next $1.5 billion | 0.475% |
| On next $2.5 billion | 0.465% |
| On next $5 billion | 0.455% |
| Over $10 billion | 0.445% |
Accounting Services Agreement – Pursuant to the Fund Accounting Agreement between HFMC and the Company, on behalf of the Fund, HFMC provides accounting services to the Fund and receives monthly compensation based on the Fund’s average daily net assets at the rates set forth below. The Fund’s accounting services fees are accrued daily and paid monthly.
| Average Daily Net Assets | Annual Fee |
| On first $5 billion | 0.025% |
| On next $5 billion | 0.020% |
| Over $10 billion | 0.015% |
Operating Expenses – Allocable expenses incurred by the Company are allocated to each Fund and allocated to classes within the Fund in proportion to the average daily net assets of the Fund and each class, except where allocation of certain expenses is more fairly made directly to the Fund or to specific classes within a Fund. As of October 31, 2014, HFMC contractually limited the total operating expenses of this Fund, exclusive of taxes, interest expense, brokerage commissions, acquired fund fees and expenses and extraordinary expenses, through February 28, 2015 as follows:
| Class A | Class B | Class C | Class I | Class R3 | Class R4 | Class R5 | Class Y |
| 0.99% | 1.74% | 1.74% | 0.74% | 1.29% | 0.99% | 0.69% | 0.69% |
| 41 |
| The Hartford Unconstrained Bond Fund |
| Notes to Financial Statements – (continued) |
| October 31, 2014 |
| (000’s Omitted) |
Fees Paid Indirectly – The Fund's custodian bank has agreed to reduce its fees when the Fund maintains cash on deposit in a non-interest-bearing custody account. For the year ended October 31, 2014, this amount, if any, is included in the Statement of Operations.
The ratio of expenses to average net assets in the accompanying financial highlights excludes the reduction in expenses related to fees paid indirectly. The annualized expense ratio after waivers for the period listed below reflecting the reduction for fees paid indirectly is as follows:
| Year Ended October 31, 2014 | ||||
| Class A | 0.99 | % | ||
| Class B | 1.74 | |||
| Class C | 1.74 | |||
| Class I | 0.73 | |||
| Class R3 | 1.29 | |||
| Class R4 | 0.99 | |||
| Class R5 | 0.69 | |||
| Class Y | 0.69 | |||
Distribution and Service Plan for Class A, B, C, R3 and R4 Shares – Hartford Funds Distributors, LLC ("HFD"), an indirect wholly owned subsidiary of The Hartford, is the principal underwriter and distributor of the Fund. HFD is engaged in distribution activities, which include marketing and distribution of shares through broker/dealers, financing distribution costs and maintaining financial books and records. For the year ended October 31, 2014, HFD received front-end load sales charges of $35 and contingent deferred sales charges of $7 from the Fund.
The Fund has adopted a Distribution and Service Plan in accordance with Rule 12b-1 of the 1940 Act to compensate the distributor (HFD) for activities intended to result in the sale and distribution of Class A, B, C, R3 and R4 shares and for providing services for shareholders. The Rule 12b-1 plan applicable to Class A shares of the Fund provides for payment of a Rule 12b-1 fee of 0.25% of average daily net assets. Some or all of the fee may be used for shareholder servicing expenses with the remainder used for distribution expenses. Under the Class B Plan, the Fund pays the distributor 1.00% of the average daily net assets of Class B shares that are outstanding for 8 years or less, 0.25% of which is a fee for services provided to existing shareholders with the remainder used for distribution expenses. Some or the entire Rule 12b-1 fee for Class B shares may be remitted to broker/dealers for distribution and/or shareholder account services. After eight years, Class B shares convert to Class A shares. Upon conversion to Class A shares, the Class A plan described above will apply to those shares. Under the Class C Plan, the Fund pays the distributor 1.00% of the average daily net assets of Class C shares outstanding, 0.25% of which is intended as a fee for services provided to existing shareholders with the remainder used for distribution expenses. For Class C shares, some or the entire fee may be remitted to broker/dealers for distribution and/or shareholder account services. Class R3 shares have a distribution fee of 0.50% of average daily net assets and Class R4 shares have a distribution fee of 0.25% of average daily net assets. For Class R3 and R4 shares, some or the entire fee may be remitted to broker/dealers for distribution and/or shareholder account services. The Fund’s 12b-1 fees are accrued daily and paid monthly or at such other intervals as the Board of Directors may determine.
Other Related Party Transactions – Certain officers of the Fund are directors and/or officers of HFMC and/or The Hartford or its subsidiaries. For the year ended October 31, 2014, a portion of the Fund’s Chief Compliance Officer’s compensation was paid by all of the investment companies in the Hartford fund complex. The portion allocated to the Fund, as represented in other expenses on the Statement of Operations, rounds to zero. Hartford Administrative Services Company (“HASCO”), an indirect wholly-owned subsidiary of The Hartford, provides transfer agent services to the Fund. HASCO has contractually agreed to reimburse any portion of the transfer agency fees over 0.30% of average daily net assets per fiscal year for each class. Any transfer agency fee reimbursement is determined before considering the contractual operating expense limitation. For providing such services, HASCO is compensated on a per account basis that varies by account type, except with respect to Class Y, for which it is compensated based on average daily net assets. The amount paid to HASCO and any related contractual reimbursement amounts, if applicable, can be found in the Statement of Operations. These fees are accrued daily and paid monthly.
| 42 |
| The Hartford Unconstrained Bond Fund |
| Notes to Financial Statements – (continued) |
| October 31, 2014 |
| (000’s Omitted) |
Administrative services fees are paid to HASCO for third-party recordkeeping services that are payable as a percentage of net assets in the amount of up to 0.20%, 0.15% and 0.10% for Classes R3, R4 and R5 shares, respectively. The total administrative services fees are shown on the Statement of Operations. These fees are accrued daily and paid monthly.
Affiliate Holdings:
As of October 31, 2014, affiliates of The Hartford had ownership of shares in the Fund as follows:
| Percentage of Class | Percentage of Fund | |||||||
| Class R3 | 57 | % | — | %* | ||||
| Class R4 | 70 | — | * | |||||
| Class R5 | 100 | — | * | |||||
| * | Percentage rounds to zero. |
Investment Transactions:
For the year ended October 31, 2014, the cost of purchases and proceeds from sales of investment securities (excluding short-term investments) were as follows:
| Excluding U.S. Government Obligations | U.S. Government Obligations | Total | ||||||||||
| Cost of Purchases | $ | 1,238,772 | $ | 25,812 | $ | 1,264,584 | ||||||
| Sales Proceeds | 1,269,041 | 33,309 | 1,302,350 | |||||||||
| 43 |
| The Hartford Unconstrained Bond Fund |
| Notes to Financial Statements – (continued) |
| October 31, 2014 |
| (000’s Omitted) |
Capital Share Transactions:
The following information is for the year ended October 31, 2014, and the year ended October 31, 2013:
| For the Year Ended October 31, 2014 | For the Year Ended October 31, 2013 | |||||||||||||||||||||||||||||||
| Shares Sold | Shares
Issued for Reinvested Dividends | Shares Redeemed | Net
Increase (Decrease) of Shares | Shares Sold | Shares
Issued for Reinvested Dividends | Shares Redeemed | Net
Increase (Decrease) of Shares | |||||||||||||||||||||||||
| Class A | ||||||||||||||||||||||||||||||||
| Shares | 599 | 225 | (2,302 | ) | (1,478 | ) | 1,254 | 270 | (4,526 | ) | (3,002 | ) | ||||||||||||||||||||
| Amount | $ | 6,054 | $ | 2,275 | $ | (23,264 | ) | $ | (14,935 | ) | $ | 13,025 | $ | 2,782 | $ | (46,498 | ) | $ | (30,691 | ) | ||||||||||||
| Class B | ||||||||||||||||||||||||||||||||
| Shares | 5 | 5 | (135 | ) | (125 | ) | 16 | 8 | (197 | ) | (173 | ) | ||||||||||||||||||||
| Amount | $ | 48 | $ | 54 | $ | (1,366 | ) | $ | (1,264 | ) | $ | 166 | $ | 80 | $ | (2,018 | ) | $ | (1,772 | ) | ||||||||||||
| Class C | ||||||||||||||||||||||||||||||||
| Shares | 231 | 35 | (548 | ) | (282 | ) | 565 | 46 | (1,579 | ) | (968 | ) | ||||||||||||||||||||
| Amount | $ | 2,340 | $ | 354 | $ | (5,552 | ) | $ | (2,858 | ) | $ | 5,903 | $ | 477 | $ | (16,236 | ) | $ | (9,856 | ) | ||||||||||||
| Class I | ||||||||||||||||||||||||||||||||
| Shares | 465 | 7 | (104 | ) | 368 | 243 | 4 | (196 | ) | 51 | ||||||||||||||||||||||
| Amount | $ | 4,712 | $ | 72 | $ | (1,053 | ) | $ | 3,731 | $ | 2,533 | $ | 46 | $ | (2,025 | ) | $ | 554 | ||||||||||||||
| Class R3 | ||||||||||||||||||||||||||||||||
| Shares | 2 | — | (1 | ) | 1 | 6 | — | (1 | ) | 5 | ||||||||||||||||||||||
| Amount | $ | 17 | $ | 4 | $ | (6 | ) | $ | 15 | $ | 49 | $ | 3 | $ | (6 | ) | $ | 46 | ||||||||||||||
| Class R4 | ||||||||||||||||||||||||||||||||
| Shares | 3 | — | — | 3 | 4 | — | (2 | ) | 2 | |||||||||||||||||||||||
| Amount | $ | 29 | $ | 4 | $ | (2 | ) | $ | 31 | $ | 39 | $ | 3 | $ | (16 | ) | $ | 26 | ||||||||||||||
| Class R5 | ||||||||||||||||||||||||||||||||
| Shares | — | — | (4 | ) | (4 | ) | 5 | — | (1 | ) | 4 | |||||||||||||||||||||
| Amount | $ | — | $ | 5 | $ | (40 | ) | $ | (35 | ) | $ | 48 | $ | 4 | $ | (7 | ) | $ | 45 | |||||||||||||
| Class Y | ||||||||||||||||||||||||||||||||
| Shares | 666 | 63 | (571 | ) | 158 | 2,063 | 34 | (315 | ) | 1,782 | ||||||||||||||||||||||
| Amount | $ | 6,711 | $ | 635 | $ | (5,750 | ) | $ | 1,596 | $ | 21,305 | $ | 344 | $ | (3,212 | ) | $ | 18,437 | ||||||||||||||
| Total | ||||||||||||||||||||||||||||||||
| Shares | 1,971 | 335 | (3,665 | ) | (1,359 | ) | 4,156 | 362 | (6,817 | ) | (2,299 | ) | ||||||||||||||||||||
| Amount | $ | 19,911 | $ | 3,403 | $ | (37,033 | ) | $ | (13,719 | ) | $ | 43,068 | $ | 3,739 | $ | (70,018 | ) | $ | (23,211 | ) | ||||||||||||
The following reflects the conversion of Class B shares into Class A shares (reflected as Class A shares sold) for the year ended October 31, 2014, and the year ended October 31, 2013:
| Shares | Dollars | |||||||
| For the Year Ended October 31, 2014 | 18 | $ | 180 | |||||
| For the Year Ended October 31, 2013 | 22 | $ | 231 | |||||
Line of Credit:
The Fund is one of several Hartford Funds that participate in a $500 million committed revolving line of credit facility. The facility is to be used for temporary or emergency purposes. Under the arrangement, the funds are required to own securities having a market value in excess of 300% of the total bank borrowings. The interest rate on borrowings varies depending on the nature of the loan. The facility also requires a fee to be paid based on the amount of the commitment. This commitment fee is allocated to all the funds participating in the line of credit based on the average net assets of the funds. During the year ended October 31, 2014, the Fund did not have any borrowings under this facility.
Pending Legal Proceedings:
On February 25, 2011, Jennifer L. Kasilag, Louis Mellinger, Judith M. Menendez, Jacqueline M. Robinson, and Linda A. Russell filed a derivative lawsuit against Hartford Investment Financial Services, LLC (“HIFSCO”) (now known as HFD) on behalf of six Hartford retail mutual funds in the United States District Court for the District of New Jersey, alleging that HIFSCO received excessive advisory and distribution fees in violation of its statutory fiduciary duty under Section 36(b) of the 1940 Act when serving as investment manager and principal underwriter, respectively, to the Hartford retail mutual funds. Although this action was purportedly filed on behalf of certain of the
| 44 |
| The Hartford Unconstrained Bond Fund |
| Notes to Financial Statements – (continued) |
| October 31, 2014 |
| (000’s Omitted) |
Hartford Funds, none of the Hartford Funds is itself a defendant to the suit. HIFSCO moved to dismiss and, in September 2011, the motion was granted in part and denied in part, with leave to amend the complaint. In November 2011, plaintiffs filed an amended complaint on behalf of certain Hartford retail mutual funds, The Hartford Global Health Fund (now known as The Hartford Healthcare Fund), The Hartford Conservative Allocation Fund, The Hartford Growth Opportunities Fund, The Hartford Inflation Plus Fund, The Hartford Advisers Fund (now known as The Hartford Balanced Fund), and The Hartford Capital Appreciation Fund. Plaintiffs seek to rescind the investment management agreements and distribution plans between HIFSCO and these funds and to recover the total fees charged thereunder or, in the alternative, to recover any improper compensation HIFSCO received, in addition to lost earnings. HIFSCO filed a partial motion to dismiss the amended complaint and, in December 2012, the court dismissed without prejudice the claims regarding distribution fees and denied the motion with respect to the advisory fees claims. HIFSCO disputes the allegations and intends to defend vigorously.
In March 2014, the plaintiffs filed a new complaint that added as new plaintiffs The Hartford Floating Rate Fund and The Hartford Small Company Fund and named as a defendant HFMC, which assumed the role as investment manager to the funds as of January 2013. HFMC and HIFSCO dispute the allegations and intend to defend vigorously.
No accrual for litigation relating to this matter has been recorded in the financial statements of the Fund because the Fund is not party to the suit.
Indemnifications:
Under the Company's organizational documents, the Company shall indemnify its officers and directors to the full extent required or permitted under Maryland General Corporation Law and the federal securities laws. In addition, the Company, on behalf of the Fund, may enter into contracts that contain a variety of indemnifications. The Company's maximum exposure under these arrangements is unknown. However, as of the date of these financial statements, the Company has not had prior claims or losses pursuant to these contracts and expects the risk of loss to be remote.
Subsequent Event:
Effective December 1, 2014, pursuant to a sub-transfer agency agreement between HASCO and Boston Financial Data Services, Inc. (“BFDS”), HASCO has delegated certain transfer agent, dividend disbursing agent and shareholder servicing agent functions to BFDS. The costs and expenses of such delegation are borne by HASCO, not by the Fund.
| 45 |
| The Hartford Unconstrained Bond Fund |
| Financial Highlights |
| - Selected Per-Share Data - (A) | - Ratios and Supplemental Data - | |||||||||||||||||||||||||||||||||||||||||||||||||||
| Class | Net
Asset Value at Beginning of Period | Net Investment Income (Loss) | Net Realized and Unrealized Gain (Loss) on Invest- ments | Total
from Investment Operations | Dividends from Net Investment Income | Distribu- tions from Realized Capital Gains | Total Dividends and Distributions | Net
Asset Value at End of Period | Total Return(B) | Net Assets at End of Period (000's) | Ratio
of Expenses to Average Net Assets Before Adjust- ments(C) | Ratio
of Expenses to Average Net Assets After Adjust- ments(C) | Ratio
of Net Investment Income (Loss) to Average Net Assets | |||||||||||||||||||||||||||||||||||||||
| For the Year Ended October 31, 2014 | ||||||||||||||||||||||||||||||||||||||||||||||||||||
| A | $ | 10.06 | $ | 0.29 | $ | 0.02 | $ | 0.31 | $ | (0.30 | )(D) | $ | – | $ | (0.30 | ) | $ | 10.07 | 3.16 | % | $ | 70,192 | 1.17 | % | 0.99 | % | 2.86 | % | ||||||||||||||||||||||||
| B | 10.06 | 0.21 | 0.02 | 0.23 | (0.23 | )(E) | – | (0.23 | ) | 10.06 | 2.30 | 1,974 | 2.08 | 1.74 | 2.12 | |||||||||||||||||||||||||||||||||||||
| C | 10.09 | 0.21 | 0.02 | 0.23 | (0.23 | )(E) | – | (0.23 | ) | 10.09 | 2.29 | 15,869 | 1.86 | 1.74 | 2.11 | |||||||||||||||||||||||||||||||||||||
| I | 10.07 | 0.31 | 0.02 | 0.33 | (0.33 | )(F) | – | (0.33 | ) | 10.07 | 3.32 | 5,311 | 0.77 | 0.73 | 3.10 | |||||||||||||||||||||||||||||||||||||
| R3 | 10.05 | 0.26 | 0.02 | 0.28 | (0.28 | )(D) | – | (0.28 | ) | 10.05 | 2.76 | 193 | 1.46 | 1.29 | 2.56 | |||||||||||||||||||||||||||||||||||||
| R4 | 10.05 | 0.29 | 0.02 | 0.31 | (0.31 | )(D) | – | (0.31 | ) | 10.05 | 3.07 | 161 | 1.15 | 0.99 | 2.85 | |||||||||||||||||||||||||||||||||||||
| R5 | 10.05 | 0.32 | 0.02 | 0.34 | (0.34 | )(F) | – | (0.34 | ) | 10.05 | 3.37 | 113 | 0.85 | 0.69 | 3.17 | |||||||||||||||||||||||||||||||||||||
| Y | 10.03 | 0.32 | 0.02 | 0.34 | (0.33 | )(F) | – | (0.33 | ) | 10.04 | 3.48 | 19,584 | 0.73 | 0.69 | 3.16 | |||||||||||||||||||||||||||||||||||||
| For the Year Ended October 31, 2013 | ||||||||||||||||||||||||||||||||||||||||||||||||||||
| A | $ | 10.51 | $ | 0.25 | $ | (0.41 | ) | $ | (0.16 | ) | $ | (0.29 | ) | $ | – | $ | (0.29 | ) | $ | 10.06 | (1.54 | )% | $ | 85,062 | 1.13 | % | 0.99 | % | 2.43 | % | ||||||||||||||||||||||
| B | 10.51 | 0.17 | (0.41 | ) | (0.24 | ) | (0.21 | ) | – | (0.21 | ) | 10.06 | (2.28 | ) | 3,234 | 2.01 | 1.74 | 1.68 | ||||||||||||||||||||||||||||||||||
| C | 10.53 | 0.17 | (0.40 | ) | (0.23 | ) | (0.21 | ) | – | (0.21 | ) | 10.09 | (2.18 | ) | 18,711 | 1.82 | 1.74 | 1.67 | ||||||||||||||||||||||||||||||||||
| I | 10.51 | 0.28 | (0.40 | ) | (0.12 | ) | (0.32 | ) | – | (0.32 | ) | 10.07 | (1.19 | ) | 1,602 | 0.76 | 0.74 | 2.69 | ||||||||||||||||||||||||||||||||||
| R3 | 10.50 | 0.22 | (0.41 | ) | (0.19 | ) | (0.26 | ) | – | (0.26 | ) | 10.05 | (1.83 | ) | 179 | 1.44 | 1.29 | 2.17 | ||||||||||||||||||||||||||||||||||
| R4 | 10.50 | 0.25 | (0.41 | ) | (0.16 | ) | (0.29 | ) | – | (0.29 | ) | 10.05 | (1.54 | ) | 130 | 1.11 | 0.99 | 2.46 | ||||||||||||||||||||||||||||||||||
| R5 | 10.50 | 0.28 | (0.41 | ) | (0.13 | ) | (0.32 | ) | – | (0.32 | ) | 10.05 | (1.24 | ) | 149 | 0.82 | 0.69 | 2.75 | ||||||||||||||||||||||||||||||||||
| Y | 10.48 | 0.29 | (0.42 | ) | (0.13 | ) | (0.32 | ) | – | (0.32 | ) | 10.03 | (1.24 | ) | 17,992 | 0.71 | 0.69 | 2.85 | ||||||||||||||||||||||||||||||||||
| For the Year Ended October 31, 2012 | ||||||||||||||||||||||||||||||||||||||||||||||||||||
| A | $ | 10.06 | $ | 0.37 | $ | 0.47 | $ | 0.84 | $ | (0.39 | ) | $ | – | $ | (0.39 | ) | $ | 10.51 | 8.47 | % | $ | 120,395 | 1.09 | % | 0.77 | % | 3.59 | % | ||||||||||||||||||||||||
| B | 10.05 | 0.30 | 0.47 | 0.77 | (0.31 | ) | – | (0.31 | ) | 10.51 | 7.77 | 5,187 | 1.96 | 1.53 | 2.92 | |||||||||||||||||||||||||||||||||||||
| C | 10.07 | 0.29 | 0.48 | 0.77 | (0.31 | ) | – | (0.31 | ) | 10.53 | 7.76 | 29,736 | 1.79 | 1.52 | 2.83 | |||||||||||||||||||||||||||||||||||||
| I(G) | 10.30 | 0.13 | 0.21 | 0.34 | (0.13 | ) | – | (0.13 | ) | 10.51 | 3.35 | (H) | 1,132 | 0.83 | (I) | 0.62 | (I) | 2.93 | (I) | |||||||||||||||||||||||||||||||||
| R3 | 10.04 | 0.33 | 0.49 | 0.82 | (0.36 | ) | – | (0.36 | ) | 10.50 | 8.27 | 141 | 1.40 | 1.06 | 3.20 | |||||||||||||||||||||||||||||||||||||
| R4 | 10.04 | 0.37 | 0.48 | 0.85 | (0.39 | ) | – | (0.39 | ) | 10.50 | 8.60 | 111 | 1.07 | 0.77 | 3.57 | |||||||||||||||||||||||||||||||||||||
| R5 | 10.04 | 0.40 | 0.48 | 0.88 | (0.42 | ) | – | (0.42 | ) | 10.50 | 8.92 | 111 | 0.77 | 0.47 | 3.87 | |||||||||||||||||||||||||||||||||||||
| Y | 10.04 | 0.48 | 0.38 | 0.86 | (0.42 | ) | – | (0.42 | ) | 10.48 | 8.73 | 115 | 0.72 | 0.69 | 4.70 | |||||||||||||||||||||||||||||||||||||
| For the Year Ended October 31, 2011 (J) | ||||||||||||||||||||||||||||||||||||||||||||||||||||
| A | $ | 9.98 | $ | 0.46 | $ | 0.10 | $ | 0.56 | $ | (0.48 | ) | $ | – | $ | (0.48 | ) | $ | 10.06 | 5.71 | % | $ | 126,654 | 1.06 | % | 0.95 | % | 4.56 | % | ||||||||||||||||||||||||
| B | 9.98 | 0.38 | 0.09 | 0.47 | (0.40 | ) | – | (0.40 | ) | 10.05 | 4.82 | 7,324 | 1.88 | 1.70 | 3.82 | |||||||||||||||||||||||||||||||||||||
| C | 10.00 | 0.38 | 0.09 | 0.47 | (0.40 | ) | – | (0.40 | ) | 10.07 | 4.81 | 27,057 | 1.74 | 1.70 | 3.80 | |||||||||||||||||||||||||||||||||||||
| R3(K) | 9.89 | 0.03 | 0.15 | 0.18 | (0.03 | ) | – | (0.03 | ) | 10.04 | 1.81 | (H) | 102 | 1.34 | (I) | 1.25 | (I) | 4.29 | (I) | |||||||||||||||||||||||||||||||||
| R4(K) | 9.89 | 0.04 | 0.14 | 0.18 | (0.03 | ) | – | (0.03 | ) | 10.04 | 1.84 | (H) | 102 | 1.04 | (I) | 0.95 | (I) | 4.58 | (I) | |||||||||||||||||||||||||||||||||
| R5(K) | 9.89 | 0.04 | 0.15 | 0.19 | (0.04 | ) | – | (0.04 | ) | 10.04 | 1.87 | (H) | 102 | 0.74 | (I) | 0.65 | (I) | 4.87 | (I) | |||||||||||||||||||||||||||||||||
| Y | 9.97 | 0.49 | 0.09 | 0.58 | (0.51 | ) | – | (0.51 | ) | 10.04 | 5.96 | 102,134 | 0.63 | 0.63 | 4.90 | |||||||||||||||||||||||||||||||||||||
See Portfolio Turnover information on the next page.
| 46 |
| The Hartford Unconstrained Bond Fund |
| Financial Highlights – (continued) |
| - Selected Per-Share Data - (A) | - Ratios and Supplemental Data - | |||||||||||||||||||||||||||||||||||||||||||||||||||
| Class | Net
Asset Value at Beginning of Period | Net Investment Income (Loss) | Net Realized and Unrealized Gain (Loss) on Invest- ments | Total
from Investment Operations | Dividends from Net Investment Income | Distribu- tions from Realized Capital Gains | Total Dividends and Distributions | Net
Asset Value at End of Period | Total Return(B) | Net Assets at End of Period (000's) | Ratio
of Expenses to Average Net Assets Before Adjust- ments(C) | Ratio of Expenses to Average Net Assets After Adjust- ments(C) | Ratio
of Net Investment Income (Loss) to Average Net Assets | |||||||||||||||||||||||||||||||||||||||
| For the Year Ended October 31, 2010 (J) | ||||||||||||||||||||||||||||||||||||||||||||||||||||
| A | $ | 9.54 | $ | 0.37 | $ | 0.45 | $ | 0.82 | $ | (0.38 | ) | $ | – | $ | (0.38 | ) | $ | 9.98 | 8.82 | % | $ | 138,388 | 1.04 | % | 1.00 | % | 3.75 | % | ||||||||||||||||||||||||
| B | 9.53 | 0.29 | 0.47 | 0.76 | (0.31 | ) | – | (0.31 | ) | 9.98 | 8.13 | 10,007 | 1.87 | 1.75 | 3.02 | |||||||||||||||||||||||||||||||||||||
| C | 9.55 | 0.30 | 0.46 | 0.76 | (0.31 | ) | – | (0.31 | ) | 10.00 | 8.14 | 26,778 | 1.72 | 1.72 | 3.03 | |||||||||||||||||||||||||||||||||||||
| Y | 9.52 | 0.40 | 0.47 | 0.87 | (0.42 | ) | – | (0.42 | ) | 9.97 | 9.37 | 147,197 | 0.62 | 0.62 | 4.13 | |||||||||||||||||||||||||||||||||||||
| (A) | Information presented relates to a share outstanding throughout the indicated period. Net investment income (loss) per share amounts are calculated based on average shares outstanding unless otherwise noted. |
| (B) | Assumes initial investment at net asset value at the beginning of each period, reinvestment of all distributions, the complete redemption of the investment at net asset value at the end of each period and no sales charge. Total return would be reduced if sales charges were taken into account. |
| (C) | Adjustments include waivers and reimbursements, if applicable. Ratios do not include fees paid indirectly (see Expenses in the accompanying Notes to Financial Statements). |
| (D) | Included in this amount are tax distributions from capital of ($0.04). |
| (E) | Included in this amount are tax distributions from capital of ($0.03). |
| (F) | Included in this amount are tax distributions from capital of ($0.05). |
| (G) | Commenced operations on May 25, 2012. |
| (H) | Not annualized. |
| (I) | Annualized. |
| (J) | Net investment income (loss) per share amounts have been calculated using the SEC method. |
| (K) | Commenced operations on September 30, 2011. |
| Portfolio Turnover Rate for All Share Classes | ||||
| For the Year Ended October 31, 2014 | 62 | % | ||
| For the Year Ended October 31, 2013 | 69 | |||
| For the Year Ended October 31, 2012 | 134 | |||
| For the Year Ended October 31, 2011 | 207 | |||
| For the Year Ended October 31, 2010 | 210 | |||
| 47 |
| Report of Independent Registered Public Accounting Firm |
| The Board of Directors and Shareholders of The Hartford Mutual Funds, Inc. |
We have audited the accompanying statement of assets and liabilities, including the schedule of investments, of The Hartford Unconstrained Bond Fund (one of the portfolios constituting The Hartford Mutual Funds, Inc. (the Funds)) as of October 31, 2014, and the related statement of operations for the year then ended, the statements of changes in net assets for each of the two years in the period then ended, and the financial highlights for the periods indicated therein. These financial statements and financial highlights are the responsibility of the Funds’ management. Our responsibility is to express an opinion on these financial statements and financial highlights based on our audits.
We conducted our audits in accordance with the standards of the Public Company Accounting Oversight Board (United States). Those standards require that we plan and perform the audit to obtain reasonable assurance about whether the financial statements and financial highlights are free of material misstatement. We were not engaged to perform an audit of the Funds’ internal control over financial reporting. Our audits included consideration of internal control over financial reporting as a basis for designing audit procedures that are appropriate in the circumstances, but not for the purpose of expressing an opinion on the effectiveness of the Funds’ internal control over financial reporting. Accordingly, we express no such opinion. An audit also includes examining, on a test basis, evidence supporting the amounts and disclosures in the financial statements and financial highlights, assessing the accounting principles used and significant estimates made by management, and evaluating the overall financial statement presentation. Our procedures included confirmation of securities owned as of October 31, 2014, by correspondence with the custodian, agent banks and brokers or by other appropriate auditing procedures where replies from agent banks and brokers were not received. We believe that our audits provide a reasonable basis for our opinion.
In our opinion, the financial statements and financial highlights referred to above present fairly, in all material respects, the financial position of The Hartford Unconstrained Bond Fund of The Hartford Mutual Funds, Inc. at October 31, 2014, the results of its operations for the year then ended, the changes in its net assets for each of the two years in the period then ended, and the financial highlights for the periods indicated therein, in conformity with U.S. generally accepted accounting principles.
Minneapolis, Minnesota
December 18, 2014
| 48 |
| The Hartford Unconstrained Bond Fund |
| Directors and Officers (Unaudited) |
The Board of Directors of the Company (the "Directors") appoints officers who are responsible for the day-to-day operations of the Fund and who execute policies formulated by the Directors. Each Director serves until his or her death, resignation, or retirement or until the next annual meeting of shareholders is held or until his or her successor is elected and qualifies.
Directors and officers who are employed by or who have a financial interest in The Hartford Financial Services Group, Inc. ("The Hartford") are considered “interested” persons of the Fund pursuant to the 1940 Act. Each officer and two of the Company's Directors, as noted in the chart below, are “interested” persons of the Fund. Each Director serves as a director for The Hartford Mutual Funds, Inc., The Hartford Mutual Funds II, Inc., Hartford Series Fund, Inc., and Hartford HLS Series Fund II, Inc., and as a trustee for The Hartford Alternative Strategies Fund, which, as of October 31, 2014, collectively consist of 66 funds. Correspondence may be sent to Directors and officers c/o Hartford Funds, 5 Radnor Corporate Center, Suite 300, 100 Matsonford Road, Radnor, Pennsylvania 19087, except that correspondence to Mr. Annoni, Mr. Dressen and Ms. Quade may be sent to 500 Bielenberg Drive, Suite 500, Woodbury, Minnesota 55125.
The table below sets forth, for each Director and officer, his or her name, year of birth, current position with the Company and date first elected or appointed to The Hartford Mutual Funds, Inc. ("MF") and The Hartford Mutual Funds II, Inc. ("MF2"), principal occupation, and, for Directors, other directorships held. The Fund’s Statement of Additional Information contains further information on the Directors and is available free of charge by calling 1-888-843-7824 or writing to: Hartford Funds, P.O. Box 55022, Boston, MA 02205-5022.
Information on the aggregate remuneration paid to the directors of the Company can be found in the Statement of Operations herein. The Fund pays to The Hartford a portion of the Chief Compliance Officer’s compensation, but does not pay salaries or compensation to any of its other officers or Directors who are employed by The Hartford.
Non-Interested Directors
Hilary E. Ackermann (1956) Director since September 23, 2014
Ms. Ackermann served as Chief Risk Officer at Goldman Sachs Bank USA from October 2008 to November 2011 and serves as a Director of Dynegy, Inc., an independent power company, from October 2012 to present.
Lynn S. Birdsong (1946) Director since 2003, Chairman of the Investment Committee since 2014
Mr. Birdsong is a private investor. Mr. Birdsong currently serves as a Director of the Sovereign High Yield Investment Company (April 2010 to current). Mr. Birdsong currently serves as an Independent Director of Nomura Partners Funds, Inc. (formerly, The Japan Fund) (April 2003 to current). From 2003 to March 2005, Mr. Birdsong was an Independent Director of the Atlantic Whitehall Funds. From 1979 to 2002, Mr. Birdsong was a Managing Director of Zurich Scudder Investments, an investment management firm. During his employment with Scudder, Mr. Birdsong was an Interested Director of The Japan Fund. From January 1981 through December 2013, Mr. Birdsong was a partner in Birdsong Company, an advertising specialty firm.
Robert M. Gavin, Jr. (1940) Director since 2002 (MF) and 1986 (MF2), Chairman of the Board for each since 2004
Dr. Gavin is an educational consultant. Prior to September 1, 2001, he was President of Cranbrook Education Community and prior to July 1996, he was President of Macalester College, St. Paul, Minnesota.
Duane E. Hill (1945) Director since 2001 (MF) and 2002 (MF2), Chairman of the Nominating Committee since 2003
Mr. Hill is a Partner of TSG Ventures L.P., a private equity investment company. Mr. Hill is a former partner of TSG Capital Group, a private equity investment firm that served as sponsor and lead investor in leveraged buyouts of middle market companies.
Sandra S. Jaffee (1941) Director since 2005
Ms. Jaffee is the founder and Chief Executive Officer of a private company, Homeworks Concierge, LLC, which provides residential property management services in Westchester County, New York (January 2012 to present). Ms. Jaffee served as Chairman (2008 to 2009) and Chief Executive Officer of Fortent (formerly Searchspace Group), a leading provider of compliance/regulatory technology to financial institutions from August 2005 to August 2009. From August 2004 to August 2005, Ms. Jaffee served as an Entrepreneur in Residence with Warburg Pincus, a private equity firm. Prior to joining Warburg Pincus, Ms. Jaffee served as Executive Vice President at Citigroup, from September 1995 to July 2004, where she was President and Chief Executive Officer of Citibank’s Global Securities Services (1995 to 2003). Ms. Jaffee currently serves as a member of the Board of Directors of Broadridge Financial Solutions as well as a Trustee of Muhlenberg College.
| 49 |
| The Hartford Unconstrained Bond Fund |
| Directors and Officers (Unaudited) – (continued) |
William P. Johnston (1944) Director since 2005, Chairman of the Compliance Committee since 2005
In June 2006, Mr. Johnston was appointed as Senior Advisor to The Carlyle Group, a global private equity and other alternative asset investment firm and currently serves as an Operating Executive. In July 2006, Mr. Johnston was elected to the Board of Directors of MultiPlan, Inc. and served as a Director (July 2006 to August 2010). In August 2007, Mr. Johnston was elected to the Board of Directors of LifeCare Holdings, Inc. and served as a Director (August 2007 to June 2013). In February 2008, Mr. Johnston was elected to the Board of Directors of HCR-ManorCare, Inc. In May 2006, Mr. Johnston was elected to the Supervisory Board of Fresenius Medical Care AG & Co. KGaA, after its acquisition of Renal Care Group, Inc. in March 2006. Mr. Johnston joined Renal Care Group in November 2002 as a member of the Board of Directors and served as Chairman of the Board from March 2003 through March 2006. From 2002 through 2013, Mr. Johnston served as a Board member of the Georgia O’Keefe Museum. From September 1987 to December 2002, Mr. Johnston was with Equitable Securities Corporation (and its successors, SunTrust Equitable Securities and SunTrust Robinson Humphrey) serving in various investment banking and managerial positions, including Managing Director and Head of Investment Banking, Chief Executive Officer and Vice Chairman.
Phillip O. Peterson (1944) Director since 2002 (MF) and 2000 (MF2), Chairman of the Audit Committee since 2002
Mr. Peterson is a mutual fund industry consultant. He was a partner of KPMG LLP (an accounting firm) until July 1999. Mr. Peterson joined William Blair Funds in February 2007 as a member of the Board of Trustees. From February 2012 to February 2014, Mr. Peterson served as a Trustee of Symetra Variable Mutual Funds. From January 2004 to April 2005, Mr. Peterson served as Independent President of the Strong Mutual Funds.
Lemma W. Senbet (1946) Director since 2005
Dr. Senbet is the William E. Mayer Chair Professor of Finance and Founding Director, Center for Financial Policy, at the University of Maryland, Robert H. Smith School of Business. He was chair of the Finance Department of the University of Maryland, Robert H. Smith School of Business from 1998 to 2006. Since June 2013, he has been on leave from the University to serve as Executive Director of African Economic Research Consortium which focuses on economic policy research and training. Previously, he was a chaired professor of finance at the University of Wisconsin-Madison. Also, he was a Director of the Fortis Funds from March 2000 to July 2002. Dr. Senbet served as Director of the American Finance Association and President of the Western Finance Association. In 2006, Dr. Senbet was inducted Fellow of Financial Management Association International for his career-long distinguished scholarship and professional service.
Interested Directors and Officers
James E. Davey (1964) Director since 2012, President and Chief Executive Officer since 2010
Mr. Davey serves as Executive Vice President of Hartford Life Insurance Company (“HLIC”) and The Hartford. Additionally, Mr. Davey serves as Chairman of the Board, Manager and Senior Managing Director of Hartford Funds Distributors, LLC (“HFD”). He also currently serves as Director, Chairman of the Board, President and Senior Managing Director of Hartford Administrative Services Company (“HASCO”). Mr. Davey also serves as Manager, Chairman of the Board and Senior Managing Director for Hartford Funds Management Company, LLC (“HFMC”) and Director, Chairman of the Board and Senior Managing Director for Hartford Funds Management Group, Inc. ("HFMG"). Mr. Davey has served in various positions within The Hartford and its subsidiaries in connection with the operation of the Hartford Funds. Mr. Davey joined The Hartford in 2002.
Lowndes A. Smith* (1939) Director since 1996 (MF) and 2002 (MF2)
Mr. Smith served as Vice Chairman of The Hartford from February 1997 to January 2002, as President and Chief Executive Officer of Hartford Life, Inc. from February 1997 to January 2002, and as President and Chief Operating Officer of The Hartford Life Insurance Companies from January 1989 to January 2002. Mr. Smith serves as a Director of White Mountains Insurance Group Ltd. (October 2003 to current); One Beacon Insurance (October 2006 to current); Symetra Financial (August 2007 to current) and is a Managing Director of Whittington Gray Associates (January 2007 to current).
* Mr. Smith resigned as a Director of MF, MF2, Hartford Series Fund, Inc. and Hartford HLS Series Fund II, Inc. and as a Trustee of The Hartford Alternative Strategies Fund effective September 17, 2014.
Other Officers
Mark A. Annoni (1964) Vice President, Controller and Treasurer since 2012
Mr. Annoni currently serves as the Assistant Vice President of HLIC (February 2004 to present) and Senior Vice President of HFMG (December 2013 to present). Mr. Annoni has served in various positions within The Hartford and its subsidiaries in connection with the operation of the Hartford Funds. Mr. Annoni joined The Hartford in 2001.
| 50 |
| The Hartford Unconstrained Bond Fund |
| Directors and Officers (Unaudited) – (continued) |
Michael R. Dressen (1963) AML Compliance Officer since 2011
Mr. Dressen currently serves as Assistant Vice President of HLIC. He also serves as Chief Compliance Officer and AML Compliance Officer of HASCO and as AML Officer of HFD. Mr. Dressen has served in various positions within The Hartford and its subsidiaries in connection with the operation of the Hartford Funds.
Edward P. Macdonald (1967) Vice President, Secretary and Chief Legal Officer since 2005
Mr. Macdonald currently serves as Assistant Secretary, Executive Vice President and Deputy General Counsel of HFD, HASCO, HFMC and HFMG. He also serves as Vice President of HLIC. Mr. Macdonald has served in various positions within The Hartford and its subsidiaries in connection with the operation of the Hartford Funds. Mr. Macdonald joined The Hartford in 2005.
Joseph G. Melcher (1973) Vice President and Chief Compliance Officer since 2013
Mr. Melcher currently serves as Executive Vice President of HFD, HFMG and HASCO. Mr. Melcher also currently serves as Executive Vice President and Chief Compliance Officer of HFMC. Mr. Melcher has served in various positions within The Hartford and its subsidiaries in connection with the operation of the Hartford Funds since joining The Hartford in 2012. Prior to joining The Hartford, Mr. Melcher worked at Touchstone Investments, a member of the Western & Southern Financial Group, where he held the position of Vice President and Chief Compliance Officer from 2010 through 2012 and Assistant Vice President, Compliance from 2005 to 2010.
Vernon J. Meyer (1964) Vice President since 2006
Mr. Meyer currently serves as Senior Vice President of HLIC. He also currently serves as Managing Director and Chief Investment Officer of HFMC and Managing Director of HFMG. Mr. Meyer has served in various positions within The Hartford and its subsidiaries in connection with the operation of the Hartford Funds. Mr. Meyer joined The Hartford in 2004.
Laura S. Quade (1969) Vice President since 2012
Ms. Quade currently serves as Vice President of HASCO, HFD and HFMG. She is the Head of Operations of HASCO and formerly served as Director, Enterprise Operations of HLIC. Ms. Quade has served in various positions within The Hartford and its subsidiaries in connection with the operation of the Hartford Funds. Ms. Quade joined The Hartford in 2001.
Martin A. Swanson** (1962) Vice President since 2010
Mr. Swanson currently serves as Vice President of HLIC. Mr. Swanson also serves as Managing Director, Chief Marketing Officer and Principal of HFD and Managing Director of HFMG. Mr. Swanson has served in various positions within The Hartford and its subsidiaries in connection with the operation of the Hartford Funds.
** Mr. Swanson resigned as an officer effective November 6, 2014.
HOW TO OBTAIN A COPY OF THE FUND’S PROXY VOTING POLICIES AND VOTING RECORDS (UNAUDITED)
A description of the policies and procedures that the Fund uses to determine how to vote proxies relating to portfolio securities and information about how the Fund voted proxies relating to portfolio securities during the most recent twelve-month period ended June 30 are available (1) without charge, upon request, by calling 888-843-7824 and (2) on the SEC’s website at http://www.sec.gov.
QUARTERLY PORTFOLIO HOLDINGS INFORMATION (UNAUDITED)
The Fund files a complete schedule of portfolio holdings with the SEC for the first and third quarters of each fiscal year on Form N-Q. The Fund’s Forms N-Q are available (1) without charge, upon request, by calling 888-843-7824 and (2) on the SEC’s website at http://www.sec.gov. The Form N-Q may be reviewed and copied at the SEC’s Public Reference Room in Washington, DC. Information on the operation of the Public Reference Room may be obtained by calling 1-800-SEC-0330.
| 51 |
| The Hartford Unconstrained Bond Fund |
| Federal Tax Information (Unaudited) |
For the fiscal year ended October 31, 2014, there is no further federal tax information required for this Fund.
| 52 |
| The Hartford Unconstrained Bond Fund |
| Expense Example (Unaudited) |
Your Fund's Expenses
As a shareholder of the Fund, you incur two types of costs: (1) transaction costs, including sales charges (loads) on purchase payments, if any, and contingent deferred sales charges (CDSC), if any, and (2) ongoing costs, including investment management fees, distribution and/or service (12b-1) fees, if any, and other fund expenses. This example is intended to help you understand your ongoing costs (in dollars) of investing in the Fund and to compare these costs with the ongoing costs of investing in other mutual funds. The example is based on an investment of $1,000 invested at the beginning of the period and held for the entire period of April 30, 2014 through October 31, 2014.
Actual Expenses
The first set of columns of the table below provides information about actual account values and actual expenses. You may use the information in this column, together with the amount you invested, to estimate the expenses that you paid over the period. Simply divide your account value by $1,000 (for example, an $8,600 account value divided by $1,000 = 8.6), then multiply the result by the number in the line under the heading entitled “Expenses Paid During Period” to estimate the expenses you paid on your account during this period.
Hypothetical Example for Comparison Purposes
The second set of columns of the table below provides information about hypothetical account values and hypothetical expenses based on the Fund's actual expense ratio and an assumed rate of return of 5% per year before expenses, which is not the Fund's actual return. The hypothetical account values and expenses may not be used to estimate the actual ending account balance or expenses you paid for the period. You may use this information to compare the ongoing costs of investing in the Fund and other funds. To do so, compare this 5% hypothetical example with the 5% hypothetical examples that appear in the shareholder reports of the other funds.
Please note that the expenses shown in the table are meant to highlight your ongoing costs only and do not reflect any transactional costs, such as sales charges (loads) and CDSC. Therefore, the second set of columns of the table is useful in comparing ongoing costs only, and will not help you determine the relative total costs of owning different funds. In addition, if these transactional costs were included, your costs would be higher. Expenses are equal to the Fund's annualized expense ratios multiplied by average account value over the period, multiplied by 184/365 (to reflect the one-half year period).
| Actual return | Hypothetical (5% return before expenses) | |||||||||||||||||||||||||||||||
| Beginning
Account Value April 30, 2014 | Ending
Account Value October 31, 2014 | Expenses
paid during the period April 30, 2014 through October 31, 2014 | Beginning Account Value April 30, 2014 | Ending
Account Value October 31, 2014 | Expenses
paid during the period April 30, 2014 through October 31, 2014 | Annualized
expense ratio | Days
in the current 1/2 year | Days in the full year | ||||||||||||||||||||||||
| Class A | $ | 1,000.00 | $ | 1,011.00 | $ | 5.03 | $ | 1,000.00 | $ | 1,020.21 | $ | 5.05 | 0.99 | % | 184 | 365 | ||||||||||||||||
| Class B | $ | 1,000.00 | $ | 1,006.20 | $ | 8.81 | $ | 1,000.00 | $ | 1,016.43 | $ | 8.85 | 1.74 | 184 | 365 | |||||||||||||||||
| Class C | $ | 1,000.00 | $ | 1,007.20 | $ | 8.81 | $ | 1,000.00 | $ | 1,016.43 | $ | 8.85 | 1.74 | 184 | 365 | |||||||||||||||||
| Class I | $ | 1,000.00 | $ | 1,012.20 | $ | 3.70 | $ | 1,000.00 | $ | 1,021.53 | $ | 3.72 | 0.73 | 184 | 365 | |||||||||||||||||
| Class R3 | $ | 1,000.00 | $ | 1,009.50 | $ | 6.54 | $ | 1,000.00 | $ | 1,018.69 | $ | 6.57 | 1.29 | 184 | 365 | |||||||||||||||||
| Class R4 | $ | 1,000.00 | $ | 1,010.00 | $ | 5.02 | $ | 1,000.00 | $ | 1,020.21 | $ | 5.05 | 0.99 | 184 | 365 | |||||||||||||||||
| Class R5 | $ | 1,000.00 | $ | 1,012.50 | $ | 3.51 | $ | 1,000.00 | $ | 1,021.72 | $ | 3.52 | 0.69 | 184 | 365 | |||||||||||||||||
| Class Y | $ | 1,000.00 | $ | 1,012.50 | $ | 3.51 | $ | 1,000.00 | $ | 1,021.72 | $ | 3.52 | 0.69 | 184 | 365 | |||||||||||||||||
| 53 |
| The Hartford Unconstrained Bond Fund |
| Approval of Investment Management and Investment Sub-Advisory Agreements (Unaudited) |
Section 15(c) of the Investment Company Act of 1940, as amended (the “1940 Act”), requires that each mutual fund’s board of directors, including a majority of those directors who are not “interested persons” of the mutual fund, as defined in the 1940 Act (the “Independent Directors”), annually review and consider the continuation of the mutual fund’s investment advisory and sub-advisory agreements. At its meeting held on August 5-6, 2014, the Board of Directors (the “Board”) of The Hartford Mutual Funds, Inc., including each of the Independent Directors, unanimously voted to approve the continuation of the investment management agreement for The Hartford Unconstrained Bond Fund (the “Fund”) with Hartford Funds Management Company, LLC (“HFMC”) and the continuation of the investment sub-advisory agreement between HFMC and the Fund’s sub-adviser, Wellington Management Company, LLP (the “Sub-adviser,” and together with HFMC, the “Advisers”) (collectively, the “Agreements”).
In the months preceding the August 5-6, 2014 meeting, the Board requested, received and reviewed written responses from the Advisers to questions posed to them on behalf of the Independent Directors and supporting materials relating to those questions and responses. The Board considered information furnished to the Board at its meetings throughout the year, as well as information specifically prepared in connection with the annual approval of the Agreements at the Board’s meetings held on June 17-18, 2014 and August 5-6, 2014. Information provided to the Board at its meetings throughout the year included, among other things, reports on Fund performance, legal and compliance matters, sales and marketing activity, shareholder services, and the other services provided to the Fund by the Advisers and their affiliates. The Board also received in-person presentations by Fund officers and representatives of HFMC at the Board’s meetings on June 17-18, 2014 and August 5-6, 2014 concerning the Agreements.
The Independent Directors, advised by independent legal counsel, engaged service providers to assist them with evaluating the Agreements with respect to the Fund. Lipper Inc. (“Lipper”), an independent provider of investment company data, was retained to provide the Board with reports on how the Fund’s contractual management fees, actual management fees, other non-management fees, overall expense ratios and investment performance compared to those of mutual funds with similar investment objectives. The Independent Directors also engaged an independent financial services consultant (the “Consultant”) to assist them in evaluating the Fund’s management fees, sub-advisory fees, other non-management fees, overall expense ratios and investment performance. In addition, the Consultant reviewed the profitability calculations utilized by HFMC in connection with the continuation of the investment management agreement.
In determining whether to continue the Agreements for the Fund, the members of the Board reviewed and evaluated information and factors they believed to be relevant and appropriate in light of the information that the Board deemed necessary and appropriate through the exercise of its reasonable business judgment. While individual members of the Board may have weighed certain factors differently, the Board’s determination to continue the Agreements was based on a comprehensive consideration of all information provided to the Board throughout the year and specifically with respect to the continuation of the Agreements. A more detailed discussion of the factors the Board considered with respect to its approval of the Agreements is provided below.
Nature, Extent and Quality of Services Provided by the Advisers
The Board requested and considered information concerning the nature, extent and quality of the services provided to the Fund by the Advisers. The Board considered, among other things, the terms of the Agreements and the range of services provided by the Advisers. The Board considered the Advisers’ professional personnel who provide services to the Fund, including each Adviser’s ability and experience in attracting and retaining qualified personnel to service the Fund. The Board considered each Adviser’s reputation and overall financial strength, as well as its willingness to consider and implement organizational and operational changes designed to enhance services to the Hartford Funds. In addition, the Board considered the quality of each Adviser’s communications with the Board and responsiveness to Board inquiries and requests made from time to time with respect to the Fund and other Hartford Funds.
The Board also requested and evaluated information concerning each Adviser’s regulatory and compliance environment. In this regard, the Board requested and reviewed information on each Adviser’s compliance policies and procedures, compliance history, and a report from the Fund’s Chief Compliance Officer on each Adviser’s compliance with applicable laws and regulations, including responses to regulatory developments and compliance issues raised by regulators. The Board also noted the Advisers’ support of the Fund’s compliance control structure, particularly the resources devoted by the Advisers in support of the Fund’s obligations pursuant to Rule 38a-1 under the 1940 Act.
With respect to HFMC, the Board noted that, under the Agreements, HFMC is responsible for the management of the Fund, including oversight of fund operations and service providers, and provides administrative and investment advisory services in connection with selecting, monitoring and supervising the Sub-adviser. The Board considered HFMC’s ongoing monitoring of people, process and performance, including its quarterly reviews of each of the Hartford Funds, semi-annual meetings with the leaders of each Fund’s portfolio management team, and oversight of the Hartford Funds’ approximately 66 portfolio managers. The Board recognized that HFMC has demonstrated a record of making changes to the
| 54 |
| The Hartford Unconstrained Bond Fund |
| Approval of Investment Management and Investment Sub-Advisory Agreements (Unaudited) – (continued) |
management and/or strategies of the Hartford Funds when warranted. The Board considered HFMC’s oversight of the Sub-adviser’s investment approach and results, process for monitoring best execution of portfolio trades by the Sub-adviser, and approach to risk management with respect to the Fund and the service providers to the Fund. The Board also considered HFMC’s oversight of compliance with the Fund’s objective and policies as well as with applicable laws and regulations, noting that regulatory and other developments had over time led to an increase in the scope of HFMC’s services in this regard.
In addition, the Board considered HFMC’s ongoing commitment to review and rationalize the Hartford Funds product line-up and the expenses that HFMC had incurred in connection with fund combinations in recent years. The Board considered that HFMC or its affiliates are responsible for providing the Fund’s officers.
With respect to the Sub-adviser, which provides certain day-to-day portfolio management services for the Fund, the Board considered the quality of the Fund’s portfolio managers, the Sub-adviser’s other investment personnel, its investment philosophy and process, investment research capabilities and resources, its use of the Fund’s investment flexibility, performance record, trade execution capabilities and experience. The Board considered the experience of the Fund’s portfolio managers, the number of accounts managed by the portfolio managers, and the Sub-adviser’s method for compensating the portfolio managers.
Based on these considerations, the Board concluded that it was satisfied with the nature, extent and quality of the services provided to the Fund by HFMC and the Sub-adviser.
Performance of the Fund and the Advisers
The Board considered the investment performance of the Fund. In this regard, the Board reviewed the performance of the Fund over different time periods presented in the materials and evaluated HFMC’s analysis of the Fund’s performance for these time periods. The Board considered information and materials provided to the Board by the Advisers concerning Fund performance, as well as information from Lipper comparing the investment performance of the Fund to an appropriate benchmark and universe of peer funds. The Board noted that the Fund’s performance was in the 5th quintile of its performance universe for the 1-year period, the 2nd quintile for the 3-year period and the 4th quintile for the 5-year period. The Board also noted that the Fund’s performance was in line with its benchmark for the 1-year period and above its benchmark for the 3- and 5-year periods. In considering the Fund’s performance record, the Board noted that the Fund had transitioned to Wellington Management Company, LLP as sub-adviser in 2012.
The Board considered the detailed investment analytics reports provided by Hartford Funds’ Investment Advisory Group throughout the year. These reports include, among other things, information on the Fund’s gross and net returns, the Fund’s investment performance relative to an appropriate benchmark and peer group, various statistics concerning the Fund’s portfolio, and a narrative summary of various factors affecting Fund performance. The Board considered the Advisers’ cooperation with the Investment Committee, which assists the Board in evaluating the performance of the Fund at periodic meetings throughout the year. The Board also considered the analysis provided by the Consultant relating to the Fund’s performance track record.
In light of all the considerations noted above, the Board concluded that it had continued confidence in HFMC’s and the Sub-adviser’s overall capabilities to manage the Fund.
Costs of the Services and Profitability of the Advisers
The Board reviewed information regarding HFMC’s cost to provide investment management and related services to the Fund and HFMC’s profitability, both overall and for the Fund, on a pre-tax basis without regard to distribution expenses. The Board also requested and reviewed information about the profitability to HFMC and its affiliates from all services provided to the Fund and all aspects of their relationship with the Fund. The Board also requested and received information relating to the operations and profitability of the Sub-adviser.
The Board considered the Consultant’s review of the profitability calculations used by HFMC in connection with the continuation of the investment management agreement, noting the Consultant’s view that Hartford Funds’ process for calculating and reporting Fund profitability is reasonable. In this regard, the Board noted that the Consultant performed a full review of this process in light of the recent restructuring of the Hartford Funds business and reported that the approach to analyzing Fund profitability, including the use of common expense allocation methodologies, is reasonable, sound and well within common industry practice.
| 55 |
| The Hartford Unconstrained Bond Fund |
| Approval of Investment Management and Investment Sub-Advisory Agreements (Unaudited) – (continued) |
Based on these considerations, the Board concluded that the profits anticipated to be realized by the Advisers and their affiliates from their relationships with the Fund would not be excessive.
Comparison of Fees and Services Provided by the Advisers
The Board considered comparative information with respect to the management fees to be paid by the Fund to HFMC and the total expense ratios of the Fund. The Board also considered comparative information with respect to the sub-advisory fees to be paid by HFMC to the Sub-adviser. In this regard, the Board requested and reviewed information from HFMC and the Sub-adviser relating to the management and sub-advisory fees, including the sub-advisory fee schedule for the Fund, and total operating expenses for the Fund. With respect to the sub-advisory fee schedule, the Board considered representations from HFMC and the Sub-adviser that the Sub-adviser’s fees were negotiated at arm’s length on a fund-by-fund basis. The Board also reviewed information from Lipper comparing the Fund’s contractual management fees, actual management fees and overall expense ratios relative to a group of funds selected by Lipper, in consultation with the Consultant, and a broader universe of funds selected by Lipper. The Board considered that the Fund’s contractual management fee and total expenses (less 12b-1 and shareholder service fees) were in the 1st quintile of its expense group, while its actual management fee was in the 2nd quintile. The Board noted that the Fund has an automatically renewable contractual expense cap on each share class as well as a permanent expense cap on certain share classes. These arrangements resulted in reimbursement of certain expenses incurred in 2013.
While the Board recognized that comparisons between the Fund and peer funds may be imprecise, given the different service levels and characteristics of mutual funds and the different business models and cost structures of the Advisers, the comparative information provided by Lipper assisted the Board in evaluating the reasonableness of the Fund’s management and sub-advisory fees and total operating expenses. In addition, the Board considered the analysis and recommendations of the Consultant relating to the Fund’s management and sub-advisory fees and total operating expenses.
Based on these considerations, the Board concluded that the Fund’s fees and total operating expenses, in conjunction with the information about quality of services, profitability, economies of scale, and other matters discussed, were reasonable in light of the services provided.
Economies of Scale
The Board requested and considered information regarding the Advisers’ realization of economies of scale with respect to the Fund and whether the fee levels reflect these economies of scale for the benefit of the Fund’s shareholders. The Board reviewed the breakpoints in the management fee schedule for the Fund, which reduce fee rates as Fund assets grow over time. The Board recognized that a fund with assets beyond the highest breakpoint level will continue to benefit from economies of scale because additional assets are charged the lowest breakpoint fee resulting in lower overall effective management fee rates. The Board also considered that expense limitations and fee waivers that reduce the Fund’s expenses at all asset levels can have the same effect as breakpoints in sharing economies of scale with shareholders and provide protection from an increase in expenses if Fund assets decline. The Board recognized that a fee schedule that reaches a lower breakpoint quickly provides shareholders with the benefit of anticipated or potential economies of scale, although the Board noted that the Fund’s current low asset levels have kept the Fund from fully realizing this benefit. The Board also considered that HFMC has been active in managing expenses, which has resulted in benefits being realized by shareholders as assets within the Hartford Funds family of funds have grown over time, including through lower transfer agent costs and other operating expenses.
The Board reviewed and evaluated materials from Lipper and the Consultant showing how management fee schedules of peer funds reflect economies of scale for the benefit of shareholders as a peer fund’s assets hypothetically increase over time. Based on information provided by HFMC, Lipper, and the Consultant, the Board recognized that there is no uniform methodology for establishing breakpoints or uniform pattern in asset levels that trigger breakpoints or the amounts of breakpoints triggered.
After considering all of the information available to it, the Board concluded that it was satisfied with the extent to which economies of scale would be shared for the benefit of the Fund’s shareholders based on currently available information and the effective advisory fees and expense ratios for the Fund at its current and reasonably anticipated asset levels. The Board noted, however, that it would continue to monitor future growth in Fund assets and the appropriateness of additional breakpoints.
Other Benefits
The Board considered other benefits to the Advisers and their affiliates from their relationships with the Fund.
| 56 |
| The Hartford Unconstrained Bond Fund |
| Approval of Investment Management and Investment Sub-Advisory Agreements (Unaudited) – (continued) |
The Board noted that HFMC receives fees for fund accounting and related services from the Fund, and the Board considered information on profits to HFMC for such services. The Board also considered that Hartford Administrative Services Company (“HASCO”), the Fund’s transfer agent and an affiliate of HFMC, receives transfer agency compensation from the Fund, and the Board reviewed information on the profitability of the Fund’s transfer agency function to HASCO. The Board considered information provided by HASCO indicating that the transfer agent fees charged by HASCO to the Fund were fair and reasonable based on publicly available information.
The Board also considered that Hartford Funds Distributors, LLC (“HFD”), an affiliate of HFMC, serves as principal underwriter of the Fund. As principal underwriter, HFD receives 12b-1 fees from the Fund and receives all or a portion of the sales charges on sales or redemptions of certain classes of shares. The Board also noted that certain affiliates of HFD distribute shares of the Fund and receive compensation in that connection.
The Board considered the benefits, if any, to the Sub-adviser from any use of the Fund’s brokerage commissions to obtain soft dollar research, and representations from HFMC and the Sub-adviser that the Sub-adviser would not make any revenue-sharing payments or any other type of distribution payments to HFMC or its affiliates.
The Board considered the benefits to shareholders of being part of the Hartford Funds family of funds, including the right to exchange investments between the same class of funds without a sales charge, the ability to reinvest Fund dividends into other funds in the family, and the ability to combine holdings in the Fund with holdings in other funds to obtain a reduced sales charge. The Board considered HFMC’s efforts to provide investors in the family with a broad range of investment styles and asset classes and its entrepreneurial risk in initiating new funds to expand these opportunities for shareholders.
* * * *
Based upon its review of these various factors, among others, the Board concluded that it is in the best interests of the Fund and its shareholders for the Board to approve the Agreements for an additional year. In reaching this decision, the Board did not assign relative weights to the factors discussed above or deem any one or group of them to be controlling in and of themselves. In connection with their deliberations, the Independent Directors met separately in executive session on several occasions, with independent legal counsel and the Consultant, to review the relevant materials and consider their responsibilities under relevant laws and regulations.
| 57 |
| The Hartford Unconstrained Bond Fund |
| Main Risks (Unaudited) |
The main risks of investing in the Fund are described below.
Market, Selection and Strategy Risk: The Fund’s share price may fluctuate due to market risk and/or security selections that may underperform the market or relevant benchmarks. If the sub-adviser's investment strategy does not perform as expected, the Fund could underperform its peers or lose money. There is no guarantee the Fund will achieve its stated objective.
Fixed Income Risk: The Fund is subject to interest rate risk (the risk that the value of an investment decreases when interest rates rise), credit risk (the risk that the issuing company of a security is unable to pay interest and principal when due), liquidity risk (the risk that an investment may be difficult to sell at an advantageous time or price) and call risk (the risk that an investment may be redeemed early). These risks also apply to the Fund’s investments in U.S. government securities, which may not be guaranteed by the U.S. government.
Junk Bond Risk: Investments in junk bonds involve greater risk of price volatility, illiquidity, and default than higher-rated debt securities.
Loan Risk: The Fund’s investments in loans may at times become difficult to value and highly illiquid; they are subject to credit risk such as nonpayment of principal or interest, and risks of bankruptcy and insolvency.
Foreign Investment and Emerging Markets Risk: Investments in foreign securities may be riskier than investments in U.S. securities. Potential risks include the risks of illiquidity, increased price volatility, less government regulation, less extensive and less frequent accounting and other reporting requirements, unfavorable changes in currency exchange rates, and economic and political disruptions. These risks are generally greater for investments in emerging markets.
Derivatives Risk: Investments in derivatives can be volatile. Potential risks include currency risk, leverage risk (the risk that small market movements may result in large changes in the value of an investment), liquidity risk, index risk, pricing risk, and counterparty risk (the risk that the counterparty may be unwilling or unable to honor its obligations).
Mortgage-Backed Securities Risk: Mortgage-backed securities are subject to interest rate risk, credit risk, prepayment risk, extension risk, and the risk that an investment’s value may be reduced or become worthless if it receives interest or income payments only after other investments in the same pool. The Fund may purchase mortgage-backed securities in the "to be announced" (TBA) market. This subjects the Fund to counterparty risk and the risk that the security the Fund buys will lose value prior to its delivery.
Active Trading Risk: Actively trading investments may result in higher costs and higher taxable income.
| 58 |
THIS PRIVACY POLICY IS NOT PART OF THIS REPORT
Privacy Policy and Practices of The Hartford Financial Services Group, Inc. and its Affiliates
(herein called “we, our and us”)
This Privacy Policy applies to our United States Operations
We value your trust. We are committed to the responsible: a) management; b) use; and c) protection; of Personal Information.
This notice describes how we collect, disclose, and protect Personal Information.
We collect Personal Information to: a) service your Transactions with us; and b) support our business functions.
We may obtain Personal Information from: a) You; b) your Transactions with us; and c) third parties such as a consumer-reporting agency.
Based on the type of product or service You apply for or get from us, Personal Information such as: a) your name; b) your address; c) your income; d) your payment; or e) your credit history; may be gathered from sources such as applications, Transactions, and consumer reports.
To serve You and service our business, we may share certain Personal Information. We will share Personal Information, only as allowed by law, with affiliates such as: a) our insurance companies; b) our employee agents; c) our brokerage firms; and d) our administrators.
As allowed by law, we may share Personal Financial Information with our affiliates to: a) market our products; or b) market our services; to You without providing You with an option to prevent these disclosures.
|
We may also share Personal Information, only as allowed by law, with unaffiliated third parties including: a) independent agents; b) brokerage firms; c) insurance companies; d) administrators; and e) service providers; who help us serve You and service our business.
When allowed by law, we may share certain Personal Financial Information with other unaffiliated third parties who assist us by performing services or functions such as: a) taking surveys; b) marketing our products or services; or c) offering financial products or services under a joint agreement between us and one or more financial institutions.
We, and third parties we partner with, may track some of the pages You visit through the use of: a) cookies; b) pixel tagging; or c) other technologies; and currently do not process or comply with any web browser’s “do not track” signal or similar mechanism that indicates a request to disable online tracking of individual users who visit our websites or use our services.
We will not sell or share your Personal Financial Information with anyone for purposes unrelated to our business functions without offering You the opportunity to: a) “opt-out;” or b) “opt-in;” as required by law.
We only disclose Personal Health Information with: a) your proper written authorization; or b) as otherwise allowed or required by law.
Our employees have access to Personal Information in the course of doing their jobs, such as: a) underwriting policies; b) paying claims; c) developing new products; or d) advising customers of our products and services.
|
We use manual and electronic security procedures to maintain: a) the confidentiality; and b) the integrity of; Personal Information that we have. We use these procedures to guard against unauthorized access.
Some techniques we use to protect Personal Information include: a) secured files; b) user authentication; c) encryption; d) firewall technology; and e) the use of detection software.
We are responsible for and must: a) identify information to be protected; b) provide an adequate level of protection for that data; c) grant access to protected data only to those people who must use it in the performance of their job-related duties.
Employees who violate our Privacy Policy will be subject to discipline, which may include ending their employment with us.
At the start of our business relationship, we will give You a copy of our current Privacy Policy.
We will also give You a copy of our current Privacy Policy once a year if You maintain a continuing business relationship with us.
We will continue to follow our Privacy Policy regarding Personal Information even when a business relationship no longer exists between us.
|
As used in this Privacy Notice:
Application means your request for our product or service.
Personal Financial Information means financial information such as: a) credit history; b) income; c) financial benefits; or d) policy or claim information.
Personal Health Information means health information such as: a) your medical records; or b) information about your illness, disability or injury.
Personal Information means information that identifies You personally and is not otherwise available to the public. It includes: a) Personal Financial Information; and b) Personal Health Information.
Transaction means your business dealings with us, such as: a) your Application; b) your request for us to pay a claim; and c) your request for us to take an action on your account.
You means an individual who has given us Personal Information in conjunction with: a) asking about; b) applying for; or c) obtaining; a financial product or service from us if the product or service is used mainly for personal, family, or household purposes.
|
This Privacy Policy is being provided on behalf of the following affiliates of The Hartford Financial Services Group, Inc.:
1stAGChoice, Inc.; Access CoverageCorp, Inc.; Access CoverageCorp Technologies, Inc.; American Maturity Life Insurance Company; Archway 60 R, LLC; Business Management Group, Inc.; Champlain Life Reinsurance Company; DMS R, LLC; Eloy R, LLC; Ersatz Corporation; First State Insurance Company; Hartford Accident and Indemnity Company; Hartford Administrative Services Company; Hartford Casualty General Agency, Inc.; Hartford Casualty Insurance Company; Hartford-Comprehensive Employee Benefit Service Company; Hartford Equity Sales Company, Inc.; Hartford Fire General Agency, Inc.; Hartford Fire Insurance Company; Hartford Funds Management Company, LLC; Hartford Funds Management Group, Inc.; Hartford HLS Series Fund II, Inc.; Hartford Insurance Company of Illinois; Hartford Insurance Company of the Midwest; Hartford Insurance Company of the Southeast; Hartford Integrated Technologies, Inc.; Hartford International Life Reassurance Corporation; Hartford Funds Distributors, LLC; Hartford Investment Management Company; Hartford Life and Accident Insurance Company; Hartford Life and Annuity Insurance Company; Hartford Life Insurance Company; Hartford Life Private Placement, LLC; Hartford Lloyd’s Corporation; Hartford Lloyd’s Insurance Company; Hartford Mezzanine Investors I, LLC; Hartford Residual Market, L.C.C.; Hartford Retirement Services, LLC; Hartford Securities Distribution Company, Inc.; Hartford Series Fund, Inc.; Hartford Specialty Insurance Services of Texas, LLC; Hartford Strategic Investments, LLC; Hartford Underwriters Insurance Company; Hartford Technology Services Company, L.L.C.; Hartford of Texas General Agency, Inc.; Hartford Underwriters General Agency, Inc.; HARTRE Company, L.C.C.; HL Investment Advisors, LLC; HLA LLC; Horizon Management Group, LLC; HRA Brokerage Services, Inc.; Lanidex Class B, LLC; M-CAP Insurance Agency, LLC; New England Insurance Company; New England Reinsurance Corporation; Nutmeg Insurance Agency, Inc.; Nutmeg Insurance Company; Pacific Insurance Company, Limited; Planco, LLC: Property and Casualty Insurance Company of Hartford; Revere R, LLC; RVR R, LLC; Sentinel Insurance Company, Ltd.; Sunstone R, LLC; Symphony R, LLC; The Evergreen Group Incorporated; The Hartford Alternative Strategies Fund; The Hartford Mutual Funds, Inc.; The Hartford Mutual Funds II, Inc.; Trumbull Flood Management, L.L.C.; Trumbull Insurance Company; Twin City Fire Insurance Company; White River Life Reinsurance Company.
HPP Revised January 2014
HARTFORDFUNDS
hartfordfunds.com
This information is written in connection with the promotion or marketing of the matter(s) addressed in this material.
This report is submitted for the general information of the shareholders of the Fund. It is not authorized for distribution unless preceded or accompanied by a current prospectus for the Fund.
The information cannot be used or relied upon for the purpose of avoiding IRS penalties. These materials are not intended to provide tax, accounting or legal advice. As with all matters of a tax or legal nature, you should consult your own tax or legal counsel for advice.
Investors should carefully consider the investment objectives, risks, charges, and expenses of Hartford Funds before investing. This and other information can be found in the prospectus and summary prospectus, which can be obtained by calling 888-843-7824 (retail) or 800-279-1541 (institutional). Investors should read them carefully before they invest.
Hartford Funds are underwritten and distributed by Hartford Funds Distributors, LLC.
MFAR-UB14 12/14 114012-3 Printed in U.S.A.
HARTFORDFUNDS
|
THE HARTFORD
WORLD BOND FUND
2014 Annual Report |
A MESSAGE FROM THE PRESIDENT
Dear Fellow Shareholders:
Thank you for investing in Hartford Funds.
Market Review
U.S. equities (as represented by the S&P 500 Index) rose steadily for the fiscal year ended October 31, 2014, with a return of 17.27% for the period. With the exception of short-lived geopolitical scares early in 2014 and concerns about continuing global growth near the end of the period, stocks generally rose on solid fundamentals and encouraging macroeconomic data during the year.
September 2014 marked the six-year anniversary of the start of the financial crisis. Within weeks of that anniversary, both the S&P 500 Index and the Dow Jones Industrial Average set new all-time highs, closing at 2,018 and 17,391, respectively, on October 31. Although the fallout of the crisis continues to influence investor behavior, stocks have recovered and risen dramatically, up 198% from their low in March 2009. Meanwhile, the domestic economy is notching strong growth, and the unemployment rate has reached its lowest level since August 2008.
While the U.S. economy appears to have stabilized and to have reverted to a solid growth path, the outlook for the global economy appears to have gotten cloudier. The U.S. Federal Reserve has ended quantitative easing, while Europe and Japan are pursuing stimulus options to avoid a double-dip recession and deflation, respectively. Diverging central-bank policies will likely continue to play an important role in market movements going forward as investors wait to see the reactions to their efforts and their impacts on global markets.
How have market movements impacted your portfolio throughout the last year? Are your investments still on track to provide the growth or income you need, and are you comfortable with their progress during times of volatility?
Your financial professional can help you navigate today’s markets with confidence, as well as assist you to achieve your investment goals by providing advice on the best options within our fund family to help you work toward overcoming today’s investing challenges. Meet with your financial advisor regularly to examine your portfolio and your investment strategy, and to determine if you’re still on track to meet your goals.
Thank you again for investing with Hartford Funds.
James Davey
President
Hartford Funds
1 The S&P 500 Index is a market capitalization-weighted price index composed of 500 widely held common stocks.
2 The Dow Jones Industrial Average is an unmanaged, price-weighted index of 30 of the largest, most widely held stocks traded on the NYSE
Table of Contents
The views expressed in the Fund’s Manager Discussion under “Why did the Fund perform this way?” and “What is the outlook?” are views of the Fund’s sub-adviser and portfolio management team through the end of the period and are subject to change based on market and other conditions. The Fund’s Manager Discussion is for informational purposes only and does not represent an offer, recommendation or solicitation to buy, hold or sell any security. The specific securities identified and described, if any, do not represent all of the securities purchased or sold and you should not assume that investments in the securities identified and discussed will be profitable.
The Hartford World Bond Fund inception 05/31/2011
(sub-advised by Wellington Management Company, LLP)
Investment objective – The Fund seeks capital appreciation with income as a secondary goal.
Performance Overview 5/31/11 - 10/31/14

The chart above represents the hypothetical growth of a $10,000 investment in Class A, which includes a sales charge. Growth results in classes other than Class A will vary from what is seen above due to differences in the expenses charged to those share classes.
Average Annual Total Returns (as of 10/31/14)
| 1 Year | Since Inception▲ | |||||||
| World Bond A# | 2.74 | % | 4.30 | % | ||||
| World Bond A## | -1.88 | % | 2.91 | % | ||||
| World Bond C# | 2.00 | % | 3.53 | % | ||||
| World Bond C## | 1.00 | % | 3.53 | % | ||||
| World Bond I# | 3.03 | % | 4.58 | % | ||||
| World Bond R3# | 2.42 | % | 3.95 | % | ||||
| World Bond R4# | 2.80 | % | 4.30 | % | ||||
| World Bond R5# | 3.03 | % | 4.56 | % | ||||
| World Bond Y# | 3.11 | % | 4.66 | % | ||||
| Citigroup World Government Bond Index | -1.28 | % | 0.22 | % | ||||
| ▲ | Inception: 05/31/2011 |
| # | Without sales charge |
| ## | With sales charge |
PERFORMANCE DATA QUOTED REPRESENTS PAST PERFORMANCE AND DOES NOT GUARANTEE FUTURE RESULTS. The investment return and principal value of the investment will fluctuate so that investors’ shares, when redeemed, may be worth more or less than their original cost. Current performance may be lower or higher than the performance data quoted. To obtain performance data current to the most recent month-end, please visit our website www.hartfordfunds.com.
The initial investment in Class A shares reflects the maximum sales charge of 4.50% and returns for Class C shares reflect a contingent deferred sales charge of up to 1.00% on shares redeemed within twelve months of purchase.
Total returns presented above were calculated using the Fund’s net asset value available to shareholders for sale or redemption of Fund shares on October 31, 2014, which may exclude investment transactions as of this date. All share class returns assume the reinvestment of all distributions at net asset value and the deduction of all fund expenses.
Citigroup World Government Bond Index includes the most significant and liquid government bond markets globally that carry at least an investment grade rating. Index weights are based on the market capitalization of qualifying outstanding debt stocks.
You cannot invest directly in an index.
The chart and table do not reflect the deductions of taxes that a shareholder would pay on Fund distributions or the redemption of Fund shares.
Performance information may reflect historical or current expense waivers/reimbursements from the investment adviser, without which performance would have been lower. For information on current expense waivers/reimbursements, please see the prospectus.
| 2 |
The Hartford World Bond Fund
Manager Discussion
October 31, 2014 (Unaudited)
| Operating Expenses* | ||||||||
| Net | Gross | |||||||
| World Bond Class A | 1.03 | % | 1.03 | % | ||||
| World Bond Class C | 1.77 | % | 1.77 | % | ||||
| World Bond Class I | 0.79 | % | 0.79 | % | ||||
| World Bond Class R3 | 1.35 | % | 1.40 | % | ||||
| World Bond Class R4 | 1.05 | % | 1.08 | % | ||||
| World Bond Class R5 | 0.75 | % | 0.79 | % | ||||
| World Bond Class Y | 0.68 | % | 0.68 | % | ||||
| * | As shown in the Fund's prospectus dated March 1, 2014. Actual expenses may be higher or lower. Please see accompanying Financial Highlights for expense ratios for the year ended October 31, 2014. |
Gross expenses are the Fund's total annual operating expenses shown in the Fund's prospectus dated March 1, 2014. Net expenses are the Fund's total annual operating expenses shown in the Fund's prospectus dated March 1, 2014 and reflect contractual expense reimbursements in instances when these reductions reduce the Fund's gross expenses. Contractual reimbursements remain in effect until February 28, 2015, and automatically renew for one-year terms unless terminated.
The Fund filed an updated prospectus, dated November 7, 2014, with the U.S. Securities and Exchange Commission that became effective on that date. However, the information in this annual report is as of October 31, 2014 and does not reflect any changes made to the total annual fund operating expense table in the November 7, 2014 prospectus.
All investments are subject to risk including the possible loss of principal. For a discussion of the Fund’s risks, please see the Main Risks section of this report. For more detailed information on the risks associated with an investment in the Fund, please see the prospectus.
| Portfolio Managers | |
| Robert L. Evans | Mark H. Sullivan, CFA |
| Director and Fixed Income Portfolio Manager | Senior Vice President and Fixed Income Portfolio Manager |
How did the Fund perform?
The Class A shares of The Hartford World Bond Fund returned 2.74%, before sales charge, for the twelve-month period ended October 31, 2014, outperforming the Fund’s benchmark, the Citigroup World Government Bond Index, which returned -1.28% for the same period. The Fund underperformed the 2.96% average return of the Lipper Global Income Funds peer group, a group of funds that invests primarily in U.S. Dollar (USD) and non-USD debt securities of issuers located in at least three countries, one of which may be the United States.
Why did the Fund perform this way?
Fixed income markets gained throughout much of the period as expectations of prolonged easy monetary policy by major central banks and a supportive macroeconomic environment kept rates low and suppressed volatility. Early in the period emerging markets dominated headlines as economic and political developments sparked risk aversion across global markets, pushing bond prices higher and yields lower amid a flight to quality. Toward the end of the period, however, persistent geopolitical risks – tensions between Ukraine and Russia and violence in Iraq – and Chinese economic slowdown concerns raised questions about the global growth rate, keeping a lid on risk appetites overall.
The period was also highlighted by a divergence in central bank policies. The European Central Bank (ECB) cut its benchmark lending and deposit rates and announced a host of stimulus measures in an effort to encourage lending and fend off fears of deflation. China’s central bank joined the ECB in boosting liquidity by injecting funds into the nation’s largest banks in an attempt to combat weakening growth. The Bank of Japan pre-emptively announced incremental monetary easing to counter market fears that a change from a historical inflationary environment would be delayed. In contrast, the Bank of England and U.S. Federal Reserve (Fed) leaned toward tighter policies. The Fed ended its quantitative easing program as U.S. data largely suggested the economy was on a sustainable growth path. Second quarter gross domestic product (GDP) rebounded after the first quarter’s steep contraction. The labor market strengthened as the unemployment rate dropped to a six-year low. Housing regained some lost ground after a weak start to the year, though the pace of home price appreciation started to slow after a strong 2013. Inflation pressures were muted overall, alleviating pressure on the Fed to raise rates.
Note that the Fund is managed in a benchmark-agnostic manner, meaning that the strategy is not focused on a particular benchmark but has a total return approach. For the twelve-month period, interest rate positioning and credit strategies contributed to total returns, while currency positioning moderately detracted.
Our high exposure to the USD helped preserve capital during the period and contributed to outperformance versus the benchmark. However, our limited exposure to non-USD currencies detracted on an absolute basis. Most currencies fell versus the USD due to the flight to safety and expectations that the Fed will raise interest rates. Our allocations to the Nok, Euro and British Pound were the primary drivers of negative performance in our smart market core foreign exchange (FX) exposure as these currencies depreciated against the USD.
Our overall cautious duration positioning and exposure to high quality global government bond markets provided positive total returns. However, we lagged market returns because we were not invested in the peripheral European countries like Italy, Spain,
| 3 |
The Hartford World Bond Fund
Manager Discussion – (continued)
October 31, 2014 (Unaudited)
Ireland and France which experienced a strong rally driven by the disinflationary pulse in Europe and expectations of ECB easing. Within discretionary macro strategies, various duration positions contributed to total returns. Specifically our overweight duration positions in U.K., Australia, and Korea, based on our theme of slowing global growth, contributed to results. Our opportunistic country rotation strategies detracted from results throughout this period. Particularly, our long U.S. 10-year vs U.K. 10-year and Germany 10-year positions detracted as both spreads widened at the margin. Our country (duration and yield curve) positioning is primarily implemented through the use of exchange-traded government bond futures and cash bonds.
Within our credit strategies our allocation to securitized debt, investment grade and high yield corporates contributed to absolute results as these sectors benefitted from investors’ prolonged appetite for yield and falling interest rates. Our opportunistic allocation to the high yield sector, particularly within defensive sectors such as banking and communications, was additive to relative performance during the period as the sector continued to benefit from strong investor inflows driven by the search for yield. In addition, our select exposure to securitized assets, specifically commercial mortgage backed securities, collateralized mortgage obligations, and asset backed securities contributed to results on an absolute and relative basis. Our credit positioning is primarily implemented through the use of cash bonds, credit default swaps (index and single name), and interest rate swaps.
What is the outlook?
We believe that global growth is sluggish and is becoming more narrowly based (U.S.-centric). The key question appears to be whether the U.S. can continue to grow independently from the rest of the world. We believe rising monetary policy divergence - Fed normalization versus accommodative policy from other major central banks –should continue to drive rate markets for some time. A weaker Chinese growth profile, rolling over of Asia data surprises and Fed policy normalization (i.e. bringing interest rates to normal levels) could be negative for Asia-linked economies including Australia and New Zealand. Although we expect the Fed to move at a moderate pace, recent activity suggests that the start of the rate hike cycle may be unsettling for emerging markets.
In summary, headline global growth opportunities remain expansionary; however, we believe there is increased divergence between U.S. and non-U.S. regions. Global inflation pressures appear to be remaining subdued. Global policy objectives in the absence of inflation, in our view, are supportive of lower yields. We believe geopolitical risks are aplenty and each on their own could change our outlook meaningfully. As a result, we continue to manage duration tactically and had duration of 4.63 years at the end of the period. We also remain tactical in our overall portfolio positioning, with a greater emphasis on country differentiation.
Credit Exposure
as of October 31, 2014
| Credit Rating * | Percentage of Net Assets | |||
| Aaa/ AAA | 36.6 | % | ||
| Aa/ AA | 29.5 | |||
| A | 5.3 | |||
| Baa/ BBB | 2.8 | |||
| Ba/ BB | 4.9 | |||
| B | 6.3 | |||
| Caa/ CCC or Lower | 3.7 | |||
| Not Rated | 5.0 | |||
| Non-Debt Securities and Other Short-Term Instruments | 4.1 | |||
| Other Assets and Liabilities | 1.8 | |||
| Total | 100.0 | % | ||
| * | Credit exposure is the long-term credit ratings for the Fund's holdings, as of the date noted, as provided by Standard and Poor's (S&P) or Moody's Investors Service (Moody's) and typically range from AAA/Aaa (highest) to C/D (lowest). Presentation of S&P and Moody's credit ratings in this report have been selected for informational purposes for shareholders, as well as the Fund's consideration of industry practice. If Moody's and S&P assign different ratings, the lower rating is used. Fixed income securities that are not rated by either agency are listed as "Not Rated." Ratings do not apply to the Fund itself or to the Fund's shares. Ratings may change. |
Diversification by Security Type
as of October 31, 2014
| Category | Percentage of Net Assets | |||
| Equity Securities | ||||
| Preferred Stocks | 0.1 | % | ||
| Total | 0.1 | % | ||
| Fixed Income Securities | ||||
| Asset & Commercial Mortgage Backed Securities | 13.0 | % | ||
| Corporate Bonds | 10.4 | |||
| Foreign Government Obligations | 55.9 | |||
| Senior Floating Rate Interests | 2.9 | |||
| U.S. Government Agencies | 0.2 | |||
| U.S. Government Securities | 11.7 | |||
| Total | 94.1 | % | ||
| Short-Term Investments | 3.9 | |||
| Purchased Options | 0.1 | |||
| Other Assets and Liabilities | 1.8 | |||
| Total | 100.0 | % | ||
| 4 |
Schedule of Investments
October 31, 2014
(000’s Omitted)
| Shares or Principal Amount ╬ | Market Value ╪ | |||||||
| Asset and Commercial Mortgage Backed Securities - 13.0% | ||||||||
| Cayman Islands - 2.3% | ||||||||
| A Voce CLO Ltd. | ||||||||
| $ | 5,000 | 1.69%, 07/15/2026 ■Δ | $ | 4,954 | ||||
| Apidos CLO XVIII | ||||||||
| 4,500 | 1.65%, 07/22/2026 ■Δ | 4,460 | ||||||
| Ares CLO Ltd. | ||||||||
| 2,738 | 1.02%, 04/20/2023 ■Δ | 2,721 | ||||||
| 2,995 | 1.62%, 04/20/2023 ■Δ | 2,904 | ||||||
| 3,845 | 1.76%, 04/17/2026 ■Δ | 3,827 | ||||||
| Atrium CDO Corp. | ||||||||
| 1,735 | 1.99%, 11/16/2022 ■Δ | 1,693 | ||||||
| Babson CLO Ltd. | ||||||||
| 2,725 | 1.33%, 04/20/2025 ■Δ | 2,672 | ||||||
| Dryden Senior Loan Fund | ||||||||
| 4,575 | 1.48%, 07/17/2023 ■Δ | 4,522 | ||||||
| Gramercy Park CLO Ltd. | ||||||||
| 2,235 | 1.53%, 07/17/2023 ■Δ | 2,228 | ||||||
| ING Investment Management CLO Ltd. | ||||||||
| 4,175 | 1.43%, 03/14/2022 ■Δ | 4,145 | ||||||
| Limerock CLO | ||||||||
| 4,130 | 1.73%, 04/18/2026 ■Δ | 4,100 | ||||||
| Magnetite CLO Ltd. | ||||||||
| 4,365 | 1.70%, 07/25/2026 ■Δ | 4,327 | ||||||
| Neuberger Berman CLO XVII Ltd. | ||||||||
| 4,245 | 1.70%, 08/04/2025 ■Δ | 4,208 | ||||||
| OZLM Funding Ltd. | ||||||||
| 11,510 | 1.73%, 04/17/2026 ■Δ | 11,456 | ||||||
| Race Point CLO Ltd. | ||||||||
| 3,825 | 2.38%, 05/24/2023 ■Δ | 3,771 | ||||||
| Seneca Park CLO Ltd. | ||||||||
| 1,555 | 1.70%, 07/17/2026 ■Δ | 1,553 | ||||||
| Symphony CLO XV Ltd. | ||||||||
| 6,095 | 1.65%, 10/17/2026 ■☼Δ | 6,049 | ||||||
| Voya CLO Ltd. | ||||||||
| 1,725 | 1.68%, 07/17/2026 ■Δ | 1,717 | ||||||
| 71,307 | ||||||||
| United Kingdom - 0.1% | ||||||||
| Granite Master Issuer plc | ||||||||
| 1,354 | 0.23%, 12/20/2054 ■Δ | 1,343 | ||||||
| 415 | 0.23%, 12/17/2054 Δ | 412 | ||||||
| 863 | 0.24%, 12/20/2054 Δ | 857 | ||||||
| 374 | 0.30%, 12/20/2054 Δ | 371 | ||||||
| 465 | 0.33%, 12/17/2054 Δ | 462 | ||||||
| Motor plc | ||||||||
| 48 | 1.29%, 02/25/2020 ■ | 48 | ||||||
| 3,493 | ||||||||
| United States - 10.6% | ||||||||
| Adjustable Rate Mortgage Trust | ||||||||
| 482 | 0.42%, 11/25/2035 Δ | 444 | ||||||
| Agate Bay Mortgage Trust | ||||||||
| 3,198 | 3.50%, 07/25/2043 ■Δ | 3,241 | ||||||
| Ally Master Owner Trust | ||||||||
| 1,775 | 0.67%, 09/17/2018 Δ | 1,780 | ||||||
| 1,245 | 1.54%, 09/15/2019 | 1,245 | ||||||
| American Credit Acceptance Receivables | ||||||||
| 4,011 | 1.14%, 03/12/2018 ■ | 4,015 | ||||||
| 347 | 1.64%, 11/15/2016 ■ | 348 | ||||||
| 1,915 | 3.96%, 05/15/2019 ■ | 1,956 | ||||||
| American Home Mortgage Assets Trust | ||||||||
| 142 | 0.28%, 03/25/2047 Δ | 115 | ||||||
| 861 | 0.34%, 10/25/2046 Δ | 612 | ||||||
| 632 | 1.06%, 10/25/2046 Δ | 461 | ||||||
| American Money Management Corp. | ||||||||
| 4,615 | 1.68%, 07/27/2026 ■Δ | 4,570 | ||||||
| AmeriCredit Automobile Receivables Trust | ||||||||
| 831 | 0.74%, 11/08/2016 | 832 | ||||||
| 652 | 1.57%, 01/08/2019 | 653 | ||||||
| 465 | 1.69%, 11/08/2018 | 468 | ||||||
| 1,780 | 2.35%, 12/10/2018 | 1,790 | ||||||
| 70 | 3.34%, 04/08/2016 | 70 | ||||||
| Apidos CLO | ||||||||
| 2,900 | 1.33%, 04/15/2025 ■Δ | 2,851 | ||||||
| 3,840 | 1.68%, 01/19/2025 ■Δ | 3,820 | ||||||
| Ares CLO Ltd. | ||||||||
| 4,040 | 1.73%, 10/12/2023 ■Δ | 4,034 | ||||||
| Banc of America Funding Corp. | ||||||||
| 2,228 | 0.39%, 02/20/2047 Δ | 1,917 | ||||||
| 397 | 5.77%, 05/25/2037 | 335 | ||||||
| 513 | 5.85%, 01/25/2037 | 415 | ||||||
| Bear Stearns Adjustable Rate Mortgage Trust | ||||||||
| 2,396 | 2.26%, 08/25/2035 Δ | 2,406 | ||||||
| 1,601 | 2.65%, 07/25/2036 Δ | 1,351 | ||||||
| 1,642 | 4.99%, 06/25/2047 Δ | 1,465 | ||||||
| Bear Stearns Alt-A Trust | ||||||||
| 798 | 0.47%, 08/25/2036 Δ | 604 | ||||||
| 2,052 | 0.65%, 01/25/2036 Δ | 1,626 | ||||||
| 906 | 2.63%, 09/25/2035 Δ | 829 | ||||||
| 226 | 2.70%, 08/25/2036 Δ | 165 | ||||||
| Bear Stearns Mortgage Funding Trust | ||||||||
| 673 | 0.35%, 02/25/2037 Δ | 496 | ||||||
| Cabela's Master Credit Card Trust | ||||||||
| 1,805 | 0.80%, 08/16/2021 ■Δ | 1,817 | ||||||
| Cal Funding II Ltd. | ||||||||
| 528 | 3.47%, 10/25/2027 ■ | 525 | ||||||
| Carlyle Global Market Strategies | ||||||||
| 3,390 | 1.35%, 07/15/2025 ■Δ | 3,321 | ||||||
| 875 | 1.38%, 04/18/2025 ■Δ | 860 | ||||||
| Cent CLO L.P. | ||||||||
| 3,970 | 1.71%, 01/25/2026 ■Δ | 3,951 | ||||||
| CFCRE Commercial Mortgage Trust | ||||||||
| 1,935 | 3.83%, 12/15/2047 | 2,051 | ||||||
| Chase Issuance Trust | ||||||||
| 4,700 | 0.58%, 09/15/2020 Δ | 4,715 | ||||||
| ChaseFlex Trust | ||||||||
| 254 | 5.50%, 06/25/2035 | 233 | ||||||
| CHL Mortgage Pass-Through Trust | ||||||||
| 1,937 | 0.49%, 03/25/2035 Δ | 1,668 | ||||||
| 3,161 | 2.42%, 06/20/2035 Δ | 3,035 | ||||||
| 2,604 | 2.66%, 04/25/2037 Δ | 2,372 | ||||||
| CIFC Funding Ltd. | ||||||||
| 4,065 | 1.73%, 04/18/2025 ■Δ | 4,037 | ||||||
| Citigroup Commercial Mortgage Trust | ||||||||
| 2,320 | 1.90%, 06/15/2033 ■Δ | 2,311 | ||||||
| Citigroup Mortgage Loan Trust, Inc. | ||||||||
| 725 | 2.44%, 07/25/2036 Δ | 476 | ||||||
| Citigroup/Deutsche Bank Commercial Mortgage Trust | ||||||||
| 9 | 5.89%, 11/15/2044 | 10 | ||||||
The accompanying notes are an integral part of these financial statements.
| 5 |
The Hartford World Bond Fund
Schedule of Investments – (continued)
October 31, 2014
(000’s Omitted)
| Shares or Principal Amount ╬ | Market Value ╪ | |||||||
| Asset and Commercial Mortgage Backed Securities - 13.0% - (continued) | ||||||||
| United States - 10.6% - (continued) | ||||||||
| Commercial Mortgage Loan Trust | ||||||||
| $ | 4,341 | 6.24%, 12/10/2049 Δ | $ | 4,704 | ||||
| Commercial Mortgage Pass-Through Certificates | ||||||||
| 2,605 | 2.85%, 10/15/2045 | 2,577 | ||||||
| 2,140 | 4.02%, 07/10/2045 | 2,282 | ||||||
| Commercial Mortgage Trust | ||||||||
| 1,680 | 4.50%, 03/10/2046 ■Δ | 1,127 | ||||||
| Community or Commercial Mortgage Trust | ||||||||
| 2,610 | 3.21%, 03/10/2046 | 2,638 | ||||||
| 1,880 | 4.38%, 07/10/2045 Δ | 2,046 | ||||||
| Connecticut Avenue Securities Series | ||||||||
| 2,964 | 2.15%, 10/25/2023 Δ | 2,984 | ||||||
| Consumer Portfolio Services, Inc. | ||||||||
| 66 | 2.78%, 06/17/2019 ■ | 67 | ||||||
| Countrywide Alternative Loan Trust | ||||||||
| 897 | 0.29%, 04/25/2047 Δ | 750 | ||||||
| 948 | 0.42%, 01/25/2036 Δ | 842 | ||||||
| 600 | 0.47%, 11/25/2035 Δ | 484 | ||||||
| 772 | 0.65%, 12/25/2035 Δ | 556 | ||||||
| 1,163 | 0.95%, 12/25/2035 Δ | 959 | ||||||
| 1,174 | 5.75%, 05/25/2036 | 999 | ||||||
| 812 | 6.50%, 08/25/2037 | 587 | ||||||
| Countrywide Home Loans, Inc. | ||||||||
| 1,043 | 2.58%, 09/25/2047 Δ | 928 | ||||||
| 1,718 | 4.87%, 11/20/2035 Δ | 1,541 | ||||||
| CPS Automotive Trust | ||||||||
| 2,681 | 1.64%, 08/15/2016 ■ | 2,691 | ||||||
| 843 | 1.94%, 03/16/2020 ■ | 849 | ||||||
| Credit Acceptance Automotive Loan Trust | ||||||||
| 1,360 | 1.21%, 10/15/2020 ■ | 1,360 | ||||||
| Credit Suisse Commercial Mortgage Trust | ||||||||
| 3,372 | 3.50%, 08/25/2043 ■ | 3,417 | ||||||
| 70 | 5.97%, 02/15/2041 Δ | 78 | ||||||
| Credit Suisse Mortgage Trust | ||||||||
| 1,225 | 5.75%, 03/25/2036 | 1,116 | ||||||
| DBUBS Mortgage Trust | ||||||||
| 2,964 | 1.55%, 01/01/2021 ■► | 76 | ||||||
| Deutsche Alt-A Securities, Inc. Mortgage | ||||||||
| 631 | 0.27%, 08/25/2036 Δ | 490 | ||||||
| Downey S & L Association Mortgage Loan Trust | ||||||||
| 1,763 | 1.04%, 03/19/2046 Δ | 1,363 | ||||||
| Dryden Senior Loan Fund | ||||||||
| 3,990 | 1.58%, 04/18/2026 ■Δ | 3,944 | ||||||
| 7,900 | 1.70%, 07/15/2026 ■Δ | 7,854 | ||||||
| Eaton Vance CLO Ltd. | ||||||||
| 2,455 | 1.68%, 07/15/2026 ■Δ | 2,437 | ||||||
| Enterprise Fleet Financing LLC | ||||||||
| 915 | 0.93%, 04/20/2018 ■ | 917 | ||||||
| 2,010 | 1.51%, 03/20/2019 ■ | 2,027 | ||||||
| First Horizon Alternative Mortgage Securities | ||||||||
| 435 | 2.21%, 04/25/2036 Δ | 364 | ||||||
| First Investors Automotive Owner Trust | ||||||||
| 460 | 0.90%, 10/15/2018 ■ | 461 | ||||||
| Ford Credit Floorplan Master Owner Trust | ||||||||
| 500 | 1.69%, 09/15/2019 Δ | 500 | ||||||
| GMAC Mortgage Corp. Loan Trust | ||||||||
| 737 | 2.93%, 09/19/2035 Δ | 689 | ||||||
| 1,084 | 2.95%, 04/19/2036 Δ | 954 | ||||||
| GreenPoint Mortgage Funding Trust | ||||||||
| 641 | 0.41%, 10/25/2045 Δ | 557 | ||||||
| Greenwich Capital Commercial Funding Corp. | ||||||||
| 400 | 5.74%, 12/10/2049 | 438 | ||||||
| 145 | 6.01%, 07/10/2038 Δ | 153 | ||||||
| GS Mortgage Securities Trust | ||||||||
| 2,470 | 3.38%, 05/10/2045 | 2,554 | ||||||
| 615 | 3.67%, 04/10/2047 ■Δ | 422 | ||||||
| 1,300 | 5.03%, 04/10/2047 ■Δ | 1,226 | ||||||
| GSAA Home Equity Trust | ||||||||
| 301 | 0.20%, 12/25/2046 Δ | 201 | ||||||
| 2,171 | 0.22%, 12/25/2046 Δ | 1,235 | ||||||
| 1,845 | 0.23%, 02/25/2037 Δ | 1,004 | ||||||
| 48 | 0.25%, 03/25/2037 Δ | 25 | ||||||
| 2,984 | 0.27%, 05/25/2047 Δ | 2,131 | ||||||
| 818 | 0.38%, 04/25/2047 Δ | 525 | ||||||
| 2,180 | 0.47%, 04/25/2047 Δ | 1,406 | ||||||
| GSR Mortgage Loan Trust | ||||||||
| 1,204 | 2.59%, 07/25/2035 Δ | 1,134 | ||||||
| 335 | 2.71%, 05/25/2037 Δ | 277 | ||||||
| 2,838 | 2.74%, 01/25/2036 Δ | 2,627 | ||||||
| Harborview Mortgage Loan Trust | ||||||||
| 1,008 | 0.35%, 01/19/2038 Δ | 851 | ||||||
| 652 | 0.38%, 05/19/2047 Δ | 255 | ||||||
| 3,527 | 0.40%, 12/19/2036 Δ | 2,495 | ||||||
| 270 | 0.49%, 09/19/2035 Δ | 209 | ||||||
| 2,199 | 0.51%, 01/19/2035 Δ | 1,540 | ||||||
| Hilton USA Trust | ||||||||
| 980 | 2.91%, 11/05/2030 ■Δ | 980 | ||||||
| HLSS Servicer Advance Receivables | ||||||||
| 2,286 | 1.50%, 01/16/2046 ■ | 2,280 | ||||||
| 3,230 | 1.98%, 11/15/2046 ■ | 3,215 | ||||||
| 2,300 | 1.99%, 10/15/2045 ■ | 2,316 | ||||||
| 1,620 | 2.22%, 01/15/2047 ■ | 1,617 | ||||||
| 3,555 | 2.48%, 10/15/2045 ■ | 3,572 | ||||||
| Home Equity Loan Trust | ||||||||
| 1,377 | 2.45%, 11/25/2035 Δ | 1,294 | ||||||
| IMPAC Commercial Mortgage Backed Trust | ||||||||
| 920 | 0.95%, 10/25/2034 Δ | 875 | ||||||
| IndyMac Index Mortgage Loan Trust | ||||||||
| 1,842 | 0.35%, 10/25/2036 Δ | 1,579 | ||||||
| 97 | 0.39%, 07/25/2035 Δ | 86 | ||||||
| 879 | 0.43%, 07/25/2035 Δ | 750 | ||||||
| 1,619 | 0.55%, 07/25/2046 Δ | 795 | ||||||
| 584 | 2.47%, 08/25/2035 Δ | 468 | ||||||
| 365 | 2.55%, 09/25/2036 Δ | 308 | ||||||
| 1,520 | 2.60%, 12/25/2036 Δ | 1,329 | ||||||
| ING Investment Management CLO Ltd. | ||||||||
| 3,970 | 1.77%, 04/18/2026 ■Δ | 3,951 | ||||||
| JP Morgan Chase Commercial Mortgage Securities Corp. | ||||||||
| 1,209 | 1.65%, 02/12/2051 Δ | 1,213 | ||||||
| 2,124 | 2.75%, 10/15/2045 ■ | 1,608 | ||||||
| 850 | 2.83%, 10/15/2045 | 842 | ||||||
| 700 | 4.00%, 08/15/2046 ■ | 606 | ||||||
| 2,825 | 4.17%, 08/15/2046 | 3,063 | ||||||
| 1,536 | 4.57%, 12/15/2047 ■Δ | 1,306 | ||||||
| 1,690 | 4.82%, 10/15/2045 ■Δ | 1,677 | ||||||
| 4,640 | 5.89%, 02/12/2049 Δ | 5,046 | ||||||
The accompanying notes are an integral part of these financial statements.
| 6 |
The Hartford World Bond Fund
Schedule of Investments – (continued)
October 31, 2014
(000’s Omitted)
| Shares or Principal Amount ╬ | Market Value ╪ | |||||||
| Asset and Commercial Mortgage Backed Securities - 13.0% - (continued) | ||||||||
| United States - 10.6% - (continued) | ||||||||
| JP Morgan Mortgage Trust | ||||||||
| $ | 3,954 | 2.61%, 02/25/2035 Δ | $ | 4,002 | ||||
| 1,246 | 2.71%, 05/25/2036 Δ | 1,132 | ||||||
| 3,803 | 3.00%, 09/25/2044 ■ | 3,847 | ||||||
| 306 | 6.00%, 01/25/2037 | 273 | ||||||
| JPMBB Commercial Mortgage Securities Trust | ||||||||
| 70,607 | 0.89%, 09/15/2047 ► | 3,726 | ||||||
| LB-UBS Commercial Mortgage Trust | ||||||||
| 254 | 5.43%, 02/15/2040 | 275 | ||||||
| LCM Ltd. | ||||||||
| 1,100 | 2.13%, 04/15/2022 ■Δ | 1,079 | ||||||
| Lehman XS Trust | ||||||||
| 905 | 0.34%, 11/25/2046 Δ | 720 | ||||||
| 1,174 | 1.00%, 09/25/2047 Δ | 961 | ||||||
| Luminent Mortgage Trust | ||||||||
| 2,400 | 0.35%, 02/25/2046 Δ | 1,765 | ||||||
| 585 | 0.39%, 04/25/2036 Δ | 393 | ||||||
| 1,091 | 0.41%, 11/25/2035 Δ | 1,014 | ||||||
| M&T Bank Automotive Receivables Trust | ||||||||
| 1,170 | 1.57%, 01/15/2017 ■ | 1,182 | ||||||
| Madison Park Funding Ltd. | ||||||||
| 6,150 | 1.68%, 01/19/2025 - 07/20/2026 ■Δ | 6,121 | ||||||
| Master Adjustable Rate Mortgages Trust | ||||||||
| 1,221 | 0.39%, 05/25/2037 Δ | 827 | ||||||
| Merrill Lynch Mortgage Investors Trust | ||||||||
| 190 | 2.19%, 05/25/2033 Δ | 184 | ||||||
| 1,430 | 2.52%, 07/25/2035 Δ | 1,187 | ||||||
| 1,060 | 5.14%, 07/12/2038 | 1,087 | ||||||
| Morgan Stanley ABS Capital I | ||||||||
| 4,443 | 0.30%, 06/25/2036 Δ | 3,807 | ||||||
| Morgan Stanley BAML Trust | ||||||||
| 1,505 | 4.50%, 08/15/2045 ■ | 1,148 | ||||||
| Morgan Stanley Capital I | ||||||||
| 2,990 | 3.24%, 03/15/2045 | 3,058 | ||||||
| 100 | 5.42%, 09/15/2047 ■Δ | 114 | ||||||
| 50 | 5.83%, 06/11/2042 Δ | 55 | ||||||
| 625 | 6.45%, 01/11/2043 Δ | 704 | ||||||
| Morgan Stanley Mortgage Loan Trust | ||||||||
| 4,002 | 0.32%, 05/25/2036 - 11/25/2036 Δ | 2,008 | ||||||
| 245 | 2.59%, 05/25/2036 Δ | 178 | ||||||
| 657 | 2.63%, 06/25/2037 Δ | 420 | ||||||
| Morgan Stanley Re-Remic Trust | ||||||||
| 951 | 5.99%, 08/15/2045 ■Δ | 1,032 | ||||||
| Nationstar Agency Advance Funding Trust | ||||||||
| 1,000 | 1.89%, 02/18/2048 ■ | 981 | ||||||
| 250 | 3.23%, 02/18/2048 ■Δ | 252 | ||||||
| Neuberger Berman CLO XVI Ltd. | ||||||||
| 3,030 | 1.70%, 03/01/2026 ■Δ | 3,004 | ||||||
| OHA Intrepid Leveraged Loan Fund Ltd. | ||||||||
| 2,161 | 1.15%, 04/20/2021 ■Δ | 2,161 | ||||||
| OZLM Funding Ltd. | ||||||||
| 3,880 | 1.73%, 01/17/2026 ■Δ | 3,841 | ||||||
| Prestige Automotive Receivables Trust | ||||||||
| 1,089 | 1.09%, 02/15/2018 ■ | 1,091 | ||||||
| 100 | 1.33%, 05/15/2019 ■ | 100 | ||||||
| Prime Mortgage Trust | ||||||||
| 755 | 5.50%, 06/25/2036 | 706 | ||||||
| Race Point CLO Ltd. | ||||||||
| 2,040 | 1.48%, 02/20/2025 ■Δ | 2,019 | ||||||
| RBSGC Mortage Pass Through Certificates | ||||||||
| 1,079 | 6.25%, 01/25/2037 | 1,011 | ||||||
| Renaissance Home Equity Loan Trust | ||||||||
| 3,695 | 0.67%, 03/25/2034 Δ | 3,516 | ||||||
| Residential Accredit Loans, Inc. | ||||||||
| 1,062 | 0.92%, 09/25/2046 Δ | 713 | ||||||
| 2,208 | 1.41%, 11/25/2037 Δ | 1,405 | ||||||
| 307 | 6.25%, 01/25/2037 | 252 | ||||||
| Residential Funding Mortgage Securities, Inc. | ||||||||
| 932 | 3.05%, 04/25/2037 Δ | 812 | ||||||
| 617 | 6.00%, 04/25/2037 - 07/25/2037 | 553 | ||||||
| Sequoia Mortgage Trust | ||||||||
| 1,709 | 0.43%, 01/20/2035 Δ | 1,633 | ||||||
| 683 | 5.03%, 07/20/2037 Δ | 650 | ||||||
| Sheridan Square CLO | ||||||||
| 2,435 | 1.40%, 04/15/2025 ■Δ | 2,394 | ||||||
| SNAAC Automotive Receivables Trust | ||||||||
| 309 | 1.14%, 07/16/2018 ■ | 309 | ||||||
| SpringCastle America Funding LLC | ||||||||
| 2,910 | 2.70%, 05/25/2023 ■ | 2,912 | ||||||
| Springleaf Funding Trust | ||||||||
| 1,790 | 2.41%, 12/15/2022 ■ | 1,794 | ||||||
| Springleaf Mortgage Loan Trust | ||||||||
| 479 | 1.57%, 12/25/2059 ■ | 479 | ||||||
| 2,430 | 1.78%, 12/25/2065 ■ | 2,426 | ||||||
| 3,065 | 2.31%, 06/25/2058 ■ | 3,002 | ||||||
| 510 | 2.66%, 12/25/2059 ■ | 510 | ||||||
| 1,725 | 3.14%, 06/25/2058 ■ | 1,728 | ||||||
| 920 | 3.52%, 12/25/2065 ■ | 939 | ||||||
| 2,770 | 3.79%, 09/25/2057 ■ | 2,790 | ||||||
| Structured Adjustable Rate Mortgage Loan Trust | ||||||||
| 1,159 | 0.45%, 09/25/2034 Δ | 1,029 | ||||||
| Structured Agency Credit Risk Debt Notes | ||||||||
| 4,142 | 1.00%, 04/25/2024 Δ | 4,095 | ||||||
| 9,775 | 1.15%, 02/25/2024 Δ | 9,683 | ||||||
| Structured Asset Mortgage Investments, Inc. | ||||||||
| 682 | 0.38%, 02/25/2036 Δ | 556 | ||||||
| Structured Asset Securities Corp. | ||||||||
| 399 | 2.54%, 11/25/2033 Δ | 390 | ||||||
| Symphony CLO Ltd. | ||||||||
| 4,355 | 1.71%, 07/14/2026 ■Δ | 4,330 | ||||||
| TAL Advantage LLC | ||||||||
| 1,079 | 2.83%, 02/22/2038 ■ | 1,063 | ||||||
| Terwin Mortgage Trust | ||||||||
| 1,944 | 1.09%, 12/25/2034 Δ | 1,890 | ||||||
| Thornburg Mortgage Securities Trust | ||||||||
| 1,605 | 2.24%, 04/25/2045 Δ | 1,619 | ||||||
| UBS-Barclays Commercial Mortgage Trust | ||||||||
| 5,950 | 3.18%, 03/10/2046 Δ | 5,972 | ||||||
| 1,095 | 4.23%, 03/10/2046 ■Δ | 912 | ||||||
| Wachovia Bank Commercial Mortgage Trust | ||||||||
| 1,009 | 5.42%, 01/15/2045 Δ | 1,042 | ||||||
| WaMu Mortgage Pass-Through Certificates | ||||||||
| 1,249 | 4.61%, 08/25/2036 Δ | 1,142 | ||||||
| Wells Fargo Commercial Mortgage Trust | ||||||||
| 3,900 | 2.92%, 10/15/2045 | 3,891 | ||||||
| Wells Fargo Mortgage Backed Securities Trust | ||||||||
| 511 | 2.49%, 10/25/2036 Δ | 476 | ||||||
| 882 | 2.59%, 12/28/2037 Δ | 812 | ||||||
The accompanying notes are an integral part of these financial statements.
| 7 |
The Hartford World Bond Fund
Schedule of Investments – (continued)
October 31, 2014
(000’s Omitted)
| Shares or Principal Amount ╬ | Market Value ╪ | |||||||
| Asset and Commercial Mortgage Backed Securities - 13.0% - (continued) | ||||||||
| United States - 10.6% - (continued) | ||||||||
| Wells Fargo Mortgage Backed Securities Trust - (continued) | ||||||||
| $ | 1,745 | 2.61%, 10/25/2035 Δ | $ | 1,630 | ||||
| 90 | 5.21%, 10/25/2035 Δ | 89 | ||||||
| WF-RBS Commercial Mortgage Trust | ||||||||
| 15,903 | 1.47%, 03/15/2047 ► | 1,381 | ||||||
| 830 | 4.90%, 06/15/2044 ■ | 932 | ||||||
| 1,325 | 5.00%, 06/15/2044 - 04/15/2045 ■ | 1,097 | ||||||
| 935 | 5.75%, 04/15/2045 ■Δ | 990 | ||||||
| 327,298 | ||||||||
| Total Asset and Commercial Mortgage Backed Securities | ||||||||
| (Cost $400,903) | $ | 402,098 | ||||||
| Corporate Bonds - 10.4% | ||||||||
| Australia - 0.2% | ||||||||
| FMG Resources Aug 2006 | ||||||||
| $ | 2,730 | 6.88%, 04/01/2022 ■ | $ | 2,819 | ||||
| FMG Resources Pty Ltd. | ||||||||
| 2,825 | 8.25%, 11/01/2019 ■ | 2,931 | ||||||
| 5,750 | ||||||||
| Brazil - 0.2% | ||||||||
| Petrobras Global Finance Co. | ||||||||
| 7,850 | 3.25%, 03/17/2017 | 7,936 | ||||||
| Canada - 0.1% | ||||||||
| Novelis, Inc. | ||||||||
| 475 | 8.75%, 12/15/2020 | 518 | ||||||
| Telesat LLC | ||||||||
| 1,300 | 6.00%, 05/15/2017 ■ | 1,340 | ||||||
| Videotron Ltd. | ||||||||
| 3 | 9.13%, 04/15/2018 | 3 | ||||||
| 1,861 | ||||||||
| France - 0.4% | ||||||||
| Banque PSA Finance S.A. | ||||||||
| EUR | 4,247 | 4.25%, 02/25/2016 § | 5,530 | |||||
| BPCE S.A. | ||||||||
| EUR | 1,250 | 9.00%, 03/17/2015 ♠Δ | 1,598 | |||||
| Societe Generale | ||||||||
| 1,325 | 6.00%, 01/27/2020 ■♠ | 1,249 | ||||||
| EUR | 1,200 | 6.75%, 04/07/2049 § | 1,509 | |||||
| 1,545 | 7.88%, 12/18/2023 ■♠ | 1,545 | ||||||
| 11,431 | ||||||||
| Germany - 0.1% | ||||||||
| Trionista Holdco GmbH | ||||||||
| EUR | 330 | 5.00%, 04/30/2020 ■ | 427 | |||||
| Unitymedia Hessen GmbH & Co. | ||||||||
| EUR | 1,350 | 9.63%, 12/01/2019 § | 1,779 | |||||
| 2,206 | ||||||||
| Ireland - 0.2% | ||||||||
| AerCap Ireland Capital Ltd. | ||||||||
| 2,700 | 4.50%, 05/15/2021 ■ | 2,727 | ||||||
| Ardagh Packaging Finance plc | ||||||||
| EUR | 850 | 9.25%, 10/15/2020 § | 1,140 | |||||
| Baggot Securities Ltd. | ||||||||
| EUR | 100 | 10.24%, 12/29/2049 ■ | 132 | |||||
| Nara Cable Funding Ltd. | ||||||||
| 525 | 8.88%, 12/01/2018 ■ | 551 | ||||||
| EUR | 700 | 8.88%, 12/01/2018 § | 919 | |||||
| 5,469 | ||||||||
| Italy - 0.2% | ||||||||
| Intesa Sanpaolo S.p.A. | ||||||||
| EUR | 1,300 | 9.50%, 10/29/2049 § | 1,776 | |||||
| Wind Acquisition Finance S.A. | ||||||||
| EUR | 1,160 | 4.00%, 07/15/2020 ■ | 1,432 | |||||
| EUR | 3,525 | 4.08%, 07/15/2020 ■Δ | 4,339 | |||||
| 7,547 | ||||||||
| Japan - 0.0% | ||||||||
| SoftBank Corp. | ||||||||
| 1,230 | 4.50%, 04/15/2020 ■ | 1,245 | ||||||
| Luxembourg - 0.5% | ||||||||
| Aguila 3 S.A. | ||||||||
| 1,455 | 7.88%, 01/31/2018 ■ | 1,459 | ||||||
| Altice Financing S.A. | ||||||||
| EUR | 1,185 | 6.50%, 01/15/2022 § | 1,529 | |||||
| 355 | 8.13%, 01/15/2024 ■ | 374 | ||||||
| 610 | 9.88%, 12/15/2020 ■ | 680 | ||||||
| Ardagh Finance Holdings S.A. | ||||||||
| EUR | 470 | 8.38%, 06/15/2019 ■ | 560 | |||||
| CNH Industrial Finance Europe S.A. | ||||||||
| EUR | 3,316 | 2.75%, 03/18/2019 § | 4,170 | |||||
| Ineos Group Holdings plc | ||||||||
| EUR | 3,750 | 5.75%, 02/15/2019 § | 4,678 | |||||
| Ontex IV S.A. | ||||||||
| EUR | 625 | 7.50%, 04/15/2018 § | 810 | |||||
| EUR | 245 | 7.50%, 04/15/2018 ■ | 318 | |||||
| 14,578 | ||||||||
| Netherlands - 0.2% | ||||||||
| AerCap Aviation Solutions B.V. | ||||||||
| 200 | 6.38%, 05/30/2017 | 212 | ||||||
| Constellium N.V. | ||||||||
| EUR | 1,250 | 4.63%, 05/15/2021 § | 1,551 | |||||
| EUR | 295 | 4.63%, 05/15/2021 ■ | 366 | |||||
| NXP B.V./NXP Funding LLC | ||||||||
| 440 | 3.75%, 06/01/2018 ■ | 443 | ||||||
| UPC Holding B.V. | ||||||||
| EUR | 2,075 | 8.38%, 08/15/2020 § | 2,795 | |||||
| 5,367 | ||||||||
| South Korea - 0.0% | ||||||||
| Harvest Operations Corp. | ||||||||
| 41 | 6.88%, 10/01/2017 | 42 | ||||||
| Spain - 0.7% | ||||||||
| Abengoa Finance | ||||||||
| 1,500 | 7.75%, 02/01/2020 ■ | 1,568 | ||||||
| Abengoa Greenfield, S.A. | ||||||||
| EUR | 3,750 | 5.50%, 10/01/2019 ■ | 4,578 | |||||
| Banco Bilbao Vizcaya Argentaria S.A. | ||||||||
| EUR | 2,400 | 7.00%, 12/29/2049 § | 3,085 | |||||
| 2,800 | 9.00%, 05/09/2018 §♠ | 3,026 | ||||||
| Banco Santander S.A. | ||||||||
| EUR | 3,800 | 6.25%, 03/12/2049 § | 4,661 | |||||
| NH Hoteles S.A. | ||||||||
| EUR | 3,390 | 6.88%, 11/15/2019 ■ | 4,509 | |||||
| 21,427 | ||||||||
The accompanying notes are an integral part of these financial statements.
| 8 |
The Hartford World Bond Fund
Schedule of Investments – (continued)
October 31, 2014
(000’s Omitted)
| Shares or Principal Amount ╬ | Market Value ╪ | |||||||
| Corporate Bonds - 10.4% - (continued) | ||||||||
| Switzerland - 0.1% | ||||||||
| Credit Suisse Group AG | ||||||||
| $ | 3,725 | 7.88%, 02/24/2041 § | $ | 3,976 | ||||
| United Kingdom - 1.6% | ||||||||
| Barclays Bank plc | ||||||||
| 2,180 | 0.56%, 11/17/2014 ♠Δ | 1,417 | ||||||
| 14,260 | 4.38%, 09/11/2024 | 13,833 | ||||||
| 3,495 | 8.25%, 12/15/2018 ♠β | 3,608 | ||||||
| GBP | 550 | 14.00%, 06/15/2019 ♠ | 1,144 | |||||
| HSBC Holdings plc | ||||||||
| EUR | 825 | 0.38%, 09/30/2020 Δ | 1,027 | |||||
| 2,620 | 0.75%, 09/30/2049 Δ | 1,769 | ||||||
| Ineos Group Holdings plc | ||||||||
| EUR | 1,090 | 6.50%, 08/15/2018 ■ | 1,383 | |||||
| Lloyds Banking Group plc | ||||||||
| EUR | 2,725 | 6.38%, 06/27/2049 § | 3,526 | |||||
| GBP | 1,550 | 7.00%, 12/29/2049 § | 2,475 | |||||
| Matalan Finance plc | ||||||||
| GBP | 710 | 6.88%, 06/01/2019 ■ | 1,086 | |||||
| National Westminster Bank plc | ||||||||
| 1,270 | 0.56%, 01/11/2015 ♠Δ | 836 | ||||||
| EUR | 725 | 2.23%, 10/29/2049 Δ | 848 | |||||
| Nationwide Building Society | ||||||||
| GBP | 2,400 | 6.88%, 03/11/2049 § | 3,753 | |||||
| Paragon Offshore plc | ||||||||
| 2,345 | 6.75%, 07/15/2022 ■ | 1,788 | ||||||
| Royal Bank of Scotland Group plc | ||||||||
| 5,070 | 6.00%, 12/19/2023 | 5,457 | ||||||
| 2,075 | 9.50%, 03/16/2022 § | 2,371 | ||||||
| Tullow Oil plc | ||||||||
| 545 | 6.00%, 11/01/2020 ■ | 510 | ||||||
| 1,745 | 6.25%, 04/15/2022 ■ | 1,623 | ||||||
| 48,454 | ||||||||
| United States - 5.9% | ||||||||
| 99 Cents Only Stores | ||||||||
| 425 | 11.00%, 12/15/2019 | 460 | ||||||
| AbbVie, Inc. | ||||||||
| 690 | 1.75%, 11/06/2017 | 692 | ||||||
| Activision Blizzard, Inc. | ||||||||
| 6,820 | 6.13%, 09/15/2023 ■ | 7,383 | ||||||
| AES (The) Corp. | ||||||||
| 84 | 7.75%, 10/15/2015 | 89 | ||||||
| 7 | 8.00%, 10/15/2017 | 8 | ||||||
| AK Steel Corp. | ||||||||
| 3,520 | 7.63%, 05/15/2020 - 10/01/2021 | 3,533 | ||||||
| 440 | 8.38%, 04/01/2022 | 449 | ||||||
| Albertson's Holdings LLC | ||||||||
| 1,650 | 7.75%, 10/15/2022 ■ | 1,625 | ||||||
| Alcatel-Lucent USA, Inc. | ||||||||
| 3,525 | 4.63%, 07/01/2017 ■ | 3,582 | ||||||
| 610 | 6.75%, 11/15/2020 ■ | 629 | ||||||
| Alere, Inc. | ||||||||
| 1,970 | 6.50%, 06/15/2020 | 2,029 | ||||||
| 1,050 | 7.25%, 07/01/2018 | 1,118 | ||||||
| Ally Financial, Inc. | ||||||||
| 2,480 | 5.13%, 09/30/2024 | 2,579 | ||||||
| AMC Entertainment, Inc. | ||||||||
| 734 | 9.75%, 12/01/2020 | 815 | ||||||
| American Builders & Contractors Supply Co., Inc. | ||||||||
| 220 | 5.63%, 04/15/2021 ■ | 223 | ||||||
| American International Group, Inc. | ||||||||
| GBP | 2,100 | 5.75%, 03/15/2067 | 3,484 | |||||
| AmSurg Corp. | ||||||||
| 575 | 5.63%, 07/15/2022 ■ | 596 | ||||||
| Antero Resources Corp. | ||||||||
| 380 | 5.38%, 11/01/2021 | 386 | ||||||
| ARAMARK Corp. | ||||||||
| 1,505 | 5.75%, 03/15/2020 | 1,573 | ||||||
| Ashtead Capital, Inc. | ||||||||
| 800 | 6.50%, 07/15/2022 ■ | 864 | ||||||
| Associated Materials LLC | ||||||||
| 245 | 9.13%, 11/01/2017 | 240 | ||||||
| Bank of America Corp. | ||||||||
| EUR | 1,800 | 0.78%, 05/23/2017 Δ | 2,236 | |||||
| Biomet, Inc. | ||||||||
| 1,210 | 6.50%, 08/01/2020 - 10/01/2020 | 1,294 | ||||||
| Building Materials Corp. | ||||||||
| 430 | 6.88%, 08/15/2018 ■ | 447 | ||||||
| CCO Holdings LLC | ||||||||
| 195 | 7.25%, 10/30/2017 | 203 | ||||||
| 1,300 | 7.38%, 06/01/2020 | 1,393 | ||||||
| 425 | 8.13%, 04/30/2020 | 451 | ||||||
| CDW Escrow Corp. | ||||||||
| 3,025 | 8.50%, 04/01/2019 | 3,207 | ||||||
| CEC Entertainment, Inc. | ||||||||
| 280 | 8.00%, 02/15/2022 ■ | 269 | ||||||
| Chrysler Group LLC | ||||||||
| 6,255 | 8.00%, 06/15/2019 | 6,700 | ||||||
| 2,560 | 8.25%, 06/15/2021 | 2,861 | ||||||
| CIT Group, Inc. | ||||||||
| 30 | 5.00%, 05/15/2017 | 31 | ||||||
| 65 | 5.25%, 03/15/2018 | 69 | ||||||
| 525 | 5.50%, 02/15/2019 ■ | 560 | ||||||
| Clean Harbors, Inc. | ||||||||
| 640 | 5.13%, 06/01/2021 | 651 | ||||||
| CNH America LLC | ||||||||
| 95 | 7.25%, 01/15/2016 | 100 | ||||||
| CNH Capital LLC | ||||||||
| 3,205 | 3.63%, 04/15/2018 | 3,205 | ||||||
| 205 | 3.88%, 11/01/2015 | 208 | ||||||
| 230 | 6.25%, 11/01/2016 | 243 | ||||||
| Cobalt International Energy, Inc. | ||||||||
| 1,155 | 2.63%, 12/01/2019 β | 858 | ||||||
| Community Health Systems, Inc. | ||||||||
| 610 | 5.13%, 08/15/2018 | 635 | ||||||
| 4,350 | 6.88%, 02/01/2022 | 4,687 | ||||||
| 1,930 | 7.13%, 07/15/2020 | 2,089 | ||||||
| Cubist Pharmaceuticals | ||||||||
| 235 | 1.88%, 09/01/2020 β | 274 | ||||||
| DaVita, Inc. | ||||||||
| 1,120 | 5.75%, 08/15/2022 | 1,187 | ||||||
| Deutsche Postbank IV | ||||||||
| EUR | 200 | 5.98%, 06/29/2049 §Δ | 262 | |||||
| DISH DBS Corp. | ||||||||
| 2,895 | 5.00%, 03/15/2023 | 2,884 | ||||||
| Dolphin Subsidiary II, Inc. | ||||||||
| 1,495 | 7.25%, 10/15/2021 | 1,588 | ||||||
The accompanying notes are an integral part of these financial statements.
| 9 |
The Hartford World Bond Fund
Schedule of Investments – (continued)
October 31, 2014
(000’s Omitted)
| Shares or Principal Amount ╬ | Market Value ╪ | |||||||
| Corporate Bonds - 10.4% - (continued) | ||||||||
| United States - 5.9% - (continued) | ||||||||
| Emdeon, Inc. | ||||||||
| $ | 25 | 11.00%, 12/31/2019 | $ | 28 | ||||
| Entegris, Inc. | ||||||||
| 565 | 6.00%, 04/01/2022 ■ | 575 | ||||||
| Envision Healthcare Corp. | ||||||||
| 435 | 5.13%, 07/01/2022 ■ | 440 | ||||||
| Equinix, Inc. | ||||||||
| 60 | 4.88%, 04/01/2020 | 61 | ||||||
| Everest Acquisition LLC | ||||||||
| 80 | 9.38%, 05/01/2020 | 87 | ||||||
| First Data Corp. | ||||||||
| 306 | 14.50%, 09/24/2019 ■Þ | 320 | ||||||
| Ford Motor Credit Co. LLC | ||||||||
| 5,450 | 5.63%, 09/15/2015 | 5,672 | ||||||
| Fresenius Medical Care U.S. Finance II, Inc. | ||||||||
| 435 | 5.63%, 07/31/2019 ■ | 466 | ||||||
| 610 | 5.88%, 01/31/2022 ■ | 665 | ||||||
| 60 | 9.00%, 07/15/2015 ■ | 62 | ||||||
| General Motors Financial Co., Inc. | ||||||||
| 245 | 2.75%, 05/15/2016 | 248 | ||||||
| GenOn Americas Generation LLC | ||||||||
| 605 | 9.13%, 05/01/2031 | 566 | ||||||
| Getty Images, Inc. | ||||||||
| 1,630 | 7.00%, 10/15/2020 ■ | 1,255 | ||||||
| GRD Holding III Corp. | ||||||||
| 1,750 | 10.75%, 06/01/2019 ■ | 1,932 | ||||||
| H & E Equipment Services, Inc. | ||||||||
| 475 | 7.00%, 09/01/2022 | 507 | ||||||
| Harron Communications L.P. | ||||||||
| 2,325 | 9.13%, 04/01/2020 ■ | 2,534 | ||||||
| HCA Holdings, Inc. | ||||||||
| 2,530 | 7.50%, 11/15/2095 | 2,429 | ||||||
| HCA, Inc. | ||||||||
| 120 | 6.38%, 01/15/2015 | 121 | ||||||
| Hertz Corp. | ||||||||
| 946 | 7.38%, 01/15/2021 ■ | 1,001 | ||||||
| 430 | 7.50%, 10/15/2018 | 447 | ||||||
| IMS Health, Inc. | ||||||||
| 2,845 | 6.00%, 11/01/2020 ■ | 2,952 | ||||||
| Infor Software Parent LLC | ||||||||
| 2,885 | 7.13%, 05/01/2021 ■ | 2,921 | ||||||
| Infor US, Inc. | ||||||||
| 380 | 9.38%, 04/01/2019 | 413 | ||||||
| Intelsat Luxembourg S.A. | ||||||||
| 1,065 | 6.75%, 06/01/2018 | 1,102 | ||||||
| 1,940 | 7.75%, 06/01/2021 | 2,028 | ||||||
| International Lease Finance Corp. | ||||||||
| 1,015 | 5.88%, 04/01/2019 | 1,094 | ||||||
| InVentiv Health, Inc. | ||||||||
| 525 | 9.00%, 01/15/2018 ■ | 545 | ||||||
| Iron Mountain, Inc. | ||||||||
| 30 | 7.75%, 10/01/2019 | 32 | ||||||
| 610 | 8.38%, 08/15/2021 | 635 | ||||||
| Isle of Capri Casinos, Inc. | ||||||||
| 850 | 7.75%, 03/15/2019 | 893 | ||||||
| J.M. Huber Corp. | ||||||||
| 10 | 9.88%, 11/01/2019 ■ | 11 | ||||||
| K Hovnanian Enterprises, Inc. | ||||||||
| 1,305 | 7.00%, 01/15/2019 ■ | 1,272 | ||||||
| 176 | 9.13%, 11/15/2020 ■ | 191 | ||||||
| KB Home | ||||||||
| 1,685 | 7.00%, 12/15/2021 | 1,803 | ||||||
| 75 | 7.50%, 09/15/2022 | 81 | ||||||
| 1,075 | 8.00%, 03/15/2020 | 1,198 | ||||||
| KB Home & Broad Home Corp. | ||||||||
| 216 | 6.25%, 06/15/2015 | 221 | ||||||
| Lennar Corp. | ||||||||
| 90 | 5.60%, 05/31/2015 | 92 | ||||||
| Level 3 Communications, Inc. | ||||||||
| 500 | 11.88%, 02/01/2019 | 539 | ||||||
| Level 3 Financing, Inc. | ||||||||
| 700 | 8.63%, 07/15/2020 | 770 | ||||||
| 205 | 9.38%, 04/01/2019 | 219 | ||||||
| Lin Television Corp. | ||||||||
| 3,625 | 6.38%, 01/15/2021 | 3,679 | ||||||
| M/I Homes, Inc. | ||||||||
| 147 | 3.00%, 03/01/2018 β | 149 | ||||||
| Masco Corp. | ||||||||
| 140 | 4.80%, 06/15/2015 | 143 | ||||||
| Michaels Stores, Inc. | ||||||||
| 1,100 | 5.88%, 12/15/2020 ■ | 1,114 | ||||||
| Nationstar Mortgage LLC | ||||||||
| 1,045 | 6.50%, 08/01/2018 | 1,024 | ||||||
| 456 | 7.88%, 10/01/2020 | 449 | ||||||
| Navient Corp. | ||||||||
| 6,870 | 5.50%, 01/15/2019 | 7,123 | ||||||
| 840 | 6.25%, 01/25/2016 | 874 | ||||||
| NBC Universal Enterprise | ||||||||
| 680 | 5.25%, 12/19/2049 ■ | 708 | ||||||
| Nortek, Inc. | ||||||||
| 650 | 8.50%, 04/15/2021 | 699 | ||||||
| Nuveen Investments, Inc. | ||||||||
| 630 | 9.13%, 10/15/2017 ■ | 673 | ||||||
| Owens-Brockway Glass Container, Inc. | ||||||||
| 85 | 7.38%, 05/15/2016 | 91 | ||||||
| Party City Holdings, Inc. | ||||||||
| 2,915 | 8.88%, 08/01/2020 | 3,163 | ||||||
| Pinnacle Merger Sub, Inc. | ||||||||
| 2,835 | 9.50%, 10/01/2023 ■ | 3,090 | ||||||
| Ply Gem Industries, Inc. | ||||||||
| 1,600 | 6.50%, 02/01/2022 | 1,574 | ||||||
| Provident Funding Associates L.P. | ||||||||
| 3,225 | 6.75%, 06/15/2021 ■ | 3,217 | ||||||
| Range Resources Corp. | ||||||||
| 15 | 6.75%, 08/01/2020 | 16 | ||||||
| Realogy Corp. | ||||||||
| 75 | 7.63%, 01/15/2020 ■ | 81 | ||||||
| Salix Pharmaceuticals Ltd. | ||||||||
| 7,385 | 6.00%, 01/15/2021 ■ | 7,994 | ||||||
| Savient Pharmaceuticals, Inc. | ||||||||
| 205 | 0.00%, 02/01/2018 Ω | — | ||||||
| Service Corp. International | ||||||||
| 755 | 5.38%, 01/15/2022 | 782 | ||||||
| ServiceMaster (The) Co. | ||||||||
| 2,327 | 7.00%, 08/15/2020 | 2,461 | ||||||
| Softbrands, Inc. | ||||||||
| 475 | 11.50%, 07/15/2018 | 525 | ||||||
| Sovereign Capital Trust IV | ||||||||
| 125 | 7.91%, 06/13/2036 | 133 | ||||||
The accompanying notes are an integral part of these financial statements.
| 10 |
The Hartford World Bond Fund
Schedule of Investments – (continued)
October 31, 2014
(000’s Omitted)
| Shares or Principal Amount ╬ | Market Value ╪ | |||||||
| Corporate Bonds - 10.4% - (continued) | ||||||||
| United States - 5.9% - (continued) | ||||||||
| Spectrum Brands, Inc. | ||||||||
| $ | 950 | 6.38%, 11/15/2020 | $ | 1,007 | ||||
| 940 | 6.63%, 11/15/2022 | 1,008 | ||||||
| Sprint Communications, Inc. | ||||||||
| 75 | 9.00%, 11/15/2018 ■ | 88 | ||||||
| Sprint Corp. | ||||||||
| 4,360 | 7.13%, 06/15/2024 ■ | 4,480 | ||||||
| 670 | 7.25%, 09/15/2021 ■ | 708 | ||||||
| Sun Products Corp. | ||||||||
| 1,310 | 7.75%, 03/15/2021 ■ | 969 | ||||||
| SunGard Data Systems, Inc. | ||||||||
| 2,450 | 6.63%, 11/01/2019 | 2,536 | ||||||
| 2,150 | 7.38%, 11/15/2018 | 2,241 | ||||||
| Swiss Re Capital I L.P. | ||||||||
| 690 | 6.85%, 05/25/2016 §♠ | 725 | ||||||
| Syniverse Holdings, Inc. | ||||||||
| 2,640 | 9.13%, 01/15/2019 | 2,772 | ||||||
| Tempur Sealy International, Inc. | ||||||||
| 395 | 6.88%, 12/15/2020 | 422 | ||||||
| Texas Competitive Electric Holdings Co. LLC | ||||||||
| 925 | 11.50%, 10/01/2020 ■Ϫ | 742 | ||||||
| T-Mobile USA, Inc. | ||||||||
| 575 | 5.25%, 09/01/2018 | 597 | ||||||
| 785 | 6.46%, 04/28/2019 | 818 | ||||||
| TMX Finance LLC | ||||||||
| 1,185 | 8.50%, 09/15/2018 ■ | 1,155 | ||||||
| United States Steel Corp. | ||||||||
| 1,037 | 7.38%, 04/01/2020 | 1,161 | ||||||
| Verint Systems, Inc. | ||||||||
| 462 | 1.50%, 06/01/2021 β | 515 | ||||||
| Verizon Communications, Inc. | ||||||||
| 1,647 | 5.01%, 08/21/2054 ■ | 1,676 | ||||||
| 6,053 | 6.55%, 09/15/2043 | 7,630 | ||||||
| WPX Energy, Inc. | ||||||||
| 500 | 5.25%, 09/15/2024 ☼ | 488 | ||||||
| 1,100 | 6.00%, 01/15/2022 | 1,152 | ||||||
| 182,029 | ||||||||
| Total Corporate Bonds | ||||||||
| (Cost $321,085) | $ | 319,318 | ||||||
| Foreign Government Obligations - 55.9% | ||||||||
| Australia - 7.3% | ||||||||
| Australia (Commonwealth of) | ||||||||
| AUD | 40,625 | 2.75%, 04/21/2024 | $ | 34,180 | ||||
| AUD | 56,130 | 4.50%, 04/15/2020 | 53,391 | |||||
| AUD | 69,000 | 4.75%, 06/15/2016 | 62,883 | |||||
| AUD | 55,200 | 5.25%, 03/15/2019 | 53,571 | |||||
| AUD | 21,180 | 5.50%, 04/21/2023 | 21,794 | |||||
| 225,819 | ||||||||
| Brazil - 0.0% | ||||||||
| Brazil (Federative Republic of) | ||||||||
| BRL | 2,555 | 10.00%, 01/01/2017 | 985 | |||||
| Cyprus - 0.0% | ||||||||
| Cyprus (Republic of) | ||||||||
| EUR | 955 | 4.75%, 06/25/2019 § | 1,153 | |||||
| Denmark - 6.3% | ||||||||
| Denmark (Kingdom of) | ||||||||
| DKK | 249,375 | 1.50%, 11/15/2023 | 44,455 | |||||
| DKK | 100,000 | 2.00%, 11/15/2014 | 16,849 | |||||
| DKK | 280,000 | 2.50%, 11/15/2016 | 49,532 | |||||
| DKK | 51,255 | 3.00%, 11/15/2021 | 10,122 | |||||
| DKK | 370,705 | 4.00%, 11/15/2017 - 11/15/2019 | 73,587 | |||||
| 194,545 | ||||||||
| Finland - 7.4% | ||||||||
| Finland (Republic of) | ||||||||
| EUR | 122,565 | 1.13%, 09/15/2018 ■ | 159,668 | |||||
| EUR | 52,255 | 1.50%, 04/15/2023 ■ | 69,171 | |||||
| 228,839 | ||||||||
| Germany - 4.7% | ||||||||
| Germany (Federal Republic of) | ||||||||
| EUR | 70,545 | 0.25%, 04/13/2018 | 89,181 | |||||
| EUR | 20,075 | 1.00%, 02/22/2019 | 26,175 | |||||
| EUR | 21,700 | 1.50%, 05/15/2024 | 28,920 | |||||
| 144,276 | ||||||||
| Ireland - 0.2% | ||||||||
| Ireland (Republic of) | ||||||||
| EUR | 3,810 | 3.40%, 03/18/2024 § | 5,463 | |||||
| Italy - 1.0% | ||||||||
| Italy (Republic of) | ||||||||
| EUR | 25,000 | 0.14%, 12/31/2014 ○ | 31,320 | |||||
| Mexico - 4.1% | ||||||||
| Mexico (United Mexican States) | ||||||||
| MXN | 1,306,104 | 10.00%, 12/05/2024 | 126,789 | |||||
| Netherlands - 7.0% | ||||||||
| Netherlands (Government of) | ||||||||
| EUR | 107,315 | 1.25%, 01/15/2018 - 01/15/2019 ■ | 140,344 | |||||
| EUR | 27,595 | 2.00%, 07/15/2024 | 37,825 | |||||
| EUR | 25,430 | 3.25%, 07/15/2021 ■ | 37,611 | |||||
| 215,780 | ||||||||
| Portugal - 0.3% | ||||||||
| Portugal (Republic of) | ||||||||
| EUR | 7,775 | 3.88%, 02/15/2030 ■ | 9,627 | |||||
| South Africa - 0.2% | ||||||||
| South Africa (Republic of) | ||||||||
| ZAR | 29,725 | 8.00%, 01/31/2030 | 2,629 | |||||
| ZAR | 28,515 | 10.50%, 12/21/2026 | 3,104 | |||||
| 5,733 | ||||||||
| South Korea - 3.8% | ||||||||
| Korea (Republic of) | ||||||||
| KRW | 111,200,000 | 4.25%, 06/10/2021 | 115,421 | |||||
| Sweden - 6.6% | ||||||||
| Sweden (Kingdom of) | ||||||||
| SEK | 332,165 | 1.50%, 11/13/2023 | 46,661 | |||||
| SEK | 178,815 | 3.00%, 07/12/2016 | 25,441 | |||||
| SEK | 73,045 | 3.75%, 08/12/2017 | 10,896 | |||||
| SEK | 762,150 | 4.25%, 03/12/2019 | 120,876 | |||||
| 203,874 | ||||||||
The accompanying notes are an integral part of these financial statements.
| 11 |
The Hartford World Bond Fund
Schedule of Investments – (continued)
October 31, 2014
(000’s Omitted)
| Shares or Principal Amount ╬ | Market Value ╪ | |||||||
| Foreign Government Obligations - 55.9% - (continued) | ||||||||
| United Kingdom - 7.0% | ||||||||
| United Kingdom (Government of) | ||||||||
| GBP | 103,090 | 1.75%, 01/22/2017 - 07/22/2019 § | $ | 167,072 | ||||
| GBP | 29,450 | 2.75%, 09/07/2024 § | 49,185 | |||||
| 216,257 | ||||||||
| Total Foreign Government Obligations | ||||||||
| (Cost $1,776,305) | $ | 1,725,881 | ||||||
| Senior Floating Rate Interests ♦ - 2.9% | ||||||||
| Canada - 0.1% | ||||||||
| Burger King Co. | ||||||||
| $ | 2,565 | 4.50%, 10/27/2021 | $ | 2,562 | ||||
| Germany - 0.0% | ||||||||
| CeramTec | ||||||||
| EUR | 103 | 4.75%, 08/28/2020 | 129 | |||||
| Faenza Acquisition Gmbh | ||||||||
| EUR | 337 | 4.75%, 08/28/2020 | 423 | |||||
| 552 | ||||||||
| Ireland - 0.0% | ||||||||
| Ardagh Holdings USA, Inc. | ||||||||
| 1,279 | 4.00%, 12/17/2019 | 1,265 | ||||||
| United States - 2.8% | ||||||||
| 99 Cents Only Stores | ||||||||
| 1,762 | 4.50%, 01/11/2019 | 1,748 | ||||||
| Alliance Laundry Systems LLC | ||||||||
| 3,521 | 4.25%, 12/10/2018 | 3,479 | ||||||
| AMC Entertainment, Inc. | ||||||||
| 867 | 3.50%, 04/30/2020 | 855 | ||||||
| American Builders & Contractors Supply Co., Inc. | ||||||||
| 1,292 | 3.50%, 04/16/2020 | 1,262 | ||||||
| Amscan Holdings, Inc. | ||||||||
| 3,410 | 4.00%, 07/27/2019 | 3,337 | ||||||
| AmSurg Corp. | ||||||||
| 3,387 | 3.75%, 07/16/2021 | 3,359 | ||||||
| Apex Tool Group LLC | ||||||||
| 2,451 | 4.50%, 01/31/2020 | 2,322 | ||||||
| Arch Coal, Inc. | ||||||||
| 1,033 | 6.25%, 05/16/2018 | 911 | ||||||
| Aristocrat Leisure Ltd. | ||||||||
| 4,345 | 4.75%, 10/20/2021 | 4,311 | ||||||
| Asurion LLC | ||||||||
| 1,934 | 4.25%, 07/08/2020 | 1,906 | ||||||
| 2,274 | 5.00%, 05/24/2019 | 2,274 | ||||||
| 350 | 8.50%, 03/03/2021 | 356 | ||||||
| Avago Technologies Ltd. | ||||||||
| 1,441 | 3.75%, 05/06/2021 | 1,436 | ||||||
| Bauer Performance Sports Ltd. | ||||||||
| 1,201 | 4.00%, 04/15/2021 | 1,191 | ||||||
| Calpine Corp. | ||||||||
| 1,028 | 4.00%, 10/09/2019 - 10/31/2020 | 1,018 | ||||||
| Chrysler Group LLC | ||||||||
| 97 | 3.50%, 05/24/2017 | 97 | ||||||
| Community Health Systems, Inc. | ||||||||
| 566 | 4.25%, 01/27/2021 | 566 | ||||||
| Crosby Worldwide Ltd. | ||||||||
| 675 | 4.00%, 11/23/2020 | 646 | ||||||
| Darling International, Inc. | ||||||||
| EUR | 1,866 | 3.50%, 01/06/2021 | 2,326 | |||||
| First Data Corp. | ||||||||
| 5,950 | 3.65%, 03/23/2018 - 09/24/2018 | 5,890 | ||||||
| Fly Leasing Ltd. | ||||||||
| 1,252 | 4.50%, 08/09/2019 | 1,251 | ||||||
| Freescale Semiconductor, Inc. | ||||||||
| 3,214 | 4.25%, 02/28/2020 | 3,167 | ||||||
| 1,445 | 5.00%, 01/15/2021 | 1,442 | ||||||
| Gardner Denver, Inc. | ||||||||
| EUR | 1,332 | 4.75%, 07/30/2020 | 1,665 | |||||
| Hilton Worldwide Holdings, Inc. | ||||||||
| 1,293 | 3.50%, 10/26/2020 | 1,280 | ||||||
| Houghton International, Inc. | ||||||||
| 192 | 4.00%, 12/20/2019 | 189 | ||||||
| Hyland Software, Inc. | ||||||||
| 836 | 4.75%, 02/19/2021 | 833 | ||||||
| Interactive Data Corp. | ||||||||
| 2,440 | 4.75%, 05/02/2021 | 2,439 | ||||||
| Lands' End, Inc. | ||||||||
| 3,218 | 4.25%, 04/04/2021 | 3,141 | ||||||
| Level 3 Financing, Inc. | ||||||||
| 4,075 | 4.50%, 01/31/2022 ☼ | 4,091 | ||||||
| Light Tower Fiber LLC | ||||||||
| 1,091 | 4.00%, 04/13/2020 | 1,078 | ||||||
| MGM Resorts International | ||||||||
| 521 | 3.50%, 12/20/2019 | 514 | ||||||
| MISYS plc | ||||||||
| 515 | 5.00%, 12/12/2018 | 515 | ||||||
| Multiplan, Inc. | ||||||||
| 3,143 | 4.00%, 03/31/2021 | 3,091 | ||||||
| Neiman Marcus (The) Group, Inc. | ||||||||
| 3,218 | 4.25%, 10/25/2020 | 3,173 | ||||||
| Nortek, Inc. | ||||||||
| 2,075 | 3.75%, 10/30/2020 | 2,034 | ||||||
| Ply Gem Industries, Inc. | ||||||||
| 950 | 4.00%, 02/01/2021 | 932 | ||||||
| Realogy Group LLC | ||||||||
| 2,544 | 3.75%, 03/05/2020 | 2,522 | ||||||
| Rexnord LLC | ||||||||
| 2,732 | 4.00%, 08/21/2020 | 2,692 | ||||||
| ServiceMaster (The) Co. | ||||||||
| 2,935 | 4.25%, 07/01/2021 | 2,906 | ||||||
| Signode Industrial Group US, Inc. | ||||||||
| EUR | 798 | 4.25%, 05/01/2021 | 996 | |||||
| Sprouts Farmers Markets Holdings LLC | ||||||||
| 577 | 4.00%, 04/23/2020 | 572 | ||||||
| Star West Generation LLC | ||||||||
| 752 | 4.25%, 03/13/2020 | 744 | ||||||
| Syniverse Holdings, Inc. | ||||||||
| 4,483 | 4.00%, 04/23/2019 | 4,404 | ||||||
| Tribune Co. | ||||||||
| 1,319 | 4.00%, 12/27/2020 | 1,307 | ||||||
| 86,268 | ||||||||
| Total Senior Floating Rate Interests | ||||||||
| (Cost $91,613) | $ | 90,647 | ||||||
The accompanying notes are an integral part of these financial statements.
| 12 |
The Hartford World Bond Fund
Schedule of Investments – (continued)
October 31, 2014
(000’s Omitted)
| Shares or Principal Amount ╬ | Market Value ╪ | |||||||
| U.S. Government Agencies - 0.2% | ||||||||
| United States - 0.2% | ||||||||
| FHLMC | ||||||||
| $ | 3,691 | 1.78%, 09/25/2041 ► | $ | 455 | ||||
| 1,317 | 1.85%, 08/25/2016 ► | 30 | ||||||
| 11,435 | 2.08%, 02/25/2041 ► | 1,277 | ||||||
| 2,200 | 2.18%, 12/25/2041 ► | 342 | ||||||
| 6,088 | 2.28%, 01/25/2024 ► | 1,003 | ||||||
| 10,140 | 2.29%, 12/25/2039 ► | 1,315 | ||||||
| 4,422 | ||||||||
| Total U.S. Government Agencies | ||||||||
| (Cost $4,188) | $ | 4,422 | ||||||
| U.S. Government Securities - 11.7% | ||||||||
| United States - 11.7% | ||||||||
| U.S. Treasury Notes | ||||||||
| $ | 50,000 | 0.13%, 12/31/2014 ‡Θ | $ | 50,000 | ||||
| 78,500 | 0.25%, 05/15/2015 | 78,555 | ||||||
| 85,085 | 0.38%, 03/15/2016 ╦ | 85,205 | ||||||
| 20,170 | 0.63%, 04/30/2018 | 19,781 | ||||||
| 76,265 | 0.75%, 12/31/2017 | 75,550 | ||||||
| 41,890 | 1.25%, 01/31/2019 | 41,530 | ||||||
| 4,285 | 1.75%, 05/15/2023 ╦ | 4,124 | ||||||
| 6,085 | 2.50%, 05/15/2024 | 6,183 | ||||||
| 360,928 | ||||||||
| Total U.S. Government Securities | ||||||||
| (Cost $360,540) | $ | 360,928 | ||||||
| Preferred Stocks - 0.1% | ||||||||
| United States - 0.1% | ||||||||
| — | Citigroup Capital XIII | $ | 1 | |||||
| 111 | GMAC Capital Trust I β | 2,967 | ||||||
| 7 | Intelsat S.A., 5.75% β | 358 | ||||||
| 3,326 | ||||||||
| Total Preferred Stocks | ||||||||
| (Cost $3,291) | $ | 3,326 | ||||||
| Total Long-Term Investments Excluding Purchased Options | ||||||||
| (Cost $2,957,925) | $ | 2,906,620 | ||||||
| Short-Term Investments - 3.9% | ||||||||
| Repurchase Agreements - 3.9% | ||||||||
| Bank of America Merrill Lynch TriParty Repurchase Agreement (maturing on 11/03/2014 in the amount of $345, collateralized by U.S. Treasury Note 1.50%, 2019, value of $352) | ||||||||
| $ | 345 | 0.08%, 10/31/2014 | $ | 345 | ||||
| Bank of America Merrill Lynch TriParty Repurchase Agreement (maturing on 11/03/2014 in the amount of $5,869, collateralized by GNMA 1.63% - 7.00%, 2031 - 2054, value of $5,987) | ||||||||
| 5,869 | 0.09%, 10/31/2014 | 5,869 | ||||||
| Bank of Montreal TriParty Repurchase Agreement (maturing on 11/03/2014 in the amount of $1,577, collateralized by U.S. Treasury Bond 2.88% - 5.25%, 2029 - 2043, U.S. Treasury Note 0.38% - 4.50%, 2015 - 2022, value of $1,608) | ||||||||
| 1,577 | 0.08%, 10/31/2014 | 1,577 | ||||||
| Bank of Montreal TriParty Repurchase Agreement (maturing on 11/03/2014 in the amount of $5,346, collateralized by FHLMC 2.00% - 5.50%, 2022 - 2034, FNMA 2.00% - 4.50%, 2024 - 2039, GNMA 3.00%, 2043, U.S. Treasury Note 4.63%, 2017, value of $5,452) | ||||||||
| 5,346 | 0.10%, 10/31/2014 | 5,346 | ||||||
| Barclays Capital TriParty Repurchase Agreement (maturing on 11/03/2014 in the amount of $20,142, collateralized by U.S. Treasury Bond 4.50% - 6.25%, 2023 - 2036, U.S. Treasury Note 1.63% - 2.13%, 2015 - 2019, value of $20,545) | ||||||||
| 20,142 | 0.08%, 10/31/2014 | 20,142 | ||||||
| Citigroup Global Markets, Inc. TriParty Repurchase Agreement (maturing on 11/03/2014 in the amount of $23,151, collateralized by U.S. Treasury Bill 0.02%, 2015, U.S. Treasury Bond 3.88% - 11.25%, 2015 - 2040, U.S. Treasury Note 2.00% - 3.38%, 2019 - 2021, value of $23,614) | ||||||||
| 23,151 | 0.09%, 10/31/2014 | 23,151 | ||||||
| Deutsche Bank Securities TriParty Repurchase Agreement (maturing on 11/03/2014 in the amount of $1,336, collateralized by U.S. Treasury Note 0.88%, 2017, value of $1,363) | ||||||||
| 1,336 | 0.13%, 10/31/2014 | 1,336 | ||||||
| RBS Securities, Inc. TriParty Repurchase Agreement (maturing on 11/03/2014 in the amount of $1,967, collateralized by U.S. Treasury Bond 3.63% - 5.00%, 2037 - 2043, U.S. Treasury Note 2.13%, 2020, value of $2,007) | ||||||||
| 1,967 | 0.07%, 10/31/2014 | 1,967 | ||||||
| Societe Generale TriParty Repurchase Agreement (maturing on 11/03/2014 in the amount of $20,724, collateralized by U.S. Treasury Bill 0.02%, 2015, U.S. Treasury Bond 3.75% - 11.25%, 2015 - 2043, U.S. Treasury Note 1.38% - 4.25%, 2015 - 2022, value of $21,139) | ||||||||
| 20,724 | 0.08%, 10/31/2014 | 20,724 | ||||||
The accompanying notes are an integral part of these financial statements.
| 13 |
The Hartford World Bond Fund
Schedule of Investments – (continued)
October 31, 2014
(000’s Omitted)
| Shares or Principal Amount ╬ | Market Value ╪ | |||||||||||
| Short-Term Investments - 3.9% - (continued) | ||||||||||||
| Repurchase Agreements - 3.9% - (continued) | ||||||||||||
| TD Securities TriParty Repurchase Agreement (maturing on 11/03/2014 in the amount of $40,161, collateralized by FHLMC 3.00% - 4.00%, 2026 - 2044, FNMA 2.50% - 5.00%, 2025 - 2044, U.S. Treasury Bond 3.50% - 6.50%, 2026 - 2041, U.S. Treasury Note 1.75% - 2.88%, 2018 - 2019, value of $40,964) | ||||||||||||
| $ | 40,161 | 0.10%, 10/31/2014 | $ | 40,161 | ||||||||
| 120,618 | ||||||||||||
| Total Short-Term Investments | ||||||||||||
| (Cost $120,618) | $ | 120,618 | ||||||||||
| Total Investments Excluding Purchased Options | ||||||||||||
| (Cost $3,078,543) | 98.1 | % | $ | 3,027,238 | ||||||||
| Total Purchased Options | ||||||||||||
| (Cost $2,182) | 0.1 | % | 1,903 | |||||||||
| Total Investments | ||||||||||||
| (Cost $3,080,725) ▲ | 98.2 | % | $ | 3,029,141 | ||||||||
| Other Assets and Liabilities | 1.8 | % | 58,027 | |||||||||
| Total Net Assets | 100.0 | % | $ | 3,087,168 | ||||||||
The accompanying notes are an integral part of these financial statements.
| 14 |
The Hartford World Bond Fund
Schedule of Investments – (continued)
October 31, 2014
(000’s Omitted)
Note: Percentage of investments as shown is the ratio of the total market value to total net assets.
The Fund may refer to any one or more of the industry classifications used by one or more widely recognized market indices, ratings group indices and/or as defined by Fund management. Industry classifications may not be identical across all security types.
Equity industry classifications used in this report are the Global Industry Classification Standard, which was developed by and is the exclusive property and service mark of MSCI, Inc. and Standard & Poor’s.
For Fund compliance purposes, the Fund may not use the same classification system shown in this report as these classifications are used for reporting ease.
| ▲ | At October 31, 2014, the cost of securities for federal income tax purposes was $3,081,495 and the aggregate gross unrealized appreciation and depreciation based on that cost were: |
| Unrealized Appreciation | $ | 12,101 | ||
| Unrealized Depreciation | (64,455 | ) | ||
| Net Unrealized Depreciation | $ | (52,354 | ) |
| ╬ | All principal amounts are in U.S. dollars unless otherwise indicated. |
| Ω | Debt security in default due to bankruptcy. |
| Ϫ | The issuer is in bankruptcy. The investment held by the Fund has made partial interest payments. |
| Δ | Variable rate securities; the rate reported is the coupon rate in effect at October 31, 2014. |
| ○ | The interest rate disclosed for these securities represents the effective yield on the date of the acquisition. |
| ► | Securities disclosed are interest-only strips. |
| ♦ | Senior floating rate interests generally pay interest rates which are periodically adjusted by reference to a base short-term, floating lending rate plus a premium. The base lending rates are primarily the LIBOR, and secondarily the prime rate offered by one or more major United States banks (the "Prime Rate") and the certificate of deposit rate or other base lending rates used by commercial lenders. Senior floating rate interests often require prepayments from excess cash flows or permit the borrower to repay at its election. The rate at which the borrower repays cannot be predicted with accuracy. As a result, the actual remaining maturity may be substantially less than the stated maturities shown. Unless otherwise noted, the interest rate disclosed for these securities represents the average coupon as of October 31, 2014. |
| ■ | Securities issued within terms of a private placement memorandum, exempt from registration under Rule 144A under the Securities Act of 1933, as amended, and may be sold only to qualified institutional buyers. Unless otherwise indicated, these holdings are determined to be liquid. At October 31, 2014, the aggregate value of these securities was $741,355, which represents 24.0% of total net assets. |
| § | These securities were sold to the Fund under Regulation S, rules governing offers and sales made outside the United States without registration under the Securities Act of 1933, as amended. The Fund may only be able to resell these securities in the United States if an exemption from registration under the federal and state securities laws is available, or the Fund may only be able to sell these securities outside of the United States (such as on a foreign exchange) to a non-U.S. person. Unless otherwise indicated, these holdings are determined to be liquid. At October 31, 2014, the aggregate value of these securities was $278,919, which represents 9.0% of total net assets. |
| β | Convertible security. |
| ♠ | Perpetual maturity security. Maturity date shown is the next call date or final legal maturity date, whichever comes first. |
| Þ | This security may pay interest in the form of additional principal in lieu of cash. |
| ☼ | This security, or a portion of this security, was purchased on a when-issued or delayed-delivery basis. The cost of these securities was $10,162 at October 31, 2014. |
| ‡ | This security, or a portion of this security, has been segregated to cover funding requirements on investment transactions settling in the future. |
| ╦ | This security, or a portion of this security, has been pledged as collateral in connection with OTC swap contracts. |
| Θ | This security, or a portion of this security, has been pledged as collateral in connection with OTC option and/or swaption contracts. |
The accompanying notes are an integral part of these financial statements.
| 15 |
The Hartford World Bond Fund
Schedule of Investments – (continued)
October 31, 2014
(000’s Omitted)
Cash and securities pledged and received as collateral in connection with derivatives at October 31, 2014:
| Pledged | Received * | |||||||
| OTC option and/or OTC swap contracts | $ | 1,741 | $ | 2,186 | ||||
| Futures contracts | 15,146 | – | ||||||
| Centrally cleared swaps contracts | 11,629 | – | ||||||
| Total | $ | 28,516 | $ | 2,186 | ||||
| * | Securities valued at $1,151, held on behalf of the Fund at the custodian bank, were designated by broker(s) as collateral in connection with OTC option and/or OTC swap contracts Since the broker retains legal title to the securities, the securities are not considered an asset of the Fund. |
OTC Option Contracts Outstanding at October 31, 2014
| Description | Counter - party | Risk Exposure Category | Exercise Price/
FX Rate/ Rate | Expiration Date | Number
of Contracts * | Market Value ╪ | Premiums Paid by Fund | Unrealized Appreciation (Depreciation) | ||||||||||||||||
| Purchased Option contracts: | ||||||||||||||||||||||||
| Calls | ||||||||||||||||||||||||
| CMS Spread Option CMS10/CMS5 | BOA | IR | 0.76 USD | 11/03/14 | USD | 169,590,000 | $ | – | $ | 114 | $ | (114 | ) | |||||||||||
| EUR Call/USD Put | GSC | FX | 1.29 USD per EUR | 04/15/15 | EUR | 11,330,000 | 108 | 267 | (159 | ) | ||||||||||||||
| USD Call/CAD Put æ | JPM | FX | 1.11 CAD per USD | 01/22/15 | USD | 391,000 | 291 | 91 | 200 | |||||||||||||||
| USD Call/CHF Put И | CBK | FX | 1.10 USD per CHF | 07/02/15 | USD | 1,565,000 | 167 | 208 | (41 | ) | ||||||||||||||
| USD Call/CHF Put И | CBK | FX | 1.10 USD per CHF | 07/02/15 | USD | 783,000 | 83 | 104 | (21 | ) | ||||||||||||||
| USD Call/CNH Put | SCB | FX | 6.50 CNH per USD | 04/16/15 | USD | 18,785,000 | 29 | 145 | (116 | ) | ||||||||||||||
| USD Call/CNY Put | JPM | FX | 6.30 CNY per USD | 06/15/15 | USD | 22,650,000 | 83 | 105 | (22 | ) | ||||||||||||||
| Total Calls | 225,094,000 | $ | 761 | $ | 1,034 | $ | (273 | ) | ||||||||||||||||
| Puts | ||||||||||||||||||||||||
| AUD Put/NZD Call | UBS | FX | 1.08 NZD per AUD | 04/01/15 | AUD | 16,782,000 | $ | 45 | $ | 94 | $ | (49 | ) | |||||||||||
| AUD Put/NZD Call ₡ | JPM | FX | 1.08 NZD per AUD | 04/01/15 | AUD | 599,000 | 62 | 112 | (50 | ) | ||||||||||||||
| EUR Put/USD Call | JPM | FX | 1.26 USD per EUR | 03/05/15 | EUR | 10,155,000 | 282 | 116 | 166 | |||||||||||||||
| EUR Put/USD Call | GSC | FX | 1.25 USD per EUR | 11/04/14 | EUR | 458,036 | 231 | 75 | 156 | |||||||||||||||
| GBP Put/USD Call | GSC | FX | 1.60 USD per GBP | 03/19/15 | GBP | 6,120,000 | 162 | 94 | 68 | |||||||||||||||
| GBP Put/USD Call ₪ | JPM | FX | 1.50 USD per GBP | 07/01/15 | GBP | 1,140,000 | 201 | 227 | (26 | ) | ||||||||||||||
| SGD Put/JPY Call | GSC | FX | 83.00 JPY per SGD | 01/08/15 | SGD | 19,700,000 | 17 | 106 | (89 | ) | ||||||||||||||
| USD Put/CHF Call | JPM | FX | 0.93 CHF per USD | 04/15/15 | USD | 13,537,000 | 117 | 248 | (131 | ) | ||||||||||||||
| Total Puts | 68,491,036 | $ | 1,117 | $ | 1,072 | $ | 45 | |||||||||||||||||
| Total purchased option contracts | 293,585,036 | $ | 1,878 | $ | 2,106 | $ | (228 | ) | ||||||||||||||||
| * | The number of contracts does not omit 000's. |
| æ | This security has limitations. If the CAD per USD exchange rate is greater than or equal to 1.107 at expiration date, the Fund will receive the equivalent of par on the number of contracts traded. |
| И | This security has limitations. If the USD per CHF exchange rate is greater than or equal to 1.1 at expiration date, the Fund will receive the equivalent of par on the number of contracts traded. |
| ₡ | This security has limitations. If the NZD per AUD exchange rate is greater than or equal to 1.08 at expiration date, the Fund will receive the equivalent of par on the number of contracts traded. |
| ₪ | This security has limitations. If the USD per GBP exchange rate is greater than or equal to 1.5 at expiration date, the Fund will receive the equivalent of par on the number of contracts traded. |
OTC Swaption Contracts Outstanding at October 31, 2014
| Description | Counter
- party | Risk Exposure Category | Exercise
Price/ FX Rate/ Rate | Expiration Date | Number
of Contracts * | Market Value ╪ | Premiums Received/ Paid by Fund Δ | Unrealized Appreciation (Depreciation) | ||||||||||||||||||
| Purchased swaption contracts: | ||||||||||||||||||||||||||
| Puts | ||||||||||||||||||||||||||
| Credit Default Swaption CDX.NA.IG.23 | CSI | CR | 75.00 | % | 11/19/14 | USD | 90,125,000 | $ | 25 | $ | 76 | $ | (51 | ) | ||||||||||||
| Written swaption contracts: | ||||||||||||||||||||||||||
| Calls | ||||||||||||||||||||||||||
| Credit Default Swaption CDX.NA.IG.23 | CSI | CR | 65.00 | % | 11/19/14 | USD | 90,125,000 | $ | 123 | $ | 90 | $ | (33 | ) | ||||||||||||
* The number of contracts does not omit 000's.
Δ For purchased swaptions, premiums are paid by the Fund, for written swaptions, premiums are received.
The accompanying notes are an integral part of these financial statements.
| 16 |
The Hartford World Bond Fund
Schedule of Investments – (continued)
October 31, 2014
(000’s Omitted)
Futures Contracts Outstanding at October 31, 2014
| Number of | Expiration | Notional | Market | Unrealized Appreciation/(Depreciation) | Variation Margin | |||||||||||||||||||||||||
| Description | Contracts* | Date | Amount | Value ╪ | Asset | Liability | Asset | Liability | ||||||||||||||||||||||
| Long position contracts: | ||||||||||||||||||||||||||||||
| Australian 10-Year Bond Future | 274 | 12/15/2014 | $ | 29,581 | $ | 29,607 | $ | 26 | $ | – | $ | 115 | $ | – | ||||||||||||||||
| Australian 3-Year Bond Future | 1,661 | 12/15/2014 | 160,398 | 160,511 | 113 | – | 177 | – | ||||||||||||||||||||||
| Euro-BOBL Future | 299 | 12/08/2014 | 47,905 | 47,979 | 74 | – | 30 | – | ||||||||||||||||||||||
| U.S. Treasury 10-Year Note Future | 4,377 | 12/19/2014 | 560,664 | 553,075 | – | (7,589 | ) | 1 | (1157 | ) | ||||||||||||||||||||
| U.S. Treasury 5-Year Note Future | 935 | 12/31/2014 | 112,170 | 111,667 | – | (503 | ) | – | (137 | ) | ||||||||||||||||||||
| Total | $ | 213 | $ | (8,092 | ) | $ | 323 | $ | (1,294 | ) | ||||||||||||||||||||
| Short position contracts: | ||||||||||||||||||||||||||||||
| Euro BUXL 30-Year Bond Future | 100 | 12/08/2014 | $ | 18,123 | $ | 18,211 | $ | – | $ | (88 | ) | $ | 53 | $ | – | |||||||||||||||
| Euro FX Currency Future | 220 | 12/15/2014 | 35,565 | 34,457 | 1,108 | – | 237 | – | ||||||||||||||||||||||
| Euro-BTP Future | 69 | 12/08/2014 | 11,133 | 11,269 | – | (136 | ) | 337 | (739 | ) | ||||||||||||||||||||
| Euro-BUND Future | 643 | 12/08/2014 | 121,540 | 121,600 | – | (60 | ) | – | (24 | ) | ||||||||||||||||||||
| Japan 10-Year Bond Future | 93 | 12/11/2014 | 120,564 | 121,320 | – | (756 | ) | – | – | |||||||||||||||||||||
| Long Gilt Future | 1,415 | 12/29/2014 | 262,816 | 260,536 | 2,280 | – | 506 | – | ||||||||||||||||||||||
| U.S. Treasury 2-Year Note Future | 22 | 12/31/2014 | 4,815 | 4,830 | – | (15 | ) | 1 | – | |||||||||||||||||||||
| U.S. Treasury Long Bond Future | 125 | 12/19/2014 | 17,699 | 17,637 | 62 | – | 107 | (20 | ) | |||||||||||||||||||||
| Total | $ | 3,450 | $ | (1,055 | ) | $ | 1,241 | $ | (783 | ) | ||||||||||||||||||||
| Total futures contracts | $ | 3,663 | $ | (9,147 | ) | $ | 1,564 | $ | (2,077 | ) | ||||||||||||||||||||
* The number of contracts does not omit 000's.
OTC Credit Default Swap Contracts Outstanding at October 31, 2014
| Counter- | Notional | (Pay)/ Receive Fixed Rate/ Implied | Expiration | Upfront Premiums | Upfront Premiums | Market | Unrealized
Appreciation/ (Depreciation) | |||||||||||||||||||||||
| Reference Entity | party | Amount (a) | Credit Spread (b) | Date | Paid | Received | Value ╪ | Asset | Liability | |||||||||||||||||||||
| Credit default swaps on indices: | ||||||||||||||||||||||||||||||
| Buy protection: | ||||||||||||||||||||||||||||||
| CMBX.NA.A.7 | JPM | USD | 1,645 | (2.00)% | 01/17/47 | $ | – | $ | (35 | ) | $ | (4 | ) | $ | 31 | $ | – | |||||||||||||
| CMBX.NA.AJ.4 | DEUT | USD | 60 | (0.96)% | 02/17/51 | 12 | – | 12 | – | – | ||||||||||||||||||||
| CMBX.NA.AJ.4 | JPM | USD | 1,250 | (0.96)% | 02/17/51 | 319 | – | 243 | – | (76 | ) | |||||||||||||||||||
| CMBX.NA.AS.7 | CSI | USD | 9,350 | (1.00)% | 01/17/47 | 83 | – | 147 | 64 | – | ||||||||||||||||||||
| ITRAXX.SUB.FIN.16 | JPM | EUR | 155 | (5.00)% | 12/20/16 | 2 | – | (18 | ) | – | (20 | ) | ||||||||||||||||||
| ITRAXX.SUB.FIN.21 | DEUT | EUR | 6,060 | (1.00)% | 06/20/19 | – | (93 | ) | (144 | ) | – | (51 | ) | |||||||||||||||||
| Total | $ | 416 | $ | (128 | ) | $ | 236 | $ | 95 | $ | (147 | ) | ||||||||||||||||||
| Sell protection: | ||||||||||||||||||||||||||||||
| CMBX.NA.AAA.6 | CSI | USD | 12,081 | 0.50% | 05/11/63 | $ | – | $ | (400 | ) | $ | (235 | ) | $ | 165 | $ | – | |||||||||||||
| CMBX.NA.AAA.6 | DEUT | USD | 22,365 | 0.50% | 05/11/63 | – | (815 | ) | (437 | ) | 378 | – | ||||||||||||||||||
| CMBX.NA.AAA.7 | CSI | USD | 13,195 | 0.50% | 01/17/47 | – | (532 | ) | (385 | ) | 147 | – | ||||||||||||||||||
| Total | $ | – | $ | (1,747 | ) | $ | (1,057 | ) | $ | 690 | $ | – | ||||||||||||||||||
| Total traded indices | $ | 416 | $ | (1,875 | ) | $ | (821 | ) | $ | 785 | $ | (147 | ) | |||||||||||||||||
| Credit default swaps on single-name issues: | ||||||||||||||||||||||||||||||
| Buy protection: | ||||||||||||||||||||||||||||||
| Ally Financial, Inc. | MSC | USD | 1,970 | (5.00)% / (1.55)% | 12/20/19 | $ | – | $ | (306 | ) | $ | (325 | ) | $ | – | $ | (19 | ) | ||||||||||||
| Australia & New Zealand Banking Group Ltd. | DEUT | USD | 3,350 | (1.00)% / (0.71)% | 12/20/19 | – | (40 | ) | (48 | ) | – | (8 | ) | |||||||||||||||||
| Avis Budget Group, Inc. | BOA | USD | 75 | (5.00)% / (1.11)% | 03/20/17 | 3 | – | (7 | ) | – | (10 | ) | ||||||||||||||||||
| Beazer Homes USA, Inc. | BOA | USD | 1,620 | (5.00)% / (3.56)% | 12/20/18 | – | (15 | ) | (90 | ) | – | (75 | ) | |||||||||||||||||
| CenturyLink. Inc. | DEUT | USD | 2,970 | (1.00)% / (1.61)% | 09/20/19 | 111 | – | 84 | – | (27 | ) | |||||||||||||||||||
| Commonwealth Bank of Australia | DEUT | USD | 3,450 | (1.00)% / (0.70)% | 12/20/19 | – | (42 | ) | (51 | ) | – | (9 | ) | |||||||||||||||||
| Dish DBS Corp. | BCLY | USD | 2,895 | (5.00)% / (1.88)% | 12/20/19 | – | (377 | ) | (434 | ) | – | (57 | ) | |||||||||||||||||
| Domtar Corp. | GSC | USD | 55 | (1.00)% / (0.48)% | 12/20/16 | 2 | – | (1 | ) | – | (3 | ) | ||||||||||||||||||
| First Data Corp. | MSC | USD | 5,450 | (5.00)% / (1.65)% | 09/20/17 | – | (477 | ) | (517 | ) | – | (40 | ) | |||||||||||||||||
| Freescale Semiconductors, Inc. | JPM | USD | 5,000 | (5.00)% / (1.65)% | 12/20/17 | – | (523 | ) | (513 | ) | 10 | – | ||||||||||||||||||
The accompanying notes are an integral part of these financial statements.
| 17 |
The Hartford World Bond Fund
Schedule of Investments – (continued)
October 31, 2014
(000’s Omitted)
OTC Credit Default Swap Contracts Outstanding at October 31, 2014 - (continued)
| Counter- | Notional | (Pay)/ Receive
Fixed Rate/ Implied | Expiration | Upfront Premiums | Upfront Premiums | Market | Unrealized
Appreciation/ (Depreciation) | |||||||||||||||||||||||
| Reference Entity | party | Amount (a) | Credit Spread (b) | Date | Paid | Received | Value ╪ | Asset | Liability | |||||||||||||||||||||
| Credit default swaps on single-name issues: - (continued) | ||||||||||||||||||||||||||||||
| Buy protection: - (continued) | ||||||||||||||||||||||||||||||
| Freescale Semiconductors, Inc. | JPM | USD | 2,000 | (5.00)% / (1.65)% | 12/20/17 | $ | – | $ | (159 | ) | $ | (205 | ) | $ | – | $ | (46 | ) | ||||||||||||
| Frontier Communications Co. | BOA | USD | 625 | (5.00)% / (1.29)% | 09/20/17 | 19 | – | (66 | ) | – | (85 | ) | ||||||||||||||||||
| National Australia Bank Ltd. | DEUT | USD | 3,350 | (1.00)% / (0.73)% | 12/20/19 | – | (41 | ) | (45 | ) | – | (4 | ) | |||||||||||||||||
| Peugeot S.A. | CBK | EUR | 70 | (1.00)% / (1.30)% | 12/20/16 | 18 | – | 1 | – | (17 | ) | |||||||||||||||||||
| Rite Aid Corp. | GSC | USD | 105 | (5.00)% / (1.46)% | 06/20/17 | 8 | – | (10 | ) | – | (18 | ) | ||||||||||||||||||
| Ryland Group, Inc. | DEUT | USD | 3,400 | (5.00)% / (1.34)% | 12/20/17 | – | (363 | ) | (382 | ) | – | (19 | ) | |||||||||||||||||
| Ryland Group, Inc. | DEUT | USD | 4,000 | (5.00)% / (1.26)% | 09/20/17 | – | (391 | ) | (427 | ) | – | (36 | ) | |||||||||||||||||
| Telefonica S.A. | CSI | EUR | 2,925 | (1.00)% / (0.85)% | 06/20/19 | 6 | – | (24 | ) | – | (30 | ) | ||||||||||||||||||
| Tenet Healthcare Corp. | MSC | USD | 3,275 | (5.00)% / (1.39)% | 12/20/17 | – | (312 | ) | (363 | ) | – | (51 | ) | |||||||||||||||||
| Westpac Banking Corp. | DEUT | USD | 3,350 | (1.00)% / (0.71)% | 12/20/19 | – | (40 | ) | (49 | ) | – | (9 | ) | |||||||||||||||||
| Total | $ | 167 | $ | (3,086 | ) | $ | (3,472 | ) | $ | 10 | $ | (563 | ) | |||||||||||||||||
| Sell protection: | ||||||||||||||||||||||||||||||
| First Data Corp. | JPM | USD | 5,450 | 5.00% / 3.45% | 12/20/19 | $ | 360 | $ | – | $ | 390 | $ | 30 | $ | – | |||||||||||||||
| Freescale Semiconductors, Inc. | GSC | USD | 2,600 | 5.00% / 3.25% | 12/20/19 | 240 | – | 212 | – | (28 | ) | |||||||||||||||||||
| Freescale Semiconductors, Inc. | JPM | USD | 2,000 | 5.00% / 3.25% | 12/20/19 | 81 | – | 163 | 82 | – | ||||||||||||||||||||
| Freescale Semiconductors, Inc. | JPM | USD | 5,650 | 5.00% / 3.25% | 12/20/19 | 485 | – | 461 | – | (24 | ) | |||||||||||||||||||
| Gannett Co., Inc. | GSC | USD | 3,225 | 5.00% / 2.18% | 12/20/19 | 420 | – | 435 | 15 | – | ||||||||||||||||||||
| K Hovnanian Enterprises, Inc. | BOA | USD | 1,650 | 5.00% / 4.56% | 12/20/18 | – | (39 | ) | 27 | 66 | – | |||||||||||||||||||
| Koninklijke KPN, N.V. | CSI | EUR | 2,925 | 1.00% / 0.87% | 06/20/19 | – | (10 | ) | 21 | 31 | – | |||||||||||||||||||
| Liberty Interactive LLC | GSC | USD | 4,200 | 5.00% / 2.40% | 12/20/19 | 442 | – | 520 | 78 | – | ||||||||||||||||||||
| Rite Aid Corp. | GSC | USD | 1,065 | 5.00% / 3.41% | 12/20/19 | 55 | – | 79 | 24 | – | ||||||||||||||||||||
| Ryland Group, Inc. | DEUT | USD | 3,400 | 5.00% / 2.64% | 12/20/19 | 316 | – | 378 | 62 | – | ||||||||||||||||||||
| Ryland Group, Inc. | DEUT | USD | 4,000 | 5.00% / 2.52% | 09/20/19 | 369 | – | 451 | 82 | – | ||||||||||||||||||||
| Tenet Healthcare Corp. | MSC | USD | 3,275 | 5.00% / 2.72% | 12/20/19 | 243 | – | 352 | 109 | – | ||||||||||||||||||||
| Total | $ | 3,011 | $ | (49 | ) | $ | 3,489 | $ | 579 | $ | (52 | ) | ||||||||||||||||||
| Total single-name issues | $ | 3,178 | $ | (3,135 | ) | $ | 17 | $ | 589 | $ | (615 | ) | ||||||||||||||||||
| $ | 3,594 | $ | (5,010 | ) | $ | (804 | ) | $ | 1,374 | $ | (762 | ) | ||||||||||||||||||
| (a) | The maximum potential amount the Fund could be required to pay as a seller of credit protection or receive as a buyer of credit protection if a credit event occurs as defined under the terms of that particular swap agreement. |
| (b) | Implied credit spreads, utilized in determining the market value of credit default swap agreements on corporate issues, U.S. municipal issues or sovereign government issues as of period end serve as an indicator of the current status of the payment/performance risk and represent the likelihood of risk of default for the credit derivative. The implied credit spread of a particular entity reflects the cost of buying/selling protection and may include upfront payments required to be made to enter into the agreement. Wider credit spreads represent a deterioration of the reference entity's credit soundness and a greater likelihood or risk of default or other credit event occurring as defined under the terms of the agreement. The percentage shown is the implied credit spread on October 31, 2014. For credit default swap agreements on indices, the quoted market prices and resulting values serve as the indicator of the current status of the payment/performance risk. |
The accompanying notes are an integral part of these financial statements.
| 18 |
The Hartford World Bond Fund
Schedule of Investments – (continued)
October 31, 2014
(000’s Omitted)
Centrally Cleared Credit Default Swap Contracts Outstanding at October 31, 2014
| Clearing | Notional | (Pay)/
Receive Fixed | Expiration | Market | Unrealized Appreciation/ (Depreciation) | Variation Margin | ||||||||||||||||||||||||||||||
| Reference Entity | House (a) | Amount (b) | Rate | Date | Cost Basis | Value ╪ | Asset | Liability | Asset | Liability | ||||||||||||||||||||||||||
| Credit default swaps on indices: | ||||||||||||||||||||||||||||||||||||
| Buy protection: | ||||||||||||||||||||||||||||||||||||
| CDX.NA.HY.22 | CME | USD | 1,059 | (5.00 | )% | 06/20/19 | $ | (63 | ) | $ | (79 | ) | $ | – | $ | (16 | ) | $ | – | $ | (4 | ) | ||||||||||||||
| (a) | The FCM to the contracts is MSC. |
| (b) | The maximum potential amount the Fund could be required to pay as a seller of credit protection or receive as a buyer of credit protection if a credit event occurs as defined under the terms of that particular swap agreement. |
OTC Interest Rate Swap Contracts Outstanding at October 31, 2014
| Payments made | Payments received | Notional | Expiration | Upfront Premiums | Upfront Premiums | Market | Unrealized
Appreciation/(Depreciation) | |||||||||||||||||||||||
| Counterparty | by Fund | by Fund | Amount | Date | Paid | Received | Value ╪ | Asset | Liability | |||||||||||||||||||||
| CBK | 6M WIBOR PLN | 1.66% Fixed | PLN | 38,340 | 12/17/16 | $ | – | $ | – | $ | (3 | ) | $ | – | $ | (3 | ) | |||||||||||||
| DEUT | KRW CD KSDA | 2.36% Fixed | KRW | 12,469,730 | 12/17/19 | – | – | 77 | 77 | – | ||||||||||||||||||||
| DEUT | KRW CD KSDA | 2.41% Fixed | KRW | 25,933,045 | 12/17/19 | – | – | 217 | 217 | – | ||||||||||||||||||||
| DEUT | KRW CD KSDA | 2.51% Fixed | KRW | 9,889,775 | 12/17/19 | – | – | 126 | 126 | – | ||||||||||||||||||||
| DEUT | KRW CD KSDA | 2.76% Fixed | KRW | 6,373,270 | 12/17/24 | – | – | 154 | 154 | – | ||||||||||||||||||||
| DEUT | KRW CD KSDA | 2.85% Fixed | KRW | 8,719,590 | 12/17/24 | – | – | 277 | 277 | – | ||||||||||||||||||||
| JPM | 6M WIBOR PLN | 1.67% Fixed | PLN | 37,790 | 12/17/16 | – | – | – | – | – | ||||||||||||||||||||
| JPM | KRW CD KSDA | 2.21% Fixed | KRW | 9,352,300 | 12/17/19 | – | – | – | – | – | ||||||||||||||||||||
| JPM | KRW CD KSDA | 2.39% Fixed | KRW | 20,783,005 | 12/17/19 | – | – | 151 | 151 | – | ||||||||||||||||||||
| JPM | KRW CD KSDA | 2.51% Fixed | KRW | 9,779,950 | 12/17/19 | – | – | 126 | 126 | – | ||||||||||||||||||||
| JPM | KRW CD KSDA | 2.60% Fixed | KRW | 28,784,180 | 12/17/19 | – | – | 479 | 479 | – | ||||||||||||||||||||
| Total | $ | – | $ | – | $ | 1,604 | $ | 1,607 | $ | (3 | ) | |||||||||||||||||||
| Centrally Cleared Interest Rate Swap Contracts Outstanding at October 31, 2014 | ||||||||||||||||||||||||||||||||||
| Clearing | Payments made | Payments received | Notional | Expiration | Upfront Premiums Paid | Market | Unrealized | Variation Margin | ||||||||||||||||||||||||||
House (a) | by Fund | by Fund | Amount | Date | (Received) | Value ╪ | Asset | Liability | Asset | Liability | ||||||||||||||||||||||||
| LCH | 6M EURIBOR | 2.00% Fixed | EUR | 21,655 | 12/18/24 | $ | 128 | $ | 323 | $ | 195 | $ | – | $ | – | $ | (5 | ) | ||||||||||||||||
| LCH | 6M GBP LIBOR | 2.13% Fixed | GBP | 37,230 | 12/21/18 | (13 | ) | (49 | ) | – | (36 | ) | – | (53 | ) | |||||||||||||||||||
| LCH | 6M GBP LIBOR | 2.34% Fixed | GBP | 61,685 | 12/18/20 | – | (323 | ) | – | (323 | ) | – | (26 | ) | ||||||||||||||||||||
| LCH | 6M GBP LIBOR | 2.45% Fixed | GBP | 511,850 | 12/21/18 | 3,363 | 4,281 | 918 | – | – | (553 | ) | ||||||||||||||||||||||
| LCH | 6M GBP LIBOR | 2.53% Fixed | GBP | 61,185 | 12/18/20 | – | (151 | ) | – | (151 | ) | – | (27 | ) | ||||||||||||||||||||
| Total | $ | 3,478 | $ | 4,081 | $ | 1,113 | $ | (510 | ) | $ | – | $ | (664 | ) | ||||||||||||||||||||
| (a) | The FCM to the contracts is MSC. |
Foreign Currency Contracts Outstanding at October 31, 2014
Unrealized Appreciation/(Depreciation) | ||||||||||||||||||||||
Currency | Buy / Sell | Delivery Date | Counterparty | Contract Amount | Market Value ╪ | Asset | Liability | |||||||||||||||
| AUD | Buy | 11/28/2014 | BCLY | $ | 3,185 | $ | 3,193 | $ | 8 | $ | – | |||||||||||
| AUD | Buy | 11/28/2014 | BOA | 9,282 | 9,206 | – | (76 | ) | ||||||||||||||
| AUD | Buy | 11/28/2014 | JPM | 6,903 | 6,905 | 2 | – | |||||||||||||||
| AUD | Buy | 11/28/2014 | JPM | 6,936 | 6,905 | – | (31 | ) | ||||||||||||||
| AUD | Sell | 11/28/2014 | CBA | 23,755 | 23,832 | – | (77 | ) | ||||||||||||||
| AUD | Sell | 11/28/2014 | JPM | 1,675 | 1,669 | 6 | – | |||||||||||||||
| AUD | Sell | 11/28/2014 | NAB | 254,001 | 255,309 | – | (1,308 | ) | ||||||||||||||
| BRL | Sell | 12/02/2014 | UBS | 1,121 | 1,043 | 78 | – | |||||||||||||||
| CAD | Buy | 11/28/2014 | RBC | 4,487 | 4,460 | – | (27 | ) | ||||||||||||||
The accompanying notes are an integral part of these financial statements.
| 19 |
The Hartford World Bond Fund
Schedule of Investments – (continued)
October 31, 2014
(000’s Omitted)
Foreign Currency Contracts Outstanding at October 31, 2014 - (continued)
| Unrealized Appreciation/(Depreciation) | ||||||||||||||||||||||
| Currency | Buy / Sell | Delivery Date | Counterparty | Contract Amount | Market Value ╪ | Asset | Liability | |||||||||||||||
| CHF | Buy | 11/28/2014 | GSC | $ | 61,292 | $ | 60,672 | $ | – | $ | (620 | ) | ||||||||||
| CHF | Buy | 11/28/2014 | HSBC | 63,997 | 63,468 | – | (529 | ) | ||||||||||||||
| CHF | Sell | 11/28/2014 | HSBC | 9,547 | 9,469 | 78 | – | |||||||||||||||
| CNH | Sell | 11/28/2014 | HSBC | 8,775 | 8,772 | 3 | – | |||||||||||||||
| DKK | Sell | 11/28/2014 | BCLY | 5,708 | 5,655 | 53 | – | |||||||||||||||
| DKK | Sell | 11/17/2014 | BOA | 18,684 | 17,176 | 1,508 | – | |||||||||||||||
| DKK | Sell | 11/28/2014 | GSC | 177,644 | 175,635 | 2,009 | – | |||||||||||||||
| EUR | Buy | 11/28/2014 | BCLY | 50,622 | 49,785 | – | (837 | ) | ||||||||||||||
| EUR | Buy | 11/28/2014 | CBA | 13,202 | 13,021 | – | (181 | ) | ||||||||||||||
| EUR | Buy | 11/28/2014 | DEUT | 8,985 | 8,868 | – | (117 | ) | ||||||||||||||
| EUR | Buy | 11/28/2014 | GSC | 61,257 | 60,625 | – | (632 | ) | ||||||||||||||
| EUR | Buy | 11/28/2014 | HSBC | 3,405 | 3,368 | – | (37 | ) | ||||||||||||||
| EUR | Buy | 11/28/2014 | JPM | 64,236 | 63,560 | – | (676 | ) | ||||||||||||||
| EUR | Buy | 11/03/2014 | SSG | – | – | – | – | |||||||||||||||
| EUR | Buy | 11/28/2014 | UBS | 6,882 | 6,820 | – | (62 | ) | ||||||||||||||
| EUR | Buy | 11/28/2014 | WEST | 4,603 | 4,556 | – | (47 | ) | ||||||||||||||
| EUR | Sell | 11/28/2014 | CBA | 119,758 | 118,402 | 1,356 | – | |||||||||||||||
| EUR | Sell | 11/28/2014 | CBK | 119,720 | 118,413 | 1,307 | – | |||||||||||||||
| EUR | Sell | 11/28/2014 | DEUT | 119,688 | 118,419 | 1,269 | – | |||||||||||||||
| EUR | Sell | 11/28/2014 | JPM | 135,378 | 134,026 | 1,352 | – | |||||||||||||||
| EUR | Sell | 11/28/2014 | MSC | 119,680 | 118,420 | 1,260 | – | |||||||||||||||
| EUR | Sell | 11/28/2014 | RBC | 119,720 | 118,413 | 1,307 | – | |||||||||||||||
| EUR | Sell | 11/28/2014 | UBS | 37,408 | 37,072 | 336 | – | |||||||||||||||
| GBP | Buy | 11/28/2014 | BOA | 4,538 | 4,499 | – | (39 | ) | ||||||||||||||
| GBP | Buy | 11/28/2014 | SSG | 13,757 | 13,645 | – | (112 | ) | ||||||||||||||
| GBP | Sell | 11/28/2014 | BOA | 4,403 | 4,392 | 11 | – | |||||||||||||||
| GBP | Sell | 11/28/2014 | CBK | 257,892 | 257,522 | 370 | – | |||||||||||||||
| GBP | Sell | 11/28/2014 | DEUT | 2,471 | 2,471 | – | – | |||||||||||||||
| GBP | Sell | 11/28/2014 | HSBC | 6,795 | 6,788 | 7 | – | |||||||||||||||
| GBP | Sell | 11/28/2014 | JPM | 1,784 | 1,783 | 1 | – | |||||||||||||||
| GBP | Sell | 11/28/2014 | UBS | 7,415 | 7,399 | 16 | – | |||||||||||||||
| JPY | Buy | 11/28/2014 | JPM | 2,198 | 2,185 | – | (13 | ) | ||||||||||||||
| JPY | Buy | 11/28/2014 | RBS | 60,558 | 58,225 | – | (2,333 | ) | ||||||||||||||
| JPY | Sell | 11/28/2014 | JPM | 13,466 | 13,456 | 10 | – | |||||||||||||||
| KRW | Sell | 11/28/2014 | BCLY | 13,825 | 13,599 | 226 | – | |||||||||||||||
| KRW | Sell | 11/28/2014 | HSBC | 168,935 | 167,196 | 1,739 | – | |||||||||||||||
| MXN | Sell | 11/28/2014 | BCLY | 6,033 | 6,072 | – | (39 | ) | ||||||||||||||
| MXN | Sell | 11/28/2014 | MSC | 136,502 | 137,319 | – | (817 | ) | ||||||||||||||
| NOK | Buy | 11/28/2014 | CBK | 52,627 | 51,242 | – | (1,385 | ) | ||||||||||||||
| NOK | Buy | 11/28/2014 | JPM | 4,572 | 4,590 | 18 | – | |||||||||||||||
| NOK | Sell | 11/28/2014 | CBK | 4,568 | 4,448 | 120 | – | |||||||||||||||
| NOK | Sell | 11/28/2014 | GSC | 52,460 | 51,242 | 1,218 | – | |||||||||||||||
| NOK | Sell | 11/28/2014 | MSC | 142 | 142 | – | – | |||||||||||||||
| NZD | Buy | 11/28/2014 | JPM | 9,173 | 9,169 | – | (4 | ) | ||||||||||||||
| NZD | Sell | 11/28/2014 | BOA | 4,501 | 4,503 | – | (2 | ) | ||||||||||||||
| NZD | Sell | 11/28/2014 | JPM | 13,738 | 13,636 | 102 | – | |||||||||||||||
| NZD | Sell | 11/28/2014 | MSC | 4,532 | 4,504 | 28 | – | |||||||||||||||
| NZD | Sell | 11/28/2014 | WEST | 63,528 | 62,938 | 590 | – | |||||||||||||||
| PLN | Buy | 11/28/2014 | HSBC | 104 | 103 | – | (1 | ) | ||||||||||||||
| PLN | Buy | 11/28/2014 | JPM | 9,193 | 9,125 | – | (68 | ) | ||||||||||||||
| PLN | Sell | 11/28/2014 | HSBC | 9,007 | 8,937 | 70 | – | |||||||||||||||
| PLN | Sell | 11/28/2014 | MSC | 188 | 188 | – | – | |||||||||||||||
| SEK | Buy | 11/28/2014 | BOA | 299 | 297 | – | (2 | ) | ||||||||||||||
| SEK | Buy | 11/28/2014 | CSFB | 75,604 | 74,283 | – | (1,321 | ) | ||||||||||||||
| SEK | Sell | 11/28/2014 | BOA | 4,468 | 4,410 | 58 | – | |||||||||||||||
| SEK | Sell | 11/28/2014 | CBA | 10,534 | 10,361 | 173 | – | |||||||||||||||
| SEK | Sell | 11/28/2014 | CSFB | 198,798 | 195,326 | 3,472 | – | |||||||||||||||
| SEK | Sell | 11/28/2014 | GSC | 57,694 | 56,725 | 969 | – | |||||||||||||||
| SEK | Sell | 11/28/2014 | SSG | 13,564 | 13,446 | 118 | – | |||||||||||||||
The accompanying notes are an integral part of these financial statements.
| 20 |
The Hartford World Bond Fund
Schedule of Investments – (continued)
October 31, 2014
(000’s Omitted)
Foreign Currency Contracts Outstanding at October 31, 2014 - (continued)
| Unrealized Appreciation/(Depreciation) | ||||||||||||||||||||||
| Currency | Buy / Sell | Delivery Date | Counterparty | Contract Amount | Market Value ╪ | Asset | Liability | |||||||||||||||
| SEK | Sell | 11/28/2014 | UBS | $ | 3,162 | $ | 3,169 | $ | – | $ | (7 | ) | ||||||||||
| SGD | Sell | 11/28/2014 | HSBC | 12,587 | 12,476 | 111 | – | |||||||||||||||
| TRY | Buy | 11/28/2014 | BOA | 9,161 | 9,138 | – | (23 | ) | ||||||||||||||
| TRY | Sell | 11/28/2014 | CBK | 9,086 | 9,137 | – | (51 | ) | ||||||||||||||
| ZAR | Sell | 11/28/2014 | DEUT | 5,947 | 5,856 | 91 | – | |||||||||||||||
| Total | $ | 21,450 | $ | (11,474 | ) | |||||||||||||||||
| ╪ | See Significant Accounting Policies of accompanying Notes to Financial Statements regarding valuation of securities. |
| GLOSSARY: (abbreviations used in preceding Schedule of Investments) | |
| Counterparty Abbreviations: | |
| BCLY | Barclays |
| BOA | Banc of America Securities LLC |
| CBA | Commonwealth Bank of Australia |
| CBK | Citibank NA |
| CME | Chicago Mercantile Exchange |
| CSFB | Credit Suisse First Boston Corp. |
| CSI | Credit Suisse International |
| DEUT | Deutsche Bank Securities, Inc. |
| FCM | Futures Commission Merchant |
| GSC | Goldman Sachs & Co. |
| HSBC | HSBC Bank USA |
| JPM | JP Morgan Chase & Co. |
| LCH | LCH Clearnet |
| MSC | Morgan Stanley |
| NAB | National Australia Bank Limited |
| RBC | RBC Dominion Securities, Inc. |
| RBS | RBS Greenwich Capital |
| SCB | Standard Chartered Bank |
| SSG | State Street Global Markets LLC |
| UBS | UBS AG |
| WEST | Westpac International |
| Currency Abbreviations: | |
| AUD | Australian Dollar |
| BRL | Brazilian Real |
| CAD | Canadian Dollar |
| CHF | Swiss Franc |
| CNH | Chinese Yuan Renminbi - Hong Kong |
| CNY | Chinese Yuan Renminbi |
| DKK | Danish Krone |
| EUR | EURO |
| GBP | British Pound |
| JPY | Japanese Yen |
| KRW | South Korean Won |
| MXN | Mexican New Peso |
| NOK | Norwegian Krone |
| NZD | New Zealand Dollar |
| PLN | Polish New Zloty |
| SEK | Swedish Krona |
| SGD | Singapore Dollar |
| TRY | Turkish New Lira |
| USD | U.S. Dollar |
| ZAR | South African Rand |
| Index Abbreviations: | |
| CDX.NA.HY | Credit Derivatives North American High Yield |
| CDX.NA.IG | Credit Derivatives North American Investment Grade |
| CMBX.NA | Markit Commercial Mortgage Backed North American |
| ITRAXX.SUB.FIN | Markit iTraxx - Europe Sub Financials |
| Other Abbreviations: | |
| CD | Certificate of Deposit |
| CLO | Collateralized Loan Obligation |
| CMS | Constant Maturity Swap |
| CR | Credit |
| EURIBOR | Euro Interbank Offered Rate |
| FHLMC | Federal Home Loan Mortgage Corp. |
| FNMA | Federal National Mortgage Association |
| FX | Foreign Exchange |
| GNMA | Government National Mortgage Association |
| IR | Interest Rate |
| KSDA | Korea Securities Dealers Association |
| LIBOR | London Interbank Offered Rate |
| OTC | Over-the-Counter |
| WIBOR | Warsaw Interbank Offered Rate |
The accompanying notes are an integral part of these financial statements.
| 21 |
The Hartford World Bond Fund
Schedule of Investments – (continued)
October 31, 2014
(000’s Omitted)
Investment Valuation Hierarchy Level Summary
October 31, 2014
| Total | Level 1 ♦ | Level 2 ♦ | Level 3 | |||||||||||||
| Assets: | ||||||||||||||||
| Asset and Commercial Mortgage Backed Securities | $ | 402,098 | $ | – | $ | 371,163 | $ | 30,935 | ||||||||
| Corporate Bonds | 319,318 | – | 319,318 | – | ||||||||||||
| Foreign Government Obligations | 1,725,881 | – | 1,725,881 | – | ||||||||||||
| Preferred Stocks | 3,326 | 3,326 | – | – | ||||||||||||
| Senior Floating Rate Interests | 90,647 | – | 90,647 | – | ||||||||||||
| U.S. Government Agencies | 4,422 | – | 4,422 | – | ||||||||||||
| U.S. Government Securities | 360,928 | – | 360,928 | – | ||||||||||||
| Short-Term Investments | 120,618 | – | 120,618 | – | ||||||||||||
| Purchased Options | 1,903 | – | 1,903 | – | ||||||||||||
| Total | $ | 3,029,141 | $ | 3,326 | $ | 2,994,880 | $ | 30,935 | ||||||||
| Foreign Currency Contracts * | $ | 21,450 | $ | – | $ | 21,450 | $ | – | ||||||||
| Futures * | 3,663 | 3,663 | – | – | ||||||||||||
| Swaps - Credit Default * | 1,374 | – | 1,374 | – | ||||||||||||
| Swaps - Interest Rate * | 2,720 | – | 2,720 | – | ||||||||||||
| Total | $ | 29,207 | $ | 3,663 | $ | 25,544 | $ | – | ||||||||
| Liabilities: | ||||||||||||||||
| Written Options | $ | 123 | – | $ | 123 | $ | – | |||||||||
| Total | $ | 123 | $ | – | $ | 123 | $ | – | ||||||||
| Foreign Currency Contracts * | $ | 11,474 | $ | – | $ | 11,474 | $ | – | ||||||||
| Futures * | 9,147 | 9,147 | – | – | ||||||||||||
| Swaps - Credit Default * | 778 | – | 778 | – | ||||||||||||
| Swaps - Interest Rate * | 513 | – | 513 | – | ||||||||||||
| Total | $ | 21,912 | $ | 9,147 | $ | 12,765 | $ | – | ||||||||
| ♦ | For the year ended October 31, 2014, investments valued at $14,731 were transferred from Level 1 to Level 2, and investments valued at $377 were transferred from Level 2 to Level 1. Investments are transferred between Level 1 and Level 2 for a variety of reasons including, but not limited to: |
1) Foreign equities for which a fair value price is more representative of exit value than the local market close (transfer into Level 2). Foreign equities for which the local market close is more representative of exit value (transfer into Level 1).
2) U.S. Treasury securities that no longer represent the most recent issue (transfer into Level 2).
3) Equity investments with no observable trading but a bid or mean price is used (transfer into Level 2). Equity investments using observable quoted prices in an active market (transfer into Level 1).
| * | Derivative instruments (excluding purchased and written options, if applicable) are valued at the unrealized appreciation/depreciation on the investments. |
Following is a reconciliation of Level 3 assets for which significant unobservable inputs were used to determine fair value:
Balance as | Realized | Change in | Net | Purchases | Sales | Transfers | Transfers | Balance as | ||||||||||||||||||||||||||||
| Assets: | ||||||||||||||||||||||||||||||||||||
| Asset & Commercial Mortgage Backed Securities | $ | 21,272 | $ | 603 | $ | 706 | † | $ | 443 | $ | 22,842 | $ | (9,953 | ) | $ | 2,142 | $ | (7,120 | ) | $ | 30,935 | |||||||||||||||
| Corporate Bonds | 3,551 | — | — | — | — | — | — | (3,551 | ) | — | ||||||||||||||||||||||||||
| Total | $ | 24,823 | $ | 603 | $ | 706 | $ | 443 | $ | 22,842 | $ | (9,953 | ) | $ | 2,142 | $ | (10,671 | ) | $ | 30,935 | ||||||||||||||||
| * | Investments are transferred into and out of Level 3 for a variety of reasons including, but not limited to: |
1) Investments where trading has been halted (transfer into Level 3) or investments where trading has resumed (transfer out of Level 3).
2) Broker quoted investments (transfer into Level 3) or quoted prices in active markets (transfer out of Level 3).
3) Investments that have certain restrictions on trading (transfer into Level 3) or investments where trading restrictions have expired (transfer out of Level 3).
| † | Change in unrealized appreciation (depreciation) in the current period relating to assets still held at October 31, 2014 was $779. |
| Note: | For purposes of reporting transfers between different hierarchy levels, both transfers in and out of each level, as applicable, are shown as if they occurred at the beginning of the period. |
The accompanying notes are an integral part of these financial statements.
| 22 |
Statement of Assets and Liabilities
October 31, 2014
(000’s Omitted)
| Assets: | ||||
| Investments in securities, at market value (cost $3,080,725) | $ | 3,029,141 | ||
| Cash | 28,516 | * | ||
| Foreign currency on deposit with custodian (cost $18) | 18 | |||
| Unrealized appreciation on foreign currency contracts | 21,450 | |||
| Unrealized appreciation on OTC swap contracts | 2,981 | |||
| Receivables: | ||||
| Investment securities sold | 12,958 | |||
| Fund shares sold | 15,722 | |||
| Dividends and interest | 26,443 | |||
| Variation margin on financial derivative instruments | 1,564 | |||
| OTC swap premiums paid | 3,594 | |||
| Other assets | 148 | |||
| Total assets | 3,142,535 | |||
| Liabilities: | ||||
| Unrealized depreciation on foreign currency contracts | 11,474 | |||
| Unrealized depreciation on OTC swap contracts | 765 | |||
| Bank overdraft | 9,755 | |||
| Payables: | ||||
| Investment securities purchased | 15,434 | |||
| Fund shares redeemed | 8,141 | |||
| Investment management fees | 361 | |||
| Dividends | — | |||
| Administrative fees | — | |||
| Distribution fees | 55 | |||
| Collateral received from broker | 1,035 | |||
| Variation margin on financial derivative instruments | 2,745 | |||
| Accrued expenses | 336 | |||
| OTC swap premiums received | 5,010 | |||
| Written option contracts (proceeds $90) | 123 | |||
| Other liabilities | 133 | |||
| Total liabilities | 55,367 | |||
| Net assets | $ | 3,087,168 | ||
| Summary of Net Assets: | ||||
| Capital stock and paid-in-capital | $ | 3,057,044 | ||
| Undistributed net investment income | 71,231 | |||
| Accumulated net realized gain | 4,075 | |||
| Unrealized depreciation of investments and the translation of assets and liabilities denominated in foreign currency | (45,182 | ) | ||
| Net assets | $ | 3,087,168 |
* Cash of $28,516 was pledged as collateral for open financial derivative instruments at October 31, 2014.
The accompanying notes are an integral part of these financial statements.
| 23 |
The Hartford World Bond Fund
Statement of Assets and Liabilities – (continued)
October 31, 2014
(000’s Omitted)
| Shares authorized | 650,000 | |||
| Par value | $ | 0.001 | ||
| Class A: Net asset value per share/Maximum offering price per share | $10.76/$11.27 | |||
| Shares outstanding | 39,277 | |||
| Net assets | $ | 422,689 | ||
| Class C: Net asset value per share | $ | 10.74 | ||
| Shares outstanding | 16,675 | |||
| Net assets | $ | 179,147 | ||
| Class I: Net asset value per share | $ | 10.77 | ||
| Shares outstanding | 182,568 | |||
| Net assets | $ | 1,966,455 | ||
| Class R3: Net asset value per share | $ | 10.77 | ||
| Shares outstanding | 70 | |||
| Net assets | $ | 759 | ||
| Class R4: Net asset value per share | $ | 10.78 | ||
| Shares outstanding | 67 | |||
| Net assets | $ | 725 | ||
| Class R5: Net asset value per share | $ | 10.76 | ||
| Shares outstanding | 21 | |||
| Net assets | $ | 226 | ||
| Class Y: Net asset value per share | $ | 10.77 | ||
| Shares outstanding | 48,006 | |||
| Net assets | $ | 517,167 |
The accompanying notes are an integral part of these financial statements.
| 24 |
Statement of Operations
For the Year Ended October 31, 2014
(000’s Omitted)
| Investment Income: | ||||
| Dividends | $ | 145 | ||
| Interest | 50,033 | |||
| Less: Foreign tax withheld | (516 | ) | ||
| Total investment income | 49,662 | |||
| Expenses: | ||||
| Investment management fees | 14,292 | |||
| Administrative services fees | ||||
| Class R3 | 1 | |||
| Class R4 | 1 | |||
| Class R5 | — | |||
| Transfer agent fees | ||||
| Class A | 523 | |||
| Class C | 164 | |||
| Class I | 1,170 | |||
| Class R3 | — | |||
| Class R4 | — | |||
| Class R5 | — | |||
| Class Y | 6 | |||
| Distribution fees | ||||
| Class A | 1,214 | |||
| Class C | 1,749 | |||
| Class R3 | 3 | |||
| Class R4 | 2 | |||
| Custodian fees | 90 | |||
| Accounting services fees | 464 | |||
| Registration and filing fees | 248 | |||
| Board of Directors' fees | 57 | |||
| Audit fees | 27 | |||
| Other expenses | 322 | |||
| Total expenses (before waivers and fees paid indirectly) | 20,333 | |||
| Expense waivers | (1 | ) | ||
| Management fee waivers | (661 | ) | ||
| Custodian fee offset | — | |||
| Total waivers and fees paid indirectly | (662 | ) | ||
| Total expenses, net | 19,671 | |||
| Net Investment Income | 29,991 | |||
| Net Realized Gain on Investments, Other Financial Instruments and Foreign Currency Transactions: | ||||
| Net realized gain on investments | 16,195 | |||
| Net realized loss on purchased option contracts | (2,060 | ) | ||
| Net realized loss on TBA sale transactions | (1,278 | ) | ||
| Net realized loss on futures contracts | (4,733 | ) | ||
| Net realized gain on written option contracts | 477 | |||
| Net realized loss on swap contracts | (3,467 | ) | ||
| Net realized gain on foreign currency contracts | 105,825 | |||
| Net realized loss on other foreign currency transactions | (178 | ) | ||
| Net Realized Gain on Investments, Other Financial Instruments and Foreign Currency Transactions | 110,781 | |||
| Net Changes in Unrealized Depreciation of Investments, Other Financial Instruments and Foreign Currency Transactions: | ||||
| Net unrealized depreciation of investments | (73,918 | ) | ||
| Net unrealized appreciation of purchased option contracts | 304 | |||
| Net unrealized depreciation of futures contracts | (938 | ) | ||
| Net unrealized depreciation of written option contracts | (204 | ) | ||
| Net unrealized appreciation of swap contracts | 4,463 | |||
| Net unrealized depreciation of foreign currency contracts | (5,703 | ) | ||
| Net unrealized depreciation of translation of other assets and liabilities in foreign currencies | (1,607 | ) | ||
| Net Changes in Unrealized Depreciation of Investments, Other Financial Instruments and Foreign Currency Transactions | (77,603 | ) | ||
| Net Gain on Investments, Other Financial Instruments and Foreign Currency Transactions | 33,178 | |||
| Net Increase in Net Assets Resulting from Operations | $ | 63,169 |
The accompanying notes are an integral part of these financial statements.
| 25 |
Statement of Changes in Net Assets
(000’s Omitted)
| For the Year Ended October 31, 2014 | For the Year Ended October 31, 2013 | |||||||
| Operations: | ||||||||
| Net investment income | $ | 29,991 | $ | 15,794 | ||||
| Net realized gain (loss) on investments, other financial instruments and foreign currency transactions | 110,781 | (18,390 | ) | |||||
| Net unrealized appreciation (depreciation) of investments, other financial instruments and foreign currency transactions | (77,603 | ) | 17,614 | |||||
| Net Increase in Net Assets Resulting from Operations | 63,169 | 15,018 | ||||||
| Distributions to Shareholders: | ||||||||
| From net investment income | ||||||||
| Class A | (5,721 | ) | (6,063 | ) | ||||
| Class C | (785 | ) | (1,266 | ) | ||||
| Class I | (17,983 | ) | (12,578 | ) | ||||
| Class R3 | (5 | ) | (5 | ) | ||||
| Class R4 | (10 | ) | (10 | ) | ||||
| Class R5 | (4 | ) | (8 | ) | ||||
| Class Y | (6,521 | ) | (4,593 | ) | ||||
| Total from net investment income | (31,029 | ) | (24,523 | ) | ||||
| From net realized gain on investments | ||||||||
| Class A | (1,501 | ) | (2,916 | ) | ||||
| Class C | (544 | ) | (1,137 | ) | ||||
| Class I | (3,043 | ) | (4,780 | ) | ||||
| Class R3 | (2 | ) | (14 | ) | ||||
| Class R4 | (3 | ) | (16 | ) | ||||
| Class R5 | (1 | ) | (14 | ) | ||||
| Class Y | (1,138 | ) | (2,063 | ) | ||||
| Total from net realized gain on investments | (6,232 | ) | (10,940 | ) | ||||
| Total distributions | (37,261 | ) | (35,463 | ) | ||||
| Capital Share Transactions: | ||||||||
| Class A | (65,734 | ) | 236,592 | |||||
| Class C | (772 | ) | 82,938 | |||||
| Class I | 1,063,184 | 479,276 | ||||||
| Class R3 | 232 | (773 | ) | |||||
| Class R4 | (262 | ) | (361 | ) | ||||
| Class R5 | (149 | ) | (898 | ) | ||||
| Class Y | 171,691 | 145,527 | ||||||
| Net increase from capital share transactions | 1,168,190 | 942,301 | ||||||
| Net Increase in Net Assets | 1,194,098 | 921,856 | ||||||
| Net Assets: | ||||||||
| Beginning of period | 1,893,070 | 971,214 | ||||||
| End of period | $ | 3,087,168 | $ | 1,893,070 | ||||
| Undistributed (distributions in excess of) net investment income | $ | 71,231 | $ | (2,318 | ) | |||
The accompanying notes are an integral part of these financial statements.
| 26 |
Notes to Financial Statements
October 31, 2014
(000’s Omitted)
Organization:
The Hartford Mutual Funds, Inc. (“Company”) is an open-end management investment company comprised of forty-two portfolios. Financial statements for The Hartford World Bond Fund (the "Fund"), a series of the Company, are included in this report.
The Company is organized under the laws of the State of Maryland and is registered with the Securities and Exchange Commission (“SEC”) under the Investment Company Act of 1940, as amended (“1940 Act”). The Fund is a non-diversified open-end management investment company. The Fund is an investment company and applies specialized accounting and reporting under Accounting Standards Codification Topic 946, Financial Services - Investment Companies.
Class A shares are sold with a front-end sales charge of up to 4.50%. Class C shares are sold with a contingent deferred sales charge of up to 1.00% on shares redeemed within twelve months of purchase. Class I shares are sold without sales charges to certain eligible investors primarily through advisory fee-based wrap programs. Class R3, R4 and R5 shares, which are offered to employer-sponsored retirement plans, and Class Y shares, which are sold to certain eligible institutional investors, are sold without a sales charge. All classes of shares have identical voting, redemption, dividend, liquidation and other rights and the same terms and conditions, with the exceptions that each class may have different expenses, which may affect performance.
Significant Accounting Policies:
The following is a summary of significant accounting policies of the Fund in the preparation of its financial statements, which are in accordance with United States generally accepted accounting principles (“U.S. GAAP”). The preparation of financial statements in accordance with U.S. GAAP may require management to make estimates and assumptions that affect the reported amounts of assets and liabilities and disclosure of contingent assets and liabilities at the date of the financial statements and the reported amounts of increases and decreases in net assets from operations during the reporting period. Actual results could differ from those estimates.
Determination of Net Asset Value – The per share net asset value ("NAV") of each class of the Fund's shares is determined as of the close of regular trading (normally 4:00 p.m. Eastern Time) (the “NYSE Close”) on each day that the New York Stock Exchange (the “Exchange”) is open (“Valuation Date”). Information that becomes known to the Fund after the NAV has been calculated on a particular day will not generally be used to retroactively adjust the NAV determined earlier that day.
Investment Valuation and Fair Value Measurements – For purposes of calculating the NAV, portfolio investments and other assets held by the Fund's portfolio for which market quotes are readily available are valued at market value. Market value is generally determined on the basis of last reported sales prices or official close price. If no sales are reported, market value is based on quotes obtained from a quotation reporting system, established market makers, or independent pricing services. If market prices are not readily available or are deemed unreliable, the Fund will use the fair value of the investment as determined in good faith under policies and procedures established by and under the supervision of the Company's Board of Directors. Market quotes are considered not readily available where there is an absence of current or reliable market-based data (e.g., trade information or indicative market quotes), including where events occur after the close of the relevant market, but prior to the NYSE Close, that materially affect the values of the Fund's portfolio investments or assets. In addition, market quotes are considered not readily available when, due to extraordinary circumstances, the exchanges or markets on which the investments trade do not open for trading for the entire day and no other market prices are available. There can be no assurance that the Fund could obtain the fair market value assigned to an investment if the Fund were to sell the investment at approximately the time at which the Fund determines its NAV.
Fixed income investments (other than short-term obligations), non-exchange traded derivatives and centrally cleared swaps held by the Fund are normally valued on the basis of quotes obtained from independent pricing services or brokers and dealers in accordance with procedures established by the Company's Board of Directors. Prices obtained from independent pricing services use information provided by market makers or estimates of market values through accepted market modeling, trading and pricing conventions. Inputs to the models may include, but are not limited to, prepayment speeds, pricing spread, yield, trade information, dealer quotes, market color, cash flow models and the investment’s terms and conditions. Generally, the Fund may use fair valuation in regard to fixed income investments when the Fund holds defaulted or distressed investments or investments in a company in which a reorganization is pending. Senior floating rate interests generally trade in over-the-counter (“OTC”) markets and are priced through an independent pricing service utilizing independent market quotations from loan dealers or financial institutions. A composite bid price is used, which
| 27 |
The Hartford World Bond Fund
Notes to Financial Statements – (continued)
October 31, 2014
(000’s Omitted)
is an average of the dealer marks and dealer runs. Short-term investments maturing in 60 days or less are generally valued at amortized cost, if their original term to maturity was 60 days or less, or by amortizing their value on the 61st day prior to maturity, if the original term to maturity exceeded 60 days, which approximates fair value.
Exchange traded options, futures and options on futures are valued at the settlement price or last trade price determined by the relevant exchange as of the NYSE Close. If the last trade price for exchange traded options does not fall between the bid and ask prices, the value will be the mean of the bid and ask prices as of the NYSE Close. If a last trade price is not available, the value will be the mean of the bid and ask prices as of the NYSE Close. If a mean of the bid and ask prices cannot be calculated for the day, the value will be the bid price as of the NYSE Close. In the case of OTC options and such instruments that do not trade on an exchange, values may be supplied by a pricing service using a formula or other objective method that may take into consideration the style, direction, expiration, strike price, notional value and volatility or other special adjustments.
Investments valued in currencies other than U.S. dollars are converted to U.S. dollars using exchange rates obtained from independent pricing services for calculation of the NAV. As a result, the NAV of the Fund’s shares may be affected by changes in the value of currencies in relation to the U.S. dollar. The value of investments traded in markets outside the United States or denominated in currencies other than the U.S. dollar may be affected significantly on a day that the NYSE is closed and the market value may change on days when an investor is not able to purchase, redeem or exchange shares of the Fund.
Foreign currency contracts represent agreements to exchange currencies on specific future dates at predetermined rates. Foreign currency contracts are valued using foreign currency exchange rates and forward rates as provided by an independent pricing service on the Valuation Date.
Financial instruments for which prices are not available from an independent pricing service may be valued using market quotations obtained from one or more dealers that make markets in the respective financial instrument in accordance with procedures established by the Company's Board of Directors.
U.S. GAAP defines fair value as the price that the Fund would receive to sell an asset or pay to transfer a liability in an orderly transaction between market participants. The U.S. GAAP fair value measurement standards require disclosure of a fair value hierarchy for each major category of assets and liabilities. Various inputs are used in determining the fair value of the Fund’s investments. These inputs are summarized into three broad hierarchy levels. This hierarchy is based on whether the valuation inputs are observable or unobservable. These levels are:
Level 1 – Quoted prices in active markets for identical investments. Level 1 may include exchange traded instruments, such as domestic equities, some foreign equities, options, futures, mutual funds, exchange traded funds, rights and warrants.
Level 2 – Observable inputs other than Level 1 prices, such as quoted prices for similar investments; quoted prices in markets that are not active; or other inputs that are observable or can be corroborated by observable market data. Level 2 may include debt investments that are traded less frequently than exchange traded instruments and which are valued using independent pricing services; foreign equities, which are principally traded on certain foreign markets and are adjusted daily pursuant to a fair value pricing service in order to reflect an adjustment for the factors occurring after the close of certain foreign markets but before the NYSE Close; senior floating rate interests, which are valued using an aggregate of dealer bids; short-term investments, which are valued at amortized cost; and swaps, which are valued based upon the terms of each swap contract.
Level 3 – Significant unobservable inputs that are supported by limited or no market activity. Level 3 may include financial instruments whose values are determined using indicative market quotes or require significant management judgment or estimation. These unobservable valuation inputs may include estimates for current yields, maturity/duration, prepayment speed, and indicative market quotes for comparable investments along with other assumptions relating to credit quality, collateral value, complexity of the investment structure, general market conditions and liquidity. This category may include investments where trading has been halted or there are certain restrictions on trading. While these investments are priced using unobservable inputs, the valuation of these investments reflects the best available data and management believes the prices are a reasonable representation of exit price.
| 28 |
The Hartford World Bond Fund
Notes to Financial Statements – (continued)
October 31, 2014
(000’s Omitted)
The Board of Directors of the Company generally reviews and approves the “Procedures for Valuation of Portfolio Securities” at least once a year. These procedures define how investments are to be valued, including the formation and activities of a Valuation Committee. The Valuation Committee is responsible for determining in good faith the fair value of investments when the value cannot be obtained from primary pricing services or alternative sources or if the valuation of an investment as provided by the primary pricing service or alternative source is believed not to reflect the investment’s fair value as of the Valuation Date. Voting members of the Valuation Committee include the Fund's Treasurer or designee and a Vice President of the investment manager or designee. An Assistant Vice President of the Fund with legal expertise or designee is also included on the Valuation Committee as a non-voting advisory member. In addition, the Fund’s Chief Compliance Officer shall designate a member of the compliance group to attend Valuation Committee meetings as a non-voting resource, to monitor for and provide guidance with respect to compliance with these procedures. Two members of the Valuation Committee or their designees, representing different departments, shall constitute a quorum for purposes of permitting the Valuation Committee to take action. The Valuation Committee will consider all relevant factors in determining an investment’s fair value, and may seek the advice of the Fund’s sub-adviser, knowledgeable brokers, and legal counsel in making such determination. The Valuation Committee reports to the Audit Committee of the Company's Board of Directors. The Audit Committee receives quarterly written reports which include details of all fair-valued investments, including the reason for the fair valuation, and an indication, when possible, of the accuracy of the valuation by disclosing the next available reliable public price quotation or the disposition price of such investments (the “look-back” test). The Board of Directors then must consider for ratification all of the fair value determinations made during the previous quarter.
Valuation levels are not necessarily indicative of the risk associated with investing in such investments. Individual investments within any of the above mentioned asset classes may be assigned a different hierarchical level than those presented above, as individual circumstances dictate.
For additional information, refer to the Investment Valuation Hierarchy Level Summary and the Level 3 roll-forward reconciliation, if applicable, which follow the Schedule of Investments.
Investment Transactions and Investment Income – Investment transactions are recorded as of the trade date (the date the order to buy or sell is executed) for financial reporting purposes. Investments purchased or sold on a when-issued or delayed-delivery basis may be settled a month or more after the trade date. Realized gains and losses are determined on the basis of identified cost.
Trade date for senior floating rate interests purchased in the primary loan market is considered the date on which the loan allocations are determined. Trade date for senior floating rate interests purchased in the secondary loan market is the date on which the transaction is entered into.
Dividend income from domestic securities is accrued on the ex-dividend date. Interest income, including amortization of premium, accretion of discounts and additional principal received in-kind in lieu of cash, is accrued on a daily basis. Paydown gains and losses on mortgage related and other asset backed securities are included in interest income in the Statement of Operations, as applicable.
Foreign Currency Transactions – Assets and liabilities denominated in currencies other than U.S. dollars are translated into U.S. dollars at the exchange rates in effect on the valuation date. Purchases and sales of investments, income and expenses are translated into U.S. dollars at the exchange rates on the dates of such transactions.
The Fund does not isolate that portion of portfolio investment valuation resulting from fluctuations in the foreign currency exchange rates from the fluctuations arising from changes in the market prices of investments held. Exchange rate fluctuations are included with the net realized and unrealized gain or loss on investments in the accompanying financial statements.
Net realized foreign exchange gains or losses arise from sales of foreign currencies and the difference between asset and liability amounts initially stated in foreign currencies and the U.S. dollar value of the amounts actually received or paid. Net unrealized foreign exchange gains or losses arise from changes in the value of other assets and liabilities at the end of the reporting period, resulting from changes in the exchange rates.
| 29 |
The Hartford World Bond Fund
Notes to Financial Statements – (continued)
October 31, 2014
(000’s Omitted)
Joint Trading Account – The Fund may invest cash balances into a joint trading account that may be invested in one or more repurchase agreements.
Fund Share Valuation and Dividend Distributions to Shareholders – Orders for the Fund’s shares are executed in accordance with the investment instructions of the shareholders. The NAV of the Fund’s shares is determined as of the close of business on each business day of the Exchange. The NAV is determined separately for each class of shares of the Fund by dividing the Fund’s net assets attributable to that class by the number of shares of the class outstanding. Each class of shares offered by the Fund has equal rights as to assets and voting privileges (except that shareholders of a class have exclusive voting rights regarding any matter relating solely to that class of shares). Income and non-class specific expenses are allocated daily to each class on the basis of the relative net assets of the class. Realized and unrealized gains and losses are allocated daily based on the relative net assets of each class of shares of the Fund.
Orders for the purchase of the Fund’s shares received prior to the close of the Exchange on any day the Exchange is open for business are priced at the NAV determined as of the close of the Exchange. Orders received after the close of the Exchange, or on a day on which the Exchange and/or the Fund is not open for business, are priced at the next determined NAV.
Dividends are declared pursuant to a policy adopted by the Company's Board of Directors based upon the investment performance of the Fund. Normally, dividends from net investment income are declared and paid monthly. Dividends from realized gains, if any, are paid at least once a year.
Net investment income, dividends and distributions from net realized gains and capital are determined in accordance with federal income tax regulations, which may differ from U.S. GAAP with respect to character and timing (see Federal Income Taxes: Distributions and Components of Distributable Earnings and Reclassification of Capital Accounts).
Securities and Other Investments:
Repurchase Agreements – A repurchase agreement is an agreement by which a counterparty agrees to sell an investment and agrees to repurchase the investment sold from the buyer at a mutually agreed upon time and price. During the period of the repurchase agreement, the counterparty will deposit cash and or securities in a third party custodial account to serve as collateral. At the time the Fund enters into a repurchase agreement, the value of the underlying collateral, including accrued interest, will be equal to or exceed the value of the repurchase agreement. Repurchase agreements expose the Fund to counterparty risk - that is, the risk that the counterparty will not fulfill its obligations. To minimize counterparty risk, the investments that serve to collateralize the repurchase agreement are held by the Fund’s custodian in book entry or physical form in the custodial account of the Fund or in a third party custodial account. Repurchase agreements are valued at cost plus accrued interest, which approximates fair value. Repurchase agreements have master netting arrangements which allow the Fund to offset amounts owed to a counterparty with amounts owed by the counterparty, including any collateral. Upon an event of default under a master repurchase agreement, the non-defaulting party may close out all transactions traded under such agreement and net amounts owed under each transaction to one net amount payable by one party to the other. Absent an event of default, the master repurchase agreement does not result in an offset of reported amounts of assets and liabilities in the Statement of Assets and Liabilities across transactions between the Fund and the applicable counterparty. The Fund, as shown on the Schedule of Investments, had outstanding repurchase agreements and related collateral as of October 31, 2014.
Illiquid and Restricted Investments – The Fund is permitted to invest up to 15% of its net assets in illiquid investments. Illiquid investments are those that may not be sold or disposed of in the ordinary course of business within seven days, at approximately the price used to determine the Fund’s NAV. The Fund may not be able to sell illiquid investments when its sub-adviser considers it desirable to do so or may have to sell such investments at a price that is lower than the price that could be obtained if the investments were more liquid. A sale of illiquid investments may require more time and may result in higher dealer discounts and other selling expenses than does the sale of those that are liquid. Illiquid investments also may be more difficult to value due to the unavailability of reliable market quotations for such investments, and an investment in them may have an adverse impact on the Fund’s NAV. The Fund may also purchase certain restricted investments that can only be resold to certain qualified investors and may be determined to be liquid pursuant to policies and guidelines established by the Company's Board of Directors. The Fund, as shown on the Schedule of Investments, had illiquid or restricted investments as of October 31, 2014.
| 30 |
The Hartford World Bond Fund
Notes to Financial Statements – (continued)
October 31, 2014
(000’s Omitted)
Investments Purchased on a When-Issued or Delayed-Delivery Basis – Delivery and payment for investments that have been purchased by the Fund on a forward commitment, or when-issued or delayed-delivery basis, take place beyond the customary settlement period. The Fund may dispose of or renegotiate a delayed-delivery transaction after it is entered into, and may sell delayed-delivery investments before they are delivered, which may result in a realized gain or loss. During this period, such investments are subject to market fluctuations, and the Fund identifies investments segregated in its records with a value at least equal to the amount of the commitment. The Fund, as shown on the Schedule of Investments, had when-issued or delayed-delivery investments as of October 31, 2014.
In connection with the Fund’s ability to purchase investments on a when-issued or forward commitment basis, the Fund may enter into to-be announced (“TBA”) commitments. TBA commitments are forward agreements for the purchase or sale of mortgage backed securities for a fixed price, with payment and delivery on an agreed-upon future settlement date. The specific securities to be delivered are not identified at the trade date; however, delivered securities must meet specified terms, including issuer, rate and mortgage terms. Although the Fund may enter into TBA commitments with the intention of acquiring or delivering securities for its portfolio, the Fund can extend the settlement date, roll the transaction, or dispose of a commitment prior to settlement if deemed appropriate to do so. If the TBA commitment is closed through the acquisition of an offsetting TBA commitment, the Fund realizes a gain or loss. In a TBA roll transaction, the Fund generally purchases or sells the initial TBA commitment prior to the agreed upon settlement date and enters into a new TBA commitment for future delivery or receipt of the mortgage backed securities. TBA commitments involve a risk of loss if the value of the security to be purchased or sold declines or increases, respectively, prior to settlement date.
The Fund may enter into “dollar rolls” in which the Fund sells securities and contracts with the same counterparty to repurchase substantially similar securities (for example, same issuer, coupon and maturity) on a specified future date at an agreed upon price. The Fund gives up the right to receive interest paid on the investments sold. The Fund would benefit to the extent of any differences between the price received for the security and the lower forward price for the future purchase. Dollar rolls involve the risk that the market value of the securities that the Fund is required to purchase may decline below the agreed upon repurchase price of those securities. The Fund records dollar roll transactions as purchases and sales and realizes gains and losses on these transactions. These transactions are excluded from the Fund’s portfolio turnover rate. The Fund had no open TBA commitments or dollar rolls as of October 31, 2014.
Senior Floating Rate Interests – The Fund may invest in senior floating rate interests. Senior floating rate interests hold the most senior position in the capital structure of a business entity (the “Borrower”), are typically secured by specific collateral and have a claim on the assets and/or stock of the Borrower that is senior to the assets held by subordinated debtholders and stockholders of the Borrower. Senior floating rate interests are typically structured and administered by a financial institution that acts as the agent of the lenders participating in the senior floating rate interest. The Fund may invest in multiple series or tranches of a senior floating rate interest, which may have varying terms and carry different associated risks. The Fund may also enter into unfunded loan commitments, which are contractual obligations for future funding. Unfunded loan commitments may include revolving credit facilities, which may obligate the Fund to supply additional cash to the borrower on demand, representing a potential financial obligation by the Fund in the future. The Fund may receive a commitment fee based on the undrawn portion of the underlying line of credit portion of a senior floating rate interest. In certain circumstances, the Fund may receive various fees upon the restructure of a senior floating rate interest by a borrower. Fees earned/paid are recorded as a component of income or realized gain/loss in the Statement of Operations.
Senior floating rate interests are typically rated below-investment-grade, which suggests the risk of default is higher, and generally pay higher interest rates than investment-grade debt securities. A default could lead to non-payment of income or principal, which would result in a reduction of investment income to the Fund, and there can be no assurance that the liquidation of any collateral would satisfy the Borrower’s obligation in the event of non-payment of scheduled interest or principal payments, or that such collateral could be readily liquidated. The Fund, as shown on the Schedule of Investments, had senior floating rate interests as of October 31, 2014.
Mortgage Related and Other Asset Backed Securities – The Fund may invest in mortgage related and other asset backed securities. These securities include mortgage pass-through securities, collateralized mortgage obligations, commercial mortgage backed securities, stripped mortgage backed securities, asset backed securities, collateralized debt obligations and other securities that directly or indirectly represent a participation in, or are secured by and payable from, mortgage loans on real property. Mortgage
| 31 |
The Hartford World Bond Fund
Notes to Financial Statements – (continued)
October 31, 2014
(000’s Omitted)
related securities are created from pools of residential or commercial mortgage loans, including mortgage loans made by savings and loan institutions, mortgage bankers, commercial banks and other similar financial institutions. Asset backed securities are created from many types of assets, including auto loans, credit card receivables, home equity loans, and student loans. These securities provide a monthly payment that consists of both interest and principal payments. Interest payments may be determined by fixed or adjustable rates. The rate of pre-payments on underlying mortgages will affect the price and volatility of a mortgage related security, and may have the effect of shortening or extending the effective duration of the security relative to what was anticipated at the time of purchase. The timely payment of principal and interest of certain mortgage related securities is guaranteed by the full faith and credit of the United States Government. Mortgage related and other asset backed securities created and guaranteed by non-governmental issuers, including government-sponsored corporations, may be supported by various forms of insurance or guarantees, but there can be no assurance that the private insurers or guarantors can meet their obligations under the insurance policies or guarantee arrangements. The Fund, as shown on the Schedule of Investments, had outstanding mortgage related and other asset backed securities as of October 31, 2014.
Inflation Indexed Bonds – The Fund may invest in inflation indexed bonds. Inflation indexed bonds are fixed income investments whose principal value is periodically adjusted to the rate of inflation. The interest rate on these bonds is generally fixed at issuance at a rate lower than typical bonds. Over the life of an inflation indexed bond, however, interest will be paid based on a principal value, which is adjusted for inflation. Any increase or decrease in the principal amount of an inflation indexed bond will be included as interest income on the Statement of Operations, even though investors do not receive the principal amount until maturity. The Fund had no inflation indexed bonds as of October 31, 2014.
Financial Derivative Instruments:
The following disclosures contain information on how and why the Fund uses derivative instruments, the credit-risk-related contingent features in certain derivative instruments and how derivative instruments affect the Fund’s financial position and results of operations. The location and fair value amounts of these instruments on the Statement of Assets and Liabilities and the realized gains and losses and changes in unrealized gains and losses on the Statement of Operations, each categorized by type of derivative contract, are included in the following Additional Derivative Instrument Information footnote. The derivative instruments outstanding as of year-end are disclosed in the notes to the Schedule of Investments, if applicable. The amounts of realized gains and losses and changes in unrealized gains and losses on derivative instruments during the year are disclosed in the Statement of Operations.
Foreign Currency Contracts – The Fund may enter into foreign currency contracts that obligate the Fund to purchase or sell currencies at specified future dates. Foreign currency contracts are used to hedge the currency exposure associated with some or all of the Fund’s investments and/or as part of an investment strategy. Foreign currency contracts are marked to market daily and the change in value is recorded by the Fund as an unrealized gain or loss. The Fund will record a realized gain or loss when the foreign currency contract is settled.
Foreign currency contracts involve elements of market risk in excess of the amounts reflected in the Statement of Assets and Liabilities. In addition, risks may arise upon entering into these contracts from the potential inability of the counterparties to meet the terms of the contracts and from unanticipated movements in the value of the foreign currencies relative to the U.S. dollar. The Fund, as shown on the Schedule of Investments, had outstanding foreign currency contracts as of October 31, 2014.
Futures Contracts – The Fund may enter into futures contracts. A futures contract is an agreement between two parties to buy or sell an asset at a set price on a future date. The Fund uses futures contracts to manage or obtain exposure to the investment markets, commodities, or movements in interest rates and currency values. The primary risks associated with the use of futures contracts are the imperfect correlation between the change in market value of the investments held by the Fund and the prices of futures contracts and the possibility of an illiquid market. Upon entering into a futures contract, the Fund is required to deposit with a futures commission merchant (“FCM”) an amount of cash or U.S. Government or Agency Obligations in accordance with the initial margin requirements of the broker or exchange. Futures contracts are marked to market daily at the most recent settlement price reported by an exchange on which, over time, they are traded most extensively, and an appropriate payable or receivable for the change in value (“variation margin”) is recorded by the Fund. Gains or losses are recognized but not considered realized until the contracts expire or are closed. Futures contracts involve, to varying degrees, risk of loss in excess of the variation margin disclosed on the Statement of
| 32 |
The Hartford World Bond Fund
Notes to Financial Statements – (continued)
October 31, 2014
(000’s Omitted)
Assets and Liabilities; however, the Fund seeks to reduce this risk through the use of an FCM. The Fund, as shown on the Schedule of Investments, had outstanding futures contracts as of October 31, 2014.
Options Contracts – An option contract is a contract sold by one party to another party that offers the buyer the right, but not the obligation, to buy (call) or sell (put) an investment or other financial asset at an agreed-upon price during a specific period of time or on a specific date. Options contracts are either privately negotiated in the over-the-counter market ("OTC options") or executed in a registered exchange ("exchange traded options"). The Fund may write (sell) covered call and put options on futures, swaps (“swaptions”), securities, commodities or currencies. “Covered” means that so long as the Fund is obligated as the writer of an option, it will own either the underlying investments or currency or an option to purchase the same underlying investments or currency having an expiration date of the covered option and an exercise price equal to or less than the exercise price of the covered option, or will pledge cash or other liquid investments having a value equal to or greater than the fluctuating market value of the option investment or currency. Writing put options increases the Fund’s exposure to the underlying instrument. Writing call options decreases the Fund’s exposure to the underlying instrument. Premiums received from writing options that expire are treated as realized gains. Premiums received from writing options that are exercised or closed are added to the proceeds or offset amounts paid on the underlying futures, swap, investment or currency transaction to determine the realized gain or loss. The Fund as a writer of an option has no control over whether the underlying instrument may be sold (call) or purchased (put) and as a result bears the market risk of an unfavorable change in the price of the instrument underlying the written option. There is the risk the Fund may not be able to enter into a closing transaction because of an illiquid market. The Fund may also purchase put and call options. Purchasing call options increases the Fund’s exposure to the underlying instrument. Purchasing put options decreases the Fund’s exposure to the underlying instrument. The Fund pays a premium, which is included on the Fund’s Statement of Assets and Liabilities as an investment and is subsequently marked to market to reflect the current value of the option. Premiums paid for purchasing options that expire are treated as realized losses. Certain options may be purchased with premiums to be determined on a future date. The premiums for these options are based upon implied volatility parameters at specified terms. The risk associated with purchasing put and call options is generally limited to the premium paid. Premiums paid for purchasing options that are exercised or closed are added to the amounts paid or offset against the proceeds on the underlying investment transaction to determine the realized gain or loss. Entering into over-the-counter options also exposes the Fund to counterparty risk. Counterparty risk is the possibility that the counterparty to the agreements may default on its obligation to perform or disagree as to the meaning of the contractual terms in the agreements.
The Fund, as shown on the Schedule of Investments, had outstanding purchased and written option contracts as of October 31, 2014. Transactions involving written option contracts during the year ended October 31, 2014, are summarized below:
| Options Contract Activity During the Year Ended October 31, 2014: | ||||||||
| Call Options Written During the Year | Number of Contracts* | Premium Amounts | ||||||
| Beginning of the period | 12,045,000 | $ | 267 | |||||
| Written | 149,775,486 | 242 | ||||||
| Expired | (12,045,000 | ) | (267 | ) | ||||
| Closed | (59,650,486 | ) | (152 | ) | ||||
| Exercised | — | — | ||||||
| End of period | 90,125,000 | $ | 90 | |||||
| Put Options Written During the Year | Number of Contracts* | Premium Amounts | ||||||
| Beginning of the period | 1,628 | $ | 108 | |||||
| Written | — | — | ||||||
| Expired | (1,628 | ) | (108 | ) | ||||
| Closed | — | — | ||||||
| Exercised | — | — | ||||||
| End of period | — | $ | — | |||||
* The number of contracts does not omit 000's.
Swap Contracts – The Fund may invest in swap contracts. Swap contracts are agreements to exchange or swap investment cash flows, assets, foreign currencies or market-linked returns at specified, future intervals. Swap contracts are either privately negotiated in the over-the-counter market (“OTC swaps”) or cleared in a central clearing house (“centrally cleared swaps”). The Fund may enter into credit default, total return, cross-currency, interest rate, inflation and other forms of swap contracts to manage its exposure to credit, currency, interest rate, commodity and inflation risk. Swap contracts are also used to gain exposure to certain markets. In
| 33 |
The Hartford World Bond Fund
Notes to Financial Statements – (continued)
October 31, 2014
(000’s Omitted)
connection with these contracts, investments or cash may be identified as collateral or margin in accordance with the terms of the respective swap contracts and/or master netting arrangement to provide assets of value and recourse in the event of default or bankruptcy/insolvency.
Swaps are valued based on custom valuations furnished by an independent pricing service. Swaps for which prices are not available from an independent pricing service are valued in accordance with procedures established by the Company's Board of Directors. Changes in market value, if any, are reflected as a component of net changes in unrealized appreciation or depreciation on the Statement of Operations. Daily changes in valuation of centrally cleared swaps, if any, are recorded as a receivable or payable for the change in value (“variation margin”) on the Statement of Assets and Liabilities. Realized gains or losses on centrally cleared swaps are recorded upon the termination of the swap. OTC swap payments received or paid at the beginning of the measurement period are reflected as such on the Statement of Assets and Liabilities and represent premiums paid or received upon entering into the swap contract to compensate for differences between the stated terms of the swap contract and prevailing market conditions (credit spreads, currency exchange rates, interest rates and other relevant factors). These upfront premiums are recorded as realized gains or losses on the Statement of Operations upon termination or maturity of the swap. A liquidation payment received or made at the termination or maturity of the swap is recorded as a realized gain or loss on the Statement of Operations. Net periodic payments received or paid by the Fund are included as part of realized gains or losses on the Statement of Operations.
Entering into these contracts involves, to varying degrees, elements of liquidation, counterparty, credit and market risk in excess of the amounts recognized on the Statement of Assets and Liabilities. Such risks involve the possibility that there will be no liquid market for these contracts, that the counterparty to the contracts may default on its obligation to perform or disagree as to the meaning of contractual terms in the contracts, and that there may be unfavorable changes in market conditions (credit spreads, currency exchange rates, interest rates and other relevant factors).
The Fund’s maximum risk of loss from counterparty risk for OTC swaps is the net value of the discounted cash flows to be received from the counterparty over the contract’s remaining life, and current market value, to the extent that amount is positive. The risk is mitigated by having a master netting arrangement between the Fund and the counterparty, which allows for the netting of payments made or received (although such amounts are presented on a gross basis within the Statement of Assets and Liabilities, as applicable) as well as the posting of collateral to the Fund to cover the Fund’s exposure to the counterparty. In a centrally cleared swap, while the Fund enters into an agreement with a clearing broker to execute contracts with a counterparty, the performance of the swap is guaranteed by the central clearinghouse, which reduces the Fund’s exposure to counterparty risk. The Fund is still exposed to the counterparty risk through the clearing broker and clearinghouse. The clearinghouse attempts to minimize this risk to its participants through the use of mandatory margin requirements, daily cash settlements and other procedures. Likewise, the clearing broker reduces its risk through margin requirements and required segregation of customer balances.
Credit Default Swap Contracts – The credit default swap market allows the Fund to manage its exposure to the market or certain sectors of the market, to reduce its risk exposure to defaults of corporate and sovereign issuers, or to create exposure to corporate or sovereign issuers to which it is not otherwise exposed. Certain credit default swaps involve the exchange of a fixed rate premium for protection against the loss in value of an underlying investment or index in the event of a credit event, such as payment default or bankruptcy.
Under a credit default swap contract, one party acts as guarantor by receiving the fixed periodic payment in exchange for the commitment to purchase the underlying investment at par if the defined credit event occurs. Upon the occurrence of a defined credit event, the difference between the value of the reference obligation and the swap’s notional amount is recorded as realized gain or loss on swap transactions in the Statement of Operations. A “buyer” of credit protection agrees to pay a counterparty to assume the credit risk of an issuer upon the occurrence of certain events. The “seller” of the protection receives periodic payments and agrees to assume the credit risk of an issuer upon the occurrence of certain events. Although specified events are contract specific, credit events are generally defined as bankruptcy, failure to pay, restructuring, obligation acceleration, obligation default or repudiation/moratorium. A “seller’s” exposure is limited to the total notional amount of the credit default swap contract. These potential amounts would be partially offset by any recovery values of the respective referenced obligations or upfront payments received upon entering into the contract.
| 34 |
The Hartford World Bond Fund
Notes to Financial Statements – (continued)
October 31, 2014
(000’s Omitted)
Implied credit spreads, represented in absolute terms, utilized in determining the market value of credit default swap contracts on corporate issues, sovereign government issues or U.S. municipal issues as of year-end are disclosed in the notes to the Schedule of Investments, as applicable, and serve as an indicator of the current status of the payment/performance risk and represent the likelihood or risk of default for the credit derivative. The implied credit spread of a particular referenced entity reflects the cost of buying/selling protection and there may also be upfront payments required to be made to enter into the contract. Wider credit spreads represent a deterioration of the referenced entity’s credit soundness and a greater likelihood or risk of default or other credit event occurring as defined under the terms of the contract. For credit default swap contracts on credit indices, the quoted market prices and resulting values serve as the indicator of the current status of the payment/performance risk. Increasing market values, in absolute terms when compared to the notional amount of the swap, represent a deterioration of the referenced equity’s credit soundness and a greater likelihood or risk of default or other credit event occurring as defined under the terms of the contract. The Fund, as shown on the Schedule of Investments, had outstanding credit default swap contracts as of October 31, 2014.
Interest Rate Swap Contracts – The Fund is subject to interest rate risk exposure in the normal course of pursuing its investment objectives. Because the Fund holds fixed rate bonds, the value of these bonds may decrease if interest rates rise. To hedge against this risk and to maintain its ability to generate income at prevailing market rates, the Fund may enter into interest rate swap contracts. In a typical interest rate swap, one party agrees to make regular payments equal to a floating interest rate, based on a specified interest rate or benchmark (e.g. London Interbank Offered Rate (“LIBOR”)), multiplied by a notional amount, in return for payments equal to a fixed rate multiplied by the same amount, for a specific period of time. The net interest received or paid on interest rate swap contracts is recorded as a realized gain or loss. Interest rate swaps are marked to market daily and the change, if any, is recorded as an unrealized gain or loss in the Statement of Operations. When the interest rate swap contract is terminated early, the Fund records a realized gain or loss equal to the difference between the current market value and the upfront premium or cost.
If an interest rate swap contract provides for payments in different currencies, the parties might agree to exchange the notional amount as well. Interest rate swaps may also depend on other prices or rates, such as the value of an index. The risks of interest rate swaps include changes in market conditions which will affect the value of the contract or the cash flows and the possible inability of the counterparty to fulfill its obligations under the contract. The Fund’s maximum risk of loss from counterparty credit risk is the discounted net value of the cash flows to be received from the counterparty over the contract’s remaining life, to the extent that amount is positive. The Fund, as shown on the Schedule of Investments, had outstanding interest rate swap contracts as of October 31, 2014.
Additional Derivative Instrument Information:
Fair Value of Derivative Instruments on the Statement of Assets and Liabilities as of October 31, 2014:
| Risk Exposure Category | ||||||||||||||||||||||||||||
Interest Rate | Foreign | Credit | Equity | Commodity | Other | Total | ||||||||||||||||||||||
| Assets: | ||||||||||||||||||||||||||||
| Investments in securities, at value (purchased option contracts), market value | $ | — | $ | 1,878 | $ | 25 | $ | — | $ | — | $ | — | $ | 1,903 | ||||||||||||||
| Unrealized appreciation on foreign currency contracts | — | 21,450 | — | — | — | — | 21,450 | |||||||||||||||||||||
| Unrealized appreciation on OTC swap contracts | 1,607 | — | 1,374 | — | — | — | 2,981 | |||||||||||||||||||||
| Variation margin receivable * | 1,564 | — | — | — | — | — | 1,564 | |||||||||||||||||||||
| Total | $ | 3,171 | $ | 23,328 | $ | 1,399 | $ | — | $ | — | $ | — | $ | 27,898 | ||||||||||||||
| Liabilities: | ||||||||||||||||||||||||||||
| Unrealized depreciation on foreign currency contracts | $ | — | $ | 11,474 | $ | — | $ | — | $ | — | $ | — | $ | 11,474 | ||||||||||||||
| Unrealized depreciation on OTC swap contracts | 3 | — | 762 | — | — | — | 765 | |||||||||||||||||||||
| Variation margin payable * | 2,741 | — | 4 | — | — | — | 2,745 | |||||||||||||||||||||
| Written option contracts, market value | — | — | 123 | — | — | — | 123 | |||||||||||||||||||||
| Total | $ | 2,744 | $ | 11,474 | $ | 889 | $ | — | $ | — | $ | — | $ | 15,107 | ||||||||||||||
* Only current day's variation margin is reported within the Statement of Assets and Liabilities. The variation margin is included in the open futures net cumulative depreciation of $(5,484) and open centrally cleared swaps net cumulative appreciation of $587 as reported in the Schedule of Investments.
| 35 |
The Hartford World Bond Fund
Notes to Financial Statements – (continued)
October 31, 2014
(000’s Omitted)
The volume of derivatives that is presented in the Schedule of Investments is consistent with the derivative activity during the year ended October 31, 2014.
The Effect of Derivative Instruments on the Statement of Operations for the year ended October 31, 2014:
| Risk Exposure Category | ||||||||||||||||||||||||||||
Interest Rate Contracts | Foreign | Credit | Equity | Commodity | Other | Total | ||||||||||||||||||||||
| Realized Gain (Loss) on Derivatives Recognized as a Result of Operations: | ||||||||||||||||||||||||||||
| Net realized gain (loss) on purchased option contracts | $ | (480 | ) | $ | (1,641 | ) | $ | 61 | $ | — | $ | — | $ | — | $ | (2,060 | ) | |||||||||||
| Net realized gain (loss) on futures contracts | (6,613 | ) | 1,880 | — | — | — | — | (4,733 | ) | |||||||||||||||||||
| Net realized gain on written option contracts | 163 | 267 | 47 | — | — | — | 477 | |||||||||||||||||||||
| Net realized loss on swap contracts | (2,201 | ) | — | (1,266 | ) | — | — | — | (3,467 | ) | ||||||||||||||||||
| Net realized gain on foreign currency contracts | — | 105,825 | — | — | — | — | 105,825 | |||||||||||||||||||||
| Total | $ | (9,131 | ) | $ | 106,331 | $ | (1,158 | ) | $ | — | $ | — | $ | — | $ | 96,042 | ||||||||||||
| Net Change in Unrealized Appreciation (Depreciation) on Derivatives Recognized as a Result of Operations: | ||||||||||||||||||||||||||||
| Net change in unrealized appreciation (depreciation) of purchased option contracts | $ | (43 | ) | $ | 398 | $ | (51 | ) | $ | — | $ | — | $ | — | $ | 304 | ||||||||||||
| Net change in unrealized depreciation of futures contracts | (938 | ) | — | — | — | — | — | (938 | ) | |||||||||||||||||||
| Net change in unrealized appreciation (depreciation) of written option contracts | 44 | (215 | ) | (33 | ) | — | — | — | (204 | ) | ||||||||||||||||||
| Net change in unrealized appreciation of swap contracts | 3,335 | — | 1,128 | — | — | — | 4,463 | |||||||||||||||||||||
| Net change in unrealized depreciation of foreign currency contracts | — | (5,703 | ) | — | — | — | — | (5,703 | ) | |||||||||||||||||||
| Total | $ | 2,398 | $ | (5,520 | ) | $ | 1,044 | $ | — | $ | — | $ | — | $ | (2,078 | ) | ||||||||||||
Balance Sheet Offsetting Information - The following discloses both gross information and net information about instruments and transactions eligible for offset in the financial statements, and instruments and transactions that are subject to a master netting arrangement, as well as amounts related to margin, reflected as financial collateral (including cash collateral), held at clearing brokers, counterparties and the Fund’s custodian. The master netting arrangements allow the clearing brokers to net any collateral held in or on behalf of the Fund, or liabilities or payment obligations of the clearing brokers to the Fund, against any liabilities or payment obligations of the Fund to the clearing brokers. The Fund is required to deposit financial collateral (including cash collateral) at the FCM's custodian on behalf of clearing brokers and counterparties to continually meet the original and maintenance requirements established by the clearing brokers and counterparties. Such requirements are specific to the respective clearing broker or counterparty. Certain master netting arrangements may not be enforceable in the bankruptcy proceedings of a counterparty.
Offsetting of Financial Assets and Derivative Assets as of October 31, 2014:
Gross Amounts* | Financial | Non-cash | Cash Collateral | Net Amount (not | ||||||||||||||||
| Description | ||||||||||||||||||||
| OTC purchased option and OTC swap contracts at market value | $ | 7,486 | $ | (2,909 | ) | $ | (1,151 | ) | $ | (1,035 | ) | $ | 2,391 | |||||||
| Futures contracts - variation margin receivable | 1,564 | (1,564 | ) | — | — | — | ||||||||||||||
| Unrealized appreciation on foreign currency contracts | 21,450 | (7,244 | ) | — | — | 14,206 | ||||||||||||||
| Total subject to a master netting or similar arrangement | $ | 30,500 | $ | (11,717 | ) | $ | (1,151 | ) | $ | (1,035 | ) | $ | 16,597 | |||||||
* Gross amounts are presented here as there are no amounts that are netted within the Statement of Assets and Liabilities.
| 36 |
The Hartford World Bond Fund
Notes to Financial Statements – (continued)
October 31, 2014
(000’s Omitted)
Offsetting of Financial Liabilities and Derivative Liabilities as of October 31, 2014:
Gross Amounts* | Financial | Non-cash | Cash Collateral | Net Amount (not | ||||||||||||||||
| Description | ||||||||||||||||||||
| OTC written option and OTC swap contracts at market value | $ | 4,906 | $ | (2,909 | ) | $ | — | $ | (1,741 | ) | $ | 256 | ||||||||
| Futures contracts - variation margin payable | 2,077 | (1,564 | ) | — | (15,146 | ) | — | |||||||||||||
| Swaps contracts - variation margin payable | 668 | — | — | (11,629 | ) | — | ||||||||||||||
| Unrealized depreciation on foreign currency contracts | 11,474 | (7,244 | ) | — | — | 4,230 | ||||||||||||||
| Total subject to a master netting or similar arrangement | $ | 19,125 | $ | (11,717 | ) | $ | — | $ | (28,516 | ) | $ | 4,486 | ||||||||
* Gross amounts are presented here as there are no amounts that are netted within the Statement of Assets and Liabilities.
Certain derivatives held by the Fund, as of October 31, 2014, are not subject to a master netting arrangement and are excluded from the table above.
Principal Risks:
Credit risk depends largely on the perceived financial health of bond issuers. In general, the credit rating is inversely related to the credit risk of the issuer. Higher rated bonds generally are deemed to have less credit risk, while lower or unrated bonds are deemed to have higher risk of default. The share price, yield and total return of a fund that holds securities with higher credit risk may be more volatile than those of a fund that holds bonds with lower credit risk. Similar to credit risk, the Fund may be exposed to counterparty risk, or the risk that an institution or other entity with which the Fund has unsettled or open transactions will default.
The Fund’s investments expose the Fund to various risks including, but not limited to, interest rate, prepayment, extension, foreign currency and equity risks. Interest rate risk is the risk that fixed income securities will decline in value because of changes in interest rates. As nominal interest rates rise, the values of certain fixed income securities held by the Fund are likely to decrease. A nominal interest rate can be described as the sum of a real interest rate and an expected inflation rate. Fixed income securities with longer durations tend to be more sensitive to changes in interest rates, usually making them more volatile than securities with shorter durations. Duration is useful primarily as a measure of the sensitivity of a fixed income security’s market price to interest rate (i.e., yield) movements. Senior floating rate interests and securities subject to prepayment and extension risk generally offer less potential for gains when interest rates decline. Rising interest rates may cause prepayments to occur at a slower than expected rate, thereby effectively lengthening the maturity of the security and making the security more sensitive to interest rate changes. Prepayment and extension risk are major risks of mortgage backed securities, senior floating rate interests and certain asset backed securities. For certain asset backed securities, the actual maturity may be less than the stated maturity shown in the Schedule of Investments, if applicable. As a result, the timing of income recognition relating to these securities may vary based upon the actual maturity.
If the Fund invests directly in foreign currencies or in securities that trade in, and receive revenues in, foreign currencies, or in derivatives that provide exposure to foreign currencies, it will be subject to the risk that those currencies will decline in value relative to the base currency (U.S. dollars) of the Fund, or, in the case of hedging positions, that the Fund’s base currency will decline in value relative to the currency being hedged. Currency rates in foreign countries may fluctuate significantly over short periods of time for a number of reasons, including changes in interest rates, intervention (or the failure to intervene) by U.S. or foreign governments, central banks or supranational entities, such as the International Monetary Fund, or by the imposition of currency controls or other political developments in the United States or abroad. As a result, the Fund’s investments in foreign currency denominated securities may reduce the returns of the Fund. The market values of equity securities, such as common stocks and preferred stocks, or equity related investments, such as futures and options, may decline due to general market conditions which are not specifically related to a particular company, such as real or perceived adverse economic conditions, changes in the general outlook for corporate earnings, changes in interest or currency rates or adverse investor sentiment generally. The market value of equity securities may also decline due to factors which affect a particular industry or industries, such as labor shortages or increased production costs and competitive conditions within an industry. Equity securities and equity related investments generally have greater market price volatility than fixed income securities.
| 37 |
The Hartford World Bond Fund
Notes to Financial Statements – (continued)
October 31, 2014
(000’s Omitted)
Federal Income Taxes:
Federal Income Taxes – For federal income tax purposes, the Fund intends to continue to qualify as a Regulated Investment Company ("RIC") under Subchapter M of the Internal Revenue Code (“IRC”) by distributing substantially all of its taxable net investment income and net realized capital gains to its shareholders and otherwise complying with the requirements of the IRC. The Fund has distributed substantially all of its income and capital gains in prior years, if applicable, and intends to distribute substantially all of its income and capital gains during the calendar year ending December 31, 2014. Accordingly, no provision for federal income or excise taxes has been made in the accompanying financial statements. Distributions from short-term capital gains are treated as ordinary income distributions for federal income tax purposes.
Net Investment Income (Loss), Net Realized Gains (Losses) and Distributions – Net investment income (loss) and net realized gains (losses) may differ for financial statement and tax purposes primarily because of losses deferred due to wash sale adjustments, foreign currency gains and losses, adjustments related to Passive Foreign Investment Companies ("PFICs"), Real Estate Investment Trusts ("REITs"), RICs, certain derivatives and partnerships. The character of distributions made during the year from net investment income or net realized gains may differ from their ultimate characterization for federal income tax purposes. Also, due to the timing of dividend distributions, the fiscal year in which amounts are distributed may differ from the year that the income or realized gains (losses) were recorded by the Fund.
Distributions and Components of Distributable Earnings – The tax character of distributions paid by the Fund for the periods indicated is as follows (as adjusted for dividends payable, if applicable):
| For the Year Ended October 31, 2014 | For the Year Ended October 31, 2013 | |||||||
| Ordinary Income | $ | 31,704 | $ | 31,789 | ||||
| Long-Term Capital Gains ‡ | 5,557 | 3,773 | ||||||
| ‡ | The Fund designates these distributions as long-term capital gain dividends pursuant to IRC Sec. 852(b)(3)(C). |
As of October 31, 2014, the Fund’s components of distributable earnings (deficit) on a tax basis are as follows:
| Amount | ||||
| Undistributed Ordinary Income | $ | 86,661 | ||
| Accumulated Capital and Other Losses* | (4,320 | ) | ||
| Unrealized Depreciation† | (52,222 | ) | ||
| Total Accumulated Earnings | $ | 30,119 | ||
| * | The Fund has capital loss carryforwards that are identified in the Capital Loss Carryforward note that follows. |
| † | Differences between book-basis and tax-basis unrealized appreciation (depreciation) may be attributable to the losses deferred due to wash sale adjustments, foreign currency gains and losses, adjustments related to PFICs, REITs, RICs, certain derivatives and partnerships. |
Reclassification of Capital Accounts – The Fund may record reclassifications in its capital accounts. These reclassifications have no impact on the total net assets of the Fund. The reclassifications are a result of permanent differences between U.S. GAAP and tax accounting for such items as foreign currency, PFICs, expiration or utilization of capital loss carryforwards or net operating losses. Adjustments are made to reflect the impact these items have on current and future distributions to shareholders. Therefore, the source of the Fund’s distributions may be shown in the accompanying Statement of Changes in Net Assets as from undistributed net investment income, from accumulated net realized gains on investments or from capital depending on the type of book and tax differences that exist. For the year ended October 31, 2014, the Fund recorded reclassifications to increase (decrease) the accounts listed below:
| Amount | ||||
| Undistributed Net Investment Income (Loss) | $ | 74,587 | ||
| Accumulated Net Realized Gain (Loss) | (74,587 | ) | ||
| 38 |
The Hartford World Bond Fund
Notes to Financial Statements – (continued)
October 31, 2014
(000’s Omitted)
Capital Loss Carryforward – On December 22, 2010, the Regulated Investment Company Modernization Act of 2010 (the “Act”) was enacted, which made changes to the capital loss carryforward rules. The changes are effective for taxable years beginning after the date of enactment. Under the Act, funds are permitted to carry forward capital losses for an unlimited period. Additionally, capital loss carryforwards retain their character as either short-term or long-term capital losses rather than being considered all short-term as permitted under prior regulation.
At October 31, 2014 (tax year end), the Fund had capital loss carryforwards for U.S. federal income tax purposes as follows:
| Amount | ||||
| Long-Term Capital Loss Carryforward | $ | 4,320 | ||
| Total | $ | 4,320 | ||
Accounting for Uncertainty in Income Taxes – The Fund has adopted financial reporting rules that require the Fund to analyze all open tax years, as defined by the statute of limitations, for all major jurisdictions. Generally, tax authorities can examine all tax returns filed for the last three years. The Fund does not have an examination in progress.
The Fund has reviewed all open tax years and major jurisdictions and concluded that these financial reporting rules had no effect on the Fund’s financial position or results of operations. There is no tax liability resulting from unrecognized tax benefits relating to uncertain income tax positions taken or expected to be taken on the tax return for the fiscal year ended October 31, 2014. The Fund is also not aware of any tax positions for which it is reasonably possible that the total amounts of unrecognized tax benefits will significantly change in the next twelve months.
Expenses:
Investment Management Agreement – Hartford Funds Management Company, LLC ("HFMC") serves as the Fund’s investment manager pursuant to an Investment Management Agreement with the Company. HFMC is an indirect wholly owned subsidiary of The Hartford Financial Services Group, Inc. ("The Hartford"). The investment manager has overall investment supervisory responsibility for the Fund. In addition, the investment manager provides administrative personnel, services, equipment, facilities and office space for proper operation of the Fund. HFMC has contracted with Wellington Management Company, LLP ("Wellington Management") under a sub-advisory agreement for the provision of day-to-day investment management services to the Fund in accordance with the Fund’s investment objective and policies. The Fund pays a fee to the investment manager, a portion of which may be used to compensate Wellington Management.
The schedule below reflects the rates of compensation paid to the investment manager for investment management services rendered as of October 31, 2014; the rates are accrued daily and paid monthly:
| Average Daily Net Assets | Annual Fee |
| On first $250 million | 0.7000% |
| On next $250 million | 0.6500% |
| On next $4.5 billion | 0.6000% |
| On next $5 billion | 0.5750% |
| Over $10 billion | 0.5725% |
HFMC contractually agreed to waive investment management fees of 0.10% of average daily net assets until February 28, 2014. These amounts are deducted from expenses and are reported as expense waivers on the accompanying Statement of Operations, as applicable.
| 39 |
The Hartford World Bond Fund
Notes to Financial Statements – (continued)
October 31, 2014
(000’s Omitted)
Accounting Services Agreement – Pursuant to the Fund Accounting Agreement between HFMC and the Company, on behalf of the Fund, HFMC provides accounting services to the Fund and receives monthly compensation based on the Fund’s average daily net assets at the rates set forth below. The Fund’s accounting services fees are accrued daily and paid monthly.
| Average Daily Net Assets | Annual Fee |
| On first $5 billion | 0.020% |
| On next $5 billion | 0.015% |
| Over $10 billion | 0.010% |
Operating Expenses – Allocable expenses incurred by the Company are allocated to each Fund and allocated to classes within the Fund in proportion to the average daily net assets of the Fund and each class, except where allocation of certain expenses is more fairly made directly to the Fund or to specific classes within a Fund. From March 1, 2014 through October 31, 2014, HFMC contractually limited the total operating expenses of this Fund, exclusive of taxes, interest expense, brokerage commissions, acquired fund fees and expenses and extraordinary expenses, through February 28, 2015 as follows:
| Class A | Class C | Class I | Class R3 | Class R4 | Class R5 | Class Y |
| 1.05% | 1.80% | 0.80% | 1.35% | 1.05% | 0.75% | 0.70% |
From November 1, 2013 through February 28, 2014, the investment manager contractually limited the total operating expenses of the Fund, exclusive of taxes, interest expense, brokerage commissions, acquired fund fees and expenses and extraordinary expense as follows:
| Class A | Class C | Class I | Class R3 | Class R4 | Class R5 | Class Y |
| 0.95% | 1.70% | 0.70% | 1.25% | 0.95% | 0.65% | 0.60% |
Fees Paid Indirectly – The Fund's custodian bank has agreed to reduce its fees when the Fund maintains cash on deposit in a non-interest-bearing custody account. For the year ended October 31, 2014, this amount, if any, is included in the Statement of Operations.
The ratio of expenses to average net assets in the accompanying financial highlights excludes the reduction in expenses related to fees paid indirectly. The annualized expense ratio after waivers for the period listed below reflecting the reduction for fees paid indirectly is as follows:
| Year Ended October 31, 2014 | ||||
| Class A | 0.99 | % | ||
| Class C | 1.73 | |||
| Class I | 0.74 | |||
| Class R3 | 1.32 | |||
| Class R4 | 1.02 | |||
| Class R5 | 0.70 | |||
| Class Y | 0.64 | |||
Distribution and Service Plan for Class A, C, R3 and R4 Shares – Hartford Funds Distributors, LLC ("HFD"), an indirect wholly owned subsidiary of The Hartford, is the principal underwriter and distributor of the Fund. HFD is engaged in distribution activities, which include marketing and distribution of shares through broker/dealers, financing distribution costs and maintaining financial books and records. For the year ended October 31, 2014, HFD received front-end load sales charges of $1,018 and contingent deferred sales charges of $77 from the Fund.
The Fund has adopted a Distribution and Service Plan in accordance with Rule 12b-1 of the 1940 Act to compensate the distributor (HFD) for activities intended to result in the sale and distribution of Class A, C, R3 and R4 shares and for providing services for
| 40 |
The Hartford World Bond Fund
Notes to Financial Statements – (continued)
October 31, 2014
(000’s Omitted)
shareholders. The Rule 12b-1 plan applicable to Class A shares of the Fund provides for payment of a Rule 12b-1 fee of 0.25% of average daily net assets. Some or all of the fee may be used for shareholder servicing expenses with the remainder used for distribution expenses. Under the Class C Plan, the Fund pays the distributor 1.00% of the average daily net assets of Class C shares outstanding, 0.25% of which is intended as a fee for services provided to existing shareholders with the remainder used for distribution expenses. For Class C shares, some or the entire fee may be remitted to broker/dealers for distribution and/or shareholder account services. Class R3 shares have a distribution fee of 0.50% of average daily net assets and Class R4 shares have a distribution fee of 0.25% of average daily net assets. For Class R3 and R4 shares, some or the entire fee may be remitted to broker/dealers for distribution and/or shareholder account services. The Fund’s 12b-1 fees are accrued daily and paid monthly or at such other intervals as the Board of Directors may determine.
Other Related Party Transactions – Certain officers of the Fund are directors and/or officers of HFMC and/or The Hartford or its subsidiaries. For the year ended October 31, 2014, a portion of the Fund’s Chief Compliance Officer’s compensation was paid by all of the investment companies in the Hartford fund complex. The portion allocated to the Fund, as represented in other expenses on the Statement of Operations, was in the amount of $4. Hartford Administrative Services Company (“HASCO”), an indirect wholly-owned subsidiary of The Hartford, provides transfer agent services to the Fund. HASCO has contractually agreed to reimburse any portion of the transfer agency fees over 0.30% of average daily net assets per fiscal year for each class. Any transfer agency fee reimbursement is determined before considering the contractual operating expense limitation. For providing such services, HASCO is compensated on a per account basis that varies by account type, except with respect to Class Y, for which it is compensated based on average daily net assets. The amount paid to HASCO and any related contractual reimbursement amounts, if applicable, can be found in the Statement of Operations. These fees are accrued daily and paid monthly.
Administrative services fees are paid to HASCO for third-party recordkeeping services that are payable as a percentage of net assets in the amount of up to 0.20%, 0.15% and 0.10% for Classes R3, R4 and R5 shares, respectively. The total administrative services fees are shown on the Statement of Operations. These fees are accrued daily and paid monthly.
Affiliate Holdings:
As of October 31, 2014, affiliates of The Hartford had ownership of shares in the Fund as follows:
| Percentage of Class | Percentage of Fund | |||||||
| Class R5 | 26 | % | — | %* | ||||
As of October 31, 2014, the Fund's shares were owned in aggregate by affiliated fund of funds. Therefore, the Fund may experience relatively large purchases or redemptions of its shares from these affiliated fund of funds. Affiliated fund of funds owned shares in the Fund as follows:
| Percentage of Fund | ||||
| Class Y | 7 | % | ||
| * | Percentage rounds to zero. |
| 41 |
The Hartford World Bond Fund
Notes to Financial Statements – (continued)
October 31, 2014
(000’s Omitted)
Investment Transactions:
For the year ended October 31, 2014, the cost of purchases and proceeds from sales of investment securities (excluding short-term investments) were as follows:
| Excluding U.S. Government Obligations | U.S. Government Obligations | Total | ||||||||||
| Cost of Purchases | $ | 5,111,405 | $ | 461,956 | $ | 5,573,361 | ||||||
| Sales Proceeds | 4,095,132 | 256,916 | 4,352,048 | |||||||||
Capital Share Transactions:
The following information is for the year ended October 31, 2014, and the year ended October 31, 2013:
For the Year Ended October 31, 2014 | For the Year Ended October 31, 2013 | |||||||||||||||||||||||||||||||
Shares Sold | Shares Issued | Shares | Net Increase (Decrease) of Shares | Shares Sold | Shares Issued | Shares | Net Increase (Decrease) of Shares | |||||||||||||||||||||||||
| Class A | ||||||||||||||||||||||||||||||||
| Shares | 30,986 | 630 | (37,662 | ) | (6,046 | ) | 40,051 | 785 | (18,803 | ) | 22,033 | |||||||||||||||||||||
| Amount | $ | 332,147 | $ | 6,717 | $ | (404,598 | ) | $ | (65,734 | ) | $ | 428,748 | $ | 8,406 | $ | (200,562 | ) | $ | 236,592 | |||||||||||||
| Class C | ||||||||||||||||||||||||||||||||
| Shares | 5,908 | 107 | (6,097 | ) | (82 | ) | 11,839 | 185 | (4,304 | ) | 7,720 | |||||||||||||||||||||
| Amount | $ | 63,245 | $ | 1,135 | $ | (65,152 | ) | $ | (772 | ) | $ | 126,701 | $ | 1,979 | $ | (45,742 | ) | $ | 82,938 | |||||||||||||
| Class I | ||||||||||||||||||||||||||||||||
| Shares | 145,529 | 1,341 | (48,059 | ) | 98,811 | 87,494 | 1,219 | (44,043 | ) | 44,670 | ||||||||||||||||||||||
| Amount | $ | 1,563,851 | $ | 14,351 | $ | (515,018 | ) | $ | 1,063,184 | $ | 936,948 | $ | 13,054 | $ | (470,726 | ) | $ | 479,276 | ||||||||||||||
| Class R3 | ||||||||||||||||||||||||||||||||
| Shares | 45 | 1 | (25 | ) | 21 | 27 | 2 | (100 | ) | (71 | ) | |||||||||||||||||||||
| Amount | $ | 488 | $ | 7 | $ | (263 | ) | $ | 232 | $ | 284 | $ | 19 | $ | (1,076 | ) | $ | (773 | ) | |||||||||||||
| Class R4 | ||||||||||||||||||||||||||||||||
| Shares | 18 | — | (43 | ) | (25 | ) | 60 | 1 | (94 | ) | (33 | ) | ||||||||||||||||||||
| Amount | $ | 202 | $ | 2 | $ | (466 | ) | $ | (262 | ) | $ | 640 | $ | 15 | $ | (1,016 | ) | $ | (361 | ) | ||||||||||||
| Class R5 | ||||||||||||||||||||||||||||||||
| Shares | 17 | — | (31 | ) | (14 | ) | 30 | 2 | (115 | ) | (83 | ) | ||||||||||||||||||||
| Amount | $ | 180 | $ | 5 | $ | (334 | ) | $ | (149 | ) | $ | 322 | $ | 21 | $ | (1,241 | ) | $ | (898 | ) | ||||||||||||
| Class Y | ||||||||||||||||||||||||||||||||
| Shares | 27,680 | 672 | (12,368 | ) | 15,984 | 19,928 | 601 | (6,835 | ) | 13,694 | ||||||||||||||||||||||
| Amount | $ | 297,294 | $ | 7,191 | $ | (132,794 | ) | $ | 171,691 | $ | 212,249 | $ | 6,437 | $ | (73,159 | ) | $ | 145,527 | ||||||||||||||
| Total | ||||||||||||||||||||||||||||||||
| Shares | 210,183 | 2,751 | (104,285 | ) | 108,649 | 159,429 | 2,795 | (74,294 | ) | 87,930 | ||||||||||||||||||||||
| Amount | $ | 2,257,407 | $ | 29,408 | $ | (1,118,625 | ) | $ | 1,168,190 | $ | 1,705,892 | $ | 29,931 | $ | (793,522 | ) | $ | 942,301 | ||||||||||||||
Line of Credit:
The Fund is one of several Hartford Funds that participate in a $500 million committed revolving line of credit facility. The facility is to be used for temporary or emergency purposes. Under the arrangement, the funds are required to own securities having a market value in excess of 300% of the total bank borrowings. The interest rate on borrowings varies depending on the nature of the loan. The facility also requires a fee to be paid based on the amount of the commitment. This commitment fee is allocated to all the funds participating in the line of credit based on the average net assets of the funds. During the year ended October 31, 2014, the Fund did not have any borrowings under this facility.
Pending Legal Proceedings:
On February 25, 2011, Jennifer L. Kasilag, Louis Mellinger, Judith M. Menendez, Jacqueline M. Robinson, and Linda A. Russell filed a derivative lawsuit against Hartford Investment Financial Services, LLC (“HIFSCO”) (now known as HFD) on behalf of six Hartford retail mutual funds in the United States District Court for the District of New Jersey, alleging that HIFSCO received excessive advisory and
| 42 |
The Hartford World Bond Fund
Notes to Financial Statements – (continued)
October 31, 2014
(000’s Omitted)
distribution fees in violation of its statutory fiduciary duty under Section 36(b) of the 1940 Act when serving as investment manager and principal underwriter, respectively, to the Hartford retail mutual funds. Although this action was purportedly filed on behalf of certain of the Hartford Funds, none of the Hartford Funds is itself a defendant to the suit. HIFSCO moved to dismiss and, in September 2011, the motion was granted in part and denied in part, with leave to amend the complaint. In November 2011, plaintiffs filed an amended complaint on behalf of certain Hartford retail mutual funds, The Hartford Global Health Fund (now known as The Hartford Healthcare Fund), The Hartford Conservative Allocation Fund, The Hartford Growth Opportunities Fund, The Hartford Inflation Plus Fund, The Hartford Advisers Fund (now known as The Hartford Balanced Fund), and The Hartford Capital Appreciation Fund. Plaintiffs seek to rescind the investment management agreements and distribution plans between HIFSCO and these funds and to recover the total fees charged thereunder or, in the alternative, to recover any improper compensation HIFSCO received, in addition to lost earnings. HIFSCO filed a partial motion to dismiss the amended complaint and, in December 2012, the court dismissed without prejudice the claims regarding distribution fees and denied the motion with respect to the advisory fees claims. HIFSCO disputes the allegations and intends to defend vigorously.
In March 2014, the plaintiffs filed a new complaint that added as new plaintiffs The Hartford Floating Rate Fund and The Hartford Small Company Fund and named as a defendant HFMC, which assumed the role as investment manager to the funds as of January 2013. HFMC and HIFSCO dispute the allegations and intend to defend vigorously.
No accrual for litigation relating to this matter has been recorded in the financial statements of the Fund because the Fund is not party to the suit.
Indemnifications:
Under the Company's organizational documents, the Company shall indemnify its officers and directors to the full extent required or permitted under Maryland General Corporation Law and the federal securities laws. In addition, the Company, on behalf of the Fund, may enter into contracts that contain a variety of indemnifications. The Company's maximum exposure under these arrangements is unknown. However, as of the date of these financial statements, the Company has not had prior claims or losses pursuant to these contracts and expects the risk of loss to be remote.
Subsequent Events:
At the August 5-6, 2014 meeting, the Board of Directors approved the creation of Class R6 shares for the Fund. Class R6 shares launched on November 7, 2014. In connection with the launch of the Class R6 shares, an updated prospectus, dated November 7, 2014, and Statement of Additional Information, dated March 1, 2014, as amended November 7, 2014, for the Fund were filed with the U.S. Securities and Exchange Commission.
Effective December 1, 2014, pursuant to a sub-transfer agency agreement between HASCO and Boston Financial Data Services, Inc. (“BFDS”), HASCO has delegated certain transfer agent, dividend disbursing agent and shareholder servicing agent functions to BFDS. The costs and expenses of such delegation are borne by HASCO, not by the Fund.
| 43 |
Financial Highlights
| - Selected Per-Share Data - (A) | - Ratios and Supplemental Data - | |||||||||||||||||||||||||||||||||||||||||||||||||||
Class | Net
Asset | Net
| Net
| Total
from | Dividends
| Distribu- | Total
| Net
Asset | Total
| Net
Assets | Ratio
of | Ratio
of to
Average | Ratio
of | |||||||||||||||||||||||||||||||||||||||
| For the Year Ended October 31, 2014 | ||||||||||||||||||||||||||||||||||||||||||||||||||||
| A | $ | 10.63 | $ | 0.12 | $ | 0.17 | $ | 0.29 | $ | (0.13 | ) | $ | (0.03 | ) | $ | (0.16 | ) | $ | 10.76 | 2.74 | % | $ | 422,689 | 1.02 | % | 0.99 | % | 1.15 | % | |||||||||||||||||||||||
| C | 10.61 | 0.04 | 0.17 | 0.21 | (0.05 | ) | (0.03 | ) | (0.08 | ) | 10.74 | 2.00 | 179,147 | 1.76 | 1.73 | 0.41 | ||||||||||||||||||||||||||||||||||||
| I | 10.64 | 0.15 | 0.17 | 0.32 | (0.16 | ) | (0.03 | ) | (0.19 | ) | 10.77 | 3.03 | 1,966,455 | 0.76 | 0.74 | 1.40 | ||||||||||||||||||||||||||||||||||||
| R3 | 10.64 | 0.09 | 0.17 | 0.26 | (0.10 | ) | (0.03 | ) | (0.13 | ) | 10.77 | 2.42 | 759 | 1.39 | 1.32 | 0.82 | ||||||||||||||||||||||||||||||||||||
| R4 | 10.64 | 0.12 | 0.18 | 0.30 | (0.13 | ) | (0.03 | ) | (0.16 | ) | 10.78 | 2.80 | 725 | 1.07 | 1.02 | 1.12 | ||||||||||||||||||||||||||||||||||||
| R5 | 10.63 | 0.15 | 0.17 | 0.32 | (0.16 | ) | (0.03 | ) | (0.19 | ) | 10.76 | 3.03 | 226 | 0.79 | 0.70 | 1.42 | ||||||||||||||||||||||||||||||||||||
| Y | 10.64 | 0.16 | 0.17 | 0.33 | (0.17 | ) | (0.03 | ) | (0.20 | ) | 10.77 | 3.11 | 517,167 | 0.67 | 0.64 | 1.50 | ||||||||||||||||||||||||||||||||||||
| For the Year Ended October 31, 2013 | ||||||||||||||||||||||||||||||||||||||||||||||||||||
| A | $ | 10.77 | $ | 0.10 | $ | 0.06 | $ | 0.16 | $ | (0.18 | ) | $ | (0.12 | ) | $ | (0.30 | ) | $ | 10.63 | 1.47 | % | $ | 481,684 | 1.03 | % | 0.93 | % | 0.95 | % | |||||||||||||||||||||||
| C | 10.76 | 0.02 | 0.05 | 0.07 | (0.10 | ) | (0.12 | ) | (0.22 | ) | 10.61 | 0.67 | 177,802 | 1.77 | 1.67 | 0.21 | ||||||||||||||||||||||||||||||||||||
| I | 10.78 | 0.13 | 0.05 | 0.18 | (0.20 | ) | (0.12 | ) | (0.32 | ) | 10.64 | 1.71 | 891,048 | 0.79 | 0.69 | 1.19 | ||||||||||||||||||||||||||||||||||||
| R3 | 10.78 | 0.06 | 0.05 | 0.11 | (0.13 | ) | (0.12 | ) | (0.25 | ) | 10.64 | 1.03 | 519 | 1.40 | 1.25 | 0.60 | ||||||||||||||||||||||||||||||||||||
| R4 | 10.78 | 0.10 | 0.05 | 0.15 | (0.17 | ) | (0.12 | ) | (0.29 | ) | 10.64 | 1.40 | 976 | 1.08 | 0.95 | 0.92 | ||||||||||||||||||||||||||||||||||||
| R5 | 10.77 | 0.13 | 0.06 | 0.19 | (0.21 | ) | (0.12 | ) | (0.33 | ) | 10.63 | 1.73 | 372 | 0.79 | 0.65 | 1.18 | ||||||||||||||||||||||||||||||||||||
| Y | 10.78 | 0.14 | 0.05 | 0.19 | (0.21 | ) | (0.12 | ) | (0.33 | ) | 10.64 | 1.81 | 340,669 | 0.68 | 0.58 | 1.30 | ||||||||||||||||||||||||||||||||||||
| For the Year Ended October 31, 2012 | ||||||||||||||||||||||||||||||||||||||||||||||||||||
| A | $ | 10.32 | $ | 0.10 | $ | 0.59 | $ | 0.69 | $ | (0.20 | ) | $ | (0.04 | ) | $ | (0.24 | ) | $ | 10.77 | 6.79 | % | $ | 250,916 | 1.11 | % | 0.95 | % | 0.95 | % | |||||||||||||||||||||||
| C | 10.31 | 0.02 | 0.60 | 0.62 | (0.13 | ) | (0.04 | ) | (0.17 | ) | 10.76 | 6.12 | 97,235 | 1.83 | 1.67 | 0.19 | ||||||||||||||||||||||||||||||||||||
| I | 10.32 | 0.12 | 0.60 | 0.72 | (0.22 | ) | (0.04 | ) | (0.26 | ) | 10.78 | 7.11 | 421,508 | 0.86 | 0.70 | 1.14 | ||||||||||||||||||||||||||||||||||||
| R3 | 10.32 | 0.09 | 0.57 | 0.66 | (0.16 | ) | (0.04 | ) | (0.20 | ) | 10.78 | 6.51 | 1,297 | 1.51 | 1.25 | 0.85 | ||||||||||||||||||||||||||||||||||||
| R4 | 10.32 | 0.12 | 0.57 | 0.69 | (0.19 | ) | (0.04 | ) | (0.23 | ) | 10.78 | 6.82 | 1,345 | 1.21 | 0.95 | 1.15 | ||||||||||||||||||||||||||||||||||||
| R5 | 10.32 | 0.15 | 0.56 | 0.71 | (0.22 | ) | (0.04 | ) | (0.26 | ) | 10.77 | 7.03 | 1,276 | 0.91 | 0.65 | 1.45 | ||||||||||||||||||||||||||||||||||||
| Y | 10.32 | 0.12 | 0.61 | 0.73 | (0.23 | ) | (0.04 | ) | (0.27 | ) | 10.78 | 7.18 | 197,637 | 0.73 | 0.57 | 1.12 | ||||||||||||||||||||||||||||||||||||
| From May 31, 2011 (commencement of operations), through October 31, 2011 | ||||||||||||||||||||||||||||||||||||||||||||||||||||
| A(D) | $ | 10.00 | $ | 0.09 | $ | 0.28 | $ | 0.37 | $ | (0.05 | ) | $ | – | $ | (0.05 | ) | $ | 10.32 | 3.74 | %(E) | $ | 33,346 | 1.27 | %(F) | 0.85 | %(F) | 1.93 | %(F) | ||||||||||||||||||||||||
| C(D) | 10.00 | 0.05 | 0.28 | 0.33 | (0.02 | ) | – | (0.02 | ) | 10.31 | 3.33 | (E) | 9,175 | 2.03 | (F) | 1.61 | (F) | 1.18 | (F) | |||||||||||||||||||||||||||||||||
| I(D) | 10.00 | 0.09 | 0.29 | 0.38 | (0.06 | ) | – | (0.06 | ) | 10.32 | 3.84 | (E) | 24,552 | 1.01 | (F) | 0.59 | (F) | 2.10 | (F) | |||||||||||||||||||||||||||||||||
| R3(D) | 10.00 | 0.07 | 0.29 | 0.36 | (0.04 | ) | – | (0.04 | ) | 10.32 | 3.58 | (E) | 2,071 | 1.72 | (F) | 1.25 | (F) | 1.64 | (F) | |||||||||||||||||||||||||||||||||
| R4(D) | 10.00 | 0.09 | 0.28 | 0.37 | (0.05 | ) | – | (0.05 | ) | 10.32 | 3.70 | (E) | 2,073 | 1.42 | (F) | 0.95 | (F) | 1.94 | (F) | |||||||||||||||||||||||||||||||||
| R5(D) | 10.00 | 0.10 | 0.28 | 0.38 | (0.06 | ) | – | (0.06 | ) | 10.32 | 3.83 | (E) | 2,076 | 1.12 | (F) | 0.65 | (F) | 2.24 | (F) | |||||||||||||||||||||||||||||||||
| Y(D) | 10.00 | 0.10 | 0.28 | 0.38 | (0.06 | ) | – | (0.06 | ) | 10.32 | 3.85 | (E) | 9,344 | 1.02 | (F) | 0.60 | (F) | 2.29 | (F) | |||||||||||||||||||||||||||||||||
See Portfolio Turnover information on the next page.
| 44 |
The Hartford World Bond Fund
Financial Highlights – (continued)
| (A) | Information presented relates to a share outstanding throughout the indicated period. Net investment income (loss) per share amounts are calculated based on average shares outstanding unless otherwise noted. |
| (B) | Assumes initial investment at net asset value at the beginning of each period, reinvestment of all distributions, the complete redemption of the investment at net asset value at the end of each period and no sales charge. Total return would be reduced if sales charges were taken into account. |
| (C) | Adjustments include waivers and reimbursements, if applicable. Ratios do not include fees paid indirectly (see Expenses in the accompanying Notes to Financial Statements). |
| (D) | Commenced operations on May 31, 2011. |
| (E) | Not annualized. |
| (F) | Annualized. |
| Portfolio Turnover Rate for All Share Classes | ||||
| For the Year Ended October 31, 2014 | 140 | % | ||
| For the Year Ended October 31, 2013 | 129 | |||
| For the Year Ended October 31, 2012 | 191 | |||
| From May 31, 2011 (commencement of operations) through October 31, 2011 | 50 | (A) | ||
| (A) Not annualized. |
| 45 |
Report of Independent Registered Public Accounting Firm
The Board of Directors and Shareholders of
The Hartford Mutual Funds, Inc.
We have audited the accompanying statement of assets and liabilities, including the schedule of investments, of The Hartford World Bond Fund (one of the portfolios constituting The Hartford Mutual Funds, Inc. (the Funds)) as of October 31, 2014, and the related statement of operations for the year then ended, the statements of changes in net assets for each of the two years in the period then ended, and the financial highlights for the periods indicated therein. These financial statements and financial highlights are the responsibility of the Funds’ management. Our responsibility is to express an opinion on these financial statements and financial highlights based on our audits.
We conducted our audits in accordance with the standards of the Public Company Accounting Oversight Board (United States). Those standards require that we plan and perform the audit to obtain reasonable assurance about whether the financial statements and financial highlights are free of material misstatement. We were not engaged to perform an audit of the Funds’ internal control over financial reporting. Our audits included consideration of internal control over financial reporting as a basis for designing audit procedures that are appropriate in the circumstances, but not for the purpose of expressing an opinion on the effectiveness of the Funds’ internal control over financial reporting. Accordingly, we express no such opinion. An audit also includes examining, on a test basis, evidence supporting the amounts and disclosures in the financial statements and financial highlights, assessing the accounting principles used and significant estimates made by management, and evaluating the overall financial statement presentation. Our procedures included confirmation of securities owned as of October 31, 2014, by correspondence with the custodian, agent banks and brokers or by other appropriate auditing procedures where replies from agent banks and brokers were not received. We believe that our audits provide a reasonable basis for our opinion.
In our opinion, the financial statements and financial highlights referred to above present fairly, in all material respects, the financial position of The Hartford World Bond Fund of The Hartford Mutual Funds, Inc. at October 31, 2014, the results of its operations for the year then ended, the changes in its net assets for each of the two years in the period then ended, and the financial highlights for the periods indicated therein, in conformity with U.S. generally accepted accounting principles.
Minneapolis, Minnesota
December 18, 2014
| 46 |
Directors and Officers (Unaudited)
The Board of Directors of the Company (the "Directors") appoints officers who are responsible for the day-to-day operations of the Fund and who execute policies formulated by the Directors. Each Director serves until his or her death, resignation, or retirement or until the next annual meeting of shareholders is held or until his or her successor is elected and qualifies.
Directors and officers who are employed by or who have a financial interest in The Hartford Financial Services Group, Inc. ("The Hartford") are considered “interested” persons of the Fund pursuant to the 1940 Act. Each officer and two of the Company's Directors, as noted in the chart below, are “interested” persons of the Fund. Each Director serves as a director for The Hartford Mutual Funds, Inc., The Hartford Mutual Funds II, Inc., Hartford Series Fund, Inc., and Hartford HLS Series Fund II, Inc., and as a trustee for The Hartford Alternative Strategies Fund, which, as of October 31, 2014, collectively consist of 66 funds. Correspondence may be sent to Directors and officers c/o Hartford Funds, 5 Radnor Corporate Center, Suite 300, 100 Matsonford Road, Radnor, Pennsylvania 19087, except that correspondence to Mr. Annoni, Mr. Dressen and Ms. Quade may be sent to 500 Bielenberg Drive, Suite 500, Woodbury, Minnesota 55125.
The table below sets forth, for each Director and officer, his or her name, year of birth, current position with the Company and date first elected or appointed to The Hartford Mutual Funds, Inc. ("MF") and The Hartford Mutual Funds II, Inc. ("MF2"), principal occupation, and, for Directors, other directorships held. The Fund’s Statement of Additional Information contains further information on the Directors and is available free of charge by calling 1-888-843-7824 or writing to: Hartford Funds, P.O. Box 55022, Boston, MA 02205-5022.
Information on the aggregate remuneration paid to the directors of the Company can be found in the Statement of Operations herein. The Fund pays to The Hartford a portion of the Chief Compliance Officer’s compensation, but does not pay salaries or compensation to any of its other officers or Directors who are employed by The Hartford.
Non-Interested Directors
Hilary E. Ackermann (1956) Director since September 23, 2014
Ms. Ackermann served as Chief Risk Officer at Goldman Sachs Bank USA from October 2008 to November 2011 and serves as a Director of Dynegy, Inc., an independent power company, from October 2012 to present.
Lynn S. Birdsong (1946) Director since 2003, Chairman of the Investment Committee since 2014
Mr. Birdsong is a private investor. Mr. Birdsong currently serves as a Director of the Sovereign High Yield Investment Company (April 2010 to current). Mr. Birdsong currently serves as an Independent Director of Nomura Partners Funds, Inc. (formerly, The Japan Fund) (April 2003 to current). From 2003 to March 2005, Mr. Birdsong was an Independent Director of the Atlantic Whitehall Funds. From 1979 to 2002, Mr. Birdsong was a Managing Director of Zurich Scudder Investments, an investment management firm. During his employment with Scudder, Mr. Birdsong was an Interested Director of The Japan Fund. From January 1981 through December 2013, Mr. Birdsong was a partner in Birdsong Company, an advertising specialty firm.
Robert M. Gavin, Jr. (1940) Director since 2002 (MF) and 1986 (MF2), Chairman of the Board for each since 2004
Dr. Gavin is an educational consultant. Prior to September 1, 2001, he was President of Cranbrook Education Community and prior to July 1996, he was President of Macalester College, St. Paul, Minnesota.
Duane E. Hill (1945) Director since 2001 (MF) and 2002 (MF2), Chairman of the Nominating Committee since 2003
Mr. Hill is a Partner of TSG Ventures L.P., a private equity investment company. Mr. Hill is a former partner of TSG Capital Group, a private equity investment firm that served as sponsor and lead investor in leveraged buyouts of middle market companies.
Sandra S. Jaffee (1941) Director since 2005
Ms. Jaffee is the founder and Chief Executive Officer of a private company, Homeworks Concierge, LLC, which provides residential property management services in Westchester County, New York (January 2012 to present). Ms. Jaffee served as Chairman (2008 to 2009) and Chief Executive Officer of Fortent (formerly Searchspace Group), a leading provider of compliance/regulatory technology to financial institutions from August 2005 to August 2009. From August 2004 to August 2005, Ms. Jaffee served as an Entrepreneur in Residence with Warburg Pincus, a private equity firm. Prior to joining Warburg Pincus, Ms. Jaffee served as Executive Vice President at Citigroup, from September 1995 to July 2004, where she was President and Chief Executive Officer of Citibank’s Global Securities Services (1995 to 2003). Ms. Jaffee currently serves as a member of the Board of Directors of Broadridge Financial Solutions as well as a Trustee of Muhlenberg College.
| 47 |
The Hartford World Bond Fund
Directors and Officers (Unaudited) – (continued)
William P. Johnston (1944) Director since 2005, Chairman of the Compliance Committee since 2005
In June 2006, Mr. Johnston was appointed as Senior Advisor to The Carlyle Group, a global private equity and other alternative asset investment firm and currently serves as an Operating Executive. In July 2006, Mr. Johnston was elected to the Board of Directors of MultiPlan, Inc. and served as a Director (July 2006 to August 2010). In August 2007, Mr. Johnston was elected to the Board of Directors of LifeCare Holdings, Inc. and served as a Director (August 2007 to June 2013). In February 2008, Mr. Johnston was elected to the Board of Directors of HCR-ManorCare, Inc. In May 2006, Mr. Johnston was elected to the Supervisory Board of Fresenius Medical Care AG & Co. KGaA, after its acquisition of Renal Care Group, Inc. in March 2006. Mr. Johnston joined Renal Care Group in November 2002 as a member of the Board of Directors and served as Chairman of the Board from March 2003 through March 2006. From 2002 through 2013, Mr. Johnston served as a Board member of the Georgia O’Keefe Museum. From September 1987 to December 2002, Mr. Johnston was with Equitable Securities Corporation (and its successors, SunTrust Equitable Securities and SunTrust Robinson Humphrey) serving in various investment banking and managerial positions, including Managing Director and Head of Investment Banking, Chief Executive Officer and Vice Chairman.
Phillip O. Peterson (1944) Director since 2002 (MF) and 2000 (MF2), Chairman of the Audit Committee since 2002
Mr. Peterson is a mutual fund industry consultant. He was a partner of KPMG LLP (an accounting firm) until July 1999. Mr. Peterson joined William Blair Funds in February 2007 as a member of the Board of Trustees. From February 2012 to February 2014, Mr. Peterson served as a Trustee of Symetra Variable Mutual Funds. From January 2004 to April 2005, Mr. Peterson served as Independent President of the Strong Mutual Funds.
Lemma W. Senbet (1946) Director since 2005
Dr. Senbet is the William E. Mayer Chair Professor of Finance and Founding Director, Center for Financial Policy, at the University of Maryland, Robert H. Smith School of Business. He was chair of the Finance Department of the University of Maryland, Robert H. Smith School of Business from 1998 to 2006. Since June 2013, he has been on leave from the University to serve as Executive Director of African Economic Research Consortium which focuses on economic policy research and training. Previously, he was a chaired professor of finance at the University of Wisconsin-Madison. Also, he was a Director of the Fortis Funds from March 2000 to July 2002. Dr. Senbet served as Director of the American Finance Association and President of the Western Finance Association. In 2006, Dr. Senbet was inducted Fellow of Financial Management Association International for his career-long distinguished scholarship and professional service.
Interested Directors and Officers
James E. Davey (1964) Director since 2012, President and Chief Executive Officer since 2010
Mr. Davey serves as Executive Vice President of Hartford Life Insurance Company (“HLIC”) and The Hartford. Additionally, Mr. Davey serves as Chairman of the Board, Manager and Senior Managing Director of Hartford Funds Distributors, LLC (“HFD”). He also currently serves as Director, Chairman of the Board, President and Senior Managing Director of Hartford Administrative Services Company (“HASCO”). Mr. Davey also serves as Manager, Chairman of the Board and Senior Managing Director for Hartford Funds Management Company, LLC (“HFMC”) and Director, Chairman of the Board and Senior Managing Director for Hartford Funds Management Group, Inc. ("HFMG"). Mr. Davey has served in various positions within The Hartford and its subsidiaries in connection with the operation of the Hartford Funds. Mr. Davey joined The Hartford in 2002.
Lowndes A. Smith* (1939) Director since 1996 (MF) and 2002 (MF2)
Mr. Smith served as Vice Chairman of The Hartford from February 1997 to January 2002, as President and Chief Executive Officer of Hartford Life, Inc. from February 1997 to January 2002, and as President and Chief Operating Officer of The Hartford Life Insurance Companies from January 1989 to January 2002. Mr. Smith serves as a Director of White Mountains Insurance Group Ltd. (October 2003 to current); One Beacon Insurance (October 2006 to current); Symetra Financial (August 2007 to current) and is a Managing Director of Whittington Gray Associates (January 2007 to current).
* Mr. Smith resigned as a Director of MF, MF2, Hartford Series Fund, Inc. and Hartford HLS Series Fund II, Inc. and as a Trustee of The Hartford Alternative Strategies Fund effective September 17, 2014.
Other Officers
Mark A. Annoni (1964) Vice President, Controller and Treasurer since 2012
Mr. Annoni currently serves as the Assistant Vice President of HLIC (February 2004 to present) and Senior Vice President of HFMG (December 2013 to present). Mr. Annoni has served in various positions within The Hartford and its subsidiaries in connection with the operation of the Hartford Funds. Mr. Annoni joined The Hartford in 2001.
| 48 |
The Hartford World Bond Fund
Directors and Officers (Unaudited) – (continued)
Michael R. Dressen (1963) AML Compliance Officer since 2011
Mr. Dressen currently serves as Assistant Vice President of HLIC. He also serves as Chief Compliance Officer and AML Compliance Officer of HASCO and as AML Officer of HFD. Mr. Dressen has served in various positions within The Hartford and its subsidiaries in connection with the operation of the Hartford Funds.
Edward P. Macdonald (1967) Vice President, Secretary and Chief Legal Officer since 2005
Mr. Macdonald currently serves as Assistant Secretary, Executive Vice President and Deputy General Counsel of HFD, HASCO, HFMC and HFMG. He also serves as Vice President of HLIC. Mr. Macdonald has served in various positions within The Hartford and its subsidiaries in connection with the operation of the Hartford Funds. Mr. Macdonald joined The Hartford in 2005.
Joseph G. Melcher (1973) Vice President and Chief Compliance Officer since 2013
Mr. Melcher currently serves as Executive Vice President of HFD, HFMG and HASCO. Mr. Melcher also currently serves as Executive Vice President and Chief Compliance Officer of HFMC. Mr. Melcher has served in various positions within The Hartford and its subsidiaries in connection with the operation of the Hartford Funds since joining The Hartford in 2012. Prior to joining The Hartford, Mr. Melcher worked at Touchstone Investments, a member of the Western & Southern Financial Group, where he held the position of Vice President and Chief Compliance Officer from 2010 through 2012 and Assistant Vice President, Compliance from 2005 to 2010.
Vernon J. Meyer (1964) Vice President since 2006
Mr. Meyer currently serves as Senior Vice President of HLIC. He also currently serves as Managing Director and Chief Investment Officer of HFMC and Managing Director of HFMG. Mr. Meyer has served in various positions within The Hartford and its subsidiaries in connection with the operation of the Hartford Funds. Mr. Meyer joined The Hartford in 2004.
Laura S. Quade (1969) Vice President since 2012
Ms. Quade currently serves as Vice President of HASCO, HFD and HFMG. She is the Head of Operations of HASCO and formerly served as Director, Enterprise Operations of HLIC. Ms. Quade has served in various positions within The Hartford and its subsidiaries in connection with the operation of the Hartford Funds. Ms. Quade joined The Hartford in 2001.
Martin A. Swanson** (1962) Vice President since 2010
Mr. Swanson currently serves as Vice President of HLIC. Mr. Swanson also serves as Managing Director, Chief Marketing Officer and Principal of HFD and Managing Director of HFMG. Mr. Swanson has served in various positions within The Hartford and its subsidiaries in connection with the operation of the Hartford Funds.
** Mr. Swanson resigned as an officer effective November 6, 2014.
HOW TO OBTAIN A COPY OF THE FUND’S PROXY VOTING POLICIES AND VOTING RECORDS (UNAUDITED)
A description of the policies and procedures that the Fund uses to determine how to vote proxies relating to portfolio securities and information about how the Fund voted proxies relating to portfolio securities during the most recent twelve-month period ended June 30 are available (1) without charge, upon request, by calling 888-843-7824 and (2) on the SEC’s website at http://www.sec.gov.
QUARTERLY PORTFOLIO HOLDINGS INFORMATION (UNAUDITED)
The Fund files a complete schedule of portfolio holdings with the SEC for the first and third quarters of each fiscal year on Form N-Q. The Fund’s Forms N-Q are available (1) without charge, upon request, by calling 888-843-7824 and (2) on the SEC’s website at http://www.sec.gov. The Form N-Q may be reviewed and copied at the SEC’s Public Reference Room in Washington, DC. Information on the operation of the Public Reference Room may be obtained by calling 1-800-SEC-0330.
| 49 |
Federal Tax Information (Unaudited)
For the fiscal year ended October 31, 2014, there is no further federal tax information required for this Fund.
| 50 |
Expense Example (Unaudited)
Your Fund's Expenses
As a shareholder of the Fund, you incur two types of costs: (1) transaction costs, including sales charges (loads) on purchase payments, if any, and contingent deferred sales charges (CDSC), if any, and (2) ongoing costs, including investment management fees, distribution and/or service (12b-1) fees, if any, and other fund expenses. This example is intended to help you understand your ongoing costs (in dollars) of investing in the Fund and to compare these costs with the ongoing costs of investing in other mutual funds. The example is based on an investment of $1,000 invested at the beginning of the period and held for the entire period of April 30, 2014 through October 31, 2014.
Actual Expenses
The first set of columns of the table below provides information about actual account values and actual expenses. You may use the information in this column, together with the amount you invested, to estimate the expenses that you paid over the period. Simply divide your account value by $1,000 (for example, an $8,600 account value divided by $1,000 = 8.6), then multiply the result by the number in the line under the heading entitled “Expenses Paid During Period” to estimate the expenses you paid on your account during this period.
Hypothetical Example for Comparison Purposes
The second set of columns of the table below provides information about hypothetical account values and hypothetical expenses based on the Fund's actual expense ratio and an assumed rate of return of 5% per year before expenses, which is not the Fund's actual return. The hypothetical account values and expenses may not be used to estimate the actual ending account balance or expenses you paid for the period. You may use this information to compare the ongoing costs of investing in the Fund and other funds. To do so, compare this 5% hypothetical example with the 5% hypothetical examples that appear in the shareholder reports of the other funds.
Please note that the expenses shown in the table are meant to highlight your ongoing costs only and do not reflect any transactional costs, such as sales charges (loads) and CDSC. Therefore, the second set of columns of the table is useful in comparing ongoing costs only, and will not help you determine the relative total costs of owning different funds. In addition, if these transactional costs were included, your costs would be higher. Expenses are equal to the Fund's annualized expense ratios multiplied by average account value over the period, multiplied by 184/365 (to reflect the one-half year period).
| Actual return | Hypothetical (5% return before expenses) | |||||||||||||||||||||||||||||||||||
Beginning | Ending Account | Expenses paid during the period April 30, 2014 through October 31, 2014 | Beginning | Ending Account | Expenses paid | Annualized | Days | Days | ||||||||||||||||||||||||||||
| Class A | $ | 1,000.00 | $ | 1,010.50 | $ | 5.16 | $ | 1,000.00 | $ | 1,020.08 | $ | 5.18 | 1.02 | % | 184 | 365 | ||||||||||||||||||||
| Class C | $ | 1,000.00 | $ | 1,006.90 | $ | 8.91 | $ | 1,000.00 | $ | 1,016.33 | $ | 8.95 | 1.76 | 184 | 365 | |||||||||||||||||||||
| Class I | $ | 1,000.00 | $ | 1,012.00 | $ | 3.88 | $ | 1,000.00 | $ | 1,021.35 | $ | 3.90 | 0.76 | 184 | 365 | |||||||||||||||||||||
| Class R3 | $ | 1,000.00 | $ | 1,009.00 | $ | 6.84 | $ | 1,000.00 | $ | 1,018.39 | $ | 6.87 | 1.35 | 184 | 365 | |||||||||||||||||||||
| Class R4 | $ | 1,000.00 | $ | 1,011.20 | $ | 5.33 | $ | 1,000.00 | $ | 1,019.91 | $ | 5.35 | 1.05 | 184 | 365 | |||||||||||||||||||||
| Class R5 | $ | 1,000.00 | $ | 1,012.00 | $ | 3.81 | $ | 1,000.00 | $ | 1,021.42 | $ | 3.83 | 0.75 | 184 | 365 | |||||||||||||||||||||
| Class Y | $ | 1,000.00 | $ | 1,012.30 | $ | 3.39 | $ | 1,000.00 | $ | 1,021.83 | $ | 3.41 | 0.67 | 184 | 365 | |||||||||||||||||||||
| 51 |
Approval of Investment Management and Investment Sub-Advisory Agreements (Unaudited)
Section 15(c) of the Investment Company Act of 1940, as amended (the “1940 Act”), requires that each mutual fund’s board of directors, including a majority of those directors who are not “interested persons” of the mutual fund, as defined in the 1940 Act (the “Independent Directors”), annually review and consider the continuation of the mutual fund’s investment advisory and sub-advisory agreements. At its meeting held on August 5-6, 2014, the Board of Directors (the “Board”) of The Hartford Mutual Funds, Inc., including each of the Independent Directors, unanimously voted to approve the continuation of the investment management agreement for The Hartford World Bond Fund (the “Fund”) with Hartford Funds Management Company, LLC (“HFMC”) and the continuation of the investment sub-advisory agreement between HFMC and the Fund’s sub-adviser, Wellington Management Company, LLP (the “Sub-adviser,” and together with HFMC, the “Advisers”) (collectively, the “Agreements”).
In the months preceding the August 5-6, 2014 meeting, the Board requested, received and reviewed written responses from the Advisers to questions posed to them on behalf of the Independent Directors and supporting materials relating to those questions and responses. The Board considered information furnished to the Board at its meetings throughout the year, as well as information specifically prepared in connection with the annual approval of the Agreements at the Board’s meetings held on June 17-18, 2014 and August 5-6, 2014. Information provided to the Board at its meetings throughout the year included, among other things, reports on Fund performance, legal and compliance matters, sales and marketing activity, shareholder services, and the other services provided to the Fund by the Advisers and their affiliates. The Board also received in-person presentations by Fund officers and representatives of HFMC at the Board’s meetings on June 17-18, 2014 and August 5-6, 2014 concerning the Agreements.
The Independent Directors, advised by independent legal counsel, engaged service providers to assist them with evaluating the Agreements with respect to the Fund. Lipper Inc. (“Lipper”), an independent provider of investment company data, was retained to provide the Board with reports on how the Fund’s contractual management fees, actual management fees, other non-management fees, overall expense ratios and investment performance compared to those of mutual funds with similar investment objectives. The Independent Directors also engaged an independent financial services consultant (the “Consultant”) to assist them in evaluating the Fund’s management fees, sub-advisory fees, other non-management fees, overall expense ratios and investment performance. In addition, the Consultant reviewed the profitability calculations utilized by HFMC in connection with the continuation of the investment management agreement.
In determining whether to continue the Agreements for the Fund, the members of the Board reviewed and evaluated information and factors they believed to be relevant and appropriate in light of the information that the Board deemed necessary and appropriate through the exercise of its reasonable business judgment. While individual members of the Board may have weighed certain factors differently, the Board’s determination to continue the Agreements was based on a comprehensive consideration of all information provided to the Board throughout the year and specifically with respect to the continuation of the Agreements. A more detailed discussion of the factors the Board considered with respect to its approval of the Agreements is provided below.
Nature, Extent and Quality of Services Provided by the Advisers
The Board requested and considered information concerning the nature, extent and quality of the services provided to the Fund by the Advisers. The Board considered, among other things, the terms of the Agreements and the range of services provided by the Advisers. The Board considered the Advisers’ professional personnel who provide services to the Fund, including each Adviser’s ability and experience in attracting and retaining qualified personnel to service the Fund. The Board considered each Adviser’s reputation and overall financial strength, as well as its willingness to consider and implement organizational and operational changes designed to enhance services to the Hartford Funds. In addition, the Board considered the quality of each Adviser’s communications with the Board and responsiveness to Board inquiries and requests made from time to time with respect to the Fund and other Hartford Funds.
The Board also requested and evaluated information concerning each Adviser’s regulatory and compliance environment. In this regard, the Board requested and reviewed information on each Adviser’s compliance policies and procedures, compliance history, and a report from the Fund’s Chief Compliance Officer on each Adviser’s compliance with applicable laws and regulations, including responses to regulatory developments and compliance issues raised by regulators. The Board also noted the Advisers’ support of the Fund’s compliance control structure, particularly the resources devoted by the Advisers in support of the Fund’s obligations pursuant to Rule 38a-1 under the 1940 Act.
With respect to HFMC, the Board noted that, under the Agreements, HFMC is responsible for the management of the Fund, including oversight of fund operations and service providers, and provides administrative and investment advisory services in connection with selecting, monitoring and supervising the Sub-adviser. The Board considered HFMC’s ongoing monitoring of people, process and performance, including its quarterly reviews of each of the Hartford Funds, semi-annual meetings with the leaders of each Fund’s portfolio management team, and oversight of the Hartford Funds’ approximately 66 portfolio managers. The Board recognized that HFMC has demonstrated a record of making changes to the
| 52 |
The Hartford World Bond Fund
Approval of Investment Management and Investment Sub-Advisory Agreements (Unaudited) – (continued)
management and/or strategies of the Hartford Funds when warranted. The Board considered HFMC’s oversight of the Sub-adviser’s investment approach and results, process for monitoring best execution of portfolio trades by the Sub-adviser, and approach to risk management with respect to the Fund and the service providers to the Fund. The Board also considered HFMC’s oversight of compliance with the Fund’s objective and policies as well as with applicable laws and regulations, noting that regulatory and other developments had over time led to an increase in the scope of HFMC’s services in this regard.
In addition, the Board considered HFMC’s ongoing commitment to review and rationalize the Hartford Funds product line-up and the expenses that HFMC had incurred in connection with fund combinations in recent years. The Board considered that HFMC or its affiliates are responsible for providing the Fund’s officers.
With respect to the Sub-adviser, which provides certain day-to-day portfolio management services for the Fund, the Board considered the quality of the Fund’s portfolio managers, the Sub-adviser’s other investment personnel, its investment philosophy and process, investment research capabilities and resources, performance record, trade execution capabilities and experience. The Board considered the experience of the Fund’s portfolio managers, the number of accounts managed by the portfolio managers, and the Sub-adviser’s method for compensating the portfolio managers.
Based on these considerations, the Board concluded that it was satisfied with the nature, extent and quality of the services provided to the Fund by HFMC and the Sub-adviser.
Performance of the Fund and the Advisers
The Board considered the investment performance of the Fund. In this regard, the Board reviewed the performance of the Fund over different time periods presented in the materials and evaluated HFMC’s analysis of the Fund’s performance for these time periods. The Board considered information and materials provided to the Board by the Advisers concerning Fund performance, as well as information from Lipper comparing the investment performance of the Fund to an appropriate benchmark and universe of peer funds. The Board noted that the Fund’s performance was in the 3rd quintile of its performance universe for the 1-year period. The Board also noted that the Fund’s performance was in line with its benchmark for the 1-year period.
The Board considered the detailed investment analytics reports provided by Hartford Funds’ Investment Advisory Group throughout the year. These reports include, among other things, information on the Fund’s gross and net returns, the Fund’s investment performance relative to an appropriate benchmark and peer group, various statistics concerning the Fund’s portfolio, and a narrative summary of various factors affecting Fund performance. The Board considered the Advisers’ cooperation with the Investment Committee, which assists the Board in evaluating the performance of the Fund at periodic meetings throughout the year. The Board also considered the analysis provided by the Consultant relating to the Fund’s performance track record.
In light of all the considerations noted above, the Board concluded that it had continued confidence in HFMC’s and the Sub-adviser’s overall capabilities to manage the Fund.
Costs of the Services and Profitability of the Advisers
The Board reviewed information regarding HFMC’s cost to provide investment management and related services to the Fund and HFMC’s profitability, both overall and for the Fund, on a pre-tax basis without regard to distribution expenses. The Board also requested and reviewed information about the profitability to HFMC and its affiliates from all services provided to the Fund and all aspects of their relationship with the Fund. The Board also requested and received information relating to the operations and profitability of the Sub-adviser.
The Board considered the Consultant’s review of the profitability calculations used by HFMC in connection with the continuation of the investment management agreement, noting the Consultant’s view that Hartford Funds’ process for calculating and reporting Fund profitability is reasonable. In this regard, the Board noted that the Consultant performed a full review of this process in light of the recent restructuring of the Hartford Funds business and reported that the approach to analyzing Fund profitability, including the use of common expense allocation methodologies, is reasonable, sound and well within common industry practice.
Based on these considerations, the Board concluded that the profits anticipated to be realized by the Advisers and their affiliates from their relationships with the Fund would not be excessive.
| 53 |
The Hartford World Bond Fund
Approval of Investment Management and Investment Sub-Advisory Agreements (Unaudited) – (continued)
Comparison of Fees and Services Provided by the Advisers
The Board considered comparative information with respect to the management fees to be paid by the Fund to HFMC and the total expense ratios of the Fund. The Board also considered comparative information with respect to the sub-advisory fees to be paid by HFMC to the Sub-adviser. In this regard, the Board requested and reviewed information from HFMC and the Sub-adviser relating to the management and sub-advisory fees, including the sub-advisory fee schedule for the Fund, and total operating expenses for the Fund. With respect to the sub-advisory fee schedule, the Board considered representations from HFMC and the Sub-adviser that the Sub-adviser’s fees were negotiated at arm’s length on a fund-by-fund basis. The Board also reviewed information from Lipper comparing the Fund’s contractual management fees, actual management fees and overall expense ratios relative to a group of funds selected by Lipper, in consultation with the Consultant, and a broader universe of funds selected by Lipper. The Board considered that the Fund’s contractual management fee and actual management fee were in the 4th quintile of its expense group, while its total expenses (less 12b-1 and shareholder service fees) were in the 1st quintile. The Board noted that the Fund has an automatically renewable contractual expense cap on each share class. The expense cap resulted in reimbursement of certain expenses incurred in 2013.
While the Board recognized that comparisons between the Fund and peer funds may be imprecise, given the different service levels and characteristics of mutual funds and the different business models and cost structures of the Advisers, the comparative information provided by Lipper assisted the Board in evaluating the reasonableness of the Fund’s management and sub-advisory fees and total operating expenses. In addition, the Board considered the analysis and recommendations of the Consultant relating to the Fund’s management and sub-advisory fees and total operating expenses.
Based on these considerations, the Board concluded that the Fund’s fees and total operating expenses, in conjunction with the information about quality of services, profitability, economies of scale, and other matters discussed, were reasonable in light of the services provided.
Economies of Scale
The Board requested and considered information regarding the Advisers’ realization of economies of scale with respect to the Fund and whether the fee levels reflect these economies of scale for the benefit of the Fund’s shareholders. The Board reviewed the breakpoints in the management fee schedule for the Fund, which reduce fee rates as Fund assets grow over time. The Board recognized that a fund with assets beyond the highest breakpoint level will continue to benefit from economies of scale because additional assets are charged the lowest breakpoint fee resulting in lower overall effective management fee rates. The Board also considered that expense limitations and fee waivers that reduce the Fund’s expenses at all asset levels can have the same effect as breakpoints in sharing economies of scale with shareholders and provide protection from an increase in expenses if Fund assets decline. The Board recognized that a fee schedule that reaches a lower breakpoint quickly provides shareholders with the benefit of anticipated or potential economies of scale. The Board also considered that HFMC has been active in managing expenses, which has resulted in benefits being realized by shareholders as assets within the Hartford Funds family of funds have grown over time, including through lower transfer agent costs and other operating expenses.
The Board reviewed and evaluated materials from Lipper and the Consultant showing how management fee schedules of peer funds reflect economies of scale for the benefit of shareholders as a peer fund’s assets hypothetically increase over time. Based on information provided by HFMC, Lipper, and the Consultant, the Board recognized that there is no uniform methodology for establishing breakpoints or uniform pattern in asset levels that trigger breakpoints or the amounts of breakpoints triggered.
After considering all of the information available to it, the Board concluded that it was satisfied with the extent to which economies of scale would be shared for the benefit of the Fund’s shareholders based on currently available information and the effective advisory fees and expense ratios for the Fund at its current and reasonably anticipated asset levels. The Board noted, however, that it would continue to monitor future growth in Fund assets and the appropriateness of additional breakpoints.
Other Benefits
The Board considered other benefits to the Advisers and their affiliates from their relationships with the Fund.
The Board noted that HFMC receives fees for fund accounting and related services from the Fund, and the Board considered information on profits to HFMC for such services. The Board also considered that Hartford Administrative Services Company (“HASCO”), the Fund’s transfer agent and an affiliate of HFMC, receives transfer agency compensation from the Fund, and the Board reviewed information on the profitability of
| 54 |
The Hartford World Bond Fund
Approval of Investment Management and Investment Sub-Advisory Agreements (Unaudited) – (continued)
the Fund’s transfer agency function to HASCO. The Board considered information provided by HASCO indicating that the transfer agent fees charged by HASCO to the Fund were fair and reasonable based on publicly available information.
The Board also considered that Hartford Funds Distributors, LLC (“HFD”), an affiliate of HFMC, serves as principal underwriter of the Fund. As principal underwriter, HFD receives 12b-1 fees from the Fund and receives all or a portion of the sales charges on sales or redemptions of certain classes of shares. The Board also noted that certain affiliates of HFD distribute shares of the Fund and receive compensation in that connection.
The Board considered the benefits, if any, to the Sub-adviser from any use of the Fund’s brokerage commissions to obtain soft dollar research, and representations from HFMC and the Sub-adviser that the Sub-adviser would not make any revenue-sharing payments or any other type of distribution payments to HFMC or its affiliates.
The Board considered the benefits to shareholders of being part of the Hartford Funds family of funds, including the right to exchange investments between the same class of funds without a sales charge, the ability to reinvest Fund dividends into other funds in the family, and the ability to combine holdings in the Fund with holdings in other funds to obtain a reduced sales charge. The Board considered HFMC’s efforts to provide investors in the family with a broad range of investment styles and asset classes and its entrepreneurial risk in initiating new funds to expand these opportunities for shareholders.
* * * *
Based upon its review of these various factors, among others, the Board concluded that it is in the best interests of the Fund and its shareholders for the Board to approve the Agreements for an additional year. In reaching this decision, the Board did not assign relative weights to the factors discussed above or deem any one or group of them to be controlling in and of themselves. In connection with their deliberations, the Independent Directors met separately in executive session on several occasions, with independent legal counsel and the Consultant, to review the relevant materials and consider their responsibilities under relevant laws and regulations.
| 55 |
Main Risks (Unaudited)
The main risks of investing in the Fund are described below.
Market, Selection and Strategy Risk: The Fund’s share price may fluctuate due to market risk and/or security selections that may underperform the market or relevant benchmarks. If the sub-adviser's investment strategy does not perform as expected, the Fund could underperform its peers or lose money. There is no guarantee the Fund will achieve its stated objective.
Fixed Income Risk: The Fund is subject to interest rate risk (the risk that the value of an investment decreases when interest rates rise), credit risk (the risk that the issuing company of a security is unable to pay interest and principal when due) and call risk (the risk that an investment may be redeemed early). These risks also apply to the Fund’s investments in U.S. government securities, which may not be guaranteed by the U.S. government.
Foreign Investment, Emerging Markets and Sovereign Debt Risk: Investments in foreign securities may be riskier than investments in U.S. securities. Potential risks include the risks of illiquidity, increased price volatility, less government regulation, less extensive and less frequent accounting and other reporting requirements, unfavorable changes in currency exchange rates, and economic and political disruptions. These risks are generally greater for investments in emerging markets. Sovereign debt investments are subject to credit risk and the risk of default.
Junk Bond Risk: Investments in junk bonds involve greater risk of price volatility, illiquidity, and default than higher-rated debt securities.
Derivatives Risk: Investments in derivatives can be volatile. Potential risks include currency risk, leverage risk (the risk that small market movements may result in large changes in the value of an investment), liquidity risk, index risk, pricing risk, and counterparty risk (the risk that the counterparty may be unwilling or unable to honor its obligations).
Mortgage-Backed Securities Risk: Mortgage-backed securities are subject to interest rate risk, credit risk, prepayment risk, extension risk, and the risk that an investment’s value may be reduced or become worthless if it receives interest or income payments only after other investments in the same pool.
Active Trading Risk: Actively trading investments may result in higher costs and higher taxable income.
Non-Diversified Risk: The Fund is non-diversified, so it may be more exposed to the risks associated with individual issuers than a diversified fund.
| 56 |
THIS PRIVACY POLICY IS NOT PART OF THIS REPORT
Privacy Policy and Practices of The Hartford Financial Services Group, Inc. and its Affiliates
(herein called “we, our and us”)
This Privacy Policy applies to our United States Operations
|
We value your trust. We are committed to the responsible: a) management; b) use; and c) protection; of Personal Information.
This notice describes how we collect, disclose, and protect Personal Information.
We collect Personal Information to: a) service your Transactions with us; and b) support our business functions.
We may obtain Personal Information from: a) You; b) your Transactions with us; and c) third parties such as a consumer-reporting agency.
Based on the type of product or service You apply for or get from us, Personal Information such as: a) your name; b) your address; c) your income; d) your payment; or e) your credit history; may be gathered from sources such as applications, Transactions, and consumer reports.
To serve You and service our business, we may share certain Personal Information. We will share Personal Information, only as allowed by law, with affiliates such as: a) our insurance companies; b) our employee agents; c) our brokerage firms; and d) our administrators.
As allowed by law, we may share Personal Financial Information with our affiliates to: a) market our products; or b) market our services; to You without providing You with an option to prevent these disclosures.
|
We may also share Personal Information, only as allowed by law, with unaffiliated third parties including: a) independent agents; b) brokerage firms; c) insurance companies; d) administrators; and e) service providers; who help us serve You and service our business.
When allowed by law, we may share certain Personal Financial Information with other unaffiliated third parties who assist us by performing services or functions such as: a) taking surveys; b) marketing our products or services; or c) offering financial products or services under a joint agreement between us and one or more financial institutions.
We, and third parties we partner with, may track some of the pages You visit through the use of: a) cookies; b) pixel tagging; or c) other technologies; and currently do not process or comply with any web browser’s “do not track” signal or similar mechanism that indicates a request to disable online tracking of individual users who visit our websites or use our services.
We will not sell or share your Personal Financial Information with anyone for purposes unrelated to our business functions without offering You the opportunity to: a) “opt-out;” or b) “opt-in;” as required by law.
We only disclose Personal Health Information with: a) your proper written authorization; or b) as otherwise allowed or required by law.
Our employees have access to Personal Information in the course of doing their jobs, such as: a) underwriting policies; b) paying claims; c) developing new products; or d) advising customers of our products and services.
|
|
We use manual and electronic security procedures to maintain: a) the confidentiality; and b) the integrity of; Personal Information that we have. We use these procedures to guard against unauthorized access.
Some techniques we use to protect Personal Information include: a) secured files; b) user authentication; c) encryption; d) firewall technology; and e) the use of detection software.
We are responsible for and must: a) identify information to be protected; b) provide an adequate level of protection for that data; c) grant access to protected data only to those people who must use it in the performance of their job-related duties.
Employees who violate our Privacy Policy will be subject to discipline, which may include ending their employment with us.
At the start of our business relationship, we will give You a copy of our current Privacy Policy.
We will also give You a copy of our current Privacy Policy once a year if You maintain a continuing business relationship with us.
We will continue to follow our Privacy Policy regarding Personal Information even when a business relationship no longer exists between us.
|
As used in this Privacy Notice:
Application means your request for our product or service.
Personal Financial Information means financial information such as: a) credit history; b) income; c) financial benefits; or d) policy or claim information.
Personal Health Information means health information such as: a) your medical records; or b) information about your illness, disability or injury.
Personal Information means information that identifies You personally and is not otherwise available to the public. It includes: a) Personal Financial Information; and b) Personal Health Information.
Transaction means your business dealings with us, such as: a) your Application; b) your request for us to pay a claim; and c) your request for us to take an action on your account.
You means an individual who has given us Personal Information in conjunction with: a) asking about; b) applying for; or c) obtaining; a financial product or service from us if the product or service is used mainly for personal, family, or household purposes.
|
This Privacy Policy is being provided on behalf of the following affiliates of The Hartford Financial Services Group, Inc.:
1stAGChoice, Inc.; Access CoverageCorp, Inc.; Access CoverageCorp Technologies, Inc.; American Maturity Life Insurance Company; Archway 60 R, LLC; Business Management Group, Inc.; Champlain Life Reinsurance Company; DMS R, LLC; Eloy R, LLC; Ersatz Corporation; First State Insurance Company; Hartford Accident and Indemnity Company; Hartford Administrative Services Company; Hartford Casualty General Agency, Inc.; Hartford Casualty Insurance Company; Hartford-Comprehensive Employee Benefit Service Company; Hartford Equity Sales Company, Inc.; Hartford Fire General Agency, Inc.; Hartford Fire Insurance Company; Hartford Funds Management Company, LLC; Hartford Funds Management Group, Inc.; Hartford HLS Series Fund II, Inc.; Hartford Insurance Company of Illinois; Hartford Insurance Company of the Midwest; Hartford Insurance Company of the Southeast; Hartford Integrated Technologies, Inc.; Hartford International Life Reassurance Corporation; Hartford Funds Distributors, LLC; Hartford Investment Management Company; Hartford Life and Accident Insurance Company; Hartford Life and Annuity Insurance Company; Hartford Life Insurance Company; Hartford Life Private Placement, LLC; Hartford Lloyd’s Corporation; Hartford Lloyd’s Insurance Company; Hartford Mezzanine Investors I, LLC; Hartford Residual Market, L.C.C.; Hartford Retirement Services, LLC; Hartford Securities Distribution Company, Inc.; Hartford Series Fund, Inc.; Hartford Specialty Insurance Services of Texas, LLC; Hartford Strategic Investments, LLC; Hartford Underwriters Insurance Company; Hartford Technology Services Company, L.L.C.; Hartford of Texas General Agency, Inc.; Hartford Underwriters General Agency, Inc.; HARTRE Company, L.C.C.; HL Investment Advisors, LLC; HLA LLC; Horizon Management Group, LLC; HRA Brokerage Services, Inc.; Lanidex Class B, LLC; M-CAP Insurance Agency, LLC; New England Insurance Company; New England Reinsurance Corporation; Nutmeg Insurance Agency, Inc.; Nutmeg Insurance Company; Pacific Insurance Company, Limited; Planco, LLC: Property and Casualty Insurance Company of Hartford; Revere R, LLC; RVR R, LLC; Sentinel Insurance Company, Ltd.; Sunstone R, LLC; Symphony R, LLC; The Evergreen Group Incorporated; The Hartford Alternative Strategies Fund; The Hartford Mutual Funds, Inc.; The Hartford Mutual Funds II, Inc.; Trumbull Flood Management, L.L.C.; Trumbull Insurance Company; Twin City Fire Insurance Company; White River Life Reinsurance Company.
HPP Revised January 2014
HARTFORDFUNDS
hartfordfunds.com
This information is written in connection with the promotion or marketing of the matter(s) addressed in this material.
This report is submitted for the general information of the shareholders of the Fund. It is not authorized for distribution unless preceded or accompanied by a current prospectus for the Fund.
The information cannot be used or relied upon for the purpose of avoiding IRS penalties. These materials are not intended to provide tax, accounting or legal advice. As with all matters of a tax or legal nature, you should consult your own tax or legal counsel for advice.
Investors should carefully consider the investment objectives, risks, charges, and expenses of Hartford Funds before investing. This and other information can be found in the prospectus and summary prospectus, which can be obtained by calling 888-843-7824 (retail) or 800-279-1541 (institutional). Investors should read them carefully before they invest.
Hartford Funds are underwritten and distributed by Hartford Funds Distributors, LLC.
MFAR-WB14 12/14 114015-3 Printed in U.S.A.
Item 2. Code of Ethics.
| (a) | The registrant, as of the end of the period covered by this report, has adopted a code of ethics that applies to the registrant’s principal executive officer, principal financial officer, principal accounting officer or controller, or persons performing similar functions, regardless of whether these individuals are employed by the registrant or a third party. A copy of the code of ethics is filed herewith. |
| (c) | There have been no amendments, during the period covered by this report, to a provision of the code of ethics that applies to the registrant’s principal executive officer, principal financial officer, principal accounting officer or controller, or persons performing similar functions, regardless of whether these individuals are employed by the registrant or a third party, and that relates to any element of the code of ethics description. |
| (d) | The registrant has not granted any waivers, including an implicit waiver, from a provision of the code of ethics that applies to the registrant’s principal executive officer, principal financial officer, principal accounting officer or controller, or persons performing similar functions, regardless of whether these individuals are employed by the registrant or a third party, that relates to one or more of the items set forth in paragraph (b) of this item’s instructions. |
Item 3. Audit Committee Financial Expert.
The Board of Directors of the Registrant has designated Phillip O. Peterson as an Audit Committee Financial Expert. Mr. Peterson is considered by the Board to be an independent director.
Item 4. Principal Accountant Fees and Services.
| (a) | Audit Fees: The aggregate fees billed for each of the last two fiscal years for professional services rendered by the principal accountant for the audit of the registrant’s annual financial statements or services that are normally provided by the accountant in connection with statutory and regulatory filings or engagements for those fiscal years were: |
$715,215 for the fiscal year ended October 31, 2013; $712,021 for the fiscal year ended October 31, 2014.
| (b) | Audit Related Fees: The aggregate fees billed in each of the last two fiscal years for assurance and related services by the principal accountant that are reasonably related to the performance of the audit of the registrant’s financial statements and are not reported under paragraph (a) of this Item were: |
$22,160 for the fiscal year ended October 31, 2013; $25,614 for the fiscal year ended October 31, 2014. Audit-related services principally in connection with Rule 17Ad-13 under the Securities and Exchange Act of 1934.
| (c) | Tax Fees: The aggregate fees billed in each of the last two fiscal years for professional services rendered by the principal accountant for tax compliance, tax advice, and tax planning were: |
$234,461 for the fiscal year ended October 31, 2013; $203,826 for the fiscal year ended October 31, 2014. Tax-related services are principally in connection with, but not limited to, general tax services, excise tax and Passive Foreign Investment Company (PFIC) analysis.
| (d) | All Other Fees: The aggregate fees billed in each of the last two fiscal years for products and services provided by the principal accountant, other than the services reported in paragraphs (a) through (c) of this Item were: |
$0 for the fiscal year ended October 31, 2013; $0 for the fiscal year ended October 31, 2014.
| (e) | (1) The Pre-Approval Policies and Procedures (the “Policy”) adopted by the Audit Committee of the Registrant (also, the “Fund”) sets forth the procedures pursuant to which services performed by the Independent Auditor for the Registrant may be pre-approved. The following are some main provisions from the Policy. |
| 1. | The Audit Committee must pre-approve all audit services and non-audit services that the Independent Auditor provides to the Fund. |
| 2. | The Audit Committee must pre-approve any engagement of the Independent Auditor to provide non-audit services to any Service Affiliate (which is defined to include any entity controlling, controlled by, or under common control with the investment adviser that provides ongoing services to the Fund) during the period of the Independent Auditor’s engagement to provide audit services to the Fund, if the non-audit services to the Service Affiliate directly impact the Fund’s operations and financial reporting. |
| 3. | The Audit Committee shall pre-approve certain non-audit services to the Fund and its Service Affiliates pursuant to procedures set forth in the Policy. |
| 4. | The Audit Committee, from time to time, may designate one or more of its members who are Independent Directors (each a “Designated Member”) to consider, on the Audit Committee’s behalf, any non-audit services, whether to the Fund or to any Service Affiliate, that have not been pre-approved by the Audit Committee. In considering any requested non-audit services or proposed material change in such services, the Designated Member shall not authorize services which would exceed $50,000 in fees for such services. Any action by the Designated Member in approving a requested non-audit service shall be reported to the Audit Committee not later than at its next scheduled meeting. |
The Independent Auditor may not provide specified prohibited non-audit services set forth in the Policy to the Fund, the Fund’s investment adviser, the Service Affiliates or any other member of the investment company complex.
| (e) | (2) One hundred percent of the services described in items 4(b) through 4(d) were approved in accordance with the Audit Committee's Pre-Approval Policy. As a result, none of such services was approved pursuant to paragraph (c) (7) (i) (c) of Rule 2-01 of Regulation S-X. |
| (f) | None of the hours expended on the principal accountant's engagement to audit the registrant's financial statements for the year ended October 31, 2014, were attributed to work performed by persons other than the principal accountant's full-time, permanent employees. |
| (g) | The aggregate non-audit fees billed by the registrant’s accountant for services rendered to the registrant, and rendered to the registrant’s investment adviser (not including any sub-adviser whose role is primarily portfolio management and is subcontracted with or overseen by another investment adviser), and any entity controlling, controlled by, or under common control with the adviser that provides ongoing services to the registrant for each of the last two fiscal years of the registrant were: |
Non-Audit Fees: $3,731,461 for the fiscal year ended October 31, 2013; $1,646,194 for the fiscal year ended October 31, 2014.
| (h) | The registrant’s audit committee of the board of directors has considered whether the provision of non-audit services that were rendered to the registrant’s investment adviser (not including any sub-adviser whose role is primarily portfolio management and is subcontracted with or overseen by another investment adviser), and any entity controlling, controlled by, or under common control with the investment adviser that provides ongoing services to the registrant that were not pre-approved pursuant to paragraph (c)(7)(ii) of Rule 2-01 of Regulation S-X is compatible with maintaining the principal accountant’s independence. |
Item 5. Audit Committee of Listed Registrants.
Not applicable.
Item 6. Investments
| (a) | The Schedule of Investments in securities of unaffiliated issuers as of the close of the reporting period is included as part of the annual report filed under Item 1 of this form. |
| (b) | Not applicable. |
Item 7. Disclosure of Proxy Voting Policies and Procedures for Closed-End Management Investment Companies.
Not applicable.
Item 8. Portfolio Managers of Closed-End Management Investment Companies.
Not applicable.
Item 9. Purchases of Equity Securities by Closed-End Management Investment Company and Affiliated Purchasers.
Not applicable.
Item 10. Submission of Matters to a Vote of Security Holders
There have been no material changes to the procedures by which shareholders may recommend nominees to the registrant’s board of directors since registrant last provided disclosure in response to this requirement.
Item 11. Controls and Procedures.
| (a) | The registrant’s principal executive and principal financial officers, or persons performing similar functions, have concluded that the registrant’s disclosure controls and procedures (as defined in Rule 30a-3(c) under the Investment Company Act of 1940, as amended (the “1940 Act”) (17 CFR 270.30a-3(c))) are generally effective to provide reasonable assurance, as of a date within 90 days of the filing date of the report that includes the disclosure required by this paragraph, based on their evaluation of these controls and procedures required by Rule 30a-3(b) under the 1940 Act (17 CFR 270.30a-3(b)) and Rules 13a-15(b) or 15d-15(b) under the Securities Exchange Act of 1934, as amended (17 CFR 240.13a-15(b) or 240.15d-15(b)). |
| (b) | There were no changes in the registrant’s internal control over financial reporting (as defined in Rule 30a-3(d) under the 1940 Act (17 CFR 270.30a-3(d)) that occurred during the registrant’s second fiscal quarter of the period covered by this report that have materially affected, or is reasonably likely to materially affect, the registrant’s internal control over financial reporting. |
Item 12. Exhibits.
(a)(1) Code of Ethics
(a)(2) Separate certifications for each principal executive officer and principal financial officer of the registrant as required by Rule 30a-2(a) under the 1940 Act (17 CFR 270.30a-2(a)) and Section 302 of the Sarbanes-Oxley Act of 2002 are attached hereto.
(a)(3) Not applicable
(b) Certifications pursuant to Rule 30a-2(b) under the 1940 Act and Section 906 of the Sarbanes-Oxley Act of 2002 are attached hereto.
SIGNATURES
Pursuant to the requirements of the Securities Exchange Act of 1934 and the Investment Company Act of 1940, the registrant has duly caused this report to be signed on its behalf by the undersigned, thereunto duly authorized.
| THE HARTFORD MUTUAL FUNDS, INC. | |
| Date: December 16, 2014 | By: /s/ James E. Davey__________ |
| James E. Davey, President and | |
| Chief Executive Officer |
Pursuant to the requirements of the Securities Exchange Act of 1934 and the Investment Company Act of 1940, this report has been signed below by the following persons on behalf of the registrant and in the capacities and on the dates indicated.
| Date: December 16, 2014 | By: /s/ James E. Davey___________ |
| James E. Davey, President and | |
| Chief Executive Officer | |
| Date: December 16, 2014 | By: /s/ Mark A. Annoni___________ |
| Mark A. Annoni, Vice President, | |
| Treasurer and Controller |