UNITED STATES
SECURITIES AND EXCHANGE COMMISSION
Washington, D.C. 20549
FORM N-CSR
CERTIFIED SHAREHOLDER REPORT
OF
REGISTERED MANAGEMENT INVESTMENT COMPANIES
Investment Company Act file number: 811-07537
Name of Registrant: Royce Capital Fund
Address of Registrant: 745 Fifth Avenue
New York, NY 10151
| Name and address of agent for service: | John E. Denneen, Esq. 745 Fifth Avenue New York, NY 10151 |
Registrant's telephone number, including area code: (212) 508-4500
Date of fiscal year end: December 31, 2018
Date of reporting period: January 1, 2018 – June 30, 2018
Item 1. Reports to Shareholders.
 |
| JUNE 30, 2018 | ||
| 2018 Semiannual | ||
| Review and Report to Shareholders | ||
| Royce Capital Fund– | |||
| Micro-Cap Portfolio | |||
| Royce Capital Fund– | |||
| Small-Cap Portfolio | |||
| roycefunds.com |  |
||
| Table of Contents | |||
| Semiannual Review | |||
| Letter to Our Shareholders | 1 | ||
| Performance and Expenses | 5 | ||
| Semiannual Report to Shareholders | |||
| Managers’ Discussions of Fund Performance and Schedules of Investments | |||
Royce Capital Fund–Micro-Cap Portfolio |
6 | ||
Royce Capital Fund–Small-Cap Portfolio |
12 | ||
| Financial Statements | 16 | ||
| Notes to Financial Statements | 20 | ||
| Understanding Your Fund’s Expenses | 24 | ||
| Trustees and Officers | 25 | ||
| Board Approval of Investment Advisory Agreement | 26 | ||
| Notes to Performance and Other Important Information | 27 |

| This page is not part of the Royce Capital Fund 2018 Semiannual Report to Shareholders |
Letter to Our Shareholders

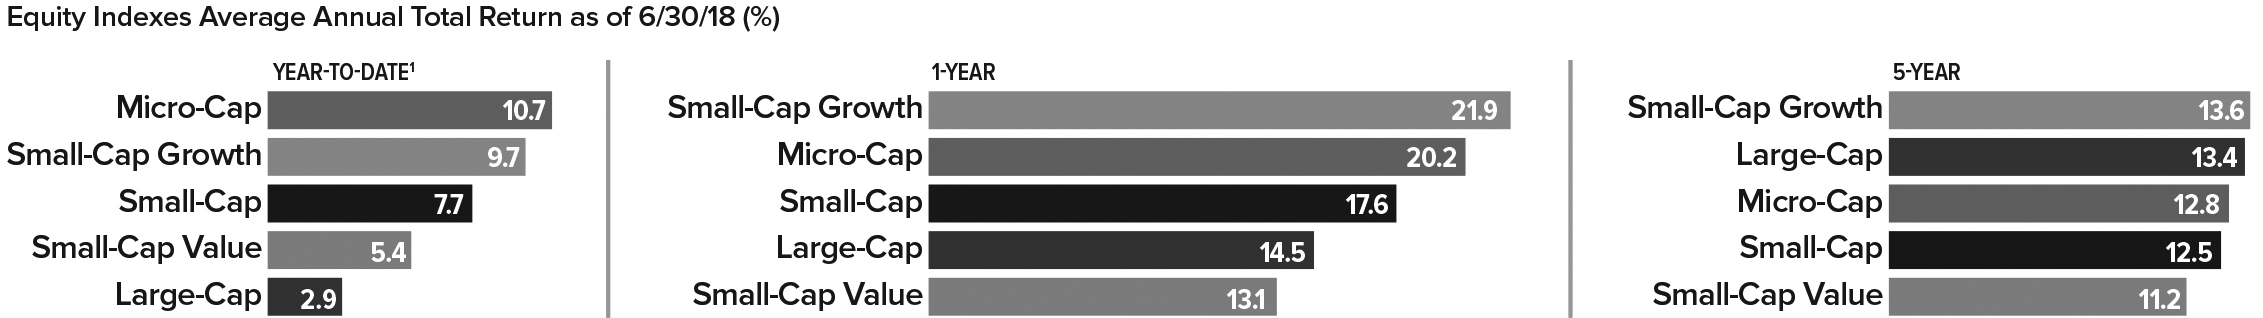 |
| Small-Cap is represented by Russell 2000; Small-Cap Value is represented by Russell 2000 Value, Small-Cap Growth is represented by Russell 2000 Growth, Large-Cap is represented by Russell 1000, Micro-Cap is represented by Russell Microcap. For details on The Royce Funds’ performance in the period, please turn to the Managers’ Discussions that begin on page 8. Past performance is no guarantee of future results. |
| 1 Not annualized. |
| This page is not part of the Royce Capital Fund 2018 Semiannual Report to Shareholders | 1 |
LETTER TO OUR SHAREHOLDERS
| 2 | This page is not part of the Royce Capital Fund 2018 Semiannual Report to Shareholders |
LETTER TO OUR SHAREHOLDERS
| This page is not part of the Royce Capital Fund 2018 Semiannual Report to Shareholders | 3 |
LETTER TO OUR SHAREHOLDERS
| Sincerely, |
 |
 |
 |
||
| Charles M. Royce | Christopher D. Clark | Francis D. Gannon | ||
| Chairman, | Chief Executive Officer, and | Co-Chief Investment Officer, | ||
| Royce & Associates, LP | Co-Chief Investment Officer, | Royce & Associates, LP | ||
| Royce & Associates, LP | ||||
| July 30, 2018 |
| 4 | This page is not part of the Royce Capital Fund 2018 Semiannual Report to Shareholders |
Performance and Expenses
| Performance and Expenses |
| As of June 30, 2018 |
| YTD1 | 1-YR | 3-YR | 5-YR | 10-YR | 15-YR | 20-YR | SINCE INCEPTION (12/27/96) |
ANNUAL OPERATING EXPENSES (%) |
||||||||||||||
| Royce Capital Fund–Micro-Cap Portfolio | 10.31 | 14.08 | 7.11 | 6.55 | 5.34 | 8.04 | 9.63 | 10.21 | 1.42 | |||||||||||||
| Royce Capital Fund–Small-Cap Portfolio | 7.06 | 17.72 | 6.48 | 8.29 | 7.81 | 10.00 | 10.13 | 10.80 | 1.08 | |||||||||||||
INDEX |
||||||||||||||||||||||
| Russell Microcap Index | 10.71 | 20.21 | 10.49 | 12.78 | 10.63 | 9.44 | N/A | N/A | N/A | |||||||||||||
| Russell 2000 Index | 7.66 | 17.57 | 10.96 | 12.46 | 10.60 | 10.50 | 8.03 | N/A | N/A | |||||||||||||
| 1 Not annualized. | ||||||||||||||||||||||
Important Performance, Expense, and Risk Information
All performance information in this Review and Report reflects past performance, is presented on a total return basis, reflects the reinvestment of distributions, and does not reflect the deduction of taxes that a shareholder would pay on fund distributions or the redemption of fund shares. Past performance is no guarantee of future results. Investment return and principal value of an investment will fluctuate, so that shares may be worth more or less than their original cost when redeemed. Current performance may be higher or lower than performance quoted and may be obtained at www.roycefunds.com. The Funds’ total returns do not reflect any deduction for charges or expenses of the variable contracts investing in the Funds. All performance and expense information reflects the result for each Fund’s Investment Class Shares. Gross annual operating expenses reflect each Fund’s gross total annual operating expenses and include management fees, operating expenses, and any applicable acquired fund fees and expenses. Net annual operating expenses reflect contractual fee waivers and/or expense reimbursements. All expense information is reported as of each fund’s most current prospectus. Royce & Associates has contractually agreed to waive fees and/or reimburse operating expenses, excluding brokerage commissions, taxes, interest litigation expenses, acquired fund fees and expenses, and other expenses not borne in the ordinary cost of business, to the extent necessary to maintain net operating expenses at or below 1.33% for Royce Capital Fund–Micro-Cap Portfolio, and at or below 1.08% for Royce Capital Fund–Small-Cap Portfolio through April 30, 2019. Acquired fund fees and expenses reflect the estimated amount of fees and expenses incurred indirectly by the Fund through its investment in mutual funds, hedge funds, private equity funds, and other investment companies.
Service Class Shares bear an annual distribution expense that is not borne by the Investment Class; if those expenses were reflected, total returns would have been lower. Royce Micro-Cap Portfolio invests primarily in micro-cap companies while Royce Small-Cap Portfolio invests primarily in small-cap companies. Investments in micro-cap and small-cap companies may involve considerably more risk than investments in securities of larger-cap companies. (Please see “Primary Risks for Fund Investors” in the prospectus.) Each series of Royce Capital Fund may invest up to 25% of its net assets in foreign securities. Investments in foreign securities may involve political, economic, currency, and other risks not encountered in U.S. investments. (Please see “Investing in Foreign Securities” in the prospectus.) As of 6/30/18, Royce Small-Cap Portfolio invested a significant portion of its assets in a limited number of stocks, which may involve considerably more risk than a more broadly diversified portfolio because a decline in the value of any one of these stocks would cause the Portfolio’s overall value to decline to a greater degree. Royce Micro-Cap Portfolio’s broadly diversified portfolio does not ensure a profit or guarantee against loss. (Please see “Primary Risks for Fund Investors” in the prospectus.) This Review and Report must be preceded or accompanied by a prospectus. Please read the prospectus carefully before investing or sending money. Russell Investment Group is the source and owner of the trademarks, service marks, and copyrights related to the Russell Indexes. Russell® is a trademark of Russell Investment Group. The Russell Microcap Index includes 1,000 of the smallest securities in the small-cap Russell 2000 Index along with the next smallest eligible securities as determined by Russell. The Russell 2000 Index is an unmanaged, capitalization-weighted index of domestic small-cap stocks. It measures the performance of the 2,000 smallest publicly traded U.S. companies in the Russell 3000 Index. The performance of an index does not represent exactly any particular investment, as you cannot invest directly in an index. Distributor: Royce Fund Services, LLC.
| This page is not part of the Royce Capital Fund 2018 Semiannual Report to Shareholders | 5 |
| MANAGERS’ DISCUSSION |
| Royce Capital Fund–Micro-Cap Portfolio (RCM) |
 |
| Jim Stoeffel Brendan Hartman |
| FUND PERFORMANCE |
| Royce Capital Fund–Micro Cap Portfolio increased 10.3% for the year-to-date period ended June 30, 2018, ahead of the small-cap Russell 2000 Index, which was up 7.7%, but narrowly behind its benchmark, the Russell Microcap Index, which increased 10.7% for the same period. Micro-cap stocks were the top-performing U.S. asset class in the first half of the year, as the greater reliance on U.S. growth left small- and micro-cap stocks better positioned for superior performance relative to large-caps in the first half of the year. |
| WHAT WORKED... AND WHAT DIDN’T |
| The Fund boasted strong sector contributions from Information Technology, Health Care, and Consumer Discretionary, while two healthcare companies made strong positive impacts at the position level. Tactile Systems, which makes medical devices used to treat lymphedema, grew its sales force and introduced new products, such as its new system targeted at head and neck lymphedema. Seeing low market penetration and a favorable competitive environment, we continued to hold shares after making modest trims as its stock price rose. Medical device company Surmodics, which specializes in coronary stents and catheters, was another notable pick for the portfolio. A recent agreement gave Abbot Laboratories exclusive global commercialization rights for the company’s SurVeil drug. We saw an extended pipeline of interesting products and therefore maintained our position in the company’s shares. |
| We reduced our stake in Profire Energy, an oilfield technology specialist in burner management systems that was the portfolio’s top contributor overall. It benefited from the resurgence in oil field activity fueled by higher oil prices. We held our stock in Attunity, a leading provider of data management software, because we saw an increased adoption of its core software platform across an ever increasing number of enterprises. The company’s software addresses new paradigms in data management, which we believed were in the very early stages of adoption. Stoneridge, which supplies electrical components to cars and trucks, was winning new business across several product lines, such as its MirrorEye camera system that offers safety and fuel economy benefits by replacing side mirrors on trucks. We sold a portion of our shares as its share price rose steadily. We also saw positive contributions to return on these positions in relation to the Russell Microcap. |
| Thanks to effective stock selection, Consumer Discretionary and Information Technology were the areas that contributed most to performance versus the benchmark, while Energy and Financials were the largest detractors—both due to poor stock picking. One position significantly detracted from performance on both an absolute and relative basis: Basic Energy Services, a leading provider of well site services in the oil and gas industry, saw increased pricing pressure as well as project delays in certain markets. We increased our stake slightly within the first six months of the year based on the belief that these pressures were transitory given ongoing strength in underlying energy prices. Gulf Island Fabrication makes specialized structures and marine vessels used in the energy sector. Its shares have been pressured as its off-shore oil well platform business remained sluggish while it also experienced cost overruns on a major marine vessel contract. |
| Atlas Financial, which provides insurance for taxis, limos, ride share services, and paratransit transportation firms, was another impactful detractor on an absolute and relative basis. For a second year in a row, Atlas recorded a surprise fourth-quarter loss due to an increase in loss reserves for prior year accidents. Our belief that the first surprise loss was an anomaly and that the company’s market niche could provide high returns on equity was proven incorrect. We sold all of our shares as a result. Shares of Paratek Pharmaceuticals fell due to concerns over incremental FDA approval scrutiny, the potential for a slow commercial ramp up, and a capital raise in April. We increased our position in the first half because of the large market opportunity for a new antibiotic associated with the increased human resistance to older varieties. We chose to trim our position in U.S. Concrete, which saw its shares pressured as poor weather impacted certain large markets and the company had some early execution shortfalls digesting a large acquisition. |
| Top Contributors to Performance | ||||
| Year-to-Date Through 6/30/18 (%)1 | ||||
| Profire Energy | 0.60 | |||
| Tactile Systems Technology | 0.58 | |||
| Surmodics | 0.58 | |||
| Attunity | 0.54 | |||
| Stoneridge | 0.49 | |||
| 1 Includes dividends | ||||
| Top Detractors from Performance | ||||
| Year-to-Date Through 6/30/18 (%)2 | ||||
| Atlas Financial Holdings | -0.46 | |||
| Basic Energy Services | -0.40 | |||
| U.S. Concrete | -0.29 | |||
| Paratek Pharmaceuticals | -0.27 | |||
| Gulf Island Fabrication | -0.24 | |||
| 2 Net of dividends | ||||
| CURRENT POSITIONING AND OUTLOOK |
| We did not make any major changes to portfolio positioning in the first half of 2018. Despite the increasing uncertainty around trade, we remained generally constructive on the U.S. economy, which supported underlying growth and valuations in our overweight sectors, such as Information Technology, Industrials, and Consumer Discretionary. These sectors were also our largest overweights relative to the Russell Microcap. Health Care, particularly biotechnology, continued to be among our largest underweights by nearly 50%. We remained optimistic about micro-cap stocks in anticipation of an increasingly less restrictive regulatory environment. Considering the accelerated pace of U.S. economic growth, lower corporate tax rates, and the slower pace of global economic growth, we were particularly focused on micro-cap companies that had a disproportionate exposure to the U.S. economy. |
| 6 | Royce Capital Fund 2018 Semiannual Report to Shareholders |
| PERFORMANCE AND PORTFOLIO REVIEW | TICKER SYMBOLS RCMCX RCMSX |
| Performance and Expenses | ||||||||||||||||
| Average Annual Total Return (%) Through 6/30/18 | ||||||||||||||||
| JAN-JUN 20181 | 1-YR | 3-YR | 5-YR | 10-YR | 15-YR | 20-YR | SINCE INCEPTION (12/27/96) | |||||||||
| RCM | 10.31 | 14.08 | 7.11 | 6.55 | 5.34 | 8.04 | 9.63 | 10.21 | ||||||||
| Annual Gross Operating Expenses: 1.47% Annual Net Operating Expenses: 1.42% | ||||||||||||||||
| 1 Not annualized | ||||||||||||||||
Relative Returns: Monthly Rolling Average Annual Return Periods
| On a monthly rolling basis, the Fund outperformed the Russell Microcap in 57% of all 10-year periods; 58% of all 5-year periods; and 48% of all 1-year periods. |
| PERIODS BEATING THE INDEX | FUND AVG (%)1 | INDEX AVG (%)1 | ||||||||||
| 10-year | 55/97 | 57% | 6.8 | 6.4 | ||||||||
| 5-year | 91/157 | 58% | 7.7 | 8.3 | ||||||||
| 1-year | 99/205 | 48% | 10.4 | 10.8 | ||||||||
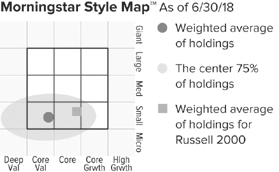
The Morningstar Style Map is the Morningstar
Style BoxTM with the center 75% of
fund holdings plotted as the Morningstar
Ownership ZoneTM. The Morningstar Style Box is designed to reveal a
fund’s investment strategy. The Morningstar Ownership Zone provides
detail about a portfolio’s investment style by showing the range of
stock sizes and styles. The Ownership Zone is derived by plotting each
stock in the portfolio within the proprietary Morningstar Style Box.
Over time, the shape and location of a fund's ownership zone may vary.
See page 27 for additional information. |
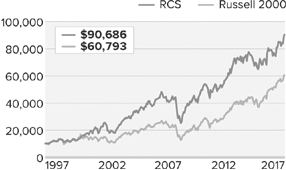
Value of $10,000
as of 6/30/18 ($)
Includes reinvestment of distributions.
| Top 10 Positions | ||
| % of Net Assets | ||
| AtriCure | 1.2 | |
| Attunity | 1.1 | |
| Stoneridge | 1.1 | |
| Shoe Carnival | 1.1 | |
| Surmodics | 1.1 | |
| CryoLife | 1.1 | |
| PC Connection | 1.0 | |
| Red Lion Hotels | 1.0 | |
| QAD Cl. A | 1.0 | |
| Vishay Precision Group | 1.0 | |
| Portfolio Sector Breakdown | ||
| % of Net Assets | ||
| Information Technology | 19.6 | |
| Industrials | 19.2 | |
| Financials | 15.2 | |
| Consumer Discretionary | 14.3 | |
| Health Care | 11.4 | |
| Energy | 6.3 | |
| Materials | 4.5 | |
| Consumer Staples | 2.4 | |
| Real Estate | 2.4 | |
| Telecommunication Services | 0.6 | |
| Cash and Cash Equivalents | 4.1 | |
| Calendar Year Total Returns (%) | ||
| YEAR | RCM | |
| 2017 | 5.2 | |
| 2016 | 19.7 | |
| 2015 | -12.5 | |
| 2014 | -3.6 | |
| 2013 | 21.0 | |
| 2012 | 7.6 | |
| 2011 | -12.1 | |
| 2010 | 30.1 | |
| 2009 | 57.9 | |
| 2008 | -43.3 | |
| 2007 | 4.0 | |
| 2006 | 21.1 | |
| 2005 | 11.6 | |
| 2004 | 13.8 | |
| 2003 | 49.2 | |
| Upside/Downside Capture Ratios | ||||
| Periods Ended 6/30/18 (%) | ||||
| UPSIDE | DOWNSIDE | |||
| 10-Year | 76 | 99 | ||
| From 6/30/00 (Russell Microcap Inception) |
88 | 77 | ||
| Portfolio Diagnostics | ||
| Fund Net Assets | $195 million | |
| Number of Holdings | 145 | |
| Turnover Rate | 14% | |
| Average Market Capitalization1 | $485 million | |
| Weighted Average P/E Ratio2,3 | 23.6x | |
| Weighted Average P/B Ratio2 | 2.1x | |
| Active Share4 | 90% | |
| U.S. Investments (% of Net Assets) | 84.2% | |
| Non-U.S. Investments (% of Net Assets) | 11.7% | |
| 1 | Geometric Average. This weighted calculation uses each portfolio
holding’s market cap in a way designed to not skew the effect of
very large or small holdings; instead, it aims to better identify
the portfolio’s center, which Royce believes offers a more accurate
measure of average market cap than a simple mean or median. |
| 2 | Harmonic Average. This weighted calculation evaluates a portfolio
as if it were a single stock and measures it overall. It compares the
total market value of the portfolio to the portfolio’s share in the
earnings or book value, as the case may be, of its underlying stocks. |
| 3 | The Fund’s P/E ratio calculation excludes companies with zero or
negative earnings (27% of portfolio holdings as of 6/30/18). |
| 4 | Active Share is the sum of the absolute values of the different
weightings of each holding in the Fund versus each holding in the
benchmark, divided by two. |
| Important Performance and Expense Information
All performance information in this Report reflects past performance, is presented on a total return basis, reflects the reinvestment of distributions, and does not reflect the deduction of taxes that a shareholder would pay on fund distributions or the redemption of fund shares. Past performance is no guarantee of future results. Investment return and principal value of an investment will fluctuate, so that shares may be worth more or less than their original cost when redeemed. Current performance may be higher or lower than performance quoted. The Fund’s total returns do not reflect any deduction for charges or expenses of the variable contracts investing in the Fund. Returns as of the most recent month-end may be obtained at www.roycefunds.com. All performance and risk information reflects the result of the Investment Class (its oldest class). Shares of RCM’s Service Class bear an annual distribution expense that is not borne by the Investment Class; if those expenses were reflected, total returns would have been lower. Certain immaterial adjustments were made to the net assets of Royce Capital Fund-Micro-Cap Portfolio at 12/31/17 for financial reporting purposes, and as a result the calendar year total returns based on those net assets values differ from the adjusted net values and calendar year total returns reported in the Financial Highlights. The Fund’s total returns do not reflect any deduction for charges or expenses of the variable contracts investing in the Fund. Gross operating expenses reflect the Fund’s total gross operating expenses for the Investment Class and include management fees, other expenses, and acquired fund fees and expenses. Net operating expenses reflect contractual fee waivers and/or expense reimbursements. All expense information is reported as of the Fund’s most current prospectus. Royce & Associates has contractually agreed, without right of termination, to waive fees and/or reimburse expenses to the extent necessary to maintain the Investment Class’s net annual operating expenses (excluding brokerage commissions, taxes, interest, litigation expenses, acquired fund fees and expenses, and other expenses not borne in the ordinary course of business) at or below 1.33% through April 30, 2019. Acquired fund fees and expenses reflect the estimated amount of the fees and expenses incurred indirectly by the Fund through its investments in mutual funds, hedge funds, private equity funds, and other investment companies. Regarding the “Top Contributors” and “Top Detractors” tables shown above, the sum of all contributors to, and all detractors from, performance for all securities in the portfolio would approximate the Fund’s year-to-date performance for 2018. Upside Capture Ratio measures a manager’s performance in up markets relative to the Fund’s benchmark. It is calculated by measuring the Fund’s performance in quarters when the benchmark went up and dividing it by the benchmark’s return in those quarters. Downside Capture Ratio measures a manager’s performance in down markets relative to the Fund’s benchmark (Russell Microcap). It is calculated by measuring the Fund’s performance in quarters when the benchmark goes down and dividing it by the benchmark’s return in those quarters. |
| Royce Capital Fund 2018 Semiannual Report to Shareholders | 7 |
Schedule of Investments
| Royce Capital Fund - Micro-Cap Portfolio | |||||||
| Common Stocks – 95.9% | |||||||
| SHARES | VALUE | ||||||
| CONSUMER DISCRETIONARY – 14.3% | |||||||
| AUTO COMPONENTS - 3.4% | |||||||
Fox Factory Holding 1 |
33,800 | $ | 1,573,390 | ||||
Standard Motor Products |
31,100 | 1,503,374 | |||||
Stoneridge 1 |
62,100 | 2,182,194 | |||||
Unique Fabricating |
153,300 | 1,339,842 | |||||
| 6,598,800 | |||||||
| HOTELS, RESTAURANTS & LEISURE - 1.9% | |||||||
Del Taco Restaurants 1 |
121,400 | 1,721,452 | |||||
| 13,400 | 177,550 | ||||||
Red Lion Hotels 1 |
161,800 | 1,884,970 | |||||
| 3,783,972 | |||||||
| HOUSEHOLD DURABLES - 1.1% | |||||||
Cavco Industries 1 |
6,404 | 1,329,791 | |||||
| 39,000 | 809,250 | ||||||
| 2,139,041 | |||||||
| INTERNET & DIRECT MARKETING RETAIL - 0.7% | |||||||
Gaia Cl. A 1 |
62,100 | 1,257,525 | |||||
| LEISURE PRODUCTS - 1.7% | |||||||
MCBC Holdings 1 |
59,117 | 1,711,437 | |||||
Nautilus 1 |
106,900 | 1,678,330 | |||||
| 3,389,767 | |||||||
| SPECIALTY RETAIL - 4.2% | |||||||
Build-A-Bear Workshop 1 |
132,500 | 1,007,000 | |||||
Citi Trends |
55,886 | 1,533,512 | |||||
Francesca’s Holdings 1 |
101,400 | 765,570 | |||||
Haverty Furniture |
66,300 | 1,432,080 | |||||
Kirkland’s 1 |
103,000 | 1,198,920 | |||||
Shoe Carnival |
66,700 | 2,164,415 | |||||
| 8,101,497 | |||||||
| TEXTILES, APPAREL & LUXURY GOODS - 1.3% | |||||||
Culp |
30,649 | 752,433 | |||||
Vera Bradley 1 |
129,300 | 1,815,372 | |||||
| 2,567,805 | |||||||
| Total (Cost $19,207,817) | 27,838,407 | ||||||
| CONSUMER STAPLES – 2.4% | |||||||
| BEVERAGES - 0.9% | |||||||
Primo Water 1 |
100,500 | 1,757,745 | |||||
| FOOD PRODUCTS - 1.5% | |||||||
Farmer Bros. 1 |
47,800 | 1,460,290 | |||||
John B. Sanfilippo & Son |
20,900 | 1,556,005 | |||||
| 3,016,295 | |||||||
| Total (Cost $3,811,088) | 4,774,040 | ||||||
| ENERGY – 6.3% | |||||||
| ENERGY EQUIPMENT & SERVICES - 4.9% | |||||||
Basic Energy Services 1 |
72,000 | 799,920 | |||||
Computer Modelling Group |
133,400 | 1,024,866 | |||||
Gulf Island Fabrication |
92,634 | 833,706 | |||||
Independence Contract Drilling 1 |
316,500 | 1,303,980 | |||||
Natural Gas Services Group 1 |
60,800 | 1,434,880 | |||||
Newpark Resources 1 |
158,400 | 1,718,640 | |||||
Profire Energy 1 |
423,729 | 1,432,204 | |||||
Total Energy Services |
123,500 | 1,091,598 | |||||
| 9,639,794 | |||||||
| OIL, GAS & CONSUMABLE FUELS - 1.4% | |||||||
Ardmore Shipping 1 |
205,800 | 1,687,560 | |||||
Panhandle Oil and Gas Cl. A |
53,800 | 1,027,580 | |||||
| 2,715,140 | |||||||
| Total (Cost $11,425,618) | 12,354,934 | ||||||
| FINANCIALS – 15.2% | |||||||
| BANKS - 6.5% | |||||||
Allegiance Bancshares 1 |
31,200 | 1,352,520 | |||||
| 8,782 | 217,354 | ||||||
Blue Hills Bancorp |
76,400 | 1,696,080 | |||||
Brookline Bancorp |
64,200 | 1,194,120 | |||||
Caribbean Investment Holdings 1 |
1,751,547 | 404,531 | |||||
County Bancorp |
50,200 | 1,380,500 | |||||
HarborOne Bancorp 1 |
77,200 | 1,462,168 | |||||
| 7,500 | 211,125 | ||||||
†Investar Holding |
27,500 | 760,375 | |||||
| 1,751,577 | 0 | ||||||
Stewardship Financial |
92,000 | 1,071,800 | |||||
TriState Capital Holdings 1 |
56,072 | 1,463,479 | |||||
Two River Bancorp |
72,400 | 1,385,012 | |||||
| 12,599,064 | |||||||
| CAPITAL MARKETS - 4.4% | |||||||
B. Riley Financial |
57,800 | 1,303,390 | |||||
Canaccord Genuity Group |
291,800 | 1,611,431 | |||||
GAIN Capital Holdings |
141,600 | 1,069,080 | |||||
Gluskin Sheff + Associates |
117,300 | 1,465,079 | |||||
Silvercrest Asset Management Group Cl. A |
103,900 | 1,693,570 | |||||
Westwood Holdings Group |
25,727 | 1,531,786 | |||||
| 8,674,336 | |||||||
| DIVERSIFIED FINANCIAL SERVICES - 0.2% | |||||||
| 1,302,000 | 390,600 | ||||||
| INSURANCE - 1.0% | |||||||
Blue Capital Reinsurance Holdings |
75,292 | 831,977 | |||||
| 34,900 | 1,129,015 | ||||||
| 1,960,992 | |||||||
| THRIFTS & MORTGAGE FINANCE - 3.1% | |||||||
Federal Agricultural Mortgage |
17,700 | 1,583,796 | |||||
PCSB Financial |
70,400 | 1,398,848 | |||||
Territorial Bancorp |
45,900 | 1,422,900 | |||||
Western New England Bancorp |
139,954 | 1,539,494 | |||||
| 5,945,038 | |||||||
| Total (Cost $26,988,927) | 29,570,030 | ||||||
| HEALTH CARE – 11.4% | |||||||
| BIOTECHNOLOGY - 2.1% | |||||||
BioSpecifics Technologies 1 |
31,500 | 1,413,090 | |||||
Progenics Pharmaceuticals 1 |
173,800 | 1,397,352 | |||||
Zealand Pharma 1 |
92,658 | 1,219,958 | |||||
| 4,030,400 | |||||||
| HEALTH CARE EQUIPMENT & SUPPLIES - 5.6% | |||||||
AtriCure 1 |
84,600 | 2,288,430 | |||||
| 132,900 | 1,475,190 | ||||||
CryoLife 1 |
74,889 | 2,085,659 | |||||
OrthoPediatrics Corporation 1 |
41,200 | 1,097,568 | |||||
Surmodics 1 |
38,078 | 2,101,905 | |||||
| 34,800 | 1,809,600 | ||||||
| 10,858,352 | |||||||
| LIFE SCIENCES TOOLS & SERVICES - 2.0% | |||||||
Harvard Bioscience 1 |
321,568 | 1,720,389 | |||||
| 8 | Royce Capital Fund 2018 Semiannual Report to Shareholders | THE ACCOMPANYING NOTES ARE AN INTEGRAL PART OF THESE FINANCIAL STATEMENTS |
| June 30, 2018 (unaudited) |
| Royce Capital Fund - Micro-Cap Portfolio (continued) | |||||||
| SHARES | VALUE | ||||||
| HEALTH CARE (continued) | |||||||
| LIFE SCIENCES TOOLS & SERVICES (continued) | |||||||
NeoGenomics 1 |
99,400 | $ | 1,303,134 | ||||
| 67,800 | 973,608 | ||||||
| 3,997,131 | |||||||
| PHARMACEUTICALS - 1.7% | |||||||
BioDelivery Sciences International 1 |
411,700 | 1,214,515 | |||||
| 134,400 | 1,076,544 | ||||||
Paratek Pharmaceuticals 1 |
78,600 | 801,720 | |||||
| 246,900 | 0 | ||||||
| 75,800 | 270,606 | ||||||
| 3,363,385 | |||||||
| Total (Cost $14,554,300) | 22,249,268 | ||||||
| INDUSTRIALS – 19.2% | |||||||
| AEROSPACE & DEFENSE - 1.5% | |||||||
Astronics Corporation 1 |
28,545 | 1,026,764 | |||||
CPI Aerostructures 1 |
174,344 | 1,830,612 | |||||
| 2,857,376 | |||||||
| COMMERCIAL SERVICES & SUPPLIES - 1.7% | |||||||
Acme United |
45,065 | 935,099 | |||||
Heritage-Crystal Clean 1 |
48,834 | 981,563 | |||||
Viad Corporation |
24,100 | 1,307,425 | |||||
| 3,224,087 | |||||||
| CONSTRUCTION & ENGINEERING - 1.2% | |||||||
| 50,000 | 658,500 | ||||||
Northwest Pipe 1 |
86,700 | 1,679,379 | |||||
| 2,337,879 | |||||||
| ELECTRICAL EQUIPMENT - 1.3% | |||||||
| 169,500 | 1,186,500 | ||||||
Encore Wire |
30,100 | 1,428,245 | |||||
| 2,614,745 | |||||||
| INDUSTRIAL CONGLOMERATES - 0.6% | |||||||
Raven Industries |
32,900 | 1,265,005 | |||||
| MACHINERY - 7.8% | |||||||
Alimak Group |
84,600 | 1,295,908 | |||||
Exco Technologies |
156,700 | 1,059,645 | |||||
FreightCar America 1 |
79,691 | 1,338,012 | |||||
Global Brass and Copper Holdings |
39,900 | 1,250,865 | |||||
Graham Corporation |
67,020 | 1,729,786 | |||||
Greenbrier Companies (The) |
21,600 | 1,139,400 | |||||
Kadant |
16,331 | 1,570,226 | |||||
| 97,600 | 1,737,280 | ||||||
Lindsay Corporation |
16,700 | 1,619,733 | |||||
Lydall 1 |
33,300 | 1,453,545 | |||||
Sun Hydraulics |
21,100 | 1,016,809 | |||||
| 15,211,209 | |||||||
| MARINE - 0.6% | |||||||
Clarkson |
38,100 | 1,156,497 | |||||
| PROFESSIONAL SERVICES - 3.7% | |||||||
CRA International |
23,006 | 1,170,775 | |||||
GP Strategies 1 |
72,908 | 1,283,181 | |||||
Heidrick & Struggles International |
34,800 | 1,218,000 | |||||
Kforce |
51,800 | 1,776,740 | |||||
Resources Connection |
103,954 | 1,756,823 | |||||
| 7,205,519 | |||||||
| ROAD & RAIL - 0.8% | |||||||
Marten Transport |
66,341 | 1,555,696 | |||||
| Total (Cost $24,880,905) | 37,428,013 | ||||||
| INFORMATION TECHNOLOGY – 19.6% | |||||||
| COMMUNICATIONS EQUIPMENT - 1.0% | |||||||
Digi International 1 |
91,500 | 1,207,800 | |||||
EMCORE Corporation 1 |
134,300 | 678,215 | |||||
| 1,886,015 | |||||||
| ELECTRONIC EQUIPMENT, INSTRUMENTS & COMPONENTS - 6.5% | |||||||
| 63,500 | 583,565 | ||||||
CUI Global 1 |
298,762 | 887,323 | |||||
| 48,400 | 763,268 | ||||||
ePlus 1 |
14,692 | 1,382,517 | |||||
Fabrinet 1 |
45,569 | 1,681,041 | |||||
Mesa Laboratories |
8,600 | 1,815,288 | |||||
| 14,800 | 489,288 | ||||||
Novanta 1 |
21,400 | 1,333,220 | |||||
PC Connection |
56,900 | 1,889,080 | |||||
Vishay Precision Group 1 |
48,700 | 1,857,905 | |||||
| 12,682,495 | |||||||
| INTERNET SOFTWARE & SERVICES - 1.5% | |||||||
Amber Road 1 |
153,900 | 1,448,199 | |||||
QuinStreet 1 |
122,500 | 1,555,750 | |||||
| 3,003,949 | |||||||
| IT SERVICES - 1.4% | |||||||
Cass Information Systems |
23,540 | 1,620,023 | |||||
Computer Task Group 1 |
137,342 | 1,063,027 | |||||
| 2,683,050 | |||||||
| SEMICONDUCTORS & SEMICONDUCTOR EQUIPMENT - 5.3% | |||||||
Brooks Automation |
41,000 | 1,337,420 | |||||
| 92,500 | 825,100 | ||||||
NeoPhotonics Corporation 1 |
218,600 | 1,361,878 | |||||
| 46,300 | 1,261,675 | ||||||
Photronics 1 |
185,500 | 1,479,362 | |||||
Rudolph Technologies 1 |
43,093 | 1,275,553 | |||||
Silicon Motion Technology ADR |
26,900 | 1,422,741 | |||||
Ultra Clean Holdings 1 |
81,000 | 1,344,600 | |||||
| 10,308,329 | |||||||
| SOFTWARE - 3.0% | |||||||
Agilysys 1 |
45,200 | 700,600 | |||||
Attunity 1 |
188,100 | 2,183,841 | |||||
QAD Cl. A |
37,100 | 1,860,565 | |||||
SeaChange International 1 |
312,900 | 1,070,118 | |||||
| 5,815,124 | |||||||
| TECHNOLOGY HARDWARE, STORAGE & PERIPHERALS - 0.9% | |||||||
†AstroNova |
29,400 | 554,190 | |||||
Super Micro Computer 1 |
53,611 | 1,267,900 | |||||
| 1,822,090 | |||||||
| Total (Cost $28,288,657) | 38,201,052 | ||||||
| MATERIALS – 4.5% | |||||||
| CHEMICALS - 1.9% | |||||||
FutureFuel Corporation |
62,400 | 874,224 | |||||
Quaker Chemical |
7,588 | 1,175,154 | |||||
Trecora Resources 1 |
116,100 | 1,724,085 | |||||
| 3,773,463 | |||||||
| CONSTRUCTION MATERIALS - 0.5% | |||||||
U.S. Concrete 1 |
16,600 | 871,500 | |||||
| METALS & MINING - 2.1% | |||||||
Haynes International |
41,970 | 1,541,978 | |||||
Major Drilling Group International 1 |
240,900 | 1,271,704 | |||||
Schnitzer Steel Industries Cl. A |
37,500 | 1,263,750 | |||||
| 4,077,432 | |||||||
| Total (Cost $6,791,092) | 8,722,395 | ||||||
| THE ACCOMPANYING NOTES ARE AN INTEGRAL PART OF THESE FINANCIAL STATEMENTS | Royce Capital Fund 2018 Semiannual Report to Shareholders | 9 |
| Schedule of Investments | June 30, 2018 (unaudited) |
| Royce Capital Fund - Micro-Cap Portfolio (continued) | |||||||
| SHARES | VALUE | ||||||
| REAL ESTATE – 2.4% | |||||||
| EQUITY REAL ESTATE INVESTMENT TRUSTS (REITS) - 0.8% | |||||||
Community Healthcare Trust |
53,100 | $ | 1,586,097 | ||||
| REAL ESTATE MANAGEMENT & DEVELOPMENT - 1.6% | |||||||
FRP Holdings 1 |
23,440 | 1,517,740 | |||||
Marcus & Millichap 1 |
41,600 | 1,622,816 | |||||
| 3,140,556 | |||||||
| Total (Cost $2,956,700) | 4,726,653 | ||||||
| TELECOMMUNICATION SERVICES – 0.6% | |||||||
| DIVERSIFIED TELECOMMUNICATION SERVICES - 0.6% | |||||||
ORBCOMM 1 |
117,500 | 1,186,750 | |||||
| Total (Cost $736,738) | 1,186,750 | ||||||
| TOTAL COMMON STOCKS | |||||||
| (Cost $139,641,842) | 187,051,542 | ||||||
| REPURCHASE AGREEMENT – 4.3% | |||||||
|
Fixed Income Clearing Corporation, 0.35% dated 6/29/18, due 7/2/18, maturity value
$8,427,246 (collateralized by obligations of various U.S. Government Agencies, 1.375% due 10/07/21, valued at $8,599,601) |
|||||||
| (Cost $8,427,000) | 8,427,000 | ||||||
| COLLATERAL RECEIVED FOR SECURITIES LOANED – 1.4% | |||||||
| Money Market Funds | |||||||
Federated Government Obligations Fund (7 day yield-1.7400%) |
|||||||
| (Cost $2,783,561) | 2,783,561 | ||||||
| TOTAL INVESTMENTS – 101.6% | |||||||
| (Cost $150,852,403) | 198,262,103 | ||||||
| LIABILITIES LESS CASH AND OTHER ASSETS – (1.6)% | (3,205,195 | ) | |||||
| NET ASSETS – 100.0% | $ | 195,056,908 | |||||
| † | New additions in 2018. | |
| 1 | Non-income producing. | |
| 2 | All or a portion of these securities were on loan at June 30, 2018. | |
| 3 | Securities for which market quotations are not readily available represent 0.2% of
net assets. These securities have been valued at their fair value under procedures
approved by the Fund’s Board of Trustees. These securities are defined as Level
3 securities due to the use of significant unobservable inputs in the determination
of fair value. See Notes to Financial Statements. |
|
| Bold indicates the Fund’s 20 largest equity holdings in terms of June 30, 2018, market value. | ||
| 10 | Royce Capital Fund 2018 Semiannual Report to Shareholders | THE ACCOMPANYING NOTES ARE AN INTEGRAL PART OF THESE FINANCIAL STATEMENTS |
| This page is intentionally left blank. |
| Royce Capital Fund 2018 Semiannual Report to Shareholders | 11 |
| MANAGER’S DISCUSSION |
| Royce Capital Fund–Small-Cap Portfolio (RCS) |
 |
| Jay Kaplan, CFA |
| FUND PERFORMANCE |
| Royce Capital Fund–Small-Cap Portfolio rose 7.1% for the year-to-date period ended June 30, 2018, trailing its small-cap benchmark, the Russell 2000 Index, which was up 7.7% for the same period. The Fund narrowly outpaced the small-cap index, however, for the one-year period ended June 30, 2018, up 17.7% versus 17.6%. |
| WHAT WORKED... AND WHAT DIDN’T |
| Information Technology and Consumer Discretionary were the top-contributing sectors by a wide margin, while Utilities, where we typically have very little exposure, detracted modestly. The portfolio’s two leading industry groups—electronic equipment, instruments & components and specialty retail—came from its two top-contributing sectors. The airlines group detracted most at the industry level, followed by commercial services & supplies—both groups are in the Industrials sector. |
| Three of the portfolio’s top five positive contributors came from the electronic instruments & components industry. Two more top-10 holdings from this same group—Vishay Intertechnology, which makes semiconductor and passive component equipment, and Celestica, a contract manufacturer that offers manufacturing, hardware platform, and supply chain solutions—were also strong performers. Another contract manufacturer, Fabrinet, specializes mostly in optical components. Its shares tend to be highly volatile, so we always try to trade effectively around its occasionally extreme moves. The company’s recent growth has been strong, spurred by the ongoing adoption of cloud storage solutions, which require optical components. Insight Enterprises and PC Connection are value-add distributors that provide a wide range of IT products and solutions. Global demand has been on the rise, which has kept revenues and earnings for both companies healthy. |
| Moving from tech to transportation, the portfolio also saw a strong contribution from Stoneridge, a manufacturer of highly engineered electrical and electronic components, modules, and systems for the commercial vehicle, automotive, and agricultural vehicle markets. New management, which joined the firm a few years ago, has rolled out new products, including MirrorEye, a camera monitor system that replaces the rear- and side-view mirrors on trucks. In May, the company reported increased 2018 guidance for sales and adjusted earnings per share while also reaffirming previous margin estimates. All of this combined to keep its shares rolling. |
| Asset management business Federated Investors detracted most at the
position level, as outflows from a large equity mutual fund combined
with increased competition in money market funds to keep investors
selling. We chose to hold our shares in the expectation that the firm will
be able to rebound. We built our position in low-cost carrier Spirit Airlines, one of three holdings in the airline industry that disappointed
in the first half. Spirit saw weakness in fares, to which its stock has
historically been vulnerable, through much of 2018’s first six months.
We like its profitability and long-term prospects and were encouraged
by a recent reversal in the direction of fares. Thor Industries is
another long-time Royce favorite and a leading manufacturer of RVs
(recreational vehicles) that has emerged as an innovative industry leader
over the last several years. The firm announced record fiscal second-quarter
sales in March, but also reported higher raw material and
commodity costs. Along with concerns that its industry may have hit a
sales peak, this was enough to drive investors away. Ever contrarian, we
chose to hold our position. First-half performance versus the benchmark suffered most from sector allocation—stock selection was a strength against the Russell 2000. The portfolio’s much lower weighting in Health Care, the top performer in the benchmark, hurt most, while our greater exposure to Industrials also detracted, largely due to our overweight in airlines, where, in addition to Spirit, Allegiant Travel and Hawaiian Holdings also disappointed. Stock picking in Financials also had a negative impact. Stock selection strength could be seen in a number of sectors, with the largest positive impact coming from holdings in Consumer Discretionary, with notable outperformance in the auto components and specialty retail industries. Holdings in Consumer Staples and Real Estate also contributed positively to relative results in the first half, with our lower weighting in the latter sector also helping. |
| Top Contributors to Performance | ||||
| Year-to-Date Through 6/30/18 (%)1 | ||||
| Fabrinet | 0.74 | |||
| Stoneridge | 0.73 | |||
| Insight Enterprises | 0.63 | |||
| PC Connection | 0.62 | |||
| Village Super Market Cl. A | 0.59 | |||
| 1 Includes dividends | ||||
| Top Detractors from Performance | ||||
| Year-to-Date Through 6/30/18 (%)2 | ||||
| Federated Investors Cl. B | -0.75 | |||
| Spirit Airlines | -0.39 | |||
| Thor Industries | -0.31 | |||
| Wabash National | -0.29 | |||
| Electro Scientific Industries | -0.26 | |||
| 2 Net of dividends | ||||
| CURRENT POSITIONING AND OUTLOOK |
| As interest rates continue to rise—and rise more consistently—valuations become more and more important. Most looked high to us at the end of June, especially with current and imminent challenges, some of which investors may be overlooking. In addition to a flattened yield curve and trade war noise, we have a more challenging climate for earnings growth now that the tax cuts have been reflected and a lack of quality in earnings can be discerned in many cases throughout the small-cap market. The approaching mid-term elections could generate a great deal of noise—and market volatility—all on their own. So while in general, we see more that is worth selling than buying, we have also seen pockets of value within technology in semiconductor and capital equipment makers, distributors, and contract manufacturers, as well as in banks. Moreover, with the expectation of increased volatility, we see a reasonable environment for our contrarian value approach taking shape. |
| 12 | Royce Capital Fund 2018 Semiannual Report to Shareholders |
| PERFORMANCE AND PORTFOLIO REVIEW | TICKER SYMBOLS RCPFX RCSSX |
| Performance and Expenses | ||||||||||||||||
| Average Annual Total Return (%) Through 6/30/18 | ||||||||||||||||
| JAN-JUN 20181 | 1-YR | 3-YR | 5-YR | 10-YR | 15-YR | 20-YR | SINCE INCEPTION (12/27/96) | |||||||||
| RCS | 7.06 | 17.72 | 6.48 | 8.29 | 7.81 | 10.00 | 10.13 | 10.80 | ||||||||
| Annual Gross Operating Expenses: 1.11% Annual Net Operating Expenses: 1.08% | ||||||||||||||||
| 1 Not annualized | ||||||||||||||||
Relative Returns: Monthly Rolling Average Annual Return Periods
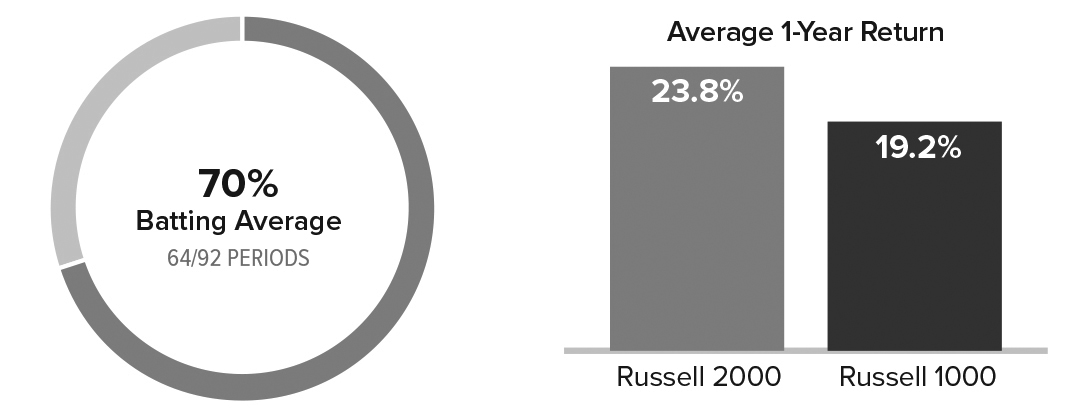
| On a monthly rolling basis, the Fund outperformed the Russell 2000 in 69% of all 10-year periods; 64% of all 5-year periods; and 49% of all 1-year periods. |
| PERIODS BEATING THE INDEX | FUND AVG (%)1 | INDEX AVG (%)1 | ||||||||||
| 10-year | 83/121 | 69% | 8.9 | 6.9 | ||||||||
| 5-year | 116/181 | 64% | 10.5 | 8.7 | ||||||||
| 1-year | 112/229 | 49% | 12.1 | 10.4 | ||||||||
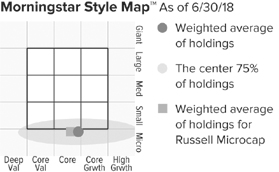
The Morningstar Style Map is the Morningstar
Style BoxTM
with the center 75% of fund holdings plotted as the Morningstar
Ownership ZoneTM. The Morningstar Style Box is designed to reveal a
fund’s investment strategy. The Morningstar Ownership Zone provides
detail about a portfolio’s investment style by showing the range of
stock sizes and styles. The Ownership Zone is derived by plotting each
stock in the portfolio within the proprietary Morningstar Style Box.
Over time, the shape and location of a fund’s ownership zone may vary.
See page 27 for additional information. |
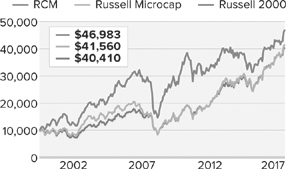
Value of $10,000
Includes reinvestment of distributions.
| Top 10 Positions | ||
| % of Net Assets | ||
| PC Connection | 2.5 | |
| Insight Enterprises | 2.5 | |
| Kulicke & Soffa Industries | 2.5 | |
| Genworth MI Canada | 2.4 | |
| Village Super Market Cl. A | 2.3 | |
| Spirit Airlines | 2.3 | |
| Vishay Intertechnology | 2.2 | |
| Celestica | 2.2 | |
| Fabrinet | 2.0 | |
| Hawaiian Holdings | 2.0 | |
| Portfolio Sector Breakdown | ||
| % of Net Assets | ||
| Information Technology | 25.6 | |
| Industrials | 22.3 | |
| Financials | 21.3 | |
| Consumer Discretionary | 14.1 | |
| Consumer Staples | 2.3 | |
| Energy | 2.1 | |
| Real Estate | 1.5 | |
| Health Care | 1.4 | |
| Utilities | 0.4 | |
| Cash and Cash Equivalents | 9.0 | |
| Calendar Year Total Returns (%) | ||
| YEAR | RCS | |
| 2017 | 5.4 | |
| 2016 | 21.0 | |
| 2015 | -11.8 | |
| 2014 | 3.2 | |
| 2013 | 34.8 | |
| 2012 | 12.5 | |
| 2011 | -3.3 | |
| 2010 | 20.5 | |
| 2009 | 35.2 | |
| 2008 | -27.2 | |
| 2007 | -2.1 | |
| 2006 | 15.6 | |
| 2005 | 8.6 | |
| 2004 | 25.0 | |
| 2003 | 41.1 | |
| Upside/Downside Capture Ratios | ||||
| Periods Ended 6/30/18 (%) | ||||
| UPSIDE | DOWNSIDE | |||
| 10-Year | 77 | 82 | ||
| From 12/31/96 (Start of
Fund’s First Full Quarter) |
94 | 76 | ||
| Portfolio Diagnostics | ||
| Fund Net Assets | $478 million | |
| Number of Holdings | 79 | |
| Turnover Rate | 23% | |
| Average Market Capitalization1 | $1,295 million | |
| Weighted Average P/E Ratio2,3 | 15.2x | |
| Weighted Average P/B Ratio2 | 2.0x | |
| Active Share4 | 96% | |
| U.S. Investments (% of Net Assets) | 79.4% | |
| Non-U.S. Investments (% of Net Assets) | 11.6% | |
| 1 | Geometric Average. This weighted calculation uses each portfolio
holding’s market cap in a way designed to not skew the effect of
very large or small holdings; instead, it aims to better identify
the portfolio’s center, which Royce believes offers a more accurate
measure of average market cap than a simple mean or median. |
| 2 | Harmonic Average. This weighted calculation evaluates a portfolio
as if it were a single stock and measures it overall. It compares the
total market value of the portfolio to the portfolio’s share in the
earnings or book value, as the case may be, of its underlying stocks. |
| 3 | The Fund’s P/E ratio calculation excludes companies with zero or
negative earnings (6% of portfolio holdings as of 6/30/18). |
| 4 | Active Share is the sum of the absolute values of the different
weightings of each holding in the Fund versus each holding in the
benchmark, divided by two. |
| Important Performance and Expense Information
All performance information in this Report reflects past performance, is presented on a total return basis, reflects the reinvestment of distributions, and does not reflect the deduction of taxes that a shareholder would pay on fund distributions or the redemption of fund shares. Past performance is no guarantee of future results. Investment return and principal value of an investment will fluctuate, so that shares may be worth more or less than their original cost when redeemed. Current performance may be higher or lower than performance quoted. The Fund’s total returns do not reflect any deduction for charges or expenses of the variable contracts investing in the Fund. Returns as of the most recent month-end may be obtained at www.roycefunds.com. All performance and risk information reflects the result of the Investment Class (its oldest class). Shares of RCS’s Service Class bear an annual distribution expense that is not borne by the Investment Class; if those expenses were reflected, total returns would have been lower. Certain immaterial adjustments were made to the net assets of Royce Capital Fund-Small-Cap Portfolio at 12/31/17 for financial reporting purposes, and as a result the calendar year total returns based on those net assets values differ from the adjusted net values and calendar year total returns reported in the Financial Highlights. All performance information reflects past performance, is presented on a total return basis, reflects the reinvestment of distributions, and does not reflect the deduction of taxes that a shareholder would pay on fund distributions or the redemption of fund shares. Past performance is no guarantee of future results. Investment return and principal value of an investment will fluctuate, so that shares may be worth more or less than their original cost when redeemed. Current month-end performance may be higher or lower than performance quoted and may be obtained at www.roycefunds.com. The Fund’s total returns do not reflect any deduction for charges or expenses of the variable contracts investing in the Fund. Gross operating expenses reflect the Fund’s total gross operating expenses for the Investment Class and include management fees and other expenses. Net operating expenses reflect contractual fee waivers and/or expense reimbursements. All expense information is reported as of the Fund’s most current prospectus. Royce & Associates has contractually agreed, without right of termination, to waive fees and/or reimburse expenses to the extent necessary to maintain the Investment Class’s net annual operating expenses (excluding brokerage commissions, taxes, interest, litigation expenses, acquired fund fees and expenses, and other expenses not borne in the ordinary course of business) at or below 1.08% through April 30, 2019. Regarding the “Top Contributors” and “Top Detractors” tables shown above, the sum of all contributors to, and all detractors from, performance for all securities in the portfolio would approximate the Fund’s year-to-date performance for 2018. Upside Capture Ratio measures a manager’s performance in up markets relative to the Fund’s benchmark. It is calculated by measuring the Fund’s performance in quarters when the benchmark went up and dividing it by the benchmark’s return in those quarters. Downside Capture Ratio measures a manager’s performance in down markets relative to the Fund’s benchmark (Russell 2000). It is calculated by measuring the Fund’s performance in quarters when the benchmark goes down and dividing it by the benchmark’s return in those quarters. |
| Royce Capital Fund 2018 Semiannual Report to Shareholders | 13 |
| Schedule of Investments |
| Royce Capital Fund - Small-Cap Portfolio | |||||||
| Common Stocks – 91.0% | |||||||
| SHARES | VALUE | ||||||
| CONSUMER DISCRETIONARY – 14.1% | |||||||
| AUTO COMPONENTS - 2.5% | |||||||
Gentex Corporation |
289,616 | $ | 6,666,960 | ||||
Stoneridge 1 |
143,161 | 5,030,678 | |||||
| 11,697,638 | |||||||
| AUTOMOBILES - 0.5% | |||||||
Thor Industries |
26,600 | 2,590,574 | |||||
| HOTELS, RESTAURANTS & LEISURE - 0.5% | |||||||
Cheesecake Factory |
41,415 | 2,280,310 | |||||
| HOUSEHOLD DURABLES - 2.7% | |||||||
Bassett Furniture Industries |
58,122 | 1,601,261 | |||||
Flexsteel Industries |
105,743 | 4,219,146 | |||||
La-Z-Boy |
231,786 | 7,092,651 | |||||
| 12,913,058 | |||||||
| INTERNET & DIRECT MARKETING RETAIL - 1.1% | |||||||
†Nutrisystem |
139,900 | 5,386,150 | |||||
| MEDIA - 1.5% | |||||||
Saga Communications Cl. A |
191,107 | 7,357,620 | |||||
| SPECIALTY RETAIL - 4.3% | |||||||
American Eagle Outfitters |
286,765 | 6,667,286 | |||||
DSW Cl. A |
273,593 | 7,064,171 | |||||
Shoe Carnival |
206,346 | 6,695,928 | |||||
| 20,427,385 | |||||||
| TEXTILES, APPAREL & LUXURY GOODS - 1.0% | |||||||
Steven Madden |
89,071 | 4,729,670 | |||||
| Total (Cost $51,876,364) | 67,382,405 | ||||||
| CONSUMER STAPLES – 2.3% | |||||||
| FOOD & STAPLES RETAILING - 2.3% | |||||||
Village Super Market Cl. A |
369,177 | 10,875,955 | |||||
| Total (Cost $10,540,057) | 10,875,955 | ||||||
| ENERGY – 2.1% | |||||||
| ENERGY EQUIPMENT & SERVICES - 2.1% | |||||||
Helmerich & Payne |
82,700 | 5,272,952 | |||||
Unit Corporation 1 |
183,013 | 4,677,812 | |||||
| Total (Cost $7,325,817) | 9,950,764 | ||||||
| FINANCIALS – 21.3% | |||||||
| BANKS - 10.0% | |||||||
Ames National |
148,534 | 4,582,274 | |||||
†Bar Harbor Bankshares |
90,658 | 2,746,031 | |||||
Camden National |
153,882 | 7,033,946 | |||||
City Holding Company |
65,567 | 4,932,605 | |||||
CNB Financial |
186,126 | 5,594,948 | |||||
Codorus Valley Bancorp |
51,400 | 1,576,952 | |||||
Landmark Bancorp |
40,017 | 1,140,484 | |||||
MidWestOne Financial Group |
213,023 | 7,195,917 | |||||
National Bankshares |
128,639 | 5,968,850 | |||||
Northrim BanCorp |
127,481 | 5,041,873 | |||||
Unity Bancorp |
92,521 | 2,104,853 | |||||
| 47,918,733 | |||||||
| CAPITAL MARKETS - 3.2% | |||||||
Federated Investors Cl. B |
270,786 | 6,314,730 | |||||
Houlihan Lokey Cl. A |
92,269 | 4,726,018 | |||||
Moelis & Company Cl. A |
74,920 | 4,394,058 | |||||
| 15,434,806 | |||||||
| INSURANCE - 2.9% | |||||||
James River Group Holdings |
176,101 | 6,919,009 | |||||
Kingstone Companies |
119,288 | 2,015,967 | |||||
Reinsurance Group of America |
37,236 | 4,970,261 | |||||
| 13,905,237 | |||||||
| THRIFTS & MORTGAGE FINANCE - 5.2% | |||||||
Genworth MI Canada |
352,550 | 11,472,322 | |||||
Southern Missouri Bancorp |
40,987 | 1,599,313 | |||||
Timberland Bancorp |
119,932 | 4,478,261 | |||||
TrustCo Bank Corp. NY |
783,082 | 6,969,430 | |||||
| 24,519,326 | |||||||
| Total (Cost $73,329,150) | 101,778,102 | ||||||
| HEALTH CARE – 1.4% | |||||||
| HEALTH CARE PROVIDERS & SERVICES - 1.4% | |||||||
| 39,741 | 2,328,823 | ||||||
Ensign Group (The) |
126,314 | 4,524,567 | |||||
| Total (Cost $4,295,287) | 6,853,390 | ||||||
| INDUSTRIALS – 22.3% | |||||||
| AIRLINES - 5.8% | |||||||
Allegiant Travel |
51,899 | 7,211,366 | |||||
Hawaiian Holdings |
265,955 | 9,561,082 | |||||
| 298,953 | 10,866,942 | ||||||
| 27,639,390 | |||||||
| BUILDING PRODUCTS - 2.0% | |||||||
American Woodmark 1 |
22,543 | 2,063,812 | |||||
Apogee Enterprises |
156,017 | 7,515,339 | |||||
| 9,579,151 | |||||||
| COMMERCIAL SERVICES & SUPPLIES - 2.7% | |||||||
Herman Miller |
198,603 | 6,732,642 | |||||
Kimball International Cl. B |
392,482 | 6,342,509 | |||||
| 13,075,151 | |||||||
| CONSTRUCTION & ENGINEERING - 0.5% | |||||||
Comfort Systems USA |
49,969 | 2,288,580 | |||||
| ELECTRICAL EQUIPMENT - 1.2% | |||||||
EnerSys |
77,200 | 5,762,208 | |||||
| MACHINERY - 4.9% | |||||||
Alamo Group |
32,728 | 2,957,302 | |||||
Federal Signal |
96,841 | 2,255,427 | |||||
Miller Industries |
346,682 | 8,857,725 | |||||
Wabash National |
508,303 | 9,484,934 | |||||
| 23,555,388 | |||||||
| PROFESSIONAL SERVICES - 3.9% | |||||||
Heidrick & Struggles International |
63,162 | 2,210,670 | |||||
Kforce |
135,467 | 4,646,518 | |||||
Korn/Ferry International |
76,372 | 4,729,718 | |||||
Robert Half International |
69,100 | 4,498,410 | |||||
TrueBlue 1 |
85,271 | 2,298,053 | |||||
| 18,383,369 | |||||||
| ROAD & RAIL - 1.3% | |||||||
Old Dominion Freight Line |
14,704 | 2,190,308 | |||||
Saia 1 |
28,361 | 2,292,987 | |||||
Werner Enterprises |
47,961 | 1,800,935 | |||||
| 6,284,230 | |||||||
| Total (Cost $89,754,862) | 106,567,467 | ||||||
| INFORMATION TECHNOLOGY – 25.6% | |||||||
| COMMUNICATIONS EQUIPMENT - 0.4% | |||||||
NETGEAR 1 |
34,271 | 2,141,938 | |||||
| 14 | Royce Capital Fund 2018 Semiannual Report to Shareholders | THE ACCOMPANYING NOTES ARE AN INTEGRAL PART OF THESE FINANCIAL STATEMENTS |
| June 30, 2018 (unaudited) |
| Royce Capital Fund - Small-Cap Portfolio (continued) | |||||||
| SHARES | VALUE | ||||||
| INFORMATION TECHNOLOGY (continued) | |||||||
| ELECTRONIC EQUIPMENT, INSTRUMENTS & COMPONENTS - 16.4% | |||||||
Benchmark Electronics |
240,435 | $ | 7,008,680 | ||||
Celestica 1 |
894,672 | 10,619,757 | |||||
| 446,309 | 7,038,293 | ||||||
Fabrinet 1 |
264,760 | 9,766,996 | |||||
Insight Enterprises 1 |
240,902 | 11,787,335 | |||||
Methode Electronics |
177,353 | 7,147,326 | |||||
PC Connection |
362,317 | 12,028,924 | |||||
Sanmina Corporation 1 |
76,044 | 2,228,089 | |||||
Vishay Intertechnology |
458,299 | 10,632,537 | |||||
| 78,257,937 | |||||||
| SEMICONDUCTORS & SEMICONDUCTOR EQUIPMENT - 7.9% | |||||||
Advanced Energy Industries 1 |
125,850 | 7,310,626 | |||||
†Cohu |
154,115 | 3,777,359 | |||||
Kulicke & Soffa Industries |
491,726 | 11,712,913 | |||||
MKS Instruments |
38,391 | 3,674,019 | |||||
Silicon Motion Technology ADR |
89,800 | 4,749,522 | |||||
| 458,600 | 6,406,642 | ||||||
| 37,631,081 | |||||||
| TECHNOLOGY HARDWARE, STORAGE & PERIPHERALS - 0.9% | |||||||
Super Micro Computer 1 |
179,883 | 4,254,233 | |||||
| Total (Cost $105,036,104) | 122,285,189 | ||||||
| REAL ESTATE – 1.5% | |||||||
| REAL ESTATE MANAGEMENT & DEVELOPMENT - 1.5% | |||||||
Marcus & Millichap 1 |
181,284 | 7,071,889 | |||||
| Total (Cost $4,644,978) | 7,071,889 | ||||||
| UTILITIES – 0.4% | |||||||
| GAS UTILITIES - 0.4% | |||||||
Star Group L.P. |
230,460 | 2,258,508 | |||||
| Total (Cost $2,158,098) | 2,258,508 | ||||||
| TOTAL COMMON STOCKS | |||||||
| (Cost $348,960,717) | 435,023,669 | ||||||
| REPURCHASE AGREEMENT– 8.4% | |||||||
|
Fixed Income Clearing Corporation, 0.35% dated 6/29/18, due 7/2/18, maturity value
$40,227,173 (collateralized by obligations of various U.S. Government Agencies, 1.375% due 10/07/21, valued at $41,030,868) |
|||||||
| (Cost $40,226,000) | 40,226,000 | ||||||
| COLLATERAL RECEIVED FOR SECURITIES LOANED – 0.6% | |||||||
| Money Market Funds | |||||||
Federated Government Obligations Fund (7 day yield-1.7400%) |
|||||||
| (Cost $2,957,094) | 2,957,094 | ||||||
| TOTAL INVESTMENTS – 100.0% | |||||||
| (Cost $392,143,811) | 478,206,763 | ||||||
| LIABILITIES LESS CASH AND OTHER ASSETS – (0.0)% | (133,940 | ) | |||||
| NET ASSETS – 100.0% | $ | 478,072,823 | |||||
| † | New additions in 2018. | |
| 1 | Non-income producing. | |
| 2 | All or a portion of these securities were on loan at June 30, 2018. | |
| Bold indicates the Fund’s 20 largest equity holdings in terms of June 30, 2018, market value. |
| THE ACCOMPANYING NOTES ARE AN INTEGRAL PART OF THESE FINANCIAL STATEMENTS | Royce Capital Fund 2018 Semiannual Report to Shareholders | 15 |
| Statements of Assets and Liabilities | June 30, 2018 (unaudited) |
| Micro-Cap | Small-Cap | |||||||
| Portfolio | Portfolio | |||||||
| ASSETS: | ||||||||
| Investments at value (including collateral on loaned securities) 1 | $ | 189,835,103 | $ | 437,980,763 | ||||
| Repurchase agreements (at cost and value) | 8,427,000 | 40,226,000 | ||||||
| Cash and foreign currency | 43,366 | – | ||||||
| Receivable for investments sold | – | 4,386,362 | ||||||
| Receivable for capital shares sold | 215,227 | 157,672 | ||||||
| Receivable for dividends and interest | 142,621 | 373,932 | ||||||
| Receivable for securities lending income | 4,773 | 1,219 | ||||||
| Prepaid expenses and other assets | 640 | 7,722 | ||||||
| Total Assets | 198,668,730 | 483,133,670 | ||||||
| LIABILITIES: | ||||||||
| Payable for collateral on loaned securities | 2,783,561 | 2,957,094 | ||||||
| Payable to custodian for cash and foreign currency overdrawn | – | 33,430 | ||||||
| Payable for investments purchased | 338,917 | 1,248,244 | ||||||
| Payable for capital shares redeemed | 214,701 | 264,093 | ||||||
| Payable for investment advisory fees | 204,342 | 401,654 | ||||||
| Payable for trustees’ fees | 11,711 | 27,916 | ||||||
| Accrued expenses | 58,590 | 128,416 | ||||||
| Total Liabilities | 3,611,822 | 5,060,847 | ||||||
| Net Assets | $ | 195,056,908 | $ | 478,072,823 | ||||
| ANALYSIS OF NET ASSETS: | ||||||||
| Paid-in capital | $ | 132,447,821 | $ | 364,622,003 | ||||
| Undistributed net investment income (loss) | (170,679 | ) | 2,815,674 | |||||
| Accumulated net realized gain (loss) on investments and foreign currency | 15,370,047 | 24,572,194 | ||||||
| Net unrealized appreciation (depreciation) on investments and foreign currency | 47,409,719 | 86,062,952 | ||||||
| Net Assets | $ | 195,056,908 | $ | 478,072,823 | ||||
Investment Class |
$ | 162,857,359 | $ | 217,616,068 | ||||
Service Class |
32,199,549 | 260,456,755 | ||||||
| SHARES OUTSTANDING (unlimited number of $.001 par value): | ||||||||
Investment Class |
14,222,520 | 23,151,857 | ||||||
Service Class |
2,863,102 | 28,459,700 | ||||||
| NET ASSET VALUES (Net Assets ÷ Shares Outstanding): | ||||||||
(offering and redemption price per share) |
||||||||
Investment Class |
$11.45 | $9.40 | ||||||
Service Class |
11.25 | 9.15 | ||||||
| Investments at identified cost | $ | 142,425,403 | $ | 351,917,811 | ||||
| Market value of loaned securities 2 | 3,241,193 | 12,873,326 | ||||||
| 1 | See Notes to Financial Statements for additional collateral on loaned securities. |
| 2 | Market value of loaned securities backed by non-cash collateral is as of prior business day. |
| 16 | Royce Capital Fund 2018 Semiannual Report to Shareholders | THE ACCOMPANYING NOTES ARE AN INTEGRAL PART OF THESE FINANCIAL STATEMENTS |
| Statements of Changes in Net Assets |
| Micro-Cap Portfolio | Small-Cap Portfolio | ||||||||||||||||
|
Six Months Ended 6/30/18 (unaudited) |
Year Ended 12/31/17 |
Six Months Ended 6/30/18 (unaudited) |
Year Ended 12/31/17 | ||||||||||||||
| INVESTMENT OPERATIONS: | |||||||||||||||||
| Net investment income (loss) | $ | (208,623 | ) | $ | (507,803 | ) | $ | 957,604 | $ | 1,986,132 | |||||||
| Net realized gain (loss) on investments and foreign currency | 8,016,787 | 8,353,077 | 21,982,524 | 7,868,418 | |||||||||||||
Net change in unrealized appreciation (depreciation) on investments and foreign currency |
10,668,687 | 1,752,552 | 9,524,788 | 2,459,022 | |||||||||||||
| Net increase (decrease) in net assets from investment operations | 18,476,851 | 9,597,826 | 32,464,916 | 12,313,572 | |||||||||||||
| DISTRIBUTIONS: | |||||||||||||||||
| Net investment income | |||||||||||||||||
Investment Class |
– | (1,090,893 | ) | – | (2,075,505 | ) | |||||||||||
Service Class |
– | (170,672 | ) | – | (2,047,296 | ) | |||||||||||
| Net realized gain on investments and foreign currency | |||||||||||||||||
Investment Class |
– | (17,091,597 | ) | – | – | ||||||||||||
Service Class |
– | (3,298,738 | ) | – | – | ||||||||||||
| Total distributions | – | (21,651,900 | ) | – | (4,122,801 | ) | |||||||||||
| CAPITAL SHARE TRANSACTIONS: | |||||||||||||||||
| Value of shares sold | |||||||||||||||||
Investment Class |
6,453,325 | 19,985,987 | 10,346,375 | 27,113,319 | |||||||||||||
Service Class |
6,728,550 | 8,994,660 | 896,650 | 193,204,040 | |||||||||||||
| Distributions reinvested | |||||||||||||||||
Investment Class |
– | 18,182,489 | – | 2,075,505 | |||||||||||||
Service Class |
– | 3,469,410 | – | 2,047,296 | |||||||||||||
| Value of shares redeemed | |||||||||||||||||
Investment Class |
(23,927,751 | ) | (41,333,398 | ) | (36,176,977 | ) | (57,799,564 | ) | |||||||||
Service Class |
(9,397,534 | ) | (12,640,986 | ) | (21,627,251 | ) | (198,351,118 | ) | |||||||||
Net increase (decrease) in net assets from capital share transactions |
(20,143,410 | ) | (3,341,838 | ) | (46,561,203 | ) | (31,710,522 | ) | |||||||||
| Net Increase (Decrease) in Net Assets | (1,666,559 | ) | (15,395,912 | ) | (14,096,287 | ) | (23,519,751 | ) | |||||||||
| NET ASSETS: | |||||||||||||||||
| Beginning of period | 196,723,467 | 212,119,379 | 492,169,110 | 515,688,861 | |||||||||||||
| End of period | $ | 195,056,908 | $ | 196,723,467 | $ | 478,072,823 | $ | 492,169,110 | |||||||||
| Undistributed Net Investment Income (Loss) at End of Period | $ | (170,679 | ) | $ | 37,944 | $ | 2,815,674 | $ | 1,858,071 | ||||||||
| THE ACCOMPANYING NOTES ARE AN INTEGRAL PART OF THESE FINANCIAL STATEMENTS | Royce Capital Fund 2018 Semiannual Report to Shareholders | 17 |
| Statements of Operations | Six Months Ended June 30, 2018 (unaudited) |
| Micro-Cap | Small-Cap | |||||||
| Portfolio | Portfolio | |||||||
| INVESTMENT INCOME: | ||||||||
| INCOME: | ||||||||
| Dividends | $ | 995,907 | $ | 3,834,220 | ||||
| Foreign withholding tax | (30,582 | ) | (39,296 | ) | ||||
| Interest | 11,974 | 38,028 | ||||||
| Securities lending | 108,169 | 7,361 | ||||||
| Total income | 1,085,468 | 3,840,313 | ||||||
| EXPENSES: | ||||||||
| Investment advisory fees | 1,180,818 | 2,370,797 | ||||||
| Distribution fees | 37,701 | 322,248 | ||||||
| Shareholder reports | 33,800 | 38,127 | ||||||
| Administrative and office facilities | 27,442 | 64,085 | ||||||
| Trustees’ fees | 19,642 | 48,419 | ||||||
| Audit | 17,189 | 15,962 | ||||||
| Custody | 14,303 | 28,513 | ||||||
| Shareholder servicing | 6,874 | 6,745 | ||||||
| Legal | 2,594 | 6,028 | ||||||
| Other expenses | 6,606 | 14,131 | ||||||
| Total expenses | 1,346,969 | 2,915,055 | ||||||
| Compensating balance credits | (75 | ) | (197 | ) | ||||
| Fees waived by investment adviser | (12,122 | ) | – | |||||
| Expenses reimbursed by investment adviser | (40,681 | ) | (32,149 | ) | ||||
| Net expenses | 1,294,091 | 2,882,709 | ||||||
| Net investment income (loss) | (208,623 | ) | 957,604 | |||||
| REALIZED AND UNREALIZED GAIN (LOSS) ON INVESTMENTS AND FOREIGN CURRENCY: | ||||||||
| NET REALIZED GAIN (LOSS): | ||||||||
| Investments | 8,017,164 | 21,985,910 | ||||||
| Foreign currency transactions | (377 | ) | (3,386 | ) | ||||
| NET CHANGE IN UNREALIZED APPRECIATION (DEPRECIATION): | ||||||||
| Investments and foreign currency translations | 10,670,029 | 9,524,788 | ||||||
| Other assets and liabilities denominated in foreign currency | (1,342 | ) | – | |||||
| Net realized and unrealized gain (loss) on investments and foreign currency | 18,685,474 | 31,507,312 | ||||||
| NET INCREASE (DECREASE) IN NET ASSETS FROM INVESTMENT OPERATIONS | $ | 18,476,851 | $ | 32,464,916 | ||||
| 18 | Royce Capital Fund 2018 Semiannual Report to Shareholders | THE ACCOMPANYING NOTES ARE AN INTEGRAL PART OF THESE FINANCIAL STATEMENTS |
Financial Highlights
This table is presented to show selected data for a share outstanding throughout each year or other indicated period and to assist shareholders in evaluating a Fund’s performance for the periods presented. Per share amounts have been determined on the basis of the weighted average number of shares outstanding during the period.
| Ratio of Expenses to Average Net Assets | |||||||||||||||||||||||||||||||||||||||||||||||||||||||||||
|
Net Asset Value, Beginning of Period |
Net Investment Income (Loss) |
Net Realized and Unrealized Gain (Loss) on Investments and Foreign Currency |
Total from Investment Operations |
Distributions from Net Investment Income |
Distributions from Net Realized Gain on Investments and Foreign Currency |
Total Distributions |
Net Asset Value, End of Period |
Total Return |
Net Assets, End of Period (in thousands) |
Prior to Fee Waivers, Expense Reimbursements and Balance Credits |
Prior to Fee Waivers and Expense Reimbursements |
Net of Fee Waivers and Expense Reimbursements |
Ratio of Net Investment Income (Loss) to Average Net Assets |
Portfolio Turnover Rate |
|||||||||||||||||||||||||||||||||||||||||||||
| Micro-Cap Portfolio–Investment Class | |||||||||||||||||||||||||||||||||||||||||||||||||||||||||||
| 2018† | $ | 10.39 | $ | (0.01 | ) | $ | 1.07 | $ | 1.06 | $ | – | $ | – | $ | – | $ | 11.45 | 10.20 | %1 | $ | 162,857 | 1.39 | %2 | 1.39 | %2 | 1.33 | %2 | (0.18 | )%2 | 14 | % | ||||||||||||||||||||||||||||
| 2017 | 11.11 | (0.02 | ) | 0.58 | 0.56 | (0.08 | ) | (1.20 | ) | (1.28 | ) | 10.39 | 5.29 | 164,656 | 1.38 | 1.38 | 1.38 | (0.22 | ) | 30 | |||||||||||||||||||||||||||||||||||||||
| 2016 | 9.34 | 0.03 | 1.81 | 1.84 | (0.07 | ) | – | (0.07 | ) | 11.11 | 19.71 | 177,444 | 1.36 | 1.36 | 1.36 | 0.02 | 57 | ||||||||||||||||||||||||||||||||||||||||||
| 2015 | 11.37 | 0.03 | (1.45 | ) | (1.42 | ) | – | (0.61 | ) | (0.61 | ) | 9.34 | (12.46 | ) | 369,991 | 1.32 | 1.32 | 1.32 | 0.27 | 51 | |||||||||||||||||||||||||||||||||||||||
| 2014 | 12.83 | (0.04 | ) | (0.44 | ) | (0.48 | ) | – | (0.98 | ) | (0.98 | ) | 11.37 | (3.58 | ) | 485,434 | 1.30 | 1.30 | 1.30 | (0.32 | ) | 25 | |||||||||||||||||||||||||||||||||||||
| 2013 | 10.95 | (0.04 | ) | 2.32 | 2.28 | (0.06 | ) | (0.34 | ) | (0.40 | ) | 12.83 | 20.99 | 572,666 | 1.32 | 1.32 | 1.32 | (0.36 | ) | 30 | |||||||||||||||||||||||||||||||||||||||
| Micro-Cap Portfolio–Service Class | |||||||||||||||||||||||||||||||||||||||||||||||||||||||||||
| 2018† | $ | 10.21 | $ | (0.02 | ) | $ | 1.06 | $ | 1.04 | $ | – | $ | – | $ | – | $ | 11.25 | 10.19 | %1 | $ | 32,200 | 1.63 | %2 | 1.63 | %2 | 1.58 | %2 | (0.44 | )%2 | 14 | % | ||||||||||||||||||||||||||||
| 2017 | 10.93 | (0.04 | ) | 0.57 | 0.53 | (0.06 | ) | (1.19 | ) | (1.25 | ) | 10.21 | 5.02 | 32,067 | 1.64 | 1.64 | 1.58 | (0.43 | ) | 30 | |||||||||||||||||||||||||||||||||||||||
| 2016 | 9.20 | (0.02 | ) | 1.80 | 1.78 | (0.05 | ) | – | (0.05 | ) | 10.93 | 19.37 | 34,675 | 1.65 | 1.65 | 1.58 | (0.15 | ) | 57 | ||||||||||||||||||||||||||||||||||||||||
| 2015 | 11.23 | 0.00 | (1.42 | ) | (1.42 | ) | – | (0.61 | ) | (0.61 | ) | 9.20 | (12.61 | ) | 23,928 | 1.60 | 1.60 | 1.56 | 0.01 | 51 | |||||||||||||||||||||||||||||||||||||||
| 2014 | 12.72 | (0.07 | ) | (0.44 | ) | (0.51 | ) | – | (0.98 | ) | (0.98 | ) | 11.23 | (3.84 | ) | 27,362 | 1.57 | 1.57 | 1.57 | (0.60 | ) | 25 | |||||||||||||||||||||||||||||||||||||
| 2013 | 10.87 | (0.07 | ) | 2.30 | 2.23 | (0.04 | ) | (0.34 | ) | (0.38 | ) | 12.72 | 20.65 | 40,753 | 1.60 | 1.60 | 1.58 | (0.62 | ) | 30 | |||||||||||||||||||||||||||||||||||||||
| Small-Cap Portfolio–Investment Class | |||||||||||||||||||||||||||||||||||||||||||||||||||||||||||
| 2018† | $ | 8.77 | $ | 0.02 | $ | 0.61 | $ | 0.63 | $ | – | $ | – | $ | – | $ | 9.40 | 7.18 | %1 | $ | 217,616 | 1.10 | %2 | 1.10 | %2 | 1.08 | %2 | 0.54 | %2 | 23 | % | |||||||||||||||||||||||||||||
| 2017 | 8.41 | 0.05 | 0.39 | 0.44 | (0.08 | ) | – | (0.08 | ) | 8.77 | 5.26 | 228,620 | 1.11 | 1.11 | 1.11 | 0.55 | 91 | ||||||||||||||||||||||||||||||||||||||||||
| 2016 | 8.43 | 0.13 | 1.66 | 1.79 | (0.17 | ) | (1.64 | ) | (1.81 | ) | 8.41 | 20.96 | 248,244 | 1.09 | 1.09 | 1.09 | 0.89 | 78 | |||||||||||||||||||||||||||||||||||||||||
| 2015 | 12.65 | 0.17 | (1.66 | ) | (1.49 | ) | (0.09 | ) | (2.64 | ) | (2.73 | ) | 8.43 | (11.80 | ) | 356,258 | 1.06 | 1.06 | 1.06 | 1.26 | 59 | ||||||||||||||||||||||||||||||||||||||
| 2014 | 13.92 | 0.06 | 0.35 | 0.41 | (0.02 | ) | (1.66 | ) | (1.68 | ) | 12.65 | 3.24 | 577,222 | 1.05 | 1.05 | 1.05 | 0.44 | 36 | |||||||||||||||||||||||||||||||||||||||||
| 2013 | 11.03 | 0.03 | 3.75 | 3.78 | (0.14 | ) | (0.75 | ) | (0.89 | ) | 13.92 | 34.75 | 736,917 | 1.05 | 1.05 | 1.05 | 0.13 | 43 | |||||||||||||||||||||||||||||||||||||||||
| Small-Cap Portfolio–Service Class | |||||||||||||||||||||||||||||||||||||||||||||||||||||||||||
| 2018† | $ | 8.55 | $ | 0.01 | $ | 0.59 | $ | 0.60 | $ | – | $ | – | $ | – | $ | 9.15 | 7.02 | %1 | $ | 260,457 | 1.34 | %2 | 1.34 | %2 | 1.33 | %2 | 0.29 | %2 | 23 | % | |||||||||||||||||||||||||||||
| 2017 | 8.20 | 0.02 | 0.40 | 0.42 | (0.07 | ) | – | (0.07 | ) | 8.55 | 5.10 | 263,549 | 1.34 | 1.34 | 1.34 | 0.32 | 91 | ||||||||||||||||||||||||||||||||||||||||||
| 2016 | 8.27 | 0.03 | 1.69 | 1.72 | (0.15 | ) | (1.64 | ) | (1.79 | ) | 8.20 | 20.53 | 267,445 | 1.34 | 1.34 | 1.34 | 0.69 | 78 | |||||||||||||||||||||||||||||||||||||||||
| 2015 | 12.44 | 0.13 | (1.62 | ) | (1.49 | ) | (0.04 | ) | (2.64 | ) | (2.68 | ) | 8.27 | (11.97 | ) | 128,285 | 1.31 | 1.31 | 1.31 | 1.00 | 59 | ||||||||||||||||||||||||||||||||||||||
| 2014 | 13.74 | 0.03 | 0.33 | 0.36 | – | (1.66 | ) | (1.66 | ) | 12.44 | 2.92 | 218,175 | 1.30 | 1.30 | 1.30 | 0.21 | 36 | ||||||||||||||||||||||||||||||||||||||||||
| 2013 | 10.91 | (0.02 | ) | 3.73 | 3.71 | (0.13 | ) | (0.75 | ) | (0.88 | ) | 13.74 | 34.44 | 232,189 | 1.31 | 1.31 | 1.31 | (0.12 | ) | 43 | |||||||||||||||||||||||||||||||||||||||
| † | Six months ended June 30, 2018 (unaudited). |
| 1 | Not annualized |
| 2 | Annualized |
| THE ACCOMPANYING NOTES ARE AN INTEGRAL PART OF THESE FINANCIAL STATEMENTS | Royce Capital Fund 2018 Semiannual Report to Shareholders | 19 |
Notes to Financial Statements (unaudited)
| Summary of Significant Accounting Policies: |
Royce Micro-Cap
Portfolio and Royce Small-Cap Portfolio (the “Fund” or “Funds”)
are the two series of Royce Capital Fund (the “Trust”), a diversified
open-end management investment company organized as a Delaware statutory trust.
Shares of the Funds are offered to life insurance companies for allocation to certain
separate accounts established for the purpose of funding qualified and non-qualified
variable annuity contracts and variable life insurance contracts. Micro-Cap Portfolio
and Small-Cap Portfolio commenced operations on December 27, 1996. |
Classes of
shares have equal rights as to earnings and assets, except that each class may bear
different fees and expenses for distribution, shareholder servicing, registration
and shareholder reports, and receive different compensating balance credits and
expense reimbursements. Investment income, realized and unrealized capital gains
or losses on investments and foreign currency, and expenses other than those attributable
to a specific class are allocated to each class of shares based on its relative
net assets. |
The preparation
of financial statements in conformity with accounting principles generally accepted
in the United States requires management to make estimates and assumptions that
affect the reported amounts of assets and liabilities and the disclosure of contingent
assets and liabilities at the date of the financial statements and the reported
amounts of income and expenses during the reporting period. Actual results could
differ from those estimates. |
Each Fund
is an investment company and accordingly follows the investment company accounting
and reporting guidance of the Financial Accounting Standards Board (FASB) Accounting
Standard Codification Topic 946 “Financial Services-Investment Companies”. |
| VALUATION OF INVESTMENTS: |
Securities
are valued as of the close of trading on the New York Stock Exchange (NYSE) (generally
4:00 p.m. Eastern time) on the valuation date. Securities that trade on an exchange,
and securities traded on Nasdaq’s Electronic Bulletin Board, are valued at
their last reported sales price or Nasdaq official closing price taken from the
primary market in which each security trades or, if no sale is reported for such
day, at their highest bid price. Other over-the-counter securities for which market
quotations are readily available are valued at their highest bid price, except in
the case of some bonds and other fixed income securities which may be valued by
reference to other securities with comparable ratings, interest rates and maturities,
using established independent pricing services. The Funds value their non-U.S. dollar
denominated securities in U.S. dollars daily at the prevailing foreign currency
exchange rates as quoted by a major bank. Securities for which market quotations
are not readily available are valued at their fair value in accordance with the
provisions of the 1940 Act, under procedures approved by the Trust’s Board
of Trustees, and are reported as Level 3 securities. As a general principle, the
fair value of a security is the amount which the Fund might reasonably expect to
receive for the security upon its current sale. However, in light of the judgment
involved in fair valuations, there can be no assurance that a fair value assigned
to a particular security will be the amount which the Fund might be able to receive
upon its current sale. In addition, if, between the time trading ends on a particular
security and the close of the customary trading session on the NYSE, events occur
that are significant and may make the closing price unreliable, a Fund may fair
value the security. The Funds use an independent pricing service to provide fair
value estimates for relevant non-U.S. equity securities on days when the U.S. market
volatility exceeds a certain threshold. This pricing service uses proprietary correlations
it has developed between the movement of prices of non-U.S. equity securities and
indices of U.S.-traded securities, futures contracts and other indications to estimate
the fair value of relevant non-U.S. securities. When fair value pricing is employed,
the prices of securities used by a Fund may differ from quoted or published prices
for the same security. Investments in money market funds are valued at net asset
value per share. |
Various inputs
are used in determining the value of each Fund’s investments, as noted above.
These inputs are summarized in the three broad levels below: |
| Level 1 | – | quoted prices
in active markets for identical securities. |
||
| Level 2 | – | other significant
observable inputs (including quoted prices for similar securities, foreign securities
that may be fair valued and repurchase agreements). The table below includes all
Level 2 securities. Level 2 securities with values based on quoted prices for similar
securities would be noted in the Schedules of Investments. |
||
| Level 3 | – | significant
unobservable inputs (including last trade price before trading was suspended, or
at a discount thereto for lack of marketability or otherwise, market price information
regarding other securities, information received from the company and/or published
documents, including SEC filings and financial statements, or other publicly available
information). |
The inputs
or methodology used for valuing securities are not necessarily an indication of
the risk associated with investing in those securities. |
The following
is a summary of the inputs used to value each Fund’s investments as of June
30, 2018. For a detailed breakout of common stocks by sector classification, please
refer to the Schedules of Investments. |
| LEVEL 1 | LEVEL 2 | LEVEL 3 | TOTAL | ||||||||||||
| Micro-Cap Portfolio | |||||||||||||||
| Common Stocks | $ | 186,660,942 | $ | – | $ | 390,600 | $ | 187,051,542 | |||||||
| Cash Equivalents | 2,783,561 | 8,427,000 | – | 11,210,561 | |||||||||||
| 20 | Royce Capital Fund 2018 Semiannual Report to Shareholders |
| VALUATION OF INVESTMENTS (continued): | |||||||||||||||
| LEVEL 1 | LEVEL 2 | LEVEL 3 | TOTAL | ||||||||||||
| Small-Cap Portfolio | |||||||||||||||
| Common Stocks | $ | 435,023,669 | $ | – | $ | – | $ | 435,023,669 | |||||||
| Cash Equivalents | 2,957,094 | 40,226,000 | – | 43,183,094 | |||||||||||
Certain securities have transferred in and out of Level 1 and Level 2 measurements during the reporting period. The Funds recognize transfers between levels as of the end of the reporting period. For the six months ended June 30, 2018, securities valued at $3,672,363 were transferred from Level 2 to Level 1 for Royce Micro-Cap Portfolio within the fair value hierarchy.
| Level 3 Reconciliation: | ||||||||||||||||||||||
| BALANCE AS OF 12/31/17 | PURCHASES | SALES | REALIZED GAIN (LOSS) | UNREALIZED GAIN (LOSS)1 | BALANCE AS OF 6/30/18 | |||||||||||||||||
| Micro-Cap Portfolio | ||||||||||||||||||||||
| Common Stocks | $390,600 | $ – | $ – | $ – | $ – | $390,600 | ||||||||||||||||
| 1 | The net change in unrealized
appreciation (depreciation) is included in the accompanying Statement of Operations.
Change in unrealized appreciation (depreciation) includes net unrealized appreciation
(depreciation) resulting from changes in investment values during the reporting
period and the reversal of previously recorded unrealized appreciation (depreciation)
when gains or losses are realized. Net realized gain (loss) from investments and
foreign currency transactions is included in the accompanying Statement of Operations. |
The following table summarizes the valuation techniques used and unobservable inputs approved by the Valuation Committee to determine the fair value of certain Level 3 investments. The table does not include Level 3 investments with values derived utilizing prices from prior transactions or third party pricing information with adjustments (e.g. broker quotes, pricing services, net asset values).
| FAIR VALUE AT | IMPACT TO VALUATION FROM | ||||||||||||||
| 6/30/18 | VALUATION TECHNIQUE(S) | UNOBSERVABLE INPUT(S) | RANGE AVERAGE | AN INCREASE IN INPUT1 | |||||||||||
| Micro-Cap Portfolio | |||||||||||||||
| Common Stocks | $390,600 | Discounted Present Value Balance Sheet Analysis |
Liquidity Discount | 30%-40% | Decrease | ||||||||||
| 1 | This column represents the directional change in the fair value of the Level 3 investments that would result in an increase from the corresponding unobservable input. A decrease to the unobservable input would have the opposite effect. Significant increases and decreases in these unobservable inputs in isolation could result in significantly higher or lower fair value measurements. |
| REPURCHASE AGREEMENTS: |
The Funds
may enter into repurchase agreements with institutions that the Funds’ investment
adviser has determined are creditworthy. Each Fund restricts repurchase agreements
to maturities of no more than seven days. Securities pledged as collateral for repurchase
agreements, which are held until maturity of the repurchase agreements, are marked-to-market
daily and maintained at a value at least equal to the principal amount of the repurchase
agreement (including accrued interest). Repurchase agreements could involve certain
risks in the event of default or insolvency of the counter-party, including possible
delays or restrictions upon the ability of each Fund to dispose of its underlying
securities. The remaining contractual maturities of repurchase agreements held by
the Funds at June 30, 2018 are overnight and continuous. |
| FOREIGN CURRENCY: |
Net realized
foreign exchange gains or losses arise from sales and maturities of short-term securities,
sales of foreign currencies, expiration of currency forward contracts, currency
gains or losses realized between the trade and settlement dates on securities transactions,
and the difference between the amounts of dividends, interest, and foreign withholding
taxes recorded on each Fund’s books and the U.S. dollar equivalent of the amounts
actually received or paid. Net unrealized foreign exchange gains and losses arise
from changes in the value of assets and liabilities, including investments in securities
at the end of the reporting period, as a result of changes in foreign currency exchange
rates. |
| SECURITIES LENDING: |
The Funds
loan securities through a lending agent to qualified institutional investors for
the purpose of realizing additional income. Collateral for the Funds on all securities
loaned is accepted in cash and cash equivalents, which are invested temporarily
by the custodian, as well as non-cash collateral, which includes short and long-term
U.S. Treasuries. The collateral maintained is at least 100% of the current market
value of the loaned securities. The market value of the loaned securities is determined
at the close of business of the Funds and any additional required collateral is
delivered to the Funds on the next business day. The Funds retain the risk of any
loss on the securities on loan as well as incurring the potential loss on investments
purchased with cash collateral received for securities lending. In the event of
default or bankruptcy by the other party to the agreement, realization and/or retention
of the collateral may be subject to legal proceedings. If the borrower fails to
return loaned securities, and cash collateral being maintained by the borrower is
insufficient to cover the value of loaned securities and provided such collateral
insufficiency is not the result of investment losses, the lending agent has agreed
to pay the amount of the shortfall to the Funds or, at the option of the lending
agent, to replace the securities. In the event of the bankruptcy of the borrower,
the Funds could experience delay in recovering the loaned securities or only recover
cash or a security of equivalent value. Loans of securities generally do not have
stated maturity dates, and the Funds may recall a security at any time. |
| Royce Capital Fund 2018 Semiannual Report to Shareholders | 21 |
Notes to Financial Statements (unaudited) (continued)
| SECURITIES LENDING (continued): |
The Funds’ securities lending income consists of the income earned on investing cash
collateral, plus any premium payments received for lending certain securities, less
any rebates paid to borrowers and lending agent fees associated with the loan. The
lending agent is not affiliated with Royce. The market value of non-cash collateral
held by the Funds at June 30, 2018 was $599,570 for Micro-Cap Portfolio and $10,109,890
for Small-Cap Portfolio. |
The following
table presents by financial instrument, a Fund’s assets and liabilities net
of related collateral held by the Fund at June 30, 2018: |
| CASH COLLATERAL1 |
SECURITIES ON LOAN COLLATERALIZED BY CASH COLLATERAL |
NET AMOUNT | |||||||||||
| Micro-Cap Portfolio | |||||||||||||
| Collateral on Loaned Securities/Securities on Loan | $ | 2,783,561 | $ | (2,656,169) | $ | 127,392 | |||||||
| Small-Cap Portfolio | |||||||||||||
| Collateral on Loaned Securities/Securities on Loan | 2,957,094 | (2,965,251) | (8,157) | ||||||||||
| 1Absent an event of default, assets and liabilities are presented gross and not offset in the Statements of Assets and Liabilities. The remaining contractual maturity of cash collateral is overnight and continuous. |
| DISTRIBUTIONS AND TAXES: |
As qualified
regulated investment companies under Subchapter M of the Internal Revenue Code,
the Funds are not subject to income taxes to the extent that each Fund distributes
substantially all of its taxable income for its fiscal year. |
The Funds
pay any dividends and capital gain distributions annually in December. Dividends
from net investment income and distributions from capital gains are determined at
a class level. Because federal income tax regulations differ from generally accepted
accounting principles, income and capital gain distributions determined in accordance
with tax regulations may differ from net investment income and realized gains recognized
for financial reporting purposes. Accordingly, the character of distributions and
composition of net assets for tax purposes differ from those reflected in the accompanying
financial statements. |
| INVESTMENT TRANSACTIONS AND RELATED INVESTMENT INCOME: |
Investment
transactions are accounted for on the trade date. Dividend income is recorded on
the ex-dividend date. Non-cash dividend income is recorded at the fair market value
of the securities received. Interest income is recorded on an accrual basis. Realized
gains and losses from investment transactions are determined on the basis of identified
cost for book and tax purposes. |
| EXPENSES: |
The Funds
incur direct and indirect expenses. Expenses directly attributable to a Fund are
charged to the Fund’s operations, while expenses applicable to more than one
series of the Trust are allocated equitably. Certain personnel, occupancy costs
and other administrative expenses related to the Funds are allocated by Royce &
Associates (“Royce”) under an administration agreement and are included
in administrative and office facilities and legal expenses. The Trust has adopted
a deferred fee agreement that allows the Trustees to defer the receipt of all or
a portion of trustees’ fees otherwise payable. The deferred fees are invested
in certain Royce Funds until distributed in accordance with the agreement. |
| COMPENSATING BALANCE CREDITS: |
The Funds
have arrangements with their custodian bank and transfer agent, whereby a portion
of the custodian’s fee and transfer agent’s fee is paid indirectly by
credits earned on a Fund’s cash on deposit with the bank and transfer agent.
These deposit arrangements are an alternative to purchasing overnight investments.
Conversely, a Fund pays interest to the custodian on any cash overdrafts, to the
extent they are not offset by credits earned on positive cash balances. |
| LINE OF CREDIT: |
The Funds,
along with certain other Royce Funds, participate in a $65 million line of credit
(“Credit Agreement”) with State Street Bank and Trust Company to be used
for temporary or emergency purposes. This revolving Credit Agreement expires on
October 12, 2018. Pursuant to the Credit Agreement, each participating Fund is liable
for a portion of the commitment fee for the credit facility and for principal and
interest payments related to borrowings made by that Fund. Borrowings under the
Credit Agreement bear interest at a rate equal to the higher of the federal funds
rate or One-Month LIBOR rate. The Funds did not utilize the line of credit during
the six months ended June 30, 2018. |
| 22 | Royce Capital Fund 2018 Semiannual Report to Shareholders |
| Capital Share Transactions (in shares): | |||||||||||||||||||||||||||
| SHARES SOLD |
SHARES ISSUED FOR REINVESTMENT OF DISTRIBUTIONS |
SHARES REDEEMED |
NET INCREASE (DECREASE) IN SHARES OUTSTANDING |
||||||||||||||||||||||||
| Six Months Ended 6/30/18 (unaudited) |
Year Ended 12/31/17 |
Six Months Ended 6/30/18 (unaudited) |
Year Ended 12/31/17 |
Six Months Ended 6/30/18 (unaudited) |
Year Ended 12/31/17 |
Six Months Ended 6/30/18 (unaudited) |
Year Ended 12/31/17 |
||||||||||||||||||||
| Micro-Cap Portfolio | |||||||||||||||||||||||||||
| Investment Class | 601,085 | 1,796,718 | – | 1,782,597 | (2,232,602 | ) | (3,703,922 | ) | (1,631,517 | ) | (124,607 | ) | |||||||||||||||
| Service Class | 651,007 | 802,872 | – | 345,903 | (927,566 | ) | (1,182,366 | ) | (276,559 | ) | (33,591 | ) | |||||||||||||||
| Small-Cap Portfolio | |||||||||||||||||||||||||||
| Investment Class | 1,155,735 | 3,308,390 | – | 242,182 | (4,058,066 | ) | (7,022,710 | ) | (2,902,331 | ) | (3,472,138 | ) | |||||||||||||||
| Service Class | 104,744 | 23,847,980 | – | 245,185 | (2,454,490 | ) | (25,883,175 | ) | (2,349,746 | ) | (1,790,010 | ) | |||||||||||||||
| Investment Adviser and Distributor: |
| INVESTMENT ADVISER: |
Under the Trust’s
investment advisory agreements with Royce, Royce is entitled to receive investment
advisory fees in respect of each Fund that are computed daily and payable monthly.
Royce has contractually agreed, without right of termination, to waive fees and/or
reimburse expenses (excluding brokerage commissions, taxes, interest, litigation
expenses, acquired fund fees and expenses, and other expenses not borne in the ordinary
course of business) to the extent necessary to maintain the Funds’ net annual
operating expense ratios at specified levels through April 30, 2019, and is shown
below to the extent that it impacted net expenses for the six months ended June
30, 2018. See the Prospectus for contractual waiver expiration dates. |
| ANNUAL CONTRACTUAL
ADVISORY FEE AS A PERCENTAGE OF AVERAGE NET ASSETS |
COMMITTED NET ANNUAL OPERATING EXPENSE RATIO CAP1 |
SIX MONTHS ENDED JUNE 30, 2018 (UNAUDITED) |
||||||||
| Investment Class1 | Service Class1 | Net advisory fees | Advisory fees
waived |
|||||||
| Micro-Cap Portfolio | 1.25% | 1.33% | 1.58% | $ 1,168,696 | $ 12,122 | |||||
| Small-Cap Portfolio | 1.00% | 1.08% | 1.33% | 2,370,797 | – | |||||
| DISTRIBUTOR: |
Royce Fund
Services, LLC (“RFS”), the distributor of the Trust’s shares, is
a wholly owned subsidiary of Royce. RFS is entitled to receive distribution fees
from each Fund’s Service Class that are computed daily and payable monthly,
at an annual rate of 0.25% of the average net assets of each Class. For the six
months ended June 30, 2018, Micro-Cap Portfolio-Service Class recorded net distribution
fees of $37,701 and Small-Cap Portfolio-Service Class recorded net distribution fees
of $322,248. |
| Purchases and Sales of Investment Securities: |
For the six
months ended June 30, 2018, the costs of purchases and the proceeds from sales of
investment securities, other than short-term securities and collateral received for
securities loaned, were as follows: |
| PURCHASES | SALES | ||||||
| Micro-Cap Portfolio | $ | 24,518,782 | $ | 36,370,270 | |||
| Small-Cap Portfolio | 102,939,374 | 152,929,666 | |||||
Class Specific Expenses:
Class
specific expenses were as follows for the six months ended June 30, 2018:
| CLASS LEVEL | ||||||||||||||||||||||||
| EXPENSES | ||||||||||||||||||||||||
| REIMBURSED BY | ||||||||||||||||||||||||
| NET DISTRIBUTION | SHAREHOLDER | SHAREHOLDER | TRANSFER AGENT | INVESTMENT | ||||||||||||||||||||
| FEES | SERVICING | REPORTS | BALANCE CREDITS | TOTAL | ADVISER | |||||||||||||||||||
| Micro-Cap Portfolio – Investment Class | $ | – | $ | 3,671 | $ | 30,910 | $ | (32 | ) | $ | 34,549 | $ | 34,549 | |||||||||||
| Micro-Cap Portfolio – Service Class | 37,701 | 3,203 | 2,890 | (12 | ) | 43,782 | 6,132 | |||||||||||||||||
| 37,701 | 6,874 | 33,800 | (44 | ) | 40,681 | |||||||||||||||||||
| Small-Cap Portfolio – Investment Class | – | 3,508 | 25,356 | (28 | ) | 28,836 | 22,930 | |||||||||||||||||
| Small-Cap Portfolio – Service Class | 322,248 | 3,237 | 12,771 | (11 | ) | 338,245 | 9,219 | |||||||||||||||||
| 322,248 | 6,745 | 38,127 | (39 | ) | 32,149 | |||||||||||||||||||
| TAX INFORMATION: |
| At June 30, 2018, net unrealized appreciation (depreciation) based on identified cost for tax purposes was as follows: |
| NET UNREALIZED | GROSS UNREALIZED | ||||||||||||||
| TAX BASIS COST | APPRECIATION (DEPRECIATION) | Appreciation | Depreciation | ||||||||||||
| Micro-Cap Portfolio | $150,885,545 | $47,376,558 | $60,698,019 | $13,321,461 | |||||||||||
| Small-Cap Portfolio | 393,550,326 | 84,656,437 | 90,881,342 | 6,224,905 | |||||||||||
The primary cause of the difference between book and tax basis cost is the timing of the recognition of losses on securities sold.
| Royce Capital Fund 2018 Semiannual Report to Shareholders | 23 |
Understanding Your Fund’s Expenses (unaudited)
As a shareholder
of a mutual fund, you pay ongoing expenses, including management fees and other
Fund expenses including, for some funds, distribution and/or service (12b-1) fees.
Using the information below, you can estimate how these ongoing expenses (in dollars)
affect your investment and compare them with the ongoing expenses of other funds.
You may also incur one-time transaction expenses which are not shown in this section
and would result in higher total costs. The example is based on an investment of $1,000
invested at January 1, 2018, and held for the entire six-month period ended June
30, 2018. Service Class shares are generally available only through certain insurance
companies who receive service fees from the Fund for services that they perform. |
| Actual Expenses |
The first
part of the table below provides information about actual account values and actual
expenses. You may use the information in this section, together with the amount
you invested, to estimate the expenses that you paid over the period. Simply divide
your account value at June 30, 2018 by $1,000 (for example, an $8,600 account value
divided by $1,000 = 8.6), then multiply the result by the number under the heading
entitled “Expenses Paid During the Period” to estimate the expenses you
paid on your account during this period. |
| Hypothetical Example for Comparison Purposes |
The second
part of the table below provides information about hypothetical account values and
hypothetical expenses based on the Fund’s actual expense ratio and an assumed
rate of return of 5% per year before expenses, which is not the Fund’s actual
return. The hypothetical account values and expenses may not be used to estimate
the actual ending account balance or expenses you paid for the period. You may use
this information to compare the ongoing costs of investing in the Fund and other
funds. To do so, compare this 5% hypothetical example with the 5% hypothetical examples
that appear in the shareholder reports of the other funds. |
Please note
that the expenses shown in the table are meant to highlight your ongoing costs only
and do not reflect any transactional costs, such as sales charges (loads), redemption
fees, or exchange fees. Therefore, this section is useful in comparing ongoing costs
only, and will not help you determine the relative total costs of owning different
funds. In addition, if these transactional costs were included, your costs would
have been higher. |
| ACTUAL | HYPOTHETICAL (5% PER YEAR BEFORE EXPENSES) | |||||||||||||||||||||||||
| Beginning Account | Ending Account Value | Expenses Paid During | Beginning Account | Ending Account Value | Expenses Paid During | Annualized Expense | ||||||||||||||||||||
| Value 1/1/18 | 6/30/18 | the Period1 | Value 1/1/18 | 6/30/18 | the Period1 | Ratio2 | ||||||||||||||||||||
| Investment Class | ||||||||||||||||||||||||||
| Micro-Cap Portfolio | $ | 1,000.00 | $ | 1,102.02 | $ | 6.93 | $ | 1,000.00 | $ | 1,018.20 | $ | 6.66 | 1.33% | |||||||||||||
| Small-Cap Portfolio | 1,000.00 | 1,071.84 | 5.55 | 1,000.00 | 1,019.44 | 5.41 | 1.08% | |||||||||||||||||||
| Service Class | ||||||||||||||||||||||||||
| Micro-Cap Portfolio | 1,000.00 | 1,101.86 | 8.23 | 1,000.00 | 1,016.96 | 7.90 | 1.58% | |||||||||||||||||||
| Small-Cap Portfolio | 1,000.00 | 1,070.20 | 6.83 | 1,000.00 | 1,018.20 | 6.66 | 1.33% | |||||||||||||||||||
| 1 | Expenses
are equal to the Fund’s annualized expense ratio multiplied by the average
account value for the period, multiplied by 181 days in the most recent fiscal half-year
divided by 365 days (to reflect the half-year period). This information does not
include fees or expenses of the variable annuity contracts investing in the Fund. |
Annualized
expense ratio used to derive figures in the table is based on the most recent fiscal
half-year. |
| 24 | Royce Capital Fund 2018 Semiannual Report to Shareholders |
Trustees and Officers
All Trustees and Officers may be reached c/o The Royce Funds, 745 Fifth Avenue, New York, NY 10151
Charles M. Royce, Trustee1
Age: 78 |
Number of Funds Overseen: 22 | Tenure: Since 1982
Non-Royce Directorships: Director
of Oxford Square Capital Corp.
Principal Occupation(s) During Past Five Years: Chairman
of the Board of Managers of Royce & Associates, LP (“Royce”),
the Trust’s investment adviser; Chief Executive Officer (1972–June
2016), President (1972-June 2014) of Royce.
Christopher D. Clark, Trustee1, President
Age: 53 | Number of Funds Overseen: 22 | Tenure: Since 2014
Principal Occupation(s)
During Past Five Years: Chief Executive Officer (since July 2016), President
(since July 2014), Co-Chief Investment Officer (Since January 2014), Managing Director of Royce,
a Member of the Board of Managers of Royce, having been employed
by Royce since May 2007.
Patricia W. Chadwick, Trustee
Age: 69
| Number of Funds Overseen: 22 | Tenure: Since 2009
Non-Royce Directorships:
Trustee of ING Mutual Funds and Director of Wisconsin Energy Corp.
Principal
Occupation(s) During Past 5 Years: Consultant and President of Ravengate Partners
LLC (since 2000).
Christopher C. Grisanti, Trustee
Age: 56
| Number of Funds Overseen: 22 | Tenure: Since 2017
Non-Royce Directorships: None
Principal
Occupation(s) During Past Five Years: Co-Founder and Chief
Executive Officer of Grisanti Capital Management LLC, an investment
advisory firm (since 1999). Mr. Grisanti’s prior business experience
includes serving as Director of Research and Portfolio Manager at Spears
Benzak, Salomon & Farrell (from 1994 to 1999) and a senior associate at
the law firm of Simpson, Thacher & Bartlett (from 1988 to 1994).
Stephen L. Isaacs, Trustee
Age: 78 |
Number of Funds Overseen: 22 | Tenure: Since 1989
Non-Royce Directorships: None
Principal Occupation(s) During Past Five Years: Attorney and President of
Health Policy Associates, Inc., consultants. Mr. Isaacs’s prior business
experience includes having served as President of the Center for Health and Social
Policy (from 1996 to 2012); Director of Columbia University Development Law and
Policy Program and Professor at Columbia University (until August 1996).
Arthur S. Mehlman, Trustee
Age: 76 |
Number of Funds Overseen: 41 | Tenure: Since 2004
Non-Royce Directorships: Director/Trustee
of registered investment companies constituting the 19 Legg Mason Funds.
Principal Occupation(s) During Past Five Years: Director of The League for People
with Disabilities, Inc.; Director of University of Maryland Foundation (non-profits).
Formerly: Director of Municipal Mortgage & Equity, LLC (from October 2004
to April 1, 2011); Director of University of Maryland College Park Foundation
(non-profit) (from 1998 to 2005); Partner, KPMG LLP (international accounting
firm) (from 1972 to 2002); Director of Maryland Business Roundtable for Education
(from July 1984 to June 2002).
David L. Meister, Trustee
Age: 78 | Number
of Funds Overseen: 22 | Tenure: Since 1982
Non-Royce Directorships: None
Principal Occupation(s) During Past Five Years: Consultant. Chairman and Chief
Executive Officer of The Tennis Channel (from June 2000 to March 2005). Mr. Meister’s prior business experience
includes having served as Chief Executive Officer
of Seniorlife.com, a consultant to the communications industry, President of
Financial News Network, Senior Vice President of HBO, President of Time-Life
Films, and Head of Broadcasting for Major League Baseball.
G. Peter O’Brien, Trustee
Age: 72
| Number of Funds Overseen: 41 | Tenure: Since 2001
Non-Royce Directorships:
Director/Trustee of registered investment companies constituting the 19 Legg
Mason Funds.
Principal Occupation(s) During
Past Five Years: Trustee Emeritus of
Colgate University (since 2005); Board Member of Hill House, Inc.
(since 1999); Formerly Director of TICC Capital Corp. (from 2003-2017):
Trustee of Colgate University (from 1996 to 2005), President of Hill
House, Inc. (from 2001 to 2005) and Managing Director/Equity Capital
Markets Group of Merrill Lynch & Co. (from 1971 to 1999).
Michael K. Shields, Trustee
Age: 60 |
Number of Funds Overseen: 22 | Tenure: Since 2015
Principal Occupation(s) During
Past Five Years: President and
Chief Executive Officer of Piedmont Trust Company, a private North
Carolina trust company (since May 2012). Mr. Shields’s prior business
experience includes owning Shields Advisors, an investment
consulting firm (from April 2010 to June 2012).
Francis D. Gannon, Vice President
Age:
50 | Tenure: Since 2014
Principal Occupation(s) During Past Five Years: Co-Chief
Investment Officer (since January 2014) and Managing Director of Royce, having
been employed by Royce since September 2006.
Daniel A. O’Byrne, Vice President
Age: 56 | Tenure: Since 1994
Principal Occupation(s) During Past Five Years: Principal
and Vice President of Royce, having been employed by Royce since October 1986.
Peter K. Hoglund, Treasurer
Age: 52 |
Tenure: Since 2015
Principal Occupation(s) During Past Five Years: Chief Financial Officer,
Chief Administrative Officer, and Managing Director of Royce, having
been employed by Royce since December 2014. Prior to joining
Royce, Mr. Hoglund spent more than 20 years with Munder Capital
Management in Birmingham, MI, serving as Managing Director and
Chief Financial Officer and overseeing all financial aspects of the firm.
He began his career at Munder as a portfolio manager.
John E. Denneen, Secretary and Chief Legal
Officer
Age: 51 | Tenure: 1996-2001 and Since 2002
Principal Occupation(s)
During Past Five Years: General Counsel, Managing Director, and, since June 2015,
a Member of the Board of Managers of Royce. Chief Legal and Compliance Officer
and Secretary of Royce.
Lisa Curcio, Chief Compliance Officer
Age: 58 | Tenure: Since 2004
Principal Occupation(s) During Past Five Years: Chief
Compliance Officer of The Royce Funds (since October 2004) and Compliance Officer of Royce (since June 2004).
| 1 | Interested Trustee. |
Trustees will hold office until their successors have been duly elected and qualified or until their earlier resignation or removal. The Statement of Additional Information, which contains additional information about the Trust’s trustees and officers, is available and can be obtained without charge at www.roycefunds.com or by calling (800) 221-4268. |
| Royce Capital Fund 2018 Semiannual Report to Shareholders | 25 |
Board Approval of Investment Advisory Agreement
At meetings held on June 4-5, 2018, the Board of Trustees of Royce Capital Fund (the “Board”), including all of the non-interested trustees, approved the continuation of an investment advisory agreement (the “Investment Advisory Agreement”) between Royce & Associates, LP (“R&A”) and Royce Capital Fund (“RCF”) relating to each of Royce Micro-Cap Portfolio and Royce Small-Cap Portfolio (each, a “Fund” and together, the “Funds”). In reaching these decisions, the Board reviewed the materials provided by R&A, which included, among other things, information prepared internally by R&A and independently by Broadridge Financial Solutions, Inc. (“Broadridge”) using the database and methodology of Morningstar Associates, LLC (“Morningstar”) containing detailed investment advisory fee, expense ratio, and investment performance comparisons for each Fund with other mutual funds in its “peer group” and “category”, information regarding the past performance of the Funds and other registered investment companies managed by R&A and a memorandum outlining the legal duties of the Board prepared by independent counsel to the non-interested trustees. R&A also provided the trustees with an analysis of its profitability with respect to providing investment advisory services to each of the Funds. In addition, the Board took into account information furnished throughout the year at regular Board meetings, including reports on investment performance, shareholder services, distribution fees and expenses, regulatory compliance, brokerage commissions and research, brokerage and other execution products and services provided to the Funds. The Board also considered other matters it deemed important to the approval process such as allocation of brokerage commissions, “soft dollar” research services R&A receives, payments made to affiliates of R&A, as well as payments made by R&A, relating to distribution of Fund shares, and other direct and indirect benefits to R&A and its affiliates, from their relationship with the Funds. The trustees also met throughout the year with investment advisory personnel from R&A. The Board also noted R&A’s efforts to provide enhanced analytical tools to its investment staff along with the ongoing meetings conducted by R&A’s Co-Chief Investment Officers with portfolio managers experiencing performance challenges in an attempt to address such challenges. The Board, in its deliberations, recognized that, for many of the Funds’ shareholders, the decision to purchase Fund shares included a decision to select R&A as the investment adviser and that there was a strong association in the minds of Fund shareholders between R&A and each Fund. In considering factors relating to the approval of the continuance of the Investment Advisory Agreement, the non-interested trustees received assistance and advice from, and met separately with, their independent legal counsel. While continuation of the investment advisory and administrative arrangements for each Fund was considered at the same Board meeting, the trustees dealt with each Fund separately. Among other factors, the trustees noted that they considered the following:
The nature, extent and quality of services provided by R&A:
The Board considered the following factors to be of fundamental
importance to their consideration of whether to approve the continuance
of the Investment Advisory Agreement: (i) R&A’s more than 40 years
of value investing experience and track record; (ii) the history of long-tenured
R&A portfolio managers managing the Funds; (iii) R&A’s focus on
mid-cap, small-cap and micro-cap value investing; (iv) the consistency of
R&A’s approach to managing the Funds, other open-end mutual funds,
and closed-end funds over more than 40 years; (v) the integrity and high
ethical standards adhered to at R&A; (vi) R&A’s specialized experience in
the area of trading small- and micro-cap securities; (vii) R&A’s historical
ability to attract and retain portfolio management talent; and (viii) R&A’s
focus on shareholder interests as exemplified by capping expenses
on smaller funds and providing expansive shareholder reporting and
communications. The Board reviewed the services that R&A provides
to the Funds, including, but not limited to, managing each Fund’s
investments in accordance with the stated policies of each Fund. The
Board considered the fact that R&A provided certain administrative
services to the Funds at cost pursuant to the Administration Agreement
between RCF and R&A. The Board determined that the services
to be provided to each Fund by R&A would be the same as those
that it previously provided to each Fund. The trustees also took into
consideration the histories, reputations and backgrounds of R&A’s
portfolio managers for the Funds, finding that these would likely have an impact on the continued success of the Funds. Lastly, the Board noted
R&A’s ability to attract and retain qualified and experienced personnel.
The Board concluded that the investment advisory services provided
by R&A to each Fund compared favorably to services provided by R&A
to other R&A client accounts, including other funds, in both nature and
quality, and that the scope of services provided by R&A would continue
to be suitable for each Fund.
Investment performance of the Funds and R&A:
Although the registered investment companies managed by R&A
currently span a wider risk spectrum than they have historically, R&A
generally emphasizes a risk-averse approach to investing. In light of
that approach, the trustees believe that risk-adjusted performance
continues to be the most appropriate measure of each Fund’s
investment performance. One measure of risk-adjusted performance
the trustees have historically used in their review of each Fund’s
performance is the Sharpe Ratio. The Sharpe Ratio is a risk-adjusted
measure of performance developed by Nobel Laureate William Sharpe.
It is calculated by dividing a fund’s annualized excess returns by its
annualized standard deviation to determine reward per unit of risk.
The higher the Sharpe Ratio, the better a fund’s historical risk-adjusted
performance. The Board attaches primary importance to risk-adjusted
performance over relatively long periods of time, typically 3 to 10 years.
Overall, the Board noted that financial markets in 2017 continued
to be marked by increased return dispersion, declining correlation,
and a steepening yield curve. Although these factors resulted in a
very strong year for small-cap stocks, defensive and growth stocks
surprisingly outperformed cyclical and value stocks. Neither Royce
Small-Cap Portfolio (“RCS”) nor Royce Micro-Cap Portfolio (“RCM”)
could overcome the market leadership of defensive and growth stocks
and ineffective stock selection in certain sectors and underperformed
the funds within their Morningstar category in 2017. It was further
noted that RCS’s and RCM’s focus on high quality companies (e.g.,
those with solid balance sheets, low leverage, the ability to generate
and effectively allocate free cash flow, and strong returns on invested
capital) and cyclical companies had hurt their relative performance
during the March 2009 to 2015 market period that has been marked
by historically low interest rates and significant U.S. Federal Reserve
market intervention, as highly leveraged, non-earning companies and
yield-oriented securities (e.g., master limited partnerships, real estate
investment trusts, and utilities) generally outperformed their higher
quality and cyclical counterparts during this period. The trustees
noted that these factors contributed to RCS’s and RCM’s Sharpe Ratio
ranking in the 4th quartile within its Morningstar category for the 1-year,
3-year, 5-year, and 10-year periods ended December 31, 2017.
In addition to each Fund’s risk–adjusted performance, the Board also
reviewed and considered each Fund’s absolute total returns, down
market performance, and long-term performance records over periods
of 10 years or longer. The Board noted that R&A manages a number of
funds that invest in micro-cap, small-cap, and mid-cap issuers, many of
which had outperformed their benchmark indices and their competitors
during the periods prior to the U.S. Federal Reserve’s near zero interest
rate policy and related market interventions as well as in more recent
periods. Although the Board recognized that past performance is not
necessarily an indicator of future results, it found that R&A had the
necessary qualifications, experience and track record in managing
equity mutual funds to manage each Fund. The Board determined that
R&A continued to be an appropriate investment adviser for each Fund
and concluded that each Fund’s performance supported the approval
of the continuance of the Investment Advisory Agreement.
Cost of the services provided and profits realized by R&A
from its relationship with each Fund:
The Board considered the cost of the services provided by R&A and
the profits realized by R&A from its relationship with each Fund. As
part of the analysis, the trustees discussed with R&A its methodology
in allocating its costs to each Fund and concluded that R&A’s
allocations were reasonable. The Board concluded that R&A’s profits
during the year ended December 31, 2017 were reasonable in relation
to the nature and quality of services provided.
| 26 | Royce Capital Fund 2018 Semiannual Report to Shareholders |
Notes to Performance and Other Important Information
This material contains forward-looking statements within the meaning of the Securities Exchange Act of 1934, as amended (the “Exchange Act”), that involve risks and uncertainties, including, among others, statements as to:
| • | the Funds’ future operating results, |
| • | the prospects of the Funds’ portfolio companies, |
| • | the impact of investments that the Funds have made or may make, |
| • | the dependence of the Funds’ future success on the general
economy and its impact on the companies and industries in which
the Funds invest, and |
| • | the ability of the Funds’ portfolio companies to
achieve their objectives. |
Proxy Voting
A copy of the policies and procedures that The Royce Funds use to
determine how to vote proxies relating to portfolio securities and
information regarding how each of The Royce Funds voted proxies
relating to portfolio securities during the most recent 12-month period
ended June 30 is available, without charge, on The Royce Funds’
website at www.roycefunds.com, by calling (800) 221-4268 (toll-free),
and on the website of the Securities and Exchange Commission
(“SEC”) at www.sec.gov.
Form N-Q Filing
The Funds file their complete schedules of investments with the
SEC for the first and third quarters of each fiscal year on Form N-Q.
The Funds’ Forms N-Q are available on The Royce Funds’ website
at www.roycefunds.com and on the SEC’s website at www.sec.gov.
The Funds’ Forms N-Q may also be reviewed and copied at the SEC’s
Public Reference Room in Washington, D.C. To find out more about this
public service, call the SEC at (202) 942-8090. The Funds’ complete
schedules of investments are updated quarterly and are available at
www.roycefunds.com.
| Royce Capital Fund 2018 Semiannual Report to Shareholders | 27 |
| This page is intentionally left blank. |
| This page is intentionally left blank. |
 |
||||
| About The Royce Funds | ||||
Unparalleled Knowledge + Experience Pioneers in small-cap investing, with 40+ years of experience, depth of knowledge, and focus. |
||||
Independent Thinking The confidence to go against consensus, the insight to uncover opportunities others might miss, and the tenacity to stay the course through market cycles. |
||||
Specialized Approaches Strategies that use value, core, or growth investment approaches to select micro-cap, small-cap, and mid-cap companies. |
Contact Us |
|||
Unwavering Commitment Our team of 18 portfolio managers have significant personal investments in the strategies they manage. |
GENERAL INFORMATION
Additional Report Copies and Prospectus Inquiries (800) 221-4268 |
|||
 |
 |
 |
||
Item 2. Code(s) of Ethics. Not applicable to this semi-annual report.
Item 3. Audit Committee Financial Expert. Not applicable to this semi-annual report.
Item 4. Principal Accountant Fees and Services. Not applicable to this semi-annual report.
Item 5. Audit Committee of Listed Registrants. Not Applicable
Item 6. Investments.
(a) See Item 1.
(b) Not Applicable
Item 7. Disclosure of Proxy Voting Policies and Procedures for Closed-End Management Investment Companies. Not Applicable.
Item 8. Portfolio Managers of Closed-End Management Investment Companies. Not Applicable.
Item 9. Purchases of Equity Securities by Closed-End Management Investment Company and Affiliated Purchasers. Not Applicable
Item 10. Submission of Matters to a Vote of Security Holders. Not Applicable.
Item 11. Controls and Procedures.
(a) Disclosure Controls and Procedures. The Principal Executive and Financial Officers concluded that the Registrant's Disclosure Controls and Procedures are effective based on their evaluation of the Disclosure Controls and Procedures as of a date within 90 days of the filing date of this report.
(b) Internal Control over Financial Reporting. There were no significant changes in Registrant's internal control over financial reporting or in other factors that could significantly affect this control subsequent to the date of the evaluation, including any corrective actions with regard to significant deficiencies and material weaknesses during the second fiscal quarter of the period covered by this report.
Item 12. Exhibits. Attached hereto.
(a)(1) Not applicable to this semi-annual report.
(a)(2) Separate certifications by the Registrant’s Principal Executive Officer and Principal Financial Officer as required by Rule 30a-2(a) under the Investment Company Act of 1940.
(a)(3) Not Applicable
(b) Separate certifications by the Registrant’s Principal Executive Officer and Principal Financial Officer, pursuant to Section 906 of the Sarbanes-Oxley Act of 2002 and required by Rule 30a-2(b) under the Investment Company Act of 1940.
Pursuant to the requirements of the Securities Exchange Act of 1934 and the Investment Company Act of 1940, the registrant has duly caused this report to be signed on its behalf by the undersigned, thereunto duly authorized.
ROYCE CAPITAL FUND
BY: /s/ Christopher D. Clark
Christopher D. Clark
President
Date: August 28, 2018
Pursuant to the requirements of the Securities Exchange Act of 1934 and the Investment Company Act of 1940, this report has been signed below by the following persons on behalf of the registrant and in the capacities and on the dates indicated.
| ROYCE CAPITAL FUND | ROYCE CAPITAL FUND |
| BY: /s/ Christopher D. Clark | BY: /s/ Peter K. Hoglund |
| Christopher D. Clark | Peter K. Hoglund |
| President | Chief Financial Officer |
| Date: August 28, 2018 | Date: August 28, 2018 |