UNITED STATES SECURITIES AND EXCHANGE COMMISSION
Washington, D.C. 20549
FORM 10-K
ANNUAL REPORT PURSUANT TO SECTION 13 OR 15(d) OF THE SECURITIES EXCHANGE ACT OF 1934 (FEE REQUIRED) | |
For the fiscal year ended March 31, 2020
or
TRANSITION REPORT PURSUANT TO SECTION 13 OR 15(d) OF THE SECURITIES EXCHANGE ACT OF 1934 | |
Commission file number 0-27618
_________________
(Exact name of Registrant as specified in its charter)
(State of Incorporation) | (I.R.S. Employer Identification Number) | |
(Address of principal executive offices, including zip code)
(716 ) 689-5400
(Registrant’s telephone number, including area code)
_________________
Securities registered pursuant to Section 12(b) of the Act:
Title of each class | Trading Symbol(s) | Name of each exchange on which registered |
Indicate by check mark if the registrant is a well-known seasoned issuer, as defined in Rule 405 of the Securities Act. Yes ☐ No ☒
Indicate by check mark if the registrant is not required to file reports pursuant to Section 13 or Section 15(d) of the Exchange Act. Yes ☐ No ☒
Indicate by checkmark whether the registrant (1) has filed all reports required to be filed by Section 13 or 15(d) of the Securities Exchange Act of 1934 during the preceding 12 months (or for such shorter period that the Registrant was required to file such reports), and (2) has been subject to such filing requirements for the past 90 days. Yes ☒ No ☐
Indicate by check mark whether the registrant has submitted electronically and posted on its corporate Web site, if any, every Interactive Data File required to be submitted and posted pursuant to Rule 405 of Regulation S-T during the preceding 12 months (or for such shorter period that the registrant was required to submit and post such files). Yes ☒ No ☐
Indicate by check mark if disclosure of delinquent filers pursuant to Item 405 of Regulation S-K (§229.405 of this chapter) is not contained herein, and will not be contained, to the best of Registrant’s knowledge, in definitive proxy or information statements incorporated by reference in Part III of this Form 10-K or any amendment to this Form 10-K ☒.
Indicate by checkmark whether the registrant is a large accelerated filer, an accelerated filer, a non-accelerated filer, or a smaller reporting company. See definition of “accelerated filer,” “large accelerated filer” and “smaller reporting company” in Rule 12b-2 of the Act.
☒ | Accelerated filer | ☐ | Non-accelerated filer | ☐ | Smaller reporting company | Emerging Growth Company | |||
If an Emerging Growth Company, indicate by check mark if the registrant has elected not to use the extended transition period for complying with any new or revised financial accounting standards provided pursuant to Section 13(a) of the Exchange Act. o | |||||||||
Indicate by check mark whether the registrant is a shell company (as defined in Rule 12b-2 of the Act). Yes ☐ No ☒
The aggregate market value of the voting stock held by non-affiliates of the Registrant as of September 30, 2019 (the second fiscal quarter in which this Form 10-K relates) was approximately $859 million, based upon the closing price of the Company’s common shares as quoted on the Nasdaq Stock Market on such date. The number of shares of the Registrant’s common stock outstanding as of May 22, 2020 was 23,786,363 shares.
DOCUMENTS INCORPORATED BY REFERENCE
Portions of the Registrant’s proxy statement for its 2020 Annual Meeting of Shareholders to be filed with the Securities and Exchange Commission pursuant to Regulation 14A not later than 120 days after the end of the Registrant’s fiscal year ended March 31, 2020 are incorporated by reference into Part III of this report.
1
COLUMBUS McKINNON CORPORATION
2020 Annual Report on Form 10-K
This annual report contains “forward-looking statements” within the meaning of the Private Securities Litigation Reform Act of 1995. Such statements involve known and unknown risks, uncertainties and other factors that could cause our actual results to differ materially from the results expressed or implied by such statements, including general economic and business conditions, including the impact of the COVID-19 pandemic, conditions affecting the industries served by us and our subsidiaries, conditions affecting our customers and suppliers, competitor responses to our products and services, the overall market acceptance of such products and services, the integration of acquisitions and other factors set forth herein under “Risk Factors.” We use words like “will,” “may,” “should,” “plan,” “believe,” “expect,” “anticipate,” “intend,” “future” and other similar expressions to identify forward looking statements. These forward looking statements speak only as of their respective dates and we do not undertake and specifically decline any obligation to publicly release the results of any revisions to these forward-looking statements that may be made to reflect any future events or circumstances after the date of such statements or to reflect the occurrence of anticipated or unanticipated changes. Our actual operating results could differ materially from those predicted in these forward-looking statements, and any other events anticipated in the forward-looking statements may not actually occur.
2
TABLE OF CONTENTS
Part I | |||
Item 1. | Business | ||
Item 1A. | Risk Factors | ||
Item 1B. | Unresolved Staff Comments | ||
Item 2. | Properties | ||
Item 3. | Legal Proceedings | ||
Item 4. | Mine Safety Disclosures | ||
Part II | |||
Item 5. | Market for Registrant's Common Equity, Related Stockholder Matters and Issuer Purchases of Equity Securities | ||
Item 6. | Selected Financial Data | ||
Item 7. | Management's Discussion and Analysis of Financial Condition and Results of Operations | ||
Item 7A | Quantitative and Qualitative Disclosures About Market Risk | ||
Item 8. | Financial Statements and Supplemental Data | ||
Item 9. | Changes in and Disagreements with Accountants on Accounting and Financial Disclosures | ||
Item 9A. | Controls and Procedures | ||
Item 9B. | Other Information | ||
Part III. | |||
Item 10. | Directors and Executive Officers of Registrant | ||
Item 11. | Executive Compensation | ||
Item 12. | Security Ownership of Certain Beneficial Owners and Management and Related Stockholder Matters | ||
Item 13. | Certain Relationships and Related Transactions, and Director Independence | ||
Item 14. | Principal Accountant Fees and Services | ||
Part IV | |||
Item 15 | Exhibits and Financial Statement Schedules | ||
3
PART I
Item 1. Business
General
Columbus McKinnon is a leading worldwide designer, manufacturer and marketer of motion control products, technologies, automated systems and services that efficiently and ergonomically move, lift, position and secure materials. Key products include hoists, crane components, actuators, rigging tools, light rail workstations, and digital power and motion control systems. The Company is focused on commercial and industrial applications that require the safety and quality provided by its superior design and engineering know-how. Our products are used for mission critical industrial applications where we have established trusted brands with significant customer retention. Our targeted market verticals include general industrial, construction and infrastructure, mining, oil & gas, energy, aerospace, transportation, automotive, heavy equipment manufacturing and entertainment.
In the U.S., we are the market leader for hoists and material handling digital power control systems, our principal line of products, as well as certain chain, forged fittings, and actuator products. We have achieved this leadership position through strategic acquisitions, our extensive, diverse, and well-established distribution channels and our commitment to product innovation and quality. We believe the breadth of our product offering and expansive distribution channels provide us a strategic advantage in our markets. Additionally, we believe we are the market leader for manual hoist and actuator products in Europe. Our market leadership and strong brands enable us to sell more products than our competition through our extensive distribution channels in the U.S. and Europe. The acquisition of STAHL CraneSystems ("STAHL") in fiscal 2017, which is well renowned for its custom engineering lifting solutions and hoisting technology, advanced our position as a global leader in the production of explosion-protected hoists. STAHL serves independent crane builders and Engineering Procurement and Construction ("EPC") firms, providing products to a variety of end markets including automotive, general manufacturing, oil and gas, steel and concrete, power generation, as well as process industries such as chemical and pharmaceuticals.
Our Blueprint for Growth Strategy is a three-phased strategy to increase the earnings power of the Company and transform us into a growth-oriented industrial technology company. The goal of our strategy is to increase our earnings power and expand EBITDA margins, as well as improve our Return on Invested Capital. Phase I, which began early in fiscal 2018, was focused on attaining operational control and instilling a performance-based culture to drive results.
We completed Phase I during fiscal 2018. In doing so, we believe we grew market share in the U.S. and achieved $6 million of synergies related to the STAHL acquisition. In addition, we introduced several new products incorporating smart hoist technologies and repaid $60 million of our long-term debt.
We began Phase II of the strategy in November 2017. This phase utilizes our 80/20 process which focuses on business simplification, improving our operational excellence, and ramping the growth engine by investing in new product development and a digital platform to grow profitably. Investment in R&D will advance our smart hoist technology and enhance our customers’ digital experience so we can capitalize on the automation megatrend. Research and development costs were $11,310,000, $13,491,000, and $13,617,000 in fiscal years 2020, 2019, and 2018, respectively.
In addition to restructuring our organization to simplify our business, we identified three businesses in our portfolio that were not a fit with our product offerings and strategy. By March 2019, the Company had completed the divestiture of these three businesses. The Tire Shredder business was sold in December 2018. The remaining two businesses, which were sold in February 2019, included Crane Equipment and Service, Inc. and Stahlhammer Bommern GmbH. During fiscal 2020, the Company reduced its manufacturing footprint by completing the closure of one manufacturing facility in Ohio and began consolidation of its remaining facility in Ohio into our remaining U.S. facilities. Similarly, one of our manufacturing facilities in China was closed during fiscal 2020 and its operations were consolidated into our other manufacturing facility in China.
Phase III of the strategy is centered on evolving the business model including optimizing our current product portfolio as well as pursuing acquisitions to advance our transformation into a leading industrial technology company. Our acquisitions of Magnetek, Inc. and STAHL and our efforts to leverage their technology are well aligned with our transformation efforts. We have demonstrated our ability to acquire companies and achieve significant synergies and growth. As we begin Phase III of our strategy, we will look for acquisitions that advance our position as a “lifting specialist” or further our technology in “smart movement”.
Our business is cyclical in nature and sensitive to changes in general economic conditions, including changes in industrial capacity utilization, industrial production, and general economic activity indicators, like GDP growth. Both U.S. and Eurozone capacity utilization are leading market indicators for our Company. Like many global companies, we are being affected by the Novel Coronavirus ("COVID-19"). While the severity and duration of this global pandemic is not known at this time, we are seeking
4
to take all appropriate measures to protect the cash flow and liquidity of the Company. This includes reducing our cost base, reducing working capital needs, and reducing capital expenditures. We have a flexible capital structure composed of a Credit Agreement that includes a Term Loan that requires quarterly principal payments of $1.1 million, and a $100 million Revolving Credit Facility ("Revolver"). Under the Credit Agreement, in addition to other affirmative and negative covenants, we have a financial covenant whereby the total net leverage ratio cannot exceed 3.00: 1.00 and is only tested at the end of the relevant reference period (quarter end) when the Revolver is outstanding. While the Revolver was undrawn as of March 31, 2020 and did not apply, had we been required to determine the covenant ratio we would have been in compliance with the covenant provisions. Subsequent to March 31, 2020, the Company drew $25 million from the Revolver for liquidity and working capital purposes, demonstrating that it has a supportive bank group.
Business Description
ASC Topic 280 “Segment Reporting” establishes the standards for reporting information about operating segments in financial statements. We provide our products and services through one operating and reportable segment.
We design, manufacture, and distribute a broad range of material handling products for various applications. Products include a wide variety of electric, air-powered, lever, and hand hoists, hoist trolleys, explosion-protected hoists, winches, and aluminum work stations; alloy and carbon steel chain; forged attachments, such as hooks, shackles, textile slings, clamps, and load binders; mechanical and electromechanical actuators and rotary unions; and below-the-hook special purpose lifters; power and motion control systems, such as AC and DC drive systems, radio remote controls, push button pendant stations, brakes, and collision avoidance and power delivery subsystems. These products are typically manufactured for stock or assembled to order from standard components and are sold primarily through a variety of commercial distributors and to a lesser extent, directly to end-users. Our STAHL subsidiary brings market leadership with independent crane builders and EPC firms. The diverse end-users of our products are in a variety of industries including manufacturing, power generation and distribution, utilities, wind power, warehouses, commercial construction, oil and gas exploration and refining, petrochemical, marine, ship building, transportation and heavy-duty trucking, agriculture, logging and mining. We also serve a niche market for the entertainment industry including permanent and traveling concerts, live theater, and sporting venues.
Products
Of our fiscal 2020 sales, $442,623,000, or 55%, were U.S. and $366,539,000 or 45% were non-U.S. The following table sets forth certain sales data for our products, expressed as a percentage of net sales for fiscal 2020 and 2019:
Fiscal Years Ended March 31, | ||||||
2020 | 2019 | |||||
Hoists | 64 | % | 62 | % | ||
Chain and rigging tools | 9 | 10 | ||||
Digital power control and delivery systems | 12 | 11 | ||||
Actuators and rotary unions | 10 | 9 | ||||
Industrial cranes | 2 | 4 | ||||
Elevator application drive systems | 3 | 3 | ||||
Other | — | 1 | ||||
100 | % | 100 | % | |||
Hoists - We manufacture a wide variety of electric chain hoists, electric wire rope hoists, hand-operated hoists, winches, lever tools, and air-powered hoists. Load capacities for our hoist product lines range from one-eighth of a ton to nearly 140 tons with the acquisition of STAHL. These products are sold under our Budgit, Chester, CM, Coffing, Little Mule, Pfaff, Shaw-Box, Yale, STAHL, and other recognized brands. Our hoists are sold for use in numerous general industrial applications, as well as for use in the construction, energy, mining, food services, entertainment, and other markets. We also supply hoist trolleys, driven manually or by electric motors, that are used in conjunction with hoists.
We also offer several lines of standard and custom-designed, below-the-hook tooling, clamps, and textile strappings. Below-the-hook tooling, textile, and chain slings and associated forgings, and clamps are specialized lifting apparatus used in a variety of lifting activities performed in conjunction with hoisting or lifting applications.
5
STAHL primarily manufactures explosion-protected hoists and custom engineered hoists, including wire rope and manual and electric chain hoists. STAHL products are sold to a variety of end markets including automotive, general manufacturing, oil and gas, steel and concrete, power generation as well as process industries such as chemical and pharmaceuticals.
Chain and Rigging Tools - We manufacture alloy and carbon steel chain for various industrial and consumer applications. U.S. federal regulations require the use of alloy chain, which we first developed, for overhead lifting applications because of its strength and wear characteristics. A line of our alloy chain is sold under the Herc-AlloyTM brand name for use in overhead lifting, pulling, and restraining applications. In addition, we also sell specialized load chain for use in hoists, as well as three grades and multiple sizes of carbon steel welded-link chain for various load securing and other non-overhead lifting applications.
We produce a broad line of alloy and carbon steel closed-die forged chain attachments, including hooks, shackles, HammerloksTM, and master links. These forged attachments are used in chain, wire rope, and textile rigging applications in a variety of industries, including transportation, mining, construction, marine, logging, petrochemical, and agriculture.
In addition, we manufacture carbon steel forged and stamped products, such as load binders, logging tools, and other securing devices, for sale to the industrial and logging markets through industrial distributors, hardware distributors, mass merchandiser outlets, and Original Equipment Manufacturers ("OEMs").
Digital Power Control and Delivery Systems - Through our Magnetek brand, we are a leading provider of innovative power control and delivery systems and solutions for overhead material handling applications used in a number of diverse industries, including aerospace, automotive, steel, aluminum, paper, logging, mining, ship loading, nuclear power plants, and heavy movable structures. We are a major supplier in North America of power and motion control systems, which include AC and DC drive systems, radio remote controls, push button pendant stations, brakes, and collision avoidance and power delivery subsystems. While we sell primarily to OEMs of overhead cranes and hoists, we spend a great deal of effort understanding the needs of end users to gain specification. We can combine our products with engineered services to provide complete customer-specific systems solutions.
We are also a leading independent supplier of AC and DC digital motion control systems for underground coal mining equipment. Our systems are used in coal hauling vehicles, shuttle cars, scoops, and other heavy mining equipment.
Actuators and Rotary Unions - Through our Duff-Norton and Pfaff brands, we design and manufacture industrial components such as mechanical and electromechanical actuators and rotary unions. Actuators are linear motion devices used in a variety of industries, including the transportation, paper, steel, energy, aerospace, and many other commercial industries. Rotary unions are devices that transfer a liquid or gas from a fixed pipe or hose to a rotating drum, cylinder or other device. Rotary unions are used in a variety of industries including pulp and paper, printing, textile and fabric manufacturing, rubber, and plastic.
Elevator Application Drive Systems - Through our Magnetek brand we also design, build, sell, and support elevator application-specific drive products that efficiently deliver power used to control motion, primarily in high-rise, high-speed elevator applications. We are recognized as an industry leader for DC high-performance elevator drives, as well as for AC drives used with low- and high-performance traction elevators, due to our extensive application expertise and product reliability. Our elevator product offerings are comprised of highly integrated subsystems and drives, sold mainly to elevator OEMs. In addition, our product options include a number of regenerative controls for both new building installations and elevator modernization projects that help building owners save energy.
Distribution and Markets
Our distribution channels include a variety of commercial distributors. In addition, we sell aluminum light rail systems as well as certain motion technology products directly to end-users. The following describes our global distribution channels:
General Distribution Channels - Our global general distribution channels consist of:
— Industrial distributors that serve local or regional industrial markets and sell a variety of products for maintenance repair, operating, and production, or MROP, applications through their own direct sales force.
— | Rigging shops that are distributors with expertise in rigging, lifting, positioning, and load securing. Most rigging shops assemble and distribute chain, wire rope and synthetic slings, and distribute manual hoists and attachments, chain slings, and other products. |
6
— | Independent crane builders that design, build, install, and service overhead crane and light-rail systems for general industry and also distribute a wide variety of hoists and crane components. We sell electric wire rope hoists and chain hoists as well as crane components, such as end trucks, trolleys, drives, and electrification systems to crane builders. |
Specialty Distribution Channels - Our global specialty distribution channels consist of:
— | National and regional distributors that market a variety of MROP supplies, including material handling products, either exclusively through large, nationally distributed catalogs, or through a combination of catalog, internet, and branch sales and a field sales force. |
— | Material handling specialists and integrators that design and assemble systems incorporating hoists, overhead rail systems, trolleys, scissor lift tables, manipulators, air balancers, jib arms, and other material handling products to provide end-users with solutions to their material handling problems. |
— | Entertainment equipment distributors that design, supply, and install a variety of material handling and rigging equipment for concerts, theaters, ice shows, sporting events, convention centers, and night clubs. |
Pfaff International Direct - Our German-based Pfaff business markets and sells most of its actuators directly to end-users, providing an additional method to market for us in the European region.
Service-After-Sale Distribution Channel - Service-after-sale distributors include our authorized network of 23 chain repair service stations and over 227 certified hoist service and repair stations globally. This service network is designed for easy parts and service access for our large installed base of hoists and related equipment in that region.
OEM/Government Distribution Channels - This channel consists of:
— | OEMs that supply various component parts directly to other industrial manufacturers as well as private branding and packaging of our traditional products for material handling, lifting, positioning, and special purpose applications. |
— | Government agencies, including the U.S. and Canadian Navies and Coast Guards, that primarily purchase load securing chain and forged attachments. We also provide our products to the U.S. and other governments for a variety of military applications. |
Independent Crane Builders and Engineering Procurement and Construction ("EPC") firms - In addition to the Distribution Channels mentioned above, we sell explosion-protected hoists and custom engineered non-standard hoists to independent crane builders and EPC firms. Independent crane builders are lifting solution developers and final crane assemblers that source hoists as components. EPC firms are responsible for project management or construction management of production facilities that purchase lifting solutions from crane and hoist builders.
Backlog
Our backlog of orders at March 31, 2020 was approximately $131,030,000 compared to approximately $161,456,000 at March 31, 2019. The decrease is a result of declining industrial markets globally due to COVID-19 and changing foreign currency rates. Our orders for standard products are generally shipped within one week. Orders for products that are manufactured to customer specifications are generally shipped within four to twelve weeks. Given the short product lead times, we do not believe that the amount of our backlog of orders is a reliable indication of our future sales. Fluctuations in backlog can reflect the project-oriented nature of certain aspects of our business.
Competitive Conditions
The material handling industry remains fragmented. We face competition from a wide range of regional, national, and international manufacturers globally. In addition, we often compete with individual operating units of larger, highly diversified companies.
The principal competitive factors affecting our business include customer service and support as well as product availability, performance, functionality, brand reputation, reliability, and price. Other important factors include distributor relationships and territory coverage.
7
We believe we have leading U.S. market share in various products categories including hoists, trolleys and components, AC and DC material handling drives, screw jacks, and elevator DC drives. These product categories represent 66% of our U.S. net sales.
Major competitors for hoists are Konecranes, which acquired Terex's Material Handling and Port Solutions business segment, and Kito (and its U.S. subsidiary Harrington); for chain are Campbell Chain, Peerless Chain Company (acquired by Kito), and American Chain and Cable Company; for digital power control systems are Konecranes, Power Electronics International, Inc., Cattron Group International (a division of Harbor Group), Conductix-Wampfler (a division of Delachaux Group), Control Techniques (a division of Emerson Electric), OMRON Corporation, KEB GmbH, and Fujitec; for forged attachments are The Crosby Group and Brewer Tichner Company; and for actuators and rotary unions are Deublin, Joyce-Dayton, and Nook Industries.
Employees
At March 31, 2020, we had 2,997 employees globally. Approximately 8% of our employees are represented under three separate U.S. collective bargaining agreements which expire April 2021, May 2021, and September 2021. We also have various labor agreements with our non-U.S. employees which we negotiate from time to time. We have good relationships with our employees and positive, productive relationships with our unions. The risk of employee or union led disruption in production is remote.
Raw Materials and Components
Our principal raw materials and components are steel, consisting of rod, wire, bar, structural, and other forms of steel; electric motors; bearings; gear reducers; castings; steel and aluminum enclosures and wire harnesses; electro-mechanical components and standard variable drives. These commodities are all available from multiple sources. We purchase most of these raw materials and components from a limited number of strategic and preferred suppliers under long-term agreements which are negotiated on a company-wide basis through our global purchasing group to take advantage of volume discounts. Generally, as we experience fluctuations in our costs, we reflect them as price increases to our customers with the goal of being margin neutral. In addition, as a result of the recent trade tariff actions with China, the Company determined its fiscal 2020 exposure for tariffs to be approximately $2,500,000 which resulted in increased cost of products sold. The Company is monitoring the impact of tariffs and is actively working to mitigate this impact through material productivity actions and pricing strategies. For all other raw materials and components, our ability to pass on these increases is determined by market conditions. Although raw materials and some components (such as motors, bearings, gear reducers, steel and aluminum enclosures and wire harnesses, castings, electro-mechanical components, and standard variable drives) are purchased, our vertical integration enables us to produce many of the components used in the manufacturing of our products.
Environmental and Other Governmental Regulation
Like most manufacturing companies, we are subject to various federal, state, and local laws relating to the protection of the environment. To address the requirements of such laws, we have adopted a corporate environmental protection policy which provides that all of our owned or leased facilities shall comply, and all of our employees have the duty to comply with all applicable environmental regulatory standards, and we have initiated an environmental auditing program for our facilities to ensure compliance with such regulatory standards. We have also established managerial responsibilities and internal communication channels for dealing with environmental compliance issues that may arise in the course of our business. We have made and could be required to continue to make significant expenditures to comply with environmental requirements. Because of the complexity and changing nature of environmental regulatory standards, it is possible that situations will arise from time to time requiring us to incur additional expenditures to ensure environmental regulatory compliance. However, we are not aware of any environmental condition or any operation at any of our facilities, either individually or in the aggregate, which would cause expenditures having a material adverse effect on our results of operations, financial condition or cash flows.
We have been a part of the Pendleton Site PRP Group since about 1993. Many years ago, we sent pickle liquor wastes from Tonawanda, NY to the Pendleton Site for treatment and disposal. The Pendleton Site PRP Group signed an Order on Consent with the NYS DEC in 1996 and the cleanup was concluded in the early 2000s. The Order on Consent required a post-construction operation and maintenance period of 30 years and we are required to pay our share of the costs associated with the operation and maintenance period. Our share of these costs is 13.4% and reserves on the books are sufficient to cover these costs for the remainder of the operations and maintenance period.
In 1986, Magnetek acquired the stock of Universal Manufacturing Corporation (“Universal”) from a predecessor of Fruit of the Loom (“FOL”), and the predecessor agreed to indemnify Magnetek against certain environmental liabilities arising from pre-acquisition activities at a facility in Bridgeport, Connecticut. Environmental liabilities covered by the indemnification agreement included completion of additional cleanup activities, if any, at the Bridgeport facility and defense and indemnification against liability for potential response costs related to offsite disposal locations. Magnetek's leasehold interest in the Bridgeport facility
8
was assigned to the buyer in connection with the sale of Magnetek's transformer business in June 2001. FOL, the successor to the indemnification obligation, filed a petition for Reorganization under Chapter 11 of the Bankruptcy Code in 1999 and Magnetek filed a proof of claim in the proceeding for obligations related to the environmental indemnification agreement. Magnetek believes that FOL had substantially completed the clean-up obligations required by the indemnification agreement prior to the bankruptcy filing. In November 2001, Magnetek and FOL entered into an agreement involving the allocation of certain potential tax benefits and Magnetek withdrew its claims in the bankruptcy proceeding. FOL's obligation to the state of Connecticut was not discharged in the reorganization proceeding.
In January 2007, the Connecticut Department of Environmental Protection (“DEP”) requested parties, including Magnetek, to submit reports summarizing the investigations and remediation performed to date at the site and the proposed additional investigations and remediation necessary to complete those actions at the site. The DEP then requested additional information relating to site investigations and remediation. Magnetek and the DEP agreed to the scope of the work plan in November 2010. The Company has implemented the work plan and has recorded a liability of $352,000 as of March 31, 2020 related to the Bridgeport facility, representing the best estimate of future site investigation costs and remediation costs which are expected to be incurred in the future.
For all of the currently known environmental matters, we have accrued as of March 31, 2020 a total of $1,143,000 which, in our opinion, is sufficient to deal with such matters. Further, we believe that the environmental matters known to, or anticipated by us should not, individually or in the aggregate, have a material adverse effect on our operating results or financial condition. However, there can be no assurance that potential liabilities and expenditures associated with unknown environmental matters, unanticipated events, or future compliance with environmental laws and regulations will not have a material adverse effect on us.
In September of 2017, Magnetek received a request for defense and indemnification from Monsanto Company, Pharmacia, LLC, and Solutia, Inc. (collectively, “Monsanto”) with respect to: (1) lawsuits brought by plaintiffs claiming that Monsanto manufactured polychlorinated biphenyls ("PCBs"), exposure to which allegedly caused injury to plaintiffs; (2) lawsuits brought by municipalities and municipal entities claiming that Monsanto should be responsible for a variety of damages due to the presence of PCBs in bodies of water in those municipalities and/or in water treated by those municipal entities. Monsanto claims to be entitled to defense and indemnification from Magnetek under a so-called “Special Undertaking” apparently executed by Universal in January of 1972, which purportedly required Universal to defend and indemnify Monsanto from liabilities “arising out of or in connection with the receipt, purchase, possession, handling, use, sale or disposition of” PCBs by Universal.
Magnetek has declined Monsanto’s tender, and believes that it has meritorious legal and factual defenses to the demands made by Monsanto. Magnetek is vigorously defending against those demands and has commenced litigation to, among other things, declare the Special Undertaking void and unenforceable. Monsanto has, in turn, commenced an action to enforce the Special Undertaking. Magnetek intends to continue to vigorously prosecute its declaratory judgment action and to defend against Monsanto’s action against it. As of March 31, 2020, the Company has recorded $100,000 for legal costs related to this matter. We cannot reasonably estimate a potential range of loss with respect to Monsanto’s tender because there is insufficient information regarding the underlying matters. Management believes, however, that the potential additional costs related to such matters, if any, will not have a material effect on the financial condition of the Company or its liquidity, although the effect of any future liabilities recorded could be material to earnings in a future period.
Our operations are also governed by many other laws and regulations, including those relating to workplace safety and worker health, principally OSHA in the U.S. and others outside the U.S. and regulations thereunder. We believe that we are in substantial compliance with these laws and regulations and do not believe that future compliance with such laws and regulations will have a material adverse effect on our operating results, financial condition, or liquidity.
Available Information
Our internet address is www.columbusmckinnon.com. We make available free of charge through our website our Annual Report on Form 10-K, Quarterly Reports on Form 10-Q, Current Reports on Form 8-K and amendments to those reports filed or furnished pursuant to Section 13(a) or 15(d) of the Securities Exchange Act of 1934, as amended, as soon as reasonably practicable after such documents are electronically filed with, or furnished to, the Securities and Exchange Commission.
9
Item 1A. Risk Factors
Columbus McKinnon is subject to a number of risk factors that could negatively affect our results from business operations or cause actual results to differ materially from those projected or indicated in any forward-looking statement. Such factors include, but are not limited to, the following:
Adverse changes in global economic conditions may negatively affect our industry, business, and results of operations.
Our industry is affected by changes in economic conditions outside our control, which can result in a general decrease in product demand from our customers. Such economic developments, like Brexit or the China trade wars, may affect our business in a number of ways. Reduced demand may drive us and our competitors to offer products at promotional prices, which would have a negative impact on our profitability. In addition, the tightening of credit in financial markets may adversely affect the ability of our customers and suppliers to obtain financing for significant purchases and operations and could result in a decrease in, or cancellation of, orders for our products. If demand for our products slows down or decreases, we will not be able to maintain our revenue and we may run the risk of failing to satisfy the financial and other restrictive covenants to which we are subject under our existing indebtedness. Reduced revenue as a result of decreased demand may also reduce our planned growth and otherwise hinder our ability to improve our performance in connection with our long-term strategy.
The risk related to Novel Coronavirus ("COVID-19") could adversely affect our business.
Our business has been and may continue to be materially and adversely impacted by the effects of the COVID-19. In addition to global macroeconomic effects, the COVID-19 outbreak and any other related adverse public health developments will cause disruption to our domestic and international operations and sales activities. The continued operation of our facilities is subject to local laws and regulations. While all of our facilities have been deemed essential under applicable law there is no guarantee this will continue. Our third-party manufacturers, suppliers, third-party distributors, sub-contractors and customers have been and will be disrupted by worker absenteeism, quarantines and restrictions on their employees’ ability to work, office and factory closures, disruptions to ports and other shipping infrastructure, border closures, or other travel or health-related restrictions. Depending on the magnitude of such effects on our manufacturing operations or the operations of our suppliers, third-party distributors, or sub-contractors, our supply chain, manufacturing and product shipments could be delayed, which could adversely affect our business, operations, and customer relationships. In addition, the COVID-19 or other disease outbreaks will in the short-run and may over the longer term adversely affect the economies and financial markets of many countries, resulting in an economic downturn that will affect demand for our products and impact our operating results. In addition, a prolonged disruption from COVID-19 could result in a requirement to record additional reserves against accounts receivable and inventories and impairments of goodwill, intangible assets, and other long lived assets which could have a material impact on our results of operations. There can be no assurance that any decrease in sales resulting from the COVID-19 will be offset by increased sales in subsequent periods. Although the magnitude of the impact of the COVID-19 outbreak on our business and operations remains uncertain, the continued spread of the COVID-19 or the occurrence of other epidemics and the imposition of related public health measures and travel and business restrictions will adversely impact our business, financial condition, operating results and cash flows.
Changes in the method of determining the London Interbank Offered Rate ("LIBOR"), or the replacement of LIBOR with an alternative reference rate, may adversely affect interest rates.
On July 27, 2017, the United Kingdom’s Financial Conduct Authority, which regulates LIBOR, announced that it intends to phase out LIBOR by the end of 2021. The interest rate on the Company’s Term Loan and Revolver have a variable component that is based on LIBOR. It is unclear whether new methods of calculating LIBOR will be established if it continues to exist after 2021, or whether different benchmark rates used to price indebtedness will develop. In the future, we may need to renegotiate our Term Loan and Revolver or incur other indebtedness, and the phase-out of LIBOR may negatively impact the terms of such indebtedness. In addition, the overall financial market may be disrupted as a result of the phase-out or replacement of LIBOR. Disruption in the financial market could have a material adverse effect on our financial position, results of operations, and liquidity.
Our business is cyclical and is affected by industrial economic conditions.
Many of the end-users of our products are in highly cyclical industries, such as manufacturing, power generation and distribution, commercial construction, oil and gas exploration and refining, transportation, agriculture, logging, and mining that are sensitive to changes in general economic conditions. Their demand for our products, and thus our results of operations, is directly related to the level of production in their facilities, which changes as a result of changes in general economic conditions and other factors beyond our control. If there is deterioration in the general economy or in the industries we serve, our business, results of operations, and financial condition could be materially adversely affected. In addition, the cyclical nature of our business could at times also adversely affect our liquidity and ability to borrow under our revolving credit facility.
10
Our business is highly competitive and subject to consolidation of competitors. Increased competition could reduce our sales, earnings, and profitability.
The principal markets that we serve within the material handling industry are fragmented and highly competitive. Competition is based primarily on customer service and support as well as product availability, performance, functionality, brand reputation, reliability, and price. Our competition in the markets in which we participate comes from companies of various sizes, some of which have greater financial and other resources than we do. Increased competition could force us to lower our prices or to offer additional services at a higher cost to us, which could reduce our gross margins and net income.
The greater financial resources or the lower amount of debt of certain of our competitors may enable them to commit larger amounts of capital in response to changing market conditions. Certain competitors may also have the ability to develop product or service innovations that could put us at a disadvantage. In addition, through consolidation, some of our competitors have achieved substantially more market penetration in certain of the markets in which we operate. If we are unable to compete successfully against other manufacturers of material handling equipment, we could lose customers and our revenues may decline. There can also be no assurance that customers will continue to regard our products favorably, that we will be able to develop new products that appeal to customers, that we will be able to improve or maintain our profit margins on sales to our customers or that we will be able to continue to compete successfully in our core markets.
Our operations outside the U.S. pose certain risks that may adversely impact sales and earnings.
We have operations and assets located outside of the United States, primarily in China, Mexico, Germany, the United Kingdom, France, and Hungary. In addition, we import a portion of our hoist product line from Asia and sell our products to distributors located in approximately 50 countries. In our fiscal year ended March 31, 2020, approximately 45% of our net sales were derived from non-U.S. markets. These non-U.S. operations are subject to a number of special risks, in addition to the risks of our U.S. business, differing protections of intellectual property, trade barriers, labor unrest, exchange controls, regional economic uncertainty, differing (and possibly more stringent) labor regulation, risk of governmental expropriation, U.S. and foreign customs and tariffs, current and changing regulatory environments, difficulty in obtaining distribution support, difficulty in staffing and managing widespread operations, differences in the availability, and terms of financing, political instability and risks of increases in taxes. Also, in some foreign jurisdictions we may be subject to laws limiting the right and ability of entities organized or operating therein to pay dividends or remit earnings to affiliated companies unless specified conditions are met. These factors may adversely affect our future profits.
Part of our strategy is to expand our worldwide market share and reduce costs by strengthening our international distribution capabilities and sourcing components in lower cost countries, such as China, Mexico, and Hungary. Implementation of this strategy may increase the impact of the risks described above, and we cannot assure you that such risks will not have an adverse effect on our business, results of operations or financial condition.
Other risks of doing business in international markets include the increased risks and burdens of complying with different legal and regulatory standards, difficulties in managing and staffing foreign operations, recruiting and retaining talented direct sales personnel, limitations on the repatriation of funds and fluctuations of foreign exchange rates, varying levels of internet technology adoption and infrastructure and our ability to enforce contracts and our intellectual property rights in foreign jurisdictions. Additionally, there are risks associated with fundamental changes to international markets, such as those that may occur as a result of the United Kingdom's withdrawal from the European Union ("Brexit"). Brexit may adversely affect global economic and market conditions and could contribute to volatility in the foreign exchange markets, which we may be unable to effectively manage.
In addition, our success in international expansion could be limited by barriers to international expansion such as adverse tax consequences and export controls. If we cannot manage these risks effectively, the costs of doing business in some international markets may be prohibitive or our costs may increase disproportionately to our revenue.
Our strategy depends on successful integration of acquisitions.
Acquisitions are a key part of our growth strategy. Our historical growth has depended, and our future growth is likely to depend on our ability to successfully implement our acquisition strategy, and the successful integration of acquired businesses into our existing business. We intend to continue to seek additional acquisition opportunities in accordance with our acquisition strategy, both to expand into new markets and to enhance our position in existing markets throughout the world. If we are unable to successfully integrate acquired businesses into our existing business or expand into new markets, our sales and earnings growth could be reduced.
11
Our products involve risks of personal injury and property damage, which exposes us to potential liability.
Our business exposes us to possible claims for personal injury or death and property damage resulting from the products that we sell. We maintain insurance through a combination of self-insurance retentions and excess insurance coverage. We monitor claims and potential claims of which we become aware and establish accrued liability reserves for the self-insurance amounts based on our liability estimates for such claims. We cannot give any assurance that existing or future claims will not exceed our estimates for self-insurance or the amount of our excess insurance coverage. In addition, we cannot give any assurance that insurance will continue to be available to us on economically reasonable terms or that our insurers would not require us to increase our self-insurance amounts. Claims brought against us that are not covered by insurance or that are in excess of insurance coverage could have a material adverse effect on our results, financial condition, or liquidity.
In addition, like many industrial manufacturers, we are also involved in asbestos-related litigation. In continually evaluating costs relating to our estimated asbestos-related liability, we review, among other things, the incidence of past and recent claims, the historical case dismissal rate, the mix of the claimed illnesses and occupations of the plaintiffs, our recent and historical resolution of the cases, the number of cases pending against us, the status and results of broad-based settlement discussions, and the number of years such activity might continue. Based on this review, we estimate our share of liability to defend and resolve probable asbestos related personal injury claims. This estimate is highly uncertain due to the limitations of the available data and the difficulty of forecasting with any certainty the numerous variables that can affect the range of the liability. We continue to study the variables in light of additional information in order to identify trends that may become evident and to assess their impact on the range of liability that is probable and estimable. We believe that the potential additional costs for claims will not have a material effect on the financial condition of the Company or its liquidity, although the effect of any future liabilities recorded could be material to earnings in a future period. See Note 16 to our March 31, 2020 consolidated financial statements included in Item 8 of this Form 10-K.
As indicated above, our self-insurance coverage is provided through our captive insurance subsidiary. The reserves of our captive insurance subsidiary are subject to periodic adjustments based upon actuarial evaluations, which adjustments impact our overall results of operations. These periodic adjustments can be favorable or unfavorable.
We are subject to currency fluctuations from our sales outside the U.S.
Our products are sold in many countries around the world. Thus, a portion of our revenues (approximately $366,539,000 in our fiscal year ended March 31, 2020) are generated in foreign currencies, including principally the Euro, the British Pound, the Canadian Dollar, the South African Rand, the Brazilian Real, the Mexican Peso, and the Chinese Yuan, and while much of the costs incurred to generate those revenues are incurred in the same currency, a portion is incurred in other currencies. Since our financial statements are denominated in U.S. dollars, changes in currency exchange rates between the U.S. dollar and other currencies have had, and will continue to have, a currency translation impact on our earnings. Currency fluctuations may impact our financial performance in the future.
Our future operating results may be affected by price fluctuations and trade tariffs on steel, aluminum, and other raw materials purchased to manufacture our products. We may not be able to pass on increases in raw material costs to our customers.
The primary raw materials used in our chain, forging and crane building operations are steel, aluminum, and other raw materials such as motors, electrical and electronic components, castings and machined parts and components. These industries are highly cyclical and at times pricing and availability can be volatile due to a number of factors beyond our control, including general economic conditions, labor costs, competition, import duties, tariffs, and currency exchange rates. This volatility can significantly affect our raw material costs. In an environment of increasing raw material prices and trade tariffs, competitive conditions will determine how much of the price increases we can pass on to our customers. In the future, to the extent we are unable to pass on any steel, aluminum, or other raw material price increases to our customers, our profitability could be adversely affected.
We rely in large part on independent distributors for sales of our products.
For the most part, we depend on independent distributors to sell our products and provide service and aftermarket support to our end-user customers. Distributors play a significant role in determining which of our products are stocked at their locations, and hence are most readily accessible to aftermarket buyers, and the price at which these products are sold. Almost all of the distributors with whom we transact business offer competitive products and services to our end-user customers. For the most part, we do not have written agreements with our distributors. The loss of a substantial number of these distributors or an increase in the distributors' sales of our competitors' products to our ultimate customers could materially reduce our sales and profits.
12
We are subject to various environmental laws which may require us to expend significant capital and incur substantial cost.
Our operations and facilities are subject to various federal, state, local, and foreign requirements relating to the protection of the environment, including those governing the discharges of pollutants in the air and water, the generation, management and disposal of hazardous substances and wastes, and the cleanup of contaminated sites. We have made, and will continue to make, expenditures to comply with such requirements. Violations of, or liabilities under, environmental laws and regulations, or changes in such laws and regulations (such as the imposition of more stringent standards for discharges into the environment), could result in substantial costs to us, including operating costs and capital expenditures, fines and civil and criminal sanctions, third party claims for property damage or personal injury, clean-up costs, or costs relating to the temporary or permanent discontinuance of operations. Certain of our facilities have been in operation for many years, and we have remediated contamination at some of our facilities. Over time, we and other predecessor operators of such facilities have generated, used, handled, and disposed of hazardous and other regulated wastes. Additional environmental liabilities could exist, including clean-up obligations at these locations or other sites at which materials from our operations were disposed, which could result in substantial future expenditures that cannot be currently quantified and which could reduce our profits or have an adverse effect on our financial condition, operations, or liquidity.
We may face claims of infringement on the intellectual property of others, or others may infringe upon our intellectual property.
Our future success depends in part on our ability to prevent others from infringing on our proprietary rights, as well as our ability to operate without infringing upon the proprietary rights of others. We may be required at times to take legal action to protect our proprietary rights and, despite our best efforts, we may be sued for infringing on the patent rights of others. Patent litigation is costly and, even if we prevail, the cost of such litigation could adversely affect our financial condition. In addition, we could be adversely affected financially should we be judged to have infringed upon the intellectual property of others.
We rely on subcontractors or suppliers to perform their contractual obligations.
Some of our contracts involve subcontracts with other companies upon which we rely to perform a portion of the services we must provide to our customers. There is a risk that we may have disputes with our subcontractors, including disputes regarding the quality and timeliness of work performed by our subcontractor or customer concerns about the subcontractor. Failure by our subcontractors to satisfactorily provide on a timely basis the agreed-upon supplies or perform the agreed upon services may materially and adversely impact our ability to perform our obligations as the prime contractor. A delay in our ability to obtain components and equipment parts from our suppliers may affect our ability to meet our customers' needs and may have an adverse effect upon our profitability.
We are subject to debt covenant restrictions.
Our revolving credit facility and Term Loan contain a financial leverage covenant and other restrictive covenants. A significant decline in our operating income or cash generating ability could cause us to violate our leverage covenant in our bank credit facility. Other material adverse changes in our business could also cause us to be in default of our debt covenants. This could result in our being unable to borrow under our bank credit facility or being obliged to refinance and renegotiate the terms of our indebtedness.
Our business operations may be adversely affected by information systems interruptions or intrusion.
We depend on various information technologies throughout our company to administer, store, and support multiple business activities. If these systems are damaged, cease to function properly, or are subject to cyber-security attacks, such as those involving unauthorized access, malicious software and/or other intrusions, we could experience production downtimes, operational delays, other detrimental impacts on our operations or ability to provide products and services to our customers, the compromising of confidential or otherwise protected information, destruction or corruption of data, security breaches, other manipulation or improper use of our systems or networks, financial losses from remedial actions, loss of business or potential liability, and/or damage to our reputation. While we attempt to mitigate these risks by employing a number of measures, including employee training, technical security controls, and maintenance of backup and protective systems, our systems, networks, products, and services remain potentially vulnerable to known or unknown threats, any of which could have a material adverse effect on our business, financial condition or results of operations.
We depend on our senior management team and the loss of any member could adversely affect our operations.
Our success is dependent on the management and leadership skills of our senior management team. The loss of any of these individuals or an inability to attract, retain, and maintain additional personnel could prevent us from implementing our business strategy. We cannot assure you that we will be able to retain our existing senior management personnel or to attract additional qualified personnel when needed.
13
Mark D. Morelli, our former President and CEO, resigned effective January 10, 2020. Our employment agreement with Mr. Morelli was terminated on January 10, 2020 in connection with his resignation. The Board of Directors began an external search for his replacement. Subsequent to his resignation, Richard H. Fleming, Chairman of the Board, was named Interim CEO until a replacement is hired. On May 14, 2020, the Company announced that David J. Wilson has been named President and CEO effective June 1, 2020. The Company has entered into an Employment Agreement and Change in Control agreement with Mr. Wilson which was filed on Form 8-K on May 14, 2020. During the CEO transition, the Company has continued to execute its Blueprint for Growth Strategy and expects to do so going forward.
Item 1B. Unresolved Staff Comments
None.
14
Item 2. Properties
We maintain our corporate headquarters in Getzville, New York (an owned property) and, as of March 31, 2020, conducted our principal manufacturing at the following facilities:
Location | Products/Operations | Square Footage | Owned or Leased | ||||||
1 | Kunzelsau, Germany | Hoists | 345,000 | Leased | |||||
2 | Wadesboro, NC | Hoists | 180,000 | Owned | |||||
3 | Lexington, TN | Chain | 164,000 | Owned | |||||
4 | Charlotte, NC | Actuators and Rotary Unions | 146,000 | Leased | |||||
5 | Menomonee Falls, WI | Power control systems | 144,000 | Leased | |||||
Tennessee forging operation: | |||||||||
6 | Chattanooga, TN | Forged attachments | 81,000 | Owned | |||||
7 | Chattanooga, TN | Forged attachments | 59,000 | Owned | |||||
8 | Wuppertal, Germany | Hoists | 124,000 | Leased | |||||
9 | Kissing, Germany | Hoists, winches, and actuators | 107,000 | Leased | |||||
10 | Damascus, VA | Hoists | 97,000 | Owned | |||||
11 | Hangzhou, China | Hoists | 82,000 | Owned | |||||
12 | Brighton, MI | Overhead light rail workstations | 71,000 | Leased | |||||
13 | Chester, England | Plate clamps | 56,000 | Owned | |||||
14 | Santiago Tianguistenco, Mexico | Hoists | 54,000 | Owned | |||||
15 | Szekesfehervar, Hungary | Textiles and textile strappings | 24,000 | Leased | |||||
16 | Romeny-sur-Marne, France | Rotary unions | 22,000 | Owned | |||||
In addition, we have a total of 49 sales offices, distribution centers, and warehouses. We believe that our properties have been adequately maintained, are in generally good condition and are suitable for our business as presently conducted. We also believe our existing facilities provide sufficient production capacity for our present needs and for our anticipated needs in the foreseeable future. Upon the expiration of our current leases, we believe that either we will be able to secure renewal terms or enter into leases for alternative locations at market terms.
15
Item 3. Legal Proceedings
From time to time, we are named a defendant in legal actions arising out of the normal course of business. We are not a party to any pending legal proceeding other than ordinary, routine litigation incidental to our business. We do not believe that any of our pending litigation will have a material impact on our business. We maintain comprehensive general product liability insurance against risks arising out of the use of our products sold to customers through our wholly owned New York State captive insurance subsidiary of which we are the sole policy holder. The per occurrence limits on the self-insurance for general and product liability coverage were $2,000,000 from inception through fiscal 2003 and $3,000,000 for fiscal 2004 and thereafter. In addition to the per occurrence limits, our coverage is also subject to an annual aggregate limit, applicable to losses only. These limits range from $2,000,000 to $6,000,000 for each policy year from inception through fiscal 2020. We obtain additional insurance coverage from independent insurers to cover potential losses in excess of these limits.
Like many industrial manufacturers, we are also involved in asbestos-related litigation. In continually evaluating costs relating to our estimated asbestos-related liability, we review, among other things, the incidence of past and recent claims, the historical case dismissal rate, the mix of the claimed illnesses and occupations of the plaintiffs, our recent and historical resolution of the cases, the number of cases pending against us, the status and results of broad-based settlement discussions, and the number of years such activity might continue. Because this liability is likely to extend over many years, management believes that the potential additional costs for claims will not have a material effect on the financial condition of the Company or its liquidity, although the effect of any future liabilities recorded could be material to earnings in a future period.
The Company believes that a share of its previously incurred asbestos-related expenses and future asbestos-related expenses are covered by pre-existing insurance policies. The Company has been engaged in a legal action against the insurance carriers for those policies to recover past expenses and future costs incurred. In March of fiscal 2020, the Company came to a tentative agreement with the insurance carriers to settle its case against them for recovery of past and cost-sharing for future asbestos-related legal defense costs. The settlement is subject to mutual agreement of the terms and conditions in a coverage in place agreement. The terms of the tentative settlement require the carriers to pay gross defense costs prior to retro-premiums of 65% for future asbestos-related defense costs subject to an annual cap of $1,650,000 for claims covered by the tentative settlement. In addition, a payout of approximately $2,650,000 is expected to be received for past defense costs which will be reduced by contingent legal costs. Further, it is expected that the insurance carriers will accept coverage for indemnity on all covered cases. Estimates of the future cost sharing have been included in the loss reserve calculation as of March 31, 2020. The settlement is expected to be finalized in fiscal 2021. Prior to the settlement agreement, during fiscal 2020 and fiscal 2019, the Company received settlement payments of $381,000 and $484,000, respectively, net of legal fees related to the insurance recovery, from its insurance carriers as partial reimbursement for asbestos-related expenses. These partial payments have been recorded as gains in cost of products sold.
See Note 16 to our March 31, 2020 consolidated financial statements for more information on our matters involving litigation.
Item 4. Mine Safety Disclosures.
Not Applicable.
16
PART II
Item 5. Market for the Company’s Common Stock and Related Security Holder Matters
Our common stock is traded on the Nasdaq Global Select Market under the symbol ‘‘CMCO.” As of April 30, 2020, there were 354 holders of record of our common stock.
During fiscal 2020, the Company declared quarterly cash dividends totaling $5,690,000. On March 24, 2020, the Company's Board of Directors declared regular quarterly dividends of $0.06 per common share. The dividend was paid on May 14, 2020 to shareholders of record on May 4, 2020 and totaled approximately $1,430,000.
Our current credit agreement allows the declaration of dividends, but limits our ability to pay dividends.
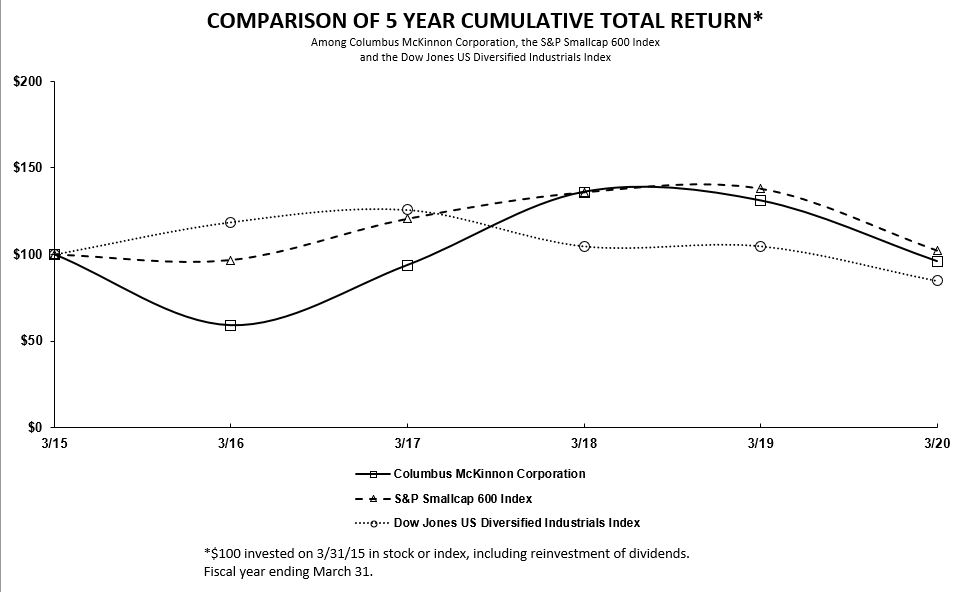
PERFORMANCE GRAPH
The Performance Graph shown below compares the cumulative total shareholder return on our common stock based on its market price, with the total return of the S&P SmallCap 600 Index, and the Dow Jones U.S. Diversified Industrials. The comparison of total return assumes that a fixed investment of $100 was invested on March 31, 2015 in our common stock and in each of the foregoing indices and further assumes the reinvestment of dividends. The stock price performance shown on the graph is not necessarily indicative of future price performance.
17
Item 6. Selected Financial Data
The consolidated balance sheets as of March 31, 2020 and 2019, and the related consolidated statements of operations, cash flows, and shareholders’ equity for each of the three years ended March 31, 2020 and notes thereto appear elsewhere in this annual report. The selected consolidated financial data presented below should be read in conjunction with, and are qualified in their entirety by “Management’s Discussion and Analysis of Results of Operations and Financial Condition,” our consolidated financial statements and the notes thereto and other financial information included elsewhere in this annual report.
(In million's, except per share data) | ||||||||||||||||||||
2020 | 2019 | 2018 | 2017 (4) | 2016 | ||||||||||||||||
Statements of Operations Data: | ||||||||||||||||||||
Net sales | $ | 809.2 | $ | 876.3 | $ | 839.4 | $ | 637.1 | $ | 597.1 | ||||||||||
Cost of products sold (1) | 526.0 | 571.3 | 554.4 | 444.2 | 411.5 | |||||||||||||||
Gross profit | 283.2 | 305.0 | 285.0 | 192.9 | 185.6 | |||||||||||||||
Selling expenses | 91.1 | 97.9 | 102.0 | 77.3 | 72.9 | |||||||||||||||
General and administrative expenses (1) (2) | 77.9 | 83.6 | 85.6 | 72.1 | 62.9 | |||||||||||||||
Research and development expenses (2) | 11.3 | 13.5 | 13.6 | 10.5 | 7.4 | |||||||||||||||
Impairment of intangible asset | — | — | — | 1.1 | — | |||||||||||||||
Net loss on sales of businesses, including impairment | 0.2 | 25.7 | — | — | — | |||||||||||||||
Amortization of intangibles | 12.9 | 14.9 | 15.6 | 8.1 | 5.0 | |||||||||||||||
Income (loss) from operations | 89.8 | 69.4 | 68.2 | 23.8 | 37.4 | |||||||||||||||
Interest and debt expense | 14.2 | 17.1 | 19.7 | 11.0 | 7.9 | |||||||||||||||
Cost of debt refinancing | — | — | — | 1.3 | — | |||||||||||||||
Other (income) and expense, net (1) | (1.6 | ) | (0.6 | ) | (1.2 | ) | (1.5 | ) | (2.1 | ) | ||||||||||
Income (loss) before income taxes | 77.2 | 52.9 | 49.7 | 13.0 | 31.6 | |||||||||||||||
Income tax expense (benefit) | 17.5 | 10.3 | 27.6 | 4.0 | 12.0 | |||||||||||||||
Net income (loss) | $ | 59.7 | $ | 42.6 | $ | 22.1 | $ | 9.0 | $ | 19.6 | ||||||||||
Basic earnings (loss) per share | $ | 2.53 | $ | 1.83 | $ | 0.97 | $ | 0.44 | $ | 0.98 | ||||||||||
Diluted earnings (loss) per share | $ | 2.50 | $ | 1.80 | $ | 0.95 | $ | 0.43 | $ | 0.96 | ||||||||||
Weighted average shares outstanding – basic | 23.6 | 23.3 | 22.8 | 20.6 | 20.1 | |||||||||||||||
Weighted average shares outstanding – assuming dilution | 23.9 | 23.7 | 23.3 | 20.9 | 20.3 | |||||||||||||||
Balance Sheet Data (at end of period): | ||||||||||||||||||||
Total assets (5) | $ | 1,093.3 | $ | 1,061.6 | $ | 1,142.4 | $ | 1,113.8 | $ | 772.9 | ||||||||||
Total debt (3) | 251.3 | 300.3 | 363.3 | 421.3 | 267.6 | |||||||||||||||
Total debt, net of cash and cash equivalents | 136.9 | 229.2 | 300.3 | 343.7 | 216.0 | |||||||||||||||
Total shareholders’ equity | 463.6 | 431.2 | 408.2 | 341.4 | 286.3 | |||||||||||||||
Other Data: | ||||||||||||||||||||
Net cash provided by operating activities | 106.8 | 79.5 | 69.7 | 60.5 | 52.6 | |||||||||||||||
Net cash provided by (used in) investing activities | (10.0 | ) | 2.5 | (32.6 | ) | (224.0 | ) | (203.2 | ) | |||||||||||
Net cash provided by (used in) financing activities | (51.6 | ) | (67.8 | ) | (59.5 | ) | 190.7 | 137.0 | ||||||||||||
Capital expenditures | (9.4 | ) | (12.3 | ) | (14.5 | ) | (14.4 | ) | (22.3 | ) | ||||||||||
18
(1) | The Company adopted ASU 2017-07 in the first quarter of fiscal 2019. The service cost component of net periodic benefit cost above is recorded in Cost of products sold, Selling expense, and General and administrative expenses while the remaining components are recorded to Other (income) expense, net. The prior year amounts have been reclassified to provide comparable presentation in line with the guidance in ASU 2017-07 based on amounts previously disclosed for the various components of net periodic pension cost (benefit). |
(2) | Beginning in fiscal 2018, the Company reclassified research and development expenses previously recorded in general and administrative expense into a separate line item on the consolidated statements of operations. All prior periods presented above have been revised to reflect this presentation. Please refer to Note 2 of the Company's financial statements for additional information regarding research and development expenses. |
(3) | Total debt includes all debt, including the current portion, notes payable, term loan, and subordinated debt. |
(4) | The Company acquired STAHL in fiscal 2017 which was deemed to be a significant acquisition. |
(5) | Beginning in fiscal 2020, the Company recorded a $38,125,000 right-of-use lease asset in adopting ASU No. 2016-02, "Leases (Topic 842)." |
19
Item 7. Management’s Discussion and Analysis of Results of Operations and Financial Condition
This section should be read in conjunction with our consolidated financial statements included elsewhere in this annual report.
EXECUTIVE OVERVIEW
The Company is a leading worldwide designer, manufacturer and marketer of motion control products, technologies, systems and services that efficiently and ergonomically move, lift, position and secure materials. Key products include hoists, actuators, rigging tools, light rail work stations and digital power and motion control systems. We are focused on commercial and industrial applications that require the safety and quality provided by our superior design and engineering know-how.
Founded in 1875, we have grown to our current size and leadership position through organic growth and acquisitions. We developed our leading market position over our 145-year history by emphasizing technological innovation, manufacturing excellence and superior customer service. In addition, acquisitions significantly broadened our product lines and services and expanded our geographic reach, end-user markets and customer base. In accordance with our Blueprint for Growth Strategy, we are simplifying the business utilizing our 80/20 process, improving our operational excellence, and ramping the growth engine by investing in new product development and a digital platform to grow profitably. Shareholder value will be enhanced by expanding EBITDA margins and return on invested capital ("ROIC").
Our revenue base is geographically diverse with approximately 45% derived from customers outside the U.S. for the year ended March 31, 2020. Our expansion within the European market with the acquisition of STAHL further expands our geographic diversity. We believe this will help balance the impact of changes that will occur in local economies, as well as benefit the Company from growth in emerging markets. We monitor both U.S. and Eurozone Industrial Capacity Utilization statistics as indicators of anticipated demand for our products. In addition, we continue to monitor the potential impact of other global and U.S. trends including, industrial production, trade tariffs, raw material cost inflation, interest rates, foreign currency exchange rates, and activity of end-user markets around the globe.
From a strategic perspective, we are leveraging our recent acquisitions and investing in new products as we focus on our greatest opportunities for growth. We maintain a strong North American market share with significant leading market positions in hoists, lifting and sling chain, forged attachments, actuators, and digital power and motion control systems for the material handling industry. We seek to maintain and enhance our market share by focusing our sales and marketing activities toward select North American and global market sectors including general industrial, utility, energy, automotive, heavy OEM, entertainment, and construction and infrastructure.
Regardless of the economic climate and point in the economic cycle, we constantly explore ways to increase operating margins as well as further improve our productivity and competitiveness. We have specific initiatives to reduce quote lead-times, improve on-time deliveries, reduce warranty costs, and improve material and factory productivity. The initiatives are being driven by the implementation of our business operating system E-PAS™. We are working to achieve these strategic initiatives through business simplification, operational excellence, and profitable growth initiatives. We believe these initiatives will enhance future operating margins.
We continuously monitor market prices of steel. We purchase approximately $25,000,000 to $30,000,000 of steel annually in a variety of forms including rod, wire, bar, structural, and other forms of steel. Generally, as we experience fluctuations in our costs, we reflect them as price increases to our customers with the goal of being margin neutral. However, as a result of the recent trade tariff actions with China, the Company determined its fiscal 2020 exposure for tariffs to be approximately $2,500,000 which resulted in increased cost of products sold. The Company is monitoring the impact of tariffs and is actively working to mitigate this impact through material productivity actions and pricing strategies.
We operate in a highly competitive and global business environment. We face a variety of opportunities in those markets and geographies, including trends toward increasing productivity of the global labor force and the expansion of market opportunities in Asia and other emerging markets. While we execute our long-term growth strategy, we are supported by our strong free cash flow as well as our liquidity position and flexible debt structure.
Like many global companies, we are being affected by COVID-19. While the severity and duration of this global pandemic is not known at this time, we are seeking to take all appropriate measures to protect the cash flow and liquidity of the Company. This includes reducing our cost base, reducing working capital needs, and reducing capital expenditures. We have a flexible capital structure composed of a Credit Agreement that includes a Term Loan that requires quarterly principal payments of $1.1 million and a $100 million Revolver. Subsequent to March 31, 2020, the Company drew $25 million from the Revolver for liquidity and working capital purposes demonstrating it has a strong, supportive bank group.
20
RESULTS OF OPERATIONS
Fiscal 2020 Compared to 2019
Fiscal 2020 sales were $809,162,000, a decrease of 7.7%, or $67,120,000 compared with fiscal 2019 sales of $876,282,000. Sales for the year were negatively impacted by $34,195,000 in sales in the previous year from sold businesses and $32,951,000 in decreased sales volume, offset by $13,169,000 in price increases. Unfavorable foreign currency translation decreased sales by $13,143,000.
Our gross profit was $283,186,000 and $304,997,000 or 35.0% and 34.8% of net sales in fiscal 2020 and 2019, respectively. The fiscal 2020 decrease in gross profit of $21,811,000 or 7.2% is the result of $14,069,000 in decreased volume, $7,053,000 in gross profit from sold businesses, $3,461,000 in decreased productivity and unfavorable manufacturing costs, $1,327,000 in costs incurred to consolidate the Salem and Lisbon Ohio facilities, $778,000 in increased tariffs, $751,000 in increased severance costs, and $622,000 in increased product liability costs. These decreases were offset by $10,338,000 of price increases net of material inflation and $382,000 received from insurance settlement. The translation of foreign currencies had a $4,470,000 unfavorable impact on gross profit for the year ended March 31, 2020.
Selling expenses were $91,054,000 and $97,925,000, or 11.3% and 11.2% of net sales in fiscal years 2020 and 2019. Selling expenses were lower as a result of $1,468,000 incurred in fiscal 2020 related to sold businesses. In addition, we had $804,000 in lower advertising expenses,$550,000 in reduced U.S. warehouse rent expense, $331,000 lower incentive compensation, and $453,000 in costs incurred to consolidate the Salem and Lisbon Ohio facilities classified as selling expense. These decreases were offset by $299,000 in current year severance costs. Additionally, foreign currency translation had a $1,765,000 favorable impact on selling expenses. The remainder of the decrease is due to lower sales volume.
General and administrative expenses were $77,880,000 and $83,567,000 or 9.6% and 9.5% of net sales in fiscal 2020 and 2019, respectively. The fiscal 2020 decrease in general and administrative expenses was primarily due to $7,540,000 of lower incentive compensation and stock compensation expense including $1,981,000 in stock compensation expense that was reversed in the third quarter of fiscal 2020 for shares that were forfeited upon our Chief Executive Officer's resignation, $1,564,000 from sold businesses, and a $697,000 net reduction in legal costs related to an insurance recovery legal action. The decrease in general and administrative expense was partially offset by $1,528,000 in increased bed debt expenses, $1,455,000 in costs incurred to close a plant in the Asia Pacific region and reorganize the business, $635,000 in tax professional services fees primarily related to a legal entity restructuring, $624,000 in increased medical and benefit expenses, $436,000 of occupancy costs for our center of excellence in North Carolina, and $352,000 in increased environmental costs. Foreign currency translation had a $1,036,000 favorable impact on general and administrative expenses.
Research and development expenses were $11,310,000 and $13,491,000 in fiscal 2020 and 2019, respectively. As a percentage of consolidated net sales, research and development expenses were 1.4% and 1.5% in fiscal 2020 and 2019. The reduction in research and development expenses is largely due to lower professional services and other expenses. $277,000 of the decrease in research and development expenses is from sold businesses.
A Net loss on sales of businesses, including impairment in the amount of $176,000 was recorded as a result of a final working capital adjustment in the year ended March 31, 2020 from businesses that were sold in fiscal 2019.
Amortization of intangibles remained relatively consistent at $12,942,000 and $14,900,000 in fiscal 2020 and 2019, respectively. The decrease is primarily related to foreign currency translation.
Interest and debt expense was $14,234,000 and $17,144,000 in fiscal 2020 and 2019, respectively, and primarily related to a decrease in interest and debt expense on the Company's Term Loan due to lower average borrowings outstanding during the fiscal 2020 period.
Investment income of $891,000 and $727,000, in fiscal 2020 and 2019, respectively, related to earnings on marketable securities held in the Company’s wholly owned captive insurance subsidiary and the Company's equity method investment in EMC, described in Note 7.
Foreign currency exchange resulted in a gain of $1,514,000 and loss of $843,000 in fiscal 2020 and 2019, respectively, as a result of foreign currency volatility related to foreign currency denominated sales and purchases and intercompany debt.
Other expense was $839,000 in fiscal 2020 and other income was $716,000 in fiscal 2019. This includes components of pension expense (all except service costs, described in Note 13) and various non-operating income and expense related activities.
21
Income tax expense as a percentage of income from continuing operations before income tax expense was 22.7% and 19.5% in fiscal 2020 and 2019, respectively. Typically these percentages vary from the U.S. statutory rate of 21% primarily due to varying effective tax rates at the Company's foreign subsidiaries, and the jurisdictional mix of taxable income for these subsidiaries.
Fiscal 2019 Compared to 2018
Fiscal 2019 sales were $876,282,000, an increase of 4.4%, or $36,863,000 compared with fiscal 2018 sales of $839,419,000. Sales for the year were positively impacted by $39,761,000 due to increased sales volume and $10,628,000 by price increases, offset by $5,957,000 in prior year sales from sold businesses. Unfavorable foreign currency translation decreased sales by $7,569,000.
Our gross profit was $304,997,000 and $285,061,000 or 34.8% and 34.0% of net sales in fiscal 2019 and 2018, respectively. The fiscal 2019 increase in gross profit of $19,936,000 or 7.0% is the result of $12,986,000 in increased volume, $8,573,000 in increased productivity and favorable manufacturing costs, $6,476,000 of price increases net of material inflation, and $1,078,000 in decreased product liability costs. These increases were offset by a prior year insurance settlement for $2,362,000 which did not reoccur in the current year, $1,717,000 in increased tariffs, $1,473,000 in costs incurred to consolidate the Salem, Ohio facility, and $1,223,000 in gross profit from sold businesses. The translation of foreign currencies had a $2,423,000 unfavorable impact on gross profit for the year ended March 31, 2019.
Selling expenses were $97,925,000 and $101,956,000 or 11.2% and 12.1% of net sales in fiscal years 2019 and 2018. Selling expenses from sold businesses decreased selling expenses by $346,000 in fiscal 2019. Additionally, foreign currency translation had a $1,016,000 favorable impact on selling expenses. The remaining decrease is largely due to lower warehouse and personnel costs.
General and administrative expenses were $83,567,000 and $85,605,000 or 9.5% and 10.2% of net sales in fiscal 2019 and 2018, respectively. The fiscal 2019 decrease was due to a $7,031,000 net reduction of STAHL integration costs that are classified as general and administrative expense, a $1,666,000 net decrease in legal costs for an insurance recovery legal action, a $300,000 net reduction in legal costs for a former subsidiary of Magnetek involved in a litigation matter, and $619,000 in debt repricing fees incurred in the prior year. These decreases were offset by higher incentive compensation and stock compensation expense of $1,347,000, $2,317,000 in costs incurred to execute the Company's Blueprint for Growth Strategy, and increased environmental remediation accruals of $585,000. The remaining increases in general and administrative expenses relates to investments in various initiatives and general inflation. Foreign currency translation had a $495,000 favorable impact on general and administrative expenses.
Research and development expenses were $13,491,000 and $13,617,000 in fiscal 2019 and 2018, respectively. As a percentage of consolidated net sales, research and development expenses were 1.5% and 1.6% in fiscal 2019 and 2018. The decrease is attributable to prior year expenses incurred by the sold business in the amount of $119,000.
A Net loss on sales of businesses in the amount of $25,672,000 was recorded in the year ended March 31, 2019. Included in the Net loss on sales of businesses is a loss on Crane Equipment and Service Inc. and Stahlhammer Bommern GmbH in the amount of $26,731,000, offset by a gain on the sale of the Tire Shredder business in the amount of $1,059,000 during the twelve months ended March 31, 2019. Included in the Net loss on sales of businesses were impairment charges of $27,753,000 recorded in fiscal 2019.
Amortization of intangibles remained relatively consistent at $14,900,000 and $15,552,000 in fiscal 2019 and 2018, respectively. The decrease is primarily related to foreign currency translation.
Interest and debt expense was $17,144,000 and $19,733,000 in fiscal 2019 and 2018, respectively, and primarily related to a decrease in interest and debt expense on the Company's Term Loan due to a lower average borrowings outstanding during the fiscal 2019 period.
Investment income of $727,000 and $157,000, in fiscal 2019 and 2018, respectively, related to earnings on marketable securities held in the Company’s wholly owned captive insurance subsidiary and the Company's equity method investment in EMC, described in Note 7. In accordance with ASU 2016-01, investment income for fiscal 2019 included net unrealized gains of marketable securities of $183,000.
Foreign currency exchange loss was $843,000 and $1,539,000 in fiscal 2019 and 2018, respectively, as a result of foreign currency volatility related to foreign currency denominated sales and purchases and intercompany debt.
22
Other income, net, was $716,000 and $2,469,000 in fiscal 2019 and 2018, respectively. This includes components of pension expense (all except service costs, described in Note 13) and various non-operating income and expense related activities.
Income tax expense as a percentage of income from continuing operations before income tax expense was 19.5% and 55.6% in fiscal 2019 and 2018, respectively. These percentages vary from the U.S. statutory rate primarily due to varying effective tax rates at the Company's foreign subsidiaries, and the jurisdictional mix of taxable income for these subsidiaries. The effective tax rate for fiscal 2019 was affected favorably by 6.2 percentage points by certain favorable permanent adjustments, including generation and utilization of certain foreign tan credits, and by 2.8 percentage points by the reduction of the Company's one-time transition tax on earnings of certain foreign subsidiaries to zero. These favorable effects were offset unfavorably by 7.6 percentage points related to certain non-deductible losses on the sale of businesses.
23
LIQUIDITY AND CAPITAL RESOURCES
Cash, cash equivalents, and restricted cash totaled $114,700,000, $71,343,000, and $63,565,000 at March 31, 2020, 2019, and 2018, respectively.
Cash flow from operating activities
Net cash provided by operating activities was $106,795,000, $79,499,000, and $69,661,000 in fiscal 2020, 2019, and 2018, respectively. In fiscal 2020, net income of $59,672,000 and non-cash adjustments to net income of $51,188,000 contributed the most to cash provided by operating activities as well as a decrease in inventory of $15,752,000, an increase in trade accounts payable of $8,110,000, and a decrease in trade accounts receivable of $2,899,000. The increase in cash was partially offset by a decrease in accrued expenses and non-current liabilities of $27,693,000. The decrease in inventory is due to the Company's initiatives to increase cash flow and improve inventory turns. The decrease in accrued expenses and non-current liabilities primarily consists of the fiscal 2019 annual incentive plan payments offset by fiscal 2020 incentive plan accruals, $10,967,000 in pension plan contributions, and $8,593,000 in cash paid for amounts included in the measurement of operating lease liabilities.
In fiscal 2019, net income of $42,577,000 and non-cash adjustments to net income of $66,436,000 contributed the most to cash provided by operating activities as well as an increase in trade accounts payable of $3,881,000. The increase in cash was offset by an increase in inventory of $15,411,000, an increase in trade accounts receivable of $11,328,000, and a decrease in accrued expenses and non-current liabilities of $6,759,000. The increase in inventory is due to the Company's initiatives to improve inventory availability. The net decrease in non-current liabilities is largely due to pension plan contributions of $11,018,000.
Cash flow from investing activities
Net cash (used) provided by investing activities was $(9,962,000), $2,486,000, and $(32,592,000) in fiscal 2020, 2019, and 2018, respectively. In fiscal 2020, the most significant use of cash in investing activities was $9,432,000 in capital expenditures followed by $367,000 in net cash purchases of marketable equity securities.
In fiscal 2019, the most significant source of cash provided by investing activities was $14,230,000 in cash received from the Sold Businesses, offset by $12,288,000 in capital expenditures. The Company also received $662,000 in net cash proceeds from the sale of marketable equity securities.
Cash flow from by financing activities
Net cash used by financing activities was $51,551,000, $67,778,000, and $59,502,000 in fiscal 2020, 2019, and 2018, respectively. In fiscal 2020, the most significant uses of cash were $51,113,000 in repayments on our Term Loan and dividends paid in the amount $5,670,000, offset by $5,232,000 in net inflows from stock related transactions, which includes proceeds of $6,000,000 from stock options exercised.
In fiscal 2019, the most significant uses of cash were $65,088,000 in repayments on our Term Loan and dividends paid in the amount of $4,652,000, offset by $1,962,000 in net inflows from stock related transactions, which included proceeds of $4,152,000 from stock options exercised.
We believe that our cash on hand, cash flows, and borrowing capacity under our New Revolving Credit Facility will be sufficient to fund our ongoing operations and budgeted capital expenditures for at least the next twelve months. This belief is dependent upon successful execution of our current business plan and effective working capital utilization. No material restriction exists in accessing cash held by our non-U.S. subsidiaries. As of March 31, 2020, $69,360,000 of cash and cash equivalents were held by foreign subsidiaries.
On January 31, 2017 the Company entered into a Credit Agreement ("Credit Agreement") and $545,000,000 of debt facilities ("Facilities") in connection with the STAHL acquisition. The Facilities consist of a Revolving Facility ("Revolver") in the amount of $100,000,000 and a $445,000,000 1st Lien Term Loan ("Term Loan"). The Term Loan has a seven-year term maturing in 2024 and the Revolver has a five-year term maturing in 2022. At March 31, 2020 the Company has not drawn from the Revolver.
The key terms of the agreement are as follows:
• | Term Loan: An aggregate $445,000,000 1st Lien Term Loan which requires quarterly principal amortization of 0.25% with the remaining principal due at maturity date. In addition, if the Company has Excess Cash Flow ("ECF") as defined in the Credit Agreement, the ECF Percentage of the Excess Cash Flow for such fiscal year minus optional prepayment |
24
of the Loans (except prepayments of Revolving Loans that are not accompanied by a corresponding permanent reduction of Revolving Commitments) pursuant to Section 2.10(a) of the Credit Agreement other than to the extent that any such prepayment is funded with the proceeds of Funded Debt, shall be applied toward the prepayment of the Term Loan. The ECF Percentage is defined as 50% stepping down to 25% or 0% based on the Secured Leverage Ratio as of the last day of the fiscal year.
• | Revolver: An aggregate $100,000,000 secured revolving facility which includes sublimits for the issuance of standby letters of credit, swingline loans and multi-currency borrowings in certain specified foreign currencies. |
• | Fees and Interest Rates: Commitment fees and interest rates are determined on the basis of either a Eurocurrency rate or a Base rate plus an applicable margin based upon the Company's Total Leverage Ratio (as defined in the Credit Agreement). |
• | Prepayments: Provisions permitting a Borrower to voluntarily prepay either the Term Loan or Revolver in whole or in part at any time, and provisions requiring certain mandatory prepayments of the Term Loan or Revolver on the occurrence of certain events which will permanently reduce the commitments under the Credit Agreement, each without premium or penalty, subject to reimbursement of certain costs of the Lenders. A prepayment premium of 1% of the principal amount of the First Lien Term Loans is required if the prepayment is associated with a Repricing Transaction and it were to occur within the first twelve months. |
• | Covenants: Provisions containing covenants required of the Corporation and its subsidiaries including various affirmative and negative financial and operational covenants. The key financial covenant is triggered only on any date when any Extension of Credit under the Revolving Facility is outstanding (excluding any Letters of Credit) (the “Covenant Trigger”), and permits the Total Leverage Ratio for the Reference Period ended on such date to not exceed (i) 4.50:1.00 as of any date of determination prior to December 31, 2017, (ii) 4.00:1.00 as of any date of determination on December 31, 2017 and thereafter but prior to December 31, 2018, (iii) 3.50:1.00 as of any date of determination on December 31, 2018 and thereafter but prior to December 31, 2019 and (iv) 3.00:1.00 as of any date of determination on December 31, 2019 and thereafter. As there is no amount drawn on the Revolver as of March 31, 2020 the requirement to comply with the covenant is not triggered. Had we been required to determine the covenant ratio we would have been in compliance with the covenant provisions as of March 31, 2020 and 2019. |
The Facility is secured by all U.S. inventory, receivables, equipment, real property, certain subsidiary stock (limited to 65% of non-U.S. subsidiaries) and intellectual property. The Credit Agreement allows, but limits our ability to pay dividends.
On February 26, 2018, the Company amended the Credit Agreement (known as the "Amended Credit Agreement"). The Amended Credit Agreement has the same terms mentioned above except for a reduction in interest rates. The applicable rate for the repriced term loan was reduced from 3.00% to 2.50%. The Company accounted for the Amended Credit Agreement as a debt modification, therefore, debt repricing fees incurred in fiscal 2018 were expensed as General and Administrative expenses and the deferred financing fees incurred as part of the Credit Agreement (discussed below) remain unchanged.
The outstanding balance of the Term Loan was $259,350,000 and $310,463,000 as of March 31, 2020 and 2019, respectively. The Company made $51,113,000 of principal payments on the Term Loan during fiscal 2020 and $65,000,000 of principal payments on the Term Loan during fiscal 2019 which is more than the minimum required principal payment the Company is obligated to make. In response to COVID-19 the Company is seeking to take all appropriate measures to protect the cash flow and liquidity of the Company and plans to make minimum required principal payments of $4,450,000 over the next 12 months. As such, only the required principal amount has been recorded within the current portion of long-term debt on the Company's Consolidated Balance Sheet with the remaining balance recorded as long-term debt.
There was $0 outstanding on the Revolving Credit Facility and $16,752,000 outstanding letters of credit as of March 31, 2020. The outstanding letters of credit at March 31, 2020 consisted of $898,000 in commercial letters of credit and $15,854,000 of standby letters of credit. Subsequent to March 31, 2020, the Company drew $25,000,000 from the Revolver for liquidity and working capital purposes demonstrating it has a supportive bank group.
The gross balance of deferred financing costs on the term loan was $14,690,000 as of March 31, 2020 and 2019. The accumulated amortization balances were $6,645,000 and $4,547,000 as of March 31, 2020 and 2019, respectively.
The gross balance of deferred financing costs associated with the Revolving Credit Facility is included in Other assets is $2,789,000 as of March 31, 2020 and March 31, 2019. The accumulated amortization balance is $1,766,000 and $1,209,000 as of March 31, 2020 and March 31, 2019 respectively. These balances are classified in Other assets since no funds were drawn on the Revolving Credit Facility in fiscal 2020 and 2019.
25
Unsecured and uncommitted lines of credit are available to meet short-term working capital needs for certain of our subsidiaries operating outside of the U.S. The lines of credit are available on an offering basis, meaning that transactions under the line of credit will be on such terms and conditions, including interest rate, maturity, representations, covenants, and events of default, as mutually agreed between our subsidiaries and the local bank at the time of each specific transaction. As of March 31, 2020, unsecured credit lines totaled approximately $2,428,000, of which $0 was drawn. In addition, unsecured lines of $14,160,000 were available for bank guarantees issued in the normal course of business of which $9,958,000 was utilized.
CONTRACTUAL OBLIGATIONS
The following table reflects a summary of our contractual obligations in millions of dollars as of March 31, 2020, by period of estimated payments due:
Total | Fiscal 2021 | Fiscal 2022- Fiscal 2023 | Fiscal 2024- Fiscal 2025 | More Than Five Years | ||||||||||||||||
Long-term debt obligations (a) | $ | 259.4 | $ | 4.5 | $ | 8.9 | $ | 246.0 | $ | — | ||||||||||
Operating lease obligations (b) | 43.9 | 8.3 | 14.6 | 8.9 | 12.1 | |||||||||||||||
Purchase obligations (c) | — | — | — | — | — | |||||||||||||||
Interest obligations (d) | 40.8 | 10.4 | 20.3 | 10.1 | — | |||||||||||||||
Letter of credit obligations | 16.8 | 14.4 | 2.4 | — | — | |||||||||||||||
Bank guarantees | 10.0 | 10.0 | — | — | — | |||||||||||||||
Uncertain tax positions | 0.2 | 0.2 | — | — | — | |||||||||||||||
Other long-term liabilities reflected on the Company’s balance sheet under GAAP | 195.9 | — | 70.7 | 60.4 | 64.8 | |||||||||||||||
Total | $ | 567.0 | $ | 47.8 | $ | 116.9 | $ | 325.4 | $ | 76.9 | ||||||||||
(a) | As described in Note 12 to consolidated financial statements. Subsequent to March 31, 2020, the Company drew $25 million from the Revolver. |
(b) | As described in Note 18 to consolidated financial statements. |
(c) | We have no purchase obligations specifying fixed or minimum quantities to be purchased. We estimate that, at any given point in time, our cancelable open purchase orders to be executed in the normal course of business approximate $78 million. |
(d) | Estimated for our Term Loan and Revolving Credit Facility and interest rate swaps as described in Note 10 and Note 12 to our consolidated financial statements. Calculated using a Eurocurrency rate of 1.45% plus an applicable margin of 2.50%. |
We have no additional off-balance sheet obligations that are not reflected above.
CAPITAL EXPENDITURES
In addition to keeping our current equipment and plants properly maintained, we are committed to replacing, enhancing, and upgrading our property, plant and equipment to support new product development, improve productivity and customer responsiveness, reduce production costs, increase flexibility to respond effectively to market fluctuations and changes, meet environmental requirements, and enhance safety. Our capital expenditures for fiscal 2020, 2019, and 2018 were $9,432,000, $12,288,000, and $14,515,000 respectively. Excluded from fiscal 2020 capital expenditures is $365,000, $227,000, and $0 in property, plant and equipment purchases included in accounts payable at March 31, 2020, 2019, and 2018, respectively. We expect capital expenditure spending in fiscal 2021 of approximately $15,000,000, excluding acquisitions and strategic alliances.
INFLATION AND OTHER MARKET CONDITIONS
Our costs are affected by inflation in the U.S. economy and, to a lesser extent, in non-U.S. economies including those of Europe, Canada, Mexico, South America, and Asia-Pacific. We do not believe that general inflation has had a material effect on our results of operations over the periods presented primarily due to overall low inflation levels over such periods and our ability to generally pass on rising costs through annual price increases. However, increases in U.S. employee benefits costs such as health insurance and workers compensation insurance have exceeded general inflation levels. In the future, we may be further affected by inflation that we may not be able to pass on as price increases. With changes in worldwide demand for steel and fluctuating scrap steel
26
prices over the past several years, we experienced fluctuations in our costs that we have reflected as price increases to our customers. We believe we have been successful in instituting price increases to pass on these material cost increases. We will continue to monitor our costs and reevaluate our pricing policies.
SEASONALITY AND QUARTERLY RESULTS
Our quarterly results may be materially affected by the timing of large customer orders, periods of high vacation and holiday concentrations, restructuring charges, and other costs attributable to plan closures as well as divestitures and acquisitions. Therefore, our operating results for any particular fiscal quarter are not necessarily indicative of results for any subsequent fiscal quarter or for the full fiscal year.
CRITICAL ACCOUNTING POLICIES AND ESTIMATES
The preparation of financial statements in conformity with U.S. generally accepted accounting principles requires us to make estimates and assumptions that affect the amounts reported in our consolidated financial statements and accompanying notes. We continually evaluate the estimates and their underlying assumptions, which form the basis for making judgments about the carrying value of our assets and liabilities. Actual results inevitably will differ from those estimates. If interpreted differently under different conditions or circumstances, changes in our estimates could result in material changes to our reported results. We have identified below the accounting policies involving estimates that are critical to our financial statements. Other accounting policies are more fully described in Note 2 of our consolidated financial statements.
Insurance Reserves. Our accrued general and product liability reserves as described in Note 16 to consolidated financial statements involve actuarial techniques including the methods selected to estimate ultimate claims, and assumptions including emergence patterns, payment patterns, initial expected losses, and increased limit factors. These actuarial estimates are subject to a high degree of uncertainty due to a variety of factors, including extended lag time in the reporting and resolution of claims, trends or changes in claim settlement patterns, insurance industry practices, and legal interpretations. Changes to these estimates could result in material changes to the amount of expense and liabilities recorded in our financial statements. Further, actual costs could differ significantly from the estimated amounts. Adjustments to estimated reserves are recorded in the period in which the change in estimate occurs. Other insurance reserves such as workers compensation and group health insurance are based on actual historical and current claim data provided by third party administrators or internally maintained.
Goodwill and indefinite-lived intangible asset impairment testing. Our goodwill balance of $319,679,000 as of March 31, 2020 is subject to impairment testing. We test goodwill for impairment at least annually, as of the end of February, and more frequently whenever events occur or circumstances change that indicate there may be impairment. These events or circumstances could include a significant long-term adverse change in the business climate, poor indicators of operating performance, or a sale or disposition of a significant portion of a reporting unit.
We test goodwill at the reporting unit level, which is one level below our operating segment. We identify our reporting units by assessing whether the components of our operating segment constitute businesses for which discrete financial information is available and segment management regularly reviews the operating results of those components. We also aggregate components that have similar economic characteristics into single reporting units (for example, similar products and / or services, similar long-term financial results, product processes, classes of customers, or in circumstances where the components share assets or other resources and have other economic interdependencies). The Company has two reporting units, both of which have goodwill. The Duff-Norton and Rest of Products reporting units have goodwill totaling $9,593,000, and $310,086,000, respectively, at March 31, 2020.
Annual Goodwill Impairment Test
When we evaluate the potential for goodwill impairment, we assess a range of qualitative factors including, but not limited to, macroeconomic conditions, industry conditions, the competitive environment, changes in the market for our products and services, regulatory and political developments, entity specific factors such as strategy, and changes in key personnel and overall financial performance. If, after completing this assessment, it is determined that it is more likely than not that the fair value of a reporting unit is less than its carrying value, we proceed to a quantitative impairment test. We also proceed to the quantitative model when economic or other business factors indicate that the fair value of our reporting units may have declined since our last quantitative test. We performed the qualitative assessment as of February 29, 2020 and determined that the quantitative test should be performed for the Rest of Products and Duff-Norton reporting units due to volatility in our stock price and uncertainty in the global economic environment caused by COVID-19. We also performed sensitivities and other analysis and determined it is more likely than not that goodwill is not impaired as of March 31, 2020.
27
Rest of Products Reporting Unit
In order to perform the quantitative impairment test for the Rest of Products reporting unit, we use the discounted cash flow method and comparable market method to estimate fair value. The discounted cash flow method incorporates various assumptions, the most significant being projected revenue growth rates, operating profit margins and cash flows, the terminal growth rate and the discount rate. Management projects revenue growth rates, operating margins and cash flows based on each reporting unit’s current business, expected developments and operational strategies over a five-year period. In estimating the terminal growth rate, we consider our historical and projected results, as well as the economic environment in which the reporting unit operates. The discount rates utilized for each reporting unit reflect management’s assumptions of marketplace participants’ cost of capital and risk assumptions, both specific to the reporting unit and overall in the economy. The comparable market method estimates fair value based on prices obtained in actual transactions. The method consists of examining selling prices for comparable assets. After studying the selling prices, value adjustments are made for any dissimilarities.
Testing goodwill for impairment under the quantitative method described above requires us to estimate fair value of the reporting unit using significant estimates and judgmental factors. The compound annual growth rate for revenue during the first five years of our projections was approximately 1.91% for the Rest of Products reporting unit. The terminal value was calculated assuming a projected growth rate of 3.0% after five years . These rates reflect our estimate of long-term growth into perpetuity and approximate the long-term gross domestic product growth expected on a global basis as well as our normal annual price increases. The estimated weighted-average cost of capital for the reporting units was determined to be 11.7% for the Rest of Products reporting unit. This was estimated based upon an analysis of similar companies and their debt to equity mix, their related volatility and the size of their market capitalization. We also consider any additional risk of the Rest of Products reporting unit achieving its forecast, and adjust the weighted-average cost of capital applied when determining the reporting unit’s estimated fair value. Future changes in these estimates and assumptions could materially affect the results of our goodwill impairment tests. For example, a decline in the terminal growth rate by 50 basis points would decrease fair market value by $8,280,000 and an increase in the weighted-average cost of capital by 100 basis points would result in a decrease in fair market value by $26,270,000 for the Rest of Products reporting unit. Even with such changes, the fair value of the reporting unit would be greater than its net book value as of February 29, 2020, therefore indicating no impairment.
Duff-Norton Reporting Reporting Unit
Similar to the Rest of Products reporting unit, we use the discounted cash flow method and comparable market method to estimate fair value for the Duff-Norton reporting unit. The discounted cash flow method incorporates various assumptions, the most significant being projected revenue growth rates, operating profit margins and cash flows, the terminal growth rate and the discount rate. Management projects revenue growth rates, operating margins and cash flows based on each reporting unit’s current business, expected developments and operational strategies over a five-year period. In estimating the terminal growth rate, we consider our historical and projected results, as well as the economic environment in which the reporting unit operates. The discount rates reflect management’s assumptions of marketplace participants’ cost of capital and risk assumptions, both specific to the reporting unit and overall in the economy. The comparable market method estimates fair value based on prices obtained in actual transactions. The method consists of examining selling prices for comparable assets. After studying the selling prices, value adjustments are made for any dissimilarities.
Testing goodwill for impairment under the quantitative method described above requires us to estimate fair value of the reporting unit using significant estimates and judgmental factors. The compound annual growth rate for revenue during the first five years of our projections was approximately 5.68% for the Duff-Norton reporting unit. The terminal value was calculated assuming a projected growth rate of 3.5% after five years. These rates reflect our estimate of long-term growth into perpetuity and approximate the long-term gross domestic product growth expected on a global basis as well as our normal annual price increases. The estimated weighted-average cost of capital for the reporting units was determined to be 12.2% for the Duff-Norton reporting unit. This was estimated initially based on the Company's consolidated weighted-average cost of capital and increased for additional market risk. We also consider any additional risk of the Duff-Norton reporting unit achieving its forecast, and adjust the weighted-average cost of capital applied when determining the reporting unit’s estimated fair value. Future changes in these estimates and assumptions could materially affect the results of our goodwill impairment tests. For example, a decline in the terminal growth rate by 50 basis points would decrease fair market value by $2,446,000 and an increase in the weighted-average cost of capital by 100 basis points would result in a decrease in fair market value by $6,929,000 for the Duff-Norton reporting unit. Even with such changes, the fair value of the reporting unit would be greater than its net book value as of February 29, 2020, therefore indicating no impairment.
We further test our indefinite-lived intangible asset balance of $46,670,000 consisting of trademarks on our recent acquisitions on an annual basis for impairment. The methodology used to value trademarks is the relief from royalty method. The recorded book value of these trademarks in excess of the calculated fair value results in impairment. The key estimate used in this calculation
28
consists of an overall royalty rate applied to the sales covered by the trademark. After performing this analysis, we determined that the fair value of these trademarks exceeded their book values, and as such, no other impairment was recorded.
29
Effects of New Accounting Pronouncements
Information regarding the effects of new accounting pronouncements is included in Note 22 to the accompanying consolidated financial statements included in this March 31, 2020 10-K report.
Safe Harbor Statement under the Private Securities Litigation Reform Act of 1995
This report may include “forward-looking statements” within the meaning of the Private Securities Litigation Reform Act of 1995. Such statements involve known and unknown risks, uncertainties and other factors that could cause our actual results to differ materially from the results expressed or implied by such statements, including general economic and business conditions, conditions affecting the industries served by us and our subsidiaries, conditions affecting our customers and suppliers, competitor responses to our products and services, the overall market acceptance of such products and services, facility consolidations and other restructurings, our asbestos-related liability, the integration of acquisitions, and other factors disclosed in our periodic reports filed with the Commission. Consequently such forward-looking statements should be regarded as our current plans, estimates and beliefs. We do not undertake and specifically decline any obligation to publicly release the results of any revisions to these forward-looking statements that may be made to reflect any future events or circumstances after the date of such statements or to reflect the occurrence of anticipated or unanticipated events.
30
Item 7A. Quantitative and Qualitative Disclosures About Market Risk
Market risk is the potential loss arising from adverse changes in market rates and prices, such as interest rates. We are exposed to various market risks, including commodity prices for raw materials, foreign currency exchange rates, and changes in interest rates. We may enter into financial instrument transactions, which attempt to manage and reduce the impact of such changes. We do not enter into derivatives or other financial instruments for trading or speculative purposes.
Our costs are affected by inflation in the U.S. economy and, to a lesser extent, in non-U.S. economies including those of Europe, Canada, Mexico, South America, and Asia-Pacific. We do not believe that general inflation has had a material effect on our results of operations over the periods presented primarily due to overall low inflation levels over such periods and our ability to generally pass on rising costs through annual price increases. However, increases in U.S. employee benefits costs such as health insurance and workers compensation insurance have exceeded general inflation levels. In the future, we may be further affected by inflation that we may not be able to pass on as price increases. With changes in worldwide demand for steel and fluctuating scrap steel prices over the past several years, we experienced fluctuations in our costs that we have reflected as price increases to our customers. We believe we have been successful in instituting price increases to pass on these material cost increases. The company is exposed to trade tariffs with China. The Company monitors the impact of tariffs and actively works to mitigate this impact through material productivity actions and pricing strategies. We will continue to monitor our costs and reevaluate our pricing policies.
We have been and may continue to be materially and adversely impacted by the effects of COVID-19. In addition to global macroeconomic effects, the COVID-19 outbreak and any other related adverse public health developments will cause disruption to our international operations and sales activities. The continued operation of our facilities is subject to local laws and regulations. While all of our facilities have been deemed essential under applicable law there is no guarantee this will continue. Currently, our Brighton, Michigan and Santiago, Mexico facilities are not operating. Our third-party manufacturers, suppliers, third-party distributors, sub-contractors and customers have been and will be disrupted by worker absenteeism, quarantines and restrictions on their employees’ ability to work, office and factory closures, disruptions to ports and other shipping infrastructure, border closures, or other travel or health-related restrictions. Depending on the magnitude of such effects on our manufacturing operations or the operations of our suppliers, third-party distributors, or sub-contractors, our supply chain, manufacturing and product shipments could be delayed, which could adversely affect our business, operations, and customer relationships. In addition, COVID-19 or other disease outbreaks will in the short-run and may over the longer term adversely affect the economies and financial markets of many countries, resulting in an economic downturn that will affect demand for our products and impact our operating results. There can be no assurance that any decrease in sales resulting from the COVID-19 will be offset by increased sales in subsequent periods. Although the magnitude of the impact of the COVID-19 outbreak on our business and operations remains uncertain, the continued spread of the COVID-19 or the occurrence of other epidemics and the imposition of related public health measures and travel and business restrictions will adversely impact our business, financial condition, operating results and cash flows.
In fiscal 2020, 45% of our net sales were from manufacturing plants and sales offices in foreign jurisdictions. We manufacture our products in the United States, China, Germany, United Kingdom, Hungary, Mexico, and France and sell our products in approximately 50 countries. Our results of operations could be affected by factors such as changes in foreign currency rates or weak economic conditions in foreign markets. With our fiscal year 2017 acquisition of STAHL, we have an increased presence in the United Arab Emirates, with total assets of approximately $10,000,000. Our operating results are exposed to fluctuations between the U.S. Dollar and the Canadian Dollar, European currencies, the South African Rand, the Mexican Peso, the Brazilian Real, and the Chinese Yuan. For example, when the U.S. dollar weakens against the Euro, the value of our net sales and net income denominated in Euros increases when translated into U.S. dollars for inclusion in our consolidated results. We are also exposed to foreign currency fluctuations in relation to purchases denominated in foreign currencies. Our foreign currency risk is mitigated since the majority of our foreign operations’ net sales and the related expense transactions are denominated in the same currency, which reduces the impact of a significant change in foreign exchange rates on net income. For example, a 10% change in the value of the U.S. dollar in relation to our most significant foreign currency exposures would have had an impact of approximately $3,900,000 on our income from operations. In addition, the majority of our export sale transactions are denominated in U.S. dollars.
The Company has a cross currency swap agreement that is designated as a cash flow hedge to hedge changes in the value of an intercompany loan to a foreign subsidiary due to changes in foreign exchange rates. This intercompany loan is related to the acquisition of STAHL. As of March 31, 2020, the notional amount of this derivative was $181,390,000, and the contract matures on January 31, 2022. From its March 31, 2020 balance of AOCL, the Company expects to reclassify approximately $1,312,000 out of AOCL, and into foreign currency exchange loss (gain), during the next 12 months based on the contractual payments due under this intercompany loan.
The Company has foreign currency forward agreements that are designated as cash flow hedges to hedge a portion of forecasted inventory purchases denominated in foreign currencies. The notional amount of those derivatives is $8,422,000 and all contracts
31
mature by December 31, 2020. From its March 31, 2020 balance of AOCL, the Company expects to reclassify approximately $264,000 out of AOCL during the next 12 months based on the underlying transactions of the sales of the goods purchased.
The Company's policy is to maintain a capital structure that is comprised of 50-70% of fixed rate long-term debt and 30-50% of variable rate long-term debt. The Company has two interest rate swap agreements in which the Company receives interest at a variable rate and pays interest at a fixed rate. These interest rate swap agreements are designated as cash flow hedges to hedge changes in interest expense due to changes in the variable interest rate of the senior secured term loan. The amortizing interest rate swaps mature by December 31, 2023 and had a total notional amount of $158,490,000 as of March 31, 2020. The effective portion of the changes in fair values of the interest rate swaps is reported in AOCL and will be reclassified to interest expense over the life of the swap agreements. From its March 31, 2020 balance of AOCL, the Company expects to reclassify approximately $1,066,000 out of AOCL, and into interest expense, during the next 12 months.
32
Item 8. Financial Statements and Supplemental Data.
INDEX TO CONSOLIDATED FINANCIAL STATEMENTS
Columbus McKinnon Corporation
Audited Consolidated Financial Statements as of March 31, 2020:
Report of Independent Registered Public Accounting Firm | ||
Consolidated Balance Sheets | ||
Consolidated Statements of Operations | ||
Consolidated Statements of Comprehensive Income | ||
Consolidated Statements of Shareholders’ Equity | ||
Consolidated Statements of Cash Flows | ||
Notes to Consolidated Financial Statements | ||
1 | Description of Business | |
2 | Accounting Principles and Practices | |
3 | Disposals | |
4 | Revenue Recognition | |
5 | Fair Value Measurements | |
6 | Inventories | |
7 | Marketable Securities and Other Investments | |
8 | Property, Plant, and Equipment | |
9 | Goodwill and Intangible Assets | |
10 | Derivative Instruments | |
11 | Accrued Liabilities and Other Non-current Liabilities | |
12 | Debt | |
13 | Pensions and Other Benefit Plans | |
14 | Employee Stock Ownership Plan ("ESOP") | |
15 | Earnings per Share and Stock Plans | |
16 | Loss Contingencies | |
17 | Income Taxes | |
18 | Leases | |
19 | Business Segment Information | |
20 | Selected Quarterly Financial Data (unaudited) | |
21 | Accumulated Other Comprehensive Loss | |
22 | Effects of New Accounting Pronouncements | |
Schedule II – Valuation and Qualifying Accounts. | ||
33
Report of Independent Registered Public Accounting Firm
To the Shareholders and the Board of Directors of Columbus McKinnon Corporation
Opinion on the Financial Statements
We have audited the accompanying consolidated balance sheets of Columbus McKinnon Corporation (the Company) as of March 31, 2020 and 2019, the related consolidated statements of operations, comprehensive income, shareholders' equity and cash flows for each of the three years in the period ended March 31, 2020, and the related notes and financial statement schedule listed in the Index at Item 15(2) (collectively referred to as the “consolidated financial statements”). In our opinion, the consolidated financial statements present fairly, in all material respects, the financial position of the Company at March 31, 2020 and 2019, and the results of its operations and its cash flows for each of the three years in the period ended March 31, 2020, in conformity with U.S. generally accepted accounting principles.
We also have audited, in accordance with the standards of the Public Company Accounting Oversight Board (United States) (PCAOB), the Company's internal control over financial reporting as of March 31, 2020, based on criteria established in Internal Control-Integrated Framework issued by the Committee of Sponsoring Organizations of the Treadway Commission (2013 framework), and our report dated May 27, 2020, expressed an unqualified opinion thereon.
Adoption of New Accounting Standards
As discussed in Note 2 to the consolidated financial statements, the Company changed its method for recognizing revenue as a result of the adoption of Accounting Standards Update (ASU) No. 2014-09, Revenue from Contracts with Customers (Topic 606), and the amendments in ASUs 2015-14, 2016-08, 2016-10 and 2016-12 effective April 1, 2018. As discussed in Note 2 to the consolidated financial statements, the Company changed its method for accounting for leases as a result of the adoption of ASU No. 2016-02, Leases (Topic 842), as amended, effective April 1, 2019.
Basis for Opinion
These financial statements are the responsibility of the Company's management. Our responsibility is to express an opinion on the Company’s financial statements based on our audits. We are a public accounting firm registered with the PCAOB and are required to be independent with respect to the Company in accordance with the U.S. federal securities laws and the applicable rules and regulations of the Securities and Exchange Commission and the PCAOB.
We conducted our audits in accordance with the standards of the PCAOB. Those standards require that we plan and perform the audit to obtain reasonable assurance about whether the financial statements are free of material misstatement, whether due to error or fraud. Our audits included performing procedures to assess the risks of material misstatement of the financial statements, whether due to error or fraud, and performing procedures that respond to those risks. Such procedures included examining, on a test basis, evidence regarding the amounts and disclosures in the financial statements. Our audits also included evaluating the accounting principles used and significant estimates made by management, as well as evaluating the overall presentation of the financial statements. We believe that our audits provide a reasonable basis for our opinion.
Critical Audit Matters
The critical audit matters communicated below are matters arising from the current period audit of the financial statements that were communicated or required to be communicated to the audit committee and that: (1) relate to accounts or disclosures that are material to the financial statements and (2) involved our especially challenging, subjective, or complex judgments. The communication of critical audit matters does not alter in any way our opinion on the financial statements, taken as a whole, and we are not, by communicating the critical audit matters below, providing separate opinions on the critical audit matters or on the accounts or disclosures to which they relate.
34
Valuation of Goodwill | ||
Description of the Matter | At March 31, 2020, the Company’s goodwill was $319.7 million. As discussed in Notes 2 and 9 of the consolidated financial statements, goodwill is qualitatively tested and quantitatively tested, when necessary, for impairment at least annually at the reporting unit level. For its fiscal 2020 annual impairment test, the Company quantitatively tested goodwill impairment for the Rest of Products reporting unit which had goodwill of $310.1 million. In its quantitative test, the Company applied a discounted cash flow method to estimate the fair value of its reporting unit which incorporated various assumptions, the most significant being projected revenue growth rates, operating profit margins and cash flows, the terminal growth rate and the discount rate. Auditing management’s annual goodwill impairment test was complex and highly judgmental due to the significant estimation required to determine the fair value of the Rest of Products reporting unit. The fair value estimate for the Rest of Products reporting unit was sensitive to significant assumptions inherent in the Company’s discounted estimated future cash flows, in particular changes in the projected revenue growth rates and the discount rate, which are affected by expectations about future market or economic conditions. | |
How We Addressed the Matter in Our Audit | We obtained an understanding, evaluated the design and tested the operating effectiveness of controls over the Company’s goodwill impairment review process, including controls over management’s review of the significant assumptions described above. To test the estimated fair value of the Company’s Rest of Products reporting unit, we performed audit procedures with the assistance of our valuation professionals that included, among others, assessing the methodology used and testing the significant assumptions discussed above and the underlying data used in the impairment analysis. We compared the significant assumptions used by management to current industry and economic trends and evaluated the effects of changes to the Company’s business model, customer base or product mix and other factors on the significant assumptions. We assessed the historical accuracy of management’s revenue forecasts and performed sensitivity analyses of significant assumptions to evaluate the changes in the fair value of the reporting unit that would result from changes in the assumptions. We considered the relationship between the aggregate fair value of the Company’s reporting units and the Company’s market capitalization as of the annual impairment testing date. | |
Product Liabilities and Related Legal Costs | ||
Description of the Matter | At March 31, 2020 the Company’s liability for asbestos-related product liability claims and related legal costs was $4.8 million. As discussed in Note 16 to the consolidated financial statements, the Company is involved in asbestos-related litigation the cost of which is paid through a wholly-owned captive insurance company. Auditing management's estimate of its reserves for asbestos-related product liabilities is complex and highly judgmental due to the significant estimation and judgment required in determining the ultimate outcomes of the cases asserted against the Company and in determining the ultimate costs for the Company to defend against such claims. In particular, the estimated product liability reserve is sensitive to significant assumptions such as case dismissal rates, the number of years case activity might continue, legal and other costs to defend claims. The cost to defend claims takes into consideration the extent to which insurance carriers, under pre-existing insurance policies and pursuant to a pending legal settlement, are covering future indemnity payments and sharing in payment of future legal defense costs. | |
How We Addressed the Matter in Our Audit | We obtained an understanding, evaluated the design and tested the operating effectiveness of controls over the Company’s product liability estimation process. Our procedures included, among others, testing management’s review of significant assumptions used for purposes of calculating the estimated liability. To test the estimated liability for asbestos-related product liability claims, we performed audit procedures that included, among others, testing the completeness and accuracy of the asbestos-related claims data underlying the estimated liability. We compared forecasts of legal defense costs and dismissal ratios utilized by management in prior year reserve estimates to actual defense costs incurred and the actual ratios of asbestos claims asserted to claims dismissed. We inspected analyses prepared by the Company to support the current forecasts of defense costs and dismissal ratios. We inspected correspondence from the Company’s internal counsel as to the number and status of outstanding claims asserted and the pending legal settlement with insurance carriers and correspondence from external counsel to corroborate the information provided by management. We involved a specialist to assist with our procedures and to develop an independent range of asbestos-related product liability reserves, which we compared to the Company’s recorded amount. | |
35
/s/ Ernst & Young LLP |
We have served as the Company’s auditor since at least 1917, but we are unable to determine the specific year. |
Buffalo, New York |
May 27, 2020 |
36
COLUMBUS McKINNON CORPORATION
CONSOLIDATED BALANCE SHEETS
March 31, | ||||||||
2020 | 2019 | |||||||
(In thousands, except share data) | ||||||||
ASSETS | ||||||||
Current assets: | ||||||||
Cash and cash equivalents | $ | $ | ||||||
Trade accounts receivable, less allowance for doubtful accounts ($5,056 and $3,264, respectively) | ||||||||
Inventories | ||||||||
Prepaid expenses and other | ||||||||
Total current assets | ||||||||
Net property, plant, and equipment | ||||||||
Goodwill | ||||||||
Other intangibles, net | ||||||||
Marketable securities | ||||||||
Deferred taxes on income | ||||||||
Other assets | ||||||||
Total assets | $ | $ | ||||||
LIABILITIES AND SHAREHOLDERS’ EQUITY | ||||||||
Current liabilities: | ||||||||
Trade accounts payable | $ | $ | ||||||
Accrued liabilities | ||||||||
Current portion of long-term debt | ||||||||
Total current liabilities | ||||||||
Term loan and revolving credit facility | ||||||||
Other non-current liabilities | ||||||||
Total liabilities | ||||||||
Shareholders’ equity: | ||||||||
Voting common stock: 50,000,000 shares authorized; 23,771,620 and 23,391,101 shares issued and outstanding | ||||||||
Additional paid-in capital | ||||||||
Retained earnings | ||||||||
Accumulated other comprehensive loss | ( | ) | ( | ) | ||||
Total shareholders’ equity | ||||||||
Total liabilities and shareholders’ equity | $ | $ | ||||||
See accompanying notes.
37
COLUMBUS McKINNON CORPORATION
CONSOLIDATED STATEMENTS OF OPERATIONS
Year Ended March 31, | ||||||||||||
2020 | 2019 | 2018 | ||||||||||
(In thousands, except per share data) | ||||||||||||
Net sales | $ | $ | $ | |||||||||
Cost of products sold | ||||||||||||
Gross profit | ||||||||||||
Selling expenses | ||||||||||||
General and administrative expenses | ||||||||||||
Research and development expenses | ||||||||||||
Net loss on sales of businesses, including impairment | ||||||||||||
Amortization of intangibles | ||||||||||||
Income from operations | ||||||||||||
Interest and debt expense | ||||||||||||
Investment (income) loss, net | ( | ) | ( | ) | ( | ) | ||||||
Foreign currency exchange loss (gain), net | ( | ) | ||||||||||
Other (income) expense, net | ( | ) | ( | ) | ||||||||
Income from continuing operations before income tax expense | ||||||||||||
Income tax expense | ||||||||||||
Net income | $ | $ | $ | |||||||||
Average basic shares outstanding | ||||||||||||
Average diluted shares outstanding | ||||||||||||
Basic income per share | $ | $ | $ | |||||||||
Diluted income per share | $ | $ | $ | |||||||||
Dividends declared per common share | $ | $ | $ | |||||||||
See accompanying notes.
38
COLUMBUS McKINNON CORPORATION
CONSOLIDATED STATEMENTS OF COMPREHENSIVE INCOME
March 31, | ||||||||||||
2020 | 2019 | 2018 | ||||||||||
(In thousands) | ||||||||||||
Net income | $ | $ | $ | |||||||||
Other comprehensive income (loss), net of tax: | ||||||||||||
Foreign currency translation adjustments | ( | ) | ( | ) | ||||||||
Pension liability adjustments, net of taxes of $8,062, $2,242 and $(4,981) | ( | ) | ( | ) | ||||||||
Other post retirement obligations adjustments, net of taxes of $(35), $(126), and $(153) | ||||||||||||
Split-dollar life insurance arrangement adjustments, net of taxes of $(17), $(18), and $(70) | ||||||||||||
Change in derivatives qualifying as hedges, net of taxes of $(565), $469, and $(1,519) | ( | ) | ||||||||||
Change in investments: | ||||||||||||
Unrealized holding (loss) gain arising during the period, net of taxes of $0, $0, and $(124) | ||||||||||||
Net change in unrealized gain (loss) on investments | ||||||||||||
Total other comprehensive income (loss) | ( | ) | ( | ) | ||||||||
Comprehensive income | $ | $ | $ | |||||||||
See accompanying notes.
39
COLUMBUS McKINNON CORPORATION
CONSOLIDATED STATEMENTS OF SHAREHOLDERS’ EQUITY
(In thousands, except share data)
Common Stock ($0.01 par value) | Additional Paid-in Capital | Retained Earnings | Accumulated Other Comprehensive Loss | Total Shareholders’ Equity | ||||||||||||||||
Balance at April 1, 2017 | $ | $ | $ | $ | ( | ) | $ | |||||||||||||
Net income 2018 | ||||||||||||||||||||
Dividends declared | ( | ) | ( | ) | ||||||||||||||||
Change in foreign currency translation adjustment | ||||||||||||||||||||
Change in net unrealized gain on investments, net of tax of $(124) | ||||||||||||||||||||
Change in derivatives qualifying as hedges, net of tax of $(1,519) | ||||||||||||||||||||
Change in pension liability and postretirement obligations, net of tax of $(5,205) | ||||||||||||||||||||
Stock compensation - directors | ||||||||||||||||||||
Stock options exercised, 363,091 shares | ||||||||||||||||||||
Stock compensation expense | ||||||||||||||||||||
Restricted stock units released, 116.775 shares, net of shares withheld for minimum statutory tax obligation | ( | ) | ( | ) | ||||||||||||||||
Balance at March 31, 2018 | $ | $ | $ | $ | ( | ) | $ | |||||||||||||
Net income 2019 | ||||||||||||||||||||
Dividends declared | ( | ) | ( | ) | ||||||||||||||||
Change in accounting principle | ||||||||||||||||||||
Change in foreign currency translation adjustment | ( | ) | ( | ) | ||||||||||||||||
Change in net unrealized gain on investments, net of tax of | ( | ) | ( | ) | ||||||||||||||||
Change in derivatives qualifying as hedges, net of tax of $469 | ( | ) | ( | ) | ||||||||||||||||
Change in pension liability and postretirement obligations, net of tax of $2,097 | ( | ) | ( | ) | ||||||||||||||||
Stock compensation - directors | ||||||||||||||||||||
Stock options exercised, 187,907 shares | ||||||||||||||||||||
Stock compensation expense | ||||||||||||||||||||
Restricted stock units released, 157,715 shares, net of shares withheld for minimum statutory tax obligation | ( | ) | ( | ) | ||||||||||||||||
Balance at March 31, 2019 | $ | $ | $ | $ | ( | ) | $ | |||||||||||||
Net income 2020 | ||||||||||||||||||||
Dividends declared | ( | ) | ( | ) | ||||||||||||||||
Change in foreign currency translation adjustment | ( | ) | ( | ) | ||||||||||||||||
Change in derivatives qualifying as hedges, net of tax of $(565) | ||||||||||||||||||||
Change in pension liability and postretirement obligations, net of tax of $8,010 | ( | ) | ( | ) | ||||||||||||||||
Stock compensation - directors | ||||||||||||||||||||
Stock options exercised, 296,027 shares | ||||||||||||||||||||
Stock compensation expense | ||||||||||||||||||||
Restricted stock units released, 82,861 shares, net of shares withheld for minimum statutory tax obligation | ( | ) | ( | ) | ||||||||||||||||
Balance at March 31, 2020 | $ | $ | $ | $ | ( | ) | $ | |||||||||||||
See accompanying notes.
40
COLUMBUS McKINNON CORPORATION
CONSOLIDATED STATEMENTS OF CASH FLOWS
Year ended March 31, | ||||||||||||
2020 | 2019 | 2018 | ||||||||||
Operating activities: | (In thousands) | |||||||||||
Net income | $ | $ | $ | |||||||||
Adjustments to reconcile net income to net cash provided by (used for) operating activities: | ||||||||||||
Depreciation and amortization | ||||||||||||
Deferred income taxes and related valuation allowance | ( | ) | ||||||||||
Net loss (gain) on sale of real estate, investments and other | ( | ) | ||||||||||
Cost of debt repricing/refinancing | ||||||||||||
Net loss on sales of businesses, including impairment | ||||||||||||
Amortization of deferred financing costs | ||||||||||||
Stock-based compensation | ||||||||||||
Non-cash lease expense | ||||||||||||
Changes in operating assets and liabilities, net of effects of business acquisitions and divestitures: | ||||||||||||
Trade accounts receivable | ( | ) | ( | ) | ||||||||
Inventories | ( | ) | ( | ) | ||||||||
Prepaid expenses and other | ( | ) | ( | ) | ||||||||
Other assets | ||||||||||||
Trade accounts payable | ||||||||||||
Accrued liabilities | ( | ) | ||||||||||
Non-current liabilities | ( | ) | ( | ) | ( | ) | ||||||
Net cash provided by (used for) operating activities | ||||||||||||
Investing activities: | ||||||||||||
Proceeds from sales of marketable securities | ||||||||||||
Purchases of marketable securities | ( | ) | ( | ) | ( | ) | ||||||
Capital expenditures | ( | ) | ( | ) | ( | ) | ||||||
Proceeds from sale of equipment and real estate | ||||||||||||
Net (payments) proceeds from the sales of businesses | ( | ) | ||||||||||
Net payment to former STAHL owner | ( | ) | ||||||||||
Payment of restricted cash to former owner | ( | ) | ( | ) | ||||||||
Cash paid for equity investment | ( | ) | ||||||||||
Net cash provided by (used for) investing activities | ( | ) | ( | ) | ||||||||
Financing activities: | ||||||||||||
Proceeds from issuance of common stock | ||||||||||||
Payment of dividends | ( | ) | ( | ) | ( | ) | ||||||
Repayment of debt | ( | ) | ( | ) | ( | ) | ||||||
Fees related to debt repricing/refinancing and equity offerings | ( | ) | ||||||||||
Other | ( | ) | ( | ) | ( | ) | ||||||
Net cash provided by (used for) financing activities | ( | ) | ( | ) | ( | ) | ||||||
Effect of exchange rate changes on cash | ( | ) | ( | ) | ||||||||
Net change in cash and cash equivalents | ( | ) | ||||||||||
Cash, cash equivalents, and restricted cash at beginning of year | ||||||||||||
Cash, cash equivalents, and restricted cash at end of year | $ | $ | $ | |||||||||
Supplementary cash flows data: | ||||||||||||
Interest paid | $ | $ | $ | |||||||||
Income taxes paid, net of refunds | $ | $ | $ | |||||||||
Property, plant and equipment purchases included in trade accounts payable | $ | $ | $ | |||||||||
Restricted cash presented in Other assets | $ | $ | $ | |||||||||
See accompanying notes.
41
COLUMBUS McKINNON CORPORATION
NOTES TO CONSOLIDATED FINANCIAL STATEMENTS
(tabular amounts in thousands, except share data)
1. Description of Business
Columbus McKinnon Corporation ("the Company") is a leading worldwide designer, manufacturer, and marketer of hoists, actuators, rigging tools, digital power control systems, motion control products, and other technologies, systems, and services that efficiently and ergonomically move, lift, position, and secure materials. Key products include hoists, rigging tools, digital power control systems, actuators, elevator application drive systems, and explosion-protected hoists. The Company is focused on commercial and industrial applications that require safety and productivity in moving material. The Company’s targeted market verticals include general industrial, construction and infrastructure, mining, oil & gas, energy, aerospace, transportation, automotive, heavy equipment manufacturing, and entertainment.
The Company’s material handling products are sold globally, principally to third party distributors through diverse distribution channels and, to a lesser extent, directly to end-users. During fiscal 2020, approximately 55 % of sales were to customers in the United States.
2. Accounting Principles and Practices
Advertising
Cash and Cash Equivalents
The Company considers as cash equivalents all highly liquid investments with an original maturity of three months or less.
Concentrations of Labor
Approximately 8 % of the Company’s employees are represented by three separate U.S. collective bargaining agreements which expire April 2021, May 2021, and September 2021.
Consolidation
These consolidated financial statements include the accounts of the Company and its global subsidiaries; all significant intercompany accounts and transactions have been eliminated.
Equity Method Investment
The Company has an investment in Eastern Morris Cranes Company Limited ("EMC") whose principal activity is to manufacture various electrical overhead traveling cranes. This investment represents a minority ownership interest that is accounted for under the equity method of accounting since the Company has significant influence over the investee. As a result, the Company records its portion of the gains and losses incurred by this entity in Investment (income) loss in the Consolidated Statements of Operations.
Foreign Currency Translations
The Company translates foreign currency financial statements as described in Financial Accounting Standards Board ("FASB") Accounting Standards Codification ("ASC") Topic 830, “Foreign Currency Matters.” Under this method, all items of income and expense are translated to U.S. dollars at average exchange rates during the year. All assets and liabilities are translated to U.S. dollars at the year-end exchange rate. Gains or losses on translations are recorded in accumulated other comprehensive loss in the shareholders’ equity section of the balance sheet. The functional currency is the foreign currency in which the foreign subsidiaries conduct their business. Gains and losses from foreign currency transactions are reported in foreign currency exchange loss (gain).
42
COLUMBUS McKINNON CORPORATION
NOTES TO CONSOLIDATED FINANCIAL STATEMENTS - (Continued)
(tabular amounts in thousands, except share data)
Goodwill
Goodwill is not amortized but is tested for impairment at least annually, or more frequently if indicators of impairment exist, in accordance with the provisions of ASC Topic 350-20-35-1. Goodwill impairment is deemed to exist if the net book value of a reporting unit exceeds its estimated fair value. The fair value of a reporting unit is determined using a discounted cash flow methodology. The Company’s reporting units are determined based upon whether discrete financial information is available and reviewed regularly, whether those units constitute a business, and the extent of economic similarities and interdependencies between those reporting units for purposes of aggregation. The Company’s reporting units identified under ASC Topic 350-20-35-33 are at the component level, or one level below the reporting segment level as defined under ASC Topic 280-10-50-10 “Segment Reporting – Disclosure.” As of March 31, 2020, the Company’s one segment is subdivided into two reporting units. Further, the Company adopted ASU No. 2017-04, "Simplifying the Test for Goodwill Impairment (Topic 350)," in fiscal 2018, therefore, is no longer required to compare the implied fair value of goodwill with its carrying value amount as part of step two of the goodwill test. An impairment charge is the amount by which the carrying value is greater than the reporting unit's fair value.
When the Company evaluates the potential for goodwill impairment, it assesses a range of qualitative factors including, but not limited to, macroeconomic conditions, industry conditions, the competitive environment, changes in the market for its products and services, regulatory and political developments, entity specific factors such as strategy and changes in key personnel, and overall financial performance. If, after completing this assessment, it is determined that it is more likely than not that the fair value of a reporting unit is less than its carrying value or if economic or other business factors indicate that the fair value of our reporting units may have declined since our last quantitative test, the Company performs a quantitative test.
To perform the quantitative impairment test, the Company uses the discounted cash flow method and a market-based valuation model to estimate the fair value of the reporting units. The discounted cash flow method incorporates various assumptions, the most significant being projected revenue growth rates, operating profit margins and cash flows, the terminal growth rate, and the discount rate. The Company projects revenue growth rates, operating margins and cash flows based on each reporting unit's current business, expected developments, and operational strategies over a five-year period. In estimating the terminal growth rates, the Company considers its historical and projected results, as well as the economic environment in which its reporting units operate. The discount rates utilized for each reporting unit reflect the Company's assumptions of marketplace participants' cost of capital and risk assumptions, both specific to the reporting unit and overall in the economy.
The Company performed its qualitative assessment as of February 29, 2020 and determined that the quantitative goodwill impairment test was required for both the Rest of Products reporting unit and the Duff-Norton reporting unit due to economic conditions at the time of the analysis. Based on results of the quantitative impairment test for the both reporting units, the Company determined the fair value was not less than its carrying value. Refer to Note 5 for valuation techniques and significant inputs and Note 9 for further details.
Impairment of Long-Lived Assets
The Company assesses impairment of its long-lived assets in accordance with the provisions of ASC Topic 360 “Property, Plant, and Equipment.” This statement requires long-lived assets, such as property and equipment and purchased intangibles subject to amortization, to be reviewed for impairment whenever events or changes in circumstances indicate that the carrying amount of an asset group may not be recoverable. Recoverability of assets to be held and used is measured by a comparison of the carrying amount of an asset group to estimated undiscounted future cash flows expected to be generated by the asset group over its remaining useful life. If the carrying amount of an asset group exceeds its estimated future cash flows, an impairment charge is recognized equal to the amount by which the carrying amount of the asset group exceeds the fair value of the asset group. The fair values are determined in accordance with ASC 820.
In assessing long-lived assets for an impairment loss, assets are grouped with other assets and liabilities at the lowest level for which identifiable cash flows are largely independent of the cash flows of other assets and liabilities. Asset grouping requires a significant amount of judgment. Accordingly, facts and circumstances will influence how asset groups are determined for impairment testing. In assessing long-lived assets for impairment, management considered the Company’s product line portfolio, customers and related commercial agreements, labor agreements and other factors in grouping assets and liabilities at the lowest level for which identifiable cash flows are independent. The Company considers projected future undiscounted cash flows, trends and other factors in its assessment of whether impairment conditions exist. While the Company believes that its estimates of future cash flows are reasonable, different assumptions regarding such factors as future production volumes, customer pricing, economics,
43
COLUMBUS McKINNON CORPORATION
NOTES TO CONSOLIDATED FINANCIAL STATEMENTS - (Continued)
(tabular amounts in thousands, except share data)
and productivity and cost initiatives, could significantly affect its estimates. In determining fair value of long-lived assets, management uses management estimates, discounted cash flow calculations, and appraisals where necessary. There were no impairments recorded related to long-lived assets in the current year.
Intangible Assets
At acquisition, the Company estimates and records the fair value of purchased intangible assets which primarily consist of trade names, customer relationships, and technology. The fair values are estimated based on management’s assessment as well as independent third party appraisals. Such valuations may include a discounted cash flow of anticipated revenues resulting from the acquired intangible asset.
Amortization of intangible assets with finite lives is recognized over their estimated useful lives using an amortization method that reflects the pattern in which the economic benefits of the intangible assets are consumed or otherwise realized. The straight line method is used for customer relationships. As a result of the negligible attrition rate in our customer base, the difference between the straight line method and attrition method is not considered significant. The estimated useful lives for our intangible assets range from 1 to 25 years.
Inventories
Inventories are valued at the lower of cost and net realizable value. Cost of approximately 36 % of inventories at March 31, 2020 and March 31, 2019 have been determined using the LIFO (last-in, first-out) method. Costs of other inventories have been determined using the FIFO (first-in, first-out) or average cost method. FIFO cost approximates replacement cost. Costs in inventory include components for direct labor and overhead costs.
Marketable Securities
The Company’s marketable securities, which consist of equity and fixed income securities, are recorded at fair value. Under ASU 2016-01 all equity investments (including certain fixed income securities) in unconsolidated entities are measured at fair value through earnings. Therefore, gains and losses on marketable securities are realized within Investment (income) loss on the Consolidated Statements of Operations. Estimated fair value is based on published trading values at the balance sheet dates. The cost of securities sold is based on the specific identification method. Interest and dividend income are also included in Investment (income) loss on the Consolidated Statements of Operations.
The marketable securities are carried as long-term assets since they are held for the settlement of the Company’s general and products liability insurance claims filed through CM Insurance Company, Inc., a wholly owned captive insurance subsidiary. The marketable securities are not available for general working capital purposes.
Property, Plant, and Equipment
44
COLUMBUS McKINNON CORPORATION
NOTES TO CONSOLIDATED FINANCIAL STATEMENTS - (Continued)
(tabular amounts in thousands, except share data)
Property, plant, and equipment are stated at cost and depreciated principally using the straight-line method over their respective estimated useful lives (buildings and building equipment—15 to 40 years; machinery and equipment—3 to 18 years). When depreciable assets are retired, or otherwise disposed of, the cost and related accumulated depreciation are removed from the accounts and any resulting gain or loss is reflected in operating results.
Research and Development
With the acquisitions of Magnetek in September 2015 and STAHL CraneSystems (“STAHL”) in January 2017, research and development ("R&D") costs factor more prominently into the Company's cost structure. Therefore, R&D costs are presented on the Consolidated Statement of Operations in order to provide transparency into these costs. Consistent with prior periods, the Company continues to account for R&D expenses in accordance with the provisions of ASC 730 and are expensed as incurred.
Revenue Recognition, Accounts Receivable, and Concentration of Credit Risk
The Company adopted ASC 606, "Revenue from Contracts with Customers," in fiscal 2019. Revenue from contracts with customers for standard products is recognized when legal title and significant risk and rewards has transferred to the customer, which is generally at the time of shipment. This is the point in time when control is deemed to transfer to the customer. The Company also sells custom engineered products and services which are contracts that are typically completed within one quarter but can extend beyond one year in duration. The Company generally recognizes revenue for customer engineered products upon satisfaction of its performance obligation under the contract which typically coincides with project completion which is when the products and services are controlled by the customer. Control is typically achieved at the later of when legal title and significant risk and rewards have transferred to the customer or the customer has accepted the asset. For both standard products and custom engineered products, the transaction price is based upon the price stated in either the purchase order or contract. Refer to Note 4 for further details.
Shipping and Handling Costs
Shipping and handling costs are a component of cost of products sold.
Stock-Based Compensation
The Company records stock-based compensation in accordance with ASC Topic 718, “Compensation – Stock Compensation.” This standard requires all equity-based payments to employees, including grants of employee stock options, to be recognized in the Consolidated Statements of Operations based on the grant date fair value of the award. Stock compensation expense is included in Cost of products sold, Selling, and General and administrative expense depending on the nature of the service of the employee receiving the award. The Company uses a straight-line method of attributing the value of stock compensation expense, subject to minimum levels of expense, based on vesting. See Note 15 for further discussion of stock-based compensation.
Leases
45
COLUMBUS McKINNON CORPORATION
NOTES TO CONSOLIDATED FINANCIAL STATEMENTS - (Continued)
(tabular amounts in thousands, except share data)
Use of Estimates
The preparation of financial statements in conformity with U.S. generally accepted accounting principles requires management to make estimates and assumptions that affect the amounts reported in the financial statements and accompanying notes. Actual results could differ from those estimates.
Warranties
The Company offers warranties for certain products it sells. The specific terms and conditions of those warranties vary depending upon the product sold and the country in which the Company sold the product. As noted in the Revenue Recognition note (Note 4), the Company offers standard warranties which are typically 12 months in duration for standard products and 24 to 36 months for custom engineered products. These are assurance-type warranties that do not qualify as separate performance obligations under ASC 606. The Company estimates the costs that may be incurred under its standard warranties, based largely upon actual warranty repair costs history, and records a liability in the amount of such costs in the month that revenue is recognized. The resulting accrual balance is reviewed during the year. Factors that affect the Company’s warranty liability include the number of units sold, historical and anticipated rate of warranty claims, and cost per claim. Changes in the Company’s product warranty accrual are as follows:
March 31, | ||||||||
2020 | 2019 | |||||||
Balance at beginning of year | $ | $ | ||||||
Accrual for warranties issued | ||||||||
Warranties settled | ( | ) | ( | ) | ||||
Warranties on Sold Businesses (Note 3) | ( | ) | ||||||
Foreign currency translation | ( | ) | ||||||
Balance at end of year | $ | $ | ||||||
3. Disposals
As part of our business strategy, Blueprint for Growth, in the first quarter of fiscal 2019 the Company started the process to sell its Tire Shredder business, its crane builder business, Crane Equipment and Service Inc., and Stahlhammer Bommern GmbH, its European forging business acquired in 2014 (the "Sold Businesses") as they were no longer considered part of the core business or a strategic fit with the Company's long-term growth and operational objectives. On December 28, 2018, the Company sold its Tire Shredder business and recognized a gain. On February 28, 2019, the Company sold the remaining two businesses, Crane Equipment and Service Inc. and Stahlhammer Bommern GmbH, and recognized a loss. As such, there are no remaining businesses which meet the criteria as being held for sale in accordance with ASC 360-10-45-9, "Property, Plant, and Equipment." The businesses were not deemed a strategic shift or significant to be considered discontinued operations.
When businesses or asset groups meet the criteria as held for sale, they are recorded at the lesser of their carrying value or fair value less cost to sell. The Company recognized a gain on the sale of its Tire Shredder business in the amount of $1,059,000 during the twelve months ending March 31, 2019, a $44,000 decrease from the third quarter as a result of a final working capital adjustment. The Company recognized a loss on Crane Equipment and Service Inc., and Stahlhammer Bommern GmbH in the amount of $26,731,000 during the twelve months ended March 31, 2019, which is $1,022,000 less than the third quarter estimate primarily as a result of an increase in the previously estimated selling price for one of the businesses. The recognized loss of $26,731,000 recognized during fiscal 2019 includes an impairment loss on the Sold Businesses in the amount of $27,753,000 which was recorded through December 31, 2018. The impairment loss included a $6,174,000 reduction to goodwill, a $1,872,000 reduction to other intangible assets, a $12,830,000 reduction to property, plant, and equipment, and a $6,877,000 reduction to inventory. Both the gain and loss on sale of business were recorded in Net loss on sales of businesses, including impairment on the Consolidated Statements of Operations and was determined based on the selling price less carrying value, described further in Note 5. Additionally, net sales and pre-tax income (loss) before recognized gain or loss on sales for the three Sold Businesses was $34,195,000 and $3,623,000 for the twelve months ended March 31, 2019 and $38,299,000 and $1,373,000 for the twelve months ended March 31, 2018, respectively. In the twelve months ending March 31, 2020, the Company recognized an additional loss of $176,000 as a result of a final working capital adjustment.
46
COLUMBUS McKINNON CORPORATION
NOTES TO CONSOLIDATED FINANCIAL STATEMENTS - (Continued)
(tabular amounts in thousands, except share data)
As part of its business strategy, the Company is consolidating its manufacturing footprint. The Company previously announced in fiscal 2019 the closure of its Salem, Ohio facility. In fiscal 2020 the Company announced that it plans to consolidate its hoist manufacturing facility in Lisbon, Ohio with its Wadesboro, North Carolina and Damascus, Virginia facilities in fiscal 2021. The Salem, Ohio facility consolidation was completed during the first quarter of fiscal 2020. In total $2,958,000 and $1,473,000 are included in Cost of products sold on the Consolidated Statements of Operations during the twelve months ended March 31, 2020 and 2019, respectively, related to the consolidation of the Lisbon and Salem facilities. Costs incurred include accelerated depreciation, accelerated lease costs, severance and other payroll related costs, and a potential refund of a previously recorded tax credit which may need to be refunded to the state.
4. Revenue Recognition
The core principle under ASC 606 is for revenue to be recognized when a customer obtains control of promised goods or services in an amount that reflects the consideration we expect to receive in exchange for those goods or services. To achieve this core principle, the Company applies the following five steps:
1) Identifying contracts with customers
A contract with a customer exists when (i) the Company enters into an enforceable contract with a customer that defines each party’s rights regarding the goods or services to be transferred and identifies the related payment terms, (ii) the contract has commercial substance, and (iii) the Company determines that collection of substantially all consideration for goods and services that are transferred is probable based on the customer’s intent and ability to pay the promised consideration.
2) Identify the performance obligations in the contract
Performance obligations promised in a contract are identified based on the products and services that will be transferred to the customer that are both capable of being distinct, whereby the customer can benefit from the good or service either on its own or together with other available resources, and are distinct in the context of the contract, whereby the transfer of the good or service is separately identifiable from other promises in the contract. To the extent a contract includes multiple promised goods and services, the Company must apply judgment to determine whether promised goods and services are capable of being distinct and distinct in the context of the contract. If these criteria are not met, the promised goods and services are accounted for as a combined performance obligation.
3) Determine the transaction price
The transaction price is determined based on the consideration to which the Company will be entitled in exchange for transferring products and services to the customer. To the extent the transaction price includes variable consideration, the Company estimates the amount of variable consideration that should be included in the transaction price utilizing either the expected value method or the most likely amount method depending on the nature of the variable consideration. Variable consideration is included in the transaction price if, in the Company’s judgment, it is probable that a significant future reversal of cumulative revenue under the contract will not occur. Any estimates, including the effect of the constraint on variable consideration, are evaluated at each reporting period for any changes. In applying this guidance, the Company also considers whether any significant financing components exist.
4) Allocate the transaction price to the performance obligations in the contract
If the contract contains a single performance obligation, the entire transaction price is allocated to the single performance obligation. Contracts that contain multiple performance obligations require an allocation of the transaction price to each performance obligation on a relative standalone selling price basis unless the transaction price is variable and meets the criteria to be allocated entirely to a performance obligation or to a distinct service that forms part of a single performance obligation.
47
COLUMBUS McKINNON CORPORATION
NOTES TO CONSOLIDATED FINANCIAL STATEMENTS - (Continued)
(tabular amounts in thousands, except share data)
5) Recognize revenue when or as the Company satisfies a performance obligation
The Company determines whether it satisfies performance obligations either over time or at a point in time. Revenue is recognized over time if either 1) the customer simultaneously receives and consumes the benefits provided by the entity’s performance, 2) the entity’s performance creates or enhances an asset that the customer controls as the asset is created or enhanced, or 3) the entity’s performance does not create an asset with an alternative use to the entity and the entity has an enforceable right to payment for performance completed to date. If the entity does not satisfy a performance obligation over time, the related performance obligation is satisfied at a point in time by transferring the control of a promised good or service to a customer. Examples of control are using the asset to produce goods or services, enhancing the value of other assets, settling liabilities, and holding or selling the asset. For over time recognition, ASC 606 requires the Company to select a single revenue recognition method for the performance obligation that faithfully depicts the Company’s performance in transferring control of the goods and services. The guidance allows entities to choose between either an input method or an output method to measure progress toward complete satisfaction of a performance obligation.
Performance obligations
The Company has contracts with customers for standard products and custom engineered products and determines when and how to recognize revenue for each performance obligation based on the nature and type of contract following the five steps above.
Revenue from contracts with customers for standard products is recognized when legal title and significant risk and rewards has transferred to the customer, which is generally at the time of shipment. This is the point in time when control is deemed to transfer to the customer. The Company sells standard products to customers utilizing purchase orders. Payment terms for these types of contracts generally require payment within 30-60 days. Each standard product is deemed to be a single performance obligation and the amount of revenue recognized is based on the negotiated price. The transaction price for standard products is based on the price reflected in each purchase order. Sales incentives are offered to customers who purchase standard products and include offers such as volume-based discounts, rebates for priority customers, and discounts for early cash payments. These sales incentives are accounted for as variable consideration included in the transaction price. Accordingly, the Company reduces revenue for these incentives in the period which the sale occurs and is based on the most likely amount method for estimating the amount of consideration the Company expects to receive. These sales incentive estimates are updated each reporting information as additional information becomes available.
The Company also sells custom engineered products and services which are contracts that are typically completed within one quarter but can extend beyond one year in duration. For custom engineered products, the transaction price is based upon the price stated in the contract. Variable consideration has not been identified as a significant component of transaction price for custom engineered products and services. The Company generally recognizes revenue for custom engineered products upon satisfaction of its performance obligation under the contract which typically coincides with project completion which is when the products and services are controlled by the customer. Control is typically achieved at the later of when legal title and significant risk and rewards have transferred to the customer or the customer has accepted the asset. These contracts often require either up front or installment payments. These types of contracts are generally accounted for as one performance obligation as the products and services are not separately identifiable. The promised services (such as inspection, commissioning, and installation) are essential in order for the delivered product to operate as intended on the customer’s site and the services are therefore highly interrelated with product functionality.
For most custom engineered products contracts, the Company determined that while there is no alternative use for the custom engineered products, the Company does not have an enforceable right to payment (which must include a reasonable profit margin) for performance completed to date in order to meet the over time revenue recognition criteria. Therefore, revenue is recognized at a point in time (when the contract is complete). For custom engineered products contracts that contain an enforceable right to payment (including reasonable profit margin) the Company satisfies the performance obligation over time and recognizes revenue based on the extent of progress towards completion of the performance obligation. The cost-to-cost measure of progress is an appropriate measure of progress toward satisfaction of performance obligations as this measure most accurately depicts the progress of work performed and transfer of control to the customers. Under the cost-to-cost measure of progress, the extent of progress toward completion is measured based on the ratio of costs incurred to date to the total estimated costs at completion of the performance obligation. Revenues are recognized proportionally as costs are incurred.
48
COLUMBUS McKINNON CORPORATION
NOTES TO CONSOLIDATED FINANCIAL STATEMENTS - (Continued)
(tabular amounts in thousands, except share data)
Sales and other taxes collected with revenue are excluded from revenue, consistent with the previous revenue standard. Shipping and handling costs incurred prior to shipment are considered activities required to fulfill the Company’s promise to transfer goods, and do not qualify as a separate performance obligation. Additionally, the Company offers standard warranties which are typically 12 months in duration for standard products and 24 to 36 months for custom engineered products. These types of warranties are included in the purchase price of the product and are deemed to be assurance-type warranties which are not accounted for as a separate performance obligation. Other performance obligations included in a contract (such as drawings, owner’s manuals, and training services) are immaterial in the context of the contract and are not recognized as a separate performance obligation.
Reconciliation of contract balances
The Company records a contract liability when cash is received prior to recording revenue. Some standard contracts require a down payment while most custom engineered contracts require installment payments. Installment payments for the custom engineered contracts typically require a portion due at inception while the remaining payments are due upon completion of certain performance milestones. For both types of contracts, these contract liabilities, referred to as customer advances, are recorded at the time payment is received and are included in Accrued liabilities on the Consolidated Balance Sheets. When the related performance obligation is satisfied, the contract liability is released into revenue.
The following table illustrates the balance and related activity for customer advances in fiscal 2020 and 2019 (in thousands):
Customer advances (contract liabilities) | |||||||
March 31, | |||||||
2020 | 2019 | ||||||
Beginning balance | $ | $ | |||||
Additional customer advances received | |||||||
Revenue recognized from customer advances included in the beginning balance | ( | ) | ( | ) | |||
Other revenue recognized from customer advances | ( | ) | ( | ) | |||
Customer deposits on Sold Businesses (Note 3) | — | ( | ) | ||||
Other (1) | ( | ) | ( | ) | |||
Ending balance | $ | $ | |||||
(1) Other includes the impact of foreign currency translation
During the twelve months ended March 31, 2020, revenue was recognized prior to the right to invoice the customer which resulted in a contract asset balance in the amount of $2,361,000 as of March 31, 2020. Contract assets are included in Prepaid expenses and other assets on the Consolidated Balance Sheets. Contract assets were not material as of March 31, 2019.
Disaggregated revenue
In accordance with ASC 606, the Company is required to disaggregate revenue into categories that depict how economic factors affect the nature, amount, timing and uncertainty of revenue and cash flows. The following table illustrates the disaggregation of revenue by product grouping for the year ending March 31, 2020 (in thousands):
Twelve Months Ended | Twelve Months Ended | |||||
Net Sales by Product Grouping | March 31, 2020 | March 31, 2019 | ||||
Industrial Products | $ | $ | ||||
Crane Solutions | ||||||
Engineered Products | ||||||
All other | ||||||
Total | $ | $ | ||||
49
COLUMBUS McKINNON CORPORATION
NOTES TO CONSOLIDATED FINANCIAL STATEMENTS - (Continued)
(tabular amounts in thousands, except share data)
Industrial products include: manual chain hoists, electrical chain hoists, rigging/ clamps, industrial winches, hooks, shackles, and other forged attachments. Crane solutions products include: wire rope hoists, drives and controls, crane kits and components, and workstations. Engineered products include: linear and mechanical actuators, lifting tables, rail projects, and actuations systems. The All other product grouping includes miscellaneous revenue and the businesses divested in fiscal 2019. The prior year net sales have been reclassified to be consistent with the current period presentation.
Practical expedients
Incremental costs to obtain a contract incurred by the Company primarily relate to sales commissions for contracts with a duration of one year or less. Therefore, these costs are expensed as incurred and are recorded in Selling Expenses on the Consolidated Statements of Operations.
Unsatisfied performance obligations for contracts with an expected length of one year or less are not disclosed. Further, revenue from contracts with customers do not include a significant financing component as payment is generally expected within one year from when the performance obligation is controlled by the customer.
5. Fair Value Measurements
ASC Topic 820 “Fair Value Measurements and Disclosures” establishes the standards for reporting financial assets and liabilities and nonfinancial assets and liabilities that are recognized or disclosed at fair value on a recurring basis (at least annually). Under these standards, fair value is defined as the price that would be received to sell an asset or paid to transfer a liability (i.e. the "exit price") in an orderly transaction between market participants at the measurement date.
ASC Topic 820-10-35-37 establishes a hierarchy for inputs used in measuring fair value that maximizes the use of observable inputs and minimizes the use of unobservable inputs by requiring that the most observable inputs be used when available. Observable inputs are inputs that market participants would use in pricing the asset or liability developed based on market data obtained from sources independent of the Company. Unobservable inputs are inputs that reflect the Company's assumptions about the valuation techniques that market participants would use in pricing the asset or liability developed based on the best information available in the circumstances. The hierarchy is separated into three levels based on the reliability of inputs as follows:
Level 1 - Valuations based on quoted prices in active markets for identical assets or liabilities that the Company has the ability to access. Since valuations are based on quoted prices that are readily and regularly available in an active market, valuation of these products does not entail a significant degree of judgment.
Level 2 - Valuations based on quoted prices in markets that are not active or for which all significant inputs are observable, either directly or indirectly, involving some degree of judgment.
Level 3 - Valuations based on inputs that are unobservable and significant to the overall fair value measurement. The degree of judgment exercised in determining fair value is greatest for instruments categorized in Level 3.
The availability of observable inputs can vary and is affected by a wide variety of factors, including the type of asset/liability, whether the asset/liability is established in the marketplace, and other characteristics particular to the transaction. To the extent that valuation is based on models or inputs that are less observable or unobservable in the market, the determination of fair value requires more judgment. In certain cases, the inputs used to measure fair value may fall into different levels of the fair value
50
COLUMBUS McKINNON CORPORATION
NOTES TO CONSOLIDATED FINANCIAL STATEMENTS - (Continued)
(tabular amounts in thousands, except share data)
hierarchy. In such cases, for disclosure purposes the level in the fair value hierarchy within which the fair value measurement in its entirety falls is determined based on the lowest level input that is significant to the fair value measurement in its entirety.
Fair value is a market-based measure considered from the perspective of a market participant rather than an entity-specific measure. Therefore, even when market assumptions are not readily available, assumptions are required to reflect those that market participants would use in pricing the asset or liability at the measurement date.
The Company primarily uses readily observable market data in conjunction with internally developed discounted cash flow valuation models when valuing its derivative portfolio and, consequently, the fair value of the Company’s derivatives is based on Level 2 inputs. The carrying amount of the Company's annuity contract is recorded at net asset value of the contract and, consequently, its fair value is based on Level 2 inputs and is included in other assets on the Company's Consolidated Balance Sheet. The Company uses quoted prices in an inactive market when valuing its term loan and, consequently, the fair value is based on Level 2 inputs.
The following table provides information regarding financial assets and liabilities measured or disclosed at fair value on a recurring basis:
Fair value measurements at reporting date using | ||||||||||||||||
Quoted prices in active markets for identical assets | Significant other observable inputs | Significant unobservable inputs | ||||||||||||||
Description | At March 31, 2020 | (Level 1) | (Level 2) | (Level 3) | ||||||||||||
Assets/(Liabilities) Measured at fair value: | ||||||||||||||||
Marketable securities | $ | $ | $ | $ | ||||||||||||
Annuity contract | ||||||||||||||||
Derivative assets (liabilities): | ||||||||||||||||
Foreign exchange contracts | ||||||||||||||||
Interest rate swap liability | ( | ) | ( | ) | ||||||||||||
Cross currency swap liability | ( | ) | ( | ) | ||||||||||||
Cross currency swap asset | ||||||||||||||||
Disclosed at fair value: | ||||||||||||||||
Term loan | $ | ( | ) | $ | $ | ( | ) | $ | ||||||||
51
COLUMBUS McKINNON CORPORATION
NOTES TO CONSOLIDATED FINANCIAL STATEMENTS - (Continued)
(tabular amounts in thousands, except share data)
Fair value measurements at reporting date using | ||||||||||||||||
Quoted prices in active markets for identical assets | Significant other observable inputs | Significant unobservable inputs | ||||||||||||||
Description | At March 31, 2019 | (Level 1) | (Level 2) | (Level 3) | ||||||||||||
Assets/(Liabilities) Measured at fair value: | ||||||||||||||||
Marketable securities | $ | $ | $ | — | $ | — | ||||||||||
Annuity contract | ||||||||||||||||
Derivative assets (liabilities): | ||||||||||||||||
Foreign exchange contracts | ( | ) | ( | ) | ||||||||||||
Interest rate swap asset | ||||||||||||||||
Cross currency swap liability | ( | ) | ( | ) | ||||||||||||
Cross currency swap asset | ||||||||||||||||
Disclosed at fair value: | ||||||||||||||||
Term loan | $ | ( | ) | $ | $ | ( | ) | $ | ||||||||
The Company did not have any non-financial assets and liabilities that are recognized at fair value on a recurring basis.
At March 31, 2020, the term loan and revolving credit facility have been recorded at carrying value which approximates fair value.
Market gains, interest, and dividend income on marketable securities are recorded in investment (income) loss. Changes in the fair value of derivatives are recorded in foreign currency exchange (gain) loss or other comprehensive income (loss), to the extent that the derivative qualifies as a hedge under the provisions of ASC Topic 815. Interest and dividend income on marketable securities are measured based upon amounts earned on their respective declaration dates.
Fiscal 2020 Non-Recurring Measurements
The fair value of the net assets of the Company’s Rest of Products and Duff-Norton reporting units were calculated on a non-recurring basis. These measurements have been used to test goodwill for impairment on an annual basis under the provisions of ASC Topic 350-20-35-1 “Intangibles, Goodwill and Other – Goodwill Subsequent Measurement.”
The fiscal 2020 goodwill impairment test consisted of determining the fair values of the Rest of Products and Duff-Norton reporting units on a quantitative basis. The fair value for the Company’s reporting units cannot be determined using readily available quoted Level 1 inputs or Level 2 inputs that are observable in active markets. Therefore, the Company used a blended discounted cash flow and market-based valuation model to estimate the fair value using Level 3 inputs. To estimate the fair values of the Rest of Products and Duff-Norton reporting units, the Company used significant estimates and judgmental factors. The key estimates and factors used in the discounted cash flow valuation include revenue growth rates and profit margins based on internal forecasts, terminal value, and the weighted-average cost of capital used to discount future cash flows. The estimates used are disclosed below:
Rest of Products Reporting Unit | Duff-Norton Reporting Unit | |||
Compound annual growth rate | % | % | ||
Terminal value growth rate | % | % | ||
Weighted-average cost of capital | % | % | ||
We further test our indefinite-lived intangible asset balance of $46,670,000 consisting of trademarks on our recent acquisitions on an annual basis for impairment. The methodology used to value trademarks is the relief from royalty method. The recorded
52
COLUMBUS McKINNON CORPORATION
NOTES TO CONSOLIDATED FINANCIAL STATEMENTS - (Continued)
(tabular amounts in thousands, except share data)
book value of these trademarks in excess of the calculated fair value results in impairment. The key estimate used in this calculation consists of an overall royalty rate applied to the sales covered by the trademark. After performing this analysis, we determined that the fair value of these trademarks exceeded their book values, and as such, other impairment was recorded.
6. Inventories
Inventories consisted of the following:
March 31, | ||||||||
2020 | 2019 | |||||||
At cost—FIFO basis: | ||||||||
Raw materials | $ | $ | ||||||
Work-in-process | ||||||||
Finished goods | ||||||||
LIFO cost less than FIFO cost | ( | ) | ( | ) | ||||
Net inventories | $ | $ | ||||||
7. Marketable Securities and Other Investments
In accordance with ASU 2016-01 "Financial Instruments - Overall (Subtopic 825-10): Recognition and Measurement of Financial Assets and Financial Liabilities," adopted by the Company on April 1, 2018, all equity investments in unconsolidated entities (other than those accounted for using the equity method of accounts) are measured at fair value through earnings. The Company's marketable securities are recorded at their fair value, with unrealized changes in market value realized within Investment (income) loss on the Consolidated Statements of Operations. The Company adopted this standard on a modified retrospective basis. A cumulative effect adjustment of $888,000 was recorded on April 1, 2018 to the beginning balance of Retained Earnings with an offset to Accumulated Other Comprehensive Loss. The impact on earnings for unrealized gains and losses was a loss of $143,000 and $183,000 in the twelve months ended March 31, 2020 and March 31, 2019, respectively.
Consistent with prior periods, the estimated fair value is based on quoted prices at the balance sheet dates. The cost of securities is based on the specific identification method. Interest and dividend income are included in Investment (income) loss in the Consolidated Statements of Operations.
Marketable securities are carried as long-term assets since they are held for the settlement of the Company’s general and products liability insurance claims filed through CM Insurance Company, Inc. ("CMIC"), a wholly owned captive insurance subsidiary. The marketable securities are not available for general working capital purposes.
Net realized gains related to sales of marketable securities were $50,000 , $201,000 , and $0 in fiscal years 2020, 2019, and 2018, respectively, and are included in Investment (income) loss in the Consolidated Statements of Operations.
On December 21, 2017, the Company purchased a 49 % ownership interest in Eastern Morris Cranes Company Limited ("EMC"), a limited liability company organized and existing under the laws and regulations of the Kingdom of Saudi Arabia. The Company's ownership represents an equity investment in a strategic customer of STAHL serving the Kingdom of Saudi Arabia. The investment's carrying value is presented in Other assets in the Consolidated Balance Sheets in the amount of $3,402,000 and $3,602,000 as of March 31, 2020 and March 31, 2019, respectively, and has been accounted for as an equity method investment. The investment value was increased for the Company's ownership percentage of income earned by EMC in the amount of $778,000 and $449,000 in the twelve months ended March 31, 2020 and March 31, 2019, respectively, and is recorded in Investment (income) loss on the Consolidated Statement of Operations. Further, in the twelve months ended March 31, 2020, EMC distributed a cash dividend which the Company received 49 % of pursuant to its ownership interest. The investment value was decreased for the Company's
53
COLUMBUS McKINNON CORPORATION
NOTES TO CONSOLIDATED FINANCIAL STATEMENTS - (Continued)
(tabular amounts in thousands, except share data)
share of EMC's cash dividend in the amount of $924,000 in the twelve months ended March 31, 2020 as it was determined to be a return on the Company's investment. The dividend is included in operating activities on the Consolidated Statement of Cash Flows under the cumulative earnings approach. The March 31, 2020 and 2019 trade accounts receivable balances due from EMC are $4,166,000 and $2,986,000 , respectively, and are comprised of amounts due for the sale of goods and services in the ordinary course of business.
8. Property, Plant, and Equipment
Consolidated property, plant, and equipment of the Company consisted of the following:
March 31, | ||||||||
2020 | 2019 | |||||||
Land and land improvements | $ | $ | ||||||
Buildings | ||||||||
Machinery, equipment, and leasehold improvements | ||||||||
Construction in progress | ||||||||
Less accumulated depreciation | ||||||||
Net property, plant, and equipment | $ | $ | ||||||
Depreciation expense was $16,184,000 , $17,775,000 , and $20,584,000 for the years ended March 31, 2020, 2019, and 2018, respectively.
Gross property, plant, and equipment includes capitalized software costs of $37,864,000 and $37,832,000 at March 31, 2020 and 2019, respectively. Accumulated depreciation includes accumulated amortization on capitalized software costs of $22,962,000 and $20,225,000 at March 31, 2020 and 2019, respectively. Amortization expense on capitalized software costs was $2,937,000 , $3,045,000 , and $3,151,000 during the years ended March 31, 2020, 2019, and 2018, respectively.
9. Goodwill and Intangible Assets
As discussed in Note 2, goodwill is not amortized but is tested for impairment at least annually, in accordance with the provisions of ASC Topic 350-20-35-1. Goodwill impairment is deemed to exist if the net book value of a reporting unit exceeds its estimated fair value. The fair value of a reporting unit is determined using a discounted cash flow methodology. The Company’s reporting units are determined based upon whether discrete financial information is available and reviewed regularly, whether those units constitute a business, and the extent of economic similarities and interdependencies between those reporting units for purposes of aggregation. The Company’s reporting units identified under ASC Topic 350-20-35-33 are at the component level, or one level below the operating segment level as defined under ASC Topic 280-10-50-10 “Segment Reporting – Disclosure.” At March 31, 2018, the Company had four reporting units. Two of these reporting units were sold in connection with the Sold Businesses described in Note 3. As such, the Company has two reporting units as of March 31, 2020, both of which have goodwill. The Duff-Norton reporting unit (which designs, manufactures, and sources mechanical and electromechanical actuators and rotary unions) had goodwill of $9,593,000 and $9,611,000 at March 31, 2020 and 2019, respectively, and the Rest of Products reporting unit (representing the hoist, chain, and forgings, digital power control systems, and distribution businesses) had goodwill of $310,086,000 and $313,205,000 at March 31, 2020 and 2019, respectively.
Fiscal 2020 Annual Goodwill and Intangible Asset Impairment Test
When we evaluate the potential for goodwill impairment, we assess a range of qualitative factors including, but not limited to, macroeconomic conditions, industry conditions, the competitive environment, changes in the market for our products and services, regulatory and political developments, entity specific factors such as strategy and changes in key personnel, and overall financial performance. If, after completing this assessment, it is determined that it is more likely than not that the fair value of a reporting unit is less than its carrying value or if economic or other business factors indicate that the fair value of our reporting units may
54
COLUMBUS McKINNON CORPORATION
NOTES TO CONSOLIDATED FINANCIAL STATEMENTS - (Continued)
(tabular amounts in thousands, except share data)
have declined since our last quantitative test, we proceed to a quantitative impairment test. To perform the quantitative impairment test, the Company uses the discounted cash flow method to estimate the fair value of the reporting units. The discounted cash flow method incorporates various assumptions, the most significant being projected revenue growth rates, operating profit margins and cash flows, the terminal growth rate, and the discount rate. The Company projects revenue growth rates, operating margins and cash flows based on each reporting unit's current business, expected developments, and operational strategies over a five-year period. In estimating the terminal growth rates, the Company considers its historical and projected results, as well as the economic environment in which its reporting units operate. The discount rates utilized for each reporting unit reflect the Company's assumptions of marketplace participants' cost of capital and risk assumptions, both specific to the reporting unit and overall in the economy.
We performed the qualitative assessment as of February 29, 2020 and determined that the quantitative test should be performed for the Rest of Products and Duff-Norton reporting units due to volatility in our stock price and uncertainty in the global economic environment caused by COVID-19. We also performed sensitivities and other analysis and determined it is more likely than not that goodwill is not impaired as of March 31, 2020.
In accordance with ASC Topic 350-30-35, indefinite-lived intangible assets that are not subject to amortization shall be tested for impairment annually or more frequently if events or circumstances indicate that it is more likely than not that an asset is impaired. Similar to goodwill, we first assess various qualitative factors in the analysis. If, after completing this assessment, it is determined that it is more likely than not that the fair value of an indefinite-lived intangible asset is greater than its carrying value, we conclude that the indefinite-lived intangible asset is not impaired. If, after completing this assessment, it is determined that it is more likely than not that the fair value of an indefinite-lived intangible asset is less than its carrying value or if economic or other business factors indicate that the fair value of our indefinite-lived intangible assets may have declined since our last quantitative test, the Company performs a new quantitative test. The methodology used to value trademarks is the relief from royalty method. The recorded book value of these trademarks in excess of the calculated fair value triggers an impairment. The key estimate used in this calculation consists of an overall royalty rate applied to the sales covered by the trademark. After performing a qualitative assessment we determined that economic factors indicate that the fair value of our indefinite-lived intangible assets may have declined since our last quantitative test. We performed the quantitative test as of February 29, 2020 and determined that the trademarks were not impaired.
Fiscal 2019 Interim Goodwill Impairment Test
During the first quarter of fiscal 2019, the Company classified the assets and liabilities of certain businesses as held for sale. These businesses were sold later in the year which is described in Note 3. As a result of this classification, the Company determined an indicator of impairment existed and was required to perform an interim goodwill impairment test on the Rest of Products goodwill reporting unit. The net assets of the Rest of Products reporting unit were measured on a non-recurring basis in order to perform a quantitative goodwill impairment test. The interim quantitative goodwill impairment test for Rest of Products did not indicate that goodwill was impaired.
The held for sale classification described above further required the Company to assign a portion of goodwill to the business that was a part of the Rest of Products reporting unit being sold based on its relative fair value and to record the assets and liabilities of the businesses held for sale at the lower of their carrying amount or fair value less cost to sell. Based on this analysis, the Company recorded a $6,174,000 goodwill impairment charge at the time the businesses were classified as held for sale.
A summary of changes in goodwill during the years ended March 31, 2020 and 2019 is as follows:
Balance at April 1, 2018 | $ | ||
Interim Goodwill Impairment | $ | ( | ) |
Currency translation | ( | ) | |
Balance at March 31, 2019 | $ | ||
Currency translation | ( | ) | |
Balance at March 31, 2020 | $ | ||
55
COLUMBUS McKINNON CORPORATION
NOTES TO CONSOLIDATED FINANCIAL STATEMENTS - (Continued)
(tabular amounts in thousands, except share data)
Goodwill is recognized net of accumulated impairment losses of $113,174,000 as of both March 31, 2020 and 2019. There were no goodwill impairment losses recorded in fiscal 2020 and $6,174,000 and $0 recorded in 2019 and 2018, respectively. The goodwill impairment recorded in fiscal 2019 relates to the 2019 interim goodwill impairment test described above and in Note 5.
Identifiable intangible assets at March 31, 2020 are summarized as follows (in thousands):
Gross Carrying Amount | Accumulated Amortization | Net | ||||||||||
Trademark | $ | $ | ( | ) | $ | |||||||
Indefinite-lived trademark | — | |||||||||||
Customer relationships | ( | ) | ||||||||||
Acquired technology | ( | ) | ||||||||||
Other | ( | ) | ||||||||||
Balance at March 31, 2020 | $ | $ | ( | ) | $ | |||||||
Identifiable intangible assets at March 31, 2019 were as follows (in thousands):
Gross Carrying Amount | Accumulated Amortization | Net | ||||||||||
Trademark | $ | $ | ( | ) | $ | |||||||
Indefinite-lived trademark | — | |||||||||||
Customer relationships | ( | ) | ||||||||||
Acquired technology | ( | ) | ||||||||||
Other | ( | ) | ||||||||||
Balance at March 31, 2019 | $ | $ | ( | ) | $ | |||||||
Customer relationships with a gross carrying amount of $2,815,000 and accumulated amortization of $957,000 were written off during fiscal 2019, in connection with the loss on the Sold Businesses discussed in Note 3. Further, other intangible assets with a gross carrying amount of $226,000 and accumulated amortization of $211,000 were also written off during fiscal 2019 as a result of the loss on the Sold Businesses.
The Company’s intangible assets that are considered to have finite lives are amortized over the period in which the assets are expected to generate future cash flows. Identifiable intangible assets acquired in a business combination are amortized over their estimated useful lives. The weighted-average amortization periods are 15 years for trademarks, 18 years for customer relationships, 18 years for acquired technology, 5 years for other, and 18 years in total. Trademarks with a book value of $46,670,000 have an indefinite useful life and are therefore not being amortized.
10. Derivative Instruments
The Company uses derivative instruments to manage selected foreign currency and interest rate exposures. The Company does not use derivative instruments for speculative trading purposes. All derivative instruments must be recorded on the balance sheet at fair value. For derivatives designated as cash flow hedges, the effective portion of changes in the fair value of the derivative is recorded as accumulated other comprehensive gain (loss), or “AOCL,” and is reclassified to earnings when the underlying transaction has an impact on earnings. The ineffective portion of changes in the fair value of the foreign currency forward agreements is reported in foreign currency exchange loss (gain) in the Company’s consolidated statement of operations. The ineffective portion
56
COLUMBUS McKINNON CORPORATION
NOTES TO CONSOLIDATED FINANCIAL STATEMENTS - (Continued)
(tabular amounts in thousands, except share data)
of changes in the fair value of the interest rate swap agreements is reported in interest expense. For derivatives not designated as cash flow hedges, all changes in market value are recorded as a foreign currency exchange (gain) loss in the Company’s consolidated statements of operations. The cash flow effects of derivatives are reported within net cash provided by operating activities.
The Company is exposed to credit losses in the event of non-performance by the counterparties on its financial instruments. The counterparties have investment grade credit ratings. The Company anticipates that these counterparties will be able to fully satisfy their obligations under the contracts. The Company has derivative contracts with three counterparties as of March 31, 2020.
The Company's agreements with its counterparties contain provisions pursuant to which the Company could be declared in default of its derivative obligations. As of March 31, 2020, the Company had not posted any collateral related to these agreements. If the Company had breached any of these provisions as of March 31, 2020, it could have been required to settle its obligations under these agreements at amounts which approximate the March 31, 2020 fair values reflected in the table below. During the year ended March 31, 2020, the Company was not in default of any of its derivative obligations.
As of March 31, 2020 and 2019, the Company had no derivatives designated as net investments or fair value hedges in accordance with ASC Topic 815, “Derivatives and Hedging.”
The Company has a cross currency swap agreement that is designated as a cash flow hedge to hedge changes in the value of an intercompany loan to a foreign subsidiary due to changes in foreign exchange rates. This intercompany loan is related to the acquisition of STAHL. As of March 31, 2020, the notional amount of this derivatives was $181,390,000 , and the contract matures on January 31, 2022. From its March 31, 2020 balance of AOCL, the Company expects to reclassify approximately $1,312,000 out of AOCL, and into foreign currency exchange loss (gain), during the next 12 months based on the contractual payments due under this intercompany loan.
The Company has foreign currency forward agreements that are designated as cash flow hedges to hedge a portion of forecasted inventory purchases denominated in foreign currencies. The notional amount of those derivatives is $8,422,000 and all contracts mature by December 31, 2020. From its March 31, 2020 balance of AOCL, the Company expects to reclassify approximately $264,000 out of AOCL during the next 12 months based on the underlying transactions of the sales of the goods purchased.
The Company's policy is to maintain a capital structure that is comprised of 50-70% of fixed rate long-term debt and 30-50% of variable rate long-term debt. The Company has two interest rate swap agreements in which the Company receives interest at a variable rate and pays interest at a fixed rate. These interest rate swap agreements are designated as cash flow hedges to hedge changes in interest expense due to changes in the variable interest rate of the senior secured term loan. The amortizing interest rate swaps mature by December 31, 2023 and had a total notional amount of $158,490,000 as of March 31, 2020. The effective portion of the changes in fair values of the interest rate swaps is reported in AOCL and will be reclassified to interest expense over the life of the swap agreements. From its March 31, 2020 balance of AOCL, the Company expects to reclassify approximately $1,066,000 out of AOCL, and into interest expense, during the next 12 months.
57
COLUMBUS McKINNON CORPORATION
NOTES TO CONSOLIDATED FINANCIAL STATEMENTS - (Continued)
(tabular amounts in thousands, except share data)
The following is the effect of derivative instruments on the consolidated statements of operations for the years ended March 31, 2020, 2019, and 2018 (in thousands):
Derivatives Designated as Cash Flow Hedges | Type of Instrument | Amount of Gain or (Loss) Recognized in Other Comprehensive Income (Loss) on Derivatives (Effective Portion) | Location of Gain or (Loss) Recognized in Income on Derivatives | Amount of Gain or (Loss) Reclassified from AOCL into Income (Effective Portion) | |||||||
March 31, | |||||||||||
2020 | Foreign exchange contracts | $ | Cost of products sold | $ | |||||||
2020 | Interest rate swap | $ | ( | ) | Interest expense | $ | |||||
2020 | Cross currency swap | $ | Foreign currency exchange loss (gain) | $ | |||||||
2019 | Foreign exchange contracts | $ | ( | ) | Cost of products sold | $ | ( | ) | |||
2019 | Interest rate swap | $ | ( | ) | Interest expense | $ | |||||
2019 | Cross currency swap | $ | Foreign currency exchange loss (gain) | $ | |||||||
2018 | Foreign exchange contracts | $ | ( | ) | Cost of products sold | $ | ( | ) | |||
2018 | Interest rate swap | $ | Interest expense | $ | ( | ) | |||||
2018 | Cross currency swap | $ | ( | ) | Foreign currency exchange loss (gain) | $ | ( | ) | |||
Derivatives Not Designated as Hedging Instruments (Foreign Exchange Contracts) | Location of Gain or (Loss) Recognized in Income on Derivatives | Amount of Gain or (Loss) Recognized in Income on Derivatives | ||||
March 31, | ||||||
2020 | Foreign currency exchange loss (gain) | $ | ||||
2019 | Foreign currency exchange loss (gain) | $ | ||||
2018 | Foreign currency exchange loss (gain) | $ | ( | ) | ||
58
COLUMBUS McKINNON CORPORATION
NOTES TO CONSOLIDATED FINANCIAL STATEMENTS - (Continued)
(tabular amounts in thousands, except share data)
The following is information relative to the Company’s derivative instruments in the consolidated balance sheets as of March 31, 2020 and 2019 (in thousands):
Fair Value of Asset (Liability) March 31, | ||||||||||
Derivatives Designated as Hedging Instruments | Balance Sheet Location | 2020 | 2019 | |||||||
Foreign exchange contracts | Prepaid expenses and other | $ | $ | |||||||
Foreign exchange contracts | Accrued Liabilities | ( | ) | ( | ) | |||||
Interest rate swap | Prepaid expenses and other | |||||||||
Interest rate swap | Other Assets | |||||||||
Interest rate swap | Accrued Liabilities | ( | ) | |||||||
Interest rate swap | Other non current liabilities | ( | ) | |||||||
Cross currency swap | Prepaid expenses and other | |||||||||
Cross currency swap | Accrued liabilities | ( | ) | |||||||
Cross currency swap | Other non current liabilities | ( | ) | ( | ) | |||||
Fair Value of Asset (Liability) | ||||||||
March 31, | ||||||||
Derivatives Not Designated as Hedging Instruments | Balance Sheet Location | 2020 | 2019 | |||||
Foreign exchange contracts | Accrued Liabilities | ( | ) | |||||
11. Accrued Liabilities and Other Non-current Liabilities
Consolidated accrued liabilities of the Company consisted of the following:
March 31, | ||||||||
2020 | 2019 | |||||||
Accrued payroll | $ | $ | ||||||
Accrued income taxes payable | ||||||||
Accrued health insurance | ||||||||
Accrued general and product liability costs | ||||||||
Customer advances, deposits, and rebates | ||||||||
Current ROU lease liabilities | ||||||||
Other accrued liabilities | ||||||||
$ | $ | |||||||
59
COLUMBUS McKINNON CORPORATION
NOTES TO CONSOLIDATED FINANCIAL STATEMENTS - (Continued)
(tabular amounts in thousands, except share data)
Consolidated other non-current liabilities of the Company consisted of the following:
March 31, | ||||||||
2020 | 2019 | |||||||
Accumulated postretirement benefit obligation | $ | $ | ||||||
Accrued general and product liability costs | ||||||||
Accrued pension cost | ||||||||
Cross currency swap | ||||||||
Deferred income tax | ||||||||
Non-current ROU lease liabilities | ||||||||
Other non-current liabilities | ||||||||
$ | $ | |||||||
12. Debt
Consolidated long-term debt of the Company consisted of the following:
March 31, | ||||||||
2020 | 2019 | |||||||
Term loan | ||||||||
Unamortized deferred financing costs, net | ( | ) | ( | ) | ||||
Total debt | ||||||||
Less: current portion | ||||||||
Total debt, less current portion | $ | $ | ||||||
On January 31, 2017 the Company entered into a Credit Agreement ("Credit Agreement") and $545,000,000 of debt facilities ("Facilities") in connection with the STAHL acquisition. The Facilities consist of a Revolving Facility ("Revolver") in the amount of $100,000,000 and a $445,000,000 1st Lien Term Loan ("Term Loan"). The Term Loan has a seven-year term maturing in 2024 and the Revolver has a five-year term maturing in 2022. At March 31, 2020 the Company has not drawn from the Revolver.
The key terms of the agreement are as follows:
• | Term Loan: An aggregate $ |
• | Revolver: An aggregate $ |
• | Fees and Interest Rates: Commitment fees and interest rates are determined on the basis of either a Eurocurrency rate or a Base rate plus an applicable margin based upon the Company's Total Leverage Ratio (as defined in the Credit Agreement). |
60
COLUMBUS McKINNON CORPORATION
NOTES TO CONSOLIDATED FINANCIAL STATEMENTS - (Continued)
(tabular amounts in thousands, except share data)
• | Prepayments: Provisions permitting a Borrower to voluntarily prepay either the Term Loan or Revolver in whole or in part at any time, and provisions requiring certain mandatory prepayments of the Term Loan or Revolver on the occurrence of certain events which will permanently reduce the commitments under the Credit Agreement, each without premium or penalty, subject to reimbursement of certain costs of the Lenders. A prepayment premium of 1% of the principal amount of the First Lien Term Loans is required if the prepayment is associated with a Repricing Transaction and it were to occur within the first twelve months. |
• | Covenants: Provisions containing covenants required of the Corporation and its subsidiaries including various affirmative and negative financial and operational covenants. The key financial covenant is triggered only on any date when any Extension of Credit under the Revolving Facility is outstanding (excluding any Letters of Credit) (the “Covenant Trigger”), and permits the Total Leverage Ratio for the Reference Period ended on such date to not exceed (i) 4.50:1.00 as of any date of determination prior to December 31, 2017, (ii) 4.00:1.00 as of any date of determination on December 31, 2017 and thereafter but prior to December 31, 2018, (iii) 3.50:1.00 as of any date of determination on December 31, 2018 and thereafter but prior to December 31, 2019 and (iv) 3.00:1.00 as of any date of determination on December 31, 2019 and thereafter. As there is no amount drawn on the Revolver as of March 31, 2020 the requirement to comply with the covenant is not triggered. Had we been required to determine the covenant ratio we would have been in compliance with the covenant provisions as of March 31, 2020 and 2019. |
The Facility is secured by all U.S. inventory, receivables, equipment, real property, certain subsidiary stock (limited to 65% of non-U.S. subsidiaries) and intellectual property. The Credit Agreement allows the declaration of dividends, but limits our ability to pay dividends.
On February 26, 2018, the Company amended the Credit Agreement (known as the "Amended Credit Agreement"). The Amended Credit Agreement has the same terms mentioned above except for a reduction in interest rates. The applicable rate for the repriced term loan was reduced from 3.00 % to 2.50 %. The Company accounted for the Amended Credit Agreement as a debt modification, therefore, debt repricing fees incurred in fiscal 2018 were expensed as General and Administrative expenses and the deferred financing fees incurred as part of the Credit Agreement (discussed below) remain unchanged.
The outstanding balance of the Term Loan was $259,350,000 and $310,463,000 as of March 31, 2020 and 2019, respectively. The Company made $51,113,000 of principal payment on the Term Loan during fiscal 2020 and $65,000,000 of principal payment on the Term Loan during fiscal 2019. The Company is obligated to make $4,450,000 of principal payments over the next 12 months. As previously discussed, in response to COVID-19 the Company is seeking to take all appropriate measures to protect the cash flow and liquidity of the Company. As such, only the required principal amount has been recorded within the current portion of long-term debt on the Company's Consolidated Balance Sheet with the remaining balance recorded as long-term debt.
There was $0 outstanding on the Revolving Credit Facility and $16,752,000 outstanding letters of credit as of March 31, 2020. The outstanding letters of credit at March 31, 2020 consisted of $898,000 in commercial letters of credit and $15,854,000 of standby letters of credit. Subsequent to March 31, 2020, the Company drew $25,000,000 from the Revolver for liquidity and working capital purposes.
The gross balance of deferred financing costs on the term loan was $14,690,000 as of March 31, 2020 and 2019. The accumulated amortization balances were $6,645,000 and $4,547,000 as of March 31, 2020 and 2019, respectively.
The gross balance of deferred financing costs associated with the Revolving Credit Facility is included in Other assets is $2,789,000 as of March 31, 2020 and March 31, 2019. The accumulated amortization balance is $1,766,000 and $1,209,000 as of March 31, 2020 and March 31, 2019 respectively. These balances are classified in Other assets since no funds were drawn on the Revolving Credit Facility in fiscal 2020 and 2019.
61
COLUMBUS McKINNON CORPORATION
NOTES TO CONSOLIDATED FINANCIAL STATEMENTS - (Continued)
(tabular amounts in thousands, except share data)
The principal payments obligated to be made as of March 31, 2020 on the Term Loan are as follows:
2021 | |||
2022 | |||
2023 | |||
2024 | |||
Thereafter | |||
$ | |||
Non-U.S. Lines of Credit and Loans
Unsecured and uncommitted lines of credit are available to meet short-term working capital needs for certain of our subsidiaries operating outside of the U.S. The lines of credit are available on an offering basis, meaning that transactions under the line of credit will be on such terms and conditions, including interest rate, maturity, representations, covenants, and events of default, as mutually agreed between our subsidiaries and the local bank at the time of each specific transaction. As of March 31, 2020, unsecured credit lines totaled approximately $2,428,000 , of which $0 was drawn. In addition, unsecured lines of $14,160,000 were available for bank guarantees issued in the normal course of business of which $9,958,000 was utilized.
13. Pensions and Other Benefit Plans
The Company provides retirement plans, including defined benefit and defined contribution plans, and other postretirement benefit plans to certain employees. The Company applies ASC Topic 715 “Compensation – Retirement Benefits,” which required the recognition in pension and other postretirement benefits obligations and accumulated other comprehensive income of actuarial gains or losses, prior service costs or credits and transition assets or obligations that had previously been deferred. This statement also requires an entity to measure a defined benefit postretirement plan’s assets and obligations that determine its funded status as of the end of the fiscal year.
62
COLUMBUS McKINNON CORPORATION
NOTES TO CONSOLIDATED FINANCIAL STATEMENTS - (Continued)
(tabular amounts in thousands, except share data)
Pension Plans
The Company provides defined benefit pension plans to certain employees. The Company uses March 31 as the measurement date. The following provides a reconciliation of benefit obligation, plan assets, and funded status of the plans:
March 31, | ||||||||
2020 | 2019 | |||||||
Change in benefit obligation: | ||||||||
Benefit obligation at beginning of year | $ | $ | ||||||
Service cost | ||||||||
Interest cost | ||||||||
Actuarial (gain) loss | ||||||||
Benefits paid | ( | ) | ( | ) | ||||
Foreign exchange rate changes | ( | ) | ( | ) | ||||
Benefit obligation at end of year | $ | $ | ||||||
Change in plan assets: | ||||||||
Fair value of plan assets at beginning of year | $ | $ | ||||||
Actual gain (loss) on plan assets | ||||||||
Employer contribution | ||||||||
Benefits paid | ( | ) | ( | ) | ||||
Foreign exchange rate changes | ( | ) | ( | ) | ||||
Fair value of plan assets at end of year | $ | $ | ||||||
Funded status | $ | ( | ) | $ | ( | ) | ||
Unrecognized actuarial loss | ||||||||
Net amount recognized | $ | ( | ) | $ | ( | ) | ||
Amounts recognized in the consolidated balance sheets are as follows:
March 31, | ||||||||
2020 | 2019 | |||||||
Other assets | $ | $ | ||||||
Accrued liabilities | ( | ) | ( | ) | ||||
Other non-current liabilities | ( | ) | ( | ) | ||||
Accumulated other comprehensive loss, before tax | ||||||||
Net amount recognized | $ | ( | ) | $ | ( | ) | ||
Other assets are presented separately from pension liabilities as one of the Company's U.S. plans is overfunded.
In fiscal 2021, an estimated net loss of $3,516,000 and no prior service costs for the defined benefit pension plans will be amortized from accumulated other comprehensive loss to net periodic benefit cost.
63
COLUMBUS McKINNON CORPORATION
NOTES TO CONSOLIDATED FINANCIAL STATEMENTS - (Continued)
(tabular amounts in thousands, except share data)
Net periodic pension cost included the following components:
2020 | 2019 | 2018 | ||||||||||
Service costs—benefits earned during the period | $ | $ | $ | |||||||||
Interest cost on projected benefit obligation | ||||||||||||
Expected return on plan assets | ( | ) | ( | ) | ( | ) | ||||||
Net amortization | ||||||||||||
Curtailment | ||||||||||||
Other | ||||||||||||
Net periodic pension cost (benefit) | $ | $ | $ | |||||||||
The Company adopted ASU 2017-07 in the fiscal 2019. The service cost component of net periodic benefit cost above is recorded in Cost of products sold, Selling expense, and General and administrative expenses within the Consolidated Statements of Operations, while the remaining components are recorded to Other (income) expense, net. Fiscal 2018 amounts have been reclassified to provide comparable presentation in line with the guidance in ASU 2017-07 based on amounts previously disclosed for the various components of net periodic pension cost (benefit).
Information for pension plans with a projected benefit obligation in excess of plan assets is as follows:
March 31, | ||||||||
2020 | 2019 | |||||||
Projected benefit obligation | $ | $ | ||||||
Fair value of plan assets | 257,093 | |||||||
Information for pension plans with an accumulated benefit obligation in excess of plan assets is as follows:
March 31, | ||||||||
2020 | 2019 | |||||||
Accumulated benefit obligation | $ | $ | ||||||
Fair value of plan assets | ||||||||
Unrecognized gains and losses are amortized through March 31, 2020 on a straight-line basis over the average remaining service period of active participants. Starting in fiscal 2016, the Company changed the amortization period of its largest plan to the average remaining lifetime of inactive participants, as a significant portion of the plan population is now inactive. This change increases the amortization period of the unrecognized gains and losses.
The weighted-average assumptions in the following table represent the rates used to develop the actuarial present value of the projected benefit obligation for the year listed and also net periodic pension cost for the following year:
2020 | 2019 | 2018 | |||||||
Discount rate | % | % | % | ||||||
Expected long-term rate of return on plan assets | % | % | % | ||||||
Rate of compensation increase on active plans | % | % | % | ||||||
The expected rates of return on plan asset assumptions are determined considering long-term historical averages and real returns on each asset class.
64
COLUMBUS McKINNON CORPORATION
NOTES TO CONSOLIDATED FINANCIAL STATEMENTS - (Continued)
(tabular amounts in thousands, except share data)
The Company’s retirement plan target and actual asset allocations are as follows:
Target | Actual | |||||
2021 | 2020 | 2019 | ||||
Equity securities | 40-30% | |||||
Fixed income | 60-70% | |||||
Total plan assets | ||||||
The Company has an investment objective for domestic pension plans to adequately provide for both the growth and liquidity needed to support all current and future benefit payment obligations. The Company's policy is to de-risk the portfolio by increasing liability-hedging investments as the pension liability funded status increases, which is known as the glide path method. Within the table above, cash equivalents are categorized as fixed income as they earn lower returns than equity securities which includes alternative real estate funds (shown in the fair value tables below).
The Company’s funding policy with respect to the defined benefit pension plans is to contribute annually at least the minimum amount required by the Employee Retirement Income Security Act of 1974 (ERISA). Additional contributions may be made to minimize PBGC premiums. The Company plans to contribute the minimum amount required (approximately $4,945,000 ) to its pension plans in fiscal 2021 as a response to COVID-19 but will reassess later in the fiscal year and increase contributions if economic conditions improve.
Information about the expected benefit payments for the Company’s defined benefit plans is as follows:
2021 | $ | ||
2022 | |||
2023 | |||
2024 | |||
2025 | |||
2026-2030 | |||
Postretirement Benefit Plans
The Company sponsors a defined benefit other postretirement health care plan that provide medical and life insurance coverage to certain U.S. retirees and their dependents of one of its subsidiaries. Prior to the acquisition of this subsidiary, the Company did not sponsor any postretirement benefit plans. The Company pays the majority of the medical costs for certain retirees and their spouses who are under age 65 . For retirees and dependents of retirees who retired prior to January 1, 1989, and are age 65 or over, the Company contributes 100 % toward the American Association of Retired Persons (“AARP”) premium frozen at the 1992 level. For retirees and dependents of retirees who retired after January 1, 1989, the Company contributes $35 per month toward the AARP premium. The life insurance plan is noncontributory.
65
COLUMBUS McKINNON CORPORATION
NOTES TO CONSOLIDATED FINANCIAL STATEMENTS - (Continued)
(tabular amounts in thousands, except share data)
The Company’s postretirement health benefit plans are not funded. The following sets forth a reconciliation of benefit obligation and the funded status of the plan:
March 31, | ||||||||
2020 | 2019 | |||||||
Change in benefit obligation: | ||||||||
Benefit obligation at beginning of year | $ | $ | ||||||
Interest cost | ||||||||
Actuarial gain | ( | ) | ( | ) | ||||
Benefits paid | ( | ) | ( | ) | ||||
Benefit obligation at end of year | $ | $ | ||||||
Funded status | $ | ( | ) | $ | ( | ) | ||
Unrecognized actuarial gain | ( | ) | ( | ) | ||||
Net amount recognized | $ | ( | ) | $ | ( | ) | ||
Amounts recognized in the consolidated balance sheets are as follows:
March 31, | ||||||||
2020 | 2019 | |||||||
Accrued liabilities | $ | ( | ) | $ | ( | ) | ||
Other non-current liabilities | ( | ) | ( | ) | ||||
Accumulated other comprehensive gain, before tax | ( | ) | ( | ) | ||||
Net amount recognized | $ | ( | ) | $ | ( | ) | ||
In fiscal 2021, an estimated gain of $207,000 for the defined benefit postretirement health care plans will be amortized from accumulated other comprehensive loss to net periodic benefit cost. In fiscal 2020, net periodic postretirement benefit cost included the following:
Year Ended March 31, | ||||||||||||
2020 | 2019 | 2018 | ||||||||||
Interest cost | $ | $ | $ | |||||||||
Net amortization | ( | ) | ( | ) | ( | ) | ||||||
Net periodic postretirement benefit cost | $ | ( | ) | $ | ( | ) | $ | |||||
For measurement purposes, healthcare costs are assumed to increase 5.75 % in fiscal 2021, grading down over time to 5.0 % in four years. The discount rate used in determining the accumulated postretirement benefit obligation was 3.17 % and 3.63 % as of March 31, 2020 and 2019, respectively.
Information about the expected benefit payments for the Company’s postretirement health benefit plans is as follows:
2021 | $ | ||
2022 | |||
2023 | |||
2024 | |||
2025 | |||
2026-2030 | |||
66
COLUMBUS McKINNON CORPORATION
NOTES TO CONSOLIDATED FINANCIAL STATEMENTS - (Continued)
(tabular amounts in thousands, except share data)
Assumed medical claims cost trend rates have an effect on the amounts reported for the health care plans. A one-percentage point change in assumed health care cost trend rates would have the following effects
One Percentage Point Increase | One Percentage Point Decrease | |||||||
Effect on total of service and interest cost components | $ | $ | ( | ) | ||||
Effect on postretirement obligation | ( | ) | ||||||
The Company has collateralized split-dollar life insurance arrangements with two of its former officers. Under these arrangements, the Company pays certain premium costs on life insurance policies for the former officers. Upon the later of the death of the former officer and their spouse, the Company will receive all of the premiums paid to-date. The net periodic pension cost for fiscal 2020 was $145,000 and the liability at March 31, 2020 is $4,631,000 with $4,494,000 included in Other non-current liabilities and $137,000 included in Accrued liabilities in the Consolidated Balance Sheet. The cash surrender value of the policies is $3,346,000 and $3,207,000 at March 31, 2020 and 2019, respectively. The balance is included in Other assets in the consolidated balance sheet.
Other Benefit Plans
The Company also sponsors defined contribution plans covering substantially all domestic employees and certain international employees. Participants may elect to contribute basic contributions. These plans provide for employer contributions based on employee eligibility and participation. The Company recorded a charge for such contributions of approximately $5,239,000 , $5,260,000 , and $4,198,000 for the years ended March 31, 2020, 2019, and 2018, respectively which are included in Cost of Products Sold, Selling Expenses, and General and Administrative Expenses within the Consolidated Statements of Operations. The Company expects its contributions for the defined contribution plans in future years to remain comparable to its fiscal 2020 contributions.
Fair Values of Plan Assets
The Company classified its investments within the categories of equity securities, fixed income securities, alternative real estate, and cash equivalents, as the Company’s management bases its investment objectives and decisions from these four categories. The Company’s investment policy is to use its glide-path method to de-risk the portfolio by increasing liability-hedging investments as the pension liability funded status increases.
The fair values of the Company’s defined benefit plans’ consolidated assets by asset category as of March 31 were as follows:
March 31, | ||||||||
2020 | 2019 | |||||||
Asset categories: | ||||||||
Equity securities | $ | $ | ||||||
Fixed income securities | ||||||||
Alternative real estate | ||||||||
Cash equivalents | ||||||||
Total | $ | $ | ||||||
67
COLUMBUS McKINNON CORPORATION
NOTES TO CONSOLIDATED FINANCIAL STATEMENTS - (Continued)
(tabular amounts in thousands, except share data)
The fair values of our defined benefit plans’ consolidated assets were determined using the fair value hierarchy of inputs described in Note 5. The fair values by category of inputs as of March 31, 2020 and March 31, 2019 were as follows:
Measured at NAV (1) | Quoted Prices in Active Markets for Identical Assets | Significant other observable Inputs | Significant unobservable Inputs | |||||||||||||||||
As of March 31, 2020: | (Level 1) | (Level 2) | (Level 3) | Total | ||||||||||||||||
Asset categories: | ||||||||||||||||||||
Equity securities | $ | $ | $ | $ | $ | |||||||||||||||
Fixed income securities | ||||||||||||||||||||
Alternative real estate | ||||||||||||||||||||
Cash equivalents | ||||||||||||||||||||
Total | $ | $ | $ | $ | $ | |||||||||||||||
(1) Reflects the net asset value (NAV) practical expedient used to approximate fair value.
Measured at NAV (1) | Quoted Prices in Active Markets for Identical Assets | Significant other observable Inputs | Significant unobservable Inputs | |||||||||||||||||
As of March 31, 2019: | (Level 1) | (Level 2) | (Level 3) | Total | ||||||||||||||||
Asset categories: | ||||||||||||||||||||
Equity securities | $ | $ | $ | $ | $ | |||||||||||||||
Fixed income securities | ||||||||||||||||||||
Alternative real estate | ||||||||||||||||||||
Cash equivalents | ||||||||||||||||||||
Total | $ | $ | $ | $ | $ | |||||||||||||||
(1) Reflects the net asset value (NAV) practical expedient used to approximate fair value.
Level 1 securities consist of mutual funds with quoted market prices.
The Level 2 fixed income securities are investments in a combination of funds whose underlying investments are in a variety of fixed income securities including foreign and domestic corporate bonds, securities issued by the U.S. government, U.S. and foreign government obligations, and other similar fixed income investments. The fair values of the underlying investments in these funds are generally based on independent broker dealer bids, or by comparison to other debt securities having similar durations, yields, and credit ratings. The fair values of these funds are determined based on their net asset values which are published daily. We are not aware of any significant restrictions on the issuances or redemption of shares of these funds
Fair value of Level 3 fixed income securities at the beginning of the year was $5,701,000 . During fiscal 2020 fixed income securities earned investment return of $113,000 and had disbursements of $311,000 , which includes liquidations, resulting in an ending balance of $5,503,000 . These fixed income securities consist primarily of insurance contracts which are carried at their liquidation value based on actuarial calculations and the terms of the contracts. Significant inputs in determining the fair value for these contracts include company contributions, contract disbursements, and stated interest rates. Gains and losses on these contracts are recognized as part of net periodic pension cost and recorded as part of cost of sales, selling, or general and administrative expense.
68
14. Employee Stock Ownership Plan (ESOP)
Effective January 1, 2012 the ESOP was closed to new hires. Prior to this date, substantially all of the Company’s U.S. non-union employees were participants in the ESOP. Additionally, during the year ended March 31, 2015 the final loan payment was made by the ESOP to the Company and there was no compensation expense recorded in fiscal years 2020, 2019, or 2018.
At March 31, 2020 and 2019, 234,000 and 280,000 of ESOP shares, respectively, were allocated or available to be allocated to participants’ accounts. There are no shares of collateralized common stock related to the ESOP loan outstanding at March 31, 2020 and no ESOP shares were pledged as collateral to guarantee the ESOP term loans.
15. Earnings per Share and Stock Plans
Earnings per Share
The Company calculates earnings per share in accordance with ASC Topic 260, “Earnings per Share.” Basic earnings per share exclude any dilutive effects of options, warrants, and convertible securities. Diluted earnings per share include any dilutive effects of stock options, unvested restricted stock units, unvested performance shares, and unvested restricted stock. Stock options and performance shares with respect to 196,000 and 128,000 common shares were not included in the computation of diluted earnings per share for fiscal 2020 and 2019, respectively, because they were antidilutive. For the years ended March 31, 2020 and 2019, an additional 40,000 and 153,000 , respectively, in contingently issuable shares were not included in the computation of diluted earnings per share because a performance condition had not yet been met.
The following table sets forth the computation of basic and diluted earnings per share (share data presented in thousands):
Year Ended March 31, | ||||||||||||
Numerator for basic and diluted earnings per share: | 2020 | 2019 | 2018 | |||||||||
Net income | $ | $ | $ | |||||||||
Denominators: | ||||||||||||
Weighted-average common stock outstanding— denominator for basic EPS | ||||||||||||
Effect of dilutive employee stock options, RSU's and performance shares | ||||||||||||
Adjusted weighted-average common stock outstanding and assumed conversions— denominator for diluted EPS | ||||||||||||
The weighted-average common stock outstanding shown above is net of unallocated ESOP shares (see Note 14).
During fiscal 2018, the Company adopted ASU No. 2016-09, "Compensation—Stock Compensation (Topic 718): Improvements to Employee Share-Based Payment Accounting" (ASU No. 2016-09). Among other modifications to accounting for stock based compensation, this ASU requires that assumed proceeds from excess tax benefits and deficiencies are no longer included in the calculation of weighted-average diluted common stock outstanding and are recorded as income tax expense or benefit in the statement of operations. Refer to Note 17 for the impact the adoption had on the Company's financial statements.
Stock Plans
The Company records stock-based compensation in accordance with ASC Topic 718, “Compensation – Stock Compensation,” applying the modified prospective method. This Statement requires all equity-based payments to employees, including grants of employee stock options, to be recognized in the statement of earnings based on the grant date fair value of the award. Under the modified prospective method, the Company is required to record equity-based compensation expense for all awards granted after the date of adoption and for the unvested portion of previously granted awards outstanding as of the date of adoption.
The Company grants share based compensation to eligible participants under the 2016 Long Term Incentive Plan, as Amended and Restated in June 2019 ("2016 LTIP"). The total number of shares of common stock with respect to which awards may be granted under the 2016 LTIP were increased by 2,500,000 as a result of the June 2019 amendment. Shares not previously
69
COLUMBUS McKINNON CORPORATION
NOTES TO CONSOLIDATED FINANCIAL STATEMENTS - (Continued)
(tabular amounts in thousands, except share data)
authorized for issuance under any of the prior stock plans and any shares not issued or subject to outstanding awards under the prior stock plans are still available for issuance. Details of the shares granted under these plans are discussed below.
Prior to the adoption of the 2016 LTIP, the Company granted stock awards under the 2010 Long Term Incentive Plan and the 2006 Long Term Incentive Plan, collectively referred to as the “Prior Stock Plans.”
Stock based compensation expense was $4,507,000 , $6,198,000 , and $5,586,000 for fiscal 2020, 2019, and 2018, respectively. The decrease in stock based compensation expense in fiscal 2020 is primarily related to shares that were forfeited when the Company's Chief Executive Officer (CEO) resigned on January 10, 2020. The forfeiture resulted in the reversal of $1,981,000 in stock compensation expense during fiscal 2020 recorded as a reduction to General and administrative expenses.
Stock compensation expense is included in cost of products sold, selling, general and administrative, and research and development expenses depending on the nature of the service of the employee receiving the award. The Company recognizes expense for all share–based awards over the service period, which is the shorter of the period until the employees’ retirement eligibility dates or the service period for the award, for awards expected to vest. Accordingly, expense is generally reduced for estimated forfeitures. ASC Topic 718 requires forfeitures to be estimated at the time of grant and revised if necessary, in subsequent periods if actual forfeitures differ from those estimates.
The Company recognized compensation expense for stock option awards and unvested restricted share awards that vest based on time or market parameters straight-line over the requisite service period for vesting of the award.
Long Term Incentive Plan
Under the 2016 LTIP, the total number of shares of common stock with respect to which awards may be granted under the plan is 2,500,000 in addition to shares not previously authorized for issuance under any of the prior stock plans and any shares not issued or subject to outstanding awards under the prior stock plans. As of March 31, 2020, 3,033,000 shares remain for future grants. The 2016 LTIP was designed as an omnibus plan and awards may consist of non-qualified stock options, incentive stock options, stock appreciation rights, restricted stock, restricted stock units, or stock bonuses.
Under the 2016 LTIP, the granting of awards to employees may take the form of options, restricted shares, and performance shares. The Compensation Committee of our Board of Directors determines the number of shares, the term, the frequency and date, the type, the exercise periods, any performance criteria pursuant to which awards may be granted, and the restriction and other terms and conditions of each grant in accordance with terms of the Plan.
In connection with the acquisition of Magnetek, the Company agreed to continue the 2014 Stock Incentive Plan of Magnetek, Inc. (the "Magnetek Stock Plan"). In doing so, the Company has available under the Magnetek Stock Plan 164,461 of the Company's shares which can be granted to certain employees as stock-based compensation.
Stock Option Plans
Options outstanding under the 2016 LTIP generally become exercisable over a four-year period at a rate of 25 % per year commencing one year from the date of grant and have an exercise price of not less than 100 % of the fair market value of the common stock on the date of grant.
70
COLUMBUS McKINNON CORPORATION
NOTES TO CONSOLIDATED FINANCIAL STATEMENTS - (Continued)
(tabular amounts in thousands, except share data)
A summary of option transactions during each of the three fiscal years in the period ended March 31, 2020 is as follows:
Shares | Weighted- average Exercise Price per share | Weighted- average Remaining Contractual Life (in years) | Aggregate Intrinsic Value | ||||||||||
Outstanding at April 1, 2017 | $ | ||||||||||||
Granted | |||||||||||||
Exercised | ( | ) | |||||||||||
Cancelled | ( | ) | |||||||||||
Outstanding at March 31, 2018 | $ | ||||||||||||
Granted | |||||||||||||
Exercised | ( | ) | |||||||||||
Cancelled | ( | ) | |||||||||||
Outstanding at March 31, 2019 | $ | ||||||||||||
Granted | |||||||||||||
Exercised | ( | ) | |||||||||||
Cancelled | ( | ) | |||||||||||
Outstanding at March 31, 2020 | $ | ||||||||||||
Exercisable at March 31, 2020 | $ | $ | |||||||||||
The Company calculated intrinsic value for those options that had an exercise price lower than the market price of our common shares as of March 31, 2020. The aggregate intrinsic value of outstanding options as of March 31, 2020 is calculated as the difference between the exercise price of the underlying options and the market price of our common shares for the 302,505 options that were in-the-money at that date. The aggregate intrinsic value of exercisable options as of March 31, 2020 is calculated as the difference between the exercise price of the underlying options and the market price of our common shares for the 177,251 exercisable options that were in-the-money at that date. The Company's closing stock price was $25.00 as of March 31, 2020. The total intrinsic value of stock options exercised was $5,438,000 , $3,577,000 , and $5,851,000 during fiscal 2020, 2019, and 2018, respectively.
The grant date fair value of options that vested was $7.43 , $7.36 , and $7.42 during fiscal 2020, 2019, and 2018, respectively.
As of March 31, 2020, $1,961,000 of unrecognized compensation cost related to non-vested stock options is expected to be recognized over a weighted-average period of approximately 2.6 years.
Exercise prices for options outstanding as of March 31, 2020, ranged from $13.43 to $38.70 . The following table provides certain information with respect to stock options outstanding at March 31, 2020:
Stock Options Outstanding | Weighted-average Exercise Price | Weighted-average Remaining Contractual Life | |||||||
Range of Exercise Prices | |||||||||
$10.01 to 20.00 | $ | ||||||||
$20.01 to 30.00 | $ | ||||||||
$30.01 to $40.00 | $ | ||||||||
$ | |||||||||
71
COLUMBUS McKINNON CORPORATION
NOTES TO CONSOLIDATED FINANCIAL STATEMENTS - (Continued)
(tabular amounts in thousands, except share data)
The following table provides certain information with respect to stock options exercisable at March 31, 2020:
Range of Exercise Prices | Stock Options Exercisable | Weighted- average Exercise Price per share | |||||
$10.01 to $20.00 | $ | ||||||
$20.01 to $30.00 | |||||||
$30.01 to $40.00 | |||||||
$ | |||||||
The fair value of stock options granted was estimated on the date of grant using a Black-Scholes option pricing model. The Black-Scholes option valuation model was developed for use in estimating the fair value of traded options which have no vesting restrictions and are fully transferable. In addition, option valuation models require the input of subjective assumptions including the expected stock price volatility. Because the Company’s employee stock options have characteristics significantly different from those of traded options, and because changes in the subjective input assumptions can materially affect the fair value estimate, in management’s opinion, the existing models do not necessarily provide a reliable single measure of the fair value of its employee stock options. The weighted-average grant date fair value of the options was $12.39 , $13.56 , and $7.66 for options granted during fiscal 2020, 2019, and 2018, respectively. The following table provides the weighted-average assumptions used to value stock options granted during fiscal 2020, 2019, and 2018:
Year Ended March 31, 2020 | Year Ended March 31, 2019 | Year Ended March 31, 2018 | |||||||
Assumptions: | |||||||||
Risk-free interest rate | % | % | % | ||||||
Dividend yield | % | % | % | ||||||
Volatility factor | |||||||||
Expected life | |||||||||
To determine expected volatility, the Company uses historical volatility based on daily closing prices of its Common Stock over periods that correlate with the expected terms of the options granted. The risk-free rate is based on the United States Treasury yield curve at the time of grant for the appropriate term of the options granted. Expected dividends are based on the Company's history and expectation of dividend payouts. The expected term of stock options is based on vesting schedules, expected exercise patterns and contractual terms.
Restricted Stock Units
The Company granted restricted stock units under the 2016 LTIP during fiscal 2020, 2019, and 2018 to employees as well as to the Company’s non-executive directors as part of their annual compensation. Restricted stock units for employees vest ratably based on service one-quarter after each of years one, two, three, and four.
72
COLUMBUS McKINNON CORPORATION
NOTES TO CONSOLIDATED FINANCIAL STATEMENTS - (Continued)
(tabular amounts in thousands, except share data)
A summary of the restricted stock unit awards granted under the Company’s LTIP plan as of March 31, 2020 is as follows:
Shares | Weighted-average Grant Date Fair Value per share | ||||||
Unvested at April 1, 2017 | $ | ||||||
Granted | |||||||
Vested | ( | ) | |||||
Forfeited | ( | ) | |||||
Unvested at March 31, 2018 | $ | ||||||
Granted | |||||||
Vested | ( | ) | |||||
Forfeited | ( | ) | |||||
Unvested at March 31, 2019 | $ | ||||||
Granted | |||||||
Vested | ( | ) | |||||
Forfeited | ( | ) | |||||
Unvested at March 31, 2020 | $ | ||||||
Total unrecognized compensation cost related to unvested restricted stock units as of March 31, 2020 is $4,954,000 and is expected to be recognized over a weighted average period of 2.4 years. The fair value of restricted stock units that vested during the year ended March 31, 2020 and 2019 was $3,320,000 and $4,802,000 , respectively.
Performance Shares
The Company granted performance shares under the 2016 LTIP during fiscal 2020, 2019, and 2018. Performance based shares are recognized as compensation expense based upon their grant date fair value and to the extent it is probable that the performance conditions will be met. This expense is recognized ratably over the three year period that these shares are restricted. Fiscal 2017 performance shares granted vest pursuant to a performance condition based upon the Company’s Consolidated Net Sales. During fiscal 2019, the Company determined that the fiscal year 2017 performance shares would not vest due to the performance condition not being met. Fiscal 2018 performance shares granted vest pursuant to a performance condition based upon the Company’s Consolidated Net Sales. During fiscal 2019, the Company determined that the fiscal year 2018 performance shares were earned based on the performance condition being met. Fiscal 2019 performance shares granted vest pursuant to a performance condition based upon the Company’s Consolidated EBITDA margin for the twelve months ended March 31, 2020. During fiscal 2020, the Company determined that the fiscal year 2019 performance shares were earned based on the performance condition being met. Fiscal 2020 performance shares granted vest pursuant to a performance condition based upon the Company’s Consolidated EBITDA margin for the twelve months ended March 31, 2021. At this time we believe it is probable that the March 31, 2021 performance condition will be met.
73
COLUMBUS McKINNON CORPORATION
NOTES TO CONSOLIDATED FINANCIAL STATEMENTS - (Continued)
(tabular amounts in thousands, except share data)
A summary of the performance shares transactions during each of the three fiscal years in the period ended March 31, 2020 is as follows:
Shares | Weighted-average Grant Date Fair Value per share | ||||||
Unvested at April 1, 2017 | $ | ||||||
Granted | |||||||
Forfeited | ( | ) | |||||
Unvested at March 31, 2018 | $ | ||||||
Granted | |||||||
Forfeited | ( | ) | |||||
Unvested at March 31, 2019 | $ | ||||||
Granted | |||||||
Forfeited | ( | ) | |||||
Unvested at March 31, 2020 | $ | ||||||
The Company had $1,335,000 in unrecognized compensation costs related to the unvested performance share awards as of March 31, 2020.
Directors Stock
During fiscal 2020, 2019, and 2018, a total of 11,768 , 10,031 , and 16,667 shares of stock, respectively, were granted under the 2016 LTIP to the Company’s non-executive directors as part of their annual compensation. The weighted average fair value grant price of those shares was $39.09 , $41.88 , and $25.80 for fiscal 2020, 2019, and 2018, respectively. The expense related to the shares for fiscal 2020 was $460,000 and $430,000 for fiscal years 2018 and 2019.
Shareholder Rights Plan
On March 29, 2018 the Company announced that its Board of Directors had amended the Company's Shareholder Rights Plan, which accelerated the expiration of the Company's preferred share purchase rights to March 31, 2018. Prior to its expiration, preferred share purchase right holders could exercise their rights if a person or group acquired 20 % or more of the Company’s common shares or announced a tender offer for 20 % or more of the common shares.
Dividends
On March 24, 2020 the Company's Board of Directors approved payment of a quarterly dividend of $0.06 per common share, representing an annual dividend rate of $0.24 per share. The dividend was paid on May 14, 2020 to shareholders of record on May 4, 2020 and totaled approximately $1,430,000 .
Stock Repurchase Plan
16. Loss Contingencies
From time to time, the Company is named a defendant in legal actions arising out of the normal course of business. The Company is not a party to any pending legal proceeding other than ordinary, routine litigation incidental to our business. The Company does not believe that any of our pending litigation will have a material impact on its business.
74
COLUMBUS McKINNON CORPORATION
NOTES TO CONSOLIDATED FINANCIAL STATEMENTS - (Continued)
(tabular amounts in thousands, except share data)
Accrued general and product liability costs are actuarially estimated reserves based on amounts determined from loss reports, individual cases filed with the Company, and an amount for losses incurred but not reported. The aggregate amounts of reserves were $11,944,000 and $12,686,000 of which $8,444,000 and $9,185,000 are included in Other non current liabilities and $3,500,000 in Accrued liabilities for both years as of March 31, 2020 and 2019, respectively. The liability for accrued general and product liability costs are funded by investments in marketable securities (see Notes 2 and 7).
The following table provides a reconciliation of the beginning and ending balances for accrued general and product liability:
Year Ended March 31, | ||||||||||||
2020 | 2019 | 2018 | ||||||||||
Accrued general and product liability, beginning of year | $ | $ | $ | |||||||||
Add provision for claims | ||||||||||||
Deduct payments for claims | ( | ) | ( | ) | ( | ) | ||||||
Accrued general and product liability, end of year | $ | $ | $ | |||||||||
The per occurrence limits on the self-insurance for general and product liability coverage to Columbus McKinnon through its wholly-owned captive insurance company were $2,000,000 from inception through fiscal 2003 and $3,000,000 for fiscal 2004 and thereafter. In addition to the per occurrence limits, the Company’s coverage is also subject to an annual aggregate limit, applicable to losses only. These limits range from $2,000,000 to $6,000,000 for each policy year from inception through fiscal 2020.
Along with other manufacturing companies, the Company is subject to various federal, state, and local laws relating to the protection of the environment. To address the requirements of such laws, the Company has adopted a corporate environmental protection policy which provides that all of its owned or leased facilities shall, and all of its employees have the duty to, comply with all applicable environmental regulatory standards, and the Company utilizes an environmental auditing program for its facilities to ensure compliance with such regulatory standards. The Company has also established managerial responsibilities and internal communication channels for dealing with environmental compliance issues that may arise in the course of its business. Because of the complexity and changing nature of environmental regulatory standards, it is possible that situations will arise from time to time requiring the Company to incur expenditures in order to ensure environmental regulatory compliance. However, the Company is not aware of any environmental condition or any operation at any of its facilities, either individually or in the aggregate, which would cause expenditures having a material adverse effect on its results of operations, financial condition or cash flows and, accordingly, has not budgeted any material capital expenditures for environmental compliance for fiscal 2020.
We have entered a voluntary environmental cleanup program in certain states where we operate and believe that our current reserves are sufficient to remediate these locations. For all of the currently known environmental matters, we have accrued as of March 31, 2020, a total of $1,143,000 which, in our opinion, is sufficient to deal with such matters. The Company is not aware of any environmental condition or any operation at any of its facilities, either individually or in the aggregate, which would cause expenditures to have a material adverse effect on its results of operations, financial condition or cash flows and, accordingly, has not budgeted any material capital expenditures for environmental compliance for fiscal 2020.
Like many industrial manufacturers, the Company is involved in asbestos-related litigation. In continually evaluating costs relating to its estimated asbestos-related liability, the Company reviews, among other things, the incidence of past and recent claims, the historical case dismissal rate, the mix of the claimed illnesses and occupations of the plaintiffs, its recent and historical resolution of the cases, the number of cases pending against it, the status and results of broad-based settlement discussions, and the number of years such activity might continue. Based on this review, the Company has estimated its share of liability to defend and resolve probable asbestos-related personal injury claims. This estimate is highly uncertain due to the limitations of the available data and the difficulty of forecasting with any certainty the numerous variables that can affect the range of the liability. The Company will continue to study the variables in light of additional information in order to identify trends that may become evident and to assess their impact on the range of liability that is probable and estimable.
Based on actuarial information, the Company has estimated its asbestos-related aggregate liability including related legal costs to range between $3,800,000 and $6,900,000 using actuarial parameters of continued claims for a period of 37 years from March 31, 2020. The Company's estimation of its asbestos-related aggregate liability that is probable and estimable, in accordance with U.S.
75
COLUMBUS McKINNON CORPORATION
NOTES TO CONSOLIDATED FINANCIAL STATEMENTS - (Continued)
(tabular amounts in thousands, except share data)
generally accepted accounting principles approximates $4,753,000 , which has been reflected as a liability in the consolidated financial statements as of March 31, 2020. The recorded liability does not consider the impact of any potential favorable federal legislation. This liability will fluctuate based on the uncertainty in the number of future claims that will be filed and the cost to resolve those claims, which may be influenced by a number of factors, including the outcome of the ongoing broad-based settlement negotiations, defensive strategies, and the cost to resolve claims outside the broad-based settlement program. Of this amount, management expects to incur asbestos liability payments of approximately $2,000,000 over the next 12 months. Because payment of the liability is likely to extend over many years, management believes that the potential additional costs for claims will not have a material effect on the financial condition of the Company or its liquidity, although the effect of any future liabilities recorded could be material to earnings in a future period.
The Company believes that a share of its previously incurred asbestos-related expenses and future asbestos-related expenses are covered by pre-existing insurance policies. The Company has been engaged in a legal action against the insurance carriers for those policies to recover past expenses and future costs incurred. In March of fiscal 2020, the Company came to a tentative agreement with the insurance carriers to settle its case against them for recovery of past and cost-sharing for future asbestos-related legal defense costs. The settlement is subject to mutual agreement of the terms and conditions in a coverage in place agreement. The terms of the tentative settlement require the carriers to pay gross defense costs prior to retro-premiums of 65 % for future asbestos-related defense costs subject to an annual cap of $1,650,000 for clams covered by the tentative settlement. In addition, a payout of approximately $2,650,000 is expected to be received for past defense costs which will be reduced by contingent legal costs. Further, it is expected that the insurance carriers will accept coverage for indemnity on all covered cases. Estimates of the future cost sharing have been included in the loss reserve calculation as of March 31, 2020. The settlement is expected to be finalized in fiscal 2021. During fiscal 2020 and fiscal 2019, the Company received settlement payments of $381,000 and $484,000 , respectively, net of legal fees, from its insurance carriers as partial reimbursement for asbestos-related expenses. These partial payments have been recorded as gains in cost of products sold.
The Company is also involved in other unresolved legal actions that arise in the normal course of business. The most prevalent of these unresolved actions involve disputes related to product design, manufacture and performance liability. The Company's estimation of its product-related aggregate liability that is probable and estimable, in accordance with U.S. generally accepted accounting principles approximates $6,423,000 , which has been reflected as a liability in the consolidated financial statements as of March 31, 2020. In some cases, we cannot reasonably estimate a range of loss because there is insufficient information regarding the matter. Management believes that the potential additional costs for claims will not have a material effect on the financial condition of the Company or its liquidity, although the effect of any future liabilities recorded could be material to earnings in a future period.
The following loss contingencies relate to the Company's Magnetek subsidiary:
Product Liability
Magnetek has been named, along with multiple other defendants, in asbestos-related lawsuits associated with business operations previously acquired but which are no longer owned. During Magnetek's ownership, none of the businesses produced or sold asbestos-containing products. For such claims, Magnetek is uninsured and either contractually indemnified against liability, or contractually obligated to defend and indemnify the purchaser of these former business operations. The Company aggressively seeks dismissal from these proceedings. Based on actuarial information, the asbestos related liability including legal costs is estimated to be approximately $768,000 which has been reflected as a liability in the consolidated financial statements at March 31, 2020.
Litigation-Other
In October 2010, Magnetek received a request for indemnification from Power-One, Inc. ("Power-One") for an Italian tax matter arising out of the sale of Magnetek's power electronics business to Power-One in October 2006. With a reservation of rights, Magnetek affirmed its obligation to indemnify Power-One for certain pre-closing taxes. The sale included an Italian company, Magnetek, S.p.A., and its wholly owned subsidiary, Magnetek Electronics (Shenzhen) Co. Ltd. (the “Power-One China Subsidiary”). The tax authority in Arezzo, Italy, issued a notice of audit report in September 2010 wherein it asserted that the Power-One China Subsidiary had its administrative headquarters in Italy with fiscal residence in Italy and, therefore, is subject to taxation in Italy. In November 2010, the tax authority issued a notice of tax assessment for the period of July 2003 to June 2004, alleging that taxes of approximately $2,100,000 (Euro 1,900,000) were due in Italy on taxable income earned by the Power-One China Subsidiary during this period. In addition, the assessment alleges potential penalties together with interest in the amount of approximately $2,900,000 (Euro 2,600,000) for the alleged failure of the Power-One China Subsidiary to file its Italian tax
76
COLUMBUS McKINNON CORPORATION
NOTES TO CONSOLIDATED FINANCIAL STATEMENTS - (Continued)
(tabular amounts in thousands, except share data)
return. The Power-One China Subsidiary filed its response with the provincial tax commission of Arezzo, Italy in January 2011. A hearing before the Tax Court was held in July 2012 on the tax assessment for the period of July 2003 to June 2004. In September 2012, the Tax Court ruled in favor of the Power-One China Subsidiary dismissing the tax assessment for the period of July 2003 to June 2004. In February 2013, the tax authority filed an appeal of the Tax Court's September 2012 ruling. The Regional Tax Commission of Florence heard the appeal of the tax assessment dismissal for the period of July 2003 to June 2004 and thereafter issued its ruling finding in favor of the tax authority. Magnetek believes the court’s decision was based upon erroneous interpretations of the applicable law and appealed the ruling to the Italian Supreme Court in April 2015.
The tax authority in Arezzo, Italy also issued a tax inspection report in January 2011 for the periods July 2002 to June 2003 and July 2004 to December 2006 claiming that the Power-One China Subsidiary failed to file Italian tax returns for the reported periods. In August 2012, the tax authority in Arezzo, Italy issued notices of tax assessment for the periods July 2002 to June 2003 and July 2004 to December 2006, alleging that taxes of approximately $7,500,000 (Euro 6,700,000) were due in Italy on taxable income earned by the Power-One China Subsidiary together with an allegation of potential penalties in the amount of approximately $3,100,000 (Euro 2,800,000) for the alleged failure of the Power-One China Subsidiary to file its Italian tax returns. On June 3, 2015, the Tax Court ruled in favor of the Power-One China Subsidiary dismissing the tax assessments for the periods of July 2002 to June 2003 and July 2004 to December 2006. On July 27, 2015, the tax authority filed an appeal of the Tax Court's ruling of June 3, 2015. In May 2016, the Regional Tax Court of Florence rejected the appeal of the tax authority and at the same time canceled the notices of assessment for the fiscal years of 2004/2005 and 2005/2006. The tax authority had up to six months to appeal the decision. In December 2016, Magnetek was served by the Italian Revenue Service with two appeals to the Italian Supreme Court regarding the two positive judgments on the tax assessments for the fiscal periods 2004/2005 and 2005/2006. In March 2017, the tax authority rejected the appeal of the assessment for 2005/2006 fiscal year. The tax authority had until October 2017 to appeal this decision. In October 2017, Magnetek was served by the Italian Revenue Service with an appeal to the Italian Supreme Court against the positive judgment on the tax assessment for fiscal year 2005/2006. In November 2017 Magnetek filed a memorandum with the Italian Revenue Service and the Italian Supreme Court in response to the appeal made by the tax authority. In February 2018 an appeal hearing was held at the Regional Tax Court of Florence regarding the Italian tax authority's claim for taxes due for fiscal 2002/2003. In October 2018 Magnetek was served by the Italian Revenue Service with an appeal to the Italian Supreme Court against the positive judgment on the tax assessment for fiscal year 2002/2003. In November 2018 Magnetek filed a memorandum with the Italian Supreme Court in response to the appeal made by the tax authority.
The Company believes it will be successful and does not expect to incur a liability related to these assessments.
Environmental Matters
From time to time, Magnetek has taken action to bring certain facilities associated with previously owned businesses into compliance with applicable environmental laws and regulations. Upon the subsequent sale of certain businesses, Magnetek agreed to indemnify the buyers against environmental claims associated with the divested operations, subject to certain conditions and limitations. Remediation activities, including those related to indemnification obligations, did not involve material expenditures during fiscal year 2020.
Magnetek has also been identified by the United States Environmental Protection Agency and certain state agencies as a potentially responsible party for cleanup costs associated with alleged past waste disposal practices at several previously utilized, owned or leased facilities and offsite locations. Its remediation activities as a potentially responsible party were not material in fiscal year 2020. Although the materiality of future expenditures for environmental activities may be affected by the level and type of contamination, the extent and nature of cleanup activities required by governmental authorities, the nature of Magnetek's alleged connection to the contaminated sites, the number and financial resources of other potentially responsible parties, the availability of indemnification rights against third parties, and the identification of additional contaminated sites, Magnetek's estimated share of liability, if any, for environmental remediation, including its indemnification obligations, is not expected to be material.
In 1986, Magnetek acquired the stock of Universal Manufacturing Corporation (“Universal”) from a predecessor of Fruit of the Loom (“FOL”), and the predecessor agreed to indemnify Magnetek against certain environmental liabilities arising from pre-acquisition activities at a facility in Bridgeport, Connecticut. Environmental liabilities covered by the indemnification agreement included completion of additional cleanup activities, if any, at the Bridgeport facility and defense and indemnification against liability for potential response costs related to offsite disposal locations. Magnetek's leasehold interest in the Bridgeport facility was assigned to the buyer in connection with the sale of Magnetek's transformer business in June 2001. FOL, the successor to the indemnification obligation, filed a petition for Reorganization under Chapter 11 of the Bankruptcy Code in 1999 and Magnetek filed a proof of claim in the proceeding for obligations related to the environmental indemnification agreement. Magnetek believes
77
COLUMBUS McKINNON CORPORATION
NOTES TO CONSOLIDATED FINANCIAL STATEMENTS - (Continued)
(tabular amounts in thousands, except share data)
that FOL had substantially completed the clean-up obligations required by the indemnification agreement prior to the bankruptcy filing. In November 2001, Magnetek and FOL entered into an agreement involving the allocation of certain potential tax benefits and Magnetek withdrew its claims in the bankruptcy proceeding. Magnetek further believes that FOL's obligation to the state of Connecticut was not discharged in the reorganization proceeding.
In January 2007, the Connecticut Department of Environmental Protection (“DEP”) requested parties, including Magnetek, to submit reports summarizing the investigations and remediation performed to date at the site and the proposed additional investigations and remediation necessary to complete those actions at the site. DEP requested additional information relating to site investigations and remediation. Magnetek and the DEP agreed to the scope of the work plan in November 2010. The Company has recorded a liability of $352,000 , included in the amount specified above, related to the Bridgeport facility, representing the best estimate of future site investigation costs and remediation costs which are expected to be incurred in the future.
The Company has recorded total liabilities of $464,000 for all environmental matters related to Magnetek in the consolidated financial statements as of March 31, 2020 on an undiscounted basis.
In September of 2017, Magnetek received a request for defense and indemnification from Monsanto Company, Pharmacia, LLC, and Solutia, Inc. (collectively, “Monsanto”) with respect to: (1) lawsuits brought by plaintiffs claiming that Monsanto manufactured polychlorinated biphenyls ("PCBs"), exposure to which allegedly caused injury to plaintiffs; and (2) lawsuits brought by municipalities and municipal entities claiming that Monsanto should be responsible for a variety of damages due to the presence of PCBs in bodies of water in those municipalities and/or in water treated by those municipal entities. Monsanto claims to be entitled to defense and indemnification from Magnetek under a so-called “Special Undertaking” apparently executed by Universal in January of 1972, which purportedly required Universal to defend and indemnify Monsanto from liabilities “arising out of or in connection with the receipt, purchase, possession, handling, use, sale or disposition of” PCBs by Universal.
Magnetek has declined Monsanto’s tender, and believes that it has meritorious legal and factual defenses to the demands made by Monsanto. Magnetek is vigorously defending against those demands and has commenced litigation to, among other things, declare the Special Undertaking void and unenforceable. Monsanto has, in turn, commenced an action to enforce the Special Undertaking. Magnetek intends to continue to vigorously prosecute its declaratory judgment action and to defend against Monsanto’s action against it. We cannot reasonably estimate a potential range of loss with respect to Monsanto’s tender because there is insufficient information regarding the underlying matters. Management believes, however, that the potential additional legal costs related to such matters will not have a material effect on the financial condition of the Company or its liquidity, although the effect of any future liabilities recorded could be material to earnings in a future period.
As of March 31, 2020 the Company has recorded a reserve of $100,000 for legal costs incurred to date and expected to be incurred related to this matter. The Company previously filed suit against Travelers in District Court seeking coverage under insurance policies in the name of Magnetek’s predecessor Universal Manufacturing. In July 2019, the District Court ruled that Travelers is obligated to defend Magnetek under these policies in connection with Magnetek’s litigation against Monsanto. The Court held that Monsanto’s claims against Magnetek fall within the insuring agreement of the Travelers policies and that none of the policy exclusions precluded the possibility of coverage. The Court also held that Travelers prior settlements with other insureds under the policies did not cut off or release Magnetek’s rights under the policies. Travelers has moved for reconsideration and has sought discovery from Magnetek and Monsanto in connection with that motion, which is not yet decided, and will have a right of appeal after that motion is decided. Subject to any appeal, Travelers will be required to reimburse Magnetek’s defense costs to date, and fund its defense costs moving forward.
The Company is also engaged in similar coverage litigation against Transportation Insurance Company in the Circuit Court of Cook County, Illinois. The Company has sought a ruling that Transportation Insurance Company is also obligated to reimburse Magnetek’s defense costs to date, and fund its defense costs moving forward. That motion is not yet fully briefed.
17. Income Taxes
On December 22, 2017, the President of the United States signed into law the Tax Cuts and Jobs Act (“Tax Reform Act” or “the Act”). The legislation significantly changed U.S. tax law by, among other things, lowering corporate income tax rates, assessing a one-time transition tax on a deemed repatriation of non-previously taxed earnings of foreign subsidiaries, and implementing a territorial tax system.
78
COLUMBUS McKINNON CORPORATION
NOTES TO CONSOLIDATED FINANCIAL STATEMENTS - (Continued)
(tabular amounts in thousands, except share data)
While the Tax Reform Act provides for a territorial tax system, beginning in 2018, it includes two new U.S. tax base erosion provisions, the global intangible low-taxed income (“GILTI”) provisions and the base-erosion and anti-abuse tax (“BEAT”) provisions. The Act also provides for the foreign-derived intangible income (“FDII”) deduction for corporations that derive gross income from export activities
The GILTI provisions require the Company to include in its U.S. income tax return any foreign subsidiary earnings in excess of an allowable return on the foreign subsidiary’s tangible assets. The Company recorded $525,000 and $0 additional income tax expense as a result of GILTI for the years ended March 31, 2020 and 2019, respectively. The Company has elected to account for GILTI tax in the period in which it is incurred, and therefore has not provided any deferred tax impacts of GILTI in its consolidated financial statements for the years ended March 31, 2020 and 2019.
The BEAT provisions in the Tax Reform Act eliminate the deduction of certain base-erosion payments made to related foreign corporations, and impose a minimum tax if greater than regular tax. The BEAT tax had no impact on the Company's consolidated financial statements for the years ended March 31, 2020 and 2019.
The FDII provisions of the Act provide an incentive to domestic corporations in the form of a lower tax rate on income derived from tangible and intangible products and services in foreign markets. This lower tax rate is accomplished via an additional tax deduction based on a percentage of qualifying sales. The FDII deduction provided the Company an additional tax benefit of $1,029,000 and $945,000 in the years ended March 31, 2020 and 2019, respectively.
SAB 118 measurement period adjustments
On December 22, 2017, the SEC staff issued Staff Accounting Bulletin No. 118 (“SAB 118”) to address the application of U.S. GAAP in situations when a registrant does not have the necessary information available, prepared, or analyzed (including computations) in reasonable detail to complete the accounting for certain income tax effects of the Tax Reform Act.
We applied the guidance in SAB 118 when accounting for the enactment-date effects of the Act in 2017 and throughout 2018. At December 31, 2017, we had not completed our accounting for all of the enactment-date income tax effects of the Act under ASC 740, Income Taxes, for the following aspects: remeasurement of deferred tax assets and liabilities and one-time transition tax. As of December 31, 2018, we completed our accounting for all of the enactment-date income tax effects of the Act, the impacts of which are summarized below.
One-time transition tax
The one-time transition tax is based on our total post-1986 earnings and profits ("E&P"), the tax on which we previously substantially deferred from U.S. income taxes under U.S. law. We recorded a provisional amount for our one-time transition tax liability for each of our foreign subsidiaries, resulting in a transition tax liability of $1,500,000 at March 31, 2018.
Upon further analysis of the Act, Notices and regulations issued and proposed by the U.S. Department of the Treasury and the Internal Revenue Service, we finalized our calculations of the transition tax liability during the quarter ended December 31, 2018. We decreased our March 31, 2018 provisional amount of $1,500,000 to zero, the effect of which is included as a component of income tax expense in fiscal 2019.
On March 27, 2020, the Coronavirus Aid, Relief, and Economic Security Act ("CARES Act") was enacted in response to the COVID-19 pandemic. Other tax jurisdictions have enacted similar legislation. The Company is currently evaluating the impact of the CARES Act and other, similar, legislation, but at present does not expect that the provision of the legislation would result in a material income tax benefit.
Deferred tax assets and liabilities
As of December 31, 2017 we remeasured certain deferred tax assets and liabilities based on the rates at which they were expected to reverse in the future (which was generally 21 %), by recording a provisional amount of $16,128,000 . Based upon further analysis completed during the measurement period, we reduced this estimate by $26,000 during the year ended March 31, 2018. No further adjustments were made to this provisional amount during the measurement period.
79
COLUMBUS McKINNON CORPORATION
NOTES TO CONSOLIDATED FINANCIAL STATEMENTS - (Continued)
(tabular amounts in thousands, except share data)
The provision for income taxes differs from the amount computed by applying the statutory federal income tax rate to income from continuing operations before income tax expense. The sources and tax effects of the differences were as follows:
Year Ended March 31, | ||||||||||||
2020 | 2019 | 2018 | ||||||||||
Statutory federal income tax rate (1) | % | % | % | |||||||||
Expected tax at statutory rate | $ | $ | $ | |||||||||
Effect of Tax Reform Act (2), (3) | ( | ) | ||||||||||
State income taxes net of federal benefit | ( | ) | ||||||||||
Foreign taxes at rates other than statutory federal rate | ( | ) | ( | ) | ||||||||
Net loss on sale of businesses (5) | ||||||||||||
Permanent items (8), (9) | ( | ) | ( | ) | ||||||||
Valuation allowance (4), (6) | ( | ) | ( | ) | ||||||||
Foreign tax credits (4) | ( | ) | ||||||||||
Federal tax credits (7) | ( | ) | ( | ) | ( | ) | ||||||
Other | ( | ) | ||||||||||
Actual tax provision expense | $ | $ | $ | |||||||||
(1) For fiscal 2018, represents the blended rate of 35 percent for the first three quarters of the fiscal year and 21 percent for the fourth quarter.
(2) For fiscal 2018, represents the discrete expense of the one-time transition tax ($1,500,000 ) and the remeasurement of our net U.S. deferred tax assets at the new lower U.S. corporate income tax rate ($16,102,000 ).
(3) For fiscal 2019, represents the discrete benefit of the reduction of the one-time transition tax of $1,500,000 recorded in fiscal 2018 to zero.
(4) For fiscal 2019, primarily represents foreign tax credits generated by the one-time transition tax calculation and valuation allowance as the Company believes their utilization is uncertain.
(5) For fiscal 2019, represents losses on sales of businesses that are not deductible for income tax purposes.
(6) For fiscal 2020, represents the reversal of a valuation allowance on certain foreign tax credits offset by increases in valuation allowances required in certain foreign jurisdiction.
(7) Federal tax credits include research and development credits and minimum tax credits.
(8) For fiscal 2019, permanent items include a FDII deduction of $945,000 .
(9) For fiscal 2020, permanent items include a net GILTI inclusion of $525,000 and a FDII deduction of $1,029,000 .
The provision for income tax expense (benefit) consisted of the following:
Year Ended March 31, | ||||||||||||
2020 | 2019 | 2018 | ||||||||||
Current income tax expense (benefit): | ||||||||||||
United States Federal | $ | ( | ) | $ | ( | ) | $ | |||||
State taxes | ||||||||||||
Foreign | ||||||||||||
Deferred income tax expense (benefit): | ||||||||||||
United States | ||||||||||||
Foreign | ( | ) | ( | ) | ( | ) | ||||||
$ | $ | $ | ||||||||||
80
COLUMBUS McKINNON CORPORATION
NOTES TO CONSOLIDATED FINANCIAL STATEMENTS - (Continued)
(tabular amounts in thousands, except share data)
The Company applies the liability method of accounting for income taxes as required by ASC Topic 740, “Income Taxes.” The tax effects of temporary differences that give rise to significant portions of the deferred tax assets and deferred tax liabilities are as follows:
March 31, | ||||||||
2020 | 2019 | |||||||
Deferred tax assets: | ||||||||
Federal net operating loss carryforwards | $ | $ | ||||||
State and foreign net operating loss carryforwards | ||||||||
Employee benefit plans | ||||||||
Insurance reserves | ||||||||
Accrued vacation and incentive costs | ||||||||
Federal tax credit carryforwards | ||||||||
ASC 842 Lease Liability | ||||||||
Equity compensation | ||||||||
Other | ||||||||
Valuation allowance | ( | ) | ( | ) | ||||
Deferred tax assets after valuation allowance | ||||||||
Deferred tax liabilities: | ||||||||
Property, plant, and equipment | ( | ) | ( | ) | ||||
ASC 842 Right-of-Use Asset | ( | ) | ||||||
Intangible assets | ( | ) | ( | ) | ||||
Total deferred tax liabilities | ( | ) | ( | ) | ||||
Net deferred tax assets (liabilities) | $ | $ | ||||||
The net deferred tax asset increased in fiscal 2020 primarily as a result of an increase is accrued employee benefits and the amortization of certain intangible assets, offset by the utilization of federal and state net operating losses and certain tax credits.
The gross amount of the Company’s deferred tax assets were $93,401,000 and $90,403,000 at March 31, 2020 and 2019, respectively.
The valuation allowance includes $2,696,000 , $2,372,000 , and $3,837,000 related to foreign net operating losses at March 31, 2020, 2019, and 2018, respectively. The Company’s foreign subsidiaries have net operating loss carryforwards that expire in periods ranging from five years to indefinite.
The federal net operating losses arose from the acquisition of Magnetek and have expiration dates ranging from 2021 through 2035 and are subject to certain limitations under U.S. tax law. The state net operating losses have expiration dates ranging from 2020 through 2038. The federal tax credits have expiration dates ranging from 2032 to indefinite.
Deferred income taxes are classified within the consolidated balance sheets based on the following breakdown:
March 31, | ||||||||
2020 | 2019 | |||||||
Net non-current deferred tax assets | $ | $ | ||||||
Net non-current deferred tax liabilities | ( | ) | ( | ) | ||||
Net deferred tax assets (liabilities) | $ | $ | ||||||
Net non-current deferred tax liabilities are included in other non-current liabilities.
81
COLUMBUS McKINNON CORPORATION
NOTES TO CONSOLIDATED FINANCIAL STATEMENTS - (Continued)
(tabular amounts in thousands, except share data)
Income from continuing operations before income tax expense includes foreign subsidiary income of $37,577,000 , $14,362,000 , and $25,144,000 for the years ended March 31, 2020, 2019, and 2018, respectively. As of March 31, 2020, the Company had approximately $137,000,000 of undistributed earnings of foreign subsidiaries. These earnings are considered to be permanently invested in operations outside the U.S. with the exception of the current earnings from one foreign subsidiary. Any repatriation of these amounts would not be expected to result in a material increase to income tax expense due to the one-time transition tax and the new U.S. territorial tax system. Determination of the amount of unrecognized deferred U.S. income tax liability with respect to such earnings is not practicable.
During fiscal 2018, the Company adopted ASU No. 2016-09. There were shares of common stock issued through restricted stock units, the exercise of non-qualified stock options, or through the disqualifying disposition of incentive stock options in the years ended March 31, 2020 and 2019. The tax effect to the Company from these share transactions during fiscal 2020 and 2019 was a reduction to income tax expense of ($169,000 ) and ($1,129,000 ), respectively.
Changes in the Company’s uncertain income tax positions, excluding the related accrual for interest and penalties, are as follows:
2020 | 2019 | 2018 | ||||||||||
Beginning balance | $ | $ | $ | |||||||||
Additions for tax positions of the current year | ||||||||||||
Reductions for prior year tax positions | ( | ) | ( | ) | ||||||||
Foreign currency translation | ( | ) | ( | ) | ||||||||
Lapses in statutes of limitation | ( | ) | ||||||||||
Ending balance | $ | $ | $ | |||||||||
The Company had $46,000 and $38,000 accrued for the payment of interest and penalties at March 31, 2020 and 2019, respectively. The Company recognizes interest expense or penalties related to uncertain tax positions as a part of income tax expense in its consolidated statements of operations.
All of the unrecognized tax benefits as of March 31, 2020 would impact the effective tax rate if recognized.
The Company and its subsidiaries file income tax returns in the U.S., various state, local, and foreign jurisdictions. The Internal Revenue Service has completed an examination of the Company’s U.S. income tax returns for fiscal 2015 resulting in no adjustments. The Company has no current U.S. income tax examinations or audits.
The Company’s major tax jurisdictions are the United States and Germany. With few exceptions, the Company is no longer subject to tax examinations by tax authorities in the United States for tax years prior to March 31, 2016 and in Germany for tax years prior to March 31, 2012. The Company has a current tax examination in Germany for fiscal years 2012 to 2014.
The Company anticipates that total unrecognized tax benefits will change due to the settlement of audits in certain foreign jurisdictions prior to March 31, 2021.
18. Leases
Transition
In February 2016, the FASB issued ASU No. 2016-02, "Leases (Topic 842)" ("ASC 842"). ASC 842 requires the recognition of lease ROU assets and lease liabilities by lessees for those leases classified as operating leases and additional disclosures regarding the nature of the Company's leases, significant judgments made, and amounts recognized in the financial statements relating to those leases. The Company adopted this standard effective April 1, 2019 under the modified retrospective method whereas comparative period information is not restated. In addition, the Company elected the package of practical expedients which permits the Company to not reassess whether existing contracts are or contain leases, to not reassess the lease classification of any existing leases, and to not reassess initial direct costs for any existing leases. The Company also elected the practical expedient to not
82
separate lease and non-lease components for all classes of underlying assets and made an accounting policy election to not record leases with an initial term of twelve months or less on the balance sheet for all classes of underlying assets.
As a result of the adoption of ASC 842, the Company recognized an initial operating lease ROU assets of $35,553,000 on April 1, 2019 with a corresponding lease liability of the same amount. The standard did not materially impact the Company's Consolidated Statement of Operations or the Consolidated Statements of Cash Flows for the fiscal year ending March 31, 2020.
Nature of leases
The Company's leases are classified as operating leases and consist of manufacturing facilities, sales offices, distribution centers, warehouses, vehicles, and equipment. For leases with terms greater than twelve months, at lease commencement the Company recognizes a ROU asset and a lease liability. The initial lease liability is recognized at the present value of remaining lease payments over the lease term. Leases with an initial term of twelve months or less are not recorded on the Company's Consolidated Balance Sheet. The Company recognizes lease expense for operating leases on a straight-line basis over the lease term. Additionally, because the Company has elected to not separate lease and non-lease components, variable costs also include payments to the landlord for common area maintenance, real estate taxes, insurance, and other operating expenses.
The Company's leases have lease terms ranging from 1 to 15 years, some of which include options to extend or terminate the lease. The exercise of lease renewal options is at the Company’s sole discretion. When deemed reasonably certain of exercise, the renewal options are included in the determination of the lease term. The Company’s lease agreements do not contain material residual value guarantees or any material restrictive covenants.
As of March 31, 2020, the Company does not have any significant additional operating leases that have not yet commenced.
Significant assumptions or judgments
The discount rate implicit within each lease is generally not readily determinable, therefore, the Company uses its estimated incremental borrowing rate in determining the present value of lease payments. The incremental borrowing rate is determined based on the Company’s recent debt issuances, lease term, and the currency in which lease payments are made.
The following table presents the weighted average remaining lease term and discount rate:
March 31, 2020 | ||
Weighted-average remaining lease term (in years) | ||
Weighted-average discount rate | % | |
Amounts recognized on the financial statements
The following table illustrates the balance sheet classification for ROU assets and lease liabilities as of March 31, 2020 (in thousands):
Balance sheet classification | March 31, 2020 | |||
Assets | Other assets | $ | ||
Current | Accrued liabilities | |||
Non-current | Other non current liabilities | |||
Total liabilities | $ | |||
Operating lease expense of $8,869,000 for the fiscal year ending March 31, 2020 is included in income from operations on the Consolidated Statements of Operations. Short-term lease expense, sublease income, and variable lease expenses are not material for the fiscal year ending March 31, 2020. Rental expense for the years ended March 31, 2019 and 2018 was $12,248,000 and $13,020,000 , respectively, under ASC 840 (prior to the adoption of ASC 842).
83
Other lease disclosures
At March 31, 2020, the maturities of operating lease liabilities were as follows (in thousands):
Year: | March 31, 2020 | ||
2021 | $ | ||
2022 | |||
2023 | |||
2024 | |||
2025 | |||
Thereafter | |||
Total undiscounted lease payments | $ | ||
Less: imputed interest | $ | ||
Present value of lease liabilities | $ | ||
Supplemental cash flow information related to operating leases is as follows (in thousands):
Year ended March 31, 2020 | |||
Cash paid for amounts included in the measurement of operating lease liabilities | $ | ||
ROU assets obtained in exchange for new operating lease liabilities | $ | ||
19. Business Segment Information
ASC Topic 280, “Segment Reporting,” establishes the standards for reporting information about operating segments in financial statements. The Company has one operating and reportable segment for both internal and external reporting purposes.
Financial information relating to the Company’s operations by geographic area is as follows:
Year Ended March 31, | ||||||||||||
2020 | 2019 | 2018 | ||||||||||
Net sales: | ||||||||||||
United States | $ | $ | $ | |||||||||
Germany | ||||||||||||
Europe, Middle East, and Africa (Excluding Germany) | ||||||||||||
Canada | ||||||||||||
Asia Pacific | ||||||||||||
Latin America | ||||||||||||
Total | $ | $ | $ | |||||||||
Note: Net sales to external customers are attributed to geographic areas based upon the location from which the product was shipped from the Company to the customer.
Year Ended March 31, | ||||||||||||
2020 | 2019 | 2018 | ||||||||||
Total assets: | ||||||||||||
United States | $ | $ | $ | |||||||||
Germany | ||||||||||||
Europe, Middle East, and Africa (Excluding Germany) | ||||||||||||
Canada | ||||||||||||
Asia Pacific | ||||||||||||
Latin America | ||||||||||||
Total | $ | $ | $ | |||||||||
Year Ended March 31, | ||||||||||||
2020 | 2019 | 2018 | ||||||||||
Long-lived assets: | ||||||||||||
United States | $ | $ | $ | |||||||||
Germany | ||||||||||||
Europe, Middle East, and Africa | ||||||||||||
Canada | ||||||||||||
Asia Pacific | ||||||||||||
Latin America | ||||||||||||
Total | $ | $ | $ | |||||||||
Note: Long-lived assets include net property, plant, and equipment, goodwill, and other intangibles, net.
Sales by major product group are as follows: | Year Ended March 31, | |||||||||||
2020 | 2019 | 2018 | ||||||||||
Hoists | $ | $ | $ | |||||||||
Chain and rigging tools | ||||||||||||
Industrial cranes | ||||||||||||
Actuators and rotary unions | ||||||||||||
Digital power control and delivery systems | ||||||||||||
Elevator application drive systems | ||||||||||||
Other | ||||||||||||
Total | $ | $ | $ | |||||||||
On December 28, 2018, the Company sold its Tire Shredder business, and on February 28, 2019, the Company sold Crane Equipment and Service Inc. and Stahlhammer Bommern GmbH. In fiscal year 2019, these businesses accounted for chain and rigging tools sales of $12,289,000 , industrial cranes sales of $14,184,000 , and other sales of $7,722,000 .
84
COLUMBUS McKINNON CORPORATION
NOTES TO CONSOLIDATED FINANCIAL STATEMENTS - (Continued)
(tabular amounts in thousands, except share data)
20. Selected Quarterly Financial Data (Unaudited)
Below is selected quarterly financial data for fiscal 2020 and 2019:
Three Months Ended | ||||||||||||||||
June 30, 2019 | September 30, 2019 | December 31, 2019 | March 31, 2020 | |||||||||||||
Net sales | $ | $ | $ | $ | ||||||||||||
Gross profit | ||||||||||||||||
Income from operations | ||||||||||||||||
Net income (loss) | $ | $ | $ | $ | ||||||||||||
Net income (loss) per share – basic | $ | $ | $ | $ | ||||||||||||
Net income (loss) per share – diluted | $ | $ | $ | $ | ||||||||||||
Three Months Ended | ||||||||||||||||
June 30, 2018 | September 30, 2018 | December 31, 2018 | March 31, 2019 | |||||||||||||
Net sales | $ | $ | $ | $ | ||||||||||||
Gross profit | ||||||||||||||||
Income from operations | ||||||||||||||||
Net income (loss) | $ | $ | $ | ( | ) | $ | ||||||||||
Net income (loss) per share – basic | $ | $ | $ | ( | ) | $ | ||||||||||
Net income (loss) per share – diluted | $ | $ | $ | ( | ) | $ | ||||||||||
85
COLUMBUS McKINNON CORPORATION
NOTES TO CONSOLIDATED FINANCIAL STATEMENTS - (Continued)
(tabular amounts in thousands, except share data)
21. Accumulated Other Comprehensive Loss
The components of accumulated other comprehensive loss is as follows:
March 31, | ||||||||
2020 | 2019 | |||||||
Foreign currency translation adjustment – net of tax | $ | ( | ) | $ | ( | ) | ||
Pension liability – net of tax | ( | ) | ( | ) | ||||
Postretirement obligations – net of tax | ||||||||
Split-dollar life insurance arrangements – net of tax | ( | ) | ( | ) | ||||
Derivatives qualifying as hedges – net of tax | ( | ) | ( | ) | ||||
Accumulated other comprehensive loss | $ | ( | ) | $ | ( | ) | ||
The deferred taxes related to the adjustments associated with the items included in accumulated other comprehensive loss, net of deferred tax asset valuation allowances, were $7,445,000 , $2,566,000 , and $(6,848,000 ) for fiscal 2020, 2019, and 2018 respectively. Refer to Note 17 for discussion of the deferred tax asset valuation allowance. In the period subsequent to our initial recording of the valuation allowance in fiscal 2011, increases and decreases to both the deferred tax assets associated with items in accumulated other comprehensive loss, and the valuation allowance, have been recorded as offsets to comprehensive income.
As a result of the Act as described in Note 17, the Company recorded as an offsetting entry a $(9,477,000 ) stranded tax effect in the minimum pension liability component and a $(194,000 ) stranded tax effect in the split dollar life insurance arrangement component of other comprehensive income in fiscal 2018. The stranded tax effect related to the other post retirement obligations component was not material.
As a result of the recording of a deferred tax asset valuation allowance in fiscal 2011, the Company recorded as an offsetting entry a $10,006,000 stranded tax effect in the minimum pension liability component, $935,000 stranded tax effect in the other post retirement obligations component and a $747,000 stranded tax effect in the split dollar life insurance arrangement component of other comprehensive income. With the reversal of that valuation allowance in fiscal 2013, the Company recorded the reversal of the valuation allowance as a reduction of income taxes in the consolidated statement of operations.
As a result of the recording of a deferred tax asset valuation allowance in fiscal 2005, the Company recorded as an offsetting entry a $534,000 stranded tax effect in the minimum pension liability component of other comprehensive income. With the reversal of that valuation allowance in fiscal 2006, the Company recorded the reversal of the valuation allowance as a reduction of income taxes in the consolidated statement of operations.
The stranded tax effects described above are in accordance with ASC Topic 740, “Income Taxes” even though the impact of the act and the deferred tax asset valuation allowance described above were initially established as an adjustment to comprehensive income. This amount will remain indefinitely as a component of accumulated other comprehensive loss. As described in Note 22, the Company is evaluating the impact ASU 2018-02 will have accumulated other comprehensive income. Refer to Note 22 for additional information.
86
COLUMBUS McKINNON CORPORATION
NOTES TO CONSOLIDATED FINANCIAL STATEMENTS - (Continued)
(tabular amounts in thousands, except share data)
The activity by year related to investments, including reclassification adjustments for activity included in earnings are as follows (all items shown net of tax):
Year Ended March 31, | ||||||||||||
2020 | 2019 | 2018 | ||||||||||
Net unrealized investment gain (loss) at beginning of year | $ | $ | $ | |||||||||
Unrealized holdings gain (loss) arising during the period | ||||||||||||
Reclassification adjustments for gain included in earnings | ||||||||||||
Adoption of ASU 2016-01 | ( | ) | ||||||||||
Net change in unrealized gain (loss) on investments | ( | ) | ||||||||||
Net unrealized investment gain at end of year | $ | $ | $ | |||||||||
Changes in accumulated other comprehensive income by component for the year ended March 31, 2020 are as follows (in thousands):
March 31, 2020 | |||||||||||||||||
Retirement Obligations | Foreign Currency | Change in Derivatives Qualifying as Hedges | Total | ||||||||||||||
Beginning balance net of tax | $ | ( | ) | $ | ( | ) | $ | ( | ) | ( | ) | ||||||
Other comprehensive income (loss) before reclassification | ( | ) | ( | ) | ( | ) | |||||||||||
Amounts reclassified from other comprehensive loss to net income | ( | ) | ( | ) | |||||||||||||
Net current period other comprehensive (loss) income | ( | ) | ( | ) | ( | ) | |||||||||||
Ending balance net of tax | $ | ( | ) | $ | ( | ) | $ | ( | ) | $ | ( | ) | |||||
87
COLUMBUS McKINNON CORPORATION
NOTES TO CONSOLIDATED FINANCIAL STATEMENTS - (Continued)
(tabular amounts in thousands, except share data)
Details of amounts reclassified out of accumulated other comprehensive loss for the year ended March 31, 2020 are as follows (in thousands):
Details of AOCL Components | Amount reclassified from AOCL | Affected line item on consolidated statement of operations | ||||
Net pension amount unrecognized | ||||||
$ | (1) | |||||
Total before tax | ||||||
( | ) | Tax benefit | ||||
$ | Net of tax | |||||
Change in derivatives qualifying as hedges | ||||||
$ | ( | ) | Cost of products sold | |||
( | ) | Interest expense | ||||
( | ) | Foreign currency | ||||
( | ) | Total before tax | ||||
Tax benefit | ||||||
$ | ( | ) | Net of tax | |||
(1) | These accumulated other comprehensive loss components are included in the computation of net periodic pension cost. (See Note 13 — Pensions and Other Benefit Plans for additional details.) |
22. Effects of New Accounting Pronouncements
ASU 2016-02 (Topic 842) - Adopted in fiscal 2020
In March 2019, the FASB issued ASU No. 2019-01, "Codification Improvements: Leases (Topic 842)." The ASU clarifies transition disclosure requirements, specifically that entities are not subject to the transition disclosure requirements in ASC 250 related to the effect on income of an accounting change on certain interim period information. The ASU was effective for fiscal years beginning after December 15, 2018, and interim periods within those years, with early adoption permitted no earlier than when the entity adopts ASC 842.
In December 2018, the FASB issued ASU No. 2018-20, "Narrow-Scope Improvements for Lessors (Topic 842)." The ASU gives lessors elections to account for the following under the new lease standard: sales taxes and other similar taxes collected from lessees, lessor costs paid directly by a lessee, and recognition of variable payments for contracts with lease and nonlease components. The ASU was effective for fiscal years beginning after December 15, 2018, and interim periods within those years, with early adoption permitted no earlier than when the entity adopts ASC 842.
In July 2018, the FASB issued ASU No. 2018-11, "Leases (Topic 842): Targeted Improvements." Under the ASU, entities may elect not to recast the comparative periods presented when transitioning to ASC 842 and lessors may elect not to separate lease and nonlease components when certain conditions are met. The ASU was effective for fiscal years beginning after December 15, 2018, and interim periods within those years, with early adoption permitted no earlier than when the entity adopts ASC 842.
In July 2018, the FASB issued ASU No. 2018-10, "Codification Improvements to Topic 842." Under the ASU, various aspects within ASC 842 were improved, such as the rate implicit in the lease, lessee's reassessment of lease classification, lease term and purchase option, as well as many others aspects of the guidance. The ASU is effective when the entity adopts ASC 842.
88
COLUMBUS McKINNON CORPORATION
NOTES TO CONSOLIDATED FINANCIAL STATEMENTS - (Continued)
(tabular amounts in thousands, except share data)
In February 2016, the FASB issued ASU No. 2016-02, "Leases (Topic 842)." This standard requires all leases with durations greater than twelve months to be recognized on the balance sheet as right-of-use ("ROU") assets and leases liabilities. The standard also requires additional disclosures about leasing arrangements and requires a modified retrospective transition approach for existing leases, whereby the standard will be applied to the earliest year presented. The Company adopted this standard and all related standards effective April 1, 2019. Refer to Note 18 (Leases) for the transition impact and further details.
Other Topics adopted in fiscal 2020
In July 2019, the FASB issued ASU No. 2019-07, "Codification Updates to SEC Sections." The standard aligns the guidance in various SEC sections of the codification with the requirements of certain SEC final rules. The standard became effective upon issuance and the standard did not have a material impact on the financial statements for the twelve months ended March 31, 2020.
In June 2018, the FASB issued ASU No. 2018-07, "Improvements to Nonemployee Share-Based Payment Accounting (Topic 550 and 718)." The standard simplifies the accounting for share-based payments granted to nonemployees for goods and services. Under the ASU, most of the guidance on such payments to nonemployees (accounted for under ASC 550) would be aligned with the requirements for share-based payments granted to employees (accounted for under ASC 718). The Company adopted this standard effective April 1, 2019 and the standard did not have a material impact on the financial statements for the twelve months ended March 31, 2020.
In February 2018, the FASB issued ASU No. 2018-02, "Income Statement - Reporting Comprehensive Income (Topic 220): Reclassification of Certain Tax Effects from Accumulated Other Comprehensive Income." This ASU amends ASC 220, Income Statement — Reporting Comprehensive Income, to allow a reclassification from accumulated other comprehensive income to retained earnings for stranded tax effects resulting from the Tax Cuts and Jobs Act. The Company adopted this standard effective April 1, 2019 and did not make the election to reclassify the income tax effects of the Tax Cuts and Jobs Act from accumulated other comprehensive income to retained earnings.
In August 2017, the FASB issued ASU No. 2017-12, "Targeted Improvements to Accounting for Hedging Activities (Topic 815)." The standard better aligns an entity’s financial reporting for hedging relationships with risk management activities and reduces the complexity for the application of hedge accounting. For example, the ASU continues to require an initial prospective quantitative hedge effectiveness assessment and documentation at hedge inception. However, if certain criteria are met, entities can elect to subsequently perform prospective and retrospective effectiveness assessments qualitatively, unless facts and circumstances change, and the hedge effectiveness assessment generally does not need to be completed until the first quarterly hedge effectiveness assessment date (i.e., up to three months). The new standard also removes the concept of separately measuring and reporting hedge ineffectiveness and requires a company to present the earnings effect of the hedging instrument, including any ineffectiveness, in the same income statement line item in which the earnings effect of the hedged item is reported. The Company adopted this standard effective April 1, 2019 and the standard did not have a material impact on the financial statements for the twelve months ended March 31, 2020. The Company adopted the guidance on the modified retrospective basis and did not recognize a cumulative effect adjustment upon adoption as the Company had not recognized ineffectiveness on any of the hedging instruments existing as of the date of adoption.
Other Topics not yet adopted
In March 2020, the FASB issued ASU No. 2020-04, "Reference Rate Reform (Topic 848): Facilitation of the Effects of Reference Rate Reform on Financial Reporting." The ASU is elective and is relief to all entities, subject to meeting certain criteria, that have contracts, hedging relationships, and other transactions that reference LIBOR or another reference rate expected to be discontinued because of reference rate reform. Optional expedients are provided for contract modification accounting under topics such as debt, leases, and derivatives. The optional amendments are effective for all entities as of any date from the beginning of an interim period that includes or is subsequent to March 12, 2020 through December 31, 2022. We are currently evaluating the impact the standard will have on our consolidated financial statements if we chose to elect.
In March 2020, the FASB issued ASU No. 2020-03, "Codification Improvements to Financial Instruments." The ASU makes narrow-scope improvements to various aspects of the financial instruments guidance, including the current expected credit losses CECL) standard issued in 2016. Certain issues (topics) in the standard are effective upon issuance and did not have a material impact on our consolidated financial statements. The two issues that pertain to CECL are effective when the Company adopts ASU 2016-13 (fiscal 2021, discussed below).
89
COLUMBUS McKINNON CORPORATION
NOTES TO CONSOLIDATED FINANCIAL STATEMENTS - (Continued)
(tabular amounts in thousands, except share data)
In December 2019, the FASB issued ASU No. 2019-12, "Simplifying the Accounting for Income Taxes" (Topic 740). The standard clarifies, among other topics, that the effects of an enacted change in tax law on taxes currently payable or refundable for the current year be reflected in the computation of the annual effective tax rate in the first interim period that includes the enactment date of the new legislation. The standard is effective for fiscal years, and interim periods within those years, beginning after December 15, 2020. Early adoption is permitted for fiscal years, and interim periods within those years. We are currently evaluating the impact the standard will have on our consolidated financial statements.
In November 2019, the FASB issued ASU No. 2019-11, "Codification Improvements to Topic 326: Financial Instruments - Credit Losses." The ASU allows, among other aspects, companies to make accounting policy elections to simplify certain aspects of the presentation and measurement of accrued interest on receivables as well as certain practical expedients for disclosure of accrued interest and financial assets secured by collateral maintenance provisions. The ASU is effective when the entity adopts ASU 2016-13, which is fiscal 2021 for the Company.
In May 2019, the FASB issued ASU No. 2019-05, "Financial Instruments - Credit Losses (Topic 326): Targeted Transition Relief." The ASU allows companies to elect, upon adoption of ASU 2016-13, the fair value option on financial instruments that were previously recorded at amortized cost and are within the scope of ASC 326-20 if the instruments are eligible for the fair value option under ASC 825-10. The ASU is effective when the entity adopts ASU 2016-13.
In November 2018, the FASB issued ASU No. 2018-19, "Codification Improvements to Topic 326: Financial Instruments - Credit Losses." The ASU changes the effective date of ASU 2016-13, Financial Instruments - Credit Losses, to fiscal years beginning after December 15, 2019, including interim periods within those fiscal years.
In June 2016, the FASB issued ASU No. 2016-13, “Financial Instruments - Credit Losses (Topic 326): Measurement of Credit Losses on Financial Instruments” (“ASU 2016-13”). The standard changes the methodology for measuring credit losses on financial instruments and the timing of when such losses are recorded. ASU 2016-13 is effective for fiscal years, and interim periods within those years, beginning after December 15, 2019. The Company has made significant progress on its implementation plan and is on track to adopt this standard effective fiscal 2021. We are currently updating our existing allowance for doubtful accounts policy and enhancing our controls in order to comply with the new standard and expect the impact to consolidated financial statement to be immaterial. However, the Company is monitoring the impact that COVID-19 is having on our customers and their outstanding receivable balances and is taking preventative measures, such as tightening credit limits and increasing bad debt expense, as necessary.
In August 2018, the FASB issued ASU No. 2018-14, "Disclosure Framework - Changes to the Disclosure Requirements for Defined Benefit Plan (Topic 715)." The ASU amends ASC 715 to add, remove, and clarify disclosure requirements related to defined benefit pension and other postretirement plans such as a narrative description describing the reasons for significant gains and losses affecting the benefit obligation for the period and the removal of disclosing amounts in accumulated other comprehensive income expected to be recognized as part of net periodic benefit cost over the next year. The ASU is effective for fiscal years beginning after December 15, 2020 with early adoption permitted. We anticipate this standard will change the disclosures in the Net Periodic Benefit Cost footnote in the Company's Form 10-K upon adoption.
In August 2018, the FASB issued ASU No. 2018-13, "Disclosure Framework - Changes to the Disclosure Requirements for Fair Value Measurement (Topic 820)." The ASU changes the fair value measurement disclosure requirements including new, eliminated, and modified disclosure requirements of ASC 820. For instance, the ASU requires the addition of disclosures for Level 3 fair value measurements with unrealized gains and losses included in other comprehensive income and disclosure of the range of the weighted average used to develop significant unobservable inputs for Level 3 measurements. The ASU is effective for fiscal years beginning after December 15, 2019, and interim periods within those years, with early adoption permitted for any eliminated or modified disclosures. We anticipate this standard will modify the disclosures in the Derivative Instruments footnote upon adoption.
90
COLUMBUS McKINNON CORPORATION
SCHEDULE II—Valuation and qualifying accounts
March 31, 2020, 2019, and 2018
Dollars in thousands
Additions | ||||||||||||||||||||||||
Description | Balance at Beginning of Period | Charged to Costs and Expenses | Charged to Other Accounts | Acquisition/Divestiture | Deductions | Balance at End of Period | ||||||||||||||||||
Year ended March 31, 2020: | ||||||||||||||||||||||||
Deducted from asset accounts: | ||||||||||||||||||||||||
Allowance for doubtful accounts | $ | $ | $ | ( | ) | $ | $ | (1) | $ | |||||||||||||||
Deferred tax asset valuation allowance | ( | ) | ( | ) | ||||||||||||||||||||
Total | $ | $ | $ | ( | ) | $ | $ | $ | ||||||||||||||||
Reserves on balance sheet: | ||||||||||||||||||||||||
Accrued general and product liability costs | $ | $ | $ | $ | $ | (2) | $ | |||||||||||||||||
Year ended March 31, 2019: | ||||||||||||||||||||||||
Deducted from asset accounts: | ||||||||||||||||||||||||
Allowance for doubtful accounts | $ | $ | $ | ( | ) | $ | ( | ) | $ | (1) | $ | |||||||||||||
Deferred tax asset valuation allowance | ( | ) | ( | ) | ||||||||||||||||||||
Total | $ | $ | $ | ( | ) | $ | ( | ) | $ | $ | ||||||||||||||
Reserves on balance sheet: | ||||||||||||||||||||||||
Accrued general and product liability costs | $ | $ | $ | $ | $ | (2) | $ | |||||||||||||||||
Year ended March 31, 2018: | ||||||||||||||||||||||||
Deducted from asset accounts: | ||||||||||||||||||||||||
Allowance for doubtful accounts | $ | $ | $ | $ | $ | (1) | $ | |||||||||||||||||
Deferred tax asset valuation allowance | ( | ) | ||||||||||||||||||||||
Total | $ | $ | $ | $ | $ | $ | ||||||||||||||||||
Reserves on balance sheet: | ||||||||||||||||||||||||
Accrued general and product liability costs | $ | $ | $ | $ | $ | (2) | $ | |||||||||||||||||
_________________
(1) | Uncollectible accounts written off, net of recoveries |
(2) | Insurance claims and expenses paid |
91
Item 9. Changes in and Disagreements with Accountants on Accounting and Financial Disclosures
None.
Item 9A. Controls and Procedures
Management’s Evaluation of Disclosure Controls and Procedures
As of March 31, 2020, an evaluation was performed under the supervision and with the participation of our management, including the Chief Executive Officer and Chief Financial Officer, of the effectiveness of the design and operation of our disclosure controls and procedures. Based on that evaluation, our management, including the Chief Executive Officer and Chief Financial Officer, concluded that our disclosure controls and procedures were effective as of March 31, 2020.
Management’s Report on Internal Control Over Financial Reporting
Our management is responsible for establishing and maintaining adequate internal control over financial reporting, as such term is defined in Exchange Act Rules 13a-15(f) and 15d-15(f). Under the supervision and with the participation of our management, including our Chief Executive Officer and Chief Financial Officer, we conducted an evaluation of the effectiveness of our internal control over financial reporting based on the framework in Internal Control--Integrated Framework issued by the Committee of Sponsoring Organizations of the Treadway Commission (2013 framework) (COSO). Based on that evaluation, our management concluded that our internal control over financial reporting was effective as of March 31, 2020.
The effectiveness of the Company’s internal control over financial reporting as of March 31, 2020 has been audited by Ernst & Young LLP, an independent registered public accounting firm, as stated in their report which is included herein.
Our management, including the CEO and CFO, does not expect that our disclosure controls or our internal control over financial reporting will prevent or detect all error and all fraud. A control system, no matter how well designed and operated, can provide only reasonable, not absolute, assurance that the control system’s objectives will be met. The design of a control system must reflect the fact that there are resource constraints, and the benefits of controls must be considered relative to their costs. Further, because of the inherent limitations in all control systems, no evaluation of controls can provide absolute assurance that misstatements due to error or fraud will not occur or that all control issues and instances of fraud, if any, have been detected. These inherent limitations include the realities that judgments in decision-making can be faulty and that breakdowns can occur because of simple error or mistake. Controls can also be circumvented by the individual acts of some persons, by collusion of two or more people, or by management override of the controls. The design of any system of controls is based in part on certain assumptions about the likelihood of future events, and there can be no assurance that any design will succeed in achieving its stated goals under all potential future conditions. Projections of any evaluation of controls effectiveness to future periods are subject to risks. Over time, controls may become inadequate because of changes in conditions or deterioration in the degree of compliance with policies or procedures.
Changes in Internal Control over Financial Reporting
There have been no changes in internal control over financial reporting during the three months ended March 31, 2020 that have materially affected, or are reasonably likely to materially affect, our internal control over financial reporting.
92
Report of Independent Registered Public Accounting Firm
To the Shareholders and the Board of Directors of Columbus McKinnon Corporation
Opinion on Internal Control over Financial Reporting
We have audited Columbus McKinnon Corporation’s internal control over financial reporting as of March 31, 2020, based on criteria established in Internal Control-Integrated Framework issued by the Committee of Sponsoring Organizations of the Treadway Commission (2013 framework) (the COSO criteria). In our opinion, Columbus McKinnon Corporation (the Company) maintained, in all material respects, effective internal control over financial reporting as of March 31, 2020, based on the COSO criteria.
We also have audited, in accordance with the standards of the Public Company Accounting Oversight Board (United States) (PCAOB), the consolidated balance sheets as of March 31, 2020 and 2019, the related consolidated statements of operations, comprehensive income, shareholders' equity and cash flows for each of the three years in the period ended March 31, 2020, and the related notes and financial statement schedule listed in the Index at Item 15(2) and our report dated May 27, 2020 expressed an unqualified opinion thereon.
Basis for Opinion
The Company’s management is responsible for maintaining effective internal control over financial reporting and for its assessment of the effectiveness of internal control over financial reporting included in the accompanying Management's Report on Internal Control over Financial Reporting. Our responsibility is to express an opinion on the Company’s internal control over financial reporting based on our audit. We are a public accounting firm registered with the PCAOB and are required to be independent with respect to the Company in accordance with the U.S. federal securities laws and the applicable rules and regulations of the Securities and Exchange Commission and the PCAOB.
We conducted our audit in accordance with the standards of the PCAOB. Those standards require that we plan and perform the audit to obtain reasonable assurance about whether effective internal control over financial reporting was maintained in all material respects.
Our audit included obtaining an understanding of internal control over financial reporting, assessing the risk that a material weakness exists, testing and evaluating the design and operating effectiveness of internal control based on the assessed risk, and performing such other procedures as we considered necessary in the circumstances. We believe that our audit provides a reasonable basis for our opinion.
Definition and Limitations of Internal Control Over Financial Reporting
A company’s internal control over financial reporting is a process designed to provide reasonable assurance regarding the reliability of financial reporting and the preparation of financial statements for external purposes in accordance with generally accepted accounting principles. A company’s internal control over financial reporting includes those policies and procedures that (1) pertain to the maintenance of records that, in reasonable detail, accurately and fairly reflect the transactions and dispositions of the assets of the company; (2) provide reasonable assurance that transactions are recorded as necessary to permit preparation of financial statements in accordance with generally accepted accounting principles, and that receipts and expenditures of the company are being made only in accordance with authorizations of management and directors of the company; and (3) provide reasonable assurance regarding prevention or timely detection of unauthorized acquisition, use, or disposition of the company’s assets that could have a material effect on the financial statements.
Because of its inherent limitations, internal control over financial reporting may not prevent or detect misstatements. Also, projections of any evaluation of effectiveness to future periods are subject to the risk that controls may become inadequate because of changes in conditions, or that the degree of compliance with the policies or procedures may deteriorate.
/s/ Ernst & Young LLP
Buffalo, New York
May 27, 2020
93
Item 9B. Other Information
None.
PART III
Item 10. Directors and Executive Officers of the Registrant
The information regarding Directors and Executive Officers of the Registrant will be included in a Proxy Statement to be filed with the Commission prior to July 31, 2020 and upon the filing of such Proxy Statement, is incorporated by reference herein.
The charters of our Audit Committee, Compensation and Succession Committee, and Governance and Nomination Committee are available on our website at www.columbusmckinnon.com and are available to any shareholder upon request to the Corporate Secretary. The information on the Company's website is not incorporated by reference into this Annual Report on Form 10-K.
We have adopted a code of ethics that applies to all of our employees, including our principal executive officer, principal financial officer and principal accounting officer, as well as our directors. Our code of ethics, the Columbus McKinnon Corporation Legal Compliance & Business Ethics Manual, is available on our website at www.columbusmckinnon.com. We intend to disclose any amendment to, or waiver from, the code of ethics that applies to our principal executive officer, principal financial officer or principal accounting officer otherwise required to be disclosed under Item 10 of Form 8-K by posting such amendment or waiver, as applicable, on our website.
Item 11. Executive Compensation
The information regarding Executive Compensation will be included in a Proxy Statement to be filed with the Commission prior to July 31, 2020 and upon the filing of such Proxy Statement, is incorporated by reference herein.
Item 12. Security Ownership of Certain Beneficial Owners and Management and Related Stockholder Matters
The information regarding Security Ownership of Certain Beneficial Owners and Management and regarding equity compensation plan incorporation will be included in a Proxy Statement to be filed with the Commission prior to July 31, 2020 and upon the filing of such Proxy Statement, is incorporated by reference herein.
Item 13. Certain Relationships and Related Transactions, and Director Independence
The information regarding Certain Relationships and Related Transactions will be included in a Proxy Statement to be filed with the Commission prior to July 31, 2020 and upon the filing of such Proxy Statement, is incorporated by reference herein.
Item 14. Principal Accountant Fees and Services
The information regarding Principal Accountant Fees and Services will be included in a Proxy Statement to be filed with the Commission prior to July 31, 2020 and upon the filing of such Proxy Statement, is incorporated by reference herein.
94
PART IV
Item 15. Exhibits and Financial Statement Schedules
(1) | Financial Statements: |
The following consolidated financial statements of Columbus McKinnon Corporation are included in Item 8:
Reference | Page No. |
Report of Independent Registered Public Accounting Firm | |
Consolidated Balance Sheets - March 31, 2020 and 2019 | |
Consolidated Statements of Operations – Years ended March 31, 2020, 2019, and 2018 | |
Consolidated Statements of Comprehensive Income – Years ended March 31, 2020, 2019, and 2018 | |
Consolidated Statements of Shareholders’ Equity – Years ended March 31, 2020, 2019, and 2018 | |
Consolidated Statements of Cash Flows – Years ended March 31, 2020, 2019, and 2018 | |
Notes to consolidated financial statements | |
(2) | Financial Statement Schedule: | Page No. |
Schedule II - Valuation and qualifying accounts | ||
All other schedules for which provision is made in the applicable accounting regulation of the Securities and Exchange Commission are not required under the related instructions or are inapplicable and therefore have been omitted. | ||
(3) | Exhibits: |
Exhibit Number | Exhibit | ||
3.1 | Restated Certificate of Incorporation of the Registrant (incorporated by reference to Exhibit 3.1 to the Company’s Registration Statement No. 33-80687 on Form S-1 dated December 21, 1995). | ||
Amended By-Laws of the Registrant (incorporated by reference to Exhibit 3.1 to the Company’s Current Report on Form 8-K dated March 28, 2013). | |||
Certificate of Amendment to the Restated Certificate of Incorporation of Columbus McKinnon Corporation, dated as of May 18, 2009 (incorporated by reference to Exhibit 3.1 to the Company’s Current Report on Form 8-K dated May 18, 2009). | |||
Amended and Restated By-Laws of the Registrant (incorporated by reference to Exhibit 3.5 to the Company’s Current Report on Form 8-K dated March 29, 2018). | |||
4.1 | Specimen common share certificate (incorporated by reference to Exhibit 4.1 to the Company’s Registration Statement No. 33-80687 on Form S-1 dated December 21, 1995.) | ||
#10.1 | Agreement by and among Columbus McKinnon Corporation Employee Stock Ownership Trust, Columbus McKinnon Corporation and Marine Midland Bank, dated November 2, 1995 (incorporated by reference to Exhibit 10.6 to the Company’s Registration Statement No. 33-80687 on Form S-1 dated December 21, 1995). | ||
#10.2 | Columbus McKinnon Corporation Employee Stock Ownership Plan Restatement Effective April 1, 1989 (incorporated by reference to Exhibit 10.23 to the Company’s Registration Statement No. 33-80687 on Form S-1 dated December 21, 1995). | ||
95
#10.3 | Amendment No. 1 to the Columbus McKinnon Corporation Employee Stock Ownership Plan as Amended and Restated as of April 1, 1989, dated March 2, 1995 (incorporated by reference to Exhibit 10.24 to the Company’s Registration Statement No. 33-80687 on Form S-1 dated December 21, 1995). | ||
#10.4 | Amendment No. 2 to the Columbus McKinnon Corporation Employee Stock Ownership Plan, dated October 17, 1995 (incorporated by reference to Exhibit 10.38 to the Company’s Annual Report on Form 10-K for the fiscal year ended March 31, 1997). | ||
#10.5 | Amendment No. 3 to the Columbus McKinnon Corporation Employee Stock Ownership Plan, dated March 27, 1996 (incorporated by reference to Exhibit 10.39 to the Company’s Annual Report on Form 10-K for the fiscal year ended March 31, 1997). | ||
#10.6 | Amendment No. 4 of the Columbus McKinnon Corporation Employee Stock Ownership Plan as Amended and Restated as of April 1, 1989, dated September 30, 1996 (incorporated by reference to Exhibit 10.1 to the Company’s Quarterly Report on Form 10-Q for the quarterly period ended September 30, 1996). | ||
#10.7 | Amendment No. 5 to the Columbus McKinnon Corporation Employee Stock Ownership Plan as Amended and Restated as of April 1, 1989, dated August 28, 1997 (incorporated by reference to Exhibit 10.37 to the Company’s Annual Report on Form 10-K for the fiscal year ended March 31, 1998). | ||
#10.8 | Amendment No. 6 to the Columbus McKinnon Corporation Employee Stock Ownership Plan as Amended and Restated as of April 1, 1989, dated June 24, 1998 (incorporated by reference to Exhibit 10.38 to the Company’s Annual Report on Form 10-K for the fiscal year ended March 31, 1998). | ||
#10.9 | Amendment No. 7 to the Columbus McKinnon Corporation Employee Stock Ownership Plan as Amended and Restated as of April 1, 1989, dated April 30, 2000 (incorporated by reference to Exhibit 10.24 to the Company’s Annual Report on Form 10-K for the fiscal year ended March 31, 2000). | ||
#10.10 | Amendment No. 8 to the Columbus McKinnon Corporation Employee Stock Ownership Plan as Amended and Restated as of April 1, 1989, dated March 26, 2002 (incorporated by reference to Exhibit 10.30 to the Company’s Annual Report on Form 10-K for the fiscal year ended March 31, 2002). | ||
Amendment No. 9 to the Columbus McKinnon Corporation Employee Stock Ownership Plan as Amended and Restated as of April 1, 1989, dated March 27, 2003 (incorporated by reference to Exhibit 10.32 to the Company’s Annual Report on Form 10-K for the fiscal year ended March 31, 2003). | |||
#10.12 | Amendment No. 10 to the Columbus McKinnon Corporation Employee Stock Ownership Plan as Amended and Restated as of April 1, 1989, dated February 28, 2004 (incorporated by reference to Exhibit 10.12 to the Company’s Annual Report on Form 10-K for the fiscal year ended March 31, 2004). | ||
#10.13 | Amendment No. 11 to the Columbus McKinnon Corporation Employee Stock Ownership Plan as Amended and Restated as of April 1, 1989, dated December 19, 2003 (incorporated by reference to Exhibit 10.2 to the Company’s Quarterly Report on Form 10-Q for the quarterly period ended December 28, 2003). | ||
#10.14 | Amendment No. 12 to the Columbus McKinnon Corporation Employee Stock Ownership Plan as Amended and Restated as of April 1, 1989, dated March 17, 2005 (incorporated by reference to Exhibit 10.14 to the Company’s Annual Report on Form 10-K for the fiscal year ended March 31, 2005). | ||
Amendment No. 13 to the Columbus McKinnon Corporation Employee Stock Ownership Plan as Amended and Restated as of April 1, 1989, dated December 19, 2008 (incorporated by reference to Exhibit 10.1 to the Company’s Quarterly Report on Form 10-Q for the quarterly period ended December 28, 2008). | |||
#10.16 | Columbus McKinnon Corporation Personal Retirement Account Plan Trust Agreement, dated April 1, 1987 (incorporated by reference to Exhibit 10.25 to the Company’s Registration Statement No. 33-80687 on Form S-1 dated December 21, 1995). | ||
#10.17 | Second Amendment to the Columbus McKinnon Corporation Restricted Stock Plan (incorporated by reference to Exhibit 10.3 to the Company’s Quarterly Report on Form 10-Q for the quarterly period ended September 29, 2002). | ||
#10.18 | Columbus McKinnon Corporation Thrift [401(k)] Plan 1989 Restatement Effective January 1, 1998 (incorporated by reference to Exhibit 10.2 to the Company’s Quarterly Report on Form 10-Q for the quarterly period ended December 27, 1998). | ||
#10.19 | Amendment No. 1 to the 1998 Plan Restatement of the Columbus McKinnon Corporation Thrift [401(k)] Plan, dated December 10, 1998 (incorporated by reference to Exhibit 10.29 to the Company’s Annual Report on Form 10-K for the fiscal year ended March 31, 1999). | ||
#10.20 | Amendment No. 2 to the 1998 Plan Restatement of the Columbus McKinnon Corporation Thrift [401 (k)] Plan, dated June 1, 2000 (incorporated by reference to Exhibit 10.33 to the Company’s Annual Report on Form 10-K for the fiscal year ended March 31, 2000). | ||
#10.21 | Amendment No. 3 to the 1998 Plan Restatement of the Columbus McKinnon Corporation Thrift [401 (k)] Plan, dated March 26, 2002 (incorporated by reference to Exhibit 10.39 to the Company’s Annual Report on Form 10-K for the fiscal year ended March 31, 2002). | ||
#10.22 | Amendment No. 4 to the 1998 Plan Restatement of the Columbus McKinnon Corporation Thrift [401(k)] Plan, dated May 10, 2002 (incorporated by reference to Exhibit 10.4 to the Company’s Quarterly Report on Form 10-Q for the quarterly period ended September 29, 2002). | ||
96
#10.23 | Amendment No. 5 to the 1998 Plan Restatement of the Columbus McKinnon Corporation Thrift [401(k)] Plan, dated December 20, 2002 (incorporated by reference to Exhibit 10.1 to the Company’s Quarterly Report on Form 10-Q for the quarterly period ended December 29, 2002). | ||
#10.24 | Amendment No. 6 to the 1998 Plan Restatement of the Columbus McKinnon Corporation Thrift [401(k)] Plan, dated May 22, 2003 (incorporated by reference to Exhibit 10.46 to the Company’s Annual Report on Form 10-K for the fiscal year ended March 31, 2003). | ||
#10.25 | Amendment No. 7 to the 1998 Plan Restatement of the Columbus McKinnon Corporation Thrift [401(k)] Plan, dated April 14, 2004 (incorporated by reference to Exhibit 10.28 to the Company’s Annual Report on Form 10-K for the fiscal year ended March 31, 2004). | ||
#10.26 | Amendment No. 8 to the 1998 Plan Restatement of the Columbus McKinnon Corporation Thrift [401(k)] Plan, dated December 19, 2003 (incorporated by reference to Exhibit 10.3 to the Company’s Quarterly Report on Form 10-Q for the quarterly period ended December 28, 2003). | ||
#10.27 | Amendment No. 9 to the 1998 Plan Restatement of the Columbus McKinnon Corporation Thrift [401(k)] Plan, dated March 16, 2004 (incorporated by reference to Exhibit 10.30 to the Company’s Annual Report on Form 10-K for the fiscal year ended March 31, 2004). | ||
#10.28 | Amendment No. 10 to the 1998 Plan Restatement of the Columbus McKinnon Corporation Thrift [401(k)] Plan, dated July 12, 2004 (incorporated by reference to Exhibit 10.3 to the Company’s Quarterly Report on Form 10-Q for the quarterly period ended July 4, 2004). | ||
#10.29 | Amendment No. 11 to the 1998 Plan Restatement of the Columbus McKinnon Corporation Thrift [401(k)] Plan, dated March 31, 2005 (incorporated by reference to Exhibit 10.33 to the Company’s Annual Report on Form 10-K for the fiscal year ended March 31, 2005). | ||
#10.30 | Amendment No. 12 to the 1998 Plan Restatement of the Columbus McKinnon Corporation Thrift [401(k)] Plan, dated December 27, 2005 (incorporated by reference to Exhibit 10.34 to the Company’s Annual Report on Form 10-K for the fiscal year ended March 31, 2006). | ||
#10.31 | Amendment No. 13 to the 1998 Plan Restatement of the Columbus McKinnon Corporation Thrift [401(k)] Plan, dated December 21, 2006 (incorporated by reference to Exhibit 10.35 to the Company’s Annual Report on Form 10-K for the fiscal year ended March, 31, 2007). | ||
Amendment No. 14 to the 1998 Plan Restatement of the Columbus McKinnon Corporation Thrift [401(k)] Plan, dated December 21, 2007 (incorporated by reference to Exhibit 10.36 to the Company’s Annual Report on Form 10-K for the fiscal year ended March 31, 2008). | |||
Amendment No. 15 to the 1998 Plan Restatement of the Columbus McKinnon Corporation Thrift [401(k)] Plan, dated January 29, 2009 (incorporated by reference to Exhibit 10.4 to the Company’s Quarterly Report on Form 10-Q for the quarterly period ended December 28, 2008). | |||
#10.34 | Columbus McKinnon Corporation Thrift 401(k) Plan Trust Agreement Restatement Effective August 9, 1994 (incorporated by reference to Exhibit 10.32 to the Company’s Registration Statement No. 33-80687 on Form S-1 dated December 21, 1995). | ||
#10.35 | Columbus McKinnon Corporation Monthly Retirement Benefit Plan Restatement Effective April 1, 1998 (incorporated by reference to Exhibit 10.1 to the Company’s Quarterly Report on Form 10-Q for the quarterly period ended December 27, 1998). | ||
#10.36 | Amendment No. 1 to the 1998 Plan Restatement of the Columbus McKinnon Corporation Monthly Retirement Benefit Plan, dated December 10, 1998 (incorporated by reference to Exhibit 10.32 to the Company’s Annual Report on Form 10-K for the fiscal year ended March 31, 1999). | ||
#10.37 | Amendment No. 2 to the 1998 Plan Restatement of the Columbus McKinnon Corporation Monthly Retirement Benefit Plan, dated May 26, 1999 (incorporated by reference to Exhibit 10.33 to the Company’s Annual Report on Form 10-K for the fiscal year ended March 31, 1999). | ||
#10.38 | Amendment No. 3 to the 1998 Plan Restatement of the Columbus McKinnon Corporation Monthly Retirement Benefit Plan, dated March 26, 2002 (incorporated by reference to Exhibit 10.44 to the Company’s Annual Report on Form 10-K for the fiscal year ended March 31, 2002). | ||
#10.39 | Amendment No. 4 to the 1998 Plan Restatement of the Columbus McKinnon Corporation Monthly Retirement Benefit Plan, dated December 20, 2002 (incorporated by reference to Exhibit 10.1 to the Company’s Quarterly Report on Form 10-Q for the quarterly period ended December 29, 2002). | ||
#10.40 | Amendment No. 5 to the 1998 Plan Restatement of the Columbus McKinnon Corporation Monthly Retirement Benefit Plan, dated February 28, 2004 (incorporated by reference to Exhibit 10.37 to the Company’s Annual Report on Form 10-K for the fiscal year ended March 31, 2004). | ||
#10.41 | Amendment No. 6 to the 1998 Plan Restatement of the Columbus McKinnon Corporation Monthly Retirement Benefit Plan, dated March 17, 2005 (incorporated by reference to Exhibit 10.41 to the Company’s Annual Report on Form 10-K for the fiscal year ended March 31, 2005). | ||
97
#10.42 | Amendment No. 7 to the 1998 Plan Restatement of the Columbus McKinnon Corporation Monthly Retirement Benefit Plan, dated December 28, 2005 (incorporated by reference to Exhibit 10.43 to the Company’s Annual Report on Form 10-K for the fiscal year ended March 31, 2006). | ||
#10.43 | Amendment No. 8 to the 1998 Plan Restatement of the Columbus McKinnon Corporation Monthly Retirement Benefit Plan, dated December 28, 2005 (incorporated by reference to Exhibit 10.1 to the Company’s Quarterly Report on Form 10-Q for the quarterly period ended December 31, 2006). | ||
Amendment No. 9 to the 1998 Plan Restatement of the Columbus McKinnon Corporation Monthly Retirement Benefit Plan, dated April 21, 2008 (incorporated by reference to Exhibit 10.47 to the Company’s Annual Report on Form 10-K for the fiscal year ended March 31, 2008). | |||
Amendment No. 10 to the 1998 Plan Restatement of the Columbus McKinnon Corporation Monthly Retirement Benefit Plan, dated December 19, 2008 (incorporated by reference to Exhibit 10.2 to the Company’s Quarterly Report on Form 10-Q for the quarterly period ended December 28, 2008). | |||
#10.46 | Columbus McKinnon Corporation Monthly Retirement Benefit Plan Trust Agreement Effective as of April 1, 1987 (incorporated by reference to Exhibit 10.34 to the Company’s Registration Statement No. 33-80687 on Form S-1 dated December 21, 1995). | ||
#10.47 | Form of Change in Control Agreement as entered into between Columbus McKinnon Corporation and certain of its executive officers. (incorporated by reference to Exhibit 10.33 to the Company's Annual Report on Form 10-K for the fiscal year ended March 31, 1998). | ||
#10.48 | Form of Omnibus Code Section 409A Compliance Policy as entered into between Columbus McKinnon Corporation and certain of its executive officers. (incorporated by reference to Appendix to the definitive Proxy Statement for the Annual Meeting of Stockholders of Columbus McKinnon Corporation held on July 31, 2006). | ||
Amendment to the Company’s non-qualified deferred compensation plan, effective January 1, 2013. (incorporated by reference to Exhibit 5.02 of the Company’s Current Report on Form 8-K filed on July 19, 2012) | |||
2016 Long Term Incentive Plan effective August 3, 2016 (incorporated by reference to Exhibit 4.1 of the Company’s S-8 filed on August 3, 2016, as amended June 5, 2019. | |||
Credit agreement dated January 31, 2017. (incorporated by reference to Exhibit 10.1 of the Company’s Current Report on Form 8-K filed on January 31, 2017) | |||
Subsidiaries of the Registrant. | |||
Consent of Independent Registered Public Accounting Firm. | |||
Certification of the principal executive officer pursuant to Rule 13a-14(a) of the Securities Exchange Act of 1934, as amended. | |||
Certification of the principal financial officer pursuant to Rule 13a-14(a) of the Securities Exchange Act of 1934, as amended. | |||
Certification of the principal executive officer and the principal financial officer pursuant to Rule 13a-14(b) of the Securities Exchange Act of 1934, as amended and 18 U.S.C. Section 1350, as adopted by pursuant to Section 906 of the Sarbanes-Oxley Act of 2002. The information contained in this exhibit shall not be deemed filed with the Securities and Exchange Commission nor incorporated by reference in any registration statement foiled by the Registrant under the Securities Act of 1933, as amended. | |||
*101 | The financial statements from the Company’s Annual Report on Form 10-K for the twelve months ended March 31, 2020 formatted in iXBRL | ||
*101.INS | XBRL Instance Document | ||
*101.SCH | XBRL Taxonomy Extension Schema Document | ||
*101.CAL | XBRL Taxonomy Extension Calculation Linkbase Document | ||
*101.DEF | XBRL Taxonomy Extension Definition Linkbase Document | ||
*101.LAB | XBRL Taxonomy Extension Label Linkbase Document | ||
*101.PRE | XBRL Taxonomy Extension Presentation Linkbase Document | ||
*104 | Cover Page Interactive Data File (the cover page XBRL tags are embedded within the Inline XBRL document) | ||
* Filed herewith
# Indicates a Management contract or compensation plan or arrangement
98
SIGNATURES
Pursuant to the requirements of Section 13 or 15(d) of the Securities Exchange Act of 1934, the registrant has duly caused this report to be signed on its behalf by the undersigned, thereunto duly authorized.
Date: | May 27, 2020 | ||
COLUMBUS McKINNON CORPORATION | |||
By: | /s/ Richard H. Fleming | ||
Richard H. Fleming | |||
Chief Executive Officer | |||
(Principal Executive Officer) | |||
Pursuant to the requirements of the Securities Exchange Act of 1934, this report has been signed below by the following persons on behalf of the registrant and in the capacities and on the dates indicated.
99
Signature | Title | Date | ||
/s/ Richard H. Fleming | Chief Executive Officer and Chairman of the Board of Directors (Principal Executive Officer) | May 27, 2020 | ||
Richard H. Fleming | ||||
/s/ Gregory P. Rustowicz | Vice President and Chief Financial Officer (Principal Financial Officer) | May 27, 2020 | ||
Gregory P. Rustowicz | ||||
/s/ Jeanne Beliveau-Dunn | Director | May 27, 2020 | ||
Jeanne Beliveau-Dunn | ||||
/s/ Aziz S. Aghili | Director | May 27, 2020 | ||
Aziz S. Aghili | ||||
/s/ Liam G. McCarthy | Director | May 27, 2020 | ||
Liam G. McCarthy | ||||
/s/ Heath A. Mitts | Director | May 27, 2020 | ||
Heath A. Mitts | ||||
/s/ Nicholas T. Pinchuk | Director | May 27, 2020 | ||
Nicholas T. Pinchuk | ||||
/s/ Kathryn V. Roedel | Director | May 27, 2020 | ||
Kathryn V. Roedel | ||||
/s/ R. Scott Trumbull | Director | May 27, 2020 | ||
R. Scott Trumbull | ||||
/s/ Ernest R. Verebelyi | Chairman Emeritus | May 27, 2020 | ||
Ernest R. Verebelyi | ||||
100