UNITED STATES
SECURITIES AND EXCHANGE COMMISSION
Washington, D.C. 20549
FORM
Annual Report Pursuant to Section 13 or 15(d) of the Securities Exchange Act of 1934 |
For the fiscal year ended
Transition Report Pursuant to Section 13 or 15(d) of the Securities Exchange Act of 1934 |
Commission File Number:
(Exact name of registrant as specified in its charter)
|
||
(State or other jurisdiction of |
|
(I.R.S. Employer |
incorporation or organization) |
|
Identification No.) |
(
(Address, including zip code, and telephone number,
including area code, of registrant’s principal executive offices)
Securities registered pursuant to Section 12(b) of the Act:
Title of each class |
Trading Symbol |
|
Name of exchange on which registered |
|
Securities registered pursuant to Section 12(g) of the Act: None
Indicate by check mark if the registrant is a well-known seasoned issuer, as defined in Rule 405 of the Securities Act.
Indicate by check mark if the registrant is not required to file reports pursuant to Section 13 or Section 15(d) of the Act. Yes ☐
Indicate by check mark whether the registrant (1) has filed all reports required to be filed by Section 13 or 15(d) of the Securities Exchange Act of 1934 during the preceding 12 months (or for such shorter period that the registrant was required to file such reports), and (2) has been subject to such filing requirements for the past 90 days.
Indicate by check mark whether the registrant has submitted electronically every Interactive Data File required to be submitted pursuant to Rule 405 of Regulation S-T (§232.405 of this chapter) during the preceding 12 months (or for such shorter period that the registrant was required to submit such files).
Indicate by check mark whether the registrant is a large accelerated filer, an accelerated filer, a non-accelerated filer, a smaller reporting company, or an emerging growth company. See the definitions of “large accelerated filer,” “accelerated filer,” “smaller reporting company,” and “emerging growth company” in Rule 12b-2 of the Exchange Act.
☒ |
Accelerated filer |
☐ |
Emerging growth company |
||
Non-accelerated filer |
☐ |
Smaller reporting company |
|
|
If an emerging growth company, indicate by check mark if the registrant has elected not to use the extended transition period for complying with any new or revised financial accounting standards provided pursuant to Section 13(a) of the Exchange Act. ☐
Indicate by check mark whether the registrant has filed a report on and attestation to its management’s assessment of the effectiveness of its internal control over financial reporting under Section 404(b) of the Sarbanes-Oxley Act (15 U.S.C. 7262(b)) by the registered public accounting firm that prepared or issued its audit report.
If securities are registered pursuant to Section 12(b) of the Act, indicate by check mark whether the financial statements of the registrant included in the filing reflect the correction of an error to previously issued financial statements.
Indicate by check mark whether any of those error corrections are restatements that required a recovery analysis of incentive- based compensation received by any of the registrant’s executive officers during the relevant recovery period pursuant to §240.10D-1(b). ☐
Indicate by check mark whether the registrant is a shell company (as defined in Rule 12b-2 of the Act). Yes
The aggregate market value as of March 24, 2023 of the registrant’s Common Units held by non-affiliates of the registrant, based on the reported closing price of such units on the New York Stock Exchange on such date ($14.84 per unit), was approximately $
Documents Incorporated by Reference: None |
|
Total number of pages (excluding Exhibits): 144 |
SUBURBAN PROPANE PARTNERS, L.P. AND SUBSIDIARIES
INDEX TO ANNUAL REPORT ON FORM 10-K
|
|
Page |
|
|
|
|
|
|
ITEM 1. |
1 |
|
|
|
|
ITEM 1A. |
14 |
|
|
|
|
ITEM 1B. |
32 |
|
|
|
|
ITEM 2. |
32 |
|
|
|
|
ITEM 3. |
32 |
|
|
|
|
ITEM 4. |
32 |
|
|
|
|
|
|
|
|
|
|
ITEM 5. |
MARKET FOR THE REGISTRANT’S COMMON UNITS, RELATED UNITHOLDER MATTERS AND ISSUER PURCHASES OF UNITS |
33 |
|
|
|
ITEM 6. |
33 |
|
|
|
|
ITEM 7. |
MANAGEMENT’S DISCUSSION AND ANALYSIS OF FINANCIAL CONDITION AND RESULTS OF OPERATIONS |
33 |
|
|
|
ITEM 7A. |
44 |
|
|
|
|
ITEM 8. |
46 |
|
|
|
|
ITEM 9. |
CHANGES IN AND DISAGREEMENTS WITH ACCOUNTANTS ON ACCOUNTING AND FINANCIAL DISCLOSURE |
47 |
|
|
|
ITEM 9A. |
47 |
|
|
|
|
ITEM 9B. |
48 |
|
|
|
|
ITEM 9C. |
DISCLOSURE REGARDING FOREIGN JURISDICTIONS THAT PREVENT INSPECTIONS |
48 |
|
|
|
|
|
|
|
|
|
ITEM 10. |
49 |
|
|
|
|
ITEM 11. |
57 |
|
|
|
|
ITEM 12. |
SECURITY OWNERSHIP OF CERTAIN BENEFICIAL OWNERS AND MANAGEMENT AND RELATED UNITHOLDER MATTERS |
96 |
|
|
|
ITEM 13. |
CERTAIN RELATIONSHIPS AND RELATED TRANSACTIONS, AND DIRECTOR INDEPENDENCE |
97 |
|
|
|
ITEM 14. |
98 |
|
|
|
|
|
|
|
|
|
|
ITEM 15. |
99 |
|
|
|
|
ITEM 16. |
99 |
|
|
|
|
103 |
||
DISCLOSURE REGARDING FORWARD-LOOKING STATEMENTS
This Annual Report on Form 10-K contains forward-looking statements (“Forward-Looking Statements”) as defined in the Private Securities Litigation Reform Act of 1995, Section 27A of the Securities Act of 1933, as amended, and Section 21E of the Securities Exchange Act of 1934, as amended, relating to future business expectations and predictions, project developments, and financial condition and results of operations of Suburban Propane Partners, L.P. (the “Partnership”). Some of these statements can be identified by the use of forward-looking terminology such as “prospects,” “outlook,” “believes,” “estimates,” “intends,” “may,” “will,” “should,” “could,” “anticipates,” “expects” or “plans” or the negative or other variation of these or similar words, or by discussion of trends and conditions, strategies or risks and uncertainties. These Forward-Looking Statements involve certain risks and uncertainties that could cause actual results to differ materially from those discussed or implied in such Forward-Looking Statements (statements contained in this Annual Report identifying such risks and uncertainties are referred to as “Cautionary Statements”). The risks and uncertainties that could impact the Partnership’s results include, but are not limited to, the following:
Some of these Forward-Looking Statements are discussed in more detail in “Management’s Discussion and Analysis of Financial Condition and Results of Operations” in this Annual Report. Reference is also made to the risk factors discussed in Item 1A of this Annual Report. On different occasions, the Partnership or its representatives have made or may make Forward-Looking Statements in other filings with the SEC, press releases or oral statements made by or with the approval of one of the Partnership’s authorized executive officers. Readers are cautioned not to place undue reliance on Forward-Looking Statements, which reflect management’s view only as of the date made. The Partnership undertakes no obligation to update any Forward-Looking Statement or Cautionary Statement, except as required by law. All subsequent written and oral Forward-Looking Statements attributable to the Partnership or persons acting on its behalf are expressly qualified in their entirety by the Cautionary Statements in this Annual Report and in future SEC reports. For a more complete discussion of specific factors which could cause actual results to differ from those in the Forward-Looking Statements or Cautionary Statements, see “Risk Factors” in this Annual Report.
PART I
ITEM 1. BUSINESS
Development of Business
Suburban Propane Partners, L.P. (the “Partnership”), a publicly traded Delaware limited partnership, is a nationwide marketer and distributor of a diverse array of products meeting the energy needs of our customers. We specialize in the distribution of propane, renewable propane, renewable natural gas (“RNG”), fuel oil and refined fuels, as well as the marketing of natural gas and electricity in deregulated markets and production of and investor in low-carbon fuel alternatives. In support of our core marketing and distribution operations, we install and service a variety of home comfort equipment, particularly in the areas of heating and ventilation. We believe, based on LP/Gas Magazine dated February 2023, that we are the third-largest retail marketer of propane in the United States, measured by retail gallons sold in calendar year 2022. As of September 30, 2023, we were serving the energy needs of approximately 1.0 million residential, commercial, industrial and agricultural customers through approximately 700 locations in 42 states with operations principally concentrated in the east and west coast regions of the United States, as well as portions of the midwest region of the United States and Alaska. We sold approximately 396.4 million gallons of propane and 19.1 million gallons of fuel oil and refined fuels to retail customers during the year ended September 30, 2023. Together with our predecessor companies, we have been continuously engaged in the retail propane business since 1928.
We conduct our business principally through Suburban Propane, L.P., a Delaware limited partnership, which operates our propane business and assets (the “Operating Partnership”), and its direct and indirect subsidiaries. Our general partner, and the general partner of our Operating Partnership, is Suburban Energy Services Group LLC (the “General Partner”), a Delaware limited liability company whose sole member is the Chief Executive Officer of the Partnership. Since October 19, 2006, the General Partner has no economic interest in either the Partnership or the Operating Partnership (which means that the General Partner is not entitled to any cash distributions of either partnership, nor to any cash payment upon the liquidation of either partnership, nor any other economic rights in either partnership) other than as a holder of 784 Common Units of the Partnership. Additionally, under the Third Amended and Restated Agreement of Limited Partnership (as amended, the “Partnership Agreement”) of the Partnership, there are no incentive distribution rights for the benefit of the General Partner. The Partnership owns (directly and indirectly) all of the limited partner interests in the Operating Partnership. The Common Units represent 100% of the limited partner interests in the Partnership.
Direct and indirect subsidiaries of the Operating Partnership include Suburban Heating Oil Partners, LLC, which owns and operates the assets of our fuel oil and refined fuels business; Agway Energy Services, LLC, which owns and operates the assets of our natural gas and electricity business; Suburban Sales and Service, Inc., which conducts a portion of our service work and appliance and parts business; and Suburban Renewable Energy, LLC (“Suburban Renewable Energy”), which serves as the platform for our investments in innovative renewable energy technologies and businesses. Our fuel oil and refined fuels, natural gas and electricity, services and renewable energy businesses are structured as either limited liability companies that are treated as corporations or corporate entities (collectively referred to as “Corporate Entities”) and, as such, are subject to corporate level income tax.
On December 28, 2022, Suburban Renewable Energy acquired a platform of RNG production assets from Equilibrium Capital Group (“Equilibrium”), a leading sustainability-driven asset management firm. In addition, the parties formed a partnership to serve as a long-term growth platform for the identification, development and operation of additional RNG projects, including an existing pipeline of identified RNG projects that are in various stages of evaluation (the “RNG Acquisition”). The RNG platform includes the following: (1) a large-scale RNG production facility in Stanfield, Arizona that is currently operating and includes seven anaerobic digesters, manure rights from approximately 55,000 dairy cattle and an interconnect with an interstate pipeline; (2) an operating facility in Columbus, Ohio that is currently receiving tipping fees from several large food and beverage providers for processing food waste into fertilizer and biogas, and has an active development project to upgrade the biogas into RNG for sale; (3) rights of first offer for a third RNG facility in the Midwest that is currently being developed by Equilibrium; and (4) the creation of a joint venture to invest in and develop approximately $155.0 million of future RNG projects, of which Suburban Renewable Energy will own approximately 70% and Equilibrium will own approximately 30% once such projects are fully funded.
During fiscal 2022, Suburban Renewable Energy acquired a 25% equity interest in Independence Hydrogen, Inc. (“IH”), a veteran-owned and operated, privately held company developing a gaseous hydrogen ecosystem to deliver locally sourced hydrogen to local markets, with a primary focus on material handling and backup power applications. Also in fiscal 2022, Suburban Renewable Energy entered into an agreement to construct, own and operate a new biodigester system with Adirondack Farms, a family dairy farm located in Clinton County, New York (“Adirondack Farms”) for the production of RNG. Construction of the assets began during fiscal 2023, and is expected to be completed by the end of the 2024 calendar year.
During fiscal 2020, our Operating Partnership acquired a 38% equity interest in Oberon Fuels, Inc. (“Oberon”), which is a development-stage producer of low carbon renewable dimethyl ether (“rDME”) transportation fuel. Oberon is focused on the research and development of practical and affordable pathways to zero-emission transportation through its proprietary production process.
1
Oberon’s rDME fuel is a low carbon, zero-soot alternative to petroleum diesel, and when blended with propane can significantly reduce the carbon intensity (“CI”) of propane. Additionally, rDME is a carrier for hydrogen, making it easy to deliver this renewable fuel for the growing hydrogen fuel cell industry.
Suburban Energy Finance Corp., a direct 100%-owned subsidiary of the Partnership, was formed on November 26, 2003 to serve as co-issuer, jointly and severally with the Partnership, of the Partnership’s senior notes. Suburban Energy Finance Corp. has no assets and conducts no business operations.
In this Annual Report, unless otherwise indicated, the terms “Partnership,” “Suburban,” “we,” “us” and “our” are used to refer to Suburban Propane Partners, L.P. and its consolidated subsidiaries, including the Operating Partnership. The Partnership and the Operating Partnership commenced operations in March 1996 in connection with the Partnership’s initial public offering of Common Units.
We currently file Annual Reports on Form 10-K, Quarterly Reports on Form 10-Q and current reports on Form 8-K with the SEC. You may read and print copies of any materials that we file with the SEC on the SEC’s EDGAR database at www.sec.gov.
Upon written request or through an information request link from our website at www.suburbanpropane.com, we will provide, without charge, copies of our Annual Report on Form 10-K for the year ended September 30, 2023, each of the Quarterly Reports on Form 10-Q, current reports filed or furnished on Form 8-K and all amendments to such reports as soon as is reasonably practicable after such reports are electronically filed with or furnished to the SEC. Requests should be directed to: Suburban Propane Partners, L.P., Investor Relations, P.O. Box 206, Whippany, New Jersey 07981-0206. The information contained on our website is not included as part of, or incorporated by reference into, this Annual Report on Form 10-K.
Our Strategy
Our business strategy is to deliver increasing value to our Unitholders through initiatives, both internal and external, that are geared toward achieving sustainable profitable growth. In advancing this strategy, we consider the interests of our employees, customers and the communities in which we operate, as exemplified by our three corporate pillars; Go Green with Suburban Propane, SuburbanCares, and Suburban Commitment to Excellence. The following are key elements of our strategy:
Strategic Investments in the Continued Build Out of Our Renewable Energy Platform. The economy-wide energy transition to a low-carbon world offers an opportunity for us to realize top-line organic growth through advancing the significant air quality and climate benefits of traditional propane, and through continued investments in the next generation of even cleaner and lower CI renewable energy products. This dual approach has driven our engagement in particularly hard to abate segments, including heavy duty transportation and rural heating and cooking. Through our RNG Acquisition, strategic investments in Oberon and IH, our collaboration with Adirondack Farms, and collaborations with key participants in the renewable energy sector, we have begun to develop an interconnected portfolio of renewable energy assets that are focused on the distribution of renewable fuels, including hydrogen and RNG. These investments and partnerships allow us to leverage our logistics expertise as local distributors of energy, support the country’s clean energy transition, and helps position the company for long-term growth and sustainability. As a company with a 95-year legacy of being a trusted and reliable provider of energy and exceptional customer service, our goal is to lead the propane industry in the transition to a renewable energy future that provides value to our customers, Unitholders, employees, and the communities we serve in a way that ensures that we can thrive in a carbon constrained world for the next 95 years and beyond.
Growing Our Customer Base by Improving Customer Retention and Acquiring New Customers. We set clear objectives to focus our employees on seeking new customers and retaining existing customers by providing highly responsive customer service. We believe that customer satisfaction is a critical factor in the growth and success of our operations. “Our Business is Customer Satisfaction” is one of our core operating philosophies. We measure and reward our customer service centers based on a combination of profitability of the individual customer service center and net customer growth. We have made investments in training our people both on techniques to provide exceptional customer service to our existing customer base, as well as advanced sales training focused on growing our customer base.
Selective Acquisitions of Complementary Businesses or Assets. We supplement our organic customer base growth and retention initiatives with selective acquisitions of high-quality propane businesses in strategic markets, as well as identifying and fostering new market expansion efforts to establish or extend our presence and expand market share. Our acquisition strategy is to focus on businesses with a relatively steady or predictable cash flow that will extend our presence in strategically attractive markets, complement our existing business segments or provide an opportunity to diversify our operations. We are very patient, disciplined and deliberate in evaluating both traditional and renewable energy acquisition opportunities.
Internal Focus on Driving Operating Efficiencies, Right-Sizing Our Cost Structure and Enhancing Our Customer Mix. We focus internally on improving the efficiency of our existing operations, customer support, managing our cost structure, improving our
2
customer mix, and hardening our cybersecurity defenses. Through investments in our technology infrastructure, we continue to seek to improve operating efficiencies and the return on assets employed. We have developed a streamlined operating footprint and management structure to facilitate effective resource planning and decision making. Our internal efforts are particularly focused in the areas of route optimization, forecasting customer usage, customer onboarding and support, inventory and fixed assets control, cash management and customer tracking. We will continue to pursue operational efficiencies while staying focused on providing exceptional service to our customer base. Our systems platform is advanced and scalable and we will seek to leverage that technology for enhanced routing, forecasting and customer relationship management.
Selective Disposition of Non-Strategic Assets. We continuously evaluate our existing facilities to identify opportunities to optimize our return on assets by selectively divesting operations in slower growing markets, generating proceeds that can be reinvested in markets that present greater opportunities for growth. Our objective is to maximize the growth and profit potential of all of our assets.
The Three Pillars of the Suburban Propane Experience. We execute the foregoing strategy within the framework of our three corporate pillars:
Business Segments
As described below, we manage and evaluate our operations in four operating segments, three of which are reportable segments: Propane, Fuel Oil and Refined Fuels and Natural Gas and Electricity. See the Notes to the Consolidated Financial Statements included in this Annual Report for financial information about our business segments.
Propane
Propane is a by‑product of natural gas processing and petroleum refining. It is a clean burning energy source recognized for its transportability and ease of use relative to alternative forms of stand‑alone energy sources. Propane use falls into three broad categories:
In the residential, commercial and government markets, propane is used primarily for space heating, water heating, clothes drying and cooking. Industrial customers use propane generally as a motor fuel to power over‑the‑road vehicles, forklifts and stationary engines, to fire furnaces, as a cutting gas and in other process applications. In the agricultural market, propane is primarily used for tobacco curing, crop drying, poultry brooding and weed control.
Propane is extracted from natural gas or oil wellhead gas at processing plants or separated from crude oil during the refining process. It is normally transported and stored in a liquid state under moderate pressure or refrigeration for ease of handling in shipping and distribution. When the pressure is released or the temperature is increased, propane becomes a flammable gas that is colorless and odorless, although an odorant is added to allow its detection. Propane is non-toxic, clean burning and, when consumed, produces virtually no particulate matter. In addition, our equity investment in Oberon is included within the propane segment.
Product Distribution and Marketing
We distribute propane and renewable propane through a nationwide retail distribution network consisting of approximately 700 locations in 42 states as of September 30, 2023. Our operations are principally concentrated in the east and west coast regions of the United States, as well as portions of the midwest region of the United States and Alaska. As of September 30, 2023, we serviced approximately 962,000 propane customers. Typically, our customer service centers are located in suburban and rural areas where natural gas is not readily available. Generally, these customer service centers consist of an office, appliance showroom, warehouse and service facilities, with one or more 18,000 to 30,000 gallon storage tanks on the premises. Approximately 60% of our residential customers receive their propane supply through an automatic delivery system. These deliveries are scheduled through proprietary technology, based upon each customer’s historical consumption patterns and prevailing weather conditions. Additionally, we offer our customers a
3
budget payment plan whereby the customer’s estimated annual propane purchases and service contracts are paid for in a series of estimated equal monthly payments over a twelve-month period. From our customer service centers, we also sell, install and service heating and cooking appliances to customers who purchase propane from us and, at some locations, sell propane fuel systems for motor vehicles.
We sell propane primarily to seven customer markets: residential, commercial, industrial (including engine fuel), government, agricultural, other retail users and wholesale. Approximately 96% of the propane gallons sold by us in fiscal 2023 were to retail customers: 42% of those propane gallons to residential customers, 38% to commercial customers, 10% to industrial customers, 6% to government customers and 4% to agricultural customers. The balance of approximately 4% of the propane gallons sold by us in fiscal 2023 were for risk management activities and wholesale customers. No single customer accounted for 10% or more of our propane revenues during fiscal 2023.
Retail deliveries of propane are usually made to customers by means of bobtail and rack trucks. Propane is pumped from bobtail trucks, which have capacities typically ranging from 2,400 gallons to 3,500 gallons of propane, into a stationary storage tank on the customers’ premises. The capacity of these storage tanks ranges from approximately 100 gallons to approximately 1,200 gallons, with a typical tank having a capacity of 300 to 400 gallons. As is common in the propane industry, we own a significant portion of the storage tanks located on our customers’ premises. We also deliver propane to retail customers in portable cylinders, which typically have a capacity of 5 to 35 gallons. When these cylinders are delivered to customers, empty cylinders are refilled in place or transported for replenishment at our distribution locations. We also deliver propane to certain other bulk end users in larger trucks known as transports, which have an average capacity of approximately 9,000 gallons. End users receiving transport deliveries include industrial customers, large‑scale heating accounts, such as local gas utilities that use propane as a supplemental fuel to meet peak load delivery requirements, and large agricultural accounts that use propane for crop drying.
Supply
Our propane supply is purchased from approximately 45 wholesalers at approximately 145 supply points located throughout the United States and Canada. We make purchases primarily under one-year agreements that are subject to annual renewal, and also purchase propane on the spot market. Supply contracts generally provide for pricing in accordance with posted prices at the time of delivery or the current prices established at major storage points, and some contracts include a pricing formula that typically is based on prevailing market prices. Some of these agreements provide maximum and minimum seasonal purchase guidelines. Propane is generally transported from refineries, pipeline terminals, storage facilities (including our storage facility in Elk Grove, California) and coastal terminals to our customer service centers by a combination of common carriers, owner‑operators and railroad tank cars. See Item 2 of this Annual Report.
Historically, supplies of propane have been readily available from our supply sources. Although we make no assurance regarding the availability of supplies of propane in the future, we currently expect to be able to secure adequate supplies during fiscal 2024. During fiscal 2023, Crestwood Equity Partners L.P. (“Crestwood”) and Targa Liquids Marketing and Trade LLC (“Targa”) provided approximately 30% and 16% of our total propane purchases, respectively. No other single supplier accounted for 10% or more of our propane purchases in fiscal 2023. The availability of our propane supply is dependent on several factors, including the severity of winter weather, the magnitude of competing demands for available supply (e.g., crop drying and exports), the availability of transportation and storage infrastructure and the price and availability of competing fuels, such as natural gas and fuel oil. We believe that if supplies from Crestwood or Targa were interrupted, we would be able to secure adequate propane supplies from other sources without a material disruption of our operations. Nevertheless, the cost of acquiring and transporting such propane might be higher and, at least on a short-term basis, our margins could be affected. Approximately 86% of our total propane purchases were from domestic suppliers and 100% came from North America in fiscal 2023.
We seek to reduce the effect of propane price volatility on our product costs and to help ensure the availability of propane during periods of short supply. We enter into propane forward options and swap agreements with third parties to purchase and sell propane at fixed prices in the future. These activities are monitored by our senior management through enforcement of our Hedging and Risk Management Policy. See Items 7 and 7A of this Annual Report.
We own and operate a large propane storage facility in Elk Grove, California. We also operate smaller storage facilities in other locations throughout the United States and have rights to use storage facilities in additional locations. These storage facilities enable us to buy and store large quantities of propane particularly during periods of low demand, which generally occur during the summer months. This practice helps ensure a more secure supply of propane during periods of intense demand or price instability. As of September 30, 2023, the storage capacity at our facility in Elk Grove, California was leased to third parties.
4
Competition
According to the U.S. Census Bureau’s 2022 American Community Survey, propane ranks as the third most important source of residential energy in the nation, with about 5% of all households using propane as their primary space heating fuel. This level has not changed materially over the previous two decades. As an energy source, propane competes primarily with natural gas, electricity and fuel oil, principally on the basis of price, availability and portability.
Propane is more expensive than natural gas on an equivalent British Thermal Unit (“BTU”) basis in locations serviced by natural gas, but it is an alternative or supplement to natural gas in rural and suburban areas where natural gas is unavailable or portability of product is required. Historically, the expansion of natural gas into traditional propane markets has been inhibited by the capital costs required to expand pipeline and retail distribution systems, and in some territories, geological and activist challenges. The increasing availability of natural gas extracted from shale deposits in the United States may accelerate the extension of natural gas pipelines in the future. Although the extension of natural gas pipelines to previously unserved geographic areas tends to displace propane distribution in those areas, we believe new opportunities for propane sales may arise as new neighborhoods are developed in geographically remote areas.
Propane has some relative advantages over other energy sources. For example, in certain geographic areas, propane is generally less expensive to use than electricity for space heating, water heating, clothes drying and cooking. Utilization of fuel oil is geographically limited (primarily in the northeast), and even in that region, propane and fuel oil are not significant competitors because of the cost of converting from one source to the other.
In addition to competing with suppliers of other energy sources, our propane operations compete with other retail propane distributors. The retail propane industry is highly fragmented and competition generally occurs on a local basis with other large full-service multi-state propane marketers, thousands of smaller local independent marketers and farm cooperatives. Based on industry statistics contained in the 2021 Annual Retail Propane Sales Report, as published by the Propane Education & Research Council in December 2022, and LP/Gas Magazine dated February 2022, the ten largest retailers, including us, account for approximately 34% of total retail sales of propane in the United States. Each of our customer service centers operates in its own competitive environment because retail marketers tend to locate in close proximity to customers in order to lower the cost of providing service. Our typical customer service center has an effective marketing radius of approximately 50 miles, although in certain areas the marketing radius may be extended by one or more satellite offices. Most of our customer service centers compete with five or more marketers or distributors at any point in time.
Fuel Oil and Refined Fuels
Product Distribution and Marketing
We market and distribute fuel oil, kerosene, diesel fuel and gasoline to approximately 30,000 residential and commercial customers primarily in the northeast region of the United States. Sales of fuel oil and refined fuels for fiscal 2023 amounted to 19.1 million gallons. Approximately 65% of the fuel oil and refined fuels gallons sold by us in fiscal 2023 were to residential customers, principally for home heating, 7% were to commercial customers, and 7% to other users. Sales of diesel and gasoline accounted for the remaining 21% of total volumes sold in this segment during fiscal 2023. Fuel oil has a more limited use, compared to propane, and is used almost exclusively for space and water heating in residential and commercial buildings. We sell diesel fuel and gasoline to commercial and industrial customers for use primarily to operate motor vehicles.
Approximately 50% of our fuel oil customers receive their fuel oil under an automatic delivery system. These deliveries are scheduled through proprietary technology, based upon each customer’s historical consumption patterns and prevailing weather conditions. Additionally, we offer our customers a budget payment plan whereby the customer’s estimated annual fuel oil purchases are paid for in a series of estimated equal monthly payments over a twelve-month period. From our customer service centers, we also sell, install and service heating equipment to customers who purchase fuel oil from us.
Deliveries of fuel oil are usually made to customers by means of tankwagon trucks, which have capacities ranging from 2,500 gallons to 3,000 gallons. Fuel oil is pumped from the tankwagon truck into a stationary storage tank that is located on the customer’s premises, which is owned by the customer. The capacity of customer storage tanks ranges from approximately 275 gallons to approximately 1,000 gallons. No single customer accounted for 10% or more of our fuel oil and refined fuels revenues during fiscal 2023.
5
Supply
We obtain fuel oil and other refined fuels in pipeline, truckload or tankwagon quantities, and have contracts with certain pipeline and terminal operators for the right to temporarily store fuel oil at 13 terminal facilities that we do not own. We have arrangements with certain suppliers of fuel oil, which provide open access to fuel oil at specific terminals throughout the northeast. Additionally, a portion of our purchases of fuel oil are made at local wholesale terminal racks. In most cases, the supply contracts do not establish the price of fuel oil in advance; rather, prices are typically established based upon market prices at the time of delivery, plus or minus a differential for transportation and volume discounts. We purchase fuel oil from approximately 20 suppliers at approximately 45 supply points. While fuel oil supply is more susceptible to longer periods of supply constraint than propane, we believe that our supply arrangements will provide us with sufficient supply sources. Although we make no assurance regarding the availability of supplies of fuel oil in the future, we currently expect to be able to secure adequate supplies during fiscal 2024.
Competition
The fuel oil industry is a mature industry with total demand expected to remain relatively flat to moderately declining. The fuel oil industry is highly fragmented, characterized by a large number of relatively small, independently owned and operated local distributors. We compete with other fuel oil distributors offering a broad range of services and prices, from full service distributors to those that solely offer the delivery service. We are a full-service energy provider and have developed a wide range of sales programs and service offerings for our fuel oil customer base that are intended to build customer loyalty. For instance, we provide home heating equipment repair service to our fuel oil customers on a 24-hour a day basis. The fuel oil business unit also competes for retail customers with suppliers of alternative energy sources, principally natural gas, propane and electricity.
Natural Gas and Electricity
We market natural gas and electricity through our 100%-owned subsidiary, Agway Energy Services, LLC (“AES”), in the deregulated markets of New York, Pennsylvania and Maryland, primarily to residential and small commercial customers. Historically, local utility companies provided their customers with all three aspects of electric and natural gas service: generation, transmission and distribution. However, under deregulation, public utility commissions in several states are licensing energy service companies, such as AES, to act as alternative suppliers of the commodity to end consumers. In essence, the local utility companies distribute electricity and natural gas on their distribution systems and we arrange for the supply of electricity or natural gas to specific delivery points. The business strategy of this segment is to expand its market share by concentrating on growth in the customer base and expansion into other deregulated markets that are considered strategic markets.
We serve approximately 31,000 natural gas and electricity customers in New York, Pennsylvania and Maryland. AES’s customer base has been adversely impacted by several state regulations that make some customers ineligible to shop in the deregulated energy market, require that certain customers be returned to default utility service, as well as other restrictions on how prospective customers can be contacted. Specifically, an Order from the New York Public Service Commission (“NY PSC”) regarding low-income consumers went into effect in 2018 and requires that all energy service companies (“ESCOs”) stop serving certain low-income consumers. Similar orders also went into effect in Pennsylvania in 2019 and Maryland in 2023. In December 2019, the NY PSC issued an Order that imposed product, pricing, and other requirements on ESCOs (“Second Reset Order”). AES was specifically and solely exempted from complying with the criteria concerning product offerings during the pendency of further rulemaking proceedings. In September 2020, the NY PSC issued another Order reaffirming the Second Reset Order, including the exemption that allows AES to maintain its existing business model in New York while rulemaking proceedings continue. While AES is exempt from the restrictive pricing measures of the order, it is still subject to rules that restrict marketing to prospective customers. Separately, the State of New York issued a State of Emergency Order in March of 2020 due to the COVID-19 pandemic. Under New York law, telemarketers are prevented from making cold sales calls during states of emergency. As a result, AES halted cold call telemarketing activities in New York in March 2020. While the New York State of Emergency Order for COVID-19 ended in June 2021, other states of emergency were issued in NY and remain in effect. AES has adjusted its marketing programs accordingly.
During fiscal 2023, we sold approximately 1.3 million dekatherms of natural gas and 151.6 million kilowatt hours of electricity through the natural gas and electricity segment. Approximately 88% of our customers were residential households and the remainder were small commercial and industrial customers. New accounts are obtained through numerous marketing and advertising programs, including telemarketing, direct mail initiatives, and digital marketing campaigns. Most local utility companies that AES is actively marketing have established billing service arrangements whereby customers receive a single bill from the local utility company, which includes distribution charges from the local utility company, as well as supply charges for the amount of natural gas or electricity provided by AES and utilized by the customer. We have arrangements with several local utility companies that provide billing and collection services for a fee. Under these arrangements, we are paid by the local utility company for all or a portion of customer billings after a specified number of days following the customer billing with no receivables risk to AES.
6
Supply of natural gas is arranged through annual supply agreements with major national wholesale suppliers. Wholesale pricing under annual natural gas supply contracts is based on posted market prices at the time of delivery, and some contracts include a pricing formula that typically is based on prevailing market prices. Our electricity requirements are purchased through the New York Independent System Operator (“NYISO”) and PJM Interconnection (“PJM”). Other requirements, such as renewable energy credits, are purchased through supply agreements, or on the open market. Electricity pricing under the NYISO and PJM agreements are based on local market indices at the time of delivery. Competition is primarily with local utility companies, as well as other marketers of natural gas and electricity providing similar alternatives as AES.
All Other
We sell, install and service various types of whole-house heating products, air cleaners, humidifiers and space heaters to the customers of our propane and fuel oil businesses. Our supply needs are filled through supply arrangements with several large regional equipment manufacturers and distribution companies. Competition in this business is primarily with small, local heating and ventilation providers and contractors, as well as, to a lesser extent, other regional service providers. The focus of our ongoing service offerings are in support of the service needs of our existing customer base within our propane and refined fuels business segments. Additionally, we have entered into arrangements with third-party service providers to complement and, in certain instances, supplement our existing service capabilities. Our platform of RNG businesses and the equity investment in IH are included within “all other”.
Seasonality
The retail propane and fuel oil distribution businesses, as well as the natural gas marketing business, are seasonal because the primary use of these fuels is for heating residential and commercial buildings. Historically, approximately two‑thirds of our retail propane volume is sold during the six-month peak heating season from October through March. The fuel oil business tends to experience greater seasonality given its more limited use for space heating, and approximately three-fourths of our fuel oil volumes are sold between October and March. Consequently, sales and operating profits are concentrated in our first and second fiscal quarters. Cash flows from operations, therefore, are greatest during the second and third fiscal quarters when customers pay for product purchased during the winter heating season. We expect lower operating profits and either net losses or lower net income during the period from April through September (our third and fourth fiscal quarters).
Weather conditions have a significant impact on the demand for our products, in particular propane, fuel oil and natural gas, for both heating and agricultural purposes. Many of our customers rely on propane, fuel oil or natural gas primarily as a heating source. Accordingly, the volume sold is directly affected by the severity of the winter weather in our service areas, which can vary substantially from year to year. In any given area, sustained warmer than normal temperatures will tend to result in reduced propane, fuel oil and natural gas consumption, while sustained colder than normal temperatures will tend to result in greater consumption.
Trademarks and Tradenames
We rely primarily on a combination of trademark, patent, trade secret and copyright laws, as well as contractual provisions with employees and third parties, to establish and protect our intellectual property rights. We utilize a variety of trademarks and tradenames owned by us, including “Suburban Propane,” and “Agway Energy Services” and related marks or designs incorporating such related logos such as “Go Green with Suburban Propane,” “SuburbanCares” and “Energy Guard.” All of the trademarks and tradenames used by Suburban Propane and Agway Energy Services are registered (or have applications pending for registration) with the U.S. Patent and Trademark Office. We regard our trademarks, patents, tradenames and other proprietary rights as valuable assets and believe that they have significant value in the marketing of our products and services.
Government Regulation; Environmental, Health and Safety Matters
Our operations are subject to numerous federal, state and local environmental, health and safety laws and regulations. Generally, these laws and regulations impose limitations on the discharge of hazardous materials and pollutants and establish standards for the handling, transportation, distribution, treatment, storage and disposal of hazardous materials and solid and hazardous wastes, which may require the investigation, assessment, cleanup, or monitoring of, or compensation for, environmental impacts, including natural resource damages. Notably, these laws include the federal Comprehensive Environmental Response, Compensation, and Liability Act (“CERCLA”); Resource Conservation and Recovery Act (“RCRA”); Clean Air Act; Clean Water Act; National Environmental Policy Act, and their implementing regulations, as well as comparable state laws and regulations. Additionally, there are environmental laws and regulations specific to the sale of electricity and natural gas in the retail energy market by AES. Under the various laws and regulations to which we are subject, we must maintain various permits and comply with various monitoring and reporting requirements.
7
We own real property at locations where hazardous materials may be or may have been present as a result of prior activities. We expect that we will be required to expend funds to participate in the remediation of certain sites, including sites where we have been designated as a potentially responsible party under applicable laws and at sites with above ground and underground fuel storage tanks. We will also incur other expenses associated with environmental compliance. We continually monitor our operations with respect to potential environmental issues, including changes in legal requirements and remediation technologies. As of September 30, 2023, we had accrued environmental liabilities of $1.7 million representing the total estimated future liability for remediation and monitoring of all of our properties.
Estimating the extent of our responsibility at a particular site, and the method and ultimate cost of remediation and monitoring of that site, requires making numerous assumptions. As a result, the ultimate cost to remediate and monitor any site may differ from current estimates, and will depend, in part, on whether there is additional contamination, not currently known to us, relating to that site. However, we believe that our past experience provides a reasonable basis for estimating these liabilities. As additional information becomes available, estimates are adjusted as necessary. While we do not anticipate that any such adjustment would be material to our financial statements, the result of ongoing or future environmental studies or other factors could alter this expectation and require recording additional liabilities. We currently cannot determine whether we will incur additional environmental liabilities or the extent or amount of any such liabilities, or the extent to which such additional liabilities would be subject to any contractual indemnification protections.
Certain rules and procedures imposed by the National Fire Protection Association (“NFPA”), as well as comparable state laws and regulations, govern the safe handling of propane and establish industry standards for propane storage, distribution and equipment installation and operation in all of the states in which we operate. In some states, these laws and regulations are administered by state agencies, and in others they are administered on a municipal level.
The NFPA’s rules and procedures, as well as comparable state laws and regulations govern the safe handling of distillates (fuel oil, kerosene and diesel fuel) and gasoline and establish industry standards for fuel oil, kerosene, diesel fuel and gasoline storage, distribution and equipment installation and operation in all of the states in which we sell those products. In some states these laws and regulations are administered by state agencies and in others they are administered on a municipal level.
With respect to the transportation of propane, distillates and gasoline by truck, we are subject to laws and regulations that cover the transportation of hazardous materials and are administered, respectively, by the Federal Motor Carrier Safety Administration and the Pipeline and Hazardous Materials Safety Administration of the United States Department of Transportation (“DOT”), or comparable state agencies. We conduct ongoing training programs to help ensure that our operations comply with these and other applicable safety laws and regulations. We maintain various permits that are necessary to operate our equipment and facilities, some of which may be material to our operations. In compliance with the DOT’s pipeline safety regulations for “jurisdictional” propane systems that serve multiple customers, we provide training and written instruction for our employees, provide customers with periodic public awareness notices and safety information, have established written procedures to minimize the hazards resulting from gas pipeline emergencies and keep records of inspections.
Our operations are subject to workplace safety standards under the Federal Occupational Safety and Health Act of 1970 (“OSHA”) and comparable state laws that regulate the protection of worker health and safety. Compliance with these standards is monitored through required workplace injury and illness recordkeeping, and reporting. We believe that our operations comply, in all material respects, with applicable worker health and safety standards. We are also subject to laws and regulations governing the security of hazardous materials, including propane, under the Federal Homeland Security Act of 2002, as administered by the Department of Homeland Security (“DHS”). The DHS promulgated the Chemical Facility Anti-Terrorism Standards (“CFATS”) to identify and secure chemical facilities that present the greatest security risk using a risk-based tiering structure. We have a number of facilities registered with the DHS, now referred to as the “Cybersecurity and Infrastructure Security Agency” or “CISA”.
Currently, we have submitted all required Top-Screens as defined by CISA and have developed approved Site Security Plans for our regulated or “tiered” facilities. Less than 5% of our facilities are designated as tiered facilities. We expect to continue to incur minor costs associated with administrative controls and enhanced cyber and physical security measures for those tiered facilities that are subject to ongoing compliance activity.
In 2009, the U.S. Environmental Protection Agency (“EPA”) issued an Endangerment Finding under the Clean Air Act, determining that emissions of carbon dioxide, methane and four other greenhouse gases (“GHGs”) threaten the public health and welfare of current and future generations. Based on these findings, the EPA has implemented regulations to restrict emissions of GHGs from certain industries and require reporting by certain regulated entities. In 2009, the EPA also adopted the Greenhouse Gas Reporting Rule that requires reporting of greenhouse gas data and other relevant information from large GHG emission sources, fuel and industrial gas suppliers, and CO2 injection sites in the United States. While the Partnership is not a regulated entity and propane is not a greenhouse gas, these regulations impact both our core business, as well as the retail sale of electricity and natural gas by AES.
8
In June 2022, the U.S. Supreme Court issued a decision in West Virginia v. EPA, which did not preclude, but instead limited the EPA’s ability to regulate GHGs absent clear congressional authorization. The Court determined that the EPA’s emission reduction measures requiring an industry-wide shift in electricity production from coal- and natural gas-fired power plants to renewable power sources require specific congressional authorization, which had not been given under the Clean Air Act.
Nonetheless, current EPA leadership has prioritized climate change mitigation measures and has implemented regulations requiring significant reductions in GHG emissions. Changes in the White House and EPA administration may result in changes to the EPA’s prioritization of climate change mitigation. The EPA is also prioritizing environmental justice issues, which may impact how the agency addresses environmental and climate change matters. We cannot predict the impact of future changes to the EPA’s prioritization of climate change mitigation or the impact of future GHG legislation or regulations on our business, financial conditions or operations in the future.
Regardless of what happens at the federal level, numerous states and municipalities have begun to adopt laws and policies to regulate and reduce GHG emissions. These regulatory actions could require us to incur increased expenses or lost revenue. We cannot predict when, or in what form, additional climate change laws and regulations will be enacted, and what effect such laws and regulations may have on our business, financial condition or operations in the future. These current and prospective local, state, and federal laws and regulations have sparked a shift in our industry toward the next generation of clean energy. We are an industry leader in this regard by making strategic investments so we can be positioned to have an adequate clean energy supply as these laws and regulations become operative or require deeper emission reductions. For example, we have taken a 38% equity stake in Oberon, a producer of low carbon rDME transportation fuel, a 25% equity stake in IH, a veteran-owned and operated start-up company developing a low CI gaseous hydrogen ecosystem, acquired anaerobic digester facilities in Columbus, Ohio and Stanfield, Arizona through the RNG Acquisition that produce or will be producing RNG and we entered into an agreement to produce RNG at Adirondack Farms. We have also executed agreements to purchase and distribute renewable propane, which offers a low CI alternative to traditional propane, gasoline or diesel. We are committed to increasing the availability of blends of traditional propane with rDME and/or renewable propane, renewable propane, hydrogen, and RNG in the coming years.
Our investments in Oberon and IH, as well as our anaerobic digesters, are expected to result in the production of rDME, hydrogen, and RNG, respectively, all of which, along with renewable propane, are products that present an opportunity to generate environmental attributes. The monetization of these environmental attributes occurs under several state and federal programs. At the federal level those programs include: the renewable fuel standard program (“RFS”), which was authorized under the Energy Policy Act of 2005 and expanded through the Energy Independence and Security Act of 2007, and the Inflation Reduction Act of 2022 (the “Inflation Reduction Act”) that was signed into law in 2022. The RFS mandates the use of renewable fuel in the transportation fuel sector, while the Inflation Reduction Act includes tax credits and other incentives intended to combat climate change by advancing decarbonization and promoting increased investment in renewable and low CI energy. At the state level, transportation fuel programs include: the California Low Carbon Fuel Standard (“CA LCFS”), the Oregon Clean Fuels Program (“OR CFP”), and the Washington Clean Fuel Standard (“WA CFS”). These states also have GHG reduction programs: the California Cap-and-Trade Program; the Oregon Climate Protection Program; and the Washington Cap-and-Invest Program.
The RFS is administered by the EPA and requires the production and use of specific volumes with the goal of: increasing energy security by reducing dependence on foreign oil, establishing domestic biofuel industries, and improving environmental quality by reducing GHG emissions. The RFS seeks to achieve these goals by mandating that transportation fuels contain a minimum volume of renewable fuel. To enforce compliance, the EPA uses a credit system based on a biofuel’s renewable identification number (“RIN”). The amount of RIN credits (“RINs”) generated by each biofuel depends on the process and feedstock used to create the specific biofuel. There is a market for RINs and as we produce RFS-compliant biofuel we expect to generate RINs, which can be sold in the open market. Crop-based renewable fuel has the largest market-share, resulting in all RIN values being subjected to some extent or another to global agricultural commodity prices as well as the gasoline and diesel markets.
The Inflation Reduction Act is administered by multiple federal agencies including the EPA, U.S. Department of Energy (“DOE”) and the Internal Revenue Service of the U.S. Department of the Treasury (“IRS”). The goals of the Inflation Reduction Act include incentivizing the development and production of renewable energy. As of the fiscal year ended September 30, 2023, the EPA, DOE, and IRS had commenced issuing guidance on some aspects of the implementation of the Inflation Reduction Act, but much relevant guidance is still forthcoming. We cannot speculate on exactly how the Inflation Reduction Act will be implemented; however, the Act does contain numerous incentives for the production of clean energy for which certain of our renewable energy products, as well as those produced by Oberon and IH, are expected to qualify. These incentives include grants, loan guaranties, development funding, investment tax credits, and production tax credits.
At the state level, the CA LCFS, OR CFP, and WA CFS (collectively “LCFS Programs”) are administered by state agencies and have the goal of reducing GHG emissions from the transportation sector by lowering the CI of transportation fuels. While there are differences in the CA LCFS, OR CFP, and WA CFS, all LCFS Programs seek to achieve their goals through annual reductions in a
9
baseline where low CI transportation fuels that are below the baseline generate LCFS Program credits (“LCFS Credits”). In addition to our renewable energy product offerings, as well as those produced by Oberon and IH, traditional propane, when used as an engine fuel in LCFS Program states, also qualifies for LCFS Credits. As we sell LCFS Program compliant fuels, we generate LCFS Credits. There are individual state LCFS Credit markets under the various LCFS Programs, and we can sell our LCFS Credits in these respective open markets.
Also at the state level, the California Cap-and-Trade Program, the Oregon Climate Protection Program, and the Washington Cap-and-Invest Program (collectively “Cap-and-Trade Programs”) are administered by state agencies and generally establish a declining limit on major sources of GHG emissions throughout each respective state. While there are differences in the Cap-and-Trade Programs, all incorporate fuel suppliers, requiring them to purchase or generate carbon offset credits to compensate for the GHG emissions created by their business operations. The import or sale of renewable fuel helps emitters meet their obligations.
The climate change regulatory landscape is highly complex and continuously evolving. The further adoption or expansion of federal, state or local climate change law or regulatory programs to reduce emissions of GHGs could require us to incur increased capital and operating costs, with resulting impact on product price. We cannot predict whether, or in what form, climate change legislation provisions and renewable energy standards may be enacted, and what effect such regulation may have on our business, financial condition or operations in the future. In addition, a consequence of climate change is increased volatility in seasonal temperatures. It is difficult to predict how the market for our products will be affected by increased temperature volatility, or increased temperatures generally, although if there is an overall trend of unseasonably warmer temperatures in the winter months, it could adversely affect our business.
Future developments, such as stricter environmental, health or safety laws and regulations, could affect our operations. We do not anticipate that the cost of our compliance with environmental, health and safety laws and regulations, including RCRA and CERCLA, as currently in effect and applicable to known sites will have a material adverse effect on our financial condition or results of operations. However, there can be no assurance that our financial condition or operations will not be materially adversely affected by future discovery of presently unknown environmental liabilities or future environmental regulations.
Many of the states in which we do business have passed laws prohibiting “unfair or deceptive practices” in transactions between consumers and sellers of products used for residential purposes, which give the Attorney General or other officials of that state the authority to investigate alleged violations of those laws. From time to time, we receive inquiries or requests for additional information under these laws from the offices of Attorneys General or other government officials in connection with the sale of our products to residential customers. Based on information to date, and because our policies and business practices are designed to comply with all applicable laws, we do not believe that the costs or liabilities associated with such inquiries or requests will result in a material adverse effect on our financial condition or results of operations; however, there can be no assurance that our financial condition or results of operations may not be materially and adversely affected as a result of current or future government investigations or civil litigation derived therefrom.
See the Risk Factor entitled “The ability of AES to acquire and retain retail natural gas and electricity customers is highly competitive, price sensitive and may be impacted by changes in state regulations” for a description of certain regulatory and litigation impacts on our AES business.
ESG Strategy and Initiatives
We are committed to delivering safe, reliable, affordable, and low CI energy to our customers and the local communities we serve. We have made significant progress on our environmental, social and governance (“ESG”) initiatives, which accelerated with the launch of our Three Pillars of the Suburban Propane Experience in June 2019. The three essential pillars are: i) Go Green with Suburban Propane, ii) SuburbanCares, and iii) Suburban Commitment to Excellence. We identified these three critical corporate pillars to emphasize our ongoing commitment to excellence for the safety and comfort of our customers, our dedication to the safety and career development of our employees, our philanthropic efforts to give back to the communities we serve, our work to advocate for the inherent environmental advantages of using propane as a clean energy solution, our focus on supporting the sustainability needs of our customers and our ongoing strategic efforts to invest in and develop innovative solutions to help lead the way to lower greenhouse gas emissions. We are committed to implementing business strategies using a holistic approach to doing what is best for our customers, employees, the communities we serve and our investors. Effective ESG management for us supports our goal to create long-term value for our Unitholders and to support the interests of all stakeholders. Our Board of Supervisors takes an active role in overseeing the management of risks facing Suburban, including those impacted by ESG issues.
In support of our efforts to successfully manage and grow our business, we will continue to identify ways to include more ESG initiatives in our strategies that support our customers, employees, investors, and the communities we serve, including initiatives that
10
support our three-pillars strategic plan. Advancing our focus on ESG initiatives will allow for increased engagement across our business and help us to continue to identify and meet the evolving expectations of our customers, employees, investors, and other stakeholders.
Environmental Initiatives
Our Go Green with Suburban Propane corporate pillar encompasses our commitment and efforts to promote the versatile, affordable, low CI and clean air benefits of traditional propane as one solution that can contribute to our customers achieving their sustainability goals and our efforts to contribute to the goals of reducing the nation’s carbon footprint and having a positive effect on climate change. Traditional propane is an alternative fuel under the Clean Air Act Amendments. Propane can offer immediate reductions in carbon emissions and immediate improvements in air quality over other traditional fuels, particularly in the transportation sector. Propane is non-toxic and emits 60% to 70% fewer smog producing hydrocarbons than gasoline and diesel. Several states have implemented low-carbon fuel standards that recognize the environmental benefits of using propane to power over-the-road vehicles and forklifts. Through our dedicated sales efforts, we are actively promoting the use of propane in the transportation sector, and for the last three fiscal years, we sold an average of nearly 30 million gallons of propane annually to the over-the-road vehicle and forklift markets.
With advancements in new technologies for the production of propane from renewable sources, as well as other technological advances to reduce the CI of traditional propane, our Go Green with Suburban Propane corporate pillar also underscores our commitment to invest in innovative solutions that can contribute to a sustainable energy future. Starting in fiscal year 2020, the Partnership made great strides in advancing our strategic growth initiatives through our Go Green with Suburban Propane corporate pillar. Specifically, we contracted for the supply and distribution of over 1.0 million gallons annually of renewable propane, to meet customer demand for a renewable energy source. In support of our long-term strategic growth initiative to build out a comprehensive renewable energy platform, we acquired a 38% equity stake in Oberon, a 25% equity stake in IH, committed to building a dairy waste anaerobic digester in upstate New York for the production of RNG, and purchased anaerobic digesters operating in Columbus, Ohio and Stanfield, Arizona. Through our investment in Oberon, we have brought to market a new blended product Propane+rDME. This new product is a blend of traditional propane and rDME and has a lower CI than the traditional propane product. We are collaborating with Oberon and others to support continued development efforts to commercialize a Propane+rDME blended product, and have the exclusive right to market and sell Oberon’s rDME in North America.
In further support of the Partnership’s efforts to advance its Go Green with Suburban Propane corporate pillar, we have officially registered the Go Green with Suburban Propane logo with the United States Patent and Trademark office. As part of our commitment to innovating for a sustainable energy future, and in support of our strategic growth initiatives to build out a renewable energy platform, the Partnership created an executive-level position in fiscal 2021 (reporting directly to our President and Chief Executive Officer) entitled Vice President, Strategic Initiatives – Renewable Energy. This position focuses on identifying, analyzing and developing opportunities within the renewable energy space for potential future acquisitions, partnerships or collaborative arrangements that support the Partnership’s efforts to grow its overall business through investment in, and development of, innovative solutions that will help pave the way to lowering greenhouse gas emissions.
We present information about our commitment to sustainable and environmentally sound practices on the “Go Green” page on our website, which may be accessed at www.suburbanpropane.com/suburban-propane-experience/go-green. The information included on our “Go Green” page is not intended to be incorporated by reference into this Form 10-K Annual Report.
Social Initiatives
The Partnership celebrated its 95th anniversary this year, commemorating a momentous milestone and the remarkable journey that brought us here. Spanning nearly a century, our legacy exhibits an unwavering dedication to the highest standard for safety and outstanding customer service. From humble beginnings in 1928 as a family-owned business, we sustain a family-oriented culture deeply rooted in the communities we serve and operate nationwide. Our SuburbanCares corporate pillar highlights our continued dedication to philanthropic endeavors through our national partnership with the American Red Cross and countless engagements in local community sponsorships and events, as well as the various employee-focused initiatives that differentiate the Partnership as a great place to work. This pillar is supported by the tagline, “SuburbanCares about our people and the communities we serve.”
During fiscal 2023, the Partnership emphasized its collaboration with organizations that offer critical support to individuals and families facing adversity in disadvantaged communities across our operational area, including fundamental provisions such as food, housing, educational resources, and various essential supplies. Furthermore, we have a longstanding commitment to supporting our troops and military veterans through our initiative called “Heroes Hired Here,” providing a range of employment opportunities to those who have served, in addition to volunteering at community events and various outreach initiatives. In our continued collaboration with
11
our national partner, the American Red Cross, we hosted blood-drives, fire-safety programs, provided disaster relief efforts, and supported various campaigns that make a positive difference in the lives of those in need.
Safety
Embedded in our culture and the Partnership’s mission statement is our commitment to safety. We believe that the safety and well-being of our employees, customers, and communities is of the utmost importance. Safety is a top priority for our business and we continue to invest in programs, technology, and training to improve safety throughout our operations. We believe that the achievement of superior safety performance is both an important short-term and long-term strategic initiative in supporting our business and managing our operations.
Human Capital Management
Our Board, and our management, consider effective talent development and human capital management to be critical components to the Partnership’s continued success. Our Board is involved in leadership development and actively oversees the Partnership’s succession planning, which includes periodic reviews of our talent management strategies, leadership pipeline and succession planning for key executive positions. Our Board oversees the process of succession planning and the Compensation Committee of our Board implements programs to compensate, retain and motivate key talent.
In further support of our SuburbanCares corporate pillar, and our commitment to building a diverse and inclusive culture, we have developed many employee-focused initiatives to support employee career development and hiring, such as our “Steer Your Career” program, which encourages and supports employees to further their education and enhance their knowledge and skills to prepare them for expanded opportunities and responsibilities; our “Heroes Hired Here” program, in which we take pride in our efforts to attract and employ military veterans in recognition and appreciation for the values, leadership, dedication and unique skills that they bring to the Partnership, and support provided to their family members; and our “Apprentice Program,” which provides company-paid, on-the-job training for apprentices to develop their careers and provide them the necessary skills and tools to prepare them for a successful career within the Partnership.
Governance Initiatives
The Board believes that sound corporate governance practices and policies provide an important framework to assist the Board in fulfilling its duty to Unitholders. Our corporate governance practices and policies, which are periodically reassessed, are reflected in our committee charters, Code of Business Conduct and Ethics, and our Corporate Governance Guidelines & Principles. A copy of each is available from our website at www.suburbanpropane.com.
The Partnership was one of the first publicly traded partnerships to eliminate the “incentive distribution rights” of its general partner, which we completed in 2006. This removed the potential for conflicts of interest between our general partner and limited partners, and simplified our capital structure. The general partner of both the Partnership and our Operating Partnership is Suburban Energy Services Group LLC (the “General Partner”), a Delaware limited liability company, the sole member of which is the Partnership’s Chief Executive Officer. Other than as a holder of 784 Common Units that will remain in the General Partner, the General Partner does not have any economic interest in us or our Operating Partnership. Accordingly, and unlike many publicly traded partnerships, the Partnership is controlled by our Unitholders through the independently elected Board.
Governance Highlights
Highlights that demonstrate our commitment to sound corporate governance include:
12
Board Diversity Highlights
Our Supervisors have extensive and diverse experience relevant to our business and strategy that enhances the knowledge of our Board and the insight that they provide the Partnership, including significant experience in the following industries:
Our Supervisors also currently hold, or have held, a diverse range of leadership positions, including:
If a vacancy on our Board arises, then our Nominating/Governance Committee is instructed by its charter to consider candidates from various disciplines and diverse backgrounds that optimally enhance the current mix of talent and experience on the Board. While industry-specific expertise is an essential component of our Board’s oversight of the Partnership, we consider all aspects of a candidate’s qualifications and skills in the context of the Partnership’s needs, with a view to creating a Board with a diversity of experience and perspectives; including diversity with respect to race, gender, age, background and areas of expertise. We also benefit from the viewpoints of supervisors with expertise outside of our industry and our Nominating/Governance Committee includes, and has any search firm that it may engage include, women and minority candidates in the pool from which the Nominating/Governance Committee selects supervisor candidates. Our current slate of eight independent Supervisors has 37.5% of Supervisors that identify as diverse in gender, race or ethnicity.
Safety and Ethics Hotline
It is the Partnership’s policy to encourage the communication of bona fide concerns relating to the lawful and ethical conduct of its business, and its audit and accounting procedures or related matters. It is also the policy of the Partnership to protect those who
13
communicate their bona fide concerns from any retaliation for such reporting. All employees, customers, vendors and other stakeholders can communicate concerns by calling our Safety and Ethics Hotline, which is hosted by a third party to maintain confidentiality and anonymity when requested. Our senior leadership team, along with our Audit Committee, review matters reported through the Safety and Ethics Hotline. Confidential and anonymous mechanisms for reporting concerns are also available and described in our Code of Business Conduct and Ethics.
Cybersecurity
The Partnership’s cybersecurity program is based upon the National Institute of Standards of Technology (NIST) Cybersecurity Framework. Our program is comprehensive in scope and covers all of the Partnership’s general corporate Information Technology (IT) systems, as well as operational technology systems supporting our business and the technology systems used by our third-party service providers. Our senior leadership team, along with our Audit Committee, receive regular and recurring program updates, metrics, and roadmaps to promote the effectiveness of the program and the alignment with the Partnership’s business objectives. Our program and controls are periodically reviewed and tested by independent third parties to enable the Partnership to employ industry best practices.
Employees
As of September 30, 2023, we had 3,240 full time employees, of whom 606 were engaged in general and administrative activities (including fleet maintenance), 72 were engaged in transportation and product supply activities and 2,562 were customer service center employees, as well as 105 part time employees. As of September 30, 2023, 62 of our employees were represented by eight different local chapters of labor unions. We believe that our relations with both our union and non-union employees are satisfactory. In addition, we hire temporary workers to meet peak seasonal demands.
ITEM 1A. RISK FACTORS
The following is a cautionary discussion of the most significant risks, uncertainties and assumptions that we believe are significant to our business and should be considered carefully in conjunction with all of the other information set forth in this Annual Report on Form 10-K. The risks described below are not an exhaustive list of all of the risks that we face. The risks described below are organized by category of risks to the Partnership, but are not necessarily listed by order of priority or materiality. In addition to the factors discussed elsewhere in this Annual Report on Form 10-K, the factors described in this item could, individually or in the aggregate, cause our actual results to differ materially from those described in any forward-looking statements. Should unknown risks or uncertainties materialize or underlying assumptions prove inaccurate, actual results could materially differ from past results and/or those anticipated, estimated or projected. Achievement of future results is subject to risks, uncertainties and potentially inaccurate assumptions. In this case, the trading price of our Common Units could decline and you might lose part or all of the value in our Common Units. Investing in our Common Units involves a high degree of risk. Past financial performance may not be a reliable indicator of future performance and historical trends should not be used to anticipate results or trends in future periods. You should carefully consider the specific risk factors set forth below as well as the other information contained or incorporated by reference in this Annual Report. Some factors in this section are Forward-Looking Statements. See “Disclosure Regarding Forward-Looking Statements” above.
RISK FACTORS SUMMARY
Below is a summary of material factors that make an investment in our Common Units speculative or risky:
Risks Related to our Business:
14
Risks Related to our Indebtedness and Access to Capital:
Risks Related to our Common Units:
Tax Risks to our Unitholders:
15
RISKS RELATED TO OUR BUSINESS
Because weather conditions may adversely affect demand for our products, our results of operations and financial condition are vulnerable to warm winters and natural disasters.
Weather conditions have a significant impact on the demand for our products, for both heating and agricultural purposes. Many of our customers rely on propane, fuel oil or natural gas primarily as a heating source. The volume of propane, fuel oil and natural gas sold is at its highest during the six-month peak heating season of October through March and is directly affected by the severity and length of the winter months. Typically, we sell approximately two-thirds of our retail propane volume and approximately three-fourths of our retail fuel oil volume during the peak heating season. Weather conditions can vary substantially from year to year in the regions in which we operate, which could significantly impact the demand for our products and our financial performance and condition. The agricultural demand for propane is also affected by the weather, as dry or warm weather during the harvest season may reduce the demand for propane used in some crop drying applications for which we service.
Actual weather conditions can vary substantially from year to year, significantly affecting our financial performance. For example, average temperatures in our service territories were 8% warmer than normal for fiscal 2023, and 10% warmer than normal for fiscal 2022 and fiscal 2021, as measured by the number of heating degree days reported by the National Oceanic and Atmospheric Administration. If this trend of warmer than normal temperatures continues, it could have a negative impact on our financial performance. Furthermore, variations in weather in one or more regions in which we operate can significantly affect the total volume of propane, fuel oil and other refined fuels and natural gas we sell and, consequently, our results of operations. Variations in the weather in the northeast, where we have a greater concentration of propane accounts and substantially all of our fuel oil and natural gas operations, generally have a greater impact on our operations than variations in the weather in other regions. We can give no assurance that the weather conditions in any quarter or year will not have a material adverse effect on our operations, or that our available cash will be sufficient to pay principal and interest on our indebtedness and distributions to Unitholders.
If the frequency or magnitude of significant weather conditions or natural disasters such as floods, droughts, wildfires, hurricanes, blizzards or earthquakes increase, as a result of climate change or for other reasons, our results of operations and our financial performance could be negatively impacted by the extent of damage to our facilities or to our customers’ residential homes and business structures, or of disruption to the supply or delivery of the products we sell.
The potential effects of climate change may affect our business, operations, supply chain and customers, which could adversely impact our financial condition and results of operations.
Shifts and fluctuations in weather patterns and other environmental conditions, including temperature and precipitation levels, may affect consumer demand for our energy products and services. In addition, the potential physical effects of climate change, such as increased frequency and severity of storms, floods and other climatic events, could disrupt our operations and supply chain, and cause us to incur significant costs in preparing for or responding to these effects. These or other meteorological changes could lead to increased operating costs, capital expenses or supply costs. Our customers may also experience the potential physical impacts of climate change and may incur significant costs in preparing for or responding to these efforts, including increasing the mix and resiliency of their energy solutions and supply, which may adversely impact their ability to pay for our products and services or decrease demand for our products and services. The impact of any one or all of the foregoing factors may adversely affect our financial condition and results of operations.
The adoption of climate change legislation could negatively impact our operations and result in increased operating costs and reduced demand for the products and services we provide.
The EPA issued an Endangerment Finding under the federal Clean Air Act, which determined that emissions of greenhouse gases (“GHG”), such as carbon dioxide, present an endangerment to public health and the environment because emissions of such gases may be contributing to the warming of the earth’s atmosphere, volatility in seasonal temperatures, increased frequency and severity of storms, floods and other climatic changes. Based on these findings, the EPA has begun adopting and implementing regulations to restrict emissions of GHGs from certain industries and require reporting by certain regulated facilities.
Current EPA leadership has prioritized climate change mitigation measures and has implemented regulations requiring significant reductions in GHG emissions. Changes in the White House and EPA administration may result in changes to the EPA’s prioritization of climate change mitigation measures. EPA is also prioritizing environmental justice issues, which may impact how the agency addresses environmental and climate change matters. We cannot predict the impact of future changes to the EPA’s prioritization of climate change mitigation or the impact of future GHG legislation or regulations on our business, financial condition or operations in the future.
16
Numerous states, municipalities and regulators have also adopted or proposed laws and policies on climate change, including GHG emission reduction targets and climate disclosure. For example, in July 2019, the Climate Leadership and Community Protection Act was signed into law in New York, establishing a statewide climate action framework which includes a target to reduce net GHG emissions to zero by 2050. With respect to disclosure, the SEC has proposed sweeping climate-change related disclosure rules that, if adopted, would require significant disclosure regarding GHG emissions and would require significant time and expense to collect and prepare the information which may need to be gathered due to new disclosure requirements and any regulatory requirements for independent attestation as to such disclosures. Some states are also beginning to propose their own climate change disclosure requirements. For example, in September 2023, California became the first state to pass its own far-reaching mandatory disclosure bills which require any entity doing business in California that meets certain annual revenue thresholds to annually disclose publicly and provide independent third-party attestation on its global Scope 1 and Scope 2 GHG emissions beginning in 2026 for the prior fiscal year, and on its value chain (Scope 3) GHG emissions beginning in 2027.
The adoption of federal, state or local climate change legislation or regulatory programs to reduce emissions of GHGs and comply with disclosure obligations could require us to incur increased capital and operating costs, with resulting impact on product price and demand. We cannot predict when or in what form climate change legislation provisions and renewable energy standards may be enacted and what the impact of any such legislation or standards may have on our business, financial conditions or operations in the future. In addition, a possible consequence of climate change is increased volatility in seasonal temperatures. It is difficult to predict how the market for our fuels would be affected by changes in regulations or increased temperature volatility, although if there is an overall trend of warmer winter temperatures, it could adversely affect our business.
The generation and monetization of environmental attributes and available tax credits or other incentives resulting from our investments in Oberon and IH, our construction and operation of anaerobic digesters through our wholly-owned subsidiary, Suburban Renewable Energy, LLC and our sale of renewable propane, are contingent on several state and federal programs, including renewable fuel standard programs (“RFS”), the Inflation Reduction Act, the Infrastructure Investment and Jobs Act, the California Low Carbon Fuel Standard (“CA LCFS”), the Oregon Clean Fuels Program (“OR CFP”), and the Washington Clean Fuel Standard (“WA CFS”). Changes to the enabling legislation, changes in governmental guidance and/or changes in the regulations implementing those programs could change, or eliminate, the availability and value of a biofuel’s renewable identification number (“RIN”) or Low Carbon Fuel Standard credit (“LCFS Credit”), as well as investment tax credits and production tax credits currently available under the Inflation Reduction Act. Additionally, the open markets where RINs and LCFS Credits are traded have experienced volatility over the past year and may experience continued volatility in the future. There is increasing interest at the federal, state, and local level to further reduce GHG emissions by promoting electrification, incentivizing the production of renewable energy and disincentivizing the use of fossil fuels. While our emerging renewable energy platform may benefit from additional incentives for the growth of renewable energy, our sale of propane, fuel oil and refined fuels, and natural gas may experience significant negative impact from the restrictions placed on the use of fossil fuels. We cannot predict what impact changes to existing federal, state, or local programs designed to reduce GHG emissions and address climate change may have on our business. Nor can we predict what impact the creation of future federal, state, and local programs designed to reduce GHG emissions and address climate change will have on our business.
The federal, state and local climate change regulatory landscape is highly complex and rapidly and continuously evolving. Failure to comply with these regulations and any future laws and regulations designed to reduce GHG emissions and address climate change, could result in the imposition of higher costs, penalties, fines, or restrictions on our operations. We cannot predict the impact these and future regulations, and the unattainability, reduction or elimination of government and economic incentives could have on our business, financial conditions or results of operation.
Deterioration of general economic and other external conditions have harmed and could continue to harm our business and results of operations.
Our business and results of operations have been, and may continue to be, adversely affected by changes in national or global economic and other external conditions, including inflation, interest rates, availability of capital markets, consumer spending rates, unemployment rates, energy availability and costs, the negative impacts caused by pandemics and public health crises, geopolitical conflict and the effects of governmental initiatives to manage economic conditions.
Volatility in financial markets and deterioration of national and global economic conditions have impacted, and may again impact, our business and operations in a variety of ways, including as follows:
17
Disruption of our supply chain could have an adverse impact on our business and our operating results.
Damage or disruption to our supply chain, including third-party production or transportation and distribution capabilities, due to weather, including any potential effects of climate change, natural disasters, fires or explosions, terrorism, pandemics, strikes, geopolitical conflict, government action, economic and operational considerations of producers and refineries, or other reasons beyond our control or the control of our suppliers and business partners, could impair our ability to acquire sufficient supplies of the products we sell.
We have actively monitored and managed supply chain and logistical (including transport) issues and disruptions in the past. Although we source our propane, fuel oil and refined fuels and natural gas from a broad group of suppliers, restrictions on businesses or volatility in the economy or supply chain could cause global supply, logistics and transport of these fuels to become constrained, which may cause the price to increase and/or adversely affect our ability to acquire adequate supplies to meet customer demand. The disruptions to the global economy over the past several years have impeded global supply chains, resulting in longer lead times and increased freight expenses in general. We have taken steps to minimize the impact of these increased costs by working closely with our suppliers and customers, and strategically managing our purchasing functions and logistics in delivering our products and services. Despite the actions we have undertaken to minimize the impacts from disruptions to the global economy, there can be no assurances that unforeseen future events in the global supply chain, our ability to deliver our products and services or the costs associated therewith, will not have a material adverse effect on our business, financial condition and results of operations.
Sudden increases in our costs to acquire and transport our products due to, among other things, our inability to obtain adequate supplies from our usual suppliers, or our inability to obtain adequate supplies of such products from alternative suppliers, or inflationary conditions, may adversely affect our operating results.
Our profitability in the retail propane, fuel oil and refined fuels and natural gas businesses is largely dependent on the difference between our costs to acquire and transport product, and retail sales prices. Propane, fuel oil and other refined fuels and natural gas are commodities, and the availability of those products, and the unit prices we need to pay to acquire and transport those products, are subject to volatile changes in response to changes in production and supply or other market conditions over which we have no control, including the severity and length of winter weather, natural disasters, the price and availability of competing alternative energy sources, competing demands for the products (including for export) and infrastructure (including highway, rail, pipeline and refinery) constraints, general inflationary pressures or delays in shipping availability, backlogs at shipping ports or other points of entry and lack of available trucking or other shipping means. Our supply of these products from our usual sources may be interrupted due to these and other reasons that are beyond our control, necessitating the transportation of product, if it is available at all, by truck, rail car or other means from other suppliers in other areas, with resulting delay in receipt and delivery to customers and increased expense. As a result, our costs of acquiring and transporting alternative supplies of these products to our facilities may be materially higher at least on a short-term basis. Because we may not be able to pass on to our customers immediately, or in full, all increases in our wholesale and transportation costs of our products, these increases could reduce our profitability. Due to high inflation in the United States in recent years, we have experienced higher commodity, transportation and labor costs and the cost of tanks and other equipment, which have impacted our profitability in recent periods and may continue to do so while these conditions exist. In addition, our inability to obtain sufficient supplies of propane, fuel oil and other refined fuels and natural gas in order for us to fully meet customer demand for these products on a timely basis could adversely affect our revenues, and consequently our profitability.
In general, product supply contracts permit suppliers to charge posted prices at the time of delivery, or the current prices established at major supply points, including Mont Belvieu, Texas, and Conway, Kansas. We engage in transactions to manage the price risk associated with certain of our product costs from time to time in an attempt to reduce cost volatility and to help ensure availability of product. We can give no assurance that future increases in our costs to acquire and transport propane, fuel oil and natural gas will not have a material adverse effect on our profitability and cash flow.
18
High prices for propane, fuel oil and other refined fuels and natural gas can lead to customer conservation, resulting in reduced demand for our products.
Prices for propane, fuel oil and other refined fuels and natural gas are subject to fluctuations in response to changes in wholesale prices and other market conditions beyond our control. Heightened levels of uncertainty related to the ongoing geopolitical conflicts around the world may lead to additional economic sanctions by the United States and the international community and could further disrupt financial and commodities markets. Therefore, our average retail sales prices can vary significantly within a heating season, or from year to year, as wholesale prices fluctuate with propane, fuel oil and natural gas commodity market conditions. During periods with high product costs for propane, fuel oil and other refined fuels and natural gas, our selling prices generally increase. High prices can lead to customer conservation, resulting in reduced demand for our products. Higher commodity, transportation and labor costs due to inflationary conditions have impacted wholesale prices and can cause certain customers to reduce their consumption of energy, which could have a negative impact on our sales and profitability.
Because of the highly competitive nature of the retail propane and fuel oil businesses, we may not be able to retain existing customers or acquire or attract new customers, which could have an adverse impact on our operating results and financial condition.
The retail propane and fuel oil industries are mature and highly competitive. We expect overall demand for propane and fuel oil to be relatively flat to moderately declining over the next several years. Year-to-year industry volumes of propane and fuel oil are expected to be primarily affected by weather patterns and from competition intensifying during warmer than normal winters, as well as from the impact of a sustained higher commodity price environment on customer conservation, and the impact of perceived uncertainty about the economy on customer buying habits.
Propane and fuel oil compete with electricity, natural gas and other existing and future sources of energy, some of which are, or may in the future be, less costly for equivalent energy value. For example, natural gas currently is a significantly less expensive source of energy than propane and fuel oil on an equivalent BTU basis. As a result, except for some industrial and commercial applications, propane and fuel oil are generally not economically competitive with natural gas in areas where natural gas pipelines already exist. The gradual expansion of the nation’s natural gas distribution systems has made natural gas available in areas that previously depended upon propane or fuel oil. Propane and fuel oil compete to a lesser extent with each other due to the cost of converting from one source to the other.
In addition to competing with other sources of energy, our propane and fuel oil businesses compete with other distributors of those respective products principally on the basis of price, service and availability. Competition in the retail propane business is highly fragmented and generally occurs on a local basis with other large full-service multi-state propane marketers, thousands of smaller local independent marketers and farm cooperatives. Our fuel oil business competes with fuel oil distributors offering a broad range of services and prices, from full service distributors to those offering delivery only. In addition, our existing fuel oil customers, unlike our existing propane customers, generally own their own tanks, which can result in intensified competition for these customers.
As a result of the highly competitive nature of the retail propane and fuel oil businesses, our growth within these industries depends on our ability to acquire other well-run retail distributors, open new customer service centers, acquire or attract new customers and retain existing customers. We can give no assurance that we will be able to acquire other retail distributors, open new customer service centers, or add new customers or retain existing customers.
Energy efficiency, general economic conditions, technological advances and legislative bans have affected and may continue to affect demand for propane, fuel oil and natural gas by our retail customers.
The national trend toward increased conservation and technological advances, including installation of improved insulation and other advancements in building materials, as well as the development of more efficient furnaces and other heating and energy sources, has adversely affected the demand for propane and fuel oil by our retail customers which, in turn, has resulted in lower sales volumes to our customers. In addition, perceived uncertainty about the economy may lead to additional conservation by retail customers seeking to further reduce their heating costs, particularly during periods of sustained higher commodity prices. Future technological advances in heating, conservation and energy generation and economic weakness may adversely affect our volumes sold, which, in turn, may adversely affect our financial condition and results of operations. In addition, in an effort to reduce GHG emissions and promote electrification, a growing number of state and local governments in the regions in which we operate have passed, or may be considering, bans on the use of gas in residential and commercial buildings, which may also adversely affect demand for propane, fuel oil and natural gas, which, in turn, may adversely affect our financial condition and results of operations.
In addition, in an effort to reduce GHG emissions and promote electrification, a growing number of state and local governments in the regions in which we operate have passed, or may be considering, bans on the use of gas in residential and commercial buildings. Such restrictions could have an adverse impact on the demand for certain of our products in those jurisdictions, but may have a favorable impact on our emerging renewable energy products. However, there are also many states that have passed laws that prohibit local
19
governments from restricting gas use in buildings. We cannot predict how many other states and localities will adopt similar laws, if restrictions will be expanded to other fossil-based fuels, and what the impact will be on our financial condition and results of operations.
We may not be able to attract and retain qualified employees or find, develop and retain key employees to support and grow our business, which may adversely affect our business and results of operations.
Like most companies in the markets in which we operate, we are continuously challenged in attracting, developing and retaining a sufficient number of qualified employees to operate our businesses throughout our operating geographies, particularly with regard to our driver and technician positions. Our industry in general, as well as the overall trucking industry, is currently experiencing a shortage of qualified drivers and technicians that is exacerbated by several factors, including:
We may also have difficulty recruiting and retaining new employees beyond our driver and technician positions with adequate qualifications and experience. The challenge of hiring new employees at times is further exacerbated by the rural nature of our business, which provides for a smaller pool of skilled employee candidates who meet our hiring criteria and the licensing and qualification requirements that may exist for certain types of positions such as our driver and technician positions. If we are unable to continue to attract and retain a sufficient number of new employees or retain existing employees with the technical skills upon which our business depends, we may be forced to adjust our compensation packages to pay higher wages, or offer other benefits that might impact our cost of labor, or force us at times to operate with fewer employees and face difficulties in meeting delivery demands for our customers, in particular during times of higher demand as a result of prolonged periods of cold weather or otherwise, any of which could adversely affect our profitability and results of operations.
We are dependent on our senior management and other key personnel.
Our success depends on our senior management team and other key personnel with technical skills upon which our business depends and our ability to effectively identify, attract, retain and motivate high quality employees, and replace those who retire or resign. We believe that we have an experienced and highly qualified senior management team and the loss of service of any one or more of these key personnel could have a significant adverse impact on our operations and our future profitability. Failure to retain and motivate our senior management team and to hire, retain and develop other important personnel could generally impact other levels of our management and operations, ability to execute our strategies and adversely affect our business and results of operations.
The risk of terrorism, political unrest and the current hostilities in the Middle East or other energy producing regions, including Russian military action in Ukraine, has adversely affected, and may continue to adversely affect the economy and the price and availability of propane, fuel oil and other refined fuels and natural gas.
Terrorist attacks, political unrest and hostilities, and military action in the Middle East or other energy producing regions could likely lead to increased volatility in the price and availability of propane, fuel oil and other refined fuels and natural gas, as well as our results of operations, our ability to raise capital and our future growth. The impact that the foregoing may have on our industry in general, and on us in particular, is not known at this time. An act of terror could result in disruptions of crude oil or natural gas supplies and markets (the sources of propane and fuel oil), and our infrastructure facilities could be direct or indirect targets. Terrorist activity may also hinder our ability to transport propane, fuel oil and other refined fuels if our means of supply transportation, such as rail or pipeline, become damaged as a result of an attack. A lower level of economic activity could result in a decline in energy consumption, which could adversely impact our revenues or restrict our future growth. Instability in the financial markets as a result of terrorism or military conflict could also affect our ability to raise capital. The ongoing geopolitical conflicts around the world, including in Ukraine and in the Middle East, have caused, and could intensify, volatility in the price and supply of natural gas, oil, and propane and other refined fuels. We have opted to purchase insurance coverage for terrorist acts within our property and casualty insurance programs, but we can give no assurance that our insurance coverage will be adequate to fully compensate us for any losses to our business or property resulting from terrorist acts.
The conflicts in Ukraine and in the Middle East and related price volatility and geopolitical instability could negatively impact our business.
Since February 2022, Russia has continued significant military action against Ukraine. Since October 2023, with the launch of the Israel-Hamas war, there has been increased hostilities in the Middle East. These geopolitical conflicts have caused, and could intensify, volatility in the price and supply of propane, fuel oil and other refined fuels and natural gas. The extent and duration of the
20
military action, economic sanctions and resulting market disruptions could be significant and could potentially have a substantial negative impact on the global economy and/or our business for an unknown period of time. To the extent that the Russian military action in Ukraine or the Israel-Hamas war continues and related price volatility and geopolitical instability continue, and to the extent that military action intensifies in those regions or in other parts of the world, which may further increase volatility in the price and supply of propane, fuel oil and other refined fuels and natural gas, our business and results of operations could be adversely impacted.
Our financial condition and results of operations may be adversely affected by governmental regulation and associated environmental and health and safety costs.
Our business is subject to a wide range of federal, state and local laws and regulations related to environmental, health and safety matters; including those concerning, among other things, the investigation and remediation of contaminated soil, groundwater and other environmental resources, the transportation of hazardous materials and guidelines and other mandates with regard to the health and safety of our employees and customers. These requirements are complex, changing and tend to become more stringent over time. In addition, we are required to maintain various permits that are necessary to operate our facilities and equipment, some of which are material to our operations. There can be no assurance that we have been, or will be, at all times in complete compliance with all legal, regulatory and permitting requirements or that we will not incur significant costs in the future relating to such requirements. Violations could result in penalties, or the curtailment or cessation of operations.
Moreover, currently unknown environmental issues, such as the discovery of contamination, could result in significant expenditures, including the need to comply with future changes to environmental laws and regulations or the interpretation or enforcement thereof. Such expenditures, if required, could have a material adverse effect on our business, financial condition or results of operations.
The ability of AES to acquire and retain retail natural gas and electricity customers is highly competitive, price sensitive and may be impacted by changes in state regulations.
The deregulated retail natural gas and electricity industries in which AES participates are highly competitive. New York has instituted significant regulation of these industries, and other states have changed business rules to provide further protections to consumers. An Order from the NY PSC regarding low income consumers went into effect in 2018 and required that all ESCOs stop serving low-income consumers. As a result, AES returned approximately 8,400 of our customers to local utility service. A Reset Order issued by the NY PSC in 2016 attempted to impose rules that would have allowed the NY PSC to regulate ESCO pricing, which was subsequently challenged and struck down by the New York Supreme Court. On appeal, the New York State Court of Appeals issued a ruling in 2019 that held that the NY PSC cannot regulate ESCO pricing, but does have the ability to restrict an ESCO’s access to the utility distribution system if the NY PSC determines that an ESCO’s pricing is not “just and reasonable.” In December 2019, the NY PSC issued a Second Reset Order that imposed product, pricing, and other requirements on ESCOs. AES was specifically and solely exempted from complying with the criteria concerning product offerings during the pendency of further rulemaking proceedings. In September 2020, the NY PSC issued another Order reaffirming the Second Reset Order, including the exemption that allows AES to maintain its existing business model in New York while rulemaking proceedings continue.
These industries have also seen an increase in the number of class action lawsuits brought against retailers and relating to their pricing policies and practices. Two such lawsuits were commenced against AES in 2017 and 2018, involving New York and Pennsylvania customers. AES filed motions to dismiss both actions on procedural and substantive grounds. The United States District Court for the Western District of Pennsylvania granted AES’s motion and dismissed the plaintiff’s complaint with prejudice, finding that AES did not breach its contract or defraud customers. In August of 2020, the Third Circuit Court of Appeals affirmed the dismissal of plaintiff’s complaint. In the New York action, the United States District Court for the Northern District of New York granted AES’ dismissal motion in part in October 2018, but allowed plaintiff’s statutory consumer fraud and breach of contract causes of action to proceed. The court granted summary judgment in our favor on the remaining counts and the complaint was dismissed in full. The plaintiff has filed an appeal to the Second Circuit Court of Appeals. The matter has been fully briefed, argued, and a decision is pending. While AES believes that the appeal is without merit and has vigorously defended the decision on appeal, we are unable to predict at this time the ultimate outcome of the New York action. If the plaintiff prevails on appeal, the matter will return to the trial court for further proceedings. If we are ultimately unable to successfully defend our AES business in this class action lawsuit, a decision rendered against AES could have an adverse impact on our business and operations.
Costs associated with lawsuits, investigations or increases in legal reserves that we establish based on our assessment of contingent liabilities could adversely affect our operating results to the extent not covered by insurance.
Our operations expose us to various claims, lawsuits and other legal proceedings that arise in and outside of the ordinary course of our business. We may be subject to complaints and/or litigation involving our customers, employees and others with whom we conduct business, including claims for bodily injury, death and property damage related to operating hazards and risks normally
21
associated with handling, storing and delivering combustible liquids such as propane, fuel oil and other refined fuels or claims based on allegations of discrimination, wage and hourly pay disputes, and various other claims as a result of other aspects of our business. We could be subject to substantial costs and/or adverse outcomes from such complaints or litigation, which could have a material adverse effect on our financial condition, cash flows or results of operations.
From time to time, our Partnership and/or other companies in the segments in which we operate may be reviewed or investigated by government regulators, which could lead to tax assessments, enforcement actions, fines and penalties or the assertion of private litigation claims. It is not possible to predict with certainty the outcome of claims, investigations and lawsuits, and we could in the future incur judgments, taxes, fines or penalties, or enter into settlements of lawsuits or claims that could have an adverse impact on our financial condition or results of operations. We are self-insured for general and product, workers’ compensation and automobile liabilities up to predetermined amounts above which third-party insurance applies. We cannot guarantee that our insurance will be adequate to protect us from all material expenses related to potential future claims for personal injury and property damage, that these levels of insurance will be available at economical prices in the future, or that all legal matters that arise will be covered by our insurance programs.
As required by accounting principles generally accepted in the United States (“GAAP”), we establish reserves based on our assessment of actual or potential loss contingencies, including contingencies related to legal claims asserted against us. Subsequent developments may affect our assessment and estimates of such loss contingencies and require us to make payments in excess of our reserves, which could have an adverse effect on our financial condition or results of operations.
If we are unable to make acquisitions on economically acceptable terms or effectively integrate such acquisitions into our operations, our financial performance may be adversely affected.
The retail propane and fuel oil industries are mature. We expect overall demand for propane and fuel oil to be relatively flat to moderately declining over the next several years. With respect to our retail propane business, it may be difficult for us to increase our aggregate number of retail propane customers except through acquisitions. In contrast to the propane and fuel oil industries, the renewable energy industry is rapidly growing, and we expect the renewable energy industry to continue to grow rapidly for the next several years. As a result, we may engage in strategic transactions involving the acquisition of, or investment in, other retail propane and fuel oil distributors, other energy-related businesses or other related cross-functional lines of business, including renewable energy technologies and businesses as part of our long-term strategic growth initiatives.
The competition for propane, fuel oil, and renewable energy acquisitions is intense and we can make no assurance that we will be able to successfully acquire other businesses on economically acceptable terms or at all, or, if we do, that we can integrate and operate those acquired businesses effectively or in a way to realize the expected benefits of such transactions within the anticipated timeframe, or at all, such as cost savings, synergies, sales and growth opportunities. In addition, the integration of an acquired business may result in material unanticipated challenges, expenses, liabilities or competitive responses, including:
Any one of these factors could result in delays, increased costs or decreases in the amount of expected revenues related to combining the businesses or derived from a strategic transaction and could adversely impact our financial condition or results of operations.
22
Current conditions in the global capital and credit markets, and general economic pressures, may adversely affect our financial position and results of operations.
Our business and operating results are materially affected by worldwide economic conditions. Conditions in the global capital and credit markets, as well as general economic pressures, including high inflation and temporary or prolonged recessionary conditions, could impact consumer and/or business confidence and increase market volatility, which could negatively affect business activity generally. This situation, especially when coupled with increasing energy prices, may cause our customers to experience cash flow shortages which in turn may lead to delayed or cancelled plans to purchase our products, and affect the ability of our customers to pay for our products. In addition, any disruptions in the United States residential mortgage market (as a result of changes in tax laws or otherwise) and the rate of mortgage foreclosures may adversely affect retail customer demand for our products (in particular, products used for home heating and home comfort equipment) and our business and results of operations.
Our use of derivative contracts involves credit and regulatory risk and may expose us to financial loss.
From time to time, we enter into hedging transactions to reduce our business risks arising from fluctuations in commodity prices and interest rates. Hedging transactions expose us to risk of financial loss in some circumstances, including if the other party to the contract defaults on its obligations to us or if there is a change in the expected differential between the price of the underlying commodity or financial metric provided in the hedging agreement and the actual amount received. Transactional, margin, capital, recordkeeping, reporting, clearing and other requirements imposed on parties to derivatives transactions as a result of legislation and related rulemaking may increase our operational and transactional cost of entering into and maintaining derivatives contracts and may adversely affect the number and/or creditworthiness of derivatives counterparties available to us. If we were to reduce our use of derivatives as a result of regulatory burdens or otherwise, our results of operations could become more volatile and our cash flow could be less predictable.
Our renewable fuel investments are subject to a number of risks, including the willingness of customers to adopt these fuels, the financing, construction and development of facilities, our ability to generate a sufficient return on our investments, our dependence on third-party partners, increased or changing regulation, and dependence on government incentives for commercial viability.
We have expanded our Go Green with Suburban Propane corporate pillar with our investments in renewable and low-carbon energy sources offered through our investments in Oberon and IH, our agreement to build an anaerobic digester at Adirondack Farms, our purchase of RNG production and distribution assets through SuburbanRNG – Columbus and SuburbanRNG – Stanfield and our sales of renewable propane. The success of these businesses and investments is subject to a number of factors and risks, including unpredictability and uncertainty as to the willingness of customers in their intended markets to adopt the use of these fuels, which will be dependent upon perceptions about the benefits of these fuels relative to other alternative fuels; increases, decreases or volatility in demand; on-site operational constraints such as the availability of feedstock or the reliable operation of anaerobic digesters with respect to production of renewable fuels; use and prices of crude oil, gasoline and other fuels and energy sources; and the adoption or expansion of government policies, programs, funding or incentives in favor of these or alternative fuels.
We may also face increasing competition from other companies seeking to produce fuels from alternative sources. If we are unable to establish production and sales channels that allow us to offer comparable products at attractive prices, we may not be able to compete effectively with these companies.
The success of our existing and future investments in our renewable energy platform will depend on our ability to successfully develop, market and distribute the specific renewable energy products. In addition, the acquisition, financing, construction and development of these projects involves numerous risks, including:
We will compete with other companies and private equity sponsors for acquisition opportunities, which may increase our costs or cause us to refrain from making acquisitions. We have a planned construction of natural gas upgrade equipment at SuburbanRNG – Columbus that will require capital expenditures and there is no guarantee that the project will be completed on time or on budget, and our operations could be adversely affected by disruptions or delays which could have a negative impact on revenues and operations. The
23
development of these products may also be negatively affected by production risks resulting from mechanical breakdowns, faulty technology, competitive markets, or changes to the laws and regulations that mandate the use of renewable energy sources, and the other regulatory risks discussed above under the caption, “The adoption of climate change legislation could negatively impact our operations and result in increased operating costs and reduced demand for the products and services we provide.”
A prolonged environment of low prices or reduced demand for RNG could have an adverse effect on our long-term business prospects, financial condition and results of renewable operations.
Long-term RNG prices may fluctuate substantially due to factors outside of our control, including the market price of environmental attributes, which have historically been a very volatile market and influenced by numerous factors including global commodity markets. If we are unable to renew or replace an off-take agreement for a project for a certain volume of RNG produced, we would be subject to the risks associated with selling that volume of RNG produced at then-current market prices. We may be required to make such sales at a time when the market prices for natural gas, RNG, or environmental attributes as a whole or in the regions where those volumes are produced, are depressed. If this were to occur, we would be subject to the volatility of market prices and be unable to predict our revenues from such volumes, and the sales prices for such RNG may be lower than what we could sell the RNG for under an alternative off-take agreement.
A decline in prices for certain fuels or reduced government incentives for renewable energy sources, or RNG specifically, could make our renewable investments less cost-competitive on an overall basis. Slow growth or a long-term reduction in overall demand for energy could have a material adverse effect on our business strategy and could, in turn, have an adverse effect on our long-term business prospects, financial condition and results of renewable energy operations.
The generation and monetization of environmental attributes by our renewable natural gas assets are subject to state and federal regulations that could negatively impact the availability or value of environmental attributes in the future.
The generation and monetization of the environmental attributes resulting from our renewable natural gas assets and our sale of renewable propane are contingent on several state and federal programs; including the RFS, the Inflation Reduction Act, the Infrastructure Investment and Jobs Act, CA LCFS, OR CFP, and WA CFS. Changes to the enabling legislation and/or changes in the regulations implementing those programs, and/or the issuance of new regulations or other governmental guidance, could impact, or eliminate the availability and value of RINs and LCFS Credits, and/or the investment tax credits and production tax credits available under the Inflation Reduction Act. Current regulatory proposals under consideration for the CA LCFS could adversely impact the assessment of carbon intensity (“CI”) for fuel produced outside of the state and perhaps even effectively curtail qualifying deliveries into the state. Additionally, the open markets where RINs and LCFS Credits are traded have experienced significant volatility in the past and continued volatility in the future may adversely impact the value of RINs and LCFS Credits sold by us. The price for all credits is impacted by global markets for feedstocks; such as crops, as well as global markets for crude oil, making the RIN market historically volatile. Currently, income from RIN and LCFS Credits is not material to our results of operations; however, as we continue to invest in the build out of our renewable energy platform, we anticipate increased RIN and LCFS Credits income, as well as financial benefits from investment tax credits and production tax credits.
There is increasing interest at the federal, state, and local level to further regulate GHG emissions by incentivizing the production of renewable energy and disincentivizing the use of fossil fuels and in some cases, force the electrification of several aspects of the economy. There are also many efforts to electrify our economy, including goals and mandates at the federal and state level for auto manufacturers to produce, and for governments to acquire, zero-emission vehicles in the upcoming years. Cap and Trade, or Cap and Invest, programs that put a price on carbon emissions have been adopted in California, Oregon and Washington state. The CA LCFS, OR CFP and WA CFS incentivize production of renewable electricity for transportation fuel use. Many of these GHG programs or amendments to these programs are subject to ongoing litigation in state and federal courts, creating great uncertainty about the future value of environmental attributes and the regulatory impact of these programs. There is also market uncertainty around the calculation and verification of CI scoring for projects, with some lobbying for government programs to disallow “book and claim” accounting for projects or ignoring the carbon-negative emission calculations associated with the capture of methane for renewable natural gas in GHG lifecycle accounting methodologies where the renewable natural gas is ultimately used as a fuel with emissions at the final point of fuel production or use. While our emerging renewable energy platform may benefit from additional incentives for the growth of renewable energy, it is possible, especially in the short term, that such growth will be outweighed by regulatory uncertainty and restrictions placed on our sale of propane, fuel oil and refined fuels, and natural gas. We cannot predict what impact changes to existing federal, state, or local programs designed to reduce GHG emissions and address climate change may have on our business. Nor can we predict what impact the creation of future federal, state, and local programs designed to reduce GHG emissions and address climate change will have on our business.
24
Certain of our anaerobic digester facilities are newly constructed, are under construction or renovation, or are in development and may not perform as we expect.
Our anaerobic digester operations located at Adirondack Farms in New York, and at SuburbanRNG – Columbus, are under construction and upgrading to produce RNG and are expected to begin production in fiscal year 2025. Our expectations of the operating performance of our Adirondack Farms facility are based on assumptions and estimates made without the benefit of an operating history at that location. Our expectations with respect to our new and developing projects, and related estimates and assumptions, are based on limited or previous operating histories. The ability of these facilities to meet our performance expectations is subject to the risks inherent in newly constructed RNG production facilities or renovation of such facilities, including delays or problems in construction, degradation of equipment in excess of our expectations, system failures, and outages, interruptions in feedstock supply for the digesters due to operational constraints or changes, fluctuations in demand and/or changes in circumstances that impact the supply of feedstock to the facilities. The failure of these facilities to perform as we expect could have an adverse effect on our business, financial condition, results of renewable operations and cash flows.
We rely on gas pipelines that we do not own or control and are subject to quality standards and regulations that may restricted or negatively impact our ability to deliver RNG and we may either incur additional costs or forego revenues.
We depend on gas pipelines owned and operated by others to deliver the RNG that we produce, or will produce, at our anaerobic digester facilities. A failure in the operation of the distribution channel could cause delays in the delivery of RNG that we produce, additional costs to distribute and the potential for the loss of revenues. The distribution channel is also subject to changes in pipeline gas quality standards or other regulatory changes that may also limit our ability to transport RNG on pipelines for delivery to third parties or increase the costs of processing RNG to allow for such deliveries.
Our plans for growth and diversification may not be successful or could expose our business to new risks.
We continue to seek to strategically diversify and grow our business. Our diversification efforts into the renewable and low CI energy markets or other industries may require additional investments in personnel, equipment and operational infrastructure, and there is no assurance that we will be able to sufficiently grow our presence in these markets. Our growth and diversification efforts will require coordinated efforts across the Partnership and continued enhancements to our current operating infrastructure. If the cost of making these changes increases, or if our efforts are unsuccessful, we may not realize anticipated benefits and our future earnings may be adversely affected. Moreover, if we are able to successfully diversify into the renewable or low-carbon energy markets, our business may be exposed to new risks associated with these markets, which could adversely affect our future earnings and growth.
We face risks related to our reliance on particular management information systems and communication networks to effectively manage all aspects of our business.
We depend heavily on the performance and availability of our management information systems and those of our third-party vendors, websites and network infrastructure to attract and retain customers, process orders, manage inventory and accounts receivable collections, maintain distributor and customer information, maintain cost-efficient operations, assist in delivering our products on a timely basis and otherwise conduct our business. We have centralized our information systems and we rely on third-party communications service and system providers to provide technology services and link our systems with the business locations these systems were designed to serve. Any failure or disruption in the availability or operation of those management information systems, loss of employees knowledgeable about such systems, termination of our relationship with one or more of these key third-party providers or failure to continue to modify such systems effectively as our business expands could create negative publicity that damages our reputation or otherwise adversely impact our ability to manage our business effectively. We may experience system interruptions or disruptions for a variety of reasons, including as the result of network failures, power outages, cyber attacks, employee errors, software errors, an unusually high volume of visitors attempting to access our systems, or localized conditions such as fire, explosions or power outages or broader geographic events such as earthquakes, storms, floods, epidemics, strikes, acts of war, civil unrest or terrorist acts. Because we are dependent in part on third-party vendors for the implementation and maintenance of certain aspects of our information systems and because some of the causes of information system interruptions may be outside of our control, we may not be able to remedy such interruptions in a timely manner, or at all. Our information systems’ business continuity plans and insurance programs seek to mitigate such risks, but they cannot fully eliminate the risks as a failure or disruption could be experienced in any of our information systems.
We face risks related to cybersecurity breaches of our systems and information technology and those of our third-party vendors.
Cybersecurity threats to network and data security are becoming increasingly diverse and sophisticated. As threats become more frequent, intense and sophisticated, the costs of proactive defensive measures may increase as we seek to continue to protect our information systems, websites, and network. The advancement of artificial intelligence (“AI”) and large language models has given rise
25
to additional vulnerabilities and potential entry points for cyber threats. With generative AI tools, threat actors may have additional tools to automate breaches or persistent attacks, evade detection, or generate sophisticated phishing emails. Despite our efforts to comply with applicable cybersecurity requirements and mitigate risks of cybersecurity threats, we cannot be certain that our security measures will definitively prevent, contain, or detect all cybersecurity breaches or other instructions from malware currently in existence or developed in the future. While we have in place security procedures, such as business continuity plans or disaster recovery protocols, our continuous investments in and updates to information security programs cannot guarantee the prevention of adverse impacts due to cybersecurity threats and data breaches, which could result in significant harm to our business, reputation, and operations.
We endeavor to design and implement various security measures to provide safeguards for confidential information, including personally identifiable information, and conduct personnel training to mitigate the risk of cybersecurity threats. Our outsourcing agreements with third-party service providers that access, store, or process our data and/or proprietary information generally require that they utilize adequate security systems to protect our confidential information. However, advances and changes in technologies could render our information systems and security measures, or those used by our third-party service providers, vulnerable to a breach or other exploitation. Risks of cybersecurity incidents caused by malicious third parties using sophisticated, targeted methods to circumvent firewalls, encryption, and other security defenses, including hacking, viruses, malicious software, ransomware, phishing attacks, denial of service attacks and other attempts to capture, disrupt or gain unauthorized access to data are rapidly evolving and could lead to disruptions in our information systems, websites, or other data processing systems and unauthorized disclosure, deletion or modification of confidential or other protected information. In addition, dependence upon automated systems may further increase the risks that operational system flaws, employee tampering, or manipulation of those systems will result in data losses that are difficult to detect or recoup. To the extent customer data is hacked or misappropriated, we could be subject to liability to impacted persons. Any successful efforts by individuals to infiltrate, break into, disrupt, damage or otherwise steal from us or our third-party service providers’ security or information systems could expose us to increased costs, litigation expenses, regulatory actions, fines and penalties, or other liabilities that could adversely impact our financial condition or results of operations.
We are subject to laws, rules, regulations and policies regarding data privacy and security, and may be subject to additional related laws and regulations in jurisdictions in which we operate. Many of these laws and regulations are subject to change and interpretation, and could result in claims, changes to our business practices, monetary penalties, increased cost of operations or other harm to our business.
We are subject to a variety of federal, state and local laws, directives, rules and policies relating to privacy and the collection, protection, use, retention, security, disclosure, transfer and other processing of personal data and other data. The regulatory framework for data privacy and security is continuously developing and, as a result, interpretation and implementation standards and enforcement practices are likely to remain uncertain for the foreseeable future. Additionally, new laws, amendments to or interpretations of existing laws, regulations, standards and other obligations both federally and on a state by state basis may require us to incur additional costs and restrict our business operations, and may require us to change how we use, collect, store, transfer or otherwise process certain types of personal information and to implement new processes to comply with those laws and our customers’ exercise of their rights thereunder. These laws also are not uniform, as certain laws may be more stringent or broader in scope, or offer greater individual rights, with respect to sensitive and personal information, and such laws may differ from each other, which may complicate compliance efforts. Compliance in the event of a widespread data breach may be costly. Any failure or perceived failure by us or our third-party service providers to comply with any applicable federal or state law, rule, regulation, industry standard, policy, certification or order relating to data privacy and security, or any compromise of security that results in the theft, unauthorized access, acquisition, use, disclosure, or misappropriation of personal data or other customer data, could result in significant awards, fines, civil and/or criminal penalties or judgments, proceedings or litigation by governmental agencies or customers, including class action privacy litigation in certain jurisdictions and negative publicity and reputational harm, one or all of which could have an adverse effect on our reputation, business, financial condition and results of operations.
RISKS RELATED TO OUR INDEBTEDNESS AND ACCESS TO CAPITAL
We face risks related to our current and future debt obligations that may limit our ability to make distributions to Unitholders, as well as our financial flexibility.
As of September 30, 2023, our long-term debt consisted of $350.0 million in aggregate principal amount of 5.875% senior notes due March 1, 2027, $650.0 million in aggregate principal amount of 5.0% senior notes due June 1, 2031, $80.6 million in aggregate principal amount of 5.5% Green Bonds due October 1, 2028 through October 1, 2033 and $132.0 million outstanding under our $500.0 million senior secured revolving credit facility. The payment of principal and interest on our debt will reduce the cash available to make distributions on our Common Units. In addition, we will not be able to make any distributions to holders of our Common Units if there is, or after giving effect to such distribution, there would be, an event of default under the indentures governing the senior notes, the senior secured revolving credit facility or the Green Bonds. The amount of distributions that we may make to holders of our Common Units is limited by the senior notes, and the amount of distributions that the Operating Partnership may make to us is limited by our
26
revolving credit facility. The amount of distributions that our subsidiary WOF SW GGP 1, LLC (“SuburbanRNG – Stanfield”) may make to us is limited by the Green Bonds. The revolving credit facility and the senior notes both contain various restrictive and affirmative covenants applicable to us, the Operating Partnership and its subsidiaries, respectively, including (i) restrictions on the incurrence of additional indebtedness, and (ii) restrictions on certain liens, investments, guarantees, loans, advances, payments, mergers, consolidations, distributions, sales of assets and other transactions. The revolving credit facility contains certain financial covenants:
Under the indentures governing the senior notes, we are generally permitted to make cash distributions equal to available cash, as defined, as of the end of the immediately preceding quarter, if no event of default exists or would exist upon making such distributions, and our consolidated fixed charge coverage ratio, as defined, is greater than 1.75 to 1. We and the Operating Partnership were in compliance with all covenants and terms of the senior notes and the revolving credit facility as of September 30, 2023.
The Green Bonds contain various restrictive and affirmative covenants applicable to SuburbanRNG – Stanfield, including (i) restrictions on the incurrence of additional indebtedness and (ii) restrictions on certain liens, investments, guarantees, loans, advances, payments, mergers, consolidations, distributions, sales of assets and other transactions. The Green Bonds contain a financial covenant requiring SuburbanRNG – Stanfield’s debt service coverage ratio, as defined therein, to be not less than 1.25 to 1.00 for any fiscal quarter. SuburbanRNG – Stanfield is in compliance with all covenants and terms of the Green Bonds as of September 30, 2023.
The amount and terms of our debt may also adversely affect our ability to finance future operations and capital needs, limit our ability to pursue acquisitions and other business opportunities and make our results of operations more susceptible to adverse economic and industry conditions. In addition to our outstanding indebtedness, we may in the future require additional debt to finance acquisitions or for general business purposes; however, credit market conditions may impact our ability to access such financing. If we are unable to access needed financing or to generate sufficient cash from operations, we may be required to abandon certain projects or curtail capital expenditures. Additional debt, where it is available, could result in an increase in our leverage. Our ability to make principal and interest payments depends on our future performance, which is subject to many factors, some of which are beyond our control, including, but not limited to, the risks discussed elsewhere in this section. As interest expense increases (whether due to an increase in interest rates and/or the size of aggregate outstanding debt), our ability to fund distributions on our Common Units may be impacted, depending on the level of revenue generation, which is not assured.
Our operating results and ability to generate sufficient cash flow to pay principal and interest on our indebtedness, and to pay distributions to Unitholders, may be affected by our ability to continue to control expenses.
The propane and fuel oil industries are mature and highly fragmented with competition from other multi-state marketers and thousands of smaller, local independent marketers. Demand for propane and fuel oil is expected to be affected by many factors beyond our control, including, but not limited to, the severity and length of weather conditions during the peak heating season, customer energy conservation driven by high energy costs and other economic factors, as well as technological advances impacting energy efficiency. Accordingly, our propane and fuel oil sales volumes and related gross margins may be negatively affected by these factors beyond our control. Our operating profits and ability to generate sufficient cash flow may depend on our ability to continue to control expenses in line with sales volumes. We can give no assurance that we will be able to continue to control expenses to the extent necessary to reduce any negative impact on our profitability and cash flow from these factors.
Disruptions in the capital and credit markets, including the availability and cost of debt and equity issuances for liquidity requirements, may adversely affect our ability to meet long-term commitments and our ability to hedge effectively, any of which could adversely affect our results of operations, cash flows and financial condition.
We rely on our ability to access the capital and credit markets at rates and terms reasonable to us. A disruption in the capital and credit markets or increased volatility could impair our ability to access capital and credit markets at rates and terms acceptable to us or at all. This could limit our ability to refinance long-term debt at or in advance of maturities or could force us to access capital and credit markets at rates or terms normally considered to be unreasonable, any of which could adversely affect our results of operations, cash flows and financial condition.
27
RISKS RELATED TO OUR COMMON UNITS
Cash distributions are not guaranteed and may fluctuate with our performance and other external factors.
Cash distributions on our Common Units are not guaranteed, and depend primarily on our cash flow and our cash on hand. Because they are not directly dependent on profitability, which is affected by non-cash items, our cash distributions might be made during periods when we record losses and might not be made during periods when we record profits.
The amount of cash we generate may fluctuate based on our performance and other factors, including:
Our Partnership Agreement gives our Board of Supervisors broad discretion in establishing cash reserves for, among other things, the proper conduct of our business. These cash reserves will affect the amount of cash available for distributions.
Unitholders have limited voting rights.
A Board of Supervisors governs our operations. Unitholders have only limited voting rights on matters affecting our business, including the right to elect the members of our Board of Supervisors every three years and the right to vote on the removal of the general partner.
It may be difficult for a third party to acquire us, even if doing so would be beneficial to our Unitholders.
Some provisions of our Partnership Agreement may discourage, delay or prevent third parties from acquiring us, even if doing so would be beneficial to our Unitholders. For example, our Partnership Agreement contains a provision, based on Section 203 of the Delaware General Corporation Law, that generally prohibits us from engaging in a business combination with a 15% or greater Unitholder for a period of three years following the date that person or entity acquired at least 15% of our outstanding Common Units, unless certain exceptions apply. Additionally, our Partnership Agreement sets forth advance notice procedures for a Unitholder to nominate a Supervisor to stand for election, which procedures may discourage or deter a potential acquirer from conducting a solicitation of proxies to elect the acquirer’s own slate of Supervisors or otherwise attempting to obtain control of the Partnership. These nomination procedures may not be revised or repealed, and inconsistent provisions may not be adopted, without the approval of the holders of at least 66-2/3% of the outstanding Common Units. These provisions may have an anti-takeover effect with respect to transactions not approved in advance by our Board of Supervisors, including discouraging attempts that might result in a premium over the market price of the Common Units held by our Unitholders.
Unitholders may not have limited liability in some circumstances.
A number of states have not clearly established limitations on the liabilities of limited partners for the obligations of a limited partnership. Our Unitholders might be held liable for our obligations as if they were general partners if:
Unitholders may have liability to repay distributions.
Unitholders will not be liable for assessments in addition to their initial capital investment in the Common Units. Under specific circumstances, however, Unitholders may have to repay to us amounts wrongfully returned or distributed to them. Under Delaware law, we may not make a distribution to Unitholders if the distribution causes our liabilities to exceed the fair value of our assets. Liabilities to partners on account of their partnership interests and nonrecourse liabilities are not counted for purposes of determining whether a distribution is permitted. Delaware law provides that a limited partner who receives a distribution of this kind and knew at the time of the distribution that the distribution violated Delaware law will be liable to the limited partnership for the distribution amount for three
28
years from the distribution date. Under Delaware law, an assignee who becomes a substituted limited partner of a limited partnership is liable for the obligations of the assignor to make contributions to the partnership. However, such an assignee is not obligated for liabilities unknown to them at the time that they became a limited partner if the liabilities could not be determined from the partnership agreement.
Our limited partner interest and Unitholders’ percentage of ownership may be diluted in the future and additional taxable income may be allocated to each Unitholder.
Our Partnership Agreement generally allows us to issue additional limited partner interests and other equity securities without the approval of our Unitholders. Therefore, when we issue additional Common Units or securities ranking above or on a parity with the Common Units, each Unitholder’s partnership interest will be diluted proportionately, and the amount of cash distributed on each Common Unit and the market price of Common Units could decrease. Similarly, our Unitholders’ percentage of ownership may be diluted in the future due to equity issuances or equity awards that we have granted or will grant to our supervisors, officers and employees. In addition, we have engaged in and may continue to undertake acquisitions financed in part through public or private offerings of securities, or other arrangements. The issuance of additional Common Units will also diminish the relative voting strength of each previously outstanding Common Unit. In addition, the issuance of additional Common Units, or other equity securities, will, over time, result in the allocation of additional taxable income, representing built-in gains at the time of the new issuance, to those Unitholders that existed prior to the new issuance.
TAX RISKS TO OUR UNITHOLDERS
Our tax treatment depends on our status as a partnership for U.S. federal income tax purposes. The Internal Revenue Service (“IRS”) could treat us as a corporation, which would substantially reduce the cash available for distribution to Unitholders.
The anticipated after-tax economic benefit of an investment in our Common Units depends largely on our being treated as a partnership for U.S. federal income tax purposes. If less than 90% of the gross income of a publicly traded partnership, such as Suburban Propane Partners, L.P., for any taxable year is “qualifying income” within the meaning of Section 7704 of the Internal Revenue Code, that partnership will be taxable as a corporation for U.S. federal income tax purposes for that taxable year and all subsequent years.
If we were treated as a corporation for U.S. federal income tax purposes, then we would pay U.S. federal income tax on our net income at the corporate tax rate, which is currently a maximum of 21%, and would likely pay additional state and local income and franchise tax at varying rates. Because a tax would be imposed upon us as a corporation, our cash available for distribution to Unitholders would be substantially reduced. Treatment of us as a corporation would result in a material reduction in the anticipated cash flow and after-tax return to Unitholders and thus would likely result in a substantial reduction in the value of our Common Units.
The tax treatment of publicly traded partnerships or an investment in our Common Units could be subject to potential legislative, judicial or administrative changes and differing interpretations thereof, possibly on a retroactive basis.
The present U.S. federal income tax treatment of publicly traded partnerships, including Suburban Propane Partners, L.P., or an investment in our Common Units may be modified by legislative, judicial or administrative changes and differing interpretations thereof at any time. Any modification to the U.S. federal income tax laws or interpretations thereof may or may not be applied retroactively. Moreover, any such modification could make it more difficult or impossible for us to meet the exception that allows publicly traded partnerships that generate qualifying income to be treated as partnerships (rather than as corporations) for U.S. federal income tax purposes, affect or cause us to change our business activities, or affect the tax consequences of an investment in our Common Units.
In addition, because of widespread state budget deficits and other reasons, several states are evaluating ways to subject partnerships to entity-level taxation through the imposition of state income, franchise and other forms of taxation.
If the IRS makes audit adjustments to our income tax returns, it (and some states) may collect any resulting taxes (including any applicable penalties and interest) directly from the Partnership, in which case cash available to service debt or to pay distributions to our Unitholders, could be substantially reduced.
If the IRS makes audit adjustments to our income tax returns, it may collect any resulting taxes (including any applicable penalties and interest) directly from us. We will generally have the ability to allocate any such tax liability to our current and former Unitholders in accordance with their interests in us during the year under audit. However, we may not be able to (or may not choose to) so allocate that tax liability, and may not be able to (or may choose not to) similarly allocate state income or similar tax liability resulting from adjustments in states in which we do business in the year under audit or in the adjustment year; instead, we may pay the tax. Accordingly, our current Unitholders may bear some or all of the audit adjustment, even if such Unitholders did not own units during the tax year
29
under audit. If we make payments of taxes, penalties and interest resulting from audit adjustments, cash available to service debt or to make distributions to our Unitholders could be substantially reduced.
A successful IRS contest of the U.S. federal income tax positions we take may adversely affect the market for our Common Units, and the cost of any IRS contest will reduce our cash available for distribution to our Unitholders.
We have not requested a ruling from the IRS with respect to our treatment as a partnership for U.S. federal income tax purposes or any other matter affecting us. The IRS may adopt positions that differ from the positions we take. It may be necessary to resort to administrative or court proceedings to sustain some or all of the positions we take. A court may not agree with the positions we take. Any contest with the IRS may materially and adversely impact the market for our Common Units and the price at which they trade. In addition, our costs of any contest with the IRS will be borne indirectly by our Unitholders because the costs will reduce our cash available for distribution.
A Unitholder’s tax liability could exceed cash distributions on its Common Units.
Because our Unitholders are treated as partners, a Unitholder is required to pay U.S. federal income taxes and state and local income taxes on its allocable share of our income, without regard to whether we make cash distributions to the Unitholder. We cannot guarantee that a Unitholder will receive cash distributions equal to its allocable share of our taxable income or even the tax liability to it resulting from that income.
Ownership of Common Units may have adverse tax consequences for tax-exempt organizations and foreign investors.
Investment in Common Units by certain tax-exempt entities and foreign persons raises issues specific to them. For example, virtually all of our taxable income allocated to organizations exempt from U.S. federal income tax, including individual retirement accounts and other retirement plans, will be unrelated business taxable income and thus will be taxable to them. Further, a tax-exempt entity with more than one unrelated trade or business (including by attribution from an investment in a partnership such as ours that is engaged in one or more unrelated trades or businesses) is required to compute the unrelated business taxable income of such tax-exempt entity separately with respect to each such trade or business (including for purposes of determining any net operating loss deduction). As a result, it may not be possible for tax-exempt entities to utilize losses from an investment in our partnership to offset unrelated business taxable income from another unrelated trade or business and vice versa.
Cash distributions paid to foreign persons will be reduced by withholding taxes at the highest applicable effective U.S. tax rate, and foreign persons will be required to file U.S. federal tax returns and pay tax on their share of our taxable income allocated to them. Upon the sale, exchange or other disposition of a common unit of a publicly traded partnership by a foreign person, the transferee is generally required to withhold 10% of the amount realized on such sale, exchange or other disposition if any portion of the gain on such sale, exchange or other disposition would be treated as effectively connected with a U.S. trade or business. Beginning in 2023, the IRS has clarified the broker is generally responsible for withholding 10% of the gross proceeds upon sale of an investment in a publicly traded partnership by a foreign investor. Distributions to foreign persons may also be subject to additional withholding of 10% under these rules to the extent a portion of a distribution is attributable to an amount in excess of our cumulative net income that has not previously been distributed.
The ability of a Unitholder to deduct its share of our losses may be limited.
Various limitations may apply to the ability of a Unitholder to deduct its share of our losses. For example, in the case of taxpayers subject to the passive activity loss rules (generally, individuals and closely held corporations), any losses generated by us will only be available to offset our future income and cannot be used to offset income from other activities, including other passive activities or investments. Such unused losses may be deducted when the Unitholder disposes of its entire investment in us in a fully taxable transaction with an unrelated party, such as a sale by a Unitholder of all of its Common Units in the open market. A Unitholder’s share of any net passive income may be offset by unused losses from us carried over from prior years, but not by losses from other passive activities, including losses from other publicly-traded partnerships.
The tax gain or loss on the disposition of Common Units could be different than expected.
A Unitholder who sells Common Units will recognize a gain or loss equal to the difference between the amount realized and its adjusted tax basis in the Common Units. Prior distributions in excess of cumulative net taxable income allocated to a Common Unit which decreased a Unitholder’s tax basis in that Common Unit will, in effect, become taxable income if the Common Unit is sold at a price greater than the Unitholder’s tax basis in that Common Unit, even if the price is less than the original cost of the Common Unit. A portion of the amount realized, if the amount realized exceeds the Unitholder’s adjusted basis in that Common Unit, will likely be characterized as ordinary income. Furthermore, should the IRS successfully contest some conventions used by us, a Unitholder could
30
recognize more gain on the sale of Common Units than would be the case under those conventions, without the benefit of decreased income in prior years. In addition, because the amount realized will include a holder’s share of our nonrecourse liabilities, if a Unitholder sells its Common Units, such Unitholder may incur a tax liability in excess of the amount of cash it receives from the sale.
Reporting of partnership tax information is complicated and subject to audits.
We intend to furnish to each Unitholder, within 90 days after the close of each calendar year, specific tax information, including a Schedule K-1 that sets forth its allocable share of income, gains, losses and deductions for our preceding taxable year. In preparing these schedules, we use various accounting and reporting conventions and adopt various depreciation and amortization methods. We cannot guarantee that these conventions will yield a result that conforms to statutory or regulatory requirements or to administrative pronouncements of the IRS. Further, our income tax return may be audited, which could result in an audit of a Unitholder’s income tax return and increased liabilities for taxes because of adjustments resulting from the audit.
We treat each purchaser of our Common Units as having the same tax benefits without regard to the actual Common Units purchased. The IRS may challenge this treatment, which could adversely affect the value of the Common Units.
Because we cannot match transferors and transferees of Common Units and because of other reasons, uniformity of the economic and tax characteristics of the Common Units to a purchaser of Common Units of the same class must be maintained. To maintain uniformity and for other reasons, we have adopted certain depreciation and amortization conventions that may be inconsistent with U.S. Treasury regulations. A successful IRS challenge to those positions could adversely affect the amount of tax benefits available to a Unitholder or result in a tax imposed upon us and borne by current Unitholders even if such Unitholder did not own units during the tax year under audit. A successful IRS challenge also could affect the timing of tax benefits or the amount of gain from the sale of Common Units, and could have a negative impact on the value of our Common Units or result in audit adjustments to a Unitholder’s income tax return.
We prorate our items of income, gain, loss and deduction between transferors and transferees of our Common Units each month based upon the ownership of our Common Units on the first day of each month, instead of on the basis of the date a particular Common Unit is transferred. The IRS may challenge this treatment, which could change the allocation of items of income, gain, loss and deduction among our Unitholders.
We prorate our items of income, gain, loss and deduction between transferors and transferees of our Common Units each month based upon the ownership of our Common Units on the first day of each month, instead of on the basis of the date a particular Common Unit is transferred. U.S. Treasury regulations provide a safe harbor pursuant to which publicly traded partnerships may use a similar monthly simplifying convention to allocate tax items among transferors and transferees of our Common Units. However, if the IRS were to challenge our proration method, we may be required to change the allocation of items of income, gain, loss and deduction among our Unitholders.
Unitholders may have negative tax consequences if we default on our debt or sell assets.
If we default on any of our debt obligations, our lenders will have the right to sue us for non-payment. This could cause an investment loss and negative tax consequences for Unitholders through the realization of taxable income by Unitholders without a corresponding cash distribution. Likewise, if we were to dispose of assets and realize a taxable gain while there is substantial debt outstanding and proceeds of the sale were applied to the debt, Unitholders could have increased taxable income without a corresponding cash distribution.
There are state, local and other tax considerations for our Unitholders.
In addition to U.S. federal income taxes, Unitholders will likely be subject to other taxes, such as state and local taxes, unincorporated business taxes and estate, inheritance or intangible taxes that are imposed by the various jurisdictions in which we do business or own property, even if the Unitholder does not reside in any of those jurisdictions. A Unitholder will likely be required to file state and local income tax returns and pay state and local income taxes in some or all of the various jurisdictions in which we do business or own property and may be subject to penalties for failure to comply with those requirements. It is the responsibility of each Unitholder to file all U.S. federal, state and local income tax returns that may be required of each Unitholder.
A Unitholder whose Common Units are loaned to a “short seller” to cover a short sale of Common Units may be considered as having disposed of those Common Units. If so, that Unitholder would no longer be treated for tax purposes as a partner with respect to those Common Units during the period of the loan and may recognize gain or loss from the disposition.
Because lending a partnership interest is not tax free, a Unitholder whose Common Units are loaned to a “short seller” to cover a short sale of Common Units may be considered as having disposed of the loaned Common Units. In that case, a Unitholder may no longer be treated for tax purposes as a partner with respect to those Common Units during the period of the loan to the short seller and
31
may recognize gain or loss from such disposition. Moreover, during the period of the loan to the short seller, any of our income, gain, loss or deduction with respect to those Common Units may not be reportable by the Unitholder and any cash distribution received by the Unitholder as to those Common Units could be fully taxable as ordinary income. Unitholders desiring to ensure their status as partners and avoid the risk of gain recognition from a loan to a short seller should consult their own tax advisors to discuss whether it is advisable to modify any applicable brokerage account agreements to prohibit their brokers from borrowing their Common Units.
ITEM 1B. UNRESOLVED STAFF COMMENTS
None.
ITEM 2. PROPERTIES
As of September 30, 2023, we owned approximately 74% of our customer service center and satellite locations and leased the balance of our retail locations from third parties. We own and operate a 22 million gallon refrigerated, above ground propane storage facility in Elk Grove, California. Additionally, we own our principal executive offices located in Whippany, New Jersey.
The transportation of propane requires specialized equipment. The trucks and railroad tank cars utilized for this purpose carry specialized steel tanks that maintain the propane in a liquefied state. As of September 30, 2023, we had a fleet of 10 transport truck tractors, of which we owned 4, and 33 railroad tank cars, of which we owned none. In addition, as of September 30, 2023 we had 1,022 bobtail and rack trucks, of which we owned 6%, 86 fuel oil tankwagons, of which we owned 7%, and 1,242 other delivery and service vehicles, of which we owned 18%. We lease the vehicles we do not own. As of September 30, 2023, we also owned approximately 829,000 customer propane storage tanks with typical capacities of 100 to 500 gallons, 55,000 customer propane storage tanks with typical capacities of over 500 gallons and 245,000 portable propane cylinders with typical capacities of five to ten gallons.
ITEM 3. LEGAL PROCEEDINGS
Our operations are subject to operating hazards and risks normally incidental to handling, storing and delivering combustible liquids such as propane. We have been, and will continue to be, a defendant in various legal proceedings and litigation as a result of these operating hazards and risks, and as a result of other aspects of our business. In this regard, our natural gas and electricity business was sued in a putative class action suit in the Northern District of New York. The complaint alleged a number of claims under various consumer statutes and common law in New York and Pennsylvania regarding pricing offered to electricity customers in those states. The case was dismissed in part by the district court, but causes of action based on the New York consumer statute and breach of contract were allowed to proceed. On April 12, 2022, the court granted summary judgment in favor of the Partnership on the remaining counts and the complaint was dismissed in full. The plaintiff has filed an appeal to the Second Circuit Court of Appeals. The matter has been fully briefed, argued, and a decision is pending. While we believe that the appeal is without merit, we are unable to predict at this time the ultimate outcome of the New York action. If the plaintiff prevails on appeal, the matter will return to the trial court for further proceedings. If we are ultimately unable to successfully defend our AES business in this class action lawsuit, a decision rendered against AES could have an adverse impact on AES’s business and operations. Although any litigation is inherently uncertain, based on past experience, the information currently available to us, and the amount of our accrued insurance liabilities, we do not believe that currently pending or threatened litigation matters, or known claims or known contingent claims, will have a material adverse effect on our results of operations, financial condition or cash flow.
ITEM 4. MINE SAFETY DISCLOSURES
None.
32
PART II
ITEM 5. MARKET FOR THE REGISTRANT’S COMMON UNITS, RELATED UNITHOLDER MATTERS AND ISSUER PURCHASES OF UNITS
On October 26, 2023, we announced that our Board of Supervisors declared a quarterly distribution of $0.325 per Common Unit for the three months ended September 30, 2023. This quarterly distribution rate equates to an annualized rate of $1.30 per Common Unit.
ITEM 6. [RESERVED]
ITEM 7. MANAGEMENT’S DISCUSSION AND ANALYSIS OF FINANCIAL CONDITION AND RESULTS OF OPERATIONS
The following is a discussion and analysis of our financial condition and results of operations, seen from our perspective, which should be read in conjunction with our consolidated financial statements and notes thereto included elsewhere in this Annual Report.
Executive Overview
The following are factors that regularly affect our operating results and financial condition. In addition, our business is subject to the risks and uncertainties described in Item 1A of this Annual Report. Management currently considers the following events, trends, and uncertainties to be most important to understanding our financial condition and operating performance:
Product Costs and Supply
The level of profitability in the retail propane, fuel oil, natural gas and electricity businesses is largely dependent on the difference between retail sales price and our costs to acquire and transport products. The unit cost of our products, particularly propane, fuel oil and natural gas, is subject to volatility as a result of supply and demand dynamics or other market conditions, including, but not limited to, economic and political factors impacting crude oil and natural gas supply or pricing. We enter into product supply contracts that are generally one-year agreements subject to annual renewal, and also purchase product on the open market. We attempt to reduce price risk by pricing product on a short-term basis. Our propane supply contracts typically provide for pricing based upon index formulas using the posted prices established at major supply points such as Mont Belvieu, Texas, or Conway, Kansas (plus transportation costs) at the time of delivery.
To supplement our annual purchase requirements, we may utilize forward fixed price purchase contracts to acquire a portion of the propane that we resell to our customers, which allows us to manage our exposure to unfavorable changes in commodity prices and to assure adequate physical supply. The percentage of contract purchases, and the amount of supply contracted for under forward contracts at fixed prices, will vary from year to year based on market conditions.
Changes in our costs to acquire and transport products can occur rapidly over a short period of time and can impact profitability. There is no assurance that we will be able to pass on product acquisition and transportation cost increases fully or immediately, particularly when such costs increase rapidly. Therefore, average retail sales prices can vary significantly from year to year as our costs fluctuate with the propane, fuel oil, crude oil and natural gas commodity markets and infrastructure conditions. In addition, periods of sustained higher commodity and/or transportation prices can lead to customer conservation, resulting in reduced demand for our product.
During fiscal 2023, the wholesale cost of propane generally trended lower as the nation’s propane inventory levels improved relative to the prior year and historical averages. According to the Energy Information Administration, U.S. propane inventory levels at the end of September 2023 were 101.4 million barrels, which was 20.1% higher than September 2022 levels and 11.2% more than the five-year average for September. The higher propane inventory levels contributed to declines in average posted propane prices (basis Mont Belvieu, Texas) for fiscal 2023 of 38.9% compared to the prior year. Consistent with our established practice, we adjusted customer pricing as market conditions allowed.
33
Seasonality
The retail propane and fuel oil distribution businesses, as well as the retail natural gas marketing business, are seasonal because these fuels are primarily used for heating in residential and commercial buildings. Historically, approximately two‑thirds of our retail propane volume is sold during the nine-month peak heating season from October through March. The fuel oil business tends to experience greater seasonality given its more limited use for space heating and approximately three-fourths of our fuel oil volumes are sold between October and March. Consequently, sales and operating profits are concentrated in our first and second fiscal quarters. Cash flows from operations, therefore, are greatest during the second and third fiscal quarters when customers pay for product purchased during the winter heating season. We expect lower operating profits and either net losses or lower net income during the period from April through September (our third and fourth fiscal quarters). To the extent necessary, we will reserve cash from the second and third quarters for distribution to holders of our Common Units in the fourth quarter and the following fiscal year first quarter.
Weather
Weather conditions have a significant impact on the demand for our products, in particular propane, fuel oil and natural gas, for both heating and agricultural purposes. Many of our customers rely heavily on propane, fuel oil or natural gas as a heating source. Accordingly, the volume sold is directly affected by the severity of the winter weather in our service areas, which can vary substantially from year to year. In any given area, sustained warmer than normal temperatures will tend to result in reduced propane, fuel oil and natural gas consumption, while sustained colder than normal temperatures will tend to result in greater consumption.
Hedging and Risk Management Activities
We engage in hedging and risk management activities to reduce the effect of price volatility on our product costs and to ensure the availability of product during periods of short supply. We enter into propane forward, options and swap agreements with third parties, and use futures and options contracts traded on the New York Mercantile Exchange (“NYMEX”) to purchase and sell propane, fuel oil, crude oil and natural gas at fixed prices in the future. The majority of the futures, forward and options agreements are used to hedge price risk associated with propane and fuel oil physical inventory, as well as, in certain instances, forecasted purchases of propane or fuel oil. In addition, we sell propane and fuel oil to customers at fixed prices, and enter into derivative instruments to hedge a portion of our exposure to fluctuations in commodity prices as a result of selling the fixed price contracts. Forward contracts are generally settled physically at the expiration of the contract whereas futures, options and swap contracts are generally settled at the expiration of the contract through a net settlement mechanism. Although we use derivative instruments to reduce the effect of price volatility associated with priced physical inventory and forecasted transactions, we do not use derivative instruments for speculative trading purposes. Risk management activities are monitored by an internal Commodity Risk Management Committee, made up of six members of management and reporting to our Audit Committee, through enforcement of our Hedging and Risk Management Policy.
Inflation and Other Cost Increases
We are experiencing increased inflation in the costs of various goods and services we use to operate our business, including volatile wholesale costs for the products we distribute. Although we have not experienced significant disruptions with securing the products we sell, inflationary factors and competition for resources across the supply chain has resulted in increased costs in a wide variety of areas, including labor, transportation costs, operating costs and the cost of tanks and other equipment. These and other factors may continue to impact our product costs, expenses, and capital expenditures, and could continue to have an impact on consumer demand as consumers manage the impact of inflation on their resources.
Critical Accounting Policies and Estimates
Our significant accounting policies are summarized in Note 2, “Summary of Significant Accounting Policies” included within the Notes to Consolidated Financial Statements section elsewhere in this Annual Report.
Certain amounts included in or affecting our consolidated financial statements and related disclosures must be estimated, requiring management to make certain assumptions with respect to values or conditions that cannot be known with certainty at the time the financial statements are prepared. The preparation of financial statements in conformity with accounting principles generally accepted in the United States of America (“US GAAP”) requires management to make estimates and assumptions that affect the reported amounts of assets and liabilities and disclosure of contingent assets and liabilities at the date of the financial statements and the reported amounts of revenues and expenses during the reporting period. We are also subject to risks and uncertainties that may cause actual results to differ from estimated results. Estimates are used when accounting for depreciation and amortization of long-lived assets, employee benefit plans, self-insurance and litigation reserves, environmental reserves, allowances for doubtful accounts, asset valuation assessments and valuation of derivative instruments. We base our estimates on historical experience and on various other assumptions that are believed to be reasonable under the circumstances, the results of which form the basis for making judgments about the carrying
34
values of assets and liabilities that are not readily apparent from other sources. Any effects on our business, financial position or results of operations resulting from revisions to these estimates are recorded in the period in which the facts that give rise to the revision become known to us. Management has reviewed these critical accounting estimates and related disclosures with the Audit Committee of our Board of Supervisors. We believe that the following are our critical accounting estimates:
Allowances for Doubtful Accounts. We maintain allowances for doubtful accounts for estimated losses resulting from the inability of our customers to make required payments. We estimate our allowances for doubtful accounts using a specific reserve for known or anticipated uncollectible accounts, as well as an estimated reserve for potential future uncollectible accounts taking into consideration our historical write-offs. If the financial condition of one or more of our customers were to deteriorate resulting in an impairment in their ability to make payments, additional allowances could be required. As a result of our large and diverse customer base, which is comprised of approximately 1.0 million customers, no individual customer account is material. Therefore, while some variation to actual results occurs, historically such variability has not been material. Schedule II, Valuation and Qualifying Accounts, provides a summary of the changes in our allowances for doubtful accounts during the period.
Pension and Other Postretirement Benefits. We estimate the rate of return on plan assets, the discount rate used to estimate the present value of future benefit obligations and the expected cost of future health care benefits in determining our annual pension and other postretirement benefit costs. We use the Society of Actuaries’ mortality scale (MP-2021) and other actuarial life expectancy information when developing the annual mortality assumptions for our pension and postretirement benefit plans, which are used to measure net periodic benefit costs and the obligation under these plans. While we believe that our assumptions are appropriate, significant differences in our actual experience or significant changes in market conditions may materially affect our pension and other postretirement benefit obligations and our future expense.
We contribute to multi-employer pension plans (“MEPPs”) in accordance with various collective bargaining agreements covering union employees. As one of the many participating employers in these MEPPs, we are responsible with the other participating employers for any plan underfunding. Due to the uncertainty regarding future factors that could impact the withdrawal liability, we are unable to determine the timing of the payment of the future withdrawal liability, or additional future withdrawal liability, if any.
Accrued Insurance. Our accrued insurance represents the estimated costs of known and anticipated or unasserted claims for incidents related to general and product, workers’ compensation and automobile liabilities. For each claim, we record a provision up to the estimated amount of the probable claim utilizing actuarially determined loss development factors applied to actual claims data. Our insurance provisions are susceptible to change to the extent that actual claims development differs from historical claims development. We maintain insurance coverage wherein our net exposure for insured claims is limited to the insurance deductible, claims above which are paid by our insurance carriers. For the portion of our estimated insurance liability that exceeds our deductibles, we record an asset related to the amount of the liability expected to be paid by the insurance companies. Historically, we have not experienced significant variability in our actuarial estimates for claims incurred but not reported. Accrued insurance provisions for reported claims are reviewed at least quarterly, and our assessment of whether a loss is probable and/or reasonably estimable is updated as necessary. Due to the inherently uncertain nature of, in particular, product liability claims, the ultimate loss may differ materially from our estimates. However, because of the nature of our insurance arrangements, those material variations historically have not, nor are they expected in the future to have, a material impact on our results of operations or financial position.
Loss Contingencies. In the normal course of business, we are involved in various claims and legal proceedings. We record a liability for such matters when it is probable that a loss has been incurred and the amounts can be reasonably estimated. The liability includes probable and estimable legal costs to the point in the legal matter where we believe a conclusion to the matter will be reached. When only a range of possible loss can be established, the most probable amount in the range is accrued. If no amount within this range is a better estimate than any other amount within the range, the minimum amount in the range is accrued.
Fair Values of Acquired Assets and Liabilities. From time to time, we enter into material business combinations. In accordance with accounting guidance associated with business combinations, the assets acquired and liabilities assumed are recorded at their estimated fair value as of the acquisition date. Fair values of assets acquired and liabilities assumed are based upon available information and may involve us engaging an independent third party to perform an appraisal. Estimating fair values can be complex and subject to significant business judgment. Estimates most commonly impact property, plant and equipment and intangible assets, including goodwill. Generally, we have, if necessary, up to one year from the acquisition date to finalize our estimates of acquisition date fair values.
35
Results of Operations and Financial Condition
Fiscal 2023 included 53 weeks of operations compared to 52 weeks reported in the prior year.
Net income for fiscal 2023 was $123.8 million, or $1.94 per Common Unit, compared to $139.7 million, or $2.21 per Common Unit, in fiscal 2022.
Adjusted earnings before interest, taxes, depreciation and amortization (Adjusted EBITDA, as defined and reconciled below) was $275.0 million for fiscal 2023, compared to $291.0 million in the prior year.
Retail propane gallons sold in fiscal 2023 of 396.4 million gallons decreased 1.2% compared to the prior year, primarily due to unseasonably warm and inconsistent temperatures throughout the heating season, including near record warm temperatures during January and February, which are the two most critical months for heat-related demand. Average temperatures (as measured by heating degree days) across all of our service territories for fiscal 2023 were 8% warmer than normal and 2% cooler than the prior year. However, for the months of January and February, average temperatures were 16% warmer than normal and 11% warmer than the same period last year.
Average propane prices (basis Mont Belvieu, Texas) for fiscal 2023 decreased 38.9% compared to the prior year. Total gross margins of $839.0 million in fiscal 2023 increased $49.7 million, or 6.3%, compared to the prior year. Gross margins included a $3.7 million unrealized loss attributable to the mark-to-market adjustment for derivative instruments used in risk management activities in fiscal 2023, compared to a $27.9 million unrealized loss in the prior year. These non-cash adjustments, which were reported in cost of products sold, were excluded from Adjusted EBITDA for both periods. Excluding the impact of the unrealized mark-to-market adjustments, gross margin for fiscal 2023 increased $25.4 million, or 3.1%, compared to the prior year, primarily due to higher propane unit margins and margin contribution from the RNG assets acquired in December 2022, offset to an extent by lower propane volumes sold. Excluding the impact of the unrealized mark-to-market adjustments, propane unit margins for fiscal 2023 increased $0.04 per gallon, or 2.0%, compared to the prior year.
Combined operating and general and administrative expenses of $569.6 million for fiscal 2023 increased 8.7% compared to the prior year, primarily due to higher payroll and benefit-related expenses, higher vehicle lease and operating costs, operating and acquisition-related costs associated with the RNG assets acquired in December 2022, as well as other inflationary effects on our operating costs. Acquisition-related costs of $4.7 million during fiscal 2023 were reported within general and administrative expenses, and were excluded from Adjusted EBITDA.
In addition to overcoming the challenging weather patterns and inflationary cost environment to deliver solid earnings, we succeeded in accomplishing a number of significant goals in fiscal 2023 as we continued to execute on our long-term strategic growth initiatives. The following highlights a few noteworthy accomplishments for fiscal 2023:
36
As a result of the net borrowings to fund the RNG Acquisition, reduced in large part by the use of excess cash flow from operating activities, our Consolidated Leverage Ratio, as defined in our credit agreement, measured 4.28x for the fiscal year ended September 30, 2023.
On October 26, 2023, we announced that our Board of Supervisors declared a quarterly distribution of $0.325 per Common Unit for the three months ended September 30, 2023. This quarterly distribution rate equates to an annualized rate of $1.30 per Common Unit. The distribution was paid on November 14, 2023 to Common Unitholders of record as of November 7, 2023.
As we look ahead to fiscal 2024, our anticipated cash requirements include: (i) maintenance and growth capital expenditures of approximately $40.0 million for the propane segment; (ii) capital expenditures of approximately $28.2 million to support the construction and development efforts for our renewable energy platform; (iii) approximately $71.7 million of interest and income tax payments; and (iv) approximately $83.1 million of distributions to Unitholders, based on the current annualized rate of $1.30 per Common Unit. Based on our liquidity position, which includes availability of funds under the revolving credit facility and expected cash flow from operating activities, we expect to have sufficient funds to meet our current and future obligations.
Our RNG production facilities are diversified across feedstocks, geographies and revenue streams, and complements Suburban Renewable Energy’s ongoing activity to construct, own and operate an RNG facility at Adirondack Farms. The RNG Acquisition enhanced and increases Suburban Renewable Energy’s presence in RNG production and distribution. Additionally, the partnership with Equilibrium through the joint venture arrangement provides visible growth and experienced management in the rapidly developing waste-to-energy economy. RNG can be produced from multiple organic waste streams, including agricultural and food waste, helping to reduce methane emissions, while offering a lower carbon solution as a drop-in replacement for traditional natural gas. This scalable platform complements our existing portfolio of renewable energy assets, both as a stand-alone RNG distributor, or using RNG as a pathway to hydrogen or rDME production. Suburban Propane has a proud 95-year legacy of being a trusted provider of energy to local communities. Leveraging the strength and stability of our core propane business, we are positioning ourselves for sustainable long-term growth by investing in the clean energy economy of the future as society transitions to lower carbon alternatives.
Fiscal Year 2023 Compared to Fiscal Year 2022
Revenues
(Dollars and gallons in thousands) |
|
|
|
|
|
|
|
|
|
|
Percent |
|
||||
|
|
Fiscal |
|
|
Fiscal |
|
|
Increase |
|
|
Increase |
|
||||
|
|
2023 |
|
|
2022 |
|
|
(Decrease) |
|
|
(Decrease) |
|
||||
Revenues |
|
|
|
|
|
|
|
|
|
|
|
|
||||
Propane |
|
$ |
1,232,138 |
|
|
$ |
1,313,556 |
|
|
$ |
(81,418 |
) |
|
|
(6.2 |
)% |
Fuel oil and refined fuels |
|
|
92,127 |
|
|
|
95,157 |
|
|
|
(3,030 |
) |
|
|
(3.2 |
)% |
Natural gas and electricity |
|
|
31,160 |
|
|
|
39,511 |
|
|
|
(8,351 |
) |
|
|
(21.1 |
)% |
All other |
|
|
73,769 |
|
|
|
53,241 |
|
|
|
20,528 |
|
|
|
38.6 |
% |
Total revenues |
|
$ |
1,429,194 |
|
|
$ |
1,501,465 |
|
|
$ |
(72,271 |
) |
|
|
(4.8 |
)% |
Retail gallons sold |
|
|
|
|
|
|
|
|
|
|
|
|
||||
Propane |
|
|
396,393 |
|
|
|
401,322 |
|
|
|
(4,929 |
) |
|
|
(1.2 |
)% |
Fuel oil and refined fuels |
|
|
19,103 |
|
|
|
22,767 |
|
|
|
(3,664 |
) |
|
|
(16.1 |
)% |
As discussed above, average temperatures (as measured in heating degree days) across all of our service territories for fiscal 2023 were 8% warmer than normal, albeit 2% cooler than the prior year. The weather pattern during the fiscal 2023 heating season was characterized by exceptionally warm temperatures throughout our East and Midwest service territories, particularly during the most critical months for heat-related demand, while our service territories in the West generally experienced cooler weather throughout the heating season that extended into the second half of the fiscal year. For the critical heating months of January and February, overall average temperatures were 16% warmer than normal and 11% warmer than the same period last year, and were on par for the warmest on record for that two-month period. The unseasonably warm and inconsistent weather pattern during much of fiscal 2023 adversely impacted heat-related demand.
Revenues from the distribution of propane and related activities of $1,232.1 million for fiscal 2023 decreased $81.4 million, or 6.2%, compared to $1,313.6 million for the prior year, primarily due to lower average retail selling prices associated with lower wholesale costs and lower volumes sold. Average propane selling prices for fiscal 2023 decreased 4.6% compared to the prior year, reflecting lower average wholesale costs, resulting in a $58.2 million decrease in revenues. Retail propane gallons sold decreased 4.9 million gallons, or 1.2%, to 396.4 million gallons, resulting in a decrease in revenues of $15.9 million. Included within the propane segment are revenues from risk management activities of $12.7 million for fiscal 2023, which decreased $7.3 million primarily due to the impact of lower selling prices on hedging contracts used in risk management activities that were settled physically.
37
Revenues from the distribution of fuel oil and refined fuels of $92.1 million for fiscal 2023 decreased $3.0 million, or 3.2%, from $95.2 million for the prior year, primarily due to lower volumes sold, offset to an extent by higher average selling prices. Fuel oil and refined fuels gallons sold decreased 3.7 million gallons, or 16.1%, resulting in a $15.0 million decrease in revenues. Average selling prices for fuel oil and refined fuels increased 15.1%, resulting in a $12.0 million increase in revenues.
Revenues in our natural gas and electricity segment decreased $8.4 million, or 21.1%, to $31.2 million in fiscal 2023 compared to $39.5 million in the prior year, resulting from lower volumes sold, primarily due to the impact of warmer temperatures in our operating territories on customer demand and a lower customer base.
Revenues in our all other segment of $73.8 million were $20.5 million, or 38.6%, higher than in the corresponding prior year, primarily due to the impact of the RNG Acquisition in December 2022. Revenue from the RNG production assets primarily consist of sales of RNG and the associated environmental attributes, and tipping fees charged to third parties for various waste feedstocks.
Cost of Products Sold
(Dollars in thousands) |
|
|
|
|
|
|
|
|
|
|
Percent |
|
||||
|
|
Fiscal |
|
|
Fiscal |
|
|
Increase |
|
|
Increase |
|
||||
|
|
2023 |
|
|
2022 |
|
|
(Decrease) |
|
|
(Decrease) |
|
||||
Cost of products sold |
|
|
|
|
|
|
|
|
|
|
|
|
||||
Propane |
|
$ |
489,808 |
|
|
$ |
601,081 |
|
|
$ |
(111,273 |
) |
|
|
(18.5 |
)% |
Fuel oil and refined fuels |
|
|
65,572 |
|
|
|
68,298 |
|
|
|
(2,726 |
) |
|
|
(4.0 |
)% |
Natural gas and electricity |
|
|
19,100 |
|
|
|
27,256 |
|
|
|
(8,156 |
) |
|
|
(29.9 |
)% |
All other |
|
|
15,651 |
|
|
|
15,488 |
|
|
|
163 |
|
|
|
1.1 |
% |
Total cost of products sold |
|
$ |
590,131 |
|
|
$ |
712,123 |
|
|
$ |
(121,992 |
) |
|
|
(17.1 |
)% |
As a percent of total revenues |
|
|
41.3 |
% |
|
|
47.4 |
% |
|
|
|
|
|
|
||
The cost of products sold reported in the consolidated statements of operations represents the weighted average unit cost of propane, fuel oil and refined fuels, and natural gas and electricity sold, including transportation costs to deliver product from our supply points to storage or to our customer service centers. Cost of products sold also includes the cost of appliances and related parts sold or installed by our customer service centers computed on a basis that approximates the average cost of the products.
Given the retail nature of our operations, we maintain a certain level of priced physical inventory to help ensure that our field operations have adequate supply commensurate with the time of year. Our strategy has been, and will continue to be, to keep our physical inventory priced relatively close to market for our field operations. Consistent with past practices, we principally utilize futures and/or options contracts traded on the NYMEX to mitigate the price risk associated with our priced physical inventory, as well as, in certain instances, forecasted purchases of propane or fuel oil. In addition, we sell propane and fuel oil to customers at fixed prices, and enter into derivative instruments to hedge a portion of our exposure to fluctuations in commodity prices as a result of selling the fixed price contracts. At expiration, the derivative contracts are settled by the delivery of the product to the respective party or are settled by the payment to the respective party of a net amount equal to the difference between the then market price and the fixed contract price or option exercise price. Under this risk management strategy, realized gains or losses on futures or options contracts, which are reported in cost of products sold, will typically offset losses or gains on the physical inventory once the product is sold or delivered as it pertains to fixed price contracts (which may or may not occur in the same accounting period). We do not use futures or options contracts, or other derivative instruments, for speculative trading purposes. Unrealized non-cash gains or losses from changes in the fair value of derivative instruments that are not designated as cash flow hedges are recorded within cost of products sold. Cost of products sold excludes depreciation and amortization; these amounts are reported separately within the consolidated statements of operations.
From a commodity perspective, as discussed above, wholesale propane prices trended lower throughout much of fiscal 2023. Overall, average posted propane prices (basis Mont Belvieu, Texas) and fuel oil prices during fiscal 2023 were 38.9% and 8.0% lower than the prior year, respectively. The net change in the fair value of derivative instruments during the fiscal year resulted in unrealized non-cash losses of $3.7 million and $27.9 million reported in cost of products sold in fiscal 2023 and 2022, respectively, resulting in a year-over-year decrease of $24.2 million in cost of products sold, all of which was reported in the propane segment.
38
Cost of products sold associated with the distribution of propane and related activities of $489.8 million for fiscal 2023 decreased $111.3 million, or 18.5%, compared to the prior year. Lower average wholesale costs contributed to an $85.6 million decrease in cost of products sold, while lower volumes sold contributed to a $7.6 million decrease. Included within the propane segment are costs from other propane activities which decreased $18.1 million resulting from the mark-to-market adjustments on derivative instruments in both periods discussed above, partially offset by an increase in costs for physically settled propane hedges.
Cost of products sold associated with our fuel oil and refined fuels segment of $65.6 million for fiscal 2023 decreased $2.7 million, or 4.0%, compared to the prior year. Lower volumes sold contributed to an $11.0 million decrease in cost of products sold, while higher average wholesale costs from inventory purchased earlier in the year contributed to an increase in cost of products sold of $8.3 million.
Cost of products sold in our natural gas and electricity segment of $19.1 million for fiscal 2023 decreased $8.2 million, or 29.9%, compared to the prior year, primarily due to lower natural gas and electricity wholesale costs, coupled with lower usage.
Operating Expenses
(Dollars in thousands) |
|
|
|
|
|
|
|
|
|
|
|
|
||||
|
|
Fiscal |
|
|
Fiscal |
|
|
|
|
|
Percent |
|
||||
|
|
2023 |
|
|
2022 |
|
|
Increase |
|
|
Increase |
|
||||
Operating expenses |
|
$ |
478,058 |
|
|
$ |
442,411 |
|
|
$ |
35,647 |
|
|
|
8.1 |
% |
As a percent of total revenues |
|
|
33.4 |
% |
|
|
29.5 |
% |
|
|
|
|
|
|
||
All costs of operating our retail distribution and appliance sales and service operations, as well as the RNG production facilities, are reported within operating expenses in the consolidated statements of operations. These operating expenses include the compensation and benefits of field and direct operating support personnel, costs of operating and maintaining our vehicle fleet, overhead and other costs of our purchasing, training and safety departments and other direct and indirect costs of operating our customer service centers and RNG production facilities.
Operating expenses of $478.1 million for fiscal 2023 increased $35.6 million, or 8.1%, compared to $442.4 million in the prior year, primarily due to higher payroll costs, higher vehicle lease and repair costs, higher travel costs, the operating costs associated with our new RNG production facilities and other inflationary effects on our operating costs.
General and Administrative Expenses
(Dollars in thousands) |
|
|
|
|
|
|
|
|
|
|
|
|
||||
|
|
Fiscal |
|
|
Fiscal |
|
|
|
|
|
Percent |
|
||||
|
|
2023 |
|
|
2022 |
|
|
Increase |
|
|
Increase |
|
||||
General and administrative expenses |
|
$ |
91,574 |
|
|
$ |
81,756 |
|
|
$ |
9,818 |
|
|
|
12.0 |
% |
As a percent of total revenues |
|
|
6.4 |
% |
|
|
5.4 |
% |
|
|
|
|
|
|
||
All costs of our back office support functions, including compensation and benefits for executives and other support functions, as well as other costs and expenses to maintain finance and accounting, treasury, legal, human resources, corporate development and the information systems functions are reported within general and administrative expenses in the consolidated statements of operations.
General and administrative expenses of $91.6 million for fiscal 2023 increased $9.8 million, or 12.0%, compared to $81.8 million in the prior year, primarily due to professional fees and expenses of $4.7 million related to the RNG Acquisition, as well as higher payroll costs and other inflationary increases, offset to an extent by a decrease in variable compensation expenses.
Depreciation and Amortization
(Dollars in thousands) |
|
|
|
|
|
|
|
|
|
|
|
|
||||
|
|
Fiscal |
|
|
Fiscal |
|
|
|
|
|
Percent |
|
||||
|
|
2023 |
|
|
2022 |
|
|
Increase |
|
|
Increase |
|
||||
Depreciation and amortization |
|
$ |
62,582 |
|
|
$ |
58,848 |
|
|
$ |
3,734 |
|
|
|
6.3 |
% |
As a percent of total revenues |
|
|
4.4 |
% |
|
|
3.9 |
% |
|
|
|
|
|
|
||
Depreciation and amortization expense of $62.6 million in fiscal 2023 increased $3.7 million, or 6.3%, from $58.8 million in the prior year, primarily as a result of depreciation and amortization from the tangible and intangible assets from the RNG Acquisition, partially offset by accelerated depreciation recorded in the prior year on certain assets taken out of service.
39
Interest Expense, net
(Dollars in thousands) |
|
|
|
|
|
|
|
|
|
|
|
|
||||
|
|
Fiscal |
|
|
Fiscal |
|
|
|
|
|
Percent |
|
||||
|
|
2023 |
|
|
2022 |
|
|
Increase |
|
|
Increase |
|
||||
Interest expense, net |
|
$ |
73,393 |
|
|
$ |
60,658 |
|
|
$ |
12,735 |
|
|
|
21.0 |
% |
As a percent of total revenues |
|
|
5.1 |
% |
|
|
4.0 |
% |
|
|
|
|
|
|
||
Net interest expense of $73.4 million for fiscal 2023 increased $12.7 million, or 21.0% from $60.7 million in the prior year, primarily due to the impact of higher benchmark interest rates for borrowings under our Revolving Credit Facility and a higher average level of outstanding borrowings under that facility to fund the RNG Acquisition, as well as the impact of $80.6 million in Green Bonds assumed in the RNG Acquisition. See Liquidity and Capital Resources below for additional discussion.
Net Income and Adjusted EBITDA
Net income for fiscal 2023 amounted to $123.8 million, or $1.94 per Common Unit, compared to $139.7 million, or $2.21 per Common Unit, in fiscal 2022. Earnings before interest, taxes, depreciation and amortization (“EBITDA”) for fiscal 2023 amounted to $260.4 million, compared to $259.6 million for fiscal 2022.
Net income and EBITDA for fiscal 2023 included (i) a $6.3 million loss on our equity investments in unconsolidated affiliates; and (ii) $4.7 million in professional fees and expenses related to the RNG Acquisition. Net income and EBITDA for fiscal 2022 included (i) a $2.6 million loss on our equity investments in unconsolidated affiliates; and (ii) a $0.8 million pension settlement charge. Excluding the effects of these items, as well as the unrealized non-cash mark-to-market adjustments on derivative instruments in both years, Adjusted EBITDA decreased to $275.0 million for fiscal 2023, compared to Adjusted EBITDA of $291.0 million for fiscal 2022.
EBITDA represents net income before deducting interest expense, income taxes, depreciation and amortization. Adjusted EBITDA represents EBITDA excluding the unrealized net gain or loss on mark-to-market activity for derivative instruments and other items, as applicable, as provided in the table below. Our management uses EBITDA and Adjusted EBITDA as supplemental measures of operating performance and we are including them because we believe that they provide our investors and industry analysts with additional information to evaluate our operating results. EBITDA and Adjusted EBITDA are not recognized terms under US GAAP and should not be considered as an alternative to net income or net cash provided by operating activities determined in accordance with US GAAP. Because EBITDA and Adjusted EBITDA as determined by us excludes some, but not all, items that affect net income, they may not be comparable to EBITDA and Adjusted EBITDA or similarly titled measures used by other companies.
The following table sets forth our calculations of EBITDA and Adjusted EBITDA:
(Dollars in thousands) |
|
Year Ended |
|
|||||
|
|
September 30, |
|
|
September 24, |
|
||
|
|
2023 |
|
|
2022 |
|
||
Net income |
|
$ |
123,752 |
|
|
$ |
139,708 |
|
Add: |
|
|
|
|
|
|
||
Provision for income taxes |
|
|
668 |
|
|
|
429 |
|
Interest expense, net |
|
|
73,393 |
|
|
|
60,658 |
|
Depreciation and amortization |
|
|
62,582 |
|
|
|
58,848 |
|
EBITDA |
|
|
260,395 |
|
|
|
259,643 |
|
Unrealized non-cash losses on changes in fair value of derivatives |
|
|
3,671 |
|
|
|
27,929 |
|
Equity in losses of unconsolidated affiliates |
|
|
6,264 |
|
|
|
2,614 |
|
Acquisition-related costs |
|
|
4,695 |
|
|
|
— |
|
Pension settlement charge |
|
|
— |
|
|
|
840 |
|
Adjusted EBITDA |
|
$ |
275,025 |
|
|
$ |
291,026 |
|
We also reference gross margins, computed as revenues less cost of products sold as those amounts are reported on the consolidated financial statements. Our management uses gross margin as a supplemental measure of operating performance and we are including it as we believe that it provides our investors and industry analysts with additional information that we determined is useful to evaluate our operating results. As cost of products sold does not include depreciation and amortization expense, the gross margin we reference is considered a non-GAAP financial measure.
40
Fiscal Year 2022 Compared to Fiscal Year 2021
We are omitting from this section our discussion of the earliest of the three years of financial information included in this Form 10-K. The discussion for fiscal year 2022 compared to fiscal year 2021 can be found in “Management’s Discussion and Analysis of Financial Condition and Results of Operations” in Part II, Item 7 of our Annual Report on Form 10-K for the fiscal year ended September 24, 2022, which was filed with the SEC on November 23, 2022.
Liquidity and Capital Resources
Analysis of Cash Flows
Operating Activities. Net cash provided by operating activities for fiscal 2023 amounted to $225.2 million, an increase of $4.7 million compared to the prior year. The increase was primarily due to a lower level of working capital compared to the prior year, which stemmed from the decline in wholesale costs of propane (discussed above) coupled with the payment in fiscal 2022 of the employer portion of social security payroll tax that was deferred during a certain portion of fiscal 2020 under the CARES Act, partially offset by lower earnings.
Investing Activities. Net cash used in investing activities of $170.6 million for fiscal 2023 consisted of the RNG Acquisition (net of cash acquired and Green Bonds assumed) of $108.3 million, capital expenditures of $44.9 million (including approximately $25.2 million to support the growth of operations and $19.7 million for maintenance expenditures), $7.5 million used in the acquisition of a retail propane business, a $3.1 million investment in a privately held start-up entity (plus direct transaction costs) and additional investments in Oberon, partially offset by approximately $4.4 million in proceeds from the sale of property, plant and equipment. See Part IV, Note 4 of this Annual Report in relation to these transactions.
Net cash used in investing activities of $94.4 million for fiscal 2022 consisted of capital expenditures of $44.4 million (including $24.3 million to support the growth of operations and $20.1 million for maintenance expenditures), a $30.0 million investment in IH (plus direct transaction costs), as well as $25.6 million used in the acquisition of a retail propane business and additional investments in Oberon. This was partially offset by approximately $6.0 million in net proceeds from the sale of property, plant and equipment, as well as the sale of certain assets and operations in a non-strategic market of the propane segment.
Financing Activities. Net cash used in financing activities of $44.6 million for fiscal 2023 reflected $82.4 million paid for the quarterly distributions to Common Unitholders at a rate of $0.325 per Common Unit paid in respect of the fourth quarter of fiscal 2022 and first three quarters of fiscal 2023, $42.4 million in net borrowings under our revolving credit facility, which were used to fund the acquisitions and investments noted above, and other financing activities of $4.6 million.
Net cash used in financing activities for fiscal 2022 of $127.8 million reflected the quarterly distribution to Common Unitholders at a rate of $0.325 per Common Unit paid in respect of the fourth quarter of fiscal 2021 and the first three quarters of fiscal 2022, net repayments of borrowings under our revolving credit facility of $42.4 million, and other financing activities of $3.7 million.
Summary of Long-Term Debt Obligations and Revolving Credit Lines
As of September 30, 2023, our long-term debt consisted of $350.0 million in aggregate principal amount of 5.875% Senior Notes due March 1, 2027, $650.0 million in aggregate principal amount of 5.0% Senior Notes due June 1, 2031, $80.6 million in aggregate principal amount of 5.5% Green Bonds due October 1, 2028 through October 1, 2033 and $132.0 million outstanding under our $500.0 million senior secured revolving credit facility (“Revolving Credit Facility”) provided by our credit agreement. On December 28, 2022, we amended the credit agreement to modify certain restrictive and affirmative covenants set forth in the credit agreement and replace the LIBOR component of the borrowing rate with a rate based on SOFR. See Part IV, Note 10 of this Annual Report.
The aggregate amounts of long-term debt maturities subsequent to September 30, 2023 are as follows: fiscal 2024: $-0-; fiscal 2025: $132.0 million; fiscal 2026: $-0- ; fiscal 2027: $350.0 million; fiscal 2028: $-0- ; and thereafter: $730.6 million.
Total Consolidated Leverage Ratio. Total Consolidated Leverage Ratio, as defined by our credit agreement, represents Adjusted EBITDA calculated on a trailing twelve-month basis plus non-cash compensation costs recognized under our Restricted Unit Plans for the same period. To calculate the Total Consolidated Leverage Ratio, divide gross borrowings outstanding as of the current period’s balance sheet date by our Adjusted EBITDA.
41
(Dollars in thousands) |
|
|
|
|
|
|
||
|
|
Fiscal |
|
|
Fiscal |
|
||
|
|
2023 |
|
|
2022 |
|
||
Long-term borrowings |
|
$ |
1,212,645 |
|
|
$ |
1,089,600 |
|
|
|
|
|
|
|
|
||
Adjusted EBITDA |
|
|
275,025 |
|
|
|
291,026 |
|
Compensation costs recognized under Restricted Unit Plans |
|
|
8,260 |
|
|
|
11,253 |
|
Other |
|
|
168 |
|
|
|
— |
|
Adjusted EBITDA for use in calculation |
|
|
283,453 |
|
|
|
302,279 |
|
|
|
|
|
|
|
|
||
Total Consolidated Leverage Ratio |
|
4.28 x |
|
|
3.60 x |
|
||
Partnership Distributions
We are required to make distributions in an amount equal to all of our Available Cash, as defined in our Third Amended and Restated Partnership Agreement, as amended (the “Partnership Agreement”), no more than 45 days after the end of each fiscal quarter to holders of record on the applicable record dates. Available Cash, as defined in the Partnership Agreement, generally means all cash on hand at the end of the respective fiscal quarter, less the amount of cash reserves established by the Board of Supervisors in its reasonable discretion for future cash requirements. These reserves are retained for the proper conduct of our business, the payment of debt principal and interest and for distributions during the next four quarters. The Board of Supervisors reviews the level of Available Cash on a quarterly basis based upon information provided by management.
Pension Plan Assets and Obligations
We have a noncontributory defined benefit pension plan which was originally designed to cover all of our eligible employees who met certain requirements as to age and length of service. Effective January 1, 1998, we amended the defined benefit pension plan to provide benefits under a cash balance formula as compared to a final average pay formula which was in effect prior to January 1, 1998. Our defined benefit pension plan was frozen to new participants effective January 1, 2000 and, in furtherance of our effort to minimize future increases in our benefit obligations, effective January 1, 2003, all future service credits were eliminated. Therefore, eligible participants will receive interest credits only toward their ultimate defined benefit under the defined benefit pension plan. We made contribution payments to the defined benefit pension plan of $4.0 million, $3.3 million and $6.3 million in fiscal 2023, fiscal 2022 and fiscal 2021, respectively. As of September 30, 2023 and September 24, 2022, the plan’s projected benefit obligation exceeded the fair value of plan assets by $18.0 million and $20.8 million, respectively. The net liability recognized in the consolidated financial statements for the defined benefit pension plan decreased by $2.8 million during fiscal 2023, which was primarily attributable to the contributions made during the year, as well as the increase in the discount rate used to measure the benefit obligation. During fiscal 2024, we expect to contribute approximately $4.0 million to the defined benefit pension plan.
Our investment policies and strategies, as set forth in the Investment Management Policy and Guidelines, are monitored by a Benefits Committee comprised of five members of management. The Benefits Committee employs a liability driven investment strategy, which seeks to increase the correlation of the plan’s assets and liabilities to reduce the volatility of the plan’s funded status. The execution of this strategy has resulted in an asset allocation that is largely comprised of fixed income securities. A liability driven investment strategy is intended to reduce investment risk and, over the long-term, generate returns on plan assets that largely fund the annual interest on the accumulated benefit obligation. For purposes of measuring the projected benefit obligation as of September 30, 2023 and September 24, 2022, we used a discount rate of 5.50% and 5.125%, respectively, reflecting current market rates for debt obligations of a similar duration to our pension obligations. With other assumptions held constant, an increase or decrease of 100 basis points in the discount rate would have an immaterial impact on net pension and postretirement benefit costs.
During fiscal 2022, lump sum pension settlement payments of $3.3 million exceeded the interest and service cost components of the net periodic pension cost of $2.2 million. As a result, we recorded a non-cash settlement charge of $0.8 million during fiscal 2022, in order to accelerate recognition of a portion of cumulative unamortized losses. Similarly, during fiscal 2021, lump sum pension settlement payments of $3.9 million exceeded the interest and service cost components of the net periodic pension cost of $2.3 million. As a result, we recorded a non-cash settlement charge of $1.0 million during fiscal 2021, also in order to accelerate recognition of a portion of cumulative unamortized losses. These unrecognized losses were previously accumulated as a reduction to partners’ capital and were being amortized to expense as part of our net periodic pension cost.
We also provide postretirement health care and life insurance benefits for certain retired employees. Partnership employees hired prior to July 1993 and who retired prior to March 1998 are eligible for postretirement health care and life insurance benefits if they reached a specified retirement age while working for the Partnership. Effective March 31, 1998, we froze participation in the postretirement health care benefit plan, with no new retirees eligible to participate in the plan. All active employees who were eligible
42
to receive health care benefits under the postretirement plan subsequent to March 1, 1998, were provided an increase to their accumulated benefits under the cash balance pension plan. Our postretirement health care and life insurance benefit plans are unfunded. Effective January 1, 2006, we changed our postretirement health care plan from a self-insured program to one that is fully insured under which we pay a portion of the insurance premium on behalf of the eligible participants.
Contractual and Other Obligations
The following table summarizes payments due under our known contractual and other obligations as of September 30, 2023:
(Dollars in thousands) |
|
|
|
|
|
|
|
|
|
|
|
|
|
|
|
|
|
|
||||||
|
|
|
|
|
|
|
|
|
|
|
|
|
|
|
|
|
Fiscal |
|
||||||
|
|
Fiscal |
|
|
Fiscal |
|
|
Fiscal |
|
|
Fiscal |
|
|
Fiscal |
|
|
2029 and |
|
||||||
|
|
2024 |
|
|
2025 |
|
|
2026 |
|
|
2027 |
|
|
2028 |
|
|
thereafter |
|
||||||
Long-term debt obligations |
|
|
— |
|
|
|
132,000 |
|
|
|
— |
|
|
|
350,000 |
|
|
|
— |
|
|
|
730,645 |
|
Interest payments |
|
|
70,788 |
|
|
|
60,693 |
|
|
|
57,498 |
|
|
|
47,217 |
|
|
|
36,935 |
|
|
|
111,498 |
|
Operating lease obligations (a) |
|
|
40,660 |
|
|
|
36,491 |
|
|
|
30,991 |
|
|
|
20,818 |
|
|
|
15,701 |
|
|
|
24,501 |
|
Self-insurance obligations (b) |
|
|
13,972 |
|
|
|
11,705 |
|
|
|
9,118 |
|
|
|
6,277 |
|
|
|
3,402 |
|
|
|
16,155 |
|
Pension contributions (c) |
|
|
4,000 |
|
|
|
5,600 |
|
|
|
4,000 |
|
|
|
4,000 |
|
|
|
4,000 |
|
|
|
8,000 |
|
Other obligations (d) |
|
|
31,588 |
|
|
|
10,097 |
|
|
|
12,057 |
|
|
|
2,294 |
|
|
|
2,092 |
|
|
|
18,832 |
|
Total |
|
$ |
161,008 |
|
|
$ |
256,586 |
|
|
$ |
113,664 |
|
|
$ |
430,606 |
|
|
$ |
62,130 |
|
|
$ |
909,631 |
|
Additionally, we have standby letters of credit in the aggregate amount of $42.7 million, in support of retention levels under our casualty insurance programs and certain lease obligations, which expire periodically through April 30, 2024.
Operating Leases
We lease certain property, plant and equipment for various periods under noncancelable operating leases, including 88% of our vehicle fleet, approximately 26% of our customer service centers and portions of our information systems equipment. Rental expense under operating leases was $41.7 million, $41.0 million and $37.8 million for fiscal 2023, 2022 and 2021, respectively. Future minimum rental commitments under noncancelable operating lease agreements as of September 30, 2023 are presented in the table above.
Guarantees
Certain of our operating leases, primarily those for transportation equipment with remaining lease periods scheduled to expire periodically through fiscal 2032, contain residual value guarantee provisions. Under those provisions, we guarantee that the fair value of the equipment will equal or exceed the guaranteed amount upon completion of the lease period, or we will pay the lessor the difference between fair value and the guaranteed amount. Although the fair value of equipment at the end of its lease term has historically exceeded the guaranteed amounts, the maximum potential amount of aggregate future payments we could be required to make under these leasing arrangements, assuming the equipment is deemed worthless at the end of the lease term, was approximately $39.9 million. The fair value of residual value guarantees for outstanding operating leases was de minimis as of September 30, 2023 and September 24, 2022.
Recently Issued/Adopted Accounting Pronouncements
See Part IV, Note 2 of this Annual Report.
43
ITEM 7A. QUANTITATIVE AND QUALITATIVE DISCLOSURES ABOUT MARKET RISK
Commodity Price Risk
We enter into product supply contracts that are generally one-year agreements subject to annual renewal, and also purchase product on the open market. Our propane supply contracts typically provide for pricing based upon index formulas using the posted prices established at major supply points such as Mont Belvieu, Texas, or Conway, Kansas (plus transportation costs) at the time of delivery. In addition, to supplement our annual purchase requirements, we may utilize forward fixed price purchase contracts to acquire a portion of the propane that we resell to our customers, which allows us to manage our exposure to unfavorable changes in commodity prices and to ensure adequate physical supply. The percentage of contract purchases, and the amount of supply contracted for under forward contracts at fixed prices, will vary from year to year based on market conditions. In certain instances, and when market conditions are favorable, we are able to purchase product under our supply arrangements at a discount to the market.
Product cost changes can occur rapidly over a short period of time and can impact profitability. We attempt to reduce commodity price risk by pricing product on a short-term basis. The level of priced, physical product maintained in storage facilities and at our customer service centers for immediate sale to our customers will vary depending on several factors, including, but not limited to, price, supply and demand dynamics for a given time of the year. Typically, our on hand priced position does not exceed more than four to eight weeks of our supply needs, depending on the time of the year. In the course of normal operations, we routinely enter into contracts such as forward priced physical contracts for the purchase or sale of propane and fuel oil that, under accounting rules for derivative instruments and hedging activities, qualify for and are designated as normal purchase or normal sale contracts. Such contracts are exempted from fair value accounting and are accounted for at the time product is purchased or sold under the related contract.
Under our hedging and risk management strategies, we enter into a combination of exchange-traded futures and options contracts and, in certain instances, over-the-counter options and swap contracts (collectively, “derivative instruments”) to manage the price risk associated with physical product and with future purchases of the commodities used in our operations, principally propane and fuel oil, as well as to help ensure the availability of product during periods of high demand. In addition, we sell propane and fuel oil to customers at fixed prices, and enter into derivative instruments to hedge a portion of our exposure to fluctuations in commodity prices as a result of selling the fixed price contracts. We do not use derivative instruments for speculative or trading purposes. Futures and swap contracts require that we sell or acquire propane or fuel oil at a fixed price for delivery at fixed future dates. An option contract allows, but does not require, its holder to buy or sell propane or fuel oil at a specified price during a specified time period. However, the writer of an option contract must fulfill the obligation of the option contract, should the holder choose to exercise the option. At expiration, the contracts are settled by the delivery of the product to the respective party or are settled by the payment of a net amount equal to the difference between the then market price and the fixed contract price or option exercise price. To the extent that we utilize derivative instruments to manage exposure to commodity price risk and commodity prices move adversely in relation to the contracts, we could suffer losses on those derivative instruments when settled. Conversely, if prices move favorably, we could realize gains. Under our hedging and risk management strategy, realized gains or losses on derivative instruments will typically offset losses or gains on the physical inventory once the product is sold to customers at market prices, or delivered to customers as it pertains to fixed price contracts.
Futures are traded with brokers of the NYMEX and require daily cash settlements in margin accounts. Forward contracts are generally settled at the expiration of the contract term by physical delivery, and swap and options contracts are generally settled at expiration through a net settlement mechanism. Market risks associated with our derivative instruments are monitored daily for compliance with our Hedging and Risk Management Policy which includes volume limits for open positions. Open inventory positions are reviewed and managed daily as to exposures to changing market prices.
Credit Risk
Exchange-traded futures and options contracts are guaranteed by the NYMEX and, as a result, have minimal credit risk. We are subject to credit risk with over-the-counter forward, swap and options contracts to the extent the counterparties do not perform. We evaluate the financial condition of each counterparty with which we conduct business and establish credit limits to reduce exposure to the risk of non-performance by our counterparties.
Interest Rate Risk
A portion of our borrowings bear interest at prevailing interest rates based upon, at the Operating Partnership’s option, SOFR, plus an applicable margin or the base rate, defined as the higher of the Federal Funds Rate plus ½ of 1% or the agent bank’s prime rate, or SOFR plus 1%, plus the applicable margin. The applicable margin is dependent on the level of our total consolidated leverage (the total ratio of debt to consolidated EBITDA). Therefore, we are subject to interest rate risk on the variable component of the interest rate. From time to time, we enter into interest rate swap agreements to manage a part of our variable interest rate risk. The interest rate swaps are designated as cash flow hedges. Changes in the fair value of the interest rate swaps are recognized in other comprehensive income (“OCI”) until the hedged item is recognized in earnings. At September 30, 2023, we were not party to any interest rate swap agreement.
44
Derivative Instruments and Hedging Activities
All of our derivative instruments are reported on the balance sheet at their fair values. On the date that derivative instruments are entered into, we make a determination as to whether the derivative instrument qualifies for designation as a hedge. Changes in the fair value of derivative instruments are recorded each period in current period earnings or OCI, depending on whether a derivative instrument is designated as a hedge and, if so, the type of hedge. For derivative instruments designated as cash flow hedges, we formally assess, both at the hedge contract’s inception and on an ongoing basis, whether the hedge contract is highly effective in offsetting changes in cash flows of hedged items. Changes in the fair value of derivative instruments designated as cash flow hedges are reported in OCI to the extent effective and reclassified into earnings during the same period in which the hedged item affects earnings. The mark-to-market gains or losses on ineffective portions of cash flow hedges are immediately recognized in earnings. Changes in the fair value of derivative instruments that are not designated as cash flow hedges, and that do not meet the normal purchase and normal sale exemption, are recorded in earnings as they occur. Cash flows associated with derivative instruments are reported as operating activities within the consolidated statement of cash flows.
Sensitivity Analysis
In an effort to estimate our exposure to unfavorable market price changes in commodities related to our open positions under derivative instruments, we developed a model that incorporates the following data and assumptions:
Based on the sensitivity analysis described above, the hypothetical 10% adverse change in market prices for open derivative instruments as of September 30, 2023 indicates a decrease in potential future net gains of $4.3 million. See also Item 7A of this Annual Report. The above hypothetical change does not reflect the worst case scenario. Actual results may be significantly different depending on market conditions and the composition of the open position portfolio.
45
ITEM 8. FINANCIAL STATEMENTS AND SUPPLEMENTARY DATA
Our Consolidated Financial Statements and the Report of Independent Registered Public Accounting Firm thereon listed on the accompanying Index to Financial Statements in Part IV, Item 15 (see page F-1) and the Supplemental Financial Information listed on the accompanying Index to Financial Statement Schedule in Part IV, Item 15 (see page S-1) are included herein.
Selected Quarterly Financial Data
Due to the seasonality of the retail propane, fuel oil and other refined fuel and natural gas businesses, our first and second quarter revenues and earnings are consistently greater than third and fourth quarter results. The following presents our selected quarterly financial data for the last two fiscal years (unaudited; in thousands, except per unit amounts).
|
|
First |
|
|
Second |
|
|
Third |
|
|
Fourth |
|
|
Total |
|
|||||
Fiscal 2023 |
|
|
|
|
|
|
|
|
|
|
|
|
|
|
|
|||||
Revenues |
|
$ |
397,470 |
|
|
$ |
526,501 |
|
|
$ |
278,628 |
|
|
$ |
226,595 |
|
|
$ |
1,429,194 |
|
Costs of products sold |
|
|
182,653 |
|
|
|
231,608 |
|
|
|
110,446 |
|
|
|
65,424 |
|
|
|
590,131 |
|
Operating income |
|
|
62,315 |
|
|
|
125,679 |
|
|
|
14,866 |
|
|
|
3,989 |
|
|
|
206,849 |
|
Net income (loss) |
|
|
45,394 |
|
|
|
104,477 |
|
|
|
(5,261 |
) |
|
|
(20,858 |
) |
|
|
123,752 |
|
Net income (loss) per Common Unit - basic (a) |
|
$ |
0.71 |
|
|
$ |
1.63 |
|
|
$ |
(0.08 |
) |
|
$ |
(0.33 |
) |
|
$ |
1.94 |
|
Net income (loss) per Common Unit - diluted (a) |
|
$ |
0.71 |
|
|
$ |
1.62 |
|
|
$ |
(0.08 |
) |
|
$ |
(0.33 |
) |
|
$ |
1.92 |
|
|
|
|
|
|
|
|
|
|
|
|
|
|
|
|
|
|||||
Cash provided by (used in): |
|
|
|
|
|
|
|
|
|
|
|
|
|
|
|
|||||
Operating activities |
|
|
6,272 |
|
|
|
99,122 |
|
|
|
61,998 |
|
|
|
57,847 |
|
|
|
225,239 |
|
Investing activities |
|
|
(14,391 |
) |
|
|
(123,104 |
) |
|
|
(19,640 |
) |
|
|
(13,502 |
) |
|
|
(170,637 |
) |
Financing activities |
|
|
10,097 |
|
|
|
35,866 |
|
|
|
(41,616 |
) |
|
|
(48,975 |
) |
|
|
(44,628 |
) |
EBITDA (b) |
|
$ |
75,119 |
|
|
$ |
140,637 |
|
|
$ |
29,253 |
|
|
$ |
15,386 |
|
|
$ |
260,395 |
|
Adjusted EBITDA (b) |
|
$ |
90,042 |
|
|
$ |
148,957 |
|
|
$ |
33,024 |
|
|
$ |
3,002 |
|
|
$ |
275,025 |
|
Retail gallons sold |
|
|
|
|
|
|
|
|
|
|
|
|
|
|
|
|||||
Propane |
|
|
108,764 |
|
|
|
144,149 |
|
|
|
78,474 |
|
|
|
65,006 |
|
|
|
396,393 |
|
Fuel oil and refined fuels |
|
|
5,563 |
|
|
|
7,742 |
|
|
|
3,354 |
|
|
|
2,444 |
|
|
|
19,103 |
|
|
|
|
|
|
|
|
|
|
|
|
|
|
|
|
|
|||||
Fiscal 2022 |
|
|
|
|
|
|
|
|
|
|
|
|
|
|
|
|||||
Revenues |
|
$ |
375,407 |
|
|
$ |
588,095 |
|
|
$ |
300,332 |
|
|
$ |
237,631 |
|
|
$ |
1,501,465 |
|
Costs of products sold |
|
|
196,338 |
|
|
|
239,031 |
|
|
|
140,930 |
|
|
|
135,824 |
|
|
|
712,123 |
|
Operating income (loss) |
|
|
37,256 |
|
|
|
191,961 |
|
|
|
14,771 |
|
|
|
(37,661 |
) |
|
|
206,327 |
|
Net income (loss) |
|
|
21,298 |
|
|
|
175,102 |
|
|
|
(2,535 |
) |
|
|
(54,157 |
) |
|
|
139,708 |
|
Net income (loss) per Common Unit - basic (a) |
|
$ |
0.34 |
|
|
$ |
2.77 |
|
|
$ |
(0.04 |
) |
|
$ |
(0.86 |
) |
|
|
2.21 |
|
Net income (loss) per Common Unit - diluted (a) |
|
$ |
0.34 |
|
|
$ |
2.74 |
|
|
$ |
(0.04 |
) |
|
$ |
(0.86 |
) |
|
|
2.18 |
|
|
|
|
|
|
|
|
|
|
|
|
|
|
|
|
|
|||||
Cash provided by (used in): |
|
|
|
|
|
|
|
|
|
|
|
|
|
|
|
|||||
Operating activities |
|
|
(13,335 |
) |
|
|
108,874 |
|
|
|
75,597 |
|
|
|
49,411 |
|
|
|
220,547 |
|
Investing activities |
|
|
(10,371 |
) |
|
|
(42,681 |
) |
|
|
(11,276 |
) |
|
|
(30,107 |
) |
|
|
(94,435 |
) |
Financing activities |
|
|
21,426 |
|
|
|
(62,895 |
) |
|
|
(64,081 |
) |
|
|
(22,270 |
) |
|
|
(127,820 |
) |
EBITDA (b) |
|
$ |
52,411 |
|
|
$ |
204,789 |
|
|
$ |
26,749 |
|
|
$ |
(24,306 |
) |
|
$ |
259,643 |
|
Adjusted EBITDA (b) |
|
$ |
86,526 |
|
|
$ |
172,520 |
|
|
$ |
29,181 |
|
|
$ |
2,799 |
|
|
$ |
291,026 |
|
Retail gallons sold |
|
|
|
|
|
|
|
|
|
|
|
|
|
|
|
|||||
Propane |
|
|
105,265 |
|
|
|
159,179 |
|
|
|
75,510 |
|
|
|
61,368 |
|
|
|
401,322 |
|
Fuel oil and refined fuels |
|
|
6,134 |
|
|
|
10,715 |
|
|
|
3,629 |
|
|
|
2,289 |
|
|
|
22,767 |
|
46
|
|
First |
|
|
Second |
|
|
Third |
|
|
Fourth |
|
|
Total |
|
|||||
Fiscal 2023 |
|
|
|
|
|
|
|
|
|
|
|
|
|
|
|
|||||
Net income (loss) |
|
$ |
45,394 |
|
|
$ |
104,477 |
|
|
$ |
(5,261 |
) |
|
$ |
(20,858 |
) |
|
$ |
123,752 |
|
Add: |
|
|
|
|
|
|
|
|
|
|
|
|
|
|
|
|||||
(Benefit from) provision for income taxes |
|
|
(48 |
) |
|
|
225 |
|
|
|
244 |
|
|
|
247 |
|
|
|
668 |
|
Interest expense, net |
|
|
15,994 |
|
|
|
19,871 |
|
|
|
18,733 |
|
|
|
18,795 |
|
|
|
73,393 |
|
Depreciation and amortization |
|
|
13,779 |
|
|
|
16,064 |
|
|
|
15,537 |
|
|
|
17,202 |
|
|
|
62,582 |
|
EBITDA |
|
|
75,119 |
|
|
|
140,637 |
|
|
|
29,253 |
|
|
|
15,386 |
|
|
|
260,395 |
|
Unrealized non-cash losses (gains) on changes |
|
|
13,706 |
|
|
|
4,501 |
|
|
|
2,960 |
|
|
|
(17,496 |
) |
|
|
3,671 |
|
Equity in losses of unconsolidated affiliates |
|
|
282 |
|
|
|
413 |
|
|
|
457 |
|
|
|
5,112 |
|
|
|
6,264 |
|
Acquisition-related costs |
|
|
935 |
|
|
|
3,406 |
|
|
|
354 |
|
|
|
— |
|
|
|
4,695 |
|
Adjusted EBITDA |
|
$ |
90,042 |
|
|
$ |
148,957 |
|
|
$ |
33,024 |
|
|
$ |
3,002 |
|
|
$ |
275,025 |
|
|
|
|
|
|
|
|
|
|
|
|
|
|
|
|
|
|||||
Fiscal 2022 |
|
|
|
|
|
|
|
|
|
|
|
|
|
|
|
|||||
Net income (loss) |
|
$ |
21,298 |
|
|
$ |
175,102 |
|
|
$ |
(2,535 |
) |
|
$ |
(54,157 |
) |
|
$ |
139,708 |
|
Add: |
|
|
|
|
|
|
|
|
|
|
|
|
|
|
|
|||||
(Benefit from) provision for income taxes |
|
|
(471 |
) |
|
|
371 |
|
|
|
271 |
|
|
|
258 |
|
|
|
429 |
|
Interest expense, net |
|
|
15,299 |
|
|
|
15,254 |
|
|
|
15,004 |
|
|
|
15,101 |
|
|
|
60,658 |
|
Depreciation and amortization |
|
|
16,285 |
|
|
|
14,062 |
|
|
|
14,009 |
|
|
|
14,492 |
|
|
|
58,848 |
|
EBITDA |
|
|
52,411 |
|
|
|
204,789 |
|
|
|
26,749 |
|
|
|
(24,306 |
) |
|
|
259,643 |
|
Unrealized non-cash losses (gains) on changes |
|
|
33,505 |
|
|
|
(32,984 |
) |
|
|
921 |
|
|
|
26,487 |
|
|
|
27,929 |
|
Equity in losses of unconsolidated affiliates |
|
|
610 |
|
|
|
715 |
|
|
|
877 |
|
|
|
412 |
|
|
|
2,614 |
|
Pension settlement charge |
|
|
— |
|
|
|
— |
|
|
|
634 |
|
|
|
206 |
|
|
|
840 |
|
Adjusted EBITDA |
|
$ |
86,526 |
|
|
$ |
172,520 |
|
|
$ |
29,181 |
|
|
$ |
2,799 |
|
|
$ |
291,026 |
|
ITEM 9. CHANGES IN AND DISAGREEMENTS WITH ACCOUNTANTS ON ACCOUNTING AND FINANCIAL DISCLOSURE
None.
ITEM 9A. CONTROLS AND PROCEDURES
Evaluation of Disclosure Controls and Procedures
The Partnership maintains disclosure controls and procedures (as defined in Rules 13a-15(e) and 15d-15(e) of the Securities Exchange Act of 1934 (the “Exchange Act”)) that are designed to provide reasonable assurance that information required to be disclosed in the Partnership’s filings and submissions under the Exchange Act is recorded, processed, summarized and reported within the periods specified in the rules and forms of the SEC and that such information is accumulated and communicated to the Partnership’s management, including its principal executive officer and principal financial officer, as appropriate, to allow timely decisions regarding required disclosure.
Before filing this Annual Report, the Partnership completed an evaluation under the supervision and with the participation of the Partnership’s management, including the Partnership’s principal executive officer and principal financial officer, of the effectiveness of the design and operation of the Partnership’s disclosure controls and procedures as of September 30, 2023. Based on this evaluation, the Partnership’s principal executive officer and principal financial officer concluded that as of September 30, 2023, such disclosure controls and procedures were effective to provide the reasonable assurance level described above.
47
Changes in Internal Control Over Financial Reporting
On December 28, 2022, Suburban Renewable Energy completed the RNG Acquisition. As permitted by SEC staff interpretive guidance that an assessment of a recently acquired business may be omitted from the scope of evaluation in the year of acquisition, management has excluded the assets and facilities acquired in the RNG Acquisition from its evaluation of internal control over financial reporting.
Other than as set forth above, there have not been any changes in our internal control over financial reporting (as defined in Rules 13a-15(f) and 15d-15(f) of the Exchange Act) during the quarter ended September 30, 2023, that have materially affected, or are reasonably likely to materially affect, our internal control over financial reporting. Management’s Report on Internal Control over Financial Reporting is included below.
Management’s Report on Internal Control Over Financial Reporting
Management of the Partnership is responsible for establishing and maintaining adequate internal control over financial reporting. The Partnership's internal control over financial reporting is designed to provide reasonable assurance as to the reliability of the Partnership's financial reporting and the preparation of financial statements for external purposes in accordance with generally accepted accounting principles.
Because of its inherent limitations, internal control over financial reporting may not prevent or detect misstatements. Also, projections of any evaluation of effectiveness to future periods are subject to the risk that controls may become inadequate because of changes in conditions, or that the degree of compliance with the policies or procedures may deteriorate.
The Partnership’s management has assessed the effectiveness of the Partnership’s internal control over financial reporting as of September 30, 2023. In making this assessment, the Partnership used the criteria established by the Committee of Sponsoring Organizations of the Treadway Commission (“COSO”) in “Internal Control-Integrated Framework (2013).” These criteria are in the areas of control environment, risk assessment, control activities, information and communication, and monitoring. The Partnership's assessment included documenting, evaluating and testing the design and operating effectiveness of its internal control over financial reporting.
Based on the Partnership’s assessment, as described above, management has concluded that, as of September 30, 2023, the Partnership’s internal control over financial reporting was effective.
Our independent registered public accounting firm, PricewaterhouseCoopers LLP, issued an attestation report dated November 22, 2023 on the effectiveness of our internal control over financial reporting, which is included herein.
ITEM 9B. OTHER INFORMATION
During the fiscal quarter ended September 30, 2023, our
ITEM 9C. DISCLOSURE REGARDING FOREIGN JURISDICTIONS THAT PREVENT INSPECTIONS
None.
48
PART III
ITEM 10. DIRECTORS, EXECUTIVE OFFICERS AND PARTNERSHIP GOVERNANCE
Partnership Management
Our Partnership Agreement provides that all management powers over our business and affairs are exclusively vested in our Board of Supervisors and, subject to the direction of the Board of Supervisors, our officers. No Unitholder has any management power over our business and affairs or actual or apparent authority to enter into contracts on behalf of or otherwise to bind us. Under the current Partnership Agreement, members of our Board of Supervisors are elected by the Unitholders for three-year terms.
Seven of our current Supervisors, namely Messrs. Matthew J. Chanin, Harold R. Logan Jr., Lawrence C. Caldwell, Terence J. Connors, William M. Landuyt, Michael A. Stivala and Ms. Jane Swift, were elected to their current three-year terms at the Tri-Annual Meeting of our Unitholders held on May 18, 2021. Two of our current Supervisors, namely Ms. Amy M. Adams and Mr. Rommel M. Oates, were each appointed to the Board of Supervisors by unanimous approval of the Supervisors, pursuant to our Partnership Agreement, for a term due to expire at the next Tri-Annual Meeting of our Unitholders, currently planned for May 2024.
Four Supervisors, who are not officers or employees of the Partnership or its subsidiaries, currently serve on the Audit Committee with authority to review, approve or ratify, at the request of the Board of Supervisors, specific matters as to which the Board of Supervisors believes there may be a conflict of interest, or which may be required to be disclosed pursuant to Item 404(a) of Regulation S-K adopted by the SEC, in order to determine if the resolution or course of action in respect of such conflict proposed by the Board of Supervisors is fair and reasonable to us. Under the Partnership Agreement, any matter that receives the “Special Approval” of the Audit Committee (i.e., approval by a majority of the members of the Audit Committee) is conclusively deemed to be fair and reasonable to us, is deemed approved by all of our partners and shall not constitute a breach of the Partnership Agreement or any duty stated or implied by law or equity as long as the material facts known to the party having the potential conflict of interest regarding that matter were disclosed to the Audit Committee at the time it gave Special Approval. The Audit Committee also assists the Board of Supervisors in fulfilling its oversight responsibilities relating to (i) the integrity of the Partnership’s financial statements and internal control over financial reporting; (ii) the Partnership’s compliance with applicable laws, regulations and its code of conduct; (iii) the Partnership’s major financial risk exposure and the steps management has taken to monitor and mitigate such risks (including ESG and cybersecurity); (iv) review and approval of related person transactions; (v) the engagement, independence, qualifications and compensation of the internal audit function and independent registered public accounting firm; (vi) the performance of the internal audit function and the independent registered public accounting firm; and (vii) financial reporting and accounting complaints.
The Board of Supervisors has determined that all four current members of the Audit Committee, namely Messrs. Terence J. Connors, Lawrence C. Caldwell, William M. Landuyt and Rommel M. Oates, are independent and are audit committee financial experts within the meaning of the NYSE corporate governance listing standards and in accordance with Rule 10A-3 of the Exchange Act, Item 407 of Regulation S-K and the Partnership’s criteria for Supervisor independence (as discussed in Item 13, herein) as of the date of this Annual Report.
Mr. Matthew J. Chanin, Chairman of the Board, presides at regularly scheduled executive sessions of the non-management Supervisors, all of whom are independent, held as part of the regular meetings of the Board of Supervisors. Investors and other parties interested in communicating directly with the non-management Supervisors as a group may do so by writing to the Non-Management Members of the Board of Supervisors, c/o Company Secretary, Suburban Propane Partners, L.P., P.O. Box 206, Whippany, New Jersey 07981-0206.
49
Board of Supervisors and Executive Officers of the Partnership
The following table sets forth certain information with respect to the members of the Board of Supervisors and our executive officers as of November 22, 2023. Officers are appointed by the Board of Supervisors for one‑year terms and Supervisors (other than those elected by the Board to fill vacancies) are elected by the Unitholders for three‑year terms.
Name |
|
Age |
|
Position With the Partnership |
Michael A. Stivala |
|
54 |
|
President and Chief Executive Officer; Member of the Board of Supervisors |
Michael A. Kuglin |
|
53 |
|
Chief Financial Officer |
Steven C. Boyd |
|
59 |
|
Chief Operating Officer |
Douglas T. Brinkworth |
|
62 |
|
Senior Vice President – Product Supply, Purchasing & Logistics |
Neil E. Scanlon |
|
58 |
|
Senior Vice President – Information Services |
Daniel S. Bloomstein |
|
50 |
|
Vice President, Controller and Chief Accounting Officer |
Daniel W. Boyd |
|
56 |
|
Vice President – Area Operations |
Alejandro Centeno |
|
51 |
|
Vice President – Operations |
Francesca Cleffi |
|
53 |
|
Vice President – Human Resources |
M. Douglas Dagan |
|
44 |
|
Vice President, Strategic Initiatives – Renewable Energy |
A. Davin D’Ambrosio |
|
59 |
|
Vice President and Treasurer |
John D. Fields |
|
58 |
|
Vice President – Area Operations |
Samuel Hodges |
|
52 |
|
Vice President – Area Operations |
Bryon L. Koepke |
|
51 |
|
Vice President – General Counsel and Secretary |
Keith P. Onderdonk |
|
59 |
|
Vice President – Operational Support |
Nandini Sankara |
|
44 |
|
Vice President – Marketing and Brand Strategy |
Michael A. Schueler |
|
57 |
|
Vice President – Product Supply |
Brent C. Stubbs |
|
46 |
|
Vice President – Area Operations |
Matthew J. Chanin |
|
69 |
|
Member of the Board of Supervisors (Board Chair and Chair of Nominating/Governance Committee) |
Harold R. Logan, Jr. |
|
79 |
|
Member of the Board of Supervisors |
Jane Swift |
|
58 |
|
Member of the Board of Supervisors (Chair of the Compensation Committee) |
Lawrence C. Caldwell |
|
77 |
|
Member of the Board of Supervisors |
Terence J. Connors |
|
68 |
|
Member of the Board of Supervisors (Chair of the Audit Committee) |
William M. Landuyt |
|
68 |
|
Member of the Board of Supervisors |
Amy M. Adams |
|
58 |
|
Member of the Board of Supervisors |
Rommel M. Oates |
|
44 |
|
Member of the Board of Supervisors |
Mr. Stivala has served as our President since April 2014 and as our Chief Executive Officer since September 2014. Mr. Stivala has served as a Supervisor since November 2014. From November 2009 until March 2014 he was our Chief Financial Officer, and, before that, our Chief Financial Officer and Chief Accounting Officer since October 2007. Prior to that, he was our Controller and Chief Accounting Officer since May 2005 and Controller since December 2001. Before joining the Partnership, he held several positions with PricewaterhouseCoopers LLP, an international accounting firm, most recently as Senior Manager in the Assurance practice. Mr. Stivala currently serves on the Board of Directors of Independence Hydrogen Inc., in which we currently own a 25% equity stake; Nu:ionic Technologies Inc., in which we own a minority equity stake and Oberon Fuels, Inc., in which we currently own a 38% equity stake. In addition, Mr. Stivala is the Chairperson of the New Jersey Regional Council of the American Red Cross and a member of the Global Industry Council of the World LPG Association.
Mr. Stivala’s qualifications to sit on our Board include his years of experience in the propane industry, including as our current President and Chief Executive Officer and, before that, as our Chief Financial Officer for seven years, which day-to-day leadership roles have provided him with intimate knowledge of our operations.
Mr. Kuglin has served as our Chief Financial Officer since September 2014, and was our Vice President – Finance and Chief Accounting Officer from April 2014 through September 2014, and served as our Chief Accounting Officer until November 2023. Prior to that, he served as our Vice President and Chief Accounting Officer since November 2011, our Controller and Chief Accounting Officer since November 2009 and our Controller since October 2007. For the eight years prior to joining the Partnership, he held several financial and managerial positions with Alcatel-Lucent, a global communications solutions provider. Prior to Alcatel-Lucent, Mr. Kuglin held several positions with the international accounting firm PricewaterhouseCoopers LLP, most recently as Manager in the Assurance practice. Mr. Kuglin is a Certified Public Accountant and a member of the American Institute of Certified Public Accountants.
Mr. Steven Boyd has served as our Chief Operating Officer since October 2017 and before that was our Senior Vice President – Operations (September 2015 – October 2017) and our Senior Vice President – Field Operations since April 2014. Previously he was our
50
Vice President – Field Operations (formerly Vice President – Operations) since October 2008, our Southeast and Western Area Vice President since March 2007, Managing Director – Area Operations since November 2003 and Regional Manager – Northern California since May 1997. Mr. Steven Boyd held various managerial positions with predecessors of the Partnership from 1986 through 1996.
Mr. Brinkworth has served as our Senior Vice President – Product Supply, Purchasing & Logistics since April 2014 and was previously our Vice President – Product Supply (formerly Vice President – Supply) since May 2005. Mr. Brinkworth joined the Partnership in April 1997 after a nine-year career with Goldman Sachs and, since joining the Partnership, has served in various positions in the product supply area.
Mr. Scanlon became our Senior Vice President – Information Services in April 2014, after serving as our Vice President – Information Services since November 2008. Prior to that, he served as our Assistant Vice President – Information Services since November 2007, Managing Director – Information Services from November 2002 to November 2007 and Director – Information Services from April 1997 until November 2002. Prior to joining the Partnership, Mr. Scanlon spent several years with JP Morgan & Co., most recently as Vice President – Corporate Systems and earlier held several positions with Andersen Consulting, an international systems consulting firm, most recently as Manager.
Mr. Bloomstein joined the Partnership as its Controller in April 2014 and was promoted to Vice President and Controller in October 2017. In November 2023, he was appointed Chief Accounting Officer. For the ten years prior to joining the Partnership, he held several executive financial and accounting positions with The Access Group, a network of professional services companies, and with Dow Jones & Company, Inc., a global news and financial information company. Mr. Bloomstein started his career with the international accounting firm PricewaterhouseCoopers LLP, working his way to the level of Manager in the Assurance practice. Mr. Bloomstein is a Certified Public Accountant and a member of the American Institute of Certified Public Accountants.
Mr. Daniel Boyd has served as our Vice President – Area Operations since November 2020. Prior to that, he was Managing Director – Area Operations for our Northeast Area since October 2019 and before that, he was General Manager of our Southwest Region since October 2014. He joined the Partnership in October 1991 as a delivery driver, and has since held various regional management positions within our field operations. Mr. Daniel Boyd is also a U.S. Navy Veteran who served in Operation Desert Storm, Persian Gulf War.
Mr. Centeno has served as our Vice President – Operations since August 2023. Prior to that, he was General Manager of our Midwest Territory since June 2017. Prior to that, Mr. Centeno served as Region Operations Manager of our Mid-Atlantic Region since December 2015 and Area Sales and Business Development Manager since April 2014. Prior to joining the Partnership in July 2007 as a CSC Manager through our Professional Development Program, Mr. Centeno spent 13 years in various management roles in the retail industry.
Ms. Cleffi has served as our Vice President – Human Resources since November 2020. Prior to that appointment, she served as our Managing Director – Human Resources since June 2020 and before that she served as our Managing Director – Compensation, Talent Management and Operational Human Resources since October 2017. Prior to that, Ms. Cleffi served as our Director – Compensation and Talent Management from October 2007 to October 2017. Ms. Cleffi joined the Partnership in October 1992 and has held various positions in the human resources area since that time.
Mr. Dagan has served as our Vice President, Strategic Initiatives – Renewable Energy since March 2021. Prior to joining the Partnership, he was a senior associate at the law firm of Bevan, Mosca, & Giuditta, P.C., and the Director of Public Affairs and Government Relations for the firm’s affiliate, bmgstrategies, since 2018. Prior to that, Mr. Dagan was engaged in the practice of law at the Law Practice of M. Douglas Dagan since 2013. Mr. Dagan’s practice over his career has focused on advising companies on the development of renewable energy projects, environmental management, advocating for environmental and renewable energy policies, and supporting climate change strategies and initiatives.
Mr. D’Ambrosio has served as our Treasurer since November 2002 and was promoted to Vice President in October 2007. He served as our Assistant Treasurer from October 2000 to November 2002 and as Director of Treasury Services from January 1998 to October 2000. Mr. D’Ambrosio joined the Partnership in May 1996 after ten years in the commercial banking industry.
Mr. Fields has served as our Vice President – Area Operations since September 2022. Prior to that appointment, he was General Manager of our Southeast Region since June 2010. Prior to that, Mr. Fields served as Regional Distribution Manager of our Southeast Region since 2007 and in various other management positions within our field operations since joining the Partnership in 1998. Prior to joining the Partnership, Mr. Fields worked for an independent propane gas company for five years.
Mr. Hodges has served as our Vice President – Area Operations since October 2023. He joined the Partnership in 1997 as a Manager in Development and has held various management positions within the Partnership’s field operations; including, most recently, as General Manager of the Partnership’s Florida Region. Mr. Hodges has also served as the past President of the Florida Propane Gas
51
Association, the Chairman of the Florida LP Gas Advisory Board, and is the Chairman of the Florida Propane Gas Safety, Education, and Research Council.
Mr. Koepke has served as our Vice President – General Counsel and Secretary since October 2019, after serving as our Vice President – Deputy General Counsel and Assistant Secretary since March 2019. For the nineteen years prior to joining the Partnership, Mr. Koepke served as Senior Vice President, Chief Securities Counsel for Avis Budget Group, Inc., from October 2011 until joining the Partnership and prior to that as Corporate Counsel – Securities for Caterpillar Inc. and as a senior attorney advisor for the U.S. Securities and Exchange Commission. Mr. Koepke also serves as a member of the Board of Directors for the Association of Corporate Counsel New Jersey.
Mr. Onderdonk has served as our Vice President – Operational Support since November 2015 and before that was our Assistant Vice President – Financial Planning and Analysis since November 2013. Prior to that, he served as our Managing Director, Financial Planning and Analysis from November 2010 to November 2013. Mr. Onderdonk joined the Partnership in September 2001 after fourteen years in the consumer products industry.
Mr. Palleschi has served as our Vice President, Renewable Natural Gas Operations since November 2023. Prior to that appointment, he was our Assistant Vice President, Renewable Natural Gas Operations since November 2022. Prior to that, Mr. Palleschi served as Director, Product Supply since 2020 and in various other management positions within the Partnership since joining the Partnership in 2006. Mr. Palleschi is also a founding member and President of the Sparta Benevolent Society, a non-profit organization located in Sparta, NJ.
Ms. Sankara has served as our Vice President, Marketing & Brand Strategy since November 2021 and before that was our Assistant Vice President, Marketing & Brand Strategy since May 2017. Prior to joining Suburban Propane, she held several leadership positions in her career, including Global Customer Experience, Market Intelligence, and Product Management with Sealed Air Corporation from September 2011 to December 2016. Prior to that, Ms. Sankara served as the Director and Head of Marketing & Brand with Aetna from April 2009 to September 2011. Ms. Sankara also served in several global marketing positions with Pitney Bowes from January 2001 to December 2009.
Mr. Schueler has served as our Vice President – Product Supply since October 2017 and before that was our Managing Director – Product Supply since November 2013. Mr. Schueler joined the Partnership as Director – Product Resources in July 2005 following a nine-year career at Public Service Enterprise Group and prior to that, eight years at Kraft Foods.
Mr. Stubbs has served as Vice President – Operations since October 2023. Prior to that appointment, he was General Manager of our Mid-Atlantic Region since May 2021. Before then, he held the roles of Region Operations Manager and Area Sales Manager in the Mid-Atlantic region from 2015 to 2021. He joined the Partnership in September 2004 as a Customer Service Manager and held the role in various areas within the Partnership’s Mid-Atlantic operations for eleven years. Prior to joining the Partnership, Mr. Stubbs worked for a regional petroleum company for eight years.
Mr. Chanin has served as a Supervisor since November 2012 and was elected as Chairman of the Board of Supervisors effective January 1, 2021. He was Senior Managing Director of Prudential Investment Management, a subsidiary of Prudential Financial, Inc., from 1996 until his retirement in January 2012, after which he continued to provide consulting services to Prudential until December 2016. He headed Prudential’s private fixed income business, chaired an internal committee responsible for strategic investing and was a principal in Prudential Capital Partners, the firm’s mezzanine investment business and, until October 2017, served as a Director of two private companies that were in the fund portfolios of Prudential Capital Partners.
Mr. Chanin’s qualifications to sit on our Board, and serve as Chairman of the Board and Chair of its Nominating/Governance Committee, include 35 years of investment experience with a focus on highly structured private placements in companies in a broad range of industries, with a particular focus on energy companies. He has previously served on the audit committee of a public company board and the compensation committee for a private company board. Mr. Chanin has earned an MBA and is a Chartered Financial Analyst.
Mr. Logan has served as a Supervisor since March 1996 and served as Chairman of the Board of Supervisors from January 2007 until December 31, 2020. Mr. Logan co-founded, and from 2006 to May 2018 served as a Director of Basic Materials and Services LLC, an investment company that, until it went inactive in May 2018, invested in companies that provide specialized infrastructure services and materials for the pipeline construction industry and the sand/silica industry. From 2003 to September 2006, Mr. Logan was a Director and Chairman of the Finance Committee of the Board of Directors of TransMontaigne Inc., which provided logistical services (i.e. pipeline, terminaling and marketing) to producers and end-users of refined petroleum products. From 1995 to 2002, Mr. Logan was Executive Vice President/Finance, Treasurer and a Director of TransMontaigne Inc. From 1987 to 1995, Mr. Logan served as Senior Vice President – Finance and a Director of Associated Natural Gas Corporation, an independent gatherer and marketer of natural gas, natural gas liquids and crude oil. Mr. Logan is also a Director of Hart Energy Publishing LLP, and, through October 2021
52
was a Director of Cimarex Energy Co. prior to its merger with Cabot Oil & Gas Corp.; through May 2019, was a Director of InfraREIT, Inc., which was acquired by Oncor Electric Delivery Company LLC and Sempra Energy in May 2019; and through May 2017, was a Director of Graphic Packaging Holding Company.
Over the past forty plus years, Mr. Logan’s education, investment banking/venture capital experience and business/financial management experience have provided him with a comprehensive understanding of business and finance. Most of Mr. Logan’s business experience has been in the energy industry, both in investment banking and as a senior financial officer and director of publicly-owned energy companies. Mr. Logan’s expertise and experience have been relevant to his responsibilities of providing oversight and advice to the managements of public companies, and is of particular benefit in his role as a Supervisor. Since 1996, Mr. Logan has been a director of ten public companies and has served on audit, compensation and governance committees.
Ms. Swift has served as a Supervisor since April 2007. In November 2023, Ms. Swift was appointed President of Education at Work, a not-for-profit educational institution, which is part of the Strada Education Foundation and partners with industry and higher education institutions to prepare students for current and future careers through a work-based learning model. From July 2022 until October 2023, Ms. Swift served as an Operating Partner for Vistria Group, a private investment firm operating at the intersection of purpose and profit. Ms. Swift previously served as President and Executive Director of LearnLaunch Institute, a not-for-profit educational institution in Boston, Massachusetts; as Executive Chair of Ultimate Medical Academy, a not-for-profit healthcare educational institution with a national presence; as the CEO of Middlebury Interactive Languages, LLC, a marketer of world language products; as Senior Vice President at ConnectEDU Inc., a private education technology company; as the founder of WNP Consulting, LLC, a provider of expert advice and guidance to early stage education companies; and as a General Partner at Arcadia Partners, a venture capital firm focused on the education industry. Ms. Swift served for fifteen years in Massachusetts state government, becoming Massachusetts’ first woman governor in 2001. In July 2022, Ms. Swift became the founder and President of Cobble Hill Farm Education & Rescue Center, which is a non-profit organization that provides animal rescue and education programs. In October 2023, Ms. Swift was appointed to the National Association Governing Board and currently serves as a member of the George W. Bush Institute Advisory Council, the Innovation Advisory Council of Boston College High School’s Shields Center for Innovation and as an advisor to companies within the Vistria Group’s education portfolio. She has previously served on the boards of both public and private companies in the education space, including K12, Inc., Animated Speech Company, Sally Ride Science Inc., Teachers of Tomorrow and eDynamics Learning.
Ms. Swift’s qualifications to sit on our Board, and serve as Chair of its Compensation Committee, include her strong experience in public policy and government, and her extensive knowledge of regulatory matters arising from her fifteen years in state government.
Mr. Caldwell has served as a Supervisor since November 2012. He was a Co-Founder of New Canaan Investments, Inc. (“NCI”), a private equity investment firm, where he was one of three senior officers of the firm from 1988 to 2005. NCI was an active “fix and build” investor in packaging, chemicals, and automotive components companies. Mr. Caldwell held a number of board directorships and senior management positions in those companies until he retired in 2005. The largest of these companies was Kerr Group, Inc., a plastic closure and bottle company where Mr. Caldwell served as Director for eight years and Chief Financial Officer for six years. From 1985 to 1988, Mr. Caldwell was head of acquisitions for Moore McCormack Resources, Inc., an oil and gas exploration, shipping, and construction materials company. Mr. Caldwell also currently serves on the Board of Trustees and as Chairman of the Investment Committee of Historic Deerfield, and as the President of the Board of The New Canaan Museum and Historical Society; both of which non-profit institutions focus on enriching educational programs for K-12 children locally and nationwide.
Mr. Caldwell's qualifications to sit on our Board include over forty years of successful investing in and managing of a broad range of public and private businesses in a number of different industries. This experience has encompassed both turnaround situations, and the building of companies through internal growth and acquisitions.
Mr. Connors has served as a Supervisor since January 2017. Mr. Connors retired in September 2015 from KPMG LLP after nearly forty years in public accounting. Prior to joining KPMG in 2002, he was a partner with another large international accounting firm. During his career, he served as a senior audit and global lead partner for numerous public companies, including Fortune 500 companies. At KPMG, he was a professional practice partner, SEC Reviewing Partner and was elected to serve as a member of KPMG’s board of directors (2011-2015), where he chaired the Audit, Finance & Operations Committee. Mr. Connors currently serves as a director and audit committee chair of FS Credit Real Estate Income Trust, Inc., a commercial mortgage nontraded real estate investment trust, and AdaptHealth Corp., a leading provider of home healthcare equipment and services in the United States. He previously served as a director and audit committee chair of Cardone Industries, Inc., one of the largest privately-held automotive parts remanufacturers in the world.
Mr. Connors’ qualifications to sit on our Board, and serve as Chair of its Audit Committee, include his extensive experience as a lead audit partner for numerous public companies across a variety of industries, which enables him to provide helpful insights to the Board in connection with its oversight of financial, accounting and internal control matters.
53
Mr. Landuyt has served as a Supervisor since January 1, 2017. Since 2003, Mr. Landuyt has served as a Managing Director at Charterhouse Strategic Partners, LLC, and its predecessors (“Charterhouse”), private equity firms with a focus on build-ups, management buyouts, and growth capital investments primarily in the business services and healthcare services sectors, and has served on the Boards of Directors of a number of portfolio companies of those firms. From 1996 to 2003, Mr. Landuyt served as Chairman of the Board, President and Chief Executive Officer of Millennium Chemicals, Inc. (“Millennium”), and from 1983 to 1996 he served as Finance Director of Hanson plc and several other senior executive positions with Hanson Industries, the U.S. subsidiary of Hanson plc (collectively, “Hanson,”), including Vice President and Chief Financial Officer and ultimately Director, President and Chief Executive Officer. Hanson and Millennium were both previous owners of the Partnership or its predecessor through 1996 and 1999, respectively. He joined Hanson after spending six years as a Certified Public Accountant and auditor at Price Waterhouse & Co., where he rose to the position of Senior Manager. Mr. Landuyt has previously served on the Boards of Directors (including their Audit and Compensation Committees) of public companies, including Bethlehem Steel Corp., MxEnergy Holdings, Inc., a leading retail marketer of natural gas and electricity contracts, and Top Image Systems, Inc. Mr. Landuyt is also the Co-Founder and Executive Director of Celtic Charms, Inc., a non-profit therapeutic horsemanship center previously engaged in serving people with physical and cognitive disabilities and disorders and now serving as a retirement home for Celtic Charms’ equines.
Mr. Landuyt’s qualifications to sit on our Board include over forty years of financial and executive management experience for both public and private companies, including extensive experience with mergers and acquisitions and corporate governance. Additionally, his specific responsibility for supervision of the Partnership’s predecessors, as well as his subsequent board-level involvement in the distribution, petrochemical and retail energy sectors gives Mr. Landuyt extensive expertise in areas directly relevant to the business of the Partnership.
Ms. Adams has served as a Supervisor since May 2023. Since March 2023, Ms. Adams has served as Vice President of Government Partnerships and Funding at Cummins Inc., where she focuses on private-public collaboration building in the zero emissions space. Prior to that, Ms. Adams served as Vice President, Fuel Cell and Hydrogen Technologies, overseeing Cummins’ hydrogen investments and partnerships. Ms. Adams has worked for Cummins Inc. since January 1995 and has served in several senior leadership positions within the company that enabled her to build an extensive background in emerging energy solutions, including hydrogen fuel cell and electrolyzer technologies, strategic growth and market development initiatives and launching new generations of emission solutions in Cummins’ global markets. Ms. Adams has led complex businesses on three continents, enabling her to build a truly global perspective. From 1988 to 1995, Ms. Adams served in various management positions within Ameritech Corporation (now known as AT&T Teleholdings Inc.). Since 2020, Ms. Adams has served on the Management Board of the Hydrogen Council, a global CEO-led initiative aimed at fostering the clean energy transition and from 2021-2023 she served as a co-chair of the Council. Ms. Adams also serves on the Board of the Fuel Cell and Hydrogen Energy Association (FCHEA). Since 2018, Ms. Adams has also served as a National Board Member for Girls Inc., a non-profit organization that encourages and mentors young women as they work to navigate economic, gender and social barriers.
Ms. Adams’ qualifications to sit on our Board include her extensive corporate experience and background in managing emerging energy solutions, including an extensive understanding of hydrogen-based technologies, which enables her to provide helpful insights to the Board in connection with its oversight of the Partnership’s renewable energy investments and assets and the Partnership’s strategic plans for developing its renewable energy platform.
Mr. Oates has served as a Supervisor since May 2023. In 2015, Mr. Oates founded and currently serves as the Chairman and Chief Executive Officer of Oates Energy Solutions LLC, a privately-owned energy and technology value creation services company. Since 2020, Mr. Oates has also served as Chief Executive Officer of Refinery Calculator Inc., which is a global refining, energy, chemicals, emissions and hydrogen market intelligence cloud-based software and data platform. From 2015 to 2018, Mr. Oates served in several executive leadership roles in sales, marketing and commercial development within True North Venture Partners (an Ahearn, Walton, Cox family limited partnership entity), as well as within one of their portfolio companies, Aquahydrex Pty Ltd. From 2008 to 2015, Mr. Oates held several leadership positions within Praxair Inc. (now Linde PLC), most recently as Global Director of Hydrogen and Carbon Monoxide product management, where he was accountable for the overall profitability management functions for large-scale hydrogen pipeline and storage assets, as well as carbon monoxide, liquid methane, methanol and formalin business units. From 2000 to 2003, Mr. Oates founded and operated Oates Consulting Company, where he consulted on hydrogen storage business development. Since 2022, Mr. Oates has served as an independent director of the Board of Directors, as well as a member of the Nominating, Governance and Sustainability Committee of its Board of Directors for Summit Midstream Partners, LP, which owns, develops and operates midstream energy infrastructure assets in the continental United States. Since 2014, Mr. Oates has also served as a Board member for the International Association of Hydrogen Energy and has secured over 16 hydrogen technology, purification and storage patents.
Mr. Oates’s qualifications to sit on our Board include his extensive understanding of energy markets, renewable energy solutions, and over two decades of experience in hydrogen commercial and technical market development, which enables him to provide helpful insights to the Board in connection with its oversight of the Partnership’s renewable energy investments and assets and the Partnership’s strategic plans for developing its renewable energy platform.
54
Codes of Ethics and of Business Conduct
We have adopted a Code of Ethics that applies to our principal executive officer, principal financial officer and principal accounting officer, and a Code of Business Conduct that applies to all of our employees, officers and Supervisors. A copy of our Code of Ethics and our Code of Business Conduct is available without charge from our website at www.suburbanpropane.com or upon written request directed to: Suburban Propane Partners, L.P., Investor Relations, P.O. Box 206, Whippany, New Jersey 07981-0206. Any amendments to, or waivers from, provisions of our Code of Ethics or our Code of Business Conduct will be posted on our website.
Corporate Governance Guidelines
We have adopted Corporate Governance Guidelines and Principles in accordance with the NYSE corporate governance listing standards in effect as of the date of this Annual Report. In addition, we have adopted certain Corporate Governance Policies, including an Equity Holding Policy for Supervisors and Executives and an Incentive Compensation Recoupment Policy and a Clawback Policy. A copy of our Corporate Governance Guidelines and Principles, as well as a copy of the Corporate Governance Policies, is available without charge from our website at www.suburbanpropane.com or upon written request directed to: Suburban Propane Partners, L.P., Investor Relations, P.O. Box 206, Whippany, New Jersey 07981-0206.
Audit Committee Charter
We have adopted a written Audit Committee Charter in accordance with the NYSE corporate governance listing standards in effect as of the date of this Annual Report. The Audit Committee Charter is reviewed periodically to ensure that it meets all applicable legal and NYSE listing requirements. A copy of our Audit Committee Charter is available without charge from our website at www.suburbanpropane.com or upon written request directed to: Suburban Propane Partners, L.P., Investor Relations, P.O. Box 206, Whippany, New Jersey 07981-0206.
Compensation Committee Charter
The Compensation Committee reviews the performance of, and sets the compensation for, all of the Partnership’s executives. It also approves the design of executive compensation programs. In addition, the Compensation Committee participates in executive succession planning and management development. Four Supervisors, who are not officers or employees of the Partnership or its subsidiaries, currently serve on the Compensation Committee. The Board of Supervisors has determined that all four current members of the Compensation Committee, Jane Swift, Matthew J. Chanin, Harold R. Logan, Jr. and Amy Adams are independent.
During fiscal 2023 and fiscal 2022, the Compensation Committee independently retained Willis Towers Watson, a human resources consulting firm, to assist the Compensation Committee in developing certain components of the compensation packages for the Partnership’s executive officers. See Item 11, below.
We have adopted a Compensation Committee Charter in accordance with the NYSE corporate governance listing standards in effect as of the date of this Annual Report. A copy of our Compensation Committee Charter is available without charge from our website at www.suburbanpropane.com or upon written request directed to: Suburban Propane Partners, L.P., Investor Relations, P.O. Box 206, Whippany, New Jersey 07981-0206.
Nominating/Governance Committee Charter
The Nominating/Governance Committee participates in Board succession planning and development and identifies individuals qualified to become Board members, recommends to the Board the persons to be nominated for election as Supervisors at any Tri-Annual Meeting of the Unitholders and the persons (if any) to be elected by the Board to fill any vacancies on the Board, develops and recommends to the Board changes to the Partnership’s Corporate Governance Guidelines & Principles when appropriate, and oversees the evaluation of the Board and its committees. The Committee’s current members are Matthew J. Chanin (its Chair), Harold R. Logan, Jr., Jane Swift, Lawrence C. Caldwell, Terence J. Connors, William M. Landuyt, Amy M. Adams and Rommel M. Oates, all of whom are independent in accordance with our Corporate Governance Guidelines & Principles and the rules of the NYSE.
We have adopted a written Nominating/Governance Committee Charter. A copy of our Nominating/Governance Committee Charter is available without charge from our website at www.suburbanpropane.com or upon written request directed to: Suburban Propane Partners, L.P., Investor Relations, P.O. Box 206, Whippany, New Jersey 07981-0206.
NYSE Annual CEO Certification
The NYSE requires the Chief Executive Officer of each listed company to submit a certification indicating that the company is not in violation of the Corporate Governance listing standards of the NYSE on an annual basis. Our Chief Executive Officer submits his Annual CEO Certification to the NYSE each December. In December 2022, our Chief Executive Officer, Michael A. Stivala, submitted his Annual CEO Certification to the NYSE without qualification.
55
Delinquent Section 16(a) Reports
The Form 4s filed by each of our then executive officers on November 16, 2022 inadvertently omitted the grants of phantom units to those executive officers on November 15, 2022. These grants of phantom units were reported on the amended Form 4s filed by each of our then executive officers on September 1, 2023. The Form 5 reflecting the purchases by Nandini Sankara, our Vice President – Marketing and Brand Strategy, on May 10, 2022, August 9, 2022, and November 8, 2022 was not filed until February 24, 2023.
56
ITEM 11. EXECUTIVE COMPENSATION
Compensation Discussion and Analysis
This Compensation Discussion and Analysis (“CD&A”) explains our executive compensation philosophy, policies and practices with respect to those executive officers of the Partnership identified below whom we collectively refer to as our “named executive officers”:
Name |
|
Position |
Michael A. Stivala |
|
President and Chief Executive Officer |
Michael A. Kuglin |
|
Chief Financial Officer |
Steven C. Boyd |
|
Chief Operating Officer |
Douglas T. Brinkworth |
|
Senior Vice President, Product Supply, Purchasing and Logistics |
Neil E. Scanlon |
|
Senior Vice President, Information Services |
Key Topics Covered in our CD&A
The following table summarizes the main areas of focus in our CD&A:
Compensation Governance |
Participants in the Compensation Process |
The Annual Compensation Decision Making Process |
Risk Mitigation Policies |
Executive Compensation Philosophy |
Overview |
Pay Mix |
Components of Compensation |
Base Salary |
Annual Cash Bonus |
Long-Term Incentive Plan |
Restricted Unit Plan and Phantom Equity Plan |
Distribution Equivalent Rights Plan |
Benefits and Perquisites |
Compensation Governance
Participants in the Compensation Process
Role of the Compensation Committee
The Compensation Committee of our Board of Supervisors (the “Committee”) is responsible for overseeing our executive compensation program. In accordance with its charter, available on our website at www.suburbanpropane.com, the Committee ensures that the compensation packages provided to our executive officers are designed in accordance with our compensation philosophy. The Committee reviews and approves the compensation packages of our managing directors, assistant vice presidents, vice presidents, senior vice presidents, and our named executive officers. The Committee establishes and oversees our general compensation philosophy in consultation with our President and Chief Executive Officer, and supplements that by seeking advice, best practices and benchmarking from outside compensation consultants on an as needed basis.
Among other duties, the Committee has overall responsibility for:
57
Role of the President and Chief Executive Officer
The role of our President and Chief Executive Officer in the executive compensation process is to recommend individual pay adjustments, grants of awards under our Restricted Unit Plan and Phantom Equity Plan, and other adjustments to the compensation packages of the executive officers, other than for himself, to the Committee based on market conditions, the Partnership’s performance and individual performance. When recommending individual pay adjustments for the executive officers, our President and Chief Executive Officer presents the Committee with information comparing each executive officer’s current compensation to relevant benchmark data for comparable positions.
Role of Outside Consultants
Prior to each Committee meeting at which executive compensation packages are reviewed, members of the Committee are provided with benchmarking data from the Mercer Human Resource Consulting, Inc. (“Mercer”) database for comparison. The Committee’s sole use of the Mercer database is to compare and contrast our executive officers’ current base salaries, total cash compensation opportunities and total direct compensation to the data provided in the Mercer benchmarking database, which is derived from a proprietary database of surveys from over 1,699 organizations and approximately 1,051 positions that may or may not include similarly-sized national propane marketers. The use of the Mercer database provides a broad base of compensation benchmarking information for companies of a size similar to that of the Partnership. There was no formal consultancy role played by Mercer. Therefore, prior to the Committee’s meetings, neither the Committee members nor our President and Chief Executive Officer met with representatives from Mercer.
In addition to using the benchmarking data from the Mercer database, the Committee has utilized, since fiscal 2013, the services of Willis Towers Watson (“WTW”), a human resource consulting firm, in developing compensation packages for each of our named executive officers and our other executive officers. Because the Committee has followed an informal policy of only considering increases to executive base salaries every two years, the Committee commissions WTW to update their benchmarking study every two years. The Committee has also engaged the services of WTW in evaluating other aspects of executive compensation packages on a periodic basis, including the design of incentive compensation plans and other perquisites. WTW benchmarks the base salaries, total cash compensation opportunities and total direct compensation of our executive officers in comparison to comparable positions, using market data for similarly-sized companies which were collected by WTW from multiple survey sources across several industries, inclusive of other energy companies in the United States. The Committee engaged WTW in 2021 to provide benchmarking data in reviewing and establishing executive compensation for fiscal 2022 and for fiscal 2023, and again in 2023 to evaluate executive compensation for fiscal 2024.
Our Unitholders: Say-on-Pay
At their May 18, 2021 Tri-Annual Meeting, our Unitholders overwhelmingly approved an advisory resolution approving executive compensation (commonly referred to as “Say-on-Pay”). As a result, the Committee determined that no major revisions of its executive compensation practices were required. However, it remains the Committee’s practice to periodically evaluate its compensation practices for possible improvement. The following represents the 2021 Say-on-Pay voting results:
For |
|
|
Against |
|
|
Abstain |
|
|
Broker Non-Votes |
|
||||
|
22,189,183 |
|
|
|
2,007,031 |
|
|
|
625,130 |
|
|
|
20,733,270 |
|
58
The Annual Compensation Decision Making Process
Fiscal 2023 Committee Meetings
The Committee usually holds three regularly-scheduled meetings during the fiscal year: one in October or November, one in January and one in July, and may meet at other times during the year as warranted. During fiscal 2023, the Committee chose to meet in November, January and July. The Committee finalized the fiscal 2023 compensation packages for our named executive officers at its November 8, 2022 meeting.
As in past fiscal years and as referred to above, the Committee was provided with a comprehensive analysis of each executive officer’s past and current compensation - including benchmarking data for comparison - to enable it to assess and determine each executive officer’s compensation package for fiscal 2023. Prior to making its decisions regarding each named executive officer’s fiscal 2023 compensation package, the Committee reviewed the total cash compensation opportunity that was provided to each named executive officer during the previously completed fiscal year compared to the total mean cash compensation opportunity for the parallel position in the Mercer benchmarking database and to the previous year's recommendations provided by WTW in advance of the November 8, 2022 Committee meeting.
Our Approach to Setting Compensation Packages
Although the Committee has adopted an informal policy of considering adjustments to the base salaries of our named executive officers every two years (unless specific circumstances warrant adjustments at a different time), the Committee still conducts an annual review of the compensation packages of all of our executive officers. In reviewing and determining the compensation packages of our named executive officers, the Committee considers a number of factors related to each executive; including, but not limited to, years of experience in current position, scope and level of responsibility, influence over the affairs of the Partnership and individual performance. The relative importance assigned to each of these factors by the Committee may differ from executive to executive and from year to year. As a result, different weights may be given to different components of compensation among each of our named executive officers. As a result of this informal policy, the Committee did not consider fiscal 2023 adjustments to the base salaries of our named executive officers.
As previously stated, the Committee reviewed benchmarking data from Mercer and WTW for comparison. This benchmarking data is just one of a number of factors considered by the Committee, but, in some cases, is not necessarily the most persuasive factor. The Committee compared total cash compensation opportunities (comprising base salary, annual cash bonuses and distribution equivalent rights payments) to the 50th percentile for the total cash compensation opportunity for the parallel position in both the Mercer benchmarking database and the market data provided by WTW. The Committee compared the total direct compensation, which includes the total cash compensation opportunity plus long-term incentives (inclusive of cash settled long-term incentives and grants under the Restricted Unit and Phantom Equity Plans) to the 75th percentile of the Mercer benchmarking database and the WTW benchmarking study. The Committee seeks to establish an overall compensation package for each of our executive officers that provides a competitive base salary, the opportunity to earn annual cash incentives based on annual performance targets, with the goal of establishing a total cash compensation opportunity that reflects the 50th percentile of the relevant benchmark data. The annual total cash compensation opportunity is supplemented with targeted long-term incentive opportunities, in the form of long-term performance-based awards under our Long-Term Incentive Plan and grants of awards under our Restricted Unit Plan and Phantom Equity Plan, to establish the target total direct compensation for each executive officer.
Compensation Peer Group
The Committee bases its benchmarking on the market data, provided by Mercer and WTW, derived from companies of a size similar to the Partnership, and does not rely solely on a peer group of other propane marketers. The Committee takes this approach because it believes that the proximity of our headquarters to New York City and the need to realistically compete for skilled executives in an environment shared by numerous other enterprises seeking similarly skilled employees requires a broader review of the market. Furthermore, similarly-sized propane marketers (of which there are only two) compete for executives in different economic environments and have different ownership structures which may influence the comparability of compensation data for executive officer positions. This benchmarking approach has been in place for a number of years.
59
Executive Compensation Philosophy
Overview
Our executive compensation program is underpinned by two core objectives:
We accomplish these objectives by providing our executive officers with compensation packages that provide a competitive base salary combined with the opportunity to earn both short-term and long-term cash incentives based on the achievement of short-term and long-term performance objectives under a pay-for-performance compensation philosophy. Recognizing that certain external factors, such as the severity and unpredictability of winter weather patterns, may have a significant influence on annual financial performance in any given year, the Committee evaluates additional factors in determining the amount of incentive compensation earned. We also provide our executive officers with equity-based compensation opportunities that are intended to align their interests with those of our Unitholders. Various components of compensation provided to our executive officers are specifically linked to either short-term or long-term performance measures, and encourage equity ownership in the Partnership. Therefore, our executive compensation packages are designed to achieve our overall goal of sustainable, profitable growth by rewarding our executive officers for behaviors that facilitate our achievement of this goal.
60
The principal components of the compensation we provide to our named executive officers are as follows:
Component |
|
Purpose |
|
Features |
Base Salary |
|
• To reward individual performance, |
|
• Reviewed and approved annually |
Annual cash incentive |
|
• To drive and reward the delivery of |
|
• Paid in cash |
Cash settled long-term incentives |
|
• To ensure alignment of our executive |
|
• Participants are selected by the |
Restricted units |
|
• To retain the services of the recipient |
|
• Participants are selected by the |
Phantom units |
|
• To retain the services of the recipient |
|
• Participants are selected by the |
Distribution equivalent rights |
|
• To drive and reward behaviors that lead |
|
• Participants are selected by the |
61
We align the short-term and long-term interests of our named executive officers with the short-term and long-term interests of our Unitholders by:
Pay Mix
Under our compensation structure, each named executive officer’s “total cash compensation opportunity” consists of a mix of base salary, annual cash bonus, the eligibility to participate in our Long-Term Incentive Plan for the potential to earn cash-settled long-term incentives, grants of phantom units under our Phantom Equity Plan, and distribution equivalent rights payments. In addition to the total cash compensation opportunity, each named executive officer is eligible to receive grants of restricted units under our Restricted Unit Plan, which, when combined with the total cash compensation opportunity, represents our named executive officers’ “total direct compensation opportunity.” This “mix” varies depending on his or her position, and the level of influence and line of sight to the activities that can help achieve the incentive targets. The base salary for each executive officer is the only fixed component of compensation, and the Restricted Unit Plan awards are the only non-cash compensation component. The annual cash bonuses and cash settled long-term incentive compensation, are dependent upon achievement of certain performance measures.
In allocating among these components, in order to align the interests of our senior executive officers - the executive officers having the greatest ability to influence our performance - with the interests of our Unitholders, the Committee considers it crucial to emphasize the performance-based elements of the total cash compensation opportunities provided to them. Therefore, during fiscal 2023, 60% of our President and CEO’s and at least 40% of our other named executive officers’ total cash compensation opportunity was performance-based under our annual cash bonus and long-term incentive plans, neither of which provide for guaranteed minimum payments.
In reviewing and establishing compensation packages for our named executive officers for fiscal 2023, at its meeting on November 8, 2022, in accordance with its informal policy of considering base salary increases every two years, the Committee did not make base salary adjustments. The Committee did, however, review the study provided by WTW for the fiscal 2022 adjustments, as well as the 2022 Mercer benchmark database. Specifically, both data sources were used to review and approve the target grant values of the non-cash Restricted Unit Plan, and cash settled Phantom Equity Plan, that were awarded to our named executive officers and certain other executive officers as part of their overall compensation packages for fiscal 2023.
The following table summarizes each of the components of total cash compensation as a percentage of each named executive officer’s total cash compensation opportunity for fiscal 2023, as well as the total cash compensation opportunity and the non-cash Restricted Unit Plan, and cash settled Phantom Equity Plan, grants each as a percentage of the total direct compensation opportunity for fiscal 2023:
Name |
|
Base Salary |
|
Cash Bonus |
|
Cash Settled |
|
Cash Settled |
|
Distribution |
|
Total Cash Compensation Opportunity as a Percentage of Total Direct Compensation |
|
Non-Cash Restricted Unit Plan Grants as a Percentage of Total Direct Compensation |
Michael A. Stivala |
|
28% |
|
34% |
|
26% |
|
7% |
|
5% |
|
82% |
|
18% |
Michael A. Kuglin |
|
30% |
|
24% |
|
18% |
|
21% |
|
7% |
|
79% |
|
21% |
Steven C. Boyd |
|
30% |
|
24% |
|
18% |
|
21% |
|
7% |
|
80% |
|
20% |
Douglas T. Brinkworth |
|
29% |
|
23% |
|
17% |
|
23% |
|
8% |
|
78% |
|
22% |
Neil E. Scanlon |
|
28% |
|
23% |
|
17% |
|
23% |
|
9% |
|
78% |
|
22% |
62
In reviewing and establishing compensation packages for our named executive officers for fiscal 2024, at its meeting on November 7, 2023, in accordance with its informal policy of considering base salary increases every two years, fiscal 2024 is a year for which the Committee planned to consider base salary adjustments. In anticipation of this, at its July 18, 2023 meeting, it directed management to commission a WTW compensation benchmarking study for use in considering and determining any fiscal 2024 adjustments. The Committee used this study and the 2023 Mercer benchmark database as data sources to review and approve base salary adjustments, as well as the target grant values of the non-cash Restricted Unit Plan and cash settled Phantom Equity Plan grants that were awarded to our named executive officers and certain other executive officers as part of their overall compensation packages for fiscal 2024.
The following table summarizes each of the components of total cash compensation as a percentage of each named executive officer’s total cash compensation opportunity for fiscal 2024, as well as the total cash compensation opportunity and the non-cash Restricted Unit Plan, and cash settled Phantom Equity Plan, grants each as a percentage of the total direct compensation opportunity for fiscal 2024:
Name |
|
Base Salary |
|
Cash Bonus |
|
Cash Settled |
|
Cash Settled |
|
Distribution |
|
Total Cash Compensation Opportunity as a Percentage of Total Direct Compensation |
|
Non-Cash Restricted Unit Plan Grants as a Percentage of Total Direct Compensation |
|
Michael A. Stivala |
|
28% |
|
34% |
|
25% |
|
7% |
|
6% |
|
80% |
|
20% |
|
Michael A. Kuglin |
|
28% |
|
22% |
|
17% |
|
25% |
|
8% |
|
82% |
|
18% |
|
Steven C. Boyd |
|
27% |
|
22% |
|
16% |
|
27% |
|
8% |
|
81% |
|
19% |
|
Douglas T. Brinkworth |
|
27% |
|
22% |
|
16% |
|
27% |
|
8% |
|
81% |
|
19% |
|
Neil E. Scanlon |
|
27% |
|
22% |
|
16% |
|
27% |
|
8% |
|
81% |
|
19% |
|
Total Direct Compensation for Our President and Chief Executive Officer
At its meeting on November 9, 2021, the Committee reviewed a detailed benchmarking analysis of the components of total direct compensation for our President and Chief Executive Officer prepared by WTW in making decisions regarding structural changes to his compensation for fiscal 2022. Mr. Stivala has been the Partnership’s President and Chief Executive Officer since September 2014, and has navigated the Partnership through an extraordinarily challenging operating environment during his tenure, while also beginning to shift the strategic focus of the Partnership toward the building of a renewable energy platform. In reviewing the relevant benchmark data for similar-sized companies, the Committee acknowledged a significant shortfall in the total cash compensation opportunity for Mr. Stivala compared to the 50th percentile of the benchmark total cash compensation opportunity. In an effort to begin to close the gap on the perceived shortfall in the overall compensation structure for our President and Chief Executive Officer compared to the relevant benchmark, a number of changes were made to his fiscal 2022 compensation package. As part of the structural changes to the compensation package for our President and Chief Executive Officer, by increasing his Annual Bonus Target percentage to 120%, the Committee shifted a higher percentage of the total direct compensation opportunity to performance-based compensation under the Committee’s pay for performance philosophy.
63
The following were the changes to the total direct compensation opportunity for our President and Chief Executive Officer for fiscal 2022:
Components of Total Direct Compensation |
|
Fiscal 2021 |
|
|
Fiscal 2022 |
|
||
Base Salary |
$ |
|
600,000 |
|
$ |
|
820,000 |
|
Annual Bonus Target % |
|
|
100 |
% |
|
|
120 |
% |
Annual Bonus Target $ |
$ |
|
600,000 |
|
$ |
|
984,000 |
|
Distribution Equivalent Rights Payments |
$ |
|
141,253 |
|
$ |
|
159,100 |
|
Total Cash Compensation Opportunity |
$ |
|
1,341,253 |
|
$ |
|
1,963,100 |
|
LTIP Target $ |
$ |
|
300,000 |
|
$ |
|
738,000 |
|
Restricted Unit Plan Award $ |
$ |
|
1,050,090 |
|
$ |
|
744,247 |
|
Total Direct Compensation Opportunity |
$ |
|
2,691,343 |
|
$ |
|
3,445,347 |
|
Performance-Based % of Total Direct Compensation Opportunity |
|
|
33 |
% |
|
|
50 |
% |
In summary, as a result of these structural changes to the compensation package for our President and Chief Executive Officer, the total cash compensation opportunity was more reflective of the 50th percentile for the relevant benchmark and the percentage of “at risk” compensation for fiscal 2022 increased from 33% to 50%.
In accordance with its informal policy of only considering base salary increases every two years, at its November 8, 2022 meeting, the Committee did not consider a salary increase for Mr. Stivala for fiscal 2023. Instead, the Committee focused its efforts on reviewing benchmark data to determine the appropriate target values of awards under the Restricted Unit Plan and the Phantom Equity Plan for Mr. Stivala for fiscal 2023. Similar to Mr. Stivala’s fiscal 2022 compensation package, his total cash compensation opportunity is reflective of the 50th percentile for the relevant benchmark and the percentage of “at risk” compensation for fiscal 2023 was 49%. The following summarizes the total direct compensation opportunity for our President and Chief Executive Officer for fiscal 2023:
Components of Total Direct Compensation |
|
Fiscal 2023 |
|
|
Base Salary |
$ |
|
820,000 |
|
Annual Bonus Target % |
|
|
120 |
% |
Annual Bonus Target $ |
$ |
|
984,000 |
|
Distribution Equivalent Rights Payments |
$ |
|
156,532 |
|
Total Cash Compensation Opportunity |
$ |
|
1,960,532 |
|
LTIP Target $ |
$ |
|
738,000 |
|
Restricted Unit Plan Award $ |
$ |
|
629,526 |
|
Phantom Equity Plan Award $ |
$ |
|
190,000 |
|
Total Direct Compensation Opportunity |
$ |
|
3,518,058 |
|
Performance-Based % of Total Direct Compensation Opportunity |
|
|
49 |
% |
At its November 7, 2023 meeting, the Committee reviewed a detailed benchmarking analysis of the components of total direct compensation for our President and Chief Executive Officer prepared by WTW while making decisions regarding Mr. Stivala’s fiscal 2024 compensation package. The Committee acknowledged that there is still a significant shortfall in the total cash compensation opportunity for Mr. Stivala compared to the 50th percentile of the benchmark total cash compensation opportunity, as well as in comparison of the total direct compensation opportunity compared to the 75th percentile of the relevant benchmark.
64
The following table summarizes the total direct compensation opportunity for our President and Chief Executive Officer for fiscal 2024:
Components of Total Direct Compensation |
|
Fiscal 2024 |
|
|
Base Salary |
$ |
|
910,000 |
|
Annual Bonus Target % |
|
|
120 |
% |
Annual Bonus Target $ |
$ |
|
1,092,000 |
|
Distribution Equivalent Rights Payments |
$ |
|
165,407 |
|
Total Cash Compensation Opportunity |
$ |
|
2,167,407 |
|
LTIP Target $ |
$ |
|
819,000 |
|
Restricted Unit Plan Award $ |
$ |
|
813,968 |
|
Phantom Equity Plan Award $ |
$ |
|
236,200 |
|
Total Direct Compensation Opportunity |
$ |
|
4,036,575 |
|
Performance-Based % of Total Direct Compensation Opportunity |
|
|
47 |
% |
Components of Compensation
Base Salary
Consistent with the process outlined in the section above titled “The Annual Compensation Decision Making Process,” at its November 8, 2022 meeting, the Committee followed its informal policy of considering adjustments to the base salaries of our named executive officers every two years (unless specific circumstances were deemed by the Committee to necessitate a base salary adjustment) and, as a result, the Committee did not consider Fiscal 2023 base salary adjustments for our named executive offices.
The following base salaries were in effect during fiscal 2023 and fiscal 2022 for our named executive officers:
Name |
|
Fiscal 2023 |
|
|
Fiscal 2022 |
|
||
Michael A. Stivala |
|
$ |
820,000 |
|
|
$ |
820,000 |
|
Michael A. Kuglin |
|
$ |
450,000 |
|
|
$ |
450,000 |
|
Steven C. Boyd |
|
$ |
460,000 |
|
|
$ |
460,000 |
|
Douglas T. Brinkworth |
|
$ |
400,000 |
|
|
$ |
400,000 |
|
Neil E. Scanlon |
|
$ |
350,000 |
|
|
$ |
350,000 |
|
The base salaries paid to our named executive officers in fiscal 2023, fiscal 2022 and fiscal 2021 are reported in the column titled “Salary” in the Summary Compensation Table below.
At its November 7, 2023 meeting, the Committee approved the following base salaries for fiscal 2024 for our named executive officers:
Name |
|
Fiscal 2024 |
|
|
Michael A. Stivala |
|
$ |
910,000 |
|
Michael A. Kuglin |
|
$ |
495,000 |
|
Steven C. Boyd |
|
$ |
500,000 |
|
Douglas T. Brinkworth |
|
$ |
445,000 |
|
Neil E. Scanlon |
|
$ |
390,000 |
|
Annual Cash Bonus Plan
The Committee uses the annual cash bonus plan (which falls within the SEC’s definition of a “Non-Equity Incentive Plan” for the purposes of the Summary Compensation Table and otherwise) to provide a cash incentive award to certain hourly and salaried employees; including our named executive officers. Payments, if any, are based on the attainment of EBITDA targets for the particular fiscal year, in accordance with an annual budget approved by our Board of Supervisors at the beginning of the fiscal year, and other qualitative factors that we refer to below as a “scorecard-based component.”
65
Components of Annual Cash Bonus Plan
Definitions
Actual EBITDA: represents net income before deducting interest expense, income taxes, depreciation and amortization.
Actual Adjusted EBITDA: represents Actual EBITDA adjusted for various items, including, but not limited to: unrealized non-cash gains or losses on changes in the fair value of derivative instruments; gains or losses on sale of businesses; acquisition and integration-related costs; multi-employer pension plan withdrawal charges; pension settlement charges; earnings and losses from our unconsolidated affiliates; and losses on debt extinguishment.
Budgeted EBITDA: represents our target budgeted EBITDA developed using a bottom-up process factoring in reasonable growth targets from the prior year’s performance, while at the same time attempting to reach a balance between a target that is reasonably achievable, yet not assured.
The annual cash bonus plan contains two separate measurement components as follows:
66
The following table sets forth the percentages of target cash bonuses participants will earn under the performance-based component of the annual cash bonus plan at various levels of Adjusted EBITDA in relation to Budgeted EBITDA:
Performance-Based Component |
|||||||||
|
|
Actual Adjusted EBITDA as a % of Budgeted EBITDA |
|
|
% of Target Cash Bonus Earned |
|
|
||
Maximum |
|
120% and above |
|
|
|
120 |
% |
|
|
|
|
|
119 |
% |
|
|
119 |
% |
|
|
|
|
118 |
% |
|
|
118 |
% |
|
|
|
|
117 |
% |
|
|
117 |
% |
|
|
|
|
116 |
% |
|
|
116 |
% |
|
|
|
|
115 |
% |
|
|
115 |
% |
|
|
|
|
114 |
% |
|
|
114 |
% |
|
|
|
|
113 |
% |
|
|
113 |
% |
|
|
|
|
112 |
% |
|
|
112 |
% |
|
|
|
|
111 |
% |
|
|
111 |
% |
|
|
|
|
110 |
% |
|
|
110 |
% |
|
|
|
|
109 |
% |
|
|
109 |
% |
|
|
|
|
108 |
% |
|
|
108 |
% |
|
|
|
|
107 |
% |
|
|
107 |
% |
|
|
|
|
106 |
% |
|
|
106 |
% |
|
|
|
|
105 |
% |
|
|
105 |
% |
|
|
|
|
104 |
% |
|
|
104 |
% |
|
|
|
|
103 |
% |
|
|
103 |
% |
|
|
|
|
102 |
% |
|
|
102 |
% |
|
|
|
|
101 |
% |
|
|
101 |
% |
|
Target |
|
|
100 |
% |
|
|
100 |
% |
|
|
|
|
99 |
% |
|
|
98 |
% |
|
|
|
|
98 |
% |
|
|
96 |
% |
|
|
|
|
97 |
% |
|
|
94 |
% |
|
|
|
|
96 |
% |
|
|
92 |
% |
|
|
|
|
95 |
% |
|
|
90 |
% |
|
|
|
|
94 |
% |
|
|
88 |
% |
|
|
|
|
93 |
% |
|
|
86 |
% |
|
|
|
|
92 |
% |
|
|
84 |
% |
|
|
|
|
91 |
% |
|
|
82 |
% |
|
|
|
|
90 |
% |
|
|
80 |
% |
|
|
|
|
89 |
% |
|
|
77 |
% |
|
|
|
|
88 |
% |
|
|
74 |
% |
|
|
|
|
87 |
% |
|
|
71 |
% |
|
|
|
|
86 |
% |
|
|
68 |
% |
|
|
|
|
85 |
% |
|
|
65 |
% |
|
|
|
|
84 |
% |
|
|
62 |
% |
|
|
|
|
83 |
% |
|
|
59 |
% |
|
|
|
|
82 |
% |
|
|
56 |
% |
|
|
|
|
81 |
% |
|
|
53 |
% |
|
Entry |
|
|
80 |
% |
|
|
50 |
% |
|
|
|
Below 80% |
|
|
|
0 |
% |
|
|
67
Fiscal 2023 Annual Cash Bonus
For fiscal 2023, our Budgeted EBITDA was $275.0 million. Our Actual Adjusted EBITDA was such that each of our executive officers earned 100% of his or her target cash bonus for the performance-based component of the annual cash bonus plan. During the previous two fiscal years, our Actual Adjusted EBITDA was such that each of our named executive officers earned 106% and 102% of his target cash bonus for fiscal 2022 and fiscal 2021, respectively. Additionally, for fiscal 2023, fiscal 2022 and fiscal 2021, based on the Committee’s evaluation of the qualitative scorecard-based components discussed above, the Committee awarded each of our named executive officers 25%, 24% and 25%, respectively, of the target cash bonuses for the scorecard-based component of the annual cash bonus plan. Accordingly, based on the performance of the Partnership, and the named executive officers, in fiscal 2024, 125% of target cash bonuses will be paid out in relation to fiscal 2023, in fiscal 2023, 130% of target cash bonuses were paid out in relation to fiscal 2022 and in fiscal 2022, 127% of target cash bonuses were paid out in relation to fiscal 2021.
The fiscal 2023 target cash bonus established for each named executive officer and the actual cash bonuses earned by each of them during fiscal 2023 are summarized as follows:
Name |
|
Fiscal 2023 Target Cash Bonus as a Percentage of Base Salary |
|
Fiscal 2023 Target Cash Bonus |
|
|
Fiscal 2023 Actual Cash Bonus Earned at 125% |
|
||
Michael A. Stivala |
|
120% |
|
$ |
984,000 |
|
|
$ |
1,230,000 |
|
Michael A. Kuglin |
|
80% |
|
$ |
360,000 |
|
|
$ |
450,000 |
|
Steven C. Boyd |
|
80% |
|
$ |
368,000 |
|
|
$ |
460,000 |
|
Douglas T. Brinkworth |
|
80% |
|
$ |
320,000 |
|
|
$ |
400,000 |
|
Neil E. Scanlon |
|
80% |
|
$ |
280,000 |
|
|
$ |
350,000 |
|
The Use of Discretion
The Committee retains the right to exercise its broad discretionary powers to decrease or increase the annual cash bonus paid to a particular named executive officer, upon the recommendation of our President and Chief Executive Officer, or to the named executive officers as a group, when the Committee determines that an adjustment is warranted. The Committee did not exercise this authority in fiscal 2023, fiscal 2022 or fiscal 2021.
If the Committee were to exercise its discretionary authority, any such discretionary bonuses provided to our named executive officers would be reported in the column titled “Bonus” in the Summary Compensation table below. The bonus payments earned by our named executive officers under the annual cash bonus plan for fiscal 2023, fiscal 2022 and fiscal 2021 are reported in the column titled “Non-Equity Incentive Plan Compensation” in the Summary Compensation Table below.
At its November 7, 2023 meeting, the Committee approved the following fiscal 2024 target cash bonus opportunities for our named executive officers:
Name |
|
Fiscal 2024 Target |
|
Fiscal 2024 Target |
|
|
Michael A. Stivala |
|
120% |
|
$ |
1,092,000 |
|
Michael A. Kuglin |
|
80% |
|
$ |
396,000 |
|
Steven C. Boyd |
|
80% |
|
$ |
400,000 |
|
Douglas T. Brinkworth |
|
80% |
|
$ |
356,000 |
|
Neil E. Scanlon |
|
80% |
|
$ |
312,000 |
|
Long-Term Incentive Plan
As result of a study completed by WTW, the Committee adopted our 2021 Long-Term Incentive Plan (the “LTIP”) to complement the annual cash bonus plan, which focuses on our short-term performance goals. The LTIP is a cash settled phantom unit plan that is designed to motivate our executive officers to focus on our long-term financial goals and operating and strategic objectives. Under the LTIP, performance is assessed over a three-year measurement period and, as such, at the beginning of each fiscal year, there are three active award cycles. For example, at the beginning of fiscal 2023 the active award cycles included: the fiscal 2021 award, which started at the beginning of fiscal 2021 and ended at the conclusion of fiscal 2023; the fiscal 2022 award, which started at the beginning of fiscal 2022 and will end at the conclusion of fiscal 2024; and the fiscal 2023 award, which started at the beginning of fiscal 2023 and will end at the conclusion of fiscal 2025. In order to determine if a payment is earned under the LTIP, performance is evaluated using two separate measurement components: (i) 75% weight for the fiscal 2021 award and 50% weight for the fiscal 2022 and fiscal 2023 awards based on the level of average distributable cash flow, as defined in the LTIP, of the Partnership over the three-year measurement period
68
(the “Average Distributable Cash Flow”); and (ii) 25% weight for the fiscal 2021 award and 50% weight for the fiscal 2022 and fiscal 2023 awards based on the achievement of certain operating and strategic objectives, set by the Committee, over the three-year measurement period (the “Operating/Strategic Objectives Component”), as further described below.
Performance Conditions for the LTIP
Based on their evaluation of the recommendations by WTW in the benchmarking study, the Committee established a two-component performance metric under the LTIP. For the fiscal 2021 LTIP award, the measurement period of which concluded at the end of our fiscal 2023, the two components are weighted as follows:
When approving an award, at the beginning of that particular award’s three-year measurement period, the Committee will establish a performance scale that will measure the Average Distributable Cash Flow component for the three-year measurement period. The target threshold for each fiscal year’s award cycle will represent a level of Average Distributable Cash Flow that reflects approximately 5% growth compared to a baseline distributable cash flow, or some other target threshold, as determined by the Committee. The following table illustrates the potential payout percentages associated with various levels of Average Distributable Cash Flow for the three-year measurement period of the fiscal 2021 award:
|
|
Average Distributable Cash Flow Performance Scale for the Three-Year Measurement Period (thousands) |
|
|
Payout Percentage |
|
Maximum Threshold |
|
$ |
215,000 |
|
|
150% |
|
|
|
213,000 |
|
|
145% |
|
|
|
211,000 |
|
|
140% |
|
|
|
209,000 |
|
|
135% |
|
|
|
207,000 |
|
|
130% |
|
|
|
205,000 |
|
|
125% |
|
|
|
203,000 |
|
|
120% |
|
|
|
201,000 |
|
|
115% |
|
|
|
199,000 |
|
|
110% |
|
|
|
197,000 |
|
|
105% |
Target Threshold |
|
|
195,000 |
|
|
100% |
|
|
|
191,000 |
|
|
95% |
|
|
|
187,000 |
|
|
90% |
|
|
|
183,000 |
|
|
85% |
|
|
|
179,000 |
|
|
80% |
|
|
|
175,000 |
|
|
75% |
|
|
|
171,000 |
|
|
70% |
|
|
|
167,000 |
|
|
65% |
|
|
|
163,000 |
|
|
60% |
|
|
|
159,000 |
|
|
55% |
Minimum Threshold |
|
$ |
155,000 |
|
|
50% |
The Committee also established specific operating and strategic objectives (“Operating/Strategic Objectives”) for the component of the LTIP that will measure the Partnership’s performance in achieving such Operating/Strategic Objectives for the three-year measurement period. At the end of the three-year measurement period, the Committee will evaluate the Partnership’s performance compared to the Operating/Strategic Objectives set at the beginning of the three-year measurement period to determine the amount, if any, of the Operating/Strategic Objectives component to award. The following are the Operating/Strategic Objectives set by the Committee for the fiscal 2021 award:
69
The Committee will use its discretion regarding how much weight to place on any one, or several, of the Operating/Strategic Objectives in determining the amount to award, if any, of the Operating/Strategic Objectives Component as follows:
|
|
Percentage of Operating/Strategic Objectives Component Earned |
Maximum Threshold |
|
150% |
|
|
125% |
Target Threshold |
|
100% |
|
|
75% |
Minimum Threshold |
|
50% |
At its meeting on November 9, 2021, the Committee approved a modification to the performance conditions of the LTIP, beginning with the fiscal 2022 award, which started at the beginning of fiscal 2022 and will end at the conclusion of fiscal 2024. Specifically, the Committee modified the weighting between the two-component performance metrics under the LTIP awards beginning with the fiscal 2022 award, as follows:
For purposes of the fiscal 2022 award, the same performance scale to measure the Average Distributable Cash Flow component as was in effect for the fiscal 2021 award (as set forth above) was approved. For the Operating/Strategic Objectives component of the fiscal 2022 award, the Committee set the following qualitative items to be evaluated at the end of the three-year measurement period:
For purposes of the fiscal 2023 award, which started at the beginning of fiscal 2023 and will end at the conclusion of fiscal 2025, the Committee established the following performance scale to measure the Average Distributable Cash Flow component for the award’s three-year measurement period.
|
|
Average Distributable Cash Flow Performance Scale for the Three-Year Measurement Period (thousands) |
|
|
Payout Percentage |
|
Maximum Threshold |
|
$ |
222,000 |
|
|
150% |
|
|
|
220,000 |
|
|
145% |
|
|
|
218,000 |
|
|
140% |
|
|
|
216,000 |
|
|
135% |
|
|
|
214,000 |
|
|
130% |
|
|
|
212,000 |
|
|
125% |
|
|
|
210,000 |
|
|
120% |
|
|
|
208,000 |
|
|
115% |
|
|
|
206,000 |
|
|
110% |
|
|
|
204,000 |
|
|
105% |
Target Threshold |
|
|
202,000 |
|
|
100% |
|
|
|
198,000 |
|
|
95% |
|
|
|
194,000 |
|
|
90% |
|
|
|
190,000 |
|
|
85% |
|
|
|
186,000 |
|
|
80% |
|
|
|
182,000 |
|
|
75% |
|
|
|
178,000 |
|
|
70% |
|
|
|
174,000 |
|
|
65% |
|
|
|
170,000 |
|
|
60% |
|
|
|
166,000 |
|
|
55% |
Minimum Threshold |
|
$ |
162,000 |
|
|
50% |
70
For the Operating/Strategic Objectives component of the fiscal 2023 award, the Committee maintained the same qualitative items as set forth above for the fiscal 2022 award.
Grant Process
At the beginning of each fiscal year, LTIP phantom unit awards are granted as a Committee-approved percentage of each named executive officer’s salary. In accordance with the terms of the LTIP, at the beginning of the three-year measurement period for the fiscal 2021 LTIP awards, the number of each named executive officer’s unvested LTIP phantom unit award was calculated by dividing their target LTIP amount (representing 50% of that named executive officer’s target cash bonus under the annual cash bonus plan) by the average of the closing prices of our Common Units for the twenty days preceding the beginning of the three-year measurement period. At its meeting on November 9, 2021, the Committee approved a modification to the LTIP to provide for an increase in the target LTIP amount by increasing the target amount to represent 75% of the named executive officer’s (and certain other executive officers) target cash bonus under the annual cash bonus plan. This increased target amount is effective for the three-year measurement period beginning with the target award for the fiscal 2022 award cycle, which started at the beginning of fiscal 2022 and will end at the conclusion of fiscal 2024.
Cash Payments
For awards granted under the LTIP, our named executive officers, as well as the other LTIP participants (all of whom are key employees), will, at the end of the three-year measurement period, receive cash payments equal to: (i) the quantity of the participant’s unvested phantom units that become vested phantom units at the conclusion of the three-year measurement period based on the applicable percentage earned under the respective plan multiplied by; (ii) the average of the closing prices of our Common Units for the twenty days preceding the conclusion of the three-year measurement period, plus the sum of the distributions that would have inured to one of our outstanding Common Units during the three-year measurement period.
Retirement Provision
The retirement provision applies to all LTIP participants who have been employed by the Partnership for ten years and have attained age 55. A retirement-eligible participant’s outstanding awards under the LTIP will vest as of the retirement-eligible date, but will remain subject to the same three-year measurement period for purposes of determining the eventual cash payment, if any, at the conclusion of the remaining measurement period. Mr. Boyd, Mr. Brinkworth and Mr. Scanlon are our only named executive officers to whom this retirement provision applied at the conclusion of fiscal 2023.
Outstanding Awards under the LTIP
The following are the quantities of unvested LTIP phantom units granted to our named executive officers during fiscal 2023 and fiscal 2022 that will be used to calculate cash payments at the end of the respective award’s three-year measurement period:
|
|
Fiscal 2023 Award |
|
|
Fiscal 2022 Award |
|
||
Michael A. Stivala |
|
|
44,693 |
|
|
|
48,436 |
|
Michael A. Kuglin |
|
|
16,351 |
|
|
|
17,721 |
|
Steven C. Boyd |
|
|
16,715 |
|
|
|
18,114 |
|
Douglas T. Brinkworth |
|
|
14,534 |
|
|
|
15,752 |
|
Neil E. Scanlon |
|
|
12,718 |
|
|
|
13,783 |
|
The grant date values based on the target outcomes of the awards under the LTIP granted during fiscal 2023, fiscal 2022 and fiscal 2021 are reported in the column titled “Unit Awards” in the Summary Compensation Table below.
At its meeting on November 7, 2023, the Committee granted the following quantities of unvested LTIP phantom units to our named executive officers for fiscal 2024. These quantities will be used to calculate cash payments, if earned, at the end of this award’s three-year measurement period (i.e., at the end of fiscal 2026).
Name |
|
Fiscal 2024 Award |
|
|
Michael A. Stivala |
|
|
55,261 |
|
Michael A. Kuglin |
|
|
20,040 |
|
Steven C. Boyd |
|
|
20,242 |
|
Douglas T. Brinkworth |
|
|
18,016 |
|
Neil E. Scanlon |
|
|
15,789 |
|
71
Restricted Unit Plan
At their May 15, 2018 Tri-Annual Meeting, our Unitholders approved the adoption of our 2018 Restricted Unit Plan (the “RUP”). Upon adoption, this plan authorized the issuance of 1,800,000 Common Units to our named executive officers, managers, other employees and to members of our Board of Supervisors. At their May 18, 2021 Tri-Annual Meeting, our Unitholders authorized the issuance of an additional 1,725,000 Common Units under the RUP. At the conclusion of fiscal 2023, there were 704,985 restricted units remaining available under the RUP for future awards.
Grant Process
All restricted unit awards are approved by the Committee. Because individual circumstances differ, the Committee has not adopted a formulaic approach to making restricted unit awards. Although the reasons for granting an award can vary, the general objective of granting an award to a recipient is to retain the services of the recipient over the vesting period while, at the same time, providing the type of motivation that further aligns the long-term interests of the recipient with the long-term interests of our Unitholders. The reasons for which the Committee grants restricted unit awards include, but are not limited to, the following:
In determining the quantity of restricted units to grant to named executive officers and other key employees, the Committee considers, without limitation:
In addition, in establishing the level of restricted units to grant to our named executive officers, the Committee considers the existing level of outstanding unvested restricted unit awards held by our named executive officers.
The Committee generally approves awards under our RUP at its first meeting each fiscal year following the availability of the financial results for the prior fiscal year; however, occasionally the Committee grants awards at other times of the year, particularly when the need arises to grant awards because of promotions and new hires.
When the Committee authorizes an award of restricted units, the unvested units underlying an award do not provide the grantee with voting rights and do not receive distributions or accrue rights to distributions during the vesting period. Upon vesting, restricted units are automatically converted into our Common Units, with full voting rights and rights to receive distributions.
Vesting Schedule
The standard vesting schedule of all of our outstanding RUP awards is one third of each award on each of the first three anniversaries of the award grant date. The Committee retains the ability to deviate, at its discretion, from the normal vesting schedule with respect to particular restricted unit awards, subject to the limitations set forth in the RUP, and described above, with respect to restricted units awarded under that plan. Unvested awards are subject to forfeiture in certain circumstances, as defined in the RUP document. The RUP places a five percent (5%) limit on the number of units then authorized for issuance that may (a) be awarded with a vesting schedule other than the standard vesting schedule, and (b) subject to certain limited exceptions, have their vesting accelerated to a date prior to the twelve-month anniversary of the effective date of their grant.
Outstanding Awards under the RUP
At its November 8, 2022 meeting, the Committee approved a grant of restricted units to each of our named executive officers. In determining these fiscal 2023 awards for our named executive officers, the Committee relied upon information provided by the Mercer benchmarking database and recommendations by WTW to conclude that these awards were necessary to remediate shortfalls perceived by the Committee in the cash compensation opportunities provided by the Partnership to these executives, as well as in recognition of their individual achievements throughout fiscal 2022. The Committee uses restricted unit awards to satisfy a perceived need to balance cash compensation with equity (or non-cash) compensation, and to encourage our named executive officers, and other key employees,
72
to have an equity stake in the Partnership, thereby further aligning the economic interests of our named executive officers with the economic interests of our Unitholders.
The following table summarizes the RUP awards granted to our named executive officers at the Committee’s November 8, 2022 meeting:
Name |
|
Grant Date |
|
Quantity |
|
|
Michael A. Stivala |
|
November 15, 2022 |
|
|
46,448 |
|
Michael A. Kuglin |
|
November 15, 2022 |
|
|
29,336 |
|
Steven C. Boyd |
|
November 15, 2022 |
|
|
29,336 |
|
Douglas T. Brinkworth |
|
November 15, 2022 |
|
|
29,336 |
|
Neil E. Scanlon |
|
November 15, 2022 |
|
|
25,669 |
|
At its November 7, 2023 meeting, the Committee granted the following awards under the RUP to our named executive officers:
Name |
|
Grant Date |
|
Quantity |
|
|
Michael A. Stivala |
|
November 15, 2023 |
|
|
55,523 |
|
Michael A. Kuglin |
|
November 15, 2023 |
|
|
26,445 |
|
Steven C. Boyd |
|
November 15, 2023 |
|
|
29,384 |
|
Douglas T. Brinkworth |
|
November 15, 2023 |
|
|
26,445 |
|
Neil E. Scanlon |
|
November 15, 2023 |
|
|
23,507 |
|
The aggregate grant date fair values of RUP awards made during fiscal 2023, fiscal 2022 and fiscal 2021, computed in accordance with accounting principles generally accepted in the United States of America, are reported in the column titled “Unit Awards” in the Summary Compensation Table below.
Retirement Provisions
The RUP contains retirement provisions that provide for the issuance of Common Units (six months and one day after the retirement date of qualifying participants) relating to unvested awards held by a retiring participant who meets all three of the following conditions on his or her retirement date:
Mr. Boyd, Mr. Brinkworth and Mr. Scanlon are our only named executive officers to whom these retirement provisions applied at the end of fiscal 2023.
2022 Phantom Equity Plan
At its November 8, 2022 meeting, the Committee adopted our 2022 Phantom Equity Plan (the “PEP”) as a component of our long-term compensation, based on an analysis of market practices of different components of total compensation prepared by WTW. The adoption of the PEP was recommended by WTW to provide an additional component of long-term compensation that has similar characteristics of our RUP, but that provides for cash settlement. In adopting the PEP, the Committee’s intent is to provide a reasonable mixture of both cash and non-cash equity-based compensation as components of long-term compensation.
Grant Process
The grant process, and the decision-making process for the granting of phantom equity units, for the PEP are identical to that of our RUP (described above). The Committee will generally approve awards under our PEP at its first meeting each fiscal year following the availability of the financial results for the prior fiscal year; however, the Committee reserves the right to grant awards at other times of the year, particularly when the need arises to grant awards because of promotions and new hires.
Upon vesting, phantom equity units are automatically converted into cash, the value of which is equal to the average of the highest and lowest trading prices of our Common Units on the trading day immediately preceding the date of issuance.
73
Vesting Schedule
The standard vesting schedule of all of our outstanding PEP awards will be one third of each award on each of the first three anniversaries of the award grant date, subject to continuous employment or service from the grant date through the applicable payment date. The Committee retains the ability to deviate, at its discretion, from the normal vesting schedule with respect to particular PEP awards. Unvested awards are subject to forfeiture in certain circumstances, as defined in the PEP document and the applicable award agreements. The change in control vesting provisions under the PEP are described in more detail below.
Outstanding Awards under the PEP
At its November 8, 2022 meeting, in tandem with RUP awards, the Committee approved PEP awards for each of our named executive officers. In determining these fiscal 2023 awards for our named executive officers, the Committee relied upon information provided by the Mercer benchmarking database and recommendations by WTW to conclude that these awards were necessary to remediate shortfalls perceived by the Committee in the cash compensation opportunities provided by the Partnership to these executives, as well as in recognition of their individual achievements throughout fiscal 2022.
The following table summarizes the phantom equity units granted to our named executive officers at the Committee’s November 8, 2022 meeting:
Name |
|
Grant Date |
|
Quantity |
|
|
Michael A. Stivala |
|
November 15, 2022 |
|
|
11,612 |
|
Michael A. Kuglin |
|
November 15, 2022 |
|
|
19,557 |
|
Steven C. Boyd |
|
November 15, 2022 |
|
|
19,557 |
|
Douglas T. Brinkworth |
|
November 15, 2022 |
|
|
19,557 |
|
Neil E. Scanlon |
|
November 15, 2022 |
|
|
17,113 |
|
The following table summarizes the phantom equity units granted to our named executive officers at the Committee’s November 7, 2023 meeting:
Name |
|
Grant Date |
|
Quantity |
|
|
Michael A. Stivala |
|
November 15, 2023 |
|
|
13,881 |
|
Michael A. Kuglin |
|
November 15, 2023 |
|
|
26,445 |
|
Steven C. Boyd |
|
November 15, 2023 |
|
|
29,384 |
|
Douglas T. Brinkworth |
|
November 15, 2023 |
|
|
26,445 |
|
Neil E. Scanlon |
|
November 15, 2023 |
|
|
23,507 |
|
The grant date values based on the target outcomes of the awards under the PEP granted during fiscal 2023 and fiscal 2022 are reported in the column titled “Unit Awards” in the Summary Compensation Table below.
Retirement Provisions
The PEP document contains retirement provisions that provide for the vesting of phantom units six months and one day after the retirement date of qualifying participants who meet all three of the following conditions on his or her retirement date:
Mr. Boyd, Mr. Brinkworth and Mr. Scanlon are our only named executive officers to whom these retirement provisions applied at the end of fiscal 2023.
For those who meet the conditions set forth in the retirement provisions of the PEP, the cash payment shall be equal to the average of the highest and lowest trading prices of our Common Units on the trading day immediately preceding the vesting date.
Distribution Equivalent Rights Plan
At its January 17, 2017 meeting, the Committee adopted a Distribution Equivalent Rights Plan (the “DER Plan”) as a component of executive compensation based on data provided by WTW that indicated a DER Plan aligned with industry norms (77% of other publicly traded partnerships and 92% of a sample of broader energy/utility companies, at that time, provided such plans to their executives in one form or another). The Committee adopted the DER Plan because the cash compensation resulting from the DER Plan
74
would help, in certain instances, to lessen the gap between the total compensation paid to some of our named executive officers and the benchmark compensation data. Additionally, the Committee intends for the DER Plan to provide our named executive officers with a reasonable balance between performance-based and non-performance-based cash opportunities and to assist our named executive officers to obtain funds to settle the taxes on equity-based compensation (i.e., taxes generated when restricted units vest). Most importantly, the Committee believes that this form of compensation further aligns the interests of our named executive officers with the interests of our Unitholders because it provides an incentive for the types of behaviors that lead to distribution sustainability and growth. At their November 8, 2022 meeting, the Committee amended the DER Plan to make unvested phantom units awarded under the PEP eligible for payments under the DER Plan. This became effective with the first distribution that was declared by the Board of Supervisors during calendar year 2023.
The executive officers of the Partnership (as defined in the DER Plan document) are eligible for a distribution equivalent right (“DER”) award under the DER Plan at the discretion of the Committee. Once awarded, a DER entitles the grantee to a cash payment each time our Board of Supervisors declares a cash distribution on our Common Units, but only after such distribution is paid to the Unitholders, which cash payment is equal to the amount calculated by multiplying (A) the number of unvested restricted units that have been previously awarded to the grantee under the RUP plus, beginning with fiscal 2023, the number of unvested phantom units that have been previously awarded to the grantee under the PEP, which are held by the grantee on the record date of the distribution, by (B) the amount of the declared distribution per Common Unit. The form of award agreement under the DER Plan expressly provides that the Committee retains the right to cancel, in whole or in part, any DER after its award, with or without cause. DERs also automatically terminate on the first to occur of: (a) the termination of the grantee’s employment with us or our subsidiary (except for those situations when such termination does not result in the forfeiture of the unvested restricted units then held by the grantee), (b) the vesting, termination or forfeiture of all unvested restricted units under the RUP and unvested phantom units under the PEP then held by the grantee, or (c) the grantee becoming employed by us or our subsidiary in a role other than as an executive officer. Pursuant to the terms of the DER Plan, DERs, and cash payments thereunder, are considered to be “incentive compensation” for purposes of our incentive compensation recoupment policy described below.
At its January 17, 2017 meeting, the Committee granted DERs under the DER Plan to all of our named executive officers. The following table summarizes the DER payments made to our named executive officers during fiscal 2023:
Name |
|
Payment Amount |
|
|
Michael A. Stivala |
|
$ |
156,532 |
|
Michael A. Kuglin |
|
$ |
124,580 |
|
Steven C. Boyd |
|
$ |
124,580 |
|
Douglas T. Brinkworth |
|
$ |
123,275 |
|
Neil E. Scanlon |
|
$ |
112,570 |
|
The DER Plan payments made to our named executive officers during fiscal 2023, fiscal 2022, and fiscal 2021 are reported in the column titled “Non-Equity Incentive Plan Compensation” in the Summary Compensation Table below.
Benefits and Perquisites
Pension Plan
We sponsor a noncontributory defined benefit pension plan that was originally designed to cover all of our eligible employees who met certain criteria relative to age and length of service. Effective January 1, 1998, we amended the plan in order to provide for a cash balance formula rather than the final average pay formula that was in effect prior to January 1, 1998 (the “Cash Balance Plan”). The cash balance formula was designed to evenly spread the growth of a participant’s earned retirement benefit throughout his or her career rather than the final average pay formula, under which a greater portion of a participant’s benefits were earned toward the latter stages of his or her career. Effective January 1, 2000, we amended the Cash Balance Plan to limit participation in this plan to existing participants and no longer admit new participants to the plan. On January 1, 2003, we amended the Cash Balance Plan to cease future service and pay-based credits on behalf of the participants and, from that point on, participants’ benefits have increased only because of interest credits. Of our named executive officers, only Mr. Boyd, Mr. Brinkworth and Mr. Scanlon participate in the Cash Balance Plan.
The changes in the actuarial value, if any, relative to Mr. Boyd’s, Mr. Brinkworth’s and Mr. Scanlon’s participation in the Cash Balance Plan during fiscal 2023, fiscal 2022 and fiscal 2021 are reported in the column titled “Change in Pension Value and Nonqualified Deferred Compensation Earnings” in the Summary Compensation Table below.
Deferred Compensation
All employees, including our named executive officers, who satisfy certain service requirements, are eligible to participate in our IRC Section 401(k) Plan, which we refer to as the “401(k) Plan.” Under the 401(k) Plan, participants may defer a portion of their
75
eligible cash compensation up to the limits established by law. We offer the 401(k) Plan to attract and retain talented employees by providing them with a tax-advantaged opportunity to save for retirement.
For fiscal 2023, fiscal 2022 and fiscal 2021, all of our named executive officers participated in the 401(k) Plan. The benefits provided to our named executive officers under the 401(k) Plan are provided on the same basis as to other exempt employees of the Partnership. Amounts deferred by our named executive officers under the 401(k) Plan during fiscal 2023, fiscal 2022 and fiscal 2021 are included in the column titled “Salary” in the Summary Compensation Table below.
Our 401(k) Plan provides a match of $0.50 for every dollar contributed up to 6% of each participant’s total base pay, up to a maximum compensation limit of $330,000 for calendar year 2023, $305,000 for calendar year 2022, and $290,000 for calendar year 2021. If, however, Actual Adjusted EBITDA is 115% or more than Budgeted EBITDA, each participant will receive a match of $1 for every dollar contributed up to 6% of each participant’s total base pay, up to the applicable maximum compensation limits. For fiscal 2023, fiscal 2022 and fiscal 2021, the performance conditions that provide for more than the $0.50 match were not met.
The matching contributions made on behalf of our named executive officers for fiscal 2023, fiscal 2022 and fiscal 2021 are reported in the column titled “All Other Compensation” in the Summary Compensation Table below.
Other Benefits
Each named executive officer is eligible to participate in all of our other employee benefit plans, such as the medical, dental, group life insurance and disability plans, on the same basis as other exempt employees. These benefit plans are offered to attract and retain talented employees by providing them with competitive benefits.
There are no post-termination or other special rights provided to any named executive officer to participate in these benefit programs other than the right to participate in such plans for a fixed period of time following termination of employment, on the same basis as is provided to other exempt employees, as required by law. Because these plans are offered on the same basis as is provided to other employees, we have not reported the costs of these benefits incurred on behalf of our named executive officers in the Summary Compensation Table below.
Perquisites
Perquisites represent a minor component of our executive officers’ compensation. Each of our named executive officers is eligible for tax preparation services, a company-provided vehicle, and an annual physical.
The following table summarizes both the value and the utilization of these perquisites by our named executive officers in fiscal 2023.
Name |
|
Tax |
|
|
Employer |
|
|
Physical |
|
|||
Michael A. Stivala |
|
$ |
— |
|
|
$ |
20,243 |
|
|
$ |
— |
|
Michael A. Kuglin |
|
$ |
— |
|
|
$ |
21,067 |
|
|
$ |
— |
|
Steven C. Boyd |
|
$ |
3,600 |
|
|
$ |
10,589 |
|
|
$ |
— |
|
Douglas T. Brinkworth |
|
$ |
3,400 |
|
|
$ |
17,623 |
|
|
$ |
3,550 |
|
Neil E. Scanlon |
|
$ |
3,600 |
|
|
$ |
18,745 |
|
|
$ |
3,150 |
|
Perquisite-related costs for fiscal 2023, fiscal 2022 and fiscal 2021 are reported in the column titled “All Other Compensation” in the Summary Compensation Table below.
Severance Benefits
We believe that, in most cases, employees should be paid reasonable severance benefits. Therefore, it is the general policy of the Partnership to provide named executive officers who are terminated by us without cause or who choose to terminate their employment with us for good reason with a severance payment equal to, at a minimum, one year’s base salary, unless circumstances dictate otherwise. This policy was adopted because it may be difficult for former named executive officers to find comparable employment within a short period of time. However, depending upon individual facts and circumstances, particularly the severed employee’s tenure with us and the employee’s level, the Partnership may make exceptions to this general policy.
76
Change of Control
Our executive officers and other key employees have built the Partnership into the successful enterprise that it is today; therefore, we believe that it is important to protect them in the event of a change of control. Further, it is our belief that the interests of our Unitholders will be best served if the interests of our executive officers are aligned with them, and that providing change of control benefits should eliminate, or at least reduce, the reluctance of our executive officers to pursue potential change of control transactions that may be in the best interests of our Unitholders. Additionally, we believe that the severance benefits provided to our executive officers and to our key employees are consistent with market practice and appropriate, both because these benefits are an inducement to accepting employment, and because the executive officers are subject to non-competition and non-solicitation covenants for a period following termination of employment. Therefore, our executive officers and other key employees are provided with severance protection following a change of control, which we refer to as the “Executive Special Severance Plan.” During fiscal 2023, fiscal 2022, and fiscal 2021, our Executive Special Severance Plan covered all of our executive officers, including our named executive officers.
Based on the results of the benchmarking study performed by WTW, at its November 12, 2019 meeting, the Committee approved the Executive Special Severance Plan, which became effective January 1, 2020. The Executive Special Severance Plan is intended to provide double-trigger severance benefits to our named executive officers and certain other senior employees of the Partnership in the event that their employment is terminated by us without “cause” or by the participant for “good reason” (as defined in the Executive Special Severance Plan) during the six-month period prior to, or upon or within the 24-month period following, a change of control (defined as described below). Under the Executive Special Severance Plan, a participant is entitled to receive a lump sum cash payment equal to one fifty-second (1/52nd) of the sum of the participant’s base salary plus target bonus, multiplied by the number of severance weeks available to the participant. The number of severance weeks for each of our named executive officers is 156. In addition to cash severance, participants are also entitled to receive continued health coverage, a pro-rata bonus for the year of termination and outplacement services. Participants must execute a release of claims, inclusive of an 18-month non-competition, non-solicitation and non-disparagement covenant as a condition of receiving severance payments under the plan.
Under the RUP, upon a change of control, without regard to whether a participant’s employment is terminated, all unvested awards granted under the plan will vest immediately and become distributable to the participants. Under the PEP, without regard to whether a participant’s employment is terminated, all unvested phantom awards granted under the plan will vest immediately and the participants shall be paid amounts equal to the number of phantom units held by a particular participant multiplied by the average of the highest and lowest trading prices of our Common Units on the trading day immediately preceding the date on which the change of control occurred. In addition, under the LTIP, upon a change of control and without regard to whether a participant’s employment is terminated, all outstanding, unvested phantom unit awards will vest immediately as if the three-year measurement period for each outstanding award concluded on the date the change of control occurred. Under the LTIP, an amount equal to the cash value of 150% of a participant’s unvested phantom units under the respective outstanding LTIP award, plus a sum equal to 150% of a participant’s unvested LTIP units multiplied by an amount equal to the cumulative, per-Common Unit distribution from the beginning of an unvested award’s three-year measurement period through the date on which a change of control occurred, would become payable to the participant.
For purposes of these benefits, a change of control is deemed to occur, in general, if:
For additional information pertaining to severance payable to our named executive officers following a change of control-related termination, see the tables titled “Potential Payments Upon Termination” below.
Risk Mitigation Policies
Equity Holding Policy
77
Effective April 22, 2010, the Committee adopted an Equity Holding Policy, as amended on November 11, 2015 and November 13, 2018, which established guidelines for the level of Partnership equity holdings that members of the Board and our executive officers are expected to maintain.
The Partnership’s equity holding requirements for the specified positions were as follows during fiscal 2023:
Position |
|
Amount |
Member of the Board of Supervisors |
|
4 x Annual Fee |
President and Chief Executive Officer |
|
5 x Base Salary |
Chief Financial Officer |
|
3 x Base Salary |
Chief Operating Officer |
|
3 x Base Salary |
Senior Vice President |
|
2.5 x Base Salary |
Vice President |
|
1.5 x Base Salary |
Assistant Vice President |
|
1 x Base Salary |
Managing Director |
|
1 x Base Salary |
As of the January 2, 2023 measurement date, all of our executive officers, including our named executive officers, as well as the members of our Board of Supervisors, were in compliance with our Equity Holding Policy.
The Equity Holding Policy can be accessed through a link on our website at www.suburbanpropane.com under the “Investors” tab.
The Partnership also maintains a policy that prohibits our executive officers and our Board of Supervisors from engaging in insider trading or buying or selling hedging instruments or derivative securities, or from otherwise engaging in transactions, that are designed to hedge or offset any decrease in the market value of our equity securities.
Incentive Compensation Recoupment Policy
We have a longstanding Incentive Compensation Recoupment Policy that permits the Committee to seek reimbursement from certain executives of the Partnership of incentive compensation (i.e., payments made pursuant to the annual cash bonus plan, the Long-Term Incentive Plan, the Restricted Unit Plan, the Phantom Equity Plan and the Distribution Equivalent Rights Plan) paid to those executives in connection with any fiscal year for which there is a significant restatement of the published financial statements of the Partnership triggered by a material accounting error, which results in less favorable results than those originally reported. Such reimbursement can be sought from executives even if they were not personally responsible for the restatement. In addition to the foregoing, if the Committee determines that any fraud or intentional misconduct by an executive was a contributing factor to the Partnership having to make a significant restatement, then the Committee is authorized to take appropriate action against such executive, including disciplinary action, up to, and including, termination, and requiring reimbursement of all, or any part, of the compensation paid to that executive in excess of that executive’s base salary; including cancellation of any unvested restricted units.
The Incentive Compensation Recoupment Policy is available on our website at www.suburbanpropane.com under the “Corporate Governance” tab.
Clawback Policy
At its November 7, 2023 meeting, the Committee adopted a Dodd-Frank Clawback Policy that is effective as of December 1, 2023 in response to the SEC having adopted new rules that require stock exchanges to update their listing standards for registrants to adopt compliant clawback rules that were mandated by the Dodd-Frank Wall Street Reform and Consumer Protection Act. Pursuant to this new rule, the NYSE, on which our units are traded, updated its listing standards effective as of October 2, 2023 to require issuers to adopt a clawback policy by December 1, 2023 that standardizes the requirements for the mandatory recovery of incentive-based compensation that is erroneously awarded to executive officers within the past three fiscal years due to material financial misstatements.
The Dodd Frank Clawback Policy is available on our website at www.suburbanpropane.com under the “Corporate Governance” tab.
Report of the Compensation Committee
The Compensation Committee has reviewed and discussed with management this CD&A. Based on its review and discussions with management, the Committee recommended to the Board of Supervisors that this CD&A be included in this Annual Report on Form 10-K for fiscal 2023.
78
The Compensation Committee:
Jane Swift, Chair
Amy Adams
Matthew Chanin
Harold R. Logan, Jr.
ADDITIONAL INFORMATION REGARDING EXECUTIVE COMPENSATION
Summary Compensation Table
The following table sets forth certain information concerning the compensation of each named executive officer during the fiscal years ended September 30, 2023, September 24, 2022 and September 25, 2021:
Name |
|
Year |
|
Salary (1) |
|
|
Bonus (2) |
|
|
Unit Awards (3) |
|
|
Non-Equity |
|
|
Change in |
|
|
All Other Compensation |
|
|
Total |
|
|||||||
(a) |
|
(b) |
|
(c) |
|
|
(d) |
|
|
(e) |
|
|
(g) |
|
|
(h) |
|
|
(i) |
|
|
(j) |
|
|||||||
Michael A. Stivala |
|
2023 |
|
$ |
820,000 |
|
|
$ |
— |
|
|
$ |
1,731,829 |
|
|
$ |
1,386,532 |
|
|
$ |
— |
|
|
$ |
30,143 |
|
|
$ |
3,968,504 |
|
President and Chief Executive Officer |
|
2022 |
|
$ |
820,000 |
|
|
$ |
— |
|
|
$ |
1,671,147 |
|
|
$ |
1,438,291 |
|
|
$ |
— |
|
|
$ |
30,563 |
|
|
$ |
3,960,001 |
|
|
|
2021 |
|
$ |
600,000 |
|
|
$ |
— |
|
|
$ |
1,429,420 |
|
|
$ |
1,055,653 |
|
|
$ |
— |
|
|
$ |
30,174 |
|
|
$ |
3,115,247 |
|
|
|
|
|
|
|
|
|
|
|
|
|
|
|
|
|
|
|
|
|
|
|
|
|
|||||||
Michael A. Kuglin |
|
2023 |
|
$ |
450,000 |
|
|
$ |
— |
|
|
$ |
1,051,371 |
|
|
$ |
574,580 |
|
|
$ |
— |
|
|
$ |
30,967 |
|
|
$ |
2,106,918 |
|
Chief Financial Officer |
|
2022 |
|
$ |
450,000 |
|
|
$ |
— |
|
|
$ |
959,314 |
|
|
$ |
582,975 |
|
|
$ |
— |
|
|
$ |
33,232 |
|
|
$ |
2,025,521 |
|
|
|
2021 |
|
$ |
400,000 |
|
|
$ |
— |
|
|
$ |
858,626 |
|
|
$ |
494,050 |
|
|
$ |
— |
|
|
$ |
26,903 |
|
|
$ |
1,779,579 |
|
|
|
|
|
|
|
|
|
|
|
|
|
|
|
|
|
|
|
|
|
|
|
|
|
|||||||
Steven C. Boyd |
|
2023 |
|
$ |
460,000 |
|
|
$ |
— |
|
|
$ |
1,058,791 |
|
|
$ |
584,580 |
|
|
$ |
— |
|
|
$ |
24,851 |
|
|
$ |
2,128,222 |
|
Chief Operating Officer |
|
2022 |
|
$ |
460,000 |
|
|
$ |
— |
|
|
$ |
966,847 |
|
|
$ |
593,375 |
|
|
$ |
— |
|
|
$ |
22,969 |
|
|
$ |
2,043,191 |
|
|
|
2021 |
|
$ |
400,000 |
|
|
$ |
— |
|
|
$ |
858,626 |
|
|
$ |
494,050 |
|
|
$ |
— |
|
|
$ |
22,194 |
|
|
$ |
1,774,870 |
|
|
|
|
|
|
|
|
|
|
|
|
|
|
|
|
|
|
|
|
|
|
|
|
|
|||||||
Douglas Brinkworth |
|
2023 |
|
$ |
400,000 |
|
|
$ |
— |
|
|
$ |
1,014,285 |
|
|
$ |
523,275 |
|
|
$ |
— |
|
|
$ |
35,235 |
|
|
$ |
1,972,795 |
|
Senior Vice President - |
|
2022 |
|
$ |
400,000 |
|
|
$ |
— |
|
|
$ |
921,635 |
|
|
$ |
527,453 |
|
|
$ |
— |
|
|
$ |
34,664 |
|
|
$ |
1,883,752 |
|
Product Supply, Purchasing and Logistics |
|
2021 |
|
$ |
360,000 |
|
|
$ |
— |
|
|
$ |
794,637 |
|
|
$ |
448,049 |
|
|
$ |
— |
|
|
$ |
32,652 |
|
|
$ |
1,635,338 |
|
|
|
|
|
|
|
|
|
|
|
|
|
|
|
|
|
|
|
|
|
|
|
|
|
|||||||
Neil E. Scanlon |
|
2023 |
|
$ |
350,000 |
|
|
$ |
— |
|
|
$ |
887,503 |
|
|
$ |
462,570 |
|
|
$ |
— |
|
|
$ |
36,157 |
|
|
$ |
1,736,230 |
|
Senior Vice President - |
|
2022 |
|
$ |
350,000 |
|
|
$ |
— |
|
|
$ |
842,618 |
|
|
$ |
470,855 |
|
|
$ |
— |
|
|
$ |
32,734 |
|
|
$ |
1,696,207 |
|
Information Services |
|
2021 |
|
$ |
320,000 |
|
|
$ |
— |
|
|
$ |
774,407 |
|
|
$ |
405,699 |
|
|
$ |
— |
|
|
$ |
33,192 |
|
|
$ |
1,533,298 |
|
79
Plan Name |
|
Mr. Stivala |
|
|
Mr. Kuglin |
|
|
Mr. Boyd |
|
|
Mr. Brinkworth |
|
|
Mr. Scanlon |
|
|||||
2023 |
|
|
|
|
|
|
|
|
|
|
|
|
|
|
|
|||||
RUP |
|
$ |
629,526 |
|
|
$ |
397,602 |
|
|
$ |
397,602 |
|
|
$ |
397,602 |
|
|
$ |
347,903 |
|
PEP |
|
|
190,000 |
|
|
|
320,000 |
|
|
|
320,000 |
|
|
|
320,000 |
|
|
|
280,000 |
|
LTIP |
|
|
912,303 |
|
|
|
333,769 |
|
|
|
341,189 |
|
|
|
296,683 |
|
|
|
259,600 |
|
Total |
|
$ |
1,731,829 |
|
|
$ |
1,051,371 |
|
|
$ |
1,058,791 |
|
|
$ |
1,014,285 |
|
|
$ |
887,503 |
|
2022 |
|
|
|
|
|
|
|
|
|
|
|
|
|
|
|
|||||
RUP |
|
$ |
744,247 |
|
|
$ |
620,202 |
|
|
$ |
620,202 |
|
|
$ |
620,202 |
|
|
$ |
578,864 |
|
LTIP |
|
|
926,900 |
|
|
|
339,112 |
|
|
|
346,645 |
|
|
|
301,433 |
|
|
|
263,754 |
|
Total |
|
$ |
1,671,147 |
|
|
$ |
959,314 |
|
|
$ |
966,847 |
|
|
$ |
921,635 |
|
|
$ |
842,618 |
|
2021 |
|
|
|
|
|
|
|
|
|
|
|
|
|
|
|
|||||
RUP |
|
$ |
1,050,090 |
|
|
$ |
656,315 |
|
|
$ |
656,315 |
|
|
$ |
612,560 |
|
|
$ |
612,560 |
|
LTIP |
|
|
379,330 |
|
|
|
202,311 |
|
|
|
202,311 |
|
|
|
182,077 |
|
|
|
161,847 |
|
Total |
|
$ |
1,429,420 |
|
|
$ |
858,626 |
|
|
$ |
858,626 |
|
|
$ |
794,637 |
|
|
$ |
774,407 |
|
2023 |
|
Mr. Stivala |
|
|
Mr. Kuglin |
|
|
Mr. Boyd |
|
|
Mr. Brinkworth |
|
|
Mr. Scanlon |
|
|||||
Annual Cash Bonus |
|
$ |
1,230,000 |
|
|
$ |
450,000 |
|
|
$ |
460,000 |
|
|
$ |
400,000 |
|
|
$ |
350,000 |
|
DER Payments |
|
|
156,532 |
|
|
|
124,580 |
|
|
|
124,580 |
|
|
|
123,275 |
|
|
|
112,570 |
|
Total |
|
$ |
1,386,532 |
|
|
$ |
574,580 |
|
|
$ |
584,580 |
|
|
$ |
523,275 |
|
|
$ |
462,570 |
|
2022 |
|
Mr. Stivala |
|
|
Mr. Kuglin |
|
|
Mr. Boyd |
|
|
Mr. Brinkworth |
|
|
Mr. Scanlon |
|
|||||
Annual Cash Bonus |
|
$ |
1,279,200 |
|
|
$ |
468,000 |
|
|
$ |
478,400 |
|
|
$ |
416,000 |
|
|
$ |
364,000 |
|
DER Payments |
|
|
159,091 |
|
|
|
114,975 |
|
|
|
114,975 |
|
|
|
111,453 |
|
|
|
106,855 |
|
Total |
|
$ |
1,438,291 |
|
|
$ |
582,975 |
|
|
$ |
593,375 |
|
|
$ |
527,453 |
|
|
$ |
470,855 |
|
2021 |
|
Mr. Stivala |
|
|
Mr. Kuglin |
|
|
Mr. Boyd |
|
|
Mr. Brinkworth |
|
|
Mr. Scanlon |
|
|||||
Annual Cash Bonus |
|
$ |
914,400 |
|
|
$ |
406,400 |
|
|
$ |
406,400 |
|
|
$ |
365,760 |
|
|
$ |
325,120 |
|
DER Payments |
|
|
141,253 |
|
|
|
87,650 |
|
|
|
87,650 |
|
|
|
82,289 |
|
|
|
80,579 |
|
Total |
|
$ |
1,055,653 |
|
|
$ |
494,050 |
|
|
$ |
494,050 |
|
|
$ |
448,049 |
|
|
$ |
405,699 |
|
Fiscal 2023 |
|
|||||||||||||||||||
Type of Compensation |
|
Mr. Stivala |
|
|
Mr. Kuglin |
|
|
Mr. Boyd |
|
|
Mr. Brinkworth |
|
|
Mr. Scanlon |
|
|||||
401(k) Match |
|
$ |
9,900 |
|
|
$ |
9,900 |
|
|
$ |
9,900 |
|
|
$ |
9,900 |
|
|
$ |
9,900 |
|
Value of Annual Physical Examination |
|
|
— |
|
|
|
— |
|
|
|
— |
|
|
|
3,550 |
|
|
|
3,150 |
|
Value of Partnership Provided Vehicles |
|
|
20,243 |
|
|
|
21,067 |
|
|
|
10,589 |
|
|
|
17,623 |
|
|
|
18,745 |
|
Tax Preparation Services |
|
|
— |
|
|
|
— |
|
|
|
3,600 |
|
|
|
3,400 |
|
|
|
3,600 |
|
Cash Balance Plan Administrative Fees |
|
|
— |
|
|
|
— |
|
|
|
762 |
|
|
|
762 |
|
|
|
762 |
|
Total |
|
$ |
30,143 |
|
|
$ |
30,967 |
|
|
$ |
24,851 |
|
|
$ |
35,235 |
|
|
$ |
36,157 |
|
Fiscal 2022 |
|
|||||||||||||||||||
Type of Compensation |
|
Mr. Stivala |
|
|
Mr. Kuglin |
|
|
Mr. Boyd |
|
|
Mr. Brinkworth |
|
|
Mr. Scanlon |
|
|||||
401(k) Match |
|
$ |
9,150 |
|
|
$ |
9,150 |
|
|
$ |
9,150 |
|
|
$ |
9,150 |
|
|
$ |
9,150 |
|
Value of Annual Physical Examination |
|
|
3,150 |
|
|
|
3,150 |
|
|
|
— |
|
|
|
3,550 |
|
|
|
— |
|
Value of Partnership Provided Vehicles |
|
|
18,263 |
|
|
|
20,932 |
|
|
|
9,057 |
|
|
|
18,002 |
|
|
|
18,822 |
|
Tax Preparation Services |
|
|
— |
|
|
|
— |
|
|
|
4,000 |
|
|
|
3,200 |
|
|
|
4,000 |
|
Cash Balance Plan Administrative Fees |
|
|
— |
|
|
|
— |
|
|
|
762 |
|
|
|
762 |
|
|
|
762 |
|
Total |
|
$ |
30,563 |
|
|
$ |
33,232 |
|
|
$ |
22,969 |
|
|
$ |
34,664 |
|
|
$ |
32,734 |
|
Fiscal 2021 |
|
|||||||||||||||||||
Type of Compensation |
|
Mr. Stivala |
|
|
Mr. Kuglin |
|
|
Mr. Boyd |
|
|
Mr. Brinkworth |
|
|
Mr. Scanlon |
|
|||||
401(k) Match |
|
$ |
8,700 |
|
|
$ |
8,700 |
|
|
$ |
8,700 |
|
|
$ |
8,700 |
|
|
$ |
8,700 |
|
Value of Annual Physical Examination |
|
|
3,150 |
|
|
|
— |
|
|
|
— |
|
|
|
3,150 |
|
|
|
3,100 |
|
Value of Partnership Provided Vehicles |
|
|
18,324 |
|
|
|
18,203 |
|
|
|
8,732 |
|
|
|
16,840 |
|
|
|
17,430 |
|
Tax Preparation Services |
|
|
— |
|
|
|
— |
|
|
|
4,000 |
|
|
|
3,200 |
|
|
|
3,200 |
|
Cash Balance Plan Administrative Fees |
|
|
— |
|
|
|
— |
|
|
|
762 |
|
|
|
762 |
|
|
|
762 |
|
Total |
|
$ |
30,174 |
|
|
$ |
26,903 |
|
|
$ |
22,194 |
|
|
$ |
32,652 |
|
|
$ |
33,192 |
|
80
Note: Column (f) was omitted from the Summary Compensation Table because we do not grant options to our employees.
Grants of Plan Based Awards Table for Fiscal 2023
The following table sets forth certain information concerning grants of awards made to each named executive officer during the fiscal year ended September 30, 2023:
|
|
Plan |
|
Grant |
|
Approval |
|
Units Underlying Equity Incentive Plan |
|
|
Estimated Future Payments Under Non-Equity Incentive Plan Awards |
|
|
Estimated Future Payments Under Equity Incentive Plan Awards |
|
|
All Other Stock Awards: Number of Shares of Stock |
|
|
Grant Date Fair Value of Stock and Option |
|
|||||||||||||
Name |
|
Name |
|
Date |
|
Date |
|
Awards (6) |
|
|
Target |
|
|
Maximum |
|
|
Target |
|
|
Maximum |
|
|
or Units |
|
|
Awards (7) |
|
|||||||
(a) |
|
|
|
(b) |
|
|
|
|
|
|
(d) |
|
|
(e) |
|
|
(g) |
|
|
(h) |
|
|
(i) |
|
|
(l) |
|
|||||||
Michael A. Stivala |
|
RUP (1) |
|
15 Nov 22 |
|
8 Nov 22 |
|
|
|
|
|
|
|
|
|
|
|
|
|
|
|
|
|
46,448 |
|
|
$ |
629,526 |
|
|||||
|
|
Bonus (2) |
|
25 Sep 22 |
|
8 Nov 22 |
|
|
|
|
$ |
984,000 |
|
|
$ |
1,525,200 |
|
|
|
|
|
|
|
|
|
|
|
|
|
|||||
|
|
LTIP (3) |
|
25 Sep 22 |
|
8 Nov 22 |
|
|
44,693 |
|
|
|
|
|
|
|
|
$ |
912,303 |
|
|
$ |
1,368,455 |
|
|
|
|
|
|
|
||||
|
|
DER (4) |
|
17 Jan 17 |
|
17 Jan 17 |
|
|
|
|
$ |
156,532 |
|
|
|
|
|
|
|
|
|
|
|
|
|
|
|
|
||||||
|
|
PEP (5) |
|
15 Nov 22 |
|
8 Nov 22 |
|
|
11,612 |
|
|
$ |
190,000 |
|
|
|
|
|
|
|
|
|
|
|
|
|
|
|
|
|||||
|
|
|
|
|
|
|
|
|
|
|
|
|
|
|
|
|
|
|
|
|
|
|
|
|
|
|
|
|||||||
Michael A. Kuglin |
|
RUP (1) |
|
15 Nov 22 |
|
8 Nov 22 |
|
|
|
|
|
|
|
|
|
|
|
|
|
|
|
|
|
29,336 |
|
|
$ |
397,602 |
|
|||||
|
|
Bonus (2) |
|
25 Sep 22 |
|
8 Nov 22 |
|
|
|
|
$ |
360,000 |
|
|
$ |
558,000 |
|
|
|
|
|
|
|
|
|
|
|
|
|
|||||
|
|
LTIP (3) |
|
25 Sep 22 |
|
8 Nov 22 |
|
|
16,351 |
|
|
|
|
|
|
|
|
$ |
333,769 |
|
|
$ |
500,654 |
|
|
|
|
|
|
|
||||
|
|
DER (4) |
|
17 Jan 17 |
|
17 Jan 17 |
|
|
|
|
$ |
124,580 |
|
|
|
|
|
|
|
|
|
|
|
|
|
|
|
|
||||||
|
|
PEP (5) |
|
15 Nov 22 |
|
8 Nov 22 |
|
|
19,557 |
|
|
$ |
320,000 |
|
|
|
|
|
|
|
|
|
|
|
|
|
|
|
|
|||||
|
|
|
|
|
|
|
|
|
|
|
|
|
|
|
|
|
|
|
|
|
|
|
|
|
|
|
|
|||||||
Steven C. Boyd |
|
RUP (1) |
|
15 Nov 22 |
|
8 Nov 22 |
|
|
|
|
|
|
|
|
|
|
|
|
|
|
|
|
|
29,336 |
|
|
$ |
397,602 |
|
|||||
|
|
Bonus (2) |
|
25 Sep 22 |
|
8 Nov 22 |
|
|
|
|
$ |
368,000 |
|
|
$ |
570,400 |
|
|
|
|
|
|
|
|
|
|
|
|
|
|||||
|
|
LTIP (3) |
|
25 Sep 22 |
|
8 Nov 22 |
|
|
16,715 |
|
|
|
|
|
|
|
|
$ |
341,189 |
|
|
$ |
511,784 |
|
|
|
|
|
|
|
||||
|
|
DER (4) |
|
17 Jan 17 |
|
17 Jan 17 |
|
|
|
|
$ |
124,580 |
|
|
|
|
|
|
|
|
|
|
|
|
|
|
|
|
||||||
|
|
PEP (5) |
|
15 Nov 22 |
|
8 Nov 22 |
|
|
19,557 |
|
|
$ |
320,000 |
|
|
|
|
|
|
|
|
|
|
|
|
|
|
|
|
|||||
|
|
|
|
|
|
|
|
|
|
|
|
|
|
|
|
|
|
|
|
|
|
|
|
|
|
|
|
|||||||
Douglas T. Brinkworth |
|
RUP (1) |
|
15 Nov 22 |
|
8 Nov 22 |
|
|
|
|
|
|
|
|
|
|
|
|
|
|
|
|
|
29,336 |
|
|
$ |
397,602 |
|
|||||
|
|
Bonus (2) |
|
25 Sep 22 |
|
8 Nov 22 |
|
|
|
|
$ |
320,000 |
|
|
$ |
496,000 |
|
|
|
|
|
|
|
|
|
|
|
|
|
|||||
|
|
LTIP (3) |
|
25 Sep 22 |
|
8 Nov 22 |
|
|
14,534 |
|
|
|
|
|
|
|
|
$ |
296,683 |
|
|
$ |
445,025 |
|
|
|
|
|
|
|
||||
|
|
DER (4) |
|
17 Jan 17 |
|
17 Jan 17 |
|
|
|
|
$ |
123,275 |
|
|
|
|
|
|
|
|
|
|
|
|
|
|
|
|
||||||
|
|
PEP (5) |
|
15 Nov 22 |
|
8 Nov 22 |
|
|
19,557 |
|
|
$ |
320,000 |
|
|
|
|
|
|
|
|
|
|
|
|
|
|
|
|
|||||
|
|
|
|
|
|
|
|
|
|
|
|
|
|
|
|
|
|
|
|
|
|
|
|
|
|
|
|
|||||||
Neil E. Scanlon |
|
RUP (1) |
|
15 Nov 22 |
|
8 Nov 22 |
|
|
|
|
|
|
|
|
|
|
|
|
|
|
|
|
|
25,669 |
|
|
$ |
347,903 |
|
|||||
|
|
Bonus (2) |
|
25 Sep 22 |
|
8 Nov 22 |
|
|
|
|
$ |
280,000 |
|
|
$ |
434,000 |
|
|
|
|
|
|
|
|
|
|
|
|
|
|||||
|
|
LTIP (3) |
|
25 Sep 22 |
|
8 Nov 22 |
|
|
12,718 |
|
|
|
|
|
|
|
|
$ |
259,600 |
|
|
$ |
389,400 |
|
|
|
|
|
|
|
||||
|
|
DER (4) |
|
17 Jan 17 |
|
17 Jan 17 |
|
|
|
|
$ |
112,570 |
|
|
|
|
|
|
|
|
|
|
|
|
|
|
|
|
||||||
|
|
PEP (5) |
|
15 Nov 22 |
|
8 Nov 22 |
|
|
17,113 |
|
|
$ |
280,000 |
|
|
|
|
|
|
|
|
|
|
|
|
|
|
|
|
|||||
81
Note: Columns (j) and (k) were omitted from the Grants of Plan Based Awards Table because we do not award options to our employees.
Outstanding Equity Awards at Fiscal Year End 2023 Table
The following table sets forth certain information concerning outstanding equity awards under our RUP, LTIP and PEP unit awards for each named executive officer as of September 30, 2023:
Stock Awards |
|
|||||||||||||||
Name |
|
Number of |
|
|
Market Value of |
|
|
Equity Incentive |
|
|
Equity Incentive |
|
||||
(a) |
|
(g) |
|
|
(h) |
|
|
(i) |
|
|
(j) |
|
||||
Michael A. Stivala |
|
|
108,797 |
|
|
$ |
1,728,240 |
|
|
|
104,741 |
|
|
$ |
1,927,879 |
|
Michael A. Kuglin |
|
|
76,274 |
|
|
$ |
1,211,612 |
|
|
|
53,629 |
|
|
$ |
948,518 |
|
Steven C. Boyd |
|
|
76,274 |
|
|
$ |
1,211,612 |
|
|
|
54,386 |
|
|
$ |
962,681 |
|
Douglas T. Brinkworth |
|
|
75,270 |
|
|
$ |
1,195,664 |
|
|
|
49,843 |
|
|
$ |
877,633 |
|
Neil E. Scanlon |
|
|
69,479 |
|
|
$ |
1,103,674 |
|
|
|
43,614 |
|
|
$ |
767,952 |
|
The following is a schedule of when the RUP awards reported in column (g) above will vest:
Name |
|
Number of RUP |
|
|
Number That |
|
|
Number That |
|
|
Number That |
|
||||
Michael A. Stivala |
|
|
108,797 |
|
|
|
58,706 |
|
|
|
34,609 |
|
|
|
15,482 |
|
Michael A. Kuglin |
|
|
76,274 |
|
|
|
40,779 |
|
|
|
25,717 |
|
|
|
9,778 |
|
Steven C. Boyd |
|
|
76,274 |
|
|
|
40,779 |
|
|
|
25,717 |
|
|
|
9,778 |
|
Douglas T. Brinkworth |
|
|
75,270 |
|
|
|
39,775 |
|
|
|
25,717 |
|
|
|
9,778 |
|
Neil E. Scanlon |
|
|
69,479 |
|
|
|
37,490 |
|
|
|
23,434 |
|
|
|
8,555 |
|
82
|
|
Mr. Stivala |
|
|
Mr. Kuglin |
|
|
Mr. Boyd |
|
|
Mr. Brinkworth |
|
|
Mr. Scanlon |
|
|||||
Fiscal 2023 Phantom LTIP Units |
|
|
44,693 |
|
|
|
16,351 |
|
|
|
16,715 |
|
|
|
14,534 |
|
|
|
12,718 |
|
Value of Fiscal 2023 Phantom Units |
|
$ |
662,373 |
|
|
$ |
242,340 |
|
|
$ |
247,725 |
|
|
$ |
215,401 |
|
|
$ |
188,487 |
|
Estimated Distributions over Measurement |
|
$ |
174,303 |
|
|
$ |
63,769 |
|
|
$ |
65,189 |
|
|
$ |
56,683 |
|
|
$ |
49,600 |
|
|
|
|
|
|
|
|
|
|
|
|
|
|
|
|
|
|||||
Fiscal 2022 Phantom LTIP Units |
|
|
48,436 |
|
|
|
17,721 |
|
|
|
18,114 |
|
|
|
15,752 |
|
|
|
13,783 |
|
Value of Fiscal 2022 Phantom Units |
|
$ |
717,846 |
|
|
$ |
262,634 |
|
|
$ |
268,459 |
|
|
$ |
233,453 |
|
|
$ |
204,271 |
|
Estimated Distributions over Measurement |
|
$ |
188,900 |
|
|
$ |
69,112 |
|
|
$ |
70,645 |
|
|
$ |
61,433 |
|
|
$ |
53,754 |
|
The amounts reported in this column also include the estimated future target payout of phantom equity unit awards granted under the PEP. These amounts were computed by multiplying phantom equity units included in column (i) by the average of the highest and lowest trading prices of our Common Units on September 29, 2023, the last trading day of our fiscal year. Because of the variability of the trading prices of our Common Units, actual payments may vary. The following charts provide a schedule of the phantom equity units and the dates on which they will vest:
Name |
|
Number of PEP |
|
|
Value of Phantom Equity Plan Units on September 30, 2023 |
|
||
Michael A. Stivala |
|
|
11,612 |
|
|
$ |
184,457 |
|
Michael A. Kuglin |
|
|
19,557 |
|
|
$ |
310,663 |
|
Steven C. Boyd |
|
|
19,557 |
|
|
$ |
310,663 |
|
Douglas T. Brinkworth |
|
|
19,557 |
|
|
$ |
310,663 |
|
Neil E. Scanlon |
|
|
17,113 |
|
|
$ |
271,840 |
|
Name |
|
Number of PEP |
|
|
Number That |
|
|
Number That |
|
|
Number That |
|
||||
Michael A. Stivala |
|
|
11,612 |
|
|
|
3,871 |
|
|
|
3,871 |
|
|
|
3,870 |
|
Michael A. Kuglin |
|
|
19,557 |
|
|
|
6,519 |
|
|
|
6,519 |
|
|
|
6,519 |
|
Steven C. Boyd |
|
|
19,557 |
|
|
|
6,519 |
|
|
|
6,519 |
|
|
|
6,519 |
|
Douglas T. Brinkworth |
|
|
19,557 |
|
|
|
6,519 |
|
|
|
6,519 |
|
|
|
6,519 |
|
Neil E. Scanlon |
|
|
17,113 |
|
|
|
5,705 |
|
|
|
5,705 |
|
|
|
5,703 |
|
Note: Columns (b), (c), (d), (e) and (f), all of which are for the reporting of option-related compensation, have been omitted from the “Outstanding Equity Awards at Fiscal Year End 2023 Table” because we do not grant options to our employees.
Equity Vested Table for Fiscal 2023
Awards under the RUP are settled in Common Units upon vesting. Awards under the LTIP, a phantom unit plan, and the PEP are settled in cash. The following two tables set forth certain information concerning the vesting of awards under our RUP (the first vesting
83
of PEP awards will occur in fiscal 2024) and the vesting of the fiscal 2021 award under our LTIP for each named executive officer during the fiscal year ended September 30, 2023:
Restricted Unit Plan |
|
|||||||
|
|
Unit Awards |
|
|||||
Name |
|
Number of |
|
|
Value Realized on |
|
||
Michael A. Stivala |
|
|
60,029 |
|
|
$ |
954,461 |
|
Michael A. Kuglin |
|
|
41,504 |
|
|
$ |
659,914 |
|
Steven C. Boyd |
|
|
41,504 |
|
|
$ |
659,914 |
|
Douglas T. Brinkworth |
|
|
39,799 |
|
|
$ |
632,804 |
|
Neil E. Scanlon |
|
|
38,386 |
|
|
$ |
610,337 |
|
Long-Term Incentive Plan - Fiscal 2021 Award (2) |
|
|||||||
|
|
Cash Awards |
|
|||||
Name |
|
Number of |
|
|
Value Realized on |
|
||
Michael A. Stivala |
|
|
22,036 |
|
|
$ |
426,280 |
|
Michael A. Kuglin |
|
|
11,753 |
|
|
$ |
227,359 |
|
Steven C. Boyd |
|
|
11,753 |
|
|
$ |
227,359 |
|
Douglas T. Brinkworth |
|
|
10,577 |
|
|
$ |
204,609 |
|
Neil E. Scanlon |
|
|
9,402 |
|
|
$ |
133,924 |
|
84
Retirement Benefits Table for Fiscal 2023
The following table sets forth certain information concerning each plan that provides for payments or other benefits at, following, or in connection with retirement for each named executive officer as of the end of the fiscal year ended September 30, 2023:
Name |
|
Plan Name |
|
Number of Years Credited Service |
|
Present Value of Accumulated Benefit |
|
|
Payments During Last Fiscal Year |
|
||
Michael A. Stivala (1) |
|
N/A |
|
N/A |
|
$ |
— |
|
|
$ |
— |
|
|
|
|
|
|
|
|
|
|
|
|
||
Michael A. Kuglin (1) |
|
N/A |
|
N/A |
|
$ |
— |
|
|
$ |
— |
|
|
|
|
|
|
|
|
|
|
|
|
||
Steven C. Boyd |
|
Cash Balance Plan (2) |
|
15 |
|
$ |
244,588 |
|
|
$ |
— |
|
|
|
LTIP (3) |
|
N/A |
|
$ |
652,016 |
|
|
$ |
— |
|
|
|
RUP (4) |
|
N/A |
|
$ |
745,610 |
|
|
$ |
— |
|
|
|
PEP (5) |
|
|
|
$ |
— |
|
|
$ |
— |
|
|
|
|
|
|
|
|
|
|
|
|
||
Douglas T. Brinkworth |
|
Cash Balance Plan (2) |
|
6 |
|
$ |
159,164 |
|
|
$ |
— |
|
|
|
LTIP (3) |
|
N/A |
|
$ |
566,970 |
|
|
$ |
— |
|
|
|
RUP (4) |
|
N/A |
|
$ |
729,662 |
|
|
$ |
— |
|
|
|
PEP (5) |
|
|
|
$ |
— |
|
|
$ |
— |
|
|
|
|
|
|
|
|
|
|
|
|
||
Neil E. Scanlon |
|
Cash Balance Plan (2) |
|
6 |
|
$ |
119,481 |
|
|
$ |
— |
|
|
|
LTIP (3) |
|
N/A |
|
$ |
496,112 |
|
|
$ |
— |
|
|
|
RUP (4) |
|
N/A |
|
$ |
695,922 |
|
|
$ |
— |
|
|
|
PEP (5) |
|
|
|
$ |
— |
|
|
$ |
— |
|
85
Potential Payments Upon Termination
The following table sets forth certain information containing potential payments to the named executive officers in accordance with the provisions of the Executive Special Severance Plan, the LTIP, the RUP and the PEP for the circumstances listed in the table assuming a September 30, 2023 termination date. For more information on severance and change of control payments, refer to the subheadings “Severance Benefits” and “Change of Control” above.
Executive Payments and Benefits Upon Termination |
|
Death |
|
|
Disability |
|
|
Involuntary Termination Without Cause by the Partnership or by the Executive for Good Reason without a Change of Control Event |
|
|
Involuntary Termination Without Cause by the Partnership or by the Executive for Good Reason with a Change of Control Event |
|
||||
Michael A. Stivala |
|
|
|
|
|
|
|
|
|
|
|
|
||||
Cash Severance Compensation (1) (2) (3) (4) |
|
$ |
— |
|
|
$ |
— |
|
|
$ |
820,000 |
|
|
$ |
5,412,000 |
|
Accelerated Vesting of Fiscal 2023, 2022 and |
|
|
— |
|
|
|
— |
|
|
|
— |
|
|
|
2,962,689 |
|
Accelerated Vesting of Outstanding RUP Awards (6) |
|
|
1,728,240 |
|
|
|
1,728,240 |
|
|
|
— |
|
|
|
1,728,240 |
|
Accelerated Vesting of Outstanding PEP Awards (7) |
|
|
184,457 |
|
|
|
184,457 |
|
|
|
— |
|
|
|
184,457 |
|
Medical Benefits (3) |
|
|
— |
|
|
|
— |
|
|
|
31,025 |
|
|
|
46,538 |
|
Total |
|
$ |
1,912,697 |
|
|
$ |
1,912,697 |
|
|
$ |
851,025 |
|
|
$ |
10,333,924 |
|
|
|
|
|
|
|
|
|
|
|
|
|
|
||||
Michael A. Kuglin |
|
|
|
|
|
|
|
|
|
|
|
|
||||
Cash Severance Compensation (1) (2) (3) (4) |
|
$ |
— |
|
|
$ |
— |
|
|
$ |
450,000 |
|
|
$ |
2,430,000 |
|
Accelerated Vesting of Fiscal 2023, 2022 and |
|
|
— |
|
|
|
— |
|
|
|
— |
|
|
|
1,187,153 |
|
Accelerated Vesting of Outstanding RUP Awards (6) |
|
|
1,211,612 |
|
|
|
1,211,612 |
|
|
|
— |
|
|
|
1,211,612 |
|
Accelerated Vesting of Outstanding PEP Awards (7) |
|
|
310,663 |
|
|
|
310,663 |
|
|
|
— |
|
|
|
310,663 |
|
Medical Benefits (3) |
|
|
— |
|
|
|
— |
|
|
|
27,455 |
|
|
|
41,183 |
|
Total |
|
$ |
1,522,275 |
|
|
$ |
1,522,275 |
|
|
$ |
477,455 |
|
|
$ |
5,180,611 |
|
|
|
|
|
|
|
|
|
|
|
|
|
|
||||
Steven C. Boyd |
|
|
|
|
|
|
|
|
|
|
|
|
||||
Cash Severance Compensation (1) (2) (3) (4) |
|
$ |
— |
|
|
$ |
— |
|
|
$ |
460,000 |
|
|
$ |
2,484,000 |
|
Accelerated Vesting of Fiscal 2023, 2022 and |
|
|
— |
|
|
|
— |
|
|
|
— |
|
|
|
1,206,224 |
|
Accelerated Vesting of Outstanding RUP Awards (6) |
|
|
1,211,612 |
|
|
|
1,211,612 |
|
|
|
745,610 |
|
|
|
1,211,612 |
|
Accelerated Vesting of Outstanding PEP Awards (7) |
|
|
310,663 |
|
|
|
310,663 |
|
|
|
— |
|
|
|
310,663 |
|
Medical Benefits (3) |
|
|
— |
|
|
|
— |
|
|
|
28,325 |
|
|
|
42,488 |
|
Total |
|
$ |
1,522,275 |
|
|
$ |
1,522,275 |
|
|
$ |
1,233,935 |
|
|
$ |
5,254,987 |
|
|
|
|
|
|
|
|
|
|
|
|
|
|
||||
Douglas T. Brinkworth |
|
|
|
|
|
|
|
|
|
|
|
|
||||
Cash Severance Compensation (1) (2) (3) (4) |
|
$ |
— |
|
|
$ |
— |
|
|
$ |
400,000 |
|
|
$ |
2,160,000 |
|
Accelerated Vesting of Fiscal 2023, 2022 and |
|
|
— |
|
|
|
— |
|
|
|
— |
|
|
|
1,058,874 |
|
Accelerated Vesting of Outstanding RUP Awards (6) |
|
|
1,195,664 |
|
|
|
1,195,664 |
|
|
|
729,662 |
|
|
|
1,195,664 |
|
Accelerated Vesting of Outstanding PEP Awards (7) |
|
|
310,663 |
|
|
|
310,663 |
|
|
|
— |
|
|
|
310,663 |
|
Medical Benefits (3) |
|
|
— |
|
|
|
— |
|
|
|
27,875 |
|
|
|
41,813 |
|
Total |
|
$ |
1,506,327 |
|
|
$ |
1,506,327 |
|
|
$ |
1,157,537 |
|
|
$ |
4,767,014 |
|
|
|
|
|
|
|
|
|
|
|
|
|
|
||||
Neil E. Scanlon |
|
|
|
|
|
|
|
|
|
|
|
|
||||
Cash Severance Compensation (1) (2) (3) (4) |
|
$ |
— |
|
|
$ |
— |
|
|
$ |
350,000 |
|
|
$ |
1,890,000 |
|
Accelerated Vesting of Fiscal 2023, 2022 and |
|
|
— |
|
|
|
— |
|
|
|
— |
|
|
|
930,649 |
|
Accelerated Vesting of Outstanding RUP Awards (6) |
|
|
1,103,674 |
|
|
|
1,103,674 |
|
|
|
695,922 |
|
|
|
1,103,674 |
|
Accelerated Vesting of Outstanding PEP Awards (7) |
|
|
271,840 |
|
|
|
271,840 |
|
|
|
— |
|
|
|
271,840 |
|
Medical Benefits (3) |
|
|
— |
|
|
|
— |
|
|
|
27,500 |
|
|
|
41,250 |
|
Total |
|
$ |
1,375,514 |
|
|
$ |
1,375,514 |
|
|
$ |
1,073,422 |
|
|
$ |
4,237,413 |
|
86
In the event of death, the inability to continue employment because of permanent disability, or a termination without cause or a good reason resignation unconnected to a change of control event, awards will vest in accordance with the normal vesting schedule and will be subject to the same requirements as awards held by individuals still employed by us and will be subject to the same risks as awards held by all other participants.
Under circumstances unrelated to a change of control, if a RUP award recipient’s employment is terminated without cause or he or she resigns for good reason, any unvested restricted unit awards held by such recipient will be forfeited. Because some of Mr. Boyd’s, Mr. Brinkworth’s and Mr. Scanlon’s unvested awards were subject to the retirement provisions on the last day of fiscal 2023, if Mr. Boyd, Mr. Brinkworth or Mr. Scanlon had been terminated without cause on September 30, 2023, 46,938 of Mr. Boyd’s, 45,934 of Mr. Brinkworth’s and 43,810 of Mr. Scanlon’s awards would have vested in accordance with the retirement provisions of the RUP.
In the event of a change of control, as defined in the 2018 Restricted Unit Plan document, all unvested RUP awards will vest immediately on the date the change of control is consummated, regardless of the holding period and regardless of whether the recipient’s employment is terminated.
CEO PAY RATIO
As required by Section 953(b) of the Dodd-Frank Wall Street Reform and Consumer Protection Act, and SEC rules, we are providing the following information about the relationship of the annual total compensation of our employees and the annual total compensation of Mr. Stivala, our President and Chief Executive Officer (the “CEO”):
87
For fiscal 2023, our last completed fiscal year:
Based on this information, for fiscal 2023, the ratio of the annual total compensation of Mr. Stivala, our President and Chief Executive Officer, to the median of the annual total compensation of all employees was estimated to be 66 to 1.
This pay ratio is a reasonable estimate calculated in a manner consistent with Item 402(u) of Regulation S-K based on our payroll and employment records and the methodology described below. The SEC rules for identifying the median compensated employee and calculating the pay ratio based on that employee’s annual total compensation allow companies to adopt a variety of methodologies, to apply certain exclusions, and to make reasonable estimates and assumptions that reflect their compensation practices. As such, the pay ratio reported by other companies may not be comparable to the pay ratio reported above, as other companies may have different employment and compensation practices and may utilize different methodologies, exclusions, estimates and assumptions in calculating their own pay ratios.
To identify the median of the annual total compensation of all our employees, as well as to determine the annual total compensation of the “median employee,” the methodology and the material assumptions, adjustments, and estimates that we used were as follows:
We determined that, as of August 15, 2023, our employee population consisted of approximately 3,376 individuals. We selected August 15, 2023, which is within the last three months of fiscal 2023, as the date upon which we would identify the “median employee” to allow sufficient time to identify the median employee.
To identify the “median employee” from our employee population, we collected all W-2 wages paid to each employee during the twelve-month period ending on August 15, 2023. This included each employee’s actual base salary and any overtime, any cash bonuses, the value of any RUP awards that vested during the period, and any other miscellaneous forms of W-2-related compensation added to our employees’ earnings record during the period. In making this determination, we annualized the salaries of all newly hired permanent employees during this period.
After we identified our median employee, we calculated such employee’s annual total compensation for fiscal 2023 utilizing the same methodology used to determine the CEO’s compensation, resulting in annual total compensation of $60,543.
PAY VERSUS PERFORMANCE
As a result of the rules adopted by the SEC under the Dodd-Frank Wall Street Reform and Consumer Protection Act and Item 402(v) of Regulation S-K (“PvP Rules”), we are providing the following information regarding the relationship between “compensation actually paid” to our President and Chief Executive Officer (our Principal Executive Officer or “PEO”) and average “compensation actually paid” to our other named executive officers (our “Non-PEO NEOs”) and certain metrics of our financial performance for the last years, in each case, calculated in accordance with the PvP Rules. Pursuant to the PVP Rules, in determining the “compensation actually paid” to our named executive officers, we are required to make various adjustments to amounts that have been reported in the Summary Compensation Table for those fiscal years. The term “compensation actually paid” refers to the definition of such term under the PvP Rules and does not reflect compensation actually earned, realized, or received by our named executive officers. The table below summarizes compensation values previously reported in our Summary Compensation Table and the adjusted values required in this section for fiscal years 2023, 2022, and 2021. Note that compensation for Non-PEO NEOs is reported as an average.
Pay Versus Performance |
|
|||||||||||||||||||||||||||||||
|
|
|
|
|
|
|
|
|
|
|
|
|
|
Value of Initial Fixed $100 Investment Based Made on September 26, 2020 (3): |
|
|
|
|
|
|
|
|||||||||||
Year |
|
Summary Compensation Table Total for Mike Stivala, our PEO |
|
|
Compensation Actually Paid to Mike Stivala, Our PEO (1) |
|
|
Average Summary Compensation Table Total for Our Non-PEO Named Executive Officers (2) |
|
|
Average Compensation Actually Paid to Our Non-PEO Named Executive Officers (1) |
|
|
Suburban Propane Partners, LP Total Unitholder Return |
|
|
Alerian MLP Index Total Shareholder Return |
|
|
Net Income/(Loss) |
|
|
Partnership Adjusted EBITDA (in Thousands) (4) |
|
||||||||
2023 |
|
$ |
3,968,504 |
|
|
$ |
3,692,734 |
|
|
$ |
1,986,041 |
|
|
$ |
1,925,749 |
|
|
$ |
37.86 |
|
|
$ |
133.07 |
|
|
$ |
123,752 |
|
|
$ |
275,025 |
|
2022 |
|
$ |
3,960,001 |
|
|
$ |
4,414,143 |
|
|
$ |
1,912,168 |
|
|
$ |
2,171,310 |
|
|
$ |
25.33 |
|
|
$ |
85.85 |
|
|
$ |
139,708 |
|
|
$ |
291,026 |
|
2021 |
|
$ |
3,115,247 |
|
|
$ |
3,381,847 |
|
|
$ |
1,680,771 |
|
|
$ |
1,824,677 |
|
|
$ |
10.68 |
|
|
$ |
68.97 |
|
|
$ |
122,793 |
|
|
$ |
275,680 |
|
88
Year |
|
PEO |
|
Non-PEO NEO |
|
Non-PEO NEO |
|
Non-PEO NEO |
|
Non-PEO NEO |
2023 |
|
M. Stivala |
|
M. Kuglin |
|
S. Boyd |
|
D. Brinkworth |
|
N. Scanlon |
2022 |
|
M. Stivala |
|
M. Kuglin |
|
S. Boyd |
|
D. Brinkworth |
|
N. Scanlon |
2021 |
|
M. Stivala |
|
M. Kuglin |
|
S. Boyd |
|
D. Brinkworth |
|
N. Scanlon |
89
“Compensation Actually Paid” to our named executive officers represents the “Total” compensation in the Summary Compensation Table for the applicable fiscal year, as adjusted as follows:
|
|
Fiscal 2023 |
|
|
Fiscal 2022 |
|
|
Fiscal 2021 |
|
|||||||||||||||
Adjustment |
|
PEO |
|
|
Average for Non-PEO Named Executive Officers |
|
|
PEO |
|
|
Average for Non-PEO Named Executive Officers |
|
|
PEO |
|
|
Average for Non-PEO Named Executive Officers |
|
||||||
Deduction for amounts reported under the “Unit Awards” column of the Summary Compensation Table |
|
$ |
(1,731,829 |
) |
|
$ |
(1,002,988 |
) |
|
$ |
(1,671,147 |
) |
|
$ |
(922,604 |
) |
|
$ |
(1,429,420 |
) |
|
$ |
(821,574 |
) |
Deduction for change in the actuarial present values reported under the “Change in Pension Value” column of the Summary Compensation Table. (a) |
|
$ |
— |
|
|
$ |
— |
|
|
$ |
— |
|
|
$ |
— |
|
|
$ |
— |
|
|
$ |
— |
|
Change in value of RUP awards granted during prior fiscal year that vested during this fiscal year, determined as of the vesting date. (b) |
|
$ |
11,406 |
|
|
$ |
7,657 |
|
|
$ |
28,985 |
|
|
$ |
17,221 |
|
|
$ |
109,125 |
|
|
$ |
65,983 |
|
Change of ASC 718 fair value of LTIP awards granted during prior fiscal years that vested during this fiscal year, determined as of the vesting date. (c) |
|
$ |
(56,157 |
) |
|
$ |
(26,026 |
) |
|
$ |
49,933 |
|
|
$ |
24,634 |
|
|
$ |
65,359 |
|
|
$ |
32,443 |
|
Change of ASC 718 fair value of PEP awards granted during prior fiscal years that vested during this fiscal year, determined as of the vesting date. (d) |
|
$ |
— |
|
|
$ |
— |
|
|
$ |
— |
|
|
$ |
— |
|
|
$ |
— |
|
|
$ |
— |
|
Year-end ASC 718 fair value of RUP awards granted during this fiscal year. (e) |
|
$ |
670,710 |
|
|
$ |
410,336 |
|
|
$ |
830,703 |
|
|
$ |
680,713 |
|
|
$ |
976,117 |
|
|
$ |
589,745 |
|
Year-end ASC 718 fair value of LTIP awards granted during this fiscal year. (f) |
|
$ |
717,249 |
|
|
$ |
243,089 |
|
|
$ |
992,181 |
|
|
$ |
334,766 |
|
|
$ |
403,555 |
|
|
$ |
199,090 |
|
Year-end ASC 781 fair value of PEP awards granted during this fiscal year. (g) |
|
$ |
184,457 |
|
|
$ |
300,957 |
|
|
$ |
— |
|
|
$ |
— |
|
|
$ |
— |
|
|
$ |
— |
|
Change of ASC 718 fair value of RUP awards granted during prior fiscal years, that remained outstanding at the end of this fiscal year. (e) |
|
$ |
77,171 |
|
|
$ |
56,754 |
|
|
$ |
144,605 |
|
|
$ |
87,175 |
|
|
$ |
84,524 |
|
|
$ |
49,931 |
|
Change of ACS 718 fair value of LTIP awards granted during prior fiscal years, that remained outstanding at the end of this fiscal year. (h) |
|
$ |
(148,777 |
) |
|
$ |
(50,071 |
) |
|
$ |
78,882 |
|
|
$ |
37,237 |
|
|
$ |
57,340 |
|
|
$ |
28,288 |
|
Change of ACS fair 718 of PEP awards granted during prior fiscal years, that remained outstanding at the end of this fiscal year. (d) |
|
$ |
— |
|
|
$ |
— |
|
|
$ |
— |
|
|
$ |
— |
|
|
$ |
— |
|
|
$ |
— |
|
Total Adjustments |
|
$ |
(275,770 |
) |
|
$ |
(60,292 |
) |
|
$ |
454,142 |
|
|
$ |
259,142 |
|
|
$ |
266,600 |
|
|
$ |
143,906 |
|
90
Fiscal Year |
|
Vesting Date Value |
|
|
2023 |
|
$ |
15.90 |
|
2022 |
|
$ |
15.31 |
|
2021 |
|
$ |
16.65 |
|
Fiscal Year |
|
Fiscal Year During Which Award was Granted |
|
Vesting Date Value |
|
|
Percentage Applied to Market Value Based on Financial Performance Over Three-Year Measurement Period |
|
Percentage Earned Based on Scorecard Goal Attainment |
|
2023 |
|
2021 |
|
$ |
14.82 |
|
|
105% |
|
100% |
2022 |
|
2020 |
|
$ |
16.51 |
|
|
110% |
|
N/A |
2021 |
|
2019 |
|
$ |
15.24 |
|
|
150% |
|
N/A |
Fiscal Year |
|
Fiscal Year in Which the Measurement Period for this Year’s Award will End |
|
Per Phantom Unit Fair Value at the End of the Fiscal Year Reported |
|
|
2023 |
|
2025 |
|
$ |
14.82 |
|
2022 |
|
2024 |
|
$ |
16.51 |
|
2021 |
|
2023 |
|
$ |
15.24 |
|
91
Fiscal Year |
|
Fiscal Year During Which Outstanding Award Granted in a Prior Fiscal Year Remained Outstanding at the End of this Fiscal Year was Granted |
|
Value at the End of this Fiscal Year |
|
|
Percentage that Would Be Applied to Market Value Based on Financial Performance if the End of this Fiscal Year Had Been the End of the Three-Year Measurement Period |
|
Percentage Earned Based on Scorecard Goal Attainment if the End of this Fiscal Year Had Been the End of the Three-Year Measurement Period |
|
2023 |
|
2022 |
|
$ |
14.82 |
|
|
100% |
|
100% |
2022 |
|
2021 |
|
$ |
16.51 |
|
|
120% |
|
100% |
2021 |
|
2020 |
|
$ |
15.24 |
|
|
104% |
|
N/A |
For the fiscal year ended September 30, 2023, the most important financial performance measures used to link compensation actually paid to our named executive officers to company performance are Adjusted EBITDA, distributable cash flow, and total unitholder return. Payments under our Annual Cash Bonus Plan were determined, for the most part, by Adjusted EBITDA; LTIP payments were determined, for the most part, by distributable cash flow; and the value of compensation realized by our named executive officers when they are issued Common Units when their restricted units vest is inextricably linked to the performance of our Common Units.
Important Financial Performance Measures |
Adjusted EBITDA |
Distributable Cash Flow |
Total Unitholder Return |
The following graph compares the compensation actually paid to our PEO and the average of the compensation actually paid to our remaining named executive officers with our Adjusted EBITDA.
Compensation Actually Paid Versus Adjusted EBITDA |
|
|||||||||||
|
|
Fiscal 2021 |
|
|
Fiscal 2022 |
|
|
Fiscal 2023 |
|
|||
Compensation Actually Paid to PEO |
|
$ |
3,381,847 |
|
|
$ |
4,414,143 |
|
|
$ |
3,692,734 |
|
Average Compensation Actually Paid to Non-PEO named executive officers |
|
$ |
1,824,677 |
|
|
$ |
2,171,310 |
|
|
$ |
1,925,749 |
|
Adjusted EBITDA (in millions $) |
|
$ |
276 |
|
|
$ |
291 |
|
|
$ |
275 |
|
92
The following graph compares the compensation actually paid to our PEO and the average of the compensation actually paid to our remaining named executive officers with our distributable cash flow.
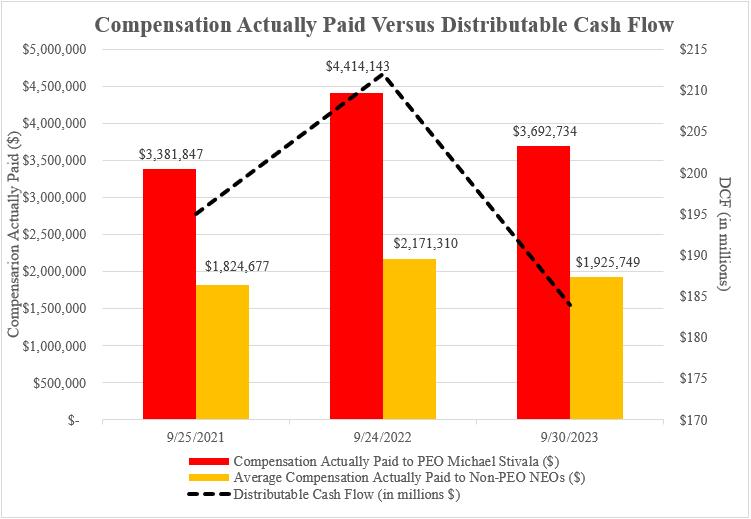
Compensation Actually Paid Versus Distributable Cash Flow |
|
|||||||||||
|
|
Fiscal 2021 |
|
|
Fiscal 2022 |
|
|
Fiscal 2023 |
|
|||
Compensation Actually Paid to PEO |
|
$ |
3,381,847 |
|
|
$ |
4,414,143 |
|
|
$ |
3,692,734 |
|
Average Compensation Actually Paid to Non-PEO named executive officers |
|
$ |
1,824,677 |
|
|
$ |
2,171,310 |
|
|
$ |
1,925,749 |
|
Distributable Cash Flow (in millions $) |
|
$ |
195 |
|
|
$ |
212 |
|
|
$ |
184 |
|
The Average Distributable Cash Flow, as defined above, of the Partnership for the three-year measurement periods ending in fiscal 2021, 2022 and 2023 was $183.8 million, $192.1 million and $197.1 million, respectively.
93
The following graph compares the compensation actually paid to our PEO and the average of the compensation actually paid to our remaining named executive officers to the total unitholder return performance of our Common Units with the total shareholder return of the Alerian MLP Index, the peer group we selected for comparison. The total return to our Unitholders and the Alerian MLP Index’s total return assumes that $100 was invested on September 26, 2020 and that all distributions or dividends were reinvested on a quarterly basis.
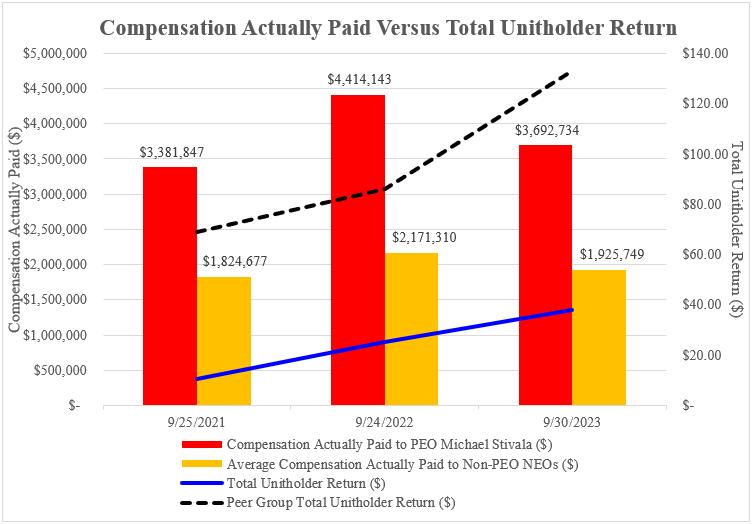
Compensation Actually Paid Versus Total Unitholder Return |
|
|||||||||||
|
|
Fiscal 2021 |
|
|
Fiscal 2022 |
|
|
Fiscal 2023 |
|
|||
Compensation Actually Paid to PEO |
|
$ |
3,381,847 |
|
|
$ |
4,414,143 |
|
|
$ |
3,692,734 |
|
Average Compensation Actually Paid to Non-PEO named executive officers |
|
$ |
1,824,677 |
|
|
$ |
2,171,310 |
|
|
$ |
1,925,749 |
|
Our Total Unitholder Return ($) |
|
$ |
10.68 |
|
|
$ |
25.33 |
|
|
$ |
37.86 |
|
Our Peer Group's Total Shareholder Return |
|
$ |
68.97 |
|
|
$ |
85.85 |
|
|
$ |
133.07 |
|
SUPERVISORS’ COMPENSATION
The following table sets forth the compensation of the non-employee members of the Board of Supervisors of the Partnership during fiscal 2023.
Supervisor |
|
Fees Earned or |
|
|
Unit Awards (2) |
|
|
Total |
|
|||
Matthew J. Chanin |
|
$ |
135,000 |
|
|
$ |
— |
|
|
$ |
135,000 |
|
Lawrence C. Caldwell |
|
$ |
95,000 |
|
|
$ |
— |
|
|
$ |
95,000 |
|
Terence J. Connors |
|
$ |
115,000 |
|
|
$ |
— |
|
|
$ |
115,000 |
|
William M. Landuyt |
|
$ |
95,000 |
|
|
$ |
— |
|
|
$ |
95,000 |
|
Harold R. Logan Jr. |
|
$ |
95,000 |
|
|
$ |
— |
|
|
$ |
95,000 |
|
Jane Swift |
|
$ |
110,000 |
|
|
$ |
— |
|
|
$ |
110,000 |
|
Amy M. Adams |
|
$ |
47,500 |
|
|
$ |
325,276 |
|
|
$ |
372,776 |
|
Rommel M. Oates |
|
$ |
47,500 |
|
|
$ |
325,276 |
|
|
$ |
372,776 |
|
94
Note: The columns for reporting option awards, non-equity incentive plan compensation, changes in pension value and non-qualified deferred compensation plan earnings and all other forms of compensation were omitted from the Supervisor’s Compensation Table because the Partnership does not provide these forms of compensation to its non-employee supervisors.
Fees and Benefit Plans for Non-Employee Supervisors
Annual Cash Retainer Fees. As the Chairman of the Board of Supervisors, Mr. Chanin receives an annual cash retainer of $135,000, payable in quarterly installments of $33,750 each. Each of the other non-employee Supervisors receives an annual cash retainer of $95,000 each, payable in quarterly installments of $23,750. As Chair of the Compensation Committee, Ms. Swift receives an additional annual cash retainer of $15,000, payable in quarterly installments of $3,750 each. As Chair of the Audit Committee, Mr. Connors receives an additional annual cash retainer of $20,000, payable in quarterly installments of $5,000 each.
Meeting Fees. The members of our Board of Supervisors receive no additional remuneration for attendance at regularly scheduled meetings of the Board or its Committees, other than reimbursement of reasonable expenses incurred in connection with such attendance.
Restricted Unit Plan. Each non-employee Supervisor is eligible to participate in our RUP. All awards vest in accordance with the provisions of the plan document (see the CD&A section titled “Restricted Unit Plan” for a description of the vesting schedule). Upon vesting, all awards are settled by issuing Common Units.
Additional Supervisor Compensation. Non-employee Supervisors receive no other forms of remuneration from us. The only perquisite provided to the members of the Board of Supervisors is the ability to purchase propane at the same discounted rate that we offer propane to our employees, the value of which was less than $10,000 in fiscal 2023 for each Supervisor.
95
ITEM 12. SECURITY OWNERSHIP OF CERTAIN BENEFICIAL OWNERS AND MANAGEMENT AND RELATED UNITHOLDER MATTERS
The following table sets forth certain information as of November 20, 2023 regarding the beneficial ownership of Common Units by (a) each person or group known to the Partnership, based upon its review of filings under Section 13(d) or (g) under the Securities Act, to own more than 5% of the outstanding Common Units; (b) each member of the Board of Supervisors; (c) each executive officer named in the Summary Compensation Table in Item 11 of this Annual Report; and (d) all members of the Board of Supervisors and executive officers as a group. Except as set forth in the notes to the table, each individual or entity has sole voting and investment power over the Common Units reported.
Name of Beneficial Owner |
|
Amount and Nature of Beneficial Ownership (1) |
|
|
Percent of Class (2) |
|
Michael A. Stivala (a) |
|
|
227,677 |
|
|
* |
Michael A. Kuglin (b) |
|
|
115,461 |
|
|
* |
Steven C. Boyd (b) |
|
|
149,697 |
|
|
* |
Douglas T. Brinkworth (c) |
|
|
110,719 |
|
|
* |
Neil Scanlon (d) |
|
|
132,633 |
|
|
* |
Matthew J. Chanin (e) |
|
|
56,131 |
|
|
* |
Harold R. Logan, Jr. (f) |
|
|
35,077 |
|
|
* |
Jane Swift (f) |
|
|
23,697 |
|
|
* |
Lawrence C. Caldwell (f) |
|
|
54,952 |
|
|
* |
Terence J. Connors (f) |
|
|
43,145 |
|
|
* |
William M. Landuyt (f) |
|
|
53,645 |
|
|
* |
Amy M. Adams (g) |
|
|
— |
|
|
* |
Rommel M. Oates (g) |
|
|
— |
|
|
* |
All Members of the Board of Supervisors and |
|
|
1,566,960 |
|
|
2.0% |
* Less than 1%.
96
Securities Authorized for Issuance Under the Restricted Unit Plans
The following table sets forth certain information, as of September 30, 2023, with respect to the Partnership’s Restricted Unit Plans, under which restricted units of the Partnership, as described in the Notes to the Consolidated Financial Statements included in this Annual Report, are authorized for issuance.
Plan Category |
|
Number of Common Units to be issued upon vesting of restricted units |
|
|
Weighted-average grant date fair value per restricted unit |
|
|
Number of restricted units remaining available for future issuance under the Restricted Unit Plan (excluding securities reflected in column (a)) |
|
|||
Equity compensation plans approved by security |
|
|
1,366,362 |
|
(2) |
$ |
12.94 |
|
|
|
704,985 |
|
Equity compensation plans not approved by |
|
|
— |
|
|
|
— |
|
|
|
|
|
Total |
|
|
1,366,362 |
|
|
$ |
12.94 |
|
|
|
704,985 |
|
Related Person Transactions
None. See “Partnership Management” under Item 10 above for a description of the Audit Committee’s role in reviewing, and approving or ratifying, related party transactions.
Supervisor Independence
The Corporate Governance Guidelines and Principles adopted by the Board of Supervisors provide that a Supervisor is deemed to be lacking a material relationship to the Partnership and is therefore independent of management if the following criteria are satisfied:
97
A copy of our Corporate Governance Guidelines is available without charge from our website at www.suburbanpropane.com or upon written request directed to: Suburban Propane Partners, L.P., Investor Relations, P.O. Box 206, Whippany, New Jersey 07981-0206.
ITEM 14. PRINCIPAL ACCOUNTANT FEES AND SERVICES
The following table sets forth the aggregate fees for services related to fiscal years 2023 and 2022 provided by PricewaterhouseCoopers LLP, our independent registered public accounting firm.
|
|
Fiscal |
|
|
Fiscal |
|
||
Audit Fees (a) |
|
$ |
2,325,000 |
|
|
$ |
2,104,935 |
|
Tax Fees (b) |
|
|
933,067 |
|
|
|
912,000 |
|
All Other Fees (c) |
|
|
5,400 |
|
|
|
5,500 |
|
Total |
|
$ |
3,263,467 |
|
|
$ |
3,022,435 |
|
The Audit Committee of the Board of Supervisors has adopted a formal policy concerning the approval of audit and non-audit services to be provided by the independent registered public accounting firm, PricewaterhouseCoopers LLP. The policy requires that all services PricewaterhouseCoopers LLP may provide to us, including audit services and permitted audit-related and non-audit services, be pre-approved by the Audit Committee. The Audit Committee pre-approved all audit and non-audit services provided by PricewaterhouseCoopers LLP during fiscal 2023 and fiscal 2022.
98
PART IV
ITEM 15. EXHIBITS AND FINANCIAL STATEMENT SCHEDULES
The consolidated financial statements of the registrant listed in the “Index to Financial Statements” on page F-1 together with the reports of PricewaterhouseCoopers LLP (PCAOB ID
See “Index to Financial Statement Schedule” set forth on page S-1.
See “Index to Exhibits”. Each management contract or compensatory plan or arrangement is identified with a “#”.
ITEM 16. FORM 10-K SUMMARY
None.
INDEX TO EXHIBITS
The exhibits listed on this Exhibit Index are filed as part of this Annual Report. Exhibits required to be filed by Item 601 of Regulation S-K, which are not listed below, are not applicable.
Exhibit Number |
|
Description |
|
|
|
3.1 |
|
|
|
|
|
3.2 |
|
|
|
|
|
3.3 |
|
|
|
|
|
3.4 |
|
|
|
|
|
3.5 |
|
|
|
|
|
3.6 |
|
|
|
|
|
3.7 |
|
|
|
|
|
3.8 |
|
|
|
|
|
3.9 |
|
|
|
|
|
4.1 |
|
|
|
|
|
99
100
10.13 |
|
|
|
|
|
10.14 |
|
|
|
|
|
10.15 |
|
|
|
|
|
10.16 |
|
|
|
|
|
10.17 |
|
|
|
|
|
10.18 |
|
|
|
|
|
10.19 |
|
|
|
|
|
10.20 |
|
|
|
|
|
10.21 |
|
|
|
|
|
10.22 |
|
|
|
|
|
21.1 |
|
Subsidiaries of Suburban Propane Partners, L.P. (Filed herewith). |
|
|
|
23.1 |
|
|
|
|
|
31.1 |
|
|
|
|
|
31.2 |
|
|
|
|
|
32.1 |
|
|
|
|
|
32.2 |
|
|
|
|
|
97.1 |
|
Dodd-Frank Clawback Policy, effective as of December 1, 2023 (Filed herewith). |
|
|
|
99.1 |
|
|
|
|
|
99.2 |
|
|
|
|
|
101.INS |
|
Inline XBRL Instance Document |
|
|
|
101.SCH |
|
Inline XBRL Taxonomy Extension Schema Document |
|
|
|
101.CAL |
|
Inline XBRL Taxonomy Extension Calculation Linkbase Document |
|
|
|
101.DEF |
|
Inline XBRL Taxonomy Extension Definition Linkbase Document |
|
|
|
101.LAB |
|
Inline XBRL Taxonomy Extension Label Linkbase Document |
|
|
|
101
101.PRE |
|
Inline XBRL Taxonomy Extension Presentation Linkbase Document |
|
|
|
104 |
|
Cover Page Interactive Data File (embedded in the Inline XBRL document). |
102
SIGNATURES
Pursuant to the requirements of Section 13 or 15(d) of the Securities Exchange Act of 1934, the Registrant has duly caused this report to be signed on its behalf by the undersigned, thereunto duly authorized.
|
SUBURBAN PROPANE PARTNERS, L.P. |
|
|
|
|
Date: November 22, 2023 |
By: |
/s/ MICHAEL A. STIVALA |
|
|
Michael A. Stivala |
|
|
President, Chief Executive Officer and |
|
|
Supervisor |
Pursuant to the requirements of the Securities Exchange Act of 1934, this Annual Report has been signed below by the following persons on behalf of the Registrant and in the capacities and on the dates indicated:
Signature |
|
Title |
|
Date |
|
|
|
|
|
|
|
By: |
/s/ MICHAEL A. STIVALA |
|
President, Chief Executive |
|
November 22, 2023 |
|
(Michael A. Stivala) |
|
Officer and Supervisor |
|
|
|
|
|
|
|
|
By: |
/s/ MATTHEW J. CHANIN |
|
Chairman and Supervisor |
|
November 22, 2023 |
|
(Matthew J. Chanin) |
|
|
|
|
|
|
|
|
|
|
By: |
/s/ HAROLD R. LOGAN, JR. |
|
Supervisor |
|
November 22, 2023 |
|
(Harold R. Logan, Jr.) |
|
|
|
|
|
|
|
|
|
|
By: |
/s/ JANE SWIFT |
|
Supervisor |
|
November 22, 2023 |
|
(Jane Swift) |
|
|
|
|
|
|
|
|
|
|
By: |
/s/ LAWRENCE C. CALDWELL |
|
Supervisor |
|
November 22, 2023 |
|
(Lawrence C. Caldwell) |
|
|
|
|
|
|
|
|
|
|
By: |
/s/ TERENCE J. CONNORS |
|
Supervisor |
|
November 22, 2023 |
|
(Terence J. Connors) |
|
|
|
|
|
|
|
|
|
|
By: |
/s/ WILLIAM M. LANDUYT |
|
Supervisor |
|
November 22, 2023 |
|
(William M. Landuyt) |
|
|
|
|
|
|
|
|
|
|
By: |
/s/ AMY M. ADAMS |
|
Supervisor |
|
November 22, 2023 |
|
(Amy M. Adams) |
|
|
|
|
|
|
|
|
|
|
By: |
/s/ ROMMEL M. OATES |
|
Supervisor |
|
November 22, 2023 |
|
(Rommel M. Oates) |
|
|
|
|
|
|
|
|
|
|
By: |
/s/ MICHAEL A. KUGLIN |
|
Chief Financial Officer |
|
November 22, 2023 |
|
(Michael A. Kuglin) |
|
|
|
|
|
|
|
|
|
|
By: |
/s/ DANIEL S. BLOOMSTEIN |
|
Vice President, Controller and |
|
November 22, 2023 |
|
(Daniel S. Bloomstein) |
|
Chief Accounting Officer |
|
|
103
INDEX TO FINANCIAL STATEMENTS
SUBURBAN PROPANE PARTNERS, L.P. AND SUBSIDIARIES
|
Page |
|
|
F-2 |
|
|
|
Consolidated Balance Sheets – As of September 30, 2023 and September 24, 2022 |
F-4 |
|
|
F-5 |
|
|
|
F-6 |
|
|
|
F-7 |
|
|
|
F-8 |
|
|
|
F-9 |
F-1
Report of Independent Registered Public Accounting Firm
To the Board of Supervisors and Unitholders
of Suburban Propane Partners, L.P.
Opinions on the Financial Statements and Internal Control over Financial Reporting
We have audited the accompanying consolidated balance sheets of Suburban Propane Partners, L.P. and its subsidiaries (the “Partnership”) as of September 30, 2023 and September 24, 2022, and the related consolidated statements of operations, of comprehensive income, of partners' capital and of cash flows for each of the three years in the period ended September 30, 2023, including the related notes and financial statement schedule listed in the index appearing under Item 15(a)(2) (collectively referred to as the “consolidated financial statements”). We also have audited the Partnership's internal control over financial reporting as of September 30, 2023, based on criteria established in Internal Control - Integrated Framework (2013) issued by the Committee of Sponsoring Organizations of the Treadway Commission (COSO).
In our opinion, the consolidated financial statements referred to above present fairly, in all material respects, the financial position of the Partnership as of September 30, 2023 and September 24, 2022, and the results of its operations and its cash flows for each of the three years in the period ended September 30, 2023 in conformity with accounting principles generally accepted in the United States of America. Also in our opinion, the Partnership maintained, in all material respects, effective internal control over financial reporting as of September 30, 2023, based on criteria established in Internal Control - Integrated Framework (2013) issued by the COSO.
Basis for Opinions
The Partnership's management is responsible for these consolidated financial statements, for maintaining effective internal control over financial reporting, and for its assessment of the effectiveness of internal control over financial reporting, included in Management’s Report on Internal Control over Financial Reporting appearing under Item 9A. Our responsibility is to express opinions on the Partnership’s consolidated financial statements and on the Partnership's internal control over financial reporting based on our audits. We are a public accounting firm registered with the Public Company Accounting Oversight Board (United States) (PCAOB) and are required to be independent with respect to the Partnership in accordance with the U.S. federal securities laws and the applicable rules and regulations of the Securities and Exchange Commission and the PCAOB.
We conducted our audits in accordance with the standards of the PCAOB. Those standards require that we plan and perform the audits to obtain reasonable assurance about whether the consolidated financial statements are free of material misstatement, whether due to error or fraud, and whether effective internal control over financial reporting was maintained in all material respects.
Our audits of the consolidated financial statements included performing procedures to assess the risks of material misstatement of the consolidated financial statements, whether due to error or fraud, and performing procedures that respond to those risks. Such procedures included examining, on a test basis, evidence regarding the amounts and disclosures in the consolidated financial statements. Our audits also included evaluating the accounting principles used and significant estimates made by management, as well as evaluating the overall presentation of the consolidated financial statements. Our audit of internal control over financial reporting included obtaining an understanding of internal control over financial reporting, assessing the risk that a material weakness exists, and testing and evaluating the design and operating effectiveness of internal control based on the assessed risk. Our audits also included performing such other procedures as we considered necessary in the circumstances. We believe that our audits provide a reasonable basis for our opinions.
Definition and Limitations of Internal Control over Financial Reporting
A company’s internal control over financial reporting is a process designed to provide reasonable assurance regarding the reliability of financial reporting and the preparation of financial statements for external purposes in accordance with generally accepted accounting principles. A company’s internal control over financial reporting includes those policies and procedures that (i) pertain to the maintenance of records that, in reasonable detail, accurately and fairly reflect the transactions and dispositions of the assets of the company; (ii) provide reasonable assurance that transactions are recorded as necessary to permit preparation of financial statements in accordance with generally accepted accounting principles, and that receipts and expenditures of the company are being made only in accordance with authorizations of management and directors of the company; and (iii) provide reasonable assurance regarding prevention or timely detection of unauthorized acquisition, use, or disposition of the company’s assets that could have a material effect on the financial statements.
Because of its inherent limitations, internal control over financial reporting may not prevent or detect misstatements. Also, projections of any evaluation of effectiveness to future periods are subject to the risk that controls may become inadequate because of changes in conditions, or that the degree of compliance with the policies or procedures may deteriorate.
F-2
Critical Audit Matters
The critical audit matter communicated below is a matter arising from the current period audit of the consolidated financial statements that was communicated or required to be communicated to the audit committee and that (i) relates to accounts or disclosures that are material to the consolidated financial statements and (ii) involved our especially challenging, subjective, or complex judgments. The communication of critical audit matters does not alter in any way our opinion on the consolidated financial statements, taken as a whole, and we are not, by communicating the critical audit matter below, providing a separate opinion on the critical audit matter or on the accounts or disclosures to which it relates.
Accrued Insurance
As described in Notes 2 and 14 to the consolidated financial statements, the Partnership had accrued insurance liabilities of approximately $61 million as of September 30, 2023, which represents the estimated costs of known and anticipated or unasserted claims for incidents related to general and product, workers’ compensation and automobile liabilities. For each claim, the Partnership records a provision up to the estimated amount of the probable claim utilizing actuarially determined loss development factors applied to actual historical claims data. The Partnership is self-insured for these liabilities up to predetermined amounts above which third party insurance applies. The Partnership maintains insurance coverage such that its net exposure for insured claims is limited to the insurance deductible, claims above which are paid by the Partnership’s insurance carriers. For the portion of the estimated liability that exceeds insurance deductibles, the Partnership records an asset within other assets related to the amount of the liability expected to be covered by insurance, which amounted to approximately $15 million as of September 30, 2023.
The principal considerations for our determination that performing procedures relating to accrued insurance is a critical audit matter are there was significant judgment by management in determining the estimate of net exposure for estimated costs of known and anticipated or unasserted claims for self-insured liabilities arising from incidents related to general and product, workers’ compensation, and automobile liabilities. This in turn led to a high degree of auditor judgment, subjectivity, and effort in performing procedures and evaluating audit evidence relating to these determinations and management’s significant assumption for loss development factors. In addition, the audit effort involved the use of professionals with specialized skill and knowledge to assist in performing these procedures and evaluating the audit evidence obtained.
Addressing the matter involved performing procedures and evaluating audit evidence in connection with forming our overall opinion on the consolidated financial statements. These procedures included testing the effectiveness of controls relating to management’s accrued insurance calculation, including controls over the determination of loss development factors. These procedures also included, among others, testing management’s process for determining the net exposure for estimated costs of known and anticipated or unasserted claims for self-insured liabilities arising from incidents related to general and product, workers’ compensation, and automobile liabilities and management’s significant assumption for loss development factors. This included testing the completeness and accuracy of underlying data used by management. Evaluating management’s significant assumption related to loss development factors involved evaluating the historical claims data utilized by management in estimating the costs of known and anticipated or unasserted claims. Professionals with specialized skill and knowledge were used to assist in the evaluation of the appropriateness of the actuarial methods used by management and the reasonableness of management’s significant assumption for loss development factors used to estimate costs of known and anticipated or unasserted claims.
/s/
November 22, 2023
We have served as the Partnership’s auditor since 1995.
F-3
SUBURBAN PROPANE PARTNERS, L.P. AND SUBSIDIARIES
CONSOLIDATED BALANCE SHEETS
(in thousands)
|
|
September 30, |
|
|
September 24, |
|
||
|
|
2023 |
|
|
2022 |
|
||
ASSETS |
|
|
|
|
|
|
||
Current assets: |
|
|
|
|
|
|
||
Cash and cash equivalents |
|
$ |
|
|
$ |
|
||
Accounts receivable, less allowance for doubtful accounts of $ |
|
|
|
|
|
|
||
Inventories |
|
|
|
|
|
|
||
Other current assets |
|
|
|
|
|
|
||
Total current assets |
|
|
|
|
|
|
||
Property, plant and equipment, net |
|
|
|
|
|
|
||
Operating lease right-of-use assets |
|
|
|
|
|
|
||
Goodwill |
|
|
|
|
|
|
||
Other intangible assets, net |
|
|
|
|
|
|
||
Other assets |
|
|
|
|
|
|
||
Total assets |
|
$ |
|
|
$ |
|
||
LIABILITIES AND PARTNERS' CAPITAL |
|
|
|
|
|
|
||
Current liabilities: |
|
|
|
|
|
|
||
Accounts payable |
|
$ |
|
|
$ |
|
||
Accrued employment and benefit costs |
|
|
|
|
|
|
||
Accrued insurance |
|
|
|
|
|
|
||
Customer deposits and advances |
|
|
|
|
|
|
||
Operating lease liabilities |
|
|
|
|
|
|
||
Accrued interest |
|
|
|
|
|
|
||
Other current liabilities |
|
|
|
|
|
|
||
Total current liabilities |
|
|
|
|
|
|
||
Long-term borrowings |
|
|
|
|
|
|
||
Accrued insurance |
|
|
|
|
|
|
||
Operating lease liabilities |
|
|
|
|
|
|
||
Other liabilities |
|
|
|
|
|
|
||
Total liabilities |
|
|
|
|
|
|
||
|
|
|
|
|
|
|||
Partners' capital: |
|
|
|
|
|
|
||
Common Unitholders ( |
|
|
|
|
|
|
||
Accumulated other comprehensive loss |
|
|
( |
) |
|
|
( |
) |
Total partners' capital |
|
|
|
|
|
|
||
Total liabilities and partners' capital |
|
$ |
|
|
$ |
|
||
The accompanying notes are an integral part of these consolidated financial statements.
F-4
SUBURBAN PROPANE PARTNERS, L.P. AND SUBSIDIARIES
CONSOLIDATED STATEMENTS OF OPERATIONS
(in thousands, except per unit amounts)
|
|
Year Ended |
|
|||||||||
|
|
September 30, |
|
|
September 24, |
|
|
September 25, |
|
|||
|
|
2023 |
|
|
2022 |
|
|
2021 |
|
|||
Revenues |
|
|
|
|
|
|
|
|
|
|||
Propane |
|
$ |
|
|
$ |
|
|
$ |
|
|||
Fuel oil and refined fuels |
|
|
|
|
|
|
|
|
|
|||
Natural gas and electricity |
|
|
|
|
|
|
|
|
|
|||
All other |
|
|
|
|
|
|
|
|
|
|||
|
|
|
|
|
|
|
|
|
|
|||
Costs and expenses |
|
|
|
|
|
|
|
|
|
|||
Cost of products sold |
|
|
|
|
|
|
|
|
|
|||
Operating |
|
|
|
|
|
|
|
|
|
|||
General and administrative |
|
|
|
|
|
|
|
|
|
|||
Depreciation and amortization |
|
|
|
|
|
|
|
|
|
|||
|
|
|
|
|
|
|
|
|
|
|||
Operating income |
|
|
|
|
|
|
|
|
|
|||
Loss on debt extinguishment |
|
|
|
|
|
|
|
|
|
|||
Interest expense, net |
|
|
|
|
|
|
|
|
|
|||
Other, net |
|
|
|
|
|
|
|
|
|
|||
Income before provision for income taxes |
|
|
|
|
|
|
|
|
|
|||
Provision for income taxes |
|
|
|
|
|
|
|
|
|
|||
Net income |
|
$ |
|
|
$ |
|
|
$ |
|
|||
Net income per Common Unit - basic |
|
$ |
|
|
$ |
|
|
$ |
|
|||
Weighted average number of Common Units outstanding - basic |
|
|
|
|
|
|
|
|
|
|||
Net income per Common Unit - diluted |
|
$ |
|
|
$ |
|
|
$ |
|
|||
Weighted average number of Common Units outstanding - diluted |
|
|
|
|
|
|
|
|
|
|||
The accompanying notes are an integral part of these consolidated financial statements.
F-5
SUBURBAN PROPANE PARTNERS, L.P. AND SUBSIDIARIES
CONSOLIDATED STATEMENTS OF COMPREHENSIVE INCOME
(in thousands)
|
|
Year Ended |
|
|||||||||
|
|
September 30, |
|
|
September 24, |
|
|
September 25, |
|
|||
|
|
2023 |
|
|
2022 |
|
|
2021 |
|
|||
Net income |
|
$ |
|
|
$ |
|
|
$ |
|
|||
Other comprehensive income: |
|
|
|
|
|
|
|
|
|
|||
Amortization of net actuarial gains and prior service credits into |
|
|
|
|
|
|
|
|
|
|||
Recognition in earnings of net actuarial loss for pension settlement |
|
|
|
|
|
|
|
|
|
|||
Other comprehensive income |
|
|
|
|
|
|
|
|
|
|||
Total comprehensive income |
|
$ |
|
|
$ |
|
|
$ |
|
|||
The accompanying notes are an integral part of these consolidated financial statements.
F-6
SUBURBAN PROPANE PARTNERS, L.P. AND SUBSIDIARIES
CONSOLIDATED STATEMENTS OF CASH FLOWS
(in thousands)
|
|
Year Ended |
|
|||||||||
|
|
September 30, |
|
|
September 24, |
|
|
September 25, |
|
|||
|
|
2023 |
|
|
2022 |
|
|
2021 |
|
|||
Cash flows from operating activities: |
|
|
|
|
|
|
|
|
|
|||
Net income |
|
$ |
|
|
$ |
|
|
$ |
|
|||
Adjustments to reconcile net income to net cash provided by operations: |
|
|
|
|
|
|
|
|
|
|||
Depreciation and amortization |
|
|
|
|
|
|
|
|
|
|||
Compensation costs recognized under Restricted Unit Plans |
|
|
|
|
|
|
|
|
|
|||
Loss on debt extinguishment |
|
|
|
|
|
|
|
|
|
|||
Pension settlement charge |
|
|
|
|
|
|
|
|
|
|||
Other, net |
|
|
|
|
|
|
|
|
|
|||
Changes in assets and liabilities: |
|
|
|
|
|
|
|
|
|
|||
Accounts receivable |
|
|
|
|
|
( |
) |
|
|
( |
) |
|
Inventories |
|
|
|
|
|
( |
) |
|
|
( |
) |
|
Other current and noncurrent assets |
|
|
|
|
|
( |
) |
|
|
( |
) |
|
Accounts payable |
|
|
( |
) |
|
|
( |
) |
|
|
|
|
Accrued employment and benefit costs |
|
|
|
|
|
|
|
|
|
|||
Accrued insurance |
|
|
( |
) |
|
|
( |
) |
|
|
( |
) |
Customer deposits and advances |
|
|
( |
) |
|
|
|
|
|
|
||
Contributions to defined benefit pension plan |
|
|
( |
) |
|
|
( |
) |
|
|
( |
) |
Other current and noncurrent liabilities |
|
|
|
|
|
|
|
|
|
|||
Net cash provided by operating activities |
|
|
|
|
|
|
|
|
|
|||
Cash flows from investing activities: |
|
|
|
|
|
|
|
|
|
|||
Capital expenditures |
|
|
( |
) |
|
|
( |
) |
|
|
( |
) |
Investments in and acquisitions of businesses |
|
|
( |
) |
|
|
( |
) |
|
|
( |
) |
Proceeds from sale of property, plant and equipment |
|
|
|
|
|
|
|
|
|
|||
Proceeds from sale of business |
|
|
|
|
|
|
|
|
|
|||
Net cash (used in) investing activities |
|
|
( |
) |
|
|
( |
) |
|
|
( |
) |
Cash flows from financing activities: |
|
|
|
|
|
|
|
|
|
|||
Proceeds from long-term borrowings |
|
|
|
|
|
|
|
|
|
|||
Repayments of long-term borrowings |
|
|
|
|
|
|
|
|
( |
) |
||
Proceeds from borrowings under revolving credit facility |
|
|
|
|
|
|
|
|
|
|||
Repayments of borrowings under revolving credit facility |
|
|
( |
) |
|
|
( |
) |
|
|
( |
) |
Issuance costs associated with long-term borrowings |
|
|
|
|
|
|
|
|
( |
) |
||
Partnership distributions |
|
|
( |
) |
|
|
( |
) |
|
|
( |
) |
Other, net |
|
|
( |
) |
|
|
( |
) |
|
|
( |
) |
Net cash (used in) financing activities |
|
|
( |
) |
|
|
( |
) |
|
|
( |
) |
Net increase (decrease) in cash, cash equivalents and restricted cash |
|
|
|
|
|
( |
) |
|
|
|
||
Cash, cash equivalents and restricted cash at beginning of period |
|
|
|
|
|
|
|
|
|
|||
Cash, cash equivalents and restricted cash at end of period |
|
$ |
|
|
$ |
|
|
$ |
|
|||
|
|
|
|
|
|
|
|
|
|
|||
Less: restricted cash |
|
|
|
|
|
|
|
|
|
|||
Cash and cash equivalents, end of period |
|
$ |
|
|
$ |
|
|
$ |
|
|||
|
|
|
|
|
|
|
|
|
|
|||
Supplemental disclosure of cash flow information: |
|
|
|
|
|
|
|
|
|
|||
Cash paid for interest |
|
$ |
|
|
$ |
|
|
$ |
|
|||
The accompanying notes are an integral part of these consolidated financial statements.
F-7
SUBURBAN PROPANE PARTNERS, L.P. AND SUBSIDIARIES
CONSOLIDATED STATEMENTS OF PARTNERS’ CAPITAL
(in thousands)
|
|
|
|
|
|
|
|
Accumulated |
|
|
|
|
||||
|
|
|
|
|
|
|
|
Other |
|
|
Total |
|
||||
|
|
Number of |
|
|
Common |
|
|
Comprehensive |
|
|
Partners' |
|
||||
|
|
Common Units |
|
|
Unitholders |
|
|
(Loss) |
|
|
Capital |
|
||||
Balance at September 26, 2020 |
|
|
|
|
$ |
|
|
$ |
( |
) |
|
$ |
|
|||
Net income |
|
|
|
|
|
|
|
|
|
|
|
|
||||
Amortization of net actuarial gains and prior service credits into |
|
|
|
|
|
|
|
|
|
|
|
|
||||
Partnership distributions |
|
|
|
|
|
( |
) |
|
|
|
|
|
( |
) |
||
Common Units issued under Restricted Unit Plans |
|
|
|
|
|
( |
) |
|
|
|
|
|
( |
) |
||
Recognition in earnings of net actuarial loss for pension settlement |
|
|
|
|
|
|
|
|
|
|
|
|
||||
Compensation costs recognized under Restricted Unit Plans |
|
|
|
|
|
|
|
|
|
|
|
|
||||
Balance at September 25, 2021 |
|
|
|
|
$ |
|
|
$ |
( |
) |
|
$ |
|
|||
|
|
|
|
|
|
|
|
|
|
|
|
|
||||
Net income |
|
|
|
|
|
|
|
|
|
|
|
|
||||
Amortization of net actuarial gains and prior service credits into |
|
|
|
|
|
|
|
|
|
|
|
|
||||
Partnership distributions |
|
|
|
|
|
( |
) |
|
|
|
|
|
( |
) |
||
Common Units issued under Restricted Unit Plans |
|
|
|
|
|
( |
) |
|
|
|
|
|
( |
) |
||
Recognition in earnings of net actuarial loss for pension settlement |
|
|
|
|
|
|
|
|
|
|
|
|
||||
Compensation costs recognized under Restricted Unit Plans |
|
|
|
|
|
|
|
|
|
|
|
|
||||
Balance at September 24, 2022 |
|
|
|
|
$ |
|
|
$ |
( |
) |
|
$ |
|
|||
|
|
|
|
|
|
|
|
|
|
|
|
|
||||
Net income |
|
|
|
|
|
|
|
|
|
|
|
|
||||
Amortization of net actuarial gains and prior service credits into |
|
|
|
|
|
|
|
|
|
|
|
|
||||
Partnership distributions |
|
|
|
|
|
( |
) |
|
|
|
|
|
( |
) |
||
Common Units issued under Restricted Unit Plans |
|
|
|
|
|
( |
) |
|
|
|
|
|
( |
) |
||
Compensation costs recognized under Restricted Unit Plans |
|
|
|
|
|
|
|
|
|
|
|
|
||||
Balance at September 30, 2023 |
|
|
|
|
$ |
|
|
$ |
( |
) |
|
$ |
|
|||
The accompanying notes are an integral part of these consolidated financial statements.
F-8
SUBURBAN PROPANE PARTNERS, L.P. AND SUBSIDIARIES
NOTES TO CONSOLIDATED FINANCIAL STATEMENTS
(dollars in thousands, except unit and per unit amounts)
1. Partnership Organization and Formation
Suburban Propane Partners, L.P. (the “Partnership”) is a publicly traded Delaware limited partnership principally engaged, through its operating partnership and subsidiaries, in the retail marketing and distribution of propane, renewable propane, renewable natural gas (“RNG”), fuel oil and refined fuels, as well as the marketing of natural gas and electricity in deregulated markets and producer of and investor in low-carbon fuel alternatives. In addition, to complement its core marketing and distribution businesses, the Partnership services a wide variety of home comfort equipment, particularly for heating and ventilation. The publicly traded limited partner interests in the Partnership are evidenced by common units traded on the New York Stock Exchange (“Common Units”), with
Suburban Propane, L.P. (the “Operating Partnership”), a Delaware limited partnership, is the Partnership’s operating subsidiary formed to operate the propane business and assets. In addition, Suburban Sales & Service, Inc. (the “Service Company”), a subsidiary of the Operating Partnership, was formed to operate the service work and appliance and parts businesses of the Partnership. The Operating Partnership, together with its direct and indirect subsidiaries, accounts for substantially all of the Partnership’s assets, revenues and earnings. The Partnership, the Operating Partnership and the Service Company commenced operations in March 1996 in connection with the Partnership’s initial public offering.
Suburban Renewable Energy, LLC (“Suburban Renewable Energy”) is a wholly owned subsidiary of the Operating Partnership that was formed in January 2022. Suburban Renewable Energy serves as the platform for the Partnership’s investments in innovative, renewable energy technologies and businesses.
The general partner of both the Partnership and the Operating Partnership is Suburban Energy Services Group LLC (the “General Partner”), a Delaware limited liability company, the sole member of which is the Partnership’s Chief Executive Officer. Other than as a holder of
The Partnership’s fuel oil and refined fuels, natural gas and electricity, services, and renewable energy businesses are structured as either limited liability companies that are treated as corporations or corporate entities (collectively referred to as the “Corporate Entities”) and, as such, are subject to corporate level federal and state income tax.
Suburban Energy Finance Corp., a direct
The Partnership serves approximately
2. Summary of Significant Accounting Policies
Principles of Consolidation. The consolidated financial statements include the accounts of the Partnership, the Operating Partnership and all of its direct and indirect subsidiaries. All significant intercompany transactions and account balances have been eliminated. The Partnership consolidates the results of operations, financial condition and cash flows of the Operating Partnership as a result of the Partnership’s
Fiscal Period. The Partnership uses a
F-9
Revenue Recognition. The Partnership recognizes revenue pursuant to the requirements of Financial Accounting Standards Board (“FASB”) Topic 606 – Revenue from Contracts with Customers (“Topic 606”) and all related amendments. Topic 606 provides a five-step model to be applied to all contracts with customers. The five steps are to identify the contract(s) with the customer, identify the performance obligations in the contract, determine the transaction price, allocate the transaction price to the performance obligations in the contract and recognize revenue when each performance obligation is satisfied.
Revenue is recognized by the Partnership when goods or services promised in a contract with a customer have been transferred, and no further performance obligation on that transfer is required, in an amount that reflects the consideration expected to be received. Performance obligations are determined and evaluated based on the specific terms of the arrangements and the distinct products and services offered. Due to the nature of the retail business of the Partnership, there are
The Partnership defers the recognition of revenue for annually billed tank rent, maintenance service contracts, fixed price contracts and budgetary programs where customer consideration is received at the start of the contract period, establishing contract liabilities which are disclosed as customer deposits and advances on the consolidated balance sheets. Deliveries to customers enrolled in budgetary programs that exceed billings to those customers establish contract assets which are included in accounts receivable on the consolidated balance sheets. The Partnership ratably recognizes revenue over the applicable term for tank rent and maintenance service agreements, which is generally
The Partnership incurs incremental direct costs, such as commissions to its salesforce, to obtain certain contracts. These costs are expensed as incurred, consistent with the practical expedients issued by the FASB, since the expected amortization period is one year or less. The Partnership generally determines selling prices based on, among other things, the current weighted average cost and the current replacement cost of the product at the time of delivery, plus an applicable margin. Except for tank rental agreements, maintenance service contracts, fixed price contracts and budgetary programs, customer payments for the satisfaction of a performance obligation are due upon receipt.
Revenues from the Partnership’s renewable energy platform, as described further in Note 4, “Investments in and Acquisitions and Dispositions of Businesses,” consist of in-take and off-take revenues. In-take revenues are generated from tipping fees charged to third parties who deliver feedstocks, including dairy manure, as well as food and beverage waste to the Partnership’s facilities, which are then anaerobically digested and converted into RNG and fertilizer. Off-take revenues are generated through the sale of RNG and the related environmental attributes, including Renewable Identification Numbers (“RINs”) and Low Carbon Fuel Standard (“LCFS”) credits that are generated from the production and distribution of RNG, and revenues generated from the sales of fertilizers and other byproducts produced in the RNG production process. Revenues from the Partnership’s renewable energy platform are reported within the “all other” segment (refer to Note 17, “Segment Information” for more information).
In-take revenues are recognized at the point in time when the feedstocks are delivered to the Partnership because that is when the performance obligations have been satisfied. Off-take revenues are recognized at the point in time when the Partnership delivers the RNG to the customer because that is when the performance obligations have been satisfied.
Fair Value Measurements. The Partnership measures certain of its assets and liabilities at fair value, which is defined as the price that would be received to sell an asset or paid to transfer a liability in an orderly transaction between market participants – in either the principal market or the most advantageous market. The principal market is the market with the greatest level of activity and volume for the asset or liability.
The common framework for measuring fair value utilizes a three-level hierarchy to prioritize the inputs used in the valuation techniques to derive fair values. The basis for fair value measurements for each level within the hierarchy is described below with Level 1 having the highest priority and Level 3 having the lowest.
F-10
Business Combinations. The Partnership accounts for business combinations using the acquisition method and accordingly, the assets and liabilities of the acquired entities are recorded at their estimated fair values at the acquisition date. Goodwill represents the excess of the purchase price over the fair value of the net assets acquired, including the amount assigned to identifiable intangible assets. The primary drivers that generate goodwill are the value of synergies between the acquired entities and the Partnership, and the acquired assembled workforce, neither of which qualifies as an identifiable intangible asset. Identifiable intangible assets with finite lives are amortized over their useful lives. The results of operations of acquired businesses are included in the consolidated financial statements from the acquisition date. The Partnership expenses all acquisition-related costs as incurred.
Use of Estimates. The preparation of financial statements in conformity with accounting principles generally accepted in the United States of America (“US GAAP”) requires management to make estimates and assumptions that affect the reported amounts of assets and liabilities and disclosure of contingent assets and liabilities at the date of the financial statements and the reported amounts of revenues and expenses during the reporting period. Estimates have been made by management in the areas of RNG revenue recognition, self-insurance and litigation reserves, pension and other postretirement benefit liabilities and costs, valuation of derivative instruments, depreciation and amortization of long-lived assets, asset impairment assessments, tax valuation allowances, allowances for doubtful accounts, and purchase price allocation for acquired businesses. The Partnership uses Society of Actuaries life expectancy information when developing the annual mortality assumptions for the pension and postretirement benefit plans, which are used to measure net periodic benefit costs and the obligation under these plans. Actual results could differ from those estimates, making it reasonably possible that a material change in these estimates could occur in the near term.
Cash, Cash Equivalents and Restricted Cash. The Partnership considers all highly liquid instruments purchased with an original maturity of three months or less to be cash equivalents. In accordance with the indenture, as amended, and loan agreement, as amended, governing the Green Bonds assumed in the RNG Acquisition (see Notes 4 and 10), the Partnership is required to maintain certain funds in various accounts that are held with a third-party trustee for debt service and other purposes. The amounts deposited in those accounts is considered Restricted Cash and is reported within other current assets (or other assets, as applicable). The balance classified as short-term included accounts for which the cash will be used within one year, and are related to interest payments as well as operating and maintenance activities for the RNG facility in Arizona. The balance classified as long-term represented cash held in a debt service fund for future debt repayments on the Green Bonds for which the first debt redemption payment is due on October 1, 2028. Refer to Note 6, “Selected Balance Sheet Information” for a reconciliation of cash, cash equivalents, and restricted cash. The carrying amount approximates fair value because of the short-term maturity of these instruments.
Inventories. Inventories are stated at the lower of cost or market. Cost is determined using a weighted average method for propane, fuel oil and refined fuels and natural gas, and a standard cost basis for appliances, which approximates average cost.
Derivative Instruments and Hedging Activities
Commodity Price Risk. Given the retail nature of its operations, the Partnership maintains a certain level of priced physical inventory to help ensure its field operations have adequate supply commensurate with the time of year. The Partnership’s strategy is to keep its physical inventory priced relatively close to market for its field operations. The Partnership enters into a combination of exchange-traded futures and option contracts and, in certain instances, over-the-counter options and swap contracts (collectively, “derivative instruments”) to hedge price risk associated with propane and fuel oil physical inventories, as well as future purchases of propane or fuel oil used in its operations and to help ensure adequate supply during periods of high demand. In addition, the Partnership sells propane and fuel oil to customers at fixed prices, and enters into derivative instruments to hedge a portion of its exposure to fluctuations in commodity prices as a result of selling the fixed price contracts. Under this risk management strategy, realized gains or losses on derivative instruments will typically offset losses or gains on the physical inventory once the product is sold or delivered as it pertains to fixed price contracts. All of the Partnership’s derivative instruments are reported on the consolidated balance sheet at their fair values. In addition, in the course of normal operations, the Partnership routinely enters into contracts such as forward priced physical contracts for the purchase or sale of propane and fuel oil that qualify for and are designated as normal purchase or normal sale contracts. Such contracts are exempted from the fair value accounting requirements and are accounted for at the time product is purchased or sold under the related contract. The Partnership does not use derivative instruments for speculative trading purposes. Market risks associated with derivative instruments are monitored daily for compliance with the Partnership’s Hedging and Risk Management Policy which includes volume limits for open positions. Priced on-hand inventory is also reviewed and managed daily as to exposures to changing market prices.
F-11
On the date that derivative instruments are entered into, other than those designated as normal purchases or normal sales, the Partnership makes a determination as to whether the derivative instrument qualifies for designation as a hedge. Changes in the fair value of derivative instruments are recorded each period in current period earnings or other comprehensive income (“OCI”), depending on whether the derivative instrument is designated as a hedge and, if so, the type of hedge. For derivative instruments designated as cash flow hedges, the Partnership formally assesses, both at the hedge contract’s inception and on an ongoing basis, whether the hedge contract is highly effective in offsetting changes in cash flows of hedged items. Changes in the fair value of derivative instruments designated as cash flow hedges are reported in OCI to the extent effective and reclassified into earnings during the same period in which the hedged item affects earnings. The mark-to-market gains or losses on ineffective portions of cash flow hedges are recognized in earnings immediately. Changes in the fair value of derivative instruments that are not designated as cash flow hedges, and that do not meet the normal purchase and normal sale exemption, are recorded within earnings as they occur. Cash flows associated with derivative instruments are reported as operating activities within the consolidated statement of cash flows.
Interest Rate Risk. A portion of the Partnership’s borrowings bear interest at prevailing interest rates based upon, at the Operating Partnership’s option, Secured Overnight Financing Rate (“SOFR”) plus an applicable margin or the base rate, defined as the higher of the
Valuation of Derivative Instruments. The Partnership measures the fair value of its exchange-traded options and futures contracts using quoted market prices found on the New York Mercantile Exchange (the “NYMEX”) (Level 1 inputs); the fair value of its swap contracts using quoted forward prices, and the fair value of its interest rate swaps using model-derived valuations driven by observable projected movements of the 3-month SOFR (Level 2 inputs); and the fair value of its over-the-counter options contracts using Level 3 inputs. The Partnership’s over-the-counter options contracts are valued based on an internal option model. The inputs utilized in the model are based on publicly available information as well as broker quotes. The significant unobservable inputs used in the fair value measurements of the Partnership’s over-the-counter options contracts are interest rate and market volatility.
Long-Lived Assets
Property, plant and equipment. Property, plant and equipment are stated at cost. Expenditures for maintenance and routine repairs are expensed as incurred while betterments are capitalized as additions to the related assets and depreciated over the asset’s remaining useful life. The Partnership capitalizes costs incurred in the acquisition and modification of computer software used internally, including consulting fees and costs of employees dedicated solely to a specific project. At the time assets are retired, or otherwise disposed of, the asset and related accumulated depreciation are removed from the accounts, and any resulting gain or loss is recognized within operating expenses.
Buildings |
|
|
Building and land improvements |
|
|
Transportation equipment |
|
|
Storage facilities |
|
|
Machinery and equipment |
|
|
Office equipment |
|
|
Tanks and cylinders |
|
|
Computer software |
|
The weighted average estimated useful life of the Partnership’s storage facilities and tanks and cylinders is approximately
The Partnership reviews the recoverability of long-lived assets when circumstances occur that indicate that the carrying value of an asset may not be recoverable. Such circumstances include a significant adverse change in the manner in which an asset is being used, current operating losses combined with a history of operating losses experienced by the asset or a current expectation that an asset will be sold or otherwise disposed of before the end of its previously estimated useful life. Evaluation of possible impairment is based on the Partnership’s ability to recover the value of the asset from the future undiscounted cash flows expected to result from the use and eventual disposition of the asset. If the expected undiscounted cash flows are less than the carrying amount of such asset, an impairment loss is recorded as the amount by which the carrying amount of an asset exceeds its fair value. The fair value of an asset will be measured using the best information available, including prices for similar assets or the result of using a discounted cash flow valuation technique.
F-12
Goodwill. Goodwill represents the excess of the purchase price over the fair value of net assets acquired. Goodwill is subject to an impairment review at a reporting unit level, on an annual basis as of the end of fiscal July of each year, or when an event occurs or circumstances change that would indicate potential impairment.
The Partnership has the option to first assess qualitative factors to determine whether the existence of events or circumstances leads to a determination that it is more likely than not that the fair value of a reporting unit is less than its carrying amount. If, after assessing the totality of events or circumstances, an entity determines it is not more likely than not that the fair value of a reporting unit is less than its carrying amount, then performing the impairment test is unnecessary. However, if an entity concludes otherwise, then it is required to perform an impairment test.
Under the impairment test, the Partnership assesses the carrying value of goodwill at a reporting unit level based on an estimate of the fair value of the respective reporting unit. Fair value of the reporting unit is estimated using discounted cash flow analyses taking into consideration estimated cash flows in a
Other Intangible Assets. Other intangible assets consist of customer and supply relationships, tradenames, non-compete agreements and leasehold interests. Customer and supply relationships and tradenames are amortized under the straight-line method over the estimated period for which the assets are expected to contribute to the future cash flows of the reporting entities to which they relate, ending periodically between fiscal years 2024 and 2035. Non-compete agreements are amortized under the straight-line method over the periods of the related agreements. Leasehold interests are amortized under the straight-line method over the shorter of the lease term or the useful life of the related assets, through fiscal 2025.
Accrued Insurance. Accrued insurance represents the estimated costs of known and anticipated or unasserted claims for incidents related to general and product, workers’ compensation and automobile liability. For each claim, the Partnership records a provision up to the estimated amount of the probable claim utilizing actuarially determined loss development factors applied to actual claims data. The Partnership is self-insured for these liabilities up to predetermined amounts above which third party insurance applies. The Partnership maintains insurance coverage such that its net exposure for insured claims is limited to the insurance deductible, claims above which are paid by the Partnership’s insurance carriers. For the portion of the estimated liability that exceeds insurance deductibles, the Partnership records an asset related to the amount of the liability expected to be covered by insurance.
Customer Deposits and Advances. The Partnership offers different payment programs to its customers including the ability to prepay for usage and to make equal monthly payments on account under a budget payment plan. The Partnership establishes a liability within customer deposits and advances for amounts collected in advance of deliveries.
Income Taxes. As discussed in Note 1, the Partnership structure consists of
Income taxes for the Corporate Entities are provided based on the asset and liability approach to accounting for income taxes. Under this method, deferred tax assets and liabilities are recognized for the expected future tax consequences of differences between the carrying amounts and the tax basis of assets and liabilities using enacted tax rates in effect for the year in which the differences are expected to reverse. The effect on deferred tax assets and liabilities of a change in tax rates is recognized in income in the period when the change is enacted. A valuation allowance is recorded to reduce the carrying amounts of deferred tax assets when it is more likely than not that the full amount will not be realized.
F-13
Loss Contingencies. In the normal course of business, the Partnership is involved in various claims and legal proceedings. The Partnership records a liability for such matters when it is probable that a loss has been incurred and the amounts can be reasonably estimated. The liability includes probable and estimable legal costs to the point in the legal matter where the Partnership believes a conclusion to the matter will be reached. When only a range of possible loss can be established, the most probable amount in the range is accrued. If no amount within this range is a better estimate than any other amount within the range, the minimum amount in the range is accrued.
Asset Retirement Obligations. Asset retirement obligations apply to legal obligations associated with the retirement of long-lived assets that result from the acquisition, construction, development and/or the normal operation of a long-lived asset. The Partnership has recognized asset retirement obligations for certain costs to remove and properly dispose of underground and above ground fuel oil storage tanks and contractually mandated removal of leasehold improvements.
The Partnership records a liability at fair value for the estimated cost to settle an asset retirement obligation at the time that liability is incurred, which is generally when the asset is purchased, constructed or leased. The Partnership records the liability, which is referred to as the asset retirement obligation, when it has a legal obligation to incur costs to retire the asset and when a reasonable estimate of the fair value of the liability can be made. If a reasonable estimate cannot be made at the time the liability is incurred, the Partnership records the liability when sufficient information is available to estimate the liability’s fair value.
Unit-Based Compensation. The Partnership recognizes compensation cost over the respective service period for employee services received in exchange for an award of equity or equity-based compensation based on the grant date fair value of the award. The Partnership measures liability awards under an equity-based payment arrangement based on remeasurement of the award’s fair value at the conclusion of each interim and annual reporting period until the date of settlement, taking into consideration the probability that the performance conditions will be satisfied.
Costs and Expenses. The cost of products sold reported in the consolidated statements of operations represents the weighted average unit cost of propane, fuel oil and refined fuels, natural gas and electricity sold, including transportation costs to deliver product from the Partnership’s supply points to storage or to the Partnership’s customer service centers. Cost of products sold also includes the cost of appliances, equipment and related parts sold or installed by the Partnership’s customer service centers computed on a basis that approximates the average cost of the products. Unrealized non-cash gains or losses from changes in the fair value of commodity derivative instruments that are not designated as cash flow hedges are recorded in each reporting period within cost of products sold. Cost of products sold is reported exclusive of any depreciation and amortization as such amounts are reported separately within the consolidated statements of operations.
All other costs of operating the Partnership’s retail propane, fuel oil and refined fuels distribution and appliance sales and service operations, as well as the natural gas and electricity marketing business and the renewable energy businesses, are reported within operating expenses in the consolidated statements of operations. These operating expenses include the compensation and benefits of field and direct operating support personnel, costs of operating and maintaining the vehicle fleet, overhead and other costs of the purchasing, training and safety departments and other direct and indirect costs of operating the Partnership’s customer service centers and RNG facilities.
All costs of back office support functions, including compensation and benefits for executives and other support functions, as well as other costs and expenses to maintain finance and accounting, treasury, legal, human resources, corporate development and the information systems functions are reported within general and administrative expenses in the consolidated statements of operations.
Net Income Per Unit. Computations of basic income per Common Unit are performed by dividing net income by the weighted average number of outstanding Common Units, and vested (and unissued) restricted units granted under the Partnership’s Restricted Unit Plans, as defined below, to retirement-eligible grantees. Computations of diluted income per Common Unit are performed by dividing net income by the weighted average number of outstanding Common Units and unissued restricted units granted under the Restricted Unit Plans. In computing diluted net income per Common Unit, weighted average units outstanding used to compute basic net income per Common Unit were increased by
Comprehensive Income. The Partnership reports comprehensive income (the total of net income and all other non-owner changes in partners’ capital) within the consolidated statement of comprehensive income. Other comprehensive income includes unrealized gains and losses on derivative instruments accounted for as cash flow hedges and reclassifications of realized gains and losses on cash flow hedges into earnings, amortization of net actuarial losses and prior service credits into earnings and changes in the funded status of pension and other postretirement benefit plans, and net actuarial losses recognized in earnings associated with pension settlements.
F-14
Recently Adopted Accounting Pronouncements. At the start of the second quarter of fiscal 2023, the Partnership adopted the guidance under Accounting Standards Update (“ASU”) 2021-01 “Reference Rate Reform” (“Topic 848”). This update provided optional expedients and exceptions for contracts, hedging relationships, and other transactions that referenced the London Interbank Offered Rate (“LIBOR”) or another reference rate expected to be discontinued because of reference rate reform. The adoption of Topic 848 did not have an impact on the Partnership’s consolidated financial statements.
3. Disaggregation of Revenue
|
Year Ended |
|
|||||||||
|
September 30, |
|
|
September 24, |
|
|
September 25, |
|
|||
|
2023 |
|
|
2022 |
|
|
2021 |
|
|||
Retail |
|
|
|
|
|
|
|
|
|||
Residential |
$ |
|
|
$ |
|
|
$ |
|
|||
Commercial |
|
|
|
|
|
|
|
|
|||
Industrial |
|
|
|
|
|
|
|
|
|||
Government |
|
|
|
|
|
|
|
|
|||
Agricultural |
|
|
|
|
|
|
|
|
|||
Wholesale |
|
|
|
|
|
|
|
|
|||
Total revenues |
$ |
|
|
$ |
|
|
$ |
|
|||
The Partnership recognized $
4. Investments in and Acquisitions and Dispositions of Businesses
On December 28, 2022, Suburban Renewable Energy acquired a platform of RNG production assets from Equilibrium Capital Group (“Equilibrium”), a leading sustainability-driven asset management firm. In addition, the parties formed a partnership to serve as a long-term growth platform for the identification, development and operation of additional RNG projects, including an existing pipeline of identified RNG projects that are in various stages of development (the “RNG Acquisition”).
The purchase price of $
Consideration paid at closing |
|
$ |
|
|
Assumption of debt and accrued interest |
|
|
|
|
Total |
|
|
|
|
Less: estimated cash and working capital |
|
|
( |
) |
Total purchase price |
|
$ |
|
The RNG platform includes the following: (1) a large-scale RNG production facility in Stanfield, Arizona that is currently operating and includes seven anaerobic digesters, manure rights from approximately
F-15
The consolidated balance sheet at September 30, 2023 reflects the allocation of the purchase price to the assets acquired and liabilities assumed. The following table summarizes the fair value of the assets acquired and liabilities assumed as of December 28, 2022:
Assets acquired: |
|
|
|
|
Cash and cash equivalents |
|
$ |
|
|
Accounts receivable |
|
|
|
|
Other current assets |
|
|
|
|
Current assets acquired |
|
|
|
|
Property, plant & equipment |
|
|
|
|
Other intangibles |
|
|
|
|
Goodwill |
|
|
|
|
Other assets |
|
|
|
|
Total assets acquired |
|
|
|
|
Liabilities assumed: |
|
|
|
|
Accounts payable |
|
$ |
( |
) |
Other current liabilities |
|
|
( |
) |
Long-term debt |
|
|
( |
) |
Other noncurrent liabilities |
|
|
( |
) |
Total liabilities assumed |
|
|
( |
) |
Total net assets acquired |
|
$ |
|
|
The fair values assigned to the acquired tangible assets were derived using a combination of the income approach, the market approach and the cost approach. Significant judgments used in valuing tangible assets include estimated reproduction or replacement cost, useful lives of assets, estimated selling prices, costs to complete and reasonable profit. Included in Other noncurrent liabilities is the fair value of the potential contingent consideration Equilibrium could earn based on a multiple of EBITDA that is earned for the two-year period from January 1, 2024 through December 31, 2025 once EBITDA exceeds a certain minimum threshold; the maximum earnout potential is capped at $
The fair values assigned to the acquired intangible assets were determined through the use of the income approach, specifically the relief from royalty method, multi-period excess earnings method and the cost approach. The Partnership believes the assumptions are representative of those a market participant would use in estimating fair value. The intangible assets represent customer relationships and favorable supply contracts of $
The following table presents unaudited pro forma combined financial information as if the aforementioned acquisition had occurred on September 26, 2021, the first day of the Partnership’s 2022 fiscal year:
|
|
Year Ended |
|
|||||
|
|
September 30, |
|
|
September 24, |
|
||
|
|
2023 |
|
|
2022 |
|
||
Revenues |
|
$ |
|
|
$ |
|
||
Net income |
|
|
|
|
|
|
||
This unaudited pro forma financial information does not include anticipated changes in market approach or synergies expected from operating the acquired facilities under the Partnership’s oversight. Accordingly, the pro forma results are not necessarily indicative of either future results of operations or results that might have been achieved had the acquisition been completed by September 26, 2021. For fiscal 2023, transaction costs directly related to the acquisition included in the pro forma combined results were $
Suburban Renewable Energy owns a
During the third quarter of fiscal 2022, Suburban Renewable Energy announced an agreement to construct, own and operate a new biodigester system with Adirondack Farms, a family dairy farm located in Clinton County, New York, for the production of RNG. Construction of the assets began during the first quarter of fiscal 2023, and is expected to be completed within 18-24 months.
F-16
The Operating Partnership owns a
The aforementioned RNG Acquisition, investments and partnerships were made in line with the Partnership’s Go Green with Suburban Propane corporate pillar, which focuses on advocating for the clean-burning and versatile nature of propane and renewable propane as a solution to a lower carbon future and investing in innovative, renewable energy alternatives to lower greenhouse gas (“GHG”) emissions. The investments in IH and Oberon are being accounted for under the equity method of accounting and were included in “Other assets” within the consolidated balance sheets, and the Partnership’s equity in their earnings were included in “Other, net” within the consolidated statements of operations.
On February 17, 2022, the Operating Partnership sold certain assets and operations in a non-strategic market of its propane segment for $
Pursuant to the Partnership’s strategic growth initiatives, the Operating Partnership acquired the propane assets and operations of various propane retailers in each of the last three fiscal years as summarized below. The purchase price allocations and results of operations of the acquired businesses were not material to the Partnership’s consolidated financial position and statement of operations.
Fiscal Year |
|
Total consideration (1) |
|
|
|
|
|
|
|
|
|
2023 |
|
$ |
|
(2) |
|
2022 |
|
$ |
|
(3) |
|
2021 |
|
$ |
|
(4) |
|
(1) Total consideration includes non-compete consideration, which will be paid over the respective non-compete periods subject to
compliance with the terms of the respective agreements, investments in Oberon and excludes working capital adjustments.
(2)
(3)
(4)
5. Distributions of Available Cash
The Partnership makes distributions to its partners no later than
The following summarizes the quarterly distributions per Common Unit declared and paid in respect of each of the quarters in the last three fiscal years:
|
|
Fiscal |
|
|
Fiscal |
|
|
Fiscal |
|
|||
|
|
2023 |
|
|
2022 |
|
|
2021 |
|
|||
First Quarter |
|
$ |
|
|
$ |
|
|
$ |
|
|||
Second Quarter |
|
|
|
|
|
|
|
|
|
|||
Third Quarter |
|
|
|
|
|
|
|
|
|
|||
Fourth Quarter |
|
|
|
|
|
|
|
|
|
|||
F-17
6. Selected Balance Sheet Information
Cash, Cash Equivalents and Restricted Cash. Restricted cash consists of amounts deposited in various bank accounts held by a trustee, as required for operating, maintenance and debt service purposes, all of which is stipulated in the loan agreement under the indenture to the Green Bonds.
|
|
As of |
|
|||||
|
|
September 30, |
|
|
September 24, |
|
||
|
|
2023 |
|
|
2022 |
|
||
Cash and cash equivalents |
|
$ |
|
|
$ |
|
||
Restricted cash included in other current assets |
|
|
|
|
|
|
||
Restricted cash included in other assets (noncurrent) |
|
|
|
|
|
|
||
Total cash, cash equivalents, and restricted cash shown on the consolidated statements of cash flows |
|
$ |
|
|
$ |
|
||
Inventories.
|
|
As of |
|
|||||
|
|
September 30, |
|
|
September 24, |
|
||
|
|
2023 |
|
|
2022 |
|
||
Propane, fuel oil and refined fuels and natural gas |
|
$ |
|
|
$ |
|
||
Appliances |
|
|
|
|
|
|
||
|
|
$ |
|
|
$ |
|
||
The Partnership enters into contracts for the supply of propane, fuel oil and natural gas. Such contracts generally have a term of one year subject to annual renewal, with purchase quantities specified at the time of order and costs based on market prices at the date of delivery.
Property, plant and equipment.
|
|
As of |
|
|||||
|
|
September 30, |
|
|
September 24, |
|
||
|
|
2023 |
|
|
2022 |
|
||
Land and improvements |
|
$ |
|
|
$ |
|
||
Buildings and improvements |
|
|
|
|
|
|
||
Transportation equipment |
|
|
|
|
|
|
||
Storage facilities |
|
|
|
|
|
|
||
Machinery and equipment |
|
|
|
|
|
|
||
Tanks and cylinders |
|
|
|
|
|
|
||
Computer software |
|
|
|
|
|
|
||
Construction in progress |
|
|
|
|
|
|
||
|
|
|
|
|
|
|
||
Less: accumulated depreciation |
|
|
( |
) |
|
|
( |
) |
|
|
$ |
|
|
$ |
|
||
Depreciation expense for fiscal 2023, 2022 and 2021 amounted to $
F-18
7. Goodwill and Other Intangible Assets
The Partnership’s fiscal 2023 and fiscal 2022 annual goodwill impairment review resulted in no adjustments to the carrying amount of goodwill.
The carrying values of goodwill assigned to the Partnership’s operating segments are as follows:
|
|
Propane |
|
|
Fuel oil and |
|
|
Natural gas |
|
|
All other |
|
|
Total |
|
|||||
Balance as of September 24, 2022 |
|
|
|
|
|
|
|
|
|
|
|
|
|
|
|
|||||
Goodwill |
|
$ |
|
|
$ |
|
|
$ |
|
|
$ |
|
|
$ |
|
|||||
Accumulated adjustments |
|
|
|
|
|
( |
) |
|
|
|
|
|
|
|
|
( |
) |
|||
|
|
$ |
|
|
$ |
|
|
$ |
|
|
$ |
|
|
$ |
|
|||||
|
|
|
|
|
|
|
|
|
|
|
|
|
|
|
|
|||||
Fiscal 2023 Activity |
|
|
|
|
|
|
|
|
|
|
|
|
|
|
|
|||||
Goodwill acquired (1) |
|
$ |
|
|
$ |
|
|
$ |
|
|
$ |
|
|
$ |
|
|||||
|
|
|
|
|
|
|
|
|
|
|
|
|
|
|
|
|||||
Balance as of September 30, 2023 |
|
|
|
|
|
|
|
|
|
|
|
|
|
|
|
|||||
Goodwill |
|
$ |
|
|
$ |
|
|
$ |
|
|
$ |
|
|
$ |
|
|||||
Accumulated adjustments |
|
|
|
|
|
( |
) |
|
|
|
|
|
|
|
|
( |
) |
|||
|
|
$ |
|
|
$ |
|
|
$ |
|
|
$ |
|
|
$ |
|
|||||
Other intangible assets consist of the following:
|
|
As of |
|
|||||
|
|
September 30, |
|
|
September 24, |
|
||
|
|
2023 |
|
|
2022 |
|
||
Customer relationships (1) |
|
$ |
|
|
$ |
|
||
Non-compete agreements (1) |
|
|
|
|
|
|
||
Other |
|
|
|
|
|
|
||
|
|
|
|
|
|
|
||
Less: accumulated amortization |
|
|
|
|
|
|
||
Customer relationships |
|
|
( |
) |
|
|
( |
) |
Non-compete agreements |
|
|
( |
) |
|
|
( |
) |
Other |
|
|
( |
) |
|
|
( |
) |
|
|
|
( |
) |
|
|
( |
) |
|
|
$ |
|
|
$ |
|
||
Aggregate amortization expense related to other intangible assets for fiscal 2023, 2022 and 2021 was $
8. Leases
The Partnership leases certain property, plant and equipment, including portions of its vehicle fleet, for various periods under noncancelable leases all of which were determined to be operating leases. The Partnership determines if an agreement contains a lease at inception based on the Partnership’s right to the economic benefits of the leased assets and its right to direct the use of the leased asset. Right-of-use assets represent the Partnership’s right to use an underlying asset, and right-of-use liabilities represent the Partnership’s obligation to make lease payments arising from the lease. Right-of-use assets and liabilities are recognized at the lease commencement date based on the present value of the lease payments over the lease term.
F-19
or less. The Partnership recognizes expenses for short-term leases on a straight-line basis and does not record a lease asset or lease liability for such leases.
The Partnership has residual value guarantees associated with certain of its operating leases, related primarily to transportation equipment. See Note 15, “Guarantees” for more information.
The Partnership does not have any material lease obligations that were signed, but not yet commenced as of September 30, 2023.
Quantitative information on the Partnership’s lease population for fiscal 2023 is as follows:
|
|
Year Ended |
|
|||||
|
|
September 30, 2023 |
|
|
September 24, 2022 |
|
||
Lease expense |
|
$ |
|
|
$ |
|
||
|
|
|
|
|
|
|
||
Other information: |
|
|
|
|
|
|
||
Cash payments for operating leases |
|
|
|
|
|
|
||
Right-of-use assets obtained in exchange for new operating |
|
|
|
|
|
|
||
Weighted-average remaining lease term |
|
|
|
|
||||
Weighted-average discount rate |
|
|
% |
|
|
% |
||
The following table summarizes future minimum lease payments under non-cancelable operating leases as of September 30, 2023:
Fiscal Year |
|
Operating Leases |
|
|
2024 |
|
$ |
|
|
2025 |
|
|
|
|
2026 |
|
|
|
|
2027 |
|
|
|
|
2028 |
|
|
|
|
2029 and thereafter |
|
|
|
|
Total future minimum lease payments |
|
$ |
|
|
Less: interest |
|
|
( |
) |
Total lease obligations |
|
$ |
|
|
9. Income Taxes
For federal income tax purposes, as well as for state income tax purposes in the majority of the states in which the Partnership operates, the earnings attributable to the Partnership and the Operating Partnership are not subject to income tax at the partnership level. With the exception of those states that impose an entity-level income tax on partnerships, the taxable income or loss attributable to the Partnership and to the Operating Partnership, which may vary substantially from the income (loss) before income taxes reported by the Partnership in the consolidated statement of operations, are includable in the federal and state income tax returns of the Common Unitholders. The aggregate difference in the basis of the Partnership’s net assets for financial and tax reporting purposes cannot be readily determined as the Partnership does not have access to each Common Unitholder’s basis in the Partnership.
As described in Note 1, “Partnership Organization and Formation,” the earnings of the Corporate Entities are subject to U.S. corporate level income tax. However, based upon past performance, the Corporate Entities are currently reporting an income tax provision composed primarily of minimum state income taxes. A full valuation allowance has been provided against the deferred tax assets (with the exception of certain net operating loss carryforwards (“NOLs”) that arose after 2017) based upon an analysis of all available evidence, both negative and positive at the balance sheet date, which, taken as a whole, indicates that it is more likely than not that sufficient future taxable income will not be available to utilize the assets. Management’s periodic reviews include, among other things, the nature and amount of the taxable income and expense items, the expected timing of when assets will be used or liabilities will be required to be reported and the reliability of historical profitability of businesses that are expected to provide future earnings. Furthermore, management considered tax-planning strategies it could use to increase the likelihood that the deferred tax assets will be realized.
As a result of the Tax Cuts and Jobs Act of 2017, NOLs generated by the Corporate Entities beginning in 2018 may be carried forward indefinitely. The Corporate Entities generated a taxable loss during the 2022 and 2021 tax years, which resulted in a $
F-20
The income tax provision of all the legal entities included in the Partnership’s consolidated statement of operations, which is composed primarily of state income taxes in the few states that impose taxes on partnerships and minimum state income taxes on the Corporate Entities, consists of the following:
|
|
Year Ended |
|
|||||||||
|
|
September 30, |
|
|
September 24, |
|
|
September 25, |
|
|||
|
|
2023 |
|
|
2022 |
|
|
2021 |
|
|||
Current |
|
|
|
|
|
|
|
|
|
|||
Federal |
|
$ |
|
|
$ |
|
|
$ |
|
|||
State and local |
|
|
|
|
|
|
|
|
|
|||
|
|
|
|
|
|
|
|
|
|
|||
Deferred |
|
|
( |
) |
|
|
( |
) |
|
|
|
|
|
|
$ |
|
|
$ |
|
|
$ |
|
|||
The provision for income taxes differs from income taxes computed at the U.S. federal statutory rate as a result of the following:
|
|
Year Ended |
|
|||||||||
|
|
September 30, |
|
|
September 24, |
|
|
September 25, |
|
|||
|
|
2023 |
|
|
2022 |
|
|
2021 |
|
|||
Income tax provision at federal statutory tax rate |
|
$ |
|
|
$ |
|
|
$ |
|
|||
Impact of Partnership income not subject to |
|
|
( |
) |
|
|
( |
) |
|
|
( |
) |
Permanent differences |
|
|
|
|
|
|
|
|
|
|||
Change in valuation allowance |
|
|
|
|
|
|
|
|
|
|||
State income taxes |
|
|
( |
) |
|
|
|
|
|
|
||
Other |
|
|
( |
) |
|
|
( |
) |
|
|
( |
) |
Provision for income taxes - current and deferred |
|
$ |
|
|
$ |
|
|
$ |
|
|||
The components of net deferred taxes and the related valuation allowance using currently enacted tax rates are as follows:
|
|
Year Ended |
|
|||||
|
|
September 30, |
|
|
September 24, |
|
||
|
|
2023 |
|
|
2022 |
|
||
Deferred tax assets: |
|
|
|
|
|
|
||
Net operating loss carryforwards |
|
$ |
|
|
$ |
|
||
Allowance for doubtful accounts |
|
|
|
|
|
|
||
Inventory |
|
|
|
|
|
|
||
Deferred revenue |
|
|
|
|
|
|
||
Other accruals |
|
|
|
|
|
|
||
Total deferred tax assets |
|
|
|
|
|
|
||
Deferred tax liabilities: |
|
|
|
|
|
|
||
Intangible assets |
|
|
|
|
|
|
||
Property, plant and equipment |
|
|
|
|
|
|
||
Total deferred tax liabilities |
|
|
|
|
|
|
||
Net deferred tax assets |
|
|
|
|
|
|
||
Valuation allowance |
|
|
( |
) |
|
|
( |
) |
Net deferred tax assets |
|
$ |
|
|
$ |
|
||
F-21
10. Long-Term Borrowings
Long-term borrowings consist of the following:
|
|
As of |
|
|||||
|
|
September 30, |
|
|
September 24, |
|
||
|
|
2023 |
|
|
2022 |
|
||
|
$ |
|
|
$ |
|
|||
|
|
|
|
|
|
|||
|
|
|
|
|
|
|||
Revolving Credit Facility, due |
|
|
|
|
|
|
||
Subtotal |
|
|
|
|
|
|
||
|
|
|
|
|
|
|
||
Less: unamortized debt issuance costs |
|
|
( |
) |
|
|
( |
) |
|
|
$ |
|
|
$ |
|
||
Senior Notes
2027 Senior Notes
On
Year |
|
Percentage |
2023 |
|
|
2024 |
|
|
2025 and thereafter |
|
2031 Senior Notes
On
At any time prior to June 1, 2024, the Partnership may on any one or more occasions redeem up to
Year |
|
Percentage |
2026 |
|
|
2027 |
|
|
2028 |
|
|
2029 and thereafter |
|
F-22
The Partnership’s obligations under the 2027 Senior Notes and 2031 Senior Notes (collectively, the “Senior Notes”) are unsecured and rank senior in right of payment to any future subordinated indebtedness and equally in right of payment with any future senior indebtedness. The Senior Notes are structurally subordinated to, which means they rank effectively behind, any debt and other liabilities of the Operating Partnership. The Partnership is permitted to redeem some or all of the Senior Notes at redemption prices and times as specified in the indentures governing the Senior Notes. The Senior Notes each have a change of control provision that would require the Partnership to offer to repurchase the notes at
Green Bonds
On December 28, 2022, the Partnership assumed the loan agreement under the Indentures of Trust, issued by The Industrial Development Authority of the County of Pinal (“Green Bonds”) from Equilibrium in conjunction with the RNG Acquisition. The proceeds of the Green Bonds, which bear interest at
Credit Agreement
The Operating Partnership has an amended and restated credit agreement dated March 5, 2020 (the “Credit Agreement”) that provides for a $
The Credit Agreement contains certain restrictive and affirmative covenants applicable to the Operating Partnership, its subsidiaries and the Partnership, as well as certain financial covenants, including (a) requiring the Partnership’s Consolidated Interest Coverage Ratio, as defined in the Credit Agreement, to be not less than
The Partnership and certain subsidiaries of the Operating Partnership act as guarantors with respect to the obligations of the Operating Partnership under the Credit Agreement pursuant to the terms and conditions set forth therein. The obligations under the Credit Agreement are secured by liens on substantially all of the personal property of the Partnership, the Operating Partnership and their subsidiaries, as well as mortgages on certain real property.
As of September 30, 2023, borrowings under the Revolving Credit Facility bear interest at prevailing interest rates based upon, at the Operating Partnership’s option, SOFR plus the Applicable Rate, or the base rate, defined as the higher of the
As of September 30, 2023, the Partnership had standby letters of credit issued under the Revolving Credit Facility of $
F-23
The Credit Agreement and the Senior Notes both contain various restrictive and affirmative covenants applicable to the Operating Partnership, its subsidiaries and the Partnership, respectively, including (i) restrictions on the incurrence of additional indebtedness, and (ii) restrictions on certain liens, investments, guarantees, loans, advances, payments, mergers, consolidations, distributions, sales of assets and other transactions. Under the Credit Agreement and the indentures governing the Senior Notes, the Operating Partnership and the Partnership are generally permitted to make cash distributions equal to available cash, as defined, as of the end of the immediately preceding quarter, if no event of default exists or would exist upon making such distributions, and with respect to the indentures governing the Senior Notes, the Partnership’s Consolidated Fixed Charge Coverage Ratio, as defined, is greater than
Debt origination costs representing the costs incurred in connection with the placement of, and the subsequent amendment to, the Credit Agreement are capitalized within other assets and amortized on a straight-line basis over the term of the Credit Agreement. During fiscal 2020, the Partnership recognized a charge of $
The aggregate amounts of long-term debt maturities subsequent to September 30, 2023 are as follows: fiscal 2024: $-
11. Unit-Based Compensation Arrangements
As described in Note 2, the Partnership recognizes compensation cost over the respective service period for employee services received in exchange for an award of equity, or equity-based compensation, based on the grant date fair value of the award. The Partnership measures liability awards under an equity-based payment arrangement based on remeasurement of the award’s fair value at the conclusion of each interim and annual reporting period until the date of settlement, taking into consideration the probability that the performance conditions will be satisfied.
Restricted Unit Plan. At the Partnership’s Tri-Annual Meeting held on May 15, 2018, the Unitholders approved and the Partnership adopted the Suburban Propane Partners, L.P. 2018 Restricted Unit Plan (the “Restricted Unit Plan”) authorizing the issuance of up to
The following is a summary of activity in the Restricted Unit Plan:
|
|
|
|
|
Weighted Average |
|
||
|
|
|
|
|
Grant Date Fair |
|
||
|
|
Units |
|
|
Value Per Unit |
|
||
Outstanding September 26, 2020 |
|
|
|
|
$ |
|
||
Awarded |
|
|
|
|
|
|
||
Forfeited |
|
|
( |
) |
|
|
( |
) |
Vested (1) |
|
|
( |
) |
|
|
( |
) |
Outstanding September 25, 2021 |
|
|
|
|
|
|
||
Awarded |
|
|
|
|
|
|
||
Forfeited |
|
|
( |
) |
|
|
( |
) |
Vested (1) |
|
|
( |
) |
|
|
( |
) |
Outstanding September 24, 2022 |
|
|
|
|
|
|
||
Awarded |
|
|
|
|
|
|
||
Forfeited |
|
|
( |
) |
|
|
( |
) |
Vested (1) |
|
|
( |
) |
|
|
( |
) |
Outstanding September 30, 2023 |
|
|
|
|
$ |
|
||
F-24
As of September 30, 2023, unrecognized compensation cost related to unvested restricted units awarded under the Restricted Unit Plan amounted to $
Phantom Equity Plan. At its November 8, 2022 meeting, the Compensation Committee adopted the Phantom Equity Plan (the “PEP”) to incentivize behaviors that will lead to the creation of long-term value for the Partnership’s Unitholders by functioning as a cash-settled corollary plan to the Partnership’s Restricted Unit Plan. The executive officers of the Partnership, the members of the Board, and other employees of the Partnership are eligible for awards of phantom units under the PEP. Unless otherwise stipulated by the Compensation Committee, the standard vesting schedule for awards under the PEP will be one-third of each award on each of the first three anniversaries of the award grant date, subject to continuous employment or service from the grant date through the applicable payment date. Unvested awards are subject to forfeiture in certain circumstances, as defined in the PEP document and the applicable award agreements. Upon vesting, phantom units are automatically converted into cash equal to the average of the highest and lowest trading prices of the Partnership’s Common Units on the vesting date.
Compensation expense for fiscal 2023 was $
Distribution Equivalent Rights Plan.
Long-Term Incentive Plan. On August 6, 2013, the Partnership adopted the 2014 Long-Term Incentive Plan (“2014 LTIP”) and on November 10, 2020, the Partnership adopted the 2021 Long-Term Incentive Plan (“2021 LTIP” and together with the 2014 LTIP, “the LTIPs”).
Compensation expense, which includes adjustments to previously recognized compensation expense for current period changes in the fair value of unvested awards, for fiscal 2023, 2022 and 2021 was $
F-25
12. Employee Benefit Plans
Defined Contribution Plan. The Partnership has an employee Retirement Savings and Investment Plan (the “401(k) Plan”) covering most employees. Employer matching contributions relating to the 401(k) Plan represent a match of $
Defined Pension and Retiree Health and Life Benefits Arrangements
Pension Benefits. The Partnership has a noncontributory defined benefit pension plan which was originally designed to cover all eligible employees of the Partnership who met certain requirements as to age and length of service. Effective January 1, 1998, the Partnership amended its defined benefit pension plan to provide benefits under a cash balance formula as compared to a final average pay formula which was in effect prior to January 1, 1998. Effective January 1, 2000, participation in the defined benefit pension plan was limited to eligible existing participants on that date with no new participants eligible to participate in the plan. On September 20, 2002, the Board of Supervisors approved an amendment to the defined benefit pension plan whereby, effective January 1, 2003, future service credits ceased and eligible employees receive interest credits only toward their ultimate retirement benefit.
Contributions, as needed, are made to a trust maintained by the Partnership. Contributions to the defined benefit pension plan are made by the Partnership in accordance with the Employee Retirement Income Security Act of 1974 minimum funding standards plus additional amounts made at the discretion of the Partnership, which may be determined from time to time. Contributions of $
Retiree Health and Life Benefits. The Partnership provides postretirement health care and life insurance benefits for certain retired employees. Partnership employees hired prior to July 1993 and who retired prior to March 1998 are eligible for postretirement health care benefits if they reached a specified retirement age while working for the Partnership. Partnership employees hired prior to July 1993 and who retired prior to January 1998 are eligible for life insurance benefits if they reached a specified retirement age while working for the Partnership. Effective January 1, 2017, the Partnership terminated postretirement life insurance benefits to all retirees that retired after December 31, 1997. Effective March 31, 1998, the Partnership froze participation in its postretirement health care benefit plan, with no new retirees eligible to participate in the plan. All active employees who were eligible to receive health care benefits under the postretirement plan subsequent to March 1, 1998, were provided an increase to their accumulated benefits under the cash balance pension plan. The Partnership’s postretirement health care and life insurance benefit plans are unfunded. Effective January 1, 2006, the Partnership changed its postretirement health care plan from a self-insured program to one that is fully insured under which the Partnership pays a portion of the insurance premium on behalf of the eligible participants.
The Partnership recognizes the funded status of pension and other postretirement benefit plans as an asset or liability on the balance sheet and recognizes changes in the funded status in other comprehensive income (loss) in the year the changes occur. The Partnership uses the date of its consolidated financial statements as the measurement date of plan assets and obligations.
Projected Benefit Obligation, Fair Value of Plan Assets and Funded Status.
F-26
both years. Under the Partnership’s cash balance defined benefit pension plan, the accumulated benefit obligation and the projected benefit obligation are the same.
|
|
Pension Benefits |
|
|
Retiree Health and Life Benefits |
|
||||||||||
|
|
2023 |
|
|
2022 |
|
|
2023 |
|
|
2022 |
|
||||
Reconciliation of benefit obligations: |
|
|
|
|
|
|
|
|
|
|
|
|
||||
Benefit obligation at beginning of year |
|
$ |
|
|
$ |
|
|
$ |
|
|
$ |
|
||||
Interest cost |
|
|
|
|
|
|
|
|
|
|
|
|
||||
Actuarial (gain) loss |
|
|
( |
) |
|
|
( |
) |
|
|
( |
) |
|
|
( |
) |
Lump sum benefits paid |
|
|
( |
) |
|
|
( |
) |
|
|
|
|
|
|
||
Ordinary benefits paid |
|
|
( |
) |
|
|
( |
) |
|
|
( |
) |
|
|
( |
) |
Prior service credits |
|
|
|
|
|
|
|
|
( |
) |
|
|
|
|||
Benefit obligation at end of year |
|
$ |
|
|
$ |
|
|
$ |
|
|
$ |
|
||||
|
|
|
|
|
|
|
|
|
|
|
|
|
||||
Reconciliation of fair value of plan assets: |
|
|
|
|
|
|
|
|
|
|
|
|
||||
Fair value of plan assets at beginning of year |
|
$ |
|
|
$ |
|
|
$ |
|
|
$ |
|
||||
Actual return on plan assets |
|
|
|
|
|
( |
) |
|
|
|
|
|
|
|||
Employer contributions |
|
|
|
|
|
|
|
|
|
|
|
|
||||
Lump sum benefits paid |
|
|
( |
) |
|
|
( |
) |
|
|
|
|
|
|
||
Ordinary benefits paid |
|
|
( |
) |
|
|
( |
) |
|
|
( |
) |
|
|
( |
) |
Fair value of plan assets at end of year |
|
$ |
|
|
$ |
|
|
$ |
|
|
$ |
|
||||
|
|
|
|
|
|
|
|
|
|
|
|
|
||||
Funded status: |
|
|
|
|
|
|
|
|
|
|
|
|
||||
Funded status at end of year |
|
$ |
( |
) |
|
$ |
( |
) |
|
$ |
( |
) |
|
$ |
( |
) |
|
|
|
|
|
|
|
|
|
|
|
|
|
||||
Amounts recognized in consolidated balance sheets |
|
|
|
|
|
|
|
|
|
|
|
|
||||
Net amount recognized at end of year |
|
$ |
( |
) |
|
$ |
( |
) |
|
$ |
( |
) |
|
$ |
( |
) |
Less: current portion |
|
|
|
|
|
|
|
|
|
|
|
|
||||
Noncurrent benefit liability |
|
$ |
( |
) |
|
$ |
( |
) |
|
$ |
( |
) |
|
$ |
( |
) |
|
|
|
|
|
|
|
|
|
|
|
|
|
||||
Amounts not yet recognized in net periodic benefit cost |
|
|
|
|
|
|
|
|
|
|
|
|
||||
Actuarial net (loss) gain |
|
$ |
( |
) |
|
$ |
( |
) |
|
$ |
|
|
$ |
|
||
Prior service credits |
|
|
|
|
|
|
|
|
|
|
|
|
||||
Net amount recognized in accumulated other |
|
$ |
( |
) |
|
$ |
( |
) |
|
$ |
|
|
$ |
|
||
Plan Assets. The Partnership’s investment policies and strategies, as set forth in the Investment Management Policy and Guidelines, are monitored by a Benefits Committee comprised of
The following table presents the actual allocation of assets held in trust as of:
|
|
September 30, |
|
September 24, |
|
|
2023 |
|
2022 |
Fixed income securities |
|
|
||
Equity securities |
|
|
||
|
|
|
The Partnership’s valuations include the use of the funds’ reported net asset values for commingled fund investments. Commingled funds are valued at the net asset value of its underlying securities. The assets of the defined benefit pension plan have no significant concentration of risk and there are no restrictions on these investments.
F-27
The following table describes the measurement of the Partnership’s pension plan assets by asset category as of:
|
|
September 30, |
|
|
September 24, |
|
||
|
|
2023 |
|
|
2022 |
|
||
Short term investments (1) |
|
$ |
|
|
$ |
|
||
|
|
|
|
|
|
|
||
Equity securities: (1) (2) |
|
|
|
|
|
|
||
Domestic |
|
|
|
|
|
|
||
International |
|
|
|
|
|
|
||
|
|
|
|
|
|
|
||
Fixed income securities (1) (3) |
|
|
|
|
|
|
||
|
|
$ |
|
|
$ |
|
||
(1)
(2)
(3)
Projected Contributions and Benefit Payments.
|
|
Pension |
|
|
Retiree Health and |
|
||
Fiscal Year |
|
Benefits |
|
|
Life Benefits |
|
||
2024 |
|
$ |
|
|
$ |
|
||
2025 |
|
|
|
|
|
|
||
2026 |
|
|
|
|
|
|
||
2027 |
|
|
|
|
|
|
||
2028 |
|
|
|
|
|
|
||
2029 through 2033 |
|
|
|
|
|
|
||
Estimated future pension benefit payments assumes that age 65 or older active and non-active eligible participants in the pension plan that had not received a benefit payment prior to fiscal 2024 will elect to receive a benefit payment in fiscal 2024. In addition, for all periods presented, estimated future pension benefit payments assumes that participants will elect a lump sum payment in the fiscal year that the participant becomes eligible to receive benefits.
Effect on Operations.
|
|
Pension Benefits |
|
|
Retiree Health and Life Benefits |
|
||||||||||||||||||
|
|
2023 |
|
|
2022 |
|
|
2021 |
|
|
2023 |
|
|
2022 |
|
|
2021 |
|
||||||
Interest cost |
|
$ |
|
|
$ |
|
|
$ |
|
|
$ |
|
|
$ |
|
|
$ |
|
||||||
Expected return on plan assets |
|
|
( |
) |
|
|
( |
) |
|
|
( |
) |
|
|
|
|
|
|
|
|
|
|||
Amortization of prior service credit |
|
|
|
|
|
|
|
|
|
|
|
( |
) |
|
|
( |
) |
|
|
( |
) |
|||
Settlement charge |
|
|
|
|
|
|
|
|
|
|
|
|
|
|
|
|
|
|
||||||
Recognized net actuarial loss (gain) |
|
|
|
|
|
|
|
|
|
|
|
( |
) |
|
|
( |
) |
|
|
( |
) |
|||
Net periodic benefit costs |
|
$ |
|
|
$ |
|
|
$ |
|
|
$ |
( |
) |
|
$ |
( |
) |
|
$ |
( |
) |
|||
During fiscal 2023, fiscal 2022 and fiscal 2021, lump sum pension settlement payments to either terminated or retired individuals amounted to $
F-28
Actuarial Assumptions.
|
|
Pension Benefits |
|
|
Retiree Health and Life Benefits |
|
||||||||||
|
|
2023 |
|
|
2022 |
|
|
2023 |
|
|
2022 |
|
||||
Weighted-average discount rate |
|
|
% |
|
|
% |
|
|
% |
|
|
% |
||||
Average rate of compensation increase |
|
n/a |
|
|
n/a |
|
|
n/a |
|
|
n/a |
|
||||
Health care cost trend |
|
n/a |
|
|
n/a |
|
|
|
% |
|
|
% |
||||
The assumptions used in the measurement of net periodic pension benefit and postretirement benefit costs for fiscal 2023, 2022 and 2021 are shown in the following table:
|
|
Pension Benefits |
|
|
Retiree Health and Life Benefits |
|
||||||||||||||||||
|
|
2023 |
|
|
2022 |
|
|
2021 |
|
|
2023 |
|
|
2022 |
|
|
2021 |
|
||||||
Weighted-average discount rate |
|
|
% |
|
|
% |
|
|
% |
|
|
% |
|
|
% |
|
|
% |
||||||
Average rate of compensation increase |
|
n/a |
|
|
n/a |
|
|
n/a |
|
|
n/a |
|
|
n/a |
|
|
n/a |
|
||||||
Weighted-average expected long-term |
|
|
% |
|
|
% |
|
|
% |
|
n/a |
|
|
n/a |
|
|
n/a |
|
||||||
Health care cost trend |
|
n/a |
|
|
n/a |
|
|
n/a |
|
|
|
% |
|
|
% |
|
|
% |
||||||
The discount rate assumption takes into consideration current market expectations related to long-term interest rates and the projected duration of the Partnership’s pension obligations based on a benchmark index with similar characteristics as the expected cash flow requirements of the Partnership’s defined benefit pension plan over the long-term. The expected long-term rate of return on plan assets assumption reflects estimated future performance in the Partnership’s pension asset portfolio considering the investment mix of the pension asset portfolio and historical asset performance. The expected return on plan assets is determined based on the expected long-term rate of return on plan assets and the market-related value of plan assets. The market-related value of pension plan assets is the fair value of the assets. Unrecognized actuarial gains and losses in excess of
The
Multi-Employer Pension Plans. As a result of the acquisition of the retail propane assets of Inergy, the Partnership contributes to multi-employer pension plans (“MEPPs”) in accordance with various collective bargaining agreements covering union employees. As one of the many participating employers in these MEPPs, the Partnership is responsible with the other participating employers for any plan underfunding. During the fourth quarter of fiscal 2021, the Partnership accrued approximately $
The Partnership’s contributions to a particular MEPP are established by the applicable collective bargaining agreements (“CBAs”); however, the required contributions may increase based on the funded status of a MEPP and legal requirements of the Pension Protection Act of 2006 (the “PPA”), which requires substantially underfunded MEPPs to implement a funding improvement plan (“FIP”) or a rehabilitation plan (“RP”) to improve their funded status. Factors that could impact funded status of a MEPP include, without limitation, investment performance, changes in the participant demographics, decline in the number of contributing employers, changes in actuarial assumptions and the utilization of extended amortization provisions.
F-29
While no multi-employer pension plan that the Partnership contributed to is individually significant to the Partnership, the table below discloses the MEPPs to which the Partnership contributes. The financial health of a MEPP is indicated by the zone status, as defined by the PPA, which represents the funded status of the plan as certified by the plan's actuary. Plans in the red zone are less than 65% funded, the yellow zone are between 65% and 80% funded, and green zone are at least 80% funded. Total contributions made by the Partnership to multi-employer pension plans for the fiscal years ended September 30, 2023, September 24, 2022 and September 25, 2021 are shown below.
|
|
|
|
PPA Zone Status |
|
|
|
Contributions |
|
|
Contributions greater than |
|
Expiration |
|||||||||||
Pension Fund |
|
EIN/Pension Plan Number |
|
2023 |
|
2022 |
|
FIP/RP Status |
|
2023 |
|
|
2022 |
|
|
2021 |
|
|
Total Plan Contributions |
|
date of |
|||
|
|
|
|
n/a |
|
$ |
|
|
$ |
|
|
$ |
|
|
|
|||||||||
|
|
|
|
|
n/a |
|
|
|
|
|
|
|
|
|
|
|
||||||||
|
|
|
|
|
|
|
|
|
|
$ |
|
|
$ |
|
|
$ |
|
|
|
|
|
|||
(1)
Additionally, the Partnership contributes to certain multi-employer plans that provide health and welfare benefits and defined annuity plans. Contributions to those plans were $
13. Financial Instruments and Risk Management
Cash, Cash Equivalents and Restricted Cash. The Partnership considers all highly liquid instruments purchased with an original maturity of
Derivative Instruments and Hedging Activities. The Partnership measures the fair value of its exchange-traded commodity-related options and futures contracts using Level 1 inputs, the fair value of its commodity-related swap contracts and interest rate swaps using Level 2 inputs and the fair value of its over-the-counter commodity-related options contracts using Level 3 inputs. The Partnership’s over-the-counter options contracts are valued based on an internal option model. The inputs utilized in the model are based on publicly available information, as well as broker quotes.
The following summarizes the fair value of the Partnership’s derivative instruments and their location in the consolidated balance sheets as of September 30, 2023 and September 24, 2022, respectively:
|
|
As of September 30, 2023 |
|
|
As of September 24, 2022 |
|
||||||
Asset Derivatives |
|
Location |
|
Fair Value |
|
|
Location |
|
Fair Value |
|
||
Derivatives not designated as hedging |
|
|
|
|
|
|
|
|
|
|
||
Commodity-related derivatives |
|
Other current assets |
|
$ |
|
|
Other current assets |
|
$ |
|
||
|
|
Other assets |
|
|
|
|
Other assets |
|
|
|
||
|
|
|
|
$ |
|
|
|
|
$ |
|
||
|
|
|
|
|
|
|
|
|
|
|
||
Liability Derivatives |
|
Location |
|
Fair Value |
|
|
Location |
|
Fair Value |
|
||
Derivatives not designated as hedging |
|
|
|
|
|
|
|
|
|
|
||
Commodity-related derivatives |
|
Other current liabilities |
|
$ |
|
|
Other current liabilities |
|
$ |
|
||
|
|
Other liabilities |
|
|
|
|
Other liabilities |
|
|
|
||
|
|
|
|
$ |
|
|
|
|
$ |
|
||
F-30
The following summarizes the reconciliation of the beginning and ending balances of assets and liabilities measured at fair value on a recurring basis using significant unobservable inputs:
|
|
Fair Value Measurement Using Significant |
|
|||||||||||||
|
|
Fiscal 2023 |
|
|
Fiscal 2022 |
|
||||||||||
|
|
Assets |
|
|
Liabilities |
|
|
Assets |
|
|
Liabilities |
|
||||
Beginning balance of over-the-counter options |
|
$ |
|
|
$ |
|
|
$ |
|
|
$ |
|
||||
Beginning balance realized during the period |
|
|
( |
) |
|
|
( |
) |
|
|
( |
) |
|
|
( |
) |
Contracts purchased during the period |
|
|
|
|
|
|
|
|
|
|
|
|
||||
Change in the fair value of outstanding contracts |
|
|
( |
) |
|
|
( |
) |
|
|
|
|
|
( |
) |
|
Ending balance of over-the-counter options |
|
$ |
|
|
$ |
|
|
$ |
|
|
$ |
|
||||
As of September 30, 2023 and September 24, 2022, the Partnership’s outstanding commodity-related derivatives had a weighted average maturity of approximately and
The effect of the Partnership’s derivative instruments on the consolidated statements of operations for fiscal 2023, 2022 and 2021 are as follows:
|
|
Unrealized Gains (Losses) Recognized in Income |
|
|||
Derivatives Not Designated as Hedging Instruments |
|
Location |
|
Amount |
|
|
Commodity-related derivatives: |
|
|
|
|
|
|
|
|
|
|
|
|
|
Fiscal 2023 |
|
Cost of products sold |
|
$ |
( |
) |
|
|
|
|
|
|
|
Fiscal 2022 |
|
Cost of products sold |
|
$ |
( |
) |
|
|
|
|
|
|
|
Fiscal 2021 |
|
Cost of products sold |
|
$ |
|
|
The following table presents the fair value of the Partnership’s recognized derivative assets and liabilities on a gross basis and amounts offset on the consolidated balance sheets subject to enforceable master netting arrangements or similar agreements:
|
|
As of September 30, 2023 |
|
|||||||||
|
|
|
|
|
|
|
|
Net amounts |
|
|||
|
|
|
|
|
|
|
|
presented in the |
|
|||
|
|
Gross amounts |
|
|
Effects of netting |
|
|
balance sheet |
|
|||
Asset Derivatives |
|
|
|
|
|
|
|
|
|
|||
Commodity-related derivatives |
|
$ |
|
|
$ |
( |
) |
|
$ |
|
||
|
|
$ |
|
|
$ |
( |
) |
|
$ |
|
||
|
|
|
|
|
|
|
|
|
|
|||
Liability Derivatives |
|
|
|
|
|
|
|
|
|
|||
Commodity-related derivatives |
|
$ |
|
|
$ |
( |
) |
|
$ |
|
||
|
|
$ |
|
|
$ |
( |
) |
|
$ |
|
||
|
|
As of September 24, 2022 |
|
|||||||||
|
|
|
|
|
|
|
|
Net amounts |
|
|||
|
|
|
|
|
|
|
|
presented in the |
|
|||
|
|
Gross amounts |
|
|
Effects of netting |
|
|
balance sheet |
|
|||
Asset Derivatives |
|
|
|
|
|
|
|
|
|
|||
Commodity-related derivatives |
|
$ |
|
|
$ |
( |
) |
|
$ |
|
||
|
|
$ |
|
|
$ |
( |
) |
|
$ |
|
||
|
|
|
|
|
|
|
|
|
|
|||
Liability Derivatives |
|
|
|
|
|
|
|
|
|
|||
Commodity-related derivatives |
|
$ |
|
|
$ |
( |
) |
|
$ |
|
||
|
|
$ |
|
|
$ |
( |
) |
|
$ |
|
||
The Partnership had $-
F-31
Concentrations. The Partnership’s principal customers are residential and commercial end users of propane and fuel oil and refined fuels served by approximately
During fiscal 2023, Crestwood Equity Partners L.P. and Targa Liquids Marketing, provided approximately
Credit Risk. Exchange-traded futures and options contracts are traded on and guaranteed by the NYMEX and as a result, have minimal credit risk. Futures contracts traded with brokers of the NYMEX require daily cash settlements in margin accounts. The Partnership is subject to credit risk with over-the-counter swaps and options contracts entered into with various third parties to the extent the counterparties do not perform. The Partnership evaluates the financial condition of each counterparty with which it conducts business and establishes credit limits to reduce exposure to credit risk based on non-performance. The Partnership does not require collateral to support the contracts.
Bank Debt, Senior Notes and Green Bonds. The fair value of the Revolving Credit Facility approximates the carrying value since the interest rates are adjusted quarterly to reflect market conditions. Based upon quoted market prices, the fair value of the Partnership’s 2027 Senior Notes and 2031 Senior Notes was $
14. Commitments and Contingencies
Commitments. The Partnership leases certain property, plant and equipment, including portions of its vehicle fleet, for various periods under noncancelable leases.
Contingencies
Accrued Insurance. The Partnership is self-insured for general and product, workers’ compensation and automobile liabilities up to predetermined amounts above which third party insurance applies. As of September 30, 2023 and September 24, 2022, the Partnership had accrued liabilities of $
Legal Matters. The Partnership’s operations are subject to operating hazards and risks normally incidental to handling, storing and delivering combustible liquids such as propane. The Partnership has been, and will continue to be, a defendant in various legal proceedings and litigation as a result of these operating hazards and risks, and as a result of other aspects of its business. In this regard, the Partnership’s natural gas and electricity (“AES”) business was sued in a putative class action suit in the Northern District of New York. The complaint alleged a number of claims under various consumer statutes and common law in New York and Pennsylvania regarding pricing offered to electricity customers in those states. The case was dismissed in part by the district court, but causes of action based on the New York consumer statute and breach of contract were allowed to proceed. On April 12, 2022, the court granted summary judgment in favor of the Partnership on the remaining counts and the complaint was dismissed in full. The plaintiff has filed an appeal to the Second Circuit Court of Appeals. The matter has been fully briefed, argued, and a decision is pending. While the Partnership believes that the appeal is without merit, the Partnership is unable to predict at this time the ultimate outcome of the New York action. Accordingly, it was determined that no reserve for a loss contingency is required. If the plaintiff prevails on appeal, the matter will return to the trial court for further proceedings. If the Partnership is ultimately unable to successfully defend its AES business in this class action lawsuit, a decision rendered against AES could have an adverse impact on AES’s business and operations.
15. Guarantees
The Partnership has residual value guarantees associated with certain of its operating leases, related primarily to transportation equipment, with remaining lease periods scheduled to expire periodically through fiscal
F-32
16. Amounts Reclassified Out of Accumulated Other Comprehensive Income
The following table summarizes amounts reclassified out of accumulated other comprehensive (loss) income for the years ended September 30, 2023, September 24, 2022 and September 25, 2021:
|
|
Year Ended |
|
|||||||||
|
|
September 30, |
|
|
September 24, |
|
|
September 25, |
|
|||
|
|
2023 |
|
|
2022 |
|
|
2021 |
|
|||
Pension Benefits |
|
|
|
|
|
|
|
|
|
|||
Balance, beginning of period |
|
$ |
( |
) |
|
$ |
( |
) |
|
$ |
( |
) |
Other comprehensive income before reclassifications: |
|
|
|
|
|
|
|
|
|
|||
Net change in funded status of benefit plan |
|
|
|
|
|
|
|
|
|
|||
Reclassifications to earnings: |
|
|
|
|
|
|
|
|
|
|||
Recognition of net actuarial loss for pension |
|
|
|
|
|
|
|
|
|
|||
Amortization of net loss (1) |
|
|
|
|
|
|
|
|
|
|||
Other comprehensive income (loss) |
|
|
|
|
|
|
|
|
|
|||
Balance, end of period |
|
$ |
( |
) |
|
$ |
( |
) |
|
$ |
( |
) |
|
|
|
|
|
|
|
|
|
|
|||
Postretirement Benefits |
|
|
|
|
|
|
|
|
|
|||
Balance, beginning of period |
|
$ |
|
|
$ |
|
|
$ |
|
|||
Other comprehensive income before reclassifications: |
|
|
|
|
|
|
|
|
|
|||
Prior service credits |
|
|
|
|
|
|
|
|
|
|||
Net change in plan obligation |
|
|
|
|
|
|
|
|
|
|||
Reclassifications to earnings: |
|
|
|
|
|
|
|
|
|
|||
Amortization of prior service credits (1) |
|
|
( |
) |
|
|
( |
) |
|
|
( |
) |
Amortization of net gain (1) |
|
|
( |
) |
|
|
( |
) |
|
|
( |
) |
Other comprehensive (loss) income |
|
|
( |
) |
|
|
( |
) |
|
|
( |
) |
Balance, end of period |
|
$ |
|
|
$ |
|
|
$ |
|
|||
|
|
|
|
|
|
|
|
|
|
|||
Accumulated Other Comprehensive Income (Loss) |
|
|
|
|
|
|
|
|
|
|||
Balance, beginning of period |
|
$ |
( |
) |
|
$ |
( |
) |
|
$ |
( |
) |
Other comprehensive income before reclassifications |
|
|
|
|
|
|
|
|
|
|||
Recognition of net actuarial loss for pension settlement |
|
|
|
|
|
|
|
|
|
|||
Reclassifications to earnings |
|
|
|
|
|
|
|
|
|
|||
Other comprehensive (loss) income |
|
|
|
|
|
|
|
|
|
|||
Balance, end of period |
|
$ |
( |
) |
|
$ |
( |
) |
|
$ |
( |
) |
(1)
17. Segment Information
The Partnership manages and evaluates its operations in
The propane segment is primarily engaged in the retail distribution of propane and renewable propane to residential, commercial, industrial, agricultural and government customers and, to a lesser extent, wholesale distribution to large industrial end users. In the residential, commercial and government markets, propane is used primarily for space heating, water heating, cooking and clothes drying. Industrial customers use propane generally as a motor fuel burned in internal combustion engines that power over-the-road vehicles, forklifts and stationary engines, to fire furnaces and as a cutting gas. In the agricultural markets, propane is primarily used for tobacco
F-33
curing, crop drying, poultry brooding and weed control. In addition, the Partnership's equity investment in Oberon is included within the propane segment.
The fuel oil and refined fuels segment is primarily engaged in the retail distribution of fuel oil, diesel, kerosene and gasoline to residential and commercial customers for use primarily as a source of heat in homes and buildings.
The natural gas and electricity segment is engaged in the marketing of natural gas and electricity to residential and commercial customers in the deregulated energy markets of New York and Pennsylvania. Under this operating segment, the Partnership owns the relationship with the end consumer and has agreements with the local distribution companies to deliver the natural gas or electricity from the Partnership’s suppliers to the customer.
Activities in the “all other” category include the Partnership’s service business, which is primarily engaged in the sale, installation and servicing of a wide variety of home comfort equipment, particularly in the areas of heating and ventilation. In addition, the Partnership's platform of RNG businesses and the equity investment in IH are included within “all other”.
The following table presents certain data by reportable segment and provides a reconciliation of total operating segment information to the corresponding consolidated amounts for the periods presented:
|
|
Year Ended |
|
|||||||||
|
|
September 30, |
|
|
September 24, |
|
|
September 25, |
|
|||
|
|
2023 |
|
|
2022 |
|
|
2021 |
|
|||
Revenues: |
|
|
|
|
|
|
|
|
|
|||
Propane |
|
$ |
|
|
$ |
|
|
$ |
|
|||
Fuel oil and refined fuels |
|
|
|
|
|
|
|
|
|
|||
Natural gas and electricity |
|
|
|
|
|
|
|
|
|
|||
All other |
|
|
|
|
|
|
|
|
|
|||
Total revenues |
|
$ |
|
|
$ |
|
|
$ |
|
|||
|
|
|
|
|
|
|
|
|
|
|||
Operating income (loss): |
|
|
|
|
|
|
|
|
|
|||
Propane |
|
$ |
|
|
$ |
|
|
$ |
|
|||
Fuel oil and refined fuels |
|
|
|
|
|
|
|
|
|
|||
Natural gas and electricity |
|
|
|
|
|
|
|
|
|
|||
All other |
|
|
( |
) |
|
|
( |
) |
|
|
( |
) |
Corporate |
|
|
( |
) |
|
|
( |
) |
|
|
( |
) |
Total operating income |
|
|
|
|
|
|
|
|
|
|||
|
|
|
|
|
|
|
|
|
|
|||
Reconciliation to net income: |
|
|
|
|
|
|
|
|
|
|||
Loss on debt extinguishment |
|
|
|
|
|
|
|
|
|
|||
Interest expense, net |
|
|
|
|
|
|
|
|
|
|||
Other, net |
|
|
|
|
|
|
|
|
|
|||
Provision for income taxes |
|
|
|
|
|
|
|
|
|
|||
Net income |
|
$ |
|
|
$ |
|
|
$ |
|
|||
|
|
|
|
|
|
|
|
|
|
|||
Depreciation and amortization: |
|
|
|
|
|
|
|
|
|
|||
Propane |
|
$ |
|
|
$ |
|
|
$ |
|
|||
Fuel oil and refined fuels |
|
|
|
|
|
|
|
|
|
|||
Natural gas and electricity |
|
|
|
|
|
|
|
|
|
|||
All other |
|
|
|
|
|
|
|
|
|
|||
Corporate |
|
|
|
|
|
|
|
|
|
|||
Total depreciation and amortization |
|
$ |
|
|
$ |
|
|
$ |
|
|||
F-34
|
|
As of |
|
|||||
|
|
September 30, |
|
|
September 24, |
|
||
|
|
2023 |
|
|
2022 |
|
||
Assets: |
|
|
|
|
|
|
||
Propane |
|
$ |
|
|
$ |
|
||
Fuel oil and refined fuels |
|
|
|
|
|
|
||
Natural gas and electricity |
|
|
|
|
|
|
||
All other |
|
|
|
|
|
|
||
Corporate |
|
|
|
|
|
|
||
Total assets |
|
$ |
|
|
$ |
|
||
F-35
INDEX TO FINANCIAL STATEMENT SCHEDULE
SUBURBAN PROPANE PARTNERS, L.P. AND SUBSIDIARIES
|
|
|
|
Page |
Schedule II |
|
|
S-2 |
S-1
SCHEDULE II
SUBURBAN PROPANE PARTNERS, L.P. AND SUBSIDIARIES
VALUATION AND QUALIFYING ACCOUNTS
(in thousands)
|
|
Balance at |
|
|
Charged (credited) to |
|
|
Other Additions |
|
|
Deductions (a) |
|
|
Balance at |
|
|||||
Year Ended September 25, 2021 |
|
|
|
|
|
|
|
|
|
|
|
|
|
|
|
|||||
Allowance for doubtful accounts |
|
$ |
|
|
$ |
|
|
$ |
|
|
$ |
( |
) |
|
$ |
|
||||
Valuation allowance for deferred tax assets |
|
|
|
|
|
|
|
|
|
|
|
|
|
|
|
|||||
Year Ended September 24, 2022 |
|
|
|
|
|
|
|
|
|
|
|
|
|
|
|
|||||
Allowance for doubtful accounts |
|
$ |
|
|
$ |
|
|
$ |
|
|
$ |
( |
) |
|
$ |
|
||||
Valuation allowance for deferred tax assets |
|
|
|
|
|
|
|
|
|
|
|
|
|
|
|
|||||
Year Ended September 30, 2023 |
|
|
|
|
|
|
|
|
|
|
|
|
|
|
|
|||||
Allowance for doubtful accounts |
|
$ |
|
|
$ |
|
|
$ |
|
|
$ |
( |
) |
|
$ |
|
||||
Valuation allowance for deferred tax assets |
|
|
|
|
|
|
|
|
|
|
|
|
|
|
|
|||||
S-2